Washington, D.C. 20549
GRUPO FINANCIERO SANTANDER MÉXICO, S.A.B. de C.V.
SANTANDER MEXICO FINANCIAL GROUP, S.A.B. de C.V.
01219 México, D.F.
Indicate by check mark whether the registrant files or will file annual reports under cover of Form 20-F or Form 40-F:
Indicate by check mark if the registrant is submitting the Form 6-K in paper as permitted by Regulation S-T Rule 101(b)(1):
Indicate by check mark if the registrant is submitting the Form 6-K in paper as permitted by Regulation S-T Rule 101(b)(7):
GRUPO FINANCIERO SANTANDER MÉXICO, S.A.B. de C.V.
TABLE OF CONTENTS
| I. | CEO Message / Key Highlights for the Quarter |
| | |
| II. | Summary of 3Q12 Consolidated Results |
| | |
| III. | Analysis of 3Q12 Consolidated Results |
| | |
| IV. | Relevant Events |
| | |
| V. | Credit Ratings |
| | |
| VI. | 3Q Earnings Call Dial-In Information |
| | |
| VII. | Financial Statements |
| | |
| VIII. | Notes to the Financial Statements |
3Q. 12 | EARNINGS REPORT | 0
Grupo Financiero Santander México Reports Third Quarter 2012 Net Income of Ps.4,215 Million
Solid Profitability and Growth Driven by Focus on Commercial Banking and Operational Efficiency
México City – October 25, 2012, Grupo Financiero Santander México, S.A.B. de C.V., (NYSE: BSMX; BMV: SANMEX), (“Santander México”), one of the leading financial groups in the Mexican financial system, today announced financial results for the three- and nine-month periods ending September 30, 2012.
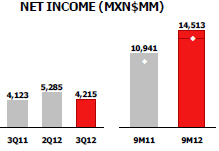
During 3Q12, Santander México reported net income of Ps.4,215 million, representing a 2.2% year-on-year (“YoY”) increase and a 20.2% sequential decrease. These comparisons however are affected by extraordinary gains in 3Q11 for the reversal of provisions to comply with CNBV (Comisión Nacional Bancaria y de Valores) regulations and in 2Q12 for the gain on the sale and leaseback of branches. Excluding these one time events, normalized net income increased 24.8% YoY and 3.5% sequentially. Consolidated net income for 9M12 was Ps.14,513 million, an increase of 32.6%, or Ps.3,572 million higher than the corresponding figure in 9M11. Excluding the aforementioned extraordinary gains in 3Q11 and 2Q12, net income for 9M12 increased 30.5% or Ps.3,107 million.
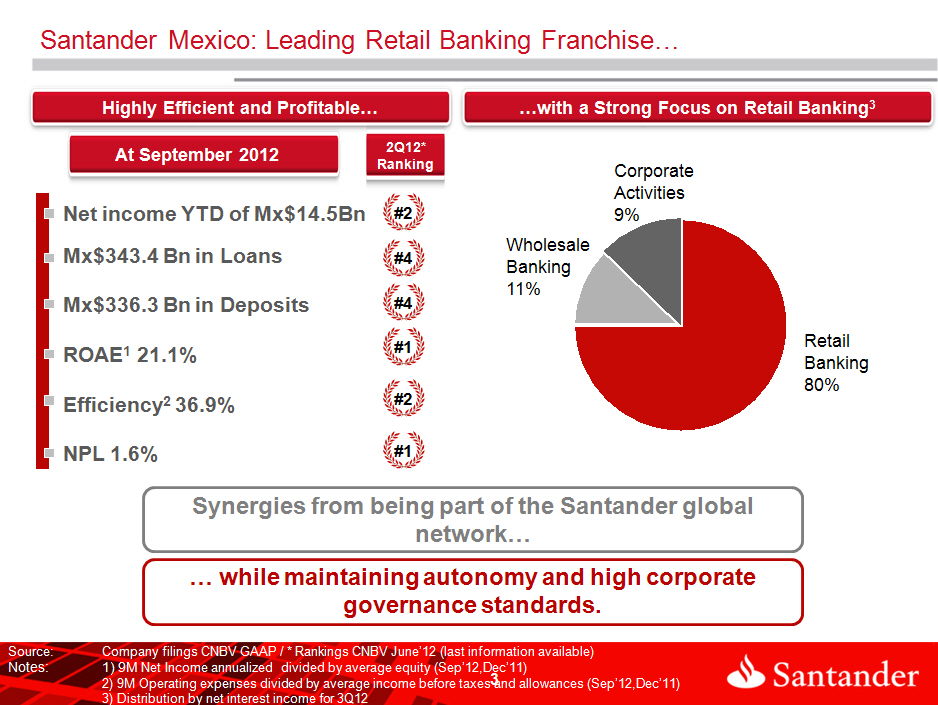
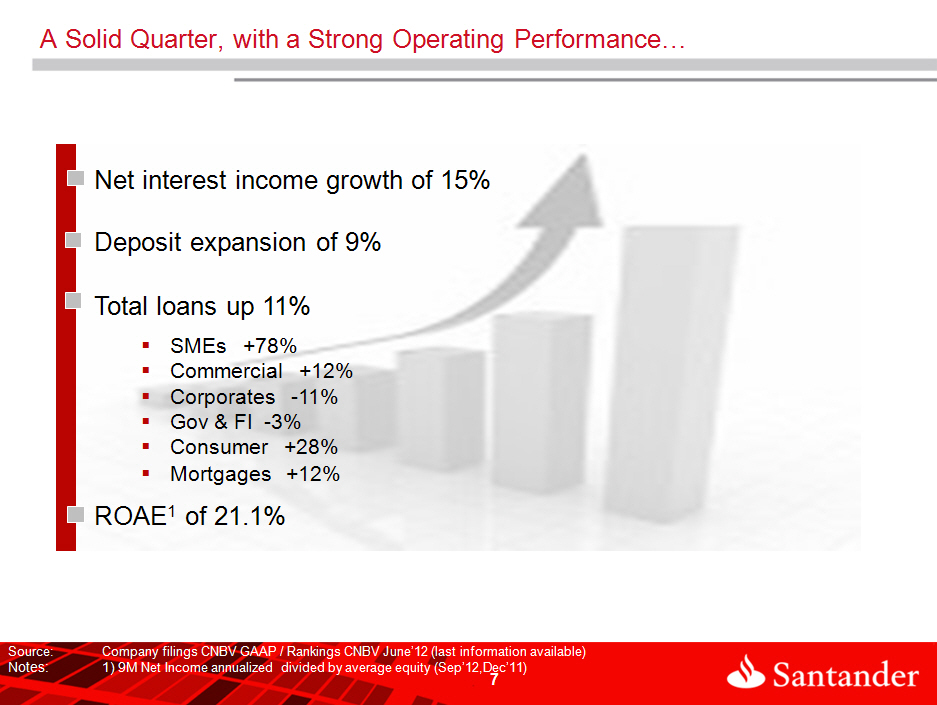
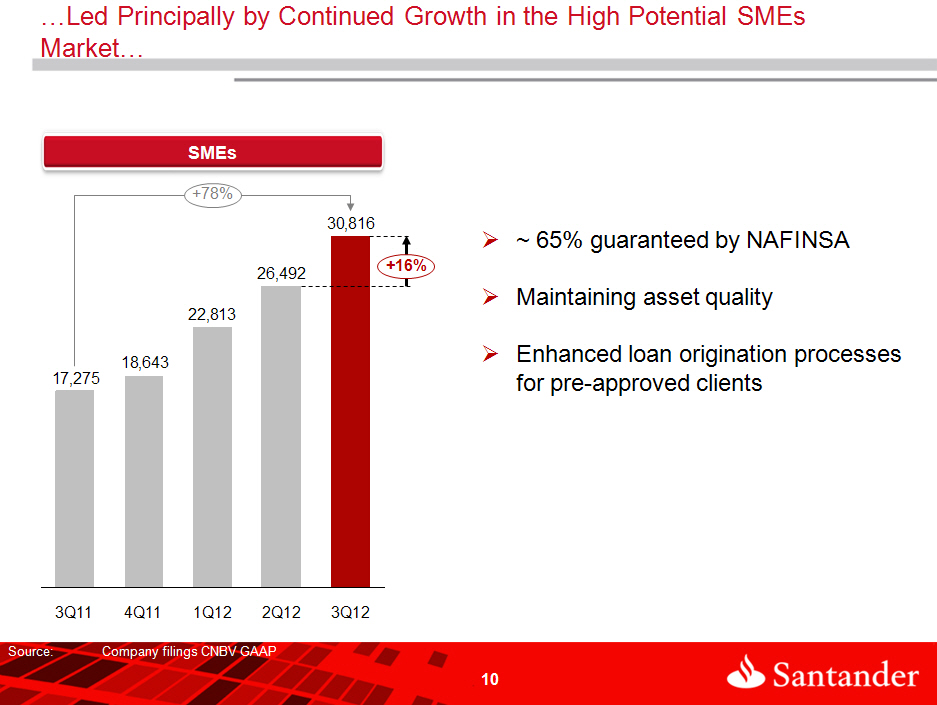
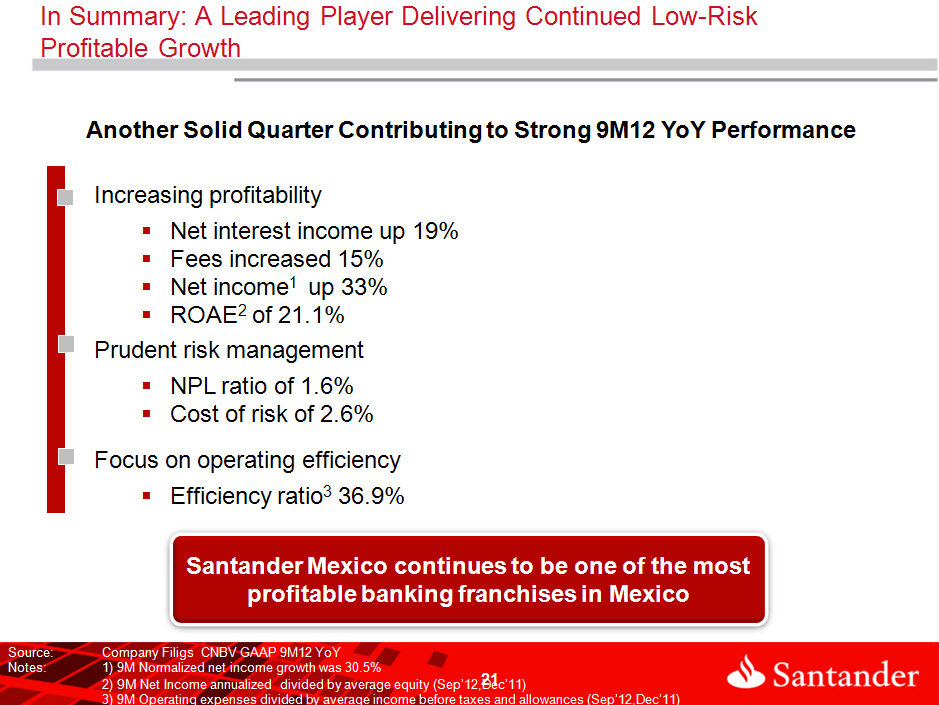
Marcos Martínez, Executive Chairman and CEO, commented, "We are pleased with our strong third quarter results, which reinforce the merits of our strategic focus on commercial banking, low-risk profitable growth and operational efficiency. We delivered year-on-year increases of 14.9% and 14.4% in net interest income and net commissions and fees, respectively. Furthermore, we executed well in our key business segments, as demonstrated by robust year-on-year growth of 28.6%, in both consumer loans and credit cards, as well as 78.4% increase in loans to small and medium enterprises (“SMEs”). Our focused growth strategy together with our strong emphasis on prudent risk management and an efficiency-oriented culture positions Santander México as one of the most profitable franchises in Mexico.”
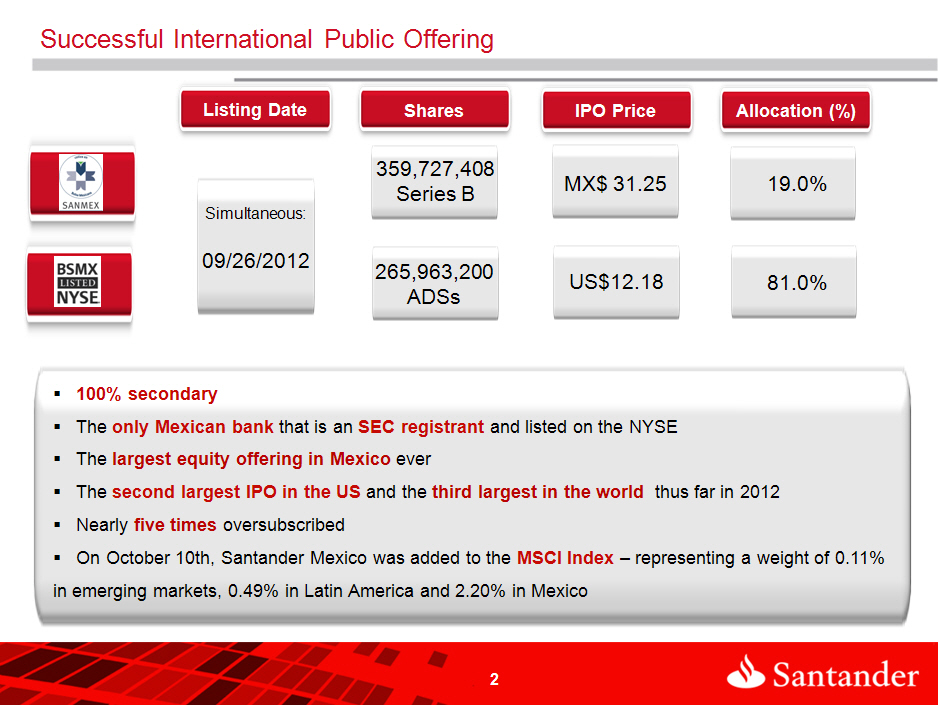
Mr. Martínez continued, “This quarter we achieved a significant milestone in Santander México’s history: our successful international public offering, which values the bank at 16.5 billion dollars. This transaction enhances the Company’s market position and brand recognition, while strengthening organizational transparency and market discipline. We begin a new chapter as a publicly traded company on strong footing and are well positioned to capitalize on the attractive fundamentals of Mexico’s banking industry.”
3Q. 12 | EARNINGS REPORT | 1
SUMMARY OF THIRD QUARTER 2012 CONSOLIDATED RESULTS
Net Income
Santander México reported net income of Ps.4,215 million in 3Q12, a 2.2% YoY increase, and 20.2% below 2Q12. Excluding the net impact from the reversal of provisions in 3Q11 and the gain from the sale of branches in 2Q12, net income would have increased 24.8% YoY and 3.5% sequentially, driven primarily by higher recurring income resulting from higher business volume. As a result, net interest margin and net commission and fee income increased QoQ by 2.2% and 8.1%, respectively.
Capitalization and ROAE
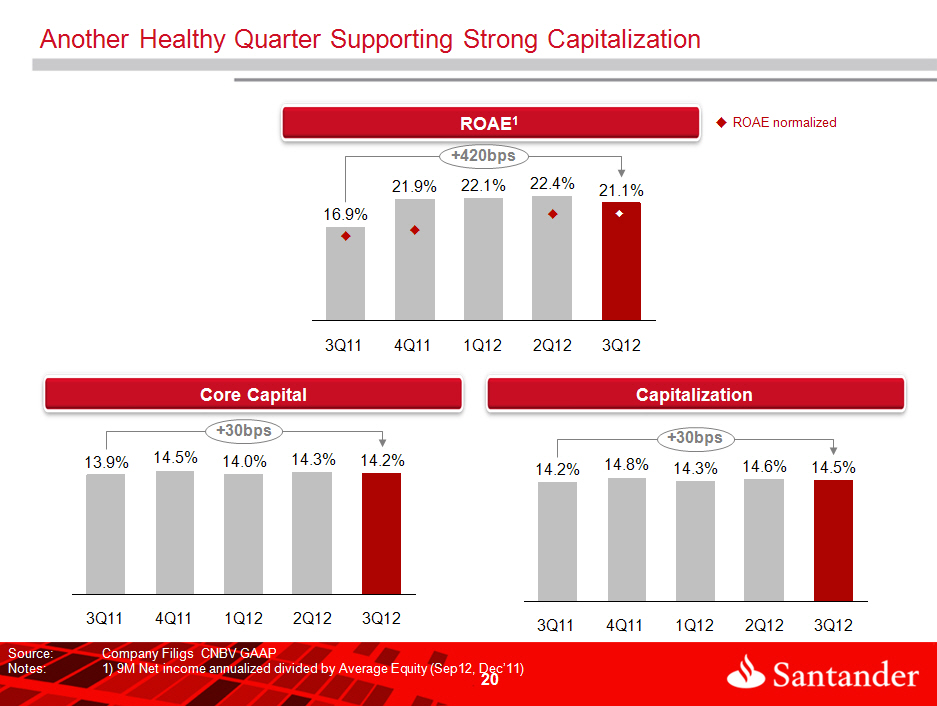
Santander México’s capital ratio was 14.45% in 3Q12, representing a 21 bps increase from 14.24% in 3Q11, and an 18 bps decline from 14.63% in 2Q12.
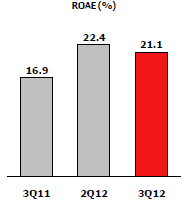
3Q12 ROAE was 21.1%, a 421 bps increase from 3Q11. On a a sequential basis, ROAE declined 127 bps reflecting the extraordinary gain from the sale of branches in 2Q12. Excluding this one-time event, normalized ROAE would have been 19.4% in 3Q12 and 19.8% in 2Q12, representing a slight decrease of 40 bps QoQ.
Net Interest Income
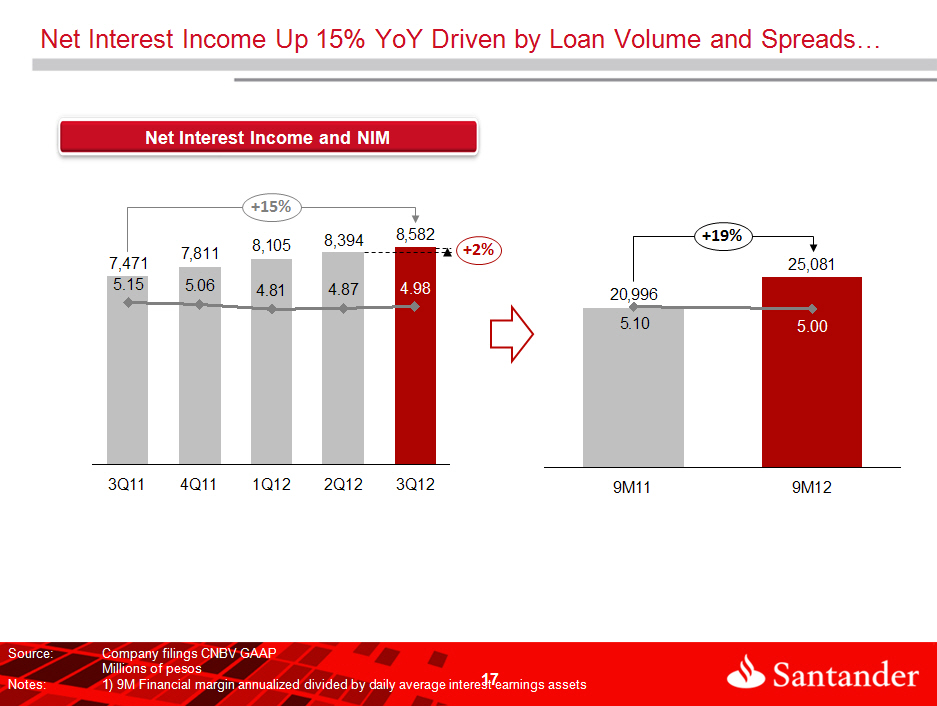
Net interest income in 3Q12 increased YoY by 14.9%, or Ps.1,111 million, to Ps.8,582 million. On a sequential basis net interest income rose 2.2%, or Ps.188 million.
Net interest margin for 3Q12 was 4.98%, increasing 11bps from 4.87% in 2Q12 and 17bps below 5.15% in 3Q11.
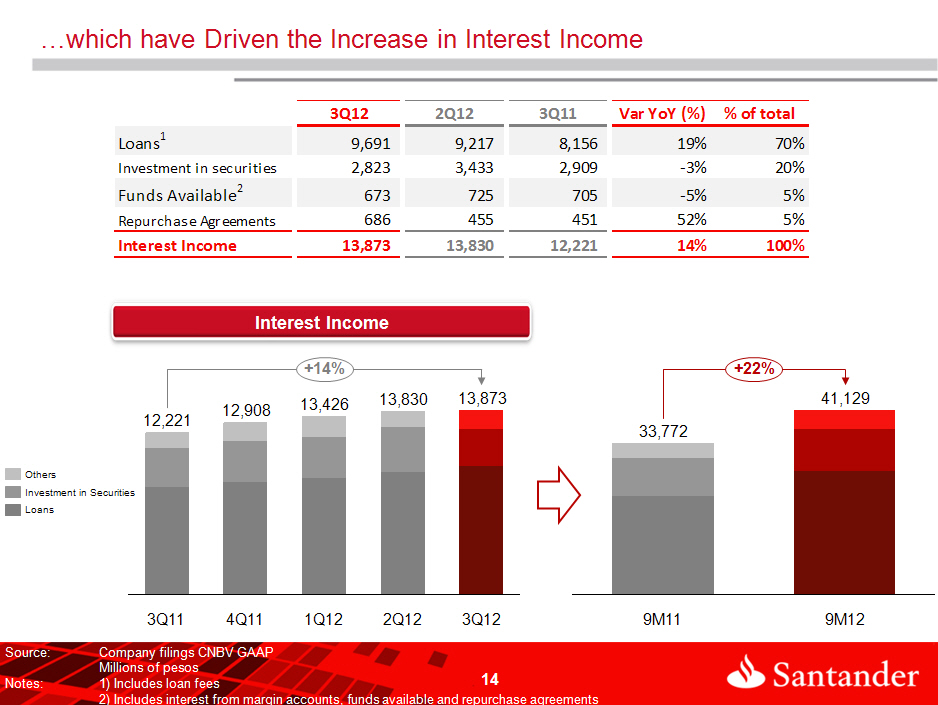
Interest income increased 13.5%, or Ps.1,652 million, reaching Ps.13,873 million in 3Q12 compared with Ps.12,221 million in 3Q11. This growth was mainly driven by higher interest income derived from our loan portfoilio which reached Ps.1,554 million.
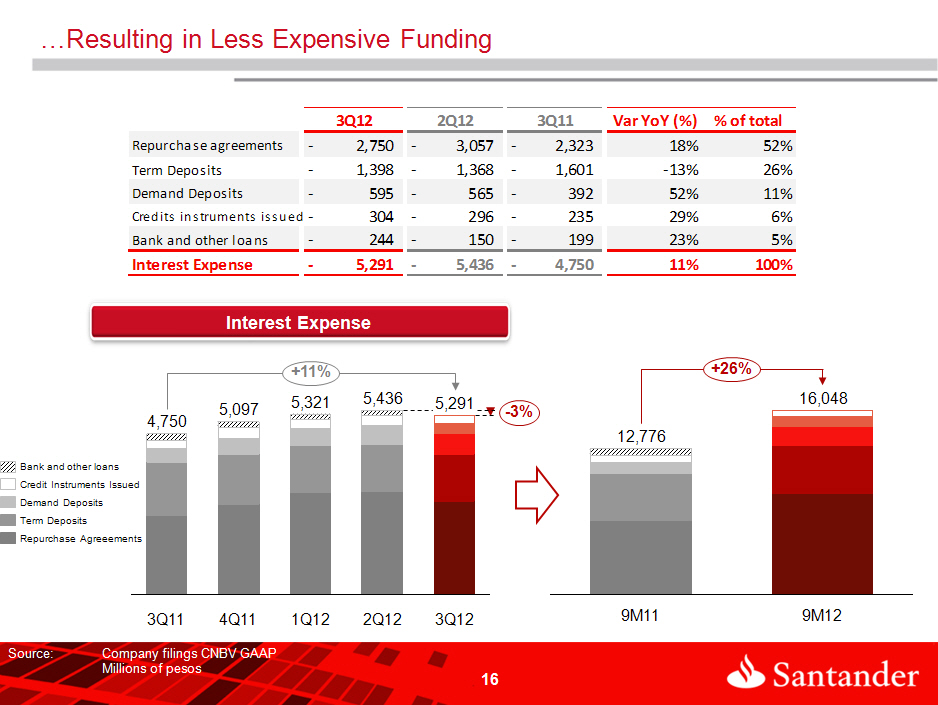
Interest expense increased 11.4%, or Ps.541 million, reaching Ps.5,291 million in 3Q12 compared with Ps.4,750 million in 3Q11. This growth was mainly driven by higher interest paid on our sale and repurchase agreements of Ps.427 million as a consequence of higher volumes.
3Q. 12 | EARNINGS REPORT | 2
Loan Portfolio Growth
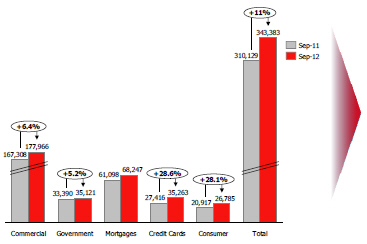
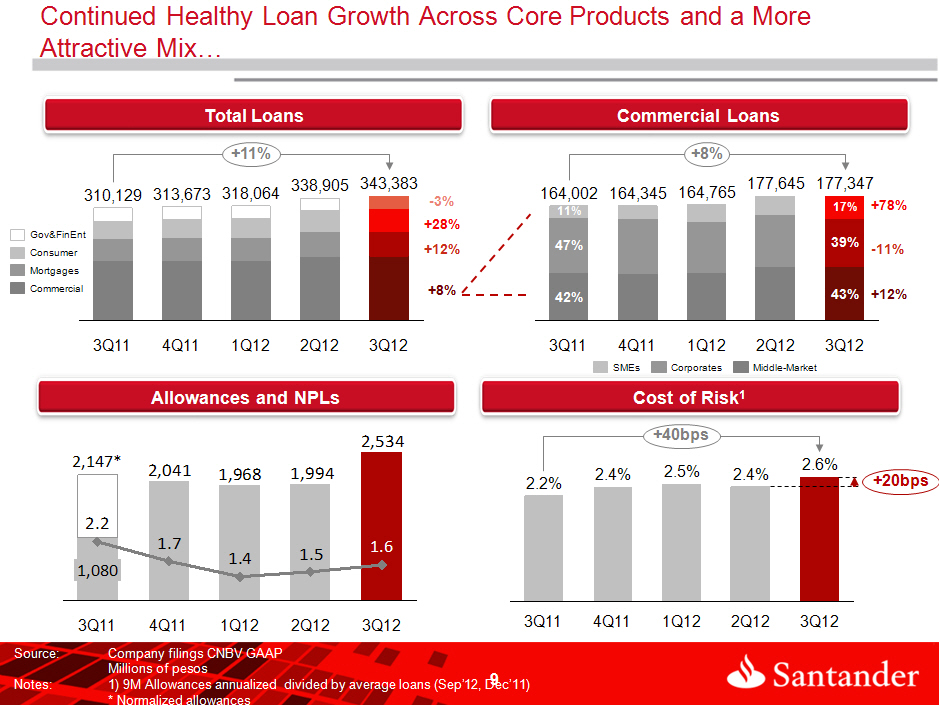
Santander México’s total loan portfolio in 3Q12 increased YoY by 10.7%, or Ps.33,254 million, to Ps.343,383 million, and 1.3%, or Ps.4,478 million, on a sequential basis.
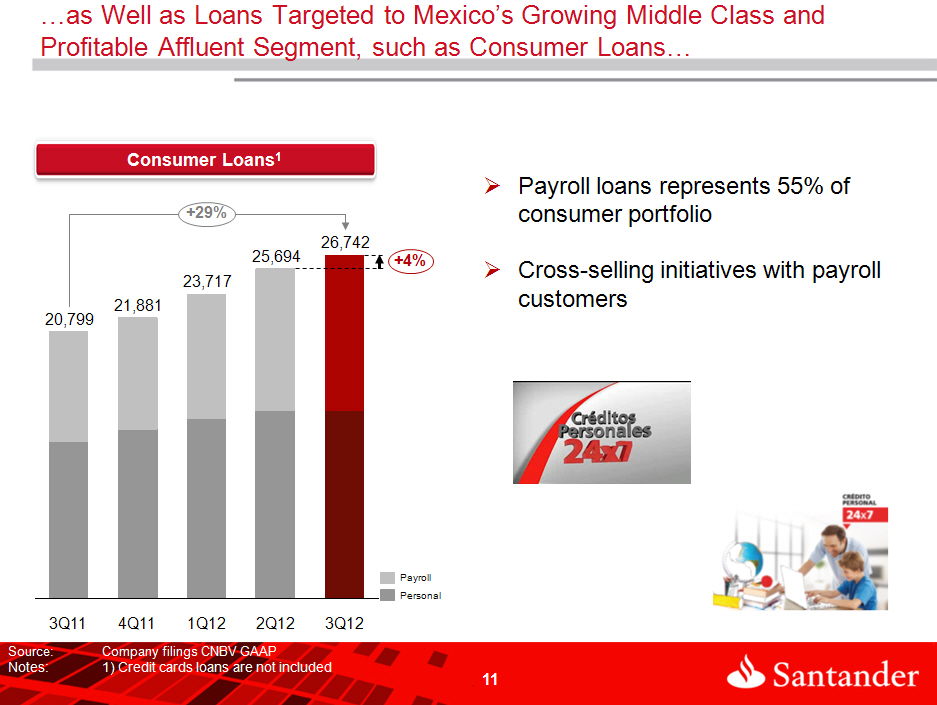
During 3Q12 Santander México continued to expand its loan portfolio across all core products, both in terms of commercial and individual loans. Individual loans were mainly driven by consumer loans, particualrly credit cards and mortgages. Commercial loans benefited from a significant YoY increase in the SME portfolio.
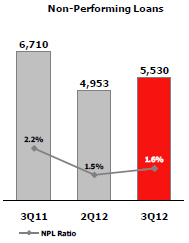
Asset Quality
Non-performing loans as of 3Q12 declined to Ps.5,530 million, from Ps.6,710 million reported in 3Q11. On a sequential basis, non-performing loans increased 11.7%, or Ps.577 million.
The NPL ratio for 3Q12 declined to 1.6%, from 2.2% in 3Q11 and remained relatively unchanged from 1.5% in 2Q12, reflecting our stringent credit scoring model and ongoing monitoring of the quality of our portfolio.
The coverage ratio for the quarter increased to 205.4%, from 162.5% in 3Q11, but declined from 224.1% in 2Q12. This sequential decrease was mainly due to the nominal increase in non-performing loans resulting from the growth in the loan portfolio.
Loans to Deposit Ratio
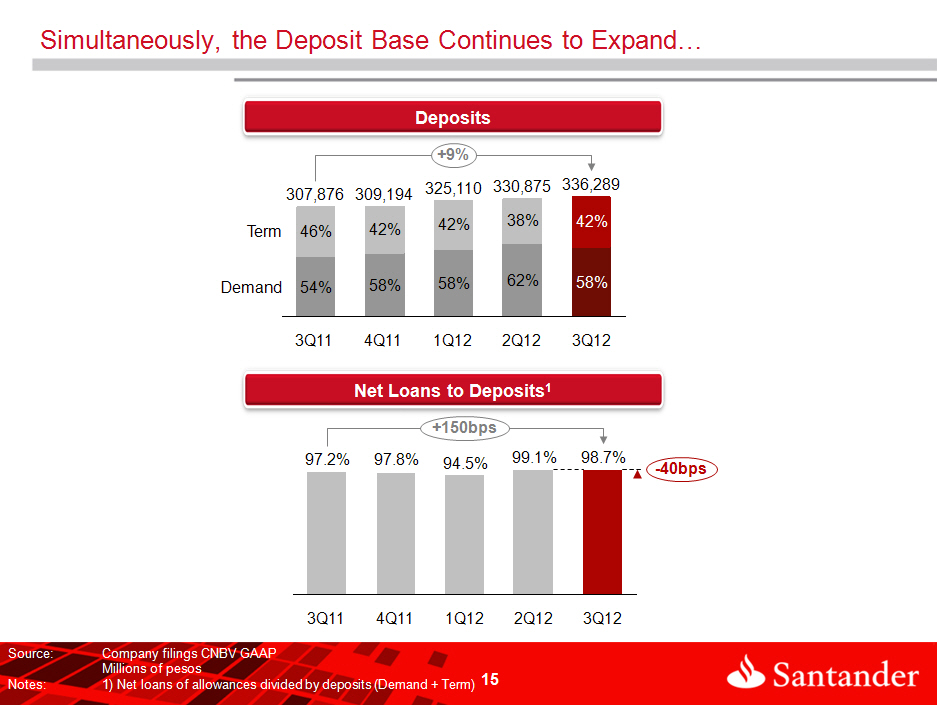
During 3Q12, deposits accounted for more than 50% of the Bank’s total funding sources, and expanded 9.2% YoY and 1.6% sequentially. This desposit base provides a stable, low cost source of funding to support the Bank’s continued growth.
The loan to deposit ratio was 98.7% in 3Q12, increasing from 97.2% in 3Q11, but declining from 99.1% in 2Q12.
Contribution to Net Income
As previously discussed, net income for 3Q12 was Ps.4,215 million, representing a 2.2% YoY increase and a 20.2% decline sequentially. Excluding the net impact of the reversal of provisions in 3Q11 and the gains from the sale of branches branches in 2Q12, net income would have increase 24.8% YoY and 3.5% sequentially.
Casa de Bolsa Santander, the brokerage business, reported net income of Ps.116 million, compared with a Ps.18 million loss reported in 3Q11 and a Ps.12 million gain in 2Q12.
Net income for the Holding and other subisidaries, amounted to Ps.29 million, compared with Ps.206 million in 3Q11 and Ps.32 million in 2Q12.
Grupo Financiero Santander México Earnings Contribution by Subsidiary | | | | | | |
| Million of Mexican Pesos | | | | | | |
| | 3Q12 | 2Q12 | 3Q11 | 9M12 | 9M11 | YoY % |
Banking business1/ | 4,069 | 5,240 | 3,934 | 14,179 | 10,381 | 36.6 |
| Brokerage | 116 | 12 | (18) | 216 | 31 | 596.8 |
Holding and other subsidiaries2/ | 29 | 32 | 206 | 117 | 528 | (77.8) |
| Net income attributable to Grupo Financiero Santander | 4,214 | 5,284 | 4,122 | 14,513 | 10,941 | 32.7 |
1/ Includes Sofomers 2/ Asset management subsidiary and Holding.
3Q. 12 | EARNINGS REPORT | 3
ANALYSIS OF THIRD-QUARTER 2012 CONSOLIDATED RESULTS
Net Income
Grupo Financiero Santander México Income Statement | | | | | | | | |
| Millions of Mexican Pesos | | | | % Change | | | % Change |
| | 3Q12 | 2Q12 | 3Q11 | QoQ | YoY | 9M12 | 9M11 | 12/11 |
| Net interest income | 8,582 | 8,394 | 7,471 | 2.2 | 14.9 | 25,081 | 20,995 | 19.5 |
| Provision for loan losses | (2,534) | (1,994) | (1,080) | (27.1) | (134.6) | (6,496) | (4,515) | (43.9) |
| Net interest income after provisions for loan losses | 6,048 | 6,400 | 6,391 | (5.5) | (5.4) | 18,585 | 16,480 | 12.8 |
| Commission and fee income, net | 3,065 | 2,836 | 2,680 | 8.1 | 14.4 | 8,864 | 7,736 | 14.6 |
| Gains (losses) on financial assets and liabilities | 921 | 106 | 29 | 768.9 | 3,075.9 | 1,781 | 939 | 89.7 |
| Other operating income (expenses) | 88 | 2,005 | 266 | (95.6) | (66.9) | 2,763 | 768 | 259.8 |
| Administrative and promotional expenses | (5,179) | (4,559) | (4,630) | (13.6) | (11.9) | (14,214) | (12,890) | (10.3) |
| Operating income | 4,943 | 6,788 | 4,736 | (27.2) | 4.4 | 17,779 | 13,033 | 36.4 |
| Equity in results of associated companies | 18 | 17 | 13 | 5.9 | 38.5 | 54 | 53 | 1.9 |
| Operating income before taxes | 4,961 | 6,805 | 4,749 | (27.1) | 4.5 | 17,833 | 13,086 | 36.4 |
| Current and deferred income taxes | (746) | (1,519) | (808) | 50.9 | 7.7 | (3,319) | (2,616) | (26.9) |
| Income from continuing operations | 4,215 | 5,286 | 3,941 | (20.3) | 7.0 | 14,514 | 10,470 | 38.6 |
| Profit from discontinued operations, net | 0 | 0 | 184 | 0.0 | (100.0) | 0 | 474 | (100.0) |
| Non-controlling interest | 0 | (1) | (2) | 100.0 | 100.0 | (1) | (3) | 66.7 |
| Net income | 4,215 | 5,285 | 4,123 | (20.2) | 2.2 | 14,513 | 10,941 | 32.6 |
Santander México reported net income of Ps.4,215 million in 3Q12, a 2.2% YoY increase and a 20.2%. sequential decline. Excluding the extraordinary impact from the net effect of the reversal of provisions for loan losses in 3Q11 and the gain from the sale of branches in 2Q12, net income would have increased 24.8% and 3.5%, respectively.
Net interest income for 3Q12 rose to Ps.8,582 million, representing a YoY increase of Ps.1,111 million, or 14.9%, and a sequential gain of Ps.188 million, or 2.2%. This increase resulted from the increase in the Bank’s business volume and a more profitable product mix, despite lower revenues from investments in securities.
Provisions for loan losses for the quarter rose to Ps.2,534 million, representing increases of Ps.1,454 million, or 134.6%, YoY and Ps.540 million, or 27.1%, on a sequential basis. Excluding the Ps.1,067 million reversal of provisions for loan losses in 3Q11, provisions for loan losses would have increased by Ps.387 million, or 18%, during the period.
The NPL ratio as of 3Q12 declined to 1.6%, from 2.2% in 3Q11, and remained relatively unchanged from 1.5% in 2Q12.
The coverage ratio for 3Q12 declined to 205.4%, from 224.1% reported in 2Q12, but increased from 162.5% in 3Q11 as a result of higher non-performing loans but in line with our loan growth.
3Q. 12 | EARNINGS REPORT | 4
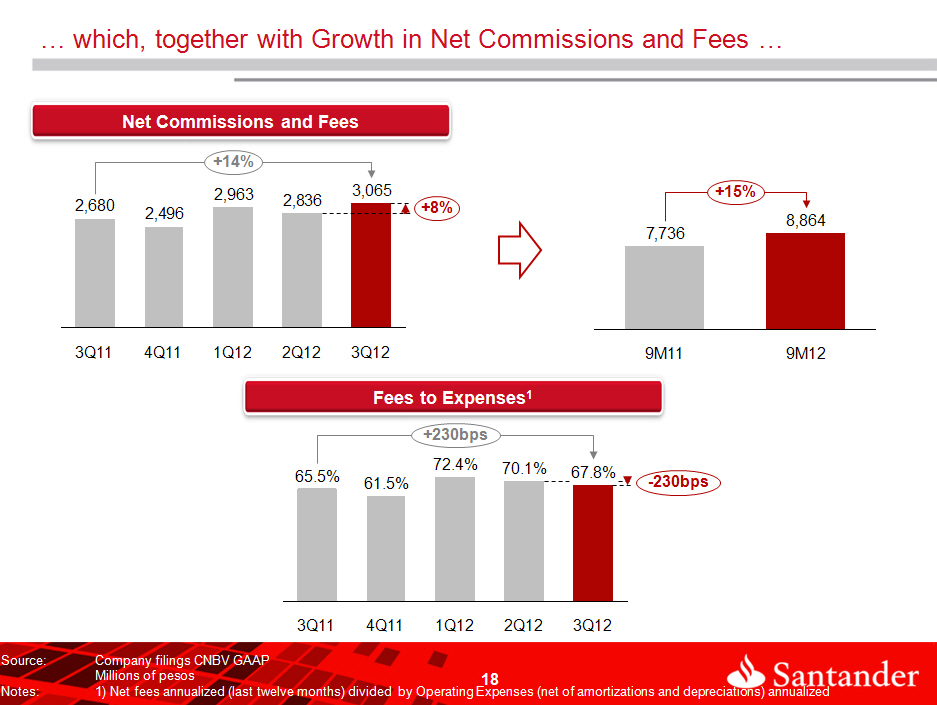
Net commissions and fee income for 3Q12 amounted to Ps.3,065 million, a YoY increase of 14.4%, or Ps.385 million and 8.1%, or Ps.229 million, higher on a sequential basis. The sequential increase is principally due to higher insurance, credit cards, and public offering fees.
Net gains from financial assets and liabilities income in 3Q12 increased to Ps.921 million, compared with Ps.29 million in 3Q11 and Ps.106 million in the 2Q12. Gains from financial assets and liabilities income in 3Q12 is mainly explained by the Ps.408 million valuation gain principally resulting from debt instruments, and a trading gain of Ps.513 million in 3Q12.
For 9M12, gains from financial assets and liabilities income increased to Ps.1,781 million, an 89.7% increase from 9M12 levels.
Other net income in 3Q12 declined to Ps.88 million, from Ps.266 million in 3Q11 and Ps.2,005 million in 2Q12. 2Q12 figures include an extraordinary gain of Ps.1,730 million derived from the sale of branches.
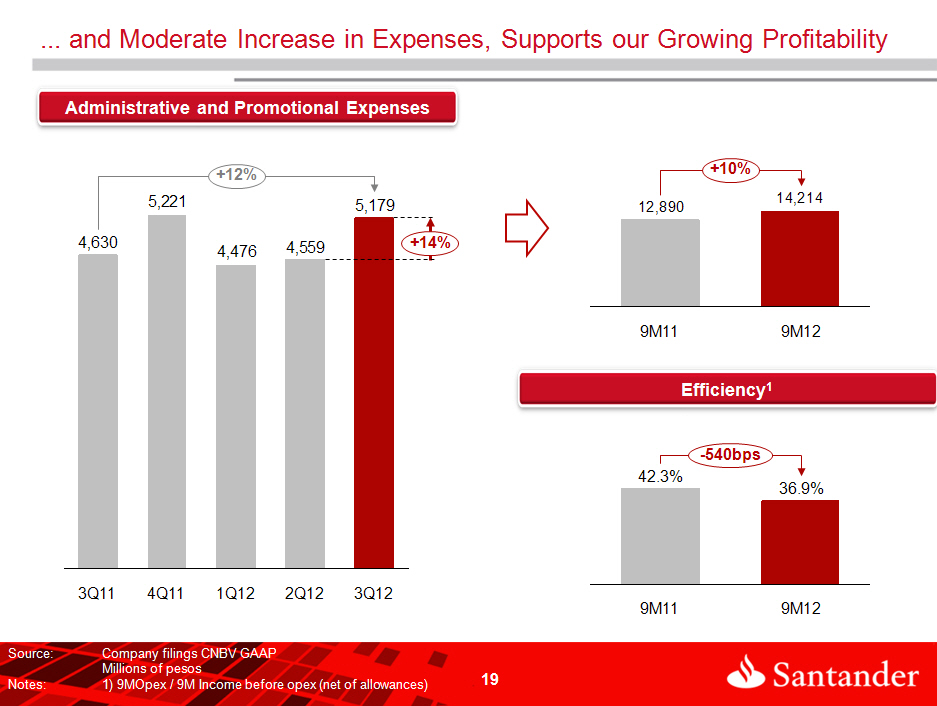
Administrative and promotional expenses as of 3Q12 amounted to Ps.5,179 million, that is Ps.549 million or 11.9% higher than in the 3Q11 and Ps.620 million or 13.6% higher than the amount reported in the 2Q12. The increase is mainly related to personnel and administrative expenses as a consequence of the growth in the business.
Other operating income in 3Q12, totaled Ps.4,943 million, representing a YoY increase of Ps.207 million, or 4.4%. On a sequential basis, other operating income decreased by Ps.1,845 million or 27.2% versus 2Q12. The above includes the effect of the extraordinary income obtained in the 2Q12, from the sale of the branches.
Net income as of 9M12 amounted to Ps.14,513 million, which is a Ps.3,572 million or 32.6% increase versus the Ps.10,941 million obtained in 9M11. Excluding extraordinary incomes, the net income for 9M12 increased Ps.3,107 million, or 30.5%, to Ps.13,301 million. This compares with Ps.10,194 million in 9M11.
These results reflect mainly the combined effect of the following:
| | § | 19.5%, or Ps.4,086 million, in the net interest income of Ps.20,995 million in 9M11 to Ps.25,081 million in the net interest income, basically explained by the increase in the loan portfolio; |
| | § | 14.6%, or Ps.1,128 million in net commissions and fee income, versus the Ps.7,736 million in 9M11 to Ps.8,864 million in 9M12, principally explained by fee income increase in insurance, management of account and technical assistance and public offers; |
| | § | 89.7%, or Ps.842 millions, in net gain from financial assets and liabilities of Ps.939 million in 9M11 to Ps.1,781 million in 9M12; and |
| | § | 259.8%, or Ps.1,995 million in other operating income of Ps.768 million in 9M11 to Ps.2,763 million in 9M12, explained by the Ps.1,730 million sale of the branches made in the 2Q12. |
These positive results were partially offset by:
| | § | Growth in loans provisions for loan losses for Ps.1,981 million, or 43.9%, mainly due to the growth in the loan portfolio as well as the reversal of provisions for loan losses of Ps.1,067 million in 3Q11; and |
| | § | Ps.1,324 million or 10.3% increase in administrative and promotional expenses of Ps.12,890 million in 9M11, to Ps.14,214 million in 9M12, mainly explained by the 12.9% increase in personnel expenses. |
Furthermore, as of 9M12 current and deferred income taxes increased by Ps.703 million or 26.9%, reaching Ps.3,319 million compared with the same period last year.
3Q. 12 | EARNINGS REPORT | 5
Net Interest Income
Grupo Financiero Santander México Net Interest Income | | | | | | | | |
| Millions of Mexican Pesos | | | | % Change | | | % Change |
| | 3Q12 | 2Q12 | 3Q11 | QoQ | YoY | 9M12 | 9M11 | 12/11 |
| Interest income | | | | | | | | |
| Funds Available | 662 | 711 | 662 | (6.9) | 0.0 | 2,107 | 1,920 | 9.7 |
| Margin accounts | 11 | 14 | 43 | (21.4) | (74.4) | 53 | 138 | (61.6) |
| Interest from investment in securities | 2,823 | 3,433 | 2,909 | (17.8) | (3.0) | 9,382 | 8,534 | 9.9 |
| Loan portfolio – excluding credit cards | 7,399 | 7,083 | 6,332 | 4.5 | 16.9 | 21,263 | 16,978 | 25.2 |
| Credit card loan portfolio | 2,141 | 1,975 | 1,654 | 8.4 | 29.4 | 5,943 | 4,803 | 23.7 |
| Loan origination fees | 151 | 159 | 170 | (5.0) | (11.2) | 482 | 440 | 9.5 |
| Sale and repurchase agreements | 686 | 455 | 451 | 50.8 | 52.1 | 1,899 | 959 | 98.0 |
| Interest Income | 13,873 | 13,830 | 12,221 | 0.3 | 13.5 | 41,129 | 33,772 | 21.8 |
| | | | | | | | | |
| Interest expense and similar charges | | | | | | | | |
| Customer deposits – Demand deposits | (595) | (565) | (392) | (5.3) | (51.8) | (1,656) | (1,035) | (60.0) |
| Customer deposits – Time deposits | (1,398) | (1,368) | (1,601) | (2.2) | 12.7 | (4,134) | (4,100) | (0.8) |
| Credit instruments issued | (304) | (296) | (235) | (2.7) | (29.4) | (896) | (592) | (51.4) |
| Interbank loans | (244) | (150) | (199) | (62.7) | (22.6) | (527) | (598) | 11.9 |
| Sale and repurchase agreements | (2,750) | (3,057) | (2,323) | 10.0 | (18.4) | (8,835) | (6,452) | (36.9) |
| Interest Expense | (5,291) | (5,436) | (4,750) | 2.7 | (11.4) | (16,048) | (12,777) | (25.6) |
| | | | | | | | | |
| Net Interest Income | 8,582 | 8,394 | 7,471 | 3.0 | 2.1 | 25,081 | 20,995 | 19.5 |
Net interest income in 3Q12 amounted to Ps.8,582 million, representing QoQ and YoY increases of 2.2%, Ps.188 million, and 14.9%, or Ps.1,111 million, respectively. During 9M12, net interest income rose 19.5%, or Ps.4,086 million, to Ps.25,081 million, from Ps.20,995 million in 9M11. This is principally explained by an increase in interest income on the loan portfolio.
The YoY increase in net interest income is explained by the combined effect of the Ps.1,652 million increase in interest income, from Ps.12,221 million in 3Q11 to Ps$13,873 million in 3Q12, and a Ps.541 million increase in interest expense, from Ps.4,750 million in 3Q11 to Ps. 5,291 million in 3T12. This was the result of a Ps.71,262 million increase in average interest-earnings assets, together with an 11 basis points increase in the average interest rate gained. Average interest-bearing liabilities rose Ps.43,376 million, presenting a 9 basis points increase in the average interest rate paid.
The sequential increase in net interest income is explained by the combined effect of the Ps.43 million increase in interest income, from Ps.13,830 million in 2Q12 to Ps.13,873 million in 3Q12, and a Ps.145 million decline in interest expense, from Ps.5,436 million in 2Q12 to Ps.5,291 million in 3Q12. This is explained by the Ps.16,332 million decline in average-earnings assets, together with a 23 basis points increase in the average interest rate earned, combined with a Ps.16,622 million decline in interest-bearing liabilities, together with a 1 basis point increase in the average interest rate paid.
The increase in net interest income in the nine month period, is explained by the combined effect of the Ps.7,357 million increase in interest income, from Ps.33,772 million in 9M11 to Ps.41,129 million in 9M12, and a Ps.3,271 million increase in interest expense, from Ps. 12,776 million in 9M11 to Ps.16,048 million in 9M12. This is explained by the Ps.127,964 million decline in average-earnings assets, together with a 12 basis points
3Q. 12 | EARNINGS REPORT | 6
decline in the average interest rate earned, combined with a Ps.90,248 million decline in average interest-bearing liabilities, together with an 18 basis point increase in the average interest rate paid.
Interest Income
Interest income was Ps.13,830 million in 2Q12 and Ps.13,873 million in 3Q12. This is explained by the combined increase of Ps.482 million in the loan portfolio and Ps.231 million from the increase in sale and repurchase agreements, negatively impacted by lower interest income on investment in securities for Ps.610 million resulting from the decline of Ps.50,559 million in the average balance of investments in securities.
Interest income increased YoY by 13.5%, or Ps.1,652 million, from Ps.12,221 million in 3Q11 to Ps.13,873 million in 3Q12, principally resulting from the increase in interest income on our loan portfolio of Ps.1,554 million.
The breakdown of interest income for 3Q12 is as follows: loan portfolio 66.9%, investment in securities 20.3%, and 9.8% in other items.
The average interest gain on interest-earning assets increased in 3Q12 to 8.36%, representing an 11 basis points increase from 8.25% in 3Q11 and a 23 basis point growth compared with 8.13% in 2Q12.
3Q12 interest-earning assets decreased by Ps.16,332 million, or 2.4%, mainly driven by: a decline in lower investments in securities of PS.50,559 million, from Ps.254,393 million in 2Q12 to Ps.203,384 million in 3Q12.
9M12 average interest-earning assets increased by 23.5%, or Ps.127,964 million, to Ps.671,752 million, compared with Ps.543,788 million in 9M11.
9M12 interest income increased by Ps.7,357 million, or 21.78%, to Ps.41,129 million, compared with Ps.33,772 in 9M11.
The evolution of the loan portfolio continues to show positive trends, the diversification among all segments, and growth in all core businesses.
Loan Portfolio Composition
3Q. 12 | EARNINGS REPORT | 7
Loan Portfolio
The total loan portfolio rose YoY by 10.7%, or Ps.33,254 million, to Ps.343,383 million as of 3Q12. On a sequential basis, the total loan portfolio increased 1.3%, or Ps.4,478 million. During the quarter, Santander México continued to experience loan growth across all core segments and products.
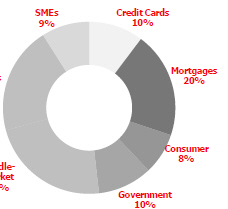
Grupo Financiero Santander México Loan Portfolio Breakdown | | | | | | | | |
| Millions of Mexican Pesos | | | | | | | | |
| | | | | | | | | |
| | 3Q12 | % | | 2Q12 | % | | 3Q11 | % |
| Commercial | 176,564 | 51.4% | | 176,938 | 52.2% | | 165,468 | 53.4% |
| Government | 35,121 | 10.2% | | 35,554 | 10.5% | | 31,997 | 10.3% |
| Consumer | 59,996 | 17.5% | | 57,043 | 16.8% | | 47,101 | 15.2% |
| Credit cards | 34,208 | 10.0% | | 32,053 | 9.5% | | 26,692 | 8.6% |
| Other | 25,788 | 7.5% | | 24,990 | 7.4% | | 20,409 | 6.6% |
| Mortgages | 66,172 | 19.3% | | 64,417 | 19.0% | | 58,853 | 19.0% |
| Total Performing Loan | 337,853 | 98.4% | | 333,952 | 98.5% | | 303,419 | 97.8% |
| | | | | | | | | |
| Commercial | 1,402 | 0.4% | | 1,313 | 0.4% | | 1,840 | 0.6% |
| Government | 0 | 0.0% | | 0 | 0.0% | | 1,393 | 0.4% |
| Consumer | 2,053 | 0.6% | | 1,709 | 0.5% | | 1,232 | 0.4% |
| Credit cards | 1,055 | 0.3% | | 948 | 0.3% | | 724 | 0.2% |
| Other | 998 | 0.3% | | 761 | 0.2% | | 508 | 0.2% |
| Mortgages | 2,075 | 0.6% | | 1,931 | 0.6% | | 2,245 | 0.7% |
| Total Non-Performing Loan | 5,530 | 1.6% | | 4,953 | 1.6% | | 6,710 | 2.2% |
| | | | | | | | | |
| Total Loan Portfolio | 343,383 | 100.0% | | 338,905 | 100.0% | | 310,129 | 100.0% |
3Q. 12 | EARNINGS REPORT | 8
The Commercial Portfolio, is composed of loans to business and commercial enterprises, as well as loans to government entities and financial institutions, and represents 62.1% of the total performing loans portfolio. Excluding loans to government, the commercial portfolio accounted for 51.8% of the total performing loans portfolio as of 3Q12 and increased 6.4% YoY, principally reflecting the 78.4% and 11.5% increase in SMEs and middle market, respectively. On a sequential basis, and excluding loans to government, the commercial portfolio declined 0.2%, principally supported by the performance of SMEs and middle market during the quarter, which increased 16.9% and 0.4%, respectively. Growth in these segments principally reflects Santander México’s focus on supporting the develpoment of SMEs and therefore the growth of the country.
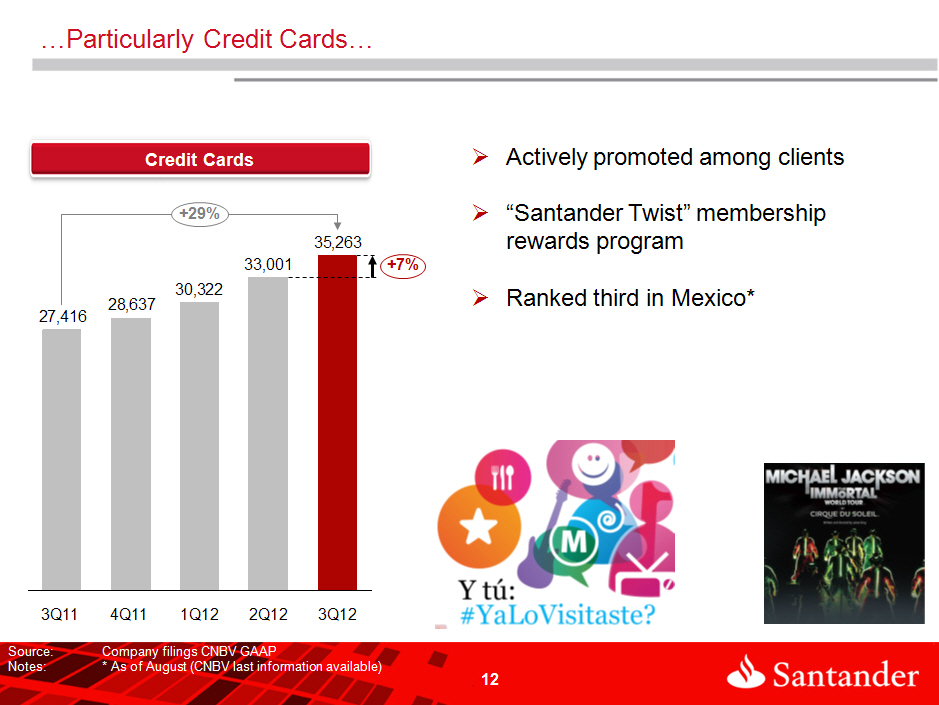
The Individual Loan Portfolio, composed of mortgages, credit card and consumer loans, represents 37.9% of the total loan portfolio. Credit cards, consumer and mortgages loans represent 10.3%, 7.8%, and 19.9% of the total loan portfolio, respectively, and increased YoY by 28.6%, 28.1%, and 11.7%, respectively. This quarter credit card loans increased 6.9% sequentially, reversing a previously reported downward trend in credit card loans. Our mortgage loans strategy remains focused on targeting the middle market segment and residential. Our strategy for consumer loans aims to support families, and loans to this client segment increased 4.1% QoQ. Overall growth in the consumer loan portfolio this quarter was principally driven by the efforts and outstanding results achieved by our commercial teams throughout our branch network, and the progression of our multichannel strategy, which helped drive a 48% YoY increase in consumer loan origination.
Interest Expense
Interest expense increased 11.4%, or Ps.541 million, to Ps.5,291 million in 3Q12, compared with Ps.4,750 million in 3Q11, principally explained by the Ps.427 million increase in interest paid on sale and repurchase agreements due to higher volume. On a sequential basis, interest expense fell Ps.145 million, mainly reflecting a decrease in the average balance of sale and repurchase agreements.
In 9M12 interest expense was Ps.16,048 million, a Ps.3,272 million increase, compared with Ps.12,777 million recorded in 9M11.
The Ps.5,291 million in interest expenses paid in 3Q12, is broken down as follows: sale and repurchase agreements 52%, term deposits 26.4%, demand deposits 11.2%, credit instruments issued 5.7%, and interbank loans 4.7%.
3Q. 12 | EARNINGS REPORT | 9
Total deposits at the end of 3Q12 amounted to Ps.336,289 million, or 9.2% higher than the corresponding figure at quarter-end 3Q11. Santander México continues to implement its strategy of enhancing customer service, in accordance with the needs of each segment. This strategy has allowed us to increase demand deposits from both individuals and corporates. As of 3Q12, demand deposits reached Ps.194,351 million, increasing 16.4% YoY, and declining 5.0% on a sequential basis. Total term deposits remained stable at Ps.141,938 million YoY, and increased 12.4% compared with 2Q12.
Interest expense on demand deposits amounted to Ps.595 million during 3Q12, representing YoY and sequential increases of 51.8% and 5.3%, respectively, driven by a higher average balance in demand deposits and an increase in the interest rate paid.
Interest paid on term deposits declined 12.7% YoY to Ps.1,398 million. On a sequential basis, interest paid on term deposits increased 2.2% reflecting average volume increase together with an average rate increase.
Asset Quality
Non-performing loans at the end of 3Q12 declined by Ps.1,180 million, or 17.6% YoY, to Ps.5,530 million, but increased on a sequential basis by 11.7%, or Ps.577 million. The breakdown of the non-performing loan portfolio is as follows: commercial loans 26.5%, consumer loans 34.5%, and mortgages 39%.
The YoY decrease in non-performing loans, is basically due to a regularization of government non-performing loans, which in 3Q11 accounted for Ps.1,393 million. In addition, a decrease in non-performing commercial and mortgage loans, offset higher non-performing consumer and credit card loans. The sequential increase in non-performing loans is principally due to increases in consumer loans, credit cards loans, and to a lesser extent in mortgage loans.
| Grupo Financiero Santander México | | | | | | |
| Asset Quality | | | | | | | |
| Millions of Pesos | | | | | | | |
| | | 2012 | | 2011 | | Change % |
| | 3Q12 | 2Q12 | | 3Q12 | | QoQ | YoY |
| Total Loans | 343,383 | 338,905 | | 310,129 | | 1.32% | 10.72 |
| Performing Loans | 337,853 | 333,952 | | 303,419 | | 1.17% | 11.35 |
| Non-performing Loans | 5,530 | 4,953 | | 6,710 | | 11.65% | (17.59) |
| | | | | | | | |
| Allowance for loan losses | (11,360) | (11,101) | | (10,906) | | 2.33% | 4.16 |
| | | | | | | | |
| Non-performing loan ratio | 1.61% | 1.46% | | 2.16% | | 15bps | (55)bps |
| Coverage ratio | 205.4 | 224.1 | | 162.5 | | (1,870)bps | 4,292bps |
3Q. 12 | EARNINGS REPORT | 10
The NPL ratio improved to 1.6% in 3Q12, from 2.2% in 3Q11 and remained essentially unchanged compared with the 1.5% reported in 2Q12, reflecting our strict monitoring and portfolio quality assessment processes, which allows the adjustment of loan origination through approval policies in accordance with the performance of the loan portfolio. The coverage ratio for the quarter increased to 205.4%, from 162.5% in 3Q11, but declined from 224.1% in 2Q12. The sequential decrease mainly reflects a nominal increase in non-performing loans resulting from the growth in the loan portfolio.
During 3Q12 allowance for loan losses amounted to Ps.2,534 million, which represented a 27.1% increase compared with 2Q12, principally generated in the mortgage and credit card loan portfolios.
During 9M12, allowances for loan losses increased by 43.9%, or Ps.1,981 million, to Ps.6,496 million compared with the same period last year. This increase is mainly explained by the 10.7% growth in the loan portfolio during the last twelve months, negatively impacted by the reversal of provisions in 3Q11.
3Q. 12 | EARNINGS REPORT | 11
Commission and Fee Income (Net)
Grupo Financiero Santander México Commission and Fee Income | | | | | | | | |
| Millions of Mexican Pesos | | | | | | | | |
| | | | | % Change | | | % Change |
| | 3Q12 | 2Q12 | 3Q11 | QoQ | YoY | 9M12 | 9M11 | 12/11 |
| Credit and debit cards | | | | | | | | |
| Cash management | 1,026 | 926 | 859 | 10.8 | 19.4 | 2,816 | 2,430 | 15.9 |
| Collection and payment services | 176 | 179 | 159 | (1.7) | 10.7 | 530 | 418 | 26.8 |
| Insurance | 347 | 365 | 291 | (4.9) | 19.2 | 1,083 | 949 | 14.1 |
| Investment fund management | 783 | 737 | 593 | 6.2 | 32.0 | 2,193 | 1,656 | 32.4 |
| Financial advisory services | 461 | 465 | 483 | (0.9) | (4.6) | 1,386 | 1,413 | (1.9) |
| Capital markets and securities activities | 430 | 244 | 318 | 76.2 | 35.2 | 1,064 | 963 | 10.5 |
| Checks | 151 | 162 | 147 | (6.8) | 2.7 | 468 | 412 | 13.6 |
| Foreign trade | 86 | 89 | 96 | (3.4) | (10.4) | 265 | 288 | (8.0) |
| Other commissions and fees | 126 | 144 | 96 | (12.5) | 31.3 | 397 | 367 | 8.2 |
| Total | 197 | 195 | 173 | 1.0 | 13.9 | 589 | 507 | 16.2 |
| | 3,783 | 3,506 | 3,215 | 7.9 | 17.7 | 10,791 | 9,403 | 14.8 |
| Fee and Commission Expenses | | | | | | | | |
| Credit and debit cards | | | | | | | | |
| Insurance | (377) | (375) | (282) | (0.5) | (33.7) | (1,039) | (723) | (43.7) |
| Investment fund management | (22) | (23) | (16) | 4.3 | (37.5) | (64) | (48) | (33.3) |
| Capital markets and securities activities | (28) | (27) | (26) | (3.7) | (7.7) | (79) | (74) | (6.8) |
| Checks | (46) | (40) | (30) | (15.0) | (53.3) | (121) | (104) | (16.3) |
| Financial advisory services | (9) | (9) | (10) | 0.0 | 10.0 | (27) | (32) | 15.6 |
| Other commissions and fees | (11) | (1) | (1) | (1,000.0) | (1,000.0) | (22) | (207) | 89.4 |
| Total | (225) | (195) | (170) | (15.4) | (32.4) | (575) | (479) | (20.0) |
| | (718) | (670) | (535) | (7.2) | (34.2) | (1,927) | (1,667) | (15.6) |
| Commission and Fee Income, net | | | | | | | | |
| Credit and debit cards | 3,065 | 2,836 | 2,680 | 8.1 | 14.4 | 8,864 | 7,736 | 14.6 |
In 3Q12 net commission and fee income amounted to Ps.3,065 million, representing a YoY increase of 14.4%, or Ps.385 million. The improvement compared to 3Q11 principally reflects the following YoY increases: 19.2%, or Ps.56 million, in credit and debit card fees; 31.9%, or Ps.184 million, in insurance fees; and 32.2%, or Ps.102 million, in financial advisory services.
Compared to 2Q12, net commission and fee income rose 8.1%, or Ps.229 million, mainly reflecting the
3Q. 12 | EARNINGS REPORT | 12
following sequential increases: 17.8%, or Ps.98 million, in credit card fees; 72.4%, or Ps.176 million, in financial advisory services fees primarily related to public debt and equity offerings; and 6.6%, or Ps.47 million, in insurance fees mainly reflecting growth of “Autocompara”.
During 9M12, net commission and fee income increased 14.6% YoY, or Ps.1,128 million, to Ps.8,864 million.
Net gain (loss) on financial assets and liabilities
Grupo Financiero Santander México Net gain (loss) on financial assets and liabilities Millions of Mexican Pesos | | | |
| | | | | % Change | | | % Change |
| | 3Q12 | 2Q12 | 3Q11 | QoQ | YoY | 9M12 | 9M11 | 12/11 |
| Valuation | | | | | | | | |
| Foreign currencies | (110) | 15 | 89 | (833.3) | (223.6) | (81) | 79 | (202.5) |
| Derivatives | (9) | (542) | 646 | 98.3 | (101.4) | (3) | (3,221) | 99.9 |
| Shares | 1 | 221 | (1,134) | (99.5) | 100.1 | 113 | (2,479) | 104.6 |
| Debt instruments | 526 | 435 | 550 | 20.9 | (4.4) | 1,026 | 439 | 133.7 |
| Subtotal | 408 | 129 | 151 | 216.3 | 170.2 | 1,055 | (5,182) | 120.4 |
| | | | | | | | | |
| Trading | | | | | | | | |
| Foreign currencies | 191 | 659 | 204 | (71.0) | (6.4) | 529 | 932 | (43.2) |
| Derivatives | 338 | (1,017) | 1,013 | 133.2 | (66.6) | (311) | 5,738 | (105.4) |
| Shares | 135 | 274 | (786) | (50.7) | 117.2 | 722 | (304) | 337.5 |
| Debt instruments | (151) | 61 | (553) | (347.5) | 72.7 | (214) | (245) | 12.7 |
| Subtotal | 513 | (23) | (122) | 2,330.4 | 520.5 | 726 | 6,121 | (88.1) |
| | | | | | | | | |
| Total | 921 | 106 | 29 | 768.9 | 3,075.9 | 1,781 | 939 | 89.7 |
In 3Q12, Santander México recorded a net gain on financial assets and liabilities of Ps.921 million, compared with Ps.29 million in 3Q11 and Ps.106 million in the 2Q12. Net gain on financial assets and liabilities in 3Q12 is mainly explained by a valuation gain of Ps.408 million principally related to debt instruments held, and trading gains of Ps.513 million in 3Q12.
Net gain on financial assets and liabilities in 3Q11 is principally the result of a Ps.151 million valuation gain, despite equity valuation losses. This was partially offset by a trading loss of Ps.122 million, as equity and debt instrument trading losses exceeded the gain from derivative instruments.
In 2Q12, a Ps.129 million valuation gain, resulting mainly from equity positions was partially offset by a of Ps.23 million trading loss, explained by a derivative trading loss.
3Q. 12 | EARNINGS REPORT | 13
Other Operating Income (Expense)
Grupo Financiero Santander México Other Operating Income (Expense) | | | | | | | | |
| Millions of Mexican Pesos | | | | % Change | | | % Change |
| | 3Q12 | 2Q12 | 3Q11 | QoQ | YoY | 9M12 | 9M11 | 12/11 |
| | | | | | | | | |
| Recoveries of loans previously charged-off | 467 | 457 | 392 | 2.1 | 19.1 | 1,365 | 1,118 | 22.1 |
| Income from sale of fixed assets | 1 | 1,730 | 0 | (100.0) | 0.0 | 1,732 | 0 | 0.0 |
| Allowance for loan losses released | 0 | 0 | 0 | 0.0 | 0.0 | 378 | 0 | 0.0 |
| Cancellation of liabilities and reserves | 43 | 64 | 33 | (33.3) | 29.3 | 154 | 121 | 27.0 |
| Interest on personnel loans | 31 | 29 | 27 | 8.3 | 16.3 | 89 | 81 | 10.4 |
| Recovered taxes | 0 | 0 | 15 | 0.0 | (100.0) | | 15 | (100.0) |
| Foreclosed assets reserve | (7) | (9) | (18) | 22.2 | 61.1 | (31) | (25) | (23.6) |
| Profit from sale of foreclosed assets | 44 | 34 | 7 | 29.4 | 528.6 | 112 | 12 | 836.0 |
| Acquisition of discounted loan portfolio | 0 | 0 | 0 | 0.0 | 0.0 | 0 | 112 | (100.0) |
| Technical advisory services | 25 | 32 | 17 | (21.3) | 48.2 | 75 | 52 | 44.6 |
| Portfolio recovery legal expenses and costs | (117) | (174) | (91) | 32.7 | (28.7) | (431) | (331) | (30.3) |
| Write-offs and bankruptcies | (343) | (160) | (59) | (114.4) | (481.4) | (614) | (269) | (128.3) |
| Provision for legal and tax contingencies | (97) | (53) | (23) | (83.9) | (323.7) | (199) | (142) | (40.5) |
| IPAB (indemnity) provisions and payments | (2) | (28) | (3) | 91.1 | 17.0 | (33) | (9) | (272.1) |
| Recoveries of loans previously charged-off | 44 | 83 | (31) | (47.0) | 241.9 | 167 | 33 | 406.1 |
| Total | 88 | 2,005 | 266 | (95.6) | (67.0) | 2,763 | 768 | 259.8 |
In 3Q12 other operating income declined to Ps.88 million, from Ps.266 million in 3Q11 and from Ps.2,005 million in 2Q12, which included an extraordinary gain of Ps.1,731 million derived from the sale of 220 branches to Fibra Uno. This gain on sale was partially offset by higher write-offs and losses in 3Q12.
During 9M12, other net operating income increased to Ps.2,763 million, compared with Ps.768 million in 9M11.
Administrative and Promotional Expenses
Administrative and promotional expenses consist of personnel such as payroll and benefits, promotion and advertising expenses, and other general expenses. Personnel expenses consist mainly of salaries, social security contributions, bonuses and our long-term incentive plan for our executives. Other general expenses mainly consist of: expenses related to technology and systems, administrative services, which are mainly services outsourced in the areas of information technology, taxes and duties, professional fees, contributions to IPAB, rental of properties and hardware, advertising and communication, surveillance and cash courier services and expenses related to maintenance, conservation and repair, among others
3Q. 12 | EARNINGS REPORT | 14
Grupo Financiero Santander México Administrative and Promotional Expenses | | | | | | �� | | |
| Millions of Mexican Pesos | | | | % Change | | | % Change |
| | 3Q12 | 2Q12 | 3Q11 | QoQ | YoY | 9M12 | 9M11 | 12/11 |
| Salaries and employee benefits | 2,172 | 2,154 | 1,918 | 0.8 | 13.2 | 6,394 | 5,664 | 12.9 |
| Credit card operation | 100 | 12 | 64 | 733.3 | 56.3 | 177 | 141 | 25.5 |
| Professional fees | 107 | 141 | 209 | (24.1) | (48.8) | 371 | 494 | (24.9) |
| Leasehold | 339 | 326 | 279 | 4.0 | 21.5 | 904 | 734 | 23.2 |
| Promotional and advertising expenses | 151 | 110 | 191 | 37.3 | (20.9) | 368 | 416 | (11.5) |
| Taxes and duties | 307 | 206 | 229 | 49.0 | 34.1 | 673 | 675 | (0.3) |
| Technology services (IT) | 428 | 341 | 360 | 25.5 | 18.9 | 1,169 | 1,015 | 15.2 |
| Depreciation and amortization | 389 | 377 | 376 | 3.2 | 3.5 | 1,147 | 1,076 | 6.6 |
| Contributions to bank savings protection system (IPAB) | 341 | 324 | 325 | 5.2 | 4.9 | 987 | 902 | 9.4 |
| Cash protection | 147 | 172 | 140 | (14.5) | 5.0 | 377 | 370 | 1.9 |
| Other services and expenses | 698 | 396 | 539 | 76.3 | 29.5 | 1,647 | 1,403 | 17.4 |
| | | | | | | | | |
| Total Administrative and Promotional Expenses | 5,179 | 4,559 | 4,630 | 13.6 | 11.9 | 14,214 | 12,890 | 10.3 |
3Q12 administrative and promotional expenses increased 11.9% YoY to Ps.5,179 million, driven by increases in the following areas: Ps.254 million in salaries and employee benefits, Ps.78 million in taxes and duties, Ps.68 million in technology services, Ps.60 million in leaseholds, and Ps.36 million in credit card operations accompanying the growth in the banking business.
On a sequential basis, administrative and promotional expenses rose 13.6%, principally due to the following variances: Ps.18 million in salaries and employee benefits, Ps.88 million in credit card operation, Ps.13 million in leaseholds, and Ps.87 million in technology services.
In 9M12, administrative and promotional expenses increased 10.3% to Ps.14,214 million compared with 9M11.
The efficiency ratio under CNBV standards for 3Q12 was 36.9%, this compares to the corresponding figures of 42.4% and 35% reported in 3Q11 and 2Q12, respectively. For 9M12 the efficiency ratio was 36.9%.
The recurrence ratio in 3Q12 was 67.8%, improving from 65.5% in 3Q11 and slightly decreasing versus 70.1% in 2Q12.
Current and Deferred Taxes
Current and deferred income taxes in 3Q12 amounted to Ps.746 million, 7.7% YoY and 50.9% higher QoQ. During 9M12, current and differed income taxes amounted to Ps.3,319 million, representing a 26.9% increase against 9M12.
3Q. 12 | EARNINGS REPORT | 15
Capitalization and ROAE
| Grupo Financiero Santander México | | | | | |
Capitalization Millions of Mexican Pesos | | | | | |
| | 3Q12 | | 2Q12 | | 3Q11 |
| Tier 1 | 73,570 | | 73,579 | | 68,417 |
| Tier 2 | 1,538 | | 1,529 | | 1,466 |
| Total Capital | 75,108 | | 75,108 | | 69,884 |
| | | | | | |
| Risk-Weighted Assets | | | | | |
| Credit Risk | 313,707 | | 307,413 | | 275,589 |
| Credit, Market, and Operational Risk | 519,647 | | 513,305 | | 490,840 |
| | | | | | |
| Credit Risk Ratios: | | | | | |
| Tier 1 (%) | 23.4 | | 23.9 | | 24.8 |
| Tier 2(%) | 0.5 | | 0.5 | | 0.5 |
| Capitalization Ratio (%) | 23.9 | | 24.4 | | 25.4 |
| | | | | | |
| Total Capital Ratios: | | | | | |
| Tier 1(%) | 14.2 | | 14.3 | | 13.9 |
| Tier 2 (%) | 0.3 | | 0.3 | | 0.3 |
| Capitalization Ratio (%) | 14.5 | | 14.6 | | 14.2 |
Banco Santander México’s capital ratio was 14.45% in 3Q12, above the corresponding figures of 14.23% and below 14.63%, in 3Q11 and 2Q12, respectively. The capital ratio reflelcts the impact of the Ps.7.3 billion cash dividend paid during the quarter. The core capital ratio amounted to 14.2% in 3Q12, compared with 13.9% in 3Q11 and 14.3% in 2Q12.
As of June 2012, Santander México is classified within Category 1 in accordance with Article 134bis of the Mexican Banking Law, and remains in this category as per the preliminary results dated July 2012, which is the most recently available analysis.
ROAE in 3Q12 was 21.1%, an increase of 421 bps from the 16.9% reported in 3Q11, and 130 bps below the 22.4% in 2Q12. This sequential decrease reflects the extraordinary gain from the sale of 220 branches in 2Q12. Normalized ROAE in 3Q12 was 19.4%, a 353 bps increase from 15.8% in 3Q11.
RELEVANT EVENTS
Santander Concludes Public Offering
In September 2012, Santander México successfully closed the secondary public offering of 24.9% of its capital stock. A total of approximately 1.7 billion Series B shares were sold at Ps.31,25 pesos per share, or 12.18 dollars per ADS, valuing Santander México at 16.5 billion dollars and making it the biggest offer of shares in Mexico to date and the second largest offering in the U.S. thus far this year. Of total shares sold, 81% were placed in the United States and in other countries outside of Mexico, and 19% were placed in Mexico.
Dividend Payment
On September 13, 2012 Santander México paid a cash dividend for the total amount of Ps.7.3 billion, of which the Ps.3.0 billion payment was declared at a General Ordinary Stockholders’ meeting held on May 14th, 2012,
3Q. 12 | EARNINGS REPORT | 16
resulting in a dividend per share of Ps.0.44206092314. Additionally, the payment of Ps.4.3 billion was declared at a General Ordinary Stockholders’ meeting held on August 13th, 2012, resulting in a dividend per share of Ps. 0.6336206565.
Agreements approved at the General Extraordinary Stockholders’ Meeting
At the General Extraordinary Stockholders’ meeting that took place on August 13th 2012, shareholders approved the change in the Company’s legal name to adopt the one currently held (Grupo Financiero Santander México, S.A.B. de C.V.).
Incentive Plan
In July 2012, our Board approved, previous recommendation of the Compensation Committee, a stock compensation plan for certain executives who will have the right to receive stock of Grupo financiero Santander Mexico once certain criteria has been met.
This stock option compensation plan is expected to benefit approximately 300 high-level executives of Banco Santander Mexico, Casa de Bolsa Santander, Gestión Santander and the Sofomes fully-owned by Banco Santander México. The establishment of this plan will have a cost os Ps.418.7 million.
CREDIT RATINGS
| Banco Santander (México) | | | | | |
| Ratings | | | | | |
| | Standard & Poor´s | | Moody´s | | Fitch Ratings |
| Global Scale | | | | | |
| Foreign Currency | | | | | |
| Long Term | BBB | | Baa1 | | BBB+ ** |
| Short Term | A-2 | | P-2 | | F2 |
| | | | | | |
| Local Currency | | | | | |
| Long Term | BBB | | A3 | | BBB+ ** |
| Short Term | A-2 | | P-2 | | F2 |
| | | | | | |
| National Scale | | | | | |
| Long Term | mxAAA | | Aaa.mx | | AAA(mex) |
| Short Term | mxA-1+ | | Mx-1 | | F1+(mex) |
| | | | | | |
| Deposit Certificates | | | | | |
| Long Term | BBB | | | | |
| Short Term | A-3 | | | | |
| | | | | | |
| Autonomous Credit Profile (SACP) | bbb+ | | - | | - |
| Rating viability (VR) | - | | - | | bbb+ |
| Support | - | | - | | 2 |
| Financial Strength | - | | C- | | - |
| Outlook | Stable | | Stable | | Stable |
| | | | | | |
| Last publication: | 11-Jul-12 | | 28-Jun-12 | | 13-Jun-12 |
| | | | | | |
| ** Negative Outlook |
3Q. 12 | EARNINGS REPORT | 17
| Brokerage - Casa de Bolsa Santander |
| Ratings | | | | |
| | | Moody´s | | Fitch Ratings |
| Global Scale | | | | |
| National Scale | | | | |
| Long Term | | A3 | | _ |
| Short Term | | Prime-2 | | _ |
| | | | | |
| National Scale | | | | |
| Long Term | | Aaa.mx | | AAA.mx |
| Short Term | | Mx-1 | | F1+mx |
| | | | | |
| Outlook | | Stable | | Stable |
3Q EARNINGS CALL DIAL-IN INFORMATION
Date – Friday, October 26, 2012
Time – 8:00 AM (MCT); 9:00 AM (US ET)
Dial-in Numbers – 1-480-629-9664 México and International; 1-877-941-1427 US and Canada
Access Code – 4570856
Webcast – https://viavid.webcasts.com/starthere.jsp?ei=1009721
Replay – Starting: Friday, October 26, 2012 at 11:00 AM (MCT); 12:00 PM (US ET). Ending: Friday, November 2, 2012 at 11:00 PM (MCT); 12:00 AM (US ET).
About Grupo Financiero Santander México, S.A.B. de C.V. (NYSE: BSMX BMV: SANMEX)
Grupo Financiero Santander México, S.A.B. de C.V., one of Mexico’s leading financial services holding companies, provides a wide range of financial and related services, including retail and commercial banking, securities brokerage, financial advisory, and other related investment activities. Santander México offers a financial services platform focused on mid- to high-income individuals and small- to medium-sized enterprises, while also providing integrated financial services to larger multinational companies in Mexico. As of September 30, 2012, Santander Mexico had total assets of Ps.771.4 million under Mexican Banking GAAP and more than 9.7 million customers. Headquartered in Mexico City, Santander Mexico operates 1,123 branches located throughout Mexico and has a total of 12,766 employees.
We, the undersigned under oath to tell the truth declare that, in the area of our corresponding functions, we prepared the information on Grupo Financiero Santander contained in this quarterly report, which to the best of our knowledge reasonably reflects its situation.
| MARCOS A. MARTINEZ GAVICA | | PEDRO JOSE MORENO CANTALEJO |
| Executive President and Chief Executive Officer | | Vice President of Administration and Finance |
| EMILIO DE EUSEBIO SAIZ | JESÚS GONZÁLEZ DEL REAL | JAVIER PLIEGO ALEGRÍA |
Deputy General Director of Intervention and Control Management | Executive Director – Controller | Executive Director – Audit |
3Q. 12 | EARNINGS REPORT | 18
| | The financial information presented in this report has been obtained from the non-audited financial statements prepared in accordance with the General Nature Provisions applicable to Holding Corporations of Financial Groups which are subject to the supervision of the National Banking and Securities Commission on accounting procedures, published in the Federal Official Gazette on January 31, 2011. The exchange rate used to convert foreign currency transactions to pesos is PPs.13.40840. |
INVESTOR RELATIONS CONTACT
Ana Luisa González
+ 52 (55) 5269 2845
investor@santander.com.mx
LEGAL DISCLAIMER
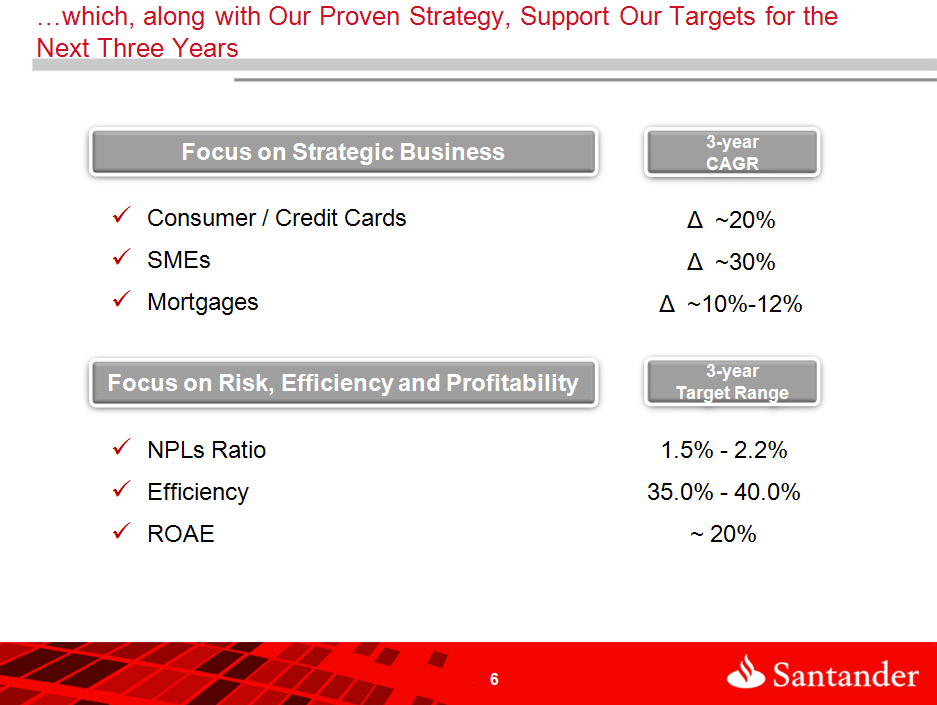
Grupo Financiero Santander México cautions that this report may contain forward-looking statements within the meaning of the U.S. Private Securities Litigation Reform Act of 1995. These forward-looking statements could be found in various places throughout this reports and include, without limitation, statements regarding our intent, belief, targets or current expectations in connection with: asset growth and sources of funding; growth of our fee-based business; expansion of our distribution network; our focus on strategic businesses; our compound annual growth rate; our risk, efficiency and profitability targets; financing plans; competition; impact of regulation; exposure to market risks including interest rate risk, foreign exchange risk and equity price risk; exposure to credit risks including credit default risk and settlement risk; projected capital expenditures; capitalization requirements and level of reserves; liquidity; trends affecting the economy generally; and trends affecting our financial condition and our results of operations. While these forward-looking statements represent our judgment and future expectations concerning the development of our business, a number of risks, uncertainties and other important factors could cause actual developments and results to differ materially from our expectations. These factors include, but are not limited to: changes in capital markets in general that may affect policies or attitudes towards lending to Mexico or Mexican companies; changes in economic conditions, in Mexico in particular, in the United States or globally; the monetary, foreign exchange and interest rate policies of the Mexican Central Bank (Banco de México); inflation; deflation; unemployment; unanticipated turbulence in interest rates; movements in foreign exchange rates; movements in equity prices or other rates or prices; changes in Mexican and foreign policies, legislation and regulations; changes in requirements to make contributions to, for the receipt of support from programs organized by or requiring deposits to be made or assessments observed or imposed by, the Mexican government; changes in taxes; competition, changes in competition and pricing environments; our inability to hedge certain risks economically; economic conditions that affect consumer spending and the ability of customers to comply with obligations; the adequacy of allowances for loans and other losses; increased default by borrowers; technological changes; changes in consumer spending and saving habits; increased costs; unanticipated increases in financing and other costs or the inability to obtain additional debt or equity financing on attractive terms; changes in, or failure to comply with, banking regulations; and certain other factors indicated in the “Risk Factors” section of our Registration Statement on Form F-1 (File No. 333-183409). The risk factors and other key factors that we have indicated in our past and future filings and reports, including those with the U.S. Securities and Exchange Commission, could adversely affect our business and financial performance.
Note: The information contained in this reports is not audited. Nevertheless, the consolidated accounts are prepared on the basis of the accounting principles and regulations prescribed by the Mexican National Banking and Securities Commission (Comisión Nacional Bancaria y de Valores) for credit institutions, as amended (Mexican Banking GAAP). All figures presented are in nominal terms. Historical figures are not adjusted by inflation.
3Q. 12 | EARNINGS REPORT | 19
Grupo Financiero Santander México
| § | Consolidated Balance Sheet |
| § | Consolidated Statement of Income |
| § | Consolidated Statement of Changes in Stockholders’ Equity |
| § | Consolidated Statement of Cash Flows |
The information contained in this report and the financial statements of the Group’s subsidiaries may be consulted on the Internet website: www.santander.com.mx or through the following direct access:
http://www.santander.com.mx/ir/inf_financiera/inf_trimestral.html
There is also information on Santander on the CNBV Website: www.cnbv.gob.mx
3Q. 12 | EARNINGS REPORT | 20
| Grupo Financiero Santander México | | | | | | |
| Consolidated Balance Sheet | | | | | | | |
| Millions of pesos | | | | | | | |
| | | | 2012 | | | | 2011 |
| | Sep | Jun | Mar | Dec | Sep | Jun | Mar |
| Assets | | | | | | | |
| | | | | | | | |
| Cash and due from banks | 91,763 | 96,468 | 75,446 | 84,862 | 90,504 | 104,679 | 93,450 |
| | | | | | | | |
| Margin accounts | 3,053 | 3,825 | 3,604 | 7,910 | 8,544 | 8,261 | 7,719 |
| | | | | | | | |
| Investment in securities | 202,967 | 263,697 | 270,275 | 222,641 | 231,358 | 237,578 | 207,456 |
| Trading securities | 142,939 | 203,958 | 203,413 | 156,319 | 180,087 | 185,997 | 147,642 |
| Securities available for sale | 54,996 | 54,764 | 61,944 | 61,461 | 46,467 | 46,831 | 55,119 |
| Securities held to maturity | 5,032 | 4,975 | 4,918 | 4,861 | 4,804 | 4,750 | 4,695 |
| | | | | | | | |
| Debtors under sale and repurchase agreements | 4,458 | 4,827 | 4,484 | 3,478 | 25,515 | 7,262 | 6,655 |
| | | | | | | | |
| Derivatives | 89,389 | 87,857 | 71,991 | 85,978 | 110,516 | 79,999 | 70,483 |
| Trading purposes | 88,945 | 87,286 | 71,276 | 85,081 | 109,441 | 78,500 | 69,329 |
| Hedging purposes | 444 | 571 | 715 | 897 | 1,075 | 1,499 | 1,154 |
| | | | | | | | |
| Valuation adjustment for hedged financial assets | 240 | 220 | 139 | 122 | 141 | 86 | (12) |
| | | | | | | | |
| Performing loan portfolio | | | | | | | |
| Commercial loans | 211,685 | 212,492 | 198,276 | 197,772 | 197,465 | 183,059 | 175,304 |
| Commercial or business activity | 175,945 | 176,332 | 163,630 | 162,419 | 162,162 | 148,546 | 152,482 |
| Financial entities loans | 619 | 606 | 1,934 | 1,975 | 3,306 | 4,542 | 4,043 |
| Government entities loans | 35,121 | 35,554 | 32,712 | 33,378 | 31,997 | 29,971 | 18,779 |
| Consumer loans | 59,996 | 57,043 | 52,857 | 49,342 | 47,101 | 43,683 | 40,242 |
| Mortage loans | 66,172 | 64,417 | 62,559 | 61,243 | 58,853 | 56,954 | 36,124 |
| Total performing loan portafolio | 337,853 | 333,952 | 313,692 | 308,357 | 303,419 | 283,696 | 251,670 |
| | | | | | | | |
| Nonperforming loan portafolio | | | | | | | |
| Commercial loans | 1,402 | 1,313 | 1,135 | 1,928 | 3,233 | 1,758 | 1,752 |
| Commercial or business activity | 1,402 | 1,313 | 1,135 | 1,926 | 1,840 | 1,758 | 1,752 |
| Government entities loans | 0 | 0 | 0 | 2 | 1,393 | 0 | 0 |
| Consumer loans | 2,053 | 1,709 | 1,255 | 1,270 | 1,232 | 1,321 | 1,131 |
| Mortage loans | 2,075 | 1,931 | 1,982 | 2,118 | 2,245 | 3,690 | 569 |
| Total nonperforming portafolio | 5,530 | 4,953 | 4,372 | 5,316 | 6,710 | 6,769 | 3,452 |
| Total loan portafolio | 343,383 | 338,905 | 318,064 | 313,673 | 310,129 | 290,465 | 255,122 |
| | | | | | | | |
| Allowance for loan losses | (11,360) | (11,101) | (10,875) | (11,191) | (10,906) | (12,892) | (10,449) |
| Loan portafolio (net) | 332,023 | 327,804 | 307,189 | 302,482 | 299,223 | 277,573 | 244,673 |
| Other receivables (net) | 30,231 | 36,483 | 32,310 | 13,649 | 21,958 | 20,771 | 31,710 |
| Foreclosed assets (net) | 172 | 196 | 220 | 253 | 290 | 305 | 155 |
| Property, furniture and fixtures (net) | 3,770 | 3,780 | 5,439 | 5,592 | 5,166 | 5,238 | 5,340 |
| Long-term investment in shares | 218 | 203 | 251 | 234 | 218 | 206 | 226 |
| Deferred taxes (net) | 9,155 | 8,425 | 8,255 | 8,063 | 8,735 | 8,722 | 7,687 |
| Deferred charges, advance payments and intangibles | 3,693 | 3,793 | 4,148 | 3,722 | 3,893 | 3,944 | 2,278 |
| Other assets | 290 | 221 | 197 | 190 | 320 | 305 | 299 |
| Discontinued operations | 0 | 0 | 0 | 0 | 10,511 | 10,702 | 9,817 |
| | | | | | | | |
| Total assets | 771,422 | 837,799 | 783,948 | 739,176 | 816,892 | 765,631 | 687,936 |

3Q. 12 | EARNINGS REPORT | 21
| Grupo Financiero Santander México | | | | | | | | |
| Consolidated Balance Sheet | | | | | | | | |
| Millions of pesos | | | | | | | | |
| | | | 2012 | | | | 2011 | |
| | Sep | Jun | Mar | Dec | Sep | Jun | Mar | |
| Liabilities | | | | | | | | |
| | | | | | | | | |
| Deposits | 358,606 | 352,753 | 346,605 | 330,870 | 328,327 | 316,729 | 286,455 | |
| Demand deposits | 194,351 | 204,606 | 187,787 | 178,065 | 166,923 | 155,932 | 151,450 | |
| Time deposits – General Public | 120,034 | 117,184 | 122,816 | 114,720 | 122,130 | 110,968 | 106,774 | |
| Time deposits – Money market | 21,904 | 9,085 | 14,507 | 16,409 | 18,823 | 32,745 | 11,405 | |
| | 0 | 0 | 0 | 0 | 0 | 0 | 0 | |
| Credit instruments issued | 22,317 | 21,878 | 21,495 | 21,676 | 20,451 | 17,084 | 16,826 | |
| | | | | | | | | |
| Bank and other loans | 34,338 | 24,804 | 21,372 | 19,554 | 36,158 | 23,627 | 17,726 | |
| Demand loans | 5,916 | 6,851 | 5,949 | 2,371 | 20,326 | 10,293 | 7,308 | |
| Short-term loans | 26,092 | 15,704 | 13,278 | 15,156 | 13,772 | 11,187 | 8,310 | |
| Long-term loans | 2,330 | 2,249 | 2,145 | 2,027 | 2,060 | 2,147 | 2,108 | |
| | | | | | | | | |
| Creditors under sale and repurchase agreements | 106,306 | 168,227 | 189,299 | 120,590 | 157,221 | 162,609 | 129,442 | |
| | | | | | | | | |
| Collateral sold or pledged as guarantee | 17,972 | 18,766 | 14,104 | 15,478 | 17,896 | 15,820 | 24,246 | |
| Securities loans | 17,972 | 18,766 | 14,104 | 15,478 | 17,896 | 15,820 | 24,246 | |
| | | | | | | | | |
| Derivatives | 86,613 | 87,960 | 70,292 | 90,649 | 114,399 | 78,362 | 65,948 | |
| Trading purposes | 85,209 | 86,233 | 69,266 | 88,148 | 111,929 | 78,198 | 65,861 | |
| Hedging purposes | 1,404 | 1,727 | 1,026 | 2,501 | 2,470 | 164 | 87 | |
| | | | | | | | | |
| Other payables | 71,702 | 88,648 | 47,647 | 72,493 | 63,114 | 72,706 | 69,844 | |
| Income taxes payable | 767 | 335 | 910 | 507 | 779 | 928 | 7 | |
| Employee profit sharing payable | 117 | 83 | 62 | 153 | 6 | 5 | 40 | |
| Creditors from settlement of transactions | 47,308 | 52,492 | 24,013 | 28,579 | 28,744 | 47,883 | 50,194 | |
| Sundry creditors and other payables | 23,510 | 35,738 | 22,662 | 43,254 | 33,585 | 23,890 | 19,603 | |
| | | | | | | | | |
| Deferred revenues | 1,091 | 1,096 | 1,385 | 1,062 | 1,135 | 1,160 | 1,534 | |
| | | | | | | | | |
| Discontinued operations | 0 | 0 | 0 | 0 | 8,496 | 8,872 | 8,142 | |
| | | | | | | | | |
| Total liabilities | 676,628 | 742,254 | 690,704 | 650,696 | 726,746 | 679,885 | 603,337 | |
| | | | | | | | |
| Paid in capital | 48,195 | 48,195 | 48,195 | 48,195 | 48,195 | 48,195 | 48,195 | |
| Capital stock | 36,357 | 36,357 | 36,357 | 36,357 | 36,357 | 36,357 | 36,357 | |
| Share premium | 11,838 | 11,838 | 11,838 | 11,838 | 11,838 | 11,838 | 11,838 | |
| Other capital | 46,599 | 47,350 | 45,049 | 40,285 | 41,951 | 37,551 | 36,404 | |
| Capital reserves | 349 | 349 | 108 | 108 | 108 | 108 | 108 | |
| Retained earnings | 30,619 | 35,311 | 38,541 | 19,828 | 28,633 | 28,781 | 31,276 | |
| Result from valuation of securities available for sale, net | 727 | 688 | 442 | 465 | 917 | 515 | 314 | |
| Result from valuation of cash flow hedge instruments, net | 382 | 690 | 932 | 1,188 | 1,340 | 1,317 | 1,242 | |
| Net income | 14,513 | 10,298 | 5,013 | 18,683 | 10,941 | 6,818 | 3,452 | |
| Non-controlling interest | 9 | 14 | 13 | 13 | 12 | 12 | 12 | |
| Total stockholders´equity | 94,794 | 95,545 | 93,244 | 88,480 | 90,146 | 85,746 | 84,599 | |
| | | | | | | | | |
| Total liabilities and stockholders´ equity | 771,422 | 837,799 | 783,948 | 739,176 | 816,892 | 765,631 | 687,936 | |
3Q. 12 | EARNINGS REPORT | 22
| Grupo Financiero Santander México | | | | | | | |
| Consolidated Balance Sheet | | | | | | | |
| Millions of pesos | | | | | | | |
| | | | 2012 | | | | 2011 |
| | Sep | Jun | Mar | Dec | Sep | Jun | Mar |
| Memorandum accounts | | | | | | | |
| | | | | | | | |
| FOR THIRD PARTIES | | | | | | | |
| | | | | | | | |
| Current client account | | | | | | | |
| Client Banks | 74 | 261 | 147 | 87 | 107 | 78 | 39 |
| Liquidation of client transactions | 350 | (2,030) | 35 | 20 | (265) | (728) | (798) |
| Dividends on behalf of clients | 0 | 1 | 1 | 0 | 0 | 0 | 1 |
| | | | | | | | |
| Custody services | | | | | | | |
| Assets under custody | 261,131 | 198,793 | 210,076 | 181,374 | 190,125 | 188,854 | 180,571 |
| Client securities abroad | 0 | 0 | 1 | 0 | 0 | 0 | 0 |
| | | | | | | | |
| Transactions on behalf of third parties | | | | | | | |
| Sale and repurchase agreements | 44,469 | 55,334 | 65,577 | 51,219 | 53,598 | 47,040 | 36,213 |
| Security loans on behalf of clients | 1,457 | 1,826 | 2,182 | 602 | 495 | 473 | 398 |
| Collaterals received as guarantee on behalf of clients | 19,013 | 15,690 | 19,542 | 21,191 | 21,686 | 4,848 | 5,048 |
| Acquisition of derivatives | 294,269 | 308,411 | 308,379 | 1,751,863 | 1,965,352 | 1,997,790 | 2,027,256 |
| Sale of derivatives | 579,263 | 603,162 | 656,451 | 2,028,099 | 2,222,326 | 2,357,339 | 2,321,732 |
| | | | | | | | |
| Total on behalf of third parties | 1,200,026 | 1,181,447 | 1,262,390 | 4,034,455 | 4,453,424 | 4,595,694 | 4,570,459 |
| | | | | | | | |
| Proprietary record accounts: | | | | | | | |
| | | | | | | | |
| Contingent assets and liabilities | 24,053 | 31,852 | 31,904 | 32,133 | 30,680 | 41,446 | 32,532 |
| | | | | | | | |
| Credit commitments | | | | | | | |
| Trusts | 106,006 | 106,747 | 155,407 | 145,755 | 142,515 | 136,825 | 129,442 |
| Mandates | 2,582 | 1,548 | 1,532 | 1,556 | 1,535 | 1,510 | 1,324 |
| | | | | | | | |
| Assets in custody or under administration | 3,312,634 | 3,062,735 | 3,084,880 | 2,935,454 | 2,908,619 | 2,837,534 | 2,710,653 |
| | | | | | | | |
| Credit Commitments | 160,790 | 203,362 | 157,565 | 162,528 | 273,286 | 256,420 | 234,036 |
| | | | | | | | |
| Collateral received | 90,548 | 52,244 | 49,931 | 39,015 | 63,514 | 53,891 | 35,246 |
| | | | | | | | |
| Collateral received and sold or pledged as guarantee | 66,877 | 26,708 | 29,027 | 18,120 | 20,208 | 30,535 | 3,555 |
| | | | | | | | |
| Uncollected interest earned on past due loan portfolio | 794 | 1,092 | 985 | 701 | 1,553 | 1,441 | 728 |
| | | | | | | | |
| Other accounts | 466,076 | 455,197 | 429,800 | 428,839 | 421,373 | 375,879 | 341,734 |
| | | | | | | | |
| Subtotal | 4,230,360 | 3,941,485 | 3,941,031 | 3,764,101 | 3,863,283 | 3,735,481 | 3,489,250 |
| | | | | | | | |
| Total | 5,430,386 | 5,122,932 | 5,203,421 | 7,798,556 | 8,316,707 | 8,331,175 | 8,059,709 |
3Q. 12 | EARNINGS REPORT | 23
These consolidated financial statements were approved by the Board of directors and signal on its behalf by
| MARCOS A. MARTINEZ GAVICA | | PEDRO JOSE MORENO CANTALEJO |
| | | |
| Executive President and Chief Executive Officer | | Vice President of Administration and Finance |
| EMILIO DE EUSEBIO SAIZ | JESÚS GONZÁLEZ DEL REAL | JAVIER PLIEGO ALEGRÍA |
| | | |
| Deputy General Director of Intervention and Control Management | Executive Vice President of Accounting | Executive Director of Internal Audit |
The accompanying notes are part of these consolidated financial statements
www.santander.com.mx
3Q. 12 | EARNINGS REPORT | 24
| Grupo Financiero Santander México | | | | | | | | |
| Consolidated Statement of Income | | | | | | | | |
| Millions of pesos | | | | | | | | |
| | | | | 2012 | | | | 2011 |
| | 9M12 | 3Q | 2Q | 1Q | 9M11 | 3Q | 2Q | 1Q |
| Interest income | 41,129 | 13,873 | 13,830 | 13,426 | 33,772 | 12,221 | 11,389 | 10,162 |
| Interest expense | (16,048) | (5,291) | (5,436) | (5,321) | (12,777) | (4,750) | (4,395) | (3,632) |
| Financial margin | 25,081 | 8,582 | 8,394 | 8,105 | 20,995 | 7,471 | 6,994 | 6,530 |
| | | | | | | | | |
| Allowance for loan losses | (6,496) | (2,534) | (1,994) | (1,968) | (4,515) | (1,080) | (1,963) | (1,472) |
| Financial margin after allowance for loan losses | 18,585 | 6,048 | 6,400 | 6,137 | 16,480 | 6,391 | 5,031 | 5,058 |
| | | | | | | | | |
| Commision and fee income | 10,791 | 3,783 | 3,506 | 3,502 | 9,403 | 3,215 | 3,021 | 3,167 |
| Commision and fee expense | (1,927) | (718) | (670) | (539) | (1,667) | (535) | (531) | (601) |
| Net gain /(loss) on financial assets and liabilities | 1,781 | 921 | 106 | 754 | 939 | 29 | 546 | 364 |
| Othe operating income / (loss) | 2,763 | 88 | 2,005 | 670 | 768 | 266 | 281 | 221 |
| Administrative and promotional expenses | (14,214) | (5,179) | (4,559) | (4,476) | (12,890) | (4,630) | (4,312) | (3,948) |
| Total operating income | 17,779 | 4,943 | 6,788 | 6,048 | 13,033 | 4,736 | 4,036 | 4,261 |
| | | | | | | | | |
| Equity in results of subsidiaries and associated companies | 54 | 18 | 17 | 19 | 53 | 13 | 18 | 22 |
| | | | | | | | | |
| Income from continuing operations before income taxes | 17,833 | 4,961 | 6,805 | 6,067 | 13,086 | 4,749 | 4,054 | 4,283 |
| | | | | | | | | |
| Current income taxes | (4,179) | (1,360) | (1,695) | (1,124) | (5,665) | (603) | (2,004) | (3,058) |
| Deferred income taxes | 860 | 614 | 176 | 70 | 3,049 | (205) | 1,156 | 2,098 |
| | | | | | | | | |
| Income from continuing operations | 14,514 | 4,215 | 5,286 | 5,013 | 10,470 | 3,941 | 3,206 | 3,323 |
| | | | | | | | | |
| Discontinued operations | 0 | 0 | 0 | 0 | 474 | 184 | 161 | 129 |
| | | | | | | | | |
| Consolidated net income | 14,514 | 4,215 | 5,286 | 5,013 | 10,944 | 4,125 | 3,367 | 3,452 |
| | | | | | | | | |
| Non-controlling interest | (1) | 0 | (1) | 0 | (3) | (2) | (1) | 0 |
| | | | | | | | | |
| Net income | 14,513 | 4,215 | 5,285 | 5,013 | 10,941 | 4,123 | 3,366 | 3,452 |
These consolidated financial statements were approved by the Board of directors and signal on its behalf by
| MARCOS A. MARTINEZ GAVICA | | PEDRO JOSE MORENO CANTALEJO |
| | | |
| Executive President and Chief Executive Officer | | Vice President of Administration and Finance |
| EMILIO DE EUSEBIO SAIZ | JESÚS GONZÁLEZ DEL REAL | JAVIER PLIEGO ALEGRÍA |
| | | |
| Deputy General Director of Intervention and Control Management | Executive Vice President of Accounting | Executive Director of Internal Audit |
The accompanying notes are part of these consolidated financial statements
www.santander.com.mx
3Q. 12 | EARNINGS REPORT | 25
Grupo Financiero Santander México
Consolidated Statements of Changes in Stockholders’ Equity
From January 1st to September 30, 2012
Millions of pesos
| | | Paid-in Capital | | | Other Capital | |
| CONCEPT | | Capital Stock | | | Additional Paid-In Capital | | | Capital Reserves | | | Retained Earnings | | | Surplus (deficit) from valuation of securities available for sale | | | Surplus (Deficit) from the valuation of cash flow hedge securities | | | Net income (loss) | | | Minority Interest | | | Total stockholders' equity | |
| | | | | | | | | | | | | | | | | | | | | | | | | | | | |
| BALANCE AS OF DECEMBER 31, 2011 | | | 36,357 | | | | 11,838 | | | | 108 | | | | 19,828 | | | | 465 | | | | 1,188 | | | | 18,682 | | | | 13 | | | | 88,479 | |
MOVEMENTS INHERENT TO THE SHAREHOLDERS' DECISIONS | | | | | | | | | | | | | | | | | | | | | | | | | | | | | | | | | | | | |
| Transfer of Net income (loss) to Retained Earnings | | | | | | | | | | | 241 | | | | 18,441 | | | | | | | | | | | | (18,682 | ) | | | | | | | 0 | |
| Payment of Dividends | | | | | | | | | | | | | | | (7,300 | ) | | | | | | | | | | | | | | | | | | | (7,300 | ) |
| TOTAL | | | 0 | | | | 0 | | | | 241 | | | | 11,141 | | | | 0 | | | | 0 | | | | (18,682 | ) | | | 0 | | | | (7,300 | ) |
| | | | | | | | | | | | | | | | | | | | | | | | | | | | | | | | | | | | | |
| MOVEMENTS INHERENT TO THE RECOGNITION OF THE COMPREHENSIVE INCOME | | | | | | | | | | | | | | | | | | | | | | | | | | | | | | | | | | | | |
| | | | | | | | | | | | | | | | | | | | | | | | | | | | | | | | | | | | | |
| Surplus (deficit) from valuation of securities available for sale | | | | | | | | | | | | | | | | | | | 262 | | | | | | | | | | | | | | | | 262 | |
| Surplus (deficit) from valuation ofcash flow hedge securities | | | | | | | | | | | | | | | | | | | | | | | (806 | ) | | | | | | | | | | | (806 | ) |
| Repurchase of own shares | | | | | | | (419 | ) | | | | | | | | | | | | | | | | | | | | | | | | | | | (419 | ) |
| Recoveries on loan reserves previously applied to prior year results | | | | | | | | | | | | | | | 45 | | | | | | | | | | | | | | | | | | | | 45 | |
| Equity effect of investment in subsidiaries and associated companies | | | | | | | | | | | | | | | 24 | | | | | | | | | | | | | | | | | | | | 24 | |
| Net Income (Loss) | | | | | | | | | | | | | | | | | | | | | | | | | | | 14,513 | | | | | | | | 14,513 | |
| Minority Interest | | | | | | | | | | | | | | | | | | | | | | | | | | | | | | | (4 | ) | | | (4 | ) |
| | | | | | | | | | | | | | | | | | | | | | | | | | | | | | | | | | | | | |
| TOTAL | | | 0 | | | | (419 | ) | | | 0 | | | | 69 | | | | 262 | | | | (806 | ) | | | 14,513 | | | | (4 | ) | | | 13,615 | |
| | | | | | | | | | | | | | | | | | | | | | | | | | | | | | | | | | | | | |
| BALANCE AS OF SEPTEMBER 30, 2012 | | | 36,357 | | | | 11,419 | | | | 349 | | | | 31,038 | | | | 727 | | | | 382 | | | | 14,513 | | | | 9 | | | | 94,794 | |
3Q. 12 | EARNINGS REPORT | 26
These consolidated financial statements were approved by the Board of directors and signal on its behalf by
| MARCOS A. MARTINEZ GAVICA | | PEDRO JOSE MORENO CANTALEJO |
| | | |
| Executive President and Chief Executive Officer | | Vice President of Administration and Finance |
| EMILIO DE EUSEBIO SAIZ | JESÚS GONZÁLEZ DEL REAL | JAVIER PLIEGO ALEGRÍA |
| | | |
| Deputy General Director of Intervention and Control Management | Executive Vice President of Accounting | Executive Director of Internal Audit |
The accompanying notes are part of these consolidated financial statements
www.santander.com.mx
3Q. 12 | EARNINGS REPORT | 27
| Grupo Financiero Santander | | | |
| Consolidated Statement of Cash Flows | | | |
| From January 1st to September 30, 2012 | | | |
| Millions of pesos | | | |
| | | | |
| OPERATING ACTIVITIES | | | |
| Net Result | | | 14,513 |
| Adjustments due to items not requiring resources | | | |
| Result from valuation related to investment or financing activities | 679 | | |
| Equity in results of subsidiaries and associated companies | (54) | | |
| Depreciation of properties, furniture and equipment | 473 | | |
| Amortization of intangible assets | 674 | | |
| Provision for impairment in foreclosed assets | 30 | | |
| Income tax, current and deferred | 3,319 | | 5,121 |
| | | | 19,634 |
| | | | |
| CHANGES IN OPERATING ACCOUNTS | | | |
| Change in margin accounts | | | 4,856 |
| Change in Securities | | | 20,047 |
| Changes in Debit balances under repurchase and resale agreements (Reporto) | | (980) |
| Changes in Derivatives (Asset) | | | (4,679) |
| Changes in Loans portfolio | | | (29,541) |
| Changes in Foreclosed assets | | | 51 |
| Changes in Other operating assets | | | (18,038) |
| Changes in Savings | | | 27,737 |
| Changes in Interbank loans and from other entities | | | 14,786 |
| Changes in Credit balances under repurchase and sale agreements (Reporto) | | (14,284) |
| Changes in sold or pledged guarantees | | | 2,494 |
| Changes in Derivatives (Liabilities)) | | | (4,036) |
| Changes in other operating liabilities | | | 11,979 |
| Income tax payments | | | (3,918) |
| Net resources generated by operating activities | | | 26,108 |
| | | | |
| INVESTING ACTIVITIES | | | |
| Sale of Properties, furniture and equipment | | | 2,936 |
| Purchases of properties, furniture and equipment | | | (187) |
| Investments in subsidiaries and associated companies | | | (8) |
| Collection of cash dividends | | | 77 |
| Purchases of intangible assets | | | (612) |
| Net resources generated by investing activities | | | 2,206 |
| | | | |
| FINANCING ACTIVITIES | | | |
| Payments derived from repurchase of own shares | | | (419) |
| Payment of dividends | | | (18,650) |
| Recoveries of reserves applied to results from previous years | | | 45 |
| | | | |
| Net resources generated by financing activities | | | (19,024) |
| | | | |
| Net decrease in funds available | | | 9,290 |
| | | | |
| Adjustments to cash flow due to exchange variations | | | (2,389) |
| | | | |
| Funds available at beginning of year | | | 84,862 |
Funds available at the end of the year | | | 91,763 |
3Q. 12 | EARNINGS REPORT | 1
These consolidated financial statements were approved by the Board of directors and signal on its behalf by
| MARCOS A. MARTINEZ GAVICA | | PEDRO JOSE MORENO CANTALEJO |
| | | |
| Executive President and Chief Executive Officer | | Vice President of Administration and Finance |
| EMILIO DE EUSEBIO SAIZ | JESÚS GONZÁLEZ DEL REAL | JAVIER PLIEGO ALEGRÍA |
| | | |
| Deputy General Director of Intervention and Control Management | Executive Vice President of Accounting | Executive Director of Internal Audit |
The accompanying notes are part of these consolidated financial statements
www.santander.com.mx
3Q. 12 | EARNINGS REPORT | 2
NOTES TO CONSOLIDATED FINANCIAL STATEMENTS OF GRUPO FINANCIERO SANTANDER MÉXICO
| § | Significant accounting policies |
| § | Balance Sheet and Income Statement by segment |
| § | Annex 1. Loan portafolio rating |
| § | Annex 2. Financial Ratios |
| § | Notes to Consolidated Financial Statements |
The information contained in this report and the financial statements of the Group’s subsidiaries may be consulted on the Internet website: www.santander.com.mx or through the following direct access:
http://www.santander.com.mx/ir/inf_financiera/inf_trimestral.html
There is also information on Santander on the CNBV Website: www.cnbv.gob.mx
3Q. 12 | EARNINGS REPORT | 3
Significant accounting policies
The significant accounting policies applied by the Financial Group are in conformity with the accounting criteria established by the Commission in the General Provisions Applicable to Financial Groups, Credit Institutions, Brokerage Houses and Regulated Multiple Purpose Financing Entities (the “Provisions”), in its circulars and in general and specific official mandates, which require that management make certain estimates and utilize certain assumptions to determine the valuation of items included in the consolidated financial statements and to make required disclosures. Although the actual results may differ, management believes that the estimates and assumptions utilized were appropriate under the circumstances.
Based on accounting criterion A-1 of the Commission, the accounting of the Financial Group/Bank shall be in conformity with Mexican Financial Reporting Standards (MFRS or NIF) as promulgated by the Mexican Board of Financial Reporting Standards (CINIF), except when the Commission believes that a specific regulation or accounting treatment should be applied on the basis that the institutions subject to its rules carry out specialized transactions.
Changes in the Accounting Criteria of the Commission
Changes that occurred during 2012
During July 2012, the Federal Official Gazette published certain modifications to the accounting criteria for Credit Institutions modifying the accounting criteria relating to trusts and consolidation of special purpose entities (SPE), which define specific rules regarding the recognition, measurement, presentation and disclosure in the financial statements of trusts and special purpose entities of these institutions, thereby allowing to have transparent and comparable financial information with other countries.
The changes are as follows:
| | Ø | The valuation of the trust patrimony recognized in memorandum accounts shall be effected in accordance with the accounting criteria for credit institutions, except in the case of patrimony of trusts who apply and, where appropriate, obtain and retain registration their securities in the National Securities Registry, in which case, such patrimony shall be valued based on the accounting standards established for such purposes by the Commission applicable to securities issuers and other market participants (International Financial Reporting Standards). |
| | Ø | Elimination of accounting treatment of an unconsolidated SPE. |
| | Ø | Clarification that the financial statements of the consolidated SPE should be prepared based on the same accounting criteria and, for transactions of the same nature, the same accounting policies of the consolidated entity should be used. |
| | Ø | When the SPE use criteria or policies other than those applicable to the consolidated entity, the financial statements of the SPE that are used to carry out the consolidation should be modified to be consistent with those of the entity that consolidates the SPE. |
Changes that occurred during 2011
During 2011, the Federal Official Gazette published certain modifications to the accounting criteria for Financial Groups, Credit Institutions, Brokerage Houses and Regulated Multiple Purpose Financing Entities.
The purpose of these changes is to achieve consistency with International Financial Reporting Standards (IFRS), and to provide more complete financial information with improved disclosures. Such changes principally affected investments in securities, derivatives and hedging operations, the credit portfolio, and the presentation of the basic financial statements.
3Q. 12 | EARNINGS REPORT | 4
The most significant effects of these changes are as follows:
| | Ø | The presentation of the income statement is comprehensively restructured for purposes of compliance with MFRS. The headings of "Other products" and "Other expenses" are eliminated and the items which comprise these headings are now presented within the heading of "Other operating income”. |
| | Ø | The accounting standard related to the treatment of collateral in derivatives transactions in unrecognized markets (over-the-counter) is clarified. They will be accounted for separately from the margin accounts, and will be recorded in an account receivable or payable, as the case may be. |
| | Ø | The valuation of implicit derivatives denominated in foreign currency contained in contracts is not established, when such contracts require payments in a currency that is commonly used to purchase or sell non-financial items in the economic environment in which the transaction is performed (for example, a stable and liquid currency which is commonly used in local transactions or in foreign trade transactions). |
| | Ø | In the case of segregable hybrid financial instruments, the host contract and the embedded derivative will be presented separately. Previously, it was established that both should be presented together. Now the embedded derivative should be presented under the heading of "Derivatives". |
| | Ø | In convergence with the MFRS, the requirement to incorporate the provision for loan losses in earnings as part of the cash flow statement is eliminated. |
Accounting Treatment B-6 “Credit portfolio” of the General provisions applicable to credit institutions, is amended mainly to establish the following:
| | Ø | The treatment for the restructuring and renewal of credits, as well as the respective commissions and costs. |
| | Ø | The incorporation of the commissions for credit restructurings as commissions for the initial granting of the credit, which may be deferred during the new term of the restructured credit. |
| | Ø | It is also established that the presentation of the commissions collected and paid should be net of their respective costs and expenses. |
| | Ø | The requirements which should be followed to consider that there is sustained payment by the borrower. |
| | Ø | Any deferred charge which was generated on the acquisition of portfolio should be presented under the heading of "Other assets" and, furthermore, the purchase option at the reduced price should be presented under the heading of "Deferred revenues and other advances", together with any excess originated on the portfolio acquisitions. |
| | Ø | On the cancellation date of a credit line, the unamortized balance for commissions collected on the credit lines, which are canceled before the end of the 12 month period will be recognized directly in results of the year under the heading of "Commissions and fee income”. |
NIF issued by the CINIF
With the aim of bringing Mexican regulations closer in line with international regulations, during 2011, the Mexican Board of Financial Reporting Standards (CINIF) introduced the following MFRS or NIF, Interpretations to Financial Reporting Standards (INIF) and improvements to the NIF, which go into effect as of January 1, 2012:
| | · | B-3, Comprehensive income statement |
| | · | B-4, Statement of changes in stockholders' equity |
| | · | C-6, Property, plant and equipment |
| | · | Improvements to Financial Reporting Standards 2012 |
Some of the principal changes established in such provisions are as follows:
NIF B-3, Comprehensive income statement.- Establishes the option of presenting a) a single statement containing the headings which make up the net profit or loss, as well as the other comprehensive results (ORI) and the equity in the ORI of other entities, and being denominated as the comprehensive income statement or b) two statements: the income statement, which should include only the headings that comprise the net profit or loss and the statement of other comprehensive results, which should be based on the net profit or loss and presented directly after the ORI and the equity in the ORI of other entities. It also establishes that items should not be presented in segregated form as non-ordinary, either in the financial statement or in notes to the financial statements.
3Q. 12 | EARNINGS REPORT | 5
NIF B-4, Statement of changes in stockholders' equity.-Establishes general provisions for the presentation and structuring of the statement of changes in stockholders' equity, such as showing the retrospective adjustments for accounting changes and error corrections which affect the opening balances of each of the headings of stockholders' equity and presenting the comprehensive result in a single heading, detailing all the items which comprise it, as established in NIF B-3.
NIF C-6, Property, plant and equipment.- Establishes the obligation to depreciate components which are representative of an item of property, plant and equipment, apart from depreciating the rest of the item as if it were a single component.
Improvements to the NIF 2012.-The principal improvements which generate accounting changes that should be recognized retrospectively in years beginning as of January 1, 2012 are as follows:
Bulletin B-14, Income per share.-Establishes that the diluted income per share should be calculated and disclosed when the result from continued operations is a loss, regardless of whether a net profit is presented.
NIF C-1, Cash and cash equivalents.- Requires that restricted cash and cash equivalents be presented as short-term in the balance sheet, provided that such restriction runs out within the 12 months following the balance sheet date; if the restriction runs out at a subsequent date, such heading should be presented in long-term assets.
Bulletin C-11, Stockholders' equity.- Eliminates the rule of recording the donations received by an entity as part of contributed stockholders' equity, and they should now be recorded as revenue in the income statement, in accordance with NIF B-3, Income statement.
Bulletin C-15, Impairment in the value of long-lived assets and their disposal.-Eliminates: a) the restriction that an asset should not be in use in order to be classified as intended for sale and b) the reversal of losses from impairment of goodwill. It also establishes that losses from impairment in the value of long-lived assets should be presented in the income statement under the respective line items of costs and expenses, not as other revenues and expenses or as a special item.
NIF D-3, Employee benefits.-Requires that the PTU incurred and deferred be presented in the statement of income under the respective heading of costs and expenses, not the heading of other revenues and expenses.
Furthermore, improvements to the NIF 2012 were issued which do not generate accounting changes and mainly establish further disclosure requirements for key assumptions used in the estimates and in the valuation of assets and liabilities at fair value, which might originate significant adjustments in such values within the following accounting period.
The following accounting pronouncements were issued by the CINIF during the year 2010 and went into effect as of January 1, 2011:
NIF B-5, Financial information by segments- Establishes the management approach to disclose financial information by segments, in contrast to Bulletin B-5 which, although it used a management approach, required that the information to be disclosed should be classified by economic segments, geographical areas or by homogeneous groups of customers; it requires a separate disclosure of interest income, interest expense and liabilities, and information on products, services, geographical areas and principal customers and suppliers.
NIF C-5, Prepaid expenses- Establishes that a basic characteristic of prepaid expenses is that they have not yet transferred to the Company the risks and benefits inherent to the goods and services which it is yet to acquire or receive; and requires that impairment should be recognized when they lose their capacity to generate such benefits and their presentation in the balance sheet, under current assets or long-term assets.
NIF C-6, Property, plant and equipment- Incorporates the treatment of the exchange of assets based on the commercial substance; includes the bases for determining the residual value of a component, by considering current amounts; eliminates the rule of assigning an appraisal-based value to property, plant and equipment acquired at no cost or at a cost which is inadequate; establishes the rule of continuing to depreciate a component when it is not being used, except when depreciation methods are used based on the activity.
3Q. 12 | EARNINGS REPORT | 6
Furthermore, during December 2010, the CINIF issued the "Improvements to the NIF 2011", which document incorporates changes or clarifications to the NIF in order to establish a more appropriate regulatory framework. These improvements are classified into two sections as follows:
a. Improvements to the NIF‟s that generate accounting changes, which are modifications that generate accounting changes in the valuation, presentation or disclosure in the financial statements. The NIF‟s subject to this type of improvements are:
NIF B-1, Accounting Changes and Error Corrections
NIF B-2, Statement of Cash Flows
Bulletin C-3, Accounts receivable
NIF C-10, Financial derivative instruments and hedge transactions
NIF C-13, Related Parties
Bulletin D-5, Leases
b. Improvements to the NIF‟s that do not generate accounting changes, which are modifications to make clarifications to them, and which help establish a clearer and more understandable regulatory framework; because they are clarifications, they do not generate accounting changes in the financial statements. The NIF‟s subject to this type of improvements are:
NIF C-2, Financial instruments
NIF C-9, Liabilities, provisions, contingent assets and liabilities and commitments
NIF C-10, Financial derivative instruments and hedge transactions
NIF C-12, Financial instruments with characteristics of debt, equity or both
NIF D-4, Income Taxes
Bulletin D-5, Leases
NIF D-6, Capitalization of the comprehensive result of financing
Changes in accounting estimates applicable in 2011
On October 25, 2010 and on October 5, 2011, the Commission issued rulings which modified the "General Provisions Applicable to Credit Institutions", whereby the methodologies applicable to the classification of nonrevolving consumer credit portfolio and the housing mortgage credit portfolio, as well as the classification of loans owed by States and Municipalities, in order to change the current model of creating allowances for loan losses based on the incurred loss model to an expected loss model. Such modifications went into effect on March 1 and September 1, 2011, respectively.
The Commission stipulated the recognition in stockholders’ equity at the latest as of March 31 and September 30, 2011, under the heading "Retained earnings", of the initial cumulative financial effect derived from the application of the classification methods for the nonrevolving consumer credit portfolio and the housing credit portfolio, and for credits owed by States and Principalities, respectively.
The initial cumulative effect from application of the change in the classification methodology generated allowances for loan losses under the heading of "Retained earnings" within stockholders' equity, for the amount of $432, net of the related deferred tax, in relation to the nonrevolving consumer credit portfolio and the housing mortgage credit portfolio, and the amount of $173, net of the related deferred tax, in relation to the credits owed by States and Municipalities.
3Q. 12 | EARNINGS REPORT | 7
| Grupo Financiero Santander México |
| Earnings per ordinary share and Earnings per diluted share |
| (Millions of pesos, except shares and earnings per share) |
| | | | | | | | | | | | | |
| | | SEPTEMBER 2012 | | SEPTEMBER 2011 | | SEPTEMBER 2010 |
| | | | | | | | | | | | | |
| | | | Shares | Earnings | | | Shares | Earnings | | | Shares | Earnings |
| | | Earnings | -weighted- | per share | | Earnings | - weighted - | per share | | Earnings | - weighted - | per share |
| | | | | | | | | | | | | |
| | | | | | | | | | | | | |
| Earnings per share | 14,513 | 6,786,394,913 | 2.14 | | 10,941 | 6,786,394,913 | 1.61 | | 6,818 | 6,786,394,913 | 1.00 |
| | | | | | | | | | | | | |
| Reasury stock | | (293,466) | | | | | | | | | |
| | | | | | | | | | | | | |
| Diluited earnings per share | 14,513 | 6,786,101,447 | 2.14 | | 10,941 | 6,786,394,913 | 1.61 | | 6,818 | 6,786,394,913 | 1.00 |
| | | | | | | | | | | | | |
| Plus (loss) less (profit): | | | | | | | | | | | |
| | | | | | | | | | | | | |
| Discontinued operations, extraordinary items and changes in accounting policies | | | | | (474) | | | | (290) | | |
| Continued fully diluted earnings per share | 14,513 | 6,786,101,447 | 2.14 | | 10,467 | 6,786,394,913 | 1.54 | | 6,528 | 6,786,394,913 | 0.96 |
3Q. 12 | EARNINGS REPORT | 8
| Grupo Financiero Santander México | | | | |
| Consolidated Balance Sheet by Segment | | |
| Millions of pesos | | | | | | | |
| | As of September 30, 2012 | | As of September 30, 2011 |
| | | | | | | | |
| | Retail Banking 1/ | Global Wholesale Banking 2/ | Corporate Activities | | Retail Banking 1/ | Global Wholesale Banking 2/ | Corporate Activities |
| Assets | | | | | | | |
| Funds Available | 37,021 | 46,871 | 7,872 | | 32,504 | 51,148 | 6,853 |
| Margin Accounts | 0 | 3,053 | 0 | | 0 | 8,544 | 0 |
| Investment in Securities | 189 | 142,146 | 60,632 | | 199 | 179,239 | 51,920 |
| Debit balances under repurchase and resale agreements | 0 | 4,458 | 0 | | 0 | 25,515 | 0 |
| Derivatives | 0 | 88,945 | 444 | | 0 | 109,441 | 1,075 |
| Valuation adjustments for hedging financial assets | 0 | 0 | 240 | | 0 | 0 | 141 |
| Total loans portfolio | 248,154 | 93,610 | 1,619 | | 204,861 | 102,464 | 2,805 |
| Allowance for loan losses | (11,053) | (370) | 62 | | (9,752) | (350) | (803) |
| Loan Portfolio (Net) | 237,101 | 93,241 | 1,681 | | 195,108 | 102,114 | 2,001 |
| Other Account Receivables (Net) | 2,055 | 19,914 | 8,262 | | 2,311 | 13,061 | 6,586 |
| Foreclosed assets (Net) | 16 | 1 | 155 | | 27 | 1 | 262 |
| Properties, furniture and equipment (Net) | 3,186 | 537 | 47 | | 4,370 | 733 | 64 |
| Long-term investments in shares | 0 | 0 | 218 | | 0 | 0 | 218 |
| Non-current assets held for sale | 0 | 0 | 0 | | 0 | 0 | 10,511 |
| Deferred taxes and profit sharing | 0 | 0 | 9,155 | | 0 | 0 | 8,735 |
| Other assets | 1,530 | 602 | 1,852 | | 1,619 | 619 | 1,974 |
| Total assets | 281,097 | 399,766 | 90,559 | | 236,137 | 490,414 | 90,341 |
| | | | | | | | |
| Liabilities | | | | | | | |
| Savings Savings | 270,393 | 43,447 | 22,448 | | 241,370 | 42,951 | 23,555 |
| Bank bonds | 0 | 2,028 | 20,289 | | 0 | 1,474 | 18,976 |
| Bank and other loans | 13,011 | 349 | 20,979 | | 5,426 | 456 | 30,275 |
| Credit balances under repurchase and resale agreements | 10,069 | 84,576 | 11,661 | | 6,618 | 111,676 | 38,927 |
| Guarantees sold or pledged | 0 | 17,972 | 0 | | 0 | 17,896 | 0 |
| Derivatives | 0 | 85,208 | 1,404 | | 0 | 111,929 | 2,471 |
| Other accounts payable | 23,752 | 47,308 | 642 | | 25,730 | 36,820 | 564 |
| Deferred credits and advanced collections | 1,091 | 0 | 0 | | 1,135 | 0 | 0 |
| Discontinued operations | 0 | 0 | 0 | | 0 | 0 | 8,496 |
| Total Liabilities | 318,316 | 280,889 | 77,423 | | 280,278 | 323,203 | 123,264 |
| Total Stockholders' Equity | 33,069 | 12,573 | 49,152 | | 27,588 | 12,297 | 50,261 |
| Total Liabilities and Stockholders' Equity | 351,385 | 293,461 | 126,575 | | 307,866 | 335,501 | 173,525 |
3Q. 12 | EARNINGS REPORT | 0
| Grupo Financiero Santander México | | | | |
| Income Statement by Segment | | | | |
| Millions of pesos | | | | | | | |
| | As of September 30, 2012 | | As of September 30, 2011 |
| | Retail Banking 1/ | Global Wholesale Banking 2/ | Corporate Activities | | Retail Banking 1/ | Global Wholesale Banking 2/ | Corporate Activities |
| | | | | | | | |
| Net interest income before provisions | 6,889 | 892 | 801 | | 5,522 | 1,019 | 930 |
| Provisions for loan losses, net | (2,500) | (8) | (27) | | (868) | (2) | (210) |
| Net interest income after provisions | 4,390 | 884 | 774 | | 4,654 | 1,018 | 720 |
| Commissions, net | 2,620 | 466 | (21) | | 2,187 | 400 | 93 |
| Intermediation result | 179 | 803 | (62) | | 147 | (98) | (20) |
| Other operating income (expenses) | 389 | 3 | (303) | | 199 | 0 | 68 |
| Administrative and promotion expenses | (4,711) | (517) | 49 | | (4,010) | (628) | 8 |
| Operating Income | 2,867 | 1,638 | 438 | | 3,177 | 691 | 869 |
| Equity in results of non-consolidated subsidiaries and associated companies | (0) | (0) | 18 | | 0 | 0 | 13 |
| Income before income taxes | 2,867 | 1,638 | 456 | | 3,177 | 691 | 882 |
Segment information has been prepared according to the classifications used in Grupo Santander at secondary level, based in the type of developed business:
Commercial Banking
It includes all the businesses pertaining to customer banking, under the following segments: Individual, Small and Medium-sized Enterprises (Pymes) Institutions, Local Corporate Banking (large enterprises), as well as the contributions of Mutual Funds businesses (after transfer of commissions to distributors).
Global Wholesale Banking
This area reflects the earnings from Global Corporate Banking, Investment Banking and Treasury.
Corporate Activities
It includes non-commercial assets and liabilities, the result from hedging positions, insurance business (net of commissions paid to Commercial Bank) and others. Even though Corporate Banking, by definition, belongs to Commercial Banking, it is separated herein in order to reflect the results from corporate customers.
3Q. 12 | EARNINGS REPORT | 1
| Annex 1 |
| Loan Portfolio Rating |
| Grupo Financiero Santander México | | |
| As of September 30, 2012 | | |
| Millions of pesos | | |
| | | | | | | |
| | | | Allowance for loan losses | | |
| Category | Loan Portfolio | Commercial | Consumer | Mortages | Total |
| | | | | | | |
| Risk "A" | 83,779 | | 0 | 1,677 | 129 | 1,806 |
| Risk "A-1" | 192,889 | | 907 | 0 | 0 | 907 |
| Risk "A-2" | 23,340 | | 221 | 0 | 0 | 221 |
| Risk "B" | 11,925 | | 0 | 520 | 269 | 789 |
| Risk "B-1" | 17,070 | | 324 | 338 | 0 | 662 |
| Risk "B-2" | 21,479 | | 166 | 1,596 | 0 | 1,762 |
| Risk "B-3" | 3,432 | | 392 | 0 | 0 | 392 |
| Risk "C" | 5,021 | | 0 | 1,545 | 188 | 1,733 |
| Risk "C-1" | 234 | | 57 | 0 | 0 | 57 |
| Risk "C-2" | 366 | | 152 | 0 | 0 | 152 |
| Risk "D" | 2,795 | | 241 | 1,705 | 32 | 1,978 |
| Risk "E" | 695 | | 502 | 232 | 19 | 753 |
| Total rated portafolio | 363,024 | | 2,961 | 7,612 | 637 | 11,211 |
| | | | | | | |
| Exceptions | 4,887 | | | | | |
| | | | | | | |
| Total | 367,911 | | 2,961 | 7,612 | 637 | 11,211 |
| | | | | | | |
| Provisions created | | | | | 11,360 |
| Complementary provisions | | | | | 149 |
| Notes: | |
| | |
| 1. | The figures used for grading and the creation of provisions correspond to the ones as of the last day of the month of the balance sheet as of September 30, 2012. |
| | |
| 2. | Loan Portfolio is graded according to the rules for loan portfolio rating issued by the Mexican Treasury Department (Secretaría de Hacienda y Crédito Público (SHCP)) and the methodology established by CNBV. In the case of commercial and mortgages portfolio, such rating may be performed following internal methodologies authorized by CNBV. The institution utilizes a proprietary methodology from June 2009, for a portion of the commercial portfolio, i.e. the companies segment, and the standard methodology of CNBV for the rest of the portfolio. On July 31, 2009, the Bank implemented new rules for grading revolving consumer credit to be applied from August, 2009, as it is explained in Annex 31. From March 2011, the Bank implemented new rules for grading non-revolving consumer credits and mortgages. From September, 2011, the bank implemented new rules for grading loans to States and Municipalities. |
| | |
| 3. | Reserves created in excess are explained by the following: The Bank maintains additional reserves to the ones necessary pursuant to the loan portfolio grading process authorized by CNBV, in order to cover potential losses from mortgages portfolio, the valuation of assets determined in the Due Diligence and authorized by the CNBV in Official Letter No. 601DGSIF"C"-38625, for an amount of $ 58.9 million pesos, as well as to cover the cost of Governmental Programs. |
3Q. 12 | EARNINGS REPORT | 2
Annex 2 Financial Ratios |
| | | | | | | | |
| Grupo Financiero Santander México | | | | | | | |
| Percentages | | | | | | | |
| | | 3Q12 | 2Q12 | 3Q11 | | 9M12 | 9M11 |
| | | | | | | | |
| Past Due Loans Ratio | | 1.6 | 1.5 | 2.2 | | 1.6 | 2.2 |
| | | | | | | | |
| Past Due Loans Coverage | | 205.4 | 224.2 | 162.5 | | 205.4 | 162.5 |
| | | | | | | | |
| Operative Efficiency | | 2.6 | 2.2 | 2.3 | | 2.5 | 2.1 |
| | | | | | | | |
| ROE | | 17.7 | 22.4 | 18.7 | | 21.4 | 17.0 |
| | | | | | | | |
| ROA | | 2.1 | 2.6 | 2.1 | | 2.5 | 1.8 |
| | | | | | | | |
| Capitalization Ratio | | | | | | | |
| Credit Risk | | 23.9 | 24.4 | 25.4 | | 23.9 | 25.4 |
| Credit, Market and operations risk | | 14.5 | 14.6 | 14.2 | | 14.5 | 14.2 |
| | | | | | | | |
| Liquidity | | 128.0 | 156.4 | 157.7 | | 128.0 | 157.7 |
| | | | | | | | |
| NIM (Net Interest Margin) | | 3.2 | 3.4 | 3.5 | | 3.5 | 3.3 |
| | | | | | | | |
Note: ratios are prepared according to the general rules applicable to financial information of credit institutions, issued by the CNBV, according to Annex 34 of the CUB.
PAST DUE LOANS RATIO = Balance of past due loans portfolio as of the end of the quarter / Balance of loans portfolio as of the end of the quarter.
PAST DUE LOAN COVERAGE = Balance of provision for loan losses as of the end of the quarter / Balance of past due loans portfolio as of the end of the quarter.
OPERATING EFFICIENCY = Administration and promotion expenses of the quarter, annualized / Total Average Assets.
ROE = Annualized quarterly net earnings/ Average stockholders’ equity.
ROA = Annualized quarterly net earnings /Total average assets.
BREAKDOWN OF CAPITALIZATION RATIO: (1)=Net Capital/ Assets subject to credit risk. (2)=Net Capital / Assets subject to credit, market and operation risk.
LIQUIDITY = Current Assets/ Current Liabilities.
Where: Current Assets = Availabilities + securities for trade + securities available for sale.
Current liabilities= Demand deposits + bank loans and loans from other entities, payable on demand, + short term bank loans and loans from other entities.
NIM = Quarterly Net Interest Margin, adjusted by annualized credit risks, / Average interest-earning assets.
Where: Average interest-earning assets = availabilities, investments in securities, transactions with securities and derivatives and loan portfolio.
Notes:
Average = ((Balance of the corresponding quarter + balance of the previous quarter) / 2).
Annualized figures = (Flow of the corresponding quarter * 4).
3Q. 12 | EARNINGS REPORT | 3
| Grupo Financiero Santander |
| Notes to financial statements as of September 30, 2012 |
| (Millions of pesos, except for number of shares) |
| 1. Financial Instruments | |
| | |
| Financial instruments are constituted as follows: | |
| | |
| | Accounting Value |
| | |
| Trading Securities: | |
| | |
| Bank Securities | 1,499 |
| Government Securities | 131,777 |
| Private shares | 1,149 |
| Shares | 8,514 |
| | 142,939 |
| | |
| Securities available for sale: | |
| | |
| Bank Securities | 503 |
| Government Securities | 49,034 |
| Other | 5,459 |
| | 54,996 |
| Securities held until maturity: | |
| | |
| Bank Securities | |
| Government Securities | |
| Government securities (Cetes especiales) | 5,032 |
| | 5,032 |
| | |
| Total Financial Instruments | 202,967 |
| 2. Repurchase and resale agreements | |
| The repurchase and resale agreements portfolio is constituted as follows: |
| | Net balance |
| Debit Balances | |
| | |
| Bank Securities | 3,501 |
| Government Securities | 957 |
| Total | 4,458 |
| | |
| Credit balances | |
| | |
| Bank Securities | 993 |
| Government Securities | 99,894 |
| Private Securities | 5,419 |
| Total | 106,306 |
| | |
| | (101,848) |
3Q. 12 | EARNINGS REPORT | 4
| 3. Investment in securities different to government securities | | | |
| | | | | | | |
| The table below lists the investments in debt securities of a same issuer, with positions equal or greater than 5% |
| of Tier 1 Capital of the Bank. | | | | | |
| | | | | | | |
| Issuer / Series | Maturity date | % Rate | Book Value | | | |
| | | | | | | |
| MX2PPE050004 | 16-Jul-15 | 9.91% | 3,805 | | | |
| US706451BF73 | 15-Dic-15 | 2.32% | 1,612 | | | |
| | | Total | 5,417 | | | |
| | | | | | | |
| Tier 1 Capital as of June, 2012 | | 75,108 | | | |
| 5 % of Tier 1 Capital | | | 3,755 | | | |
| 4. Derivative Financial Instruments | | | | | | | | |
| | | | | | | | | |
The nominal value of the different derivative financial instruments agreements for trading and hedging purposes, as of September 30, 2012, are as follows: |
| | | | | | | | | |
| Swaps | | | | | | | | |
| | | | | | | | | |
| Interest Rate | 3,212,266 | | | | | | | |
| Foreign Exchange | 587,814 | | | | | | | |
| | | | | | | | | |
| Futures | Buy | | Sell | | | | | |
| Interest Rate | 156 | | 541,673 | | | | | |
| Foreign Exchange | - | | 882 | | | | | |
| Index | 4,237 | | 7,576 | | | | | |
| | | | | | | | | |
| Forward Contracts | | | | | | | | |
| Interest Rate | 4,000 | | 2,500 | | | | | |
| Foreign Exchange | 127,371 | | 124,952 | | | | | |
| Securities | 4,474 | | 7,463 | | | | | |
| | | | | | | | | |
| Options | Long | | Short | | | | | |
| Interest Rate | 180,408 | | 219,216 | | | | | |
| Foreign Exchange | 9,203 | | 9,740 | | | | | |
| Indexes | 11,052 | | 25,905 | | | | | |
| Securities | 3,801 | | 3,325 | | | | | |
| | | | | | | | | |
| Total for trading | 4,144,781 | | 943,231 | | | | | |
| | | | | | | | | |
| Hedge | | | | | | | | |
| Cash Flow | | | | | | | | |
| Interest Rate Swaps | 26,025 | | | | | | | |
| Foreign Exchange Swaps | 17,529 | | | | | | | |
| | | | | | | | | |
| Fair Value | | | | | | | | |
| Interest Rate Swaps | 7,768 | | | | | | | |
| Foreign Exchange Swaps | 2,090 | | | | | | | |
| | | | | | | | | |
| Total for hedge | 53,412 | | | | | | | |
| | | | | | | | | |
| Total Financial Instruments | 4,198,193 | | 943,231 | | | | | |
3Q. 12 | EARNINGS REPORT | 5
| 5. Loan Portfolio | | | | | |
| The loan portfolio, by type of loan and currency, as of September 30, 2012, is constituted as follows: |
| | | | | | |
| | | Amount | | |
| | Pesos | USA Dlls | UDIS | Total | |
| | | | | | |
| Current loan portfolio | | | | | |
| | | | | | |
| Commercial or business activities | 140,018 | 35,926 | 1 | 175,945 | |
| Financial entities | 616 | 3 | 0 | 619 | |
| Governmental entities | 25,162 | 9,956 | 3 | 35,121 | |
| Commercial loans | 165,796 | 45,885 | 4 | 211,685 | |
| Consumer loans | 59,996 | 0 | 0 | 59,996 | |
| Mortgages | 63,610 | 959 | 1,603 | 66,172 | |
| Total | 289,402 | 46,844 | 1,607 | 337,853 | |
| 6. Past Due Loans | | | | | |
| | | | | | |
| | | Amount | |
| Past Due Loans | Pesos | USD | UDIS | | Total |
| | | | | | |
| | | | | | |
| Commercial or business activities | 1,363 | 39 | 0 | | 1,402 |
| Commercial loans | 1,363 | 39 | 0 | | 1,402 |
| Past due consumer loans | 2,053 | 0 | 0 | | 2,053 |
| Past due mortgages | 1,593 | 236 | 246 | | 2,075 |
| Total | 5,009 | 275 | 246 | | 5,530 |
| | | | | | |
| | | | | | |
| The analysis of movements in past due loans from January 1 to September 30, 2012, is as follows: |
| | | | | | |
| Balance as of December 31, 2011 | | | | 5,315 |
| | | | | | |
| Plus: Transfer from current loan portfolio to past due loans | | | 10,296 |
| | | | | | |
| Collections | | | | | |
| Cash | | | (1,206) | | |
| Normalization | | | (2,013) | | |
| Awards | | | 0 | | (3,219) |
| Reestructured loans | | | | | (990) |
| | | | | | |
| Charges off | | | | | (5,873) |
| | | | | | |
| Balance as of September 30, 2012 | | | | 5,530 |
| | | | | | |
| 7. Allowances for loan losses | | | |
| | | | |
| The movements in the provision for loan losses, from January 1st. to September 30, 2012, are as follows: |
| | | | |
| Balance as of December 31, 2011 | | | 11,191 |
| | | | |
| Allowances created | | | 6,496 |
| Release vs. Goodwill | | | (45) |
| Charge-offs | | | (5,873) |
| Release Comercial Mexicana, S.A. | | | (378) |
| Exchange rate effect on foreign currency | | | (31) |
| Balance as of September 30, 2012 | | | 11,360 |
3Q. 12 | EARNINGS REPORT | 6
The table below presents a summary of charge-offs by type of product as of September 30, 2012: |
| | | | | | | | | |
| Product | | Charge-offs | | Debit Relieves | | Total | | % |
| | | | | | | | | |
| First Quarter | | | | | | | | |
| Commercial Loans | 280 | | 48 | | 328 | | 17.62 |
| Mortage | | 310 | | 10 | | 320 | | 17.20 |
| Credit Card | | 721 | | 55 | | 776 | | 41.70 |
| Consumer loans | 420 | | 17 | | 437 | | 23.48 |
| Total | | 1,731 | | 130 | | 1,861 | | 100.00 |
| | | | | | | | | |
| Second Quarter | | | | | | | |
| Commercial Loans | 396 | | 5 | | 401 | | 22.71 |
| Mortage | | 103 | | 10 | | 113 | | 6.40 |
| Credit Card | | 431 | | 16 | | 447 | | 25.31 |
| Consumer loans | 758 | | 47 | | 805 | | 45.58 |
| Total | | 1,688 | | 78 | | 1,766 | | 100.00 |
| | | | | | | | | |
| Third Quarter | | | | | | | | |
| Commercial Loans | 311 | | 9 | | 320 | | 14.25 |
| Mortage | | 325 | | 5 | | 330 | | 14.69 |
| Credit Card | | 958 | | 46 | | 1,004 | | 44.70 |
| Consumer loans | 577 | | 15 | | 592 | | 26.36 |
| Total | | 2,171 | | 75 | | 2,246 | | 100.00 |
| | | | | | | | | |
| 2011 | | | | | | | | |
| Commercial Loans | 987 | | 62 | | 1,049 | | 17.86 |
| Mortage | | 738 | | 25 | | 763 | | 12.99 |
| Credit Card | | 2,110 | | 117 | | 2,227 | | 37.92 |
| Consumer loans | 1,755 | | 79 | | 1,834 | | 31.23 |
| Total | | 5,590 | | 283 | | 5,873 | | 100.00 |
| Allowances for Loan Lossses from the Commerce Fund | |
| Pursuant to the Commission's authorization in Official Bulletin No. 601-I-DGSIF "C" - 38625 issued on March, 2001; as of September 30, 2012, there are MX$76 million in allowances for loan losses from the commerce fund, which resulted from the reestructuring process of Grupo Financiero Santander. As of December 31, 2011, such allowances totaled Mx$ $113. |
3Q. 12 | EARNINGS REPORT | 7
| During the third quarter of 2012, the abovementioned allowances for loan losses had the following breakdown: |
| | |
| Mortgages and commercial loans charge-offs | -38 |
| Udis reserves actualization and f/x effects | 0 |
| | -38 |
| | |
| As part of the Commission's authorization for these reserves, in case there are exit loan portfolio recoveries from previously charged off loans, these recoveries will be recorded in the income statement. During the period, charges due to income statement due to recoveries of previously charge off loans amounted Mx$45. |
8. Problematic Loans
Loans portfolio was graded according to the general provisions issued by the National Banking and Exchange Commission. The management considers that problematic loans are the ones graded as “D” and “E”, due to their low possibility for the collection of the full amount of principal.
| 9. Programs of benefits to bank debtors with the support of the Federal Government. | | |
| | | | | | |
As of September 30, 2012, the accounts receivable from the federal government are $203, regarding the early termination of benefit programs granted to bank debtors. |
Early termination of the support programs for debtors
On July 15, 2010, an Agreement for the early termination of the support programs for bank debtors (the “Agreement”) was entered into. The credit institutions considered to early terminate the following programs, which were created between years 1995- 1998, derived from restructuring of loans, as follows:
| 1. | Support Program for Mortgages Debtors (Support Program); |
| 2. | Support Program for the Construction of Housing, in the stage of individual loans (Support Program), and |
3. Agreement on benefits for Mortgages Debtors (Discounts Program)
The credit institutions reached an agreement with the Mexican Treasury Department (Secretaría de Hacienda y Crédito Público (SHCP)) and the Commission. The banks were represented by the Mexican Bank’s Association (Asociación de Bancos de México, A.C. (ABM)) and it establishes that, for the correct application of the early termination agreement, the credit institutions are to be subject to the supervision and monitoring of the Commission, and they shall comply with all the comments and corrections made by such Commission and they shall deliver all the information requested by the Commission for the fulfillment of the agreement.
Restructured loans or loans in UDIs granted under the Support Programs for debtors, loans in Mexican pesos; loans in Mexican pesos with right to receive the benefits of the Discounts Program and, loans that, as of December 31, 2010, were current, as well as past due loans that as of the aforementioned date, had been restructured, and those loans that, in order to continue in effect, received a write-off or discount, whatever the amount, were subject to the scheme of early termination, provided that evidence of payments was delivered.
10. Average Interest Rates paid on deposits | | | |
| | | | |
| The average interest rates paid on deposits during September, 2012, is as follows: |
| | Pesos | | USD |
| | | | |
| Average balance | 149,040 | | 17,773 |
| Interest | 592 | | 1 |
| Rate | 1.5887% | | 0.0288% |
| 11. Bank and other Loans | | | | | | |
| | | | | | | |
| As of september 30, 2012, banks and other loans are constituted as follows: | | | | |
3Q. 12 | EARNINGS REPORT | 8
| | | | | | | |
| | | | | | | |
| | | | | |
| | | | | | | |
| | | | Average | | | |
| Liabilities | Amount | | Rate | | Maturity | |
| | | | | | | |
| Loans in Mexican pesos | | | | | | |
| | | | | | | |
| Banco de México | | | | | | |
| Call money | 9,000 | | 4.50% | | From 2 days | |
| Public fiduciary funds | 5,565 | | 4.28% | | From 1 day to 18 years |
| Government loans | 5,335 | | 5.50% | | From 1 day to 6 years |
| Total | 19,900 | | | | | |
| | | | | | | |
| Loans in foreign currency | | | | | | |
| | | | | | | |
| Foreign bank loans | 7,828 | | 1.55% | | From 1 day to 9 years |
| Call money | 5,596 | | 0.39% | | 1 day | |
| Public fiduciary funds | 575 | | 1.05% | | From 1 day to 3 years |
| Development bank loans | 361 | | 1.96% | | From 1 day to 4 years |
| Total | 14,360 | | | | | |
| | | | | | | |
| Total Loans | 34,259 | | | | | |
| | | | | | | |
| Accrued Interests | 79 | | | | | |
| | | | | | | |
| Total | 34,339 | | | | | |
| | | | | | | |
| 12. Current and Deferred Taxes | | | |
| | | | |
| Current taxes as of September 30, 2012 | | | |
| | | | |
| Income Tax | 1,853 | | |
| Deferred taxes | (406) | (1) | |
| Total Bank | 1,447 | | |
| Current-deferred taxes from other subsidiaries | 1,871 | | |
| Total Financial Group | 3,318 | | |
| | | | |
(1) Deferred taxes are broken down as follows: | | | |
| | | | |
| Global provision | 22 | | |
| Fixed Asset | (233) | | |
| Net effect from financial instruments | (446) | | |
| Accrued Liabilities | 243 | | |
| Other | 8 | | |
| Total Bank | (406) | | |
| Provision for loan losses of subsidiaries, net effect | (467) | | |
| Others, subsidiaries | 13 | | |
| Total deferred tax, Financial Group | (860) | | |
| | | | |
| As of September 30, 2012, Deferred Assets are registered at 75.67% and Deferred Liabilities are registered at 100% |
| | | | |
| Remainder of global provisions and allowances for loan losses | 9,784 | | |
| Other concepts | 3,106 | | |
| Total Deferred Tax (net) | 12,889 | | |
| | | | |
| Deferred taxes registered in balance sheet accounts | 9,155 | | |
| Deferred taxes registered in memorandum accounts | 3,735 | | |
3Q. 12 | EARNINGS REPORT | 9
| 13. Other operating income (expenses) | | | | |
| The main items that constitute the balance of Other Income (Expenses) account, as of September 30, 2012, are the following: |
| | | | | |
| Concept: | | | | |
| Recoveries of previously charged-off loans | | 1,365 | | |
| Sales of fixed assets | | 1,732 | | |
| Release of allowances for loan losses (Comercial Mexicana) | | 378 | | |
| Write-offs of liabilities and reserves | | 154 | | |
| Interests on employees' loans | | 89 | | |
| Provision for foreclosed assets | | 81 | | |
| Technical Advisory | | 75 | | |
| Expenses on collections | | (432) | | |
| Write-offs | | (614) | | |
| Provisions for legal and fiscal contingencies | | (199) | | |
| Provision and payments to IPAB (Indemnity) | | (33) | | |
| Others | | 167 | | |
| | | 2,763 | | |
14. Discontinued Transactions
Sale of Seguros Santander
On February, 2011, Banco Santander, S.A. (España) and ZS Insurance America, SL entered into a commercial alliance for the business of bancassurance in Latin America that consists in an agreement for the distribution for sale of insurance products in each country, during 25 years.
Derived from the commercial alliance, on July 14, 2011, the agreement among Banco Santander, S.A. (España), Zurich, and Zurich Insurance Company LTD. was entered into (the “purchaser”).
On July 14, 2011, the financial Group performed the sale of the totality of the shares of Seguros Santander, S.A. via a stock- purchase agreement entered into and between the financial group and ZS Insurance America, SL, and only for guarantee purposes, with Banco Santander, S.A. (España).
The agreement stipulates that the financial group agreed to sell, transfer and deliver to ZS Insurance America, SL 189,999 shares of the capital stock of Seguros Santander, which represented 99.99% of the capital stock.
The book value of the capital stock of Seguros Santander, as of December 31, 2010, amounted $1,528. In addition, as of that date, a goodwill derived from the purchase of the insurance company was registered for an amount of $42. The sale price for the 99.99% of the shares of Seguros Santander, owned by the financial group, amounted $7,441, which generated a profit after taxes of $4,822, registered on November, 2011 by the Financial Group once the sale was executed pursuant to the clauses of the agreement, and the effects of such sale were reflected in the statement of income within the item “discontinued transactions”.
According to the agreement, the financial group may continue to provide administrative services as well as the sale of insurance policies as part of the continuation of the business, to have and keep tangible goods and properties of Seguros Santander, as well as to maintain relevant business relationships, except in case Zurich and Inversiones ZS América, SL do not accept so or the agreement is terminated.
In addition, the results from the operations of Seguros Santander for year 2011 where it belonged to the financial group, are shown in the income statement within the item “Discontinued Transactions”.
3Q. 12 | EARNINGS REPORT | 10
| 15. Capitalization Ratio | | | |
| | | | |
| Banco Santander (México), S.A. | | | |
| | | | |
| | Amount of equivalent positions | | Capital Requirement |
| I. ASSET RISKS | | | |
| DUE TO MARKET RISKS | | | |
| Transactions in Mexican pesos with a nominal rate | 139,163 | | 11,133 |
| Transactions with debt securities in Mexican pesos, with overrate and variable rate | 4,464 | | 357 |
| Transactions in Mexican pesos with real rate or UDI | 7,135 | | 571 |
| Transactions in Mexican pesos with rate referred to General Minimum Wage | 1,215 | | 97 |
| UDI positions or referred to NCPI | 22 | | 2 |
| Positions in Mexican pesos with rate referred to General Minimum Wage | 6 | | 0 |
| Transactions in foreign currency with nominal rate | 4,356 | | 348 |
| Foreign Currency positions or rate referred to exchange rate. | 688 | | 55 |
| Stock positions or rate referred to the price of a stock or group of stocks | 398 | | 32 |
| Total | 157,447 | | 12,596 |
| | | | |
| CREDIT RISKS | | | |
| Group II weighted at 50%) | 31 | | 2 |
| Group III (weighted at 20%) | 17,410 | | 1,393 |
| Group III (weighted at 23%) | 5,621 | | 450 |
| Group III (weighted at 50%) | 174 | | 14 |
| Group III (weighted at 100%) | 6,016 | | 481 |
| Group IV (wieghted at 20%) | 5,237 | | 419 |
| Group V (weighted at 10%) | 11 | | 1 |
| Group V (weighted at 20%) | 353 | | 28 |
| Group V (weighted at 50%) | 546 | | 44 |
| Group V (weighted at 115%) | 8,030 | | 642 |
| Group V (weighted at 150%) | 20 | | 2 |
| Group VI (weighted at 50%) | 13,115 | | 1,049 |
| Group VI (weighted at 75%) | 6,357 | | 509 |
| Group VI (weighted at 100%) | 14,217 | | 1,137 |
| Group VI (weighted at 125%) | 749 | | 60 |
| Group VII-A (weighted at 20%) | 5,033 | | 403 |
| Group VII-A (weighted at 23%) | 3,719 | | 297 |
| Group VII-A (weighted at 50%) | 679 | | 54 |
| Group VII-A (weighted at 57.5%) | 348 | | 28 |
| Group VII-A (weighted at 100%) | 108,322 | | 8,666 |
| Group VII-A (weighted at 115%) | 33,353 | | 2,668 |
| Group VII-A (weighted at 120%) | 61 | | 5 |
| Group VII-A (weighted at 125%) | 173 | | 14 |
| Group VII-A (weighted at 150%) | 239 | | 19 |
| Group VII-B (weighted at 20%) | 253 | | 20 |
| Group VII-B (weighted at 100%) | 9,858 | | 789 |
| Group IX (weighted at 100%) | 42,374 | | 3,390 |
| Group IX (weighted at 115%) | 22 | | 2 |
| Group IX (weighted at 125%) | 546 | | 44 |
| Other assets (weighted at 10%) | 204 | | 16 |
| Other assets (weighted at 11.5%) | 2 | | 0 |
| Other assets (weighted at 20%) | 5,811 | | 465 |
| Other assets (weighted at 50%) | 3,063 | | 245 |
| Other assets (weighted at 100%) | 21,759 | | 1,741 |
| Total | 313,707 | | 25,097 |
| | | | |
| OPERATIONS RISK | | | |
| Requirement on Operations Risk | 48,493 | | 3,879 |
| | | | |
| TOTAL REQUIREMENTS | | | |
| Net requirement on market risk | 157,447 | | 12,596 |
| Requirement on credit risk | 313,707 | | 25,097 |
| Requirement on operations risk | 48,493 | | 3,879 |
| Total | 519,647 | | 41,572 |
| | | | |
| | | | |
3Q. 12 | EARNINGS REPORT | 11
| II. CAPITAL INTEGRATION | | | |
| | | | |
| BASIC CAPITAL | | | |
| Stockholders' Equity | 93,064 | | |
| Total Stockholders' equity | 93,064 | | |
| Less: | | | |
| Investment in shares of financial entities | 17,581 | | |
| Investment in non-financial shares | 24 | | |
| Intangibles and Deferred expenses or costs | 1,888 | | |
| Total basic Capital | 73,570 | | |
| | | | |
| SUPLEMENTARY CAPITAL | | | |
| Provisions for general credit risks. | 1,538 | | |
| NET CAPITAL | 75,108 | | |
| | | | |
| | | | |
| III. CAPITALIZATION RATIO | | | |
| | | | |
| Net Capital / Required Capital | 1.81 | | |
| Basic Capital / Assets subject to credit and market risk | 14.16 | | |
| Net capital /Assets subject to credit risk | 23.94 | | |
| Net Capital / Assets subject to Total Risk | 14.45 | | |
| Casa de Bolsa Santander, S.A. de C.V. | | | |
| | | | |
| | Amount of equivalent positions | | Capital Requirement |
| I. ASSETS RISK | | | |
| MARKET RISK | | | |
| | | | |
| Transactions in Mexican pesos with nominal rate | 46 | | 4 |
| Transactions with debt securities in Mexican pesos with overrate and variable rate. | 1 | | 0 |
| Transactions in Mexican pesos with real rate or UDI | 0 | | 0 |
| UDI positions or referred to NCPI | 0 | | 0 |
| Stock positions or rate referred to the price of a stock or group of stocks | 1,365 | | 109 |
| | 1,412 | | 113 |
| | | | |
3Q. 12 | EARNINGS REPORT | 12
| CREDIT RISKS | | | |
| Group II ( weighted at 20% ) | 37 | | 3 |
| Group III (weighted at 100% ) | 428 | | 34 |
| | 466 | | 37 |
| | | | |
| | | | |
| OPERATION RISKS | 237 | | 19 |
| | | | |
| TOTAL REQUIREMENTS | | | |
| Net requirement on market risk | 1,412 | | 113 |
| Requirement on credit risk | 466 | | 37 |
| Requirement on operations risk | 237 | | 19 |
| | 2,114 | | 169 |
| | | | |
| II. CAPITAL INTEGRATION | | | |
| | | | |
| BASIC CAPITAL | | | |
| Stockholders' Equity | 1,406 | | |
| Subordinated Debentures and capitalization securities | 0 | | |
| Total Stockholders' Equity | 1,406 | | |
| Less: | | | |
| Investment in shares of financial entities | 42 | | |
| Investment in non-financial shares | 1 | | |
| Total Basic Capital | 1,363 | | |
| | | | |
| SUPPLEMENTARY CAPITAL | | | |
| Debentures and capitalization securities | 0 | | |
| Provisions for general credit risks | 0 | | |
| GLOBAL CAPITAL | 1,363 | | |
| | | | |
| III. INDICE DE CAPITALIZACIÓN | | | |
| | | | |
| Global Capital / Required Capital | 8.06 | | |
| Basic Capital / Assets subject to credit, market and operation risk | 64.47 | | |
| Global capital /Assets subject to credit risk | 292.64 | | |
| Global Capital / Assets subject to credit, market and operation Risk | 64.47 | | |
3Q. 12 | EARNINGS REPORT | 13
| Santander Consumo, S.A. de C.V., SOFOM, E.R. | | | |
| | | | |
| | Amount of equivalent positions | | Capital requirements |
| I. ASSETS RISK | | | |
| MARKET RISKS | | | |
| | | | |
| Transactions in Mexican pesos with nominal rate | 9,577 | | 766 |
| Transactions with debt securities in Mexican pesos with overrate and variable rate. | 0 | | 0 |
| Suma | 9,577 | | 766 |
| | | | |
| CREDIT RISKS | | | |
| Group III (weighted at 20%) | 0 | | 0 |
| Group VI (weighted at 100%) | 54,656 | | 4,372 |
| Group VI (weighted at 125%) | 888 | | 71 |
| Group VI (weighted at 150%) | 0 | | 0 |
| Group VII (weighted at 20%) | 1 | | 0 |
| Group VII (weighted at 150%) | 2 | | 0 |
| Other assets (weighted at 100%) | 5,396 | | 432 |
| Suma | 60,943 | | 4,875 |
| | | | |
| OPERATIONS RISK | | | |
| Requirement on Operations Risk | 7,823 | | 626 |
| | | | |
| TOTAL REQUIREMENTS | | | |
| Net requirement on market risk | 9,577 | | 766 |
| Requirement on credit risk | 60,943 | | 4,875 |
| Requirement on operations risk | 7,823 | | 626 |
| Total | 78,344 | | 6,267 |
| | | | |
| II. CAPITAL INTEGRATION | | | |
| | | | |
| BASIC CAPITAL | | | |
| Stockholders' Equity | 10,838 | | |
| Subordinated Debentures and capitalization securities | 0 | | |
| Total Stockholders' Equity | 10,838 | | |
| Less: | | | |
| Investment in subordinated securities | 0 | | |
| Investment in shares of financial entities | 0 | | |
| Investment in non-financial shares | 0 | | |
| Loans granted for the purchase of own shares or shares of entities of the financial group. | 0 | | |
| Deferred Taxes | 0 | | |
| Intangibles and Deferred expenses or costs | 0 | | |
| Other assets | 0 | | |
| Total Basic Capital | 10,838 | | |
| | | | |
| SUPPLEMENTARY CAPITAL | | | |
| Debentures and capitalization securities | 0 | | |
| Provisions for general credit risks. | 698 | | |
| NET CAPITAL | 11,536 | | |
| | | | |
| III. CAPITALIZATION RATIO | | | |
| | | | |
| Net capital/ Required Capital | 1.84 | | |
| Basic Capital / Assets subject to total risks | 13.83 | | |
| Net Capital / Assets subject to Credit Risks | 18.93 | | |
| Net Capital / Assets subject to total Risks | 14.72 | | |
3Q. 12 | EARNINGS REPORT | 14
| Santander Hipotecario, S.A. de C.V., SOFOM, E.R. | | | |
| | | | |
| | Amount of equivalent positions | | Capital Requirements |
| I. ASSETS RISK | | | |
| MARKET RISK | | | |
| | | | |
| Transactions in Mexican pesos with nominal rate | 5,210 | | 417 |
| Transactions in Mexican pesos with real rate or UDI | 702 | | 56 |
| UDI positions or referred to NCPI | 2 | | 0 |
| Transactions in foreign currency with nominal rate | 239 | | 19 |
| Foreign Currency positions or rate referred to exchange rate | 86 | | 7 |
| Suma | 6,238 | | 499 |
| | | | |
| CREDIT RISK | | | |
| | | | |
| Group III (weighted at 20%) | 38 | | 3 |
| Group VI (weighted at 50%) | 4,831 | | 386 |
| Group VI (weighted at 75%) | 2,898 | | 232 |
| Group VI (weighted at 100%) | 3,259 | | 282 |
| Group VI (weighted at 125%) | 1,435 | | 115 |
| Group VII-A (weighted at 20%) | 1 | | 0 |
| Other assets (weighted at 100%) | 2,564 | | 205 |
| Total | 15,297 | | 1,224 |
| | | | |
| OPERATIONS RISK | | | |
| Requirement on Operations Risk | 1,174 | | 94 |
| | | | |
| TOTAL REQUIREMENTS | | | |
| Net requirement on market risk | 6,238 | | 499 |
| Requirement on credit risk | 15,297 | | 1,224 |
| Requirement on operations risk | 1,174 | | 94 |
| Total | 22,709 | | 1,817 |
| | | | |
| | | | |
3Q. 12 | EARNINGS REPORT | 15
| II. CAPITAL INTEGRATION | | | |
| | | | |
| BASIC CAPITAL | | | |
| Stockholders' Equity | 3,026 | | |
| Subordinated Debentures and capitalization securities | 0 | | |
| Total Stockholders' Equity | 3,026 | | |
| Less: | | | |
| Investment in subordinated securities | 0 | | |
| Investment in shares of financial entities | 0 | | |
| Investment in non-financial shares | 0 | | |
| Loans granted for the purchase of own shares or shares of entities of the financial group. | 0 | | |
| Deferred Taxes | 0 | | |
| Intangibles and Deferred expenses or costs | 0 | | |
| Other assets | 0 | | |
| Total Basic Capital | 3,026 | | |
| | | | |
| SUPPLEMENTARY CAPITAL | | | |
| Debentures and capitalization securities | 0 | | |
| Provisions for general credit risks. | 35 | | |
| NET CAPITAL | 3,061 | | |
| | | | |
| III. CAPITALIZATION RATIO | | | |
| | | | |
| Net Capital/ Required Capital | 1.68 | | |
| Basic Capital / Assets subject to total risks | 13.33 | | |
| Net Capital / Assets subject to Credit Risks | 20.01 | | |
| Net Capital / Assets subject to total Risks | 13.48 | | |
| 16. Risk Diversification |
| Pursuant to the general rules for risk diversification in the performance of borrowing and lending transactions applicable to credit institutions, published in the Federal official Gazette on April 30, 2003, the following information with respect to credit risk transactions as of September 30, 2012, is provided: |
| - Loans granted to debtors or groups of persons representing a common risk, whose individual amount is greater to 10% of Tier 1 Capital (of the month previous to the date of report), constituted by a group representing an ampount of $9,079.5, equivalent to 12.34% of the basic capital of the Bank. |
| - Loans granted to the three major debtors or groups of persons representing a common risk for a total amount of $17,426.7, repreenting the 23.68% of the basic capital of the Bank. |
17. Internal and external Sources of Liquidity
Internal sources of liquidity in domestic and foreign currency come from the different savings products that the institution offers to clients; that is, the funds obtained from check accounts and term deposits from customers.
With respect to external sources of liquidity, the institution has several mechanisms of access to debt and capital markets, i.e., the bank obtains resources via the issue of debt securities, loans to other institutions, including the <central Bank and international institutions, as well as the issue of subordinate debt and other capital securities.
The bank may obtain liquidity also via repurchase and resale agreements on securities (reportos) possessed by the bank. Also, the bank may obtain funds via the sale of assets.
18. Dividends Policy
The institution performs the payment of dividends pursuant to the applicable legal, administrative, fiscal and accounting rules, based in the results obtained by the Institution. The Board of Directors proposes the payment of dividends at the Ordinary General Stockholders’ Meeting, which is the body that orders and approves the payment of dividends to the stockholders of the institution.
3Q. 12 | EARNINGS REPORT | 16
19. Treasury Policies
The activities of the bank’s treasury are performed pursuant to the following:
| a) | In compliance with the provisions issued by the different authorities of the financial system for bank institutions, such as guidelines for lending and borrowing transactions, accounting rules, liquidity ratios, regulatory matching, capacity of the payment systems, etc. |
| b) | Internal limits for market, liquidity and credit risks, i.e., there are limits for the management of the assets and liabilities of the bank with respect to the market and liquidity risk derived from such management, as well as the limits regarding counterparty risk derived from the daily transactions. |
| c) | Compliance with the guidelines stipulated by national and international standard agreements regarding transactions performed in markets. |
| d) | Sound market practices. |
| e) | Compliance with the operation procedures of the institution. |
| 20. Shareholding | | |
| | | |
| Subsidiaries | | % of interest |
| | | |
| Banco Santander (México), S.A. | | 99.99% |
| Casa de Bolsa Santander, S.A. de C.V. | | 99.96% |
| Gestión Santander, S.A. de C.V. | | 99.99% |
21. Internal Control
The activities of Grupo Financiero Santander are governed by a series of guidelines established by Banco Santander (España), the holding company of Grupo Financiero Santander, whose head offices are located in the city of Madrid, and the Mexican laws.
For the compliance of the rules in effect, the Group has developed and implemented an Internal Control Model (ICM) which includes the participation of the Board of Directors, the statutory advisor, the Audit Committee, the General Direction, the Internal Control Unit and the Regulatory Control Department.
The ICM is based in the identification and documentation of the main risks and the periodic assessment of the controls that are created to mitigate such risks. ICM guarantees, among other aspects, the design, establishment and updating of measures and controls that promote the compliance with the internal and external rules and the proper operation of the data processing systems.
The internal control system includes:
The implementation of an organizational structure has allowed the development and growth of the group. Such structure is constituted as follows:
CEO and General Direction
The following functions report to the CEO and General Direction:
| § | Vice-president of Finance and Administration: |
| Ø | Deputy General Direction of Intervention and Management Control |
| Ø | Deputy General Direction for Media |
| Ø | Deputy Direction for Legal Affairs |
| § | Vice-president of Commercial Banking: |
| Ø | Deputy General Direction of Commercial Strategy |
| Ø | Deputy General Direction of Companies and Institutions Banking |
| Ø | Deputy General Direction of Individuals and Small Enterprises Banking |
| Ø | Deputy general Direction of Payment Systems |
| § | Deputy General Director of Credit |
| § | Deputy General Director of Wholesale Banking |
3Q. 12 | EARNINGS REPORT | 17
| § | Deputy General Director of Institutional Relations and Communications |
| § | Executive Direction of Audit |
The roles and responsibilities of each direction have been stipulated in order to optimize the performance of the activities of the group.
The Organization area, via manuals, circulars and bulletins, governs the activities of the group; likewise, the Regulatory Control Department has established a general Code of Conduct that every employee of the Bank has to follow.
The structure of the Group includes the constitution of a Board of Directors, which establishes the objectives, the policies and general procedures of the Group, the appointment of directors and the constitution of committees that are to supervise the development of the activities of the Group.
The committees that supervise the development of the entities that constitute the Group, created by the Board of Directors, are the following:
| § | Society Practices Committee |
| § | Integral Risk management Committee |
| § | Executive Credit Committee |
| § | Regulatory Compliance Committee |
| § | Communication and Control Committee |
| § | Remunerations Committee |
The registration, control and storage of the daily activities of the Group is carried out by systems mainly designed and focused on the banking and brokerage activity. the common platform for such purposes is known as ALTAIR and it is applied by all the entities in Latin America that are part of Banco Santander (España).
Loans portfolio and transactions of commercial banking of the group are controlled and registered at ALTAIR. Treasury activities are controlled and registered in computer platforms and the operations are centralized for its accounting registration in ALTAIR. Such platforms comply with the parameters stipulated by the National banking and Exchange Commission with respect to reliability and accuracy.
Grupo Financiero Santander is regulated by the CNBV, and therefore, the financial statements are prepared according to the accounting practices stipulated by such Commission via the issue of accounting circulars, general official letters and particular official letters regarding the accounting registration of transactions. For such purposes, the accounting system of the institution has been structured with an accounts catalog stipulated by the Commission, and all the reports come from such system and comply with the applicable provisions.
Within the Group, there is an independent area of Internal Audit, whose mission is to oversee the compliance, efficacy and efficiency of the internal control systems of the Group, as well as the reliability and quality of the accounting information.
To achieve so, Internal Audit verifies that the risks inherent to the activity of the Group are properly covered and the policies stipulated by the Direction, the applicable internal and external regulations and the procedures are observed.
The results of the activities of Internal Audit are reported on regular basis to the General Direction, the Audit Committee and the Board of Directors. Among other issues, the results of the audits performed to the different business units of the companies that constitute the Group and the follow up of the recommendations provided to the different areas and/ or entities are informed.
Internal Audit has a quality system according to the requirements of the Directive UNE-EN ISO 9001:2008 and it is focused towards customer satisfaction under an approach of continuous improvement of procedures.
In summary, Internal Control of the Group includes the continuous development, implementation and updating of an internal control model where all the areas of the group have an active role.
| 22. Accounting Differences between CNBV regulations in Mexico and the Circular issued by Bank of Spain | | |
| | | |
| Earnings of Grupo Financiero Santander under CNBV regulations in Mexico | 14,513 | |
| | | |
| Temporary differences in classification and assessment of repurchase and resale agreements and securities | (72) | (a) |
| | | |
| Income and expenses from the Head Office | 142 | (b) |
| | | |
| Other differences between CNBV regulations in Mexico and the Circular issued by Bank of Spain | (472) | |
| | | |
| Earnings of Grupo Financiero Santander under the regulations set forth in the Circular issued by the Bank of Spain | 14,111 | |
(a) According to the local regulations, as of september 30, 2008, the market variation of securities classified as securities for trade was registered in the income statement; for Spain, such securities are classified as available for sale and, pursuant to the Circular issued by Bank of Spain, its valuation is registered in stockholders' equit until their realization. |
(b) Allocation of corporate income and expenses performed by the Head Office to its subsidiaries, pursuant to the rules and policies of Banco Santander España. |
3Q. 12 | EARNINGS REPORT | 18
| 23. Transactions with Related Parties | |
| | |
| Assets | |
| Availabilities | 6,948 |
| Transactions with derivative financial instruments (debit balance) | 20,255 |
| Loan Portfolio (net) | 2,022 |
| Other account receivables | 1,781 |
| Other assets | 1,481 |
| | |
| Liabilities | |
| Term deposits | 988 |
| Credit balance on repurchase and resale agreements | 87 |
| Interbank loans and from other entities | 188 |
| Transactions with derivative financial instruments (credit balance) | 25,624 |
| Other accounts payable | 173 |
| Credit balance on settlement of transactions | 818 |
| | |
| Earnings | |
| Interest collected | 64 |
| Commissions collected | 33 |
| Transactions with derivative financial instruments | 52,972 |
| Other earnings | 2 |
| | |
| Expenses | |
| Interests paid | 30 |
| Administration expenses | 177 |
| Transactions with derivative financial instruments | 57,140 |
| Technology Services | 1,016 |
| 24. Interests on Loan portfolio |
| |
| As of September 30, 2012, the Income Statement includes in the item "Earnings from loans" $27,206 million pesos that correspond to interests from the loan portfolio of Banco Santander (México), S.A.,Santander Consumo, S.A. de C.V. SOFOM ER and Santander Hipotecario, S.A. de C.V. SOFOM ER. |
25. Integral Risk Management
Risk management is considered by Grupo Financiero Santander as a competitive element of strategic nature with the purpose of maximizing the value for the stockholder. This management is defined, from a conceptual and organizational sense, as a comprehensive management of the different risks (market risk, liquidity risk, credit risk, counterparty risk, operative risk, legal risk and technological risk) assumed by the institution for the development of its activities. The management of the risk inherent to transactions is essential for understanding and determining the behavior of the financial condition of the institution and the creation of long-term value.
3Q. 12 | EARNINGS REPORT | 19
In order to comply with the provisions regarding the Comprehensive Risk management applicable to credit institutions, issued by the National Banking and Exchange Commission, the Board of Directors agreed to create the Comprehensive Risk Management Committee of the institution, to work pursuant to the rules set by such regulations. This Committee gathers every month and verifies that the transactions are according to the objectives, policies and procedures approved by the Board of Directors for the Comprehensive Risk Management.
The Comprehensive Risk management Committee delegates in the Comprehensive Risk Management Unit the responsibility for the implementation of procedures for the measure, administration and control of risks according to the applicable policies; such Unit has the faculty to authorize amounts greater than the stipulated limits and in such cases, the Board of Directors shall be informed on such deviations.
Market Risk
The Market Risk Management department of the Comprehensive Risk management Unit is responsible for recommending the policies on market risk management of the institution, and to establish the parameters for risk measuring, and to provide reports, analysis and assessments to the senior management, to the Comprehensive Risk management Committee and to the Board of Directors.
The market risk measurement quantifies the potential variation in the value of the positions as a consequence of changes in the market risk factors.
Depending on the nature of the activities of each business unit, debt and capital instruments are registered as securities for trade, securities available for sale and or securities held to maturity. The main characteristic that identifies securities available for sale is their permanent nature and they are managed as an structural part of the balance sheet. The institution has established provisions that all securities available for sale must fulfill, as well as adequate controls for the compliance of such provisions.
Whenever significant risks are identified, they are measured and limits are allocated in order to assure an adequate control. Global measurement of risk is carried out via a combination of the methodology applied to Portfolios for Trade and to the management of Assets and Liabilities.
Portfolios for Trade
In order to measure the risk in a global approach, the methodology of Value at Risk (VaR) is used. VaR is defined as the statistical estimate of the potential loss of value of a given position, during certain period and at certain confidence level. VaR provides a universal measure of the level of exposure of the different risk portfolios; it allows the comparison of the risk level assumed in different securities and markets and expresses the level of each portfolio through a unique figure in economic units.
VaR is calculated via historical simulation, with a 521 working-days window (520 percentage changes) and a one-day horizon. The calculation is performed from a series of simulated gains and losses with 1% percentile at constant pesos and with pesos decreasing on an exponential basis, with a decrease factor that is reviewed on annual basis, the most conservative measure is the one to be reported. A confidence level of 99% is assumed.
The Value at Risk as of September, 2012 (unaudited) amounted to:
| | Banco y Casa de Bolsa |
| | VaR (thousand of pesos) | % |
| Trading desks | 77,839.61 | 0.10% |
| Market Making | 45,413.72 | 0.06% |
| Prop Trading | 69,553.06 | 0.09% |
| | | |
| | | |
| Risk factor | 77,839.61 | 0.10% |
| Interest rate | 79,505.33 | 0.11% |
| Foreign exchange | 8,145.01 | 0.01% |
| Equity | 12,241.50 | 0.02% |
3Q. 12 | EARNINGS REPORT | 20
The Value at Risk for the average quarter of 2012 (unaudited) amounted to:
| | BanK y Brokerage |
| | VaR (thousand of pesos | % |
| Trading desks | 74,526.28 | 0.10% |
| Market Making | 45,876.33 | 0.06% |
| Prop Trading | 64,758.96 | 0.09% |
| | | |
| | | |
| Risk factor | 74,526.28 | 0.10% |
| Interest rate | 72,307.09 | 0.10% |
| Foreign exchange | 10,456.41 | 0.01% |
| Equity | 14,093.09 | 0.02% |
* % of VaR with respect to Net Capital
It is important to mention that the VaR related to consolidated positions in securities for trading and available for sale is 180,107 (thousands of Mexican pesos), mainly focused in the Interest Rate risk factor.
Likewise, monthly simulations of gains or losses of portfolios are carried out by revaluating such portfolios under different scenarios (Stress Test). Such estimates are generated using two different methods:
| · | Applying to risk factors the percentage changes observed in certain periods including relevant market turbulences. |
| · | Applying to risk factors changes that depend on the volatility of each risk factor. |
On a monthly basis “back testing” is carried out to compare daily gains and losses that would have been observed is the same positions had been maintained, taking into account only the change in value at risk in order to be able to fine tune the models. Even though these reports are prepared on a monthly basis, they include daily tests.
Management of Assets and Liabilities
Commercial banking activities of the institution generate important balance sheet amounts. The Assets and Liabilities Committee (ALCO) is responsible for determining the guidelines for the management of financial margin risk, net worth value and liquidity that must be followed by the different commercial portfolios. Pursuant to this approach, the General Direction of Finances has the responsibility to execute the strategies defined by the Assets and Liabilities Committee in order to modify the risk profile of the commercial portfolio by following the corresponding policies. Compliance with information requirements for interest rate, Exchange rate and liquidity risks is fundamental.
As part of the financial management of the institutions, sensitivity to financial margin (NIM) and net worth value (MVE) of the different balance sheet items is analyzed in comparison to variations in interest rates. This sensitivity is derived from the difference between maturity dates of assets and liabilities and the dates interest rates are modified. The analysis is performed from the classification of each item sensitive to interest rate throughout time, according to their repayment, maturity or contractual modification of the applicable interest rate.
| | Sensitivity 1% NIM | | Sensitivity 1% MVE |
| Banco y Casa de Bolsa | Jul-12 | Ago-12 | Sep-12 | Average | | Jul-12 | Ago-12 | Sep-12 | Average |
| Balance MXP GAP | 61% | 66% | 91% | 73% | | 81% | 78% | 78% | 78.7% |
| Balance USD GAP | 25% | 28% | 21% | 25% | | 73% | 67% | 81% | 73.6% |
Using simulation techniques, the predictable value of the financial margin and the net worth value are measured in different interest rate scenarios, and their sensitivity under extreme movement of such scenarios.
3Q. 12 | EARNINGS REPORT | 21
The Assets and Liabilities Committee adopts investment and hedging strategies in order to maintain such sensitivities within the target range.
Limits
Limits are used to control global risk of the financial group derived from each portfolio and books. The structure of limits is used to control exposures and to establish the total risk authorized to business units. These limits are established for VaR, Loss alert, maximum loss, equivalent volume of interest rate, delta equivalent in variable interest, open foreign currency positions, sensitivity of financial margin and sensitivity of net worth value.
Liquidity Risk
Liquidity risk is related to the ability of the institution to finance acquired commitments at reasonable market prices, as well as to fulfill business plans with stable financing sources. Risk factors may be external (liquidity crisis) and internal due to excessive concentration of maturities.
The institution carries out a coordinated management of maturities of assets and liabilities, and oversees the maximum timing difference profiles. This monitoring is based in the analysis of maturities of assets and liabilities, both contractual and managerial. Liquidity Risk is limited in terms of an accrued liquidity level during one month and in terms of a stipulated liquidity ratio.
| | Liquidity Ratio |
| Banco y Casa de Bolsa | Jul-12 | Ago-12 | Sep-12 | Average |
| Balance MXP GAP | 31% | 27% | 33% | 30% |
| Balance USD GAP | 25% | 13% | 23% | 20% |
Credit Risk
Management of credit risk of Grupo Financiero Santander is developed differently for the different segments of clients along the three phases of the credit process: acceptance, follow-up and recovery.
From a global perspective, management of credit risk in the institution is responsible for the identification, measurement, integration and assessment of the aggregated risk and the profitability according to such risk; with the purpose of oversee the levels of risk concentration and to adapt them to the limits and objectives previously established.
Risks receiving an individual treatment (risks with companies, institutions and financial entities) are identified and taken apart from those other risk that are managed in standardized manner (consumer and mortgages credits to individuals, loans to businesses and small enterprises)
Risks managed on individual basis are subject to a solvency or rating system with a related probability of failure that allows the measuring of the risk for each client and for each transaction from the beginning. The assessment of the client, after analyzing other relevant risk factors in different areas, is adjusted according to the special characteristics of the transaction (guarantee, term, etc,)
Standardized risks require, due to their special characteristics (great number of transactions for relatively low amounts), a different management that allows an efficient process and effective use of resources, so automated decision tools are used (expert and credit scoring systems).
Management of loans to companies is complemented, during the follow-up phase, with the so called “system of special monitoring” that determines the policy to be followed in the management of the risks with companies or groups rated within such category. Different situations of levels of monitoring are identified and generate different actions. A special monitoring grade is given in the case of alert signals, systematic reviews, or specific initiatives promoted by the Risks Department or Internal Audit.
Recovery Units constitute a critical element in the management of irregular risk, in order to minimize the final loss for the institution. These units are responsible for a specialized management of the risk from the moment they are classified as irregular risk loans (defaulting payment).
The institution has carried out a policy for the selective growth of risk and a strict treatment of late payments and the creation of the corresponding provisions, based in the prudent criteria defined by the Group.
Probability of Default and Expected Losses
Pursuant to the provisions on Comprehensive Risk Management included in the general regulations applicable to credit institutions, as part of the credit risk management, credit institutions must determine the probability of default. The system allows the calculation of the probability for the different loans portfolios.
3Q. 12 | EARNINGS REPORT | 22
| a. | The probability of failure is for “No Retail” portfolios. It is determined via the fine tune of the ratings of clients in a given moment, based in the Monthly Default Rates observed during a period of five years. Such Default Rates are adjusted to an economic cycle of ten years. For “Retail” portfolios, the standard default probabilities set by the Basilea Convention are used. |
| b. | Once the probability of default is determined, the parameters of “severity of Loss” (LGD) and “Exposure at Default” (EAD) stipulated in Basilea, are taken into consideration. |
Once the abovementioned factors are obtained, the Expected Loss (PE) is calculated as follows:
Expected Loss = Probability of Default x Severity of Loss x Exposure at Default
i.e.: PE = PD * LGD * EAD
Counterparty Risk
Included in the credit risk, there is a concept that, due to its characteristics, it requires a special management: the Counterparty Risk.
Counterparty Risk is the risk the Institution assumes with governmental entities, financial institutions, corporations, companies and individuals in their treasury activities and correspondent bank activities. The measurement and control of the Credit Risk in Financial Instruments, Counterparty Risk, is carried out by a special unit with an organizational structure independent from the business areas.
The control of Counterparty Risk is performed daily via the Kondor Global Risk (KGR) system, which informs the credit line available with any counterparty, in any product and any term.
For the control of the counterparty lines the Equivalent Credit Risk (REC) is used.REC is an estimate of the amount the institution may lose in current transactions with certain counterparty, if such counterparty commits a default in any moment until the maturity date of transactions. REC takes into account the Current Credit Exposure, which is defined as the cost to substitute the transaction ar market value provided that this value is positive for the institution, and it is measured as the market value of the transaction (MtM). In addition, REC includes the Potential Credit Exposure or Potential Additional Risk (RPA), which represents the possible evolution of the current credit exposure until maturity, given the characteristics of the transaction and the possible variations in the market factors. For the calculation of REC, mitigating factors of the counterparty credit risk are taken into consideration, such as collaterals, netting agreements, among other. The methodology continues to be effective.
In addition to the Counterparty Risk, there is the Settlement Risk, which is present in every transaction at its maturity date, when the possibility that the counterparty does not comply with its payment obligations arises, once the institution has complied with its obligations by issuing payment directions.
For the process of control for this risk, the Deputy General Direction of Financial Risks oversees on a daily basis the compliance with the limits on counterparty credit risks by product, term and other conditions stipulated in the authorization for financial markets. Likewise, it is the responsible for communicating on a daily bases, the limits, consumptions and any incurred deviation or excess.
On a monthly basis, a report is presented to the Comprehensive Risk management Committee, and on quarterly basis, to the Board of Directors, with respect to the limits to Counterparty Risks, Issuer Risks and current consumptions, as well as incurred excesses and transactions with non authorized customers. In addition, it informs the calculation of the Expected Loss for current transactions in financial markets at the closing of every month and different scenarios of stress of Expected Loss. All of the above according to the methodologies and assumptions approved by the Comprehensive Risk Management Committee.
Currently, we have approved lines of Counterparty Risks in Grupo Financiero Santander for the following segments: Mexican Sovereign Risk and Domestic Development Banking, Foreign Financial Institutions, Mexican Financial Institutions, Corporations, Companies Banking-SGC, Institutions Banking, Large Enterprises Unit, Project Finance.
Equivalent Credit Risk of the lines of Counterparty Risk and Issuer Risk of Grupo Financiero Santander as of the end of June, 2012, is concentrated on 92.53% in the Sovereign Risk segment, Development Banking and Financial Institutions, 7.05% in the Corporate segment and 0.42% in the Companies segment.
3Q. 12 | EARNINGS REPORT | 23
The quarterly average Equivalent Credit Risk of the lines of Counterparty Risk and Issuer Risk of Grupo Financiero Santander for the period April-June, 2012 was 22,316.64 million USA Dollars REC in the Sovereign Risk, Development Banking and Financial Institutions segment, 1,590.01 million USA Dollars REC in Corporate segment and 103.82 million USA Dollars REC in the <companies segment.
The Expected Loss of Grupo Financiero Santander at the end of June, 2012, is concentrated in 20.63% in the Sovereign Risk, development Banking and Financial Institutions segment; 73.06% in the Corporate segment and 6.31% in the Companies segment.
The segments of Mexican Financial Institutions and Foreign Financial Institutions are very active counterparties with whom the institution has current positions of financial instruments with Counterparty Credit Risk. It is important to mention that Equivalent Credit Risk is mitigated by netting agreements (ISDA-CMOF) and, in some cases, by collateral agreements (CSA-CGAR) or revaluation agreements with counterparties.
Operating Risk
With respect to Operating Risk, and pursuant to the corporate methodology, the institution has established policies, procedures and methodologies for the identification, control, mitigation, monitoring and reporting of operating risks.
For the identification and classification of operating risks, different categories and business lines defined by national and internal regulating organisms are used. The methodology is based in the identification and documentation of the corresponding risks, controls and processes, and quantitative and qualitative tools are used, such as self-assessment questionnaires, development of historical data bases and Operating Risk indicators, etc. for their control, mitigation and reporting.
Legal Risk
Legal Risk is defined as the potential loss due to the failure to comply with the applicable legal and administrative regulations, the issue of administrative and judicial resolutions against the institution and the application of fines, with respect to the transactions carried out by the Institution.
Pursuant to the provisions regarding the Comprehensive Risk Management, the following activities are performed: a) Establishment of policies and procedures for analyzing the legal validity and the proper execution of the legal acts. b) estimates of the amount of potential losses derived from judicial or administrative orders against the Institution and the possible application of fines c) Analysis of the legal acts governed by a legal system different to the Mexican laws, d) communication to directors and employees on the legal and administrative regulations applicable to transactions and e) the performance, at least on annual basis, of internal legal audits.
Technological Risk
Technological risk is defined as the potential loss due to damages, discontinuation, alterations or failures derived from the use or dependence on hardware, software, systems, applications, networks and any other data channel distribution for the provision of banking services to the clients of the Institution.
The Institution has adopted a corporate model for the management of Technological Risks, integrated to the processes of service and support to computing areas in order to identify, oversee, control, mitigate and report the Computing Technology Risks the transaction is exposed to, with the aim of establishing control measures that decrease the probability of risks to occur.
3Q. 12 | EARNINGS REPORT | 24
Item 2