UNITED STATES
SECURITIES AND EXCHANGE COMMISSION
Washington, D.C. 20549
FORM 6-K
| REPORT OF FOREIGN PRIVATE ISSUER PURSUANT TO RULE 13a-16 OR 15d-16 UNDER THE SECURITIES EXCHANGE ACT OF 1934 |
For the month of February, 2013
Commission File Number: 001-35658
GRUPO FINANCIERO SANTANDER MÉXICO, S.A.B. de C.V.
(Exact Name of Registrant as Specified in Its Charter)
SANTANDER MEXICO FINANCIAL GROUP, S.A.B. de C.V.
(Translation of Registrant’s Name into English)
Avenida Prolongación Paseo de la Reforma 500
Colonia Lomas de Santa Fe
Delegación Álvaro Obregón
01219 México, D.F.
(Address of principal executive office)
Indicate by check mark whether the registrant files or will file annual reports under cover of Form 20-F or Form 40-F:
Indicate by check mark if the registrant is submitting the Form 6-K in paper as permitted by Regulation S-T Rule 101(b)(1):
Indicate by check mark if the registrant is submitting the Form 6-K in paper as permitted by Regulation S-T Rule 101(b)(7):
GRUPO FINANCIERO SANTANDER MÉXICO, S.A.B. de C.V.
TABLE OF CONTENTS
| ITEM | |
| 1. | Fourth quarter 2012 earnings report of Grupo Financiero Santander México, S.A.B. de C.V. |
| 2. | Fourth quarter and full-year 2012 earnings presentation of Grupo Financiero Santander México, S.A.B. de C.V. |
| 3. | Complementary information of Grupo Financiero Santander México, S.A.B. de C.V. for the fourth quarter of 2012, in compliance with the obligation to report transactions with derivative financial instruments |
SIGNATURE
Pursuant to the requirements of the Securities Exchange Act of 1934, the registrant has duly caused this report to be signed on its behalf by the undersigned, thereunto duly authorized.
| | GRUPO FINANCIERO SANTANDER MÉXICO, S.A.B. de C.V. | |
| | | By: | /s/ Eduardo Fernández García-Travesí | |
| | | | Name: | Eduardo Fernández García-Travesí | |
| | | | Title: | General Counsel | |
Date: February 19, 2013
Item 1
| | 4Q.12 | Earnings Report | 0 |
| |
|
| | |  |
TABLE OF CONTENTS
| I. | CEO Message / Key Highlights for the Quarter |
| II. | Summary of 4Q12 Consolidated Results |
| III. | Analysis of 4Q12 Consolidated Results |
| VI. | 4Q Earnings Call Dial-In Information |
| VIII. | Notes to the Financial Statements |
| | 4Q.12 | Earnings Report | 1 |
| |
|
| | | |
Grupo Financiero Santander México Reports Fourth Quarter 2012 Net Income of Ps.3,310 Million
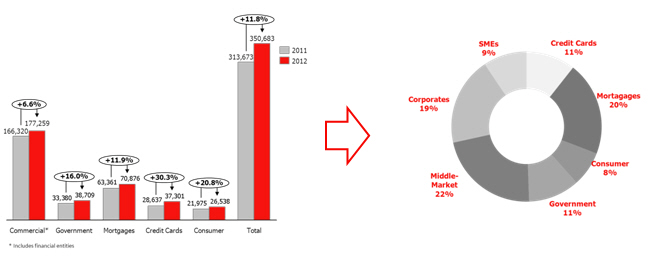
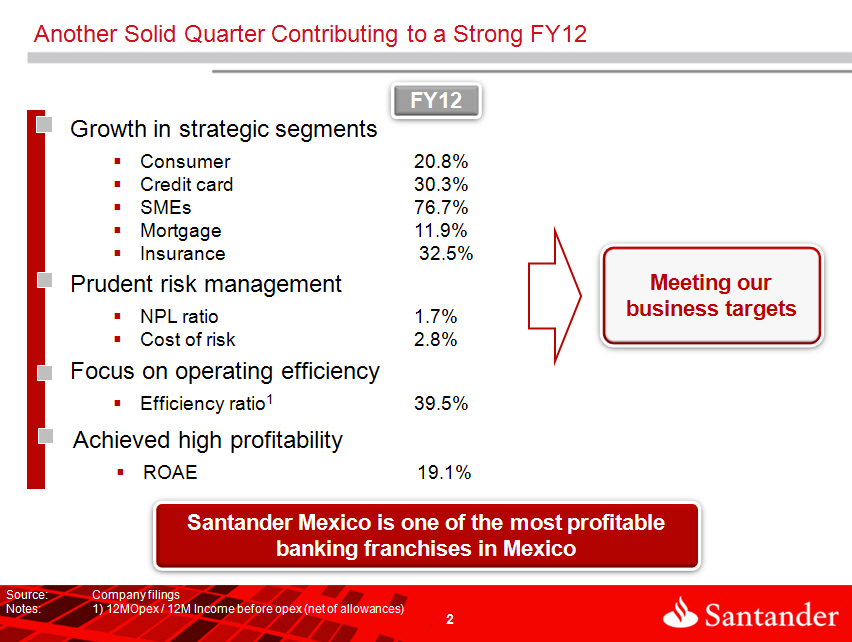
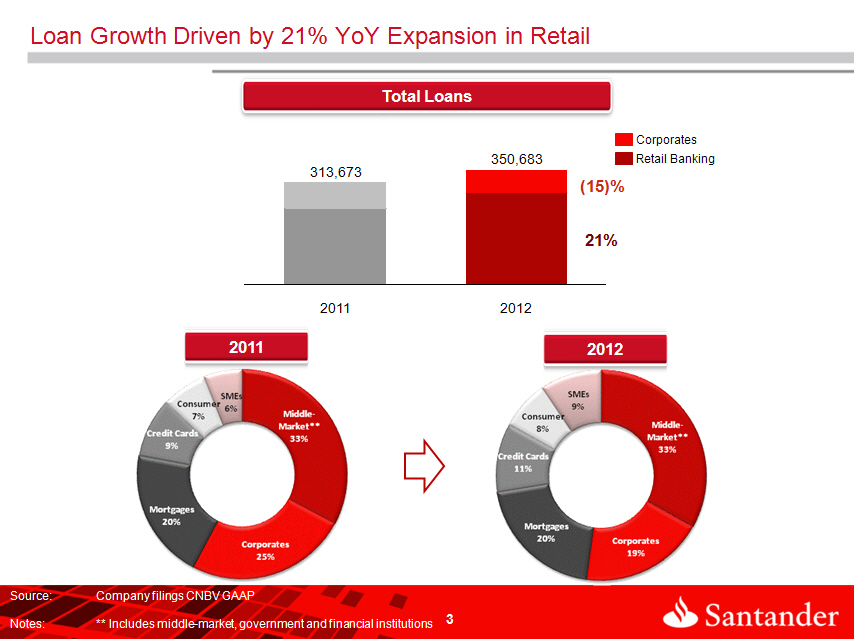
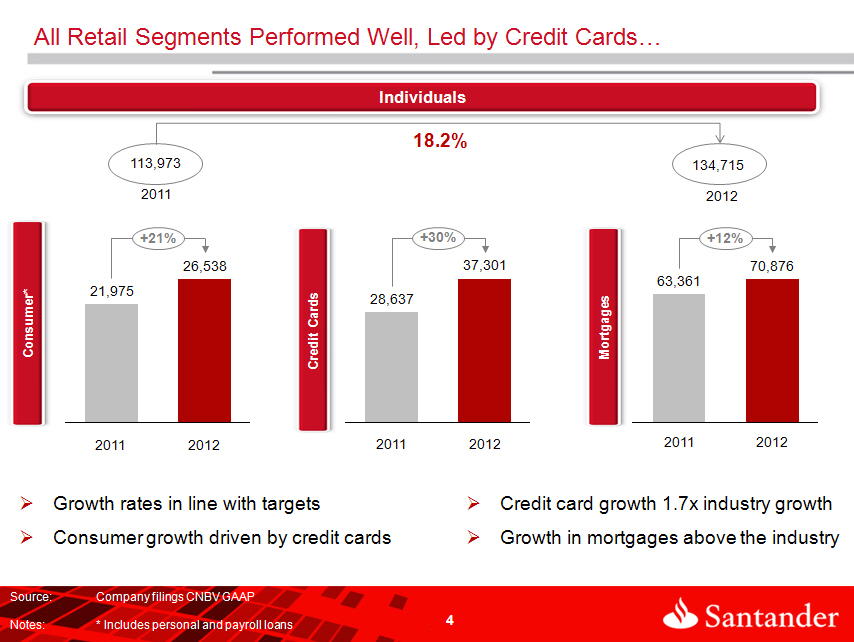
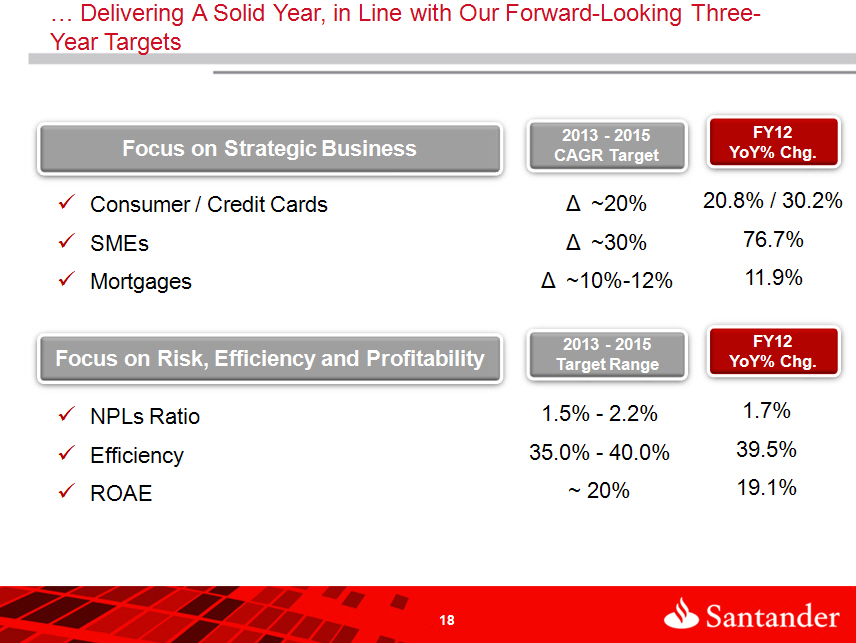
| · | Strong loan growth in commercial banking with YoY increases of 20.8% in consumer loans, 30.3% in credit cards, 76.7% in SMEs and 11.9% in mortgages |
| · | Prudent risk management demonstrated by an NPL ratio of 1.7% and cost of risk of 2.8% |
| · | Continued focus on operating efficiency, achieving a 39.5% ratio |
México City – February 18, 2013, Grupo Financiero Santander México, S.A.B. de C.V., (NYSE: BSMX; BMV: SANMEX), (“Santander México”), one of the leading financial groups in the Mexican financial system, today announced financial results for the three- and twelve-month periods ending December 31, 2012.
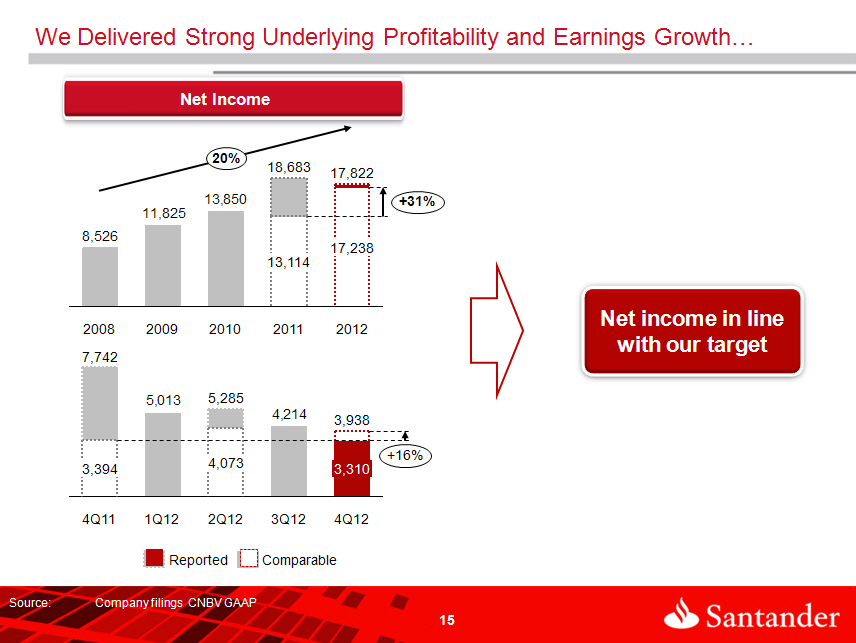
Comparable net income for 4Q12 was Ps.3,938 million, representing a 16.0% YoY increase. Including a non-recurring gain of Ps.4,348 million in 4Q11 from the sale of the insurance business to Zurich Financial Services Group (“Zurich”), as well as, incremental administrative and promotional expenses, an accounts receivable write-off and higher provisions in 4Q12, reported net income for the quarter was Ps.3,310 million, representing a decrease of 57.2% YoY and 21.5% on a sequential basis.
Comparable net income for FY12 increased by 31.4%, or Ps.4,124 million, to Ps.17,238 million. Including an extraordinary gain of Ps.4,822 million from the sale of the insurance business and income from this business in FY11, a Ps.1,067 million extraordinary gain in 3Q11 from the reversal of provisions to comply with CNBV (Comisión Nacional Bancaria y de Valores) regulations, and a Ps.1,731 million gain from the sale and leaseback of 220 branches in 2Q12, as well as, higher costs and provisions in 4Q12 as discussed above, reported net income for FY12 was Ps.17,822 million, a 4.6% decrease, from FY11.
Marcos Martínez, Executive Chairman and CEO, commented, "We reported a solid operating performance this quarter, balancing robust growth with strong asset quality and operational efficiency. Net interest income expanded 13% year-on year and net commissions and fees grew 34%. Continued growth in retail loans underscores the merits of our strategic focus. Performance in key business segments was strong in 2012, with year-on-year increases of 21% in consumer loans, 30% in credit cards, and 77% in loans to small and medium enterprises (“SMEs”). We achieved growth while maintaining a strong focus on prudent risk management - reflected in controlled NPL ratios and a stable cost of risk. This, together with our efficiency-oriented culture, positions Santander México as one of the most profitable franchises in the country.”
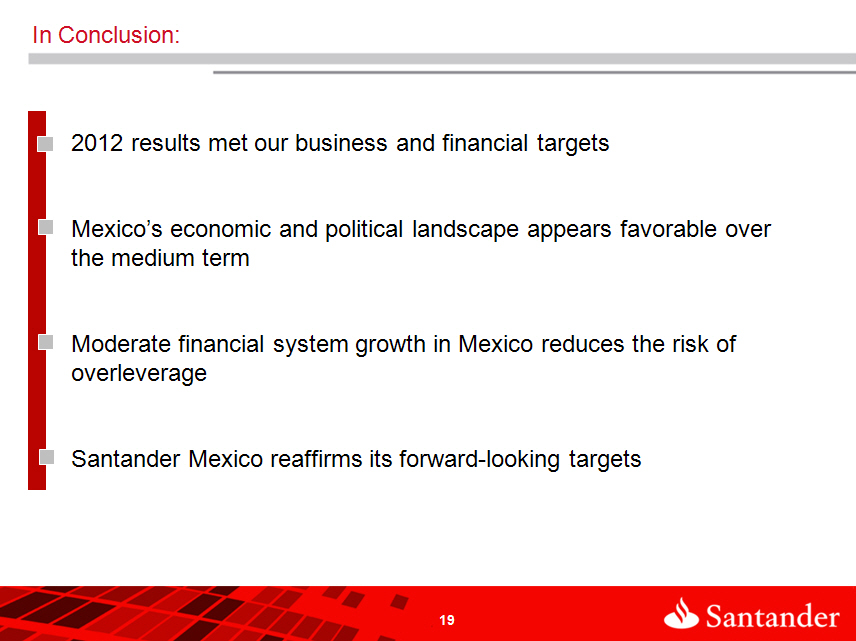
Mr. Martínez continued, “We expect Santander México’s momentum to continue in 2013 and beyond, supported by our sharp strategic focus, our favorable view of Mexico’s political and economic landscape, and our expectations for attractive yet sensible Mexican financial system growth.”
| Grupo Financiero Santander México | | | | |
| Highlights | | | | |
| | 4Q12 | 3Q12 | 4Q11 | YoY |
| Income Statement Data | | | | |
| Net interest income | 8,811 | 8,582 | 7,811 | 12.8% |
| Fee and commission, net | 3,339 | 3,065 | 2,496 | 33.8% |
| Core revenues | 12,150 | 11,647 | 10,307 | 17.9% |
| Provisions for loan losses | 2,948 | 2,535 | 2,041 | 44.4% |
| Administrative and promotional expenses | 6,022 | 5,179 | 5,221 | 15.3% |
| Net income | 3,310 | 4,214 | 7,741 | -57.2% |
| Net income per share * | 2.6 | 2.1 | 2.0 | 28.6% |
| Balance Sheet Data | | | | |
| Total loans | 350,683 | 343,383 | 313,673 | 11.8% |
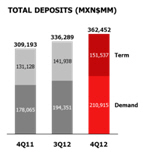
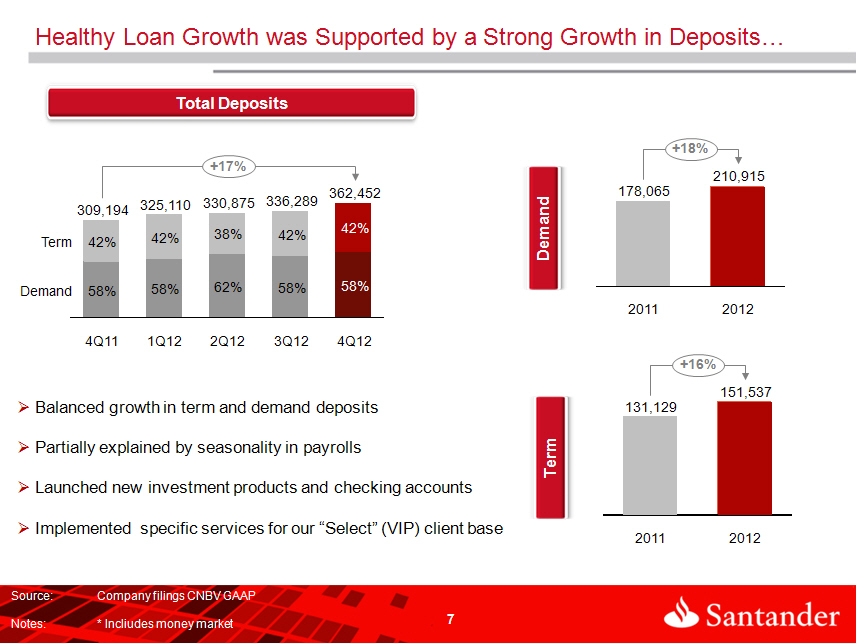
| Deposits | 362,452 | 336,289 | 309,194 | 17.2% |
| Shareholders´s equity | 97,827 | 94,793 | 88,479 | 10.6% |
| Key Ratios | | | | pbs |
| Net interest margin | 5.0% | 5.0% | 5.1% | (2.6) |
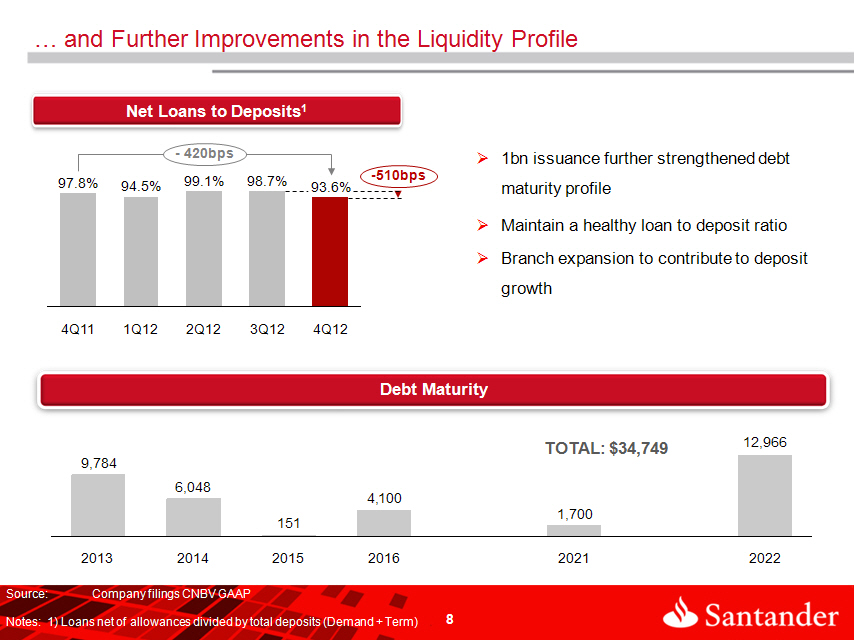
| Net loans to deposits ratio | 93.6% | 98.7% | 97.8% | (427.1) |
| ROAE | 19.1% | 21.1% | 21.9% | (273.2) |
| ROAA | 2.3% | 2.6% | 2.6% | (31.7) |
| Efficiency ratio | 39.5% | 36.9% | 44.2% | (469.3) |
| Capital ratio | 14.8% | 14.5% | 14.8% | (5.0) |
| NPLs ratio | 1.74% | 1.61% | 1.69% | 4.3 |
| Coverage ratio | 190.1% | 205.4% | 210.5% | (2,046.1) |
| Operating Data | | | | % |
| Branches** | 1,170 | 1,123 | 1,125 | 4.0% |
| ATMs | 4,946 | 4,840 | 4,689 | 5.5% |
| Customers | 10,013,228 | 9,764,741 | 9,310,681 | 7.5% |
| Employees | 13,385 | 12,766 | 12,395 | 8.0% |
| * | Treasury Shares and discontinued operations are not included |
| ** | Includes Brokerage House Branches |
| | 4Q.12 | Earnings Report | 2 |
| |
|
| | | |
SUMMARY OF FOURTH QUARTER 2012 CONSOLIDATED RESULTS
Net Income Santander México reported net income of Ps.3,310 million in 4Q12, a 57.2% YoY decrease, and 21.5% below 3Q12. Excluding the extraordinary gain in 4Q11 from the sale of the insurance business to Zurich and the aforementioned items in 4Q12, net income would have increased 16.0% YoY. Recurring income resulting from higher business volume is reflected in the net interest margin and net commission and fee income, which increased QoQ by 2.7% and 8.9%, respectively. | | 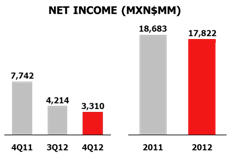 |
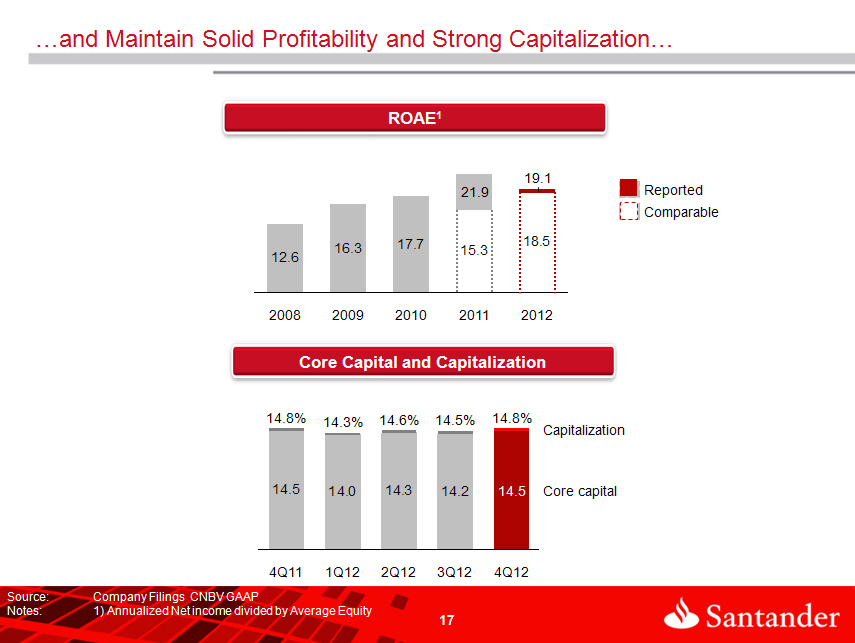
Capitalization and ROAE Santander México’s capital ratio was 14.8% in 4Q12, in line with the figure reported in 4Q11, and higher than the 14.5% reported in 3Q12. 4Q12 ROAE was 19.1%, below reported ROAE of 21.9% and 21.1% in 4Q11 and 3Q12, respectively. Excluding the aforementioned gains in 3Q11, 4Q11 and 2Q12 as well as the aforementioned costs in 4Q12, normalized ROAE would have been 18.5% in 4Q12 and 15.3% in 4Q11, representing an increase of 320 bps. | | 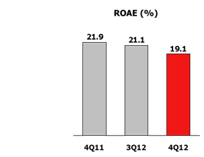 |
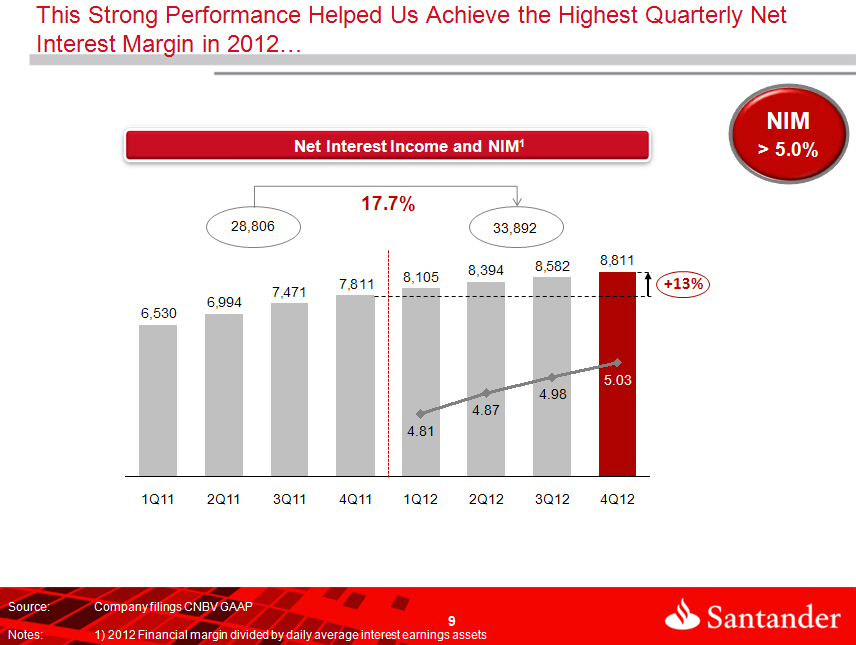
Net Interest Income Net interest income in 4Q12 increased YoY by 12.8%, or Ps.1,000 million, to Ps.8,811 million. On a sequential basis net interest income rose 2.7%, or Ps.229 million, from Ps.8,582 million reported in 3Q12. Net interest margin for 4Q12 was 5.03%, increasing 5 bps from 4.98% in 3Q12 and 3 bps below 5.06% in 4Q11. Interest income increased 10.5%, or Ps.1,351 million, reaching Ps.14,259 million in 4Q12 compared with Ps.12,908 million in 4Q11. This growth was mainly driven by higher interest income derived from our loan portfolio, which increased YoY by Ps.1,591 million. | | 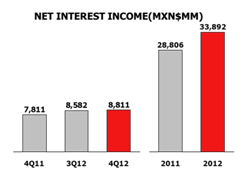 |
Interest expense rose 6.9%, or Ps.351 million, reaching Ps.5,448 million in 4Q12 compared with Ps.5,097 million in 4Q11. This growth was mainly driven by the Ps.201 million increase in interest paid on our sale and repurchase agreements and in our credit instruments issued, as well as a Ps.91 million increase in interest paid on demand and term deposits as a consequence of higher volumes.
| | 4Q.12 | Earnings Report | 3 |
| |
|
| | | |
Loan Portfolio Growth
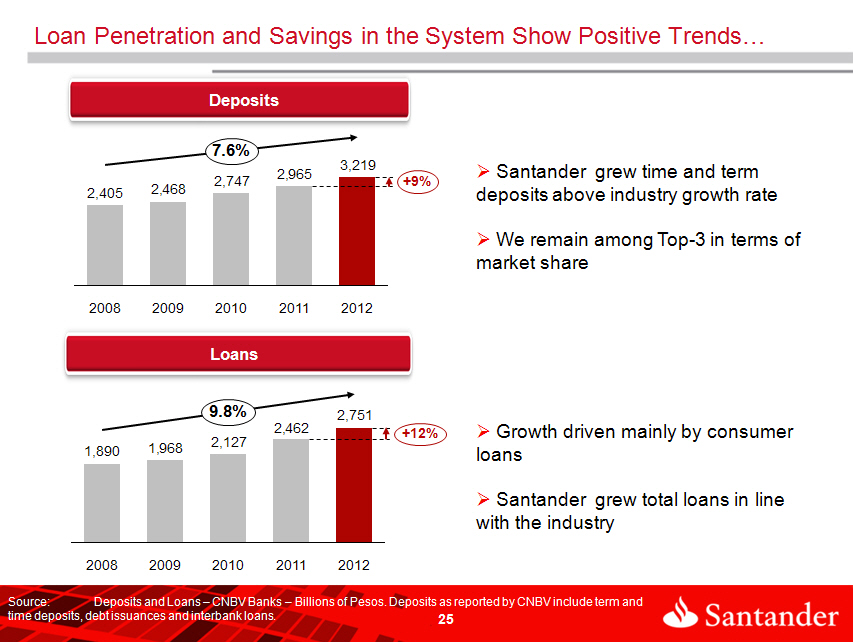
Santander México’s total loan portfolio in 4Q12 increased YoY by 11.8%, or Ps.37,010 million, to Ps.350,683 million, and 2.1%, or Ps.7,300 million, on a sequential basis.
In 4Q12, Santander México’s loan portfolio expanded YoY across all core products, both in terms of commercial and individual loans. Individual loans were mainly driven by consumer loans, mortgages and credit cards. Commercial loans continue to benefit from a significant YoY increase in the SME portfolio.
Asset Quality
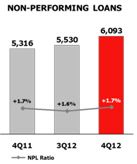
The NPL ratio for 4Q12 stood at 1.74%, a 5 bps increase from the level reported in 4Q11 and 13 bps above 1.61% in 3Q12, reflecting Santander Mexico’s stringent credit scoring model and ongoing monitoring of the quality and growth of its loan portfolio.
NPLs as of 4Q12 increased 14.6% to Ps.6,093 million, from Ps.5,316 million reported in 4Q11. On a sequential basis, NPLs increased 10.2%.
The coverage ratio for the quarter decreased to 190.1%, from the 210.5% and 205.4% reported in 4Q11 and 3Q12, respectively. The decline in coverage ratio primarily reflects a nominal increase in non-performing loans resulting from the growth in the loan portfolio. Non-performing loans, however, increased more than the provisions for loan losses because the majority of the increase in the non-performing portfolio was driven by mortgages which are guaranteed by properties and thus require lower provisions than the consumer portfolio.
Loans to Deposit Ratio
During 4Q12, deposits accounted for 55% of the Santander Mexico’s total funding sources, and expanded 17.2% YoY and 7.8% sequentially. This deposit base provides a stable, low cost source of funding to support Santander Mexico’s continued growth.
The net loan to deposit ratio was 93.6% in 4Q12, decreasing from 97.8% in 4Q11 and from 98.7% in 3Q12.
Contribution to Net Income
As previously discussed, net income for 4Q12 was Ps.3,310 million, representing declines of 57.2% YoY and 21.5% sequentially. Excluding the net impact of the extraordinary gain in 4Q11 from the sale of the insurance business to Zurich and the aforementioned items in 4Q12, net income would have increased 16.0% YoY.
Casa de Bolsa Santander, the brokerage business, reported net income of Ps.53 million, compared with gains of Ps.35 million in 4Q11 and Ps.116 million in 3Q12.
Net income for the Holding and other subsidiaries amounted to Ps.39 million in 4Q12, a decrease from Ps.4,387 million reported in 4Q11, which includes the gain from the sale of the insurance business to Zurich. Sequentially, 4Q12 was higher than the Ps.29 million reported in 3Q12.
| | 4Q.12 | Earnings Report | 4 |
| |
|
| | | |
| | Grupo Financiero Santander | | | | | | | | | | |
| | Earnings Contribution by Subsidiary | | | | | | | | | | |
| | Millions of Mexican Pesos | | | | | | | | | | |
| | | | 4Q12 | 3Q12 | | 4Q11 | | 2012 | 2011 | | YoY % |
| | Banking business1/ | | 3,218 | 4,069 | | 3,319 | | 17,398 | 13,700 | | 27.0 |
| | Brokerage | | 53 | 116 | | 35 | | 269 | 66 | | 307.6 |
| | Holding and other subsidiaries2/ | | 39 | 29 | | 4,387 | | 155 | 4,916 | | (96.8) |
| | Net income attributable to Grupo Financiero Santander | | 3,310 | 4,214 | | 7,741 | | 17,822 | 18,682 | | (4.6) |
1/ Includes Sofomes 2/ Asset management subsidiary and Holding.
| | 4Q.12 | Earnings Report | 5 |
| |
|
| | | |
ANALYSIS OF FOURTH-QUARTER 2012 CONSOLIDATED RESULTS
Net Income
| | Grupo Financiero Santander México | | | | | | | | | | |
| | Income Statement | | | | | | | | | | |
| | Millions of Mexican Pesos | | | | | | % Change | | | % Change |
| | | | 4Q12 | 3Q12 | 4Q11 | | QoQ | YoY | 2012 | 2011 | 12/11 |
| | | | | | | | | | | | |
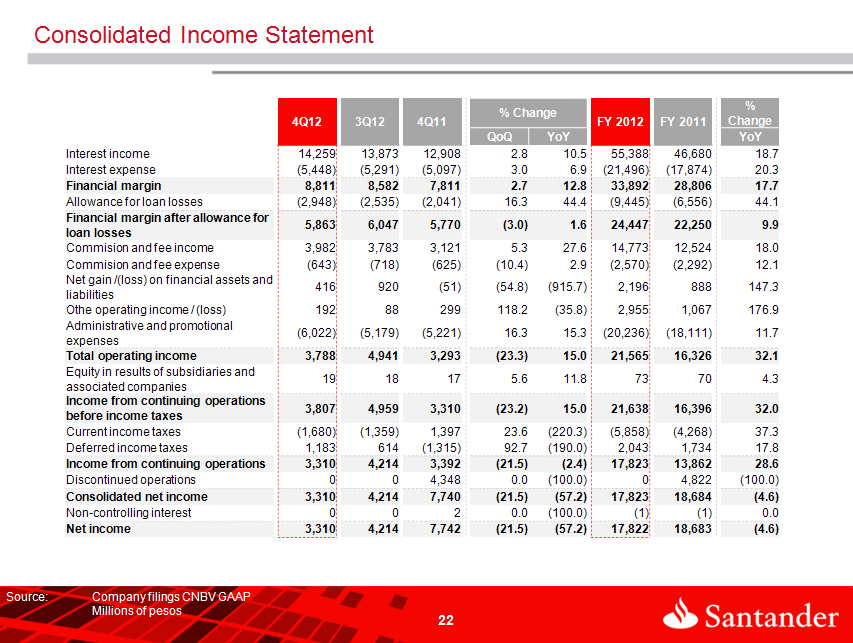
| | Net interest income | | 8,811 | 8,582 | 7,811 | | 2.7 | 12.8 | 33,892 | 28,806 | 17.7 |
| | Provision for loan losses | | (2,948) | (2,535) | (2,041) | | (16.3) | (44.4) | (9,445) | (6,556) | (44.1) |
| | Net interest income after provisions for loan losses | | 5,863 | 6,047 | 5,770 | | (3.0) | 1.6 | 24,447 | 22,250 | 9.9 |
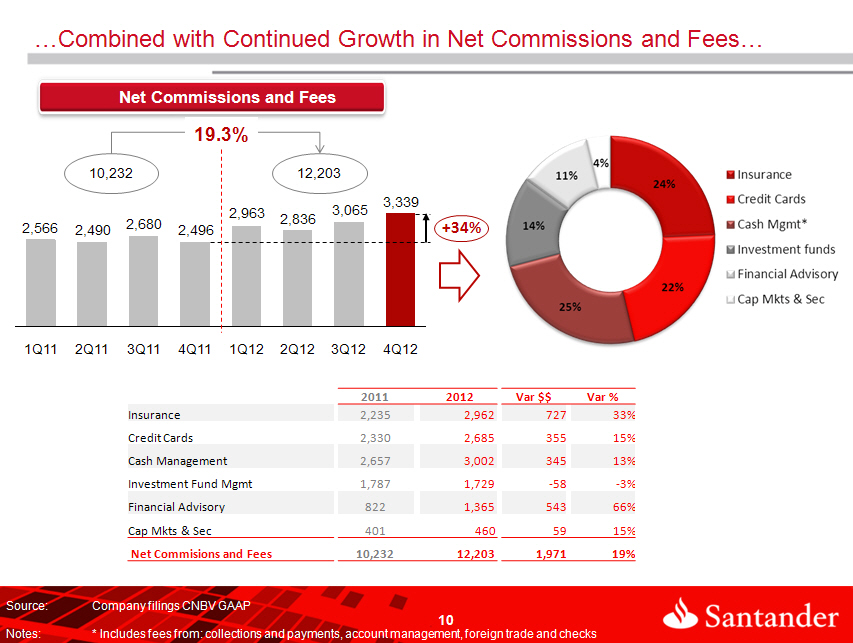
| | Commission and fee income, net | | 3,339 | 3,065 | 2,496 | | 8.9 | 33.8 | 12,203 | 10,232 | 19.3 |
| | Gains (losses) on financial assets and liabilities | | 416 | 920 | (51) | | (54.8) | 915.7 | 2,196 | 888 | 147.3 |
| | Other operating income (expenses) | | 192 | 88 | 299 | | 118.2 | (35.8) | 2,955 | 1,067 | 176.9 |
| | Administrative and promotional expenses | | (6,022) | (5,179) | (5,221) | | (16.3) | (15.3) | (20,236) | (18,111) | (11.7) |
| | Operating income | | 3,788 | 4,941 | 3,293 | | (23.3) | 15.0 | 21,565 | 16,326 | 32.1 |
| | Equity in results of associated companies | | 19 | 18 | 17 | | 5.6 | 11.8 | 73 | 70 | 4.3 |
| | Operating income before taxes | | 3,807 | 4,959 | 3,310 | | (23.2) | 15.0 | 21,638 | 16,396 | 32.0 |
| | Current and deferred income taxes | | (497) | (745) | 81 | | 33.3 | (713.6) | (3,815) | (2,535) | (50.5) |
| | Income from continuing operations | | 3,310 | 4,214 | 3,391 | | (21.5) | (2.4) | 17,823 | 13,861 | 28.6 |
| | Profit from discontinued operations, net | | 0 | 0 | 4,348 | | 0.0 | (100.0) | 0 | 4,822 | (100.0) |
| | Non-controlling interest | | 0 | 0 | 2 | | 0.0 | (100.0) | (1) | (1) | 0.0 |
| | Net income | | 3,310 | 4,214 | 7,741 | | (21.5) | (57.2) | 17,822 | 18,682 | (4.6) |
During 4Q12, Santander México reported net income of Ps.3,310 million, representing a 57.2% YoY decrease and a 21.5% sequential decrease. These comparisons, however, are affected by a non-recurring gain of Ps.4,348 million in 4Q11 on the sale of the insurance business to Zurich.
Net income for 4Q12 was negatively impacted by higher provisions and write-offs as follows:
| · | Ps.100 million provision derived from a project finance client; |
| · | Ps.245 million write-off of account receivables in connection with certain guarantees subject to conditions that were not met and that had originated in mortgage loans with FOVI. |
Results for the quarter were also negatively affected by the following incremental administrative and promotional expenses:
| · | Ps.225 million in marketing expenses from a corporate image campaign; |
| · | Ps.127 million related to the opening of 15 branches during the quarter and frontloading of expenses for branch openings in 2013; |
| · | Ps.100 million incremental rent from the 220 branches sold and leased back; |
| · | Ps.60 million expenses related to the Company’s IPO; and |
| · | Ps.40 million from the amortization of obsolete software |
Excluding these items, 4Q12 net income would have increased 16.0% YoY.
| | 4Q.12 | Earnings Report | 6 |
| |
|
| | | |
| | Grupo Financiero Santander México | | | | | | | | | | | | | | | | |
| | Net Income Adjustments | | | | | | | | | | | | | | | | |
| | Million Pesos | | | | | | | | | | | % Variación | | | | | % Variación |
| | | 4T12 | 3T12 | 2T12 | 1T12 | | 4T11 | 3T11 | 2T11 | 1T11 | | Interanual | | 2012 | 2011 | | 12/11 |
| | Net income | 3,310 | 4,214 | 5,285 | 5,013 | | 7,742 | 4,123 | 3,366 | 3,452 | | -57.2% | | 17,822 | 18,683 | | -4.6% |
| | Gain from the sale of the insurance business | | | | | 4,348 | 184 | 161 | 129 | | | | | 4,822 | | |
| | Sale and leaseback of branches | | | 1,731 | | | | | | | | | | 1,731 | | | |
| | Reversal of provisions | | | | | | | 1,067 | | | | | | | 1,067 | | |
| | FOVI write-off | (245) | | | | | | | | | | | | (245) | | | |
| | Corporate image campaign | (225) | | | | | | | | | | | | (225) | | | |
| | Project finance provisions | (100) | | | | | | | | | | | | (100) | | | |
| | IPO related expenses | (60) | | | | | | | | | | | | (60) | | | |
| | Amortization of obsolete software | (40) | | | | | | | | | | | | (40) | | | |
| | Branch expansion | (127) | | | | | | | | | | | | (127) | | | |
| | Rent from sale and leaseback | (100) | | | | | | | | | | | | (100) | | | |
| | Adjusted net income (before taxes) | 4,207 | 4,214 | 3,554 | 5,013 | 3,394 | 2,872 | 3,205 | 3,323 | | | | 16,988 | 6,266 | | |
| | Taxes | (269) | | 519 | | | | 320 | | | | | | 250 | 320 | | |
| | Adjusted net income | 3,938 | 4,214 | 4,073 | 5,013 | | 3,394 | 3,192 | 3,205 | 3,323 | | 16.0% | | 17,238 | 13,114 | | 31.4% |
Net interest income for 4Q12 rose to Ps.8,811 million, representing a YoY increase of Ps.1,000 million, or 12.8%. On a sequential basis, net interest income increased Ps.229 million, or 2.7%. An increase in the Bank’s business volume and a more profitable product mix resulted in a Ps.1,591 million increase in interest income, which more than offset the Ps.201 million rise in interest paid on our sale and repurchase agreements and on our issued credit instruments.
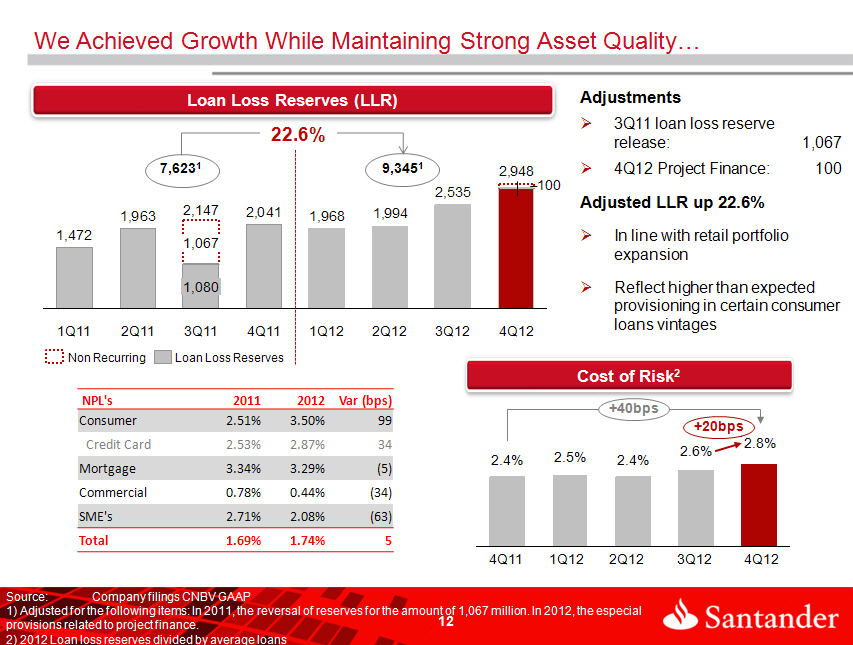
Provisions for loan losses for the quarter rose to Ps.2,948 million, representing increases of Ps.907 million, or 44.4%, YoY and Ps.413 million, or 16.3%, on a sequential basis. Results were impacted by provision derived from a project finance client discussed above, as well as provisions resulting from a trial campaign aimed at a specific target segment.
The NPL ratio for 4Q12 stood at 1.74%, a 5 bps increase from the level reported in 4Q11 and 13 bps from 1.61% in 3Q12.
The coverage ratio for the quarter decreased to 190.1% from 210.5% and 205.4% reported in 4Q11 and 3Q12, respectively. The decline in coverage ratio primarily reflects a nominal increase in non-performing loans resulting from the growth in the loan portfolio. Non-performing loans, however, increased more than the provisions for loan losses because the majority of the increase in the non-performing portfolio was driven by mortgages which are guaranteed by properties and thus require lower provisions than the consumer portfolio.
Net commissions and fee income for 4Q12 amounted to Ps.3,339 million, a 33.8% YoY increase, or Ps.843 million, and 8.9%, or Ps.274 million, higher on a sequential basis. The sequential increase is principally due to higher commissions from credit cards and insurance, which grew 39.9% and 9.5%, respectively.
During 4Q12, Santander México reported a Ps.416 million net gain from financial assets and liabilities, compared with a Ps.51 million net loss in 4Q11 and a Ps.920 million gain in 3Q12. Net gain on financial assets and liabilities in 4Q12 is mainly explained by trading gains of Ps.1,958 million, partially offset by valuation losses of Ps.1,542 million, principally related to derivatives and debt instruments. For FY12, gains from financial assets and liabilities income increased 147.3%, or Ps.1,308 million, to Ps.2,196 million.
Other income in 4Q12 declined to Ps.192 million, from Ps.299 million in 4Q11, and increased Ps.104 million from the Ps.88 million reported in 3Q12.
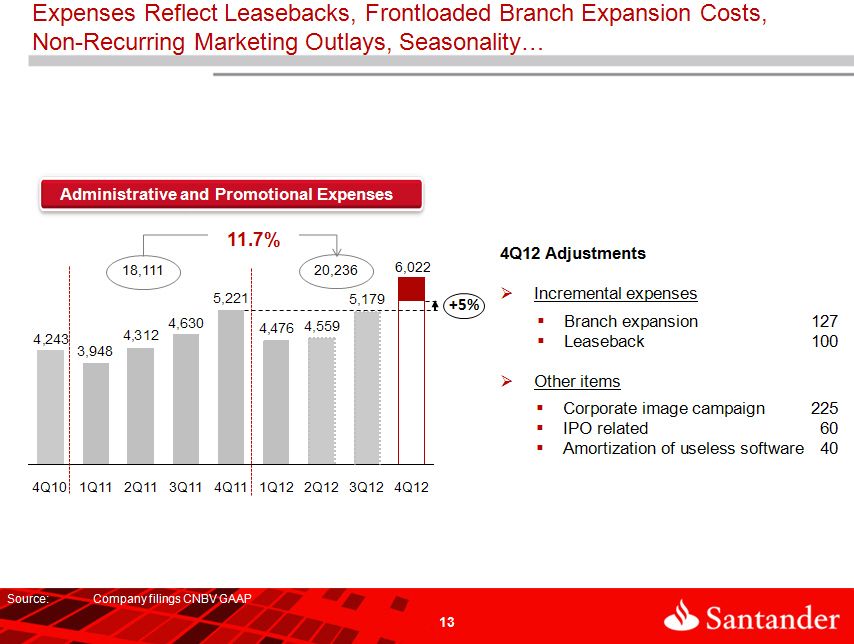
Administrative and promotional expenses for 4Q12 amounted to Ps.6,022 million, Ps.801 million, or 15.3%, higher than in 4Q11 and Ps.843 million, or 16.3%, higher than in 3Q12. The increase is mainly related to higher expenses to support business growth, as well as the items discussed above: leaseholds from the 220 branches sold and leased back, branch openings, a corporate image campaign, certain expenses in connection with the recent IPO and the amortization of obsolete software.
Operating income in 4Q12, totaled Ps.3,788 million, representing a YoY increase of Ps.495 million, or 15.0%. On a sequential basis, operating income decreased by Ps.1,153 million, or 23.3%.
| | 4Q.12 | Earnings Report | 7 |
| |
|
| | | |
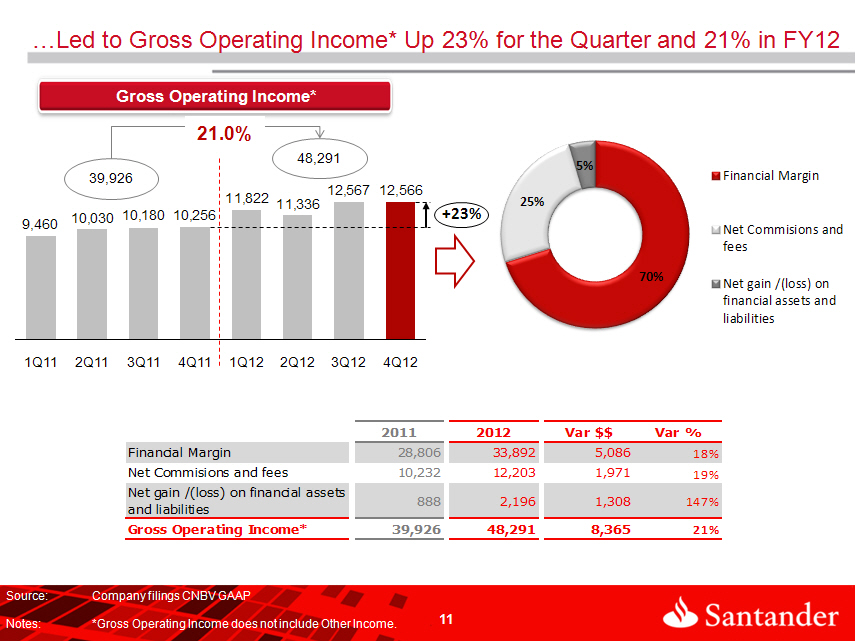
Net income for FY12 amounted to Ps.17,822 million, a decrease of 4.6%, or Ps.861, from the Ps.18,683 million obtained for FY11. Excluding extraordinary gains and the aforementioned incremental costs, net income for FY12 would have been of Ps.17,238 million, an increase of 31.4%, or Ps.4,124 million from the Ps.13,114 million registered for FY11.
These results reflect mainly the combined impact of the following increases:
| § | 17.7%, or Ps.5,086 million, in net interest income from Ps.28,806 million for FY11 to Ps.33,892 million for FY12, reflecting a higher-margin product mix and the increase in the loan portfolio; |
| § | 19.3%, or Ps.1,971 million, in net commissions and fee income, from Ps.10,232 million for FY11 to Ps.12,203 million for FY12, principally due to increases in insurance, account management and financial advisory; |
| § | 147.3%, or Ps.1,308 million, in net gains from financial assets and liabilities from Ps.888 million for FY11 to Ps.2,196 million for FY12; and |
| § | 176.9%, or Ps.1,888 million, in other operating income from Ps.1,067 million for FY11 to Ps.2,955 million for FY12, explained by the Ps.1,731 million sale and leaseback of branches in 2Q12. |
These positive results were partially offset by:
| § | Increase in provisions for loan losses of Ps.2,889 million, or 44.1%, mainly due to the growth in the loan portfolio as well as the reversal of provisions for loan losses of Ps.1,067 million in 3Q11. The increase in provisions for loan losses is mainly related to: 1) variation in the loan portfolio mix, with more weight in consumer and credit card products which require a higher level of provisions; 2) provisions derived from a project finance client; and 3) the impact from a trial campaign aimed at a specific target segment. |
| § | Ps.2,125 million or 11.7% increase in administrative and promotional expenses from Ps.18,111 million in FY11 to Ps.20,236 million for FY12, mainly explained by the following increases: 13.6%, or Ps.1,044 million in personnel expenses; 24.7%, or Ps.446 million in other expenses; 28.7%, or Ps.281 million in leaseholds; and 10.4%, or Ps.170 million in technology expenses. As explained above, administrative and promotional expenses for the year also reflect higher costs incurred in 4Q12. |
| | 4Q.12 | Earnings Report | 8 |
| |
|
| | | |
Net Interest Income
| | Grupo Financiero Santander México | | | | | | | |
| | Net Interest Income | | | | | | | |
| | Millions of Mexican Pesos | | | | | | % Change | | | % Change |
| | | | 4Q12 | 3Q12 | 4Q11 | | QoQ | YoY | 2012 | 2011 | 12/11 |
| | Funds Available | | 577 | 574 | 702 | | 0.5 | (17.8) | 2,425 | 2,622 | (7.5) |
| | Margin accounts | | 96 | 99 | 38 | | (3.0) | 152.6 | 408 | 176 | 131.8 |
| | Interest from investment in securities | | 2,661 | 2,823 | 3,055 | | (5.7) | (12.9) | 12,043 | 11,589 | 3.9 |
| | Loan portfolio – excluding credit cards | | 7,637 | 7,399 | 6,571 | | 3.2 | 16.2 | 28,900 | 23,549 | 22.7 |
| | Credit card loan portfolio | | 2,321 | 2,141 | 1,787 | | 8.4 | 29.9 | 8,264 | 6,590 | 25.4 |
| | Loan origination fees | | 143 | 151 | 152 | | (5.3) | (5.9) | 625 | 592 | 5.6 |
| | Sale and repurchase agreements | | 824 | 686 | 603 | | 20.1 | 36.7 | 2,723 | 1,562 | 74.3 |
| | Interest Income | | 14,259 | 13,873 | 12,908 | | 0.3 | 10.5 | 55,388 | 46,680 | 18.7 |
| | | | | | | | | | | | |
| | | | | | | | | | | | |
| | Customer deposits – Demand deposits | | (508) | (595) | (468) | | 14.6 | (8.5) | (2,165) | (1,503) | (44.0) |
| | Customer deposits – Time deposits | | (1,518) | (1,386) | (1,467) | | (9.5) | (3.5) | (5,630) | (5,567) | (1.1) |
| | Credit instruments issued | | (402) | (304) | (301) | | (32.2) | (33.6) | (1,298) | (893) | (45.4) |
| | Interbank loans | | (242) | (256) | (183) | | 5.5 | (32.2) | (791) | (781) | (1.3) |
| | Sale and repurchase agreements | | (2,778) | (2,750) | (2,678) | | (1.0) | (3.7) | (11,612) | (9,130) | (27.2) |
| | Interest Expense | | (5,448) | (5,291) | (5,097) | | (3.0) | (6.9) | (21,496) | (17,874) | (20.3) |
| | | | | | | | | | | | |
| | Net Interest Income | | 8,811 | 8,582 | 7,811 | | 2.7 | 12.8 | 33,892 | 28,806 | 17.7 |
Net interest income in 4Q12 amounted to Ps.8,811 million, representing QoQ and YoY increases of 2.7%, or Ps.229 million, and 12.8%, or Ps.1,000 million, respectively. For FY12, net interest income rose 17.7%, or Ps.5,086 million, to Ps.33,892 million, from Ps.28,806 million for FY11.
The YoY increase in net interest income for the quarter is explained by the combined effect of the Ps.1,351 million increase in interest income, from Ps.12,908 million in 4Q11 to Ps.14,259 million in 4Q12, and a Ps.351 million increase in interest expense, from Ps.5,097 million in 4Q11 to Ps.5,448 million in 4Q12. This was the result increases of Ps.39,314 million in average interest-earnings assets and 33 bpss in the average interest rate gained. Average interest-bearing liabilities rose Ps.44,431 million, representing a 4 bps increase in the average interest rate paid.
The sequential increase in net interest income resulted from the combined effect of the Ps.386 million increase in interest income, from Ps.13,873 million in 3Q12 to Ps.14,259 million in 4Q12, and a Ps.157 million increase in interest expense, from Ps.5,291 million in 3Q12 to Ps.5,448 million in 4Q12. This is explained by increases of Ps.13,638 million in average-earnings assets and 6 bpss in the average interest rate earned, combined with increases of Ps.15,329 million in interest-bearing liabilities and 1 bpss in the average interest rate paid.
The increase in net interest income in the twelve month period, resulted from the combined effect of the Ps.8,708 million increase in interest income, from Ps.46,680 million for FY11 to Ps.55,388 million for FY12, and a Ps.3,622 million increase in interest expense, from Ps.17,874 million for FY11 to Ps.21,496 million for FY12. This is explained by the Ps.110,886 million increase in average-earnings assets, together with a 7 bps decline in
| | 4Q.12 | Earnings Report | 9 |
| |
|
| | | |
the average interest rate earned, combined with a Ps.92,968 million increase in average interest-bearing liabilities and a 5 bps increase in the average interest rate paid.
Interest Income
Interest income rose to Ps.14,259 million in 4Q12 from Ps.13,873 million in 3Q12. This is explained by the combined increases of Ps.410 million in the loan portfolio and Ps.138 million in repurchase agreements, partially offset by lower interest income on investment in securities for Ps.162 million resulting from the decline of Ps.10,297 million in the average balance of investments in securities.
4Q12 interest-earning assets increased QoQ by Ps.13,638 million, or 2.1%, mainly driven by: a Ps.10,297 million decline in investments in securities, from Ps.203,834 million in 3Q12 to Ps.195,537 million in 4Q12, which was more than offset by a 17.9% increase in repurchase agreements.
The average interest gain on interest-earning assets rose in 4Q12 to 8.42%, representing a 33 bps increase from 8.09% in 4Q11 and a 6 bps growth compared with 8.36% in 3Q12.
Interest income rose YoY by 10.5%, or Ps.1,351 million, from Ps.12,908 million in 4Q11 to Ps.14,259 million in 4Q12, principally due to the increases of Ps.1,591 million in interest income on our loan portfolio and Ps.221 million in repurchase agreements.
The breakdown of interest income for 4Q12 is as follows: loan portfolio, which is considered as the main source of recurring income, accounts for 70.8%; investment in securities 18.7%; and 10.5% in other items.
FY12 average interest-earning assets increased by 19.7%, or Ps.110,886 million, to Ps.673,177 million, compared with Ps.562,291 million for FY11. FY12 interest income increased by Ps.8,709 million, or 18.7%, to Ps.55,388 million, compared with Ps.46,680 million for FY11.
The evolution of the loan portfolio continues to show positive trends, with diversification across all segments and growth in all core businesses.
| | 4Q.12 | Earnings Report | 10 |
| |
|
| | | |
Loan Portfolio
The total loan portfolio rose YoY by 11.8%, or Ps.37,010 million, to Ps.350,683 million in 4Q12. On a sequential basis, the total loan portfolio increased 2.1%, or Ps.7,300 million. During the quarter, Santander México continued to experience loan growth across all core segments and strategic products.
| Grupo Financiero Santander México | | | | | | | | |
| Loan Portfolio Breakdown | | | | | | | | |
| Millions of Mexican Pesos | 4Q12 | % | | 3Q12 | % | | 4Q11 | % |
| | | | | | | | | |
| Commercial | 175,736 | 50.11% | | 176,564 | 51.42% | | 164,394 | 52.41% |
| Government | 38,709 | 11.04% | | 35,121 | 10.23% | | 33,378 | 10.64% |
| Consumer | 61,603 | 17.57% | | 59,996 | 17.47% | | 49,342 | 15.73% |
| Credit cards | 36,230 | 10.33% | | 34,208 | 9.96% | | 27,912 | 8.90% |
| Other consumer | 25,373 | 7.24% | | 25,788 | 7.51% | | 21,430 | 6.83% |
| Mortgages | 68,542 | 19.55% | | 66,172 | 19.27% | | 61,243 | 19.52% |
| Total Performing Loan | 344,590 | 98.26% | | 337,853 | 98.39% | | 308,357 | 98.31% |
| | | | | | | | | |
| | | | | | | | | |
| Commercial | 1,523 | 0.43% | | 1,402 | 0.41% | | 1,926 | 0.61% |
| Government | 0 | 0.00% | | 0 | 0.00% | | 2 | 0.00% |
| Consumer | 2,236 | 0.64% | | 2,053 | 0.60% | | 1,270 | 0.40% |
| Credit cards | 1,071 | 0.31% | | 1,055 | 0.31% | | 724 | 0.23% |
| Other consumer | 1,165 | 0.33% | | 998 | 0.29% | | 546 | 0.17% |
| Mortgages | 2,334 | 0.67% | | 2,075 | 0.60% | | 2,118 | 0.68% |
| Total Non-Performing Loan | 6,093 | 1.74% | | 5,530 | 1.61% | | 5,316 | 1.69% |
| | | | | | | | | |
| Total Loan Portfolio | 350,683 | 100.00% | | 343,383 | 100.00% | | 313,673 | 100.00% |
| | 4Q.12 | Earnings Report | 11 |
| |
|
| | | |
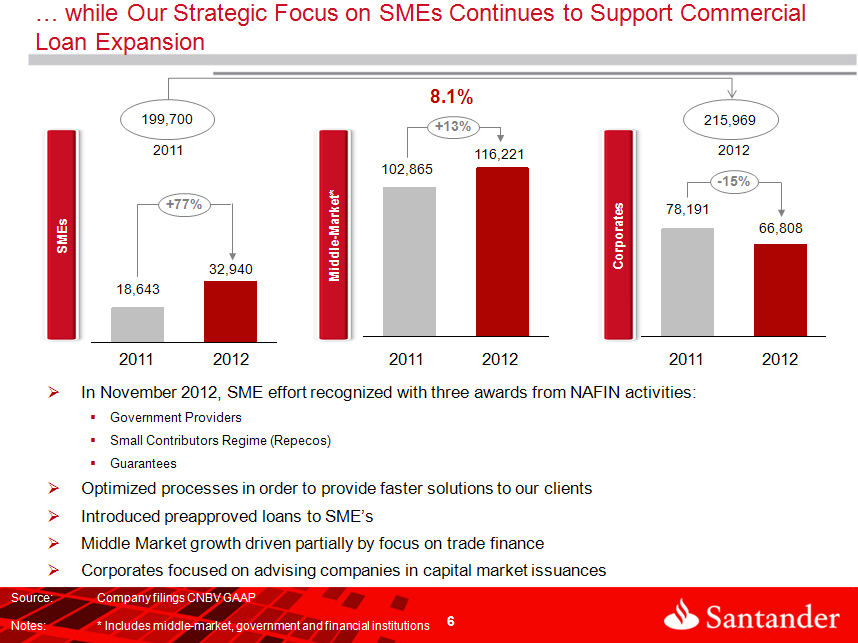
The Commercial Portfolio is composed of loans to business and commercial enterprises, as well as loans to government entities and financial institutions, and represents 61.6% of the total loan portfolio. Excluding loans to government, the commercial portfolio accounted for 50.5% of the total loan portfolio. As of 4Q12 commercial loans increased 8.1% YoY, principally reflecting the 76.7% and 14.2% increase in SMEs and middle market, respectively. On a sequential basis, excluding loans to government, the commercial portfolio remained stable, principally supported by the performance of SMEs during the quarter, which increased 6.9%.
The Individual Loan Portfolio, composed of mortgages, credit card and consumer loans, represents 38.4% of the total loan portfolio. Credit cards, consumer and mortgages loans represent 10.6%, 7.6%, and 20.2% of the total loan portfolio, respectively, and increased YoY by 30.3%, 20.8%, and 11.9%, respectively. Our mortgage loans strategy remains focused on targeting the middle market segment and residential. The Individual Loan Portfolio increased 3.9% QoQ. Our strategy for consumer loans aims to support families, and loans to these clients expanded 2.9% QoQ. Credit card loans increased 5.8%, principally driven by marketing campaigns implemented during the last part of the year to encourage the use of credit cards with zero interest financing, as well as the results achieved by our commercial teams throughout our branch network and our multichannel strategy.
Interest Expense
Interest expense increased 6.9%, or Ps.351 million, to Ps.5,448 million in 4Q12, compared with Ps.5,097 million in 4Q11, principally explained by a Ps.260 million increase in interest paid on repurchase agreements, interbank loans and credit instruments issued, due to higher volume. On a sequential basis, interest expense increased Ps.157 million, mainly reflecting a higher average balance of credit instruments issued and term deposits.
For FY12 interest expense was Ps.21,496 million, a Ps.3,622 million, or 20.3% increase, compared with Ps.17,874 million recorded for FY11.
The Ps.5,448 million in interest expenses paid in 4Q12 is broken down as follows: sale and repurchase agreements 51.0%, term deposits 27.9%, demand deposits 9.3%, credit instruments issued 7.4%, and interbank loans 4.4%.
Total deposits at the end of 4Q12 amounted to Ps.362,452 million, representing a 17.2% YoY increase. Santander México continues to implement its strategy of enhancing customer service in accordance with the needs of each segment. This strategy has resulted in an increase in demand deposits from both individuals and corporates. As of 4Q12, demand deposits reached Ps.210,915 million, increasing 18.4% YoY and 8.5% on a sequential basis. Total term deposits reached Ps.151,537 million, a 15.6% YoY increase, and 6.8% compared with 3Q12.
Interest expense on demand deposits amounted to Ps.508 million during 4Q12, representing a YoY increase of 8.5% and a sequential decline of 14.6%. The increase in 4Q12 YoY, was mainly driven by a higher average balance in demand deposits, which rose 9.1%, or Ps.12,104 million.
| | 4Q.12 | Earnings Report | 12 |
| |
|
| | | |
Interest paid on term deposits increased 2.0% YoY to Ps.1,543 million. On a sequential basis, interest paid on term deposits increased 11.2%. The 2.0% increase compared to 4Q11 reflects average volume together with an average rate increase.
Asset Quality
Non-performing loans at the end of 4Q12 increased by Ps.777 million, or 14.6% YoY, to Ps.6,093 million, and also increased on a sequential basis by 10.2%, or Ps.563 million. The breakdown of the non-performing loan portfolio is as follows: commercial loans 25.0%, consumer loans 36.7%, and mortgages 38.3%.
The YoY increase in non-performing loans, primarily reflects growth of the loan portfolio, particularly the higher participation of consumer loans, credit cards loans, mortgage loans and SMEs products in the overall mix. On a sequential basis, mortgages presented the highest increase in non-performing loans.
| | Grupo Financiero Santander México | | | | | | |
| | Asset Quality | | | | | | | | |
| | Millions of Mexican Pesos | | 2012 | 2012 | | 2011 | | Change % |
| | | | 4Q | 3Q | | 4Q | | QoQ | YoY |
| | Total Loans | | 350,683 | 343,383 | | 313,673 | | 2.13% | 11.80% |
| | Performing Loans | | 344,590 | 337,853 | | 308,357 | | 1.99% | 11.75% |
| | Non-performing Loans | | 6,093 | 5,530 | | 5,316 | | 10.18% | 14.62% |
| | | | | | | | | | |
| | Allowance for loan losses | | (11,580) | (11,360) | | (11,191) | | 1.94% | 3.48% |
| | | | | | | | | | |
| | Non-performing loan ratio | | 1.74% | 1.61% | | 1.69% | | 13bps | 4bps |
| | Coverage ratio | | 190.1 | 205.4 | | 210.5 | | (1,537)bps | (2,046)bps |
The NPL ratio for 4Q12 stood at 1.74%, a 5 bps increase from the level reported in 4Q11 and 13 bps from 1.61% in 3Q12, reflecting Santander México’s strict monitoring and portfolio quality assessment processes, which allows the adjustment of loan origination through approval policies in accordance with the performance of the loan portfolio. The coverage ratio for the quarter decreased to 190.1%, from 210.5% in 4Q11, and from 205.4% in 3Q12. The sequential decline in the coverage ratio primarily reflects a nominal increase in non-performing loans resulting from the growth of the loan portfolio. Non-performing loans, however, increased more than the provisions for loan losses because the majority of the increase in the non-performing portfolio was driven by mortgages which are guaranteed by properties and thus require lower provisions than the consumer portfolio.
| | 4Q.12 | Earnings Report | 13 |
| |
|
| | | |
During 4Q12 allowance for loan losses amounted to Ps.2,948 million, which represented a 16.3% increase compared with 3Q12, principally generated in consumer, mortgages and credit card loan portfolios. 4Q12 allowance for loan losses were impacted by provisions derived from a project finance client and the impact from a trial campaign aimed at a specific target segment.
For FY12, allowances for loan losses increased by 44.1%, or Ps.2,889 million, to Ps.9,445 million compared with the same period last year. This increase is mainly explained by the 11.8% growth in the loan portfolio during the last twelve months, the low comparison base resulting from the reversal of provisions in 3Q11 to comply with CNBV (Comisión Nacional Bancaria y de Valores) regulations, and the higher provisions in 4Q12 discussed above.
| | 4Q.12 | Earnings Report | 14 |
| |
|
| | | |
Commission and Fee Income (Net)
| | Grupo Financiero Santander México | | | | | | | | |
| | Net Commission and Fee Income | | | | | | | | |
| | Millions of Mexican Pesos | | | | | | | | |
| | | | | | | | % Change | | | % Change |
| | Commission and fee income | | 4Q12 | 3Q12 | 4Q11 | | QoQ | YoY | 2012 | 2011 | 12/11 |
| | Credit and debit cards | | 1,194 | 1,026 | 903 | | 16.4 | 32.2 | 4,010 | 3,333 | 20.3 |
| | Cash management | | 181 | 176 | 172 | | 2.8 | 5.2 | 711 | 590 | 20.5 |
| | Collection and payment services | | 351 | 347 | 308 | | 1.2 | 14.0 | 1,434 | 1,257 | 14.1 |
| | Investment fund management | | 452 | 461 | 464 | | (2.0) | (2.6) | 1,838 | 1,877 | (2.1) |
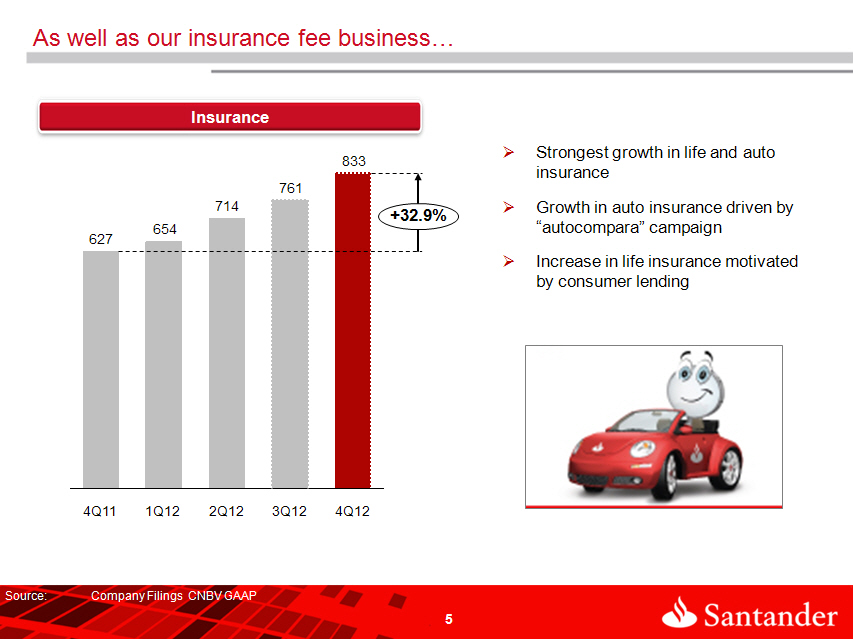
| | Insurance | | 856 | 783 | 655 | | 9.3 | 30.7 | 3,049 | 2,311 | 31.9 |
| | Capital markets and securities activities | | 153 | 151 | 137 | | 1.3 | 11.7 | 621 | 548 | 13.3 |
| | Checks | | 91 | 86 | 94 | | 5.8 | (3.2) | 356 | 382 | (6.8) |
| | Foreign trade | | 130 | 126 | 123 | | 3.2 | 5.7 | 527 | 489 | 7.8 |
| | Financial advisory services | | 330 | 430 | 85 | | (23.3) | 288.2 | 1,394 | 1,048 | 33.0 |
| | Other commissions and fees | | 244 | 197 | 180 | | 23.9 | 35.6 | 833 | 689 | 20.9 |
| | Total | | 3,982 | 3,783 | 3,121 | | 5.3 | 27.6 | 14,773 | 12,524 | 18.0 |
| | | | | | | | | | | | |
| | Commission and fee expense | | | | | | | | | | |
| | Credit and debit cards | | (286) | (377) | (280) | | 24.1 | (2.1) | (1,325) | (1,003) | (32.1) |
| | Investment fund management | | (30) | (28) | (16) | | (7.1) | (87.5) | (109) | (90) | (21.1) |
| | Insurance | | (23) | (22) | (28) | | (4.5) | 17.9 | (87) | (76) | (14.5) |
| | Capital markets and securities activities | | (40) | (46) | (43) | | 13.0 | 7.0 | (161) | (147) | (9.5) |
| | Checks | | (11) | (9) | (11) | | (22.2) | 0.0 | (38) | (43) | 11.6 |
| | Financial advisory services | | (7) | (11) | (19) | | 36.4 | 63.2 | (29) | (226) | 87.2 |
| | Other commissions and fees | | (246) | (225) | (228) | | (9.3) | (7.9) | (821) | (707) | (16.1) |
| | Total | | (643) | (718) | (625) | | 10.4 | (2.9) | (2,570) | (2,292) | (12.1) |
| | | | | | | | | | | | |
| | Commission and Fee Income, net | | 3,339 | 3,065 | 2,496 | | 8.9 | 33.8 | 12,203 | 10,232 | 19.3 |
In 4Q12 net commission and fee income amounted to Ps.3,339 million, representing a YoY increase of 33.8%, or Ps.843 million. This improvement principally reflects the following YoY increases: 45.7%, or Ps.285 million, in credit and debit card fees; 32.9%, or Ps.206 million, in insurance fees; and 389.4%, or Ps.257 million, in financial advisory services.
Compared to 3Q12, net commission and fee income rose 8.9%, or Ps.274 million, mainly reflecting the following sequential increases: 39.9%, or Ps.259 million, in credit card fees; and 9.5%, or Ps.72 million, in insurance fees mainly reflecting growth of “Autocompara”.
For FY12, net commission and fee income increased 19.3% YoY, or Ps.1,971 million, to Ps.12,203 million.
| | 4Q.12 | Earnings Report | 15 |
| |
|
| | | |
Net gain (loss) on financial assets and liabilities
| | Grupo Financiero Santander México | | | | | | |
| | Net gain (loss) on financial assets and liabilities | | | | |
| | Millions of Mexican Pesos | | | | | | % Change | | | % Change |
| | | | 4Q12 | 3Q12 | 4Q11 | | QoQ | YoY | 2012 | 2011 | 12/11 |
| | Valuation | | | | | | | | | | |
| | Foreign currencies | | 6 | (110) | (115) | | 105.5 | 105.2 | (75) | (36) | (108.3) |
| | Derivatives | | (993) | (9) | 92 | | (10,933.3) | (1,179.3) | (996) | (3,129) | 68.2 |
| | Shares | | 345 | 0 | 1,127 | | 100.0 | (69.4) | 457 | (1,352) | 133.8 |
| | Debt instruments | | (900) | 526 | (386) | | (271.1) | (133.2) | 126 | 53 | 137.7 |
| | Subtotal | | (1,542) | 407 | 718 | | (478.9) | (314.8) | (488) | (4,464) | 89.1 |
| | | | | | | | | | | | |
| | Trading | | | | | | | | | | |
| | Foreign currencies | | (435) | 191 | 202 | | (327.7) | (315.3) | 94 | 1,134 | (91.7) |
| | Derivatives | | 1,294 | 338 | (1,135) | | 282.8 | 214.0 | 983 | 4,603 | (78.6) |
| | Shares | | 306 | 135 | (224) | | 126.7 | 236.6 | 1,028 | (528) | 294.7 |
| | Debt instruments | | 793 | (151) | 388 | | 625.2 | 104.4 | 579 | 143 | 304.9 |
| | Subtotal | | 1,958 | 513 | (769) | | 281.7 | 354.6 | 2,684 | 5,352 | (49.9) |
| | | | | | | | | | | | |
| | Total | | 416 | 920 | (51) | | (55) | 916 | 2,196 | 888 | 147.3 |
In 4Q12, Santander México recorded a net gain on financial assets and liabilities of Ps.416 million, compared with a net loss of -Ps.51 million in 4Q11 and a net gain of Ps.920 million in 3Q12. The net gain on financial assets and liabilities in 4Q12 is mainly explained by trading gains of Ps.1,958 million, which were partially offset by a Ps.1,542 million valuation loss principally related to derivatives and debt instruments. This compares to gains of Ps.407 million and Ps.513 million in 3Q12 from valuation and trading, respectively. During 4Q11, Santander México reported a Ps.718 million valuation gain, despite currency and debt instrument losses which was more than offset by a Ps.769 million trading loss.
| | 4Q.12 | Earnings Report | 16 |
| |
|
| | | |
Other Operating Income (Expense)
| | Grupo Financiero Santander México | | | | | | | | |
| | Other Operating Income (Expense) | | | | | | | | |
| | | | | | | | % Change | | | % Change |
| | | | 4Q12 | 3Q12 | 4Q11 | | QoQ | YoY | 2012 | 2011 | 12/11 |
| | | | | | | | | | | | |
| | Recoveries of loans previously charged-off | | 439 | 467 | 407 | | (6.0) | 7.9 | 1,804 | 1,525 | 18.3 |
| | Income from sale of fixed assets | | 9 | 1 | 13 | | 800.0 | (30.8) | 1,741 | 13 | 13,292.3 |
| | Allowance for loan losses released | | 0 | 0 | 0 | | (100.0) | 0.0 | 378 | 0 | 0.0 |
| | Recovered taxes | | 0 | 0 | 81 | | 0.0 | (100.0) | 0 | 96 | (100.0) |
| | Cancellation of liabilities and reserve | | 47 | 43 | 55 | | 9.3 | (14.5) | 201 | 176 | 14.2 |
| | Interest on personnel loans | | 33 | 31 | 29 | | 6.5 | 13.8 | 122 | 110 | 10.9 |
| | Foreclosed assets reserve | | (14) | (6) | (23) | | (133.3) | 39.1 | (44) | (48) | 8.3 |
| | Profit from sale of foreclosed assets | | 35 | 43 | 42 | | (18.6) | (16.7) | 146 | 54 | 170.4 |
| | Acquisition of discounted loan portfolio | | | 0 | 0 | | 0.0 | 0.0 | 0 | 112 | (100.0) |
| | Technical advisory services | | 28 | 25 | 20 | | 12.0 | 40.0 | 103 | 72 | 43.1 |
| | Portfolio recovery legal expenses and costs | | (179) | (118) | (121) | | (51.7) | (47.9) | (611) | (452) | (35.2) |
| | Write-offs and bankruptcies | | (178) | (331) | (114) | | 46.2 | (56.1) | (791) | (383) | (106.5) |
| | Provision for legal and tax contingencies | | (73) | (97) | (100) | | 24.7 | 27.0 | (272) | (242) | (12.4) |
| | IPAB (indemnity) provisions and payments | | (2) | (2) | (25) | | 0.0 | 92.0 | (35) | (34) | (2.9) |
| | Recoveries of loans previously charged-off | | 0 | 0 | 32 | | 0.0 | (100.0) | 0 | 32 | (100.0) |
| | Other | | 47 | 32 | 3 | | 46.9 | 1,466.7 | 213 | 36 | 491.7 |
| | | | | | | | | | | | |
| | Other Operating Income (Expense) | | 192 | 88 | 299 | | 118.1 | (35.8) | 2,955 | 1,067 | 176.9 |
In 4Q12 other operating income declined to Ps.192 million, from Ps.299 million in 4Q11 and from Ps.88 million in 3Q12.
For FY12, other net operating income increased to Ps.2,955 million, compared with Ps.1,067 million for FY11. This growth is mainly explained by the extraordinary gain derived from the sale of 220 branches to Fibra Uno in 2Q12.
| | 4Q.12 | Earnings Report | 17 |
| |
|
| | | |
Administrative and Promotional Expenses
Administrative and promotional expenses consist of personnel such as payroll and benefits, promotion and advertising expenses, and other general expenses. Personnel expenses consist mainly of salaries, social security contributions, bonuses and our long-term incentive plan for our executives. Other general expenses mainly consist of: expenses related to technology and systems, administrative services, which are mainly services outsourced in the areas of information technology, taxes and duties, professional fees, contributions to IPAB, rental of properties and hardware, advertising and communication, surveillance and cash courier services and expenses related to maintenance, conservation and repair, among others.
| | Grupo Financiero Santander México | | | | | | | | | | |
| | Administrative and Promotional Expenses | | | | | | | | |
| | Millions of Mexican Pesos | | | | | | % Change | | | % Change |
| | | | 4Q12 | 3Q12 | 4Q11 | | QoQ | YoY | 2012 | 2011 | 12/11 |
| | Salaries and employee benefits | | 2,342 | 2,170 | 2,026 | | 7.9 | 15.6 | 8,734 | 7,690 | 13.6 |
| | Credit card operation | | 79 | 100 | 102 | | (21.0) | (22.5) | 256 | 243 | 5.3 |
| | Professional fees | | 244 | 108 | 202 | | 125.9 | 20.8 | 616 | 696 | (11.5) |
| | Leasehold | | 357 | 339 | 246 | | 5.3 | 45.1 | 1,261 | 980 | 28.7 |
| | Promotional and advertising expenses | | 401 | 151 | 411 | | 165.6 | (2.4) | 769 | 827 | (7.0) |
| | Taxes and duties | | 408 | 307 | 317 | | 32.9 | 28.7 | 1,081 | 992 | 9.0 |
| | Technology services (IT) | | 462 | 504 | 478 | | (8.3) | (3.3) | 1,803 | 1,633 | 10.4 |
| | Depreciation and amortization | | 410 | 389 | 388 | | 5.4 | 5.7 | 1,557 | 1,464 | 6.4 |
| | Contributions to bank savings protection system (IPAB) | | 355 | 341 | 326 | | 4.1 | 8.9 | 1,342 | 1,228 | 9.3 |
| | Cash protection | | 189 | 147 | 183 | | 28.6 | 3.3 | 566 | 553 | 2.4 |
| | Other services and expenses | | 775 | 623 | 542 | | 24.4 | 43.0 | 2,251 | 1,805 | 24.7 |
| | | | | | | | | | | | |
| | Total Administrative and Promotional Expenses | | 6,022 | 5,179 | 5,221 | | 16.3 | 15.3 | 20,236 | 18,111 | 11.7 |
4Q12 administrative and promotional expenses rose 15.3% YoY to Ps.6,022 million, driven by increases in the following areas: Ps.316 million in salaries and employee benefits, Ps.111 million in leaseholds, Ps.91 million in taxes and duties and Ps.233 million in other expenses.
On a sequential basis, administrative and promotional expenses rose 16.3%, principally due to the following increases: Ps.250 million in promotional expenses, Ps.172 million in salaries and employee benefits, Ps.152 million in other expenses, Ps.101 million in tax and duties, Ps.21 million in credit cards operation and Ps.18 million in leaseholds.
Results for the quarter were negatively affected by the following incremental administrative and promotional expenses:
| § | Ps.225 million in marketing expenses from a corporate image campaign; |
| § | Ps.127 million related to the opening of 15 branches during the quarter and frontloading of expenses for branch openings in 2013; |
| § | Ps.100 million incremental rent from the 220 branches sold and leased back; |
| § | Ps.60 million expenses related to the Company’s IPO; and |
| § | Ps.40 million from the amortization of obsolete software |
During 4Q12, administrative and promotional expenses grew in line with the recurring business. Additionally, administrative and promotional expenses are seasonally higher in the fourth quarter, mainly explained by expenses in marketing campaigns which become stronger in the second half of the year.
| | 4Q.12 | Earnings Report | 18 |
| |
|
| | | |
For FY12, administrative and promotional expenses increased 11.7% to Ps.20,236 million compared with FY11. This increase is mainly explained by higher: personnel expenses, leaseholds, tax and duties, technology and other administrative expenses.
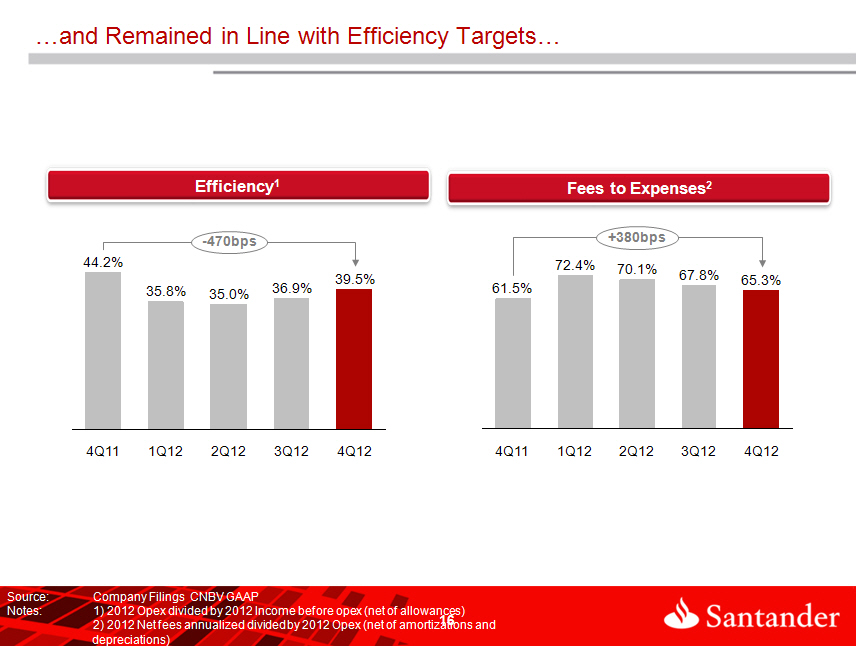
The efficiency ratio for 4Q12 was 39.5%, which compares to 44.2% and 36.9% reported in 4Q11 and 3Q12, respectively.
The recurrence ratio in 4Q12 was 65.3%, improving from 61.5% in 4Q11 and slightly decreasing versus 67.8% in 3Q12.
Current and Deferred Taxes
Current and deferred income taxes in 4Q12 amounted to Ps.497 million compared with the Ps.82 million tax credit recorded in 4Q11 and below the Ps.745 in 3Q12.
For FY12, current and deferred income taxes amounted to Ps.3,815 million, representing a 50.6%, or Ps.1,281 million increase against FY12.
Capitalization and ROAE
| | Grupo Financiero Santander México | | | | |
| | Capitalization | | | | | | |
| | Millions of Mexican Pesos | | 4Q12 | | 3Q12 | | 4Q11 |
| | Tier 1 | | 74,618 | | 73,570 | | 71,674 |
| | Tier 2 | | 1,579 | | 1,538 | | 1,469 |
| | Total Capital | | 76,197 | | 75,108 | | 73,143 |
| | | | | | | | |
| | Risk-Weighted Assets | | | | | | |
| | Credit Risk | | 320,268 | | 313,707 | | 267,270 |
| | Credit, Market, and Operational Risk | | 515,583 | | 519,647 | | 493,249 |
| | | | | | | | |
| | Credit Risk Ratios: | | | | | | |
| | Tier 1 (%) | | 23.3 | | 23.5 | | 26.8 |
| | Tier 2(%) | | 0.5 | | 0.5 | | 0.5 |
| | Capitalization Ratio (%) | | 23.8 | | 23.9 | | 27.4 |
| | | | | | | | |
| | Total Capital Ratios: | | | | | | |
| | Tier 1(%) | | 14.5 | | 14.2 | | 14.5 |
| | Tier 2 (%) | | 0.3 | | 0.3 | | 0.3 |
| | Capitalization Ratio (%) | | 14.8 | | 14.5 | | 14.8 |
Banco Santander México’s capital ratio was 14.8% in 4Q12, unchanged YoY and above the 14.5% reported in 3Q12. The capital ratio reflects the impact of the Ps.7.3 billion cash dividend paid during 3Q12. The core capital ratio amounted to 14.5% in 4Q12, unchanged from the 14.5% reported in 4Q11 and above 14.2% in 3Q12.
| | 4Q.12 | Earnings Report | 19 |
| |
|
| | | |
As of June 2012, Santander México is classified within Category 1 in accordance with Article 134bis of the Mexican Banking Law, and remains in this category as per the preliminary results dated July 2012, which is the most recently available analysis.
ROAE in 4Q12 was 19.1%, a decrease of 280 bps from the 21.9% reported in 4Q11, and below the 21.1% in 3Q12. Excluding the aforementioned events in 3Q11, 4Q11, 2Q12 and 4Q12, adjusted ROAE would have been 18.5% in 4Q12 and 15.3% in 4Q11, representing a 320 bps YoY increase.
RELEVANT EVENTS
Santander Issues Bond in the International Markets
In November 2012, Banco Santander Mexico issued a 10-year bond in the international markets with a principal amount of US$1 billion at an interest rate of 260 bps over US Treasuries.
Financing of CFE’s Energy Generation Plant
During 4Q12, Banco Santander Mexico concluded a 10.5-year structured financing to fund the second stage of CFE’s “Manzanillo” energy generation plant. Santander Mexico participated in US$247 million of the total US$424 million financing, together with the Korean Development Bank (“KDB”). The transaction was 100% guaranteed under an Export Finance program by Korean Trade Insurance Corporation (“K-sure”), an export credit agency (“ECA”).
Financing of a PEMEX Exploration and Drilling Platform
During 4Q12, Banco Santander Mexico participated in the structuring and syndication of a US$547 million, 5.7-year financing of a Deep Sea Oil and Gas Exploration and Drilling Platform (Group R), the most modern of its kind at PEMEX Exploration. Santander Mexico’s participation in the financing amounted to US$29 million.
AWARDS & RECOGNITION
Santander Mexico is Recognized as “Bank of the Year” by The Banker
In November 2012, Santander Mexico was awarded Bank of the Year 2012 by the prestigious magazine, The Banker. Banco Santander Mexico was recognized this year for the efficiency of its operations, capacity to innovate and its aggressive commercial offering, which combined with a healthy loan portfolio allowed for an increase of almost 35% in net income during fiscal year 2011.
Santander Receives Three Awards from Nafin for its Contribution to SMEs’ Financing
In November 2012, Banco Santander Mexico received three awards from Nacional Financiera (Nafin) for its contribution in providing financing to Small and Medium Enterprises, becoming the first institution to win in three categories during the same year. In the context of the Nafin awards to Financial Intermediaries, Banco Santander was recognized for its leadership and innovation in the “Government Suppliers”, “Small Contributors Regime (REPECOS)” and “Guarantees” categories.
| | 4Q.12 | Earnings Report | 20 |
| |
|
| | | |
CREDIT RATINGS
| | Banco Santander (México) | | | | | | |
| | Ratings | | | | | | |
| | | | Standard & Poor´s | | Moody´s | | Fitch Ratings |
| | Global Scale | | | | | | |
| | Foreign Currency | | | | | | |
| | Long Term | | BBB | | Baa1 | | BBB+ ** |
| | Short Term | | A-2 | | P-2 | | F2 |
| | | | | | | | |
| | Local Currency | | | | | | |
| | Long Term | | BBB | | A3 | | BBB+ ** |
| | Short Term | | A-2 | | P-2 | | F2 |
| | | | | | | | |
| | National Scale | | | | | | |
| | Long Term | | mxAAA | | Aaa.mx | | AAA(mex) |
| | Short Term | | mxA-1+ | | Mx-1 | | F1+(mex) |
| | | | | | | | |
| | Deposit Certificates | | | | | | |
| | Long Term | | BBB | | | | |
| | Short Term | | A-3 | | | | |
| | | | | | | | |
| | Autonomous Credit Profile (SACP) | | bbb+ | | - | | - |
| | Rating viability (VR) | | - | | - | | bbb+ |
| | Support | | - | | - | | 2 |
| | Financial Strength | | - | | C- | | - |
| | Standalone BCA | | - | | baa1 | | - |
| | Outlook | | Stable | | Stable | | Stable |
| | | | | | | | |
| | Last publication: | | 22-Oct-12 | | 28-Jun-12 | | 13-Jun-12 |
| | ** Negative Outlook | | | | | | |
| | 4Q.12 | Earnings Report | 21 |
| |
|
| | | |
| | Brokerage - Casa de Bolsa Santander |
| | Ratings | | | | |
| | | | Moody´s | | Fitch Ratings |
| | Global Scale | | | | |
| | National Scale | | | | |
| | Long Term | | A3 | | _ |
| | Short Term | | Prime-2 | | _ |
| | | | | | |
| | National Scale | | | | |
| | Long Term | | Aaa.mx | | AAA.mx |
| | Short Term | | Mx-1 | | F1+mx |
| | | | | | |
| | Outlook | | Stable | | Stable |
October 22, 2012 Standard and Poor's affirmed Banco Santander (Mexico)'s ratings with stable outlook. Long Tem Global rating remains in "BBB" and "A-2" in short term. Currently the systemic importance was changed to "high" from "moderate"
4Q12 EARNINGS CALL DIAL-IN INFORMATION
| Date: | | Tuesday, February 19, 2013 |
| | | |
| Time: | | 8:00 AM (MCT); 9:00 AM (US ET) |
| | | |
| Dial-in Numbers: | | 1-877-941-4774 US & Canada; 1-480-629-9760 International & Mexico |
| | | |
| Access Code: | | 4595377 |
| | | |
| Webcast: | | https://viavid.webcasts.com/starthere.jsp?ei=1013104 |
| | | |
| Replay: | | Starting Tuesday, February, 19, 2013 at 12:00 PM (MCT); 01:00 PM (US ET), and ending on Tuesday, February 26, 2013 at 10:59 PM (MCT); 11:59 PM (US ET). |
| | | |
| | | Dial-in number: 1.877-870-5176 US & Canada; 1-858-384-5517 International & Mexico |
| | | |
| | | Access Code: 4595377 |
ANALYST COVERAGE
Bank of America Merrill Lynch, Barclays, BBVA Bancomer, Citi, Credit Suisse, Deutsche Bank, EVA Dimensions, GBM, Goldman Sachs, HSBC, Independent Research, JP Morgan, Morgan Stanley, Morningstar, Nau Securities, RBC, UBS and Vector.
Santander México is covered by the aforementioned analysts. Please note that any opinions, estimates or forecasts regarding the performance of Santander México issued by these analysts reflect their own views, and therefore do not represent the opinions, estimates or forecasts of Santander México or its management. Although Santander México may refer to or distribute such statements, this does not imply that Santander México agrees with or endorses any information, conclusions or recommendations included therein.
| | 4Q.12 | Earnings Report | 22 |
| |
|
| | | |
DEFINITION OF RATIOS
ROAE: Annualized net income divided by average equity
EFFICIENCY: Annualized administrative and promotional expenses divided by annualized gross operating income (before administrative and promotional expenses and net of allowances)
RECURRENCIA: Annualized net fees divided by annualized administrative and promotional expenses (net of amortizations and depreciations)
NIM: Financial margin divided by daily average interest earnings assets
ABOUT GRUPO FINANCIERO SANTANDER MEXICO, S.A.B. DE C.V. (NYSE: BSMX; BMV: SANMEX)
Grupo Financiero Santander Mexico, S.A.B. de C.V. (Santander Mexico), one of Mexico’s leading financial services holding companies, provides a wide range of financial and related services, including retail and commercial banking, securities brokerage, financial advisory and other related investment activities. Santander Mexico offers a multichannel financial services platform focused on mid- to high-income individuals and small- to medium-sized enterprises, while also providing integrated financial services to larger multinational companies in Mexico. As of December 31, 2012, Santander Mexico had total assets of Ps.750.3 billion under Mexican GAAP and more than 10.0 million customers. Headquartered in Mexico City, the Company operates 1,170 branches nationwide and has a total of 13,385 employees.
We, the undersigned under oath to tell the truth declare that, in the area of our corresponding functions, we prepared the information on Grupo Financiero Santander contained in this quarterly report, which to the best of our knowledge reasonably reflects its situation.
| MARCOS A. MARTINEZ GAVICA | | PEDRO JOSE MORENO CANTALEJO |
| | | |
| Executive President and Chief Executive Officer | | Vice President of Administration and Finance |
| EMILIO DE EUSEBIO SAIZ | | JESÚS GONZÁLEZ DEL REAL | | JAVIER PLIEGO ALEGRÍA |
| | | | | |
Deputy General Director of Intervention and Control Management | | Executive Director – Controller | | Executive Director – Audit |
| | | |
| | The financial information presented in this report has been obtained from the non-audited financial statements prepared in accordance with the General Nature Provisions applicable to Holding Corporations of Financial Groups which are subject to the supervision of the National Banking and Securities Commission on accounting procedures, published in the Federal Official Gazette on January 31, 2011. The exchange rate used to convert foreign currency transactions to pesos is PPs.13.40840. | |
INVESTOR RELATIONS CONTACT
Gerardo Freire Alvarado
+ 52 (55) 5269-1827
investor@santander.com.mx
| | 4Q.12 | Earnings Report | 23 |
| |
|
| | | |
LEGAL DISCLAIMER
Grupo Financiero Santander México cautions that this report may contain forward-looking statements within the meaning of the U.S. Private Securities Litigation Reform Act of 1995. These forward-looking statements could be found in various places throughout this reports and include, without limitation, statements regarding our intent, belief, targets or current expectations in connection with: asset growth and sources of funding; growth of our fee-based business; expansion of our distribution network; our focus on strategic businesses; our compound annual growth rate; our risk, efficiency and profitability targets; financing plans; competition; impact of regulation; exposure to market risks including interest rate risk, foreign exchange risk and equity price risk; exposure to credit risks including credit default risk and settlement risk; projected capital expenditures; capitalization requirements and level of reserves; liquidity; trends affecting the economy generally; and trends affecting our financial condition and our results of operations. While these forward-looking statements represent our judgment and future expectations concerning the development of our business, a number of risks, uncertainties and other important factors could cause actual developments and results to differ materially from our expectations. These factors include, but are not limited to: changes in capital markets in general that may affect policies or attitudes towards lending to Mexico or Mexican companies; changes in economic conditions, in Mexico in particular, in the United States or globally; the monetary, foreign exchange and interest rate policies of the Mexican Central Bank (Banco de México); inflation; deflation; unemployment; unanticipated turbulence in interest rates; movements in foreign exchange rates; movements in equity prices or other rates or prices; changes in Mexican and foreign policies, legislation and regulations; changes in requirements to make contributions to, for the receipt of support from programs organized by or requiring deposits to be made or assessments observed or imposed by, the Mexican government; changes in taxes; competition, changes in competition and pricing environments; our inability to hedge certain risks economically; economic conditions that affect consumer spending and the ability of customers to comply with obligations; the adequacy of allowances for loans and other losses; increased default by borrowers; technological changes; changes in consumer spending and saving habits; increased costs; unanticipated increases in financing and other costs or the inability to obtain additional debt or equity financing on attractive terms; changes in, or failure to comply with, banking regulations; and certain other factors indicated in the “Risk Factors” section of our Registration Statement on Form F-1 (File No. 333-183409). The risk factors and other key factors that we have indicated in our past and future filings and reports, including those with the U.S. Securities and Exchange Commission, could adversely affect our business and financial performance.
Note: The information contained in this report is not audited. Nevertheless, the consolidated accounts are prepared on the basis of the accounting principles and regulations prescribed by the Mexican National Banking and Securities Commission (Comisión Nacional Bancaria y de Valores) for credit institutions, as amended (Mexican Banking GAAP). All figures presented are in nominal terms. Historical figures are not adjusted by inflation.
| | 4Q.12 | Earnings Report | 24 |
| |
|
| | | |
Grupo Financiero Santander México
| § | Consolidated Balance Sheet |
| § | Consolidated Statement of Income |
| § | Consolidated Statement of Changes in Stockholders’ Equity |
| § | Consolidated Statement of Cash Flows |
The information contained in this report and the financial statements of the Group’s subsidiaries may be consulted on the Internet website: www.santander.com.mx or through the following direct access:
http://www.santander.com.mx/ir/inf_financiera/inf_trimestral.html
There is also information on Santander on the CNBV Website: www.cnbv.gob.mx
| | 4Q.12 | Earnings Report | 25 |
| |
|
| | | |
| Grupo Financiero Santander México | | | | | | | | | | | | | | | | | | | |
| Consolidated Balance Sheet | | | | | | | | | | | | | | | | | | | |
| Millions of Mexican Pesos | | | | | | | | | | | | | | | | | | | |
| | | | | | | | | | | | 2012 | | | | | | | | | | | | 2011 | |
| | | Dec | | | Sep | | | Jun | | | Mar | | | Dec | | | Sep | | | Jun | | | Mar | |
| Assets | | | | | | | | | | | | | | | | | | | | | | | | |
| | | | | | | | | | | | | | | | | | | | | | | | | |
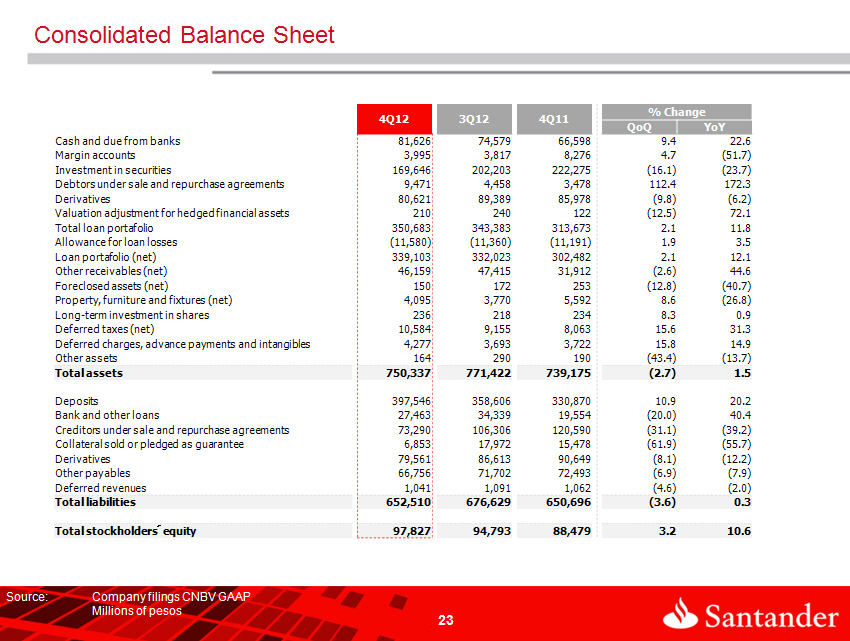
| Cash and due from banks | | | 81,626 | | | | 74,579 | | | | 77,019 | | | | 60,747 | | | | 66,598 | | | | 73,705 | | | | 93,387 | | | | 84,009 | |
| | | | | | | | | | | | | | | | | | | | | | | | | | | | | | | | | |
| Margin accounts | | | 3,995 | | | | 3,817 | | | | 4,534 | | | | 4,187 | | | | 8,276 | | | | 8,544 | | | | 8,261 | | | | 7,719 | |
| | | | | | | | | | | | | | | | | | | | | | | | | | | | | | | | | |
| Investment in securities | | | 169,646 | | | | 202,203 | | | | 262,988 | | | | 269,692 | | | | 222,275 | | | | 231,358 | | | | 237,578 | | | | 207,456 | |
| Trading securities | | | 117,183 | | | | 142,175 | | | | 203,249 | | | | 202,830 | | | | 155,953 | | | | 180,087 | | | | 185,997 | | | | 147,642 | |
| Securities available for sale | | | 47,373 | | | | 54,996 | | | | 54,764 | | | | 61,944 | | | | 61,461 | | | | 46,467 | | | | 46,831 | | | | 55,119 | |
| Securities held to maturity | | | 5,090 | | | | 5,032 | | | | 4,975 | | | | 4,918 | | | | 4,861 | | | | 4,804 | | | | 4,750 | | | | 4,695 | |
| | | | | | | | | | | | | | | | | | | | | | | | | | | | | | | | | |
| Debtors under sale and repurchase agreements | | | 9,471 | | | | 4,458 | | | | 4,827 | | | | 4,484 | | | | 3,478 | | | | 25,515 | | | | 7,262 | | | | 6,655 | |
| | | | | | | | | | | | | | | | | | | | | | | | | | | | | | | | | |
| Derivatives | | | 80,621 | | | | 89,389 | | | | 87,857 | | | | 71,991 | | | | 85,978 | | | | 110,516 | | | | 79,999 | | | | 70,483 | |
| Trading purposes | | | 80,321 | | | | 88,945 | | | | 87,286 | | | | 71,276 | | | | 85,081 | | | | 109,441 | | | | 78,500 | | | | 69,329 | |
| Hedging purposes | | | 300 | | | | 444 | | | | 571 | | | | 715 | | | | 897 | | | | 1,075 | | | | 1,499 | | | | 1,154 | |
| | | | | | | | | | | | | | | | | | | | | | | | | | | | | | | | | |
| Valuation adjustment for hedged financial assets | | | 210 | | | | 240 | | | | 220 | | | | 139 | | | | 122 | | | | 141 | | | | 86 | | | | (12 | ) |
| | | | | | | | | | | | | | | | | | | | | | | | | | | | | | | | | |
| Performing loan portfolio | | | | | | | | | | | | | | | | | | | | | | | | | | | | | | | | |
| Commercial loans | | | 214,445 | | | | 211,685 | | | | 212,492 | | | | 198,276 | | | | 197,772 | | | | 197,465 | | | | 183,059 | | | | 175,304 | |
| Commercial or business activity | | | 175,329 | | | | 175,945 | | | | 176,332 | | | | 163,630 | | | | 162,419 | | | | 162,162 | | | | 148,546 | | | | 152,482 | |
| Financial entities loans | | | 407 | | | | 619 | | | | 606 | | | | 1,934 | | | | 1,975 | | | | 3,306 | | | | 4,542 | | | | 4,043 | |
| Government entities loans | | | 38,709 | | | | 35,121 | | | | 35,554 | | | | 32,712 | | | | 33,378 | | | | 31,997 | | | | 29,971 | | | | 18,779 | |
| Consumer loans | | | 61,603 | | | | 59,996 | | | | 57,043 | | | | 52,857 | | | | 49,342 | | | | 47,101 | | | | 43,683 | | | | 40,242 | |
| Mortage loans | | | 68,542 | | | | 66,172 | | | | 64,417 | | | | 62,559 | | | | 61,243 | | | | 58,853 | | | | 56,954 | | | | 36,124 | |
| Total performing loan portafolio | | | 344,590 | | | | 337,853 | | | | 333,952 | | | | 313,692 | | | | 308,357 | | | | 303,419 | | | | 283,696 | | | | 251,670 | |
| | | | | | | | | | | | | | | | | | | | | | | | | | | | | | | | | |
| Nonperforming loan portafolio | | | | | | | | | | | | | | | | | | | | | | | | | | | | | | | | |
| Commercial loans | | | 1,523 | | | | 1,402 | | | | 1,313 | | | | 1,135 | | | | 1,928 | | | | 3,233 | | | | 1,758 | | | | 1,752 | |
| Commercial or business activity | | | 1,523 | | | | 1,402 | | | | 1,313 | | | | 1,135 | | | | 1,926 | | | | 1,840 | | | | 1,758 | | | | 1,752 | |
| Government entities loans | | | 0 | | | | 0 | | | | 0 | | | | 0 | | | | 2 | | | | 1,393 | | | | 0 | | | | 0 | |
| Consumer loans | | | 2,236 | | | | 2,053 | | | | 1,709 | | | | 1,255 | | | | 1,270 | | | | 1,232 | | | | 1,321 | | | | 1,131 | |
| Mortage loans | | | 2,334 | | | | 2,075 | | | | 1,931 | | | | 1,982 | | | | 2,118 | | | | 2,245 | | | | 3,690 | | | | 569 | |
| Total nonperforming portafolio | | | 6,093 | | | | 5,530 | | | | 4,953 | | | | 4,372 | | | | 5,316 | | | | 6,710 | | | | 6,769 | | | | 3,452 | |
| Total loan portafolio | | | 350,683 | | | | 343,383 | | | | 338,905 | | | | 318,064 | | | | 313,673 | | | | 310,129 | | | | 290,465 | | | | 255,122 | |
| | | | | | | | | | | | | | | | | | | | | | | | | | | | | | | | | |
| Allowance for loan losses | | | (11,580 | ) | | | (11,360 | ) | | | (11,101 | ) | | | (10,875 | ) | | | (11,191 | ) | | | (10,906 | ) | | | (12,892 | ) | | | (10,449 | ) |
| Loan portafolio (net) | | | 339,103 | | | | 332,023 | | | | 327,804 | | | | 307,189 | | | | 302,482 | | | | 299,223 | | | | 277,573 | | | | 244,673 | |
| | | | | | | | | | | | | | | | | | | | | | | | | | | | | | | | | |
| Other receivables (net) | | | 46,159 | | | | 47,415 | | | | 55,932 | | | | 47,009 | | | | 31,912 | | | | 38,757 | | | | 32,063 | | | | 41,151 | |
| Foreclosed assets (net) | | | 150 | | | | 172 | | | | 196 | | | | 220 | | | | 253 | | | | 290 | | | | 305 | | | | 155 | |
| Property, furniture and fixtures (net) | | | 4,095 | | | | 3,770 | | | | 3,780 | | | | 5,439 | | | | 5,592 | | | | 5,166 | | | | 5,238 | | | | 5,340 | |
| Long-term investment in shares | | | 236 | | | | 218 | | | | 203 | | | | 251 | | | | 234 | | | | 218 | | | | 206 | | | | 226 | |
| Deferred taxes (net) | | | 10,584 | | | | 9,155 | | | | 8,425 | | | | 8,255 | | | | 8,063 | | | | 8,735 | | | | 8,722 | | | | 7,687 | |
| Deferred charges, advance payments and intangibles | | | 4,277 | | | | 3,693 | | | | 3,793 | | | | 4,148 | | | | 3,722 | | | | 3,893 | | | | 3,944 | | | | 2,278 | |
| Other assets | | | 164 | | | | 290 | | | | 221 | | | | 197 | | | | 190 | | | | 320 | | | | 305 | | | | 299 | |
| Discontinued operations | | | 0 | | | | 0 | | | | 0 | | | | 0 | | | | 0 | | | | 10,511 | | | | 10,702 | | | | 9,817 | |
| | | | | | | | | | | | | | | | | | | | | | | | | | | | | | | | | |
| Total assets | | | 750,337 | | | | 771,422 | | | | 837,799 | | | | 783,948 | | | | 739,175 | | | | 816,892 | | | | 765,631 | | | | 687,936 | |
| | 4Q.12 | Earnings Report | 26 |
| |
|
| | | |
| Grupo Financiero Santander México | | | | | | | | | | | | | | | | | | | |
| Consolidated Balance Sheet | | | | | | | | | | | | | | | | | | | |
| Millions of Mexican Pesos | | | | | | | | | | | | | | | | | | | |
| | | | | | | | | | | | 2012 | | | | | | | | | | | | 2011 | |
| | | Dec | | | Sep | | | Jun | | | Mar | | | Dec | | | Sep | | | Jun | | | Mar | |
| Liabilities | | | | | | | | | | | | | | | | | | | | | | | | |
| | | | | | | | | | | | | | | | | | | | | | | | | |
| Deposits | | | 397,546 | | | | 358,606 | | | | 352,753 | | | | 346,605 | | | | 330,870 | | | | 328,327 | | | | 316,729 | | | | 286,455 | |
| Demand deposits | | | 210,915 | | | | 194,351 | | | | 204,606 | | | | 187,787 | | | | 178,065 | | | | 166,923 | | | | 155,932 | | | | 151,450 | |
| Time deposits – General Public | | | 125,584 | | | | 120,034 | | | | 117,184 | | | | 122,816 | | | | 114,720 | | | | 122,130 | | | | 110,968 | | | | 106,774 | |
| Time deposits – Money market | | | 25,953 | | | | 21,904 | | | | 9,085 | | | | 14,507 | | | | 16,409 | | | | 18,823 | | | | 32,745 | | | | 11,405 | |
| | | | | | | | | | | | | | | | | | | | | | | | | | | | | | | | | |
| Credit instruments issued | | | 35,094 | | | | 22,317 | | | | 21,878 | | | | 21,495 | | | | 21,676 | | | | 20,451 | | | | 17,084 | | | | 16,826 | |
| | | | | | | | | | | | | | | | | | | | | | | | | | | | | | | | | |
| Bank and other loans | | | 27,463 | | | | 34,339 | | | | 24,804 | | | | 21,372 | | | | 19,554 | | | | 36,158 | | | | 23,627 | | | | 17,726 | |
| Demand loans | | | 8,240 | | | | 5,916 | | | | 6,851 | | | | 5,949 | | | | 2,371 | | | | 20,326 | | | | 10,293 | | | | 7,308 | |
| Short-term loans | | | 16,767 | | | | 26,092 | | | | 15,704 | | | | 13,278 | | | | 15,156 | | | | 13,772 | | | | 11,187 | | | | 8,310 | |
| Long-term loans | | | 2,456 | | | | 2,331 | | | | 2,249 | | | | 2,145 | | | | 2,027 | | | | 2,060 | | | | 2,147 | | | | 2,108 | |
| | | | | | | | | | | | | | | | | | | | | | | | | | | | | | | | | |
| Creditors under sale and repurchase agreements | | | 73,290 | | | | 106,306 | | | | 168,227 | | | | 189,299 | | | | 120,590 | | | | 157,221 | | | | 162,609 | | | | 129,442 | |
| | | | | | | | | | | | | | | | | | | | | | | | | | | | | | | | | |
| Collateral sold or pledged as guarantee | | | 6,853 | | | | 17,972 | | | | 18,766 | | | | 14,104 | | | | 15,478 | | | | 17,896 | | | | 15,820 | | | | 24,246 | |
| Securities loans | | | 6,853 | | | | 17,972 | | | | 18,766 | | | | 14,104 | | | | 15,478 | | | | 17,896 | | | | 15,820 | | | | 24,246 | |
| | | | | | | | | | | | | | | | | | | | | | | | | | | | | | | | | |
| Derivatives | | | 79,561 | | | | 86,613 | | | | 87,960 | | | | 70,292 | | | | 90,649 | | | | 114,399 | | | | 78,362 | | | | 65,948 | |
| Trading purposes | | | 77,939 | | | | 85,209 | | | | 86,233 | | | | 69,266 | | | | 88,148 | | | | 111,929 | | | | 78,198 | | | | 65,861 | |
| Hedging purposes | | | 1,622 | | | | 1,404 | | | | 1,727 | | | | 1,026 | | | | 2,501 | | | | 2,470 | | | | 164 | | | | 87 | |
| | | | | | | | | | | | | | | | | | | | | | | | | | | | | | | | | |
| Other payables | | | 66,756 | | | | 71,702 | | | | 88,648 | | | | 47,647 | | | | 72,493 | | | | 63,114 | | | | 72,706 | | | | 69,844 | |
| Income taxes payable | | | 503 | | | | 767 | | | | 335 | | | | 910 | | | | 507 | | | | 779 | | | | 928 | | | | 7 | |
| Employee profit sharing payable | | | 172 | | | | 117 | | | | 83 | | | | 62 | | | | 153 | | | | 6 | | | | 5 | | | | 40 | |
| Creditors from settlement of transactions | | | 38,604 | | | | 47,308 | | | | 52,492 | | | | 24,013 | | | | 28,579 | | | | 28,744 | | | | 47,883 | | | | 50,194 | |
| Sundry creditors and other payables | | | 27,477 | | | | 23,510 | | | | 35,738 | | | | 22,662 | | | | 43,254 | | | | 33,585 | | | | 23,890 | | | | 19,603 | |
| | | | | | | | | | | | | | | | | | | | | | | | | | | | | | | | | |
| Deferred revenues | | | 1,041 | | | | 1,091 | | | | 1,096 | | | | 1,385 | | | | 1,062 | | | | 1,135 | | | | 1,160 | | | | 1,534 | |
| | | | | | | | | | | | | | | | | | | | | | | | | | | | | | | | | |
| Discontinued operations | | | 0 | | | | 0 | | | | 0 | | | | 0 | | | | 0 | | | | 8,496 | | | | 8,872 | | | | 8,142 | |
| | | | | | | | | | | | | | | | | | | | | | | | | | | | | | | | | |
| Total liabilities | | | 652,510 | | | | 676,629 | | | | 742,254 | | | | 690,704 | | | | 650,696 | | | | 726,746 | | | | 679,885 | | | | 603,337 | |
| | | | | | | | | | | | | | | | | | | | | | | | | | | | | | | | | |
| Paid in capital | | | 47,776 | | | | 47,776 | | | | 48,195 | | | | 48,195 | | | | 48,195 | | | | 48,195 | | | | 48,195 | | | | 48,195 | |
| Capital stock | | | 36,357 | | | | 36,357 | | | | 36,357 | | | | 36,357 | | | | 36,357 | | | | 36,357 | | | | 36,357 | | | | 36,357 | |
| Share premium | | | 11,419 | | | | 11,419 | | | | 11,838 | | | | 11,838 | | | | 11,838 | | | | 11,838 | | | | 11,838 | | | | 11,838 | |
| | | | | | | | | | | | | | | | | | | | | | | | | | | | | | | | | |
| Other capital | | | 50,051 | | | | 47,017 | | | | 47,350 | | | | 45,049 | | | | 40,284 | | | | 41,951 | | | | 37,551 | | | | 36,404 | |
| Capital reserves | | | 349 | | | | 349 | | | | 349 | | | | 108 | | | | 108 | | | | 108 | | | | 108 | | | | 108 | |
| Retained earnings | | | 31,103 | | | | 31,038 | | | | 35,311 | | | | 38,541 | | | | 19,828 | | | | 28,633 | | | | 28,781 | | | | 31,276 | |
| Result from valuation of securities available for sale, net | | | 678 | | | | 727 | | | | 688 | | | | 442 | | | | 465 | | | | 917 | | | | 515 | | | | 314 | |
| Result from valuation of cash flow hedge instruments, net | | | 90 | | | | 382 | | | | 690 | | | | 932 | | | | 1,188 | | | | 1,340 | | | | 1,317 | | | | 1,242 | |
| Net income | | | 17,822 | | | | 14,512 | | | | 10,298 | | | | 5,013 | | | | 18,682 | | | | 10,941 | | | | 6,818 | | | | 3,452 | |
| Non-controlling interest | | | 9 | | | | 9 | | | | 14 | | | | 13 | | | | 13 | | | | 12 | | | | 12 | | | | 12 | |
| Total stockholders´equity | | | 97,827 | | | | 94,793 | | | | 95,545 | | | | 93,244 | | | | 88,479 | | | | 90,146 | | | | 85,746 | | | | 84,599 | |
| | | | | | | | | | | | | | | | | | | | | | | | | | | | | | | | | |
| Total liabilities and stockholders´ equity | | | 750,337 | | | | 771,422 | | | | 837,799 | | | | 783,948 | | | | 739,175 | | | | 816,892 | | | | 765,631 | | | | 687,936 | |
| | 4Q.12 | Earnings Report | 27 |
| |
|
| | | |
| Grupo Financiero Santander México | | | | | | | | | | | | | | | | | | | |
| Consolidated Balance Sheet | | | | | | | | | | | | | | | | | | | |
| Millions of Mexican Pesos | | | | | | | | | | | | | | | | | | | |
| | | | | | | | | | | | 2012 | | | | | | | | | | | | 2011 | |
| | | Dec | | | Sep | | | Jun | | | Mar | | | Dec | | | Sep | | | Jun | | | Mar | |
| Memorandum accounts | | | | | | | | | | | | | | | | | | | | | | | | |
| | | | | | | | | | | | | | | | | | | | | | | | | |
| FOR THIRD PARTIES | | | | | | | | | | | | | | | | | | | | | | | | |
| | | | | | | | | | | | | | | | | | | | | | | | | |
| Current client account | | | | | | | | | | | | | | | | | | | | | | | | |
| Client Banks | | | 74 | | | | 74 | | | | 261 | | | | 147 | | | | 87 | | | | 107 | | | | 78 | | | | 39 | |
| Liquidation of client transactions | | | 116 | | | | 350 | | | | (2,030 | ) | | | 35 | | | | 20 | | | | (265 | ) | | | (728 | ) | | | (798 | ) |
| | | | | | | | | | | | | | | | | | | | | | | | | | | | | | | | | |
| Custody services | | | | | | | | | | | | | | | | | | | | | | | | | | | | | | | | |
| Assets under custody | | | 317,118 | | | | 261,131 | | | | 198,793 | | | | 210,076 | | | | 181,374 | | | | 190,125 | | | | 188,854 | | | | 180,571 | |
| Dividends on behalf of clients | | | 1 | | | | 0 | | | | 0 | | | | 1 | | | | 0 | | | | 0 | | | | 0 | | | | 0 | |
| | | | | | | | | | | | | | | | | | | | | | | | | | | | | | | | | |
| Transactions on behalf of third parties | | | | | | | | | | | | | | | | | | | | | | | | | |
| Sale and repurchase agreements | | | 45,914 | | | | 44,469 | | | | 55,334 | | | | 65,577 | | | | 51,219 | | | | 53,598 | | | | 47,040 | | | | 36,213 | |
| Security loans on behalf of clients | | | 1,256 | | | | 1,457 | | | | 1,826 | | | | 2,182 | | | | 602 | | | | 495 | | | | 473 | | | | 398 | |
| Collaterals received as guarantee on behalf of clients | | | 29,504 | | | | 19,013 | | | | 15,690 | | | | 19,542 | | | | 21,191 | | | | 21,686 | | | | 4,848 | | | | 5,048 | |
| Acquisition of derivatives | | | 289,248 | | | | 294,269 | | | | 308,411 | | | | 308,379 | | | | 1,751,863 | | | | 1,965,352 | | | | 1,997,790 | | | | 2,027,256 | |
| Sale of derivatives | | | 570,945 | | | | 579,263 | | | | 603,162 | | | | 656,451 | | | | 2,028,099 | | | | 2,222,326 | | | | 2,357,339 | | | | 2,321,732 | |
| | | | | | | | | | | | | | | | | | | | | | | | | | | | | | | | | |
| Total on behalf of third parties | | | 1,254,176 | | | | 1,200,026 | | | | 1,181,447 | | | | 1,262,390 | | | | 4,034,455 | | | | 4,453,424 | | | | 4,595,694 | | | | 4,570,459 | |
| | | | | | | | | | | | | | | | | | | | | | | | | | | | | | | | | |
| Proprietary record accounts: | | | | | | | | | | | | | | | | | | | | | | | | | |
| | | | | | | | | | | | | | | | | | | | | | | | | | | | | | | | | |
| Contingent assets and liabilities | | | 33,236 | | | | 24,053 | | | | 31,852 | | | | 31,904 | | | | 32,133 | | | | 30,680 | | | | 41,446 | | | | 32,532 | |
| | | | | | | | | | | | | | | | | | | | | | | | | | | | | | | | | |
| Credit commitments | | | | | | | | | | | | | | | | | | | | | | | | | | | | | | | | |
| Trusts | | | 125,954 | | | | 106,006 | | | | 106,747 | | | | 155,407 | | | | 145,755 | | | | 142,515 | | | | 136,825 | | | | 129,442 | |
| Mandates | | | 1,580 | | | | 2,582 | | | | 1,548 | | | | 1,532 | | | | 1,556 | | | | 1,535 | | | | 1,510 | | | | 1,324 | |
| | | | | | | | | | | | | | | | | | | | | | | | | | | | | | | | | |
| Assets in custody or under administration | | | 3,561,696 | | | | 3,312,634 | | | | 3,062,735 | | | | 3,084,880 | | | | 2,935,454 | | | | 2,908,619 | | | | 2,837,534 | | | | 2,710,653 | |
| | | | | | | | | | | | | | | | | | | | | | | | | | | | | | | | | |
| Credit Commitments | | | 133,744 | | | | 160,790 | | | | 203,362 | | | | 157,565 | | | | 162,528 | | | | 273,286 | | | | 256,420 | | | | 234,036 | |
| | | | | | | | | | | | | | | | | | | | | | | | | | | | | | | | | |
| Collateral received | | | 71,296 | | | | 90,548 | | | | 52,244 | | | | 49,931 | | | | 39,015 | | | | 63,514 | | | | 53,891 | | | | 35,246 | |
| | | | | | | | | | | | | | | | | | | | | | | | | | | | | | | | | |
| Collateral received and sold or pledged as guarantee | | | 53,788 | | | | 66,877 | | | | 26,708 | | | | 29,027 | | | | 18,120 | | | | 20,208 | | | | 30,535 | | | | 3,555 | |
| | | | | | | | | | | | | | | | | | | | | | | | | | | | | | | | | |
| Uncollected interest earned on past due loan portfolio | | | 1,808 | | | | 794 | | | | 1,092 | | | | 985 | | | | 701 | | | | 1,553 | | | | 1,441 | | | | 728 | |
| | | | | | | | | | | | | | | | | | | | | | | | | | | | | | | | | |
| Other accounts | | | 501,538 | | | | 466,076 | | | | 455,197 | | | | 429,800 | | | | 428,757 | | | | 421,373 | | | | 375,879 | | | | 341,734 | |
| | | | | | | | | | | | | | | | | | | | | | | | | | | | | | | | | |
| Subtotal | | | 4,484,640 | | | | 4,230,360 | | | | 3,941,485 | | | | 3,941,031 | | | | 3,764,019 | | | | 3,863,283 | | | | 3,735,481 | | | | 3,489,250 | |
| | | | | | | | | | | | | | | | | | | | | | | | | | | | | | | | | |
| Total | | | 5,738,816 | | | | 5,430,386 | | | | 5,122,932 | | | | 5,203,421 | | | | 7,798,474 | | | | 8,316,707 | | | | 8,331,175 | | | | 8,059,709 | |
| | 4Q.12 | Earnings Report | 28 |
| |
|
| | | |
These consolidated financial statements were approved by the Board of directors and signed on its behalf by
| MARCOS A. MARTINEZ GAVICA | | PEDRO JOSE MORENO CANTALEJO |
| | | |
| Executive President and Chief Executive Officer | | Vice President of Administration and Finance |
| EMILIO DE EUSEBIO SAIZ | | JESÚS GONZÁLEZ DEL REAL | | JAVIER PLIEGO ALEGRÍA |
| | | | | |
| Deputy General Director of Intervention and Control Management | | Executive Vice President of Accounting | | Executive Director of Internal Audit |
The accompanying notes are part of these consolidated financial statements
www.santander.com.mx
| | 4Q.12 | Earnings Report | 29 |
| |
|
| | | |
| Grupo Financiero Santander México | | | | | | | | | | | | | | | | | | | | | | | |
| Consolidated Statement of Income | | | | | | | | | | | | | | | | | | | | | | | |
| Millions of Mexican Pesos | | | | | | | | | | | | | | | | | | | | | | | |
| | | | | | | | | | | | | | | 2012 | | | | | | | | | | | | | | | 2011 | |
| | | 2012 | | | | 4 | Q | | | 3 | Q | | | 2 | Q | | | 1 | Q | | | 2011 | | | | 4 | Q | | | 3 | Q | | | 2 | Q | | | 1 | Q |
| Interest income | | | 55,388 | | | | 14,259 | | | | 13,873 | | | | 13,830 | | | | 13,426 | | | | 46,680 | | | | 12,908 | | | | 12,221 | | | | 11,389 | | | | 10,162 | |
| Interest expense | | | (21,496 | ) | | | (5,448 | ) | | | (5,291 | ) | | | (5,436 | ) | | | (5,321 | ) | | | (17,874 | ) | | | (5,097 | ) | | | (4,750 | ) | | | (4,395 | ) | | | (3,632 | ) |
| Financial margin | | | 33,892 | | | | 8,811 | | | | 8,582 | | | | 8,394 | | | | 8,105 | | | | 28,806 | | | | 7,811 | | | | 7,471 | | | | 6,994 | | | | 6,530 | |
| | | | | | | | | | | | | | | | | | | | | | | | | | | | | | | | | | | | | | | | | |
| Allowance for loan losses | | | (9,445 | ) | | | (2,948 | ) | | | (2,535 | ) | | | (1,994 | ) | | | (1,968 | ) | | | (6,556 | ) | | | (2,041 | ) | | | (1,080 | ) | | | (1,963 | ) | | | (1,472 | ) |
| Financial margin after allowance for loan losses | | | 24,447 | | | | 5,863 | | | | 6,047 | | | | 6,400 | | | | 6,137 | | | | 22,250 | | | | 5,770 | | | | 6,391 | | | | 5,031 | | | | 5,058 | |
| | | | | | | | | | | | | | | | | | | | | | | | | | | | | | | | | | | | | | | | | |
| Commision and fee income | | | 14,773 | | | | 3,982 | | | | 3,783 | | | | 3,506 | | | | 3,502 | | | | 12,524 | | | | 3,121 | | | | 3,215 | | | | 3,021 | | | | 3,167 | |
| Commision and fee expense | | | (2,570 | ) | | | (643 | ) | | | (718 | ) | | | (670 | ) | | | (539 | ) | | | (2,292 | ) | | | (625 | ) | | | (535 | ) | | | (531 | ) | | | (601 | ) |
| Net gain /(loss) on financial assets and liabilities | | | 2,196 | | | | 416 | | | | 920 | | | | 106 | | | | 754 | | | | 888 | | | | (51 | ) | | | 29 | | | | 546 | | | | 364 | |
| Othe operating income / (loss) | | | 2,955 | | | | 192 | | | | 88 | | | | 2,005 | | | | 670 | | | | 1,067 | | | | 299 | | | | 266 | | | | 281 | | | | 221 | |
| Administrative and promotional expenses | | | (20,236 | ) | | | (6,022 | ) | | | (5,179 | ) | | | (4,559 | ) | | | (4,476 | ) | | | (18,111 | ) | | | (5,221 | ) | | | (4,630 | ) | | | (4,312 | ) | | | (3,948 | ) |
| Total operating income | | | 21,565 | | | | 3,788 | | | | 4,941 | | | | 6,788 | | | | 6,048 | | | | 16,326 | | | | 3,293 | | | | 4,736 | | | | 4,036 | | | | 4,261 | |
| | | | | | | | | | | | | | | | | | | | | | | | | | | | | | | | | | | | | | | | | |
| Equity in results of subsidiaries and associated companies | | | 73 | | | | 19 | | | | 18 | | | | 17 | | | | 19 | | | | 69 | | | | 17 | | | | 13 | | | | 18 | | | | 22 | |
| | | | | | | | | | | | | | | | | | | | | | | | | | | | | | | | | | | | | | | | | |
| Income from continuing operations before income taxes | | | 21,638 | | | | 3,807 | | | | 4,959 | | | | 6,805 | | | | 6,067 | | | | 16,395 | | | | 3,310 | | | | 4,749 | | | | 4,054 | | | | 4,283 | |
| | | | | | | | | | | | | | | | | | | | | | | | | | | | | | | | | | | | | | | | | |
| Current income taxes | | | (5,858 | ) | | | (1,680 | ) | | | (1,359 | ) | | | (1,695 | ) | | | (1,124 | ) | | | (4,268 | ) | | | 1,396 | | | | (603 | ) | | | (2,004 | ) | | | (3,058 | ) |
| Deferred income taxes | | | 2,043 | | | | 1,183 | | | | 614 | | | | 176 | | | | 70 | | | | 1,734 | | | | (1,315 | ) | | | (205 | ) | | | 1,156 | | | | 2,098 | |
| | | | | | | | | | | | | | | | | | | | | | | | | | | | | | | | | | | | | | | | | |
| Income from continuing operations | | | 17,823 | | | | 3,310 | | | | 4,214 | | | | 5,286 | | | | 5,013 | | | | 13,861 | | | | 3,391 | | | | 3,941 | | | | 3,206 | | | | 3,323 | |
| | | | | | | | | | | | | | | | | | | | | | | | | | | | | | | | | | | | | | | | | |
| Discontinued operations | | | 0 | | | | 0 | | | | 0 | | | | 0 | | | | 0 | | | | 4,822 | | | | 4,348 | | | | 184 | | | | 161 | | | | 129 | |
| | | | | | | | | | | | | | | | | | | | | | | | | | | | | | | | | | | | | | | | | |
| Consolidated net income | | | 17,823 | | | | 3,310 | | | | 4,214 | | | | 5,286 | | | | 5,013 | | | | 18,683 | | | | 7,739 | | | | 4,125 | | | | 3,367 | | | | 3,452 | |
| | | | | | | | | | | | | | | | | | | | | | | | | | | | | | | | | | | | | | | | | |
| Non-controlling interest | | | (1 | ) | | | 0 | | | | 0 | | | | (1 | ) | | | 0 | | | | (1 | ) | | | 2 | | | | (2 | ) | | | (1 | ) | | | 0 | |
| | | | | | | | | | | | | | | | | | | | | | | | | | | | | | | | | | | | | | | | | |
| Net income | | | 17,822 | | | | 3,310 | | | | 4,214 | | | | 5,285 | | | | 5,013 | | | | 18,682 | | | | 7,741 | | | | 4,123 | | | | 3,366 | | | | 3,452 | |
These consolidated financial statements were approved by the Board of directors and signed on its behalf by
| MARCOS A. MARTINEZ GAVICA | | PEDRO JOSE MORENO CANTALEJO |
| | | |
| Executive President and Chief Executive Officer | | Vice President of Administration and Finance |
| EMILIO DE EUSEBIO SAIZ | | JESÚS GONZÁLEZ DEL REAL | | JAVIER PLIEGO ALEGRÍA |
| | | | | |
| Deputy General Director of Intervention and Control Management | | Executive Vice President of Accounting | | Executive Director of Internal Audit |
The accompanying notes are part of these consolidated financial statements
www.santander.com.mx
| | 4Q.12 | Earnings Report | 30 |
| |
|
| | | |
| Grupo Financiero Santander México | | | | | | | | | | | | | | | | | | | |
| Consolidated Statements of Changes in Stockholders’ Equity | | | | | | | | | | | | |
| From January 1st to December 31, 2012 | | | | | | | | | | | | | | | | |
| Millions of Mexican Pesos | | | | | | | | | | | | | | | | | | | |
| | | Paid-in Capital | | | Other Capital | | | | | | | |
| | | Capital Stock | | | Additional Paid-In Capital | | | Capital Reserves | | | Retained Earnings | | | Surplus (deficit) from valuation of securities available for sale | | | Surplus (Deficit) from the valuation of cash flow hedge securities | | | Net income (loss) | | | Minority Interest | | | Total stockholders' equity | |
| | | | | | | | | | | | | | | | | | | | | | | | | | | | |
| BALANCE AS OF DECEMBER 31, 2011 | | | 36,357 | | | | 11,838 | | | | 108 | | | | 19,828 | | | | 465 | | | | 1,188 | | | | 18,682 | | | | 13 | | | | 88,479 | |
| MOVEMENTS INHERENT TO THE SHAREHOLDERS' DECISIONS | | | | | | | | | | | | | | | | | | | | | | | | | | | | | | | | | | | | |
| Transfer of Net income (loss) to Retained Earnings | | | | | | | | | | | 241 | | | | 18,441 | | | | | | | | | | | | (18,682 | ) | | | | | | | 0 | |
| Payment of Dividends | | | | | | | | | | | | | | | (7,300 | ) | | | | | | | | | | | | | | | | | | | (7,300 | ) |
| TOTAL | | | 0 | | | | 0 | | | | 241 | | | | 11,141 | | | | 0 | | | | 0 | | | | (18,682 | ) | | | 0 | | | | (7,300 | ) |
| MOVEMENTS INHERENT TO THE RECOGNITION OF THE COMPREHENSIVE INCOME | | | | | | | | | | | | | | | | | | | | | | | | | | | | | | | | | | | | |
| Surplus (deficit) from valuation of securities available for sale | | | | | | | | | | | | | | | | | | | 213 | | | | | | | | | | | | | | | | 213 | |
| Surplus (deficit) from valuation of cash flow hedge securities | | | | | | | | | | | | | | | | | | | | | | | (1,098 | ) | | | | | | | | | | | (1,098 | ) |
| Repurchase of own shares | | | | | | | (419 | ) | | | | | | | | | | | | | | | | | | | | | | | | | | | (419 | ) |
| Recognition of share-based payments | | | | | | | 35 | | | | | | | | | | | | | | | | | | | | | | | | | | | | 35 | |
| Recoveries on loan reserves previously applied to prior year results | | | | | | | | | | | | | | | 61 | | | | | | | | | | | | | | | | | | | | 61 | |
| Equity effect of investment in subsidiaries and associated companies | | | | | | | | | | | | | | | 38 | | | | | | | | | | | | | | | | | | | | 38 | |
| Net Income (Loss) | | | | | | | | | | | | | | | | | | | | | | | | | | | 17,822 | | | | | | | | 17,822 | |
| Minority Interest | | | | | | | | | | | | | | | | | | | | | | | | | | | | | | | (4 | ) | | | (4 | ) |
| | | | | | | | | | | | | | | | | | | | | | | | | | | | | | | | | | | | | |
| TOTAL | | | 0 | | | | (384 | ) | | | 0 | | | | 99 | | | | 213 | | | | (1,098 | ) | | | 17,822 | | | | (4 | ) | | | 16,648 | |
| | | | | | | | | | | | | | | | | | | | | | | | | | | | | | | | | | | | | |
| BALANCE AS OF DECEMBER 31, 2012 | | | 36,357 | | | | 11,454 | | | | 349 | | | | 31,068 | | | | 678 | | | | 90 | | | | 17,822 | | | | 9 | | | | 97,827 | |
| | 4Q.12 | Earnings Report | 31 |
| |
|
| | | |
These consolidated financial statements were approved by the Board of directors and signed on its behalf by
| MARCOS A. MARTINEZ GAVICA | | PEDRO JOSE MORENO CANTALEJO |
| | | |
| Executive President and Chief Executive Officer | | Vice President of Administration and Finance |
| EMILIO DE EUSEBIO SAIZ | | JESÚS GONZÁLEZ DEL REAL | | JAVIER PLIEGO ALEGRÍA |
| | | | | |
| Deputy General Director of Intervention and Control Management | | Executive Vice President of Accounting | | Executive Director of Internal Audit |
The accompanying notes are part of these consolidated financial statements
www.santander.com.mx
| | 4Q.12 | Earnings Report | 32 |
| |
|
| | | |
| Grupo Financiero Santander | | | | | | |
| Consolidated Statement of Cash Flows | | | | | | |
| From January 1st to December 31, 2012 | | | | | | |
| Millions of Mexican Pesos | | | | | | |
| | | | | | | |
| OPERATING ACTIVITIES | | | | | | |
| Net Result | | | | | | 17,822 | |
| Adjustments due to items not requiring resources | | | | | | | |
| Result from valuation related to investment or financing activities | | | (192 | ) | | | | |
| Equity in results of subsidiaries and associated companies | | | (73 | ) | | | | |
| Depreciation of properties, furniture and equipment | | | 630 | | | | | |
| Amortization of intangible assets | | | 923 | | | | | |
| Provision for impairment in foreclosed assets | | | 44 | | | | | |
| Share-based payments liquidated with equity instruments | | | 35 | | | | | |
| Income tax, current and deferred | | | 3,815 | | | | 5,182 | |
| | | | | | | | 23,004 | |
| | | | | | | | | |
| CHANGES IN OPERATING ACCOUNTS | | | | | | | | |
| Change in margin accounts | | | | | | | 4,281 | |
| Change in Securities | | | | | | | 52,935 | |
| Changes in Debit balances under repurchase and resale agreements (Reporto) | | | | | | | (5,994 | ) |
| Changes in Derivatives (Asset) | | | | | | | 3,701 | |
| Changes in Loans portfolio | | | | | | | (36,622 | ) |
| Changes in Foreclosed assets | | | | | | | 59 | |
| Changes in Other operating assets | | | | | | | (17,063 | ) |
| Changes in Savings | | | | | | | 66,677 | |
| Changes in Interbank loans and from other entities | | | | | | | 7,909 | |
| Changes in Credit balances under repurchase and sale agreements (Reporto) | | | | | | | (47,299 | ) |
| Changes in sold or pledged guarantees | | | | | | | (8,625 | ) |
| Changes in Derivatives (Liabilities)) | | | | | | | (11,088 | ) |
| Changes in other operating liabilities | | | | | | | 7,526 | |
| Income tax payments | | | | | | | (5,076 | ) |
| | | | | | | | | |
| Net resources generated by operating activities | | | | | | | 34,325 | |
| | | | | | | | | |
| INVESTING ACTIVITIES | | | | | | | | |
| Sale of Properties, furniture and equipment | | | | | | | 2,950 | |
| Purchases of properties, furniture and equipment | | | | | | | (674 | ) |
| Collections for disposal of subsidiaries and associated companies | | | | | | | 3 | |
| Investments in subsidiaries and associated companies | | | | | | | (9 | ) |
| Collection of cash dividends | | | | | | | 77 | |
| Purchases of intangible assets | | | | | | | (1,123 | ) |
| | | | | | | | | |
| Net resources generated by investing activities | | | | | | | 1,224 | |
| | | | | | | | | |
| FINANCING ACTIVITIES | | | | | | | | |
| | | | | | | | | |
| Payments derived from repurchase of own shares | | | | | | | (419 | ) |
| Payment of dividends | | | | | | | (18,650 | ) |
| Recoveries of reserves applied to results from previous years | | | | | | | 61 | |
| | | | | | | | | |
| Net resources generated by financing activities | | | | | | | (19,008 | ) |
| | | | | | | | | |
| Net decrease in funds available | | | | | | | 16,541 | |
| | | | | | | | | |
| Adjustments to cash flow due to exchange variations and inflation | | | | | | | (1,513 | ) |
| | | | | | | | | |
| Funds available at beginning of year | | | | | | | 66,598 | |
| | | | | | | | | |
| Funds available at the end of the year | | | | | | | 81,626 | |
| | 4Q.12 | Earnings Report | 33 |
| |
|
| | | |
These consolidated financial statements were approved by the Board of directors and signed on its behalf by
| MARCOS A. MARTINEZ GAVICA | | PEDRO JOSE MORENO CANTALEJO |
| Executive President and Chief Executive Officer | | Vice President of Administration and Finance |
| EMILIO DE EUSEBIO SAIZ | | JESÚS GONZÁLEZ DEL REAL | | JAVIER PLIEGO ALEGRÍA |
| Deputy General Director of Intervention and Control Management | | Executive Vice President of Accounting | | Executive Director of Internal Audit |
The accompanying notes are part of these consolidated financial statements
www.santander.com.mx
| | 4Q.12 | Earnings Report | 34 |
| |
|
| | | |
NOTES TO CONSOLIDATED FINANCIAL STATEMENTS OF GRUPO FINANCIERO SANTANDER MÉXICO
| § | Significant accounting policies |
| § | Balance Sheet and Income Statement by segment |
| § | Annex 1. Loan portafolio rating |
| § | Annex 2. Financial Ratios |
| § | Notes to Consolidated Financial Statements |
The information contained in this report and the financial statements of the Group’s subsidiaries may be consulted on the Internet website: www.santander.com.mx or through the following direct access:
http://www.santander.com.mx/ir/inf_financiera/inf_trimestral.html
There is also information on Santander on the CNBV Website: www.cnbv.gob.mx
| | 4Q.12 | Earnings Report | 35 |
| |
|
| | | |
Significant accounting policies
The significant accounting policies applied by the Financial Group are in conformity with the accounting criteria established by the Commission in the General Provisions Applicable to Financial Groups, Credit Institutions, Brokerage Houses and Regulated Multiple Purpose Financing Entities (the “Provisions”), in its circulars and in general and specific official mandates, which require that management make certain estimates and utilize certain assumptions to determine the valuation of items included in the consolidated financial statements and to make required disclosures. Although the actual results may differ, management believes that the estimates and assumptions utilized were appropriate under the circumstances.
Based on accounting criterion A-1 of the Commission, the accounting of the Financial Group/Bank shall be in conformity with Mexican Financial Reporting Standards (MFRS or NIF) as promulgated by the Mexican Board of Financial Reporting Standards (CINIF), except when the Commission believes that a specific regulation or accounting treatment should be applied on the basis that the institutions subject to its rules carry out specialized transactions.
Changes in accounting policies
Changes in the Accounting Criteria of the Commission
Changes that occurred during 2012
During July 2012, the Federal Official Gazette published certain modifications to the accounting criteria for Credit Institutions modifying the accounting criteria relating to trusts and consolidation of special purpose entities (SPE), which define specific rules regarding the recognition, measurement, presentation and disclosure in the financial statements of trusts and special purpose entities of these institutions, thereby allowing to have transparent and comparable financial information with other countries.
The changes are as follows:
| Ø | The valuation of the trust patrimony recognized in memorandum accounts shall be effected in accordance with the accounting criteria for credit institutions, except in the case of patrimony of trusts who apply and, where appropriate, obtain and retain registration their securities in the National Securities Registry, in which case, such patrimony shall be valued based on the accounting standards established for such purposes by the Commission applicable to securities issuers and other market participants (International Financial Reporting Standards). |
| Ø | Elimination of accounting treatment of an unconsolidated SPE. |
| Ø | Clarification that the financial statements of the consolidated SPE should be prepared based on the same accounting criteria and, for transactions of the same nature, the same accounting policies of the consolidated entity should be used. |
| Ø | When the SPE use criteria or policies other than those applicable to the consolidated entity, the financial statements of the SPE that are used to carry out the consolidation should be modified to be consistent with those of the entity that consolidates the SPE. |
Changes that occurred during 2011
During 2011, the Federal Official Gazette published certain modifications to the accounting criteria for Financial Groups, Credit Institutions, Brokerage Houses and Regulated Multiple Purpose Financing Entities.
The purpose of these changes is to achieve consistency with International Financial Reporting Standards (IFRS), and to provide more complete financial information with improved disclosures. Such changes principally affected investments in securities, derivatives and hedging operations, the credit portfolio, and the presentation of the basic financial statements.
| | 4Q.12 | Earnings Report | 36 |
| |
|
| | | |
The most significant effects of these changes are as follows:
| Ø | The presentation of the income statement is comprehensively restructured for purposes of compliance with MFRS. The headings of "Other products" and "Other expenses" are eliminated and the items which comprise these headings are now presented within the heading of "Other operating income”. |
| Ø | The accounting standard related to the treatment of collateral in derivatives transactions in unrecognized markets (over-the-counter) is clarified. They will be accounted for separately from the margin accounts, and will be recorded in an account receivable or payable, as the case may be. |
| Ø | The valuation of implicit derivatives denominated in foreign currency contained in contracts is not established, when such contracts require payments in a currency that is commonly used to purchase or sell non-financial items in the economic environment in which the transaction is performed (for example, a stable and liquid currency which is commonly used in local transactions or in foreign trade transactions). |
| Ø | In the case of segregable hybrid financial instruments, the host contract and the embedded derivative will be presented separately. Previously, it was established that both should be presented together. Now the embedded derivative should be presented under the heading of "Derivatives". |
| Ø | In convergence with the MFRS, the requirement to incorporate the provision for loan losses in earnings as part of the cash flow statement is eliminated. |
| Ø | Accounting Treatment A-2 of the General provisions applicable to financial groups eliminates the disposal for insurance entities and guarantees that they were not required to consolidate. |
| Ø | Accounting Treatment B-6 “Credit portfolio” of the General provisions applicable to credit institutions, is amended mainly to establish the following: |
| o | The treatment for the restructuring and renewal to consolidate several loans into one single loan accredited to the total balance of the debt resulting from the restructuring and renewal will be given for the worse off treatment of loans involved in the same. |
| o | The demonstration of the existence of sustained payments to stop considering a loan restructured or renewed as expired, which should be followed to consider that there is sustained payment by the borrower and must be available for the Commission. |
| o | Regarding to date lines for a credit to be transferred to nonperforming loans, is indicated that monthly periods can be used, regardless of the number of days in each calendar month in accordance with the following equivalences: |
| 30 days | One month |
| 60 days | Two months |
| 90 days | Three months |
| o | Performing loans or other than with single payment of principal and interest periodical payments, either restructured or renewed, without having passed at least 80% of the original loan term will be deemed to remain in force, credited only when any a) covered all of the accrued interest, and b) covered the main original loan amount, which at the date of the renewal or restructuring should have been covered. |
| o | If any of the described conditions in the preceding paragraph not met, the credits will be considered as overdue from the time of restructure or renew, even while there is no evidence of sustained payment |
| o | Performing loans distinct than those who are single payment of principal and periodical interest payments, either restructured or renewed during the course of the final 20% of the original loan term will be considered valid only when credited to any a) paid all accrued interest, b) covered the entire original loan amount at the date of the renewal or restructuring should have been covered, and c) covered 60% of the original loan amount. |
If any of the described conditions in the preceding paragraph not met, the credits will be considered as overdue from the time of restructure or renew, even while there is no evidence of sustained payment
| o | In the case of loan repayments regarding on the borrower's payment performance without delay (sustained Pay credit), has to be covered at least 20% of the principal or the total amount of any interest payments under the restructuring or renewal scheme. |
| | 4Q.12 | Earnings Report | 37 |
| |
|
| | | |
| o | Loans with a single payment of principal and periodical interest payments, which are restructured during the term of the loan or renewed at any time, would be considered as overdue as there is no evidence of sustained payment. |
| o | The credits that its revolving nature is stipulated from the start , either restructured or renewed at any time shall be deemed effective, only when the borrower have liquidated all of the interest earned, the credit is not due billing periods, and count with elements indicating the debtor's ability to pay, the debtor has a high probability of covering such payment. |
| o | On the cancellation date of a credit line, the unamortized balance for commissions collected on the credit lines, which are canceled before the end of the 12 month period will be recognized directly in results of the year under the heading of "Commissions and fee income”. |
| o | The incorporation of the commissions for credit restructurings as commissions for the initial granting of the credit, which may be deferred during the new term of the restructured credit. |
| o | The income fees for an initial credit must be submitted to a net of costs and expenses associated with performing in the headings of "Other assets", or "Deferred charges, advance payments and intangibles", as appropriate debit or credit nature. Similarly, with the same layout, you must show the income fees charged by way of annuity credit card so net costs and associated expenses. |
| o | Any deferred charge which was generated on the acquisition of portfolio should be presented under the heading of "Other assets" and, furthermore, the purchase option at the reduced price should be presented under the heading of "Deferred revenues and other advances", together with any excess originated on the portfolio acquisitions. |
Changes in NIF´s issued by the CINIF
Applicable for 2012
NIF C-6, Property, plant and equipment.- Establishes the obligation to depreciate components which are representative of an item of property, plant and equipment, apart from depreciating the rest of the item as if it were a single component.
Improvements to the NIF 2012.-The principal improvements which generate accounting changes are as follows:
Bulletin B-14, Income per share.-Establishes that the diluted income per share should be calculated and disclosed when the result from continued operations is a loss, regardless of whether a net profit is presented.
Bulletin C-11, Stockholders' equity.- Eliminates the rule of recording the donations received by an entity as part of contributed stockholders' equity, and they should now be recorded as revenue in the income statement.
Bulletin C-15, Impairment in the value of long-lived assets and their disposal.-Eliminates: a) the restriction that an asset should not be in use in order to be classified as intended for sale and b) the reversal of losses from impairment of goodwill. It also establishes that losses from impairment in the value of long-lived assets should be presented in the income statement under the respective line items of costs and expenses, not as other revenues and expenses or as a special item.
NIF D-4, Income Taxes. - An adjustment is made to the definition of deductible temporary differences and the definition of cumulative temporary difference.
Changes in accounting estimates applicable in 2011
On October 25, 2010 and on October 5, 2011, the Commission issued rulings which modified the "General Provisions Applicable to Credit Institutions", whereby the methodologies applicable to the classification of nonrevolving consumer credit portfolio and the housing mortgage credit portfolio, as well as the classification of loans owed by States and Municipalities, in order to change the current model of creating allowances for loan losses based on the incurred loss model to an expected loss model. Such modifications went into effect on March 1 and September 1, 2011, respectively.
| | 4Q.12 | Earnings Report | 38 |
| |
|
| | | |
| Grupo Financiero Santander México | | | | | | | | | | |
| Earnings per ordinary share and Earnings per diluted share | | | | | | | | | | |
| (Millions of pesos, except shares and earnings per share) | | | | | | | | | | |
| | | | | | | | | | | | | | | | | | | | | | | | | | | | |
| | | DECEMBER 2012 | | | DECEMBER 2011 | | | DECEMBER 2010 | |
| | | | | | | | | | | | | | | | | | | | | | | | | | | | |
| | | | | | Shares | | | Earnings | | | | | | Shares | | | Earnings | | | | | | Shares | | | Earnings | |
| | | Earnings | | | -weighted- | | | per share | | | Earnings | | | - weighted - | | | per share | | | Earnings | | | - weighted - | | | per share | |
| | | | | | | | | | | | | | | | | | | | | | | | | | | | |
| | | | | | | | | | | | | | | | | | | | | | | | | | | | |
| Earnings per share | | | 17,822 | | | | 6,786,394,913 | | | | 2.63 | | | | 18,682 | | | | 6,786,394,913 | | | | 2.75 | | | | 13,850 | | | | 6,786,394,913 | | | | 2.04 | |
| |
| | | | | | | | | | | | | | | | | | | | | | | | | | | | | | | | | | | | | |
| Treasury stock | | | | | | | (3,588,407 | ) | | | | | | | | | | | | | | | | | | | | | | | | | | | | |
| | | | | | | | | | | | | | | | | | | | | | | | | | | | | | | | | | | | | |
| Diluited earnings per share | | | 17,822 | | | | 6,782,806,506 | | | | 2.63 | | | | 18,682 | | | | 6,786,394,913 | | | | 2.75 | | | | 13,850 | | | | 6,786,394,913 | | | | 2.04 | |
| | | | | | | | | | | | | | | | | | | | | | | | | | | | | | | | | | | | | |
| Plus (loss) less (profit): | | | | | | | | | | | | | | | | | | | | | | | | | | | | | | | | | | | | |
| | | | | | | | | | | | | | | | | | | | | | | | | | | | | | | | | | | | | |
| Discontinued operations, extraordinary items and changes in accounting policies | | | | | | | | | | | | | | | (4,822 | ) | | | | | | | | | | | (834 | ) | | | | | | | | |
| Continued fully diluted earnings per share | | | 17,822 | | | | 6,782,806,506 | | | | 2.63 | | | | 13,860 | | | | 6,786,394,913 | | | | 2.04 | | | | 13,016 | | | | 6,786,394,913 | | | | 1.92 | |
| | 4Q.12 | Earnings Report | 39 |
| |
|
| | | |
| Grupo Financiero Santander México | | | | | | | | | | | | | | | | |
| Consolidated Balance Sheet by Segment | | | | | | | | | | | | | |
| Millions of Mexican Pesos | | | | | | | | | | | | | | | | | | |
| | | As of December 31, 2012 | | | As of December 31, 2011 | |
| | | Retail Banking 1/ | | | Wholesale Banking 2/ | | | Corporate Activities | | | Retail Banking 1/ | | | Wholesale Banking 2/ | | | Corporate Activities | |
| Assets | | | | | | | | | | | | | | | | | | |
| Funds Available | | | 41,915 | | | | 25,764 | | | | 13,947 | | | | 35,522 | | | | 28,218 | | | | 2,859 | |
| Margin Accounts | | | 0 | | | | 3,995 | | | | 0 | | | | 0 | | | | 8,276 | | | | 0 | |
| Investment in Securities | | | 147 | | | | 117,025 | | | | 52,473 | | | | 89 | | | | 155,123 | | | | 67,063 | |
| Debit balances under repurchase and resale agreements | | | 0 | | | | 9,471 | | | | 0 | | | | 0 | | | | 3,478 | | | | 0 | |
| Derivatives | | | 0 | | | | 80,321 | | | | 300 | | | | 0 | | | | 85,081 | | | | 897 | |
| Valuation adjustments for hedging financial assets | | | 0 | | | | 0 | | | | 210 | | | | 0 | | | | 0 | | | | 122 | |
| Total loans portfolio | | | 254,972 | | | | 94,091 | | | | 1,620 | | | | 209,307 | | | | 101,596 | | | | 2,770 | |
| Allowance for loan losses | | | (11,019 | ) | | | (473 | ) | | | (88 | ) | | | (10,403 | ) | | | (350 | ) | | | (437 | ) |
| Loan Portfolio (Net) | | | 243,953 | | | | 93,618 | | | | 1,532 | | | | 198,904 | | | | 101,245 | | | | 2,332 | |
| Other Account Receivables (Net) | | | 2,001 | | | | 36,116 | | | | 8,043 | | | | 1,145 | | | | 23,828 | | | | 6,939 | |
| Foreclosed assets (Net) | | | 14 | | | | 1 | | | | 135 | | | | 22 | | | | 1 | | | | 228 | |
| Properties, furniture and equipment (Net) | | | 3,460 | | | | 583 | | | | 51 | | | | 4,730 | | | | 793 | | | | 69 | |
| Long-term investments in shares | | | 0 | | | | 0 | | | | 236 | | | | 0 | | | | 0 | | | | 234 | |
| Non-current assets held for sale | | | 0 | | | | 0 | | | | 0 | | | | 0 | | | | 0 | | | | 0 | |
| Deferred taxes and profit sharing | | | 0 | | | | 0 | | | | 10,584 | | | | 0 | | | | 0 | | | | 8,063 | |
| Other assets | | | 1,706 | | | | 670 | | | | 2,064 | | | | 1,485 | | | | 595 | | | | 1,831 | |
| Total assets | | | 293,197 | | | | 367,565 | | | | 89,576 | | | | 241,897 | | | | 406,637 | | | | 90,639 | |
| | | | | | | | | | | | | | | | | | | | | | | | | |
| Liabilities | | | | | | | | | | | | | | | | | | | | | | | | |
| Savings | | | 282,278 | | | | 58,210 | | | | 21,964 | | | | 249,259 | | | | 53,514 | | | | 6,420 | |
| Bank bonds | | | 0 | | | | 1,541 | | | | 33,552 | | | | 0 | | | | 1,366 | | | | 20,309 | |
| Bank and other loans | | | 13,791 | | | | 205 | | | | 13,467 | | | | 7,980 | | | | 301 | | | | 11,272 | |
| Credit balances under repurchase and resale agreements | | | 10,659 | | | | 54,832 | | | | 7,799 | | | | 9,238 | | | | 95,349 | | | | 16,003 | |
| Guarantees sold or pledged | | | 0 | | | | 6,853 | | | | 0 | | | | 0 | | | | 15,478 | | | | 0 | |
| Derivatives | | | 0 | | | | 77,939 | | | | 1,622 | | | | 0 | | | | 88,148 | | | | 2,501 | |
| Other accounts payable | | | 22,114 | | | | 44,045 | | | | 597 | | | | 29,252 | | | | 42,589 | | | | 652 | |
| Deferred credits and advanced collections | | | 1,041 | | | | 0 | | | | 0 | | | | 1,061 | | | | 0 | | | | 0 | |
| Discontinued operations | | | 0 | | | | 0 | | | | 0 | | | | 0 | | | | 0 | | | | 0 | |
| Total Liabilities | | | 329,883 | | | | 243,624 | | | | 79,003 | | | | 296,790 | | | | 296,745 | | | | 57,158 | |
| Total Stockholders' Equity | | | 35,357 | | | | 13,365 | | | | 49,105 | | | | 29,289 | | | | 12,695 | | | | 46,495 | |
| Total Liabilities and Stockholders' Equity | | | 365,240 | | | | 256,989 | | | | 128,108 | | | | 326,079 | | | | 309,441 | | | | 103,654 | |
| | 4Q.12 | Earnings Report | 40 |
| |
|
| | | |
| Grupo Financiero Santander México | | | | | | | | | | |
| Income Statement by Segment | | | | | | | | | | |
| Millions of Mexican Pesos | | | | | | | | | | | | | |
| | | As of December 31, 2012 | | | As of December 31, 2011 | |
| | | Retail Banking 1/ | | | Global Wholesale Banking 2/ | | | Corporate Activities | | | Retail Banking 1/ | | | Global Wholesale Banking 2/ | | | Corporate Activities | |
| | | | | | | | | | | | | | | | | | | |
| Net interest income before provisions | | | 26,535 | | | | 3,825 | | | | 3,532 | | | | 21,239 | | | | 3,702 | | | | 3,865 | |
| Provisions for loan losses, net | | | (9,212 | ) | | | (163 | ) | | | (70 | ) | | | (6,106 | ) | | | (67 | ) | | | (382 | ) |
| Net interest income after provisions | | | 17,323 | | | | 3,662 | | | | 3,462 | | | | 15,133 | | | | 3,634 | | | | 3,483 | |
| Commissions, net | | | 10,578 | | | | 1,707 | | | | (81 | ) | | | 8,929 | | | | 1,470 | | | | (167 | ) |
| Intermediation result | | | 638 | | | | 1,614 | | | | (56 | ) | | | 898 | | | | (118 | ) | | | 108 | |
| Other operating income (expenses) | | | 1,598 | | | | 2 | | | | 1,355 | | | | 885 | | | | (0 | ) | | | 182 | |
| Administrative and promotion expenses | | | (18,237 | ) | | | (2,007 | ) | | | 8 | | | | (15,751 | ) | | | (2,053 | ) | | | (306 | ) |
| Operating Income | | | 11,900 | | | | 4,977 | | | | 4,689 | | | | 10,094 | | | | 2,933 | | | | 3,299 | |
| Equity in results of non-consolidated subsidiaries and associated companies | | | 0 | | | | 1 | | | | 72 | | | | 0 | | | | 0 | | | | 70 | |
| Income before income taxes | | | 11,900 | | | | 4,978 | | | | 4,761 | | | | 10,094 | | | | 2,933 | | | | 3,369 | |
Segment information has been prepared according to the classifications used in Grupo Santander at secondary level, based in the type of developed business:
Commercial Banking
It includes all the businesses pertaining to customer banking, under the following segments: Individual, Small and Medium-sized Enterprises (Pymes) Institutions, Local Corporate Banking (large enterprises), as well as the contributions of Mutual Funds businesses (after transfer of commissions to distributors).
Global Wholesale Banking
This area reflects the earnings from Global Corporate Banking, Investment Banking and Treasury.
Corporate Activities
It includes non-commercial assets and liabilities, the result from hedging positions, insurance business (net of commissions paid to Commercial Bank) and others. Even though Corporate Banking, by definition, belongs to Commercial Banking, it is separated herein in order to reflect the results from corporate customers.
| | 4Q.12 | Earnings Report | 41 |
| |
|
| | | |
| Annex 1 | |
| Loan Portfolio Rating | |
| | | | | | | | | | | | | | | | |
| Grupo Financiero Santander México | | | | | | | | | | |
| As of December 31, 2012 | | | | | | | | | | | | | |
| Millions of Mexican Pesos | | | | | | | | | | | | | |
| | | | | | | | | | | | | | | | |
| | | | | | Allowance for loan losses | |
| Category | | Loan Portfolio | | | Commercial | | | Consumer | | | Mortages | | | Total | |
| | | | | | | | | | | | | | | | |
| Risk "A" | | | 86,321 | | | | - | | | | 1,536 | | | | 154 | | | | 1,690 | |
| Risk "A-1" | | | 200,343 | | | | 939 | | | | - | | | | - | | | | 939 | |
| Risk "A-2" | | | 19,690 | | | | 191 | | | | - | | | | - | | | | 191 | |
| Risk "B" | | | 11,983 | | | | - | | | | 467 | | | | 314 | | | | 781 | |
| Risk "B-1" | | | 18,484 | | | | 337 | | | | 361 | | | | - | | | | 699 | |
| Risk "B-2" | | | 22,996 | | | | 200 | | | | 1,685 | | | | - | | | | 1,885 | |
| Risk "B-3" | | | 3,735 | | | | 441 | | | | - | | | | - | | | | 441 | |
| Risk "C" | | | 5,328 | | | | - | | | | 1,618 | | | | 212 | | | | 1,831 | |
| Risk "C-1" | | | 197 | | | | 47 | | | | - | | | | - | | | | 47 | |
| Risk "C-2" | | | 299 | | | | 122 | | | | - | | | | - | | | | 122 | |
| Risk "D" | | | 2,889 | | | | 349 | | | | 1,628 | | | | 41 | | | | 2,018 | |
| Risk "E" | | | 755 | | | | 532 | | | | 273 | | | | 17 | | | | 822 | |
| Total rated portafolio | | | 373,017 | | | | 3,159 | | | | 7,568 | | | | 739 | | | | 11,465 | |
| | | | | | | | | | | | | | | | | | | | | |
| Exceptions | | | 4,672 | | | | | | | | | | | | | | | | | |
| | | | | | | | | | | | | | | | | | | | | |
| Total | | | 377,689 | | | | 3,159 | | | | 7,568 | | | | 739 | | | | 11,465 | |
| | | | | | | | | | | | | | | | | | | | | |
| Provisions created | | | | | | | | | | | | | | | | | | | 11,580 | |
| Complementary provisions | | | | | | | | | | | | | | | | 115 | |
| Notes: | |
| 1. | The figures used for grading and the creation of provisions correspond to the ones as of the last day of the month of the balance sheet as of December 31, 2012. |
| | |
| 2. | Loan Portfolio is graded according to the rules for loan portfolio rating issued by the Mexican Treasury Department (Secretaría de Hacienda y Crédito Público (SHCP)) and the methodology established by CNBV. In the case of commercial and mortgages portfolio, such rating may be performed following internal methodologies authorized by CNBV. The institution utilizes a proprietary methodology from June 2009, for a portion of the commercial portfolio, i.e. the companies segment, and the standard methodology of CNBV for the rest of the portfolio. On July 31, 2009, the Bank implemented new rules for grading revolving consumer credit to be applied from August, 2009, as it is explained in Annex 31. From March 2011, the Bank implemented new rules for grading non-revolving consumer credits and mortgages. From September, 2011, the bank implemented new rules for grading loans to States and Municipalities. |
| | |
| 3. | Reserves created in excess are explained by the following: The Bank maintains additional reserves to the ones necessary pursuant to the loan portfolio grading process authorized by CNBV, in order to cover potential losses from mortgages portfolio, the valuation of assets determined in the Due Diligence and authorized by the CNBV in Official Letter No. 601DGSIF"C"-38625, for an amount of $41.5 million pesos, as well as to cover the cost of Governmental Programs. |
| | 4Q.12 | Earnings Report | 42 |
| |
|
| | | |
| Annex 2 | |
| Financial Ratios | |
| | | | | | | | | | | | | | | | |
| Grupo Financiero Santander México | | | | | | | | | | | | | |
| Percentages | | | | | | | | | | | | | | | |
| | | | 4Q12 | | | | 3Q12 | | | | 4Q11 | | | | 2012 | | | | 2011 | |
| | | | | | | | | | | | | | | | | | | | | |
| Past Due Loans Ratio | | | 1.7 | | | | 1.6 | | | | 1.7 | | | | 1.7 | | | | 1.7 | |
| | | | | | | | | | | | | | | | | | | | | |
| Past Due Loans Coverage | | | 190.1 | | | | 205.4 | | | | 210.5 | | | | 190.1 | | | | 210.5 | |
| | | | | | | | | | | | | | | | | | | | | |
| Operative Efficiency | | | 3.2 | | | | 2.6 | | | | 2.7 | | | | 2.6 | | | | 2.4 | |
| | | | | | | | | | | | | | | | | | | | | |
| ROE | | | 13.7 | | | | 17.7 | | | | 34.7 | | | | 18.7 | | | | 21.4 | |
| | | | | | | | | | | | | | | | | | | | | |
| ROA | | | 1.7 | | | | 2.1 | | | | 4.0 | | | | 2.3 | | | | 2.5 | |
| | | | | | | | | | | | | | | | | | | | | |
| Capitalization Ratio: | | | | | | | | | | | | | | | | | | | | |
| Credit Risk | | | 23.8 | | | | 23.9 | | | | 27.4 | | | | 23.8 | | | | 27.4 | |
| Credit, Market and operations risk | | | 14.8 | | | | 14.5 | | | | 14.8 | | | | 14.8 | | | | 14.8 | |
| | | | | | | | | | | | | | | | | | | | | |
| Liquidity | | | 104.3 | | | | 120.1 | | | | 145.2 | | | | 104.3 | | | | 145.2 | |
| | | | | | | | | | | | | | | | | | | | | |
| NIM (Net Interest Margin) | | | 3.4 | | | | 3.3 | | | | 3.3 | | | | 3.4 | | | | 3.3 | |
Note: ratios are prepared according to the general rules applicable to financial information of credit institutions, issued by the CNBV, according to Annex 34 of the CUB.
PAST DUE LOANS RATIO = Balance of past due loans portfolio as of the end of the quarter / Balance of loans portfolio as of the end of the quarter.
PAST DUE LOAN COVERAGE = Balance of provision for loan losses as of the end of the quarter / Balance of past due loans portfolio as of the end of the quarter.
OPERATING EFFICIENCY = Administration and promotion expenses of the quarter, annualized / Total Average Assets.
ROE = Annualized quarterly net earnings/ Average stockholders’ equity.
ROA = Annualized quarterly net earnings /Total average assets.
BREAKDOWN OF CAPITALIZATION RATIO: (1)=Net Capital/ Assets subject to credit risk. (2)=Net Capital / Assets subject to credit, market and operation risk.
LIQUIDITY = Current Assets/ Current Liabilities.
Where: Current Assets = Availabilities + securities for trade + securities available for sale.
Current liabilities= Demand deposits + bank loans and loans from other entities, payable on demand, + short term bank loans and loans from other entities.
NIM = Quarterly Net Interest Margin, adjusted by annualized credit risks, / Average interest-earning assets.
Where: Average interest-earning assets = availabilities, investments in securities, transactions with securities and derivatives and loan portfolio.
Notes:
Average = ((Balance of the corresponding quarter + balance of the previous quarter) / 2).
Annualized figures = (Flow of the corresponding quarter * 4).
| | 4Q.12 | Earnings Report | 43 |
| |
|
| | | |
| Grupo Financiero Santander México | | | |
| Notes to financial statements as of December 31, 2012 | |
| (Millions of pesos, except for number of shares) | | | |
| 1. Financial Instruments | | | |
| | | | |
| Financial instruments are constituted as follows: | | | |
| | | | |
| | | Accounting Value | |
| Trading Securities: | | | |
| Bank Securities | | | 1,357 | |
| Government Securities | | | 102,952 | |
| Private shares | | | 1,226 | |
| Shares | | | 11,648 | |
| | | | 117,183 | |
| | | | | |
| Securities available for sale: | | | | |
| Bank Securities | | | 502 | |
| Government Securities | | | 41,353 | |
| Other | | | 5,518 | |
| | | | 47,373 | |
| | | | | |
| Securities held until maturity: | | | | |
| Government securities (Cetes especiales) | | | 5,090 | |
| | | | 5,090 | |
| | | | | |
| Total Financial Instruments | | | 169,646 | |
| 2. Repurchase and resale agreements | | | |
| The repurchase and resale agreements portfolio is constituted as follows: | | | |
| | | Net balance | |
| Debit Balances | | | |
| Bank Securities | | | 4,877 | |
| Government Securities | | | 4,594 | |
| Total | | | 9,471 | |
| | | | | |
| Credit balances | | | | |
| Bank Securities | | | 860 | |
| Government Securities | | | 68,104 | |
| Private Securities | | | 4,326 | |
| Total | | | 73,290 | |
| | | | (63,819 | ) |
| | 4Q.12 | Earnings Report | 44 |
| |
|
| | | |
| 3. Investment in securities different to government securities |
| | | | |
| The table below lists the investments in debt securities of a same issuer, with positions equal or greater than 5% of Tier 1 Capital of the Bank. |
| | | | |
| Issuer / Series | Maturity date | % Rate | Book Value |
| | | | |
| MX2PPE050004 | 16-Jul-15 | 9.91% | 3,868 |
| US706451BF73 | 15-Dic-15 | 1.79% | 1,615 |
| | | Total | 5,483 |
| | | | |
| Tier 1 Capital | | | 76,197 |
| 5 % of Tier 1 Capital | | | 3,810 |
| 4. Derivative Financial Instruments | | | | | | |
| | | | | | | |
| The nominal value of the different derivative financial instruments agreements for trading and hedging purposes, as of December 31, 2012, are as follows: | |
| | | | | | | |
| Swaps | | | | | | |
| Interest Rate | | | 2,931,227 | | | | |
| Foreign Exchange | | | 612,476 | | | | |
| | | | | | | | |
| Futures | | Buy | | | Sell | |
| Interest Rate | | | 0 | | | | 517,229 | |
| Foreign Exchange | | | 741 | | | | 389 | |
| Index | | | 2,996 | | | | 6,835 | |
| | | | | | | | | |
| Forward Contracts | | | | | | | | |
| Interest Rate | | | 5,000 | | | | 0 | |
| Foreign Exchange | | | 218,236 | | | | 2,663 | |
| Securities | | | 1,770 | | | | 9,058 | |
| | | | | | | | | |
| Options | | Long | | | Short | |
| Interest Rate | | | 190,123 | | | | 233,099 | |
| Foreign Exchange | | | 7,649 | | | | 8,201 | |
| Indexes | | | 6,178 | | | | 5,727 | |
| Securities | | | 5,233 | | | | 4,298 | |
| | | | | | | | | |
| Total for trading | | | 3,981,629 | | | | 787,498 | |
| | | | | | | | | |
| Hedge | | | | | | | | |
| Cash Flow | | | | | | | | |
| Interest Rate Swaps | | | 17,725 | | | | | |
| Foreign Exchange Swaps | | | 20,767 | | | | | |
| | | | | | | | | |
| Fair Value | | | | | | | | |
| Interest Rate Swaps | | | 7,895 | | | | | |
| Foreign Exchange Swaps | | | 2,477 | | | | | |
| | | | | | | | | |
| Total for hedge | | | 48,864 | | | | | |
| | | | | | | | | |
| Total Financial Instruments | | | 4,030,493 | | | | 787,498 | |
| | 4Q.12 | Earnings Report | 45 |
| |
|
| | | |
| 5. Loan Portfolio | | | | | | | | | | | | |
| The loan portfolio, by type of loan and currency, as of December 31, 2012, is constituted as follows: | |
| | | | | | Amount | | | | |
| | | Pesos | | | USA Dlls | | | UDIS | | | Total | |
| | | | | | | | | | | | | |
| Current loan portfolio | | | | | | | | | | | | |
| | | | | | | | | | | | | |
| Commercial or business activities | | | 138,112 | | | | 37,217 | | | | 1 | | | | 175,330 | |
| Financial entities | | | 406 | | | | 1 | | | | 0 | | | | 407 | |
| Governmental entities | | | 24,731 | | | | 13,978 | | | | 0 | | | | 38,709 | |
| Commercial loans | | | 163,248 | | | | 51,196 | | | | 1 | | | | 214,445 | |
| Consumer loans | | | 61,604 | | | | 0 | | | | 0 | | | | 61,604 | |
| Mortgages | | | 65,974 | | | | 1047 | | | | 1,520 | | | | 68,541 | |
| Total | | | 290,826 | | | | 52,243 | | | | 1,521 | | | | 344,590 | |
| 6. Past Due Loans | | | | | | | | | | | | |
| | | | | | | | | | | | | |
| | | | | | Amount | | | |
| Past Due Loans | | Pesos | | | USD | | | UDIS | | | Total | |
| | | | | | | | | | | | | |
| | | | | | | | | | | | | |
| Commercial or business activities | | | 1,475 | | | | 48 | | | | 0 | | | | 1,523 | |
| Commercial loans | | | 1,475 | | | | 48 | | | | 0 | | | | 1,523 | |
| Past due consumer loans | | | 2,236 | | | | 0 | | | | 0 | | | | 2,236 | |
| Past due mortgages | | | 1,911 | | | | 143 | | | | 280 | | | | 2,334 | |
| Total | | | 5,622 | | | | 191 | | | | 280 | | | | 6,093 | |
| | | | | | | | | | | | | | | | | |
| The analysis of movements in past due loans from January 1 to December 31, 2012, is as follows: | |
| | | | | | | | | | | | | | | | | |
| Balance as of December 31, 2011 | | | | | | | | 5,315 | |
| | | | | | | | | | | | | | | | | |
| | | | | | | | | | | | | | | | | |
| Plus: Transfer from current loan portfolio to past due loans | | | | | | | | | | | | 14,696 | |
| | | | | | | | | | | | | | | | | |
| Collections | | | | | | | | | | | | | | | | |
| Cash | | | | | | | | | | | (1,512 | ) | | | | |
| Normalization | | | | | | | | | | | (2,778 | ) | | | | |
| Awards | | | | | | | | | | | 0 | | | | (4,290 | ) |
| | | | | | | | | | | | | | | | | |
| Reestructured loans | | | | | | | | | | | | | | | (1,035 | ) |
| | | | | | | | | | | | | | | | | |
| Charges off | | | | | | | | | | | | | | | (8,593 | ) |
| | | | | | | | | | | | | | | | | |
| Balance as of December 31, 2012 | | | | | | | | | | | | | | | 6,093 | |
| 7. Allowances for loan losses | | | |
| | | | |
| The movements in the provision for loan losses, from January 1st. to December 31, 2012, are as follows: | |
| | | | |
| Balance as of December 31, 2011 | | | 11,191 | |
| | | | | |
| Allowances created | | | 9,445 | |
| Release vs. Goodwill | | | (61 | ) |
| Charge-offs | | | (8,593 | ) |
| Release Comercial Mexicana, S.A. | | | (378 | ) |
| Exchange rate effect on foreign currency | | | (24 | ) |
| Balance as of December 31, 2012 | | | 11,580 | |
| | 4Q.12 | Earnings Report | 46 |
| |
|
| | | |
The table below presents a summary of charge-offs by type of product as of December 31, 2012: | |
| | | | | | | | | | | | | |
| Product | | Charge-offs | | | Debit Relieves | | | Total | | | % | |
| | | | | | | | | | | | | |
| First Quarter | | | | | | | | | | | �� | |
| Commercial Loans | | | 280 | | | | 48 | | | | 328 | | | | 17.62 | % |
| Mortgage | | | 310 | | | | 10 | | | | 320 | | | | 17.20 | % |
| Credit Card | | | 721 | | | | 55 | | | | 776 | | | | 41.70 | % |
| Consumer loans | | | 420 | | | | 17 | | | | 437 | | | | 23.48 | % |
| Total | | | 1,731 | | | | 130 | | | | 1,861 | | | | 100.00 | % |
| | | | | | | | | | | | | | | | | |
| Second Quarter | | | | | | | | | | | | | | | | |
| Commercial Loans | | | 396 | | | | 5 | | | | 401 | | | | 22.71 | % |
| Mortgage | | | 103 | | | | 10 | | | | 113 | | | | 6.40 | % |
| Credit Card | | | 758 | | | | 47 | | | | 805 | | | | 45.58 | % |
| Consumer loans | | | 431 | | | | 16 | | | | 447 | | | | 25.31 | % |
| Total | | | 1,688 | | | | 78 | | | | 1,766 | | | | 100.00 | % |
| | | | | | | | | | | | | | | | | |
| Third Quarter | | | | | | | | | | | | | | | | |
| Commercial Loans | | | 311 | | | | 10 | | | | 321 | | | | 14.29 | % |
| Mortgage | | | 325 | | | | 5 | | | | 330 | | | | 14.69 | % |
| Credit Card | | | 958 | | | | 46 | | | | 1,004 | | | | 44.68 | % |
| Consumer loans | | | 577 | | | | 15 | | | | 592 | | | | 26.35 | % |
| Total | | | 2,171 | | | | 76 | | | | 2,247 | | | | 100.00 | % |
| | | | | | | | | | | | | | | | | |
| Third Quarter | | | | | | | | | | | | | | | | |
| Commercial Loans | | | 347 | | | | 3 | | | | 350 | | | | 12.87 | % |
| Mortgage | | | 140 | | | | 1 | | | | 141 | | | | 5.19 | % |
| Credit Card | | | 1,423 | | | | 47 | | | | 1,470 | | | | 54.06 | % |
| Consumer loans | | | 738 | | | | 20 | | | | 758 | | | | 27.88 | % |
| Total | | | 2,648 | | | | 71 | | | | 2,719 | | | | 100.00 | % |
| | | | | | | | | | | | | | | | | |
| 2012 | | | | | | | | | | | | | | | | |
| Commercial Loans | | | 1,334 | | | | 66 | | | | 1,400 | | | | 16.29 | % |
| Mortgage | | | 878 | | | | 26 | | | | 904 | | | | 10.52 | % |
| Credit Card | | | 3,860 | | | | 195 | | | | 4,055 | | | | 47.19 | % |
| Consumer loans | | | 2,166 | | | | 68 | | | | 2,234 | | | | 26.00 | % |
| Total | | | 8,238 | | | | 355 | | | | 8,593 | | | | 100.00 | % |
| Allowances for Loan Losses from the Commerce Fund |
| | | | | | | |
| Pursuant to the Commission's authorization in Official Bulletin No. 601-I-DGSIF "C" - 38625 issued on March, 2001; as of December 31, 2012, there are MX$55 million in allowances for loan losses from the commerce fund, which resulted from the reestructuring process of Grupo Financiero Santander. As of December 31, 2011, such allowances totaled Mx$ $113. |
| |
| During the fourth quarter of 2012, the abovementioned allowances for loan losses had the following breakdown: |
| | 4Q.12 | Earnings Report | 47 |
| |
|
| | | |
| | | | |
| Mortgages and commercial loans charge-offs | | | (58 | ) |
| Udis reserves actualization and f/x effects | | | 0 | |
| | | | (58 | ) |
As part of the Commission's authorization for these reserves, in case there are exit loan portfolio recoveries from previously charged off loans, these recoveries will be recorded in the income statement. During the period, charges due to income statement due to recoveries of previously charge off loans amounted Mx$61.
8. Problematic Loans
Loans portfolio was graded according to the general provisions issued by the National Banking and Exchange Commission. The management considers that problematic loans are the ones graded as “D” and “E”, due to their low possibility for the collection of the full amount of principal.
| 9. Programs of benefits to bank debtors with the support of the Federal Government. | | |
| | | | | | |
As of December 31, 2012, the accounts receivable from the federal government are $350, regarding the early termination of benefit programs granted to bank debtors. |
Early termination of the support programs for debtors
On July 15, 2010, an Agreement for the early termination of the support programs for bank debtors (the “Agreement”) was entered into. The credit institutions considered to early terminate the following programs, which were created between years 1995- 1998, derived from restructuring of loans, as follows:
| 1. | Support Program for Mortgages Debtors (Support Program); |
| 2. | Support Program for the Construction of Housing, in the stage of individual loans (Support Program), and |
| 3. | Agreement on benefits for Mortgages Debtors (Discounts Program) |
The credit institutions reached an agreement with the Mexican Treasury Department (Secretaría de Hacienda y Crédito Público (SHCP)) and the Commission. The banks were represented by the Mexican Bank’s Association (Asociación de Bancos de México, A.C. (ABM)) and it establishes that, for the correct application of the early termination agreement, the credit institutions are to be subject to the supervision and monitoring of the Commission, and they shall comply with all the comments and corrections made by such Commission and they shall deliver all the information requested by the Commission for the fulfillment of the agreement.
Restructured loans or loans in UDIs granted under the Support Programs for debtors, loans in Mexican pesos; loans in Mexican pesos with right to receive the benefits of the Discounts Program and, loans that, as of December 31, 2010, were current, as well as past due loans that as of the aforementioned date, had been restructured, and those loans that, in order to continue in effect, received a write-off or discount, whatever the amount, were subject to the scheme of early termination, provided that evidence of payments was delivered.
| 10. Average Interest Rates paid on deposits | |
| | | | | | | |
| The average interest rates paid on deposits during December, 2012, is as follows: | |
| | | Pesos | | | USD | |
| | | | | | | |
| Average balance | | | 149,040 | | | | 17,773 | |
| Interest | | | 592 | | | | 1 | |
| Rate | | | 1.5887 | % | | | 0.0288 | % |
| | 4Q.12 | Earnings Report | 48 |
| |
|
| | | |
| 11. Bank and other Loans | | | | | | | | |
| | | | | | | | | |
| As of December 31, 2012, banks and other loans are constituted as follows: | | | |
| | | | | | | | | |
| | | | | | | | | |
| Liabilities | | Amount | | | Rate | | | Maturity |
| | | | | | | | | |
| Loans in Mexican pesos | | | | | | | | |
| | | | | | | | | |
| Banco de México | | | | | | | | |
| Call money | | | 1,500 | | | | 5.42 | % | | 6 months |
| Public fiduciary funds | | | 5,286 | | | | 4.38 | % | | From 2 days to 18 years |
| Government loans | | | 3,611 | | | | 5.42 | % | | From 1 day to 6 years |
| Total | | | 10,397 | | | | | | | |
| | | | | | | | | | | |
| Loans in foreign currency | | | | | | | | | | |
| | | | | | | | | | | |
| Foreign bank loans | | | 8,191 | | | | 1.52 | % | | From 28 days to 8 years |
| Call money | | | 8,168 | | | | 0.38 | % | | 2 days |
| Public fiduciary funds | | | 504 | | | | 1.03 | % | | From 2 days to 4 years |
| Development bank loans | | | 154 | | | | 2.60 | % | | From 4 days to 4 years |
| Total | | | 17,016 | | | | | | | |
| | | | | | | | | | | |
| Total Loans | | | 27,413 | | | | | | | |
| | | | | | | | | | | |
| Accrued Interests | | | 50 | | | | | | | |
| | | | | | | | | | | |
| Total | | | 27,463 | | | | | | | |
| 12. Current and Deferred Taxes | | | | |
| | | | | |
| Current taxes as of December 31, 2012 | | | | |
| | | | | |
| Income Tax | | | 3,207 | | |
| Deferred taxes | | | (1,754 | ) | (1) |
| Total Bank | | | 1,453 | | |
| Current-deferred taxes from other subsidiaries | | | 2,362 | | |
| Total Financial Group | | | 3,815 | | |
| | | | | | |
(1) Deferred taxes are broken down as follows: | | | | | |
| | | | | | |
| Global provision | | | (233 | ) | |
| Fixed Asset | | | (344 | ) | |
| Net effect from financial instruments | | | (1,125 | ) | |
| Accrued Liabilities | | | (58 | ) | |
| Other | | | 6 | | |
| Total Bank | | | (1,754 | ) | |
| Provision for loan losses of subsidiaries, net effect | | | (393 | ) | |
| Others, subsidiaries | | | 105 | | |
| Total deferred tax, Financial Group | | | (2,042 | ) | |
| | | | | | |
| As of December 31, 2012, Assets are registered at 80.83% and Liabilities are registered at 100% | |
| | 4Q.12 | Earnings Report | 49 |
| |
|
| | | |
| | | | | | |
| Remainder of global provisions and allowances for loan losses | | | 10,177 | | |
| Other concepts | | | 3,303 | | |
| Total Deferred Tax (net) | | | 13,480 | | |
| | | | | | |
| Deferred taxes registered in balance sheet accounts | | | 10,584 | | |
| Deferred taxes registered in memorandum accounts | | | 2,896 | | |
| 13. Other operating income (expenses) | | | |
| The main items that constitute the balance of Other Income (Expenses) account, as of December 31, 2012, are the following: | |
| | | | |
| Concept: | | | |
| Recoveries of previously charged-off loans | | | 1,804 | |
| Sales of fixed assets | | | 1,741 | |
| Release of allowances for loan losses | | | 378 | |
| Write-offs of liabilities and reserves | | | 201 | |
| Interests on employees' loans | | | 122 | |
| Income from sale of foreclosed assets | | | 102 | |
| Technical Advisory | | | 103 | |
| Expenses on collections | | | (611 | ) |
| Write-offs | | | (791 | ) |
| Provisions for legal and fiscal contingencies | | | (272 | ) |
| Provision and payments to IPAB (Indemnity) | | | (35 | ) |
| Others | | | 213 | |
| | | | 2,955 | |
14. Discontinued Transactions
Sale of Seguros Santander
On February, 2011, Banco Santander, S.A. (España) and ZS Insurance America, SL entered into a commercial alliance for the business of bancassurance in Latin America that consists in an agreement for the distribution for sale of insurance products in each country, during 25 years.
Derived from the commercial alliance, on July 14, 2011, the agreement among Banco Santander, S.A. (España), Zurich, and Zurich Insurance Company LTD. was entered into (the “purchaser”).
On July 14, 2011, the financial Group performed the sale of the totality of the shares of Seguros Santander, S.A. via a stock-purchase agreement entered into and between the Financial Group and ZS Insurance America, SL, and only for guarantee purposes, with Banco Santander, S.A. (España).
The agreement stipulates that the financial group agreed to sell, transfer and deliver to ZS Insurance America, SL 189,999 shares of the capital stock of Seguros Santander, which represented 99.99% of the capital stock.
The book value of the capital stock of Seguros Santander, amounted $7,441, which generated a profit after taxes of $4,822 registered on November, 2011 by the Financial Group once the sale was executed pursuant to the clauses of the agreement, and the effects of such sale were reflected in the statement of income within the item “discontinued transactions”. The profit after taxes includes $570 corresponding to the results of the operations of Seguros Santander for the year 2011 where it belonged to the financial group.
According to the agreement, the financial group may continue to provide administrative services as well as the sale of insurance policies as part of the continuation of the business, to have and keep tangible goods and properties of Seguros Santander, as well as to maintain relevant business relationships, except in case Zurich and Inversiones ZS América, SL do not accept so or the agreement is terminated.
| | 4Q.12 | Earnings Report | 50 |
| |
|
| | | |
| 15. Capitalization Ratio | | | | | | |
| | | | | | | |
| Banco Santander (México), S.A. | | | | | | |
| | | Amount of equivalent positions | | | Capital Requirement | |
| I. ASSET RISKS | | | | | | |
| DUE TO MARKET RISKS | | | | | | |
| Transactions in Mexican pesos with a nominal rate | | | 118,622 | | | | 9,490 | |
| Transactions with debt securities in Mexican pesos, with overrate and variable rate | | | 4,590 | | | | 367 | |
| Transactions in Mexican pesos with real rate or UDI | | | 6,158 | | | | 493 | |
| Transactions in Mexican pesos with rate referred to General Minimum Wage | | | 2,438 | | | | 195 | |
| UDI positions or referred to NCPI | | | 4 | | | | 0 | |
| Positions in Mexican pesos with rate referred to General Minimum Wage | | | 11 | | | | 1 | |
| Transactions in foreign currency with nominal rate | | | 13,255 | | | | 1060 | |
| Foreign Currency positions or rate referred to exchange rate. | | | 261 | | | | 21 | |
| Stock positions or rate referred to the price of a stock or group of stocks | | | 376 | | | | 30 | |
| Total | | | 145,715 | | | | 11,657 | |
| | | | | | | | | |
| CREDIT RISKS | | | | | | | | |
| Group II (weighted at 50%) | | | 32 | | | | 3 | |
| Group III (weighted at 20%) | | | 19,361 | | | | 1,549 | |
| Group III (weighted at 23%) | | | 5,590 | | | | 447 | |
| Group III (weighted at 50%) | | | 117 | | | | 9 | |
| Group III (weighted at 57.5%) | | | 5,521 | | | | 442 | |
| Group III (weighted at 100%) | | | 10 | | | | 1 | |
| Group IV (weighted at 20%) | | | 6,203 | | | | 496 | |
| Group IV (weighted at 125%) | | | 0 | | | | 0 | |
| Group V (weighted at 20%) | | | 343 | | | | 27 | |
| Group V (weighted at 50%) | | | 745 | | | | 60 | |
| Group V (weighted at 115%) | | | 7,773 | | | | 622 | |
| Group V (weighted at 150%) | | | 19 | | | | 2 | |
| Group VI (weighted at 50%) | | | 13,161 | | | | 1,053 | |
| Group VI (weighted at 75%) | | | 6,363 | | | | 509 | |
| Group VI (weighted at 100%) | | | 15,580 | | | | 1,246 | |
| Group VI (weighted at 125%) | | | 941 | | | | 75 | |
| Group VII-A (weighted at 20%) | | | 8,110 | | | | 649 | |
| Group VII-A (weighted at 50%) | | | 3,344 | | | | 267 | |
| Group VII-A (weighted at 57.5%) | | | 226 | | | | 18 | |
| Group VII-A (weighted at 100%) | | | 144,312 | | | | 11,545 | |
| Group VII-A (weighted at 115%) | | | 2,371 | | | | 190 | |
| Group VII-A (weighted at 125%) | | | 126 | | | | 10 | |
| Group VII-B (weighted at 100%) | | | 2,124 | | | | 170 | |
| Group IX (weighted at 100%) | | | 44,577 | | | | 3,566 | |
| Group IX (weighted at 125%) | | | 579 | | | | 46 | |
| Other Assets (weighted at 10%) | | | 207 | | | | 17 | |
| Other Assets (weighted at 11.5%) | | | 2 | | | | 0 | |
| Other Assets (weighted at 20%) | | | 6,642 | | | | 531 | |
| Other Assets (weighted at 50%) | | | 3,013 | | | | 241 | |
| Other Assets (weighted at 100%) | | | 22,877 | | | | 1,830 | |
| Total | | | 320,268 | | | | 25,621 | |
| | 4Q.12 | Earnings Report | 51 |
| |
|
| | | |
| OPERATIONS RISK | | | | | | | | |
| Requirement on Operations Risk | | | 49,600 | | | | 3,968 | |
| | | | | | | | | |
| TOTAL REQUIREMENTS | | | | | | | | |
| Net requirement on market risk | | | 145,715 | | | | 11,657 | |
| Requirement on credit risk | | | 320,268 | | | | 25,621 | |
| Requirement on operations risk | | | 49,600 | | | | 3,968 | |
| Total | | | 515,583 | | | | 41,247 | |
| | | | | | | | | |
| II. CAPITAL INTEGRATION | | | | | | | | |
| | | | | | | | | |
| BASIC CAPITAL | | | | | | | | |
| Stockholders' Equity | | | 95,966 | | | | | |
| Total Stockholders' equity | | | 95,966 | | | | | |
| Less: | | | | | | | | |
| Investment in shares of financial entities | | | 18,942 | | | | | |
| Investment in non-financial shares | | | 24 | | | | | |
| Intangibles and Deferred expenses or costs | | | 2,382 | | | | | |
| Total basic Capital | | | 74,618 | | | | | |
| | | | | | | | | |
| SUPLEMENTARY CAPITAL | | | | | | | | |
| Provisions for general credit risks. | | | 1,579 | | | | | |
| NET CAPITAL | | | 76,197 | | | | | |
| | | | | | | | | |
| III. CAPITALIZATION RATIO | | | | | | | | |
| | | | | | | | | |
| Net Capital / Required Capital | | | 1.85 | | | | | |
| Basic Capital / Assets subject to credit and market risk | | | 14.47 | | | | | |
| Net capital /Assets subject to credit risk | | | 23.79 | | | | | |
| Net Capital / Assets subject to Total Risk | | | 14.78 | | | | | |
| Casa de Bolsa Santander, S.A. de C.V. | | | | | | |
| | | | | | | |
| | | Amount of equivalent positions | | | Capital Requirement | |
| I. ASSETS RISK | | | | | | |
| MARKET RISK | | | | | | |
| Transactions in Mexican pesos with nominal rate | | | 37 | | | | 3 | |
| Transactions with debt securities in Mexican pesos with overrate and variable rate. | | | 0 | | | | 0 | |
| Transactions in Mexican pesos with real rate or UDI | | | 0 | | | | 0 | |
| UDI positions or referred to NCPI | | | 0 | | | | 0 | |
| Stock positions or rate referred to the price of a stock or group of stocks | | | 1,462 | | | | 117 | |
| | | | 1,499 | | | | 120 | |
| | | | | | | | | |
| CREDIT RISKS | | | | | | | | |
| Group II (weighted at 20%) | | | 30 | | | | 2 | |
| Group III (weighted at 100%) | | | 404 | | | | 32 | |
| | | | 434 | | | | 35 | |
| | 4Q.12 | Earnings Report | 52 |
| |
|
| | | |
| | | | | | | | | |
| OPERATION RISKS | | | 244 | | | | 19 | |
| | | | | | | | | |
| TOTAL REQUIREMENTS | | | | | | | | |
| Net requirement on market risk | | | 1,499 | | | | 120 | |
| Requirement on credit risk | | | 434 | | | | 35 | |
| Requirement on operations risk | | | 244 | | | | 19 | |
| | | | 2,176 | | | | 174 | |
| | | | | | | | | |
| II. CAPITAL INTEGRATION | | | | | | | | |
| | | | | | | | | |
| BASIC CAPITAL | | | | | | | | |
| Stockholders' Equity | | | 1,463 | | | | | |
| Subordinated Debentures and capitalization securities | | | 0 | | | | | |
| Total Stockholders' Equity | | | 1,463 | | | | | |
| Less: | | | | | | | | |
| Investment in shares of financial entities | | | 45 | | | | | |
| Investment in non-financial shares | | | 1 | | | | | |
| Total Basic Capital | | | 1,417 | | | | | |
| | | | | | | | | |
| SUPPLEMENTARY CAPITAL | | | | | | | | |
| Debentures and capitalization securities | | | 0 | | | | | |
| Provisions for general credit risks | | | 0 | | | | | |
| GLOBAL CAPITAL | | | 1,417 | | | | | |
| | | | | | | | | |
| III. INDICE DE CAPITALIZACIÓN | | | | | | | | |
| | | | | | | | | |
| Global Capital / Required Capital | | | 8.14 | | | | | |
| Basic Capital / Assets subject to credit, market and operation risk | | | 65.12 | | | | | |
| Global capital /Assets subject to credit risk | | | 326.82 | | | | | |
| Global Capital / Assets subject to credit, market and operation Risk | | | 65.12 | | | | | |
| Santander Consumo, S.A. de C.V., SOFOM, E.R. | | | | | | |
| | | | | | | |
| | | Amount of equivalent positions | | | Capital requirements | |
| I. ASSETS RISK | | | | | | |
| MARKET RISKS | | | | | | |
| Transactions in Mexican pesos with nominal rate | | | 9,719 | | | | 778 | |
| Transactions with debt securities in Mexican pesos with overrate and variable rate. | | | 0 | | | | 0 | |
| Total | | | 9,719 | | | | 778 | |
| | | | | | | | | |
| CREDIT RISKS | | | | | | | | |
| Group III (weighted at 20%) | | | 0 | | | | 0 | |
| Group VI (weighted at 100%) | | | 56,177 | | | | 4,494 | |
| Group VI (weighted at 125%) | | | 1,076 | | | | 86 | |
| Group VI (weighted at 150%) | | | 0 | | | | 0 | |
| Group VII (weighted at 20%) | | | 1 | | | | 0 | |
| Group VII (weighted at 150%) | | | 2 | | | | 0 | |
| Other assets (weighted at 100%) | | | 4,900 | | | | 392 | |
| Total | | | 62,155 | | | | 4,972 | |
| | 4Q.12 | Earnings Report | 53 |
| |
|
| | | |
| | | | | | | | | |
| OPERATIONS RISK | | | | | | | | |
| Requirement on Operations Risk | | | 8,228 | | | | 658 | |
| | | | | | | | | |
| TOTAL REQUIREMENTS | | | | | | | | |
| Net requirement on market risk | | | 9,719 | | | | 778 | |
| Requirement on credit risk | | | 62,155 | | | | 4,972 | |
| Requirement on operations risk | | | 8,228 | | | | 658 | |
| Total | | | 80,103 | | | | 6,408 | |
| | | | | | | | | |
| II. CAPITAL INTEGRATION | | | | | | | | |
| | | | | | | | | |
| BASIC CAPITAL | | | | | | | | |
| Stockholders' Equity | | | 11,998 | | | | | |
| Subordinated Debentures and capitalization securities | | | 0 | | | | | |
| Total Stockholders' Equity | | | 11,998 | | | | | |
| Less: | | | | | | | | |
| Investment in subordinated securities | | | 0 | | | | | |
| Investment in shares of financial entities | | | 0 | | | | | |
| Investment in non-financial shares | | | 0 | | | | | |
| Loans granted for the purchase of own shares or shares of entities of the financial group. | | | 0 | | | | | |
| Deferred Taxes | | | 0 | | | | | |
| Intangibles and Deferred expenses or costs | | | 0 | | | | | |
| Other assets | | | 0 | | | | | |
| Total Basic Capital | | | 11,998 | | | | | |
| | | | | | | | | |
| SUPPLEMENTARY CAPITAL | | | | | | | | |
| Debentures and capitalization securities | | | 0 | | | | | |
| Provisions for general credit risks. | | | 717 | | | | | |
| NET CAPITAL | | | 12,715 | | | | | |
| | | | | | | | | |
| III. CAPITALIZATION RATIO | | | | | | | | |
| | | | | | | | | |
| Net capital/ Required Capital | | | 1.98 | | | | | |
| Basic Capital / Assets subject to total risks | | | 14.98 | | | | | |
| Net Capital / Assets subject to Credit Risks | | | 20.46 | | | | | |
| Net Capital / Assets subject to total Risks | | | 15.87 | | | | | |
| Santander Hipotecario, S.A. de C.V., SOFOM, E.R. | | | | |
| | | | | | | |
| | | Amount of equivalent positions | | | Capital Requirements | |
| I. ASSETS RISK | | | | | | |
| MARKET RISK | | | | | | |
| | | | | | | |
| Transactions in Mexican pesos with nominal rate | | | 5,956 | | | | 476 | |
| Transactions in Mexican pesos with real rate or UDI | | | 760 | | | | 61 | |
| UDI positions or referred to NCPI | | | 1 | | | | 0 | |
| Transactions in foreign currency with nominal rate | | | 200 | | | | 16 | |
| Foreign Currency positions or rate referred to exchange rate | | | 90 | | | | 7 | |
| Total | | | 7,008 | | | | 561 | |
| | 4Q.12 | Earnings Report | 54 |
| |
|
| | | |
| | | | | | | | | |
| CREDIT RISK | | | | | | | | |
| Group III (weighted at 20%) | | | 16 | | | | 1 | |
| Group VI (weighted at 50%) | | | 5,072 | | | | 406 | |
| Group VI (weighted at 75%) | | | 2,950 | | | | 236 | |
| Group VI (weighted at 100%) | | | 3,848 | | | | 308 | |
| Group VI (weighted at 125%) | | | 1,480 | | | | 118 | |
| Group VII-A (weighted at 20%) | | | 1 | | | | 0 | |
| Other assets (weighted at 100%) | | | 2,517 | | | | 201 | |
| Total | | | 15,883 | | | | 1,271 | |
| | | | | | | | | |
| OPERATIONS RISK | | | | | | | | |
| Requirement on Operations Risk | | | 1,160 | | | | 93 | |
| | | | | | | | | |
| TOTAL REQUIREMENTS | | | | | | | | |
| Net requirement on market risk | | | 7,008 | | | | 561 | |
| Requirement on credit risk | | | 15,883 | | | | 1,271 | |
| Requirement on operations risk | | | 1,160 | | | | 93 | |
| Total | | | 24,051 | | | | 1,924 | |
| | | | | | | | | |
| | | | | | | | | |
| II. CAPITAL INTEGRATION | | | | | | | | |
| | | | | | | | | |
| BASIC CAPITAL | | | | | | | | |
| Stockholders' Equity | | | 3,168 | | | | | |
| Subordinated Debentures and capitalization securities | | | 0 | | | | | |
| Total Stockholders' Equity | | | 3,168 | | | | | |
| Less: | | | | | | | | |
| Investment in subordinated securities | | | 0 | | | | | |
| Investment in shares of financial entities | | | 0 | | | | | |
| Investment in non-financial shares | | | 0 | | | | | |
| Loans granted for the purchase of own shares or shares of entities of the financial group. | | | 0 | | | | | |
| Deferred Taxes | | | 0 | | | | | |
| Intangibles and Deferred expenses or costs | | | 0 | | | | | |
| Other assets | | | 0 | | | | | |
| Total Basic Capital | | | 3,168 | | | | | |
| | | | | | | | | |
| SUPPLEMENTARY CAPITAL | | | | | | | | |
| Debentures and capitalization securities | | | 0 | | | | | |
| Provisions for general credit risks. | | | 39 | | | | | |
| NET CAPITAL | | | 3,207 | | | | | |
| | | | | | | | | |
| III. CAPITALIZATION RATIO | | | | | | | | |
| | | | | | | | | |
| Net Capital/ Required Capital | | | 1.67 | | | | | |
| Basic Capital / Assets subject to total risks | | | 13.17 | | | | | |
| Net Capital / Assets subject to Credit Risks | | | 20.19 | | | | | |
| Net Capital / Assets subject to total Risks | | | 13.34 | | | | | |
| | 4Q.12 | Earnings Report | 55 |
| |
|
| | | |
| 16. Risk Diversification |
| |
| Pursuant to the general rules for risk diversification in the performance of borrowing and lending transactions applicable to credit institutions, published in the Federal official Gazette on April 30, 2003, the following information with respect to credit risk transactions as of December 31, 2012, is provided: |
| |
| - At December 31, 2012 did not have financing granted to debtors or groups of individuals representing single common risk is greater the amount of core capital (the month immediately preceding the date that is reported) Bank. |
| |
| - Loans granted to the three major debtors or groups of persons representing a common risk for a total amount of $15,762.7, repreenting the 21.43% of the basic capital of the Bank. |
17. Internal and external Sources of Liquidity
Internal sources of liquidity in domestic and foreign currency come from the different savings products that the institution offers to clients; that is, the funds obtained from check accounts and term deposits from customers.
With respect to external sources of liquidity, the institution has several mechanisms of access to debt and capital markets, i.e., the bank obtains resources via the issue of debt securities, loans to other institutions, including the Central Bank and international institutions, as well as the issue of subordinate debt and other capital securities.
The bank may obtain liquidity also via repurchase and resale agreements on securities (reportos) possessed by the bank. Also, the bank may obtain funds via the sale of assets.
18. Dividends Policy
The institution performs the payment of dividends pursuant to the applicable legal, administrative, fiscal and accounting rules, based in the results obtained by the Institution. The Board of Directors proposes the payment of dividends at the Ordinary General Stockholders’ Meeting, which is the body that orders and approves the payment of dividends to the stockholders of the institution.
19. Treasury Policies
The activities of the bank’s treasury are performed pursuant to the following:
| a) | In compliance with the provisions issued by the different authorities of the financial system for bank institutions, such as guidelines for lending and borrowing transactions, accounting rules, liquidity ratios, regulatory matching, capacity of the payment systems, etc. |
| b) | Internal limits for market, liquidity and credit risks, i.e., there are limits for the management of the assets and liabilities of the bank with respect to the market and liquidity risk derived from such management, as well as the limits regarding counterparty risk derived from the daily transactions. |
| c) | Compliance with the guidelines stipulated by national and international standard agreements regarding transactions performed in markets. |
| d) | Sound market practices. |
| e) | Strategies proposed in the banks internal committees. |
| f) | Compliance with the operation procedures of the institution. |
| | | |
| Subsidiaries | | % of interest |
| | | |
| Banco Santander (México), S.A. | | 99.99% |
| Casa de Bolsa Santander, S.A. de C.V. | | 99.96% |
| Gestión Santander, S.A. de C.V. | | 99.99% |
21. Internal Control
The activities of Grupo Financiero Santander México are governed by a series of guidelines established by Banco Santander (España), the holding company of Grupo Financiero Santander México, whose head offices are located in the city of Madrid, and the Mexican laws.
| | 4Q.12 | Earnings Report | 56 |
| |
|
| | | |
For the compliance of the rules in effect, the Group has developed and implemented an Internal Control Model (ICM) which includes the participation of the Board of Directors, the statutory advisor, the Audit Committee, the General Direction, the Internal Control Unit and the Regulatory Control Department.
The ICM is based in the identification and documentation of the main risks and the periodic assessment of the controls that are created to mitigate such risks. ICM guarantees, among other aspects, the design, establishment and updating of measures and controls that promote the compliance with the internal and external rules and the proper operation of the data processing systems.
The internal control system includes:
The implementation of an organizational structure has allowed the development and growth of the group. Such structure is constituted as follows:
CEO and General Direction
The following functions report to the CEO and General Direction:
| § | Vice-president of Finance and Administration: |
| | Ø | Deputy General Direction of Intervention and Management Control |
| | Ø | Deputy General Direction for Media |
| | Ø | Deputy General of Human Resources |
| | Ø | Deputy Direction for Legal Affairs |
| | Ø | Counsel for Legal Affairs |
| § | Vice-president of Commercial Banking: |
| | Ø | Deputy General Direction of Commercial Strategy |
| | Ø | Deputy General Direction of Companies and Institutions Banking |
| | Ø | Deputy General Direction of Particulars and Small Enterprises Banking |
| | Ø | Deputy General Direction of Payment Systems |
| | Ø | Deputy General Direction of Private Banking |
| § | Deputy General Director of Credit |
| § | Deputy General Director of Wholesale Banking |
| § | Deputy General Director of Institutional Relations and Communications |
| § | Executive Direction of Audit |
The roles and responsibilities of each direction have been stipulated in order to optimize the performance of the activities of the group.
The Organization area, via manuals, circulars and bulletins, governs the activities of the group; likewise, the Regulatory Control Department has established a general Code of Conduct that every employee of the Bank has to follow.
The structure of the Group includes the constitution of a Board of Directors, which establishes the objectives, the policies and general procedures of the Group, the appointment of directors and the constitution of committees that are to supervise the development of the activities of the Group.
The committees that supervise the development of the entities that constitute the Group, created by the Board of Directors, are the following:
| § | Society Practices Committee |
| § | Integral Risk Management Committee |
| § | Executive Credit Committee |
| § | Regulatory Compliance Committee |
| § | Communication and Control Committee |
| § | Remunerations Committee |
| | 4Q.12 | Earnings Report | 57 |
| |
|
| | | |
The registration, control and storage of the daily activities of the Group is carried out by systems mainly designed and focused on the banking and brokerage activity. the common platform for such purposes is known as ALTAIR and it is applied by all the entities in Latin America that are part of Banco Santander (España).
Loans portfolio and transactions of commercial banking of the group are controlled and registered at ALTAIR. Treasury activities are controlled and registered in computer platforms and the operations are centralized for its accounting registration in ALTAIR. Such platforms comply with the parameters stipulated by the National banking and Exchange Commission with respect to reliability and accuracy.
Grupo Financiero Santander is regulated by the CNBV, and therefore, the financial statements are prepared according to the accounting practices stipulated by such Commission via the issue of accounting circulars, general official letters and particular official letters regarding the accounting registration of transactions. For such purposes, the accounting system of the institution has been structured with an accounts catalog stipulated by the Commission, and all the reports come from such system and comply with the applicable provisions.
Within the Group, there is an independent area of Internal Audit, whose mission is to oversee the compliance, efficacy and efficiency of the internal control systems of the Group, as well as the reliability and quality of the accounting information.
To achieve so, Internal Audit verifies that the risks inherent to the activity of the Group are properly covered and the policies stipulated by the Direction, the applicable internal and external regulations and the procedures are observed.
The results of the activities of Internal Audit are reported on regular basis to the General Direction, the Audit Committee and the Board of Directors. Among other issues, the results of the audits performed to the different business units of the companies that constitute the Group and the follow up of the recommendations provided to the different areas and/ or entities are informed.
Internal Audit has a quality system according to the requirements of the Directive UNE-EN ISO 9001:2008 and it is focused towards customer satisfaction under an approach of continuous improvement of procedures.
In summary, Internal Control of the Group includes the continuous development, implementation and updating of an internal control model where all the areas of the group have an active role.
| 22. Accounting Differences between CNBV regulations in Mexico and the Circular issued by Bank of Spain |
| | | | | |
| Earnings of Grupo Financiero Santander under CNBV regulations in Mexico | | | 17,822 | | |
| | | | | | |
| Temporary differences in classification and assessment of repurchase and resale agreements and securities | | | (107 | ) | (a) |
| | | | | | |
| Income and expenses from the Head Office | | | 282 | | (b) |
| | | | | | |
| Other differences between CNBV regulations in Mexico and the Circular issued by Bank of Spain | | | 158 | | |
| | | | | | |
| Earnings of Grupo Financiero Santander under the regulations set forth in the Circular issued by the Bank of Spain | | | 18,155 | | |
| | | | | | |
(a) According to the local regulations, as of september 30, 2008, the market variation of securities classified as securities for trade was registered in the income statement; for Spain, such securities are classified as available for sale and, pursuant to the Circular issued by Bank of Spain, its valuation is registered in stockholders' equit until their realization. |
(b) Allocation of corporate income and expenses performed by the Head Office to its subsidiaries, pursuant to the rules and policies of Banco Santander España. |
| | 4Q.12 | Earnings Report | 58 |
| |
|
| | | |
| 23. Transactions with Related Parties | | | |
| | | | |
| Assets | | | |
| Liabilities | | | 390 | |
| Derivatives | | | 18,937 | |
| Loan Portfolio (net) | | | 2,288 | |
| Other account receivables | | | 7,891 | |
| | | | | |
| Liabilities | | | | |
| Term deposits | | | 638 | |
| Credit instruments issued | | | 1,106 | |
| Credit balance on repurchase and resale agreements | | | 134 | |
| Derivatives | | | 24,871 | |
| Bank and other loans | | | 186 | |
| Other accounts payable | | | 78 | |
| Credit balance on settlement of transactions | | | 494 | |
| | | | | |
| Earnings | | | | |
| Interest collected | | | 86 | |
| Commissions collected | | | 3,016 | |
| Transactions with derivative financial instruments | | | 59,104 | |
| | | | | |
| Expenses | | | | |
| Interests paid | | | 47 | |
| Administration expenses | | | 241 | |
| Transactions with derivative financial instruments | | | 64,019 | |
| Technology Services | | | 1,452 | |
| 24. Interests on Loan portfolio |
| |
| As of December 31, 2012, the Income Statement includes in the item "Earnings from loans" $37,164 million pesos that correspond to interests from the loan portfolio of Banco Santander (México), S.A.,Santander Consumo, S.A. de C.V. SOFOM ER and Santander Hipotecario, S.A. de C.V. SOFOM ER. |
25. Integral Risk Management
Risk management is considered by Grupo Financiero Santander as a competitive element of strategic nature with the purpose of maximizing the value for the stockholder. This management is defined, from a conceptual and organizational sense, as a comprehensive management of the different risks (market risk, liquidity risk, credit risk, counterparty risk, operative risk, legal risk and technological risk) assumed by the institution for the development of its activities. The management of the risk inherent to transactions is essential for understanding and determining the behavior of the financial condition of the institution and the creation of long-term value.
In order to comply with the provisions regarding the Comprehensive Risk Management applicable to credit institutions, issued by the National Banking and Exchange Commission, the Board of Directors agreed to create the Comprehensive Risk Management Committee of the institution, to work pursuant to the rules set by such regulations. This Committee gathers every month and verifies that the transactions are according to the objectives, policies and procedures approved by the Board of Directors for the Comprehensive Risk Management.
The Comprehensive Risk Management Committee delegates in the Comprehensive Risk Management Unit the responsibility for the implementation of procedures for the measure, administration and control of risks according to the applicable policies; such Unit has the faculty to authorize amounts greater than the stipulated limits and in such cases, the Board of Directors shall be informed on such deviations.
Market Risk
The Market Risk Management department of the Comprehensive Risk Management Unit is responsible for recommending the policies on market risk management of the institution, and to establish the parameters for risk
| | 4Q.12 | Earnings Report | 59 |
| |
|
| | | |
measuring, and to provide reports, analysis and assessments to the senior management, to the Comprehensive Risk Management Committee and to the Board of Directors.
The market risk management is to identify, measure, monitor and control risks arising from fluctuations in interest rates, exchange rates, prices and other market risk factors in currency, money, capital and derivative markets that are exposed the positions that belong to the position.
The market risk measurement quantifies the potential variation in the value of the positions as a consequence of changes in the market risk factors.
Depending on the nature of the activities of each business unit, debt and capital instruments are registered as securities for trade, securities available for sale and or securities held to maturity. The main characteristic that identifies securities available for sale is their permanent nature and they are managed as an structural part of the balance sheet. The institution has established provisions that all securities available for sale must fulfill, as well as adequate controls for the compliance of such provisions.
Whenever significant risks are identified, they are measured and limits are allocated in order to assure an adequate control. Global measurement of risk is carried out via a combination of the methodology applied to Portfolios for Trade and to the management of Assets and Liabilities.
Portfolios for Trade
In order to measure the risk in a global approach, the methodology of Value at Risk (VaR) is used. VaR is defined as the statistical estimate of the potential loss of value of a given position, during certain period and at certain confidence level. VaR provides a universal measure of the level of exposure of the different risk portfolios; it allows the comparison of the risk level assumed in different securities and markets and expresses the level of each portfolio through a unique figure in economic units.
VaR is calculated via historical simulation, with a 521 working-days window (520 percentage changes) and a one-day horizon. The calculation is performed from a series of simulated gains and losses with 1% percentile at constant pesos and with pesos decreasing on an exponential basis, with a decrease factor that is reviewed on annual basis, the most conservative measure is the one to be reported. A confidence level of 99% is assumed.
Note that the historical simulation model is limiting to assume that the recent past represent the near future.
The Value at Risk as of December, 2012 (unaudited) amounted to:
| | Bank and Brokerage |
| | VaR (thousand of pesos) | % |
| Trading desks | 72,367.68 | 0.09% |
| Market Making | 43,924.59 | 0.06% |
| Prop Trading | 33,646.92 | 0.04% |
| | | |
| Risk factor | 72,367.68 | 0.09% |
| Interest rate | 65,992.75 | 0.09% |
| Foreign excahange | 10,235.62 | 0.01% |
| Equity | 12,718.59 | 0.02% |
| | 4Q.12 | Earnings Report | 60 |
| |
|
| | | |
The Value at Risk for the average quarter of 2012 (unaudited) amounted to:
| | |
| | | % |
| Trading desks | 70,372.62 | 0.09% |
| Market Making | 46,517.84 | 0.06% |
| Prop Trading | | 0.05% |
| | | |
| Risk factor | | 0.09% |
| Interest rate | | 0.09% |
| Foreign Exchange | | 0.01% |
| Equity | | 0.02% |
* % of VaR with respect to Net Capital
It is important to mention that the VaR related to consolidated positions in securities for trading and available for sale is 264,546 (thousands of Mexican pesos), mainly focused in the Interest Rate risk factor.
Likewise, monthly simulations of gains or losses of portfolios are carried out by revaluating such portfolios under different scenarios (Stress Test). Such estimates are generated using two different methods:
| | · | Applying to risk factors the percentage changes observed in certain periods including relevant market turbulences. |
| | · | Applying to risk factors changes that depend on the volatility of each risk factor. |
On a monthly basis “back testing” is carried out to compare daily gains and losses that would have been observed is the same positions had been maintained, taking into account only the change in value at risk in order to be able to fine tune the models. Even though these reports are prepared on a monthly basis, they include daily tests.
Management of Assets and Liabilities
Commercial banking activities of the institution generate important balance sheet amounts. The Assets and Liabilities Committee (ALCO) is responsible for determining the guidelines for the management of financial margin risk, net worth value and liquidity that must be followed by the different commercial portfolios. Pursuant to this approach, the General Direction of Finances has the responsibility to execute the strategies defined by the Assets and Liabilities Committee in order to modify the risk profile of the commercial portfolio by following the corresponding policies. Compliance with information requirements for interest rate, Exchange rate and liquidity risks is fundamental.
As part of the financial management of the institutions, sensitivity to financial margin (NIM) and net worth value (MVE) of the different balance sheet items is analyzed in comparison to variations in interest rates. This sensitivity is derived from the difference between maturity dates of assets and liabilities and the dates interest rates are modified. The analysis is performed from the classification of each item sensitive to interest rate throughout time, according to their repayment, maturity or contractual modification of the applicable interest rate.
| | Sensitivity 1% NIM | | Sensitivity 1% MVE |
| Bank and Brokerage | Oct-12 | Nov-12 | Dec-12 | Average | | Oct-12 | Nov-12 | Dec-12 | Average |
| Balance MXP GAP | 56% | 62% | 72% | 63% | | 77% | 76% | 69% | 74.0% |
| Balance USD GAP | 25% | 73% | 64% | 54% | | 80% | 75% | 54% | 69.7% |
Using simulation techniques, the predictable value of the financial margin and the net worth value are measured in different interest rate scenarios, and their sensitivity under extreme movement of such scenarios.
| | 4Q.12 | Earnings Report | 61 |
| |
|
| | | |
The Assets and Liabilities Committee adopts investment and hedging strategies in order to maintain such sensitivities within the target range.
Limits
Limits are used to control global risk of the financial group derived from each portfolio and books. The structure of limits is used to control exposures and to establish the total risk authorized to business units. These limits are established for VaR, Loss alert, maximum loss, equivalent volume of interest rate, delta equivalent in variable interest, open foreign currency positions, sensitivity of financial margin and sensitivity of net worth value.
Liquidity Risk
Liquidity risk is related to the ability of the institution to finance acquired commitments at reasonable market prices, as well as to fulfill business plans with stable financing sources. Risk factors may be external (liquidity crisis) and internal due to excessive concentration of maturities.
The institution carries out a coordinated management of maturities of assets and liabilities, and oversees the maximum timing difference profiles. This monitoring is based in the analysis of maturities of assets and liabilities, both contractual and managerial. Liquidity Risk is limited in terms of an accrued liquidity level during one month and in terms of a stipulated liquidity ratio.
| | Liquidity Ratio |
| Bank and Brokerage | Oct-12 | Nov-12 | Dec-12 | Average |
| Balance MXP GAP | 41% | 36% | 34% | 37% |
| Balance USD GAP | 24% | 26% | 19% | 23% |
Credit Risk
Management of credit risk of Grupo Financiero Santander is developed differently for the different segments of clients along the three phases of the credit process: acceptance, follow-up and recovery.
From a global perspective, management of credit risk in the institution is responsible for the identification, measurement, integration and assessment of the aggregated risk and the profitability according to such risk; with the purpose of oversee the levels of risk concentration and to adapt them to the limits and objectives previously established.
Risks receiving an individual treatment (risks with companies, institutions and financial entities) are identified and taken apart from those other risk that are managed in standardized manner (consumer and mortgages credits to individuals, loans to businesses and small enterprises)
Risks managed on individual basis are subject to a solvency or rating system with a related probability of failure that allows the measuring of the risk for each client and for each transaction from the beginning. The assessment of the client, after analyzing other relevant risk factors in different areas, is adjusted according to the special characteristics of the transaction (guarantee, term, etc,)
Standardized risks require, due to their special characteristics (great number of transactions for relatively low amounts), a different management that allows an efficient process and effective use of resources, so automated decision tools are used (expert and credit scoring systems).
Management of loans to companies is complemented, during the follow-up phase, with the so called “system of special monitoring” that determines the policy to be followed in the management of the risks with companies or groups rated within such category. Different situations of levels of monitoring are identified and generate different actions. A special monitoring grade is given in the case of alert signals, systematic reviews, or specific initiatives promoted by the Risks Department or Internal Audit.
Recovery Units constitute a critical element in the management of irregular risk, in order to minimize the final loss for the institution. These units are responsible for a specialized management of the risk from the moment they are classified as irregular risk loans (defaulting payment).
| | 4Q.12 | Earnings Report | 62 |
| |
|
| | | |
The institution has carried out a policy for the selective growth of risk and a strict treatment of late payments and the creation of the corresponding provisions, based in the prudent criteria defined by the Group.
Probability of Default and Expected Losses
Pursuant to the provisions on Comprehensive Risk Management included in the general regulations applicable to credit institutions, as part of the credit risk management, credit institutions must determine the probability of default. The system allows the calculation of the probability for the different loans portfolios.
| | a. | The probability of failure is for “No Retail” portfolios. It is determined via the fine tune of the ratings of clients in a given moment, based in the Monthly Default Rates observed during a period of five years. Such Default Rates are adjusted to an economic cycle of ten years. For “Retail” portfolios, the standard default probabilities set by the Basilea Convention are used. |
| | b. | Once the probability of default is determined, the parameters of “severity of Loss” (LGD) and “Exposure at Default” (EAD) stipulated in Basilea, are taken into consideration. |
Once the abovementioned factors are obtained, the Expected Loss (PE) is calculated as follows:
Expected Loss = Probability of Default x Severity of Loss x Exposure at Default
i.e.: PE = PD * LGD * EAD
Counterparty Risk
Included in the credit risk, there is a concept that, due to its characteristics, it requires a special management: the Counterparty Risk.
Counterparty Risk is the risk the Institution assumes with governmental entities, financial institutions, corporations, companies and individuals in their treasury activities and correspondent bank activities. The measurement and control of the Credit Risk in Financial Instruments, Counterparty Risk, is carried out by a special unit with an organizational structure independent from the business areas.
The control of Counterparty Risk is performed daily via the Kondor Global Risk (KGR) system, which informs the credit line available with any counterparty, in any product and any term.
For the control of the counterparty lines the Equivalent Credit Risk (REC) is used.REC is an estimate of the amount the institution may lose in current transactions with certain counterparty, if such counterparty commits a default in any moment until the maturity date of transactions. REC takes into account the Current Credit Exposure, which is defined as the cost to substitute the transaction ar market value provided that this value is positive for the institution, and it is measured as the market value of the transaction (MtM). In addition, REC includes the Potential Credit Exposure or Potential Additional Risk (RPA), which represents the possible evolution of the current credit exposure until maturity, given the characteristics of the transaction and the possible variations in the market factors. The REC Gross considers definitions described above, without considering mitigating by netting or by mitigating collateral.
For the calculation of REC, mitigating factors of the counterparty credit risk are taken into consideration, such as collaterals, netting agreements, among other. The methodology continues to be effective.
In addition to the Counterparty Risk, there is the Settlement Risk, which is present in every transaction at its maturity date, when the possibility that the counterparty does not comply with its payment obligations arises, once the institution has complied with its obligations by issuing payment directions.
| | 4Q.12 | Earnings Report | 63 |
| |
|
| | | |
For the process of control for this risk, the Deputy General Direction of Financial Risks oversees on a daily basis the compliance with the limits on counterparty credit risks by product, term and other conditions stipulated in the authorization for financial markets. Likewise, it is the responsible for communicating on a daily bases, the limits, consumptions and any incurred deviation or excess.
On a monthly basis, a report is presented to the Comprehensive Risk management Committee, and on quarterly basis, to the Board of Directors, with respect to the limits to Counterparty Risks, Issuer Risks and current consumptions, as well as incurred excesses and transactions with non authorized customers. In addition, it informs the calculation of the Expected Loss for current transactions in financial markets at the closing of every month and different scenarios of stress of Expected Loss. All of the above according to the methodologies and assumptions approved by the Comprehensive Risk Management Committee.
Currently, we have approved lines of Counterparty Risks in Grupo Financiero Santander for the following segments: Mexican Sovereign Risk and Domestic Development Banking, Foreign Financial Institutions, Mexican Financial Institutions, Corporations, Companies Banking-SGC, Institutions Banking, Large Enterprises Unit, Project Finance.
Equivalent Credit Risk of the lines of Counterparty Risk and Issuer Risk of Grupo Financiero Santander as of the end of December, 2012, is concentrated on 90.33% in the Sovereign Risk segment, Development Banking and Financial Institutions, 9.19% in the Corporate segment and 0.49% in the Companies segment.
The equivalent credit risk lines maximum gross counterparty risk of Grupo Financiero Santander at the end of December 2012, which corresponds to derivative transactions is 9,996 million USA dollars Gross REC. Depending on the type of derivative, we present an amount in rate derivatives of 5,908 million USA dollars Gross REC, in derivatives exchange rate is 3,889 million USA dollars Gross REC, in derivatives on bonds of 3 million USA dollars Gross REC and equity derivatives 196 million USA dollars Gross REC.
The quarterly average Equivalent Credit Risk of the lines of Counterparty Risk and Issuer Risk of Grupo Financiero Santander for the period October-December, 2012 was 19,037.48 million USA Dollars REC in the Sovereign Risk, Development Banking and Financial Institutions segment, 1,708.73 million USA Dollars REC in Corporate segment and 95.03 million USA Dollars REC in the <companies segment.
The Expected Loss of Grupo Financiero Santander at the end of December, 2012, is concentrated in 22.71% in the Sovereign Risk, development Banking and Financial Institutions segment; 71.74% in the Corporate segment and 5.55% in the Companies segment.
The quarterly average of the expected loss of the lines of Counterparty risk and issuer risk of the institution, for the period October – December, 2012 was 2.56 million USA Dollars in the Sovereign Risk, Development Banking and Financial Institutions segment, 7.56 million USA Dollars in the Corporate segment and 0.6 million USA Dollars in the Companies segment
The segments of Mexican Financial Institutions and Foreign Financial Institutions are very active counterparties with whom the institution has current positions of financial instruments with Counterparty Credit Risk. It is important to mention that Equivalent Credit Risk is mitigated by netting agreements (ISDA-CMOF) and, in some cases, by collateral agreements (CSA-CGAR) or revaluation agreements with counterparties.
| | 4Q.12 | Earnings Report | 64 |
| |
|
| | | |
Respect to total collateral received for derivatives transactions at the end of December 2012, the 99.91% is concentrated in cash collateral and the remaining 0.09% collateral refer to bonds issued by the Mexican Federal Government.
Operating Risk
With respect to Operating Risk, and pursuant to the corporate methodology, the institution has established policies, procedures and methodologies for the identification, control, mitigation, monitoring and reporting of operating risks.
For the identification and classification of operating risks, different categories and business lines defined by national and internal regulating organisms are used. The methodology is based in the identification and documentation of the corresponding risks, controls and processes, and quantitative and qualitative tools are used, such as self-assessment questionnaires, development of historical data bases and Operating Risk indicators, etc. for their control, mitigation and reporting.
Legal Risk
Legal Risk is defined as the potential loss due to the failure to comply with the applicable legal and administrative regulations, the issue of administrative and judicial resolutions against the institution and the application of fines, with respect to the transactions carried out by the Institution.
Pursuant to the provisions regarding the Comprehensive Risk Management, the following activities are performed: a) Establishment of policies and procedures for analyzing the legal validity and the proper execution of the legal acts. b) estimates of the amount of potential losses derived from judicial or administrative orders against the Institution and the possible application of fines c) Analysis of the legal acts governed by a legal system different to the Mexican laws, d) communication to directors and employees on the legal and administrative regulations applicable to transactions and e) the performance, at least on annual basis, of internal legal audits.
Technological Risk
Technological risk is defined as the potential loss due to damages, discontinuation, alterations or failures derived from the use or dependence on hardware, software, systems, applications, networks and any other data channel distribution for the provision of banking services to the clients of the Institution.
The Institution has adopted a corporate model for the management of Technological Risks, integrated to the processes of service and support to computing areas in order to identify, oversee, control, mitigate and report the Computing Technology Risks the transaction is exposed to, with the aim of establishing control measures that decrease the probability of risks to occur.
Item 2
|
4Q and Full-Year 2012

Earnings Presentation

Grupo Financiero Santander M[]xico, S.A.B. de C.V.

Mexico City, February 19(th), 2013

Mexico
|
|
Safe Harbor Statement

Grupo Financiero Santander M[]xico cautions that this presentation may contain
forward -looking statements within the meaning of the U.S. Private Securities
Litigation Reform Act of 1995. These forward -looking statements could be found
in various places throughout this presentation and include, without limitation,
statements regarding our intent, belief, targets or current expectations in
connection with: asset growth and sources of funding; growth of our fee-based
business; expansion of our distribution network; our focus on strategic
businesses; our compound annual growth rate; our risk, efficiency and
profitability targets; financing plans; competition; impact of regulation;
exposure to market risks including interest rate risk, foreign exchange risk
and equity price risk; exposure to credit risks including credit default risk
and settlement risk; projected capital expenditures; capitalization
requirements and level of reserves; liquidity; trends affecting the economy
generally; and trends affecting our financial condition and our results of
operations. While these forward -looking statements represent our judgment and
future expectations concerning the development of our business, a number of
risks, uncertainties and other important factors could cause actual
developments and results to differ materially from our expectations. These
factors include, but are not limited to: changes in capital markets in general
that may affect policies or attitudes towards lending to Mexico or Mexican
companies; changes in economic conditions, in Mexico in particular, in the
United States or globally; the monetary, foreign exchange and interest rate
policies of the Mexican Central Bank (Banco de M[]xico); inflation; deflation;
unemployment; unanticipated turbulence in interest rates; movements in foreign
exchange rates; movements in equity prices or other rates or prices; changes in
Mexican and foreign policies, legislation and regulations; changes in
requirements to make contributions to, for the receipt of support from programs
organized by or requiring deposits to be made or assessments observed or
imposed by, the Mexican government; changes in taxes; competition, changes in
competition and pricing environments; our inability to hedge certain risks
economically; economic conditions that affect consumer spending and the ability
of customers to comply with obligations; the adequacy of allowances for loans
and other losses; increased default by borrowers; technological changes;
changes in consumer spending and saving habits; increased costs; unanticipated
increases in financing and other costs or the inability to obtain additional
debt or equity financing on attractive terms; changes in, or failure to comply
with, banking regulations; and certain other factors indicated in the "Risk
Factors" section of our Registration Statement on Form F-1 (File No.
333-183409) . The risk factors and other key factors that we have indicated in
our past and future filings and reports, including those with the U.S.
Securities and Exchange Commission, could adversely affect our business and
financial performance.
Note: The information contained in this presentation is not audited.
Nevertheless, the consolidated accounts are prepared on the basis of the
accounting principles and regulations prescribed by the Mexican National
Banking and Securities Commission (Comisi[]n Nacional Bancaria y de Valores)
for credit institutions, as amended (Mexican Banking GAAP). All figures
presented are in millions of nominal Mexican pesos, unless otherwise indicated.
Historical figures are not adjusted by inflation.
|
|
Another Solid Quarter Contributing to a Strong FY12

Growth in strategic segments
         * Consumer            20.8%
         * Credit card         30.3%
         * SMEs                76.7%
         * Mortgage            11.9%
         * Insurance            32.5%
Prudent risk management
         * NPL ratio           1.7%
         * Cost of risk        2.8%
Focus on operating efficiency
         * Efficiency ratio(1) 39.5%
Achieved high profitability
          * ROAE               19.1%

     Meeting our business targets

Santander Mexico is one of the most profitable banking franchises in Mexico

Source: Company filings
Notes: 1) 12MOpex / 12M Income before opex (net of allowances)
|
|
Loan Growth Driven by 21% YoY Expansion in Retail

Source: Company filings CNBV GAAP

Notes: ** Includes middle-market, government and financial institutions
|
|
All Retail Segments Performed Well, Led by Credit Cards[]

[] Growth rates in line with targets

[] Consumer growth driven by credit cards

[] Credit card growth 1.7x  industry growth

[] Growth in mortgages above the industry

Source: Company filings CNBV GAAP
Notes:  * Includes personal and payroll loans
|
|
As well as our insurance fee business []

[] Strongest growth in life and auto insurance

[] Growth in auto insurance driven by "autocompara" campaign

[] Increase in life insurance motivated by consumer lending

Source:

Company Filings CNBV GAAP
|
|
.... while Our Strategic Focus on SMEs Continues to Support Commercial Loan
Expansion

[] In November 2012, SME effort recognized with three awards from NAFIN
activities:

* Government Providers

* Small Contributors Regime (Repecos)* Guarantees

[]   Optimized processes in order to provide faster solutions to our clients

[]   Introduced preapproved loans to SME's

[]   Middle Market growth driven partially by focus on trade finance

[]   Corporates focused on advising companies in capital market issuances

Source: Company filings CNBV GAAP
Notes:  * Includes middle-market, government and financial institutions
|
|
Healthy Loan Growth was Supported by a Strong Growth in Deposits ...

[] Balanced growth in term and demand deposits

[] Partially explained by seasonality in payrolls

[] Launched new investment products and checking accounts

[] Implemented specific services for our "Select" (VIP) client base

Source: Company filings CNBV GAAP

Notes: * Incliudes money market
|
|
.... and Further Improvements in the Liquidity Profile

[]   1bn issuance further strengthened debt maturity profile

[]   Maintain a healthy loan to deposit ratio

[]   Branch expansion to contribute to deposit growth

Source: Company filings CNBV GAAP

Notes: 1) Loans net of allowances divided by total deposits (Demand + Term)
|
|
This Strong Performance Helped Us Achieve the Highest Quarterly Net Interest
Margin in 2012...

Source: Company filings CNBV GAAP

Notes: 1) 2012 Financial margin divided by daily average interest earnings
assets
|
|
....Combined with Continued Growth in Net Commissions and Fees[]


                         2011  2012      Var $$     Var %
                        ------ --------- ---------- ---------
Insurance               2,235      2,962       727       33%
Credit Cards            2,330      2,685       355       15%
Cash Management         2,657      3,002       345       13%
Investment Fund Mgmt    1,787      1,729       -58       -3%
Financial Advisory        822      1,365       543       66%
Cap Mkts [AND] Sec        401        460        59       15%
----------------------- ------ --------- ---------- ---------
Net Commisions and Fees 10,232    12,203     1,971        19%
----------------------- ------ --------- ---------- ---------

Source: Company filings CNBV GAAP

Notes: * Includes fees from: collections and payments, account management,
foreign trade and checks
|
|
....Led to Gross Operating Income* Up 23% for the Quarter and 21% in FY12


                                     2011        2012       Var $$      Var %
                                     ----------- ---------- ----------- -----------
Financial Margin                        28,806      33,892        5,086         18%
Net Commisions and fees                 10,232      12,203        1,971         19%
Net gain /(loss) on financial assets
and liabilities                            888       2,196        1,308        147%
------------------------------------ ----------- ---------- ----------- -----------
Gross Operating Income*                 39,926      48,291        8,365         21%
------------------------------------ ----------- ---------- ----------- -----------

Source: Company filings CNBV GAAP

Notes: *Gross Operating Income does not include Other Income.
|
|
We Achieved Growth While Maintaining Strong Asset Quality ...

Source: Company filings CNBV GAAP
1) Adjusted for the following items: In 2011, the reversal of reserves for the
amount of 1,067 million. In 2012, the especial provisions related to project
finance. 12 2) 2012 Loan loss reserves divided by average loans

Adjustments

[] 3Q11 loan loss reserve release: 1,067

[] 4Q12 Project Finance:             100

Adjusted LLR up 22.6%

[] In line with retail portfolio expansion

[] Reflect higher than expected provisioning in certain consumer loans
vintages

NPL's             2011    2012  Var (bps)

Consumer          2.51%  3.50%   99
Credit Card       2.53%  2.87%   34
Mortgage          3.34   3.29%   (5)
Commercial        0.78%  0.44%  (34)
SME's             2.71%  2.08%  (63)

Total             1.69%  1.74%    5
|
|
Expenses Reflect Leasebacks, Frontloaded Branch Expansion Costs, Non-Recurring
Marketing Outlays, Seasonality ...

Administrative and Promotional Expenses

4Q12 Adjustments
[]  Incremental expenses
    --------------------
    *   Branch expansion                 127
    *   Leaseback                        100
[]  Other items
    -----------
    *   Corporate image campaign         225
    *   IPO related                       60
    *   Amortization of useless software  40

Source: Company filings CNBV GAAP
|
|
.... and Increased Investment in Workforce to Capitalize on Selective Growth
Opportunities in Mexico

                           2011      2012       Var $$      Var %
                           --------- ---------- ----------- ----------
Personnel                     7,690       8,734      1,044         14%
Admin expenses*               5,345       5,664        319          6%
Leaseholds                       980      1,261        281         29%
Others**                      2,632       3,020        388         15%
Dep. and Amort                1,464       1,557          93         6%
-------------------------- --------- ---------- ----------- ----------
 Admin. and prom. expenses   18,111      20,236      2,125         12%
-------------------------- --------- ---------- ----------- ----------

Source: Company filings CNBV GAAP
Notes: * Includes:credit cards, IT, professional fees, taxes (VAT) and duties,
         IPAB and armored car services.
       **Includes: Maintenance, office utilities, traveling expenses, and marketing,
         among others.
       1) Internal Employees
|
|
We Delivered Strong Underlying Profitability and Earnings Growth ...

Net income in line with our target

Source: Company filings CNBV GAAP
|
|
....and Remained in Line with Efficiency Targets []

Source: Company Filings CNBV GAAP
Notes:  1) 2012 Opex divided by 2012 Income before opex (net of allowances)
        2) 2012 Net fees annualized divided by 2012 Opex (net of amortizations 16 and
        depreciations)
|
|
....and Maintain Solid Profitability and Strong Capitalization []

Source: Company Filings CNBV GAAP
Notes:  1) Annualized Net income divided by Average Equity
|
|
.... Delivering A Solid Year, in Line with Our Forward -Looking Three-Year
Targets

Focus on Strategic Business

[] Consumer / Credit Cards
[] SMEs
[] Mortgages

Focus on Risk, Efficiency and Profitability

[] NPLs Ratio
[] Efficiency
[] ROAE
|
|
In Conclusion:

2012 results met our business and financial targets

Mexico's economic and political landscape appears favorable over the medium
term

Moderate financial system growth in Mexico reduces the risk of overleverage

Santander Mexico reaffirms its forward -looking targets
|
|
Consolidated Income Statement

                                                                          % Change                                  %
                                         4Q12      3Q12      4Q11                        FY 2012     FY 2011     Change
                                                                       QoQ      YoY                                YoY
                                         --------- --------- ---------                   ----------- ----------- ----------
Interest income                           14,259    13,873    12,908        2.8    10.5     55,388      46,680         18.7
Interest expense                          (5,448)   (5,291)   (5,097)       3.0      6.9  (21,496)    (17,874)         20.3
---------------------------------------- --------- --------- --------- -------- -------- ----------- ----------- ----------
Financial margin                           8,811     8,582     7,811        2.7    12.8     33,892      28,806         17.7
Allowance for loan losses                 (2,948)   (2,535)   (2,041)      16.3    44.4    (9,445)     (6,556)         44.1
---------------------------------------- --------- --------- --------- -------- -------- ----------- ----------- ----------
Financial margin after allowance for        5,863    6,047     5,770      (3.0)      1.6    24,447      22,250          9.9
loan losses
Commision and fee income                    3,982     3,783     3,121       5.3    27.6     14,773      12,524         18.0
Commision and fee expense                   (643)     (718)     (625)    (10.4)      2.9   (2,570)     (2,292)         12.1
Net gain /(loss) on financial assets and      416       920      (51)    (54.8) (915.7)      2,196          888      147.3
liabilities
Othe operating income / (loss)                192        88       299    118.2   (35.8)      2,955       1,067       176.9
Administrative and promotional            (6,022)   (5,179)   (5,221)      16.3    15.3   (20,236)    (18,111)         11.7
expenses
---------------------------------------- --------- --------- --------- -------- -------- ----------- ----------- ----------
Total operating income                     3,788     4,941     3,293     (23.3)    15.0     21,565      16,326         32.1
Equity in results of subsidiaries and          19        18        17       5.6    11.8          73          70         4.3
associated companies
---------------------------------------- --------- --------- --------- -------- -------- ----------- ----------- ----------
Income from continuing operations           3,807    4,959     3,310     (23.2)    15.0     21,638      16,396         32.0
before income taxes
Current income taxes                      (1,680)   (1,359)    1,397       23.6 (220.3)    (5,858)     (4,268)         37.3
Deferred income taxes                      1,183        614   (1,315)      92.7 (190.0)      2,043       1,734         17.8
---------------------------------------- --------- --------- --------- -------- -------- ----------- ----------- ----------
Income from continuing operations          3,310     4,214     3,392     (21.5)    (2.4)    17,823      13,862         28.6
Discontinued operations                          0         0    4,348       0.0 (100.0)            0     4,822     (100.0)
---------------------------------------- --------- --------- --------- -------- -------- ----------- ----------- ----------
Consolidated net income                    3,310     4,214     7,740     (21.5)  (57.2)     17,823      18,684        (4.6)
Non-controlling interest                         0         0         2      0.0 (100.0)          (1)         (1)        0.0
---------------------------------------- --------- --------- --------- -------- -------- ----------- ----------- ----------
Net income                                 3,310     4,214     7,742     (21.5)  (57.2)     17,822      18,683        (4.6)
                                         ---------                                       -----------

Source: Company filings CNBV GAAP
Millions of pesos
|
|
Consolidated Balance Sheet

                                                   4Q12       3Q12       4Q11           % Change
                                                                                    ---------------------
                                                                                    QoQ        YoY
                                                   ---------- ---------- ---------- ---------- ----------
Cash and due from banks                                81,626     74,579     66,598        9.4      22.6
Margin accounts                                         3,995      3,817      8,276        4.7     (51.7)
Investment in securities                             169,646    202,203    222,275      (16.1)     (23.7)
Debtors under sale and repurchase agreements            9,471      4,458      3,478     112.4      172.3
Derivatives                                            80,621     89,389     85,978      (9.8)      (6.2)
Valuation adjustment for hedged financial assets          210        240        122     (12.5)      72.1
Total loan portafolio                                350,683    343,383    313,673         2.1      11.8
Allowance for loan losses                            (11,580)   (11,360)   (11,191)        1.9        3.5
Loan portafolio (net)                                339,103    332,023    302,482         2.1      12.1
Other receivables (net)                                46,159     47,415     31,912      (2.6)      44.6
Foreclosed assets (net)                                   150        172        253     (12.8)     (40.7)
Property, furniture and fixtures (net)                  4,095      3,770      5,592        8.6     (26.8)
Long-term investment in shares                            236        218        234        8.3        0.9
Deferred taxes (net)                                   10,584      9,155      8,063       15.6      31.3
Deferred charges, advance payments and intangibles      4,277      3,693      3,722       15.8      14.9
Other assets                                              164        290        190     (43.4)     (13.7)
================================================== ========== ========== ========== ========== ==========
Total assets                                        750,337    771,422    739,175       (2.7)        1.5
Deposits                                             397,546    358,606    330,870        10.9      20.2
Bank and other loans                                   27,463     34,339     19,554     (20.0)      40.4
Creditors under sale and repurchase agreements         73,290   106,306    120,590      (31.1)     (39.2)
Collateral sold or pledged as guarantee                 6,853     17,972     15,478     (61.9)     (55.7)
Derivatives                                            79,561     86,613     90,649      (8.1)     (12.2)
Other payables                                         66,756     71,702     72,493      (6.9)      (7.9)
Deferred revenues                                       1,041      1,091      1,062      (4.6)      (2.0)
================================================== ========== ========== ========== ========== ==========
Total liabilities                                   652,510    676,629    650,696       (3.6)        0.3
================================================== ========== ========== ========== ========== ==========
Total stockholders[]equity                            97,827     94,793     88,479         3.2      10.6
                                                   ----------

Source: Company filings CNBV GAAP
Millions of pesos
|
|
Mexico's Attractive Macroeconomic Environment []

Source: GDP -- INEGI
        CETE, Inflation, Exchange Rate -- BANXICO
        Estimates - SANTANDER
|
|
Loan Penetration and Savings in the System Show Positive Trends []

Source: Deposits and Loans -- CNBV Banks -- Billions of Pesos. Deposits as
reported by CNBV include term and time deposits, debt issuances and interbank
loans.
|
Item 3
Grupo Financiero Santander México, S.A.B. de C.V.
Complementary information for the Fourth Quarter of 2012,
in compliance with the obligation of reporting transactions with derivative financial instruments.
III. Qualitative and Quantitative Information
| i. | Management of policies on the use of derivative financial instruments. |
The policies of the Institution allow the use of derivative products for hedging and/ or trading purposes.
The main objectives of the transactions with these products are for hedging risks and maximization of profitability.
The Institution uses the following instruments:
Forwards
Futures
Options
Swaps
Swaptions
Depending of the portfolios, strategies to be implemented may be for hedging or trading purposes.
Trading markets:
Exchange-traded
Over the Counter
Eligible counterparties: domestic and foreign counterparties having internal approvals.
The appointment of calculation agents is carried out in the legal documents dully executed by the parties. For the valuation of the instruments, the prices published by authorized Suppliers of Prices are used.
The main terms or conditions of the agreements are based in international ISDA or the domestic standard agreement.
Specific policies on margins, collaterals and credit lines are detailed in the internal manuals of the Institution.
Comprehensive Risk Management
Risk management is considered by Grupo Financiero Santander as a competitive element of strategic nature with the purpose of maximizing the value for the stockholder. This management is defined, from a conceptual and organizational sense, as a comprehensive management of the different risks (market risk, liquidity risk, credit risk, counterparty risk, operative risk, legal risk and technological risk) assumed by the institution for the development of its activities. The management of the risk inherent to transactions is essential for understanding and determining the behavior of the financial condition of the institution and the creation of long-term value.
In order to comply with the provisions regarding the Comprehensive Risk Management applicable to credit institutions, issued by the National Banking and Exchange Commission, the Board of Directors agreed to create the Comprehensive Risk Management Committee of the institution, to work pursuant to the rules set by such regulations. This Committee gathers every month and verifies that the transactions are according to the objectives, policies and procedures approved by the Board of Directors for the Comprehensive Risk Management.
The Comprehensive Risk management Committee delegates in the Comprehensive Risk Management Unit the responsibility for the implementation of procedures for the measure, administration and control of risks according to the applicable policies; such Unit has the faculty to authorize amounts greater than the stipulated limits and in such cases, the Board of Directors shall be informed on such deviations.
Market Risk
The Market Risk Management department of the Comprehensive Risk management Unit is responsible for recommending the policies on market risk management of the institution, and to establish the parameters for risk measuring, and to provide reports, analysis and assessments to the senior management, to the Comprehensive Risk Management Committee and to the Board of Directors.
Market risk management consists in identifying, measuring, monitoring and controlling risks arising from fluctuations in the interest rates, FX rates, market prices and other risk factors in money markets, capital markets and derivatives markets in which the institution is exposed by its position.
The market risk measurement quantifies the potential variation in the value of the positions as a consequence of changes in the market risk factors.
Depending on the nature of the activities of each business unit, debt and capital instruments are registered as securities for trade, securities available for sale and/or securities held to maturity. The main characteristic that identifies securities available for sale as such is their permanent nature and they are managed as a structural part of the balance sheet. The institution has established provisions that all securities available for sale must fulfill, as well as adequate controls for assuring the compliance of such provisions.
Whenever significant risks are identified, they are measured and limits are allocated in order to assure an adequate control. Global measurement of risk is carried out via a combination of the methodology applied to Portfolios for Trade and to the management of Assets and Liabilities.
Portfolios for Trade
In order to measure the risk in a global approach, the methodology of Value at Risk (VaR) is used. VaR is defined as the statistical estimate of the potential loss of value of a given position, during certain period and at certain confidence level. VaR provides a universal measure of the level of exposure of the different risk portfolios; it allows the comparison of the risk level assumed in different securities and markets and expresses the level of each portfolio through a unique figure in economic units.
VaR is calculated via historical simulation, with a 521 working-days window (520 percentage changes) and a one-day horizon. The calculation is performed from a series of simulated gains and losses with 1% percentile at constant pesos and with pesos decreasing on an exponential basis, with a decrease factor that is reviewed on annual basis, the most conservative measure is the one to be reported. A confidence level of 99% is assumed.
It is important to mention that a limitation of the historical simulation method is that the recent past will reproduce itself in the near-future
Likewise, monthly simulations of gains or losses of portfolios are carried out by revaluating such portfolios under different scenarios (Stress Test). Such estimates are generated using two different methods:
| | · | Applying to risk factors the percentage changes observed in certain periods including relevant market turbulences. |
| | · | Applying to risk factors changes that depend on the volatility of each risk factor. |
On a monthly basis “back testing” is carried out to compare daily gains and losses that would have been observed is the same positions had been maintained, taking into account only the change in value at risk in order to be able to fine tune the models. Even though these reports are prepared on a monthly basis, they include daily tests.
Management of Assets and Liabilities
Commercial banking activities of the institution generate important balance sheet amounts. The Assets and Liabilities Committee (ALCO) is responsible for determining the guidelines for the management of financial margin risk, net worth value and liquidity that must be followed by the different commercial portfolios. Pursuant to this approach, the General Direction of Finances has the responsibility to execute the strategies defined by the Assets and Liabilities Committee in order to modify the risk profile of the commercial portfolio by following the corresponding policies. Compliance with information requirements for interest rate, Exchange rate and liquidity risks is fundamental.
As part of the financial management of the institutions, sensitivity to financial margin (NIM) and net worth value (MVE) of the different balance sheet items is analyzed in comparison to variations in interest rates. This sensitivity is derived from the difference between maturity dates of assets and liabilities and the dates interest rates are modified. The analysis is performed from the classification of each item sensitive to interest rate throughout time, according to their repayment, maturity or contractual modification of the applicable interest rate.
Using simulation techniques, the predictable value of the financial margin and the net worth value are measured in different interest rate scenarios, and their sensitivity under extreme movement of such scenarios. As of December 2012:
| MM MXP | | 1% NIM Sensitivity | | | 1% MVE Sensitivity | |
| Bank & Casa de Bolsa | | Total | | | Derivatives | | | Non Derivatives | | | Total | | | Derivatives | | | Non Derivatives | |
| | | | | | | | | | | | | | | | | | | |
| Balance MXP GAP | | | 865 | | | | 67 | | | | 798 | | | | -2,425 | | | | 667 | | | | -3,092 | |
| Balance USD GAP | | | 124 | | | | -91 | | | | 215 | | | | 629 | | | | -90 | | | | 719 | |
The Assets and Liabilities Committee adopts investment and hedging strategies in order to maintain such sensitivities within the target range.
Limits
Limits are used to control global risk of the financial group derived from each portfolio and books. The structure of limits is used to control exposures and to establish the total risk authorized to business units. These limits are established for VaR, Loss alert, maximum loss, equivalent volume of interest rate, delta equivalent in variable interest, open foreign currency positions, sensitivity of financial margin and sensitivity of net worth value.
Liquidity Risk
Liquidity risk is related to the ability of the institution to finance acquired commitments at reasonable market prices, as well as to fulfill business plans with stable financing sources. Risk factors may be external (liquidity crisis) and internal due to excessive concentration of maturities.
The institution carries out a coordinated management of maturities of assets and liabilities, and oversees the maximum timing difference profiles. This monitoring is based in the analysis of maturities of assets and liabilities, both contractual and managerial. Liquidity Risk is limited in terms of an accrued liquidity level during one month and in terms of a stipulated liquidity ratio.
Liquidity Gap
The following table shows the liquidity GAP of different maturities as of December 31, 2012:
| Millions of Pesos | | Total | | 1D | 1W | 1M | 3M | 6M | 9M | 1Y | 5Y | >5y |
| | | | | | | | | | | | | |
| Structural Gap | | 78,251 | | 75,276 | -35,326 | -23,915 | 9,925 | 17,509 | 17,165 | 10,840 | 5,771 | 1,007 |
| Non Derivative | | 69,738 | | 75,160 | -35,484 | -23,203 | 9,432 | 18,586 | 19,480 | 10,446 | -124 | -4,554 |
| Derivatives | | 8,513 | | 116 | 158 | -712 | 493 | -1,078 | -2,314 | 394 | 5,895 | 5,561 |
Credit Risk
Management of credit risk of the Institution is developed differently for the different segments of clients along the three phases of the credit process: acceptance, follow-up and recovery.
From a global perspective, management of credit risk in the institution is responsible for the identification, measurement, integration and assessment of the aggregated risk and the profitability according to such risk; with the purpose of oversee the levels of risk concentration and to adapt them to the limits and objectives previously established.
Risks receiving an individual treatment (risks with companies, institutions and financial entities) are identified and taken apart from those other risk that are managed in standardized manner (consumer and mortgages credits to individuals, loans to businesses and small enterprises)
Risks managed on individual basis are subject to a specific solvency or rating system with a related probability of failure that allows the measuring of the risk for each client and for each transaction from the beginning. The assessment of the client, after analyzing other relevant risk factors in different areas, is adjusted according to the special characteristics of the transaction (guarantee, term, etc,)
Standardized risks require, due to their special characteristics (great number of transactions for relatively low amounts), a different management that allows an efficient process and effective use of resources, so automated decision tools are used (expert and credit scoring systems).
Management of loans to companies is complemented, during the follow-up phase, with the so called “system of special monitoring” that determines the policy to be followed in the management of the risks with companies or groups rated within such category. Different situations of levels of monitoring are identified and generate different actions. A special monitoring grade is given in the case of alert signals, systematic reviews, or specific initiatives promoted by the Risks Department or Internal Audit.
Recovery Units constitute a critical element in the management of irregular risk, in order to minimize the final loss for the institution. These units are responsible for a specialized management of the risk from the moment they are classified as irregular risk loans (defaulting payment).
The institution has carried out a policy for the selective growth of risk and a strict treatment of late payments and the creation of the corresponding provisions, based in the prudent criteria defined by the Group.
Probability of Default and Expected Losses
Pursuant to the provisions on Comprehensive Risk Management included in the general regulations applicable to credit institutions, as part of the credit risk management, credit institutions must determine the probability of default. The system allows the calculation of the probability for the different loans portfolios:
| | a. | The probability of failure (PD) for “No Retail” portfolios is determined via the fine tune of the ratings of clients in a given moment, based in the Monthly Default Rates observed during a period of five years. Such Default Rates are adjusted to an economic cycle of ten years. For “Retail” portfolios, the standard default probabilities set by the Basilea Convention are used. |
| | b. | Once the probability of default is determined, the parameters of “severity of Loss” (LGD) and “Exposure at Default” (EAD) stipulated in Basilea, are taken into consideration. |
Once the abovementioned factors are obtained, the Expected Loss (PE) is calculated as follows:
Expected Loss = Probability of Default x Severity of Loss x Exposure at Default
i.e.: PE = PD * LGD * EAD
Counterparty Risk
Included in the credit risk, there is a concept that, due to its characteristics, it requires a special management: the Counterparty Risk.
Counterparty Risk is the risk the Institution assumes with governmental entities, financial institutions, corporations, companies and individuals in their treasury activities and correspondent bank activities. The measurement and control of the Credit Risk in Financial Instruments, Counterparty Risk, is carried out by a special unit with an organizational structure independent from the business areas.
The control of Counterparty Risk is performed daily via the Kondor Global Risk (KGR) system, which informs the credit line available with any counterparty, in any product of the financial markets as well as the maximum term approved.
For the control of the counterparty lines the Equivalent Credit Risk (REC) is used. REC is an estimate of the potential loss if the counterparty stops complying with its payment obligations. REC takes into account ratios per product for measuring the potential risk and includes the current exposure with each counterpart; in consequence, REC varies depending on the type of product and term of transaction.
Equivalent Credit Risk (REC) is defined as the amount the Bank may loss in transactions with active clients if such client does not comply with his/her obligations. A position measured via REC may be constituted by several individual transactions, in different products and different maturity dates, and the total REC for each transaction represents the global position with each counterpart.
Equivalent Credit Risk (REC) is an estimate of the amount the Institution may lose in current transactions with certain counterparty, if such counterparty commits a default in any moment until the maturity date of transactions. REC takes into account the Current Credit Exposure, which is defined as the cost to
substitute the transaction at market value provided that this value is positive for the institution, and it is measured as the market value (mark to market) of the transaction (MtM).
In addition, REC includes the Potential Credit Exposure or Potential Additional Risk (RPA), which represents the possible evolution of the current credit exposure until maturity, given the characteristics of the transaction and the possible variations in the market factors. Gross Equivalent Credit Risk considers all the definitions previously described, excluding credit risk reduction because of netting or because of collateral agreements.
For the calculation of Net REC, mitigating factors of the counterparty credit risk are taken into consideration, such as collaterals, netting agreements, among other. The methodology continues to be effective.
In addition to the Counterparty Risk, there is the Settlement Risk, which is present in every transaction at its maturity date, when the possibility that the counterparty does not comply with its payment obligations arises, once the institution has complied with its obligations by issuing payment directions.
For the process of control for this risk, the Deputy General Direction of Financial Risks oversees on a daily basis the compliance with the limits on counterparty credit risks by product, term and other conditions stipulated in the authorization for financial markets. Likewise, it is the responsible for communicating on a daily bases, the limits, consumptions and any incurred deviation or excess.
On a monthly basis, a report is presented to the Comprehensive Risk management Committee, and on quarterly basis, to the Board of Directors, with respect to the limits to Counterparty Risks, Issuer Risks and current consumptions, as well as incurred excesses and transactions with non authorized customers. In addition, it informs the calculation of the Expected Loss for current transactions in financial markets at the closing of every month and different scenarios of stress of Expected Loss. All of the above according to the methodologies and assumptions approved by the Comprehensive Risk Management Committee..
Currently, we have approved lines of Counterparty Risks in Grupo Financiero Santander for the following segments: Mexican Sovereign Risk and Domestic Development Banking, Foreign Financial Institutions, Mexican Financial Institutions, Corporations, Companies Banking-SGC, Institutions Banking, Large Enterprises Unit, Project Finance.
Net Equivalent Credit Risk of the lines of Counterparty Risk and Issuer Risk of the Institution as of the end of December, 2012, is concentrated in 90.33% in the Sovereign Risk segment, Development Banking and Financial Institutions; 9.19% in the Corporate segment; 0.49% in the Companies segment.
Maximum Gross Equivalent Credit Risk of the lines of Counterparty Risk of the Institution at the end of December 2012 which it is related to derivatives transactions was 9,996 million USA Dollars. According to the type of the derivative, was 5,908 million USA Dollars Gross REC related to interest rate derivatives, 3,889 million USA Dollars Gross REC related to foreign exchange derivatives, 3 million USA Dollars Gross REC related to fixed income derivatives and 196 million USA Dollars Gross REC related to equity derivatives.
The quarterly average of the Net Equivalent Credit Risk of the lines of Counterparty Risk and Issuer Risk of the Institution, for the period October-December, 2012 was 19,037.48 million USA Dollars Net REC in the Sovereign Risk, Development Banking and Financial Institutions segment; 1,708.73 million USA Dollars Net REC in Corporate segment; 95.03 million USA Dollars Net REC in the companies segment.
The Expected Loss of the Institution at the end of December, 2012, is concentrated in 22.71% in the Sovereign Risk, Development Banking and Financial Institutions segment; 71.74% in the Corporate segment; 5.55% in the Companies segment.
The quarterly average of the Expected Loss of the lines of Counterparty Risk and Issuer Risk of the Institution, for the period October-December 2012 was 2.6 million USA Dollars in the Sovereign Risk, Development Banking and Financial Institutions segment; 7.6 million USA Dollars in Corporate segment; 0.6 million USA Dollars in the companies segment.
The segments of Mexican Financial Institutions and Foreign Financial Institutions are very active counterparties with whom the institution has current positions of financial instruments with Counterparty Credit Risk. It is important to mention that Gross Equivalent Credit Risk is mitigated by netting agreements (ISDA-CMOF) and, in some cases, by collateral agreements (CSA-CGAR) or revaluation agreements with counterparties, which consists on Net Equivalent Credit Risk.
Considering total received collateral at the end of December 2012, 99.91% is concentrated on cash collateral and 0.09% consisted on negotiable debt obligations issued by the Government of the United Mexican States.
Operating Risk
With respect to Operating Risk, and pursuant to the corporate methodology, the institution has established policies, procedures and methodologies for the identification, control, mitigation, monitoring and reporting of operating risks.
For the identification and classification of operating risks, different categories and business lines defined by national and internal regulating organisms are used. The methodology is based in the identification and documentation of the corresponding risks, controls and processes, and quantitative and qualitative tools are used, such as self-assessment questionnaires, development of historical data bases and Operating Risk indicators, etc. for their control, mitigation and reporting.
Legal Risk
Legal Risk is defined as the potential loss due to the failure to comply with the applicable legal and administrative regulations, the issue of administrative and judicial resolutions against the institution and the application of fines, with respect to the transactions carried out by the Institution.
Pursuant to the provisions regarding the Comprehensive Risk Management, the following activities are performed: a) Establishment of policies and procedures for analyzing the legal validity and the proper execution of the legal acts. b) estimates of the amount of potential losses derived from judicial or administrative orders against the Institution and the possible application of fines c) Analysis of the legal acts governed by a legal system different to the Mexican laws, d) communication to directors and employees on the legal and administrative regulations applicable to transactions and e) the performance, at least on annual basis, of internal legal audits.
Technological Risk
Technological risk is defined as the potential loss due to damages, discontinuation, alterations or failures derived from the use or dependence on hardware, software, systems, applications, networks and any other data channel distribution for the provision of banking services to the clients of the Institution.
The Institution has adopted a corporate model for the management of Technological Risks, integrated to the processes of service and support to computing areas in order to identify, oversee, control, mitigate and report the Computing Technology Risks the transaction is exposed to, with the aim of establishing control measures that decrease the probability of risks to occur.
Processes and levels of authorization
Pursuant to internal regulations, all the products and services traded by the Institution are approved by the Local Committee for New Products (CLNP) and by the Global Committee for New Products (CGNP). Those products or services that are modified or extended with respect to their original approval must be approved by the CLNP and, depending of their relevance, the CGNP must approve them too.
All areas taking part in the operation of the product or service, depending on the nature of such product or service, as well as the areas responsible for their accounting registration, legal formalization, fiscal treatment, risk assessment, etc. are present in the Committee. All approvals shall be unanimous as there are no authorizations approved by majority of votes. In addition to the Committee’s approval, there are products that require authorizations from local authorities, and therefore, the Committee’s approvals are subject to the authorizations issued by the competent authorities in each case.
Finally, all the approvals shall be authorized by the Comprehensive Risk Management Committee.
Independent Reviews
The Institution is subject to the monitoring and supervision of the National Bank and Exchange Commission, the Central Bank of Mexico and the Bank of Spain, and such monitoring and supervision is exercised via follow-up processes, inspection visits, information requests, delivery of documents and reports.
Likewise, periodic reviews are performed by Internal and External Auditors.
| ii. | General description of the valuation techniques |
Derivative financial securities are valued at reasonable value, according to the accounting rules established in the Circular Letter for Credit Institutions issued by the National Banking and Exchange Commission, in Principle B-5 “Derivative Financial Instruments and hedging Transactions” and the provisions in Principle A-2 “Application of specific rules”, and the provisions in the specific rule included in Bulletin C-10 of the Financial Information Rules.
| A. | Methodology of Valuation |
Valuation is made at the corresponding closing market price. Prices are provided by the supplier of prices.
| | b) | Over-the-Counter Markets |
| | i) | Derivative financial instruments with optionality. |
In the majority of the cases, a general form of the Black & Scholes model is used. Such model assumes that the underlying product follows a lognormal distribution. For exotic products or when payment depends on the trajectory of any market variable, MonteCarlo simulations are used. In this case, it is assumed that logarithms of the different variables follow a multi-varied normal distribution.
| | ii) | Derivative financial instruments with no optionality. |
The valuation technique is to obtain the present value of the estimated future flows.
In all cases, the Institution carries out the valuation of its positions and registers the corresponding value. In some cases, a different calculation agent is designated, and such calculation agent may be the counterparty or a third party.
In the performance of its commercial banking activities, the Institution has tried to cover the evolution of the financial margin of structured portfolios that are exposed to adverse movements in interest rates. The ALCO, the body responsible for the management of long-term assets and liabilities, has constituted the portfolio via which the Institution achieves such hedge.
An accounting hedge is defined as a transaction that complies with the following conditions:
a. A hedge relationship is designated and documented from the beginning in an individual file, where its objective and strategy is established.
b. The hedge is effective for the compensation of variations in the reasonable value or in the cash flows attributed to such risk, according to the risk management documented at the beginning.
The Management of the Institution performs derivative transactions for hedging purposes with swaps.
Derivatives for hedging purposes are valued at market value, and the effect is recognized depending on the type of accounting hedge, pursuant to the following:
a. In the case of fair value hedges, they are valued at market value for the risk covered, the primary position and the hedging derivative instrument, and the net effect is registered in the statement of income of the corresponding period.
b. In the case of cash flow hedges, the hedging derivative instrument is valued at market value. The effective portion of the hedge is registered in the comprehensive income account, within the stockholders’ equity, and the ineffective portion is registered in the statement of income.
The Institution ceases the recording of hedges at the maturity date of the derivative, or when such derivative is sold, cancelled or exercised; when the derivative does not reach a high efficiency in
compensating the changes in the reasonable value or the cash flows of the covered item, or when the Institution decides to cancel the hedge.
It shall be fully evidenced that the hedge fulfills the objective for which derivatives were contracted for. This effectiveness requirement assumes that the hedge must comply with a maximum range of deviation with respect to the initial objective of 80% to 125%.
In order to demonstrate the efficacy of hedges, two tests are to be carried out:
| | a) | Forward-looking Test: it is demonstrated that, in the future, the hedge will be within the aforementioned range of deviation. |
| | b) | Retrospective Test: This test reviews if, in the past, from its initial date to now, the hedge has been maintained within the allowed range of deviation. |
In the cases of Fair Value Hedges and the Cash Flow Hedges, they are retrospective and forward-looking efficient and within the allowed maximum range of deviation.
The most relevant reference variables are:
Exchange Rates
Interest Rates
Shares
Baskets of shares and stock indexes.
Derivative financial instruments for trading and hedging purposes are valued on a daily basis.
iii. Management of internal and external sources of liquidity that may be used for the compliance of requirements related to derivative financial instruments.
Resources are obtained via the National and International Treasury departments.
iv. Changes in exposure to identified risks, contingencies and events, known or expected, in derivative financial instruments.
At the end of the fourth quarter of 2012, the Institution has no situation or contingency such as changes in the value of the underlying asset or the reference variables, that may cause the use of the derivative financial instruments to be different to their original intended use, a significant change in their scheme or the total or partial loss of the hedge, requiring the Issuer to assume new obligations, commitments or variations in its cash flow or affecting its liquidity (day trade calls), nor contingencies or events known or expected by the Management that may affect future reports.
During year 2012, the number or expired derivative financial instruments and closed positions was as follows:
| Description | | Maturities | | | Closed Positions | |
| | | | | | | |
| Caps and Floors | | | 821 | | | | 27 | |
| Equity Forward | | | 173 | | | | 52 | |
| OTC Equity | | | 7,880 | | | | 282 | |
| OTC Fx | | | 2,968 | | | | 340 | |
| Swaptions | | | 83 | | | | 1 | |
| Fx Forward | | | 3,113 | | | | 294 | |
| IRS | | | 1,477 | | | | 2,397 | |
| CCS | | | 172 | | | | 61 | |
| Bond Forward | | | 36 | | | | 0 | |
| | | | | | | | | |
The amount of day trade calls performed during the quarter was the necessary for covering contributions to organized markets and the requirements in collateral agreements.
During the 4Q2012, there were no defaults by counterparties.
IV. Sensitivity Analysis
| i. | Identification of Risks |
Sensitivity measures of market risk associated with securities and derivative financial instruments are those that measure the change (sensitivity) of the market value of the financial instrument concerned, when changes in each of the risk factors associated with same occur.
The sensitivity of the value of a financial instrument when changes in market factors occur and is determined by the full instrument revaluation.
The sensitivities are detailed below according to each risk factor and associated historical consumption of the trading book.
The management strategy of the organization is integrated with security positions and derivatives. The latter are used largely to mitigate the market risk of the first. In view of the above, the sensitivities or exposures as described below are both types of instruments considered as a whole.
1. Sensitivity to risk factor “Equity (delta EQ)”
The EQ delta shows the change in the portfolio's value in relation to changes in the prices of equities.
The EQ delta calculated for the case of derivative financial instruments considered the relative change of 1% in the prices of the underlying assets in equities, in the case of equities, this considers the relative variation of 1% of market price title.
2. Sensitivity to risk factor “Foreign Exchange”, (delta FX)
The FX delta shows the change in the portfolio's value in relation to changes in asset prices exchange rate.
The FX delta calculated for the case of derivative financial instruments considered the relative change of 1% in the prices of the underlying assets of the exchange rate, in the case of currency positions, this considers the relative variation of 1% of the corresponding exchange rate.
3. Sensitivity to risk factor “Volatility” (VEGA)
Vega sensitivity is the measure resulting from changes in the volatility of the underlying asset (the reference asset). Vega risk is the risk that a change in the volatility of the underlying asset value, that results in a change in the market value of the derivative.
The calculation of Vega sensitivity, considers the absolute change of 1% in the volatility of the underlying asset value.
4. Sensitivity to risk factors “Interest Rate” (Rho)
This sensitivity quantifies the change in value of financial instruments for the trading portfolio in the face of a parallel increase in the interest rate curves of a basis point.
The table below presents the sensitivities described above corresponding to the position of the trading portfolio.
| SENSITIVITY ANALYSIS |
| (Data in MX$) | | |
| | | | |
| Total rate sensitivity | | |
| | MXP | OTHER CURRENCIES | |
| Sens. a 1 Bp | -2.14 | 0.37 | |
| | | | |
| Vega Risk factor | | |
| | EQ | FX | IR |
| Total | 4.03 | 0.71 | -6.37 |
| | | | |
| Delta Risk Factor (EQ and FX) | | |
| | EQ | FX | |
| Total | 2.02 | 1.65 | |
It is considered that the above sensitivity table reflects prudent management of the trading portfolio of the institution with respect to risk factors.
| ii. | Stress Test for Derivative Financial Instruments |
The following are various stress test scenarios considering various scenarios calculated for the trading portfolio of the Institution.
| | o | Probable scenario: This scenario was defined based in the movements derived from a standard deviation, with respect to risk factors that have an influence over the valuation of financial instruments. Specifically: |
| | o | Risk factors of Interest Rate (“IR”), volatility (“Vol”) and rate of Exchange (“FX”) were incremented in a standard deviation. |
| | o | Risk factors with respect to stock market (EQ) were decreased in a standard deviation. |
| | o | Possible scenario: Under this scenario, as requested in the official letter, risk factors were modified in 25%. Specifically: |
| | o | Risk factors: IR, Vol and FX were multiplied by 1.25 that means, they were incremented in 25%. |
| | o | Risk factor EQ was multiplied by 0.75 that means, it was decreased in 25%. |
| | o | Remote scenario: under this scenario, as requested in the official letter, risk factors were modified in 50%. Specifically: |
| | o | Risk factors IR, Vol and FX are multiplied by 1.50, that is, they were incremented in 50%. |
| | o | Risk factor EQ was multiplied by 0.5, that is, it was decreased a 50%. |
| iii. | Effect in the Income Statement |
The following table shows the possible income (loss) for the trading portfolio of the institution, in millions of pesos for each stress scenario:
Summary of Stress Test Analysis
| Risk Profile | Stress all factors |
| Probable scenario | -79 |
| Remote scenario | -1,443 |
| Possible scenario | -493 |
11