Exhibit 99.3
ENERGY TRANSFER PARTNERS, L.P.
AND SUNOCO LP RETAIL DROP DOWN
PIPE INVESTOR PRESENTATION
November 11, 2015
SUNOCOLP
ENERGY TRANSFER
ENERGY TRANSFER
Private and Confidential
FORWARD-LOOKING STATEMENTS AND NON-GAAP MEASURES SUNOCOLP
Some of the statements in this presentation constitute “forward-looking statements” about Sunoco LP (“SUN”), Energy Transfer Equity, L.P. (“ETE”), Energy Transfer Partners, L.P. (“ETP”), and their respective affiliates that involve risks, uncertainties and assumptions, including, without limitation, our discussion and analysis of our financial condition and results of operations and our expectations regarding the acquisition of ETP’s remaining wholesale fuel and retail assets (the “Retail Acquisition”). These forward-looking statements generally can be identified by use of phrases such as “believe,” “plan,” “expect,” “anticipate,” “intend,” “forecast” or other similar words or phrases in conjunction with a discussion of future operating or financial performance. Descriptions of SUN’s, ETE’s, ETP’s and their respective affiliates’ objectives, goals, targets, plans, strategies, costs, anticipated capital expenditures, expected cost savings, potential acquisitions and related financial projections are also forward-looking statements. These statements represent present expectations or beliefs concerning future events and are not guarantees. Such statements speak only as of the date they are made, and we do not undertake any obligation to update any forward-looking statement.
We caution that forward-looking statements involve risks and uncertainties and are qualified by important factors that could cause actual events or results to differ materially from those expressed or implied in any such forward-looking statements.
For a discussion of these factors and other risks and uncertainties, please refer to SUN’s, ETE’s and ETP’s filings with the Securities and Exchange Commission (the“SEC”), including those contained in SUN’s 2014 Annual Report on Form10-K and Quarterly Reports on Form10-Q which are available at the SEC’s website at www.sec.gov.
This presentation includes certain projections that assume that the proposed Retail Acquisition will be completed. The Retail Acquisition is expected to close in Q1 2016 and will be subject to customary closing conditions. The PIPE financing referenced herein is not contingent upon the closing of the Retail Acquisition.
This presentation includes certain non-GAAP financial measures as defined under SEC Regulation G. A reconciliation of those measures to the most directly comparable GAAP measures is provided in the appendix to this presentation. We define EBITDA as net income before net interest expense, income tax expense and depreciation and amortization expense. Adjusted EBITDA further adjusts EBITDA to reflect certain other non-recurring and non-cash items. Distributable cash flow represents Adjusted EBITDA less cash interest expense, cash tax expense, maintenance capital expenditures, and other non-cash adjustments.
2
EXECUTIVE SUMMARY SUNOCOLP
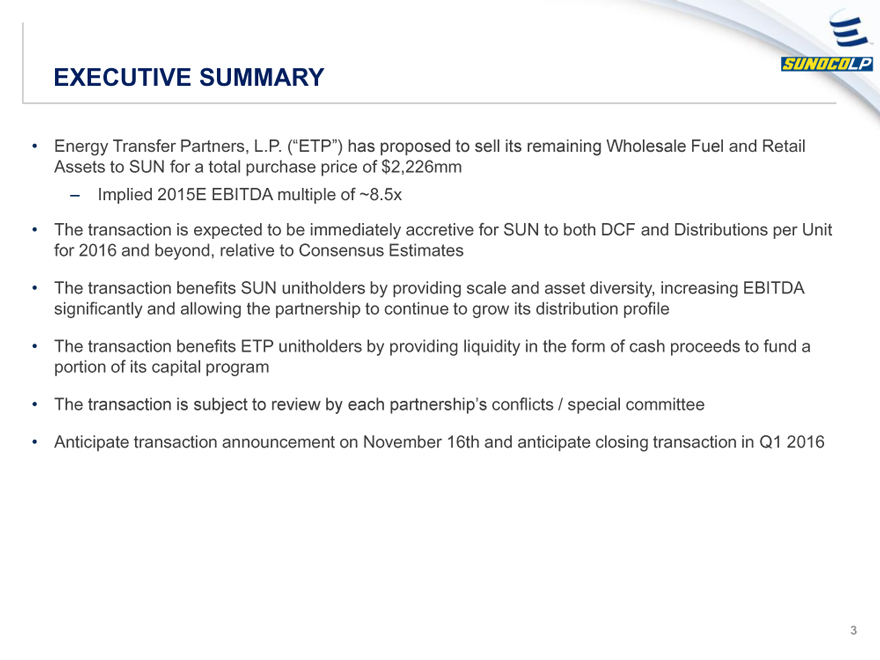
Energy Transfer Partners, L.P. (“ETP”) has proposed to sell its remaining Wholesale Fuel and Retail Assets to SUN for a total purchase price of $2,226mm – Implied 2015E EBITDA multiple of ~8.5x
The transaction is expected to be immediately accretive for SUN to both DCF and Distributions per Unit for 2016 and beyond, relative to Consensus Estimates
The transaction benefits SUN unitholders by providing scale and asset diversity, increasing EBITDA significantly and allowing the partnership to continue to grow its distribution profile
The transaction benefits ETP unitholders by providing liquidity in the form of cash proceeds to fund a portion of its capital program
The transaction is subject to review by each partnership’s conflicts / special committee
Anticipate transaction announcement on November 16th and anticipate closing transaction in Q1 2016
3
PROPOSED DROP DOWN TRANSACTION OVERVIEW SUNOCOLP
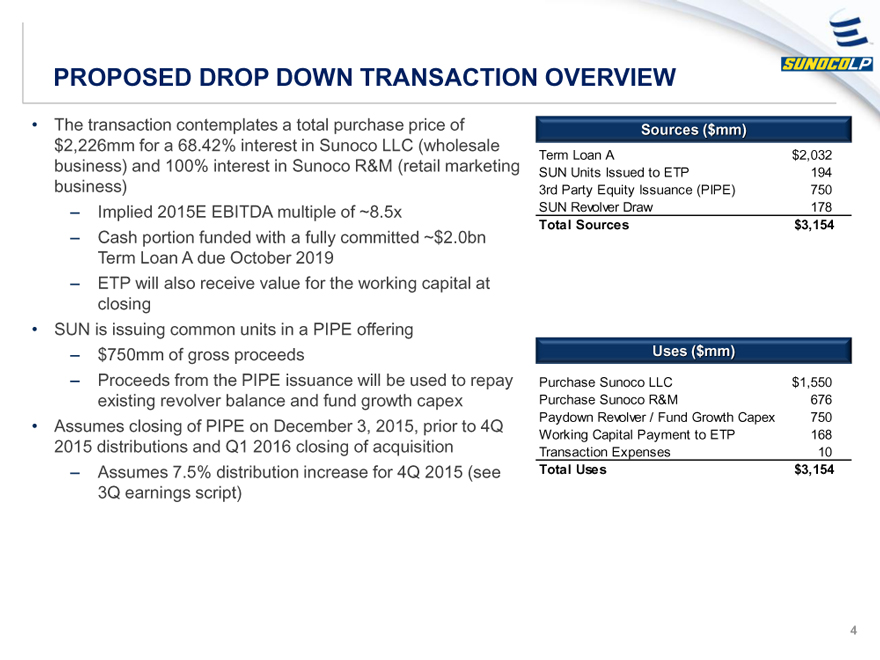
The transaction contemplates a total purchase price of $2,226mm for a 68.42% interest in Sunoco LLC (wholesale business) and 100% interest in Sunoco R&M (retail marketing business)
– Implied 2015E EBITDA multiple of ~8.5x
– Cash portion funded with a fully committed ~$2.0bn Term Loan A due October 2019
– ETP will also receive value for the working capital at closing
SUN is issuing common units in a PIPE offering
– $750mm of gross proceeds
– Proceeds from the PIPE issuance will be used to repay existing revolver balance and fund growth capex
Assumes closing of PIPE on December 3, 2015, prior to 4Q 2015 distributions and Q1 2016 closing of acquisition
– Assumes 7.5% distribution increase for 4Q 2015 (see 3Q earnings script)
Sources ($mm Term Loan A $2,032
SUN Units Issued to ETP 194
3rd Party Equity Issuance (PIPE) 750
SUN Revolver Draw 178
Total Sources $3,154
Uses ($mm) Purchase Sunoco LLC $1,550
Purchase Sunoco R&M 676
Paydown Revolver / Fund Growth Capex 750
Working Capital Payment to ETP 168
Transaction Expenses 10
Total Uses $3,154
4
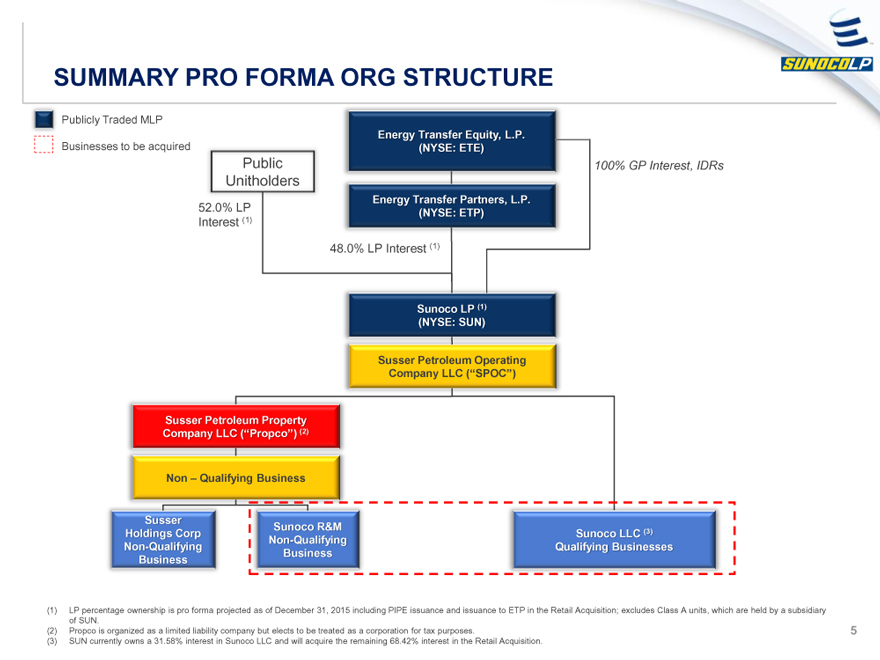
SUMMARY PRO FORMA ORG STRUCTURE SUNOCOLP
Publicly Traded MLP
Businesses to be acquired
Energy Transfer Equity, L.P.
(NYSE: ETE)
Public 100% GP Interest, IDRs
Unitholders
Energy Transfer Partners, L.P.
52.0% LP (NYSE: ETP)
Interest (1)
48.0% LP Interest (1)
Sunoco LP (1)
(NYSE: SUN(
Susser Petroleum Operating
Company LLC (“SPOC”)
Susser Petroleum Property
Company LLC (“Propco”) (2)
Non – Qualifying Business
Susser Holdings Corp Non-Qualifying Business
Sunoco R&M Non-Qualifying Business
Sunoco LLC (3) Qualifying Businesses
(1) LP percentage ownership is pro forma projected as of December 31, 2015 including PIPE issuance and issuance to ETP in the Retail Acquisition; excludes Class A units, which are held by a subsidiary of SUN.
(2) Propco is organized as a limited liability company but elects to be treated as a corporation for tax purposes.
(3) SUN currently owns a 31.58% interest in Sunoco LLC and will acquire the remaining 68.42% interest in the Retail Acquisition.
5
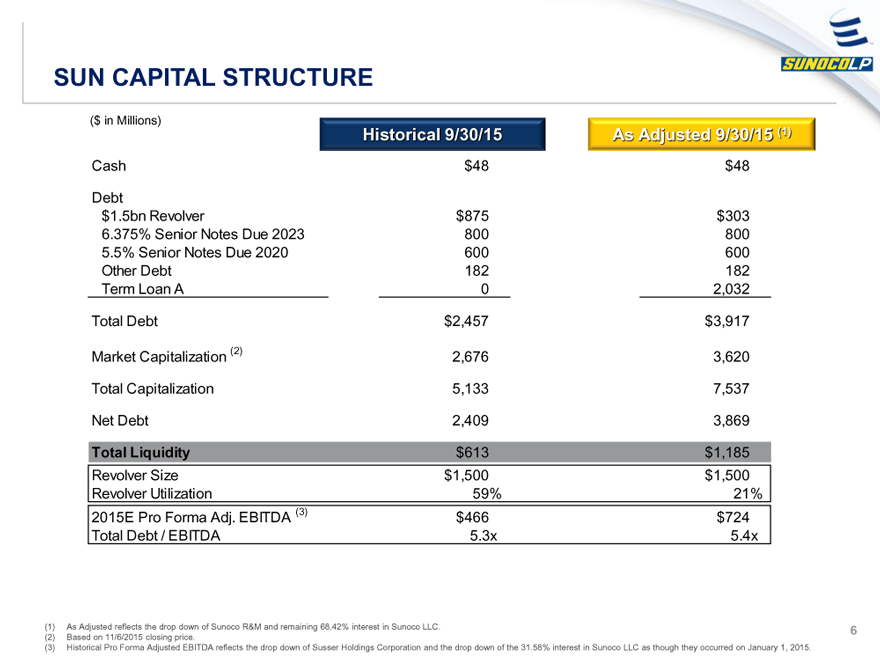
SUN CAPITAL STRUCTURE SUNOCOLP
($ in Millions)
Historical 9/30/15 As Adjusted 9/30/15 (1)
Cash $48 $48
Debt
$1.5bn Revolver $875 $303
6.375% Senior Notes Due 2023 800 800
5.5% Senior Notes Due 2020 600 600
Other Debt 182 182
Term Loan A 0 2,032
Total Debt $2,457 $3,917
Market Capitalization (2) 2,676 3,620
Total Capitalization 5,133 7,537
Net Debt 2,409 3,869
Total Liquidity $613 $1,185
Revolver Size $1,500 $1,500
Revolver Utilization 59% 21%
2015E Pro Forma Adj. EBITDA (3) $466 $724
Total Debt / EBITDA 5.3x 5.4x
(1) As Adjusted reflects the drop down of Sunoco R&M and remaining 68.42% interest in Sunoco LLC.
(2) Based on 11/6/2015 closing price.
(3) Historical Pro Forma Adjusted EBITDA reflects the drop down of Susser Holdings Corporation and the drop down of the 31.58% interest in Sunoco LLC as though they occurred on January 1, 2015.
6
APPENDIX
ENERGY TRANSFER
7
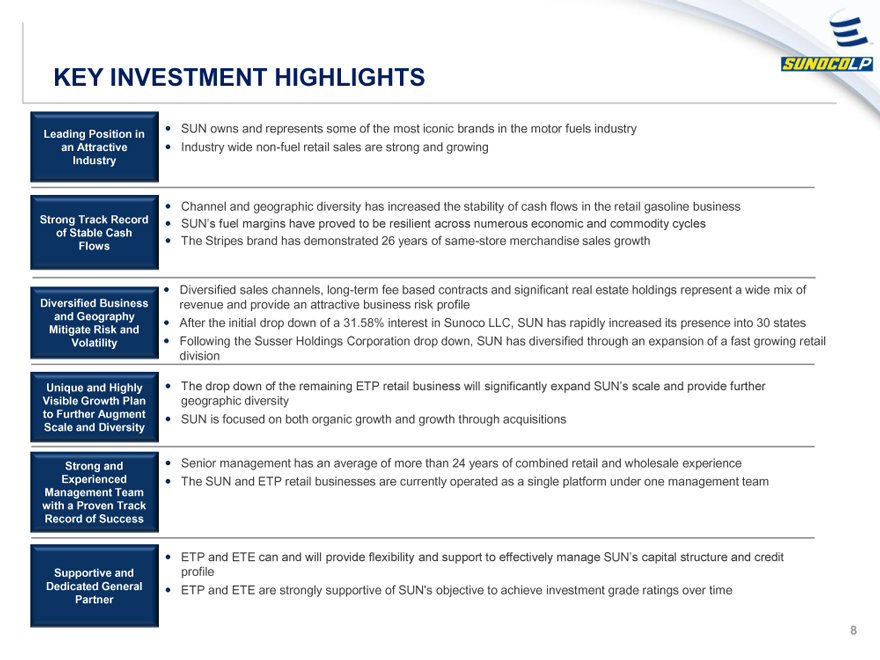
KEY INVESTMENT HIGHLIGHTS SUNOCOLP
Leading Position in an Attractive Industry
SUN owns and represents some of the most iconic brands in the motor fuels industry
Industry wide non-fuel retail sales are strong and growing
Strong Track Record of Stable Cash Flows
Channel and geographic diversity has increased the stability of cash flows in the retail gasoline business
SUN’s fuel margins have proved to be resilient across numerous economic and commodity cycles
The Stripes brand has demonstrated 26 years of same-store merchandise sales growth
Diversified Business and Geography Mitigate Risk and Volatility
Diversified sales channels, long-term fee based contracts and significant real estate holdings represent a wide mix of revenue and provide an attractive business risk profile
After the initial drop down of a 31.58% interest in Sunoco LLC, SUN has rapidly increased its presence into 30 states
Following the Susser Holdings Corporation drop down, SUN has diversified through an expansion of a fast growing retail
division
Unique and Highly Visible Growth Plan to Further Augment Scale and Diversity
The drop down of the remaining ETP retail business will significantly expand SUN’s scale and provide further geographic diversity
SUN is focused on both organic growth and growth through acquisitions
Strong and Experienced Management Team with a Proven Track Record of Success
Senior management has an average of more than 24 years of combined retail and wholesale experience
The SUN and ETP retail businesses are currently operated as a single platform under one management team
Supportive and Dedicated General Partner
ETP and ETE can and will provide flexibility and support to effectively manage SUN’s capital structure and credit profile
ETP and ETE are strongly supportive of SUN’s objective to achieve investment grade ratings over time
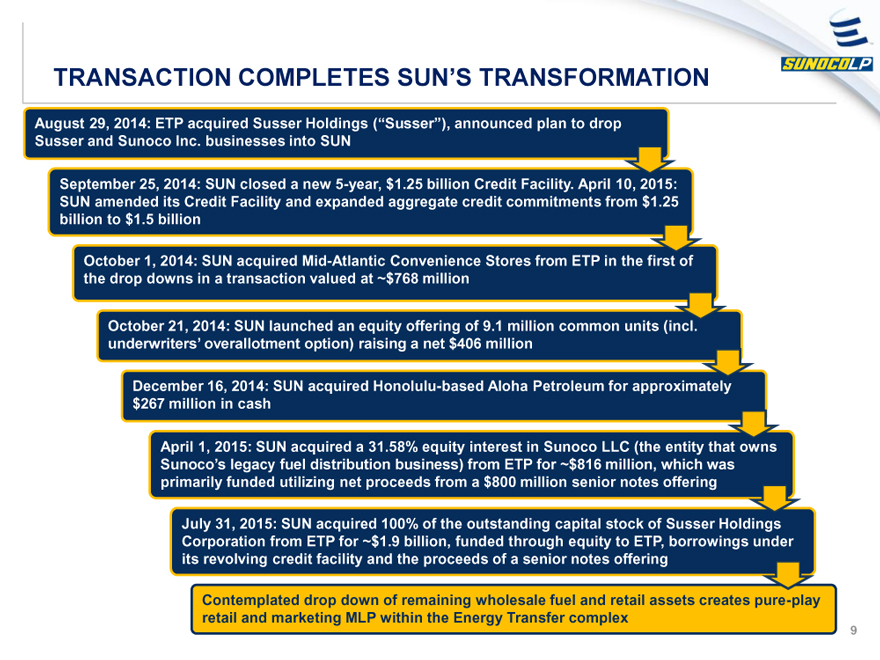
TRANSACTION COMPLETES SUN’S TRANSFORMATION SUNOCOLP
August 29, 2014: ETP acquired Susser Holdings (“Susser”), announced plan to drop Susser and Sunoco Inc. businesses into SUN
September 25, 2014: SUN closed a new 5-year, $1.25 billion Credit Facility. April 10, 2015: SUN amended its Credit Facility and expanded aggregate credit commitments from $1.25 billion to $1.5 billion
October 1, 2014: SUN acquired Mid-Atlantic Convenience Stores from ETP in the first of the drop downs in a transaction valued at ~$768 million
October 21, 2014: SUN launched an equity offering of 9.1 million common units (incl. underwriters’ overallotment option) raising a net $406 million
December 16, 2014: SUN acquired Honolulu-based Aloha Petroleum for approximately $267 million in cash
April 1, 2015: SUN acquired a 31.58% equity interest in Sunoco LLC (the entity that owns Sunoco’s legacy fuel distribution business) from ETP for ~$816 million, which was primarily funded utilizing net proceeds from a $800 million senior notes offering
July 31, 2015: SUN acquired 100% of the outstanding capital stock of Susser Holdings Corporation from ETP for ~$1.9 billion, funded through equity to ETP, borrowings under its revolving credit facility and the proceeds of a senior notes offering
Contemplated drop down of remaining wholesale fuel and retail assets creates pure-play retail and marketing MLP within the Energy Transfer complex
9
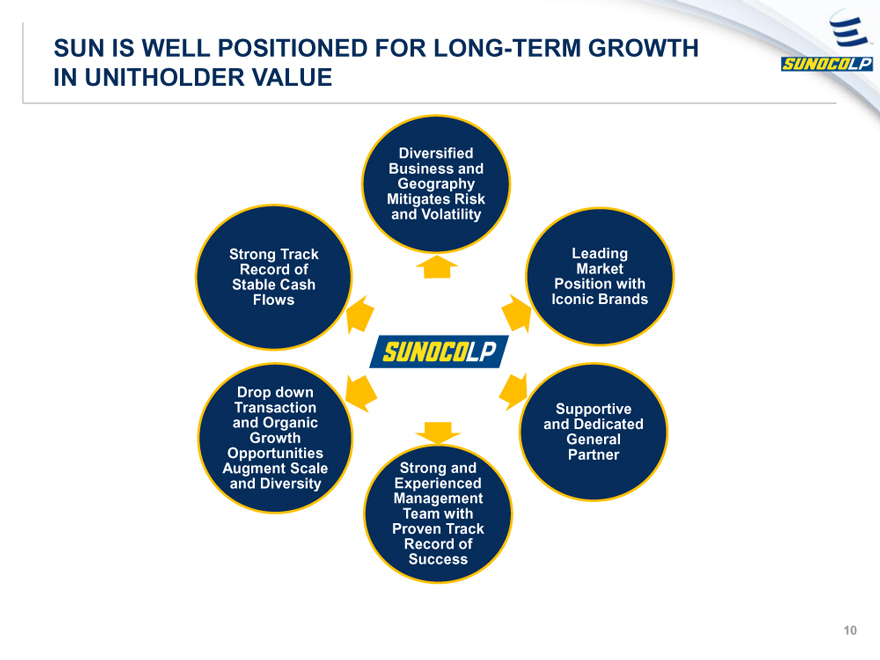
SUN IS WELL POSITIONED FOR LONG-TERM GROWTH IN UNITHOLDER VALUE SUNOCOLP
Diversified Business and Geography Mitigates Risk and Volatility
Strong Track Record of Stable Cash Flows
Leading Market Position with Iconic Brands
Drop down Transaction and Organic Growth Opportunities Augment Scale and Diversity
Supportive and Dedicated General Partner
Strong and Experienced Management Team with Proven Track Record of Success
10
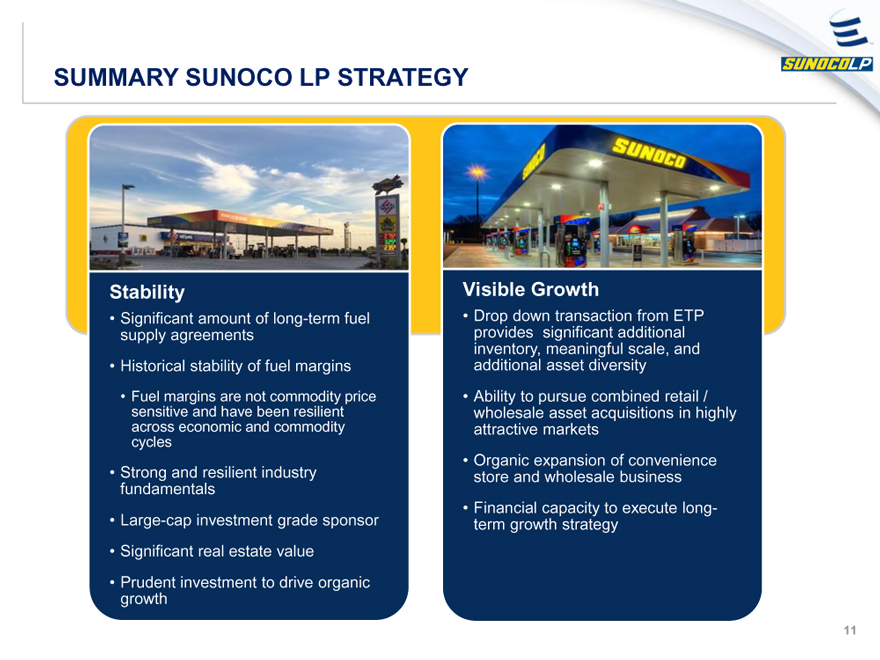
SUMMARY SUNOCO LP STRATEGY SUNOCOLP
Stability
Significant amount of long-term fuel supply agreements
Historical stability of fuel margins
Fuel margins are not commodity price sensitive and have been resilient across economic and commodity cycles
Strong and resilient industry fundamentals
Large-cap investment grade sponsor
Significant real estate value
Prudent investment to drive organic growth
Visible Growth
Drop down transaction from ETP provides significant additional inventory, meaningful scale, and additional asset diversity
Ability to pursue combined retail / wholesale asset acquisitions in highly attractive markets
Organic expansion of convenience store and wholesale business
Financial capacity to execute long-term growth strategy
11
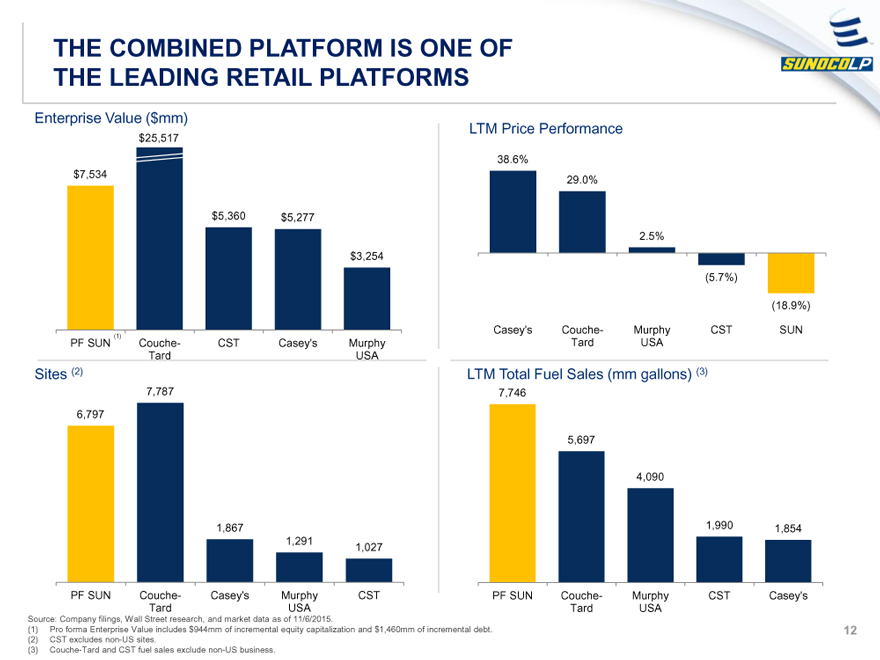
THE COMBINED PLATFORM IS ONE OF THE LEADING RETAIL PLATFORMS SUNOCOLP
Enterprise Value ($mm)
$7,534 $25,517 $5,360 $5,277 $3,254
PF SUN (1) Couche-Tard CST Casey’s Murphy USA
LTM Price Performance
38.6% 29.0% 2.5% (5.7%) (18.9%)
Casey’s Couche-Tard Murphy USA CST SUN
Sites (2)
6,797 7,787 1,867 1,291 1,027
PF SUN Couche-Tard Casey’s Murphy USA CST
LTM Total Fuel Sales (mm gallons) (3)
7,746 5,697 4,090 1,990 1,854
PF SUN Couche-Tard Murphy USA CST Casey’s
Source: Company filings, Wall Street research, and market data as of 11/6/2015.
(1) Pro forma Enterprise Value includes $944mm of incremental equity capitalization and $1,460mm of incremental debt.
(2) CST excludes non-US sites.
(3) Couche-Tard and CST fuel sales exclude non-US business.
12
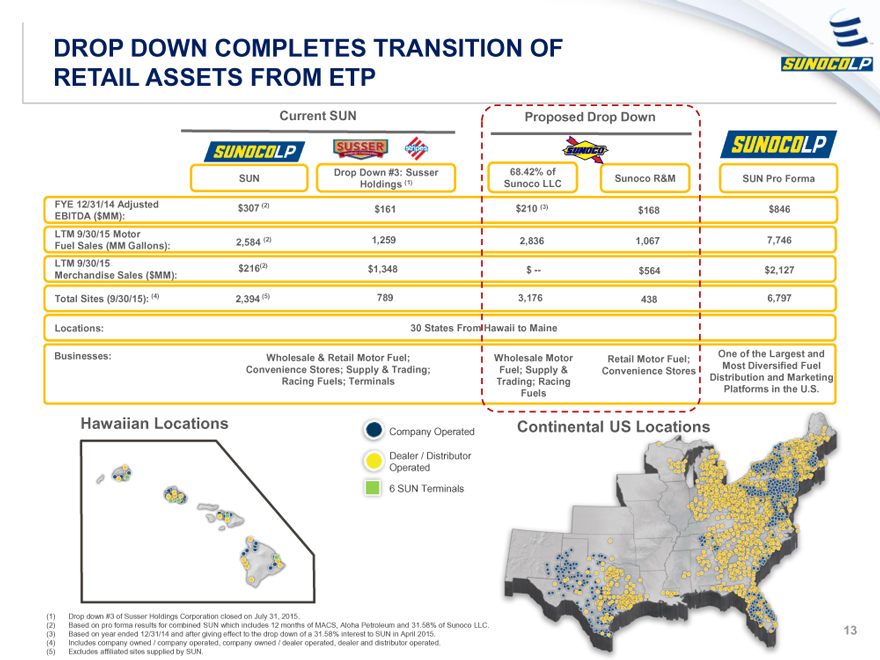
DROP DOWN COMPLETES TRANSITION OF RETAIL ASSETS FROM ETP SUNOCOLP
Current SUN Proposed Drop Down
SUNOCOLP SUSSER stripes SUNOCO SUNOCOLP
SUN Drop Down #3: Susser Holdings (1) 68.42% of Sunoco LLC Sunoco R&M SUN Pro Forma
FYE 12/31/14 Adjusted EBITDA ($MM): $307 (2) $161 $210 (3) $168 $846
LTM 9/30/15 Motor Fuel Sales (MM Gallons): 2,584 (2) 1,259 2,836 1,067 7,746
LTM 9/30/15 Merchandise Sales ($MM): $216 (2) $1,348 $-- $564 $2,127
Total Sites (9/30/15): (4) 2,394 (5) 789 3,176 438 6,797
Locations: 30 States From Hawaii to Maine
Businesses: Wholesale & Retail Motor Fuel; Convenience Stores; Supply & Trading; Racing Fuels; Terminals Wholesale Motor Fuel; Supply & Trading; Racing Fuels Retail Motor Fuel; Convenience Stores One of the Largest and Most Diversified Fuel Distribution and Marketing Platforms in the U.S.
Hawaiian Locations Company Operated Dealer / Distributor Operated 6 SUN Terminals
Continental US Locations
(1) Drop down #3 of Susser Holdings Corporation closed on July 31, 2015. (2) Based on pro forma results for combined SUN which includes 12 months of MACS, Aloha Petroleum and 31.58% of Sunoco LLC (3) Based on year ended 12/31/14 and after giving effect to the drop down of a 31.58% interest to SUN in April 2015. (4) Includes company owned / company operated, company owned / dealer operated, dealer and distributor operated. (5) Excludes affiliated sites supplied by SUN. 13
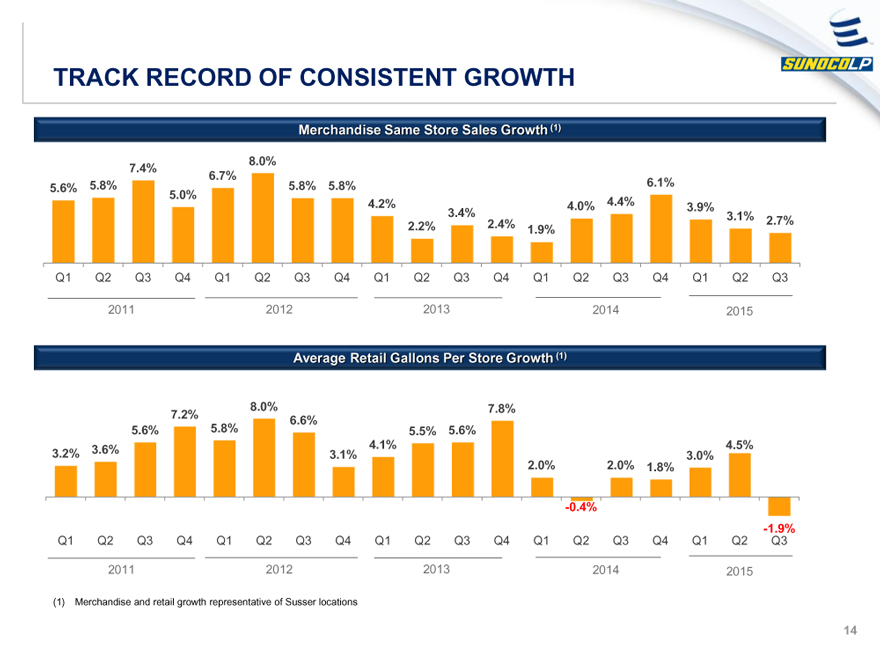
TRACK RECORD OF CONSISTENT GROWTH SUNOCOLP
Merchandise Same Store Sales Growth (1)
5.6% 5.8% 7.4% 5.0% 6.7% 8.0% 5.8% 5.8% 4.2% 2.2% 3.4% 2.4% 1.9% 4.0% 4.4% 6.1% 3.9% 3.1% 2.7%
Q1 Q2 Q3 Q4 Q1 Q2 Q3 Q4 Q1 Q2 Q3 Q4 Q1 Q2 Q3 Q4 Q1 Q2 Q3
2011 2012 2013 2014 2015
Average Retail Gallons Per Store Growth (1)
3.2% 3.6% 5.6% 7.2% 5.8% 8.0% 6.6% 3.1% 4.1% 5.5% 5.6% 7.8% 2.0% -0.4% 2.0% 1.8% 3.0% 4.5% -1.9%
Q1 Q2 Q3 Q4 Q1 Q2 Q3 Q4 Q1 Q2 Q3 Q4 Q1 Q2 Q3 Q4 Q1 Q2 Q3
2011 2012 2013 2014 2015
(1) Merchandise and retail growth representative of Susser locations 14
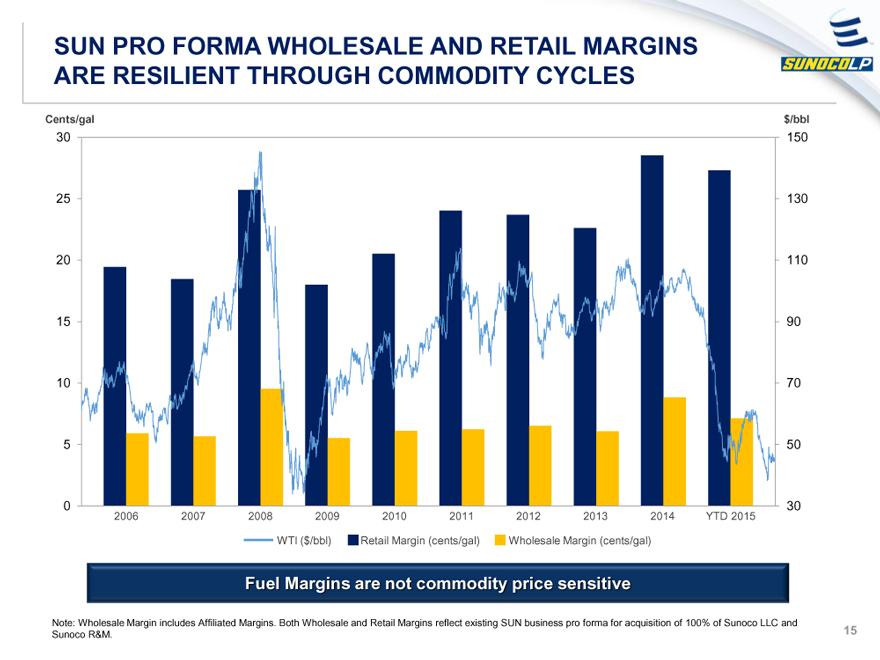
SUN PRO FORMA WHOLESALE AND RETAIL MARGINS ARE RESILIENT THROUGH COMMODITY CYCLES SUNOCOLP
Cents/gal $/bbl
30 150
25 130
20 110
15 90
10 70
5 50
0 30
2006 2007 2008 2009 2010 2011 2012 2013 2014 YTD 2015
WTI ($/bbl) Retail Margin (cents/gal) Wholesale Margin (cents/gal)
Fuel Margins are not commodity price sensitive
Note: Wholesale Margin includes Affiliated Margins. Both Wholesale and Retail Margins reflect existing SUN business pro forma for acquisition of 100% of Sunoco LLC and Sunoco R&M. 15

DIVERSIFIED LINES OF BUSINESS GENERATE A PORTFOLIO OF STABLE CASH FLOWS SUNOCOLP
Gross Profit Contribution By Channel (LTM 9/30/15)
Current SUN (1) 6% 27% 42% 25%
Total = $1,372 million
SUN Pro Forma (2) 5% 31% 35% 28%
Total = $2,140 million
Retail Fuel Wholesale Fuel Merch & Other C-Store Rent
(1) Pro Forma results for combined SUN which includes MACS, Aloha Petroleum, and 31.58% of Sunoco LLC, and Susser.
(2) Pro Forma results for combined SUN which includes 100% of Sunoco LLC and 100% of Sunoco R&M.
16
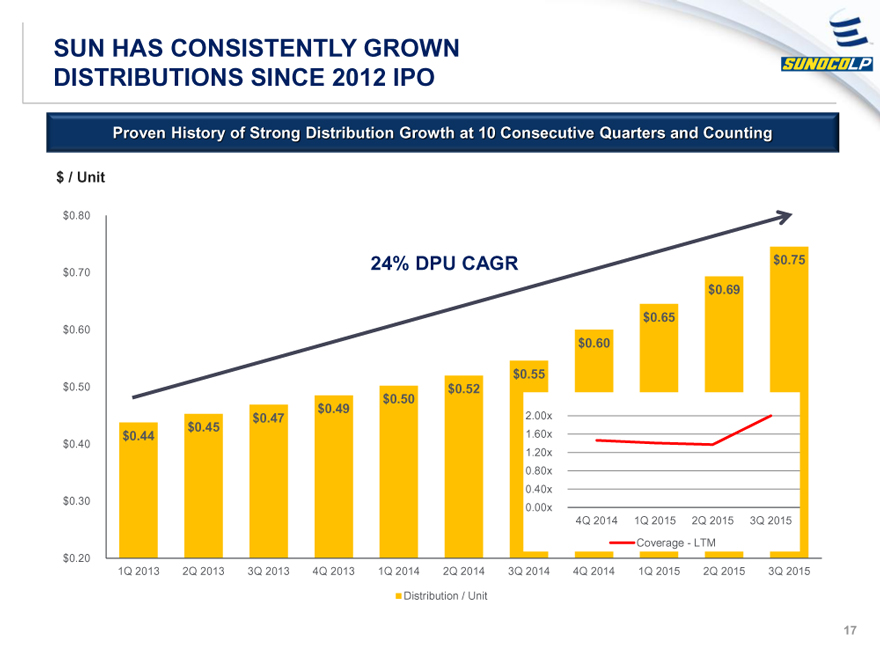
SUN HAS CONSISTENTLY GROWN DISTRIBUTIONS SINCE 2012 IPO SUNOCOLP
Proven History of Strong Distribution Growth at 10 Consecutive Quarters and Counting
$ / Unit
$0.80 $0.70 $0.60 $0.50 $0.40 $0.30 $0.20
$0.44 1Q 2013
$0.45 2Q 2013
$0.47 3Q 2013
$0.49 4Q 2013
24% DPU CAGR $0.50 1Q 2014
$0.52 2Q 2014
$0.55 2.00x 1.60x 1.20x 0.80x 0.40x 0.00x 3Q 2014
$0.60 4Q 2014 4Q 2014
$0.69 $0.65 1Q 2015 2Q 2015 Coverage - LTM 1Q 2015 2Q 2015
$0.75 3Q 2015 3Q 2015
Distribution / Unit
17
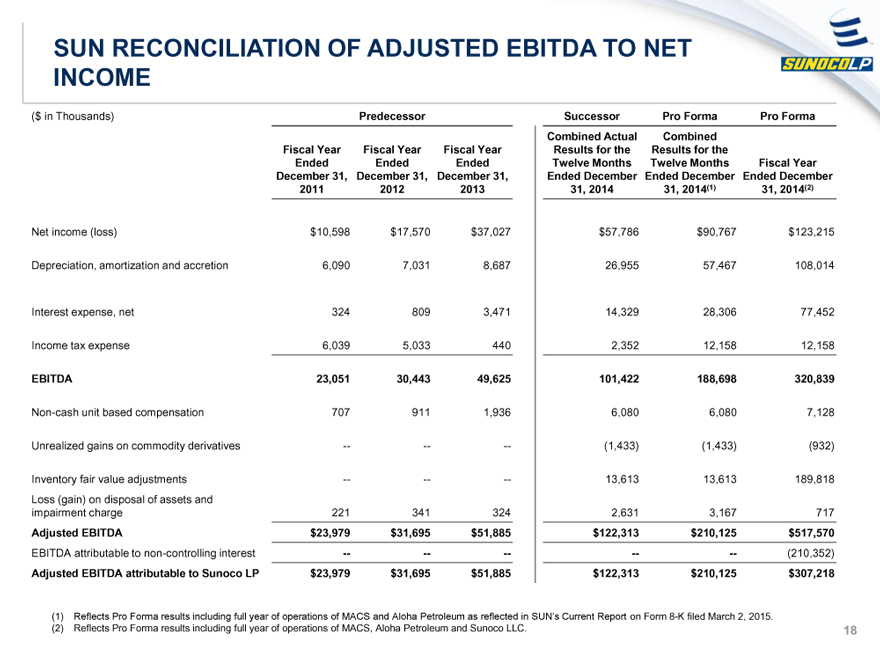
SUN RECONCILIATION OF ADJUSTED EBITDA TO NET INCOME SUNOCOLP
($ in Thousands) Net income (loss) Depreciation, amortization and accretion Interest expense, net Income tax expense EBITDA Non-cash unit based compensation Unrealized gains on commodity derivatives Inventory fair value adjustments Loss (gain) on disposal of assets and impairment charge Adjusted EBITDA EBITDA attributable to non-controlling interest Adjusted EBITDA attributable to Sunoco LP
Predecessor Fiscal Year Fiscal Year Fiscal Year Ended Ended Ended December 31, December 31, December 31, 2011 2012 2013 $ 10,598 $ 17,570 $ 37,027 6,090 7,031 8,687 324 809 3,471 6,039 5,033 440 23,051 30,443 49,625 707 911 1,936 -- -- -- -- -- -- 221 341 324 $23,979 $31,695 $51,885 -- -- -- $23,979 $31,695 $51,885
Successor Combined Actual Results for the Twelve Months Ended December 31, 2014 $57,786 26,955 14,329 2,352 101,422 6,080 (1,433) 13,613 2,631 $122,313 -- $122,313
Pro Forma Combined Results for the Twelve Months Ended December 31, 2014(1) $90,767 57,467 28,306 12,158 188,698 6,080 (1,433) 13,613 3,167 $210,125 -- $210,125
Pro Forma Fiscal Year Ended December 31, 2014(2) $123,215 108,014 77,452 12,158 320,839 7,128 (932) 189,818 717 $517,570 (210,352) $307,218
(1) Reflects Pro Forma results including full year of operations of MACS and Aloha Petroleum as reflected in SUN’s Current Report on Form 8-K filed March 2, 2015.
(2) Reflects Pro Forma results including full year of operations of MACS, Aloha Petroleum and Sunoco LLC.
18
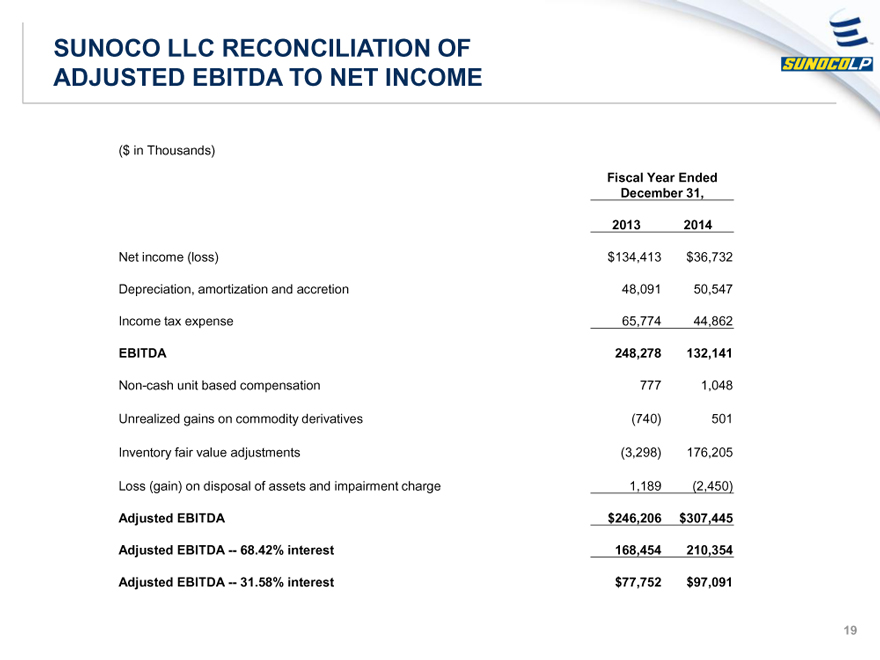
SUNOCO LLC RECONCILIATION OF ADJUSTED EBITDA TO NET INCOME SUNOCOLP
($ in Thousands)
Fiscal Year Ended
December 31,
2013 2014
Net income (loss) $134,413 $36,732
Depreciation, amortization and accretion 48,091 50,547
Income tax expense 65,774 44,862
EBITDA 248,278 132,141
Non-cash unit based compensation 777 1,048
Unrealized gains on commodity derivatives (740) 501
Inventory fair value adjustments (3,298) 176,205
Loss (gain) on disposal of assets and impairment charge 1,189 (2,450)
Adjusted EBITDA $246,206 $307,445
Adjusted EBITDA -- 68.42% interest 168,454 210,354
Adjusted EBITDA -- 31.58% interest $77,752 $97,091
19
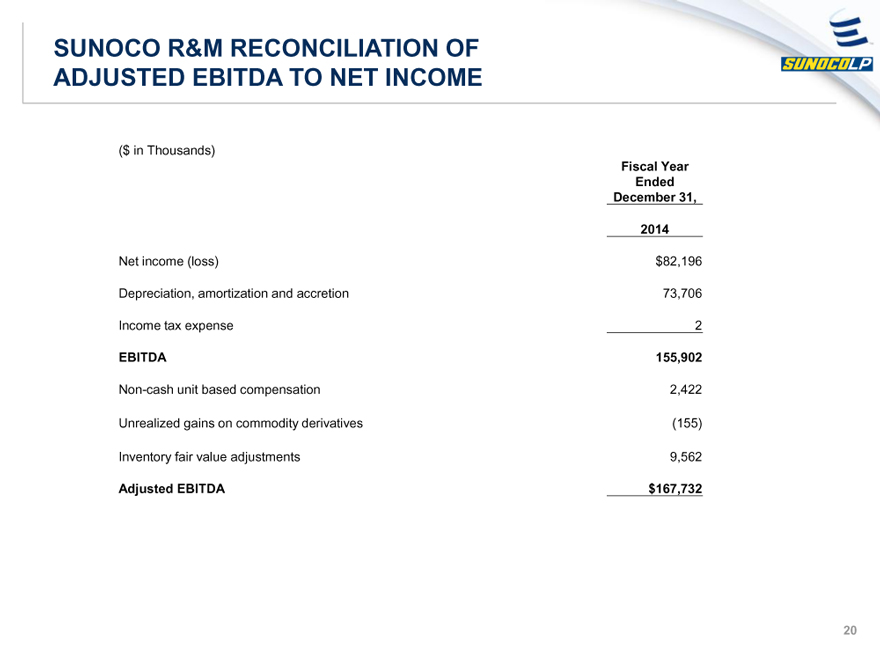
SUNOCO R&M RECONCILIATION OF ADJUSTED EBITDA TO NET INCOME SUNOCOLP
($ in Thousands)
Fiscal Year
Ended
December 31,
2014
Net income (loss) $82,196
Depreciation, amortization and accretion 73,706
Income tax expense 2
EBITDA 155,902
Non-cash unit based compensation 2,422
Unrealized gains on commodity derivatives (155)
Inventory fair value adjustments 9,562
Adjusted EBITDA $167,732
20

SUSSER RECONCILIATION OF NET INCOME TO ADJUSTED EBITDA SUNOCOLP
($ in Thousands)
Historical (1) Pro Forma Adjustments Pro Forma
Memo - EBITDA and DCF reconciliation Susser SUN (2) Adjustments (3) Susser
Fiscal Year Ended Fiscal Year Ended Fiscal Year Ended
December 31, December 31, December 31,
2014 2014 2014
Net income 129,200 (22,510) (148,204) (41,514)
Depreciation, amortization and accretion 79,996 (10,457) (4,438) 65,101
Interest expense, net 15,194 (4,767) 32,629 43,056
Income tax expense 76,442 (218) (11,502) 64,722
EBITDA 300,832 (37,952) (131,515) 131,365
Unit compensation 20,218 - - 20,218
Loss (gain) on disposal of assets and impairment charge 1,614 39 - 1,653
Equity investee gain (129,092) - 129,092 -
Unrealized gains on commodity derivatives (8,294) - - (8,294)
Inventory fair value adjustments 15,859 - - 15,859
Adjusted EBITDA (consolidated) 201,137 (37,913) (2,423) 160,801
Adj EBITDA attributable to NCI - - - -
Adj EBITDA attributable to Sunoco LP 201,137 (37,913) (2,423) 160,801
(1) Reflects combined results of the Predecessor and Successor period of Susser.
(2) To eliminate the eight months of SUN activity reflected in Susser’s historical financial statements prior to September 1, 2014.
(3) To eliminate the intercompany transactions between SUN and Susser during the last four months of 2014 after the ETP Merger.
21
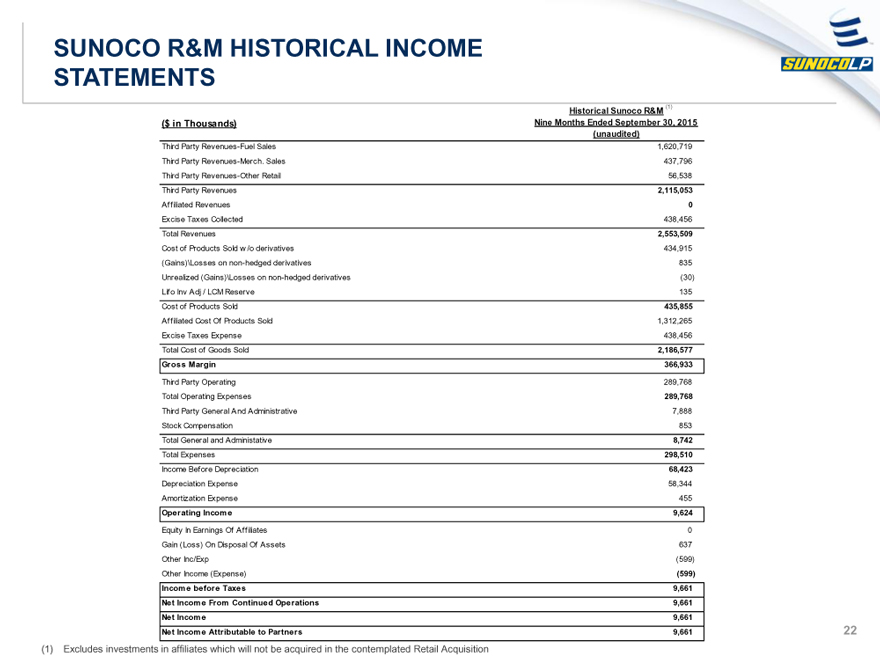
SUNOCO R&M HISTORICAL INCOME STATEMENTS SUNOCOLP
Historical Sunoco R&M (1)
($ in Thousands) Nine Months Ended September 30, 2015
(unaudited)
Third Party Revenues-Fuel Sales 1,620,719
Third Party Revenues-Merch. Sales 437,796
Third Party Revenues-Other Retail 56,538
Third Party Revenues 2,115,053
Affiliated Revenues 0
Excise Taxes Collected 438,456
Total Revenues 2,553,509
Cost of Products Sold w/o derivatives 434,915
(Gains)\Losses on non-hedged derivatives 835
Unrealized (Gains)\Losses on non-hedged derivatives (30)
Lifo Inv Adj / LCM Reserve 135
Cost of Products Sold 435,855
Affiliated Cost Of Products Sold 1,312,265
Excise Taxes Expense 438,456
Total Cost of Goods Sold 2,186,577
Gross Margin 366,933
Third Party Operating 289,768
Total Operating Expenses 289,768
Third Party General And Administrative 7,888
Stock Compensation 853
Total General and Administrative 8,742
Total Expenses 298,510
Income Before Depreciation 68,423
Depreciation Expense 58,344
Amortization Expense 455
Operating Income 9,624
Equity In Earnings Of Affiliates 0
Gain (Loss) On Disposal Of Assets 637
Other Inc/Exp (599)
Other Income (Expense) (599)
Income before Taxes 9,661
Net Income From Continued Operations 9,661
Net Income 9,661
Net Income Attributable to Partners 9,661
(1) Excludes investments in affiliates which will not be acquired in the contemplated Retail Acquisition
22
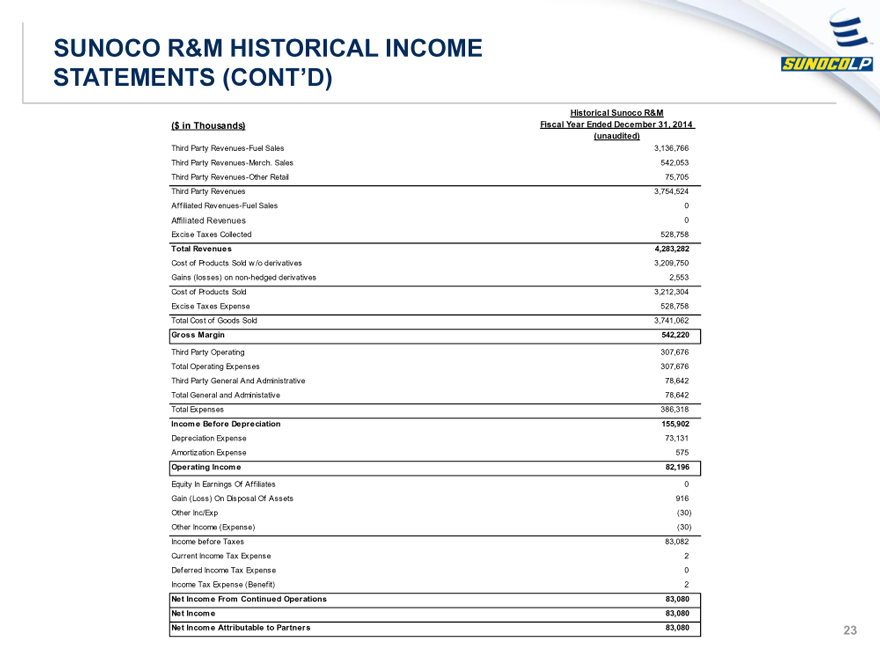
SUNOCO R&M HISTORICAL INCOME
STATEMENTS (CONT’D) SUNOCOLP
Historical Sunoco R&M
($ in Thousands) Fiscal Year Ended December 31, 2014
(unaudited)
Third Party Revenues-Fuel Sales 3,136,766
Third Party Revenues-Merch. Sales 542,053
Third Party Revenues-Other Retail 75,705
Third Party Revenues 3,754,524
Affiliated Revenues-Fuel Sales 0
Affiliated Revenues 0
Excise Taxes Collected 528,758
Total Revenues 4,283,282
Cost of Products Sold w/o derivatives 3,209,750
Gains (losses) on non-hedged derivatives 2,553
Cost of Products Sold 3,212,304
Excise Taxes Expense 528,758
Total Cost of Goods Sold 3,741,062
Gross Margin 542,220
Third Party Operating 307,676
Total Operating Expenses 307,676
Third Party General And Administrative 78,642
Total General and Administrative 78,642
Total Expenses 386,318
Income Before Depreciation 155,902
Depreciation Expense 73,131
Amortization Expense 575
Operating Income 82,196
Equity In Earnings Of Affiliates 0
Gain (Loss) On Disposal Of Assets 916
Other Inc/Exp (30)
Other Income (Expense) (30)
Income before Taxes 83,082
Current Income Tax Expense 2
Deferred Income Tax Expense 0
Income Tax Expense (Benefit) 2
Net Income From Continued Operations 83,080
Net Income 83,080
Net Income Attributable to Partners 83,080
23
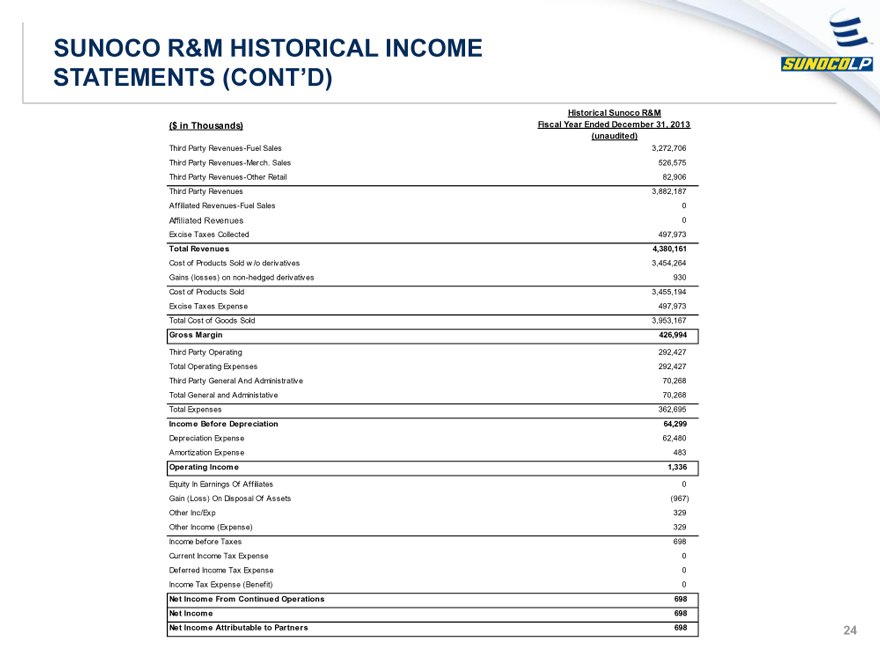
SUNOCO R&M HISTORICAL INCOME
STATEMENTS (CONT’D) SUNOCOLP
Historical Sunoco R&M
($ in Thousands) Fiscal Year Ended December 31, 2013
(unaudited)
Third Party Revenues-Fuel Sales 3,272,706
Third Party Revenues-Merch. Sales 526,575
Third Party Revenues-Other Retail 82,906
Third Party Revenues 3,882,187
Affiliated Revenues-Fuel Sales 0
Affiliated Revenues 0
Excise Taxes Collected 497,973
Total Revenues 4,380,161
Cost of Products Sold w/o derivatives 3,454,264
Gains (losses) on non-hedged derivatives 930
Cost of Products Sold 3,455,194
Excise Taxes Expense 497,973
Total Cost of Goods Sold 3,953,167
Gross Margin 426,994
Third Party Operating 292,427
Total Operating Expenses 292,427
Third Party General And Administrative 70,268
Total General and Administrative 70,268
Total Expenses 362,695
Income Before Depreciation 64,299
Depreciation Expense 62,480
Amortization Expense 483
Operating Income 1,336
Equity In Earnings Of Affiliates 0
Gain (Loss) On Disposal Of Assets (967)
Other Inc/Exp 329
Other Income (Expense) 329
Income before Taxes 698
Current Income Tax Expense 0
Deferred Income Tax Expense 0
Income Tax Expense (Benefit) 0
Net Income From Continued Operations 698
Net Income 698
Net Income Attributable to Partners 698
24