UNITED STATES
SECURITIES AND EXCHANGE COMMISSION
Washington, D.C. 20549
Form N-CSR
CERTIFIED SHAREHOLDER REPORT OF REGISTERED
MANAGEMENT INVESTMENT COMPANIES
Investment Company Act File Number: 811-22714
Eaton Vance Series Fund, Inc.
(Exact Name of Registrant as Specified in Charter)
Two International Place, Boston, Massachusetts 02110
(Address of Principal Executive Offices)
Maureen A. Gemma
Two International Place, Boston, Massachusetts 02110
(Name and Address of Agent for Services)
(617) 482-8260
(Registrant’s Telephone Number)
July 31
Date of Fiscal Year End
July 31, 2013
Date of Reporting Period
Item 1. Reports to Stockholders

Eaton Vance
Institutional Emerging Markets Local Debt Fund
Annual Report
July 31, 2013

Commodity Futures Trading Commission Registration. Effective December 31, 2012, the Commodity Futures Trading Commission (“CFTC”) adopted certain regulatory changes that subject registered investment companies and advisers to regulation by the CFTC if a fund invests more than a prescribed level of its assets in certain CFTC-regulated instruments (including futures, certain options and swap agreements) or markets itself as providing investment exposure to such instruments. The Fund has claimed an exclusion from the definition of the term “commodity pool operator” under the Commodity Exchange Act and is not subject to the CFTC regulation. Because of its management of other strategies, the Fund’s adviser is registered with the CFTC as a commodity pool operator.
Fund shares are not insured by the FDIC and are not deposits or other obligations of, or guaranteed by, any depository institution. Shares are subject to investment risks, including possible loss of principal invested.
This report must be preceded or accompanied by a current summary prospectus or prospectus. Before investing, investors should consider carefully the investment objective, risks, and charges and expenses of a mutual fund. This and other important information is contained in the summary prospectus and prospectus, which can be obtained from a financial advisor. Prospective investors should read the prospectus carefully before investing. For further information, please call 1-800-262-1122.
Annual Report July 31, 2013
Eaton Vance
Institutional Emerging Markets Local Debt Fund
Table of Contents
| | | | |
Management’s Discussion of Fund Performance | | | 2 | |
| |
Performance | | | 3 | |
| |
Fund Profile | | | 3 | |
| |
Endnotes and Additional Disclosures | | | 4 | |
| |
Fund Expenses | | | 5 | |
| |
Financial Statements | | | 6 | |
| |
Report of Independent Registered Public Accounting Firm | | | 21 | |
| |
Federal Tax Information | | | 22 | |
| |
Board of Trustees’ Contract Approval | | | 23 | |
| |
Management and Organization | | | 25 | |
| |
Important Notices | | | 27 | |
Eaton Vance
Institutional Emerging Markets Local Debt Fund
July 31, 2013
Management’s Discussion of Fund Performance1
Economic and Market Conditions
The actions of the world’s major central banks were the key driver of asset prices for the fiscal year ended July 31, 2013. The period began with investors still cheering a pledge made by the European Central Bank (ECB) in late July 2012 to do “whatever it takes” to keep the eurozone intact. The ECB followed up in September 2012 with a plan to support the bond markets of eurozone governments that are approved for aid from the region’s rescue fund and submit to austerity measures. One week later, the U.S. Federal Reserve (the Fed) embarked on its third round of quantitative easing (QE3) since the 2008 financial crisis. Then, in January 2013, the Fed increased the size of the bond purchases it was making under QE3 after a bond-swapping program known as “Operation Twist” expired. In Japan, new political leadership pushed for more aggressive monetary easing, and the Bank of Japan responded with a bond-buying program much larger than the Fed’s as a percentage of gross domestic product (GDP).
While central bank policies were supportive of asset prices during the first nine months of the fiscal year, comments made by Fed Chairman Ben Bernanke later in the period were not. In May 2013, Bernanke said that the Fed could start tapering its bond purchases within the next few months. He reiterated those remarks in June 2013 and went on to say that the central bank could end its purchases entirely by mid-2014, provided the economy met its forecasts. Fears of waning Fed support triggered a broad sell-off in the global financial markets and the unwinding of “carry” trades — long positions in high-yielding currencies funded with short positions in low-yielding currencies. The unwinding of carry trades caused most emerging-market currencies to weaken versus the U.S. dollar. In addition, the general decline in risk appetites prompted investors to pull capital out of many emerging countries, which pushed bond yields higher in the majority of these markets.
Against this backdrop, local currency emerging-market government bonds, as measured by the Fund’s benchmark, J.P. Morgan GBI-EM Global Diversified Index (the Index)2, declined 10.63% in the last three months of the fiscal year. This erased the 10.27% gain posted by the Index in the first nine months of the period.
Fund Performance
From its February 4, 2013 inception through July 31, 2013, the Eaton Vance Institutional Emerging Markets Local Debt Fund (the Fund) shares at net asset value (NAV) had
a total return of -3.90%. The Fund was more resilient than the Index, which returned -8.62% for the same period. The outperformance versus the Index was mainly due to the Fund’s broad allocation across the 16 benchmark countries as well as numerous off-benchmark countries. This approach led to significant underweights to large benchmark concentrations in markets such as Brazil and Turkey, and even no exposure to South Africa. These countries are large weights in the Index because they have substantial amounts of debt outstanding. Given their reliance on external financing, they were especially sensitive to the capital outflows that occurred in the latter part of the period.
From a regional perspective, in Asia, the Fund’s underweight position in Indonesia boosted results versus the Index. Like Brazil, Turkey and South Africa, Indonesia is a large benchmark weight with a current account deficit. On the minus side, a non-benchmark position in India detracted amid rising inflation and slowing economic growth in the country. An overweight in the Philippines was also unfavorable, even though the Philippines reported its fastest pace of economic growth in nearly three years.
In Latin America, the Fund’s underweight in Brazil was a standout contributor, while an overweight in Peru hurt relative performance versus the Index. Peru’s economy is highly dependent on copper prices, which fell sharply on concerns about the economic slowdown in China, the world’s largest copper consumer. In Central and Eastern Europe, an underweight in Russia was helpful along with an underweight in Turkey, but positioning in Poland detracted from performance versus the Index. Although an underweight position in Poland was helpful, this was overshadowed by having less duration7 exposure than the Index, as Poland was one of the few emerging markets where yields declined.
In Sub-Saharan Africa, the Fund’s relative performance results versus the Index benefited from avoiding South Africa and having less duration exposure in Nigeria than the Index, as the yield curve steepened in Nigeria. The biggest performance drag in the region was an off-benchmark position in Rwandan dollar-denominated debt. Non-benchmark investments in the Middle East North Africa region positively impacted performance versus the Index.
See Endnotes and Additional Disclosures in this report.
Past performance is no guarantee of future results. Returns are historical and are calculated by determining the percentage change in net asset value (NAV) or offering price (as applicable) with all distributions reinvested. Investment return and principal value will fluctuate so that shares, when redeemed, may be worth more or less than their original cost. Performance less than one year is cumulative. Performance is for the stated time period only; due to market volatility, the Fund’s current performance may be lower or higher than quoted. Returns are before taxes unless otherwise noted. For performance as of the most recent month end, please refer to www.eatonvance.com.
Eaton Vance
Institutional Emerging Markets Local Debt Fund
July 31, 2013
Performance2,3
Portfolio Managers John R. Baur, Michael A. Cirami, CFA, and Eric A. Stein, CFA
| | | | | | | | | | | | | | | | | | | | |
| % Cumulative Total Returns | | Inception Date | | | Performance
Inception Date | | | One Year | | | Five Years | | | Since Inception | |
Fund at NAV | | | 02/04/2013 | | | | 02/04/2013 | | | | — | | | | — | | | | –3.90 | % |
J.P. Morgan GBI-EM Global Diversified Index | | | — | | | | 02/04/2013 | | | | –1.45 | % | | | 5.32 | % | | | –8.62 | % |
| | | | | |
| | | | | | | | | | | | | | | | | | | | |
| % Total Annual Operating Expense Ratios4 | | | | | | | | | | | | | | | |
Gross | | | | | | | | | | | | | | | | | | | 0.99 | % |
Net | | | | | | | | | | | | | | | | | | | 0.85 | |
A line graph is not included since the Fund has less than six months of performance.
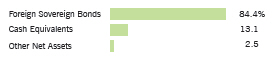
Fund Profile
Asset Allocation (% of net assets)5
Foreign Currency Exposure (% of net assets)6
| | | | | | | | | | |
Malaysia | | | 4.5 | % | | Singapore | | | 3.0 | % |
Philippines | | | 4.5 | | | Ghana | | | 3.0 | |
Nigeria | | | 4.3 | | | Indonesia | | | 2.8 | |
India | | | 4.2 | | | Brazil | | | 2.4 | |
Mexico | | | 4.2 | | | Uruguay | | | 2.3 | |
Peru | | | 4.2 | | | Lebanon | | | 2.1 | |
Kenya | | | 4.1 | | | China | | | 2.1 | |
Serbia | | | 4.0 | | | South Korea | | | 2.1 | |
Sri Lanka | | | 3.9 | | | Chile | | | 1.9 | |
Thailand | | | 3.9 | | | Israeli | | | 1.6 | |
Colombia | | | 3.6 | | | Jordan | | | 1.0 | |
Poland | | | 3.5 | | | Armenia | | | 0.9 | |
Russia | | | 3.4 | | | Bangladesh | | | 0.9 | |
Turkey | | | 3.4 | | | Georgia | | | 0.0 | * |
Romania | | | 3.1 | | | Hong Kong | | | (0.0 | )* |
| | | | | | Euro | | | (12.1 | ) |
| | | | | | Total Long | | | 84.9 | |
| | | | | | Total Short | | | (12.1 | ) |
| | | | | | Total Net | | | 72.8 | |
| * | Amount is less than 0.05%. |
See Endnotes and Additional Disclosures in this report.
Past performance is no guarantee of future results. Returns are historical and are calculated by determining the percentage change in net asset value (NAV) or offering price (as applicable) with all distributions reinvested. Investment return and principal value will fluctuate so that shares, when redeemed, may be worth more or less than their original cost. Performance less than one year is cumulative. Performance is for the stated time period only; due to market volatility, the Fund’s current performance may be lower or higher than quoted. Returns are before taxes unless otherwise noted. For performance as of the most recent month end, please refer to www.eatonvance.com.
Eaton Vance
Institutional Emerging Markets Local Debt Fund
July 31, 2013
Endnotes and Additional Disclosures
| 1 | The views expressed in this report are those of the portfolio manager(s) and are current only through the date stated at the top of this page. These views are subject to change at any time based upon market or other conditions, and Eaton Vance and the Fund(s) disclaim any responsibility to update such views. These views may not be relied upon as investment advice and, because investment decisions are based on many factors, may not be relied upon as an indication of trading intent on behalf of any Eaton Vance fund. This commentary may contain statements that are not historical facts, referred to as “forward looking statements”. The Fund’s actual future results may differ significantly from those stated in any forward looking statement, depending on factors such as changes in securities or financial markets or general economic conditions, the volume of sales and purchases of Fund shares, the continuation of investment advisory, administrative and service contracts, and other risks. |
| 2 | J.P. Morgan GBI-EM Global Diversified Index is an unmanaged index of local-currency bonds with maturities of more than one year issued by emerging markets governments. Unless otherwise stated, index returns do not reflect the effect of any applicable sales charges, commissions, expenses, taxes or leverage, as applicable. It is not possible to invest directly in an index. |
| 3 | Returns are historical and are calculated by determining the percentage change in NAV with all distributions reinvested. The Fund has no sales charge. |
| 4 | Source: Fund prospectus. Net expense ratio reflects a contractual expense reimbursement that continues through 11/30/14. Without the reimbursement, performance would have been lower. |
| 5 | Other net assets represent other assets less liabilities and includes any investment type that represents less than 1% of net assets. |
| 6 | Currency exposures include all foreign exchange denominated assets, currency derivatives and commodities (including commodity derivatives). Total exposures may exceed 100% due to implicit leverage created by derivatives. |
| 7 | Duration is a measure of the expected change in price of a bond — in percentage terms — given a one percent change in interest rates, all else being constant. Securities with lower durations tend to be less sensitive to interest-rate changes. |
| | Fund profile subject to change due to active management. |
Eaton Vance
Institutional Emerging Markets Local Debt Fund
July 31, 2013
Fund Expenses
Example: As a Fund shareholder, you incur two types of costs: (1) transaction costs, including sales charges (loads) on purchases and redemption fees (if applicable); and (2) ongoing costs, including management fees; distribution and/or service fees; and other Fund expenses. This Example is intended to help you understand your ongoing costs (in dollars) of Fund investing and to compare these costs with the ongoing costs of investing in other mutual funds. The actual expense Example is based on an investment of $1,000 invested at the beginning of the period and held for the entire period (February 4, 2013 – July 31, 2013). The hypothetical expense Example is based on an investment of $1,000 invested for the one-half year period (February 1, 2013 – July 31, 2013).
Actual Expenses: The first section of the table below provides information about actual account values and actual expenses. You may use the information in this section, together with the amount you invested, to estimate the expenses that you paid over the period. Simply divide your account value by $1,000 (for example, an $8,600 account value divided by $1,000 = 8.6), then multiply the result by the number in the first section under the heading entitled “Expenses Paid During Period” to estimate the expenses you paid on your account during this period.
Hypothetical Example for Comparison Purposes: The second section of the table below provides information about hypothetical account values and hypothetical expenses based on the actual Fund expense ratio and an assumed rate of return of 5% per year (before expenses), which is not the actual Fund return. The hypothetical account values and expenses may not be used to estimate the actual ending account balance or expenses you paid for the period. You may use this information to compare the ongoing costs of investing in your Fund and other funds. To do so, compare this 5% hypothetical example with the 5% hypothetical examples that appear in the shareholder reports of the other funds.
Please note that the expenses shown in the table are meant to highlight your ongoing costs only and do not reflect any transactional costs, such as sales charges (loads) or redemption fees (if applicable). Therefore, the second section of the table is useful in comparing ongoing costs only, and will not help you determine the relative total costs of owning different funds. In addition, if these transactional costs were included, your costs would be higher.
| | | | | | | | | | | | | | | | |
| | | Beginning
Account Value
(2/4/13) | | | Ending
Account Value
(7/31/13) | | | Expenses Paid
During Period
(2/4/13 –7/31/13) | | | Annualized
Expense
Ratio | |
| | | | |
| | | | | | | | | | | | | | | | |
Actual* | | | | |
| | $ | 1,000.00 | | | $ | 961.00 | | | $ | 4.06 | *** | | | 0.85 | % |
| | | | |
| | | | | | | | | | | | | | | | |
* The Fund had not commenced operations on February 1, 2013. Actual expenses are equal to the Fund’s annualized expense ratio, multiplied by the average account value over the period, multiplied by 178/365 (to reflect the period from commencement of operations on February 4, 2013 to July 31, 2013). The Example assumes that the $1,000 was invested at the net asset value per share determined at the opening of business on February 4, 2013. | |
| | | Beginning
Account Value
(2/1/13) | | | Ending
Account Value
(7/31/13) | | | Expenses Paid
During Period
(2/1/13 –7/31/13) | | | Annualized
Expense
Ratio | |
| | | | |
| | | | | | | | | | | | | | | | |
Hypothetical** | | | | |
(5% return per year before expenses) | | | | | | | | | | | | | | | | |
| | $ | 1,000.00 | | | $ | 1,020.60 | | | $ | 4.26 | *** | | | 0.85 | % |
| ** | Hypothetical expenses are equal to the Fund’s annualized expense ratio, multiplied by the average account value over the period, multiplied by 181/365 (to reflect the one-half year period). The Example assumes that the $1,000 was invested at the net asset value per share determined at the opening of business on February 4, 2013. |
| *** | Absent an allocation of certain expenses to an affiliate, expenses would be higher. |
Eaton Vance
Institutional Emerging Markets Local Debt Fund
July 31, 2013
Portfolio of Investments
| | | | | | | | | | |
| Foreign Government Bonds — 58.9% | | | | | |
| | | |
| | | | | | | | | | |
| Security | | | | Principal
Amount
(000’s omitted) | | | Value | |
| | | | | | | | | | |
| | | |
Bahrain — 1.4% | | | | | | | | | | |
Kingdom of Bahrain,
6.125%, 8/1/23(1)(2) | | USD | | | 200 | | | $ | 201,941 | |
| | |
Total Bahrain | | | | | | | | $ | 201,941 | |
| | |
| | | |
Bangladesh — 0.9% | | | | | | | | | | |
Bangladesh Treasury Bond, 11.62%, 1/2/18 | | BDT | | | 10,000 | | | $ | 128,242 | |
| | |
Total Bangladesh | | | | | | | | $ | 128,242 | |
| | |
| | | |
Brazil — 2.4% | | | | | | | | | | |
Republic of Brazil, 12.50%, 1/5/16 | | BRL | | | 744 | | | $ | 352,212 | |
| | |
Total Brazil | | | | | | | | $ | 352,212 | |
| | |
| | | |
Chile — 1.9% | | | | | | | | | | |
Government of Chile, 3.00%, 2/1/16(3) | | CLP | | | 137,699 | | | $ | 274,218 | |
| | |
Total Chile | | | | | | | | $ | 274,218 | |
| | |
| | | |
Colombia — 3.3% | | | | | | | | | | |
Titulos De Tesoreria B, 11.00%, 7/24/20 | | COP | | | 750,000 | | | $ | 480,499 | |
| | |
Total Colombia | | | | | | | | $ | 480,499 | |
| | |
| | | |
Cyprus — 1.1% | | | | | | | | | | |
Republic of Cyprus, 4.375%, 7/15/14 | | EUR | | | 140 | | | $ | 162,055 | |
| | |
Total Cyprus | | | | | | | | $ | 162,055 | |
| | |
| | | |
Ghana — 2.7% | | | | | | | | | | |
Ghana Government Bond, 14.25%, 7/25/16 | | GHS | | | 646 | | | $ | 271,765 | |
Ghana Government Bond, 21.00%, 10/26/15 | | GHS | | | 253 | | | | 125,354 | |
| | |
Total Ghana | | | | | | | | $ | 397,119 | |
| | |
| | | |
Indonesia — 2.7% | | | | | | | | | | |
Indonesia Government Bond, 9.50%, 6/15/15 | | IDR | | | 3,855,000 | | | $ | 392,281 | |
| | |
Total Indonesia | | | | | | | | $ | 392,281 | |
| | |
| | | |
Jordan — 1.0% | | | | | | | | | | |
Jordan Government Bond, 6.925%, 6/4/14 | | JOD | | | 100 | | | $ | 143,182 | |
| | |
Total Jordan | | | | | | | | $ | 143,182 | |
| | |
| | | |
Kenya — 0.5% | | | | | | | | | | |
Kenya Treasury Bond, 11.855%, 5/22/17 | | KES | | | 6,450 | | | $ | 74,670 | |
| | |
Total Kenya | | | | | | | | $ | 74,670 | |
| | |
| | | | | | | | | | |
| Security | | | | Principal
Amount
(000’s omitted) | | | Value | |
| | | | | | | | | | |
| | | |
Mexico — 4.1% | | | | | | | | | | |
Mexican Bonos, 6.00%, 6/18/15 | | MXN | | | 7,280 | | | $ | 589,746 | |
| | |
Total Mexico | | | | | | | | $ | 589,746 | |
| | |
| | | |
Peru — 4.0% | | | | | | | | | | |
Republic of Peru, 7.84%, 8/12/20 | | PEN | | | 700 | | | $ | 291,091 | |
Republic of Peru, 8.60%, 8/12/17 | | PEN | | | 710 | | | | 294,310 | |
| | |
Total Peru | | | | | | | | $ | 585,401 | |
| | |
| | | |
Poland — 3.4% | | | | | | | | | | |
Poland Government Bond, 3.75%, 4/25/18 | | PLN | | | 1,540 | | | $ | 489,243 | |
| | |
Total Poland | | | | | | | | $ | 489,243 | |
| | |
| | | |
Romania — 3.1% | | | | | | | | | | |
Romania Government Bond, 5.75%, 1/27/16 | | RON | | | 750 | | | $ | 232,463 | |
Romania Government Bond, 5.80%, 10/26/15 | | RON | | | 720 | | | | 223,269 | |
| | |
Total Romania | | | | | | | | $ | 455,732 | |
| | |
| | | |
Russia — 3.3% | | | | | | | | | | |
Russia Government Bond, 7.35%, 1/20/16 | | RUB | | | 15,160 | | | $ | 472,713 | |
| | |
Total Russia | | | | | | | | $ | 472,713 | |
| | |
| | | |
Rwanda — 6.2% | | | | | | | | | | |
Republic of Rwanda, 6.625%, 5/2/23(1) | | USD | | | 1,000 | | | $ | 895,000 | |
| | |
Total Rwanda | | | | | | | | $ | 895,000 | |
| | |
| | | |
Serbia — 3.0% | | | | | | | | | | |
Serbia Treasury Bond, 10.00%, 2/21/16 | | RSD | | | 38,740 | | | $ | 438,492 | |
| | |
Total Serbia | | | | | | | | $ | 438,492 | |
| | |
| | | |
Slovenia — 2.4% | | | | | | | | | | |
Republic of Slovenia Bond, 5.85%, 5/10/23(1) | | USD | | | 371 | | | $ | 352,606 | |
| | |
Total Slovenia | | | | | | | | $ | 352,606 | |
| | |
| | | |
Sri Lanka — 5.8% | | | | | | | | | | |
Republic of Sri Lanka,
5.875%, 7/25/22(1) | | USD | | | 307 | | | $ | 297,790 | |
Sri Lanka Government Bond, 8.00%, 11/15/18 | | LKR | | | 16,730 | | | | 110,875 | |
Sri Lanka Government Bond, 8.50%, 7/15/18 | | LKR | | | 64,300 | | | | 438,104 | |
| | |
Total Sri Lanka | | | | | | | | $ | 846,769 | |
| | |
| | | |
Turkey — 3.4% | | | | | | | | | | |
Turkey Government Bond, 0.00%, 9/11/13 | | TRY | | | 953 | | | $ | 488,957 | |
| | |
Total Turkey | | | | | | | | $ | 488,957 | |
| | |
| | | | |
| | 6 | | See Notes to Financial Statements. |
Eaton Vance
Institutional Emerging Markets Local Debt Fund
July 31, 2013
Portfolio of Investments — continued
| | | | | | | | | | |
| Security | | | | Principal
Amount
(000’s omitted) | | | Value | |
| | | | | | | | | | |
| | | |
Uruguay — 2.3% | | | | | | | | | | |
Uruguay Notas Del Tesoro, 2.25%, 8/23/17(3) | | UYU | | | 7,111 | | | $ | 329,273 | |
| | |
Total Uruguay | | | $ | 329,273 | |
| | |
| |
Total Foreign Government Bonds
(identified cost $9,254,778) | | | $ | 8,550,351 | |
| | |
| |
| Short-Term Investments — 38.8% | | | | | |
|
| Foreign Government Securities — 25.5% | |
| | | |
| | | | | | | | | | |
| Security | | | | Principal
Amount
(000’s omitted) | | | Value | |
| | | | | | | | | | |
| | | |
Kenya — 2.5% | | | | | | | | | | |
Kenya Treasury Bill, 0.00%, 4/14/14 | | KES | | | 12,800 | | | $ | 138,686 | |
Kenya Treasury Bill, 0.00%, 4/21/14 | | KES | | | 8,800 | | | | 95,127 | |
Kenya Treasury Bill, 0.00%, 6/9/14 | | KES | | | 12,000 | | | | 127,511 | |
| | |
Total Kenya | | | | | | | | $ | 361,324 | |
| | |
| | | |
Lebanon — 2.1% | | | | | | | | | | |
Lebanon Treasury Bill, 0.00%, 8/15/13 | | LBP | | | 225,400 | | | $ | 149,041 | |
Lebanon Treasury Bill, 0.00%, 2/20/14 | | LBP | | | 246,630 | | | | 158,854 | |
| | |
Total Lebanon | | | | | | | | $ | 307,895 | |
| | |
| | | |
Malaysia — 4.5% | | | | | | | | | | |
Bank Negara Monetary Note, 0.00%, 9/17/13 | | MYR | | | 2,125 | | | $ | 652,619 | |
| | |
Total Malaysia | | | | | | | | $ | 652,619 | |
| | |
| | | |
Nigeria — 4.3% | | | | | | | | | | |
Nigeria Treasury Bill, 0.00%, 11/28/13 | | NGN | | | 53,371 | | | $ | 318,135 | |
Nigeria Treasury Bill, 0.00%, 12/5/13 | | NGN | | | 26,595 | | | | 158,243 | |
Nigeria Treasury Bill, 0.00%, 6/5/14 | | NGN | | | 25,614 | | | | 142,681 | |
| | |
Total Nigeria | | | | | | | | $ | 619,059 | |
| | |
| | | |
Philippines — 3.9% | | | | | | | | | | |
Philippine Treasury Bill, 0.00%, 8/7/13 | | PHP | | | 24,400 | | | $ | 561,730 | |
| | |
Total Philippines | | | | | | | | $ | 561,730 | |
| | |
| | | |
Serbia — 3.1% | | | | | | | | | | |
Serbia Treasury Bill, 0.00%, 2/20/14 | | RSD | | | 41,420 | | | $ | 458,446 | |
| | |
Total Serbia | | | | | | | | $ | 458,446 | |
| | |
| | | | | | | | | | |
| Security | | | | Principal
Amount
(000’s omitted) | | | Value | |
| | | | | | | | | | |
| | | |
Singapore — 3.0% | | | | | | | | | | |
Singapore Treasury Bill, 0.00%, 11/15/13 | | SGD | | | 558 | | | $ | 438,792 | |
| | |
Total Singapore | | | | | | | | $ | 438,792 | |
| | |
| | | |
South Korea — 2.1% | | | | | | | | | | |
Korea Monetary Stabilization Bond, 0.00%, 10/1/13 | | KRW | | | 340,730 | | | $ | 302,049 | |
| | |
Total South Korea | | | | | | | | $ | 302,049 | |
| | |
| | | |
Total Foreign Government Securities
(identified cost $3,803,431) | | | | | | | | $ | 3,701,914 | |
| | |
|
| U.S. Treasury Obligations — 0.2% | |
| | | |
| | | | | | | | | | |
| Security | | | | Principal Amount (000’s omitted) | | | Value | |
U.S. Treasury Bill,
0.00%, 9/19/13(4) | | | | $ | 25 | | | $ | 24,999 | |
| | |
| |
Total U.S. Treasury Obligations
(identified cost $24,999) | | | $ | 24,999 | |
| | |
| | | |
| Other — 13.1% | | | | | | | | | | |
| | | |
| | | | | | | | | | |
| Description | | | | Interest (000’s omitted) | | | Value | |
Eaton Vance Cash Reserves Fund, LLC, 0.10%(5) | | | | $ | 1,912 | | | $ | 1,911,537 | |
| | |
| |
Total Other
(identified cost $1,911,537) | | | $ | 1,911,537 | |
| | |
| |
Total Short-Term Investments
(identified cost $5,739,967) | | | $ | 5,638,450 | |
| | |
| |
Total Investments — 97.7%
(identified cost $14,994,745) | | | $ | 14,188,801 | |
| | |
| |
Other Assets, Less Liabilities — 2.3% | | | $ | 329,650 | |
| | |
| |
Net Assets — 100.0% | | | $ | 14,518,451 | |
| | |
The percentage shown for each investment category in the Portfolio of Investments is based on net assets.
| | | | |
| | 7 | | See Notes to Financial Statements. |
Eaton Vance
Institutional Emerging Markets Local Debt Fund
July 31, 2013
Portfolio of Investments — continued
| | | | |
| BDT | | – | | Bangladesh Taka |
| BRL | | – | | Brazilian Real |
| CLP | | – | | Chilean Peso |
| COP | | – | | Colombian Peso |
| EUR | | – | | Euro |
| GHS | | – | | Ghanaian Cedi |
| IDR | | – | | Indonesian Rupiah |
| JOD | | – | | Jordanian Dinar |
| KES | | – | | Kenyan Shilling |
| KRW | | – | | South Korean Won |
| LBP | | – | | Lebanese Pound |
| LKR | | – | | Sri Lankan Rupee |
| MXN | | – | | Mexican Peso |
| MYR | | – | | Malaysian Ringgit |
| NGN | | – | | Nigerian Naira |
| PEN | | – | | Peruvian New Sol |
| PHP | | – | | Philippine Peso |
| PLN | | – | | Polish Zloty |
| RON | | – | | Romanian Leu |
| RSD | | – | | Serbian Dinar |
| RUB | | – | | Russian Ruble |
| SGD | | – | | Singapore Dollar |
| TRY | | – | | New Turkish Lira |
| USD | | – | | United States Dollar |
| UYU | | – | | Uruguayan Peso |
| (1) | Security exempt from registration pursuant to Rule 144A under the Securities Act of 1933. These securities may be sold in certain transactions (normally to qualified institutional buyers) and remain exempt from registration. At July 31, 2013, the aggregate value of these securities is $1,747,337 or 12.0% of the Fund’s net assets. |
| (2) | When-issued security. |
| (3) | Inflation-linked security whose principal is adjusted for inflation based on changes in a designated inflation index or inflation rate for the applicable country. Interest is calculated based on the inflation-adjusted principal. |
| (4) | Security (or a portion thereof) has been pledged to cover margin requirements on open financial futures contracts. |
| (5) | Affiliated investment company, available to Eaton Vance portfolios and funds, which invests in high quality, U.S. dollar denominated money market instruments. The rate shown is the annualized seven-day yield as of July 31, 2013. |
| | | | |
| | 8 | | See Notes to Financial Statements. |
Eaton Vance
Institutional Emerging Markets Local Debt Fund
July 31, 2013
Statement of Assets and Liabilities
| | | | |
| Assets | | July 31, 2013 | |
Unaffiliated investments, at value (identified cost, $13,083,208) | | $ | 12,277,264 | |
Affiliated investment, at value (identified cost, $1,911,537) | | | 1,911,537 | |
Cash | | | 750 | |
Foreign currency, at value (identified cost, $527,384) | | | 528,177 | |
Interest receivable | | | 120,377 | |
Interest receivable from affiliated investment | | | 157 | |
Receivable for open forward foreign currency exchange contracts | | | 15,343 | |
Tax reclaims receivable | | | 4,584 | |
Receivable from affiliate | | | 32,276 | |
Total assets | | $ | 14,890,465 | |
|
| Liabilities | |
Payable for when-issued securities | | $ | 198,894 | |
Payable for variation margin on open financial futures contracts | | | 944 | |
Payable for open forward foreign currency exchange contracts | | | 81,420 | |
Payable to affiliate: | | | | |
Investment adviser and administration fee | | | 8,032 | |
Accrued expenses | | | 82,724 | |
Total liabilities | | $ | 372,014 | |
Net Assets | | $ | 14,518,451 | |
|
| Sources of Net Assets | |
Common shares, $0.001 par value, 1,000,000,000 shares authorized, 1,510,000 shares issued and outstanding | | $ | 1,510 | |
Additional paid-in capital | | | 15,088,032 | |
Accumulated net realized loss | | | (19,983 | ) |
Accumulated undistributed net investment income | | | 277,162 | |
Net unrealized depreciation | | | (828,270 | ) |
Total | | $ | 14,518,451 | |
| |
| Net Asset Value, Offering Price and Redemption Price Per Share | | | | |
($14,518,451 ÷ 1,510,000 common shares issued and outstanding) | | $ | 9.61 | |
| | | | |
| | 9 | | See Notes to Financial Statements. |
Eaton Vance
Institutional Emerging Markets Local Debt Fund
July 31, 2013
Statement of Operations
| | | | |
| Investment Income | | Period Ended
July 31, 2013(1) | |
Interest (net of foreign taxes, $7,246) | | $ | 320,994 | |
Interest allocated from affiliated investment | | | 1,744 | |
Expenses allocated from affiliated investment | | | (183 | ) |
Total investment income | | $ | 322,555 | |
|
| Expenses | |
Investment adviser and administration fee | | $ | 47,139 | |
Directors’ fees and expenses | | | 538 | |
Custodian fee | | | 46,386 | |
Transfer and dividend disbursing agent fees | | | 84 | |
Legal and accounting services | | | 80,184 | |
Printing and postage | | | 7,779 | |
Registration fees | | | 32,290 | |
Miscellaneous | | | 4,905 | |
Total expenses | | $ | 219,305 | |
Deduct — | | | | |
Allocation of expenses to affiliate | | $ | 157,824 | |
Reduction of custodian fee | | | 7 | |
Total expense reductions | | $ | 157,831 | |
| |
Net expenses | | $ | 61,474 | |
| |
Net investment income | | $ | 261,081 | |
|
| Realized and Unrealized Gain (Loss) | |
Net realized gain (loss) — | | | | |
Investment transactions | | $ | (20,578 | ) |
Investment transactions allocated from affiliated investment | | | 33 | |
Financial futures contracts | | | 32,602 | |
Foreign currency and forward foreign currency exchange contract transactions | | | (26,417 | ) |
Net realized loss | | $ | (14,360 | ) |
Change in unrealized appreciation (depreciation) — | | | | |
Investments | | $ | (805,944 | ) |
Financial futures contracts | | | 44,720 | |
Foreign currency and forward foreign currency exchange contracts | | | (67,046 | ) |
Net change in unrealized appreciation (depreciation) | | $ | (828,270 | ) |
| |
Net realized and unrealized loss | | $ | (842,630 | ) |
| |
Net decrease in net assets from operations | | $ | (581,549 | ) |
| (1) | For the period from commencement of operations on February 4, 2013 to July 31, 2013. |
| | | | |
| | 10 | | See Notes to Financial Statements. |
Eaton Vance
Institutional Emerging Markets Local Debt Fund
July 31, 2013
Statement of Changes in Net Assets
| | | | |
| Increase (Decrease) in Net Assets | | Period Ended
July 31, 2013(1) | |
From operations — | | | | |
Net investment income | | $ | 261,081 | |
Net realized loss from investment transactions, financial futures contracts, and foreign currency and forward foreign currency exchange contract transactions | | | (14,360 | ) |
Net change in unrealized appreciation (depreciation) from investments, financial futures contracts, foreign currency and forward foreign currency exchange contracts | | | (828,270 | ) |
Net decrease in net assets from operations | | $ | (581,549 | ) |
Transactions in common shares — | | | | |
Proceeds from sale of shares | | $ | 15,000,000 | |
Net increase in net assets from Fund share transactions | | $ | 15,000,000 | |
| |
Net increase in net assets | | $ | 14,418,451 | |
|
| Net Assets | |
At beginning of period | | $ | 100,000 | |
At end of period | | $ | 14,518,451 | |
|
Accumulated undistributed net investment income
included in net assets | |
At end of period | | $ | 277,162 | |
| (1) | For the period from commencement of operations on February 4, 2013 to July 31, 2013. |
| | | | |
| | 11 | | See Notes to Financial Statements. |
Eaton Vance
Institutional Emerging Markets Local Debt Fund
July 31, 2013
Financial Highlights
| | | | |
| | | Period Ended July 31, 2013(1) | |
Net asset value — Beginning of period | | $ | 10.000 | |
|
| Income (Loss) From Operations | |
Net investment income(2) | | $ | 0.173 | |
Net realized and unrealized loss | | | (0.563 | ) |
| |
Total loss from operations | | $ | (0.390 | ) |
| |
Net asset value — End of period | | $ | 9.610 | |
| |
Total Return(3) | | | (3.90 | )%(4) |
|
| Ratios/Supplemental Data | |
Net assets, end of period (000’s omitted) | | $ | 14,518 | |
Ratios (as a percentage of average daily net assets): | | | | |
Expenses(5) | | | 0.85 | %(6) |
Net investment income | | | 3.58 | %(6) |
Portfolio Turnover | | | 0 | %(4) |
| (1) | For the period from commencement of operations on February 4, 2013 to July 31, 2013. |
| (2) | Computed using average common shares outstanding. |
| (3) | Returns are historical and are calculated by determining the percentage change in net asset value with all distributions reinvested. |
| (5) | The investment adviser and administrator reimbursed certain operating expenses (equal to 2.16% of average daily net assets for the period from commencement of operations on February 4, 2013 to July 31, 2013). Absent this reimbursement, total return would be lower. |
| | | | |
| | 12 | | See Notes to Financial Statements. |
Eaton Vance
Institutional Emerging Markets Local Debt Fund
July 31, 2013
Notes to Financial Statements
1 Significant Accounting Policies
Eaton Vance Institutional Emerging Markets Local Debt Fund (the Fund) is a non-diversified series of Eaton Vance Series Fund, Inc. (the Corporation). The Corporation is a Maryland corporation registered under the Investment Company Act of 1940, as amended (the 1940 Act), as an open-end management investment company. Prior to February 4, 2013, the date the Fund commenced investment operations, the Fund had been inactive except for matters relating to its organization and the sale of 10,000 shares to Eaton Vance Management (EVM) for $100,000. Organization costs in connection with the organization of the Fund were borne directly by EVM. The Fund’s investment objective is total return. The Fund’s shares are offered to institutional investors and are sold at net asset value and are not subject to a sales charge.
The following is a summary of significant accounting policies of the Fund. The policies are in conformity with accounting principles generally accepted in the United States of America.
A Investment Valuation — The following methodologies are used to determine the market value or fair value of investments.
Debt Obligations. Debt obligations (including short-term obligations with a remaining maturity of more than sixty days) are generally valued on the basis of valuations provided by third party pricing services, as derived from such services’ pricing models. Inputs to the models may include, but are not limited to, reported trades, executable bid and asked prices, broker/dealer quotations, prices or yields of securities with similar characteristics, benchmark curves or information pertaining to the issuer, as well as industry and economic events. The pricing services may use a matrix approach, which considers information regarding securities with similar characteristics to determine the valuation for a security. Short-term obligations purchased with a remaining maturity of sixty days or less (excluding those that are non-U.S. dollar denominated, which typically are valued by a pricing service or dealer quotes) are generally valued at amortized cost, which approximates market value.
Derivatives. Financial futures contracts are valued at the closing settlement price established by the board of trade or exchange on which they are traded. Forward foreign currency exchange contracts are generally valued at the mean of the average bid and average asked prices that are reported by currency dealers to a third party pricing service at the valuation time. Such third party pricing service valuations are supplied for specific settlement periods and the Fund’s forward foreign currency exchange contracts are valued at an interpolated rate between the closest preceding and subsequent settlement period reported by the third party pricing service.
Foreign Securities and Currencies. Foreign securities and currencies are valued in U.S. dollars, based on foreign currency exchange rate quotations supplied by a third party pricing service. The pricing service uses a proprietary model to determine the exchange rate. Inputs to the model include reported trades and implied bid/ask spreads. The daily valuation of exchange-traded foreign securities generally is determined as of the close of trading on the principal exchange on which such securities trade. Events occurring after the close of trading on foreign exchanges may result in adjustments to the valuation of foreign securities to more accurately reflect their fair value as of the close of regular trading on the New York Stock Exchange. When valuing foreign equity securities that meet certain criteria, the Directors have approved the use of a fair value service that values such securities to reflect market trading that occurs after the close of the applicable foreign markets of comparable securities or other instruments that have a strong correlation to the fair-valued securities.
Affiliated Fund. The Fund may invest in Eaton Vance Cash Reserves Fund, LLC (Cash Reserves Fund), an affiliated investment company managed by EVM. The value of the Fund’s investment in Cash Reserves Fund reflects the Fund’s proportionate interest in its net assets. Cash Reserves Fund generally values its investment securities utilizing the amortized cost valuation technique in accordance with Rule 2a-7 under the 1940 Act. This technique involves initially valuing a portfolio security at its cost and thereafter assuming a constant amortization to maturity of any discount or premium. If amortized cost is determined not to approximate fair value, Cash Reserves Fund may value its investment securities in the same manner as debt obligations described above.
Fair Valuation. Investments for which valuations or market quotations are not readily available or are deemed unreliable are valued at fair value using methods determined in good faith by or at the direction of the Directors of the Fund in a manner that fairly reflects the security’s value, or the amount that the Fund might reasonably expect to receive for the security upon its current sale in the ordinary course. Each such determination is based on a consideration of relevant factors, which are likely to vary from one pricing context to another. These factors may include, but are not limited to, the type of security, the existence of any contractual restrictions on the security’s disposition, the price and extent of public trading in similar securities of the issuer or of comparable companies or entities, quotations or relevant information obtained from broker/dealers or other market participants, information obtained from the issuer, analysts, and/or the appropriate stock exchange (for exchange-traded securities), an analysis of the company’s or entity’s financial condition, and an evaluation of the forces that influence the issuer and the market(s) in which the security is purchased and sold.
B Investment Transactions — Investment transactions for financial statement purposes are accounted for on a trade date basis. Realized gains and losses on investments sold are determined on the basis of identified cost.
C Income — Interest income is recorded on the basis of interest accrued, adjusted for amortization of premium or accretion of discount. Inflation adjustments to the principal amount of inflation-adjusted bonds and notes are reflected as interest income. Withholding taxes on foreign interest and capital gains have been provided for in accordance with the Fund’s understanding of the applicable countries’ tax rules and rates.
D Federal Taxes — The Fund’s policy is to comply with the provisions of the Internal Revenue Code applicable to regulated investment companies and to distribute to shareholders each year substantially all of its net investment income, and all or substantially all of its net realized capital gains. Accordingly, no provision for federal income or excise tax is necessary.
Eaton Vance
Institutional Emerging Markets Local Debt Fund
July 31, 2013
Notes to Financial Statements — continued
In addition to the requirements of the Internal Revenue Code, the Fund may also be subject to local taxes on the recognition of capital gains in certain countries. In determining the daily net asset value, the Fund estimates the accrual for such taxes, if any, based on the unrealized appreciation on certain portfolio securities and the related tax rates. Taxes attributable to unrealized appreciation are included in the change in unrealized appreciation (depreciation) on investments. Capital gains taxes on securities sold are included in net realized gain (loss) on investments.
As of July 31, 2013, the Fund had no uncertain tax positions that would require financial statement recognition, de-recognition, or disclosure. The Fund files a U.S. federal income tax return annually after its fiscal year-end, which is subject to examination by the Internal Revenue Service for a period of three years from the date of filing.
E Expenses — The majority of expenses of the Corporation are directly identifiable to an individual fund. Expenses which are not readily identifiable to a specific fund are allocated taking into consideration, among other things, the nature and type of expense and the relative size of the funds.
F Expense Reduction — State Street Bank and Trust Company (SSBT) serves as custodian of the Fund. Pursuant to the custodian agreement, SSBT receives a fee reduced by credits, which are determined based on the average daily cash balance the Fund maintains with SSBT. All credit balances, if any, used to reduce the Fund’s custodian fees are reported as a reduction of expenses in the Statement of Operations.
G Foreign Currency Translation — Investment valuations, other assets, and liabilities initially expressed in foreign currencies are translated each business day into U.S. dollars based upon current exchange rates. Purchases and sales of foreign investment securities and income and expenses denominated in foreign currencies are translated into U.S. dollars based upon currency exchange rates in effect on the respective dates of such transactions. Recognized gains or losses on investment transactions attributable to changes in foreign currency exchange rates are recorded for financial statement purposes as net realized gains and losses on investments. That portion of unrealized gains and losses on investments that results from fluctuations in foreign currency exchange rates is not separately disclosed.
H Use of Estimates — The preparation of the financial statements in conformity with accounting principles generally accepted in the United States of America requires management to make estimates and assumptions that affect the reported amounts of assets and liabilities at the date of the financial statements and the reported amounts of income and expense during the reporting period. Actual results could differ from those estimates.
I Indemnifications — The Corporation’s Articles of Incorporation provide that no Director or officer of the Corporation shall be liable, to the fullest extent permitted by Maryland law and the 1940 Act, to the Corporation or to its shareholders for money damages. Additionally, in the normal course of business, the Fund enters into agreements with service providers that may contain indemnification clauses. The Fund’s maximum exposure under these arrangements is unknown as this would involve future claims that may be made against the Fund that have not yet occurred.
J Financial Futures Contracts — Upon entering into a financial futures contract, the Fund is required to deposit with the broker, either in cash or securities, an amount equal to a certain percentage of the contract amount (initial margin). Subsequent payments, known as variation margin, are made or received by the Fund each business day, depending on the daily fluctuations in the value of the underlying security, and are recorded as unrealized gains or losses by the Fund. Gains (losses) are realized upon the expiration or closing of the financial futures contracts. Should market conditions change unexpectedly, the Fund may not achieve the anticipated benefits of the financial futures contracts and may realize a loss. Futures contracts have minimal counterparty risk as they are exchange traded and the clearinghouse for the exchange is substituted as the counterparty, guaranteeing counterparty performance.
K Forward Foreign Currency Exchange Contracts — The Fund may enter into forward foreign currency exchange contracts for the purchase or sale of a specific foreign currency at a fixed price on a future date. The forward foreign currency exchange contracts are adjusted by the daily exchange rate of the underlying currency and any gains or losses are recorded as unrealized until such time as the contracts have been closed. Risks may arise upon entering these contracts from the potential inability of counterparties to meet the terms of their contracts and from movements in the value of a foreign currency relative to the U.S. dollar.
L When-Issued Securities and Delayed Delivery Transactions — The Fund may purchase or sell securities on a delayed delivery or when-issued basis. Payment and delivery may take place after the customary settlement period for that security. At the time the transaction is negotiated, the price of the security that will be delivered is fixed. The Fund maintains security positions for these commitments such that sufficient liquid assets will be available to make payments upon settlement. Securities purchased on a delayed delivery or when-issued basis are marked-to-market daily and begin earning interest on settlement date. Losses may arise due to changes in the market value of the underlying securities or if the counterparty does not perform under the contract.
2 Distributions to Shareholders
It is the present policy of the Fund to make at least one distribution annually (normally in December) of all or substantially all of its net investment income and to distribute annually all or substantially all of its net realized capital gains. Distributions to shareholders are recorded on the ex-dividend date. Shareholders may reinvest income and capital gain distributions in additional shares of the Fund at the net asset value as of the ex-dividend date or, at the election of the shareholder, receive distributions in cash. The Fund distinguishes between distributions on a tax basis and a financial reporting basis. Accounting principles generally accepted in the United States of America require that only distributions in excess of tax basis earnings and profits be reported in the financial statements as a return of capital. Permanent differences between book and tax accounting relating to distributions are reclassified to paid-in capital. For tax purposes, distributions from short-term capital gains are considered to be from ordinary income.
Eaton Vance
Institutional Emerging Markets Local Debt Fund
July 31, 2013
Notes to Financial Statements — continued
During the period ended July 31, 2013, accumulated net realized loss was increased by $5,623, accumulated undistributed net investment income was increased by $16,081, and paid-in capital was decreased by $10,458 due to differences between book and tax accounting, primarily for premium amortization, foreign currency gain (loss), non-deductible expenses and investments in partnerships. These reclassifications had no effect on the net assets or net asset value per share of the Fund.
As of July 31, 2013, the components of distributable earnings (accumulated losses) and unrealized appreciation (depreciation) on a tax basis were as follows:
| | | | |
Undistributed ordinary income | | $ | 255,867 | |
Undistributed long-term capital gains | | $ | 46,393 | |
Net unrealized depreciation | | $ | (873,351 | ) |
The differences between components of distributable earnings (accumulated losses) on a tax basis and the amounts reflected in the Statement of Assets and Liabilities are primarily due to foreign currency transactions, futures contracts, investments in partnerships and premium amortization.
3 Investment Adviser and Administration Fee and Other Transactions with Affiliates
The investment adviser and administration fee is earned by EVM as compensation for investment advisory and administrative services rendered to the Fund. The fee is computed at an annual rate of 0.65% of the Fund’s average daily net assets up to $500 million and is payable monthly. On net assets of $500 million and over, the annual fee is reduced. For the period ended July 31, 2013, the investment adviser and administration fee amounted to $47,139 or 0.65% (annualized) of the Fund’s average daily net assets. The Fund invests its cash in Cash Reserves Fund. EVM does not currently receive a fee for advisory services provided to Cash Reserves Fund.
EVM has agreed to reimburse the Fund’s expenses to the extent that total annual operating expenses (relating to ordinary operating expenses only) exceed 0.85% of the Fund’s average daily net assets. This agreement may be changed or terminated after November 30, 2014. Pursuant to this agreement, EVM was allocated $157,824 of the Fund’s operating expenses for the period ended July 31, 2013.
EVM serves as the sub-transfer agent of the Fund and receives from the transfer agent an aggregate fee based upon the actual expenses incurred by EVM in the performance of these services. For the period ended July 31, 2013, EVM earned $4 in sub-transfer agent fees.
Directors and officers of the Fund who are members of EVM’s organization receive remuneration for their services to the Fund out of the investment adviser and administration fee. Directors of the Fund who are not affiliated with EVM may elect to defer receipt of all or a percentage of their annual fees in accordance with the terms of the Directors Deferred Compensation Plan. For the period ended July 31, 2013, no significant amounts have been deferred. Certain officers and Directors of the Fund are officers of EVM.
4 Purchases and Sales of Investments
Purchases and sales of investments, other than short-term obligations, aggregated $9,641,242 and $0, respectively, for the period ended July 31, 2013.
5 Common Shares
The Corporation’s Articles of Incorporation permit the Directors to issue one billion full and fractional common shares of the Fund ($0.001 par value per share). Transactions in Fund shares were as follows:
| | | | |
| | | Period Ended
July 31, 2013(1) | |
| |
Sales | | | 1,500,000 | |
| |
Net increase | | | 1,500,000 | |
| (1) | For the period from commencement of operations on February 4, 2013 to July 31, 2013. |
At July 31, 2013, an affiliate of EVM owned 100% of the outstanding shares of the Fund.
Eaton Vance
Institutional Emerging Markets Local Debt Fund
July 31, 2013
Notes to Financial Statements — continued
6 Federal Income Tax Basis of Investments
The cost and unrealized appreciation (depreciation) of investments of the Fund at July 31, 2013, as determined on a federal income tax basis, were as follows:
| | | | |
| |
Aggregate cost | | $ | 15,040,998 | |
| |
Gross unrealized appreciation | | $ | 11,675 | |
Gross unrealized depreciation | | | (863,872 | ) |
| |
Net unrealized depreciation | | $ | (852,197 | ) |
7 Financial Instruments
The Fund may trade in financial instruments with off-balance sheet risk in the normal course of its investing activities. These financial instruments may include forward foreign currency exchange contracts and financial futures contracts and may involve, to a varying degree, elements of risk in excess of the amounts recognized for financial statement purposes. The notional or contractual amounts of these instruments represent the investment the Fund has in particular classes of financial instruments and do not necessarily represent the amounts potentially subject to risk. The measurement of the risks associated with these instruments is meaningful only when all related and offsetting transactions are considered.
A summary of obligations under these financial instruments at July 31, 2013 is as follows:
| | | | | | | | | | |
| Forward Foreign Currency Exchange Contracts | | | | | |
| | | | |
| | | | | | | | | | |
Sales | |
| Settlement Date | | Deliver | | In Exchange For | | Counterparty | | Net Unrealized
Appreciation (Depreciation) | |
| | | | |
| 8/7/13 | | Israeli Shekel
829,460 | | United States Dollar
228,880 | | Bank of America | | $ | (3,821 | ) |
| 8/20/13 | | Euro
82,350 | | United States Dollar
109,360 | | Goldman Sachs International | | | (200 | ) |
| 8/20/13 | | Euro
1,432,156 | | United States Dollar
1,848,598 | | Standard Chartered Bank | | | (56,783 | ) |
| 9/13/13 | | Serbian Dinar
27,690,000 | | Euro
241,150 | | Deutsche Bank | | | 316 | |
| 9/23/13 | | Euro
335,000 | | United States Dollar
449,211 | | Goldman Sachs International | | | 3,465 | |
| 10/30/13 | | Euro
1,432,156 | | United States Dollar
1,902,798 | | Standard Chartered Bank | | | (3,078 | ) |
| | | | |
| | | | | | | | | $ | (60,101 | ) |
| |
| | | | |
Purchases | | | |
| Settlement Date | | In Exchange For | | Deliver | | Counterparty | | Net Unrealized Appreciation (Depreciation) | |
| | | | |
| 8/7/13 | | Israeli Shekel
829,460 | | United States Dollar
232,400 | | Bank of America | | $ | 301 | |
| 8/20/13 | | Euro
82,350 | | United States Dollar
106,324 | | Goldman Sachs International | | | 3,237 | |
Eaton Vance
Institutional Emerging Markets Local Debt Fund
July 31, 2013
Notes to Financial Statements — continued
| | | | | | | | | | |
| Forward Foreign Currency Exchange Contracts (continued) | | | | | |
| | | | |
| | | | | | | | | | |
Purchases | | | |
| Settlement Date | | In Exchange For | | Deliver | | Counterparty | | Net Unrealized Appreciation (Depreciation) | |
| | | | |
| 8/20/13 | | Euro
1,432,156 | | United States Dollar
1,902,333 | | Standard Chartered Bank | | $ | 3,048 | |
| 9/3/13 | | Philippine Peso
3,900,000 | | United States Dollar 90,159 | | Goldman Sachs International | | | (183 | ) |
| 9/12/13 | | Kenyan Shilling
12,000,000 | | United States Dollar 137,143 | | Standard Chartered Bank | | | (793 | ) |
| 9/25/13 | | Israeli Shekel
829,460 | | United States Dollar 228,602 | | Bank of America | | | 3,833 | |
| 10/15/13 | | Thai Baht
17,868,000 | | United States Dollar 569,045 | | Deutsche Bank | | | (543 | ) |
| 10/30/13 | | Euro
82,350 | | United States Dollar 109,387 | | Goldman Sachs International | | | 202 | |
| 10/31/13 | | Indian Rupee
38,453,000 | | United States Dollar 634,569 | | Goldman Sachs International | | | (16,019 | ) |
| 7/17/14 | | Armenian Dram
59,830,000 | | United States Dollar 136,567 | | VTB Capital PLC | | | 941 | |
| | | | |
| | | | | | | | | $ | (5,976 | ) |
| | | | | | | | | | | | | | |
| Futures Contracts | |
| | | | | |
| | | | | | | | | | | | | | |
Expiration
Month/Year | | Contracts | | Position | | Aggregate Cost | | Value | | | Net Unrealized Appreciation | |
| | | | | |
| 9/13 | | 12
U.S. 10-Year Deliverable Interest Rate Swap | | Short | | $(1,180,408) | | $ | (1,135,688 | ) | | $ | 44,720 | |
| | | | | |
| | | | | | | | | | | | | $ | 44,720 | |
At July 31, 2013, the Fund had sufficient cash and/or securities to cover commitments under these contracts.
In the normal course of pursuing its investment objective, the Fund is subject to the following risks:
Foreign Exchange Risk: The Fund engages in forward foreign currency exchange contracts to enhance total return, to seek to hedge against fluctuations in currency exchange rates and/or as a substitute for the purchase or sale of securities or currencies.
Interest Rate Risk: The Fund utilizes interest rate derivatives including futures contracts to enhance total return, to seek to hedge against fluctuations in interest rates and/or to change the effective duration of its portfolio.
The Fund enters into forward foreign currency exchange contracts that may contain provisions whereby the counterparty may terminate the contract under certain conditions, including but not limited to a decline in the Fund’s net assets below a certain level over a certain period of time, which would trigger a payment by the Fund for those derivatives in a liability position. At July 31, 2013, the fair value of derivatives with credit-related contingent features in a net liability position was $81,420.
The non-exchange traded derivatives in which the Fund invests, including forward foreign currency exchange contracts, are subject to the risk that the counterparty to the contract fails to perform its obligations under the contract. To mitigate this risk, the Fund has entered into master netting agreements with substantially all of its derivative counterparties, which allows it and a counterparty to aggregate amounts owed by each of them for derivative transactions under the agreement into a single net amount payable by either the Fund or the counterparty. Counterparties may be required to pledge collateral in the form of cash, U.S. Government securities or highly-rated bonds for the benefit of the Fund if the net amount due from the counterparty with respect to a derivative contract exceeds a certain threshold. The amount of collateral posted by the counterparties with respect to such contracts would also reduce the amount of any loss incurred.
Eaton Vance
Institutional Emerging Markets Local Debt Fund
July 31, 2013
Notes to Financial Statements — continued
The fair value of open derivative instruments (not considered to be hedging instruments for accounting disclosure purposes) by risk exposure at July 31, 2013 was as follows:
| | | | | | | | |
| | | Fair Value | |
| Statement of Assets and Liabilities Caption | | Foreign
Exchange | | | Interest
Rate | |
| | |
Net unrealized depreciation* | | $ | — | | | $ | 44,720 | |
Receivable for open forward foreign currency exchange contracts | | | 15,343 | | | | — | |
| | |
Total Asset Derivatives | | $ | 15,343 | | | $ | 44,720 | |
| | |
Payable for open forward foreign currency exchange contracts | | $ | (81,420 | ) | | $ | — | |
| | |
Total Liability Derivatives | | $ | (81,420 | ) | | $ | — | |
| * | Amount represents cumulative unrealized appreciation or (depreciation) on futures contracts in the Futures Contracts table above. Only the current day’s variation margin on open futures contracts is reported within the Statement of Assets and Liabilities as Receivable or Payable for variation margin, as applicable. |
During the current reporting period, the Fund adopted the new disclosure requirements for offsetting assets and liabilities, pursuant to which an entity is required to disclose both gross and net information for assets and liabilities related to derivatives, repurchase and reverse repurchase agreements, and securities lending and securities borrowing transactions that are eligible for offset or subject to an enforceable master netting or similar agreement. The Fund’s derivative assets and liabilities at fair value by type, which are reported gross in the Statement of Assets and Liabilities, are presented in the table above. The following tables present the Fund’s derivative assets and liabilities by counterparty, net of amounts available for offset under a master netting agreement and net of the related collateral received by the Fund for assets and pledged by the Fund for liabilities as of July 31, 2013.
| | | | | | | | | | | | | | | | |
| Counterparty | | Derivative Assets
Subject to Master
Netting Agreement
by Counterparty | | | Derivatives Available
for Offset | | | Non-cash Collateral Received(a) | | Cash
Collateral Received(a) | | Net Amount
of Derivative
Assets(b) | |
| | | | | |
| Bank of America | | $ | 4,134 | | | $ | (3,821 | ) | | $ — | | $ — | | $ | 313 | |
| Deutsche Bank | | | 316 | | | | (316 | ) | | — | | — | | | — | |
| Goldman Sachs International | | | 6,904 | | | | (6,904 | ) | | — | | — | | | — | |
| Standard Chartered Bank | | | 3,048 | | | | (3,048 | ) | | — | | — | | | — | |
| VTB Capital PLC | | | 941 | | | | — | | | — | | — | | | 941 | |
| | | | | |
| | | $ | 15,343 | | | $ | (14,089 | ) | | $ — | | $ — | | $ | 1,254 | |
| | | | | |
| Counterparty | | Derivative Liabilities
Subject to Master
Netting Agreement
by Counterparty | | | Derivatives Available
for Offset | | | Non-cash
Collateral
Pledged(a) | | Cash
Collateral
Pledged(a) | | Net Amount
of Derivative
Liabilities(c) | |
| | | | | |
| Bank of America | | $ | (3,821 | ) | | $ | 3,821 | | | $ — | | $ — | | $ | — | |
| Deutsche Bank | | | (543 | ) | | | 316 | | | — | | — | | | (227 | ) |
| Goldman Sachs International | | | (16,402 | ) | | | 6,904 | | | — | | — | | | (9,498 | ) |
| Standard Chartered Bank | | | (60,654 | ) | | | 3,048 | | | — | | — | | | (57,606 | ) |
| | | | | |
| | | $ | (81,420 | ) | | $ | 14,089 | | | $ — | | $ — | | $ | (67,331 | ) |
| (a) | In some instances, the actual collateral received and/or pledged may be more than the amount shown due to overcollateralization. |
| (b) | Net amount represents the net amount due from the counterparty in the event of default. |
| (c) | Net amount represents the net amount payable to the counterparty in the event of default. |
Eaton Vance
Institutional Emerging Markets Local Debt Fund
July 31, 2013
Notes to Financial Statements — continued
The effect of derivative instruments (not considered to be hedging instruments for accounting disclosure purposes) on the Statement of Operations by risk exposure for the period ended July 31, 2013 was as follows:
| | | | | | | | |
| Statement of Operations Caption | | Foreign
Exchange | | | Interest
Rate | |
| | |
Net realized gain (loss) — | | | | | | | | |
Financial futures contracts | | $ | — | | | $ | 32,602 | |
Foreign currency and forward foreign currency exchange contract transactions | | | (1,637 | ) | | | — | |
| | |
Total | | $ | (1,637 | ) | | $ | 32,602 | |
| | |
Change in unrealized appreciation (depreciation) — | | | | | | | | |
Financial futures contracts | | $ | — | | | $ | 44,720 | |
Foreign currency and forward foreign currency exchange contracts | | | (66,077 | ) | | | — | |
| | |
Total | | $ | (66,077 | ) | | $ | 44,720 | |
The average notional amounts of futures contracts and forward foreign currency exchange contracts outstanding during the period ended July 31, 2013, which are indicative of the volume of these derivative types, were approximately $650,000 and $5,732,000, respectively.
8 Risks Associated with Foreign Investments
Investing in securities issued by entities whose principal business activities are outside the United States may involve significant risks not present in domestic investments. For example, there is generally less publicly available information about foreign companies, particularly those not subject to the disclosure and reporting requirements of the U.S. securities laws. Certain foreign issuers are generally not bound by uniform accounting, auditing, and financial reporting requirements and standards of practice comparable to those applicable to domestic issuers. Investments in foreign securities also involve the risk of possible adverse changes in investment or exchange control regulations, expropriation or confiscatory taxation, limitation on the removal of funds or other assets of the Fund, political or financial instability or diplomatic and other developments which could affect such investments. Foreign securities markets, while growing in volume and sophistication, are generally not as developed as those in the United States, and securities of some foreign issuers (particularly those located in developing countries) may be less liquid and more volatile than securities of comparable U.S. companies. In general, there is less overall governmental supervision and regulation of foreign securities markets, broker/dealers and issuers than in the United States.
9 Fair Value Measurements
Under generally accepted accounting principles for fair value measurements, a three-tier hierarchy to prioritize the assumptions, referred to as inputs, is used in valuation techniques to measure fair value. The three-tier hierarchy of inputs is summarized in the three broad levels listed below.
| Ÿ | | Level 1 – quoted prices in active markets for identical investments |
| Ÿ | | Level 2 – other significant observable inputs (including quoted prices for similar investments, interest rates, prepayment speeds, credit risk, etc.) |
| Ÿ | | Level 3 – significant unobservable inputs (including a fund’s own assumptions in determining the fair value of investments) |
In cases where the inputs used to measure fair value fall in different levels of the fair value hierarchy, the level disclosed is determined based on the lowest level input that is significant to the fair value measurement in its entirety. The inputs or methodology used for valuing securities are not necessarily an indication of the risk associated with investing in those securities.
Eaton Vance
Institutional Emerging Markets Local Debt Fund
July 31, 2013
Notes to Financial Statements — continued
At July 31, 2013, the hierarchy of inputs used in valuing the Fund’s investments and open derivative instruments, which are carried at value, were as follows:
| | | | | | | | | | | | | | | | |
| Asset Description | | Level 1 | | | Level 2 | | | Level 3 | | | Total | |
| | | | |
Foreign Government Bonds | | $ | — | | | $ | 8,550,351 | | | $ | — | | | $ | 8,550,351 | |
Short-Term Investments — | | | | | | | | | | | | |
Foreign Government Securities | | | — | | | | 3,701,914 | | | | — | | | | 3,701,914 | |
U.S. Treasury Obligations | | | — | | | | 24,999 | | | | — | | | | 24,999 | |
Other | | | — | | | | 1,911,537 | | | | — | | | | 1,911,537 | |
| | | | |
Total Investments | | $ | — | | | $ | 14,188,801 | | | $ | — | | | $ | 14,188,801 | |
| | | | |
Forward Foreign Currency Exchange Contracts | | $ | — | | | $ | 15,343 | | | $ | — | | | $ | 15,343 | |
Futures Contracts | | | 44,720 | | | | — | | | | — | | | | 44,720 | |
| | | | |
Total | | $ | 44,720 | | | $ | 14,204,144 | | | $ | — | | | $ | 14,248,864 | |
| | | | |
Liability Description | | | | | | | | | | | | | | | | |
| | | | |
Forward Foreign Currency Exchange Contracts | | $ | — | | | $ | (81,420 | ) | | $ | — | | | $ | (81,420 | ) |
| | | | |
Total | | $ | — | | | $ | (81,420 | ) | | $ | — | | | $ | (81,420 | ) |
Eaton Vance
Institutional Emerging Markets Local Debt Fund
July 31, 2013
Report of Independent Registered Public Accounting Firm
To the Directors of Eaton Vance Series Fund, Inc. and Shareholder of Eaton Vance Institutional Emerging Markets Local Debt Fund:
We have audited the accompanying statement of assets and liabilities of Eaton Vance Institutional Emerging Markets Local Debt Fund (the “Fund”) (one of the funds constituting Eaton Vance Series Fund, Inc.), including the portfolio of investments, as of July 31, 2013, and the related statements of operations and changes in net assets and the financial highlights for the period from commencement of operations on February 4, 2013 to July 31, 2013. These financial statements and financial highlights are the responsibility of the Fund’s management. Our responsibility is to express an opinion on these financial statements and financial highlights based on our audit.
We conducted our audit in accordance with the standards of the Public Company Accounting Oversight Board (United States). Those standards require that we plan and perform the audit to obtain reasonable assurance about whether the financial statements and financial highlights are free of material misstatement. The Fund is not required to have, nor were we engaged to perform, an audit of its internal control over financial reporting. Our audit included consideration of internal control over financial reporting as a basis for designing audit procedures that are appropriate in the circumstances, but not for the purpose of expressing an opinion on the effectiveness of the Fund’s internal control over financial reporting. Accordingly, we express no such opinion. An audit also includes examining, on a test basis, evidence supporting the amounts and disclosures in the financial statements, assessing the accounting principles used and significant estimates made by management, as well as evaluating the overall financial statement presentation. Our procedures included confirmation of securities owned as of July 31, 2013, by correspondence with the custodian and brokers; where replies were not received from brokers, we performed other auditing procedures. We believe that our audit provides a reasonable basis for our opinion.
In our opinion, such financial statements and financial highlights referred to above present fairly, in all material respects, the financial position of Eaton Vance Institutional Emerging Markets Local Debt Fund as of July 31, 2013, and the results of its operations, the changes in its net assets, and the financial highlights for the period from commencement of operations on February 4, 2013 to July 31, 2013, in conformity with accounting principles generally accepted in the United States of America.
DELOITTE & TOUCHE LLP
Boston, Massachusetts
September 16, 2013
Eaton Vance
Institutional Emerging Markets Local Debt Fund
July 31, 2013
Federal Tax Information (Unaudited)
The Form 1099-DIV you receive in January 2014 will show the tax status of all distributions paid to your account in calendar year 2013. Shareholders are advised to consult their own tax adviser with respect to the tax consequences of their investment in the Fund. As required by the Internal Revenue Code and/or regulations, shareholders must be notified regarding the status of the foreign tax credit and capital gains dividends.
Foreign Tax Credit. The Fund paid foreign taxes of $7,246 and recognized foreign source income of $382,218.
Capital Gains Dividends. The Fund hereby designates as a capital gain dividend with respect to the taxable year ended July 31, 2013, $46,393 or, if subsequently determined to be different, the net capital gain of such year.
Eaton Vance
Institutional Emerging Markets Local Debt Fund
July 31, 2013
Board of Trustees’ Contract Approval
Overview of the Contract Review Process
The Investment Company Act of 1940, as amended (the “1940 Act”), provides, in substance, that for a fund to enter into an investment advisory agreement with an investment adviser, the fund’s board of trustees, including a majority of the trustees who are not “interested persons” of the fund (“Independent Trustees”), must approve the agreement and its terms at an in-person meeting called for the purpose of considering such approval.
At a meeting of the Boards of Trustees (each a “Board”) of the Eaton Vance group of mutual funds (the “Eaton Vance Funds”) held on August 6, 2012, the Board, including a majority of the Independent Trustees, voted to approve the investment advisory and administrative agreement of Eaton Vance Institutional Emerging Markets Local Debt Fund (the “Fund”), with Eaton Vance Management (the “Adviser”). The Board reviewed information furnished for the August 6, 2012 meeting as well as information previously furnished with respect to the approval of other investment advisory agreements for other Eaton Vance Funds. Such information included, among other things, the following:
Information about Fees and Expenses
| Ÿ | | The advisory and related fees to be paid by the Fund and the anticipated expense ratio of the Fund; |
| Ÿ | | Comparative information concerning fees charged by the Adviser for managing other accounts (including mutual funds, other collective investment funds and institutional accounts) using investment strategies and techniques similar to those to be used in managing the Fund, if applicable, and concerning fees charged by other advisers for managing funds similar to the Fund; |
Information about Portfolio Management
| Ÿ | | Descriptions of the investment management services to be provided to the Fund, including the investment strategies and processes to be employed; |
| Ÿ | | Information concerning the allocation of brokerage and the benefits expected to be received by the Adviser as a result of brokerage allocation for the Fund, including information concerning the acquisition of research through client commission arrangements and the Fund’s policies with respect to “soft dollar” arrangements; |
| Ÿ | | The procedures and processes to be used to determine the fair value of the Fund’s assets and actions to be taken to monitor and test the effectiveness of such procedures and processes; |
Information about the Adviser
| Ÿ | | Reports and/or other information provided by the Adviser describing the financial results and condition of the Adviser; |
| Ÿ | | Descriptions of the qualifications, education and experience of the individual investment professionals whose responsibilities include portfolio management and investment research for the Fund, and information relating to their compensation and responsibilities with respect to managing other mutual funds and investment accounts; |
| Ÿ | | Copies of the Codes of Ethics of the Adviser and its affiliates, together with information relating to compliance with and the administration of such codes; |
| Ÿ | | Copies of or descriptions of the Adviser’s policies and procedures relating to proxy voting and the handling of corporate actions and class actions; |
| Ÿ | | Information concerning the resources devoted to compliance efforts undertaken by the Adviser and its affiliates on behalf of the Eaton Vance Funds (including descriptions of various compliance programs) and their record of compliance with investment policies and restrictions, including policies with respect to market-timing, late trading and selective portfolio disclosure, and with policies on personal securities transactions; |
| Ÿ | | Descriptions of the business continuity and disaster recovery plans of the Adviser and its affiliates; |
Other Relevant Information
| Ÿ | | Information concerning the nature, cost and character of the administrative and other non-investment management services to be provided by Eaton Vance Management and its affiliates; |
| Ÿ | | Information concerning management of the relationship with the custodian, subcustodians and fund accountants by the Adviser (which is the administrator); and |
| Ÿ | | The terms of the investment advisory and administrative agreement of the Fund. |
Results of the Process
Based on its consideration of the foregoing, and such other information as it deemed relevant, including the factors and conclusions described below, the Board concluded that the terms of the Fund’s investment advisory and administrative agreement with the Adviser, including its fee structure, is in the interests of shareholders and, therefore, the Board, including a majority of the Independent Trustees, voted to approve the terms of the investment advisory and administrative agreement for the Fund.
Eaton Vance
Institutional Emerging Markets Local Debt Fund
July 31, 2013
Board of Trustees’ Contract Approval — continued
Nature, Extent and Quality of Services
In considering whether to approve the investment advisory and administrative agreement of the Fund, the Board evaluated the nature, extent and quality of services to be provided to the Fund by the Adviser.
The Board considered the Adviser’s management capabilities and investment process with respect to the types of investments to be held by the Fund, including the education, experience and number of its investment professionals and other personnel who will provide portfolio management, investment research, and similar services to the Fund. In particular, the Board considered the abilities and experience of such personnel in investing in securities, derivatives and other instruments to establish long and short investment exposures to emerging markets, and investing in derivatives to establish short investment exposure to the euro. The Board also took into account the resources dedicated to portfolio management and other services, including the compensation methods of the Adviser to recruit and retain investment personnel, and the time and attention expected to be devoted to Fund matters by senior management.
The Board reviewed the compliance programs of the Adviser and relevant affiliates thereof. Among other matters, the Board considered compliance and reporting matters relating to personal trading by investment personnel, selective disclosure of portfolio holdings, late trading, frequent trading, portfolio valuation, business continuity and the allocation of investment opportunities. The Board also evaluated the responses of the Adviser and its affiliates to requests in recent years from regulatory authorities such as the Securities and Exchange Commission and the Financial Industry Regulatory Authority.
The Board considered shareholder and other administrative services provided or managed by the Adviser and its affiliates, including transfer agency and accounting services. The Board evaluated the benefits to shareholders of investing in a fund that is a part of a large family of funds, including the ability, in many cases, to exchange an investment among different funds without incurring additional sales charges.
After consideration of the foregoing factors, among others, the Board concluded that the nature, extent and quality of services to be provided by the Adviser, taken as a whole, are appropriate and consistent with the terms of the investment advisory and administrative agreement.
Fund Performance
Because the Fund has not yet commenced operations, it has no performance record.
Management Fees and Expenses
The Board reviewed contractual fee rates to be payable by the Fund for advisory and administrative services (referred to collectively as “management fees”). As part of its review, the Board considered the Fund’s management fees as compared to a group of similarly managed funds selected by an independent data provider and the Fund’s estimated expense ratio for a one-year period.
After reviewing the foregoing information, and in light of the nature, extent and quality of the services to be provided by the Adviser, the Board concluded that the management fees proposed to be charged for advisory and related services are reasonable.
Profitability
The Board reviewed the level of profits projected to be realized by the Adviser and relevant affiliates thereof in providing investment advisory and administrative services to the Fund. The Board considered the level of profits expected to be realized without regard to revenue sharing or other payments expected to be made by the Adviser and its affiliates to third parties in respect of distribution services. The Board also considered other direct or indirect benefits expected to be received by the Adviser and its affiliates in connection with their relationships with the Fund, including the benefits of research services that may be available to the Adviser as a result of securities transactions effected for the Fund and other investment advisory clients.
The Board concluded that, in light of the foregoing factors and the nature, extent and quality of the services to be rendered, the profits expected to be realized by the Adviser and its affiliates are reasonable.
Economies of Scale
In reviewing management fees and profitability, the Board also considered the extent to which the Adviser and its affiliates, on the one hand, and the Fund, on the other hand, can expect to realize benefits from economies of scale as the assets of the Fund increase. The Board acknowledged the difficulty in accurately measuring the benefits resulting from the economies of scale with respect to the management of any specific fund or group of funds. The Board also concluded that, assuming reasonably foreseeable increases in the assets of the Fund, the structure of the advisory fee, which includes breakpoints at several asset levels, can be expected to allow the Fund to benefit from economies of scale in the future.
Eaton Vance
Institutional Emerging Markets Local Debt Fund
July 31, 2013
Management and Organization
Fund Management. The Directors of Eaton Vance Series Fund, Inc. (the Corporation) are responsible for the overall management and supervision of the Corporation’s affairs. The Directors and officers of the Corporation are listed below. Except as indicated, each individual has held the office shown or other offices in the same company for the last five years. Directors and officers of the Corporation hold indefinite terms of office. The “Noninterested Directors” consist of those Directors who are not “interested persons” of the Corporation, as that term is defined under the 1940 Act. The business address of each Director and officer is Two International Place, Boston, Massachusetts 02110. As used below, “EVC” refers to Eaton Vance Corp., “EV” refers to Eaton Vance, Inc., “EVM” refers to Eaton Vance Management, “BMR” refers to Boston Management and Research and “EVD” refers to Eaton Vance Distributors, Inc. EVC and EV are the corporate parent and trustee, respectively, of EVM and BMR. EVD is the Fund’s principal underwriter and a wholly-owned subsidiary of EVC. Each officer affiliated with Eaton Vance may hold a position with other Eaton Vance affiliates that is comparable to his or her position with EVM listed below. Each Director oversees 186 portfolios in the Eaton Vance Complex (including all master and feeder funds in a master feeder structure). Each officer serves as an officer of certain other Eaton Vance funds. Each Director and officer serves until his or her successor is elected.
| | | | | | |
| Name and Year of Birth | | Position(s) with the
Corporation | | Term of Office;
Length of
Service | | Principal Occupation(s) and Directorships During Past Five Years and Other Relevant Experience |
Interested Director |
| | | |
Thomas E. Faust Jr. 1958 | | Director | | Since 2013 | | Chairman, Chief Executive Officer and President of EVC, Director and President of EV, Chief Executive Officer and President of EVM and BMR, and Director of EVD. Trustee and/or officer of 186 registered investment companies. Mr. Faust is an interested person because of his positions with EVM, BMR, EVD, EVC and EV, which are affiliates of the Corporation. Directorships in the Last Five Years.(1) Director of EVC and Hexavest Inc. |
| | | |
| | | | | | |
Noninterested Directors |
| | | |
Scott E. Eston 1956 | | Director | | Since 2013 | | Private investor. Formerly held various positions at Grantham, Mayo, Van Otterloo and Co., L.L.C. (investment management firm) (1997-2009), including Chief Operating Officer (2002-2009), Chief Financial Officer (1997-2009) and Chairman of the Executive Committee (2002-2008); President and Principal Executive Officer, GMO Trust (open-end registered investment company) (2006-2009). Former Partner, Coopers and Lybrand L.L.P. (now PricewaterhouseCoopers) (public accounting firm) (1987-1997). Directorships in the Last Five Years. None. |
| | | |
Benjamin C. Esty 1963 | | Director | | Since 2013 | | Roy and Elizabeth Simmons Professor of Business Administration and Finance Unit Head, Harvard University Graduate School of Business Administration. Directorships in the Last Five Years.(1) None. |
| | | |
Allen R. Freedman 1940 | | Director | | Since 2013 | | Private Investor. Former Chairman (2002-2004) and a Director (1983-2004) of Systems & Computer Technology Corp. (provider of software to higher education). Formerly, a Director of Loring Ward International (fund distributor) (2005-2007). Former Chairman and a Director of Indus International, Inc. (provider of enterprise management software to the power generating industry) (2005-2007). Former Chief Executive Officer of Assurant, Inc. (insurance provider) (1979-2000). Directorships in the Last Five Years.(1) Director of Stonemor Partners, L.P. (owner and operator of cemeteries). Formerly, Director of Assurant, Inc. (insurance provider) (1979-2011). |
| | | |
William H. Park 1947 | | Director | | Since 2013 | | Consultant and private investor. Formerly, Chief Financial Officer, Aveon Group L.P. (investment management firm) (2010-2011). Formerly, Vice Chairman, Commercial Industrial Finance Corp. (specialty finance company) (2006-2010). Formerly, President and Chief Executive Officer, Prizm Capital Management, LLC (investment management firm) (2002-2005). Formerly, Executive Vice President and Chief Financial Officer, United Asset Management Corporation (investment management firm) (1982-2001). Formerly, Senior Manager, Price Waterhouse (now PricewaterhouseCoopers) (an independent registered public accounting firm) (1972-1981). Directorships in the Last Five Years.(1) None. |
| | | |
Ronald A. Pearlman 1940 | | Director | | Since 2013 | | Professor of Law, Georgetown University Law Center. Formerly, Deputy Assistant Secretary (Tax Policy) and Assistant Secretary (Tax Policy), U.S. Department of the Treasury (1983-1985). Formerly, Chief of Staff, Joint Committee on Taxation, U.S. Congress (1988-1990). Directorships in the Last Five Years.(1) None. |
Eaton Vance
Institutional Emerging Markets Local Debt Fund
July 31, 2013
Management and Organization — continued
| | | | | | |
| Name and Year of Birth | | Position(s) with the
Corporation | | Term of Office;
Length of
Service | | Principal Occupation(s) and Directorships During Past Five Years and Other Relevant Experience |
Noninterested Directors (continued) |
| | | |
Helen Frame Peters 1948 | | Director | | Since 2013 | | Professor of Finance, Carroll School of Management, Boston College. Formerly, Dean, Carroll School of Management, Boston College (2000-2002). Formerly, Chief Investment Officer, Fixed Income, Scudder Kemper Investments (investment management firm) (1998-1999). Formerly, Chief Investment Officer, Equity and Fixed Income, Colonial Management Associates (investment management firm) (1991-1998). Directorships in the Last Five Years.(1) Formerly, Director of BJ’s Wholesale Club, Inc. (wholesale club retailer) (2004-2011). Formerly, Trustee of SPDR Index Shares Funds and SPDR Series Trust (exchange traded funds) (2000-2009). Formerly, Director of Federal Home Loan Bank of Boston (a bank for banks) (2007-2009). |
| | | |
Lynn A. Stout 1957 | | Director | | Since 2013 | | Distinguished Professor of Corporate and Business Law, Jack G. Clarke Business Law Institute, Cornell University Law School. Formerly, the Paul Hastings Professor of Corporate and Securities Law (2006-2012) and Professor of Law (2001-2006), University of California at Los Angeles School of Law. Directorships in the Last Five Years.(1) None. |
| | | |
Harriett Tee Taggart 1948 | | Director | | Since 2013 | | Managing Director, Taggart Associates (a professional practice firm). Formerly, Partner and Senior Vice President, Wellington Management Company, LLP (investment management firm) (1983-2006). Directorships in the Last Five Years. Director of Albemarle Corporation (chemicals manufacturer) (since 2007) and The Hanover Group (specialty property and casualty insurance company) (since 2009). Formerly, Director of Lubrizol Corporation (specialty chemicals) (2007-2011). |
| | | |
Ralph F. Verni 1943 | | Chairman of the Board and Director | | Since 2013 | | Consultant and private investor. Formerly, Chief Investment Officer (1982-1992), Chief Financial Officer (1988-1990) and Director (1982-1992), New England Life. Formerly, Chairperson, New England Mutual Funds (1982-1992). Formerly, President and Chief Executive Officer, State Street Management & Research (1992-2000). Formerly, Chairperson, State Street Research Mutual Funds (1992-2000). Formerly, Director, W.P. Carey, LLC (1998-2004) and First Pioneer Farm Credit Corp. (2002-2006). Directorships in the Last Five Years.(1) None. |
| | | |
| | | | | | |
Principal Officers who are not Directors |
| Name and Year of Birth | | Position(s)
with the
Corporation | | Length of Service | | Principal Occupation(s) During Past Five Years |
Payson F. Swaffield 1956 | | President | | Since 2013 | | Vice President and Chief Income Investment Officer of EVM and BMR. |
| | | |
Duncan W. Richardson 1957 | | Vice President | | Since 2013 | | Director of EVC and Executive Vice President and Chief Equity Investment Officer of EVC, EVM and BMR. |
| | | |
Maureen A. Gemma 1960 | | Vice President, Secretary and Chief Legal Officer | | Since 2013 | | Vice President of EVM and BMR. |
| | | |
James F. Kirchner(2) 1967 | | Treasurer | | Since 2013 | | Vice President of EVM and BMR. |
| | | |
Paul M. O’Neil 1953 | | Chief Compliance Officer | | Since 2013 | | Vice President of EVM and BMR. |
| (1) | During their respective tenures, the Directors (except Mr. Eston and Ms. Taggart) also served as Board members of one or more of the following Eaton Vance funds (which operated in the years noted): Eaton Vance Credit Opportunities Fund (launched in 2005 and terminated in 2010); Eaton Vance Insured Florida Plus Municipal Bond Fund (launched in 2002 and terminated in 2009); and Eaton Vance National Municipal Income Trust (launched in 1998 and terminated in 2009). |
| (2) | Prior to March 1, 2013, Mr. Kirchner served as Assistant Treasurer of the Corporation, since its inception. |
The SAI for the Fund includes additional information about the Directors and officers of the Fund and can be obtained without charge on Eaton Vance’s website at www.eatonvance.com or by calling 1-800-262-1122.
Eaton Vance Funds
IMPORTANT NOTICES
Privacy. The Eaton Vance organization is committed to ensuring your financial privacy. Each of the financial institutions identified below has in effect the following policy (“Privacy Policy”) with respect to nonpublic personal information about its customers:
| Ÿ | | Only such information received from you, through application forms or otherwise, and information about your Eaton Vance fund transactions will be collected. This may include information such as name, address, social security number, tax status, account balances and transactions. |
| Ÿ | | None of such information about you (or former customers) will be disclosed to anyone, except as permitted by law (which includes disclosure to employees necessary to service your account). In the normal course of servicing a customer’s account, Eaton Vance may share information with unaffiliated third parties that perform various required services such as transfer agents, custodians and broker-dealers. |
| Ÿ | | Policies and procedures (including physical, electronic and procedural safeguards) are in place that are designed to protect the confidentiality of such information. |
| Ÿ | | We reserve the right to change our Privacy Policy at any time upon proper notification to you. Customers may want to review our Privacy Policy periodically for changes by accessing the link on our homepage: www.eatonvance.com. |
Our pledge of privacy applies to the following entities within the Eaton Vance organization: the Eaton Vance Family of Funds, Eaton Vance Management, Eaton Vance Investment Counsel, Eaton Vance Distributors, Inc., Eaton Vance Trust Company, Eaton Vance Management’s Real Estate Investment Group and Boston Management and Research. In addition, our Privacy Policy applies only to those Eaton Vance customers who are individuals and who have a direct relationship with us. If a customer’s account (i.e., fund shares) is held in the name of a third-party financial advisor/broker-dealer, it is likely that only such advisor’s privacy policies apply to the customer. This notice supersedes all previously issued privacy disclosures. For more information about Eaton Vance’s Privacy Policy, please call 1-800-262-1122.
Delivery of Shareholder Documents. The Securities and Exchange Commission (SEC) permits funds to deliver only one copy of shareholder documents, including prospectuses, proxy statements and shareholder reports, to fund investors with multiple accounts at the same residential or post office box address. This practice is often called “householding” and it helps eliminate duplicate mailings to shareholders. Eaton Vance, or your financial advisor, may household the mailing of your documents indefinitely unless you instruct Eaton Vance, or your financial advisor, otherwise. If you would prefer that your Eaton Vance documents not be householded, please contact Eaton Vance at 1-800-262-1122, or contact your financial advisor. Your instructions that householding not apply to delivery of your Eaton Vance documents will be effective within 30 days of receipt by Eaton Vance or your financial advisor.
Portfolio Holdings. Each Eaton Vance Fund and its underlying Portfolio(s) (if applicable) will file a schedule of portfolio holdings on Form N-Q with the SEC for the first and third quarters of each fiscal year. The Form N-Q will be available on the Eaton Vance website at www.eatonvance.com, by calling Eaton Vance at 1-800-262-1122 or in the EDGAR database on the SEC’s website at www.sec.gov. Form N-Q may also be reviewed and copied at the SEC’s public reference room in Washington, D.C. (call 1-800-732-0330 for information on the operation of the public reference room).
Proxy Voting. From time to time, funds are required to vote proxies related to the securities held by the funds. The Eaton Vance Funds or their underlying Portfolios (if applicable) vote proxies according to a set of policies and procedures approved by the Funds’ and Portfolios’ Boards. You may obtain a description of these policies and procedures and information on how the Funds or Portfolios voted proxies relating to portfolio securities during the most recent 12-month period ended June 30, without charge, upon request, by calling 1-800-262-1122 and by accessing the SEC’s website at www.sec.gov.
This Page Intentionally Left Blank
Investment Adviser and Administrator
Eaton Vance Management
Two International Place
Boston, MA 02110
Principal Underwriter*
Eaton Vance Distributors, Inc.
Two International Place
Boston, MA 02110
(617) 482-8260
Custodian
State Street Bank and Trust Company
200 Clarendon Street
Boston, MA 02116
Transfer Agent
BNY Mellon Investment Servicing (US) Inc.
Attn: Eaton Vance Funds
P.O. Box 9653
Providence, RI 02940-9653
(800) 262-1122
Independent Registered Public Accounting Firm
Deloitte & Touche LLP
200 Berkeley Street
Boston, MA 02116-5022
Fund Offices
Two International Place
Boston, MA 02110
| * | FINRA BrokerCheck. Investors may check the background of their Investment Professional by contacting the Financial Industry Regulatory Authority (FINRA). FINRA BrokerCheck is a free tool to help investors check the professional background of current and former FINRA-registered securities firms and brokers. FINRA BrokerCheck is available by calling 1-800-289-9999 and at www.FINRA.org. The FINRA BrokerCheck brochure describing this program is available to investors at www.FINRA.org. |
Item 2. Code of Ethics
Not required in this filing.
Item 3. Audit Committee Financial Expert
The registrant’s Board has designated William H. Park, an independent trustee, as its audit committee financial expert. Mr. Park is a certified public accountant who is a consultant and private investor. Previously, he served as the Chief Financial Officer of Aveon Group, L.P. (an investment management firm), as the Vice Chairman of Commercial Industrial Finance Corp. (specialty finance company), as President and Chief Executive Officer of Prizm Capital Management, LLC (investment management firm), as Executive Vice President and Chief Financial Officer of United Asset Management Corporation (an institutional investment management firm) and as a Senior Manager at Price Waterhouse (now PricewaterhouseCoopers) (an independent registered public accounting firm).
Item 4. Principal Accountant Fees and Services
(a)-(d)
Eaton Vance Institutional Emerging Markets Local Debt Fund (the “Fund”) is the only series of Eaton Vance Series Fund, Inc. (the “Corporation”), a Maryland corporation. The Corporation is registered under the Investment Company Act of 1940 as an open-end management investment company. This Form N-CSR relates to the Fund’s annual report.
The following table presents the aggregate fees billed to the Fund for the Fund’s fiscal year ended July 31, 2013 (initial fiscal period from commencement of operations on February 4, 2013 to July 31, 2013) by the Fund’s principal accountant, Deloitte & Touche LLP (“D&T”), for professional services rendered for the audit of the Fund’s annual financial statements and fees billed for other services rendered by D&T during such period.
Eaton Vance Institutional Emerging Markets Local Debt Fund*
| | | | |
Fiscal Period Ended | | 7/31/13 | |
Audit Fees | | $ | 64,870 | |
Audit-Related Fees(1) | | $ | 0 | |
Tax Fees(2) | | $ | 15,310 | |
All Other Fees(3) | | $ | 0 | |
| | | | |
Total | | $ | 80,180 | |
| | | | |
| * | Fund commenced operations on February 4, 2013. |
| (1) | Audit-related fees consist of the aggregate fees billed for assurance and related services that are reasonably related to the performance of the audit of the registrant’s financial statements and are not reported under the category of audit fees. |
| (2) | Tax fees consist of the aggregate fees billed for professional services rendered by the principal accountant relating to tax compliance, tax advice, and tax planning and specifically include fees for tax return preparation and other related tax compliance/planning matters. |
| (3) | All other fees consist of the aggregate fees billed for products and services provided by the principal accountant other than audit, audit-related, and tax services. |
(e)(1) The registrant’s audit committee has adopted policies and procedures relating to the pre-approval of services provided by the registrant’s principal accountant (the “Pre-Approval Policies”). The Pre-Approval Policies establish a framework intended to assist the audit committee in the proper discharge of its pre-approval responsibilities. As a general matter, the Pre-Approval Policies (i) specify certain types of audit, audit-related, tax, and other services determined to be pre-approved by the audit committee; and (ii) delineate specific procedures governing the mechanics of the pre-approval process, including the approval and monitoring of audit and non-audit service fees. Unless a service is specifically pre-approved under the Pre-Approval Policies, it must be separately pre-approved by the audit committee.
The Pre-Approval Policies and the types of audit and non-audit services pre-approved therein must be reviewed and ratified by the registrant’s audit committee at least annually. The registrant’s audit committee maintains full responsibility for the appointment, compensation, and oversight of the work of the registrant’s principal accountant.
(e)(2) No services described in paragraphs (b)-(d) above were approved by the registrant’s audit committee pursuant to the “de minimis exception” set forth in Rule 2-01(c)(7)(i)(C) of Regulation S-X.
(f) Not applicable.
(g) The following table presents (i) the aggregate non-audit fees (i.e., fees for audit-related, tax, and other services) billed by D&T for the Fund’s initial fiscal year ended July 31, 2013; and (ii) the aggregate non-audit fees (i.e., fees for audit-related, tax, and other services) billed to the Eaton Vance organization by D&T for the Series.
| | | | |
Fiscal Year Ended | | 7/31/13 | |
Registrant | | $ | 15,310 | |
Eaton Vance(1) | | $ | 276,151 | |
| (1) | The investment adviser to the Fund, as well as any of its affiliates that provide ongoing services to the Fund, are subsidiaries of Eaton Vance Corp. |
(h) The registrant’s audit committee has considered whether the provision by the registrant’s principal accountant of non-audit services to the registrant’s investment adviser and any entity controlling, controlled by, or under common control with the adviser that provides ongoing services to the registrant that were not pre-approved pursuant to Rule 2-01(c)(7)(ii) of Regulation S-X is compatible with maintaining the principal accountant’s independence.
Item 5. Audit Committee of Listed Registrants
Not required in this filing.
Item 6. Schedule of Investments
Please see schedule of investments contained in the Report to Stockholders included under Item 1 of this Form N-CSR.
Item 7. Disclosure of Proxy Voting Policies and Procedures for Closed-End Management Investment Companies
Not required in this filing.
Item 8. Portfolio Managers of Closed-End Management Investment Companies
Not required in this filing.
Item 9. Purchases of Equity Securities by Closed-End Management Investment Company and Affiliated Purchasers
Not required in this filing.
Item 10. Submission of Matters to a Vote of Security Holders
No Material Changes.
Item 11. Controls and Procedures
(a) It is the conclusion of the registrant’s principal executive officer and principal financial officer that the effectiveness of the registrant’s current disclosure controls and procedures (such disclosure controls and procedures having been evaluated within 90 days of the date of this filing) provide reasonable assurance that the information required to be disclosed by the registrant has been recorded, processed, summarized and reported within the time period specified in the Commission’s rules and forms and that the information required to be disclosed by the registrant has been accumulated and communicated to the registrant’s principal executive officer and principal financial officer in order to allow timely decisions regarding required disclosure.
(b) There have been no changes in the registrant’s internal controls over financial reporting during the second fiscal quarter of the period covered by this report that has materially affected, or is reasonably likely to materially affect, the registrant’s internal control over financial reporting.
Item 12. Exhibits
| | |
| (a)(1) | | Registrant’s Code of Ethics – Not applicable (please see Item 2). |
| (a)(2)(i) | | Treasurer’s Section 302 certification. |
| (a)(2)(ii) | | President’s Section 302 certification. |
| (b) | | Combined Section 906 certification. |
Signatures
Pursuant to the requirements of the Securities Exchange Act of 1934 and the Investment Company Act of 1940, the registrant has duly caused this report to be signed on its behalf by the undersigned, thereunto duly authorized.
| | |
| Eaton Vance Series Fund, Inc. |
| |
| By: | | /s/ Payson F. Swaffield |
| | Payson F. Swaffield |
| | President |
| |
| Date: | | September 9, 2013 |
Pursuant to the requirements of the Securities Exchange Act of 1934 and the Investment Company Act of 1940, this report has been signed below by the following persons on behalf of the registrant and in the capacities and on the dates indicated.
| | |
| By: | | /s/ James F. Kirchner |
| | James F. Kirchner |
| | Treasurer |
| |
| Date: | | September 9, 2013 |
| |
| By: | | /s/ Payson F. Swaffield |
| | Payson F. Swaffield |
| | President |
| |
| Date: | | September 9, 2013 |