UNITED STATES
SECURITIES AND EXCHANGE COMMISSION
Washington, D.C. 20549
Form N-CSR
CERTIFIED SHAREHOLDER REPORT OF REGISTERED
MANAGEMENT INVESTMENT COMPANIES
Investment Company Act File Number: 811-22714
Eaton Vance Series Fund, Inc.
(Exact Name of Registrant as Specified in Charter)
Two International Place, Boston, Massachusetts 02110
(Address of Principal Executive Offices)
Maureen A. Gemma
Two International Place, Boston, Massachusetts 02110
(Name and Address of Agent for Services)
(617) 482-8260
(Registrant’s Telephone Number)
July 31
Date of Fiscal Year End
July 31, 2015
Date of Reporting Period
Item 1. Reports to Stockholders

Eaton Vance
Emerging Markets Debt Opportunities Fund
Annual Report
July 31, 2015

Commodity Futures Trading Commission Registration. Effective December 31, 2012, the Commodity Futures Trading Commission (“CFTC”) adopted certain regulatory changes that subject registered investment companies and advisers to regulation by the CFTC if a fund invests more than a prescribed level of its assets in certain CFTC-regulated instruments (including futures, certain options and swap agreements) or markets itself as providing investment exposure to such instruments. The Fund is considered to be a commodity pool operator under CFTC regulations. The Fund’s adviser is registered with the CFTC as a commodity pool operator and a commodity trading advisor. The CFTC has neither reviewed nor approved the Fund’s investment strategies.
Fund shares are not insured by the FDIC and are not deposits or other obligations of, or guaranteed by, any depository institution. Shares are subject to investment risks, including possible loss of principal invested.
This report must be preceded or accompanied by a current summary prospectus or prospectus. Before investing, investors should consider carefully the investment objective, risks, and charges and expenses of a mutual fund. This and other important information is contained in the summary prospectus and prospectus, which can be obtained from a financial advisor. Prospective investors should read the prospectus carefully before investing. For further information, please call 1-800-262-1122.
Annual Report July 31, 2015
Eaton Vance
Emerging Markets Debt Opportunities Fund
Table of Contents
| | | | |
Management’s Discussion of Fund Performance | | | 2 | |
| |
Performance | | | 3 | |
| |
Fund Profile | | | 4 | |
| |
Endnotes and Additional Disclosures | | | 5 | |
| |
Fund Expenses | | | 6 | |
| |
Financial Statements | | | 7 | |
| |
Report of Independent Registered Public Accounting Firm | | | 32 | |
| |
Federal Tax Information | | | 33 | |
| |
Board of Trustees’ Contract Approval | | | 34 | |
| |
Management and Organization | | | 37 | |
| |
Important Notices | | | 40 | |
Eaton Vance
Emerging Markets Debt Opportunities Fund
July 31, 2015
Management’s Discussion of Fund Performance1
Economic and Market Conditions
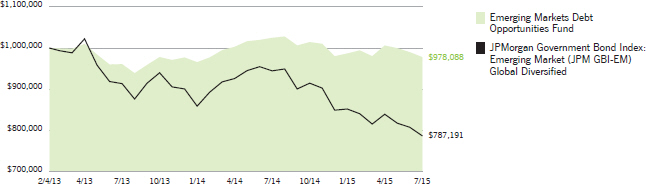
Government bond markets in emerging countries, as measured by the JPMorgan Government Bond Index: Emerging Market (JPM GBI-EM) Global Diversified Index,2 returned -16.68 for the fiscal year ended July 31, 2015. During the period, macroeconomic headwinds pushed local interest rates higher and made currencies weaker in most emerging markets.
One of the strongest headwinds was slowing growth in China, the world’s second-largest economy. The Chinese government took steps to stimulate growth, such as cutting interest rates and bank reserve requirements. Nonetheless, industrial production, retail sales and other key segments of the economy remained sluggish. The slowdown in China contributed to a broad selloff in commodities, which hurt financial markets in emerging countries that export raw materials. Oil was particularly weak, falling more than 50% amid waning global demand, rising U.S. production and the decision of the Organization of the Petroleum Exporting Countries (OPEC) not to lower output.
Expectations surrounding U.S. monetary policy were an additional challenge for emerging markets. After ending its monthly bond purchases in October 2014, the Federal Reserve began contemplating its first interest rate increase since June 2006. The central bank ultimately held short-term rates near zero throughout the fiscal year. However, longer rates climbed higher during the second half of the period as improvement in the U.S. economy led many investors to believe that a rate hike was imminent. Rising bond yields in the United States made yields on emerging market government debt look less attractive and also diminished the appeal of commodities.
Fund Performance
For the fiscal year ended July 31, 2015, Eaton Vance Emerging Markets Debt Opportunities Fund (the Fund) (formerly, Eaton Vance Institutional Emerging Markets Debt Fund) shares at net asset value (NAV) had a total return of -4.55%. The Fund was considerably more resilient than the JPMorgan Government Bond Index: Emerging Market (JPM GBI-EM) Global Diversified Index (the Index) due to its significant underweight exposure to countries in the Index, in favor of exposure to out-of-Index countries. When market conditions are unfavorable as they were this period, countries in the Index tend to underperform out-of-Index
countries because they are more vulnerable to investor outflows.
Being underweight Russia and Turkey helped make Central and Eastern Europe the best-performing region on a relative basis. Russian assets were negatively impacted by plummeting oil prices and new Western economic sanctions related to the crisis in Ukraine. Turkish markets were hurt by ongoing political turmoil and the country’s proximity to Iraq and Syria, which fueled concerns that it might be drawn into the conflict between the United States and the Islamic State of Iraq and Syria (ISIS).
Latin America made the second-largest contribution to relative return, helped by underweights in Brazil and Colombia. The Fund benefited from its relatively low exposure to the Brazilian real, which weakened because of substantial price declines in oil, soybeans and other commodities, coupled with worries about slowing growth and an investigation into corruption at state-run energy company Petrobras. Falling oil prices were the main driver of weakness in Colombia. The generally positive results in Latin America were tempered by an investment in Venezuelan dollar-denominated bonds, an out-of-Index position that was the biggest detractor in the Fund. Venezuela is an oil exporter, and the drop in oil caused the yield on these bonds to widen dramatically versus comparable-maturity U.S. Treasurys.
Asia added almost as much to relative results as Latin America, mainly due to underweight positions in oil producers Malaysia and Indonesia. Out-of-Index exposure to Bangladesh was another plus. The economy of Bangladesh has performed better than many other developing economies, in part because the country has increased its global presence as a low-cost manufacturer.
Sub-Saharan Africa made a positive, albeit more modest, contribution to Fund performance versus the Index. Within the region, the positive effect of an underweight in commodity-rich South Africa offset the negative effect of an out-of-Index position in Zambia, which was affected by declining copper prices and political uncertainty. Out-of-Index exposure to the Middle East North Africa region was a slight drag on relative returns.
See Endnotes and Additional Disclosures in this report.
Past performance is no guarantee of future results. Returns are historical and are calculated by determining the percentage change in net asset value (NAV) or offering price (as applicable) with all distributions reinvested. Investment return and principal value will fluctuate so that shares, when redeemed, may be worth more or less than their original cost. Performance less than one year is cumulative. Performance is for the stated time period only; due to market volatility, the Fund’s current performance may be lower or higher than quoted. Returns are before taxes unless otherwise noted. For performance as of the most recent month-end, please refer to eatonvance.com.
Eaton Vance
Emerging Markets Debt Opportunities Fund
July 31, 2015
Performance2,3
Portfolio Managers John R. Baur, Michael A. Cirami, CFA and Eric A. Stein, CFA
| | | | | | | | | | | | | | | | | | | | |
| % Average Annual Total Returns | | Class
Inception Date | | | Performance
Inception Date | | | One Year | | | Five Years | | | Since
Inception | |
Fund at NAV | | | 02/04/2013 | | | | 02/04/2013 | | | | –4.55 | % | | | — | | | | –0.89 | % |
JPMorgan Government Bond Index: Emerging Market (JPM GBI-EM) Global Diversified | | | — | | | | — | | | | –16.68 | % | | | –0.65 | % | | | –9.18 | % |
| | | | | |
| | | | | | | | | | | | | | | | | | | | |
| % Total Annual Operating Expense Ratios4 | | | | | | | | | | | | | | | |
Gross | | | | | | | | | | | | | | | | | | | 1.86 | % |
Net | | | | | | | | | | | | | | | | | | | 0.85 | |
Growth of $1,000,000
This graph shows the change in value of a hypothetical investment of $1,000,000 in the Emerging Markets Debt Opportunities Fund for the period indicated. For comparison, the same investment is shown in the indicated index.
See Endnotes and Additional Disclosures in this report.
Past performance is no guarantee of future results. Returns are historical and are calculated by determining the percentage change in net asset value (NAV) or offering price (as applicable) with all distributions reinvested. Investment return and principal value will fluctuate so that shares, when redeemed, may be worth more or less than their original cost. Performance less than one year is cumulative. Performance is for the stated time period only; due to market volatility, the Fund’s current performance may be lower or higher than quoted. Returns are before taxes unless otherwise noted. For performance as of the most recent month-end, please refer to eatonvance.com.
Eaton Vance
Emerging Markets Debt Opportunities Fund
July 31, 2015
Fund Profile
Asset Allocation (% of net assets)5
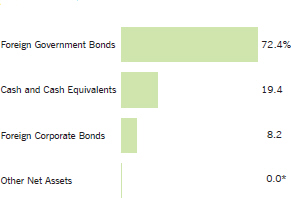
| * | Amount is less than 0.05%. |
Foreign Currency Exposure (% of net assets)6
| | | | | | | | | | |
Mexico | | | 6.8 | % | | Malaysia | | | 1.8 | % |
| | | |
Serbia | | | 6.4 | | | Uruguay | | | 1.7 | |
| | | |
Zambia | | | 5.8 | | | Brazil | | | 1.7 | |
| | | |
India | | | 5.1 | | | Chile | | | 1.5 | |
| | | |
Poland | | | 4.1 | | | Colombia | | | 1.3 | |
| | | |
Philippines | | | 3.3 | | | Albania | | | 1.0 | |
| | | |
Bangladesh | | | 3.1 | | | Other | | | 1.1 | * |
| | | |
Turkey | | | 3.0 | | | Euro | | | –13.9 | |
| | | |
Romania | | | 2.1 | | | Total Long | | | 55.7 | |
| | | |
Dominican Republic | | | 2.0 | | | Total Short | | | –14.0 | |
| | | |
Indonesia | | | 1.9 | | | Total Net | | | 41.7 | |
| | | |
Lebanon | | | 1.9 | | | | | | | |
| * | Includes amounts each less than 1.0% or –1.0%, as applicable. |
See Endnotes and Additional Disclosures in this report.
Eaton Vance
Emerging Markets Debt Opportunities Fund
July 31, 2015
Endnotes and Additional Disclosures
| 1 | The views expressed in this report are those of the portfolio manager(s) and are current only through the date stated at the top of this page. These views are subject to change at any time based upon market or other conditions, and Eaton Vance and the Fund(s) disclaim any responsibility to update such views. These views may not be relied upon as investment advice and, because investment decisions are based on many factors, may not be relied upon as an indication of trading intent on behalf of any Eaton Vance fund. This commentary may contain statements that are not historical facts, referred to as “forward looking statements”. The Fund’s actual future results may differ significantly from those stated in any forward looking statement, depending on factors such as changes in securities or financial markets or general economic conditions, the volume of sales and purchases of Fund shares, the continuation of investment advisory, administrative and service contracts, and other risks discussed from time to time in the Fund’s filings with the Securities and Exchange Commission. |
| 2 | JPMorgan Government Bond Index: Emerging Market (JPM GBI–EM) Global Diversified is an unmanaged index of local-currency bonds with maturities of more than one year issued by emerging markets governments. Unless otherwise stated, index returns do not reflect the effect of any applicable sales charges, commissions, expenses, taxes or leverage, as applicable. It is not possible to invest directly in an index. |
| 3 | Returns are historical and are calculated by determining the percentage change in NAV with all distributions reinvested. The Fund has no sales charge. Performance since inception for an index, if presented, is the performance since the Fund’s or oldest share class’ inception, as applicable. |
| 4 | Source: Fund prospectus. Net expense ratio reflects a contractual expense reimbursement that continues through 11/30/16. Without the reimbursement, if applicable, performance would have been lower. |
| 5 | Other net assets represent other assets less liabilities and includes any investment type that represents less than 1% of net assets. |
| 6 | Currency exposures include all foreign exchange denominated assets, currency derivatives and commodities (including commodity derivatives). Total exposures may exceed 100% due to implicit leverage created by derivatives. |
| | Fund profile subject to change due to active management. |
| | Important Notice to Shareholders |
| | Effective September 3, 2015, the name of the Fund changed to Eaton Vance Emerging Markets Debt Opportunities Fund. Concurrent with the name change, the Fund began offering Class A and Class I shares and the Fund’s existing share class was designated as Class R6 shares. |
Eaton Vance
Emerging Markets Debt Opportunities Fund
July 31, 2015
Fund Expenses
Example: As a Fund shareholder, you incur two types of costs: (1) transaction costs, including sales charges (loads) on purchases and redemption fees (if applicable); and (2) ongoing costs, including management fees; distribution and/or service fees; and other Fund expenses. This Example is intended to help you understand your ongoing costs (in dollars) of Fund investing and to compare these costs with the ongoing costs of investing in other mutual funds. The Example is based on an investment of $1,000 invested at the beginning of the period and held for the entire period (February 1, 2015 – July 31, 2015).
Actual Expenses: The first section of the table below provides information about actual account values and actual expenses. You may use the information in this section, together with the amount you invested, to estimate the expenses that you paid over the period. Simply divide your account value by $1,000 (for example, an $8,600 account value divided by $1,000 = 8.6), then multiply the result by the number in the first section under the heading entitled “Expenses Paid During Period” to estimate the expenses you paid on your account during this period.
Hypothetical Example for Comparison Purposes: The second section of the table below provides information about hypothetical account values and hypothetical expenses based on the actual Fund expense ratio and an assumed rate of return of 5% per year (before expenses), which is not the actual Fund return. The hypothetical account values and expenses may not be used to estimate the actual ending account balance or expenses you paid for the period. You may use this information to compare the ongoing costs of investing in your Fund and other funds. To do so, compare this 5% hypothetical example with the 5% hypothetical examples that appear in the shareholder reports of the other funds.
Please note that the expenses shown in the table are meant to highlight your ongoing costs only and do not reflect any transactional costs, such as sales charges (loads) or redemption fees (if applicable). Therefore, the second section of the table is useful in comparing ongoing costs only, and will not help you determine the relative total costs of owning different funds. In addition, if these transactional costs were included, your costs would be higher.
| | | | | | | | | | | | | | | | |
| | | Beginning Account Value (2/1/15) | | | Ending Account Value (7/31/15) | | | Expenses Paid During Period* (2/1/15 – 7/31/15) | | | Annualized Expense Ratio | |
| | | | |
| | | | | | | | | | | | | | | | |
Actual | | | | | | | | | | | | | | | | |
| | $ | 1,000.00 | | | $ | 991.20 | | | $ | 4.20 | ** | | | 0.85 | % |
| | | | | | | | | | | | | |
| | | | |
| | | | | | | | | | | | | | | | |
Hypothetical | | | | | | | | | | | | | | | | |
(5% return per year before expenses) | | | | | | | | | | | | | | | | |
| | $ | 1,000.00 | | | $ | 1,020.60 | | | $ | 4.26 | ** | | | 0.85 | % |
| * | Expenses are equal to the Fund’s annualized expense ratio, multiplied by the average account value over the period, multiplied by 181/365 (to reflect the one-half year period). The Example assumes that the $1,000 was invested at the net asset value per share determined at the close of business on January 31, 2015. |
| ** | Absent an allocation of certain expenses to an affiliate, expenses would be higher. |
Eaton Vance
Emerging Markets Debt Opportunities Fund
July 31, 2015
Portfolio of Investments
| | | | | | | | | | |
| Foreign Government Bonds — 66.1% | |
| | | |
| | | | | | | | | | |
| Security | | | | Principal Amount (000’s omitted) | | | Value | |
| | | | | | | | | | |
|
Albania — 1.0% | |
Albania Government Bond, 8.90%, 7/24/25 | | ALL | | | 52,000 | | | $ | 411,806 | |
Republic of Albania, 8.93%, 4/23/25 | | ALL | | | 10,200 | | | | 82,094 | |
| | | | | | | | | | | |
Total Albania | | | | | | | | $ | 493,900 | |
| | | | | | | | | | | |
|
Angola — 0.5% | |
Republic of Angola Via Northern Lights III BV, 7.00%, 8/16/19(1) | | USD | | | 250 | | | $ | 249,300 | |
| | | | | | | | | | | |
Total Angola | | | | | | | | $ | 249,300 | |
| | | | | | | | | | | |
|
Argentina — 3.9% | |
Republic of Argentina, 7.00%, 10/3/15 | | USD | | | 947 | | | $ | 941,209 | |
Republic of Argentina,
8.28%, 12/31/33(2)(3) | | USD | | | 1,141 | | | | 947,681 | |
| | | | | | | | | | | |
Total Argentina | | | | | | | | $ | 1,888,890 | |
| | | | | | | | | | | |
|
Armenia — 0.4% | |
Republic of Armenia, 7.15%, 3/26/25(1) | | USD | | | 200 | | | $ | 198,740 | |
| | | | | | | | | | | |
Total Armenia | | | | | | | | $ | 198,740 | |
| | | | | | | | | | | |
|
Bangladesh — 3.1% | |
Bangladesh Treasury Bond, 11.45%, 6/6/17 | | BDT | | | 18,300 | | | $ | 250,350 | |
Bangladesh Treasury Bond, 11.50%, 8/8/17 | | BDT | | | 44,100 | | | | 606,025 | |
Bangladesh Treasury Bond, 11.52%, 12/5/17 | | BDT | | | 34,600 | | | | 478,937 | |
Bangladesh Treasury Bond, 11.62%, 1/2/18 | | BDT | | | 10,000 | | | | 138,905 | |
| | | | | | | | | | | |
Total Bangladesh | | | | | | | | $ | 1,474,217 | |
| | | | | | | | | | | |
|
Barbados — 2.1% | |
Barbados Government International Bond, 6.625%, 12/5/35(1) | | USD | | | 617 | | | $ | 569,182 | |
Barbados Government International Bond, 6.625%, 12/5/35(4) | | USD | | | 493 | | | | 454,793 | |
| | | | | | | | | | | |
Total Barbados | | | | | | | | $ | 1,023,975 | |
| | | | | | | | | | | |
|
Bosnia and Herzegovina — 0.8% | |
Republic of Srpska, 1.50%, 10/30/23 | | BAM | | | 437 | | | $ | 198,293 | |
Republic of Srpska, 1.50%, 6/9/25 | | BAM | | | 98 | | | | 41,446 | |
Republic of Srpska, 1.50%, 9/25/26 | | BAM | | | 421 | | | | 167,329 | |
| | | | | | | | | | | |
Total Bosnia and Herzegovina | | | | | | | | $ | 407,068 | |
| | | | | | | | | | | |
|
Brazil — 0.5% | |
Letra Tesouro do Nacional Bill, 0.00%, 1/1/17 | | BRL | | | 1,000 | | | $ | 244,314 | |
| | | | | | | | | | | |
Total Brazil | | | | | | | | $ | 244,314 | |
| | | | | | | | | | | |
| | | | | | | | | | |
| Security | | | | Principal Amount (000’s omitted) | | | Value | |
| | | | | | | | | | |
|
Colombia — 2.2% | |
Republic of Colombia, 5.00%, 6/15/45 | | USD | | | 648 | | | $ | 604,260 | |
Titulos De Tesoreria B, 11.00%, 7/24/20 | | COP | | | 1,046,200 | | | | 438,099 | |
| | | | | | | | | | | |
Total Colombia | | | | | | | | $ | 1,042,359 | |
| | | | | | | | | | | |
|
Dominican Republic — 2.7% | |
Dominican Republic Central Bank Note, 12.00%, 4/5/19(4) | | DOP | | | 610 | | | $ | 14,306 | |
Dominican Republic International Bond, 9.04%, 1/23/18(1) | | USD | | | 306 | | | | 331,525 | |
Dominican Republic International Bond, 11.50%, 5/10/24(4) | | DOP | | | 6,000 | | | | 142,017 | |
Dominican Republic International Bond, 14.00%, 4/30/21(4) | | DOP | | | 2,300 | | | | 58,709 | |
Dominican Republic International Bond, 14.50%, 2/10/23(1) | | DOP | | | 1,100 | | | | 29,214 | |
Dominican Republic International Bond, 14.50%, 2/10/23(4) | | DOP | | | 100 | | | | 2,656 | |
Dominican Republic International Bond, 15.95%, 6/4/21(4) | | DOP | | | 3,500 | | | | 97,666 | |
Dominican Republic International Bond, 18.50%, 2/4/28(1) | | DOP | | | 19,700 | | | | 628,870 | |
Dominican Republic International Bond, 18.50%, 2/4/28(4) | | DOP | | | 100 | | | | 3,192 | |
| | | | | | | | | | | |
Total Dominican Republic | | | | | | | | $ | 1,308,155 | |
| | | | | | | | | | | |
|
Ecuador — 7.6% | |
Republic of Ecuador, 7.95%, 6/20/24(4) | | USD | | | 1,020 | | | $ | 859,350 | |
Republic of Ecuador,
9.375%, 12/15/15(1) | | USD | | | 1,508 | | | | 1,500,460 | |
Republic of Ecuador,
10.50%, 3/24/20(4) | | USD | | | 1,335 | | | | 1,278,316 | |
| | | | | | | | | | | |
Total Ecuador | | | | | | | | $ | 3,638,126 | |
| | | | | | | | | | | |
|
Fiji — 1.0% | |
Republic of Fiji, 9.00%, 3/15/16 | | USD | | | 465 | | | $ | 471,529 | |
| | | | | | | | | | | |
Total Fiji | | | | | | | | $ | 471,529 | |
| | | | | | | | | | | |
|
Indonesia — 1.4% | |
Indonesia Government Bond, 8.375%, 3/15/24 | | IDR | | | 2,516,000 | | | $ | 183,899 | |
Indonesia Government International Bond, 3.375%, 7/30/25(4) | | EUR | | | 456 | | | | 496,666 | |
| | | | | | | | | | | |
Total Indonesia | | | | | | | | $ | 680,565 | |
| | | | | | | | | | | |
|
Iraq — 1.9% | |
Republic of Iraq, 5.80%, 1/15/28(1) | | USD | | | 1,157 | | | $ | 924,096 | |
| | | | | | | | | | | |
Total Iraq | | | | | | | | $ | 924,096 | |
| | | | | | | | | | | |
| | | | |
| | 7 | | See Notes to Financial Statements. |
Eaton Vance
Emerging Markets Debt Opportunities Fund
July 31, 2015
Portfolio of Investments — continued
| | | | | | | | | | |
| Security | | | | Principal Amount (000’s omitted) | | | Value | |
| | | | | | | | | | |
|
Ivory Coast — 1.0% | |
Ivory Coast, 6.375%, 3/3/28(4) | | USD | | | 490 | | | $ | 466,725 | |
| | | | | | | | | | | |
Total Ivory Coast | | | | | | | | $ | 466,725 | |
| | | | | | | | | | | |
|
Jamaica — 0.5% | |
Jamaica Government International Bond, 7.875%, 7/28/45 | | USD | | | 245 | | | $ | 243,775 | |
| | | | | | | | | | | |
Total Jamaica | | | | | | | | $ | 243,775 | |
| | | | | | | | | | | |
|
Kazakhstan — 1.2% | |
Kazakhstan Government International Bond, 5.125%, 7/21/25(4) | | USD | | | 560 | | | $ | 555,380 | |
| | | | | | | | | | | |
Total Kazakhstan | | | | | | | | $ | 555,380 | |
| | | | | | | | | | | |
|
Kenya — 0.6% | |
Kenya Infrastructure Bond, 11.00%, 10/12/26 | | KES | | | 5,900 | | | $ | 50,181 | |
Kenya Treasury Bond, 11.855%, 5/22/17 | | KES | | | 6,450 | | | | 65,069 | |
Republic of Kenya, 6.875%, 6/24/24(1) | | USD | | | 200 | | | | 197,300 | |
| | | | | | | | | | | |
Total Kenya | | | | | | | | $ | 312,550 | |
| | | | | | | | | | | |
|
Malaysia — 1.6% | |
Malaysia Government Bond, 3.314%, 10/31/17 | | MYR | | | 2,953 | | | $ | 773,945 | |
| | | | | | | | | | | |
Total Malaysia | | | | | | | | $ | 773,945 | |
| | | | | | | | | | | |
|
Mexico — 1.3% | |
Mexican Bonos, 10.00%, 12/5/24 | | MXN | | | 7,826 | | | $ | 623,726 | |
| | | | | | | | | | | |
Total Mexico | | | | | | | | $ | 623,726 | |
| | | | | | | | | | | |
|
Montenegro — 0.9% | |
Montenegro Government International Bond, 3.875%, 3/18/20(4) | | EUR | | | 425 | | | $ | 447,890 | |
| | | | | | | | | | | |
Total Montenegro | | | | | | | | $ | 447,890 | |
| | | | | | | | | | | |
|
Nigeria — 1.0% | |
Republic of Nigeria, 5.125%, 7/12/18(1) | | USD | | | 491 | | | $ | 489,532 | |
| | | | | | | | | | | |
Total Nigeria | | | | | | | | $ | 489,532 | |
| | | | | | | | | | | |
|
Pakistan — 0.4% | |
Islamic Republic of Pakistan, 7.25%, 4/15/19(4) | | USD | | | 200 | | | $ | 209,250 | |
| | | | | | | | | | | |
Total Pakistan | | | | | | | | $ | 209,250 | |
| | | | | | | | | | | |
| | | | | | | | | | |
| Security | | | | Principal Amount (000’s omitted) | | | Value | |
| | | | | | | | | | |
|
Paraguay — 1.0% | |
Republic of Paraguay,
6.10%, 8/11/44(4) | | USD | | | 230 | | | $ | 239,775 | |
Republic of Paraguay,
6.10%, 8/11/44(1) | | USD | | | 210 | | | | 218,925 | |
| | | | | | | | | | | |
Total Paraguay | | | | | | | | $ | 458,700 | |
| | | | | | | | | | | |
|
Philippines — 4.0% | |
Republic of the Philippines, 6.25%, 1/14/36 | | PHP | | | 77,000 | | | $ | 1,920,749 | |
| | | | | | | | | | | |
Total Philippines | | | | | | | | $ | 1,920,749 | |
| | | | | | | | | | | |
|
Poland — 3.5% | |
Poland Government Bond, 3.75%, 4/25/18 | | PLN | | | 1,540 | | | $ | 427,735 | |
Poland Government Bond, 5.50%, 10/25/19 | | PLN | | | 4,150 | | | | 1,242,766 | |
| | | | | | | | | | | |
Total Poland | | | | | | | | $ | 1,670,501 | |
| | | | | | | | | | | |
|
Romania — 1.5% | |
Romania Government Bond, 5.95%, 6/11/21 | | RON | | | 2,460 | | | $ | 702,809 | |
| | | | | | | | | | | |
Total Romania | | | | | | | | $ | 702,809 | |
| | | | | | | | | | | |
|
Serbia — 9.6% | |
Republic of Serbia, 5.25%, 11/21/17(1) | | USD | | | 223 | | | $ | 232,132 | |
Serbia Treasury Bond, 10.00%, 2/21/16 | | RSD | | | 38,740 | | | | 363,184 | |
Serbia Treasury Bond, 10.00%, 5/22/16 | | RSD | | | 29,400 | | | | 278,006 | |
Serbia Treasury Bond, 10.00%, 6/12/16 | | RSD | | | 13,780 | | | | 130,522 | |
Serbia Treasury Bond, 10.00%, 3/2/18 | | RSD | | | 15,570 | | | | 150,909 | |
Serbia Treasury Bond, 10.00%, 3/20/21 | | RSD | | | 184,850 | | | | 1,776,649 | |
Serbia Treasury Bond, 10.00%, 2/5/22 | | RSD | | | 178,340 | | | | 1,683,317 | |
| | | | | | | | | | | |
Total Serbia | | | | | | | | $ | 4,614,719 | |
| | | | | | | | | | | |
|
Sri Lanka — 2.0% | |
Republic of Sri Lanka,
6.00%, 1/14/19(1) | | USD | | | 460 | | | $ | 473,800 | |
Republic of Sri Lanka,
6.25%, 7/27/21(1) | | USD | | | 500 | | | | 511,875 | |
| | | | | | | | | | | |
Total Sri Lanka | | | | | | | | $ | 985,675 | |
| | | | | | | | | | | |
|
Uruguay — 1.4% | |
Monetary Regulation Bill, 0.00%, 4/21/16 | | UYU | | | 8,471 | | | $ | 271,251 | |
Republic of Uruguay, 5.00%, 9/14/18(5) | | UYU | | | 2,121 | | | | 74,839 | |
Uruguay Notas Del Tesoro, 2.25%, 8/23/17(5) | | UYU | | | 9,820 | | | | 322,529 | |
| | | | | | | | | | | |
Total Uruguay | | | | | | | | $ | 668,619 | |
| | | | | | | | | | | |
|
Venezuela — 3.2% | |
Bolivarian Republic of Venezuela, 5.75%, 2/26/16(1) | | USD | | | 120 | | | $ | 97,350 | |
Bolivarian Republic of Venezuela, 9.25%, 9/15/27(2) | | USD | | | 1,315 | | | | 555,587 | |
Bolivarian Republic of Venezuela, 9.25%, 5/7/28(1) | | USD | | | 972 | | | | 363,416 | |
| | | | |
| | 8 | | See Notes to Financial Statements. |
Eaton Vance
Emerging Markets Debt Opportunities Fund
July 31, 2015
Portfolio of Investments — continued
| | | | | | | | | | |
| Security | | | | Principal Amount (000’s omitted) | | | Value | |
| | | | | | | | | | |
|
Venezuela (continued) | |
Bolivarian Republic of Venezuela, 11.95%, 8/5/31(1)(2) | | USD | | | 1,297 | | | $ | 544,782 | |
| | | | | | | | | | | |
Total Venezuela | | | | | | | | $ | 1,561,135 | |
| | | | | | | | | | | |
|
Zambia — 2.3% | |
Republic of Zambia,
8.50%, 4/14/24(4) | | USD | | | 220 | | | $ | 210,650 | |
Republic of Zambia,
8.97%, 7/30/27(4) | | USD | | | 265 | | | | 254,400 | |
Zambia Government Bond, 11.00%, 9/2/19 | | ZMW | | | 6,600 | | | | 620,420 | |
| | | | | | | | | | | |
Total Zambia | | | | | | | | $ | 1,085,470 | |
| | | | | | | | | | | |
| |
Total Foreign Government Bonds
(identified cost $34,138,665) | | | $ | 31,836,384 | |
| | | | | | | | | | | |
|
| Foreign Corporate Bonds — 8.2% | |
| | | |
| | | | | | | | | | |
| Security | | | | Principal Amount (000’s omitted) | | | Value | |
|
Azerbaijan — 0.4% | |
International Bank of Azerbaijan OJSC Via Rubrika Finance Co., Ltd., 6.17%, 5/10/17(1)(6) | | USD | | | 200 | | | $ | 195,750 | |
| | | | | | | | | | | |
Total Azerbaijan | | | | | | | | $ | 195,750 | |
| | | | | | | | | | | |
|
Brazil — 1.0% | |
Petrobras Global Finance BV, 2.00%, 5/20/16 | | USD | | | 120 | | | $ | 118,646 | |
Petrobras Global Finance BV, 6.25%, 3/17/24 | | USD | | | 396 | | | | 371,607 | |
| | | | | | | | | | | |
Total Brazil | | | | | | | | $ | 490,253 | |
| | | | | | | | | | | |
|
Colombia — 0.1% | |
Emgesa SA ESP, 8.75%, 1/25/21(1) | | COP | | | 86,000 | | | $ | 31,363 | |
| | | | | | | | | | | |
Total Colombia | | | | | | | | $ | 31,363 | |
| | | | | | | | | | | |
|
Georgia — 1.6% | |
Bank of Georgia JSC,
7.75%, 7/5/17(1) | | USD | | | 721 | | | $ | 751,700 | |
| | | | | | | | | | | |
Total Georgia | | | | | | | | $ | 751,700 | |
| | | | | | | | | | | |
|
Mexico — 0.2% | |
Petroleos Mexicanos, 7.19%, 9/12/24(4) | | MXN | | | 1,420 | | | $ | 86,765 | |
Petroleos Mexicanos, 7.65%, 11/24/21 | | MXN | | | 420 | | | | 26,963 | |
| | | | | | | | | | | |
Total Mexico | | | | | | | | $ | 113,728 | |
| | | | | | | | | | | |
| | | | | | | | | | |
| Security | | | | Principal Amount (000’s omitted) | | | Value | |
| | | | | | | | | | |
|
Russia — 3.0% | |
Gazprom OAO Via Gaz Capital SA, 4.30%, 11/12/15(4) | | USD | | | 500 | | | $ | 503,375 | |
Gazprom OAO Via Gaz Capital SA, 5.136%, 3/22/17(1) | | EUR | | | 832 | | | | 940,280 | |
| | | | | | | | | | | |
Total Russia | | | | | | | | $ | 1,443,655 | |
| | | | | | | | | | | |
|
South Korea — 0.1% | |
Export-Import Bank of Korea, 0.50%, 1/25/17 | | TRY | | | 220 | | | $ | 69,326 | |
| | | | | | | | | | | |
Total South Korea | | | | | | | | $ | 69,326 | |
| | | | | | | | | | | |
|
Sri Lanka — 1.0% | |
Bank of Ceylon, 6.875%, 5/3/17(1) | | USD | | | 231 | | | $ | 240,529 | |
National Savings Bank, 8.875%, 9/18/18(1) | | USD | | | 223 | | | | 241,397 | |
| | | | | | | | | | | |
Total Sri Lanka | | | | | | | | $ | 481,926 | |
| | | | | | | | | | | |
|
Supranational — 0.8% | |
Inter-American Development Bank, 7.35%, 9/12/18 | | IDR | | | 2,750,000 | | | $ | 194,824 | |
International Bank for Reconstruction & Development, 3.40%, 4/15/17(5) | | UYU | | | 4,945 | | | | 170,928 | |
International Finance Corp., 4.45%, 2/26/16 | | RUB | | | 1,400 | | | | 21,776 | |
| | | | | | | | | | | |
Total Supranational | | | | | | | | $ | 387,528 | |
| | | | | | | | | | | |
| |
Total Foreign Corporate Bonds
(identified cost $4,074,321) | | | $ | 3,965,229 | |
| | | | | | | | | | | |
|
| Sovereign Loans — 0.4% | |
| | | |
| | | | | | | | | | |
| Borrower | | | | Principal Amount (000’s omitted) | | | Value | |
|
Ethiopia — 0.4% | |
Ethiopian Railways Corporation (Federal Democratic Republic of Ethiopia guaranteed), 3.45%, Maturing
August 1, 2021(7)(8)(9)(10) | | | | $ | 200 | | | $ | 197,859 | |
| | | | | | | | | | | |
Total Ethiopia | | | | | | | | $ | 197,859 | |
| | | | | | | | | | | |
| |
Total Sovereign Loans
(identified cost $182,098) | | | $ | 197,859 | |
| | | | | | | | | | | |
| | | | |
| | 9 | | See Notes to Financial Statements. |
Eaton Vance
Emerging Markets Debt Opportunities Fund
July 31, 2015
Portfolio of Investments — continued
| | | | | | | | | | |
| Short-Term Investments — 23.8% | |
|
| Foreign Government Securities — 6.3% | |
| | | |
| | | | | | | | | | |
| Security | | | | Principal Amount (000’s omitted) | | | Value | |
| | | | | | | | | | |
|
Brazil — 1.6% | |
Brazil Letras do Tesouro Nacional, 0.00%, 4/1/16 | | BRL | | | 2,956 | | | $ | 791,054 | |
| | | | | | | | | | | |
Total Brazil | | | | | | | | $ | 791,054 | |
| | | | | | | | | | | |
|
Lebanon — 1.9% | |
Lebanon Treasury Bill, 0.00%, 8/20/15 | | LBP | | | 653,640 | | | $ | 432,854 | |
Lebanon Treasury Bill, 0.00%, 12/10/15 | | LBP | | | 268,900 | | | | 175,636 | |
Lebanon Treasury Bill, 0.00%, 1/7/16 | | LBP | | | 440,350 | | | | 286,584 | |
| | | | | | | | | | | |
Total Lebanon | | | | | | | | $ | 895,074 | |
| | | | | | | | | | | |
|
Macedonia — 1.5% | |
Republic of Macedonia, 4.625%, 12/8/15 | | EUR | | | 643 | | | $ | 707,093 | |
| | | | | | | | | | | |
Total Macedonia | | | | | | | | $ | 707,093 | |
| | | | | | | | | | | |
|
Mexico — 1.3% | |
Mexico Cetes, 0.00%, 9/17/15 | | MXN | | | 10,100 | | | $ | 624,507 | |
| | | | | | | | | | | |
Total Mexico | | | | | | | | $ | 624,507 | |
| | | | | | | | | | | |
| |
Total Foreign Government Securities
(identified cost $3,125,188) | | | $ | 3,017,728 | |
| | | | | | | | | | | |
|
| U.S. Treasury Obligations — 4.2% | |
| | | |
| | | | | | | | | | |
| Security | | | | Principal Amount (000’s omitted) | | | Value | |
U.S. Treasury Bill, 0.00%, 10/15/15(11) | | | | $ | 2,000 | | | $ | 1,999,858 | |
| | | | | | | | | | | |
| |
Total U.S. Treasury Obligations
(identified cost $1,999,958) | | | $ | 1,999,858 | |
| | | | | | | | | | | |
| | | | | | | | | | |
| Other — 13.3% | |
| | | |
| | | | | | | | | | |
| Description | | | | Interest
(000’s omitted) | | | Value | |
| | | | | | | | | | |
Eaton Vance Cash Reserves Fund, LLC, 0.20%(12) | | | | $ | 6,410 | | | $ | 6,409,739 | |
| | | | | | | | | | | |
| |
Total Other
(identified cost $6,409,739) | | | $ | 6,409,739 | |
| | | | | | | | | | | |
| |
Total Short-Term Investments
(identified cost $11,534,885) | | | $ | 11,427,325 | |
| | | | | | | | | | | |
| |
Total Investments — 98.5%
(identified cost $49,929,969) | | | $ | 47,426,797 | |
| | | | | | | | | | | |
| |
Less Unfunded Loan Commitments — (0.1)% | | | $ | (33,444 | ) |
| | | | | | | | | | | |
| |
Net Investments — 98.4%
(identified cost $49,896,525) | | | $ | 47,393,353 | |
| | | | | | | | | | | |
| |
Other Assets, Less Liabilities — 1.6% | | | $ | 747,167 | |
| | | | | | | | | | | |
| |
Net Assets — 100.0% | | | $ | 48,140,520 | |
| | | | | | | | | | | |
The percentage shown for each investment category in the Portfolio of Investments is based on net assets.
| | | | |
| ALL | | – | | Albanian Lek |
| BAM | | – | | Bosnia - Herzegovina Convertible Mark |
| BDT | | – | | Bangladesh Taka |
| BRL | | – | | Brazilian Real |
| COP | | – | | Colombian Peso |
| DOP | | – | | Dominican Peso |
| EUR | | – | | Euro |
| IDR | | – | | Indonesian Rupiah |
| KES | | – | | Kenyan Shilling |
| LBP | | – | | Lebanese Pound |
| MXN | | – | | Mexican Peso |
| MYR | | – | | Malaysian Ringgit |
| PHP | | – | | Philippine Peso |
| PLN | | – | | Polish Zloty |
| RON | | – | | Romanian Leu |
| RSD | | – | | Serbian Dinar |
| RUB | | – | | Russian Ruble |
| TRY | | – | | New Turkish Lira |
| USD | | – | | United States Dollar |
| UYU | | – | | Uruguayan Peso |
| ZMW | | – | | Zambian Kwacha |
| | (1) | Security exempt from registration under Regulation S of the Securities Act of 1933, which exempts from registration securities offered and sold outside the United States. Security may not be offered or sold in the United States except pursuant to an exemption from, or in a transaction not subject to, the registration requirements of the Securities Act of 1933. |
| | | | |
| | 10 | | See Notes to Financial Statements. |
Eaton Vance
Emerging Markets Debt Opportunities Fund
July 31, 2015
Portfolio of Investments — continued
| | At July 31, 2015, the aggregate value of these securities is $9,961,518 or 20.7% of the Fund’s net assets. |
| | (2) | Security (or a portion thereof) has been pledged for the benefit of the counterparty for reverse repurchase agreements. |
| | (4) | Security exempt from registration pursuant to Rule 144A under the Securities Act of 1933. These securities may be sold in certain transactions (normally to qualified institutional buyers) and remain exempt from registration. At July 31, 2015, the aggregate value of these securities is $6,381,881 or 13.3% of the Fund’s net assets. |
| | (5) | Inflation-linked security whose principal is adjusted for inflation based on changes in a designated inflation index or inflation rate for the applicable country. Interest is calculated based on the inflation-adjusted principal. |
| | (6) | Variable rate security. The stated interest rate represents the rate in effect at July 31, 2015. |
| | (7) | Variable interest rate that updates semiannually based on changes to the London Interbank Offered Rate (LIBOR). The stated interest rate represents a weighted average rate at July 31, 2015. |
| | (8) | For fair value measurement disclosure purposes, security is categorized as Level 3 (see Note 10). |
| | (9) | Loan is subject to scheduled mandatory prepayments. Maturity date shown reflects the final maturity date. |
| (10) | Unfunded or partially unfunded loan commitments. See Note 1G for description. |
| (11) | Security (or a portion thereof) has been pledged to cover margin requirements on open financial futures contracts. |
| (12) | Affiliated investment company, available to Eaton Vance portfolios and funds, which invests in high quality, U.S. dollar denominated money market instruments. The rate shown is the annualized seven-day yield as of July 31, 2015. |
| | | | |
| | 11 | | See Notes to Financial Statements. |
Eaton Vance
Emerging Markets Debt Opportunities Fund
July 31, 2015
Statement of Assets and Liabilities
| | | | |
| Assets | | July 31, 2015 | |
Unaffiliated investments, at value (identified cost, $43,486,786) | | $ | 40,983,614 | |
Affiliated investment, at value (identified cost, $6,409,739) | | | 6,409,739 | |
Cash | | | 447,839 | |
Restricted cash* | | | 202,853 | |
Foreign currency, at value (identified cost, $266,527) | | | 261,668 | |
Interest receivable | | | 940,548 | |
Interest receivable from affiliated investment | | | 1,268 | |
Receivable for investments sold | | | 1,880 | |
Receivable for open forward foreign currency exchange contracts | | | 268,713 | |
Receivable for open swap contracts | | | 73,659 | |
Receivable for open non-deliverable bond forward contracts | | | 12,841 | |
Tax reclaims receivable | | | 18,225 | |
Receivable from affiliate | | | 22,346 | |
Total assets | | $ | 49,645,193 | |
| |
| Liabilities | | | | |
Payable for reverse repurchase agreements | | $ | 659,589 | |
Payable for variation margin on open financial futures contracts | | | 44,247 | |
Payable for variation margin on open centrally cleared swap contracts | | | 1,029 | |
Payable for open forward foreign currency exchange contracts | | | 493,735 | |
Payable for open swap contracts | | | 161,649 | |
Payable to affiliate: | | | | |
Investment adviser and administration fee | | | 26,786 | |
Accrued foreign capital gains taxes | | | 676 | |
Accrued expenses | | | 116,962 | |
Total liabilities | | $ | 1,504,673 | |
Net Assets | | $ | 48,140,520 | |
| |
| Sources of Net Assets | | | | |
Common shares, $0.001 par value, 1,000,000,000 shares authorized, 5,315,813 shares issued and outstanding | | $ | 5,316 | |
Additional paid-in capital | | | 52,101,063 | |
Accumulated net realized loss | | | (1,303,563 | ) |
Accumulated undistributed net investment income | | | 467,534 | |
Net unrealized depreciation | | | (3,129,830 | ) |
Total | | $ | 48,140,520 | |
| |
| Net Asset Value, Offering Price and Redemption Price Per Share | | | | |
($48,140,520 ÷ 5,315,813 common shares issued and outstanding) | | $ | 9.06 | |
| * | Represents restricted cash on deposit at the broker for open derivative contracts. |
| | | | |
| | 12 | | See Notes to Financial Statements. |
Eaton Vance
Emerging Markets Debt Opportunities Fund
July 31, 2015
Statement of Operations
| | | | |
| Investment Income | | Year Ended July 31, 2015 | |
Interest (net of foreign taxes, $75,099) | | $ | 3,269,683 | |
Interest allocated from affiliated investment | | | 10,046 | |
Expenses allocated from affiliated investment | | | (882 | ) |
Total investment income | | $ | 3,278,847 | |
| |
| Expenses | | | | |
Investment adviser and administration fee | | $ | 319,364 | |
Directors’ fees and expenses | | | 3,010 | |
Custodian fee | | | 145,285 | |
Transfer and dividend disbursing agent fees | | | 855 | |
Legal and accounting services | | | 105,092 | |
Printing and postage | | | 8,385 | |
Registration fees | | | 29,738 | |
Miscellaneous | | | 20,022 | |
Total expenses | | $ | 631,751 | |
Deduct — | | | | |
Allocation of expenses to affiliate | | $ | 213,135 | |
Reduction of custodian fee | | | 21 | |
Total expense reductions | | $ | 213,156 | |
| |
Net expenses | | $ | 418,595 | |
| |
Net investment income | | $ | 2,860,252 | |
| |
| Realized and Unrealized Gain (Loss) | | | | |
Net realized gain (loss) — | | | | |
Investment transactions (net of foreign capital gains taxes of $31,413) | | $ | (2,912,666 | ) |
Investment transactions allocated from affiliated investment | | | 27 | |
Financial futures contracts | | | (93,319 | ) |
Swap contracts | | | (52,655 | ) |
Foreign currency and forward foreign currency exchange contract transactions | | | 969,764 | |
Non-deliverable bond forward contracts | | | (5,595 | ) |
Net realized loss | | $ | (2,094,444 | ) |
Change in unrealized appreciation (depreciation) — | | | | |
Investments (including net increase of $676 in accrued foreign capital gains taxes) | | $ | (2,205,665 | ) |
Financial futures contracts | | | (283,296 | ) |
Swap contracts | | | (278,370 | ) |
Foreign currency and forward foreign currency exchange contracts | | | (348,555 | ) |
Non-deliverable bond forward contracts | | | 12,841 | |
Net change in unrealized appreciation (depreciation) | | $ | (3,103,045 | ) |
| |
Net realized and unrealized loss | | $ | (5,197,489 | ) |
| |
Net decrease in net assets from operations | | $ | (2,337,237 | ) |
| | | | |
| | 13 | | See Notes to Financial Statements. |
Eaton Vance
Emerging Markets Debt Opportunities Fund
July 31, 2015
Statements of Changes in Net Assets
| | | | | | | | |
| | | Year Ended July 31, | |
| Increase (Decrease) in Net Assets | | 2015 | | | 2014 | |
From operations — | | | | | | | | |
Net investment income | | $ | 2,860,252 | | | $ | 1,014,209 | |
Net realized loss from investment transactions, financial futures contracts, swap contracts, foreign currency and forward foreign currency exchange contract transactions, and non-deliverable bond forward contracts | | | (2,094,444 | ) | | | (523,017 | ) |
Net change in unrealized appreciation (depreciation) from investments, financial futures contracts, swap contracts, foreign currency, forward foreign currency exchange contracts and non-deliverable bond forward contracts | | | (3,103,045 | ) | | | 801,485 | |
Net increase (decrease) in net assets from operations | | $ | (2,337,237 | ) | | $ | 1,292,677 | |
Distributions to shareholders — | | | | | | | | |
From net investment income | | $ | (1,845,761 | ) | | $ | (496,035 | ) |
From net realized gain | | | — | | | | (33,069 | ) |
Total distributions to shareholders | | $ | (1,845,761 | ) | | $ | (529,104 | ) |
Transactions in common shares — | | | | | | | | |
Proceeds from sale of shares | | $ | — | | | $ | 50,000,000 | |
Net asset value of shares issued to shareholders in payment of distributions declared | | | 1,845,761 | | | | 529,104 | |
Cost of shares redeemed | | | — | | | | (15,333,371 | ) |
Net increase in net assets from Fund share transactions | | $ | 1,845,761 | | | $ | 35,195,733 | |
| | |
Net increase (decrease) in net assets | | $ | (2,337,237 | ) | | $ | 35,959,306 | |
| | |
| Net Assets | | | | | | | | |
At beginning of year | | $ | 50,477,757 | | | $ | 14,518,451 | |
At end of year | | $ | 48,140,520 | | | $ | 50,477,757 | |
| | |
Accumulated undistributed net investment income
included in net assets | | | | | | | | |
At end of year | | $ | 467,534 | | | $ | 375,824 | |
| | | | |
| | 14 | | See Notes to Financial Statements. |
Eaton Vance
Emerging Markets Debt Opportunities Fund
July 31, 2015
Financial Highlights
| | | | | | | | | | | | |
| | | Year Ended July 31, | | | Period Ended
July 31, 2013(1) | |
| | | 2015 | | | 2014 | | |
Net asset value — Beginning of period | | $ | 9.880 | | | $ | 9.610 | | | $ | 10.000 | |
| | | |
| Income (Loss) From Operations | | | | | | | | | | | | |
Net investment income(2) | | $ | 0.546 | | | $ | 0.452 | | | $ | 0.173 | |
Net realized and unrealized gain (loss) | | | (1.005 | ) | | | 0.169 | | | | (0.563 | ) |
| | | |
Total income (loss) from operations | | $ | (0.459 | ) | | $ | 0.621 | | | $ | (0.390 | ) |
| | | |
| Less Distributions | | | | | | | | | | | | |
From net investment income | | $ | (0.361 | ) | | $ | (0.329 | ) | | $ | — | |
From net realized gain | | | — | | | | (0.022 | ) | | | — | |
| | | |
Total distributions | | $ | (0.361 | ) | | $ | (0.351 | ) | | $ | — | |
| | | |
Net asset value — End of period | | $ | 9.060 | | | $ | 9.880 | | | $ | 9.610 | |
| | | |
Total Return(3) | | | (4.55 | )% | | | 6.64 | % | | | (3.90 | )%(4) |
| | | |
| Ratios/Supplemental Data | | | | | | | | | | | | |
Net assets, end of period (000’s omitted) | | $ | 48,141 | | | $ | 50,478 | | | $ | 14,518 | |
Ratios (as a percentage of average daily net assets): | | | | | | | | | | | | |
Expenses(5) | | | 0.85 | % | | | 0.85 | % | | | 0.85 | %(6) |
Net investment income | | | 5.82 | % | | | 4.66 | % | | | 3.58 | %(6) |
Portfolio Turnover | | | 74 | % | | | 90 | % | | | 0 | %(4) |
| (1) | For the period from commencement of operations on February 4, 2013 to July 31, 2013. |
| (2) | Computed using average common shares outstanding. |
| (3) | Returns are historical and are calculated by determining the percentage change in net asset value with all distributions reinvested. |
| (5) | The investment adviser and administrator reimbursed certain operating expenses (equal to 0.43%, 1.01% and 2.16% of average daily net assets for the years ended July 31, 2015 and 2014 and the period from commencement of operations on February 4, 2013 to July 31, 2013, respectively). Absent this reimbursement, total return would be lower. |
| | | | |
| | 15 | | See Notes to Financial Statements. |
Eaton Vance
Emerging Markets Debt Opportunities Fund
July 31, 2015
Notes to Financial Statements
1 Significant Accounting Policies
Eaton Vance Emerging Markets Debt Opportunities Fund (formerly, Eaton Vance Institutional Emerging Markets Debt Fund) (the Fund) is a non-diversified series of Eaton Vance Series Fund, Inc. (the Corporation). The Corporation is a Maryland corporation registered under the Investment Company Act of 1940, as amended (the 1940 Act), as an open-end management investment company. The Fund’s investment objective is total return. The Fund’s shares are offered to institutional investors and are sold at net asset value and are not subject to a sales charge.
The following is a summary of significant accounting policies of the Fund. The policies are in conformity with accounting principles generally accepted in the United States of America (U.S. GAAP). The Fund is an investment company and follows accounting and reporting guidance in the Financial Accounting Standards Board (“FASB”) Accounting Standards Codification Topic 946.
A Investment Valuation — The following methodologies are used to determine the market value or fair value of investments.
Debt Obligations. Debt obligations (including short-term obligations with a remaining maturity of more than sixty days) are generally valued on the basis of valuations provided by third party pricing services, as derived from such services’ pricing models. Inputs to the models may include, but are not limited to, reported trades, executable bid and asked prices, broker/dealer quotations, prices or yields of securities with similar characteristics, interest rates, anticipated prepayments, benchmark curves or information pertaining to the issuer, as well as industry and economic events. The pricing services may use a matrix approach, which considers information regarding securities with similar characteristics to determine the valuation for a security. Short-term obligations purchased with a remaining maturity of sixty days or less (excluding those that are non-U.S. dollar denominated, which typically are valued by a pricing service or dealer quotes) are generally valued at amortized cost, which approximates market value.
Derivatives. Financial futures contracts are valued at the closing settlement price established by the board of trade or exchange on which they are traded. Forward foreign currency exchange contracts are generally valued at the mean of the average bid and average asked prices that are reported by currency dealers to a third party pricing service at the valuation time. Such third party pricing service valuations are supplied for specific settlement periods and the Fund’s forward foreign currency exchange contracts are valued at an interpolated rate between the closest preceding and subsequent settlement period reported by the third party pricing service. Non-deliverable bond forward contracts are generally valued based on the current price of the underlying bond as provided by a third party pricing service and current interest rates. Swaps (other than centrally cleared) are normally valued using valuations provided by a third party pricing service. Such pricing service valuations are based on the present value of fixed and projected floating rate cash flows over the term of the swap contract. Future cash flows on swaps are discounted to their present value using swap rates provided by electronic data services or by broker/dealers. Centrally cleared swaps are valued at the daily settlement price provided by the central clearing counterparty.
Foreign Securities and Currencies. Foreign securities and currencies are valued in U.S. dollars, based on foreign currency exchange rate quotations supplied by a third party pricing service. The pricing service uses a proprietary model to determine the exchange rate. Inputs to the model include reported trades and implied bid/ask spreads. The daily valuation of exchange-traded foreign securities generally is determined as of the close of trading on the principal exchange on which such securities trade. Events occurring after the close of trading on foreign exchanges may result in adjustments to the valuation of foreign securities to more accurately reflect their fair value as of the close of regular trading on the New York Stock Exchange. When valuing foreign equity securities that meet certain criteria, the Fund’s Directors have approved the use of a fair value service that values such securities to reflect market trading that occurs after the close of the applicable foreign markets of comparable securities or other instruments that have a strong correlation to the fair-valued securities.
Affiliated Fund. The Fund may invest in Eaton Vance Cash Reserves Fund, LLC (Cash Reserves Fund), an affiliated investment company managed by Eaton Vance Management (EVM). The value of the Fund’s investment in Cash Reserves Fund reflects the Fund’s proportionate interest in its net assets. Cash Reserves Fund generally values its investment securities utilizing the amortized cost valuation technique in accordance with Rule 2a-7 under the 1940 Act. This technique involves initially valuing a portfolio security at its cost and thereafter assuming a constant amortization to maturity of any discount or premium. If amortized cost is determined not to approximate fair value, Cash Reserves Fund may value its investment securities in the same manner as debt obligations described above.
Fair Valuation. Investments for which valuations or market quotations are not readily available or are deemed unreliable are valued at fair value using methods determined in good faith by or at the direction of the Directors of the Fund in a manner that fairly reflects the security’s value, or the amount that the Fund might reasonably expect to receive for the security upon its current sale in the ordinary course. Each such determination is based on a consideration of relevant factors, which are likely to vary from one pricing context to another. These factors may include, but are not limited to, the type of security, the existence of any contractual restrictions on the security’s disposition, the price and extent of public trading in similar securities of the issuer or of comparable companies or entities, quotations or relevant information obtained from broker/dealers or other market participants, information obtained from the issuer, analysts, and/or the appropriate stock exchange (for exchange-traded securities), an analysis of the company’s or entity’s financial condition, and an evaluation of the forces that influence the issuer and the market(s) in which the security is purchased and sold.
B Investment Transactions — Investment transactions for financial statement purposes are accounted for on a trade date basis. Realized gains and losses on investments sold are determined on the basis of identified cost.
C Income — Interest income is recorded on the basis of interest accrued, adjusted for amortization of premium or accretion of discount. Inflation adjustments to the principal amount of inflation-adjusted bonds and notes are reflected as interest income. Withholding taxes on foreign interest and capital gains have been provided for in accordance with the Fund’s understanding of the applicable countries’ tax rules and rates.
Eaton Vance
Emerging Markets Debt Opportunities Fund
July 31, 2015
Notes to Financial Statements — continued
D Federal Taxes — The Fund’s policy is to comply with the provisions of the Internal Revenue Code applicable to regulated investment companies and to distribute to shareholders each year substantially all of its net investment income, and all or substantially all of its net realized capital gains. Accordingly, no provision for federal income or excise tax is necessary.
In addition to the requirements of the Internal Revenue Code, the Fund may also be subject to local taxes on the recognition of capital gains in certain countries. In determining the daily net asset value, the Fund estimates the accrual for such taxes, if any, based on the unrealized appreciation on certain portfolio securities and the related tax rates. Taxes attributable to unrealized appreciation are included in the change in unrealized appreciation (depreciation) on investments. Capital gains taxes on securities sold are included in net realized gain (loss) on investments.
As of July 31, 2015, the Fund had no uncertain tax positions that would require financial statement recognition, de-recognition, or disclosure. The Fund files a U.S. federal income tax return annually after its fiscal year-end, which is subject to examination by the Internal Revenue Service for a period of three years from the date of filing.
E Expense Reduction — State Street Bank and Trust Company (SSBT) serves as custodian of the Fund. Pursuant to the custodian agreement, SSBT receives a fee reduced by credits, which are determined based on the average daily cash balance the Fund maintains with SSBT. All credit balances, if any, used to reduce the Fund’s custodian fees are reported as a reduction of expenses in the Statement of Operations.
F Foreign Currency Translation — Investment valuations, other assets, and liabilities initially expressed in foreign currencies are translated each business day into U.S. dollars based upon current exchange rates. Purchases and sales of foreign investment securities and income and expenses denominated in foreign currencies are translated into U.S. dollars based upon currency exchange rates in effect on the respective dates of such transactions. Recognized gains or losses on investment transactions attributable to changes in foreign currency exchange rates are recorded for financial statement purposes as net realized gains and losses on investments. That portion of unrealized gains and losses on investments that results from fluctuations in foreign currency exchange rates is not separately disclosed.
G Unfunded Loan Commitments — The Fund may enter into certain loan agreements all or a portion of which may be unfunded. The Fund is obligated to fund these commitments at the borrower’s discretion. These commitments are disclosed in the accompanying Portfolio of Investments. At July 31, 2015, the Fund had sufficient cash and/or securities to cover these commitments.
H Use of Estimates — The preparation of the financial statements in conformity with U.S. GAAP requires management to make estimates and assumptions that affect the reported amounts of assets and liabilities at the date of the financial statements and the reported amounts of income and expense during the reporting period. Actual results could differ from those estimates.
I Indemnifications — The Corporation’s Articles of Incorporation provide that no Director or officer of the Corporation shall be liable, to the fullest extent permitted by Maryland law and the 1940 Act, to the Corporation or to its shareholders for money damages. Additionally, in the normal course of business, the Fund enters into agreements with service providers that may contain indemnification clauses. The Fund’s maximum exposure under these arrangements is unknown as this would involve future claims that may be made against the Fund that have not yet occurred.
J Financial Futures Contracts — Upon entering into a financial futures contract, the Fund is required to deposit with the broker, either in cash or securities, an amount equal to a certain percentage of the contract amount (initial margin). Subsequent payments, known as variation margin, are made or received by the Fund each business day, depending on the daily fluctuations in the value of the underlying security, and are recorded as unrealized gains or losses by the Fund. Gains (losses) are realized upon the expiration or closing of the financial futures contracts. Should market conditions change unexpectedly, the Fund may not achieve the anticipated benefits of the financial futures contracts and may realize a loss. Futures contracts have minimal counterparty risk as they are exchange traded and the clearinghouse for the exchange is substituted as the counterparty, guaranteeing counterparty performance.
K Forward Foreign Currency Exchange and Non-Deliverable Bond Forward Contracts — The Fund may enter into forward foreign currency exchange contracts for the purchase or sale of a specific foreign currency at a fixed price on a future date. The forward foreign currency exchange contracts are adjusted by the daily exchange rate of the underlying currency and any gains or losses are recorded as unrealized until such time as the contracts have been closed. The Fund may also enter into non-deliverable bond forward contracts for the purchase of a bond denominated in a non-deliverable foreign currency at a fixed price on a future date. For non-deliverable bond forward contracts, unrealized gains and losses, based on changes in the value of the contract, and realized gains and losses are accounted for as described above. Risks may arise upon entering these contracts from the potential inability of counterparties to meet the terms of their contracts and from movements in the value of a foreign currency relative to the U.S. dollar.
L Interest Rate Swaps — Swap contracts are privately negotiated agreements between the Fund and a counterparty. Certain swap contracts may be centrally cleared (“centrally cleared swaps”), whereby all payments made or received by the Fund pursuant to the contract are with a central clearing party (CCP) rather than the original counterparty. The CCP guarantees the performance of the original parties to the contract. Upon entering into centrally cleared swaps, the Fund is required to deposit with the CCP, either in cash or securities, an amount of initial margin determined by the CCP, which is subject to adjustment.
Pursuant to interest rate swap agreements, the Fund either makes floating-rate payments to the counterparty (or CCP in the case of centrally cleared swaps) based on a benchmark interest rate in exchange for fixed-rate payments or the Fund makes fixed-rate payments to the counterparty (or CCP in the
Eaton Vance
Emerging Markets Debt Opportunities Fund
July 31, 2015
Notes to Financial Statements — continued
case of a centrally cleared swap) in exchange for payments on a floating benchmark interest rate. Payments received or made are recorded as realized gains or losses. During the term of the outstanding swap agreement, changes in the underlying value of the swap are recorded as unrealized gains or losses. For centrally cleared swaps, the daily change in valuation is recorded as a receivable or payable for variation margin and settled in cash with the CCP daily. The value of the swap is determined by changes in the relationship between two rates of interest. The Fund is exposed to credit loss in the event of non-performance by the swap counterparty. In the case of centrally cleared swaps, counterparty risk is minimal due to protections provided by the CCP. Risk may also arise from movements in interest rates.
M Cross-Currency Swaps — Cross-currency swaps are interest rate swaps in which interest cash flows are exchanged between two parties based on the notional amounts of two different currencies. The notional amounts are typically determined based on the spot exchange rates at the inception of the trade. Cross-currency swaps also involve the exchange of the notional amounts at the start of the contract at the current spot rate with an agreement to re-exchange such amounts at a later date at either the same exchange rate, a specified rate or the then current spot rate. The entire principal value of a cross-currency swap is subject to the risk that the counterparty to the swap will default on its contractual delivery obligations.
N Repurchase Agreements — A repurchase agreement is the purchase by the Fund of securities from a counterparty in exchange for cash that is coupled with an agreement to resell those securities to the counterparty at a specified date and price. When a repurchase agreement is entered, the Fund typically receives securities with a value that equals or exceeds the repurchase price, including any accrued interest earned on the agreement. The value of such securities will be marked to market daily, and cash or additional securities will be exchanged between the parties as needed. Except in the case of a repurchase agreement entered to settle a short sale, the value of the securities delivered to the Fund will be at least equal to 90% of the repurchase price during the term of the repurchase agreement. The terms of a repurchase agreement entered to settle a short sale may provide that the cash purchase price paid by the Fund is more than the value of purchased securities that effectively collateralize the repurchase price payable by the counterparty. Since in such a transaction, the Fund normally will have used the purchased securities to settle the short sale, the Fund will segregate liquid assets equal to the marked to market value of the purchased securities that it is obligated to return to the counterparty under the repurchase agreement. In the event of insolvency of the counterparty to a repurchase agreement, recovery of the repurchase price owed to the Fund may be delayed. Such an insolvency also may result in a loss to the extent that the value of the purchased securities decreases during the delay or that value has otherwise not been maintained at an amount at least equal to the repurchase price.
O Reverse Repurchase Agreements — Under a reverse repurchase agreement, the Fund temporarily transfers possession of a portfolio security to another party, such as a bank or broker/dealer, in return for cash. At the same time, the Fund agrees to repurchase the security at an agreed upon time and price, which reflects an interest payment. Because the Fund retains effective control over the transferred security, the transaction is accounted for as a secured borrowing. The Fund may enter into such agreements when it is able to invest the cash acquired at a rate higher than the cost of the agreement, which would increase earned income. When the Fund enters into a reverse repurchase agreement, any fluctuations in the market value of either the securities transferred to another party or the securities in which the proceeds may be invested would affect the market value of the Fund’s assets. Because reverse repurchase agreements may be considered to be the practical equivalent of borrowing funds, they constitute a form of leverage. The Fund segregates cash or liquid assets equal to its obligation to repurchase the security during the term of the agreement. In the event the counterparty to a reverse repurchase agreement becomes insolvent, recovery of the security transferred by the Fund may be delayed or the Fund may incur a loss equal to the amount by which the value of the security transferred by the Fund exceeds the repurchase price payable by the Fund.
2 Distributions to Shareholders and Income Tax Information
It is the present policy of the Fund to make at least one distribution annually (normally in December) of all or substantially all of its net investment income and to distribute annually all or substantially all of its net realized capital gains. Distributions to shareholders are recorded on the ex-dividend date. Shareholders may reinvest income and capital gain distributions in additional shares of the Fund at the net asset value as of the ex-dividend date or, at the election of the shareholder, receive distributions in cash. Distributions to shareholders are determined in accordance with income tax regulations, which may differ from U.S. GAAP. As required by U.S. GAAP, only distributions in excess of tax basis earnings and profits are reported in the financial statements as a return of capital. Permanent differences between book and tax accounting relating to distributions are reclassified to paid-in capital. For tax purposes, distributions from short-term capital gains are considered to be from ordinary income.
The tax character of distributions declared for the years ended July 31, 2015 and July 31, 2014 was as follows:
| | | | | | | | |
| | | Year Ended July 31, | |
| | | 2015 | | | 2014 | |
| | |
Distributions declared from: | | | | | | | | |
Ordinary income | | $ | 1,845,761 | | | $ | 482,711 | |
Long-term capital gains | | $ | — | | | $ | 46,393 | |
During the year ended July 31, 2015, accumulated net realized loss was decreased by $935,144, accumulated undistributed net investment income was decreased by $922,781 and paid-in capital was decreased by $12,363 due to differences between book and tax accounting, primarily for foreign currency
Eaton Vance
Emerging Markets Debt Opportunities Fund
July 31, 2015
Notes to Financial Statements — continued
gain (loss), foreign capital gains taxes, swap contracts, premium amortization, accretion of market discount and investments in partnerships. These reclassifications had no effect on the net assets or net asset value per share of the Fund.
As of July 31, 2015, the components of distributable earnings (accumulated losses) and unrealized appreciation (depreciation) on a tax basis were as follows:
| | | | |
Undistributed ordinary income | | $ | 398,338 | |
Deferred capital losses | | $ | (1,316,239 | ) |
Net unrealized depreciation | | $ | (3,047,958 | ) |
The differences between components of distributable earnings (accumulated losses) on a tax basis and the amounts reflected in the Statement of Assets and Liabilities are primarily due to foreign currency transactions, futures contracts, investments in partnerships, tax straddle transactions, premium amortization and accretion of market discount.
At July 31, 2015, the Fund, for federal income tax purposes, had deferred capital losses of $1,316,239 which will reduce its taxable income arising from future net realized gains on investment transactions, if any, to the extent permitted by the Internal Revenue Code, and thus will reduce the amount of distributions to shareholders, which would otherwise be necessary to relieve the Fund of any liability for federal income or excise tax. The deferred capital losses are treated as arising on the first day of the Fund’s next taxable year and retain the same short-term or long-term character as when originally deferred. Of the deferred capital losses at July 31, 2015, $900,760 are short-term and $415,479 are long-term.
The cost and unrealized appreciation (depreciation) of investments of the Fund at July 31, 2015, as determined on a federal income tax basis, were as follows:
| | | | |
| |
Aggregate cost | | $ | 50,171,625 | |
| |
Gross unrealized appreciation | | $ | 4,393,805 | |
Gross unrealized depreciation | | | (7,172,077 | ) |
| |
Net unrealized depreciation | | $ | (2,778,272 | ) |
3 Investment Adviser and Administration Fee and Other Transactions with Affiliates
The investment adviser and administration fee is earned by EVM as compensation for investment advisory and administrative services rendered to the Fund. The fee is computed at an annual rate of 0.65% of the Fund’s average daily net assets up to $500 million and is payable monthly. On net assets of $500 million and over, the annual fee is reduced. For the year ended July 31, 2015, the Fund’s investment adviser and administration fee amounted to $319,364 or 0.65% of the Fund’s average daily net assets. The Fund invests its cash in Cash Reserves Fund. EVM does not currently receive a fee for advisory services provided to Cash Reserves Fund.
EVM has agreed to reimburse the Fund’s expenses to the extent that total annual operating expenses (relating to ordinary operating expenses only) exceed 0.85% of the Fund’s average daily net assets. This agreement may be changed or terminated after November 30, 2016. Pursuant to this agreement, EVM was allocated $213,135 of the Fund’s operating expenses for the year ended July 31, 2015.
EVM provides sub-transfer agency and related services to the Fund pursuant to a Sub-Transfer Agency Support Services Agreement. For the year ended July 31, 2015, EVM earned $12 from the Fund pursuant to such agreement, which is included in transfer and dividend disbursing agent fees on the Statement of Operations.
Directors and officers of the Fund who are members of EVM’s organization receive remuneration for their services to the Fund out of the investment adviser and administration fee. Directors of the Fund who are not affiliated with EVM may elect to defer receipt of all or a percentage of their annual fees in accordance with the terms of the Directors Deferred Compensation Plan. For the year ended July 31, 2015, no significant amounts have been deferred. Certain officers and Directors of the Fund are officers of EVM.
4 Purchases and Sales of Investments
Purchases and sales of investments, other than short-term obligations, aggregated $31,149,736 and $24,921,322, respectively, for the year ended July 31, 2015.
Eaton Vance
Emerging Markets Debt Opportunities Fund
July 31, 2015
Notes to Financial Statements — continued
5 Common Shares
The Corporation’s Articles of Incorporation permit the Directors to issue one billion full and fractional common shares of the Fund ($0.001 par value per share). Transactions in Fund shares were as follows:
| | | | | | | | |
| | | Year Ended July 31, | |
| | | 2015 | | | 2014 | |
| | |
Sales | | | — | | | | 5,107,252 | |
Issued to shareholders electing to receive payments of distributions in Fund shares | | | 208,561 | | | | 56,228 | |
Redemptions | | | — | | | | (1,566,228 | ) |
| | |
Net increase | | | 208,561 | | | | 3,597,252 | |
At July 31, 2015, Eaton Vance Short Duration Strategic Income Fund owned 100% of the outstanding shares of the Fund.
6 Financial Instruments
The Fund may trade in financial instruments with off-balance sheet risk in the normal course of its investing activities. These financial instruments may include forward foreign currency exchange contracts, non-deliverable bond forward contracts, financial futures contracts and swap contracts and may involve, to a varying degree, elements of risk in excess of the amounts recognized for financial statement purposes. The notional or contractual amounts of these instruments represent the investment the Fund has in particular classes of financial instruments and do not necessarily represent the amounts potentially subject to risk. The measurement of the risks associated with these instruments is meaningful only when all related and offsetting transactions are considered.
A summary of obligations under these financial instruments at July 31, 2015 is as follows:
| | | | | | | | | | | | | | | | | | |
| Forward Foreign Currency Exchange Contracts | |
| | | | | | |
| | | | | | | | | | | | | | | | | | |
| Settlement Date | | Deliver | | In Exchange For | | Counterparty | | Unrealized
Appreciation | | | Unrealized
(Depreciation) | | | Net Unrealized
Appreciation
(Depreciation) | |
| | | | | | |
| 8/4/15 | | Brazilian Real
512,000 | | United States Dollar
150,854 | | BNP Paribas | | $ | 1,320 | | | $ | — | | | $ | 1,320 | |
| 8/4/15 | | Brazilian Real
796,000 | | United States Dollar
245,467 | | Morgan Stanley & Co. International PLC | | | 12,987 | | | | — | | | | 12,987 | |
| 8/4/15 | | Brazilian Real
1,242,000 | | United States Dollar
365,940 | | Morgan Stanley & Co. International PLC | | | 3,201 | | | | — | | | | 3,201 | |
| 8/4/15 | | Brazilian Real
1,537,000 | | United States Dollar
477,552 | | Standard Chartered Bank | | | 28,655 | | | | — | | | | 28,655 | |
| 8/4/15 | | Brazilian Real
1,821,000 | | United States Dollar
536,535 | | Standard Chartered Bank | | | 4,693 | | | | — | | | | 4,693 | |
| 8/4/15 | | Brazilian Real
1,242,000 | | United States Dollar
364,758 | | Standard Chartered Bank | | | 2,019 | | | | — | | | | 2,019 | |
| 8/4/15 | | Euro
667,953 | | Polish Zloty
2,771,673 | | BNP Paribas | | | 1,202 | | | | — | | | | 1,202 | |
| 8/4/15 | | Polish Zloty
929,673 | | Euro
224,431 | | BNP Paribas | | | 21 | | | | — | | | | 21 | |
| 8/4/15 | | Polish Zloty
1,842,000 | | Euro
435,364 | | BNP Paribas | | | — | | | | (10,183 | ) | | | (10,183 | ) |
Eaton Vance
Emerging Markets Debt Opportunities Fund
July 31, 2015
Notes to Financial Statements — continued
| | | | | | | | | | | | | | | | | | |
| Forward Foreign Currency Exchange Contracts (continued) | |
| Settlement Date | | Deliver | | In Exchange For | | Counterparty | | Unrealized
Appreciation | | | Unrealized
(Depreciation) | | | Net Unrealized
Appreciation
(Depreciation) | |
| | | | | | |
| 8/4/15 | | United States Dollar
162,648 | | Brazilian Real
512,000 | | BNP Paribas | | $ | — | | | $ | (13,113 | ) | | $ | (13,113 | ) |
| 8/4/15 | | United States Dollar
234,532 | | Brazilian Real
796,000 | | Morgan Stanley & Co. International PLC | | | — | | | | (2,052 | ) | | | (2,052 | ) |
| 8/4/15 | | United States Dollar
383,002 | | Brazilian Real
1,242,000 | | Morgan Stanley & Co. International PLC | | | — | | | | (20,263 | ) | | | (20,263 | ) |
| 8/4/15 | | United States Dollar
534,802 | | Brazilian Real
1,821,000 | | Standard Chartered Bank | | | — | | | | (2,960 | ) | | | (2,960 | ) |
| 8/4/15 | | United States Dollar
365,940 | | Brazilian Real
1,242,000 | | Standard Chartered Bank | | | — | | | | (3,201 | ) | | | (3,201 | ) |
| 8/4/15 | | United States Dollar
452,858 | | Brazilian Real
1,537,000 | | Standard Chartered Bank | | | — | | | | (3,961 | ) | | | (3,961 | ) |
| 8/5/15 | | Euro
1,473,959 | | United States Dollar
1,656,043 | | BNP Paribas | | | 37,248 | | | | — | | | | 37,248 | |
| 8/12/15 | | Hungarian Forint
27,848,000 | | United States Dollar
97,839 | | Goldman Sachs International | | | — | | | | (1,699 | ) | | | (1,699 | ) |
| 8/12/15 | | United States Dollar
13,671 | | Hungarian Forint
3,891,058 | | Goldman Sachs International | | | 237 | | | | — | | | | 237 | |
| 8/19/15 | | Euro
664,222 | | United States Dollar
722,886 | | Goldman Sachs International | | | — | | | | (6,729 | ) | | | (6,729 | ) |
| 8/19/15 | | United States Dollar
224,518 | | Mexican Peso
3,524,000 | | Goldman Sachs International | | | — | | | | (6,044 | ) | | | (6,044 | ) |
| 8/19/15 | | United States Dollar
907,062 | | Mexican Peso
13,719,773 | | Morgan Stanley & Co.
International PLC | | | — | | | | (56,493 | ) | | | (56,493 | ) |
| 8/19/15 | | United States Dollar
900,145 | | Mexican Peso
13,621,000 | | Standard Chartered Bank | | | — | | | | (55,699 | ) | | | (55,699 | ) |
| 8/26/15 | | Euro
3,645,172 | | United States Dollar
4,057,641 | | Bank of America, N.A. | | | 53,249 | | | | — | | | | 53,249 | |
| 8/28/15 | | United States Dollar
113,838 | | Malaysian Ringgit
436,000 | | Bank of America, N.A. | | | — | | | | (479 | ) | | | (479 | ) |
| 9/3/15 | | Euro
317,182 | | United States Dollar
348,012 | | Goldman Sachs International | | | — | | | | (462 | ) | | | (462 | ) |
| 9/8/15 | | Philippine Peso
15,319,000 | | United States Dollar
337,743 | | BNP Paribas | | | 3,221 | | | | — | | | | 3,221 | |
| 9/9/15 | | United States Dollar
102,641 | | Indian Rupee
6,663,000 | | Bank of America, N.A. | | | 889 | | | | — | | | | 889 | |
| 9/9/15 | | United States Dollar
1,926,567 | | Indian Rupee
124,725,000 | | BNP Paribas | | | 11,409 | | | | — | | | | 11,409 | |
| 9/9/15 | | United States Dollar
116,012 | | Indian Rupee
7,531,000 | | BNP Paribas | | | 1,004 | | | | — | | | | 1,004 | |
Eaton Vance
Emerging Markets Debt Opportunities Fund
July 31, 2015
Notes to Financial Statements — continued
| | | | | | | | | | | | | | | | | | |
| Forward Foreign Currency Exchange Contracts (continued) | |
| Settlement Date | | Deliver | | In Exchange For | | Counterparty | | Unrealized
Appreciation | | | Unrealized
(Depreciation) | | | Net Unrealized
Appreciation
(Depreciation) | |
| | | | | | |
| 9/9/15 | | United States Dollar
131,241 | | Indian Rupee
8,440,000 | | Goldman Sachs International | | $ | — | | | $ | (100 | ) | | $ | (100 | ) |
| 9/14/15 | | New Turkish Lira
157,428 | | United States Dollar
56,619 | | BNP Paribas | | | 482 | | | | — | | | | 482 | |
| 9/14/15 | | United States Dollar
68,183 | | New Turkish Lira
190,000 | | BNP Paribas | | | — | | | | (433 | ) | | | (433 | ) |
| 9/14/15 | | United States Dollar
446,196 | | New Turkish Lira
1,249,000 | | BNP Paribas | | | — | | | | (824 | ) | | | (824 | ) |
| 9/14/15 | | United States Dollar
927,986 | | New Turkish Lira
2,580,265 | | BNP Paribas | | | — | | | | (7,906 | ) | | | (7,906 | ) |
| 9/17/15 | | United States Dollar
704,195 | | Chilean Peso
450,755,000 | | BNP Paribas | | | — | | | | (38,417 | ) | | | (38,417 | ) |
| 9/18/15 | | Euro
390,618 | | Hungarian Forint
121,573,375 | | Deutsche Bank AG | | | 5,065 | | | | — | | | | 5,065 | |
| 9/18/15 | | Hungarian Forint
72,540,000 | | Euro
233,109 | | Deutsche Bank AG | | | — | | | | (2,982 | ) | | | (2,982 | ) |
| 9/23/15 | | Euro
422,637 | | United States Dollar
474,942 | | Goldman Sachs International | | | 10,474 | | | | — | | | | 10,474 | |
| 9/28/15 | | United States Dollar
140,135 | | Azerbaijani Manat
114,000 | | ICBC Standard Bank plc | | | — | | | | (32,851 | ) | | | (32,851 | ) |
| 9/29/15 | | Euro
917,115 | | Romanian Leu
4,056,000 | | Goldman Sachs International | | | 1,987 | | | | — | | | | 1,987 | |
| 10/1/15 | | Colombian Peso
1,981,106,000 | | United States Dollar
736,471 | | Standard Chartered Bank | | | 50,880 | | | | — | | | | 50,880 | |
| 10/1/15 | | United States Dollar
235,582 | | Colombian Peso
625,000,000 | | BNP Paribas | | | — | | | | (19,292 | ) | | | (19,292 | ) |
| 10/1/15 | | United States Dollar
664,002 | | Colombian Peso
1,761,596,000 | | BNP Paribas | | | — | | | | (54,375 | ) | | | (54,375 | ) |
| 10/2/15 | | Brazilian Real
1,821,000 | | United States Dollar
523,727 | | Standard Chartered Bank | | | 2,659 | | | | — | | | | 2,659 | |
| 10/2/15 | | United States Dollar
357,204 | | Brazilian Real
1,242,000 | | Standard Chartered Bank | | | — | | | | (1,813 | ) | | | (1,813 | ) |
| 10/2/15 | | United States Dollar
515,830 | | Indonesian Rupiah 7,035,409,000 | | Goldman Sachs International | | | — | | | | (3,714 | ) | | | (3,714 | ) |
| 10/8/15 | | Euro
223,809 | | Polish Zloty
929,673 | | BNP Paribas | | | — | | | | (25 | ) | | | (25 | ) |
| 10/8/15 | | Hungarian Forint
51,693,000 | | Euro
163,064 | | BNP Paribas | | | — | | | | (5,379 | ) | | | (5,379 | ) |
| 10/16/15 | | Romanian Leu
2,886,645 | | United States Dollar
717,982 | | Bank of America, N.A. | | | — | | | | (601 | ) | | | (601 | ) |
Eaton Vance
Emerging Markets Debt Opportunities Fund
July 31, 2015
Notes to Financial Statements — continued
| | | | | | | | | | | | | | | | | | |
| Forward Foreign Currency Exchange Contracts (continued) | |
| Settlement Date | | Deliver | | In Exchange For | | Counterparty | | Unrealized
Appreciation | | | Unrealized
(Depreciation) | | | Net Unrealized
Appreciation
(Depreciation) | |
| | | | | | |
| 10/16/15 | | United States Dollar
1,249,092 | | Yuan Renminbi Offshore
7,911,000 | | Standard Chartered Bank | | $ | 15,412 | | | $ | — | | | $ | 15,412 | |
| 10/16/15 | | Yuan Renminbi Offshore
7,911,000 | | United States Dollar
1,264,283 | | Standard Chartered Bank | | | — | | | | (221 | ) | | | (221 | ) |
| 10/21/15 | | Euro
374,101 | | United States Dollar
408,375 | | BNP Paribas | | | — | | | | (2,938 | ) | | | (2,938 | ) |
| 10/21/15 | | Euro
871,088 | | United States Dollar
946,035 | | Goldman Sachs International | | | — | | | | (11,700 | ) | | | (11,700 | ) |
| 10/21/15 | | Euro
73,014 | | United States Dollar
79,308 | | Standard Chartered Bank | | | — | | | | (969 | ) | | | (969 | ) |
| 10/21/15 | | Euro
185,412 | | United States Dollar
201,395 | | Standard Chartered Bank | | | — | | | | (2,460 | ) | | | (2,460 | ) |
| 10/23/15 | | Euro
449,192 | | United States Dollar
492,085 | | Standard Chartered Bank | | | — | | | | (1,804 | ) | | | (1,804 | ) |
| 10/27/15 | | United States Dollar
154,531 | | Indian Rupee
9,981,000 | | Deutsche Bank AG | | | — | | | | (592 | ) | | | (592 | ) |
| 10/28/15 | | United States Dollar
100,782 | | Zambian Kwacha
816,000 | | Standard Chartered Bank | | | 1,595 | | | | — | | | | 1,595 | |
| 10/28/15 | | United States Dollar
51,278 | | Zambian Kwacha
413,000 | | Standard Chartered Bank | | | 538 | | | | — | | | | 538 | |
| 11/3/15 | | United States Dollar
51,390 | | Zambian Kwacha
412,000 | | Standard Chartered Bank | | | 128 | | | | — | | | | 128 | |
| 11/3/15 | | United States Dollar
51,322 | | Zambian Kwacha
407,000 | | Standard Chartered Bank | | | — | | | | (430 | ) | | | (430 | ) |
| 11/4/15 | | United States Dollar
167,935 | | Zambian Kwacha
1,357,000 | | Barclays Bank PLC | | | 1,652 | | | | — | | | | 1,652 | |
| 11/4/15 | | United States Dollar
167,946 | | Zambian Kwacha
1,357,000 | | Barclays Bank PLC | | | 1,641 | | | | — | | | | 1,641 | |
| 11/6/15 | | United States Dollar
39,310 | | Zambian Kwacha
312,000 | | Standard Chartered Bank | | | — | | | | (360 | ) | | | (360 | ) |
| 11/30/15 | | United States Dollar
969,032 | | Zambian Kwacha
7,510,000 | | Barclays Bank PLC | | | — | | | | (42,467 | ) | | | (42,467 | ) |
| 12/16/15 | | United States Dollar
293,193 | | Zambian Kwacha
2,319,300 | | Standard Chartered Bank | | | — | | | | (9,261 | ) | | | (9,261 | ) |
| 1/29/16 | | Serbian Dinar
147,008,505 | | Euro
1,144,926 | | Deutsche Bank AG | | | — | | | | (54,817 | ) | | | (54,817 | ) |
| 3/10/16 | | Zambian Kwacha
3,104,000 | | United States Dollar
380,482 | | Standard Chartered Bank | | | 14,845 | | | | — | | | | 14,845 | |
| 3/14/16 | | United States Dollar
128,493 | | Zambian Kwacha
1,053,000 | | ICBC Standard Bank plc | | | — | | | | (4,658 | ) | | | (4,658 | ) |
Eaton Vance
Emerging Markets Debt Opportunities Fund
July 31, 2015
Notes to Financial Statements — continued
| | | | | | | | | | | | | | | | | | |
| Forward Foreign Currency Exchange Contracts (continued) | |
| Settlement Date | | Deliver | | In Exchange For | | Counterparty | | Unrealized
Appreciation | | | Unrealized
(Depreciation) | | | Net Unrealized
Appreciation
(Depreciation) | |
| | | | | | |
| 3/14/16 | | United States Dollar
140,097 | | Zambian Kwacha
1,160,000 | | Standard Chartered Bank | | $ | — | | | $ | (3,679 | ) | | $ | (3,679 | ) |
| 3/24/16 | | United States Dollar
384,762 | | Zambian Kwacha
3,239,700 | | Barclays Bank PLC | | | — | | | | (5,329 | ) | | | (5,329 | ) |
| | | |
| | | $ | 268,713 | | | $ | (493,735 | ) | | $ | (225,022 | ) |
| | | | | | | | | | | | | | | | |
| Non-deliverable Bond Forward Contracts* | |
| | | | | |
| | | | | | | | | | | | | | | | |
| Settlement Date | | Notional
Amount
(000’s omitted) | | | Reference Entity | | Counterparty | | Aggregate Cost | | | Net Unrealized
Appreciation | |
| | | | | |
| 8/10/15 | | COP | 731,000 | | | Republic of Colombia,
5.00%, 11/21/18 | | Standard Chartered Bank | | $ | 250,796 | | | $ | 396 | |
| 8/11/15 | | COP | 739,000 | | | Republic of Colombia, 5.00%, 11/21/18 | | Standard Chartered Bank | | | 253,540 | | | | 402 | |
| 9/1/15 | | COP | 877,700 | | | Republic of Colombia, 5.00%, 11/21/18 | | Deutsche Bank AG | | | 299,216 | | | | 2,454 | |
| 9/3/15 | | COP | 190,800 | | | Republic of Colombia, 5.00%, 11/21/18 | | Deutsche Bank AG | | | 65,293 | | | | 282 | |
| 9/3/15 | | COP | 377,000 | | | Republic of Colombia, 7.00%, 9/11/19 | | Deutsche Bank AG | | | 135,415 | | | | 1,190 | |
| 9/16/15 | | COP | 365,700 | | | Republic of Colombia, 5.00%, 11/21/18 | | Standard Chartered Bank | | | 125,109 | | | | 592 | |
| 9/23/15 | | COP | 497,600 | | | Republic of Colombia, 5.00%, 11/21/18 | | Deutsche Bank AG | | | 170,388 | | | | 655 | |
| 9/23/15 | | COP | 15,000 | | | Republic of Colombia, 10.00%, 7/24/24 | | Deutsche Bank AG | | | 6,096 | | | | 90 | |
| 9/23/15 | | COP | 1,094,000 | | | Republic of Colombia, 6.00%, 4/28/28 | | Deutsche Bank AG | | | 321,750 | | | | 6,780 | |
| |
| | | | $ | 12,841 | |
| * | Represents a short-term forward contract to purchase the reference entity denominated in a non-deliverable foreign currency. |
Eaton Vance
Emerging Markets Debt Opportunities Fund
July 31, 2015
Notes to Financial Statements — continued
| | | | | | | | | | | | | | | | |
| Futures Contracts | |
| Expiration Month/Year | | Contracts | | Position | | Aggregate Cost | | | Value | | | Net
Unrealized
Depreciation | |
| | | | |
| | Interest Rate Futures | | | | | | | | | | | | |
| 9/15 | | 20
Euro-Bobl | | Short | | $ | (2,834,365 | ) | | $ | (2,862,261 | ) | | $ | (27,896 | ) |
| 9/15 | | 20
Euro-Bund | | Short | | | (3,311,473 | ) | | | (3,391,398 | ) | | | (79,925 | ) |
| 9/15 | | 65
U.S. 2-Year Deliverable Interest Rate Swap | | Short | | | (6,539,464 | ) | | | (6,557,891 | ) | | | (18,427 | ) |
| 9/15 | | 40
U.S. 5-Year Deliverable Interest Rate Swap | | Short | | | (4,046,197 | ) | | | (4,096,875 | ) | | | (50,678 | ) |
| 9/15 | | 41
U.S. 10-Year Deliverable Interest Rate Swap | | Short | | | (4,170,770 | ) | | | (4,255,031 | ) | | | (84,261 | ) |
| 9/15 | | 5
U.S. 30-Year Deliverable Interest Rate Swap | | Short | | | (500,911 | ) | | | (526,094 | ) | | | (25,183 | ) |
| 9/15 | | 1
U.S. Long Treasury Bond | | Short | | | (154,531 | ) | | | (155,937 | ) | | | (1,406 | ) |
| |
| | | | $ | (287,776 | ) |
Euro-Bobl: Medium-term debt securities issued by the Federal Republic of Germany with a term to maturity of 4.5 to 5 years.
Euro-Bund: Long-term debt securities issued by the Federal Republic of Germany with a term to maturity of 8.5 to 10.5 years.
| | | | | | | | | | | | | | | | | | | | |
| Centrally Cleared Interest Rate Swaps | |
| Counterparty | | Notional
Amount
(000’s omitted) | | | Fund
Pays/Receives
Floating Rate | | Floating Rate Index | | Annual
Fixed Rate | | | Termination
Date | | | Net Unrealized Appreciation
(Depreciation) | |
| | | | | | |
| LCH.Clearnet(1) | | EUR | 710 | | | Receives | | 6-month Euro Interbank Offered Rate | | | 0.25 | %(2) | | | 9/16/17 | | | $ | (2,286 | ) |
| LCH.Clearnet | | PLN | 818 | | | Pays | | 6-month PLN WIBOR | | | 3.44 | | | | 5/9/19 | | | | 11,710 | |
| LCH.Clearnet | | PLN | 693 | | | Pays | | 6-month PLN WIBOR | | | 1.78 | | | | 2/27/20 | | | | (3,220 | ) |
| LCH.Clearnet | | PLN | 1,086 | | | Pays | | 6-month PLN WIBOR | | | 1.72 | | | | 2/27/20 | | | | (5,773 | ) |
| LCH.Clearnet | | PLN | 3,241 | | | Pays | | 6-month PLN WIBOR | | | 1.78 | | | | 2/27/20 | | | | (14,947 | ) |
| LCH.Clearnet | | PLN | 4,580 | | | Pays | | 6-month PLN WIBOR | | | 2.19 | | | | 10/28/21 | | | | 2,213 | |
| LCH.Clearnet | | PLN | 3,560 | | | Pays | | 6-month PLN WIBOR | | | 2.44 | | | | 10/28/24 | | | | (1,091 | ) |
| LCH.Clearnet(1) | | USD | 280 | | | Receives | | 3-month USD-LIBOR-BBA | | | 3.00 | (2) | | | 9/18/45 | | | | (14,997 | ) |
| |
| | | | $ | (28,391 | ) |
| (1) | Effective date, which represents the date on which the Fund and the counterparty to the interest rate swap begin interest payment accrual, is after July 31, 2015. |
| (2) | Upfront payment is exchanged with the counterparty as a result of the standardized trading coupon. |
Eaton Vance
Emerging Markets Debt Opportunities Fund
July 31, 2015
Notes to Financial Statements — continued
| | | | |
| EUR | | – | | Euro |
| PLN | | – | | Polish Zloty |
| USD | | – | | United States Dollar |
| | | | | | | | | | | | | | | | | | | | |
| Interest Rate Swaps | |
| Counterparty | | Notional
Amount
(000’s omitted) | | | Fund
Pays/Receives
Floating Rate | | Floating Rate Index | | Annual
Fixed Rate | | | Termination
Date | | | Net Unrealized
Appreciation
(Depreciation) | |
| | | | | | |
| Bank of America, N.A. | | BRL | 88 | | | Pays | | Brazil CETIP Interbank Deposit Rate | | | 13.10 | % | | | 1/4/21 | | | $ | 1,617 | |
| Bank of America, N.A. | | BRL | 683 | | | Pays | | Brazil CETIP Interbank Deposit Rate | | | 13.11 | | | | 1/4/21 | | | | 12,690 | |
| Bank of America, N.A. | | COP | 346,729 | | | Pays | | Colombia IBR Overnight Interbank Rate | | | 4.48 | | | | 11/10/16 | | | | (26 | ) |
| Bank of America, N.A. | | COP | 177,935 | | | Pays | | Colombia IBR Overnight Interbank Rate | | | 4.41 | | | | 11/14/16 | | | | (80 | ) |
| Bank of America, N.A. | | COP | 177,935 | | | Pays | | Colombia IBR Overnight Interbank Rate | | | 4.45 | | | | 11/15/16 | | | | (43 | ) |
| Bank of America, N.A. | | COP | 513,079 | | | Pays | | Colombia IBR Overnight Interbank Rate | | | 4.37 | | | | 11/21/16 | | | | (345 | ) |
| Bank of America, N.A. | | COP | 410,460 | | | Pays | | Colombia IBR Overnight Interbank Rate | | | 4.37 | | | | 11/24/16 | | | | (279 | ) |
| Bank of America, N.A. | | COP | 2,137,000 | | | Pays | | Colombia IBR Overnight Interbank Rate | | | 4.28 | | | | 12/5/16 | | | | (2,512 | ) |
| Bank of America, N.A. | | MXN | 2,844 | | | Pays | | Mexico Interbank TIIE 28 Day | | | 6.63 | | | | 3/19/24 | | | | 6,756 | |
| Barclays Bank PLC | | BRL | 10,168 | | | Pays | | Brazil CETIP Interbank Deposit Rate | | | 12.09 | | | | 1/2/17 | | | | (60,582 | ) |
| Barclays Bank PLC | | BRL | 3,922 | | | Pays | | Brazil CETIP Interbank Deposit Rate | | | 11.72 | | | | 1/4/21 | | | | (60,326 | ) |
| Barclays Bank PLC | | BRL | 2,256 | | | Receives | | Brazil CETIP Interbank Deposit Rate | | �� | 11.81 | | | | 1/2/23 | | | | 39,984 | |
| Barclays Bank PLC | | MYR | 9,334 | | | Pays | | 3-month MYR KLIBOR | | | 3.90 | | | | 11/26/19 | | | | (19,180 | ) |
| Deutsche Bank AG | | BRL | 336 | | | Pays | | Brazil CETIP Interbank Deposit Rate | | | 12.96 | | | | 1/2/18 | | | | 249 | |
| Deutsche Bank AG | | BRL | 1,866 | | | Pays | | Brazil CETIP Interbank Deposit Rate | | | 13.00 | | | | 1/2/18 | | | | 1,901 | |
| Goldman Sachs International | | BRL | 4,709 | | | Pays | | Brazil CETIP Interbank Deposit Rate | | | 13.18 | | | | 1/2/18 | | | | 10,462 | |
| Goldman Sachs International | | BRL | 2,487 | | | Pays | | Brazil CETIP Interbank Deposit Rate | | | 12.19 | | | | 1/2/23 | | | | (16,799 | ) |
| Morgan Stanley & Co. International PLC | | COP | 244,781 | | | Pays | | Colombia IBR Overnight Interbank Rate | | | 4.46 | | | | 11/15/16 | | | | (47 | ) |
| Morgan Stanley & Co. International PLC | | COP | 997,750 | | | Pays | | Colombia IBR Overnight Interbank Rate | | | 4.23 | | | | 12/5/16 | | | | (1,430 | ) |
| |
| | | | $ | (87,990 | ) |
| | | | |
| BRL | | – | | Brazilian Real |
| COP | | – | | Colombian Peso |
| MXN | | – | | Mexican Peso |
| MYR | | – | | Malaysian Ringgit |
Eaton Vance
Emerging Markets Debt Opportunities Fund
July 31, 2015
Notes to Financial Statements — continued
At July 31, 2015, the Fund had sufficient cash and/or securities to cover commitments under these contracts.
In the normal course of pursuing its investment objective, the Fund is subject to the following risks:
Foreign Exchange Risk: The Fund engages in forward foreign currency exchange contracts and cross-currency swaps to enhance total return, to seek to hedge against fluctuations in currency exchange rates and/or as a substitute for the purchase or sale of securities or currencies.
Interest Rate Risk: The Fund utilizes various interest rate derivatives including interest rate futures contracts, interest rate swaps, cross-currency swaps and non-deliverable bond forward contracts to enhance total return, to seek to hedge against fluctuations in interest rates, and/or to change the effective duration of its portfolio.
The Fund enters into swap contracts (other than centrally cleared swaps), forward foreign currency exchange contracts and non-deliverable bond forward contracts that may contain provisions whereby the counterparty may terminate the contract under certain conditions, including but not limited to a decline in the Fund’s net assets below a certain level over a certain period of time, which would trigger a payment by the Fund for those derivatives in a liability position. At July 31, 2015, the fair value of derivatives with credit-related contingent features in a net liability position was $655,384. At July 31, 2015, there were no assets pledged by the Fund for such liability.
The over-the-counter (OTC) derivatives in which the Fund invests are subject to the risk that the counterparty to the contract fails to perform its obligations under the contract. To mitigate this risk, the Fund has entered into an International Swaps and Derivatives Association, Inc. Master Agreement (“ISDA Master Agreement”) or similar agreement with substantially all its derivative counterparties. An ISDA Master Agreement is a bilateral agreement between the Fund and a counterparty that governs certain OTC derivatives and typically contains, among other things, set-off provisions in the event of a default and/or termination event as defined under the relevant ISDA Master Agreement. Under an ISDA Master Agreement, the Fund may, under certain circumstances, offset with the counterparty certain derivative financial instruments’ payables and/or receivables with collateral held and/or posted and create one single net payment. The provisions of the ISDA Master Agreement typically permit a single net payment in the event of default including the bankruptcy or insolvency of the counterparty. However, bankruptcy or insolvency laws of a particular jurisdiction may impose restrictions on or prohibitions against the right of offset in bankruptcy or insolvency. Certain ISDA Master Agreements allow counterparties to OTC derivatives to terminate derivative contracts prior to maturity in the event the Fund’s net assets decline by a stated percentage or the Fund fails to meet the terms of its ISDA Master Agreements, which would cause the counterparty to accelerate payment by the Fund of any net liability owed to it.
The collateral requirements for derivatives traded under an ISDA Master Agreement are governed by a Credit Support Annex to the ISDA Master Agreement. Collateral requirements are determined at the close of business each day and are typically based on changes in market values for each transaction under an ISDA Master Agreement and netted into one amount for such agreement. Generally, the amount of collateral due from or to a counterparty is subject to a minimum transfer threshold amount before a transfer is required, which may vary by counterparty. Collateral pledged for the benefit of the Fund and/or counterparty is held in segregated accounts by the Fund’s custodian and cannot be sold, re-pledged, assigned or otherwise used while pledged. The portion of such collateral representing cash, if any, is reflected as restricted cash and, in the case of cash pledged by a counterparty for the benefit of the Fund, a corresponding liability on the Statement of Assets and Liabilities. Securities pledged by the Fund as collateral, if any, are identified as such in the Portfolio of Investments.
Eaton Vance
Emerging Markets Debt Opportunities Fund
July 31, 2015
Notes to Financial Statements — continued
The fair value of open derivative instruments (not considered to be hedging instruments for accounting disclosure purposes) by risk exposure at July 31, 2015 was as follows:
| | | | | | | | | | | | |
| | | Fair Value | |
| Statement of Assets and Liabilities Caption | | Foreign
Exchange | | | Interest
Rate | | | Total | |
| | | |
Net unrealized depreciation* | | $ | — | | | $ | 13,923 | | | $ | 13,923 | |
Receivable for open forward foreign currency exchange contracts | | | 268,713 | | | | — | | | | 268,713 | |
Receivable for open swap contracts | | | — | | | | 73,659 | | | | 73,659 | |
Receivable for open non-deliverable bond forward contracts | | | — | | | | 12,841 | | | | 12,841 | |
| | | |
Total Asset Derivatives | | $ | 268,713 | | | $ | 100,423 | | | $ | 369,136 | |
| | | |
Derivatives not subject to master netting or similar agreements | | $ | — | | | $ | 13,923 | | | $ | 13,923 | |
| | | |
Total Asset Derivatives subject to master netting or similar agreements | | $ | 268,713 | | | $ | 86,500 | | | $ | 355,213 | |
| | | |
Net unrealized depreciation* | | $ | — | | | $ | (330,090 | ) | | $ | (330,090 | ) |
Payable for open forward foreign currency exchange contracts | | | (493,735 | ) | | | — | | | | (493,735 | ) |
Payable for open swap contracts | | | — | | | | (161,649 | ) | | | (161,649 | ) |
| | | |
Total Liability Derivatives | | $ | (493,735 | ) | | $ | (491,739 | ) | | $ | (985,474 | ) |
| | | |
Derivatives not subject to master netting or similar agreements | | $ | — | | | $ | (330,090 | ) | | $ | (330,090 | ) |
| | | |
Total Liabilities Derivatives subject to master netting or similar agreements | | $ | (493,735 | ) | | $ | (161,649 | ) | | $ | (655,384 | ) |
| * | Amount represents cumulative unrealized appreciation or (depreciation) on futures contracts and centrally cleared swap contracts in the Futures Contracts and Centrally Cleared Swaps Contracts tables above. Only the current day’s variation margin on open futures contracts and centrally cleared swap contracts is reported within the Statement of Assets and Liabilities as Receivable or Payable for variation margin, as applicable. |
The Fund’s derivative assets and liabilities at fair value by risk, which are reported gross in the Statement of Assets and Liabilities, are presented in the table above. The following tables present the Fund’s derivative assets and liabilities by counterparty, net of amounts available for offset under a master netting agreement and net of the related collateral received by the Fund for assets and pledged by the Fund for liabilities as of July 31, 2015.
| | | | | | | | | | | | | | | | | | | | |
| Counterparty | | Derivative
Assets Subject to
Master Netting
Agreement | | | Derivatives
Available
for Offset | | | Non-cash
Collateral
Received(a) | | | Cash
Collateral
Received(a) | | | Net Amount
of Derivative
Assets(b) | |
| | | | | |
Bank of America, N.A. | | $ | 75,201 | | | $ | (4,365 | ) | | $ | — | | | $ | — | | | $ | 70,836 | |
Barclays Bank PLC | | | 43,277 | | | | (43,277 | ) | | | — | | | | — | | | | — | |
BNP Paribas | | | 55,907 | | | | (55,907 | ) | | | — | | | | — | | | | — | |
Deutsche Bank AG | | | 18,666 | | | | (18,666 | ) | | | — | | | | — | | | | — | |
Goldman Sachs International | | | 23,160 | | | | (23,160 | ) | | | — | | | | — | | | | — | |
Morgan Stanley & Co. International PLC | | | 16,188 | | | | (16,188 | ) | | | — | | | | — | | | | — | |
Standard Chartered Bank | | | 122,814 | | | | (86,818 | ) | | | — | | | | — | | | | 35,996 | |
| | | | | |
| | | $ | 355,213 | | | $ | (248,381 | ) | | $ | — | | | $ | — | | | $ | 106,832 | |
Eaton Vance
Emerging Markets Debt Opportunities Fund
July 31, 2015
Notes to Financial Statements — continued
| | | | | | | | | | | | | | | | | | | | |
| Counterparty | | Derivative
Liabilities Subject to
Master Netting
Agreement | | | Derivatives
Available
for Offset | | | Non-cash
Collateral
Pledged(a) | | | Cash
Collateral
Pledged(a) | | | Net Amount
of Derivative
Liabilities(c) | |
| | | | | |
Bank of America, N.A. | | $ | (4,365 | ) | | $ | 4,365 | | | $ | — | | | $ | — | | | $ | — | |
Barclays Bank PLC | | | (187,884 | ) | | | 43,277 | | | | — | | | | — | | | | (144,607 | ) |
BNP Paribas | | | (152,885 | ) | | | 55,907 | | | | — | | | | — | | | | (96,978 | ) |
Deutsche Bank AG | | | (58,391 | ) | | | 18,666 | | | | — | | | | — | | | | (39,725 | ) |
Goldman Sachs International | | | (47,247 | ) | | | 23,160 | | | | — | | | | — | | | | (24,087 | ) |
ICBC Standard Bank plc | | | (37,509 | ) | | | — | | | | — | | | | — | | | | (37,509 | ) |
Morgan Stanley & Co. International PLC | | | (80,285 | ) | | | 16,188 | | | | — | | | | — | | | | (64,097 | ) |
Standard Chartered Bank | | | (86,818 | ) | | | 86,818 | | | | — | | | | — | | | | — | |
| | | | | |
| | | $ | (655,384 | ) | | $ | 248,381 | | | $ | — | | | $ | — | | | $ | (407,003 | ) |
| (a) | In some instances, the actual collateral received and/or pledged may be more than the amount shown due to overcollateralization. |
| (b) | Net amount represents the net amount due from the counterparty in the event of default. |
| (c) | Net amount represents the net amount payable to the counterparty in the event of default. |
Information with respect to reverse repurchase agreements at July 31, 2015 is included at Note 8.
The effect of derivative instruments (not considered to be hedging instruments for accounting disclosure purposes) on the Statement of Operations by risk exposure for the year ended July 31, 2015 was as follows:
| | | | | | | | |
| Statement of Operations Caption | | Foreign Exchange | | | Interest Rate | |
| | |
Net realized gain (loss) — | | | | | | | | |
Financial futures contracts | | $ | — | | | $ | (93,319 | ) |
Swap contracts | | | — | | | | (52,655 | ) |
Foreign currency and forward foreign currency exchange contract transactions | | | 1,122,838 | | | | — | |
Non-deliverable bond forward contracts | | | — | | | | (5,595 | ) |
| | |
Total | | $ | 1,122,838 | | | $ | (151,569 | ) |
| | |
Change in unrealized appreciation (depreciation) — | | | | | | | | |
Financial futures contracts | | $ | — | | | $ | (283,296 | ) |
Swap contracts | | | — | | | | (278,370 | ) |
Foreign currency and forward foreign currency exchange contracts | | | (348,487 | ) | | | — | |
Non-deliverable bond forward contacts | | | — | | | | 12,841 | |
| | |
Total | | $ | (348,487 | ) | | $ | (548,825 | ) |
The average notional amounts of derivative contracts outstanding during the year ended July 31, 2015, which are indicative of the volume of these derivative types, were as follows:
| | | | | | | | | | | | | | |
Futures
Contracts — Short | | | Forward Foreign Currency Exchange Contracts | | | Non-deliverable Bond Forward Contracts | | | Swap Contracts | |
| | | |
| | $15,938,000 | | | $ | 26,500,000 | | | $ | 680,000 | | | $ | 18,255,000 | |
Eaton Vance
Emerging Markets Debt Opportunities Fund
July 31, 2015
Notes to Financial Statements — continued
7 Line of Credit
The Fund participates with other portfolios and funds managed by EVM and its affiliates in a $750 million unsecured line of credit agreement with a group of banks, which is in effect through September 7, 2015. Borrowings are made by the Fund solely to facilitate the handling of unusual and/or unanticipated short-term cash requirements. Interest is charged to the Fund based on its borrowings at an amount above either the Eurodollar rate or Federal Funds rate. In addition, a fee computed at an annual rate of 0.08% on the daily unused portion of the line of credit is allocated among the participating portfolios and funds at the end of each quarter. Because the line of credit is not available exclusively to the Fund, it may be unable to borrow some or all of its requested amounts at any particular time. The Fund did not have any significant borrowings or allocated fees during the year ended July 31, 2015.
On September 4, 2015, the Fund renewed its line of credit agreement, which expires September 2, 2016. Under the terms of the renewed credit agreement, the commitment amount was reduced to $625 million and the commitment fee on the unused portion of the line of credit was changed to an annual rate of 0.10%.
8 Reverse Repurchase Agreements
Reverse repurchase agreements outstanding as of July 31, 2015 were as follows:
| | | | | | | | | | | | | | | | | | | | |
| Counterparty | | Trade
Date | | | Maturity
Date(1) | | | Interest
Rate Paid
(Received) | | | Principal
Amount | | | Value Including
Accrued
Interest | |
| | | | | |
JPMorgan Chase Bank, N.A. | | | 7/7/15 | | | | On Demand | | | | (0.25 | )% | | $ | 446,209 | | | $ | 446,209 | |
JPMorgan Chase Bank, N.A. | | | 7/7/15 | | | | On Demand | | | | (0.35 | ) | | | 186,370 | | | | 186,370 | |
JPMorgan Chase Bank, N.A. | | | 7/8/15 | | | | On Demand | | | | (0.35 | ) | | | 27,010 | | | | 27,010 | |
| (1) | Open reverse repurchase agreement with no specific maturity date. Either party may terminate the agreement upon demand. |
For the year ended July 31, 2015, the average borrowings under settled reverse repurchase agreements and the average annual interest rate were approximately $1,028,000 and (0.46)%, respectively. Based on the short-term nature of the borrowings under the reverse repurchase agreements, the carrying value of the payable for reverse repurchase agreements approximated its fair value at July 31, 2015. If measured at fair value, borrowings under the reverse repurchase agreements would have been considered as Level 2 in the fair value hierarchy (see Note 10) at July 31, 2015.
Repurchase agreements and reverse repurchase agreements entered into by the Fund are subject to Master Repurchase Agreements (MRA), which permit the Fund, under certain circumstances, including an event of default (such as bankruptcy or insolvency), to offset payables and/or receivables under the MRA with collateral held and/or posted to the counterparty and create one single net payment due to or from the Fund. The following table presents the Fund’s reverse repurchase agreements net of amounts available for offset under an MRA and net of the related collateral pledged by the Fund as of July 31, 2015.
| | | | | | | | | | | | | | | | |
| Counterparty | | Reverse Repurchase
Agreements* | | | Assets
Available for
Offset | | | Securities
Collateral
Pledged(a) | | | Net Amount(b) | |
| | | | |
JPMorgan Chase Bank, N.A. | | $ | (659,589 | ) | | $ | — | | | $ | 659,589 | | | $ | — | |
| | | | |
| | | $ | (659,589 | ) | | $ | — | | | $ | 659,589 | | | $ | — | |
| (a) | In some instances, the actual collateral pledged may be more than the amount shown due to overcollateralization. |
| (b) | Net amount represents the net amount payable to the counterparty in the event of a default. |
| * | Including accrued interest. |
9 Risks Associated with Foreign Investments
The Fund’s investments in foreign instruments can be adversely affected by changes in currency exchange rates and political, economic and market developments abroad. In emerging or less developed countries, these risks can be more significant. Investment markets in emerging market countries are typically substantially smaller, less liquid and more volatile than the major markets in developed countries. Emerging market countries may have relatively unstable governments and economies. Emerging market investments often are subject to speculative trading, which typically contributes to volatility.
Eaton Vance
Emerging Markets Debt Opportunities Fund
July 31, 2015
Notes to Financial Statements — continued
The Fund may have difficulties enforcing its legal or contractual rights in a foreign country. Economic data as reported by foreign governments and other issuers may be delayed, inaccurate or fraudulent. In the event of a default by a sovereign entity, there are typically no assets to be seized or cash flows to be attached. Furthermore, the willingness or ability of a foreign government to renegotiate defaulted debt may be limited.
10 Fair Value Measurements
Under generally accepted accounting principles for fair value measurements, a three-tier hierarchy to prioritize the assumptions, referred to as inputs, is used in valuation techniques to measure fair value. The three-tier hierarchy of inputs is summarized in the three broad levels listed below.
| • | | Level 1 – quoted prices in active markets for identical investments |
| • | | Level 2 – other significant observable inputs (including quoted prices for similar investments, interest rates, prepayment speeds, credit risk, etc.) |
| • | | Level 3 – significant unobservable inputs (including a fund’s own assumptions in determining the fair value of investments) |
In cases where the inputs used to measure fair value fall in different levels of the fair value hierarchy, the level disclosed is determined based on the lowest level input that is significant to the fair value measurement in its entirety. The inputs or methodology used for valuing securities are not necessarily an indication of the risk associated with investing in those securities.
At July 31, 2015, the hierarchy of inputs used in valuing the Fund’s investments and open derivative instruments, which are carried at value, were as follows:
| | | | | | | | | | | | | | | | |
| Asset Description | | Level 1 | | | Level 2 | | | Level 3* | | | Total | |
| | | | |
Foreign Government Bonds | | $ | — | | | $ | 31,836,384 | | | $ | — | | | $ | 31,836,384 | |
Foreign Corporate Bonds | | | — | | | | 3,965,229 | | | | — | | | | 3,965,229 | |
Sovereign Loans (Less Unfunded Loan Commitments) | | | — | | | | — | | | | 164,415 | | | | 164,415 | |
Short-Term Investments — | | | | | | | | | | | | | | | | |
Foreign Government Securities | | | — | | | | 3,017,728 | | | | — | | | | 3,017,728 | |
U.S. Treasury Obligations | | | — | | | | 1,999,858 | | | | — | | | | 1,999,858 | |
Other | | | — | | | | 6,409,739 | | | | — | | | | 6,409,739 | |
| | | | |
Total Investments | | $ | — | | | $ | 47,228,938 | | | $ | 164,415 | | | $ | 47,393,353 | |
| | | | |
Forward Foreign Currency Exchange Contracts | | $ | — | | | $ | 268,713 | | | $ | — | | | $ | 268,713 | |
Non-deliverable Bond Forward Contracts | | | — | | | | 12,841 | | | | — | | | | 12,841 | |
Swap Contracts | | | — | | | | 87,582 | | | | — | | | | 87,582 | |
| | | | |
Total | | $ | — | | | $ | 47,598,074 | | | $ | 164,415 | | | $ | 47,762,489 | |
| | | | |
Liability Description | | | | | | | | | | | | | | | | |
| | | | |
Forward Foreign Currency Exchange Contracts | | $ | — | | | $ | (493,735 | ) | | $ | — | | | $ | (493,735 | ) |
Futures Contracts | | | (287,776 | ) | | | — | | | | — | | | | (287,776 | ) |
Swap Contracts | | | — | | | | (203,963 | ) | | | — | | | | (203,963 | ) |
| | | | |
Total | | $ | (287,776 | ) | | $ | (697,698 | ) | | $ | — | | | $ | (985,474 | ) |
| * | None of the unobservable inputs for Level 3 assets, individually or collectively, had a material impact on the Fund. |
Level 3 investments at the beginning and/or end of the period in relation to net assets were not significant and accordingly, a reconciliation of Level 3 assets for the year ended July 31, 2015 is not presented. At July 31, 2015, there were no investments transferred between Level 1 and Level 2 during the year then ended.
11 Name Change
Effective September 3, 2015, the name of Eaton Vance Emerging Markets Debt Opportunities Fund was changed from Eaton Vance Institutional Emerging Markets Debt Fund. Concurrent with the name change, the Fund began offering Class A and Class I shares and the Fund’s existing share class was designated as Class R6 shares.
Eaton Vance
Emerging Markets Debt Opportunities Fund
July 31, 2015
Report of Independent Registered Public Accounting Firm
To the Directors of Eaton Vance Series Fund, Inc. and Shareholders of Eaton Vance Emerging Markets Debt Opportunities Fund:
We have audited the accompanying statement of assets and liabilities of Eaton Vance Emerging Markets Debt Opportunities Fund (formerly, Eaton Vance Institutional Emerging Markets Debt Fund) (the “Fund”) (one of the funds constituting Eaton Vance Series Fund, Inc.), including the portfolio of investments, as of July 31, 2015, and the related statement of operations for the year then ended, the statements of changes in net assets for each of the two years in the period then ended, and the financial highlights for each of the periods presented. These financial statements and financial highlights are the responsibility of the Fund’s management. Our responsibility is to express an opinion on these financial statements and financial highlights based on our audits.
We conducted our audits in accordance with the standards of the Public Company Accounting Oversight Board (United States). Those standards require that we plan and perform the audits to obtain reasonable assurance about whether the financial statements and financial highlights are free of material misstatement. The Fund is not required to have, nor were we engaged to perform, an audit of its internal control over financial reporting. Our audits included consideration of internal control over financial reporting as a basis for designing audit procedures that are appropriate in the circumstances, but not for the purpose of expressing an opinion on the effectiveness of the Fund’s internal control over financial reporting. Accordingly, we express no such opinion. An audit also includes examining, on a test basis, evidence supporting the amounts and disclosures in the financial statements, assessing the accounting principles used and significant estimates made by management, as well as evaluating the overall financial statement presentation. Our procedures included confirmation of securities and senior loans owned as of July 31, 2015, by correspondence with the custodian, brokers and selling or agent banks; where replies were not received from brokers and selling or agent banks, we performed other auditing procedures. We believe that our audits provide a reasonable basis for our opinion.
In our opinion, such financial statements and financial highlights referred to above present fairly, in all material respects, the financial position of Eaton Vance Emerging Markets Debt Opportunities Fund as of July 31, 2015, the results of its operations for the year then ended, the changes in its net assets for each of the two years in the period then ended, and the financial highlights for each of the periods presented, in conformity with accounting principles generally accepted in the United States of America.
DELOITTE & TOUCHE LLP
Boston, Massachusetts
September 18, 2015
Eaton Vance
Emerging Markets Debt Opportunities Fund
July 31, 2015
Federal Tax Information (Unaudited)
The Form 1099-DIV you receive in February 2016 will show the tax status of all distributions paid to your account in calendar year 2015. Shareholders are advised to consult their own tax adviser with respect to the tax consequences of their investment in the Fund. As required by the Internal Revenue Code and/or regulations, shareholders must be notified regarding the status of the foreign tax credit.
Foreign Tax Credit. For the fiscal year ended July 31, 2015, the Fund paid foreign taxes of $106,512 and recognized foreign source income of $3,344,396.
Eaton Vance
Emerging Markets Debt Opportunities Fund
July 31, 2015
Board of Trustees’ Contract Approval
Overview of the Contract Review Process
The Investment Company Act of 1940, as amended (the “1940 Act”), provides, in substance, that each investment advisory agreement between a fund and its investment adviser will continue in effect from year to year only if its continuation is approved at least annually by the fund’s board of trustees, including by a vote of a majority of the trustees who are not “interested persons” of the fund (“Independent Trustees”), cast in person at a meeting called for the purpose of considering such approval.
At a meeting of the Boards of Trustees (each a “Board”) of the registered investment companies advised, administered and/or distributed by Eaton Vance Management or its affiliates (the “Eaton Vance Funds”) held on April 27, 2015, the Board, including a majority of the Independent Trustees, voted to approve continuation of existing investment advisory and sub-advisory agreements for the Eaton Vance Funds for an additional one-year period. In voting its approval, the Board relied upon the affirmative recommendation of its Contract Review Committee, which is a committee comprised exclusively of Independent Trustees. Prior to making its recommendation, the Contract Review Committee reviewed information furnished by each adviser to the Eaton Vance Funds (including information specifically requested by the Board) for a series of meetings of the Contract Review Committee held between February and April 2015. The Contract Review Committee also considered information received at prior meetings of the Board and its committees, as relevant to its annual evaluation of the investment advisory and sub-advisory agreements.
The information that the Board considered included, among other things, the following:
Information about Fees, Performance and Expenses
| • | | A report from an independent data provider comparing the advisory and related fees paid by each fund with fees paid by comparable funds as identified by the data provider (“comparable funds”); |
| • | | A report from an independent data provider comparing each fund’s total expense ratio and its components to comparable funds; |
| • | | A report from an independent data provider comparing the investment performance of each fund (including, where relevant, yield data, Sharpe ratios and information ratios) to the investment performance of comparable funds over various time periods; |
| • | | Data regarding investment performance in comparison to benchmark indices and customized peer groups identified by the adviser in consultation with the Board; |
| • | | For each fund, comparative information concerning the fees charged and the services provided by each adviser in managing other accounts (including mutual funds, other collective investment funds and institutional accounts) using investment strategies and techniques similar to those used in managing such fund; |
| • | | Profitability analyses for each adviser with respect to each fund; |
Information about Portfolio Management and Trading
| • | | Descriptions of the investment management services provided to each fund, including the investment strategies and processes it employs; |
| • | | The procedures and processes used to determine the fair value of fund assets and actions taken to monitor and test the effectiveness of such procedures and processes; |
| • | | Information about each adviser’s policies and practices with respect to trading, including each adviser’s processes for monitoring best execution of portfolio transactions; |
| • | | Information about the allocation of brokerage transactions and the benefits received by each adviser as a result of brokerage allocation, including information concerning the acquisition of research through client commission arrangements and policies with respect to “soft dollars”; |
| • | | Data relating to portfolio turnover rates of each fund; |
Information about each Adviser
| • | | Reports detailing the financial results and condition of each adviser; |
| • | | Descriptions of the qualifications, education and experience of the individual investment professionals whose responsibilities include portfolio management and investment research for the funds, and information relating to their compensation and responsibilities with respect to managing other mutual funds and investment accounts; |
| • | | The Code of Ethics of each adviser and its affiliates, together with information relating to compliance with and the administration of such codes; |
| • | | Policies and procedures relating to proxy voting and the handling of corporate actions and class actions; |
| • | | Information concerning the resources devoted to compliance efforts undertaken by each adviser and its affiliates (including descriptions of various compliance programs) and their record of compliance; |
| • | | Descriptions of the business continuity and disaster recovery plans of each adviser and its affiliates; |
| • | | A description of Eaton Vance Management’s procedures for overseeing third party advisers and sub-advisers, including with respect to regulatory and compliance issues, investment management and other matters; |
Eaton Vance
Emerging Markets Debt Opportunities Fund
July 31, 2015
Board of Trustees’ Contract Approval — continued
Other Relevant Information
| • | | Information concerning the nature, cost and character of the administrative and other non-investment management services provided by Eaton Vance Management and its affiliates; |
| • | | Information concerning management of the relationship with the custodian, subcustodians and fund accountants by each adviser or the funds’ administrator; and |
| • | | The terms of each investment advisory agreement. |
Over the course of the twelve-month period ended April 30, 2015, with respect to one or more funds, the Board met nine times and the Contract Review Committee, the Audit Committee, the Governance Committee, the Portfolio Management Committee and the Compliance Reports and Regulatory Matters Committee, each of which is a Committee comprised solely of Independent Trustees, met eight, seventeen, seven, eleven and thirteen times, respectively. At such meetings, the Trustees participated in investment and performance reviews with the portfolio managers and other investment professionals of each adviser relating to each fund, and considered the investment and trading strategies used in pursuing each fund’s investment objective, including, where relevant, the use of derivative instruments, as well as processes for monitoring best execution of portfolio transactions and risk management techniques. The Board and its Committees also evaluated issues pertaining to industry and regulatory developments, compliance procedures, fund governance and other issues with respect to the funds, and received and participated in reports and presentations provided by Eaton Vance Management and other fund advisers with respect to such matters. In addition to the formal meetings of the Board and its Committees, the Independent Trustees hold regular teleconferences in between meetings to discuss, among other topics, matters relating to the continuation of investment advisory and sub-advisory agreements.
For funds that invest through one or more underlying portfolios, the Board considered similar information about the portfolio(s) when considering the approval of investment advisory agreements. In addition, in cases where the fund’s investment adviser has engaged a sub-adviser, the Board considered similar information about the sub-adviser when considering the approval of any sub-advisory agreement.
The Contract Review Committee was assisted throughout the contract review process by Goodwin Procter LLP, legal counsel for the Independent Trustees. The members of the Contract Review Committee relied upon the advice of such counsel and their own business judgment in determining the material factors to be considered in evaluating each investment advisory and sub-advisory agreement and the weight to be given to each such factor. The conclusions reached with respect to each investment advisory and sub-advisory agreement were based on a comprehensive evaluation of all the information provided and not any single factor. Moreover, each member of the Contract Review Committee may have placed varying emphasis on particular factors in reaching conclusions with respect to each investment advisory and sub-advisory agreement. In evaluating each investment advisory and sub-advisory agreement, including the specific fee structures and other terms of the agreements, the Contract Review Committee was informed by multiple years of analysis and discussion among the Independent Trustees and the Eaton Vance Funds’ advisers and sub-advisers.
Results of the Process
Based on its consideration of the foregoing, and such other information as it deemed relevant, including the factors and conclusions described below, the Contract Review Committee concluded that the continuation of the investment advisory and administrative agreement of Eaton Vance Emerging Markets Debt Opportunities Fund (formerly, Eaton Vance Institutional Emerging Markets Debt Fund) (the “Fund”) with Eaton Vance Management (the “Adviser”), including its fee structure, is in the interests of shareholders and, therefore, the Contract Review Committee recommended to the Board approval of the agreement. The Board accepted the recommendation of the Contract Review Committee as well as the factors considered and conclusions reached by the Contract Review Committee with respect to the agreement. Accordingly, the Board, including a majority of the Independent Trustees, voted to approve continuation of the investment advisory agreement for the Fund.
Nature, Extent and Quality of Services
In considering whether to approve the investment advisory and administrative agreement of the Fund, the Board evaluated the nature, extent and quality of services provided to the Fund by the Adviser.
The Board considered the Adviser’s management capabilities and investment process with respect to the types of investments held by the Fund, including the education, experience and number of its investment professionals and other personnel who provide portfolio management, investment research, and similar services to the Fund. In particular, the Board considered the abilities and experience of such personnel in investing in securities, derivatives and other instruments to establish long and short investment exposures to emerging markets, and investing in derivatives to establish short investment exposure to the euro. The Board also took into account the resources dedicated to portfolio management and other services, as well as the compensation methods of the Adviser and other factors, such as the reputation and resources of the Adviser to recruit and retain investment personnel. In addition, the Board considered the time and attention devoted to the Fund by senior management, as well as the infrastructure, operational capabilities and support staff in place to assist in the management of the Fund, including the provision of administrative services.
The Board considered the compliance programs of the Adviser and relevant affiliates thereof. Among other matters, the Board considered compliance and reporting matters relating to personal trading by investment personnel, selective disclosure of portfolio holdings, late trading, frequent trading, portfolio
Eaton Vance
Emerging Markets Debt Opportunities Fund
July 31, 2015
Board of Trustees’ Contract Approval — continued
valuation, business continuity and the allocation of investment opportunities. The Board also considered the responses of the Adviser and its affiliates to requests in recent years from regulatory authorities such as the Securities and Exchange Commission and the Financial Industry Regulatory Authority.
The Board considered shareholder and other administrative services provided or managed by Eaton Vance Management and its affiliates, including transfer agency and accounting services. The Board evaluated the benefits to shareholders of investing in a fund that is a part of a large family of funds, including the ability, in many cases, to exchange an investment among different funds without incurring additional sales charges.
After consideration of the foregoing factors, among others, the Board concluded that the nature, extent and quality of services provided by the Adviser, taken as a whole, are appropriate and consistent with the terms of the investment advisory and administrative agreement.
Fund Performance
The Board compared the Fund’s investment performance to that of comparable funds and appropriate benchmark indices, as well as a customized peer group of similarly managed funds. The Board’s review included comparative performance data for the one-year period ended September 30, 2014 for the Fund. The Board concluded that the performance of the Fund was satisfactory.
Management Fees and Expenses
The Board considered contractual fee rates payable by the Fund for advisory and administrative services (referred to collectively as “management fees”). As part of its review, the Board considered the Fund’s management fees and total expense ratio for the year ended September 30, 2014, as compared to those of comparable funds, before and after giving effect to any undertaking to waive fees or reimburse expenses. The Board also considered factors that had an impact on Fund expense ratios, as identified by management in response to inquiries from the Contract Review Committee, as well as actions taken by management in recent years to reduce expenses at the fund complex level.
After considering the foregoing information, and in light of the nature, extent and quality of the services provided by the Adviser, the Board concluded that the management fees charged for advisory and related services are reasonable.
Profitability
The Board considered the level of profits realized by the Adviser and relevant affiliates thereof in providing investment advisory and administrative services to the Fund and to all Eaton Vance Funds as a group. The Board considered the level of profits realized without regard to revenue sharing or other payments by the Adviser and its affiliates to third parties in respect of distribution services. The Board also considered other direct or indirect benefits received by the Adviser and its affiliates in connection with their relationships with the Fund, including the benefits of research services that may be available to the Adviser as a result of securities transactions effected for the Fund and other investment advisory clients.
The Board concluded that, in light of the foregoing factors and the nature, extent and quality of the services rendered, the profits realized by the Adviser and its affiliates are reasonable.
Economies of Scale
In reviewing management fees and profitability, the Board also considered the extent to which the Adviser and its affiliates, on the one hand, and the Fund, on the other hand, can expect to realize benefits from economies of scale as the assets of the Fund increase. The Board acknowledged the difficulty in accurately measuring the benefits resulting from the economies of scale with respect to the management of any specific fund or group of funds. The Board reviewed data summarizing the increases and decreases in the assets of the Fund and of all Eaton Vance Funds as a group over various time periods, and evaluated the extent to which the total expense ratio of the Fund and the profitability of the Adviser and its affiliates may have been affected by such increases or decreases. Based upon the foregoing, the Board concluded that the Fund currently shares in the benefits from economies of scale. The Board also concluded that, assuming reasonably foreseeable increases in the assets of the Fund, the structure of the advisory fee, which includes breakpoints at several asset levels, will allow the Fund to continue to benefit from economies of scale in the future.
Eaton Vance
Emerging Markets Debt Opportunities Fund
July 31, 2015
Management and Organization
Fund Management. The Directors of Eaton Vance Series Fund, Inc. (the Corporation) are responsible for the overall management and supervision of the Corporation’s affairs. The Directors and officers of the Corporation are listed below. Except as indicated, each individual has held the office shown or other offices in the same company for the last five years. Directors and officers of the Corporation hold indefinite terms of office. The “Noninterested Directors” consist of those Directors who are not “interested persons” of the Corporation, as that term is defined under the 1940 Act. The business address of each Director and officer is Two International Place, Boston, Massachusetts 02110. As used below, “EVC” refers to Eaton Vance Corp., “EV” refers to Eaton Vance, Inc., “EVM” refers to Eaton Vance Management, “BMR” refers to Boston Management and Research and “EVD” refers to Eaton Vance Distributors, Inc. EVC and EV are the corporate parent and trustee, respectively, of EVM and BMR. EVD is the Fund’s principal underwriter and a wholly-owned subsidiary of EVC. Each officer affiliated with Eaton Vance may hold a position with other Eaton Vance affiliates that is comparable to his or her position with EVM listed below. Each Director oversees 178 portfolios in the Eaton Vance Complex (including all master and feeder funds in a master feeder structure). Each officer serves as an officer of certain other Eaton Vance funds. Each Director and officer serves until his or her successor is elected.
| | | | | | |
| Name and Year of Birth | | Position(s) with the
Corporation | | Director
Since(1) | | Principal Occupation(s) and Directorships During Past Five Years and Other Relevant Experience |
Interested Director | | | | | | |
| | | |
Thomas E. Faust Jr. 1958 | | Director | | 2007 | | Chairman, Chief Executive Officer and President of EVC, Director and President of EV, Chief Executive Officer and President of EVM and BMR, and Director of EVD. Trustee and/or officer of 178 registered investment companies. Mr. Faust is an interested person because of his positions with EVM, BMR, EVD, EVC and EV, which are affiliates of the Corporation. Directorships in the Last Five Years.(2) Director of EVC and Hexavest Inc. |
| | | |
| | | | | | |
Noninterested Directors |
| | | |
Scott E. Eston 1956 | | Director | | 2011 | | Private investor. Formerly held various positions at Grantham, Mayo, Van Otterloo and Co., L.L.C. (investment management firm) (1997-2009), including Chief Operating Officer (2002-2009), Chief Financial Officer (1997-2009) and Chairman of the Executive Committee (2002-2008); President and Principal Executive Officer, GMO Trust (open-end registered investment company) (2006-2009). Former Partner, Coopers and Lybrand L.L.P. (now PricewaterhouseCoopers) (public accounting firm) (1987-1997). Directorships in the Last Five Years.(2) None. |
| | | |
Cynthia E. Frost 1961 | | Director | | 2014 | | Private investor. Formerly, Chief Investment Officer of Brown University (university endowment) (2000-2012); Portfolio Strategist for Duke Management Company (university endowment manager) (1995-2000); Managing Director, Cambridge Associates (1989-1995); Consultant, Bain and Company (1987-1989); Senior Equity Analyst, BA Investment Management Company (1983-1985). Directorships in the Last Five Years. None. |
| | | |
George J. Gorman 1952 | | Director | | 2014 | | Principal at George J. Gorman LLC (consulting firm). Formerly, Senior Partner at Ernst & Young LLP (public accounting firm) (1974-2009). Directorships in the Last Five Years. Formerly, Trustee of the Bank of America Money Market Funds Series Trust (2011-2014) and of the Ashmore Funds (2010-2014). |
| | | |
Valerie A. Mosley 1960 | | Director | | 2014 | | Chairwoman and Chief Executive Officer of Valmo Ventures (a consulting and investment firm). Former Partner and Senior Vice President, Portfolio Manager and Investment Strategist at Wellington Management Company, LLP (investment management firm) (1992-2012). Former Chief Investment Officer, PG Corbin Asset Management (1990-1992). Formerly worked in institutional corporate bond sales at Kidder Peabody (1986-1990). Directorships in the Last Five Years.(2) Director of Dynex Capital, Inc. (mortgage REIT) (since 2013). |
| | | |
William H. Park 1947 | | Director | | 2003 | | Private investor. Formerly, Consultant (2012-2014). Formerly, Chief Financial Officer, Aveon Group L.P. (investment management firm) (2010-2011). Formerly, Vice Chairman, Commercial Industrial Finance Corp. (specialty finance company) (2006-2010). Formerly, President and Chief Executive Officer, Prizm Capital Management, LLC (investment management firm) (2002-2005). Formerly, Executive Vice President and Chief Financial Officer, United Asset Management Corporation (investment management firm) (1982-2001). Formerly, Senior Manager, Price Waterhouse (now PricewaterhouseCoopers) (an independent registered public accounting firm) (1972-1981). Directorships in the Last Five Years.(2) None. |
Eaton Vance
Emerging Markets Debt Opportunities Fund
July 31, 2015
Management and Organization — continued
| | | | | | |
| Name and Year of Birth | | Position(s) with the
Corporation | | Director
Since(1) | | Principal Occupation(s) and Directorships During Past Five Years and Other Relevant Experience |
Noninterested Directors (continued) |
| | | |
Helen Frame Peters 1948 | | Director | | 2008 | | Professor of Finance, Carroll School of Management, Boston College. Formerly, Dean, Carroll School of Management, Boston College (2000-2002). Formerly, Chief Investment Officer, Fixed Income, Scudder Kemper Investments (investment management firm) (1998-1999). Formerly, Chief Investment Officer, Equity and Fixed Income, Colonial Management Associates (investment management firm) (1991-1998). Directorships in the Last Five Years.(2) Formerly, Director of BJ’s Wholesale Club, Inc. (wholesale club retailer) (2004-2011). Formerly, Trustee of SPDR Index Shares Funds and SPDR Series Trust (exchange traded funds) (2000-2009). Formerly, Director of Federal Home Loan Bank of Boston (a bank for banks) (2007-2009). |
| | | |
Susan J. Sutherland(3) 1957 | | Director | | 2015 | | Private investor. Formerly, Associate, Counsel and Partner at Skadden, Arps, Slate, Meagher & Flom LLP (law firm) (1982-2013). Directorships in the Last Five Years. Director of Montpelier Re Holdings Ltd. (global provider of customized insurance and reinsurance products) (since 2013). |
| | | |
Harriett Tee Taggart 1948 | | Director | | 2011 | | Managing Director, Taggart Associates (a professional practice firm). Formerly, Partner and Senior Vice President, Wellington Management Company, LLP (investment management firm) (1983-2006). Directorships in the Last Five Years.(2) Director of Albemarle Corporation (chemicals manufacturer) (since 2007) and The Hanover Group (specialty property and casualty insurance company) (since 2009). Formerly, Director of Lubrizol Corporation (specialty chemicals) (2007-2011). |
| | | |
Ralph F. Verni 1943 | | Chairman of the Board and Director | | 2007 (Chairman);
2005 (Director) | | Consultant and private investor. Formerly, Chief Investment Officer (1982-1992), Chief Financial Officer (1988-1990) and Director (1982-1992), New England Life. Formerly, Chairperson, New England Mutual Funds (1982-1992). Formerly, President and Chief Executive Officer, State Street Management & Research (1992-2000). Formerly, Chairperson, State Street Research Mutual Funds (1992-2000). Formerly, Director, W.P. Carey, LLC (1998-2004) and First Pioneer Farm Credit Corp. (2002-2006). Directorships in the Last Five Years.(2) None. |
| | | |
| | | | | | |
Principal Officers who are not Directors |
| Name and Year of Birth | | Position(s) with the
Corporation | | Officer Since(4) | | Principal Occupation(s) During Past Five Years |
| | | |
Payson F. Swaffield 1956 | | President | | 2003 | | Vice President and Chief Income Investment Officer of EVM and BMR. |
| | | |
Maureen A. Gemma 1960 | | Vice President, Secretary and Chief Legal Officer | | 2005 | | Vice President of EVM and BMR. |
| | | |
James F. Kirchner 1967 | | Treasurer | | 2007 | | Vice President of EVM and BMR. |
| | | |
Paul M. O’Neil 1953 | | Chief Compliance Officer | | 2004 | | Vice President of EVM and BMR. |
| (1) | Year first appointed to serve as Director for a fund in the Eaton Vance family of funds. Each Director has served continuously since appointment unless indicated otherwise. |
| (2) | During their respective tenures, the Directors (except for Mmes. Frost and Sutherland and Mr. Gorman) also served as Board members of one or more of the following funds (which operated in the years noted): eUnitsTM 2 Year U.S. Market Participation Trust: Upside to Cap / Buffered Downside (launched in 2012 and terminated in 2014); eUnitsTM 2 Year U.S. Market Participation Trust II: Upside to Cap / Buffered Downside (launched in 2012 and terminated in 2014); Eaton Vance Credit Opportunities Fund (launched in 2005 and terminated in 2010); and Eaton Vance National Municipal Income Trust (launched in 1998 and terminated in 2009). However, Ms. Mosley did not serve as a Board member of eUnitsTM 2 Year U.S. Market Participation Trust: Upside to Cap / Buffered Downside (launched in 2012 and terminated in 2014). |
Eaton Vance
Emerging Markets Debt Opportunities Fund
July 31, 2015
Management and Organization — continued
| (3) | Ms. Sutherland began serving as a Director effective May 1, 2015. |
| (4) | Year first elected to serve as officer of a fund in the Eaton Vance family of funds when the officer has served continuously. Otherwise, year of most recent election as an officer of a fund in the Eaton Vance family of funds. Titles may have changed since initial election. |
The SAI for the Fund includes additional information about the Directors and officers of the Fund and can be obtained without charge on Eaton Vance’s website at www.eatonvance.com or by calling 1-800-262-1122.
Eaton Vance Funds
IMPORTANT NOTICES
Privacy. The Eaton Vance organization is committed to ensuring your financial privacy. Each of the financial institutions identified below has in effect the following policy (“Privacy Policy”) with respect to nonpublic personal information about its customers:
| • | | Only such information received from you, through application forms or otherwise, and information about your Eaton Vance fund transactions will be collected. This may include information such as name, address, social security number, tax status, account balances and transactions. |
| • | | None of such information about you (or former customers) will be disclosed to anyone, except as permitted by law (which includes disclosure to employees necessary to service your account). In the normal course of servicing a customer’s account, Eaton Vance may share information with unaffiliated third parties that perform various required services such as transfer agents, custodians and broker-dealers. |
| • | | Policies and procedures (including physical, electronic and procedural safeguards) are in place that are designed to protect the confidentiality of such information. |
| • | | We reserve the right to change our Privacy Policy at any time upon proper notification to you. Customers may want to review our Privacy Policy periodically for changes by accessing the link on our homepage: www.eatonvance.com. |
Our pledge of privacy applies to the following entities within the Eaton Vance organization: the Eaton Vance Family of Funds, Eaton Vance Management, Eaton Vance Investment Counsel, Eaton Vance Distributors, Inc., Eaton Vance Trust Company, Eaton Vance Management’s Real Estate Investment Group and Boston Management and Research. In addition, our Privacy Policy applies only to those Eaton Vance customers who are individuals and who have a direct relationship with us. If a customer’s account (i.e., fund shares) is held in the name of a third-party financial advisor/broker-dealer, it is likely that only such advisor’s privacy policies apply to the customer. This notice supersedes all previously issued privacy disclosures. For more information about Eaton Vance’s Privacy Policy, please call 1-800-262-1122.
Delivery of Shareholder Documents. The Securities and Exchange Commission (SEC) permits funds to deliver only one copy of shareholder documents, including prospectuses, proxy statements and shareholder reports, to fund investors with multiple accounts at the same residential or post office box address. This practice is often called “householding” and it helps eliminate duplicate mailings to shareholders. Eaton Vance, or your financial advisor, may household the mailing of your documents indefinitely unless you instruct Eaton Vance, or your financial advisor, otherwise. If you would prefer that your Eaton Vance documents not be householded, please contact Eaton Vance at 1-800-262-1122, or contact your financial advisor. Your instructions that householding not apply to delivery of your Eaton Vance documents will be effective within 30 days of receipt by Eaton Vance or your financial advisor.
Portfolio Holdings. Each Eaton Vance Fund and its underlying Portfolio(s) (if applicable) will file a schedule of portfolio holdings on Form N-Q with the SEC for the first and third quarters of each fiscal year. The Form N-Q will be available on the Eaton Vance website at www.eatonvance.com, by calling Eaton Vance at 1-800-262-1122 or in the EDGAR database on the SEC’s website at www.sec.gov. Form N-Q may also be reviewed and copied at the SEC’s public reference room in Washington, D.C. (call 1-800-732-0330 for information on the operation of the public reference room).
Proxy Voting. From time to time, funds are required to vote proxies related to the securities held by the funds. The Eaton Vance Funds or their underlying Portfolios (if applicable) vote proxies according to a set of policies and procedures approved by the Funds’ and Portfolios�� Boards. You may obtain a description of these policies and procedures and information on how the Funds or Portfolios voted proxies relating to portfolio securities during the most recent 12-month period ended June 30, without charge, upon request, by calling 1-800-262-1122 and by accessing the SEC’s website at www.sec.gov.
Investment Adviser and Administrator
Eaton Vance Management
Two International Place
Boston, MA 02110
Principal Underwriter*
Eaton Vance Distributors, Inc.
Two International Place
Boston, MA 02110
(617) 482-8260
Custodian
State Street Bank and Trust Company
State Street Financial Center, One Lincoln Street
Boston, MA 02111
Transfer Agent
BNY Mellon Investment Servicing (US) Inc.
Attn: Eaton Vance Funds
P.O. Box 9653
Providence, RI 02940-9653
(800) 262-1122
Independent Registered Public Accounting Firm
Deloitte & Touche LLP
200 Berkeley Street
Boston, MA 02116-5022
Fund Offices
Two International Place
Boston, MA 02110
| * | FINRA BrokerCheck. Investors may check the background of their Investment Professional by contacting the Financial Industry Regulatory Authority (FINRA). FINRA BrokerCheck is a free tool to help investors check the professional background of current and former FINRA-registered securities firms and brokers. FINRA BrokerCheck is available by calling 1-800-289-9999 and at www.FINRA.org. The FINRA BrokerCheck brochure describing this program is available to investors at www.FINRA.org. |
7012 7.31.15
Item 2. Code of Ethics
The registrant has adopted a code of ethics applicable to its Principal Executive Officer, Principal Financial Officer and Principal Accounting Officer. The registrant undertakes to provide a copy of such code of ethics to any person upon request, without charge, by calling 1-800-262-1122.
Item 3. Audit Committee Financial Expert
The registrant’s Board has designated William H. Park, an independent trustee, as its audit committee financial expert. Mr. Park is a certified public accountant who is a private investor. Previously, he served as a consultant, as the Chief Financial Officer of Aveon Group, L.P. (an investment management firm), as the Vice Chairman of Commercial Industrial Finance Corp. (specialty finance company), as President and Chief Executive Officer of Prizm Capital Management, LLC (investment management firm), as Executive Vice President and Chief Financial Officer of United Asset Management Corporation (an institutional investment management firm) and as a Senior Manager at Price Waterhouse (now PricewaterhouseCoopers) (an independent registered public accounting firm).
Item 4. Principal Accountant Fees and Services
(a)-(d)
Eaton Vance Emerging Markets Debt Opportunities Fund (formerly, Eaton Vance Institutional Emerging Markets Debt Fund) (the “Fund”) is the only series of Eaton Vance Series Fund, Inc. (the “Corporation”), a Maryland corporation. The Corporation is registered under the Investment Company Act of 1940 as an open-end management investment company. This Form N-CSR relates to the Fund’s annual report.
The following table presents the aggregate fees billed to the Fund for the Fund’s fiscal years ended July 31, 2014 and July 31, 2015 by the Fund’s principal accountant, Deloitte & Touche LLP (“D&T”), for professional services rendered for the audit of the Fund’s annual financial statements and fees billed for other services rendered by D&T during such period.
Eaton Vance Emerging Markets Debt Opportunities Fund (formerly, Eaton Vance Institutional Emerging Markets Debt Fund)
| | | | | | | | |
Fiscal Years Ended | | 7/31/14 | | | 7/31/15 | |
Audit Fees | | $ | 71,670 | | | $ | 81,820 | |
Audit-Related Fees(1) | | $ | 0 | | | $ | 0 | |
Tax Fees(2) | | $ | 17,040 | | | $ | 17,016 | |
All Other Fees(3) | | $ | 0 | | | $ | 0 | |
| | | | | | | | |
Total | | $ | 88,710 | | | $ | 98,836 | |
| | | | | | | | |
| (1) | Audit-related fees consist of the aggregate fees billed for assurance and related services that are reasonably related to the performance of the audit of the registrant’s financial statements and are not reported under the category of audit fees. |
| (2) | Tax fees consist of the aggregate fees billed for professional services rendered by the principal accountant relating to tax compliance, tax advice, and tax planning and specifically include fees for tax return preparation and other related tax compliance/planning matters. |
| (3) | All other fees consist of the aggregate fees billed for products and services provided by the principal accountant other than audit, audit-related, and tax services. |
(e)(1) The registrant’s audit committee has adopted policies and procedures relating to the pre-approval of services provided by the registrant’s principal accountant (the “Pre-Approval Policies”). The Pre-Approval Policies establish a framework intended to assist the audit committee in the proper discharge of its pre-approval responsibilities. As a general matter, the Pre-Approval Policies (i) specify certain types of audit, audit-related, tax, and other services determined to be pre-approved by the audit committee; and (ii) delineate specific procedures governing the mechanics of the pre-approval process, including the approval and monitoring of audit and non-audit service fees. Unless a service is specifically pre-approved under the Pre-Approval Policies, it must be separately pre-approved by the audit committee.
The Pre-Approval Policies and the types of audit and non-audit services pre-approved therein must be reviewed and ratified by the registrant’s audit committee at least annually. The registrant’s audit committee maintains full responsibility for the appointment, compensation, and oversight of the work of the registrant’s principal accountant.
(e)(2) No services described in paragraphs (b)-(d) above were approved by the registrant’s audit committee pursuant to the “de minimis exception” set forth in Rule 2-01(c)(7)(i)(C) of Regulation S-X.
(f) Not applicable.
(g) The following table presents (i) the aggregate non-audit fees (i.e., fees for audit-related, tax, and other services) billed by D&T for the Fund’s fiscal years ended July 31, 2014 and July 31, 2015; and (ii) the aggregate non-audit fees (i.e., fees for audit-related, tax, and other services) billed to the Eaton Vance organization by D&T for the Series.
| | | | | | | | |
Fiscal Years Ended | | 7/31/14 | | | 7/31/15 | |
Registrant | | $ | 17,040 | | | $ | 17,016 | |
Eaton Vance(1) | | $ | 397,473 | | | $ | 46,000 | |
| (1) | The investment adviser to the Fund, as well as any of its affiliates that provide ongoing services to the Fund, are subsidiaries of Eaton Vance Corp. |
(h) The registrant’s audit committee has considered whether the provision by the registrant’s principal accountant of non-audit services to the registrant’s investment adviser and any entity controlling, controlled by, or under common control with the adviser that provides ongoing services to the registrant that were not pre-approved pursuant to Rule 2-01(c)(7)(ii) of Regulation S-X is compatible with maintaining the principal accountant’s independence.
Item 5. Audit Committee of Listed Registrants
Not applicable.
Item 6. Schedule of Investments
Please see schedule of investments contained in the Report to Stockholders included under Item 1 of this Form N-CSR.
Item 7. Disclosure of Proxy Voting Policies and Procedures for Closed-End Management Investment Companies
Not applicable.
Item 8. Portfolio Managers of Closed-End Management Investment Companies
Not applicable.
Item 9. Purchases of Equity Securities by Closed-End Management Investment Company and Affiliated Purchasers
Not applicable.
Item 10. Submission of Matters to a Vote of Security Holders
No material changes.
Item 11. Controls and Procedures
(a) It is the conclusion of the registrant’s principal executive officer and principal financial officer that the effectiveness of the registrant’s current disclosure controls and procedures (such disclosure controls and procedures having been evaluated within 90 days of the date of this filing) provide reasonable assurance that the information required to be disclosed by the registrant has been recorded, processed, summarized and reported within the time period specified in the Commission’s rules and forms and that the information required to be disclosed by the registrant has been accumulated and communicated to the registrant’s principal executive officer and principal financial officer in order to allow timely decisions regarding required disclosure.
(b) There have been no changes in the registrant’s internal controls over financial reporting during the second fiscal quarter of the period covered by this report that has materially affected, or is reasonably likely to materially affect, the registrant’s internal control over financial reporting.
Item 12. Exhibits
| | |
| (a)(1) | | Registrant’s Code of Ethics – Not applicable (please see Item 2). |
| |
| (a)(2)(i) | | Treasurer’s Section 302 certification. |
| |
| (a)(2)(ii) | | President’s Section 302 certification. |
| |
| (b) | | Combined Section 906 certification. |
Signatures
Pursuant to the requirements of the Securities Exchange Act of 1934 and the Investment Company Act of 1940, the registrant has duly caused this report to be signed on its behalf by the undersigned, thereunto duly authorized.
Eaton Vance Series Fund, Inc.
| | |
| By: | | /s/ Payson F. Swaffield |
| | Payson F. Swaffield |
| | President |
| |
| Date: | | September 15, 2015 |
Pursuant to the requirements of the Securities Exchange Act of 1934 and the Investment Company Act of 1940, this report has been signed below by the following persons on behalf of the registrant and in the capacities and on the dates indicated.
| | |
| By: | | /s/ James F. Kirchner |
| | James F. Kirchner |
| | Treasurer |
| |
| Date: | | September 15, 2015 |
| |
| By: | | /s/ Payson F. Swaffield |
| | Payson F. Swaffield |
| | President |
| |
| Date: | | September 15, 2015 |