UNITED STATES
SECURITIES AND EXCHANGE COMMISSION
Washington, D.C. 20549
Form N-CSR
CERTIFIED SHAREHOLDER REPORT OF REGISTERED
MANAGEMENT INVESTMENT COMPANIES
Investment Company Act File Number: 811-22714
Eaton Vance Series Fund, Inc.
(Exact Name of Registrant as Specified in Charter)
Two International Place, Boston, Massachusetts 02110
(Address of Principal Executive Offices)
Deidre E. Walsh
Two International Place, Boston, Massachusetts 02110
(Name and Address of Agent for Services)
(617) 482-8260
(Registrant’s Telephone Number)
July 31
Date of Fiscal Year End
January 31, 2022
Date of Reporting Period
Item 1. Reports to Stockholders

Eaton Vance
Emerging Markets Debt Opportunities Fund
Semiannual Report
January 31, 2022

Commodity Futures Trading Commission Registration. The Commodity Futures Trading Commission (“CFTC”) has adopted regulations that subject registered investment companies and advisers to regulation by the CFTC if a fund invests more than a prescribed level of its assets in certain CFTC-regulated instruments (including futures, certain options and swap agreements) or markets itself as providing investment exposure to such instruments. The adviser is registered with the CFTC as a commodity pool operator with respect to its management of the Fund. As the commodity pool operator of the Fund, the adviser has claimed relief under the Commodity Exchange Act from certain reporting and recordkeeping requirements. The adviser is also registered as a commodity trading advisor.
Fund shares are not insured by the FDIC and are not deposits or other obligations of, or guaranteed by, any depository institution. Shares are subject to investment risks, including possible loss of principal invested.
This report must be preceded or accompanied by a current summary prospectus or prospectus. Before investing, investors should consider carefully the investment objective, risks, and charges and expenses of a mutual fund. This and other important information is contained in the summary prospectus and prospectus, which can be obtained from a financial intermediary. Prospective investors should read the prospectus carefully before investing. For further information, please call 1-800-262-1122.
Semiannual Report January 31, 2022
Eaton Vance
Emerging Markets Debt Opportunities Fund
Eaton Vance
Emerging Markets Debt Opportunities Fund
January 31, 2022
Performance1,2
Portfolio Manager(s) John R. Baur, Akbar Causer and Brian Shaw, CFA
| | | | | | | | | | | | | | | | | | | | | | | | |
| % Average Annual Total Returns | | Class
Inception Date | | | Performance
Inception Date | | | Six Months | | | One Year | | | Five Years | | | Since Inception | |
| | | | | | |
Class A at NAV | | | 09/03/2015 | | | | 02/04/2013 | | | | –0.99 | % | | | –0.49 | % | | | 6.10 | % | | | 3.93 | % |
Class A with 4.75% Maximum Sales Charge | | | — | | | | — | | | | –5.68 | | | | –5.27 | | | | 5.07 | | | | 3.37 | |
Class I at NAV | | | 09/03/2015 | | | | 02/04/2013 | | | | –0.74 | | | | –0.10 | | | | 6.40 | | | | 4.16 | |
Class R6 at NAV | | | 02/04/2013 | | | | 02/04/2013 | | | | –0.84 | | | | –0.08 | | | | 6.45 | | | | 4.15 | |
|
| |
| | | | | | |
J. P. Morgan EMB (JEMB) Hard Currency/Local Currency 50-50 Index | | | — | | | | — | | | | –4.21 | % | | | –4.95 | % | | | 3.36 | % | | | 1.62 | % |
| | | | | | |
| % Total Annual Operating Expense Ratios3 | | | | | | | | | | | Class A | | | Class I | | | Class R6 | |
| | | | | | |
| | | | | | | | | | | | | | | 1.11 | % | | | 0.86 | % | | | 0.81 | % |
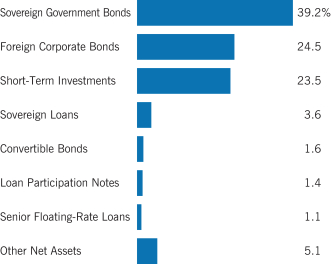
Fund Profile
Asset Allocation (% of net assets)4
Foreign Currency Exposure (% of net assets)5
| | | | |
| |
Egypt | | | 9.1 | % |
| |
Ukraine | | | 6.5 | |
| |
Hungary | | | 4.9 | |
| |
Indonesia | | | 4.0 | |
| |
Poland | | | 3.9 | |
| |
Malaysia | | | 2.5 | |
| |
Serbia | | | 2.3 | |
| |
Uzbekistan | | | 2.2 | |
| |
Russia | | | 2.0 | |
| |
Czech Republic | | | 2.0 | |
| |
Uganda | | | 2.0 | |
| |
China | | | 1.6 | |
| |
India | | | 1.5 | |
| |
Zambia | | | 1.4 | |
| |
Peru | | | 1.2 | |
| |
Other | | | 1.7 | * |
| |
China | | | –1.6 | |
| |
Euro | | | –13.4 | |
| |
Total Long | | | 49.0 | |
| |
Total Short | | | –15.2 | |
| |
Total Net | | | 33.8 | |
| * | Includes amounts each less than 1.0% or –1.0%, as applicable. |
See Endnotes and Additional Disclosures in this report.
Past performance is no guarantee of future results. Returns are historical and are calculated by determining the percentage change in net asset value (NAV) or offering price (as applicable) with all distributions reinvested. Investment return and principal value will fluctuate so that shares, when redeemed, may be worth more or less than their original cost. Performance for periods less than or equal to one year is cumulative. Performance is for the stated time period only; due to market volatility, current Fund performance may be lower or higher than the quoted return. For performance as of the most recent month-end, please refer to eatonvance.com.
Eaton Vance
Emerging Markets Debt Opportunities Fund
January 31, 2022
Endnotes and Additional Disclosures
| 1 | J.P. Morgan EMB (JEMB) Hard Currency/Local Currency 50-50 Index is a blended index comprised of 25% J.P. Morgan Emerging Markets Bond Index (EMBI) Global Diversified, 25% J.P. Morgan Corporate Emerging Markets Bond Index (CEMBI) Broad Diversified, and 50% J.P. Morgan Government Bond Index: Emerging Markets Global Diversified (JPM GBI-EM GD) (Unhedged). J.P. Morgan Emerging Markets Bond Index (EMBI) Global Diversified is a market-cap weighted index that measures USD-denominated Brady Bonds, Eurobonds, and traded loans issued by sovereign entities. J.P. Morgan Corporate Emerging Markets Bond Index (CEMBI) Broad Diversified is an unmanaged index of USD-denominated emerging market corporate bonds. J.P. Morgan Government Bond Index: Emerging Markets Global Diversified (JPM GBI-EM GD) (Unhedged) is an unmanaged index of local-currency bonds with maturities of more than one year issued by emerging markets governments. Information has been obtained from sources believed to be reliable but J.P. Morgan does not warrant its completeness or accuracy. The Index is used with permission. The Index may not be copied, used, or distributed without J.P. Morgan’s prior written approval. Copyright 2022, J.P. Morgan Chase & Co. All rights reserved. Unless otherwise stated, index returns do not reflect the effect of any applicable sales charges, commissions, expenses, taxes or leverage, as applicable. It is not possible to invest directly in an index. |
| 2 | Total Returns at net asset value (NAV) do not include applicable sales charges. If sales charges were deducted, the returns would be lower. Total Returns shown with maximum sales charge reflect the stated maximum sales charge. Unless otherwise stated, performance does not reflect the deduction of taxes on Fund distributions or redemptions of Fund shares. |
Performance prior to the inception date of a class may be linked to the performance of an older class of the Fund. This linked performance is adjusted for any applicable sales charge, but is not adjusted for class expense differences. If adjusted for such differences, the performance would be different. The performance of Class A and Class I is linked to Class R6. Performance since inception for an index, if presented, is the performance since the Fund’s or oldest share class’ inception, as applicable. Performance presented in the Financial Highlights included in the financial statements is not linked.
| 3 | Source: Fund prospectus. |
| 4 | Other Net Assets represents other assets less liabilities and includes any investment type that represents less than 1% of net assets. |
| 5 | Currency exposures include all foreign exchange denominated assets, currency derivatives and commodities (including commodity derivatives). Total exposures may exceed 100% due to implicit leverage created by derivatives. |
Fund profile subject to change due to active management.
Eaton Vance
Emerging Markets Debt Opportunities Fund
January 31, 2022
Fund Expenses
Example: As a Fund shareholder, you incur two types of costs: (1) transaction costs, including sales charges (loads) on purchases and redemption fees (if applicable); and (2) ongoing costs, including management fees; distribution and/or service fees; and other Fund expenses. This Example is intended to help you understand your ongoing costs (in dollars) of Fund investing and to compare these costs with the ongoing costs of investing in other mutual funds. The Example is based on an investment of $1,000 invested at the beginning of the period and held for the entire period (August 1, 2021 – January 31, 2022).
Actual Expenses: The first section of the table below provides information about actual account values and actual expenses. You may use the information in this section, together with the amount you invested, to estimate the expenses that you paid over the period. Simply divide your account value by $1,000 (for example, an $8,600 account value divided by $1,000 = 8.6), then multiply the result by the number in the first section under the heading entitled “Expenses Paid During Period” to estimate the expenses you paid on your account during this period.
Hypothetical Example for Comparison Purposes: The second section of the table below provides information about hypothetical account values and hypothetical expenses based on the actual Fund expense ratio and an assumed rate of return of 5% per year (before expenses), which is not the actual Fund return. The hypothetical account values and expenses may not be used to estimate the actual ending account balance or expenses you paid for the period. You may use this information to compare the ongoing costs of investing in your Fund and other funds. To do so, compare this 5% hypothetical example with the 5% hypothetical examples that appear in the shareholder reports of the other funds.
Please note that the expenses shown in the table are meant to highlight your ongoing costs only and do not reflect any transactional costs, such as sales charges (loads) or redemption fees (if applicable). Therefore, the second section of the table is useful in comparing ongoing costs only, and will not help you determine the relative total costs of owning different funds. In addition, if these transactional costs were included, your costs would be higher.
| | | | | | | | | | | | | | | | |
| | | Beginning
Account Value
(8/1/21) | | | Ending
Account Value
(1/31/22) | | | Expenses Paid
During Period*
(8/1/21 – 1/31/22) | | | Annualized
Expense
Ratio | |
| | | | |
Actual | | | | | | | | | | | | | | | | |
Class A | | $ | 1,000.00 | | | $ | 990.10 | | | $ | 5.47 | | | | 1.09 | % |
Class I | | $ | 1,000.00 | | | $ | 992.60 | | | $ | 4.27 | | | | 0.85 | % |
Class R6 | | $ | 1,000.00 | | | $ | 991.60 | | | $ | 3.92 | | | | 0.78 | % |
| | | | | |
Hypothetical | | | | | | | | | | | | | | | | |
(5% return per year before expenses) | | | | | | | | | | | | | | | | |
Class A | | $ | 1,000.00 | | | $ | 1,019.71 | | | $ | 5.55 | | | | 1.09 | % |
Class I | | $ | 1,000.00 | | | $ | 1,020.92 | | | $ | 4.33 | | | | 0.85 | % |
Class R6 | | $ | 1,000.00 | | | $ | 1,021.27 | | | $ | 3.97 | | | | 0.78 | % |
| * | Expenses are equal to the Fund’s annualized expense ratio for the indicated Class, multiplied by the average account value over the period, multiplied by 184/365 (to reflect the one-half year period). The Example assumes that the $1,000 was invested at the net asset value per share determined at the close of business on July 31, 2021. |
Eaton Vance
Emerging Markets Debt Opportunities Fund
January 31, 2022
Portfolio of Investments (Unaudited)
| | | | | | | | | | |
| Convertible Bonds — 1.6% | |
| Security | | Principal
Amount
(000’s omitted) | | | Value | |
|
| Bermuda — 1.2% | |
| | | |
Liberty Latin America, Ltd., 2.00%, 7/15/24 | | USD | | | 15,056 | | | $ | 14,510,220 | |
| |
Total Bermuda | | | $ | 14,510,220 | |
|
| India — 0.4% | |
| | | |
Indiabulls Housing Finance, Ltd., 4.50%, 9/28/26(1) | | USD | | | 4,965 | | | $ | 4,728,766 | |
| |
Total India | | | $ | 4,728,766 | |
| |
Total Convertible Bonds
(identified cost $14,877,153) | | | $ | 19,238,986 | |
|
| Foreign Corporate Bonds — 24.5% | |
| Security | | | | Principal
Amount
(000’s omitted) | | | Value | |
|
| Argentina — 1.9% | |
| | | |
Generacion Mediterranea S.A./Central Termica Roca S.A., 15.00%, 5/5/23(2)(3) | | USD | | | 938 | | | $ | 930,468 | |
| | | |
IRSA Propiedades Comerciales S.A., 8.75%, 3/23/23(1) | | USD | | | 5,591 | | | | 5,430,510 | |
| | | |
Telecom Argentina S.A., 8.50%, 8/6/25(1) | | USD | | | 3,876 | | | | 3,736,987 | |
| | | |
Transportadora de Gas del Sur S.A., 6.75%, 5/2/25(1) | | USD | | | 3,977 | | | | 3,602,824 | |
|
| YPF S.A.: | |
| | | |
4.00% to 1/1/23, 2/12/26(2)(4) | | USD | | | 6,908 | | | | 5,766,674 | |
| | | |
9.00% to 1/1/23, 2/12/26(1)(4) | | USD | | | 4,838 | | | | 4,038,959 | |
| |
Total Argentina | | | $ | 23,506,422 | |
|
| Armenia — 0.9% | |
| | | |
Ardshinbank CJSC Via Dilijan Finance BV, 6.50%, 1/28/25(1) | | USD | | | 10,926 | | | $ | 10,680,165 | |
| |
Total Armenia | | | $ | 10,680,165 | |
|
| Belarus — 0.6% | |
| | | |
Eurotorg, LLC Via Bonitron DAC, 9.00%, 10/22/25(1) | | USD | | | 6,686 | | | $ | 6,786,290 | |
| |
Total Belarus | | | $ | 6,786,290 | |
|
| Brazil — 4.6% | |
| | | |
Braskem America Finance Co., 7.125%, 7/22/41(1) | | USD | | | 3,461 | | | $ | 4,172,339 | |
| | | |
Braskem Netherlands Finance BV, 5.875%, 1/31/50(1) | | USD | | | 9,192 | | | | 10,030,862 | |
| | | |
Guara Norte S.a.r.l., 5.198%, 6/15/34(1) | | USD | | | 2,329 | | | | 2,177,816 | |
| | | | | | | | | | |
| Security | | | | Principal
Amount
(000’s omitted) | | | Value | |
|
| Brazil (continued) | |
| | | |
MC Brazil Downstream Trading S.a.r.l., 7.25%, 6/30/31(2) | | USD | | | 5,326 | | | $ | 5,115,490 | |
| | | |
MV24 Capital BV, 6.748%, 6/1/34(1) | | USD | | | 722 | | | | 721,741 | |
| | | |
Natura Cosmeticos S.A., 4.125%, 5/3/28(1) | | USD | | | 9,757 | | | | 9,513,075 | |
|
| Odebrecht Offshore Drilling Finance, Ltd.: | |
| | | |
6.72%, 12/1/22(2) | | USD | | | 219 | | | | 216,411 | |
| | | |
6.72%, 12/1/22(1) | | USD | | | 3,103 | | | | 3,072,352 | |
| | | |
Oi Movel S.A., 8.75%, 7/30/26(1) | | USD | | | 9,352 | | | | 9,480,590 | |
| | | |
Petrobras Global Finance BV, 6.90%, 3/19/49 | | USD | | | 7,520 | | | | 7,674,799 | |
| | | |
Vale S.A., 2.762%(5)(6) | | BRL | | | 55,335 | | | | 5,250,279 | |
| |
Total Brazil | | | $ | 57,425,754 | |
|
| Bulgaria — 0.4% | |
| | | |
Eurohold Bulgaria AD, 6.50%, 12/7/22(1) | | EUR | | | 4,634 | | | $ | 5,154,391 | |
| |
Total Bulgaria | | | $ | 5,154,391 | |
|
| China — 1.0% | |
| | | |
KWG Group Holdings, Ltd., 7.875%, 9/1/23(1) | | USD | | | 2,017 | | | $ | 1,280,795 | |
| | | |
Shimao Group Holdings, Ltd., 5.60%, 7/15/26(1) | | USD | | | 3,700 | | | | 1,720,500 | |
|
| Sunac China Holdings, Ltd.: | |
| | | |
6.50%, 7/9/23(1) | | USD | | | 2,000 | | | | 1,235,000 | |
| | | |
8.35%, 4/19/23(1) | | USD | | | 2,800 | | | | 1,792,000 | |
|
| Times China Holdings, Ltd.: | |
| | | |
5.55%, 6/4/24(1) | | USD | | | 8,252 | | | | 4,068,236 | |
| | | |
6.75%, 7/16/23(1) | | USD | | | 3,803 | | | | 1,968,053 | |
| |
Total China | | | $ | 12,064,584 | |
|
| Colombia — 0.1% | |
|
| Gran Tierra Energy International Holdings, Ltd.: | |
| | | |
6.25%, 2/15/25(2) | | USD | | | 632 | | | $ | 584,761 | |
| | | |
6.25%, 2/15/25(1) | | USD | | | 1,243 | | | | 1,150,092 | |
| |
Total Colombia | | | $ | 1,734,853 | |
|
| El Salvador — 0.3% | |
| | | |
AES El Salvador Trust II, 6.75%, 3/28/23(1) | | USD | | | 4,674 | | | $ | 4,149,250 | |
| |
Total El Salvador | | | $ | 4,149,250 | |
|
| Georgia — 1.2% | |
|
| Georgia Capital JSC: | |
| | | |
6.125%, 3/9/24(2) | | USD | | | 324 | | | $ | 327,969 | |
| | | |
6.125%, 3/9/24(1) | | USD | | | 3,782 | | | | 3,828,329 | |
| | | | |
| | 5 | | See Notes to Financial Statements. |
Eaton Vance
Emerging Markets Debt Opportunities Fund
January 31, 2022
Portfolio of Investments (Unaudited) — continued
| | | | | | | | | | |
| Security | | | | Principal
Amount
(000’s omitted) | | | Value | |
|
| Georgia (continued) | |
| | |
| Silknet JSC: | | | | | | |
| | | |
8.375%, 1/31/27(1) | | USD | | | 4,670 | | | $ | 4,722,537 | |
| | | |
11.00%, 4/2/24(1) | | USD | | | 508 | | | | 539,184 | |
| | | |
TBC Bank JSC, 8.894% to 11/6/26(1)(5)(7) | | USD | | | 4,741 | | | | 4,782,484 | |
| |
Total Georgia | | | $ | 14,200,503 | |
|
| Honduras — 0.5% | |
| | | |
Inversiones Atlantida S.A., 7.50%, 5/19/26(1) | | USD | | | 6,190 | | | $ | 6,302,627 | |
| |
Total Honduras | | | $ | 6,302,627 | |
|
| India — 0.7% | |
| | | |
JSW Infrastructure, Ltd., 4.95%, 1/21/29(1) | | USD | | | 8,087 | | | $ | 8,040,184 | |
| |
Total India | | | $ | 8,040,184 | |
|
| Indonesia — 0.6% | |
|
| Alam Sutera Realty Tbk PT: | |
| | | |
6.00%, (6.00% cash or 6.25% PIK), 5/2/24(8) | | USD | | | 962 | | | $ | 819,090 | |
| | | |
6.25%, (6.25% cash or 6.50% PIK), 11/2/25(1)(8) | | USD | | | 9,159 | | | | 7,095,752 | |
| |
Total Indonesia | | | $ | 7,914,842 | |
|
| Mexico — 2.6% | |
| | | |
Alpha Capital, S.A.S. (Debtor-In-Possession Note), 10.00%, 2/5/22(2)(8) | | USD | | | 471 | | | $ | 446,354 | |
|
| Alpha Holding S.A. de CV: | |
| | | |
9.00%, 2/10/25(1)(9) | | USD | | | 9,319 | | | | 1,106,631 | |
| | | |
10.00%, 12/19/22(1)(9) | | USD | | | 5,835 | | | | 751,315 | |
| | | |
Braskem Idesa SAPI, 7.45%, 11/15/29(1) | | USD | | | 11,342 | | | | 11,654,189 | |
| | | |
Grupo Kaltex S.A. de CV, 8.875%, 4/11/22(1) | | USD | | | 7,809 | | | | 7,564,539 | |
|
| Petroleos Mexicanos: | |
| | | |
6.75%, 9/21/47 | | USD | | | 12,775 | | | | 10,980,623 | |
| | | |
7.19%, 9/12/24(2) | | MXN | | | 1,420 | | | | 65,552 | |
| |
Total Mexico | | | $ | 32,569,203 | |
|
| Moldova — 0.5% | |
| | | |
Aragvi Finance International DAC, 8.45%, 4/29/26(1) | | USD | | | 5,608 | | | $ | 5,684,560 | |
| |
Total Moldova | | | $ | 5,684,560 | |
|
| Nigeria — 1.1% | |
| | | |
IHS Holding, Ltd., 5.625%, 11/29/26(1) | | USD | | | 4,685 | | | $ | 4,738,292 | |
| | | |
SEPLAT Petroleum Development Co. PLC, 7.75%, 4/1/26(1) | | USD | | | 8,706 | | | | 8,716,882 | |
| |
Total Nigeria | | | $ | 13,455,174 | |
| | | | | | | | | | |
| Security | | | | Principal
Amount
(000’s omitted) | | | Value | |
|
| Paraguay — 0.6% | |
| | | |
Frigorifico Concepcion S.A., 7.70%, 7/21/28(2) | | USD | | | 7,960 | | | $ | 7,844,779 | |
| |
Total Paraguay | | | $ | 7,844,779 | |
|
| Peru — 1.0% | |
| | | |
PetroTal Corp., 12.00%, 2/16/24(1)(2) | | USD | | | 5,650 | | | $ | 5,932,500 | |
| | | |
Telefonica del Peru SAA, 7.375%, 4/10/27(1) | | PEN | | | 29,500 | | | | 6,982,861 | |
| |
Total Peru | | | $ | 12,915,361 | |
|
| Russia — 0.9% | |
| | | |
Hacienda Investments, Ltd. Via DME Airport DAC, 5.35%, 2/8/28(1) | | USD | | | 3,242 | | | $ | 3,135,273 | |
| | | |
Tinkoff Bank JSC Via TCS Finance, Ltd.,
6.00% to 12/20/26(1)(5)(7) | | USD | | | 9,139 | | | | 8,348,477 | |
| |
Total Russia | | | $ | 11,483,750 | |
|
| Saint Lucia — 0.4% | |
| | | |
Digicel International Finance, Ltd./Digicel Holdings Bermuda, Ltd., 8.75%, 5/25/24(1) | | USD | | | 4,548 | | | $ | 4,666,748 | |
| |
Total Saint Lucia | | | $ | 4,666,748 | |
|
| Singapore — 0.4% | |
| | | |
TBLA International Pte Ltd., 7.00%, 1/24/23(1) | | USD | | | 5,094 | | | $ | 5,025,766 | |
| |
Total Singapore | | | $ | 5,025,766 | |
|
| South Africa — 1.2% | |
| | | |
Petra Diamonds US Treasury PLC,
10.50% PIK, 3/8/26(1)(8) | | USD | | | 14,610 | | | $ | 15,085,002 | |
| |
Total South Africa | | | $ | 15,085,002 | |
|
| Turkey — 1.2% | |
| | | |
Limak Iskenderun Uluslararasi Liman Isletmeciligi AS, 9.50%, 7/10/36(1) | | USD | | | 8,605 | | | $ | 8,480,572 | |
| | | |
Ulker Biskuvi Sanayi AS, 6.95%, 10/30/25(1) | | USD | | | 6,725 | | | | 6,417,358 | |
| |
Total Turkey | | | $ | 14,897,930 | |
|
| Ukraine — 0.4% | |
|
| Metinvest BV: | |
| | | |
5.625%, 6/17/25(1) | | EUR | | | 3,038 | | | $ | 3,031,805 | |
| | | |
8.50%, 4/23/26(1) | | USD | | | 2,094 | | | | 1,868,686 | |
| |
Total Ukraine | | | $ | 4,900,491 | |
| | | | |
| | 6 | | See Notes to Financial Statements. |
Eaton Vance
Emerging Markets Debt Opportunities Fund
January 31, 2022
Portfolio of Investments (Unaudited) — continued
| | | | | | | | | | |
| Security | | | | Principal
Amount
(000’s omitted) | | | Value | |
|
| United Arab Emirates — 0.7% | |
| | | |
Shelf Drilling Holdings, Ltd., 8.875%, 11/15/24(1) | | USD | | | 9,013 | | | $ | 9,225,842 | |
| |
Total United Arab Emirates | | | $ | 9,225,842 | |
|
| Uzbekistan — 0.7% | |
| | | |
Ipoteka-Bank ATIB, 16.00%, 4/16/24(1) | | UZS | | | 77,890,000 | | | $ | 7,257,741 | |
| | | |
Nederlandse Financierings-Maatschappij voor Ontwikkelingslanden NV (FMO), 15.00%, 12/8/22(1) | | UZS | | | 10,000,000 | | | | 926,759 | |
| |
Total Uzbekistan | | | $ | 8,184,500 | |
| |
Total Foreign Corporate Bonds
(identified cost $315,973,974) | | | $ | 303,898,971 | |
|
| Loan Participation Notes — 1.4% | |
| Security | | | | Principal
Amount
(000’s omitted) | | | Value | |
|
| Uzbekistan — 1.4% | |
| | | |
Daryo Finance BV (borrower - Uzbek Industrial and Construction Bank ATB), 18.75%, 6/15/23(1)(3)(10) | | UZS | | | 93,585,000 | | | $ | 8,466,118 | |
| | | |
Europe Asia Investment Finance BV (borrower - Joint Stock Commercial Bank “Asaka”), 18.70%, 7/26/23(1)(3)(10) | | UZS | | | 99,513,000 | | | | 9,058,923 | |
| |
Total Uzbekistan | | | $ | 17,525,041 | |
| |
Total Loan Participation Notes
(identified cost $19,288,241) | | | $ | 17,525,041 | |
|
| Senior Floating-Rate Loans — 1.1%(11) | |
| Borrower/Description | | | | Principal
Amount
(000’s omitted) | | | Value | |
|
| Dominican Republic — 0.2% | |
| | | |
Ingenieria Estrella, S.A. and Dominicana Cooperatief U.A., Term Loan, 5.251%, (6 mo. USD LIBOR + 5.00%), 11/29/24 | | USD | | | 2,372 | | | $ | 2,330,255 | |
| |
Total Dominican Republic | | | $ | 2,330,255 | |
|
| Mexico — 0.9% | |
| | | |
Petroleos Mexicanos, Term Loan, 6/28/24(12) | | USD | | | 12,330 | | | $ | 11,898,450 | |
| |
Total Mexico | | | $ | 11,898,450 | |
| |
Total Senior Floating-Rate Loans
(identified cost $14,193,960) | | | $ | 14,228,705 | |
| | | | | | | | | | |
| Sovereign Government Bonds — 39.2% | |
| Security | | | | Principal
Amount
(000’s omitted) | | | Value | |
|
| Albania — 0.6% | |
| | | |
Republic of Albania, 3.50%, 11/23/31(1) | | EUR | | | 6,871 | | | $ | 7,587,869 | |
| |
Total Albania | | | $ | 7,587,869 | |
|
| Argentina — 0.7% | |
| | | |
Argentina Bonar Bonds, 0.50% to 7/9/23, 7/9/30(4) | | USD | | | 2,400 | | | $ | 755,233 | |
| | | |
Republic of Argentina, 2.50% to 7/9/22, 7/9/41(4) | | USD | | | 21,488 | | | | 7,711,920 | |
| |
Total Argentina | | | $ | 8,467,153 | |
|
| Bahrain — 1.4% | |
|
| Kingdom of Bahrain: | |
| | | |
5.45%, 9/16/32(1) | | USD | | | 598 | | | $ | 565,851 | |
| | | |
6.00%, 9/19/44(1) | | USD | | | 3,084 | | | | 2,696,440 | |
| | | |
6.25%, 1/25/51(1) | | USD | | | 10,412 | | | | 9,208,425 | |
| | | |
7.50%, 9/20/47(1) | | USD | | | 4,424 | | | | 4,316,342 | |
| |
Total Bahrain | | | $ | 16,787,058 | |
|
| Barbados — 0.5% | |
|
| Government of Barbados: | |
| | | |
6.50%, 10/1/29(2) | | USD | | | 2,173 | | | $ | 2,178,132 | |
| | | |
6.50%, 10/1/29(1) | | USD | | | 3,973 | | | | 4,002,294 | |
| |
Total Barbados | | | $ | 6,180,426 | |
|
| Belarus — 0.2% | |
|
| Republic of Belarus: | |
| | | |
5.875%, 2/24/26(1) | | USD | | | 1,410 | | | $ | 1,184,160 | |
| | | |
6.875%, 2/28/23(1) | | USD | | | 1,000 | | | | 950,770 | |
| |
Total Belarus | | | $ | 2,134,930 | |
|
| Benin — 1.2% | |
| | | |
Benin Government International Bond, 6.875%, 1/19/52(1) | | EUR | | | 13,780 | | | $ | 15,108,886 | |
| |
Total Benin | | | $ | 15,108,886 | |
|
| Bosnia and Herzegovina — 0.0%(13) | |
|
| Republic of Srpska: | |
| | | |
1.50%, 10/30/23 | | BAM | | | 97 | | | $ | 55,859 | |
| | | |
1.50%, 6/9/25 | | BAM | | | 39 | | | | 22,268 | |
| | | |
1.50%, 9/25/26 | | BAM | | | 211 | | | | 120,363 | |
| |
Total Bosnia and Herzegovina | | | $ | 198,490 | |
| | | | |
| | 7 | | See Notes to Financial Statements. |
Eaton Vance
Emerging Markets Debt Opportunities Fund
January 31, 2022
Portfolio of Investments (Unaudited) — continued
| | | | | | | | | | |
| Security | | | | Principal
Amount
(000’s omitted) | | | Value | |
|
| China — 1.6% | |
| | | |
China Government Bond, 3.53%, 10/18/51 | | CNY | | | 121,580 | | | $ | 19,969,207 | |
| |
Total China | | | $ | 19,969,207 | |
|
| Costa Rica — 0.5% | |
| | | |
Costa Rica Government International Bond, 9.66%, 9/30/26(1) | | CRC | | | 3,282,500 | | | $ | 5,993,671 | |
| |
Total Costa Rica | | | $ | 5,993,671 | |
|
| Croatia — 0.9% | |
|
| Croatia Government International Bond: | |
| | | |
1.50%, 6/17/31(1) | | EUR | | | 805 | | | $ | 910,301 | |
| | | |
1.75%, 3/4/41(1) | | EUR | | | 9,184 | | | | 10,170,792 | |
| |
Total Croatia | | | $ | 11,081,093 | |
|
| Dominican Republic — 0.9% | |
|
| Dominican Republic: | |
| | | |
6.40%, 6/5/49(1) | | USD | | | 5,395 | | | $ | 5,402,553 | |
| | | |
6.85%, 1/27/45(1) | | USD | | | 5,100 | | | | 5,369,790 | |
| | | |
8.00%, 1/15/27(1) | | DOP | | | 13,200 | | | | 215,538 | |
| |
Total Dominican Republic | | | $ | 10,987,881 | |
|
| Ecuador — 0.4% | |
|
| Republic of Ecuador: | |
| | | |
0.50% to 7/31/22, 7/31/40(1)(4) | | USD | | | 800 | | | $ | 413,663 | |
| | | |
0.50% to 7/31/22, 7/31/40(1)(4) | | USD | | | 182 | | | | 92,043 | |
| | | |
0.50% to 7/31/22, 7/31/40(1)(4) | | USD | | | 2,265 | | | | 1,170,788 | |
| | | |
0.50% to 7/31/22, 7/31/40(1)(4) | | USD | | | 1,538 | | | | 776,844 | |
| | | |
0.50% to 7/31/22, 7/31/40(1)(4) | | USD | | | 410 | | | | 207,097 | |
| | | |
0.50% to 7/31/22, 7/31/40(1)(4) | | USD | | | 3,451 | | | | 1,742,836 | |
| | | |
0.50% to 7/31/22, 7/31/40(1)(4) | | USD | | | 1,640 | | | | 848,056 | |
| |
Total Ecuador | | | $ | 5,251,327 | |
|
| Egypt — 6.9% | |
|
| Arab Republic of Egypt: | |
| | | |
5.875%, 2/16/31(1) | | USD | | | 10,121 | | | $ | 8,580,382 | |
| | | |
7.50%, 2/16/61(1) | | USD | | | 13,881 | | | | 10,816,006 | |
|
| Egypt Government Bond: | |
| | | |
14.06%, 1/12/26 | | EGP | | | 293,132 | | | | 18,521,204 | |
| | | |
14.483%, 4/6/26 | | EGP | | | 172,731 | | | | 11,040,069 | |
| | | |
14.556%, 10/13/27 | | EGP | | | 411,495 | | | | 26,341,335 | |
| | | |
14.563%, 7/6/26 | | EGP | | | 37,431 | | | | 2,395,643 | |
| | | |
14.575%, 10/12/28 | | EGP | | | 124,964 | | | | 8,001,218 | |
| |
Total Egypt | | | $ | 85,695,857 | |
| | | | | | | | | | |
| Security | | | | Principal
Amount
(000’s omitted) | | | Value | |
|
| Honduras — 1.0% | |
|
| Republic of Honduras: | |
| | | |
5.625%, 6/24/30(1) | | USD | | | 10,386 | | | $ | 10,178,280 | |
| | | |
6.25%, 1/19/27(1) | | USD | | | 1,759 | | | | 1,763,415 | |
| |
Total Honduras | | | $ | 11,941,695 | |
|
| Indonesia — 5.2% | |
|
| Indonesia Government Bond: | |
| | | |
6.50%, 2/15/31 | | IDR | | | 655,017,000 | | | $ | 45,635,311 | |
| | | |
7.50%, 4/15/40 | | IDR | | | 263,555,000 | | | | 19,296,580 | |
| |
Total Indonesia | | | $ | 64,931,891 | |
|
| Ivory Coast — 1.7% | |
|
| Ivory Coast Government International Bond: | |
| | | |
4.875%, 1/30/32(1) | | EUR | | | 6,372 | | | $ | 6,738,557 | |
| | | |
5.25%, 3/22/30(1) | | EUR | | | 2,220 | | �� | | 2,502,315 | |
| | | |
6.625%, 3/22/48(1) | | EUR | | | 7,948 | | | | 8,540,050 | |
| | | |
6.875%, 10/17/40(1) | | EUR | | | 2,759 | | | | 3,133,075 | |
| |
Total Ivory Coast | | | $ | 20,913,997 | |
|
| Kenya — 0.1% | |
| | | |
Republic of Kenya, 7.25%, 2/28/28(1) | | USD | | | 1,738 | | | $ | 1,801,023 | |
| |
Total Kenya | | | $ | 1,801,023 | |
|
| Lebanon — 0.2% | |
|
| Lebanese Republic: | |
| | | |
6.25%, 11/4/24(1)(9) | | USD | | | 894 | | | $ | 97,053 | |
| | | |
6.25%, 6/12/25(1)(9) | | USD | | | 143 | | | | 15,697 | |
| | | |
6.40%, 5/26/23(9) | | USD | | | 880 | | | | 96,219 | |
| | | |
6.65%, 4/22/24(1)(9) | | USD | | | 4,796 | | | | 523,963 | |
| | | |
6.65%, 11/3/28(1)(9) | | USD | | | 8,115 | | | | 885,184 | |
| | | |
6.75%, 11/29/27(1)(9) | | USD | | | 29 | | | | 3,202 | |
| | | |
6.85%, 5/25/29(9) | | USD | | | 3,159 | | | | 343,225 | |
| | | |
7.00%, 12/3/24(9) | | USD | | | 369 | | | | 40,136 | |
| | | |
7.00%, 3/20/28(1)(9) | | USD | | | 1,314 | | | | 134,442 | |
| | | |
7.05%, 11/2/35(1)(9) | | USD | | | 564 | | | | 61,579 | |
| | | |
7.15%, 11/20/31(1)(9) | | USD | | | 226 | | | | 23,086 | |
| | | |
8.20%, 5/17/33(9) | | USD | | | 77 | | | | 7,822 | |
| | | |
8.25%, 5/17/34(9) | | USD | | | 65 | | | | 6,629 | |
| |
Total Lebanon | | | $ | 2,238,237 | |
|
| Mexico — 0.2% | |
| | | |
Mexican Bonos, 8.50%, 5/31/29 | | MXN | | | 47,000 | | | $ | 2,394,328 | |
| |
Total Mexico | | | $ | 2,394,328 | |
| | | | |
| | 8 | | See Notes to Financial Statements. |
Eaton Vance
Emerging Markets Debt Opportunities Fund
January 31, 2022
Portfolio of Investments (Unaudited) — continued
| | | | | | | | | | |
| Security | | | | Principal
Amount
(000’s omitted) | | | Value | |
|
| Pakistan — 0.1% | |
| | | |
Islamic Republic of Pakistan, 8.875%, 4/8/51(1) | | USD | | | 1,039 | | | $ | 970,613 | |
| |
Total Pakistan | | | $ | 970,613 | |
|
| Romania — 1.8% | |
|
| Romania Government International Bond: | |
| | | |
2.625%, 12/2/40(1) | | EUR | | | 390 | | | $ | 365,308 | |
| | | |
3.375%, 1/28/50(1) | | EUR | | | 1,969 | | | | 1,932,335 | |
| | | |
3.624%, 5/26/30(1) | | EUR | | | 1,190 | | | | 1,392,962 | |
| | | |
4.625%, 4/3/49(1) | | EUR | | | 15,846 | | | | 18,746,156 | |
| |
Total Romania | | | $ | 22,436,761 | |
|
| Serbia — 2.2% | |
| | | |
Serbia Treasury Bond, 4.50%, 8/20/32 | | RSD | | | 2,743,130 | | | $ | 27,840,238 | |
| |
Total Serbia | | | $ | 27,840,238 | |
|
| Seychelles — 0.0%(13) | |
| | | |
Republic of Seychelles, 8.00%, 1/1/26(1) | | USD | | | 142 | | | $ | 152,373 | |
| |
Total Seychelles | | | $ | 152,373 | |
|
| Suriname — 2.7% | |
|
| Republic of Suriname: | |
| | | |
9.25%, 10/26/26(1)(9) | | USD | | | 42,747 | | | $ | 32,669,395 | |
| | | |
12.875%, 12/30/23(1)(9) | | USD | | | 1,575 | | | | 1,204,875 | |
| |
Total Suriname | | | $ | 33,874,270 | |
|
| Turkey — 0.1% | |
| | | |
Republic of Turkey, 5.125%, 3/25/22 | | USD | | | 810 | | | $ | 814,142 | |
| |
Total Turkey | | | $ | 814,142 | |
|
| Ukraine — 6.8% | |
|
| Ukraine Government International Bond: | |
| | | |
1.258%, GDP-Linked, 5/31/40(1)(14) | | USD | | | 12,047 | | | $ | 9,144,275 | |
| | | |
9.79%, 5/26/27 | | UAH | | | 763,973 | | | | 20,711,018 | |
| | | |
9.99%, 5/22/24 | | UAH | | | 477,785 | | | | 15,135,023 | |
| | | |
10.00%, 8/23/23 | | UAH | | | 16,171 | | | | 532,681 | |
| | | |
12.52%, 5/13/26 | | UAH | | | 128,057 | | | | 3,982,719 | |
| | | |
15.84%, 2/26/25 | | UAH | | | 1,001,824 | | | | 35,139,152 | |
| |
Total Ukraine | | | $ | 84,644,868 | |
|
| Uzbekistan — 0.0%(13) | |
| | | |
Republic of Uzbekistan, 14.50%, 11/25/23(1) | | UZS | | | 2,500,000 | | | $ | 237,925 | |
| |
Total Uzbekistan | | | $ | 237,925 | |
| | | | | | | | | | |
| Security | | | | Principal
Amount
(000’s omitted) | | | Value | |
|
| Zambia — 1.3% | |
|
| Zambia Government Bond: | |
| | | |
11.00%, 1/25/26 | | ZMW | | | 112,260 | | | $ | 4,666,874 | |
| | | |
11.00%, 9/20/26 | | ZMW | | | 22,630 | | | | 888,738 | |
| | | |
11.00%, 12/27/26 | | ZMW | | | 35,500 | | | | 1,361,280 | |
| | | |
12.00%, 3/22/28 | | ZMW | | | 36,180 | | | | 1,317,561 | |
| | | |
12.00%, 5/31/28 | | ZMW | | | 11,640 | | | | 417,964 | |
| | | |
13.00%, 1/25/31 | | ZMW | | | 28,840 | | | | 962,017 | |
| | | |
13.00%, 6/28/31 | | ZMW | | | 27,870 | | | | 915,057 | |
| | | |
13.00%, 9/20/31 | | ZMW | | | 55,740 | | | | 1,817,237 | |
| | | |
13.00%, 12/27/31 | | ZMW | | | 94,590 | | | | 3,056,082 | |
| | | |
14.00%, 12/5/31 | | ZMW | | | 5,300 | | | | 181,882 | |
| | | |
15.00%, 2/16/27 | | ZMW | | | 20,870 | | | | 924,009 | |
| |
Total Zambia | | | $ | 16,508,701 | |
| |
Total Sovereign Government Bonds
(identified cost $522,882,875) | | | $ | 487,144,910 | |
|
| Sovereign Loans — 3.6% | |
| Borrower | | | | Principal
Amount
(000’s omitted) | | | Value | |
|
| Ivory Coast — 0.1% | |
| | | |
Republic of Ivory Coast, Term Loan, 5.75%, (3 mo. EURIBOR + 5.75%), 1/6/28(15) | | EUR | | | 1,050 | | | $ | 1,165,982 | |
| |
Total Ivory Coast | | | $ | 1,165,982 | |
|
| Kenya — 0.2% | |
| | | |
Government of Kenya, Term Loan, 6.616%, (6 mo. USD LIBOR + 6.45%), 6/29/25(15) | | USD | | | 1,978 | | | $ | 2,018,341 | |
| |
Total Kenya | | | $ | 2,018,341 | |
|
| Macedonia — 0.0%(13) | |
| | | |
Republic of Macedonia, Term Loan, 4.50%, (6 mo. EURIBOR + 4.50%), 12/16/22(15)(16) | | EUR | | | 200 | | | $ | 224,466 | |
| |
Total Macedonia | | | $ | 224,466 | |
|
| Nigeria — 0.7% | |
| | | |
Bank of Industry Limited, Term Loan, 6.119%, (3 mo. USD LIBOR + 6.00%), 12/14/23(15)(16) | | USD | | | 8,880 | | | $ | 9,013,295 | |
| |
Total Nigeria | | | $ | 9,013,295 | |
| | | | |
| | 9 | | See Notes to Financial Statements. |
Eaton Vance
Emerging Markets Debt Opportunities Fund
January 31, 2022
Portfolio of Investments (Unaudited) — continued
| | | | | | | | | | |
| Borrower | | | | Principal
Amount
(000’s omitted) | | | Value | |
|
| Tanzania — 2.6% | |
| |
| Government of the United Republic of Tanzania: | | | | |
| | | |
Term Loan, 5.429%, (6 mo. USD LIBOR + 5.20%), 6/23/22(15) | | USD | | | 600 | | | $ | 608,439 | |
| | | |
Term Loan, 5.528%, (6 mo. USD LIBOR + 5.20%), 6/23/22(15) | | USD | | | 104 | | | | 105,280 | |
| | | |
Term Loan, 6.454%, (3 mo. USD LIBOR + 6.30%), 4/28/31(15) | | USD | | | 31,265 | | | | 31,128,403 | |
| |
Total Tanzania | | | $ | 31,842,122 | |
| |
Total Sovereign Loans
(identified cost $44,293,478) | | | $ | 44,264,206 | |
|
| Short-Term Investments — 23.5% | |
|
| Affiliated Fund — 14.6% | |
| Description | | | | Units | | | Value | |
| | |
Eaton Vance Cash Reserves Fund, LLC, 0.08%(17) | | | 181,873,099 | | | $ | 181,854,912 | |
| |
Total Affiliated Fund
(identified cost $181,855,424) | | | $ | 181,854,912 | |
|
| Sovereign Government Securities — 4.8% | |
| Security | | | | Principal
Amount
(000’s omitted) | | | Value | |
|
| Egypt — 2.8% | |
| |
| Egypt Treasury Bill: | | | | |
| | | |
0.00%, 2/15/22 | | EGP | | | 78,550 | | | $ | 4,980,690 | |
| | | |
0.00%, 3/8/22 | | EGP | | | 38,650 | | | | 2,442,062 | |
| | | |
0.00%, 3/22/22 | | EGP | | | 80,500 | | | | 5,062,138 | |
| | | |
0.00%, 3/29/22 | | EGP | | | 40,275 | | | | 2,527,047 | |
| | | |
0.00%, 4/12/22 | | EGP | | | 61,650 | | | | 3,851,054 | |
| | | |
0.00%, 5/31/22 | | EGP | | | 265,500 | | | | 16,338,856 | |
| |
Total Egypt | | | $ | 35,201,847 | |
|
| Uganda — 2.0% | |
| |
| Uganda Treasury Bill: | | | | |
| | | |
0.00%, 2/24/22 | | UGX | | | 5,288,700 | | | $ | 1,502,517 | |
| | | |
0.00%, 3/10/22 | | UGX | | | 8,000,500 | | | | 2,274,104 | |
| | | |
0.00%, 3/24/22 | | UGX | | | 13,215,100 | | | | 3,747,204 | |
| | | |
0.00%, 4/7/22 | | UGX | | | 10,999,300 | | | | 3,111,974 | |
| | | |
0.00%, 4/21/22 | | UGX | | | 2,830,000 | | | | 798,752 | |
| | | |
0.00%, 5/5/22 | | UGX | | | 5,173,400 | | | | 1,455,428 | |
| | | | | | | | | | |
| Security | | | | Principal
Amount
(000’s omitted) | | | Value | |
|
| Uganda (continued) | |
| |
| Uganda Treasury Bill: (continued) | | | | |
| | | |
0.00%, 5/19/22 | | UGX | | | 2,214,300 | | | $ | 619,310 | |
| | | |
0.00%, 6/3/22 | | UGX | | | 9,498,200 | | | | 2,652,102 | |
| | | |
0.00%, 6/16/22 | | UGX | | | 9,466,600 | | | | 2,633,174 | |
| | | |
0.00%, 6/23/22 | | UGX | | | 2,225,300 | | | | 617,675 | |
| | | |
0.00%, 7/7/22 | | UGX | | | 13,454,200 | | | | 3,720,760 | |
| | | |
0.00%, 7/21/22 | | UGX | | | 4,664,600 | | | | 1,282,158 | |
| |
Total Uganda | | | $ | 24,415,158 | |
| |
Total Sovereign Government Securities
(identified cost $58,723,608) | | | $ | 59,617,005 | |
|
| U.S. Treasury Obligations — 4.1% | |
| Security | | | | Principal
Amount
(000’s omitted) | | | Value | |
| |
| U.S. Treasury Bill: | | | | |
| | |
0.033%, 3/03/22 | | $ | 215 | | | $ | 214,995 | |
| | |
0.043%, 2/10/22(18) | | | 50,235 | | | | 50,234,651 | |
| |
Total U.S. Treasury Obligations
(identified cost $50,449,461) | | | $ | 50,449,646 | |
| |
Total Short-Term Investments
(identified cost $291,028,493) | | | $ | 291,921,563 | |
| |
Total Purchased Swaptions — 0.0%(13)
(identified cost $196,003) | | | $ | 3,352 | |
| |
Total Investments — 94.9%
(identified cost $1,222,734,177) | | | $ | 1,178,225,734 | |
| |
Other Assets, Less Liabilities — 5.1% | | | $ | 63,710,394 | |
| |
Net Assets — 100.0% | | | $ | 1,241,936,128 | |
The percentage shown for each investment category in the Portfolio of Investments is based on net assets.
| | (1) | Security exempt from registration under Regulation S of the Securities Act of 1933, as amended, which exempts from registration securities offered and sold outside the United States. Security may not be offered or sold in the United States except pursuant to an exemption from, or in a transaction not subject to, the registration requirements of the Securities Act of 1933, as amended. At January 31, 2022, the aggregate value of these securities is $481,678,064 or 38.8% of the Fund’s net assets. |
| | (2) | Security exempt from registration under Rule 144A of the Securities Act of 1933, as amended. These securities may be sold in certain transactions in reliance on an exemption from registration (normally to |
| | | | |
| | 10 | | See Notes to Financial Statements. |
Eaton Vance
Emerging Markets Debt Opportunities Fund
January 31, 2022
Portfolio of Investments (Unaudited) — continued
| | qualified institutional buyers). At January 31, 2022, the aggregate value of these securities is $29,409,090 or 2.4% of the Fund’s net assets. |
| | (3) | For fair value measurement disclosure purposes, security is categorized as Level 3 (see Note 11). |
| | (4) | Step coupon security. Interest rate represents the rate in effect at January 31, 2022. |
| | (5) | Perpetual security with no stated maturity date but may be subject to calls by the issuer. |
| | (6) | Variable rate security whose coupon rate is linked to the issuer’s mining activity revenue. The coupon rate shown represents the rate in effect at January 31, 2022. |
| | (7) | Security converts to variable rate after the indicated fixed-rate coupon period. |
| | (8) | Represents a payment-in-kind security which may pay interest in additional principal at the issuer’s discretion. |
| | (9) | Issuer is in default with respect to interest payments. |
| (10) | Limited recourse note whose payments by the issuer are limited to amounts received by the issuer from the borrower pursuant to a loan agreement with the borrower. |
| (11) | Senior floating-rate loans (Senior Loans) often require prepayments from excess cash flows or permit the borrowers to repay at their election. The degree to which borrowers repay, whether as a contractual requirement or at their election, cannot be predicted with accuracy. As a result, the actual remaining maturity may be substantially less than the stated maturities shown. However, Senior Loans will typically have an expected average life of approximately two to four years. Senior Loans typically have rates of |
| | interest which are redetermined periodically by reference to a base lending rate, plus a spread. These base lending rates are primarily the London Interbank Offered Rate (“LIBOR”) and secondarily, the prime rate offered by one or more major United States banks (the “Prime Rate”). Base lending rates may be subject to a floor, or minimum rate. Senior Loans are generally subject to contractual restrictions that must be satisfied before they can be bought or sold. |
| (12) | This Senior Loan will settle after January 31, 2022, at which time the interest rate will be determined. |
| (13) | Amount is less than 0.05%. |
| (14) | Amounts payable in respect of the security are contingent upon and determined by reference to Ukraine’s GDP and Real GDP Growth Rate. Principal amount represents the notional amount used to calculate payments due to the security holder and does not represent an entitlement for payment. |
| (15) | Variable rate security. The stated interest rate represents the rate in effect at January 31, 2022. |
| (16) | Loan is subject to scheduled mandatory prepayments. Maturity date shown reflects the final maturity date. |
| (17) | Affiliated investment company, available to Eaton Vance portfolios and funds, which invests in high quality, U.S. dollar denominated money market instruments. The rate shown is the annualized seven-day yield as of January 31, 2022. |
| (18) | Security (or a portion thereof) has been pledged to cover collateral requirements on open derivative contracts. |
| | | | | | | | | | | | | | | | | | | | |
| Purchased Interest Rate Swaptions — 0.0%(13) | | | | | | | | | | | | | | | |
| | | | |
| Description | | Counterparty | | | Notional
Amount | | | Expiration
Date | | | Value | |
| | | | | |
| Option to enter into interest rate swap expiring 2/10/27 to pay 3-month ZAR-JIBAR and receive 5.88% | | | Goldman Sachs International | | | | ZAR | | | | 61,060,000 | | | | 2/10/22 | | | $ | 0 | |
| | | | | |
| Option to enter into interest rate swap expiring 2/16/27 to pay 3-month ZAR-JIBAR and receive 6.18% | | | Bank of America, N.A. | | | | ZAR | | | | 16,160,000 | | | | 2/16/22 | | | | 26 | |
| | | | | |
| Option to enter into interest rate swap expiring 2/21/27 to pay 3-month ZAR-JIBAR and receive 6.47% | | | Bank of America, N.A. | | | | ZAR | | | | 16,160,000 | | | | 2/21/22 | | | | 923 | |
| | | | | |
| Option to enter into interest rate swap expiring 2/23/27 to pay 3-month ZAR-JIBAR and receive 6.54% | | | Bank of America, N.A. | | | | ZAR | | | | 16,160,000 | | | | 2/23/22 | | | | 1,630 | |
| | | | | |
| Option to enter into interest rate swap expiring 2/23/27 to pay 3-month ZAR-JIBAR and receive 6.47% | | | Goldman Sachs International | | | | ZAR | | | | 12,390,000 | | | | 2/23/22 | | | | 773 | |
| | | | | |
Total | | | | | | | | | | | | | | | | | | $ | 3,352 | |
| | | | | | | | | | | | | | | | | | | | | | | | | | |
| Centrally Cleared Forward Foreign Currency Exchange Contracts | |
| | | | |
| Currency Purchased | | | Currency Sold | | | Settlement
Date | | | | | | Value/Unrealized
Appreciation
(Depreciation) | |
| | | | | | | |
| INR | | | 475,000,000 | | | USD | | | 6,330,970 | | | | | | | | 2/3/22 | | | | | | | $ | 33,848 | |
| | | | | | | |
| USD | | | 6,335,369 | | | INR | | | 475,000,000 | | | | | | | | 2/3/22 | | | | | | | | (29,449 | ) |
| | | | | | | |
| RUB | | | 800,000 | | | USD | | | 10,907 | | | | | | | | 2/8/22 | | | | | | | | (576 | ) |
| | | | | | | |
| RUB | | | 2,188,026 | | | USD | | | 29,962 | | | | | | | | 2/8/22 | | | | | | | | (1,708 | ) |
| | | | |
| | 11 | | See Notes to Financial Statements. |
Eaton Vance
Emerging Markets Debt Opportunities Fund
January 31, 2022
Portfolio of Investments (Unaudited) — continued
| | | | | | | | | | | | | | | | | | | | | | | | | | |
| Centrally Cleared Forward Foreign Currency Exchange Contracts (continued) | |
| | | | |
| Currency Purchased | | | Currency Sold | | | Settlement
Date | | | | | | Value/Unrealized
Appreciation
(Depreciation) | |
| | | | | | | |
| RUB | | | 155,000,000 | | | USD | | | 2,077,049 | | | | | | | | 2/8/22 | | | | | | | $ | (75,482 | ) |
| | | | | | | |
| RUB | | | 167,100,000 | | | USD | | | 2,278,162 | | | | | | | | 2/8/22 | | | | | | | | (120,343 | ) |
| | | | | | | |
| RUB | | | 435,404,571 | | | USD | | | 5,962,363 | | | | | | | | 2/8/22 | | | | | | | | (339,836 | ) |
| | | | | | | |
| USD | | | 926,314 | | | RUB | | | 70,000,000 | | | | | | | | 2/8/22 | | | | | | | | 22,380 | |
| | | | | | | |
| RUB | | | 300,000 | | | USD | | | 4,087 | | | | | | | | 2/9/22 | | | | | | | | (214 | ) |
| | | | | | | |
| RUB | | | 468,798 | | | USD | | | 6,400 | | | | | | | | 2/9/22 | | | | | | | | (348 | ) |
| | | | | | | |
| RUB | | | 500,000 | | | USD | | | 6,831 | | | | | | | | 2/9/22 | | | | | | | | (376 | ) |
| | | | | | | |
| RUB | | | 600,000 | | | USD | | | 8,195 | | | | | | | | 2/9/22 | | | | | | | | (449 | ) |
| | | | | | | |
| RUB | | | 2,688,079 | | | USD | | | 36,644 | | | | | | | | 2/9/22 | | | | | | | | (1,943 | ) |
| | | | | | | |
| RUB | | | 56,600,000 | | | USD | | | 771,070 | | | | | | | | 2/9/22 | | | | | | | | (40,404 | ) |
| | | | | | | |
| RUB | | | 84,878,113 | | | USD | | | 1,158,684 | | | | | | | | 2/9/22 | | | | | | | | (62,967 | ) |
| | | | | | | |
| RUB | | | 101,900,000 | | | USD | | | 1,391,790 | | | | | | | | 2/9/22 | | | | | | | | (76,333 | ) |
| | | | | | | |
| RUB | | | 101,900,000 | | | USD | | | 1,392,139 | | | | | | | | 2/9/22 | | | | | | | | (76,682 | ) |
| | | | | | | |
| RUB | | | 116,000,000 | | | USD | | | 1,602,992 | | | | | | | | 2/9/22 | | | | | | | | (105,513 | ) |
| | | | | | | |
| RUB | | | 495,869,047 | | | USD | | | 6,759,747 | | | | | | | | 2/9/22 | | | | | | | | (358,428 | ) |
| | | | | | | |
| INR | | | 421,776,400 | | | USD | | | 5,625,936 | | | | | | | | 2/10/22 | | | | | | | | 22,263 | |
| | | | | | | |
| INR | | | 184,039,000 | | | USD | | | 2,454,672 | | | | | | | | 2/10/22 | | | | | | | | 9,878 | |
| | | | | | | |
| INR | | | 11,929,500 | | | USD | | | 159,113 | | | | | | | | 2/10/22 | | | | | | | | 640 | |
| | | | | | | |
| RUB | | | 1,302,000,000 | | | USD | | | 17,450,416 | | | | | | | | 2/10/22 | | | | | | | | (647,776 | ) |
| | | | | | | |
| USD | | | 554,832 | | | RUB | | | 41,308,343 | | | | | | | | 2/17/22 | | | | | | | | 22,903 | |
| | | | | | | |
| IDR | | | 32,759,700,000 | | | USD | | | 2,278,302 | | | | | | | | 2/23/22 | | | | | | | | 1,821 | |
| | | | | | | |
| IDR | | | 37,240,300,000 | | | USD | | | 2,596,590 | | | | | | | | 2/23/22 | | | | | | | | (4,612 | ) |
| | | | | | | |
| IDR | | | 9,226,649,115 | | | USD | | | 642,345 | | | | | | | | 2/25/22 | | | | | | | | (93 | ) |
| | | | | | | |
| PEN | | | 19,100,000 | | | USD | | | 4,968,783 | | | | | | | | 2/28/22 | | | | | | | | (17,307 | ) |
| | | | | | | |
| USD | | | 258,598 | | | RUB | | | 20,483,777 | | | | | | | | 2/28/22 | | | | | | | | (4,269 | ) |
| | | | | | | |
| USD | | | 561,603 | | | RUB | | | 44,467,160 | | | | | | | | 2/28/22 | | | | | | | | (9,041 | ) |
| | | | | | | |
| USD | | | 2,536,690 | | | RUB | | | 202,542,000 | | | | | | | | 2/28/22 | | | | | | | | (62,519 | ) |
| | | | | | | |
| USD | | | 11,233,800 | | | RUB | | | 896,990,840 | | | | | | | | 2/28/22 | | | | | | | | (277,227 | ) |
| | | | | | | |
| MXN | | | 48,750,465 | | | USD | | | 2,287,423 | | | | | | | | 3/1/22 | | | | | | | | 65,505 | |
| | | | | | | |
| USD | | | 1,374,349 | | | MXN | | | 29,290,667 | | | | | | | | 3/1/22 | | | | | | | | (39,357 | ) |
| | | | | | | |
| USD | | | 362,253 | | | IDR | | | 5,203,045,305 | | | | | | | | 3/4/22 | | | | | | | | (50 | ) |
| | | | | | | |
| INR | | | 301,200,000 | | | USD | | | 3,966,571 | | | | | | | | 3/8/22 | | | | | | | | 55,892 | |
| | | | | | | |
| PEN | | | 11,490,000 | | | USD | | | 2,979,254 | | | | | | | | 3/9/22 | | | | | | | | (2,380 | ) |
| | | | | | | |
| USD | | | 231,349 | | | PEN | | | 948,381 | | | | | | | | 3/9/22 | | | | | | | | (14,361 | ) |
| | | | | | | |
| USD | | | 7,019,097 | | | PEN | | | 28,773,735 | | | | | | | | 3/9/22 | | | | | | | | (435,716 | ) |
| | | | | | | |
| COP | | | 713,900,000 | | | USD | | | 180,791 | | | | | | | | 3/14/22 | | | | | | | | (828 | ) |
| | | | | | | |
| COP | | | 428,360,743 | | | USD | | | 108,817 | | | | | | | | 3/14/22 | | | | | | | | (834 | ) |
| | | | | | | |
| RUB | | | 400,000 | | | USD | | | 5,333 | | | | | | | | 3/15/22 | | | | | | | | (219 | ) |
| | | | | | | |
| RUB | | | 41,300,000 | | | USD | | | 551,037 | | | | | | | | 3/15/22 | | | | | | | | (23,071 | ) |
| | | | | | | |
| RUB | | | 43,000,000 | | | USD | | | 573,497 | | | | | | | | 3/15/22 | | | | | | | | (23,799 | ) |
| | | | | | | |
| RUB | | | 85,900,000 | | | USD | | | 1,145,226 | | | | | | | | 3/15/22 | | | | | | | | (47,109 | ) |
| | | | | | | |
| RUB | | | 105,080,000 | | | USD | | | 1,399,820 | | | | | | | | 3/15/22 | | | | | | | | (56,512 | ) |
| | | | | | | |
| COP | | | 7,757,739,257 | | | USD | | | 1,968,020 | | | | | | | | 3/16/22 | | | | | | | | (12,877 | ) |
| | | | | | | |
| EUR | | | 2,359,103 | | | USD | | | 2,668,091 | | | | | | | | 3/16/22 | | | | | | | | (15,300 | ) |
| | | | |
| | 12 | | See Notes to Financial Statements. |
Eaton Vance
Emerging Markets Debt Opportunities Fund
January 31, 2022
Portfolio of Investments (Unaudited) — continued
| | | | | | | | | | | | | | | | | | | | | | | | | | |
| Centrally Cleared Forward Foreign Currency Exchange Contracts (continued) | |
| | | | |
| Currency Purchased | | | Currency Sold | | | Settlement
Date | | | | | | Value/Unrealized
Appreciation
(Depreciation) | |
| | | | | | | |
| EUR | | | 3,369,623 | | | USD | | | 3,810,965 | | | | | | | | 3/16/22 | | | | | | | $ | (21,854 | ) |
| | | | | | | |
| EUR | | | 7,292,981 | | | USD | | | 8,248,193 | | | | | | | | 3/16/22 | | | | | | | | (47,299 | ) |
| | | | | | | |
| EUR | | | 23,445,688 | | | USD | | | 26,516,530 | | | | | | | | 3/16/22 | | | | | | | | (152,057 | ) |
| | | | | | | |
| EUR | | | 62,952,101 | | | USD | | | 71,197,369 | | | | | | | | 3/16/22 | | | | | | | | (408,275 | ) |
| | | | | | | |
| RUB | | | 300,000 | | | USD | | | 4,002 | | | | | | | | 3/16/22 | | | | | | | | (168 | ) |
| | | | | | | |
| RUB | | | 400,000 | | | USD | | | 5,337 | | | | | | | | 3/16/22 | | | | | | | | (225 | ) |
| | | | | | | |
| RUB | | | 472,743 | | | USD | | | 6,301 | | | | | | | | 3/16/22 | | | | | | | | (259 | ) |
| | | | | | | |
| RUB | | | 500,000 | | | USD | | | 6,658 | | | | | | | | 3/16/22 | | | | | | | | (267 | ) |
| | | | | | | |
| RUB | | | 43,100,000 | | | USD | | | 574,927 | | | | | | | | 3/16/22 | | | | | | | | (24,088 | ) |
| | | | | | | |
| RUB | | | 51,300,000 | | | USD | | | 684,486 | | | | | | | | 3/16/22 | | | | | | | | (28,847 | ) |
| | | | | | | |
| RUB | | | 59,533,515 | | | USD | | | 793,519 | | | | | | | | 3/16/22 | | | | | | | | (32,651 | ) |
| | | | | | | |
| RUB | | | 100,200,000 | | | USD | | | 1,334,173 | | | | | | | | 3/16/22 | | | | | | | | (53,567 | ) |
| | | | | | | |
| USD | | | 5,774,373 | | | COP | | | 22,762,000,000 | | | | | | | | 3/16/22 | | | | | | | | 37,783 | |
| | | | | | | |
| USD | | | 1,079,020 | | | COP | | | 4,271,300,000 | | | | | | | | 3/16/22 | | | | | | | | 2,546 | |
| | | | | | | |
| USD | | | 886,500 | | | COP | | | 3,508,800,000 | | | | | | | | 3/16/22 | | | | | | | | 2,196 | |
| | | | | | | |
| USD | | | 826,586 | | | COP | | | 3,274,900,000 | | | | | | | | 3/16/22 | | | | | | | | 1,230 | |
| | | | | | | |
| USD | | | 97,420,739 | | | EUR | | | 86,138,580 | | | | | | | | 3/16/22 | | | | | | | | 558,651 | |
| | | | | | | |
| USD | | | 57,093,778 | | | EUR | | | 50,481,828 | | | | | | | | 3/16/22 | | | | | | | | 327,400 | |
| | | | | | | |
| USD | | | 36,281,680 | | | EUR | | | 32,079,950 | | | | | | | | 3/16/22 | | | | | | | | 208,054 | |
| | | | | | | |
| USD | | | 20,342,157 | | | EUR | | | 17,986,361 | | | | | | | | 3/16/22 | | | | | | | | 116,650 | |
| | | | | | | |
| USD | | | 10,652,240 | | | EUR | | | 9,418,619 | | | | | | | | 3/16/22 | | | | | | | | 61,084 | |
| | | | | | | |
| USD | | | 7,611,604 | | | EUR | | | 6,730,115 | | | | | | | | 3/16/22 | | | | | | | | 43,648 | |
| | | | | | | |
| USD | | | 6,365,121 | | | EUR | | | 5,627,985 | | | | | | | | 3/16/22 | | | | | | | | 36,500 | |
| | | | | | | |
| USD | | | 5,129,061 | | | EUR | | | 4,535,072 | | | | | | | | 3/16/22 | | | | | | | | 29,412 | |
| | | | | | | |
| USD | | | 1,534,597 | | | EUR | | | 1,356,877 | | | | | | | | 3/16/22 | | | | | | | | 8,800 | |
| | | | | | | |
| USD | | | 1,140,098 | | | EUR | | | 1,008,064 | | | | | | | | 3/16/22 | | | | | | | | 6,538 | |
| | | | | | | |
| USD | | | 752,916 | | | EUR | | | 665,722 | | | | | | | | 3/16/22 | | | | | | | | 4,318 | |
| | | | | | | |
| USD | | | 412,128 | | | EUR | | | 364,400 | | | | | | | | 3/16/22 | | | | | | | | 2,363 | |
| | | | | | | |
| RUB | | | 400,000 | | | USD | | | 5,326 | | | | | | | | 3/17/22 | | | | | | | | (215 | ) |
| | | | | | | |
| RUB | | | 400,000 | | | USD | | | 5,329 | | | | | | | | 3/17/22 | | | | | | | | (218 | ) |
| | | | | | | |
| RUB | | | 504,188 | | | USD | | | 6,722 | | | | | | | | 3/17/22 | | | | | | | | (280 | ) |
| | | | | | | |
| RUB | | | 85,900,000 | | | USD | | | 1,143,807 | | | | | | | | 3/17/22 | | | | | | | | (46,233 | ) |
| | | | | | | |
| RUB | | | 85,900,000 | | | USD | | | 1,144,465 | | | | | | | | 3/17/22 | | | | | | | | (46,891 | ) |
| | | | | | | |
| RUB | | | 90,508,042 | | | USD | | | 1,206,683 | | | | | | | | 3/17/22 | | | | | | | | (50,231 | ) |
| | | | | | | |
| USD | | | 14,106,993 | | | RUB | | | 1,123,516,223 | | | | | | | | 3/28/22 | | | | | | | | (209,581 | ) |
| | | | | | | |
| PEN | | | 9,490,000 | | | USD | | | 2,461,100 | | | | | | | | 3/31/22 | | | | | | | | (5,998 | ) |
| | | | | | | |
| PEN | | | 278,381 | | | USD | | | 69,709 | | | | | | | | 4/11/22 | | | | | | | | 2,246 | |
| | | | | | | |
| PEN | | | 180,000 | | | USD | | | 45,045 | | | | | | | | 4/11/22 | | | | | | | | 1,481 | |
| | | | | | | |
| PEN | | | 160,000 | | | USD | | | 40,020 | | | | | | | | 4/11/22 | | | | | | | | 1,336 | |
| | | | | | | |
| PEN | | | 150,000 | | | USD | | | 37,505 | | | | | | | | 4/11/22 | | | | | | | | 1,267 | |
| | | | | | | |
| RUB | | | 1,633,951 | | | USD | | | 21,344 | | | | | | | | 4/14/22 | | | | | | | | (621 | ) |
| | | | | | | |
| RUB | | | 134,300,000 | | | USD | | | 1,717,004 | | | | | | | | 4/14/22 | | | | | | | | (13,631 | ) |
| | | | | | | |
| RUB | | | 86,400,000 | | | USD | | | 1,128,845 | | | | | | | | 4/14/22 | | | | | | | | (33,004 | ) |
| | | | | | | |
| RUB | | | 301,374,455 | | | USD | | | 3,936,885 | | | | | | | | 4/14/22 | | | | | | | | (114,449 | ) |
| | | | |
| | 13 | | See Notes to Financial Statements. |
Eaton Vance
Emerging Markets Debt Opportunities Fund
January 31, 2022
Portfolio of Investments (Unaudited) — continued
| | | | | | | | | | | | | | | | | | | | | | | | | | |
| Centrally Cleared Forward Foreign Currency Exchange Contracts (continued) | |
| | | | |
| Currency Purchased | | | Currency Sold | | | Settlement
Date | | | | | | Value/Unrealized
Appreciation
(Depreciation) | |
| | | | | | | |
| IDR | | | 473,974,275,844 | | | USD | | | 32,896,604 | | | | | | | | 4/18/22 | | | | | | | $ | (24,131 | ) |
| | | | | | | |
| USD | | | 43,770,783 | | | IDR | | | 630,649,439,610 | | | | | | | | 4/18/22 | | | | | | | | 32,108 | |
| | | | | | | |
| USD | | | 7,819,689 | | | IDR | | | 112,666,080,344 | | | | | | | | 4/18/22 | | | | | | | | 5,736 | |
| | | | | | | |
| MXN | | | 13,863,625 | | | USD | | | 665,970 | | | | | | | | 4/21/22 | | | | | | | | (3,132 | ) |
| | | | | | | |
| USD | | | 87,732 | | | MXN | | | 1,826,326 | | | | | | | | 4/21/22 | | | | | | | | 413 | |
| | | | | | | |
| CLP | | | 3,822,000,000 | | | USD | | | 4,704,811 | | | | | | | | 4/27/22 | | | | | | | | 11,109 | |
| | | | | | | |
| CLP | | | 595,900,000 | | | USD | | | 736,486 | | | | | | | | 4/27/22 | | | | | | | | (1,212 | ) |
| | | | | | | |
| CLP | | | 606,000,000 | | | USD | | | 749,785 | | | | | | | | 4/27/22 | | | | | | | | (2,049 | ) |
| | | | | | | |
| PEN | | | 2,800,000 | | | USD | | | 724,544 | | | | | | | | 4/27/22 | | | | | | | | (1,824 | ) |
| | | | | | | |
| PEN | | | 12,900,000 | | | USD | | | 3,336,955 | | | | | | | | 4/28/22 | | | | | | | | (7,573 | ) |
| | | | | | | |
| INR | | | 475,000,000 | | | USD | | | 6,258,152 | | | | | | | | 5/2/22 | | | | | | | | 34,072 | |
| | | | | | | |
| BRL | | | 8,100,000 | | | USD | | | 1,451,837 | | | | | | | | 5/3/22 | | | | | | | | 37,682 | |
| | | | | | | |
| BRL | | | 8,100,000 | | | USD | | | 1,452,652 | | | | | | | | 5/3/22 | | | | | | | | 36,867 | |
| | | | | | | |
| BRL | | | 8,940,000 | | | USD | | | 1,609,941 | | | | | | | | 5/3/22 | | | | | | | | 34,047 | |
| | | | | | | |
| BRL | | | 5,000,000 | | | USD | | | 898,014 | | | | | | | | 5/3/22 | | | | | | | | 21,442 | |
| | | | | | | |
| | | | | | | | | | | | | | | | | | | | | | | | | $ | (2,415,029 | ) |
| | | | | | | | | | | | | | | | | | | | | | | | |
| Forward Foreign Currency Exchange Contracts | |
| | | | | |
| Currency Purchased | | | Currency Sold | | | Counterparty | | Settlement
Date | | | Unrealized
Appreciation | | | Unrealized
(Depreciation) | |
| | | | | | | |
| EUR | | | 1,640,055 | | | PLN | | | 7,600,000 | | | Standard Chartered Bank | | | 2/4/22 | | | $ | — | | | $ | (19,618 | ) |
| | | | | | | |
| EUR | | | 526,621 | | | USD | | | 595,993 | | | Bank of America, N.A. | | | 2/4/22 | | | | — | | | | (4,338 | ) |
| | | | | | | |
| EUR | | | 709,281 | | | USD | | | 802,716 | | | Bank of America, N.A. | | | 2/4/22 | | | | — | | | | (5,842 | ) |
| | | | | | | |
| EUR | | | 738,257 | | | USD | | | 835,509 | | | Bank of America, N.A. | | | 2/4/22 | | | | — | | | | (6,081 | ) |
| | | | | | | |
| PLN | | | 7,600,000 | | | EUR | | | 1,623,255 | | | Citibank, N.A. | | | 2/4/22 | | | | 38,494 | | | | — | |
| | | | | | | |
| PLN | | | 6,500,000 | | | EUR | | | 1,409,224 | | | Standard Chartered Bank | | | 2/4/22 | | | | 9,426 | | | | — | |
| | | | | | | |
| EGP | | | 89,980,000 | | | USD | | | 5,580,155 | | | Goldman Sachs International | | | 2/8/22 | | | | 138,265 | | | | — | |
| | | | | | | |
| KES | | | 30,679,000 | | | USD | | | 259,771 | | | Standard Chartered Bank | | | 2/8/22 | | | | 10,000 | | | | — | |
| | | | | | | |
| USD | | | 270,062 | | | KES | | | 30,679,000 | | | Standard Chartered Bank | | | 2/8/22 | | | | 291 | | | | — | |
| | | | | | | |
| MYR | | | 5,700,000 | | | USD | | | 1,357,143 | | | Goldman Sachs International | | | 2/9/22 | | | | 4,975 | | | | — | |
| | | | | | | |
| MYR | | | 21,084,580 | | | USD | | | 5,060,502 | | | Goldman Sachs International | | | 2/9/22 | | | | — | | | | (21,962 | ) |
| | | | | | | |
| EUR | | | 2,362,820 | | | HUF | | | 840,000,000 | | | Standard Chartered Bank | | | 2/14/22 | | | | 3,798 | | | | — | |
| | | | | | | |
| HUF | | | 331,000,000 | | | EUR | | | 907,589 | | | Bank of America, N.A. | | | 2/14/22 | | | | 24,882 | | | | — | |
| | | | | | | |
| HUF | | | 252,000,000 | | | EUR | | | 691,125 | | | Bank of America, N.A. | | | 2/14/22 | | | | 18,774 | | | | — | |
| | | | | | | |
| HUF | | | 2,365,000,000 | | | EUR | | | 6,496,432 | | | Citibank, N.A. | | | 2/14/22 | | | | 164,644 | | | | — | |
| | | | | | | |
| HUF | | | 1,089,100,000 | | | EUR | | | 2,991,655 | | | Citibank, N.A. | | | 2/14/22 | | | | 75,820 | | | | — | |
| | | | | | | |
| HUF | | | 316,600,000 | | | EUR | | | 870,704 | | | Citibank, N.A. | | | 2/14/22 | | | | 20,879 | | | | — | |
| | | | | | | |
| HUF | | | 253,300,000 | | | EUR | | | 696,680 | | | Citibank, N.A. | | | 2/14/22 | | | | 16,635 | | | | — | |
| | | | | | | |
| HUF | | | 2,239,000,000 | | | EUR | | | 6,136,600 | | | Standard Chartered Bank | | | 2/14/22 | | | | 171,291 | | | | — | |
| | | | | | | |
| HUF | | | 700,000,000 | | | EUR | | | 1,881,963 | | | Standard Chartered Bank | | | 2/14/22 | | | | 94,660 | | | | — | |
| | | | | | | |
| HUF | | | 331,000,000 | | | EUR | | | 908,476 | | | Standard Chartered Bank | | | 2/14/22 | | | | 23,886 | | | | — | |
| | | | | | | |
| USD | | | 982,304 | | | ZAR | | | 15,600,000 | | | Standard Chartered Bank | | | 2/15/22 | | | | — | | | | (30,855 | ) |
| | | | |
| | 14 | | See Notes to Financial Statements. |
Eaton Vance
Emerging Markets Debt Opportunities Fund
January 31, 2022
Portfolio of Investments (Unaudited) — continued
| | | | | | | | | | | | | | | | | | | | | | | | |
| Forward Foreign Currency Exchange Contracts (continued) | |
| | | | | |
| Currency Purchased | | | Currency Sold | | | Counterparty | | Settlement
Date | | | Unrealized
Appreciation | | | Unrealized
(Depreciation) | |
| | | | | | | |
| ZAR | | | 36,700,000 | | | USD | | | 2,390,242 | | | UBS AG | | | 2/15/22 | | | $ | — | | | $ | (6,721 | ) |
| | | | | | | |
| CZK | | | 138,600,000 | | | EUR | | | 5,449,988 | | | Standard Chartered Bank | | | 2/18/22 | | | | 263,302 | | | | — | |
| | | | | | | |
| CZK | | | 132,600,000 | | | EUR | | | 5,216,356 | | | Standard Chartered Bank | | | 2/18/22 | | | | 249,321 | | | | — | |
| | | | | | | |
| CZK | | | 46,500,000 | | | EUR | | | 1,830,024 | | | Standard Chartered Bank | | | 2/18/22 | | | | 86,578 | | | | — | |
| | | | | | | |
| CZK | | | 38,900,000 | | | EUR | | | 1,529,511 | | | Standard Chartered Bank | | | 2/18/22 | | | | 74,016 | | | | — | |
| | | | | | | |
| CZK | | | 23,700,000 | | | EUR | | | 932,203 | | | Standard Chartered Bank | | | 2/18/22 | | | | 44,710 | | | | — | |
| | | | | | | |
| EUR | | | 440,277 | | | CZK | | | 11,000,000 | | | UBS AG | | | 2/18/22 | | | | — | | | | (12,201 | ) |
| | | | | | | |
| CZK | | | 65,000,000 | | | EUR | | | 2,559,451 | | | Standard Chartered Bank | | | 2/22/22 | | | | 117,931 | | | | — | |
| | | | | | | |
| CZK | | | 46,200,000 | | | EUR | | | 1,818,329 | | | Standard Chartered Bank | | | 2/22/22 | | | | 84,777 | | | | — | |
| | | | | | | |
| CZK | | | 38,500,000 | | | EUR | | | 1,515,083 | | | Standard Chartered Bank | | | 2/22/22 | | | | 70,863 | | | | — | |
| | | | | | | |
| CZK | | | 22,000,000 | | | EUR | | | 866,276 | | | Standard Chartered Bank | | | 2/22/22 | | | | 39,915 | | | | — | |
| | | | | | | |
| MXN | | | 9,500,000 | | | USD | | | 450,965 | | | Bank of America, N.A. | | | 2/22/22 | | | | 8,081 | | | | — | |
| | | | | | | |
| MXN | | | 3,400,000 | | | USD | | | 161,398 | | | Bank of America, N.A. | | | 2/22/22 | | | | 2,892 | | | | — | |
| | | | | | | |
| MXN | | | 14,700,000 | | | USD | | | 695,551 | | | Standard Chartered Bank | | | 2/22/22 | | | | 14,763 | | | | — | |
| | | | | | | |
| MXN | | | 5,434,912 | | | USD | | | 257,160 | | | Standard Chartered Bank | | | 2/22/22 | | | | 5,458 | | | | — | |
| | | | | | | |
| MXN | | | 7,200,000 | | | USD | | | 341,705 | | | UBS AG | | | 2/22/22 | | | | 6,204 | | | | — | |
| | | | | | | |
| MXN | | | 2,600,000 | | | USD | | | 123,393 | | | UBS AG | | | 2/22/22 | | | | 2,240 | | | | — | |
| | | | | | | |
| USD | | | 1,789,888 | | | MXN | | | 38,000,000 | | | UBS AG | | | 2/22/22 | | | | — | | | | (46,298 | ) |
| | | | | | | |
| HUF | | | 13,002,993 | | | EUR | | | 34,885 | | | BNP Paribas | | | 2/23/22 | | | | 1,796 | | | | — | |
| | | | | | | |
| HUF | | | 10,700,000 | | | EUR | | | 28,692 | | | BNP Paribas | | | 2/23/22 | | | | 1,494 | | | | — | |
| | | | | | | |
| HUF | | | 8,900,000 | | | EUR | | | 23,897 | | | HSBC Bank USA, N.A. | | | 2/23/22 | | | | 1,207 | | | | — | |
| | | | | | | |
| HUF | | | 8,900,000 | | | EUR | | | 23,906 | | | HSBC Bank USA, N.A. | | | 2/23/22 | | | | 1,197 | | | | — | |
| | | | | | | |
| HUF | | | 5,900,000 | | | EUR | | | 15,840 | | | HSBC Bank USA, N.A. | | | 2/23/22 | | | | 802 | | | | — | |
| | | | | | | |
| HUF | | | 29,500,000 | | | EUR | | | 79,143 | | | Standard Chartered Bank | | | 2/23/22 | | | | 4,075 | | | | — | |
| | | | | | | |
| HUF | | | 5,800,000 | | | EUR | | | 15,591 | | | UBS AG | | | 2/23/22 | | | | 767 | | | | — | |
| | | | | | | |
| KES | | | 33,620,000 | | | USD | | | 288,089 | | | ICBC Standard Bank plc | | | 2/23/22 | | | | 6,638 | | | | — | |
| | | | | | | |
| KES | | | 16,826,000 | | | USD | | | 144,058 | | | ICBC Standard Bank plc | | | 2/23/22 | | | | 3,445 | | | | — | |
| | | | | | | |
| IDR | | | 114,528,840,885 | | | USD | | | 7,974,513 | | | Standard Chartered Bank | | | 2/25/22 | | | | — | | | | (2,336 | ) |
| | | | | | | |
| MYR | | | 58,950,000 | | | USD | | | 13,920,374 | | | Barclays Bank PLC | | | 2/28/22 | | | | 177,534 | | | | — | |
| | | | | | | |
| MYR | | | 2,313,126 | | | USD | | | 546,218 | | | Barclays Bank PLC | | | 2/28/22 | | | | 6,966 | | | | — | |
| | | | | | | |
| HUF | | | 799,896,273 | | | EUR | | | 2,151,292 | | | Bank of America, N.A. | | | 3/1/22 | | | | 102,671 | | | | — | |
| | | | | | | |
| HUF | | | 442,027,837 | | | EUR | | | 1,186,037 | | | Bank of America, N.A. | | | 3/1/22 | | | | 59,862 | | | | — | |
| | | | | | | |
| HUF | | | 789,300,000 | | | EUR | | | 2,119,070 | | | HSBC Bank USA, N.A. | | | 3/1/22 | | | | 105,496 | | | | — | |
| | | | | | | |
| HUF | | | 1,197,938,404 | | | EUR | | | 3,214,648 | | | Standard Chartered Bank | | | 3/1/22 | | | | 161,814 | | | | — | |
| | | | | | | |
| EGP | | | 14,350,000 | | | USD | | | 886,623 | | | Goldman Sachs International | | | 3/2/22 | | | | 20,044 | | | | — | |
| | | | | | | |
| EGP | | | 14,320,000 | | | USD | | | 886,413 | | | Goldman Sachs International | | | 3/2/22 | | | | 18,359 | | | | — | |
| | | | | | | |
| HUF | | | 1,249,000,000 | | | EUR | | | 3,357,502 | | | Bank of America, N.A. | | | 3/2/22 | | | | 161,674 | | | | — | |
| | | | | | | |
| HUF | | | 719,320,000 | | | EUR | | | 1,935,949 | | | Bank of America, N.A. | | | 3/2/22 | | | | 90,516 | | | | — | |
| | | | | | | |
| HUF | | | 618,500,000 | | | EUR | | | 1,664,099 | | | Bank of America, N.A. | | | 3/2/22 | | | | 78,400 | | | | — | |
| | | | | | | |
| HUF | | | 309,300,000 | | | EUR | | | 832,097 | | | Citibank, N.A. | | | 3/2/22 | | | | 39,304 | | | | — | |
| | | | | | | |
| KES | | | 30,470,000 | | | USD | | | 259,761 | | | Standard Chartered Bank | | | 3/2/22 | | | | 6,967 | | | | — | |
| | | | | | | |
| USD | | | 267,633 | | | KES | | | 30,470,000 | | | Standard Chartered Bank | | | 3/2/22 | | | | 905 | | | | — | |
| | | | | | | |
| KES | | | 30,400,000 | | | USD | | | 259,718 | | | Standard Chartered Bank | | | 3/4/22 | | | | 6,277 | | | | — | |
| | | | | | | |
| USD | | | 11,132,859 | | | IDR | | | 160,397,954,695 | | | Standard Chartered Bank | | | 3/4/22 | | | | — | | | | (36,137 | ) |
| | | | | | | |
| USD | | | 266,550 | | | KES | | | 30,400,000 | | | Standard Chartered Bank | | | 3/4/22 | | | | 555 | | | | — | |
| | | | |
| | 15 | | See Notes to Financial Statements. |
Eaton Vance
Emerging Markets Debt Opportunities Fund
January 31, 2022
Portfolio of Investments (Unaudited) — continued
| | | | | | | | | | | | | | | | | | | | | | | | |
| Forward Foreign Currency Exchange Contracts (continued) | |
| | | | | |
| Currency Purchased | | | Currency Sold | | | Counterparty | | Settlement
Date | | | Unrealized
Appreciation | | | Unrealized
(Depreciation) | |
| | | | | | | |
| MYR | | | 9,300,000 | | | USD | | | 2,188,235 | | | Goldman Sachs International | | | 3/7/22 | | | $ | 36,132 | | | $ | — | |
| | | | | | | |
| MYR | | | 8,779,000 | | | USD | | | 2,086,016 | | | Goldman Sachs International | | | 3/7/22 | | | | 13,738 | | | | — | |
| | | | | | | |
| MYR | | | 9,000,000 | | | USD | | | 2,143,878 | | | Goldman Sachs International | | | 3/7/22 | | | | 8,735 | | | | — | |
| | | | | | | |
| USD | | | 705,882 | | | MYR | | | 3,000,000 | | | Goldman Sachs International | | | 3/7/22 | | | | — | | | | (11,655 | ) |
| | | | | | | |
| KES | | | 30,780,000 | | | USD | | | 263,685 | | | Standard Chartered Bank | | | 3/8/22 | | | | 5,392 | | | | — | |
| | | | | | | |
| USD | | | 270,024 | | | KES | | | 30,780,000 | | | Standard Chartered Bank | | | 3/8/22 | | | | 947 | | | | — | |
| | | | | | | |
| PLN | | | 7,200,000 | | | EUR | | | 1,554,275 | | | HSBC Bank USA, N.A. | | | 3/10/22 | | | | 12,421 | | | | — | |
| | | | | | | |
| PLN | | | 1,289,000 | | | EUR | | | 276,015 | | | Citibank, N.A. | | | 3/17/22 | | | | 4,520 | | | | — | |
| | | | | | | |
| PLN | | | 1,600,000 | | | EUR | | | 343,146 | | | HSBC Bank USA, N.A. | | | 3/17/22 | | | | 5,006 | | | | — | |
| | | | | | | |
| PLN | | | 1,000,000 | | | EUR | | | 214,268 | | | HSBC Bank USA, N.A. | | | 3/17/22 | | | | 3,352 | | | | — | |
| | | | | | | |
| PLN | | | 1,000,000 | | | EUR | | | 214,477 | | | HSBC Bank USA, N.A. | | | 3/17/22 | | | | 3,118 | | | | — | |
| | | | | | | |
| PLN | | | 6,800,000 | | | EUR | | | 1,458,445 | | | Standard Chartered Bank | | | 3/17/22 | | | | 21,194 | | | | — | |
| | | | | | | |
| CNH | | | 196,185 | | | USD | | | 30,801 | | | Goldman Sachs International | | | 3/21/22 | | | | — | | | | (96 | ) |
| | | | | | | |
| USD | | | 13,636 | | | CNH | | | 86,851 | | | Goldman Sachs International | | | 3/21/22 | | | | 43 | | | | — | |
| | | | | | | |
| KES | | | 21,400,000 | | | USD | | | 183,062 | | | Standard Chartered Bank | | | 4/1/22 | | | | 3,009 | | | | — | |
| | | | | | | |
| USD | | | 185,249 | | | KES | | | 21,400,000 | | | Standard Chartered Bank | | | 4/1/22 | | | | — | | | | (822 | ) |
| | | | | | | |
| MYR | | | 10,351,000 | | | USD | | | 2,473,653 | | | Barclays Bank PLC | | | 4/5/22 | | | | 1,087 | | | | — | |
| | | | | | | |
| PLN | | | 5,100,000 | | | EUR | | | 1,106,053 | | | HSBC Bank USA, N.A. | | | 4/11/22 | | | | — | | | | (1,165 | ) |
| | | | | | | |
| PLN | | | 3,400,000 | | | EUR | | | 737,499 | | | Standard Chartered Bank | | | 4/11/22 | | | | — | | | | (923 | ) |
| | | | | | | |
| PLN | | | 4,340,000 | | | EUR | | | 944,977 | | | Standard Chartered Bank | | | 4/11/22 | | | | — | | | | (5,208 | ) |
| | | | | | | |
| PLN | | | 31,700,000 | | | EUR | | | 6,873,970 | | | Standard Chartered Bank | | | 4/11/22 | | | | — | | | | (6,217 | ) |
| | | | | | | |
| PLN | | | 10,005,000 | | | EUR | | | 2,179,673 | | | Standard Chartered Bank | | | 4/11/22 | | | | — | | | | (13,377 | ) |
| | | | | | | |
| PLN | | | 62,800,000 | | | EUR | | | 13,627,585 | | | Standard Chartered Bank | | | 4/11/22 | | | | — | | | | (23,290 | ) |
| | | | | | | |
| PLN | | | 4,700,000 | | | EUR | | | 1,027,642 | | | BNP Paribas | | | 4/20/22 | | | | — | | | | (11,654 | ) |
| | | | | | | |
| PLN | | | 3,700,000 | | | EUR | | | 809,098 | | | Goldman Sachs International | | | 4/20/22 | | | | — | | | | (9,291 | ) |
| | | | | | | |
| PLN | | | 12,700,000 | | | EUR | | | 2,776,685 | | | Standard Chartered Bank | | | 4/20/22 | | | | — | | | | (31,339 | ) |
| | | | | | | |
| PLN | | | 35,500,000 | | | EUR | | | 7,762,340 | | | Standard Chartered Bank | | | 4/20/22 | | | | — | | | | (88,435 | ) |
| | | | | | | |
| HUF | | | 920,107,486 | | | EUR | | | 2,545,362 | | | Standard Chartered Bank | | | 4/25/22 | | | | 18,663 | | | | — | |
| | | | | | | |
| HUF | | | 118,620,000 | | | EUR | | | 328,001 | | | Standard Chartered Bank | | | 4/25/22 | | | | 2,570 | | | | — | |
| | | | | | | |
| HUF | | | 191,910,000 | | | EUR | | | 532,616 | | | Standard Chartered Bank | | | 4/25/22 | | | | 1,956 | | | | — | |
| | | | | | | |
| HUF | | | 830,310,000 | | | EUR | | | 2,313,827 | | | Standard Chartered Bank | | | 4/25/22 | | | | — | | | | (2,158 | ) |
| | | | | | | |
| USD | | | 20,250,015 | | | CNH | | | 128,878,302 | | | UBS AG | | | 4/25/22 | | | | 120,506 | | | | — | |
| | | | | | | |
| HUF | | | 2,020,054,641 | | | EUR | | | 5,561,184 | | | Citibank, N.A. | | | 4/27/22 | | | | 69,819 | | | | — | |
| | | | | | | |
| HUF | | | 2,105,745,359 | | | EUR | | | 5,794,675 | | | Standard Chartered Bank | | | 4/27/22 | | | | 75,500 | | | | — | |
| | | | | | | |
| MYR | | | 18,064,420 | | | USD | | | 4,298,085 | | | Barclays Bank PLC | | | 4/27/22 | | | | 17,136 | | | | — | |
| | | | | | | |
| ZAR | | | 80,570,000 | | | USD | | | 5,252,894 | | | Standard Chartered Bank | | | 4/28/22 | | | | — | | | | (73,196 | ) |
| | | | | | | |
| UZS | | | 6,110,141,000 | | | USD | | | 534,804 | | | ICBC Standard Bank plc | | | 5/6/22 | | | | 15,356 | | | | — | |
| | | | | | | |
| KES | | | 15,900,000 | | | USD | | | 140,484 | | | Standard Chartered Bank | | | 5/11/22 | | | | — | | | | (3,522 | ) |
| | | | | | | |
| USD | | | 136,130 | | | KES | | | 15,900,000 | | | Standard Chartered Bank | | | 5/11/22 | | | | — | | | | (832 | ) |
| | | | | | | |
| KES | | | 25,292,000 | | | USD | | | 222,347 | | | ICBC Standard Bank plc | | | 5/18/22 | | | | — | | | | (4,805 | ) |
| | | | | | | |
| KES | | | 45,200,000 | | | USD | | | 396,144 | | | Standard Chartered Bank | | | 5/20/22 | | | | — | | | | (7,533 | ) |
| | | | | | | |
| USD | | | 386,028 | | | KES | | | 45,200,000 | | | Standard Chartered Bank | | | 5/20/22 | | | | — | | | | (2,583 | ) |
| | | | | | | |
| KES | | | 45,925,000 | | | USD | | | 401,267 | | | Standard Chartered Bank | | | 6/6/22 | | | | — | | | | (7,838 | ) |
| | | | | | | |
| USD | | | 389,360 | | | KES | | | 45,925,000 | | | Standard Chartered Bank | | | 6/6/22 | | | | — | | | | (4,069 | ) |
| | | | | | | |
| KES | | | 22,740,000 | | | USD | | | 198,950 | | | Goldman Sachs International | | | 6/8/22 | | | | — | | | | (4,224 | ) |
| | | | |
| | 16 | | See Notes to Financial Statements. |
Eaton Vance
Emerging Markets Debt Opportunities Fund
January 31, 2022
Portfolio of Investments (Unaudited) — continued
| | | | | | | | | | | | | | | | | | | | | | | | |
| Forward Foreign Currency Exchange Contracts (continued) | |
| | | | | |
| Currency Purchased | | | Currency Sold | | | Counterparty | | Settlement
Date | | | Unrealized
Appreciation | | | Unrealized
(Depreciation) | |
| | | | | | | |
| KES | | | 45,890,000 | | | USD | | | 401,312 | | | Standard Chartered Bank | | | 6/8/22 | | | $ | — | | | $ | (8,348 | ) |
| | | | | | | |
| USD | | | 192,745 | | | KES | | | 22,740,000 | | | Goldman Sachs International | | | 6/8/22 | | | | — | | | | (1,982 | ) |
| | | | | | | |
| USD | | | 389,559 | | | KES | | | 45,890,000 | | | Standard Chartered Bank | | | 6/8/22 | | | | — | | | | (3,405 | ) |
| | | | | | | |
| KES | | | 38,000,000 | | | USD | | | 330,435 | | | Bank of America, N.A. | | | 6/10/22 | | | | — | | | | (5,172 | ) |
| | | | | | | |
| KES | | | 70,000,000 | | | USD | | | 599,315 | | | Standard Chartered Bank | | | 8/10/22 | | | | — | | | | (7,572 | ) |
| | | | | | | |
| USD | | | 586,216 | | | KES | | | 70,000,000 | | | Standard Chartered Bank | | | 8/10/22 | | | | — | | | | (5,528 | ) |
| | | | | | | |
| | | | | | | | | | | | | | | | | | | $ | 3,386,736 | | | $ | (538,628 | ) |
| | | | | | | | | | | | | | | | | | |
| Non-deliverable Bond Forward Contracts* | |
| | | | | |
| Settlement Date | | Notional Amount
(000’s omitted) | | | Reference Entity | | Counterparty | | Aggregate Cost | | | Unrealized
Appreciation
(Depreciation) | |
| | | | | | |
| 2/15/22 | | COP | | | 15,290,600 | | | Republic of Colombia,
6.25%, 11/26/25 | | Goldman Sachs International | | $ | 3,873,210 | | | $ | (132,406 | ) |
| | | | | | |
| 3/15/22 | | COP | | | 31,658,050 | | | Republic of Colombia,
5.75%, 11/3/27 | | Bank of America, N.A. | | | 8,019,193 | | | | 13,721 | |
| | | | | | |
| 3/17/22 | | COP | | | 62,796,130 | | | Republic of Colombia,
6.00%, 4/28/28 | | Bank of America, N.A. | | | 15,906,674 | | | | 922 | |
| | | | | | |
| 3/17/22 | | COP | | | 23,377,700 | | | Republic of Colombia,
6.25%, 11/26/25 | | Goldman Sachs International | | | 5,921,726 | | | | 15,461 | |
| | | | | | |
| 3/25/22 | | COP | | | 13,830,700 | | | Republic of Colombia,
6.25%, 11/26/25 | | Goldman Sachs International | | | 3,503,407 | | | | (7,932 | ) |
| | | | | | |
| 3/29/22 | | COP | | | 22,400,000 | | | Republic of Colombia,
6.25%, 11/26/25 | | Bank of America, N.A. | | | 5,674,068 | | | | 16,251 | |
| | | | | | |
| 3/30/22 | | COP | | | 31,658,050 | | | Republic of Colombia,
5.75%, 11/3/27 | | Bank of America, N.A. | | | 8,019,193 | | | | 21,588 | |
| | | | | | |
| 3/30/22 | | COP | | | 14,933,400 | | | Republic of Colombia,
6.25%, 11/26/25 | | Bank of America, N.A. | | | 3,782,729 | | | | 1,891 | |
| | | | | | |
| | | | | | | | | | | | | | | | | $ | (70,504 | ) |
| * | Represents a short-term forward contract to purchase the reference entity denominated in a non-deliverable foreign currency. |
| | | | | | | | | | | | | | | | | | | | |
| Futures Contracts | | | | | | | | | | | | | | | |
| | | | | |
| Description | | Number of
Contracts | | | Position | | | Expiration
Date | | | Notional
Amount | | | Value/Unrealized
Appreciation | |
| | | | | |
Interest Rate Futures | | | | | | | | | | | | | | | | | | | | |
| | | | | |
| Euro-Bobl | | | (19 | ) | | | Short | | | | 3/8/22 | | | $ | (2,822,737 | ) | | $ | 38,184 | |
| | | | | |
| Euro-Bund | | | (210 | ) | | | Short | | | | 3/8/22 | | | | (39,897,204 | ) | | | 1,103,787 | |
| | | | | |
| Euro-Buxl | | | (152 | ) | | | Short | | | | 3/8/22 | | | | (34,716,413 | ) | | | 2,134,361 | |
| | | | | |
| U.S. 5-Year Treasury Note | | | (1,392 | ) | | | Short | | | | 3/31/22 | | | | (165,930,750 | ) | | | 1,680,181 | |
| | | | | |
| U.S. 10-Year Treasury Note | | | (763 | ) | | | Short | | | | 3/22/22 | | | | (97,640,156 | ) | | | 678,956 | |
| | | | | |
| U.S. Long Treasury Bond | | | (5 | ) | | | Short | | | | 3/22/22 | | | | (778,125 | ) | | | 2,022 | |
| | | | | |
| U.S. Ultra-Long Treasury Bond | | | (245 | ) | | | Short | | | | 3/22/22 | | | | (46,289,688 | ) | | | 1,065,570 | |
| | | | | |
| | | | | | | | | | | | | | | | | | | $ | 6,703,061 | |
| | | | |
| | 17 | | See Notes to Financial Statements. |
Eaton Vance
Emerging Markets Debt Opportunities Fund
January 31, 2022
Portfolio of Investments (Unaudited) — continued
| | | | | | | | | | | | | | | | | | | | | | | | |
| Centrally Cleared Interest Rate Swaps | |
| | | | | | | |
Notional
Amount
(000’s omitted) | | Fund
Pays/Receives
Floating Rate | | Floating Rate | | Annual
Fixed Rate | | Termination
Date | | | Value | | | Unamortized
Upfront
Receipts
(Payments) | | | Unrealized
Appreciation
(Depreciation) | |
| | | | | | | | |
| BRL | | 10,400 | | Pays | | Brazil CETIP Interbank Deposit Rate
(pays upon termination) | | 4.07%
(pays upon termination) | | | 1/2/23 | | | $ | (135,746 | ) | | $ | — | | | $ | (135,746 | ) |
| | | | | | | | |
| BRL | | 28,677 | | Pays | | Brazil CETIP Interbank Deposit Rate
(pays upon termination) | | 4.70%
(pays upon termination) | | | 1/2/23 | | | | (266,070 | ) | | | — | | | | (266,070 | ) |
| | | | | | | | |
| BRL | | 39,152 | | Receives | | Brazil CETIP Interbank Deposit Rate
(pays upon termination) | | 5.15%
(pays upon termination) | | | 1/2/23 | | | | 400,940 | | | | — | | | | 400,940 | |
| | | | | | | | |
| BRL | | 122,312 | | Pays | | Brazil CETIP Interbank Deposit Rate
(pays upon termination) | | 8.91%
(pays upon termination) | | | 1/2/23 | | | | (548,933 | ) | | | — | | | | (548,933 | ) |
| | | | | | | | |
| COP | | 2,551,300 | | Receives | | Colombia Overnight Interbank Reference Rate
(pays quarterly) | | 4.21%
(pays quarterly) | | | 11/26/25 | | | | 56,536 | | | | — | | | | 56,536 | |
| | | | | | | | |
| COP | | 2,616,700 | | Receives | | Colombia Overnight Interbank Reference Rate
(pays quarterly) | | 4.02%
(pays quarterly) | | | 11/26/25 | | | | 62,506 | | | | — | | | | 62,506 | |
| | | | | | | | |
| COP | | 3,238,100 | | Receives | | Colombia Overnight Interbank Reference Rate
(pays quarterly) | | 4.73%
(pays quarterly) | | | 11/26/25 | | | | 56,298 | | | | — | | | | 56,298 | |
| | | | | | | | |
| COP | | 3,266,600 | | Receives | | Colombia Overnight Interbank Reference Rate
(pays quarterly) | | 3.76%
(pays quarterly) | | | 11/26/25 | | | | 85,604 | | | | — | | | | 85,604 | |
| | | | | | | | |
| COP | | 3,266,600 | | Receives | | Colombia Overnight Interbank Reference Rate
(pays quarterly) | | 3.89%
(pays quarterly) | | | 11/26/25 | | | | 81,743 | | | | — | | | | 81,743 | |
| | | | | | | | |
| COP | | 3,514,100 | | Receives | | Colombia Overnight Interbank Reference Rate
(pays quarterly) | | 4.34%
(pays quarterly) | | | 11/26/25 | | | | 73,437 | | | | — | | | | 73,437 | |
| | | | | | | | |
| COP | | 3,964,700 | | Receives | | Colombia Overnight Interbank Reference Rate
(pays quarterly) | | 4.20%
(pays quarterly) | | | 11/26/25 | | | | 88,037 | | | | — | | | | 88,037 | |
| | | | | | | | |
| COP | | 5,766,800 | | Receives | | Colombia Overnight Interbank Reference Rate
(pays quarterly) | | 4.25%
(pays quarterly) | | | 11/26/25 | | | | 125,432 | | | | — | | | | 125,432 | |
| | | | | | | | |
| COP | | 6,149,300 | | Receives | | Colombia Overnight Interbank Reference Rate
(pays quarterly) | | 4.05%
(pays quarterly) | | | 11/26/25 | | | | 144,788 | | | | — | | | | 144,788 | |
| | | | | | | | |
| COP | | 6,533,100 | | Receives | | Colombia Overnight Interbank Reference Rate
(pays quarterly) | | 4.00%
(pays quarterly) | | | 11/26/25 | | | | 156,949 | | | | — | | | | 156,949 | |
| | | | | | | | |
| COP | | 6,533,100 | | Receives | | Colombia Overnight Interbank Reference Rate
(pays quarterly) | | 4.07%
(pays quarterly) | | | 11/26/25 | | | | 152,791 | | | | — | | | | 152,791 | |
| | | | | | | | |
| COP | | 6,533,100 | | Receives | | Colombia Overnight Interbank Reference Rate
(pays quarterly) | | 4.20%
(pays quarterly) | | | 11/26/25 | | | | 145,069 | | | | — | | | | 145,069 | |
| | | | | | | | |
| COP | | 6,533,100 | | Receives | | Colombia Overnight Interbank Reference Rate
(pays quarterly) | | 4.28%
(pays quarterly) | | | 11/26/25 | | | | 140,317 | | | | — | | | | 140,317 | |
| | | | |
| | 18 | | See Notes to Financial Statements. |
Eaton Vance
Emerging Markets Debt Opportunities Fund
January 31, 2022
Portfolio of Investments (Unaudited) — continued
| | | | | | | | | | | | | | | | | | | | | | | | |
| Centrally Cleared Interest Rate Swaps (continued) | |
| | | | | | | |
Notional
Amount
(000’s omitted) | | Fund
Pays/Receives
Floating Rate | | Floating Rate | | Annual
Fixed Rate | | Termination
Date | | | Value | | | Unamortized
Upfront
Receipts
(Payments) | | | Unrealized
Appreciation
(Depreciation) | |
| | | | | | | | |
| COP | | 6,541,800 | | Receives | | Colombia Overnight Interbank Reference Rate
(pays quarterly) | | 4.55%
(pays quarterly) | | | 11/26/25 | | | $ | 124,741 | | | $ | — | | | $ | 124,741 | |
| | | | | | | | |
| COP | | 7,036,300 | | Receives | | Colombia Overnight Interbank Reference Rate
(pays quarterly) | | 4.16%
(pays quarterly) | | | 11/26/25 | | | | 158,802 | | | | — | | | | 158,802 | |
| | | | | | | | |
| COP | | 8,375,100 | | Receives | | Colombia Overnight Interbank Reference Rate
(pays quarterly) | | 4.11%
(pays quarterly) | | | 11/26/25 | | | | 193,205 | | | | — | | | | 193,205 | |
| | | | | | | | |
| COP | | 11,139,200 | | Receives | | Colombia Overnight Interbank Reference Rate
(pays quarterly) | | 4.53%
(pays quarterly) | | | 11/26/25 | | | | 214,026 | | | | — | | | | 214,026 | |
| | | | | | | | |
| COP | | 11,139,200 | | Pays | | Colombia Overnight Interbank Reference Rate
(pays quarterly) | | 5.68%
(pays quarterly) | | | 11/26/25 | | | | (97,450 | ) | | | — | | | | (97,450 | ) |
| | | | | | | | |
| COP | | 13,613,700 | | Receives | | Colombia Overnight Interbank Reference Rate
(pays quarterly) | | 4.78%
(pays quarterly) | | | 11/26/25 | | | | 230,502 | | | | — | | | | 230,502 | |
| | | | | | | | |
| COP | | 32,427,100 | | Receives | | Colombia Overnight Interbank Reference Rate
(pays quarterly) | | 4.38%
(pays quarterly) | | | 3/30/26 | | | | 742,876 | | | | — | | | | 742,876 | |
| | | | | | | | |
| COP | | 65,491,400 | | Receives | | Colombia Overnight Interbank Reference Rate
(pays quarterly) | | 4.38%
(pays quarterly) | | | 3/30/26 | | | | 1,501,597 | | | | — | | | | 1,501,597 | |
| | | | | | | | |
| COP | | 19,292,000 | | Receives | | Colombia Overnight Interbank Reference Rate
(pays quarterly) | | 4.48%
(pays quarterly) | | | 3/31/26 | | | | 423,322 | | | | — | | | | 423,322 | |
| | | | | | | | |
| COP | | 20,652,000 | | Receives | | Colombia Overnight Interbank Reference Rate
(pays quarterly) | | 4.56%
(pays quarterly) | | | 4/6/26 | | | | 440,259 | | | | — | | | | 440,259 | |
| | | | | | | | |
| COP | | 9,785,000 | | Receives | | Colombia Overnight Interbank Reference Rate
(pays quarterly) | | 4.15%
(pays quarterly) | | | 4/19/26 | | | | 250,005 | | | | — | | | | 250,005 | |
| | | | | | | | |
| COP | | 4,129,200 | | Receives | | Colombia Overnight Interbank Reference Rate
(pays quarterly) | | 4.83%
(pays quarterly) | | | 3/26/28 | | | | 115,855 | | | | — | | | | 115,855 | |
| | | | | | | | |
| COP | | 5,780,900 | | Receives | | Colombia Overnight Interbank Reference Rate
(pays quarterly) | | 4.82%
(pays quarterly) | | | 3/26/28 | | | | 162,958 | | | | — | | | | 162,958 | |
| | | | | | | | |
| COP | | 6,462,800 | | Receives | | Colombia Overnight Interbank Reference Rate
(pays quarterly) | | 4.82%
(pays quarterly) | | | 3/26/28 | | | | 181,755 | | | | — | | | | 181,755 | |
| | | | | | | | |
| KRW | | 192,866,600 | | Pays | | 3-month KRW Certificate of Deposit Rate
(pays quarterly) | | 1.91%
(pays quarterly) | | | 10/11/23 | | | | (645,379 | ) | | | — | | | | (645,379 | ) |
| | | | | | | | |
| KRW | | 257,133,400 | | Pays | | 3-month KRW Certificate of Deposit Rate
(pays quarterly) | | 1.91%
(pays quarterly) | | | 10/11/23 | | | | (856,870 | ) | | | — | | | | (856,870 | ) |
| | | | |
| | 19 | | See Notes to Financial Statements. |
Eaton Vance
Emerging Markets Debt Opportunities Fund
January 31, 2022
Portfolio of Investments (Unaudited) — continued
| | | | | | | | | | | | | | | | | | | | | | | | |
| Centrally Cleared Interest Rate Swaps (continued) | |
| | | | | | | |
Notional
Amount
(000’s omitted) | | Fund
Pays/Receives
Floating Rate | | Floating Rate | | Annual
Fixed Rate | | Termination
Date | | | Value | | | Unamortized
Upfront
Receipts
(Payments) | | | Unrealized
Appreciation
(Depreciation) | |
| | | | | | | | |
| MXN | | 19,740 | | Pays | | Mexico Interbank TIIE 28 Day
(pays monthly) | | 5.38%
(pays monthly) | | | 4/13/22 | | | $ | (1,548 | ) | | $ | — | | | $ | (1,548 | ) |
| | | | | | | | |
| MXN | | 40,800 | | Pays | | Mexico Interbank TIIE 28 Day
(pays monthly) | | 5.35%
(pays monthly) | | | 4/13/22 | | | | (3,339 | ) | | | — | | | | (3,339 | ) |
| | | | | | | | |
| MXN | | 19,740 | | Pays | | Mexico Interbank TIIE 28 Day
(pays monthly) | | 5.25%
(pays monthly) | | | 4/14/22 | | | | (1,852 | ) | | | — | | | | (1,852 | ) |
| | | | | | | | |
| MXN | | 61,687 | | Pays | | Mexico Interbank TIIE 28 Day
(pays monthly) | | 5.29%
(pays monthly) | | | 4/14/22 | | | | (5,485 | ) | | | — | | | | (5,485 | ) |
| | | | | | | | |
| MXN | | 12,863 | | Pays | | Mexico Interbank TIIE 28 Day
(pays monthly) | | 5.16%
(pays monthly) | | | 4/15/22 | | | | (1,354 | ) | | | — | | | | (1,354 | ) |
| | | | | | | | |
| MXN | | 19,740 | | Pays | | Mexico Interbank TIIE 28 Day
(pays monthly) | | 5.20%
(pays monthly) | | | 4/15/22 | | | | (1,987 | ) | | | — | | | | (1,987 | ) |
| | | | | | | | |
| MXN | | 19,740 | | Pays | | Mexico Interbank TIIE 28 Day
(pays monthly) | | 5.14%
(pays monthly) | | | 4/18/22 | | | | (2,184 | ) | | | — | | | | (2,184 | ) |
| | | | | | | | |
| MXN | | 132,000 | | Pays | | Mexico Interbank TIIE 28 Day
(pays monthly) | | 4.23%
(pays monthly) | | | 1/6/23 | | | | (171,193 | ) | | | — | | | | (171,193 | ) |
| | | | | | | | |
| MXN | | 22,000 | | Pays | | Mexico Interbank TIIE 28 Day
(pays monthly) | | 4.69%
(pays monthly) | | | 8/30/23 | | | | (43,777 | ) | | | — | | | | (43,777 | ) |
| | | | | | | | |
| MXN | | 67,000 | | Pays | | Mexico Interbank TIIE 28 Day
(pays monthly) | | 4.64%
(pays monthly) | | | 9/22/23 | | | | (142,194 | ) | | | — | | | | (142,194 | ) |
| | | | | | | | |
| MXN | | 100,000 | | Pays | | Mexico Interbank TIIE 28 Day
(pays monthly) | | 4.63%
(pays monthly) | | | 10/13/23 | | | | (222,429 | ) | | | — | | | | (222,429 | ) |
| | | | | | | | |
| MXN | | 90,000 | | Pays | | Mexico Interbank TIIE 28 Day
(pays monthly) | | 4.59%
(pays monthly) | | | 11/29/23 | | | | (216,745 | ) | | | — | | | | (216,745 | ) |
| | | | | | | | |
| MXN | | 113,000 | | Pays | | Mexico Interbank TIIE 28 Day
(pays monthly) | | 4.41%
(pays monthly) | | | 12/21/23 | | | | (300,389 | ) | | | — | | | | (300,389 | ) |
| | | | | | | | |
| MXN | | 64,000 | | Pays | | Mexico Interbank TIIE 28 Day
(pays monthly) | | 8.45%
(pays monthly) | | | 1/3/24 | | | | 61,442 | | | | — | | | | 61,442 | |
| | | | | | | | |
| MXN | | 63,000 | | Pays | | Mexico Interbank TIIE 28 Day
(pays monthly) | | 8.38%
(pays monthly) | | | 1/18/24 | | | | 53,611 | | | | (4 | ) | | | 53,607 | |
| | | | | | | | |
| MXN | | 68,044 | | Receives | | Mexico Interbank TIIE 28 Day
(pays monthly) | | 6.79%
(pays monthly) | | | 3/7/24 | | | | 43,230 | | | | — | | | | 43,230 | |
| | | | | | | | |
| MXN | | 244,837 | | Receives | | Mexico Interbank TIIE 28 Day
(pays monthly) | | 6.76%
(pays monthly) | | | 3/7/24 | | | | 162,718 | | | | — | | | | 162,718 | |
| | | | | | | | |
| MXN | | 66,900 | | Receives | | Mexico Interbank TIIE 28 Day
(pays monthly) | | 7.35%
(pays monthly) | | | 3/14/24 | | | | 7,144 | | | | — | | | | 7,144 | |
| | | | | | | | |
| MXN | | 30,000 | | Pays | | Mexico Interbank TIIE 28 Day
(pays monthly) | | 7.75%
(pays monthly) | | | 4/1/24 | | | | 9,279 | | | | 373 | | | | 9,652 | |
| | | | | | | | |
| MXN | | 46,163 | | Pays | | Mexico Interbank TIIE 28 Day
(pays monthly) | | 7.63%
(pays monthly) | | | 5/23/24 | | | | 9,776 | | | | — | | | | 9,776 | |
| | | | | | | | |
| MXN | | 48,837 | | Pays | | Mexico Interbank TIIE 28 Day
(pays monthly) | | 7.64%
(pays monthly) | | | 5/23/24 | | | | 10,735 | | | | — | | | | 10,735 | |
| | | | | | | | |
| MXN | | 21,000 | | Pays | | Mexico Interbank TIIE 28 Day
(pays monthly) | | 6.80%
(pays monthly) | | | 9/10/24 | | | | (16,109 | ) | | | — | | | | (16,109 | ) |
| | | | | | | | |
| MXN | | 40,000 | | Pays | | Mexico Interbank TIIE 28 Day
(pays monthly) | | 6.65%
(pays monthly) | | | 11/15/24 | | | | (40,533 | ) | | | 1,010 | | | | (39,523 | ) |
| | | | | | | | |
| MXN | | 40,000 | | Pays | | Mexico Interbank TIIE 28 Day
(pays monthly) | | 6.58%
(pays monthly) | | | 1/1/25 | | | | (45,364 | ) | | | — | | | | (45,364 | ) |
| | | | |
| | 20 | | See Notes to Financial Statements. |
Eaton Vance
Emerging Markets Debt Opportunities Fund
January 31, 2022
Portfolio of Investments (Unaudited) — continued
| | | | | | | | | | | | | | | | | | | | | | | | |
| Centrally Cleared Interest Rate Swaps (continued) | |
| | | | | | | |
Notional
Amount
(000’s omitted) | | Fund
Pays/Receives
Floating Rate | | Floating Rate | | Annual
Fixed Rate | | Termination
Date | | | Value | | | Unamortized
Upfront
Receipts
(Payments) | | | Unrealized
Appreciation
(Depreciation) | |
| | | | | | | | |
| MXN | | 85,900 | | Pays | | Mexico Interbank TIIE 28 Day
(pays monthly) | | 4.63%
(pays monthly) | | | 1/9/25 | | | $ | (320,301 | ) | | $ | — | | | $ | (320,301 | ) |
| | | | | | | | |
| MXN | | 85,800 | | Pays | | Mexico Interbank TIIE 28 Day
(pays monthly) | | 4.61%
(pays monthly) | | | 1/10/25 | | | | (321,324 | ) | | | — | | | | (321,324 | ) |
| | | | | | | | |
| MXN | | 68,000 | | Pays | | Mexico Interbank TIIE 28 Day
(pays monthly) | | 4.56%
(pays monthly) | | | 1/20/25 | | | | (260,545 | ) | | | — | | | | (260,545 | ) |
| | | | | | | | |
| MXN | | 161,000 | | Pays | | Mexico Interbank TIIE 28 Day
(pays monthly) | | 4.55%
(pays monthly) | | | 1/23/25 | | | | (619,177 | ) | | | — | | | | (619,177 | ) |
| | | | | | | | |
| MXN | | 45,000 | | Pays | | Mexico Interbank TIIE 28 Day
(pays monthly) | | 4.67%
(pays monthly) | | | 2/5/25 | | | | (168,867 | ) | | | — | | | | (168,867 | ) |
| | | | | | | | |
| MXN | | 150,000 | | Pays | | Mexico Interbank TIIE 28 Day
(pays monthly) | | 4.60%
(pays monthly) | | | 2/5/25 | | | | (577,650 | ) | | | — | | | | (577,650 | ) |
| | | | | | | | |
| MXN | | 95,000 | | Pays | | Mexico Interbank TIIE 28 Day
(pays monthly) | | 4.72%
(pays monthly) | | | 2/13/25 | | | | (352,000 | ) | | | — | | | | (352,000 | ) |
| | | | | | | | |
| MXN | | 112,000 | | Pays | | Mexico Interbank TIIE 28 Day
(pays monthly) | | 5.00%
(pays monthly) | | | 2/25/25 | | | | (377,154 | ) | | | — | | | | (377,154 | ) |
| | | | | | | | |
| MXN | | 77,000 | | Pays | | Mexico Interbank TIIE 28 Day
(pays monthly) | | 5.22%
(pays monthly) | | | 3/4/25 | | | | (236,980 | ) | | | — | | | | (236,980 | ) |
| | | | | | | | |
| MXN | | 56,000 | | Pays | | Mexico Interbank TIIE 28 Day
(pays monthly) | | 5.44%
(pays monthly) | | | 3/14/25 | | | | (156,425 | ) | | | — | | | | (156,425 | ) |
| | | | | | | | |
| MXN | | 31,400 | | Pays | | Mexico Interbank TIIE 28 Day
(pays monthly) | | 4.88%
(pays monthly) | | | 7/16/25 | | | | (123,422 | ) | | | — | | | | (123,422 | ) |
| | | | | | | | |
| MXN | | 26,000 | | Pays | | Mexico Interbank TIIE 28 Day
(pays monthly) | | 4.69%
(pays monthly) | | | 12/23/25 | | | | (120,912 | ) | | | — | | | | (120,912 | ) |
| | | | | | | | |
| MXN | | 127,000 | | Pays | | Mexico Interbank TIIE 28 Day
(pays monthly) | | 6.07%
(pays monthly) | | | 4/28/26 | | | | (319,970 | ) | | | — | | | | (319,970 | ) |
| | | | | | | | |
| MXN | | 166,000 | | Pays | | Mexico Interbank TIIE 28 Day
(pays monthly) | | 6.69%
(pays monthly) | | | 6/19/26 | | | | (233,438 | ) | | | — | | | | (233,438 | ) |
| | | | | | | | |
| MXN | | 57,000 | | Pays | | Mexico Interbank TIIE 28 Day
(pays monthly) | | 6.56%
(pays monthly) | | | 7/10/26 | | | | (96,077 | ) | | | — | | | | (96,077 | ) |
| | | | | | | | |
| MXN | | 52,000 | | Pays | | Mexico Interbank TIIE 28 Day
(pays monthly) | | 6.43%
(pays monthly) | | | 8/10/26 | | | | (101,735 | ) | | | — | | | | (101,735 | ) |
| | | | | | | | |
| MXN | | 384,000 | | Pays | | Mexico Interbank TIIE 28 Day
(pays monthly) | | 6.57%
(pays monthly) | | | 9/11/26 | | | | (647,995 | ) | | | — | | | | (647,995 | ) |
| | | | | | | | |
| MXN | | 285,000 | | Pays | | Mexico Interbank TIIE 28 Day
(pays monthly) | | 7.42%
(pays monthly) | | | 11/18/26 | | | | (15,906 | ) | | | — | | | | (15,906 | ) |
| | | | | | | | |
| MXN | | 31,000 | | Pays | | Mexico Interbank TIIE 28 Day
(pays monthly) | | 7.06%
(pays monthly) | | | 7/30/29 | | | | (38,270 | ) | | | — | | | | (38,270 | ) |
| | | | | | | | |
| MXN | | 29,700 | | Receives | | Mexico Interbank TIIE 28 Day
(pays monthly) | | 7.75%
(pays monthly) | | | 3/7/30 | | | | (22,366 | ) | | | — | | | | (22,366 | ) |
| | | | | | | | |
| MYR | | 17,000 | | Pays | | 3-month MYR KLIBOR
(pays quarterly) | | 2.96%
(pays quarterly) | | | 11/22/26 | | | | (24,298 | ) | | | 108 | | | | (24,190 | ) |
| | | | | | | | |
| ZAR | | 36,590 | | Pays | | 3-month ZAR JIBAR
(pays quarterly) | | 5.47%
(pays quarterly) | | | 2/24/26 | | | | (74,665 | ) | | | 103 | | | | (74,562 | ) |
| | | | | | | | |
| ZAR | | 51,710 | | Pays | | 3-month ZAR JIBAR
(pays quarterly) | | 5.41%
(pays quarterly) | | | 2/24/26 | | | | (113,144 | ) | | | 141 | | | | (113,003 | ) |
| | | | | | | | |
| ZAR | | 51,870 | | Pays | | 3-month ZAR JIBAR
(pays quarterly) | | 5.45%
(pays quarterly) | | | 2/24/26 | | | | (108,395 | ) | | | 145 | | | | (108,250 | ) |
| | | | |
| | 21 | | See Notes to Financial Statements. |
Eaton Vance
Emerging Markets Debt Opportunities Fund
January 31, 2022
Portfolio of Investments (Unaudited) — continued
| | | | | | | | | | | | | | | | | | | | | | | | | | |
| Centrally Cleared Interest Rate Swaps (continued) | |
| | | | | | | |
Notional
Amount
(000’s omitted) | | Fund
Pays/Receives
Floating Rate | | | Floating Rate | | Annual
Fixed Rate | | Termination
Date | | | Value | | | Unamortized
Upfront
Receipts
(Payments) | | | Unrealized
Appreciation
(Depreciation) | |
| | | | | | | | |
| ZAR | | 51,900 | | | Pays | | | 3-month ZAR JIBAR
(pays quarterly) | | 5.51%
(pays quarterly) | | | 2/24/26 | | | $ | (100,804 | ) | | $ | 150 | | | $ | (100,654 | ) |
| | | | | | | | |
| ZAR | | 51,900 | | | Pays | | | 3-month ZAR JIBAR
(pays quarterly) | | 5.41%
(pays quarterly) | | | 2/24/26 | | | | (113,559 | ) | | | 142 | | | | (113,417 | ) |
| | | | | | | | |
| ZAR | | 68,900 | | | Pays | | | 3-month ZAR JIBAR
(pays quarterly) | | 5.52%
(pays quarterly) | | | 2/24/26 | | | | (132,129 | ) | | | 200 | | | | (131,929 | ) |
| | | | | | | | |
| ZAR | | 91,545 | | | Pays | | | 3-month ZAR JIBAR
(pays quarterly) | | 5.82%
(pays quarterly) | | | 3/11/26 | | | | (116,593 | ) | | | 302 | | | | (116,291 | ) |
| | | | | | | | |
| ZAR | | 103,650 | | | Pays | | | 3-month ZAR JIBAR
(pays quarterly) | | 5.88%
(pays quarterly) | | | 3/11/26 | | | | (116,789 | ) | | | 351 | | | | (116,438 | ) |
| | | | | | | | |
| ZAR | | 103,650 | | | Pays | | | 3-month ZAR JIBAR
(pays quarterly) | | 5.82%
(pays quarterly) | | | 3/11/26 | | | | (132,010 | )�� | | | 342 | | | | (131,668 | ) |
| | | | | | | | |
| ZAR | | 41,843 | | | Pays | | | 3-month ZAR JIBAR
(pays quarterly) | | 5.85%
(pays quarterly) | | | 5/28/26 | | | | (57,921 | ) | | | 158 | | | | (57,763 | ) |
| | | | | | | | |
| ZAR | | 95,000 | | | Pays | | | 3-month ZAR JIBAR
(pays quarterly) | | 5.85%
(pays quarterly) | | | 6/24/26 | | | | (148,241 | ) | | | 352 | | | | (147,889 | ) |
| | | | | | | | |
| ZAR | | 79,900 | | | Pays | | | 3-month ZAR JIBAR
(pays quarterly) | | 6.02%
(pays quarterly) | | | 7/15/26 | | | | (99,748 | ) | | | 312 | | | | (99,436 | ) |
| | | | | | | | |
| ZAR | | 221,146 | | | Pays | | | 3-month ZAR JIBAR
(pays quarterly) | | 5.77%
(pays quarterly) | | | 9/3/26 | | | | (424,765 | ) | | | 822 | | | | (423,943 | ) |
| | | | | | | | |
| ZAR | | 223,320 | | | Pays | | | 3-month ZAR JIBAR
(pays quarterly) | | 5.86%
(pays quarterly) | | | 9/15/26 | | | | (392,094 | ) | | | 861 | | | | (391,233 | ) |
| | | | | | | | |
| ZAR | | 253,308 | | | Pays | | | 3-month ZAR JIBAR
(pays quarterly) | | 5.87%
(pays quarterly) | | | 9/15/26 | | | | (436,559 | ) | | | 982 | | | | (435,577 | ) |
| | | | | | | | |
| ZAR | | 177,000 | | | Pays | | | 3-month ZAR JIBAR
(pays quarterly) | | 6.46%
(pays quarterly) | | | 10/6/26 | | | | (49,618 | ) | | | 846 | | | | (48,772 | ) |
| | | | | | | | |
| ZAR | | 93,000 | | | Pays | | | 3-month ZAR JIBAR
(pays quarterly) | | 6.53%
(pays quarterly) | | | 12/15/26 | | | | (14,797 | ) | | | — | | | | (14,797 | ) |
| | | | | | | | |
Total | | | | | | | | | | | | | | | | $ | (4,665,288 | ) | | $ | 7,696 | | | $ | (4,657,592 | ) |
| | | | | | | | | | | | | | | | | | |
| Interest Rate Swaps | |
| | | | | | |
| Counterparty | | Notional
Amount
(000’s omitted) | | | Fund
Pays/Receives
Floating Rate | | Floating Rate | | Annual
Fixed Rate | | Termination
Date | | Value/Unrealized
Depreciation | |
| | | | | | | |
| Bank of America, N.A. | | MXN | | | 2,844 | | | Pays | | Mexico Interbank TIIE 28 Day
(pays monthly) | | 6.63%
(pays monthly) | | 3/19/24 | | $ | (2,330 | ) |
| | | | | | | |
| Bank of America, N.A. | | MYR | | | 67,300 | | | Pays | | 3-month MYR KLIBOR
(pays quarterly) | | 2.50%
(pays quarterly) | | 7/19/26 | | | (399,971 | ) |
| | | | | | | |
| BNP Paribas | | MYR | | | 61,100 | | | Pays | | 3-month MYR KLIBOR
(pays quarterly) | | 2.52%
(pays quarterly) | | 7/16/26 | | | (354,595) | |
| | | | | | | |
| BNP Paribas | | MYR | | | 61,200 | | | Pays | | 3-month MYR KLIBOR
(pays quarterly) | | 2.52%
(pays quarterly) | | 7/16/26 | | | (355,175) | |
| | | | | | | |
| BNP Paribas | | MYR | | | 66,600 | | | Pays | | 3-month MYR KLIBOR
(pays quarterly) | | 2.70%
(pays quarterly) | | 9/17/26 | | | (277,618) | |
| | | | |
| | 22 | | See Notes to Financial Statements. |
Eaton Vance
Emerging Markets Debt Opportunities Fund
January 31, 2022
Portfolio of Investments (Unaudited) — continued
| | | | | | | | | | | | | | | | | | |
| Interest Rate Swaps (continued) | |
| | | | | | |
| Counterparty | | Notional
Amount
(000’s omitted) | | | Fund
Pays/Receives
Floating Rate | | Floating Rate | | Annual
Fixed Rate | | Termination
Date | | Value/Unrealized
Depreciation | |
| | | | | | | |
Goldman Sachs
International | | MYR | | | 48,400 | | | Pays | | 3-month MYR KLIBOR
(pays quarterly) | | 2.52%
(pays quarterly) | | 7/16/26 | | $ | (278,419 | ) |
| | | | | | | |
| Goldman Sachs International | | MYR | | | 14,800 | | | Pays | | 3-month MYR KLIBOR
(pays quarterly) | | 2.50%
(pays quarterly) | | 7/19/26 | | | (89,316) | |
| | | | | | | |
| Goldman Sachs International | | MYR | | | 11,000 | | | Pays | | 3-month MYR KLIBOR
(pays quarterly) | | 2.59%
(pays quarterly) | | 8/24/26 | | | (55,596) | |
| | | | | | | |
| Standard Chartered Bank | | MYR | | | 109,000 | | | Pays | | 3-month MYR KLIBOR
(pays quarterly) | | 2.53%
(pays quarterly) | | 7/16/26 | | | (615,886) | |
| | | | | | | |
| Standard Chartered Bank | | MYR | | | 48,200 | | | Pays | | 3-month MYR KLIBOR
(pays quarterly) | | 2.49%
(pays quarterly) | | 7/19/26 | | | (293,351) | |
| | | | | | | |
| Standard Chartered Bank | | MYR | | | 31,000 | | | Pays | | 3-month MYR KLIBOR
(pays quarterly) | | 2.91%
(pays quarterly) | | 10/28/26 | | | (71,433 | ) |
| | | | | | | |
| | | | | | | | | | | | | | | | | $ | (2,793,690 | ) |
| | | | | | | | | | | | | | | | | | | | | | | | |
| Centrally Cleared Credit Default Swaps — Sell Protection | |
| | | | | | | |
| Reference Entity | | Notional
Amount*
(000’s omitted) | | Contract Annual
Fixed Rate** | | Termination
Date | | | Current
Market Annual
Fixed Rate*** | | | Value | | | Unamortized
Upfront
Receipts
(Payments) | | | Unrealized
Appreciation
(Depreciation) | |
| | | | | | | |
| Brazil | | $25,097 | | 1.00%
(pays quarterly)(1) | | | 12/20/26 | | | | 2.26 | % | | $ | (1,399,961 | ) | | $ | 1,614,785 | | | $ | 214,824 | |
| | | | | | | |
| Turkey | | 8,821 | | 1.00%
(pays quarterly)(1) | | | 12/20/26 | | | | 5.30 | | | | 1,537,078 | | | | (1,555,319 | ) | | | (18,241 | ) |
| | | | | | | |
Total | | $33,918 | | | | | | | | | | | | $ | 137,117 | | | $ | 59,466 | | | $ | 196,583 | |
| | | | | | | | | | | | | | | | | | | | | | | | | | | | |
| Credit Default Swaps — Sell Protection | |
| | | | | | | | |
| Reference Entity | | Counterparty | | Notional
Amount*
(000’s omitted) | | | Contract
Annual
Fixed Rate** | | Termination
Date | | | Current
Market Annual
Fixed Rate*** | | | Value | | | Unamortized
Upfront
Receipts
(Payments) | | | Unrealized
Depreciation | |
| | | | | | | | |
| Bahamas | | Deutsche Bank AG | | $ | 600 | | | 1.00%
(pays quarterly)(1) | | | 6/20/22 | | | | 7.12 | % | | $ | (13,291 | ) | | $ | 4,107 | | | $ | (9,184 | ) |
| | | | | | | |
Total | | $ | 600 | | | | | | | | | | | | | $ | (13,291 | ) | | $ | 4,107 | | | $ | (9,184 | ) |
| * | If the Fund is the seller of credit protection, the notional amount is the maximum potential amount of future payments the Fund could be required to make if a credit event, as defined in the credit default swap agreement, were to occur. At January 31, 2022, such maximum potential amount for all open credit default swaps in which the Fund is the seller was $34,518,000. |
| ** | The contract annual fixed rate represents the fixed rate of interest received by the Fund (as a seller of protection) on the notional amount of the credit default swap contract. |
| *** | Current market annual fixed rates, utilized in determining the net unrealized appreciation or depreciation as of period end, serve as an indicator of the market’s perception of the current status of the payment/performance risk associated with the credit derivative. The current market annual fixed rate of a particular reference entity reflects the cost, as quoted by the pricing vendor, of selling protection against default of that entity as of period end and may include upfront |
| | | | |
| | 23 | | See Notes to Financial Statements. |
Eaton Vance
Emerging Markets Debt Opportunities Fund
January 31, 2022
Portfolio of Investments (Unaudited) — continued
| | payments required to be made to enter into the agreement. The higher the fixed rate, the greater the market perceived risk of a credit event involving the reference entity. A rate identified as “Defaulted” indicates a credit event has occurred for the reference entity. |
| (1) | Upfront payment is exchanged with the counterparty as a result of the standardized trading coupon. |
Abbreviations:
| | | | |
| | |
| EURIBOR | | – | | Euro Interbank Offered Rate |
| | |
| GDP | | – | | Gross Domestic Product |
| | |
| JIBAR | | – | | Johannesburg Interbank Average Rate |
| | |
| KLIBOR | | – | | Kuala Lumpur Interbank Offered Rate |
| | |
| LIBOR | | – | | London Interbank Offered Rate |
| | |
| PIK | | – | | Payment In Kind |
Currency Abbreviations:
| | | | |
| | |
| BAM | | – | | Bosnia-Herzegovina Convertible Mark |
| | |
| BRL | | – | | Brazilian Real |
| | |
| CLP | | – | | Chilean Peso |
| | |
| CNH | | – | | Yuan Renminbi Offshore |
| | |
| CNY | | – | | Yuan Renminbi |
| | |
| COP | | – | | Colombian Peso |
| | |
| CRC | | – | | Costa Rican Colon |
| | |
| CZK | | – | | Czech Koruna |
| | |
| DOP | | – | | Dominican Peso |
| | |
| EGP | | – | | Egyptian Pound |
| | |
| EUR | | – | | Euro |
| | |
| HUF | | – | | Hungarian Forint |
| | |
| IDR | | – | | Indonesian Rupiah |
| | |
| INR | | – | | Indian Rupee |
| | | | |
| | |
| KES | | – | | Kenyan Shilling |
| | |
| KRW | | – | | South Korean Won |
| | |
| MXN | | – | | Mexican Peso |
| | |
| MYR | | – | | Malaysian Ringgit |
| | |
| PEN | | – | | Peruvian Sol |
| | |
| PLN | | – | | Polish Zloty |
| | |
| RSD | | – | | Serbian Dinar |
| | |
| RUB | | – | | Russian Ruble |
| | |
| UAH | | – | | Ukrainian Hryvnia |
| | |
| UGX | | – | | Ugandan Shilling |
| | |
| USD | | – | | United States Dollar |
| | |
| UZS | | – | | Uzbekistani Som |
| | |
| ZAR | | – | | South African Rand |
| | |
| ZMW | | – | | Zambian Kwacha |
| | | | |
| | 24 | | See Notes to Financial Statements. |
Eaton Vance
Emerging Markets Debt Opportunities Fund
January 31, 2022
Statement of Assets and Liabilities (Unaudited)
| | | | |
| Assets | | January 31, 2022 | |
| |
Unaffiliated investments, at value (identified cost, $1,040,878,753) | | $ | 996,370,822 | |
| |
Affiliated investment, at value (identified cost, $181,855,424) | | | 181,854,912 | |
| |
Cash | | | 232,592 | |
| |
Deposits for derivatives collateral — | | | | |
| |
Financial futures contracts | | | 5,733,957 | |
| |
Centrally cleared derivatives | | | 36,980,602 | |
| |
OTC derivatives | | | 19,969 | |
| |
Foreign currency, at value (identified cost, $8,008,429) | | | 7,906,616 | |
| |
Interest receivable | | | 19,399,271 | |
| |
Dividends receivable from affiliated investment | | | 20,653 | |
| |
Receivable for investments sold | | | 8,000,893 | |
| |
Receivable for Fund shares sold | | | 6,714,660 | |
| |
Receivable for variation margin on open financial futures contracts | | | 646,955 | |
| |
Receivable for open forward foreign currency exchange contracts | | | 3,386,736 | |
| |
Receivable for open non-deliverable bond forward contracts | | | 69,834 | |
| |
Total assets | | $ | 1,267,338,472 | |
|
| Liabilities | |
| |
Payable for investments purchased | | $ | 16,786,316 | |
| |
Payable for Fund shares redeemed | | | 3,289,327 | |
| |
Payable for variation margin on open centrally cleared derivatives | | | 528,411 | |
| |
Payable for open forward foreign currency exchange contracts | | | 538,628 | |
| |
Payable for open swap contracts | | | 2,802,874 | |
| |
Upfront receipts on open non-centrally cleared swap contracts | | | 4,107 | |
| |
Payable for open non-deliverable bond forward contracts | | | 140,338 | |
| |
Payable to affiliate: | | | | |
| |
Investment adviser and administration fee | | | 655,084 | |
| |
Distribution and service fees | | | 12,680 | |
| |
Accrued foreign capital gains taxes | | | 46,390 | |
| |
Accrued expenses | | | 598,189 | |
| |
Total liabilities | | $ | 25,402,344 | |
| |
Net Assets | | $ | 1,241,936,128 | |
|
| Sources of Net Assets | |
| |
Common shares, $0.001 par value, 1,000,000,000 shares authorized (see Note 7), 146,829,575 shares issued and outstanding | | $ | 146,830 | |
| |
Additional paid-in capital | | | 1,311,001,922 | |
| |
Accumulated loss | | | (69,212,624 | ) |
| |
Total | | $ | 1,241,936,128 | |
| |
| Class A Shares | | | | |
| |
Net Assets | | $ | 60,791,145 | |
| |
Shares Outstanding | | | 7,202,525 | |
| |
Net Asset Value and Redemption Price Per Share | | | | |
| |
(net assets ÷ shares outstanding) | | $ | 8.44 | |
| |
Maximum Offering Price Per Share | | | | |
| |
(100 ÷ 95.25 of net asset value per share) | | $ | 8.86 | |
| |
| Class I Shares | | | | |
| |
Net Assets | | $ | 916,933,958 | |
| |
Shares Outstanding | | | 108,314,598 | |
| |
Net Asset Value, Offering Price and Redemption Price Per Share | | | | |
| |
(net assets ÷ shares outstanding) | | $ | 8.47 | |
| |
| Class R6 Shares | | | | |
| |
Net Assets | | $ | 264,211,025 | |
| |
Shares Outstanding | | | 31,312,452 | |
| |
Net Asset Value, Offering Price and Redemption Price Per Share | | | | |
| |
(net assets ÷ shares outstanding) | | $ | 8.44 | |
On sales of $50,000 or more, the offering price of Class A shares is reduced.
| | | | |
| | 25 | | See Notes to Financial Statements. |
Eaton Vance
Emerging Markets Debt Opportunities Fund
January 31, 2022
Statement of Operations (Unaudited)
| | | | |
| Investment Income | | Six Months Ended January 31, 2022 | |
| |
Interest (net of foreign taxes, $1,392,916) | | $ | 38,750,948 | |
| |
Dividends from affiliated investment | | | 78,601 | |
| |
Total investment income | | $ | 38,829,549 | |
| |
| Expenses | | | | |
| |
Investment adviser and administration fee | | $ | 3,850,507 | |
| |
Distribution and service fees | | | | |
| |
Class A | | | 75,312 | |
| |
Directors’ fees and expenses | | | 30,397 | |
| |
Custodian fee | | | 475,580 | |
| |
Transfer and dividend disbursing agent fees | | | 316,288 | |
| |
Legal and accounting services | | | 95,110 | |
| |
Printing and postage | | | 111,798 | |
| |
Registration fees | | | 126,124 | |
| |
Miscellaneous | | | 60,517 | |
| |
Total expenses | | $ | 5,141,633 | |
| |
Net investment income | | $ | 33,687,916 | |
| |
| Realized and Unrealized Gain (Loss) | | | | |
| |
Net realized gain (loss) — | | | | |
| |
Investment transactions (net of foreign capital gains taxes of $191,205) | | $ | (11,616,449 | ) |
| |
Investment transactions — affiliated investment | | | (19,043 | ) |
| |
Financial futures contracts | | | (4,054,500 | ) |
| |
Swap contracts | | | 461,722 | |
| |
Foreign currency transactions | | | (634,680 | ) |
| |
Forward foreign currency exchange contracts | | | 14,848,449 | |
| |
Non-deliverable bond forward contracts | | | (4,175,306 | ) |
| |
Net realized loss | | $ | (5,189,807 | ) |
| |
Change in unrealized appreciation (depreciation) — | | | | |
| |
Investments (including net decrease in accrued foreign capital gains taxes of $88,070) | | $ | (47,720,408 | ) |
| |
Investments — affiliated investment | | | (959 | ) |
| |
Financial futures contracts | | | 17,391,114 | |
| |
Swap contracts | | | (5,586,727 | ) |
| |
Foreign currency | | | (203,475 | ) |
| |
Forward foreign currency exchange contracts | | | (3,399,884 | ) |
| |
Non-deliverable bond forward contracts | | | (14,776 | ) |
| |
Net change in unrealized appreciation (depreciation) | | $ | (39,535,115 | ) |
| |
Net realized and unrealized loss | | $ | (44,724,922 | ) |
| |
Net decrease in net assets from operations | | $ | (11,037,006 | ) |
| | | | |
| | 26 | | See Notes to Financial Statements. |
Eaton Vance
Emerging Markets Debt Opportunities Fund
January 31, 2022
Statements of Changes in Net Assets
| | | | | | | | |
| Increase (Decrease) in Net Assets | | Six Months Ended
January 31, 2022
(Unaudited) | | | Year Ended July 31, 2021 | |
| | |
From operations — | | | | | | | | |
| | |
Net investment income | | $ | 33,687,916 | | | $ | 45,695,149 | |
| | |
Net realized gain (loss) | | | (5,189,807 | ) | | | 5,238,004 | |
| | |
Net change in unrealized appreciation (depreciation) | | | (39,535,115 | ) | | | (4,728,496 | ) |
| | |
Net increase (decrease) in net assets from operations | | $ | (11,037,006 | ) | | $ | 46,204,657 | |
| | |
Distributions to shareholders — | | | | | | | | |
| | |
Class A | | $ | (2,255,450 | ) | | $ | (2,223,535 | ) |
| | |
Class I | | | (33,628,213 | ) | | | (32,320,260 | ) |
| | |
Class R6 | | | (11,267,799 | ) | | | (11,842,783 | ) |
| | |
Total distributions to shareholders | | $ | (47,151,462 | ) | | $ | (46,386,578 | ) |
| | |
Tax return of capital to shareholders — | | | | | | | | |
| | |
Class A | | $ | — | | | $ | (471,892 | ) |
| | |
Class I | | | — | | | | (7,343,618 | ) |
| | |
Class R6 | | | — | | | | (2,453,385 | ) |
| | |
Total tax return of capital to shareholders | | $ | — | | | $ | (10,268,895 | ) |
| | |
Transactions in common shares — | | | | | | | | |
| | |
Proceeds from sale of shares | | | | | | | | |
| | |
Class A | | $ | 22,237,793 | | | $ | 44,754,058 | |
| | |
Class I | | | 377,767,411 | | | | 772,306,283 | |
| | |
Class R6 | | | 42,592,838 | | | | 157,213,888 | |
| | |
Net asset value of shares issued to shareholders in payment of distributions declared | | | | | | | | |
| | |
Class A | | | 2,251,011 | | | | 2,686,260 | |
| | |
Class I | | | 32,575,722 | | | | 38,893,103 | |
| | |
Class R6 | | | 11,250,193 | | | | 14,296,168 | |
| | |
Cost of shares redeemed | | | | | | | | |
| | |
Class A | | | (16,600,023 | ) | | | (9,987,883 | ) |
| | |
Class I | | | (280,161,397 | ) | | | (191,468,970 | ) |
| | |
Class R6 | | | (57,492,942 | ) | | | (7,763,266 | ) |
| | |
Net increase in net assets from Fund share transactions | | $ | 134,420,606 | | | $ | 820,929,641 | |
| | |
Net increase in net assets | | $ | 76,232,138 | | | $ | 810,478,825 | |
|
| Net Assets | |
| | |
At beginning of period | | $ | 1,165,703,990 | | | $ | 355,225,165 | |
| | |
At end of period | | $ | 1,241,936,128 | | | $ | 1,165,703,990 | |
| | | | |
| | 27 | | See Notes to Financial Statements. |
Eaton Vance
Emerging Markets Debt Opportunities Fund
January 31, 2022
Financial Highlights
| | | | | | | | | | | | | | | | | | | | | | | | |
| | | Class A | |
| | | Six Months Ended
January 31, 2022
(Unaudited) | | | Year Ended July 31, | |
| | | 2021 | | | 2020 | | | 2019 | | | 2018 | | | 2017 | |
| | | | | | |
Net asset value — Beginning of period | | $ | 8.850 | | | $ | 8.660 | | | $ | 9.030 | | | $ | 9.010 | | | $ | 9.460 | | | $ | 9.400 | |
| | | | | | |
| Income (Loss) From Operations | | | | | | | | | | | | | | | | | | | | | | | | |
| | | | | | |
Net investment income(1) | | $ | 0.231 | | | $ | 0.542 | | | $ | 0.563 | | | $ | 0.611 | | | $ | 0.675 | | | $ | 0.608 | |
| | | | | | |
Net realized and unrealized gain (loss) | | | (0.315 | ) | | | 0.299 | | | | (0.198 | ) | | | 0.053 | | | | (0.399 | ) | | | 0.214 | |
| | | | | | |
Total income (loss) from operations | | $ | (0.084 | ) | | $ | 0.841 | | | $ | 0.365 | | | $ | 0.664 | | | $ | 0.276 | | | $ | 0.822 | |
| | | | | | |
| Less Distributions | | | | | | | | | | | | | | | | | | | | | | | | |
| | | | | | |
From net investment income | | $ | (0.326 | ) | | $ | (0.545 | ) | | $ | (0.635 | ) | | $ | (0.356 | ) | | $ | (0.646 | ) | | $ | (0.762 | ) |
| | | | | | |
From net realized gain | | | — | | | | (0.011 | ) | | | — | | | | — | | | | — | | | | — | |
| | | | | | |
Tax return of capital | | | — | | | | (0.095 | ) | | | (0.100 | ) | | | (0.288 | ) | | | (0.080 | ) | | | — | |
| | | | | | |
Total distributions | | $ | (0.326 | ) | | $ | (0.651 | ) | | $ | (0.735 | ) | | $ | (0.644 | ) | | $ | (0.726 | ) | | $ | (0.762 | ) |
| | | | | | |
Net asset value — End of period | | $ | 8.440 | | | $ | 8.850 | | | $ | 8.660 | | | $ | 9.030 | | | $ | 9.010 | | | $ | 9.460 | |
| | | | | | |
Total Return(2) | | | (0.99 | )%(3) | | | 9.90 | % | | | 4.19 | %(4) | | | 8.03 | %(4) | | | 2.82 | %(4) | | | 9.18 | %(4) |
| | | | | | |
| Ratios/Supplemental Data | | | | | | | | | | | | | | | | | | | | | | | | |
| | | | | | |
Net assets, end of period (000’s omitted) | | $ | 60,791 | | | $ | 55,838 | | | $ | 18,761 | | | $ | 9,724 | | | $ | 4,840 | | | $ | 330 | |
| | | | | | |
Ratios (as a percentage of average daily net assets): | | | | | | | | | | | | | | | | | | | | | | | | |
| | | | | | |
Expenses | | | 1.09 | %(5) | | | 1.11 | % | | | 1.15 | %(4) | | | 1.15 | %(4) | | | 1.15 | %(4) | | | 1.16 | %(4)(6) |
| | | | | | |
Net investment income | | | 5.25 | %(5) | | | 6.03 | % | | | 6.42 | % | | | 7.01 | % | | | 7.19 | % | | | 6.46 | % |
| | | | | | |
Portfolio Turnover | | | 34 | %(3) | | | 87 | % | | | 110 | % | | | 85 | % | | | 80 | % | | | 70 | % |
| (1) | Computed using average shares outstanding. |
| (2) | Returns are historical and are calculated by determining the percentage change in net asset value with all distributions reinvested and do not reflect the effect of sales charges. |
| (4) | The investment adviser and administrator reimbursed certain operating expenses (equal to 0.13%, 0.18%, 0.29% and 0.34% of average daily net assets for the years ended July 31, 2020, 2019, 2018 and 2017, respectively). Absent this reimbursement, total return would be lower. |
| (6) | Includes interest expense of 0.01% for the year ended July 31, 2017. |
| | | | |
| | 28 | | See Notes to Financial Statements. |
Eaton Vance
Emerging Markets Debt Opportunities Fund
January 31, 2022
Financial Highlights — continued
| | | | | | | | | | | | | | | | | | | | | | | | |
| | | Class I | |
| | | Six Months Ended
January 31, 2022
(Unaudited) | | | Year Ended July 31, | |
| | | 2021 | | | 2020 | | | 2019 | | | 2018 | | | 2017 | |
| | | | | | |
Net asset value — Beginning of period | | $ | 8.870 | | | $ | 8.690 | | | $ | 9.060 | | | $ | 9.030 | | | $ | 9.490 | | | $ | 9.420 | |
| | | | | | |
| Income (Loss) From Operations | | | | | | | | | | | | | | | | | | | | | | | | |
| | | | | | |
Net investment income(1) | | $ | 0.244 | | | $ | 0.565 | | | $ | 0.578 | | | $ | 0.648 | | | $ | 0.705 | | | $ | 0.649 | |
| | | | | | |
Net realized and unrealized gain (loss) | | | (0.306 | ) | | | 0.291 | | | | (0.188 | ) | | | 0.051 | | | | (0.413 | ) | | | 0.204 | |
| | | | | | |
Total income (loss) from operations | | $ | (0.062 | ) | | $ | 0.856 | | | $ | 0.390 | | | $ | 0.699 | | | $ | 0.292 | | | $ | 0.853 | |
| | | | | | |
| Less Distributions | | | | | | | | | | | | | | | | | | | | | | | | |
| | | | | | |
From net investment income | | $ | (0.338 | ) | | $ | (0.567 | ) | | $ | (0.656 | ) | | $ | (0.370 | ) | | $ | (0.669 | ) | | $ | (0.783 | ) |
| | | | | | |
From net realized gain | | | — | | | | (0.011 | ) | | | — | | | | — | | | | — | | | | — | |
| | | | | | |
Tax return of capital | | | — | | | | (0.098 | ) | | | (0.104 | ) | | | (0.299 | ) | | | (0.083 | ) | | | — | |
| | | | | | |
Total distributions | | $ | (0.338 | ) | | $ | (0.676 | ) | | $ | (0.760 | ) | | $ | (0.669 | ) | | $ | (0.752 | ) | | $ | (0.783 | ) |
| | | | | | |
Net asset value — End of period | | $ | 8.470 | | | $ | 8.870 | | | $ | 8.690 | | | $ | 9.060 | | | $ | 9.030 | | | $ | 9.490 | |
| | | | | | |
Total Return(2) | | | (0.74 | )%(3) | | | 10.05 | % | | | 4.47 | %(4) | | | 8.42 | %(4) | | | 2.98 | %(4) | | | 9.51 | %(4) |
| | | | | | |
| Ratios/Supplemental Data | | | | | | | | | | | | | | | | | | | | | | | | |
| | | | | | |
Net assets, end of period (000’s omitted) | | $ | 916,934 | | | $ | 828,507 | | | $ | 217,227 | | | $ | 96,765 | | | $ | 38,756 | | | $ | 1,060 | |
| | | | | | |
Ratios (as a percentage of average daily net assets): | | | | | | | | | | | | | | | | | | | | | | | | |
| | | | | | |
Expenses | | | 0.85 | %(5) | | | 0.86 | % | | | 0.90 | %(4) | | | 0.90 | %(4) | | | 0.90 | %(4) | | | 0.91 | %(4)(6) |
| | | | | | |
Net investment income | | | 5.52 | %(5) | | | 6.27 | % | | | 6.60 | % | | | 7.38 | % | | | 7.48 | % | | | 6.90 | % |
| | | | | | |
Portfolio Turnover | | | 34 | %(3) | | | 87 | % | | | 110 | % | | | 85 | % | | | 80 | % | | | 70 | % |
| (1) | Computed using average shares outstanding. |
| (2) | Returns are historical and are calculated by determining the percentage change in net asset value with all distributions reinvested. |
| (4) | The investment adviser and administrator reimbursed certain operating expenses (equal to 0.13%, 0.18%, 0.29% and 0.34% of average daily net assets for the years ended July 31, 2020, 2019, 2018 and 2017, respectively). Absent this reimbursement, total return would be lower. |
| (6) | Includes interest expense of 0.01% for the year ended July 31, 2017. |
| | | | |
| | 29 | | See Notes to Financial Statements. |
Eaton Vance
Emerging Markets Debt Opportunities Fund
January 31, 2022
Financial Highlights — continued
| | | | | | | | | | | | | | | | | | | | | | | | |
| | | Class R6 | |
| | | Six Months Ended
January 31, 2022
(Unaudited) | | | Year Ended July 31, | |
| | | 2021 | | | 2020 | | | 2019 | | | 2018 | | | 2017 | |
| | | | | | |
Net asset value — Beginning of period | | $ | 8.840 | | | $ | 8.660 | | | $ | 9.030 | | | $ | 9.000 | | | $ | 9.460 | | | $ | 9.390 | |
| | | | | | |
| Income (Loss) From Operations | | | | | | | | | | | | | | | | | | | | | | | | |
| | | | | | |
Net investment income(1) | | $ | 0.245 | | | $ | 0.569 | | | $ | 0.593 | | | $ | 0.634 | | | $ | 0.725 | | | $ | 0.625 | |
| | | | | | |
Net realized and unrealized gain (loss) | | | (0.306 | ) | | | 0.289 | | | | (0.201 | ) | | | 0.067 | | | | (0.431 | ) | | | 0.230 | |
| | | | | | |
Total income (loss) from operations | | $ | (0.061 | ) | | $ | 0.858 | | | $ | 0.392 | | | $ | 0.701 | | | $ | 0.294 | | | $ | 0.855 | |
| | | | | | |
| Less Distributions | | | | | | | | | | | | | | | | | | | | | | | | |
| | | | | | |
From net investment income | | $ | (0.339 | ) | | $ | (0.568 | ) | | $ | (0.658 | ) | | $ | (0.371 | ) | | $ | (0.670 | ) | | $ | (0.785 | ) |
| | | | | | |
From net realized gain | | | — | | | | (0.011 | ) | | | — | | | | — | | | | — | | | | — | |
| | | | | | |
Tax return of capital | | | — | | | | (0.099 | ) | | | (0.104 | ) | | | (0.300 | ) | | | (0.084 | ) | | | — | |
| | | | | | |
Total distributions | | $ | (0.339 | ) | | $ | (0.678 | ) | | $ | (0.762 | ) | | $ | (0.671 | ) | | $ | (0.754 | ) | | $ | (0.785 | ) |
| | | | | | |
Net asset value — End of period | | $ | 8.440 | | | $ | 8.840 | | | $ | 8.660 | | | $ | 9.030 | | | $ | 9.000 | | | $ | 9.460 | |
| | | | | | |
Total Return(2) | | | (0.84 | )%(3) | | | 10.23 | % | | | 4.63 | %(4) | | | 8.36 | %(4) | | | 3.02 | %(4) | | | 9.57 | %(4) |
| | | | | | |
| Ratios/Supplemental Data | | | | | | | | | | | | | | | | | | | | | | | | |
| | | | | | |
Net assets, end of period (000’s omitted) | | $ | 264,211 | | | $ | 281,359 | | | $ | 119,237 | | | $ | 80,225 | | | $ | 74,277 | | | $ | 70,985 | |
| | | | | | |
Ratios (as a percentage of average daily net assets): | | | | | | | | | | | | | | | | | | | | | | | | |
| | | | | | |
Expenses | | | 0.78 | %(5) | | | 0.81 | % | | | 0.85 | %(4) | | | 0.85 | %(4) | | | 0.85 | %(4) | | | 0.86 | %(4)(6) |
| | | | | | |
Net investment income | | | 5.57 | %(5) | | | 6.34 | % | | | 6.76 | % | | | 7.27 | % | | | 7.64 | % | | | 6.65 | % |
| | | | | | |
Portfolio Turnover | | | 34 | %(3) | | | 87 | % | | | 110 | % | | | 85 | % | | | 80 | % | | | 70 | % |
| (1) | Computed using average shares outstanding. |
| (2) | Returns are historical and are calculated by determining the percentage change in net asset value with all distributions reinvested. |
| (4) | The investment adviser and administrator reimbursed certain operating expenses (equal to 0.13%, 0.18%, 0.29% and 0.34% of average daily net assets for the years ended July 31, 2020, 2019, 2018 and 2017, respectively). Absent this reimbursement, total return would be lower. |
| (6) | Includes interest expense of 0.01% for the year ended July 31, 2017. |
| | | | |
| | 30 | | See Notes to Financial Statements. |
Eaton Vance
Emerging Markets Debt Opportunities Fund
January 31, 2022
Notes to Financial Statements (Unaudited)
1 Significant Accounting Policies
Eaton Vance Emerging Markets Debt Opportunities Fund (the Fund) is a non-diversified series of Eaton Vance Series Fund, Inc. (the Corporation). The Corporation is a Maryland corporation registered under the Investment Company Act of 1940, as amended (the 1940 Act), as an open-end management investment company. The Fund’s investment objective is total return. The Fund offers three classes of shares. Class A shares are generally sold subject to a sales charge imposed at time of purchase. Class I and Class R6 shares are sold at net asset value and are not subject to a sales charge. Each class represents a pro-rata interest in the Fund, but votes separately on class-specific matters and (as noted below) is subject to different expenses. Realized and unrealized gains and losses and net investment income and losses, other than class-specific expenses, are allocated daily to each class of shares based on the relative net assets of each class to the total net assets of the Fund. Sub-accounting, recordkeeping and similar administrative fees payable to financial intermediaries, which are a component of transfer and dividend disbursing agent fees on the Statement of Operations, are not allocated to Class R6 shares. Each class of shares differs in its distribution plan and certain other class-specific expenses.
The following is a summary of significant accounting policies of the Fund. The policies are in conformity with accounting principles generally accepted in the United States of America (U.S. GAAP). The Fund is an investment company and follows accounting and reporting guidance in the Financial Accounting Standards Board (FASB) Accounting Standards Codification Topic 946.
A Investment Valuation — The following methodologies are used to determine the market value or fair value of investments.
Debt Obligations. Debt obligations are generally valued on the basis of valuations provided by third party pricing services, as derived from such services’ pricing models. Inputs to the models may include, but are not limited to, reported trades, executable bid and ask prices, broker/dealer quotations, prices or yields of securities with similar characteristics, interest rates, anticipated prepayments, benchmark curves or information pertaining to the issuer, as well as industry and economic events. The pricing services may use a matrix approach, which considers information regarding securities with similar characteristics to determine the valuation for a security. Short-term debt obligations purchased with a remaining maturity of sixty days or less for which a valuation from a third party pricing service is not readily available may be valued at amortized cost, which approximates fair value.
Derivatives. U.S. exchange-traded options are valued at the mean between the bid and ask prices at valuation time as reported by the Options Price Reporting Authority. Non-U.S. exchange-traded options and over-the-counter options (including options on securities, indices and foreign currencies) are valued by a third party pricing service using techniques that consider factors including the value of the underlying instrument, the volatility of the underlying instrument and the period of time until option expiration. Financial futures contracts are valued at the closing settlement price established by the board of trade or exchange on which they are traded. Forward foreign currency exchange contracts are generally valued at the mean of the average bid and average ask prices that are reported by currency dealers to a third party pricing service at the valuation time. Such third party pricing service valuations are supplied for specific settlement periods and the Fund’s forward foreign currency exchange contracts are valued at an interpolated rate between the closest preceding and subsequent settlement period reported by the third party pricing service. Non-deliverable bond forward contracts are generally valued based on the current price of the underlying bond as provided by a third party pricing service and current interest rates. Swaps and options on interest rate swaps (“swaptions”) are normally valued using valuations provided by a third party pricing service. Such pricing service valuations are based on the present value of fixed and projected floating rate cash flows over the term of the swap contract, and in the case of credit default swaps, based on credit spread quotations obtained from broker/dealers and expected default recovery rates determined by the pricing service using proprietary models. In the case of total return swaps, the pricing service valuations are based on the value of the underlying index or instrument and reference interest rate. Future cash flows on swaps are discounted to their present value using swap rates provided by electronic data services or by broker/dealers. Alternatively, swaptions may be valued at the valuation provided by a broker/dealer (usually the counterparty to the option), so determined using similar techniques as those employed by the pricing service.
Foreign Securities and Currencies. Foreign securities and currencies are valued in U.S. dollars, based on foreign currency exchange rate quotations supplied by a third party pricing service. The pricing service uses a proprietary model to determine the exchange rate. Inputs to the model include reported trades and implied bid/ask spreads.
Affiliated Fund. The Fund may invest in Eaton Vance Cash Reserves Fund, LLC (Cash Reserves Fund), an affiliated investment company managed by Eaton Vance Management (EVM). While Cash Reserves Fund is not a registered money market mutual fund, it conducts all of its investment activities in accordance with the requirements of Rule 2a-7 under the 1940 Act. Investments in Cash Reserves Fund are valued at the closing net asset value per unit on the valuation day. Cash Reserves Fund generally values its investment securities based on available market quotations provided by a third party pricing service.
Fair Valuation. Investments for which valuations or market quotations are not readily available or are deemed unreliable are valued at fair value using methods determined in good faith by or at the direction of the Trustees of the Fund in a manner that most fairly reflects the security’s “fair value”, which is the amount that the Fund might reasonably expect to receive for the security upon its current sale in the ordinary course. Each such determination is based on a consideration of relevant factors, which are likely to vary from one pricing context to another. These factors may include, but are not limited to, the type of security, the existence of any contractual restrictions on the security’s disposition, the price and extent of public trading in similar securities of the issuer or of comparable companies or entities, quotations or relevant information obtained from broker/dealers or other market participants, information obtained from the issuer, analysts, and/or the appropriate stock exchange (for exchange-traded securities), an analysis of the company’s or entity’s financial statements, and an evaluation of the forces that influence the issuer and the market(s) in which the security is purchased and sold.
B Investment Transactions — Investment transactions for financial statement purposes are accounted for on a trade date basis. Realized gains and losses on investments sold are determined on the basis of identified cost.
Eaton Vance
Emerging Markets Debt Opportunities Fund
January 31, 2022
Notes to Financial Statements (Unaudited) — continued
C Income — Interest income is recorded on the basis of interest accrued, adjusted for amortization of premium or accretion of discount. Fees associated with loan amendments are recognized immediately. Dividend income is recorded on the ex-dividend date for dividends received in cash and/or securities. Withholding taxes on foreign interest and capital gains have been provided for in accordance with the Fund’s understanding of the applicable countries’ tax rules and rates.
D Federal and Other Taxes — The Fund’s policy is to comply with the provisions of the Internal Revenue Code applicable to regulated investment companies and to distribute to shareholders each year substantially all of its net investment income, and all or substantially all of its net realized capital gains. Accordingly, no provision for federal income or excise tax is necessary.
In addition to the requirements of the Internal Revenue Code, the Fund may also be subject to local taxes on the recognition of capital gains in certain countries. In determining the daily net asset value, the Fund estimates the accrual for such taxes, if any, based on the unrealized appreciation on certain portfolio securities and the related tax rates. Taxes attributable to unrealized appreciation are included in the change in unrealized appreciation (depreciation) on investments. Capital gains taxes on securities sold are included in net realized gain (loss) on investments.
As of January 31, 2022, the Fund had no uncertain tax positions that would require financial statement recognition, de-recognition, or disclosure. The Fund files a U.S. federal income tax return annually after its fiscal year-end, which is subject to examination by the Internal Revenue Service for a period of three years from the date of filing.
E Foreign Currency Translation — Investment valuations, other assets, and liabilities initially expressed in foreign currencies are translated each business day into U.S. dollars based upon current exchange rates. Purchases and sales of foreign investment securities and income and expenses denominated in foreign currencies are translated into U.S. dollars based upon currency exchange rates in effect on the respective dates of such transactions. Recognized gains or losses on investment transactions attributable to changes in foreign currency exchange rates are recorded for financial statement purposes as net realized gains and losses on investments. That portion of unrealized gains and losses on investments that results from fluctuations in foreign currency exchange rates is not separately disclosed.
F Unfunded Loan Commitments — The Fund may enter into certain loan agreements all or a portion of which may be unfunded. The Fund is obligated to fund these commitments at the borrower’s discretion. These commitments, if any, are disclosed in the accompanying Portfolio of Investments.
G Use of Estimates — The preparation of the financial statements in conformity with U.S. GAAP requires management to make estimates and assumptions that affect the reported amounts of assets and liabilities at the date of the financial statements and the reported amounts of income and expense during the reporting period. Actual results could differ from those estimates.
H Indemnifications — The Corporation’s Articles of Incorporation provide that no Director or officer of the Corporation shall be liable, to the fullest extent permitted by Maryland law and the 1940 Act, to the Corporation or to its shareholders for money damages. Additionally, in the normal course of business, the Fund enters into agreements with service providers that may contain indemnification clauses. The Fund’s maximum exposure under these arrangements is unknown as this would involve future claims that may be made against the Fund that have not yet occurred.
I Financial Futures Contracts — Upon entering into a financial futures contract, the Fund is required to deposit with the broker, either in cash or securities, an amount equal to a certain percentage of the contract amount (initial margin). Subsequent payments, known as variation margin, are made or received by the Fund each business day, depending on the daily fluctuations in the value of the underlying security, and are recorded as unrealized gains or losses by the Fund. Gains (losses) are realized upon the expiration or closing of the financial futures contracts. Should market conditions change unexpectedly, the Fund may not achieve the anticipated benefits of the financial futures contracts and may realize a loss. Futures contracts have minimal counterparty risk as they are exchange traded and the clearinghouse for the exchange is substituted as the counterparty, guaranteeing counterparty performance.
J Forward Foreign Currency Exchange and Non-Deliverable Bond Forward Contracts — The Fund may enter into forward foreign currency exchange contracts for the purchase or sale of a specific foreign currency at a fixed price on a future date. The forward foreign currency exchange contracts are adjusted by the daily exchange rate of the underlying currency and any gains or losses are recorded as unrealized until such time as the contracts have been closed. While forward foreign currency exchange contracts are privately negotiated agreements between the Fund and a counterparty, certain contracts may be “centrally cleared”, whereby all payments made or received by the Fund pursuant to the contract are with a central clearing party (CCP) rather than the original counterparty. The CCP guarantees the performance of the original parties to the contract. Upon entering into centrally cleared contracts, the Fund is required to deposit with the CCP, either in cash or securities, an amount of initial margin determined by the CCP, which is subject to adjustment. For centrally cleared contracts, the daily change in valuation is recorded as a receivable or payable for variation margin and settled in cash with the CCP daily. The Fund may also enter into non-deliverable bond forward contracts for the purchase or sale of a bond denominated in a non-deliverable foreign currency at a fixed price on a future date. For non-deliverable bond forward contracts, unrealized gains and losses, based on changes in the value of the contract, and realized gains and losses are accounted for as described above. Risks may arise upon entering these contracts from the potential inability of counterparties to meet the terms of their contracts and, in the case of forward foreign currency exchange contracts, from movements in the value of a foreign currency relative to the U.S. dollar. In the case of centrally cleared contracts, counterparty risk is minimal due to protections provided by the CCP.
K Purchased Options — Upon the purchase of a call or put option, the premium paid by the Fund is included in the Statement of Assets and Liabilities as an investment. The amount of the investment is subsequently marked-to-market to reflect the current market value of the option purchased, in accordance
Eaton Vance
Emerging Markets Debt Opportunities Fund
January 31, 2022
Notes to Financial Statements (Unaudited) — continued
with the Fund’s policies on investment valuations discussed above. As the purchaser of an index option, the Fund has the right to receive a cash payment equal to any depreciation in the value of the index below the exercise price of the option (in the case of a put) or equal to any appreciation in the value of the index over the exercise price of the option (in the case of a call) as of the valuation date of the option. If an option which the Fund had purchased expires on the stipulated expiration date, the Fund will realize a loss in the amount of the cost of the option. If the Fund enters into a closing sale transaction, the Fund will realize a gain or loss, depending on whether the sales proceeds from the closing sale transaction are greater or less than the cost of the option. If the Fund exercises a put option on a security, it will realize a gain or loss from the sale of the underlying security, and the proceeds from such sale will be decreased by the premium originally paid. If the Fund exercises a call option on a security, the cost of the security which the Fund purchases upon exercise will be increased by the premium originally paid. The risk associated with purchasing options is limited to the premium originally paid. Purchased options traded over-the-counter involve risk that the issuer or counterparty will fail to perform its contractual obligations.
L Interest Rate Swaps — Pursuant to interest rate swap agreements, the Fund either makes floating-rate payments to the counterparty (or CCP in the case of centrally cleared swaps) based on a benchmark interest rate in exchange for fixed-rate payments or the Fund makes fixed-rate payments to the counterparty (or CCP in the case of a centrally cleared swap) in exchange for payments on a floating benchmark interest rate. Payments received or made, including amortization of upfront payments/receipts, if any (which are amortized over the life of the swap contract), are recorded as realized gains or losses. During the term of the outstanding swap agreement, changes in the underlying value of the swap are recorded as unrealized gains or losses. For centrally cleared swaps, the daily change in valuation is recorded as a receivable or payable for variation margin and settled in cash with the CCP daily. The value of the swap is determined by changes in the relationship between two rates of interest. The Fund is exposed to credit loss in the event of non-performance by the swap counterparty. In the case of centrally cleared swaps, counterparty risk is minimal due to protections provided by the CCP. Risk may also arise from movements in interest rates.
M Credit Default Swaps — When the Fund is the buyer of a credit default swap contract, the Fund is entitled to receive the par (or other agreed-upon) value of a referenced debt obligation (or basket of debt obligations) from the counterparty (or CCP in the case of a centrally cleared swap) to the contract if a credit event by a third party, such as a U.S. or foreign corporate issuer or sovereign issuer, on the debt obligation occurs. In return, the Fund pays the counterparty a periodic stream of payments over the term of the contract provided that no credit event has occurred. If no credit event occurs, the Fund would have spent the stream of payments and received no proceeds from the contract. When the Fund is the seller of a credit default swap contract, it receives the stream of payments, but is obligated to pay to the buyer of the protection an amount up to the notional amount of the swap and in certain instances take delivery of securities of the reference entity upon the occurrence of a credit event, as defined under the terms of that particular swap agreement. Credit events are contract specific but may include bankruptcy, failure to pay, restructuring, obligation acceleration and repudiation/moratorium. If the Fund is a seller of protection and a credit event occurs, the maximum potential amount of future payments that the Fund could be required to make would be an amount equal to the notional amount of the agreement. This potential amount would be partially offset by any recovery value of the respective referenced obligation, or net amount received from the settlement of a buy protection credit default swap agreement entered into by the Fund for the same referenced obligation. As the seller, the Fund may create economic leverage to its portfolio because, in addition to its total net assets, the Fund is subject to investment exposure on the notional amount of the swap. The interest fee paid or received on the swap contract, which is based on a specified interest rate on a fixed notional amount, is accrued daily as a component of unrealized appreciation (depreciation) and is recorded as realized gain upon receipt or realized loss upon payment. The Fund also records an increase or decrease to unrealized appreciation (depreciation) in an amount equal to the daily valuation. For centrally cleared swaps, the daily change in valuation is recorded as a receivable or payable for variation margin and settled in cash with the CCP daily. All upfront payments and receipts, if any, are amortized over the life of the swap contract as realized gains or losses. Those upfront payments or receipts for non-centrally cleared swaps are recorded as other assets or other liabilities, respectively, net of amortization. For financial reporting purposes, unamortized upfront payments or receipts, if any, are netted with unrealized appreciation or depreciation on swap contracts to determine the market value of swaps as presented in Notes 8 and 11. The Fund segregates assets in the form of cash or liquid securities in an amount equal to the notional amount of the credit default swaps of which it is the seller. The Fund segregates assets in the form of cash or liquid securities in an amount equal to any unrealized depreciation of the credit default swaps of which it is the buyer, marked-to-market on a daily basis. These transactions involve certain risks, including the risk that the seller may be unable to fulfill the transaction. In the case of centrally cleared swaps, counterparty risk is minimal due to protections provided by the CCP.
N Total Return Swaps — In a total return swap, the buyer receives a periodic return equal to the total return of a specified security, securities or index for a specified period of time. In return, the buyer pays the counterparty a fixed or variable stream of payments, typically based upon short-term interest rates, possibly plus or minus an agreed upon spread. During the term of the outstanding swap agreement, changes in the underlying value of the swap are recorded as unrealized gains and losses. Periodic payments received or made are recorded as realized gains or losses. The Fund is exposed to credit loss in the event of nonperformance by the swap counterparty. Risk may also arise from the unanticipated movements in value of exchange rates, interest rates, securities, or the index.
O Swaptions — A purchased swaption contract grants the Fund, in return for payment of the purchase price, the right, but not the obligation, to enter into a new swap agreement or to shorten, extend, cancel or otherwise modify an existing swap agreement, at some designated future time on specified terms. When the Fund purchases a swaption, the premium paid to the writer is recorded as an investment and subsequently marked-to-market to reflect the current value of the swaption. A written swaption gives the Fund the obligation, if exercised by the purchaser, to enter into a swap contract according to the terms of the underlying agreement. When the Fund writes a swaption, the premium received by the Fund is recorded as a liability and subsequently marked-to-market to reflect the current value of the swaption. When a swaption is exercised, the cost of the swap is adjusted by the amount of the premium paid or received. When a swaption expires or an unexercised swaption is closed, a gain or loss is recognized in the amount of the premium paid or received, plus the cost to close. The Fund’s risk for purchased swaptions is limited to the premium paid. The writer of a swaption bears the risk of
Eaton Vance
Emerging Markets Debt Opportunities Fund
January 31, 2022
Notes to Financial Statements (Unaudited) — continued
unfavorable changes in the preset terms of the underlying swap contract. Purchased swaptions traded over-the-counter involve risk that the issuer or counterparty will fail to perform its contractual obligations.
P Interim Financial Statements — The interim financial statements relating to January 31, 2022 and for the six months then ended have not been audited by an independent registered public accounting firm, but in the opinion of the Fund’s management, reflect all adjustments, consisting only of normal recurring adjustments, necessary for the fair presentation of the financial statements.
2 Distributions to Shareholders and Income Tax Information
It is the present policy of the Fund to make monthly distributions of all or substantially all of its net investment income and to distribute annually all or substantially all of its net realized capital gains. Distributions to shareholders are recorded on the ex-dividend date. Distributions are declared separately for each class of shares. Shareholders may reinvest income and capital gain distributions in additional shares of the same class of the Fund at the net asset value as of the ex-dividend date or, at the election of the shareholder, receive distributions in cash. Distributions to shareholders are determined in accordance with income tax regulations, which may differ from U.S. GAAP. As required by U.S. GAAP, only distributions in excess of tax basis earnings and profits are reported in the financial statements as a return of capital. Permanent differences between book and tax accounting relating to distributions are reclassified to paid-in capital. For tax purposes, distributions from short-term capital gains are considered to be from ordinary income. For the six months ended January 31, 2022, management estimates that a portion of distributions for the period will be a tax return of capital. The final determination of tax characteristics of the Fund’s distributions will occur at the end of the year and will be reported to the shareholders.
At July 31, 2021, the Fund had a late year ordinary loss of $12,676,363 which it has elected to defer to the following taxable year pursuant to income tax regulations. Late year ordinary losses represent certain specified losses realized in that portion of a taxable year after October 31 that are treated as ordinary for tax purposes plus ordinary losses attributable to that portion of a taxable year after December 31.
The cost and unrealized appreciation (depreciation) of investments, including open derivative contracts, of the Fund at January 31, 2022, as determined on a federal income tax basis, were as follows:
| | | | |
| |
Aggregate cost | | $ | 1,225,762,836 | |
| |
Gross unrealized appreciation | | $ | 17,881,594 | |
| |
Gross unrealized depreciation | | | (65,616,943 | ) |
| |
Net unrealized depreciation | | $ | (47,735,349 | ) |
3 Investment Adviser and Administration Fee and Other Transactions with Affiliates
The investment adviser and administration fee is earned by EVM, an indirect, wholly-owned subsidiary of Morgan Stanley, as compensation for investment advisory and administrative services rendered to the Fund. The fee is computed at an annual rate as a percentage of average daily net assets as follows and is payable monthly:
| | |
| Average Daily Net Assets | | Annual Fee Rate |
| |
Up to $500 million | | 0.650% |
| |
$500 million but less than $1.0 billion | | 0.625% |
| |
$1.0 billion but less than $2.5 billion | | 0.600% |
| |
$2.5 billion but less than $5.0 billion | | 0.580% |
| |
$5.0 billion and over | | 0.565% |
For the six months ended January 31, 2022, the investment adviser and administration fee amounted to $3,850,507 or 0.63% (annualized) of the Fund’s average daily net assets. The Fund may invest its cash in Cash Reserves Fund. EVM does not currently receive a fee for advisory services provided to Cash Reserves Fund.
EVM has agreed to reimburse the Fund’s expenses to the extent that total annual operating expenses (relating to ordinary operating expenses only) exceed 1.15%, 0.90% and 0.85% of the Fund’s average daily net assets for Class A, Class I and Class R6, respectively. This agreement may be changed or terminated after November 30, 2022. Pursuant to this agreement, no operating expenses were allocated to EVM for the six months ended January 31, 2022.
Eaton Vance
Emerging Markets Debt Opportunities Fund
January 31, 2022
Notes to Financial Statements (Unaudited) — continued
EVM provides sub-transfer agency and related services to the Fund pursuant to a Sub-Transfer Agency Support Services Agreement. For the six months ended January 31, 2022, EVM earned $2,690 from the Fund pursuant to such agreement, which is included in transfer and dividend disbursing agent fees on the Statement of Operations. The Fund was informed that Eaton Vance Distributors, Inc. (EVD), an affiliate of EVM and the Fund’s principal underwriter, received $12,468 as its portion of the sales charge on sales of Class A shares for the six months ended January 31, 2022. EVD also received distribution and service fees from Class A shares (see Note 4).
Directors and officers of the Fund who are members of EVM’s organization receive remuneration for their services to the Fund out of the investment adviser and administration fee. Directors of the Fund who are not affiliated with EVM may elect to defer receipt of all or a percentage of their annual fees in accordance with the terms of the Directors Deferred Compensation Plan. For the six months ended January 31, 2022, no significant amounts have been deferred. Certain officers and Directors of the Fund are officers of EVM.
4 Distribution Plan
The Fund has in effect a distribution plan for Class A shares (Class A Plan) pursuant to Rule 12b-1 under the 1940 Act. Pursuant to the Class A Plan, the Fund pays EVD a distribution and service fee of 0.25% per annum of its average daily net assets attributable to Class A shares for distribution services and facilities provided to the Fund by EVD, as well as for personal services and/or the maintenance of shareholder accounts. Distribution and service fees paid or accrued to EVD for the six months ended January 31, 2022 amounted to $75,312 for Class A shares.
Distribution and service fees are subject to the limitations contained in the Financial Industry Regulatory Authority Rule 2341(d).
5 Contingent Deferred Sales Charges
Class A shares may be subject to a 1% contingent deferred sales charge (CDSC) if redeemed within 18 months of purchase (depending on the circumstances of purchase). Generally, the CDSC is based upon the lower of the net asset value at date of redemption or date of purchase. No charge is levied on shares acquired by reinvestment of dividends or capital gain distributions. For the six months ended January 31, 2022, the Fund was informed that EVD received no CDSCs paid by Class A shareholders.
6 Purchases and Sales of Investments
Purchases and sales of investments, other than short-term obligations and including principal repayments on loans, aggregated $368,428,877 and $292,025,208, respectively, for the six months ended January 31, 2022.
7 Common Shares
The Corporation’s Articles of Incorporation permit the Directors to issue one billion full and fractional common shares of the Fund ($0.001 par value per share). The Corporation’s authorized shares are subdivided into 300 million shares for each of Class A, Class I and Class R6 and 100 million shares for Class C, which has not commenced operations. Transactions in Fund shares were as follows:
| | | | | | | | |
| Class A | | Six Months Ended
January 31, 2022
(Unaudited) | | | Year Ended
July 31, 2021 | |
| | |
Sales | | | 2,543,650 | | | | 4,956,311 | |
| | |
Issued to shareholders electing to receive payments of distributions in Fund shares | | | 259,904 | | | | 300,460 | |
| | |
Redemptions | | | (1,912,372 | ) | | | (1,111,690 | ) |
| | |
Net increase | | | 891,182 | | | | 4,145,081 | |
| | |
| Class I | | Six Months Ended
January 31, 2022
(Unaudited) | | | Year Ended
July 31, 2021 | |
| | |
Sales | | | 43,267,836 | | | | 85,193,381 | |
| | |
Issued to shareholders electing to receive payments of distributions in Fund shares | | | 3,751,637 | | | | 4,332,993 | |
| | |
Redemptions | | | (32,064,516 | ) | | | (21,171,881 | ) |
| | |
Net increase | | | 14,954,957 | | | | 68,354,493 | |
Eaton Vance
Emerging Markets Debt Opportunities Fund
January 31, 2022
Notes to Financial Statements (Unaudited) — continued
| | | | | | | | |
| Class R6 | | Six Months Ended
January 31, 2022
(Unaudited) | | | Year Ended
July 31, 2021 | |
| | |
Sales | | | 4,851,847 | | | | 17,306,609 | |
| | |
Issued to shareholders electing to receive payments of distributions in Fund shares | | | 1,298,495 | | | | 1,600,046 | |
| | |
Redemptions | | | (6,648,938 | ) | | | (868,171 | ) |
| | |
Net increase (decrease) | | | (498,596 | ) | | | 18,038,484 | |
At January 31, 2022, Eaton Vance Short Duration Strategic Income Fund and donor advised funds (established and maintained by a public charity) managed by EVM owned in the aggregate 10.2% of the value of the outstanding shares of the Fund.
8 Financial Instruments
The Fund may trade in financial instruments with off-balance sheet risk in the normal course of its investing activities. These financial instruments may include forward foreign currency exchange contracts, non-deliverable bond forward contracts, financial futures contracts and swap contracts and may involve, to a varying degree, elements of risk in excess of the amounts recognized for financial statement purposes. The notional or contractual amounts of these instruments represent the investment the Fund has in particular classes of financial instruments and do not necessarily represent the amounts potentially subject to risk. The measurement of the risks associated with these instruments is meaningful only when all related and offsetting transactions are considered. A summary of obligations under these financial instruments at January 31, 2022 is included in the Portfolio of Investments. At January 31, 2022, the Fund had sufficient cash and/or securities to cover commitments under these contracts.
In the normal course of pursuing its investment objective, the Fund is subject to the following risks:
Credit Risk: The Fund enters into credit default swap contracts to enhance total return and/or as a substitute for the purchase or sale of securities.
Foreign Exchange Risk: The Fund engages in forward foreign currency exchange contracts and currency options to enhance total return, to seek to hedge against fluctuations in currency exchange rates and/or as a substitute for the purchase or sale of securities or currencies.
Interest Rate Risk: The Fund utilizes various interest rate derivatives including non-deliverable bond forward contracts, interest rate futures contracts, interest rate swaps and swaptions and total return swaps to enhance total return, to seek to hedge against fluctuations in interest rates, and/or to change the effective duration of its portfolio.
The Fund enters into over-the-counter (OTC) derivatives that may contain provisions whereby the counterparty may terminate the contract under certain conditions, including but not limited to a decline in the Fund’s net assets below a certain level over a certain period of time, which would trigger a payment by the Fund for those derivatives in a liability position. At January 31, 2022, the fair value of derivatives with credit-related contingent features in a net liability position was $3,485,947. The aggregate fair value of assets pledged as collateral by the Fund for such liability was $5,665,030 at January 31, 2022.
The OTC derivatives in which the Fund invests are subject to the risk that the counterparty to the contract fails to perform its obligations under the contract. To mitigate this risk, the Fund has entered into an International Swaps and Derivatives Association, Inc. Master Agreement (“ISDA Master Agreement”) or similar agreement with substantially all its derivative counterparties. An ISDA Master Agreement is a bilateral agreement between the Fund and a counterparty that governs certain OTC derivatives and typically contains, among other things, set-off provisions in the event of a default and/or termination event as defined under the relevant ISDA Master Agreement. Under an ISDA Master Agreement, the Fund may, under certain circumstances, offset with the counterparty certain derivative financial instruments’ payables and/or receivables with collateral held and/or posted and create one single net payment. The provisions of the ISDA Master Agreement typically permit a single net payment in the event of default including the bankruptcy or insolvency of the counterparty. However, bankruptcy or insolvency laws of a particular jurisdiction may impose restrictions on or prohibitions against the right of offset in bankruptcy or insolvency. Certain ISDA Master Agreements allow counterparties to OTC derivatives to terminate derivative contracts prior to maturity in the event the Fund’s net assets decline by a stated percentage or the Fund fails to meet the terms of its ISDA Master Agreements, which would cause the counterparty to accelerate payment by the Fund of any net liability owed to it.
The collateral requirements for derivatives traded under an ISDA Master Agreement are governed by a Credit Support Annex to the ISDA Master Agreement. Collateral requirements are determined at the close of business each day and are typically based on changes in market values for each transaction under an ISDA Master Agreement and netted into one amount for such agreement. Generally, the amount of collateral due from or to a counterparty is subject to a minimum transfer threshold amount before a transfer is required, which may vary by counterparty. Collateral pledged for the benefit of the Fund and/or counterparty is held in segregated accounts by the Fund’s custodian and cannot be sold, re-pledged, assigned or otherwise used while pledged. The portion of such collateral representing cash, if any, is reflected as deposits for derivatives collateral and, in the case of cash pledged by a counterparty for the benefit of the Fund, a corresponding liability on the Statement of Assets and Liabilities. Securities pledged by the Fund as collateral, if any, are identified as such in the Portfolio of Investments.
Eaton Vance
Emerging Markets Debt Opportunities Fund
January 31, 2022
Notes to Financial Statements (Unaudited) — continued
The fair value of open derivative instruments (not considered to be hedging instruments for accounting disclosure purposes) by risk exposure at January 31, 2022 was as follows:
| | | | | | | | | | | | | | | | |
| | | Fair Value | |
| Statement of Assets and Liabilities Caption | | Credit | | | Foreign
Exchange | | | Interest
Rate | | | Total | |
| | | | |
Unaffiliated investments, at value | | $ | — | | | $ | — | | | $ | 3,352 | | | $ | 3,352 | |
| | | | |
Accumulated loss* | | | 1,537,078 | | | | 1,902,109 | | | | 13,571,346 | | | | 17,010,533 | |
| | | | |
Receivable for open forward foreign currency exchange contracts | | | — | | | | 3,386,736 | | | | — | | | | 3,386,736 | |
| | | | |
Receivable for open non-deliverable bond forward contracts | | | — | | | | — | | | | 69,834 | | | | 69,834 | |
| | | | |
Total Asset Derivatives | | $ | 1,537,078 | | | $ | 5,288,845 | | | $ | 13,644,532 | | | $ | 20,470,455 | |
| | | | |
Derivatives not subject to master netting or similar agreements | | $ | 1,537,078 | | | $ | 1,902,109 | | | $ | 13,571,346 | | | $ | 17,010,533 | |
| | | | |
Total Asset Derivatives subject to master netting or similar agreements | | $ | — | | | $ | 3,386,736 | | | $ | 73,186 | | | $ | 3,459,922 | |
| | | | |
| | | Credit | | | Foreign
Exchange | | | Interest
Rate | | | Total | |
| | | | |
Accumulated loss* | | $ | (1,399,961 | ) | | $ | (4,317,138 | ) | | $ | (11,533,573 | ) | | $ | (17,250,672 | ) |
| | | | |
Payable for open forward foreign currency exchange contracts | | | — | | | | (538,628 | ) | | | — | | | | (538,628 | ) |
| | | | |
Payable for open swap contracts; Upfront receipts on open non-centrally cleared swap contracts | | | (13,291 | ) | | | — | | | | (2,793,690 | ) | | | (2,806,981 | ) |
| | | | |
Payable for open non-deliverable bond forward contracts | | | — | | | | — | | | | (140,338 | ) | | | (140,338 | ) |
| | | | |
Total Liability Derivatives | | $ | (1,413,252 | ) | | $ | (4,855,766 | ) | | $ | (14,467,601 | ) | | $ | (20,736,619 | ) |
| | | | |
Derivatives not subject to master netting or similar agreements | | $ | (1,399,961 | ) | | $ | (4,317,138 | ) | | $ | (11,533,573 | ) | | $ | (17,250,672 | ) |
| | | | |
Total Liability Derivatives subject to master netting or similar agreements | | $ | (13,291 | ) | | $ | (538,628 | ) | | $ | (2,934,028 | ) | | $ | (3,485,947 | ) |
| * | Only the current day’s variation margin on open futures contracts and centrally cleared derivatives is reported within the Statement of Assets and Liabilities as Receivable or Payable for variation margin on open financial futures contracts and centrally cleared derivatives, as applicable. |
The Fund’s derivative assets and liabilities at fair value by risk, which are reported gross in the Statement of Assets and Liabilities, are presented in the table above. The following tables present the Fund’s derivative assets and liabilities by counterparty, net of amounts available for offset under a master netting agreement and net of the related collateral received by the Fund for such assets and pledged by the Fund for such liabilities as of January 31, 2022.
| | | | | | | | | | | | | | | | | | | | | | | | |
| Counterparty | | Derivative
Assets Subject to
Master Netting
Agreement | | | Derivatives
Available
for Offset | | | Non-cash
Collateral
Received(a) | | | Cash
Collateral
Received(a) | | | Net Amount
of Derivative
Assets(b) | | | Total Cash
Collateral Received | |
| | | | | | |
Bank of America, N.A. | | $ | 604,704 | | | $ | (423,734 | ) | | $ | — | | | $ | — | | | $ | 180,970 | | | $ | — | |
| | | | | | |
Barclays Bank PLC | | | 202,723 | | | | — | | | | — | | | | — | | | | 202,723 | | | | — | |
| | | | | | |
BNP Paribas | | | 3,290 | | | | (3,290 | ) | | | — | | | | — | | | | — | | | | — | |
| | | | | | |
Citibank, N.A. | | | 430,115 | | | | — | | | | — | | | | — | | | | 430,115 | | | | — | |
| | | | | | |
Goldman Sachs International | | | 256,525 | | | | (256,525 | ) | | | — | | | | — | | | | — | | | | — | |
| | | | | | |
HSBC Bank USA, N.A. | | | 132,600 | | | | (1,165 | ) | | | (131,435 | ) | | | — | | | | — | | | | — | |
| | | | | | |
ICBC Standard Bank plc | | | 25,439 | | | | (4,805 | ) | | | — | | | | — | | | | 20,634 | | | | — | |
| | | | | | |
Standard Chartered Bank | | | 1,674,809 | | | | (1,365,811 | ) | | | — | | | | — | | | | 308,998 | | | | — | |
| | | | | | |
UBS AG | | | 129,717 | | | | (65,220 | ) | | | — | | | | — | | | | 64,497 | | | | — | |
| | | | | | |
| | | $ | 3,459,922 | | | $ | (2,120,550 | ) | | $ | (131,435 | ) | | $ | — | | | $ | 1,207,937 | | | $ | — | |
Eaton Vance
Emerging Markets Debt Opportunities Fund
January 31, 2022
Notes to Financial Statements (Unaudited) — continued
| | | | | | | | | | | | | | | | | | | | | | | | |
| Counterparty | | Derivative
Liabilities Subject to
Master Netting
Agreement | | | Derivatives
Available
for Offset | | | Non-cash
Collateral
Pledged(a) | | | Cash
Collateral
Pledged(a) | | | Net Amount
of Derivative
Liabilities(c) | | | Total Cash Collateral Pledged | |
| | | | | | |
Bank of America, N.A. | | $ | (423,734 | ) | | $ | 423,734 | | | $ | — | | | $ | — | | | $ | — | | | $ | — | |
| | | | | | |
BNP Paribas | | | (999,042 | ) | | | 3,290 | | | | 995,752 | | | | — | | | | | | | | — | |
| | | | | | |
Citibank, N.A. | | | — | | | | — | | | | — | | | | — | | | | — | | | | 19,969 | |
| | | | | | |
Deutsche Bank AG | | | (13,291 | ) | | | — | | | | — | | | | — | | | | (13,291 | ) | | | — | |
| | | | | | |
Goldman Sachs International | | | (612,879 | ) | | | 256,525 | | | | 281,998 | | | | — | | | | (74,356 | ) | | | — | |
| | | | | | |
HSBC Bank USA, N.A. | | | (1,165 | ) | | | 1,165 | | | | — | | | | — | | | | — | | | | — | |
| | | | | | |
ICBC Standard Bank plc | | | (4,805 | ) | | | 4,805 | | | | — | | | | — | | | | — | | | | — | |
| | | | | | |
Standard Chartered Bank | | | (1,365,811 | ) | | | 1,365,811 | | | | — | | | | — | | | | — | | | | — | |
| | | | | | |
UBS AG. | | | (65,220 | ) | | | 65,220 | | | | — | | | | — | | | | — | | | | — | |
| | | | | | |
| | | $ | (3,485,947 | ) | | $ | 2,120,550 | | | $ | 1,277,750 | | | $ | — | | | $ | (87,647 | ) | | $ | 19,969 | |
| | | | |
Total — Deposits for derivatives collateral — OTC derivatives | | | | | | | | | | | | | | | $ | 19,969 | |
| (a) | In some instances, the total collateral received and/or pledged may be more than the amount shown due to overcollateralization. |
| (b) | Net amount represents the net amount due from the counterparty in the event of default. |
| (c) | Net amount represents the net amount payable to the counterparty in the event of default. |
The effect of derivative instruments (not considered to be hedging instruments for accounting disclosure purposes) on the Statement of Operations by risk exposure for the six months ended January 31, 2022 was as follows:
| | | | | | | | | | | | | | | | |
| Statement of Operations Caption | | Credit | | | Foreign
Exchange | | | Interest
Rate | | | Total | |
| | | | |
Net realized gain (loss) — | | | | | | | | | | | | | | | | |
| | | | |
Investment transactions | | $ | — | | | $ | — | | | $ | (261,764 | ) | | $ | (261,764 | ) |
| | | | |
Financial futures contracts | | | — | | | | — | | | | (4,054,500 | ) | | | (4,054,500 | ) |
| | | | |
Swap contracts | | | (191,894 | ) | | | — | | | | 653,616 | | | | 461,722 | |
| | | | |
Forward foreign currency exchange contracts | | | — | | | | 14,848,449 | | | | — | | | | 14,848,449 | |
| | | | |
Non-deliverable bond forward contracts | | | — | | | | — | | | | (4,175,306 | ) | | | (4,175,306 | ) |
| | | | |
Total | | $ | (191,894 | ) | | $ | 14,848,449 | | | $ | (7,837,954 | ) | | $ | 6,818,601 | |
| | | | |
Change in unrealized appreciation (depreciation) — | | | | | | | | | | | | | | | | |
| | | | |
Investments | | $ | — | | | $ | — | | | $ | 79,514 | | | $ | 79,514 | |
| | | | |
Financial futures contracts | | | — | | | | — | | | | 17,391,114 | | | | 17,391,114 | |
| | | | |
Swap contracts | | | 186,509 | | | | — | | | | (5,773,236 | ) | | | (5,586,727 | ) |
| | | | |
Forward foreign currency exchange contracts | | | — | | | | (3,399,884 | ) | | | — | | | | (3,399,884 | ) |
| | | | |
Non-deliverable bond forward contracts | | | — | | | | — | | | | (14,776 | ) | | | (14,776 | ) |
| | | | |
Total | | $ | 186,509 | | | $ | (3,399,884 | ) | | $ | 11,682,616 | | | $ | 8,469,241 | |
Eaton Vance
Emerging Markets Debt Opportunities Fund
January 31, 2022
Notes to Financial Statements (Unaudited) — continued
The average notional cost of futures contracts and average notional amounts of other derivative contracts outstanding during the six months ended January 31, 2022, which are indicative of the volume of these derivative types, were approximately as follows:
| | | | | | | | | | | | | | | | | | |
Futures
Contracts — Short | | | Forward
Foreign Currency
Exchange Contracts* | | | Non-deliverable
Bond Forward
Contracts | | | Purchased Swaptions | | | Swap
Contracts | |
| | | | |
| | $337,354,000 | | | $ | 855,603,000 | | | $ | 69,527,000 | | | $ | 17,629,000 | | | $ | 917,117,000 | |
| * | The average notional amount for forward foreign currency exchange contracts is based on the absolute value of notional amounts of currency purchased and currency sold. |
9 Line of Credit
The Fund participates with other portfolios and funds managed by EVM and its affiliates in an $800 million unsecured line of credit agreement with a group of banks, which is in effect through October 25, 2022. Borrowings are made by the Fund solely for temporary purposes related to redemptions and other short-term cash needs. Interest is charged to the Fund based on its borrowings at an amount above either the Secured Overnight Financing Rate (SOFR) or Federal Funds rate. In addition, a fee computed at an annual rate of 0.15% on the daily unused portion of the line of credit is allocated among the participating portfolios and funds at the end of each quarter. In connection with the renewal of the agreement in October 2021, an arrangement fee totaling $150,000 was incurred that was allocated to the participating portfolios and funds. Because the line of credit is not available exclusively to the Fund, it may be unable to borrow some or all of its requested amounts at any particular time. The Fund did not have any significant borrowings or allocated fees during the six months ended January 31, 2022.
10 Investments in Affiliated Funds
At January 31, 2022, the value of the Fund’s investment in affiliated funds was $181,854,912, which represents 14.6% of the Fund’s net assets. Transactions in affiliated funds by the Fund for the six months ended January 31, 2022 were as follows:
| | | | | | | | | | | | | | | | | | | | | | | | | | | | | | | | |
| Name | | Value,
beginning of
period | | | Purchases | | | Sales
proceeds | | | Net
realized
gain (loss) | | | Change in
unrealized
appreciation
(depreciation) | | | Value, end
of period | | | Dividend
income | | | Units, end
of period | |
|
Short-Term Investments | |
| | | | | | | | |
Eaton Vance Cash Reserves Fund, LLC | | $ | 138,923,923 | | | $ | 494,819,635 | | | $ | (451,868,644 | ) | | $ | (19,043 | ) | | $ | (959 | ) | | $ | 181,854,912 | | | $ | 78,601 | | | | 181,873,099 | |
11 Fair Value Measurements
Under generally accepted accounting principles for fair value measurements, a three-tier hierarchy to prioritize the assumptions, referred to as inputs, is used in valuation techniques to measure fair value. The three-tier hierarchy of inputs is summarized in the three broad levels listed below.
| • | | Level 1 – quoted prices in active markets for identical investments |
| • | | Level 2 – other significant observable inputs (including quoted prices for similar investments, interest rates, prepayment speeds, credit risk, etc.) |
| • | | Level 3 – significant unobservable inputs (including a fund’s own assumptions in determining the fair value of investments) |
In cases where the inputs used to measure fair value fall in different levels of the fair value hierarchy, the level disclosed is determined based on the lowest level input that is significant to the fair value measurement in its entirety. The inputs or methodology used for valuing securities are not necessarily an indication of the risk associated with investing in those securities.
Eaton Vance
Emerging Markets Debt Opportunities Fund
January 31, 2022
Notes to Financial Statements (Unaudited) — continued
At January 31, 2022, the hierarchy of inputs used in valuing the Fund’s investments and open derivative instruments, which are carried at value, were as follows:
| | | | | | | | | | | | | | | | |
| Asset Description | | Level 1 | | | Level 2 | | | Level 3 | | | Total | |
| | | | |
Convertible Bonds | | $ | — | | | $ | 19,238,986 | | | $ | — | | | $ | 19,238,986 | |
| | | | |
Foreign Corporate Bonds | | | — | | | | 302,968,503 | | | | 930,468 | | | | 303,898,971 | |
| | | | |
Loan Participation Notes | | | — | | | | — | | | | 17,525,041 | | | | 17,525,041 | |
| | | | |
Senior Floating-Rate Loans | | | — | | | | 14,228,705 | | | | — | | | | 14,228,705 | |
| | | | |
Sovereign Government Bonds | | | — | | | | 487,144,910 | | | | — | | | | 487,144,910 | |
| | | | |
Sovereign Loans | | | — | | | | 44,264,206 | | | | — | | | | 44,264,206 | |
| | | | |
Short-Term Investments — | | | | | | | | | | | | | | | | |
| | | | |
Affiliated Fund | | | — | | | | 181,854,912 | | | | — | | | | 181,854,912 | |
| | | | |
Sovereign Government Securities | | | — | | | | 59,617,005 | | | | — | | | | 59,617,005 | |
| | | | |
U.S. Treasury Obligations | | | — | | | | 50,449,646 | | | | — | | | | 50,449,646 | |
| | | | |
Purchased Interest Rate Swaptions | | | — | | | | 3,352 | | | | — | | | | 3,352 | |
| | | | |
Total Investments | | $ | — | | | $ | 1,159,770,225 | | | $ | 18,455,509 | | | $ | 1,178,225,734 | |
| | | | |
Forward Foreign Currency Exchange Contracts | | $ | — | | | $ | 5,288,845 | | | $ | — | | | $ | 5,288,845 | |
| | | | |
Non-deliverable Bond Forward Contracts | | | — | | | | 69,834 | | | | — | | | | 69,834 | |
| | | | |
Futures Contracts | | | 6,703,061 | | | | — | | | | — | | | | 6,703,061 | |
| | | | |
Swap Contracts | | | — | | | | 8,405,363 | | | | — | | | | 8,405,363 | |
| | | | |
Total | | $ | 6,703,061 | | | $ | 1,173,534,267 | | | $ | 18,455,509 | | | $ | 1,198,692,837 | |
| | | | |
Liability Description | | | | | | | | | | | | | | | | |
| | | | |
Forward Foreign Currency Exchange Contracts | | $ | — | | | $ | (4,855,766 | ) | | $ | — | | | $ | (4,855,766 | ) |
| | | | |
Non-deliverable Bond Forward Contracts | | | — | | | | (140,338 | ) | | | — | | | | (140,338 | ) |
| | | | |
Swap Contracts | | | — | | | | (15,740,515 | ) | | | — | | | | (15,740,515 | ) |
| | | | |
Total | | $ | — | | | $ | (20,736,619 | ) | | $ | — | | | $ | (20,736,619 | ) |
The following is a reconciliation of Level 3 assets for which significant unobservable inputs were used to determine fair value:
| | | | | | | | | | | | |
| | | Investments in Foreign Corporate
Bonds | | | Investments in
Loan Participation
Notes | | | Total | |
| | | |
Balance as of July 31, 2021 | | $ | 885,983 | | | $ | 18,605,918 | | | $ | 19,491,901 | |
| | | |
Realized gains (losses) | | | — | | | | — | | | | — | |
| | | |
Change in net unrealized appreciation (depreciation) | | | 269,485 | | | | (991,527 | ) | | | (722,042 | ) |
| | | |
Cost of purchases | | | — | | | | — | | | | — | |
| | | |
Proceeds from sales, including return of capital | | | (225,000 | ) | | | — | | | | (225,000 | ) |
| | | |
Accrued discount (premium) | | | — | | | | (89,350 | ) | | | (89,350 | ) |
| | | |
Transfers to Level 3 | | | — | | | | — | | | | — | |
| | | |
Transfers from Level 3 | | | — | | | | — | | | | — | |
| | | |
Balance as of January 31, 2022 | | $ | 930,468 | | | $ | 17,525,041 | | | $ | 18,455,509 | |
| | | |
Change in net unrealized appreciation (depreciation) on investments still held as of January 31, 2022 | | $ | 269,485 | | | $ | (991,527 | ) | | $ | (722,042 | ) |
Eaton Vance
Emerging Markets Debt Opportunities Fund
January 31, 2022
Notes to Financial Statements (Unaudited) — continued
The following is a summary of quantitative information about significant unobservable valuation inputs for Level 3 investments held as of January 31, 2022:
| | | | | | | | | | | | | | | | | | |
| Type of Investment | | Fair Value as of
January 31,
2022 | | | Valuation
Technique | | | Unobservable Inputs | | Input | | | Impact to
Valuation
from an
Increase to
Input* | |
| | | | | |
Foreign Corporate Bonds | | $ | 930,468 | | | | Matrix Pricing | | | Credit spread to U.S. Treasury | | | 24.09 | % | | | Decrease | |
| | | | | |
Loan Participation Notes | | | 17,525,041 | | | | Matrix Pricing | | | Adjusted Credit Spread to the Central Bank of Uzbekistan Quoted Policy Rate | | | 6.65 | % | | | Decrease | |
| * | Represents the directional change in the fair value of the Level 3 investments that would result in an increase to the corresponding unobservable input. A decrease to the unobservable input would have the opposite effect. |
12 Risks and Uncertainties
Risks Associated with Foreign Investments
Foreign investments can be adversely affected by political, economic and market developments abroad, including the imposition of economic and other sanctions by the United States or another country. There may be less publicly available information about foreign issuers because they may not be subject to reporting practices, requirements or regulations comparable to those to which United States companies are subject. Foreign markets may be smaller, less liquid and more volatile than the major markets in the United States. Trading in foreign markets typically involves higher expense than trading in the United States. The Fund may have difficulties enforcing its legal or contractual rights in a foreign country. Securities that trade or are denominated in currencies other than the U.S. dollar may be adversely affected by fluctuations in currency exchange rates.
Emerging market securities often involve greater risks than developed market securities. Investment markets within emerging market countries are typically smaller, less liquid, less developed and more volatile than those in more developed markets like the United States, and may be focused in certain economic sectors. The information available about an emerging market issuer may be less reliable than for comparable issuers in more developed capital markets. Governmental actions can have a significant effect on the economic conditions in emerging market countries. It may be more difficult to make a claim or obtain a judgment in the courts of these countries than it is in the United States. The possibility of fraud, negligence, undue influence being exerted by an issuer or refusal to recognize ownership exists in some emerging markets. Disruptions due to work stoppages and trading improprieties in foreign securities markets have caused such markets to close. Emerging market securities are also subject to speculative trading, which contributes to their volatility.
Economic data as reported by sovereign entities may be delayed, inaccurate or fraudulent. In the event of a default by a sovereign entity, there are typically no assets to be seized or cash flows to be attached. Furthermore, the willingness or ability of a sovereign entity to restructure defaulted debt may be limited. Therefore, losses on sovereign defaults may far exceed the losses from the default of a similarly rated U.S. debt issuer.
LIBOR Transition Risk
Certain instruments held by the Fund may pay an interest rate based on the London Interbank Offered Rate (“LIBOR”), which is the average offered rate for various maturities of short-term loans between certain major international banks. LIBOR is used throughout global banking and financial industries to determine interest rates for a variety of financial instruments (such as debt instruments and derivatives) and borrowing arrangements. The ICE Benchmark Administration Limited, the administrator of LIBOR, ceased publishing certain LIBOR settings on December 31, 2021, and is expected to cease publishing the remaining LIBOR settings on June 30, 2023. Although the transition process away from LIBOR is expected to be defined, there remains uncertainty regarding the future utilization of LIBOR and the nature of any replacement rate or rates. The phase-out of LIBOR may result in, among other things, increased volatility or illiquidity in markets for instruments based on LIBOR and changes in the value of such instruments.
Pandemic Risk
An outbreak of respiratory disease caused by a novel coronavirus was first detected in China in late 2019 and subsequently spread internationally. This coronavirus has resulted in closing borders, enhanced health screenings, changes to healthcare service preparation and delivery, quarantines, cancellations, disruptions to supply chains and customer activity, as well as general concern and uncertainty. Health crises caused by outbreaks, such as the coronavirus outbreak, may exacerbate other pre-existing political, social and economic risks and disrupt normal market conditions and operations. The impact of this outbreak has negatively affected the worldwide economy, the economies of individual countries, individual companies, and the market in
Eaton Vance
Emerging Markets Debt Opportunities Fund
January 31, 2022
Notes to Financial Statements (Unaudited) — continued
general, and may continue to do so in significant and unforeseen ways, as may other epidemics and pandemics that may arise in the future. Any such impact could adversely affect the Fund’s performance, or the performance of the securities in which the Fund invests.
13 Subsequent Event
On February 24, 2022, Russia launched an invasion of Ukraine, following rising tensions over the buildup of Russian troops along the Ukrainian border and joint military exercises by Russia with Belarus. In response to the invasion, many countries, including the U.S., have imposed economic sanctions on Russian governmental institutions, Russian entities, and Russian individuals. The conflict and sanctions have had a negative impact on the Russian economy, on the Russian currency, and on investments having exposure to Russia, Belarus and Ukraine. The conflict could also have a significant effect on investments outside the region. The duration and extent of the military conflict with Russia and the related sanctions cannot be predicted at this time.
Eaton Vance
Emerging Markets Debt Opportunities Fund
January 31, 2022
Officers and Directors
Officers
Eric A. Stein
President
Deidre E. Walsh
Vice President
James F. Kirchner
Treasurer
Jill R. Damon
Secretary
Richard F. Froio
Chief Compliance Officer
Directors
George J. Gorman
Chairperson
Thomas E. Faust Jr.*
Mark R. Fetting
Cynthia E. Frost
Valerie A. Mosley
William H. Park
Helen Frame Peters
Keith Quinton
Marcus L. Smith
Susan J. Sutherland
Scott E. Wennerholm
Eaton Vance Funds
| | |
| Privacy Notice | | April 2021 |
| | |
| |
| FACTS | | WHAT DOES EATON VANCE DO WITH YOUR
PERSONAL INFORMATION? |
| | | |
| |
| | |
| Why? | | Financial companies choose how they share your personal information. Federal law gives consumers the right to limit some but not all sharing. Federal law also requires us to tell you how we collect, share, and protect your personal information. Please read this notice carefully to understand what we do. |
| | |
| | | |
| What? | | The types of personal information we collect and share depend on the product or service you have with us. This information can include: ∎ Social Security number and income ∎ investment experience and risk tolerance ∎ checking account number and wire transfer instructions |
| | |
| | | |
| How? | | All financial companies need to share customers’ personal information to run their everyday business. In the section below, we list the reasons financial companies can share their customers’ personal information; the reasons Eaton Vance chooses to share; and whether you can limit this sharing. |
| | |
| | | |
| | | | |
Reasons we can share your
personal information | | Does Eaton Vance share? | | Can you limit this sharing? |
| For our everyday business purposes — such as to process your transactions, maintain your account(s), respond to court orders and legal investigations, or report to credit bureaus | | Yes | | No |
| For our marketing purposes — to offer our products and services to you | | Yes | | No |
| For joint marketing with other financial companies | | No | | We don’t share |
| For our investment management affiliates’ everyday business purposes — information about your transactions, experiences, and creditworthiness | | Yes | | Yes |
| For our affiliates’ everyday business purposes — information about your transactions and experiences | | Yes | | No |
| For our affiliates’ everyday business purposes — information about your creditworthiness | | No | | We don’t share |
| For our investment management affiliates to market to you | | Yes | | Yes |
| For our affiliates to market to you | | No | | We don’t share |
| For nonaffiliates to market to you | | No | | We don’t share |
| | |
| To limit our sharing | | Call toll-free 1-800-262-1122 or email: EVPrivacy@eatonvance.com Please note: If you are a new customer, we can begin sharing your information 30 days from the date we sent this notice. When you are no longer our customer, we continue to share your information as described in this notice. However, you can contact us at any time to limit our sharing. |
| | |
| | | |
| | |
| Questions? | | Call toll-free 1-800-262-1122 or email: EVPrivacy@eatonvance.com |
| | |
| | | |
Eaton Vance Funds
| | |
| Privacy Notice — continued | | April 2021 |
| | |
| Who we are |
| Who is providing this notice? | | Eaton Vance Management, Eaton Vance Distributors, Inc., Eaton Vance Trust Company, Eaton Vance Management (International) Limited, Eaton Vance Advisers International Ltd., Eaton Vance Global Advisors Limited, Eaton Vance Management’s Real Estate Investment Group, Boston Management and Research, Calvert Research and Management, Eaton Vance and Calvert Fund Families and our investment advisory affiliates (“Eaton Vance”) (see Investment Management Affiliates definition below) |
| What we do |
| How does Eaton Vance protect my personal information? | | To protect your personal information from unauthorized access and use, we use security measures that comply with federal law. These measures include computer safeguards and secured files and buildings. We have policies governing the proper handling of customer information by personnel and requiring third parties that provide support to adhere to appropriate security standards with respect to such information. |
| How does Eaton Vance collect my personal information? | | We collect your personal information, for example, when you ∎ open an account or make deposits or withdrawals from your account ∎ buy securities from us or make a wire transfer ∎ give us your contact information We also collect your personal information from others, such as credit bureaus, affiliates, or other companies. |
| Why can’t I limit all sharing? | | Federal law gives you the right to limit only ∎ sharing for affiliates’ everyday business purposes — information about your creditworthiness ∎ affiliates from using your information to market to you ∎ sharing for nonaffiliates to market to you State laws and individual companies may give you additional rights to limit sharing. See below for more on your rights under state law. |
| Definitions |
| Investment Management Affiliates | | Eaton Vance Investment Management Affiliates include registered investment advisers, registered broker-dealers, and registered and unregistered funds. Investment Management Affiliates does not include entities associated with Morgan Stanley Wealth Management, such as Morgan Stanley Smith Barney LLC and Morgan Stanley & Co. |
| Affiliates | | Companies related by common ownership or control. They can be financial and nonfinancial companies. ∎ Our affiliates include companies with a Morgan Stanley name and financial companies such as Morgan Stanley Smith Barney LLC and Morgan Stanley & Co. |
| Nonaffiliates | | Companies not related by common ownership or control. They can be financial and nonfinancial companies. ∎ Eaton Vance does not share with nonaffiliates so they can market to you. |
| Joint marketing | | A formal agreement between nonaffiliated financial companies that together market financial products or services to you. ∎ Eaton Vance doesn’t jointly market. |
| Other important information |
Vermont: Except as permitted by law, we will not share personal information we collect about Vermont residents with Nonaffiliates unless you provide us with your written consent to share such information. California: Except as permitted by law, we will not share personal information we collect about California residents with Nonaffiliates and we will limit sharing such personal information with our Affiliates to comply with California privacy laws that apply to us. |
Eaton Vance Funds
IMPORTANT NOTICES
Delivery of Shareholder Documents. The Securities and Exchange Commission (SEC) permits funds to deliver only one copy of shareholder documents, including prospectuses, proxy statements and shareholder reports, to fund investors with multiple accounts at the same residential or post office box address. This practice is often called “householding” and it helps eliminate duplicate mailings to shareholders. Eaton Vance, or your financial intermediary, may household the mailing of your documents indefinitely unless you instruct Eaton Vance, or your financial intermediary, otherwise. If you would prefer that your Eaton Vance documents not be householded, please contact Eaton Vance at 1-800-262-1122, or contact your financial intermediary. Your instructions that householding not apply to delivery of your Eaton Vance documents will typically be effective within 30 days of receipt by Eaton Vance or your financial intermediary.
Portfolio Holdings. Each Eaton Vance Fund and its underlying Portfolio(s) (if applicable) files a schedule of portfolio holdings on Part F to Form N-PORT with the SEC. Certain information filed on Form N-PORT may be viewed on the Eaton Vance website at www.eatonvance.com, by calling Eaton Vance at 1-800-262-1122 or in the EDGAR database on the SEC’s website at www.sec.gov.
Proxy Voting. From time to time, funds are required to vote proxies related to the securities held by the funds. The Eaton Vance Funds or their underlying Portfolios (if applicable) vote proxies according to a set of policies and procedures approved by the Funds’ and Portfolios’ Boards. You may obtain a description of these policies and procedures and information on how the Funds or Portfolios voted proxies relating to portfolio securities during the most recent 12-month period ended June 30, without charge, upon request, by calling 1-800-262-1122 and by accessing the SEC’s website at www.sec.gov.
This Page Intentionally Left Blank
This Page Intentionally Left Blank
Investment Adviser and Administrator
Eaton Vance Management
Two International Place
Boston, MA 02110
Principal Underwriter*
Eaton Vance Distributors, Inc.
Two International Place
Boston, MA 02110
(617) 482-8260
Custodian
State Street Bank and Trust Company
State Street Financial Center, One Lincoln Street
Boston, MA 02111
Transfer Agent
BNY Mellon Investment Servicing (US) Inc.
Attn: Eaton Vance Funds
P.O. Box 9653
Providence, RI 02940-9653
(800) 262-1122
Fund Offices
Two International Place
Boston, MA 02110
| * | FINRA BrokerCheck. Investors may check the background of their Investment Professional by contacting the Financial Industry Regulatory Authority (FINRA). FINRA BrokerCheck is a free tool to help investors check the professional background of current and former FINRA-registered securities firms and brokers. FINRA BrokerCheck is available by calling 1-800-289-9999 and at www.FINRA.org. The FINRA BrokerCheck brochure describing this program is available to investors at www.FINRA.org. |
14265 1.31.22
Item 2. Code of Ethics
Not required in this filing.
Item 3. Audit Committee Financial Expert
Not required in this filing.
Item 4. Principal Accountant Fees and Services
Not required in this filing.
Item 5. Audit Committee of Listed Registrants
Not applicable.
Item 6. Schedule of Investments
Please see schedule of investments contained in the Report to Stockholders included under Item 1 of this Form N-CSR.
Item 7. Disclosure of Proxy Voting Policies and Procedures for Closed-End Management Investment Companies
Not applicable.
Item 8. Portfolio Managers of Closed-End Management Investment Companies
Not applicable.
Item 9. Purchases of Equity Securities by Closed-End Management Investment Company and Affiliated Purchasers
Not applicable.
Item 10. Submission of Matters to a Vote of Security Holders
No material changes.
Item 11. Controls and Procedures
(a) It is the conclusion of the registrant’s principal executive officer and principal financial officer that the effectiveness of the registrant’s current disclosure controls and procedures (such disclosure controls and procedures having been evaluated within 90 days of the date of this filing) provide reasonable assurance that the information required to be disclosed by the registrant has been recorded, processed, summarized and reported within the time period specified in the Commission’s rules and forms and that the information required to be disclosed by the registrant has been accumulated and communicated to the registrant’s principal executive officer and principal financial officer in order to allow timely decisions regarding required disclosure.
(b) There have been no changes in the registrant’s internal controls over financial reporting during the period covered by this report that has materially affected, or is reasonably likely to materially affect, the registrant’s internal control over financial reporting.
Item 12. Disclosure of Securities Lending Activities for Closed-End Management Investment Companies
Not applicable.
Item 13. Exhibits
Signatures
Pursuant to the requirements of the Securities Exchange Act of 1934 and the Investment Company Act of 1940, the registrant has duly caused this report to be signed on its behalf by the undersigned, thereunto duly authorized.
| | |
| Eaton Vance Series Fund, Inc. |
| |
| By: | | /s/ Eric A. Stein |
| | Eric A. Stein |
| | President |
| |
| Date: | | March 28, 2022 |
Pursuant to the requirements of the Securities Exchange Act of 1934 and the Investment Company Act of 1940, this report has been signed below by the following persons on behalf of the registrant and in the capacities and on the dates indicated.
| | |
| By: | | /s/ James F. Kirchner |
| | James F. Kirchner |
| | Treasurer |
| |
| Date: | | March 28, 2022 |
| |
| By: | | /s/ Eric A. Stein |
| | Eric A. Stein |
| | President |
| |
| Date: | | March 28, 2022 |