UNITED STATES
SECURITIES AND EXCHANGE COMMISSION
Washington, D.C. 20549
FormN-CSR
CERTIFIED SHAREHOLDER REPORT OF REGISTERED
MANAGEMENT INVESTMENT COMPANIES
Investment Company Act File Number:811-22714
Eaton Vance Series Fund, Inc.
(Exact Name of Registrant as Specified in Charter)
Two International Place, Boston, Massachusetts 02110
(Address of Principal Executive Offices)
Maureen A. Gemma
Two International Place, Boston, Massachusetts 02110
(Name and Address of Agent for Services)
(617)482-8260
(Registrant’s Telephone Number)
July 31
Date of Fiscal Year End
January 31, 2019
Date of Reporting Period
Item 1. Reports to Stockholders

Eaton Vance
Emerging Markets Debt Opportunities Fund
Semiannual Report
January 31, 2019
Important Note. Beginning on January 1, 2021, as permitted by regulations adopted by the Securities and Exchange Commission, paper copies of the Fund’s annual and semi-annual shareholder reports will no longer be sent by mail unless you specifically request paper copies of the reports. Instead, the reports will be made available on the Fund’s website (eatonvance.com/funddocuments), and you will be notified by mail each time a report is posted and provided with a website address to access the report.
If you already elected to receive shareholder reports electronically, you will not be affected by this change and you need not take any action. If you are a direct investor, you may elect to receive shareholder reports and other communications from the Fund electronically by signing up for e-Delivery at eatonvance.com/edelivery. If you own your shares through a financial intermediary (such as a broker-dealer or bank), you must contact your financial intermediary to sign up.
You may elect to receive all future Fund shareholder reports in paper free of charge. If you are a direct investor, you can inform the Fund that you wish to continue receiving paper copies of your shareholder reports by calling 1-800-262-1122. If you own these shares through a financial intermediary, you must contact your financial intermediary or follow instructions included with this disclosure, if applicable, to elect to continue to receive paper copies of your shareholder reports. Your election to receive reports in paper will apply to all Eaton Vance funds held directly or to all funds held through your financial intermediary, as applicable.

Commodity Futures Trading Commission Registration. Effective December 31, 2012, the Commodity Futures Trading Commission (“CFTC”) adopted certain regulatory changes that subject registered investment companies and advisers to regulation by the CFTC if a fund invests more than a prescribed level of its assets in certain CFTC-regulated instruments (including futures, certain options and swap agreements) or markets itself as providing investment exposure to such instruments. The Fund is considered to be a commodity pool operator under CFTC regulations. The Fund’s adviser is registered with the CFTC as a commodity pool operator and a commodity trading advisor. The CFTC has neither reviewed nor approved the Fund’s investment strategies.
Fund shares are not insured by the FDIC and are not deposits or other obligations of, or guaranteed by, any depository institution. Shares are subject to investment risks, including possible loss of principal invested.
This report must be preceded or accompanied by a current summary prospectus or prospectus. Before investing, investors should consider carefully the investment objective, risks, and charges and expenses of a mutual fund. This and other important information is contained in the summary prospectus and prospectus, which can be obtained from a financial advisor. Prospective investors should read the prospectus carefully before investing. For further information, please call1-800-262-1122.
Semiannual ReportJanuary 31, 2019
Eaton Vance
Emerging Markets Debt Opportunities Fund
Table of Contents
| | | | |
Performance | | | 2 | |
| |
Fund Profile | | | 2 | |
| |
Endnotes and Additional Disclosures | | | 3 | |
| |
Fund Expenses | | | 4 | |
| |
Financial Statements | | | 5 | |
| |
Special Meeting of Shareholders | | | 34 | |
| |
Officers and Directors | | | 35 | |
| |
Important Notices | | | 36 | |
Eaton Vance
Emerging Markets Debt Opportunities Fund
January 31, 2019
Performance1,2
Portfolio ManagersJohn R. Baur, Michael A. Cirami, CFA and Eric A. Stein, CFA
| | | | | | | | | | | | | | | | | | | | | | | | |
| % Average Annual Total Returns | | Class
Inception Date | | | Performance
Inception Date | | | Six Months | | | One Year | | | Five Years | | | Since
Inception | |
Class A at NAV | | | 09/03/2015 | | | | 02/04/2013 | | | | 0.70 | % | | | –2.74 | % | | | 3.79 | % | | | 2.55 | % |
Class A with 4.75% Maximum Sales Charge | | | — | | | | — | | | | –4.09 | | | | –7.34 | | | | 2.79 | | | | 1.72 | |
Class I at NAV | | | 09/03/2015 | | | | 02/04/2013 | | | | 0.95 | | | | –2.46 | | | | 4.03 | | | | 2.75 | |
Class R6 at NAV | | | 02/04/2013 | | | | 02/04/2013 | | | | 0.97 | | | | –2.45 | | | | 3.99 | | | | 2.72 | |
JPMorgan EMB (JEMB) Hard Currency/Local Currency 50-50 Index | | | — | | | | — | | | | 3.27 | % | | | –2.38 | % | | | 3.26 | % | | | 1.24 | % |
JPMorgan Government Bond Index: Emerging Markets (JPM GBI-EM) Global Diversified | | | — | | | | — | | | | 3.75 | | | | –5.33 | | | | 1.05 | | | | –1.65 | |
| | | | | | |
| | | | | | | | | | | | | | | | | | | | | | | | |
| % Total Annual Operating Expense Ratios3 | | | | | | | | | | | Class A | | | Class I | | | Class R6 | |
Gross | | | | | | | | | | | | | | | 1.44 | % | | | 1.19 | % | | | 1.14 | % |
Net | | | | | | | | | | | | | | | 1.15 | | | | 0.90 | | | | 0.85 | |
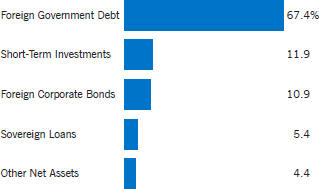
Fund Profile
Asset Allocation (% of net assets)4
Foreign Currency Exposure (% of net assets)5
| | | | |
| |
Egypt | | | 11.9 | % |
| |
Thailand | | | 8.3 | |
| |
Serbia | | | 7.4 | |
| |
Brazil | | | 7.0 | |
| |
Turkey | | | 6.7 | |
| |
Indonesia | | | 5.6 | |
| |
Sri Lanka | | | 3.5 | |
| |
Colombo | | | 3.5 | |
| |
Uganda | | | 2.8 | |
| |
Georgia | | | 1.9 | |
| |
Dominican Republic | | | 1.9 | |
| |
Morocco | | | 1.5 | |
| |
Other | | | 2.3 | * |
| |
Euro | | | –8.7 | |
| |
Total Long | | | 64.3 | |
| |
Total Short | | | –8.7 | |
| |
Total Net | | | 55.6 | |
| * | Includes amounts each less than 1.0%. |
See Endnotes and Additional Disclosures in this report.
Past performance is no guarantee of future results. Returns are historical and are calculated by determining the percentage change in net asset value (NAV) or offering price (as applicable) with all distributions reinvested. Investment return and principal value will fluctuate so that shares, when redeemed, may be worth more or less than their original cost. Performance less than or equal to one year is cumulative. Performance is for the stated time period only; due to market volatility, the Fund’s current performance may be lower or higher than quoted. Returns are before taxes unless otherwise noted. For performance as of the most recentmonth-end, please refer to eatonvance.com.
Eaton Vance
Emerging Markets Debt Opportunities Fund
January 31, 2019
Endnotes and Additional Disclosures
| 1 | JPMorgan EMB (JEMB) Hard Currency/Local Currency50-50 Index is a blended index comprised of 25% JPMorgan Emerging Market Bond Index (EMBI) Global Diversified, 25% JPMorgan Corporate Emerging Markets Bond Index (CEMBI) Broad Diversified, and 50% JPMorgan Government Bond Index: Emerging Markets (JPMGBI-EM) Global Diversified. JPMorgan Emerging Market Bond Index (EMBI) Global Diversified is amarket-cap weighted index that measuresUSD-denominated Brady Bonds, Eurobonds, and traded loans issued by sovereign entities. JPMorgan Corporate Emerging Markets Bond Index (CEMBI) Broad Diversified is an unmanaged index ofUSD-denominated emerging market corporate bonds. JPMorgan Government Bond Index: Emerging Markets (JPMGBI- EM) Global Diversified is an unmanaged index of local-currency bonds with maturities of more than one year issued by emerging markets governments. Unless otherwise stated, index returns do not reflect the effect of any applicable sales charges, commissions, expenses, taxes or leverage, as applicable. It is not possible to invest directly in an index. |
| 2 | Total Returns at net asset value (NAV) do not include applicable sales charges. If sales charges were deducted, the returns would be lower. Total Returns shown with maximum sales charge reflect the stated maximum sales charge. Unless otherwise stated, performance does not reflect the deduction of taxes on Fund distributions or redemptions of Fund shares. |
| | Performance prior to the inception date of a class may be linked to the performance of an older class of the Fund. This linked performance is adjusted for any applicable sales charge, but is not adjusted for class expense differences. If adjusted for such differences, the performance would be different. The performance of Class A and Class I is linked to Class R6. Performance since inception for an index, if presented, is the performance since the Fund’s or oldest share class’ inception, as applicable. Performance presented in the Financial Highlights included in the financial statements is not linked. |
| 3 | Source: Fund prospectus. Net expense ratios reflect a contractual expense reimbursement that continues through 11/30/19. Without the reimbursement, performance would have been lower. The expense ratios for the current reporting period can be found in the Financial Highlights section of this report. |
| 4 | Other Net Assets represents other assets less liabilities and includes any investment type that represents less than 1% of net assets. |
| 5 | Currency exposures include all foreign exchange denominated assets, currency derivatives and commodities (including commodity derivatives). Total exposures may exceed 100% due to implicit leverage created by derivatives |
| | Fund profile subject to change due to active management. |
Important Notice to Shareholders
Effective February 15, 2019, the Fund changed its primary benchmark to JPMorgan EMB (JEMB) Hard Currency/Local Currency50-50 Index because the investment adviser believes it is a more appropriate benchmark for the Fund.
Eaton Vance
Emerging Markets Debt Opportunities Fund
January 31, 2019
Fund Expenses
Example: As a Fund shareholder, you incur two types of costs: (1) transaction costs, including sales charges (loads) on purchases and redemption fees (if applicable); and (2) ongoing costs, including management fees; distribution and/or service fees; and other Fund expenses. This Example is intended to help you understand your ongoing costs (in dollars) of Fund investing and to compare these costs with the ongoing costs of investing in other mutual funds. The Example is based on an investment of $1,000 invested at the beginning of the period and held for the entire period (August 1, 2018 – January 31, 2019).
Actual Expenses: The first section of the table below provides information about actual account values and actual expenses. You may use the information in this section, together with the amount you invested, to estimate the expenses that you paid over the period. Simply divide your account value by $1,000 (for example, an $8,600 account value divided by $1,000 = 8.6), then multiply the result by the number in the first section under the heading entitled “Expenses Paid During Period” to estimate the expenses you paid on your account during this period.
Hypothetical Example for Comparison Purposes: The second section of the table below provides information about hypothetical account values and hypothetical expenses based on the actual Fund expense ratio and an assumed rate of return of 5% per year (before expenses), which is not the actual Fund return. The hypothetical account values and expenses may not be used to estimate the actual ending account balance or expenses you paid for the period. You may use this information to compare the ongoing costs of investing in your Fund and other funds. To do so, compare this 5% hypothetical example with the 5% hypothetical examples that appear in the shareholder reports of the other funds.
Please note that the expenses shown in the table are meant to highlight your ongoing costs only and do not reflect any transactional costs, such as sales charges (loads) or redemption fees (if applicable). Therefore, the second section of the table is useful in comparing ongoing costs only, and will not help you determine the relative total costs of owning different funds. In addition, if these transactional costs were included, your costs would be higher.
| | | | | | | | | | | | | | | | |
| | | Beginning
Account Value
(8/1/18) | | | Ending
Account Value
(1/31/19) | | | Expenses Paid
During Period*
(8/1/18 – 1/31/19) | | | Annualized
Expense
Ratio | |
|
Actual | |
Class A | | $ | 1,000.00 | | | $ | 1,007.00 | | | $ | 5.82 | ** | | | 1.15 | % |
Class I | | $ | 1,000.00 | | | $ | 1,009.50 | | | $ | 4.56 | ** | | | 0.90 | % |
Class R6 | | $ | 1,000.00 | | | $ | 1,009.70 | | | $ | 4.31 | ** | | | 0.85 | % |
| |
Hypothetical | |
(5% return per year before expenses) | |
Class A | | $ | 1,000.00 | | | $ | 1,019.40 | | | $ | 5.85 | ** | | | 1.15 | % |
Class I | | $ | 1,000.00 | | | $ | 1,020.70 | | | $ | 4.58 | ** | | | 0.90 | % |
Class R6 | | $ | 1,000.00 | | | $ | 1,020.90 | | | $ | 4.33 | ** | | | 0.85 | % |
| * | Expenses are equal to the Fund’s annualized expense ratio for the indicated Class, multiplied by the average account value over the period, multiplied by 184/365 (to reflect theone-half year period). The Example assumes that the $1,000 was invested at the net asset value per share determined at the close of business on July 31, 2018. |
| ** | Absent an allocation of certain expenses to an affiliate, expenses would be higher. |
Eaton Vance
Emerging Markets Debt Opportunities Fund
January 31, 2019
Portfolio of Investments (Unaudited)
| | | | | | | | | | | | |
| Foreign Government Bonds — 53.7% | |
| Security | | | | | Principal
Amount
(000’s omitted) | | | Value | |
| | | | | | | | | | | | |
|
| Albania — 1.8% | |
| | | |
Republic of Albania, 3.50%, 10/9/25(1) | | | EUR | | | | 2,000 | | | $ | 2,315,044 | |
| |
Total Albania | | | $ | 2,315,044 | |
|
| Argentina — 4.6% | |
| | | |
City of Buenos Aires, 48.97%, (BADLAR + 3.25%), 3/29/24(2) | | | ARS | | | | 1,933 | | | $ | 48,750 | |
| | | |
Provincia de Buenos Aires, 49.16%, (BADLAR + 3.75%), 4/12/25(1)(2)(3) | | | ARS | | | | 15,405 | | | | 389,597 | |
| | | |
Provincia de Buenos Aires, 51.03%, (BADLAR + 3.83%), 5/31/22(2) | | | ARS | | | | 3,317 | | | | 83,890 | |
| | | |
Republic of Argentina, 4.50%, 6/21/19 | | | USD | | | | 49 | | | | 48,480 | |
| | | |
Republic of Argentina, 6.25%, 11/9/47 | | | EUR | | | | 563 | | | | 493,295 | |
| | | |
Republic of Argentina, 6.875%, 1/11/48 | | | USD | | | | 4,311 | | | | 3,325,980 | |
| | | |
Republic of Argentina, 7.625%, 4/22/46 | | | USD | | | | 2,009 | | | | 1,640,097 | |
| |
Total Argentina | | | $ | 6,030,089 | |
|
| Armenia — 1.6% | |
| | | |
Republic of Armenia, 6.00%, 9/30/20(1) | | | USD | | | | 2,100 | | | $ | 2,150,043 | |
| |
Total Armenia | | | $ | 2,150,043 | |
|
| Bahrain — 9.5% | |
| | | |
CBB International Sukuk Co.,
6.875%, 10/5/25(1) | | | USD | | | | 405 | | | $ | 428,950 | |
| | | |
Kingdom of Bahrain, 6.125%, 8/1/23(1) | | | USD | | | | 965 | | | | 1,012,075 | |
| | | |
Kingdom of Bahrain, 6.75%, 9/20/29(1) | | | USD | | | | 2,717 | | | | 2,760,119 | |
| | | |
Kingdom of Bahrain, 7.00%, 1/26/26(1) | | | USD | | | | 936 | | | | 993,208 | |
| | | |
Kingdom of Bahrain, 7.00%, 10/12/28(1) | | | USD | | | | 3,077 | | | | 3,191,587 | |
| | | |
Kingdom of Bahrain, 7.50%, 9/20/47(1) | | | USD | | | | 4,029 | | | | 4,031,474 | |
| |
Total Bahrain | | | $ | 12,417,413 | |
|
| Barbados — 0.8% | |
| | | |
Government of Barbados,
6.625%, 12/5/35(1)(4) | | | USD | | | | 1,110 | | | $ | 604,617 | |
| | | |
Government of Barbados,
7.00%, 8/4/22(1)(4) | | | USD | | | | 116 | | | | 63,127 | |
| | | |
Government of Barbados,
7.25%, 12/15/21(1)(4) | | | USD | | | | 684 | | | | 368,471 | |
| |
Total Barbados | | | $ | 1,036,215 | |
|
| Bosnia and Herzegovina — 0.3% | |
| | | |
Republic of Srpska, 1.50%, 10/30/23 | | | BAM | | | | 243 | | | $ | 137,204 | |
| | | |
Republic of Srpska, 1.50%, 6/9/25 | | | BAM | | | | 68 | | | | 37,927 | |
| | | |
Republic of Srpska, 1.50%, 9/25/26 | | | BAM | | | | 337 | | | | 186,246 | |
| |
Total Bosnia and Herzegovina | | | $ | 361,377 | |
| | | | | | | | | | |
| Security | | | | Principal
Amount
(000’s omitted) | | | Value | |
|
| Dominican Republic — 1.8% | |
| | | |
Dominican Republic, 10.50%, 4/7/23(1) | | DOP | | | 116,500 | | | $ | 2,328,733 | |
| |
Total Dominican Republic | | | $ | 2,328,733 | |
|
| El Salvador — 1.0% | |
| | | |
Republic of El Salvador, 6.375%, 1/18/27(1) | | USD | | | 869 | | | $ | 832,067 | |
| | | |
Republic of El Salvador, 8.25%, 4/10/32(1) | | USD | | | 296 | | | | 311,874 | |
| | | |
Republic of El Salvador, 8.625%, 2/28/29(1) | | USD | | | 181 | | | | 195,933 | |
| |
Total El Salvador | | | $ | 1,339,874 | |
|
| Ethiopia — 0.2% | |
| | | |
Federal Democratic Republic of Ethiopia, 6.625%, 12/11/24(1) | | USD | | | 270 | | | $ | 272,803 | |
| |
Total Ethiopia | | | $ | 272,803 | |
|
| Fiji — 2.0% | |
| | | |
Republic of Fiji, 6.625%, 10/2/20(1) | | USD | | | 2,649 | | | $ | 2,643,265 | |
| |
Total Fiji | | | $ | 2,643,265 | |
|
| Indonesia — 6.2% | |
| | | |
Indonesia Government Bond, 7.50%, 5/15/38 | | IDR | | | 27,710,000 | | | $ | 1,809,455 | |
| | | |
Indonesia Government Bond, 8.25%, 5/15/36 | | IDR | | | 49,070,000 | | | | 3,439,904 | |
| | | |
Indonesia Government Bond, 8.75%, 5/15/31 | | IDR | | | 40,094,000 | | | | 2,942,534 | |
| |
Total Indonesia | | | $ | 8,191,893 | |
|
| Kenya — 1.0% | |
| | | |
Republic of Kenya, 7.25%, 2/28/28(1) | | USD | | | 1,400 | | | $ | 1,369,736 | |
| |
Total Kenya | | | $ | 1,369,736 | |
|
| Mongolia — 0.9% | |
| | | |
Development Bank of Mongolia, LLC, 7.25%, 10/23/23(1) | | USD | | | 200 | | | $ | 200,400 | |
| | | |
Mongolia International Bond,
5.125%, 12/5/22(1) | | USD | | | 576 | | | | 562,991 | |
| | | |
Mongolia International Bond,
5.625%, 5/1/23(1) | | USD | | | 420 | | | | 413,666 | |
| |
Total Mongolia | | | $ | 1,177,057 | |
|
| Peru — 4.7% | |
| | | |
Peru Government Bond, 5.20%, 9/12/23 | | PEN | | | 2,919 | | | $ | 898,864 | |
| | | |
Peru Government Bond, 5.70%, 8/12/24 | | PEN | | | 12,981 | | | | 4,059,018 | |
| | | |
Peru Government Bond, 6.35%, 8/12/28 | | PEN | | | 668 | | | | 211,969 | |
| | | |
Peru Government Bond, 8.20%, 8/12/26 | | PEN | | | 2,849 | | | | 1,008,510 | |
| |
Total Peru | | | $ | 6,178,361 | |
| | | | |
| | 5 | | See Notes to Financial Statements. |
Eaton Vance
Emerging Markets Debt Opportunities Fund
January 31, 2019
Portfolio of Investments (Unaudited) — continued
| | | | | | | | | | |
| Security | | | | Principal
Amount
(000’s omitted) | | | Value | |
|
| Serbia — 6.9% | |
| | | |
Serbia Treasury Bond, 5.75%, 7/21/23 | | RSD | | | 227,010 | | | $ | 2,363,239 | |
| | | |
Serbia Treasury Bond, 5.875%, 2/8/28 | | RSD | | | 169,510 | | | | 1,764,711 | |
| | | |
Serbia Treasury Bond, 10.00%, 3/20/21 | | RSD | | | 184,850 | | | | 2,030,672 | |
| | | |
Serbia Treasury Bond, 10.00%, 2/5/22 | | RSD | | | 254,500 | | | | 2,908,559 | |
| |
Total Serbia | | | $ | 9,067,181 | |
|
| Seychelles — 0.2% | |
| | | |
Republic of Seychelles, 8.00%, 1/1/26(1) | | USD | | | 248 | | | $ | 253,135 | |
| |
Total Seychelles | | | $ | 253,135 | |
|
| Sri Lanka — 3.4% | |
| | | |
Sri Lanka Government Bond,
8.50%, 5/1/19 | | LKR | | | 57,000 | | | $ | 318,550 | |
| | | |
Sri Lanka Government Bond,
9.00%, 5/1/21 | | LKR | | | 102,000 | | | | 552,438 | |
| | | |
Sri Lanka Government Bond,
10.00%, 10/1/22 | | LKR | | | 78,020 | | | | 423,193 | |
| | | |
Sri Lanka Government Bond,
10.20%, 7/15/23 | | LKR | | | 16,000 | | | | 86,687 | |
| | | |
Sri Lanka Government Bond,
10.25%, 3/15/25 | | LKR | | | 15,000 | | | | 79,906 | |
| | | |
Sri Lanka Government Bond,
10.60%, 9/15/19 | | LKR | | | 59,000 | | | | 332,009 | |
| | | |
Sri Lanka Government Bond,
10.75%, 3/1/21 | | LKR | | | 22,000 | | | | 123,411 | |
| | | |
Sri Lanka Government Bond,
11.00%, 8/1/21 | | LKR | | | 93,000 | | | | 523,527 | |
| | | |
Sri Lanka Government Bond,
11.00%, 8/1/24 | | LKR | | | 84,000 | | | | 466,381 | |
| | | |
Sri Lanka Government Bond,
11.00%, 5/15/30 | | LKR | | | 53,000 | | | | 282,745 | |
| | | |
Sri Lanka Government Bond,
11.20%, 9/1/23 | | LKR | | | 21,000 | | | | 117,395 | |
| | | |
Sri Lanka Government Bond,
11.40%, 1/1/24 | | LKR | | | 82,000 | | | | 461,770 | |
| | | |
Sri Lanka Government Bond,
11.50%, 12/15/21 | | LKR | | | 69,000 | | | | 392,978 | |
| | | |
Sri Lanka Government Bond,
11.50%, 5/15/23 | | LKR | | | 50,000 | | | | 282,713 | |
| |
Total Sri Lanka | | | $ | 4,443,703 | |
|
| Thailand — 1.2% | |
| | | |
Thailand Government Bond,
1.25%, 3/12/28(1)(5) | | THB | | | 52,167 | | | $ | 1,556,667 | |
| |
Total Thailand | | | $ | 1,556,667 | |
|
| Turkey — 4.5% | |
| | | |
Republic of Turkey, 5.20%, 2/16/26 | | EUR | | | 1,052 | | | $ | 1,238,075 | |
| | | |
Republic of Turkey, 6.125%, 10/24/28 | | USD | | | 1,900 | | | | 1,825,611 | |
| | | |
Republic of Turkey, 7.375%, 2/5/25 | | USD | | | 600 | | | | 628,477 | |
| | | |
Turkey Government Bond, 7.10%, 3/8/23 | | TRY | | | 14,500 | | | | 2,144,136 | |
| |
Total Turkey | | | $ | 5,836,299 | |
|
| Ukraine — 1.1% | |
| | | |
Ukraine Government International Bond, 9.75%, 11/1/28(1) | | USD | | | 1,400 | | | $ | 1,393,000 | |
| |
Total Ukraine | | | $ | 1,393,000 | |
| |
Total Foreign Government Bonds
(identified cost $70,577,087) | | | $ | 70,361,888 | |
| | | | | | | | | | |
| Foreign Corporate Bonds — 10.9% | |
| Security | | | | Principal
Amount
(000’s omitted) | | | Value | |
|
| Belarus — 0.4% | |
| | | |
Eurotorg, LLC Via Bonitron DAC,
8.75%, 10/30/22(1) | | USD | | | 500 | | | $ | 505,470 | |
| |
Total Belarus | | | $ | 505,470 | |
|
| Brazil — 0.9% | |
| | | |
Unigel Luxembourg SA, 10.50%, 1/22/24(1) | | USD | | | 1,100 | | | $ | 1,155,000 | |
| |
Total Brazil | | | $ | 1,155,000 | |
|
| Bulgaria — 0.4% | |
| | | |
Eurohold Bulgaria AD, 6.50%, 12/7/22(1) | | EUR | | | 500 | | | $ | 542,904 | |
| |
Total Bulgaria | | | $ | 542,904 | |
|
| China — 0.5% | |
| | | |
21Vianet Group, Inc., 7.00%, 8/17/20(1) | | USD | | | 300 | | | $ | 299,189 | |
| | | |
CAR, Inc., 6.00%, 2/11/21(1) | | USD | | | 300 | | | | 285,522 | |
| |
Total China | | | $ | 584,711 | |
|
| Colombia — 0.9% | |
| | | |
Frontera Energy Corp., 9.70%, 6/25/23(1) | | USD | | | 1,100 | | | $ | 1,111,000 | |
| |
Total Colombia | | | $ | 1,111,000 | |
|
| El Salvador — 0.7% | |
| | | |
AES El Salvador Trust II, 6.75%, 3/28/23(1) | | USD | | | 1,000 | | | $ | 931,250 | |
| |
Total El Salvador | | | $ | 931,250 | |
|
| Georgia — 0.5% | |
| | | |
JSC Georgia Capital, 6.125%, 3/9/24(1) | | USD | | | 650 | | | $ | 591,500 | |
| |
Total Georgia | | | $ | 591,500 | |
|
| Honduras — 0.2% | |
| | | |
Inversiones Atlantida SA, 8.25%, 7/28/22(1) | | USD | | | 308 | | | $ | 311,080 | |
| |
Total Honduras | | | $ | 311,080 | |
|
| Indonesia — 0.1% | |
| | | |
Jasa Marga (Persero) Tbk PT,
7.50%, 12/11/20(1) | | IDR | | | 2,720,000 | | | $ | 183,646 | |
| |
Total Indonesia | | | $ | 183,646 | |
|
| Mexico — 2.7% | |
| | | |
Credito Real SAB de CV SOFOM ER, 9.50%, 2/7/26(1)(6) | | USD | | | 1,270 | | | $ | 1,270,000 | |
| | | |
Cydsa SAB de CV, 6.25%, 10/4/27(1) | | USD | | | 500 | | | | 462,095 | |
| | | | |
| | 6 | | See Notes to Financial Statements. |
Eaton Vance
Emerging Markets Debt Opportunities Fund
January 31, 2019
Portfolio of Investments (Unaudited) — continued
| | | | | | | | | | |
| Security | | | | Principal
Amount
(000’s omitted) | | | Value | |
|
| Mexico (continued) | |
| | | |
Grupo Kaltex SA de CV,
8.875%, 4/11/22(1) | | USD | | | 1,195 | | | $ | 794,687 | |
| | | |
Grupo Televisa SAB, 7.25%, 5/14/43 | | MXN | | | 28,420 | | | | 986,691 | |
| | | |
Petroleos Mexicanos, 7.19%, 9/12/24(3) | | MXN | | | 1,420 | | | | 58,665 | |
| | | |
Petroleos Mexicanos, 7.65%, 11/24/21 | | MXN | | | 420 | | | | 20,498 | |
| |
Total Mexico | | | $ | 3,592,636 | |
|
| Nigeria — 0.6% | |
| | | |
SEPLAT Petroleum Development Co. PLC, 9.25%, 4/1/23(1) | | USD | | | 750 | | | $ | 769,687 | |
| |
Total Nigeria | | | $ | 769,687 | |
|
| Panama — 0.5% | |
| | | |
Promerica Financial Corp.,
9.70%, 5/14/24(1) | | USD | | | 700 | | | $ | 714,875 | |
| |
Total Panama | | | $ | 714,875 | |
|
| Russia — 0.3% | |
| | | |
O1 Properties Finance PLC,
8.25%, 9/27/21(1) | | USD | | | 600 | | | $ | 453,000 | |
| |
Total Russia | | | $ | 453,000 | |
|
| Singapore — 1.0% | |
| | | |
ABJA Investment Co. Pte, Ltd.,
5.45%, 1/24/28(1) | | USD | | | 700 | | | $ | 633,236 | |
| | | |
Puma International Financing SA, 5.125%, 10/6/24(1) | | USD | | | 750 | | | | 660,450 | |
| |
Total Singapore | | | $ | 1,293,686 | |
|
| South Africa — 0.7% | |
| | | |
Petra Diamonds US Treasury PLC, 7.25%, 5/1/22(1) | | USD | | | 980 | | | $ | 923,650 | |
| |
Total South Africa | | | $ | 923,650 | |
|
| Spain — 0.5% | |
| | | |
Atento Luxco 1 SA, 6.125%, 8/10/22(1) | | USD | | | 600 | | | $ | 589,500 | |
| |
Total Spain | | | $ | 589,500 | |
| |
Total Foreign Corporate Bonds
(identified cost $14,296,968) | | | $ | 14,253,595 | |
|
| Sovereign Loans — 5.4% | |
| Borrower | | | | Principal
Amount
(000’s omitted) | | | Value | |
|
| Barbados — 0.2% | |
| | | |
Government of Barbados, Term Loan, 0.00%, Maturing December 20,
2019(2)(4)(7) | | USD | | | 880 | | | $ | 304,524 | |
| |
Total Barbados | | | $ | 304,524 | |
| | | | | | | | | | |
| Borrower | | | | Principal
Amount
(000’s omitted) | | | Value | |
|
| Ethiopia — 0.1% | |
| | | |
Ethiopian Railways Corporation (Federal Democratic Republic of Ethiopia guaranteed), Term Loan, 6.28%, (6 mo. USD LIBOR + 3.75%), Maturing August 2, 2021(2)(7) | | USD | | | 134 | | | $ | 129,285 | |
| |
Total Ethiopia | | | $ | 129,285 | |
|
| Kenya — 0.1% | |
| | | |
Government of Kenya, Term Loan, 7.57%, (3 mo. USD LIBOR + 5.00%), Maturing April 18, 2019(2) | | USD | | | 90 | | | $ | 90,000 | |
| |
Total Kenya | | | $ | 90,000 | |
|
| Macedonia — 0.9% | |
| | | |
Republic of Macedonia, Term Loan, 4.5%, (6 mo. EURIBOR + 4.50%), Maturing December 16, 2022(7) | | EUR | | | 1,000 | | | $ | 1,162,227 | |
| |
Total Macedonia | | | $ | 1,162,227 | |
|
| Nigeria — 0.8% | |
| | | |
Bank of Industry Limited, Term Loan, 8.74%, (3 mo. USD LIBOR + 6.00%), Maturing May 21, 2021(2)(7) | | USD | | | 990 | | | $ | 997,594 | |
| |
Total Nigeria | | | $ | 997,594 | |
|
| Tanzania — 1.6% | |
| | | |
Government of the United Republic of Tanzania, Term Loan, 8.09%, (6 mo. USD LIBOR + 5.20%), Maturing May 23, 2023(2) | | USD | | | 1,400 | | | $ | 1,385,066 | |
| | | |
Government of the United Republic of Tanzania, Term Loan, 8.11%, (6 mo. USD LIBOR + 5.20%), Maturing June 23, 2022(2) | | USD | | | 725 | | | | 726,346 | |
| |
Total Tanzania | | | $ | 2,111,412 | |
|
| Turkey — 1.7% | |
| | | |
Akbank T.A.S., Term Loan, 1.90%, (3 mo. EURIBOR + 1.90%), Maturing October 6, 2019(2)(8) | | EUR | | | 1,000 | | | $ | 1,130,521 | |
| | | |
Yapi ve Kredi Bankasi AS, Term Loan, 1.90%, (6 mo. EURIBOR + 1.90%), Maturing November 1, 2019(2)(8) | | EUR | | | 1,000 | | | | 1,116,211 | |
| |
Total Turkey | | | $ | 2,246,732 | |
| |
Total Sovereign Loans
(identified cost $7,450,079) | | | $ | 7,041,774 | |
| | | | |
| | 7 | | See Notes to Financial Statements. |
Eaton Vance
Emerging Markets Debt Opportunities Fund
January 31, 2019
Portfolio of Investments (Unaudited) — continued
| | | | | | | | | | |
| Credit Linked Notes — 0.6% | |
| Security | | Principal
Amount
(000’s omitted) | | | Value | |
|
| Ukraine — 0.6% | |
| | | |
Ukraine Treasury Bill (Citibank, N.A.),
0.00%, 4/9/19(3)(9) | | UAH | | | 23,830 | | | $ | 839,965 | |
| |
Total Ukraine | | | $ | 839,965 | |
| |
Total Credit Linked Notes
(identified cost $824,868) | | | $ | 839,965 | |
|
| Short-Term Investments — 25.6% | |
|
| Foreign Government Securities — 13.7% | |
| Security | | Principal
Amount
(000’s omitted) | | | Value | |
|
| Egypt — 11.8% | |
| | | |
Egypt Treasury Bill, 0.00%, 3/19/19 | | EGP | | | 32,875 | | | $ | 1,818,321 | |
| | | |
Egypt Treasury Bill, 0.00%, 4/2/19 | | EGP | | | 24,475 | | | | 1,351,092 | |
| | | |
Egypt Treasury Bill, 0.00%, 4/9/19 | | EGP | | | 34,825 | | | | 1,915,816 | |
| | | |
Egypt Treasury Bill, 0.00%, 4/16/19 | | EGP | | | 45,950 | | | | 2,519,071 | |
| | | |
Egypt Treasury Bill, 0.00%, 4/23/19 | | EGP | | | 45,375 | | | | 2,466,380 | |
| | | |
Egypt Treasury Bill, 0.00%, 6/18/19 | | EGP | | | 3,300 | | | | 175,954 | |
| | | |
Egypt Treasury Bill, 0.00%, 7/23/19 | | EGP | | | 50,825 | | | | 2,647,155 | |
| | | |
Egypt Treasury Bill, 0.00%, 7/30/19 | | EGP | | | 6,775 | | | | 351,733 | |
| | | |
Egypt Treasury Bill, 0.00%, 8/6/19 | | EGP | | | 39,725 | | | | 2,055,735 | |
| | | |
Egypt Treasury Bill, 0.00%, 8/20/19 | | EGP | | | 2,225 | | | | 115,513 | |
| |
Total Egypt | | | $ | 15,416,770 | |
|
| Georgia — 1.9% | |
| | | |
Bank of Georgia Promissory Note, 7.40%, 5/17/19 | | GEL | | | 385 | | | $ | 144,957 | |
| | | |
Bank of Georgia Promissory Note, 7.40%, 5/21/19 | | GEL | | | 220 | | | | 82,829 | |
| | | |
Bank of Georgia Promissory Note, 7.40%, 5/23/19 | | GEL | | | 230 | | | | 86,592 | |
| | | |
Bank of Georgia Promissory Note, 7.40%, 5/27/19 | | GEL | | | 370 | | | | 139,296 | |
| | | |
Bank of Georgia Promissory Note, 7.40%, 5/28/19 | | GEL | | | 150 | | | | 56,659 | |
| | | |
Bank of Georgia Promissory Note, 7.40%, 5/30/19 | | GEL | | | 310 | | | | 116,703 | |
| | | |
Bank of Georgia Promissory Note, 7.40%, 6/3/19 | | GEL | | | 300 | | | | 112,934 | |
| | | |
Bank of Georgia Promissory Note, 7.40%, 6/18/19 | | GEL | | | 150 | | | | 56,457 | |
| | | |
Bank of Georgia Promissory Note, 7.40%, 6/24/19 | | GEL | | | 210 | | | | 79,034 | |
| | | |
Bank of Georgia Promissory Note, 7.40%, 6/26/19 | | GEL | | | 450 | | | | 169,354 | |
| | | |
Bank of Georgia Promissory Note, 7.40%, 7/1/19 | | GEL | | | 590 | | | | 222,028 | |
| | | |
Bank of Georgia Promissory Note, 7.40%, 7/2/19 | | GEL | | | 420 | | | | 158,052 | |
| | | |
Bank of Georgia Promissory Note, 7.59%, 6/14/19 | | GEL | | | 243 | | | | 91,562 | |
| | | |
Bank of Georgia Promissory Note, 7.59%, 6/19/19 | | GEL | | | 161 | | | | 60,637 | |
| | | |
Bank of Georgia Promissory Note, 7.59%, 6/21/19 | | GEL | | | 210 | | | | 79,091 | |
| | | |
Bank of Georgia Promissory Note, 7.59%, 6/25/19 | | GEL | | | 210 | | | | 79,089 | |
| | | |
Georgia Treasury Bill, 0.00%, 5/16/19 | | GEL | | | 400 | | | | 147,774 | |
| | | |
Georgia Treasury Bill, 0.00%, 6/13/19 | | GEL | | | 570 | | | | 209,183 | |
| | | | | | | | | | |
| Security | | Principal
Amount
(000’s omitted) | | | Value | |
|
| Georgia (continued) | |
| | | |
Georgia Treasury Bill, 0.00%, 7/18/19 | | GEL | | | 990 | | | $ | 362,385 | |
| |
Total Georgia | | | $ | 2,454,616 | |
| |
Total Foreign Government Securities
(identified cost $17,664,048) | | | $ | 17,871,386 | |
|
| U.S. Treasury Obligations — 9.5% | |
| Security | | Principal
Amount
(000’s omitted) | | | Value | |
| | | |
U.S. Treasury Bill, 0.00%, 2/7/19 | | USD | | | 2,725 | | | $ | 2,723,946 | |
| | | |
U.S. Treasury Bill, 0.00%, 2/14/19 | | USD | | | 400 | | | | 399,662 | |
| | | |
U.S. Treasury Bill, 0.00%, 2/21/19(10) | | USD | | | 2,725 | | | | 2,721,469 | |
| | | |
U.S. Treasury Bill, 0.00%, 3/5/19 | | USD | | | 2,725 | | | | 2,719,356 | |
| | | |
U.S. Treasury Bill, 0.00%, 3/14/19 | | USD | | | 2,725 | | | | 2,717,862 | |
| | | |
U.S. Treasury Bill, 0.00%, 3/21/19 | | USD | | | 1,200 | | | | 1,196,245 | |
| |
Total U.S. Treasury Obligations
(identified cost $12,478,540) | | | $ | 12,478,540 | |
|
| Other — 2.4% | |
| Description | | | | Units | | | Value | |
| | | |
Eaton Vance Cash Reserves Fund, LLC, 2.61%(11) | | | | | 3,164,722 | | | $ | 3,164,723 | |
| |
Total Other
(identified cost $3,164,592) | | | $ | 3,164,723 | |
| |
Total Short-Term Investments
(identified cost $33,307,180) | | | $ | 33,514,649 | |
| |
Total Investments — 96.2%
(identified cost $126,456,182) | | | $ | 126,011,871 | |
| |
Other Assets, Less Liabilities — 3.8% | | | $ | 4,913,515 | |
| |
Net Assets — 100.0% | | | $ | 130,925,386 | |
The percentage shown for each investment category in the Portfolio of Investments is based on net assets.
| | (1) | Security exempt from registration under Regulation S of the Securities Act of 1933, which exempts from registration securities offered and sold outside the United States. Security may not be offered or sold in the United States except pursuant to an exemption from, or in a transaction not subject to, the registration requirements of the Securities Act of 1933. At January 31, 2019, the aggregate value of these securities is $43,830,323 or 33.5% of the Fund’s net assets. |
| | (2) | Variable rate security. The stated interest rate represents the rate in effect at January 31, 2019. |
| | | | |
| | 8 | | See Notes to Financial Statements. |
Eaton Vance
Emerging Markets Debt Opportunities Fund
January 31, 2019
Portfolio of Investments (Unaudited) — continued
| | (3) | Security exempt from registration pursuant to Rule 144A under the Securities Act of 1933, as amended. These securities may be sold in certain transactions in reliance on an exemption from registration (normally to qualified institutional buyers). At January 31, 2019, the aggregate value of these securities is $1,288,227 or 1.0% of the Fund’s net assets. |
| | (4) | Issuer is in default with respect to interest payments. For a variable rate security, interest rate has been adjusted to reflectnon-accrual status. |
| | (5) | Inflation-linked security whose principal is adjusted for inflation based on changes in a designated inflation index or inflation rate for the applicable country. Interest is calculated based on the inflation-adjusted principal. |
| | (6) | When-issued security. |
| | (7) | Loan is subject to scheduled mandatory prepayments. Maturity date shown reflects the final maturity date. |
| | (8) | For fair value measurement disclosure purposes, security is categorized as Level 3 (see Note 11). |
| | (9) | Security whose performance, including redemption at maturity, is linked to the price of the underlying security. The investment is subject to credit risk of the issuing financial institution (Citibank, N.A.) in addition to the market risk of the underlying security. |
| (10) | Security (or a portion thereof) has been pledged to cover collateral requirements on open derivative contracts. |
| (11) | Affiliated investment company, available to Eaton Vance portfolios and funds, which invests in high quality, U.S. dollar denominated money market instruments. The rate shown is the annualizedseven-day yield as of January 31, 2019. |
| | | | | | | | | | | | | | | | | | | | | | | | |
| Forward Foreign Currency Exchange Contracts | |
| | | | | |
| Currency Purchased | | | Currency Sold | | | Counterparty | | Settlement Date | | | Unrealized Appreciation | | | Unrealized (Depreciation) | |
| | | | | | | |
| BRL | | | 9,931,000 | | | USD | | | 2,638,928 | | | Standard Chartered Bank | | | 2/4/19 | | | $ | 83,982 | | | $ | — | |
| | | | | | | |
| BRL | | | 14,036,600 | | | USD | | | 3,771,005 | | | Standard Chartered Bank | | | 2/4/19 | | | | 77,591 | | | | — | |
| | | | | | | |
| BRL | | | 9,429,731 | | | USD | | | 2,539,933 | | | Standard Chartered Bank | | | 2/4/19 | | | | 45,538 | | | | — | |
| | | | | | | |
| BRL | | | 22,819,000 | | | USD | | | 6,248,528 | | | Standard Chartered Bank | | | 2/4/19 | | | | 8,052 | | | | — | |
| | | | | | | |
| BRL | | | 10,578,331 | | | USD | | | 2,896,665 | | | UBS AG | | | 2/4/19 | | | | 3,733 | | | | — | |
| | | | | | | |
| COP | | | 7,719,429,000 | | | USD | | | 2,443,399 | | | Bank of America, N.A. | | | 2/4/19 | | | | 42,730 | | | | — | |
| | | | | | | |
| COP | | | 5,567,924,000 | | | USD | | | 1,787,054 | | | Bank of America, N.A. | | | 2/4/19 | | | | 6,158 | | | | — | |
| | | | | | | |
| COP | | | 2,138,229,000 | | | USD | | | 686,276 | | | Standard Chartered Bank | | | 2/4/19 | | | | 2,365 | | | | — | |
| | | | | | | |
| COP | | | 13,276,000 | | | USD | | | 4,261 | | | Standard Chartered Bank | | | 2/4/19 | | | | 15 | | | | — | |
| | | | | | | |
| USD | | | 2,582,144 | | | BRL | | | 9,429,731 | | | Standard Chartered Bank | | | 2/4/19 | | | | — | | | | (3,328 | ) |
| | | | | | | |
| USD | | | 2,719,406 | | | BRL | | | 9,931,000 | | | Standard Chartered Bank | | | 2/4/19 | | | | — | | | | (3,504 | ) |
| | | | | | | |
| USD | | | 3,843,643 | | | BRL | | | 14,036,600 | | | Standard Chartered Bank | | | 2/4/19 | | | | — | | | | (4,953 | ) |
| | | | | | | |
| USD | | | 6,144,877 | | | BRL | | | 22,819,000 | | | Standard Chartered Bank | | | 2/4/19 | | | | — | | | | (111,704 | ) |
| | | | | | | |
| USD | | | 2,843,637 | | | BRL | | | 10,578,331 | | | UBS AG | | | 2/4/19 | | | | — | | | | (56,760 | ) |
| | | | | | | |
| USD | | | 2,477,591 | | | COP | | | 7,719,429,000 | | | Bank of America, N.A. | | | 2/4/19 | | | | — | | | | (8,538 | ) |
| | | | | | | |
| USD | | | 1,760,330 | | | COP | | | 5,567,924,000 | | | Bank of America, N.A. | | | 2/4/19 | | | | — | | | | (32,882 | ) |
| | | | | | | |
| USD | | | 4,151 | | | COP | | | 13,276,000 | | | Standard Chartered Bank | | | 2/4/19 | | | | — | | | | (124 | ) |
| | | | | | | |
| USD | | | 658,543 | | | COP | | | 2,138,229,000 | | | Standard Chartered Bank | | | 2/4/19 | | | | — | | | | (30,098 | ) |
| | | | | | | |
| COP | | | 4,291,220,000 | | | USD | | | 1,347,800 | | | UBS AG | | | 2/6/19 | | | | 34,116 | | | | — | |
| | | | | | | |
| ARS | | | 23,781,000 | | | USD | | | 609,769 | | | Goldman Sachs International | | | 2/7/19 | | | | 25,613 | | | | — | |
| | | | | | | |
| USD | | | 829,536 | | | EUR | | | 725,000 | | | UBS AG | | | 2/7/19 | | | | — | | | | (506 | ) |
| | | | | | | |
| COP | | | 3,235,000,000 | | | USD | | | 1,019,620 | | | UBS AG | | | 2/8/19 | | | | 22,068 | | | | — | |
| | | | | | | |
| TRY | | | 13,540,000 | | | USD | | | 2,551,924 | | | Standard Chartered Bank | | | 2/8/19 | | | | 58,226 | | | | — | |
| | | | | | | |
| USD | | | 5,382 | | | COP | | | 17,217,000 | | | Standard Chartered Bank | | | 2/8/19 | | | | — | | | | (162 | ) |
| | | | | | | |
| USD | | | 856,106 | | | COP | | | 2,783,147,000 | | | Standard Chartered Bank | | | 2/8/19 | | | | — | | | | (40,083 | ) |
| | | | | | | |
| COP | | | 5,567,924,000 | | | USD | | | 1,759,774 | | | Bank of America, N.A. | | | 2/11/19 | | | | 32,896 | | | | — | |
| | | | | | | |
| TRY | | | 18,488,000 | | | USD | | | 3,478,566 | | | Goldman Sachs International | | | 2/11/19 | | | | 79,426 | | | | — | |
| | | | | | | |
| TRY | | | 13,181,000 | | | USD | | | 2,382,101 | | | Standard Chartered Bank | | | 2/11/19 | | | | 154,566 | | | | — | |
| | | | | | | |
| USD | | | 761,951 | | | COP | | | 2,442,352,000 | | | Standard Chartered Bank | | | 2/11/19 | | | | — | | | | (24,397 | ) |
| | | | | | | |
| USD | | | 1,510,651 | | | TRY | | | 8,028,859 | | | Goldman Sachs International | | | 2/11/19 | | | | — | | | | (34,493 | ) |
| | | | | | | |
| USD | | | 1,908,771 | | | TRY | | | 10,561,896 | | | Standard Chartered Bank | | | 2/11/19 | | | | — | | | | (123,853 | ) |
| | | | | | | |
| COP | | | 86,124,000 | | | USD | | | 26,386 | | | UBS AG | | | 2/14/19 | | | | 1,340 | | | | — | |
| | | | | | | |
| UGX | | | 1,009,224,000 | | | USD | | | 259,908 | | | Standard Chartered Bank | | | 2/14/19 | | | | 14,638 | | | | — | |
| | | | |
| | 9 | | See Notes to Financial Statements. |
Eaton Vance
Emerging Markets Debt Opportunities Fund
January 31, 2019
Portfolio of Investments (Unaudited) — continued
| | | | | | | | | | | | | | | | | | | | | | | | |
| Forward Foreign Currency Exchange Contracts (continued) | |
| | | | | |
| Currency Purchased | | | Currency Sold | | | Counterparty | | Settlement Date | | | Unrealized Appreciation | | | Unrealized (Depreciation) | |
| | | | | | | |
| USD | | | 2,324,090 | | | EUR | | | 1,993,900 | | | Deutsche Bank AG | | | 2/14/19 | | | $ | 39,960 | | | $ | — | |
| | | | | | | |
| UGX | | | 1,019,669,000 | | | USD | | | 260,452 | | | Standard Chartered Bank | | | 2/15/19 | | | | 16,865 | | | | — | |
| | | | | | | |
| ARS | | | 11,900,000 | | | USD | | | 307,732 | | | BNP Paribas | | | 2/19/19 | | | | 6,258 | | | | — | |
| | | | | | | |
| MAD | | | 6,735,356 | | | USD | | | 697,603 | | | BNP Paribas | | | 2/19/19 | | | | 8,018 | | | | — | |
| | | | | | | |
| TRY | | | 1,083,000 | | | USD | | | 195,065 | | | Standard Chartered Bank | | | 2/19/19 | | | | 12,426 | | | | — | |
| | | | | | | |
| USD | | | 926,553 | | | ARS | | | 35,496,241 | | | BNP Paribas | | | 2/19/19 | | | | — | | | | (10,041 | ) |
| | | | | | | |
| USD | | | 422,974 | | | EUR | | | 370,651 | | | Credit Agricole Corporate and Investment Bank | | | 2/19/19 | | | | — | | | | (1,808 | ) |
| | | | | | | |
| USD | | | 519,535 | | | EUR | | | 454,900 | | | Standard Chartered Bank | | | 2/19/19 | | | | — | | | | (1,800 | ) |
| | | | | | | |
| USD | | | 557,993 | | | EUR | | | 475,953 | | | Goldman Sachs International | | | 2/21/19 | | | | 12,439 | | | | — | |
| | | | | | | |
| USD | | | 1,078,705 | | | EUR | | | 942,500 | | | Goldman Sachs International | | | 2/21/19 | | | | — | | | | (1,621 | ) |
| | | | | | | |
| COP | | | 89,700,000 | | | USD | | | 27,594 | | | UBS AG | | | 2/28/19 | | | | 1,266 | | | | — | |
| | | | | | | |
| MAD | | | 1,808,000 | | | USD | | | 188,137 | | | Credit Agricole Corporate and Investment Bank | | | 2/28/19 | | | | 1,212 | | | | — | |
| | | | | | | |
| MAD | | | 1,806,000 | | | USD | | | 188,125 | | | Credit Agricole Corporate and Investment Bank | | | 2/28/19 | | | | 1,015 | | | | — | |
| | | | | | | |
| MXN | | | 8,149,768 | | | USD | | | 392,419 | | | Credit Agricole Corporate and Investment Bank | | | 2/28/19 | | | | 32,285 | | | | — | |
| | | | | | | |
| MXN | | | 5,500,000 | | | USD | | | 264,830 | | | Credit Agricole Corporate and Investment Bank | | | 2/28/19 | | | | 21,788 | | | | — | |
| | | | | | | |
| UGX | | | 1,021,492,000 | | | USD | | | 260,452 | | | Standard Chartered Bank | | | 2/28/19 | | | | 16,436 | | | | — | |
| | | | | | | |
| USD | | | 1,082,706 | | | IDR | | | 15,884,380,283 | | | Goldman Sachs International | | | 2/28/19 | | | | — | | | | (54,649 | ) |
| | | | | | | |
| USD | | | 720,316 | | | MXN | | | 13,728,964 | | | Goldman Sachs International | | | 2/28/19 | | | | 4,865 | | | | — | |
| | | | | | | |
| USD | | | 729,566 | | | MXN | | | 15,000,000 | | | Goldman Sachs International | | | 2/28/19 | | | | — | | | | (52,121 | ) |
| | | | | | | |
| USD | | | 6,000,000 | | | PEN | | | 20,124,000 | | | Bank of America, N.A. | | | 2/28/19 | | | | — | | | | (43,027 | ) |
| | | | | | | |
| USD | | | 124,446 | | | IDR | | | 1,797,000,000 | | | JPMorgan Chase Bank, N.A. | | | 3/4/19 | | | | — | | | | (4,233 | ) |
| | | | | | | |
| BRL | | | 22,819,000 | | | USD | | | 6,132,738 | | | Standard Chartered Bank | | | 3/6/19 | | | | 113,823 | | | | — | |
| | | | | | | |
| BRL | | | 10,578,331 | | | USD | | | 2,838,068 | | | UBS AG | | | 3/6/19 | | | | 57,685 | | | | — | |
| | | | | | | |
| COP | | | 4,291,220,000 | | | USD | | | 1,345,421 | | | Credit Agricole Corporate and Investment Bank | | | 3/6/19 | | | | 34,897 | | | | — | |
| | | | | | | |
| THB | | | 70,000,000 | | | USD | | | 2,139,626 | | | Bank of America, N.A. | | | 3/11/19 | | | | 102,805 | | | | — | |
| | | | | | | |
| THB | | | 53,000,000 | | | USD | | | 1,620,052 | | | Deutsche Bank AG | | | 3/11/19 | | | | 77,788 | | | | — | |
| | | | | | | |
| THB | | | 167,000,000 | | | USD | | | 5,113,288 | | | Goldman Sachs International | | | 3/11/19 | | | | 236,510 | | | | — | |
| | | | | | | |
| THB | | | 46,500,000 | | | USD | | | 1,421,149 | | | Goldman Sachs International | | | 3/11/19 | | | | 68,465 | | | | — | |
| | | | | | | |
| USD | | | 1,479,802 | | | THB | | | 48,411,719 | | | Deutsche Bank AG | | | 3/11/19 | | | | — | | | | (71,054 | ) |
| | | | | | | |
| COP | | | 1,500,000,000 | | | USD | | | 470,441 | | | Goldman Sachs International | | | 3/13/19 | | | | 11,924 | | | | — | |
| | | | | | | |
| PEN | | | 10,757,250 | | | USD | | | 3,194,242 | | | Standard Chartered Bank | | | 3/14/19 | | | | 34,583 | | | | — | |
| | | | | | | |
| USD | | | 3,230,692 | | | PEN | | | 10,880,000 | | | Standard Chartered Bank | | | 3/14/19 | | | | — | | | | (34,978 | ) |
| | | | | | | |
| MAD | | | 748,000 | | | USD | | | 77,293 | | | Standard Chartered Bank | | | 3/18/19 | | | | 935 | | | | — | |
| | | | | | | |
| TRY | | | 6,937,000 | | | USD | | | 1,251,315 | | | Standard Chartered Bank | | | 3/18/19 | | | | 58,111 | | | | — | |
| | | | | | | |
| COP | | | 159,513,000 | | | USD | | | 49,720 | | | UBS AG | | | 3/20/19 | | | | 1,562 | | | | — | |
| | | | | | | |
| USD | | | 34,753 | | | COP | | | 109,730,000 | | | Goldman Sachs International | | | 3/20/19 | | | | — | | | | (525 | ) |
| | | | | | | |
| USD | | | 8,196,449 | | | EUR | | | 7,151,257 | | | Standard Chartered Bank | | | 3/28/19 | | | | — | | | | (25,835 | ) |
| | | | | | | |
| USD | | | 483,763 | | | EUR | | | 421,000 | | | Goldman Sachs International | | | 4/4/19 | | | | — | | | | (593 | ) |
| | | | | | | |
| USD | | | 1,115,154 | | | EUR | | | 969,050 | | | Standard Chartered Bank | | | 4/4/19 | | | | 272 | | | | — | |
| | | | | | | |
| TRY | | | 1,700,000 | | | USD | | | 373,427 | | | Standard Chartered Bank | | | 4/9/19 | | | | — | | | | (56,344 | ) |
| | | | | | | |
| USD | | | 369,000 | | | TRY | | | 1,714,632 | | | Standard Chartered Bank | | | 4/9/19 | | | | 49,188 | | | | — | |
| | | | | | | |
| UGX | | | 381,024,000 | | | USD | | | 97,027 | | | Standard Chartered Bank | | | 4/11/19 | | | | 5,484 | | | | — | |
| | | | | | | |
| MAD | | | 2,284,000 | | | USD | | | 239,916 | | | Credit Agricole Corporate and Investment Bank | | | 4/15/19 | | | | — | | | | (1,554 | ) |
| | | | | | | |
| USD | | | 1,212,894 | | | EUR | | | 1,049,160 | | | Goldman Sachs International | | | 4/16/19 | | | | 4,625 | | | | — | |
| | | | | | | |
| USD | | | 127,544 | | | EUR | | | 111,111 | | | Goldman Sachs International | | | 4/16/19 | | | | — | | | | (418 | ) |
| | | | |
| | 10 | | See Notes to Financial Statements. |
Eaton Vance
Emerging Markets Debt Opportunities Fund
January 31, 2019
Portfolio of Investments (Unaudited) — continued
| | | | | | | | | | | | | | | | | | | | | | | | |
| Forward Foreign Currency Exchange Contracts (continued) | |
| | | | | |
| Currency Purchased | | | Currency Sold | | | Counterparty | | Settlement Date | | | Unrealized Appreciation | | | Unrealized (Depreciation) | |
| | | | | | | |
| USD | | | 317,616 | | | EUR | | | 276,694 | | | Goldman Sachs International | | | 4/16/19 | | | $ | — | | | $ | (1,040 | ) |
| | | | | | | |
| COP | | | 161,204,000 | | | USD | | | 51,292 | | | Credit Agricole Corporate and Investment Bank | | | 4/22/19 | | | | 466 | | | | — | |
| | | | | | | |
| ARS | | | 26,695,000 | | | USD | | | 645,899 | | | Goldman Sachs International | | | 4/25/19 | | | | 13,120 | | | | — | |
| | | | | | | |
| USD | | | 268,200 | | | PEN | | | 900,964 | | | Standard Chartered Bank | | | 4/29/19 | | | | — | | | | (1,814 | ) |
| | | | | | | |
| UGX | | | 7,506,300,000 | | | USD | | | 1,912,433 | | | Standard Chartered Bank | | | 4/30/19 | | | | 99,452 | | | | — | |
| | | | | | | |
| USD | | | 324,426 | | | EUR | | | 279,846 | | | UBS AG | | | 5/2/19 | | | | 1,705 | | | | — | |
| | | | | | | |
| USD | | | 579,260 | | | EUR | | | 500,000 | | | Standard Chartered Bank | | | 5/9/19 | | | | 2,314 | | | | — | |
| | | | | | | |
| USD | | | 422,165 | | | EUR | | | 364,400 | | | Standard Chartered Bank | | | 5/9/19 | | | | 1,686 | | | | — | |
| | | | | | | |
| USD | | | 244,982 | | | EUR | | | 211,461 | | | Standard Chartered Bank | | | 5/9/19 | | | | 979 | | | | — | |
| | | | | | | |
| UGX | | | 993,103,000 | | | USD | | | 256,285 | | | Standard Chartered Bank | | | 5/20/19 | | | | 8,778 | | �� | | — | |
| | | | | | | |
| MAD | | | 2,030,000 | | | USD | | | 210,636 | | | Credit Agricole Corporate and Investment Bank | | | 6/13/19 | | | | 510 | | | | — | |
| | | | | | | |
| UGX | | | 993,624,000 | | | USD | | | 257,416 | | | Standard Chartered Bank | | | 6/14/19 | | | | 6,372 | | | | — | |
| | | | | | | |
| UGX | | | 982,030,000 | | | USD | | | 254,808 | | | Standard Chartered Bank | | | 7/8/19 | | | | 4,574 | | | | — | |
| | | | | | | |
| MAD | | | 1,774,000 | | | USD | | | 184,676 | | | BNP Paribas | | | 7/22/19 | | | | — | | | | (567 | ) |
| | | | | | | |
| USD | | | 588,876 | | | EUR | | | 508,665 | | | Standard Chartered Bank | | | 8/1/19 | | | | — | | | | (2,265 | ) |
| | | | | | | |
| MAD | | | 304,000 | | | USD | | | 30,894 | | | BNP Paribas | | | 9/5/19 | | | | 486 | | | | — | |
| | | | | | | |
| MAD | | | 1,481,000 | | | USD | | | 152,838 | | | BNP Paribas | | | 9/5/19 | | | | 37 | | | | — | |
| | | | | | | |
| XOF | | | 31,980,000 | | | EUR | | | 46,881 | | | ICBC Standard Bank plc | | | 10/4/19 | | | | — | | | | (251 | ) |
| | | | | | | |
| XOF | | | 53,292,000 | | | EUR | | | 78,141 | | | ICBC Standard Bank plc | | | 11/5/19 | | | | — | | | | (998 | ) |
| | | | | | | |
| TRY | | | 5,109,000 | | | USD | | | 1,112,151 | | | Goldman Sachs International | | | 2/3/20 | | | | — | | | | (275,788 | ) |
| | | | | | | |
| USD | | | 1,014,484 | | | TRY | | | 5,148,000 | | | Goldman Sachs International | | | 2/3/20 | | | | 171,737 | | | | — | |
| | | | | | | |
| TRY | | | 560,801 | | | USD | | | 121,702 | | | Deutsche Bank AG | | | 2/10/20 | | | | — | | | | (30,107 | ) |
| | | | | | | |
| TRY | | | 561,000 | | | USD | | | 121,877 | | | Standard Chartered Bank | | | 2/10/20 | | | | — | | | | (30,250 | ) |
| | | | | | | |
| USD | | | 111,144 | | | TRY | | | 564,000 | | | Deutsche Bank AG | | | 2/10/20 | | | | 19,026 | | | | — | |
| | | | | | | |
| USD | | | 111,199 | | | TRY | | | 564,000 | | | Standard Chartered Bank | | | 2/10/20 | | | | 19,081 | | | | — | |
| | | | | | | |
| TRY | | | 716,199 | | | USD | | | 155,577 | | | Standard Chartered Bank | | | 2/14/20 | | | | — | | | | (38,754 | ) |
| | | | | | | |
| TRY | | | 9,000,000 | | | USD | | | 1,952,701 | | | Standard Chartered Bank | | | 2/14/20 | | | | — | | | | (484,663 | ) |
| | | | | | | |
| USD | | | 1,923,513 | | | TRY | | | 9,802,300 | | | Standard Chartered Bank | | | 2/14/20 | | | | 324,607 | | | | — | |
| | | | | | | |
| TRY | | | 5,000,000 | | | USD | | | 1,018,953 | | | Bank of America, N.A. | | | 3/20/20 | | | | — | | | | (212,599 | ) |
| | | | | | | |
| USD | | | 980,000 | | | TRY | | | 5,033,770 | | | Bank of America, N.A. | | | 3/20/20 | | | | 168,201 | | | | — | |
| | | | | | | |
| | | | | | | | | | | | | | | | | | | $ | 2,569,674 | | | $ | (1,915,082 | ) |
| | | | | | | | | | | | | | | | | | | | |
| Non-deliverable Bond Forward Contracts* | |
| | | | | |
| Settlement Date | | Notional Amount
(000’s omitted) | | | Reference Entity | | Counterparty | | Aggregate Cost | | | Unrealized
Appreciation | |
| | | | | | |
| 3/22/19 | | COP | | | 9,400,000 | | | Republic of Colombia,
10.00%, 7/24/24 | | Bank of America, N.A. | | $ | 3,027,375 | | | $ | 24,016 | |
| |
| | | | $ | 24,016 | |
| * | Reresents a short-term forward contract to purchase the reference entity denominated in anon-deliverable foreign currency. |
| | | | |
| | 11 | | See Notes to Financial Statements. |
Eaton Vance
Emerging Markets Debt Opportunities Fund
January 31, 2019
Portfolio of Investments (Unaudited) — continued
| | | | | | | | | | | | | | | | | | | | | | | | |
| Futures Contracts | |
| | | | | |
| Description | | Number of
Contracts | | | Position | | | Expiration
Date | | | Notional
Amount | | | Value/
Unrealized
Depreciation | |
|
Interest Rate Futures | |
| | | | | |
| 5-Year USD Deliverable Interest Rate Swap | | | 6 | | | | Short | | | | 3/18/19 | | | $ | (606,140 | ) | | $ | (7,794 | ) |
| | | | | |
| 10-Year USD Deliverable Interest Rate Swap | | | 2 | | | | Short | | | | 3/18/19 | | | | (205,719 | ) | | | (4,287 | ) |
| | | | | |
| Euro-Bobl | | | 11 | | | | Short | | | | 3/7/19 | | | | (1,673,668 | ) | | | (5,792 | ) |
| | | | | |
| U.S.10-Year Treasury Note | | | 12 | | | | Short | | | | 3/20/19 | | | | (1,469,625 | ) | | | (37,352 | ) |
| |
| | | | $ | (55,225 | ) |
Euro-Bobl: Medium-term debt securities issued by the Federal Republic of Germany with a term to maturity of 4.5 to 5 years.
| | | | | | | | | | | | | | | | | | | | | | | | |
| Centrally Cleared Interest Rate Swaps | |
| | | | | | | |
Notional Amount (000’s omitted) | | Fund
Pays/Receives
Floating Rate | | Floating Rate | | Annual
Fixed Rate | | Termination
Date | | | Value | | | Unamortized
Upfront
Receipts
(Payments) | | | Unrealized
Appreciation
(Depreciation) | |
| | | | | | | | |
| BRL | | 16,500 | | Pays | | Brazil CETIP Interbank Deposit Rate
(pays upon termination) | | 8.33%
(pays upon termination) | | | 1/2/23 | | | $ | 63,710 | | | $ | — | | | $ | 63,710 | |
| | | | | | | | |
| EUR | | 400 | | Receives | | 6-month EURIBOR
(pays semi-annually) | | 1.00%
(pays annually) | | | 3/21/23 | | | | (22,980 | ) | | | 13,121 | | | | (9,859 | ) |
| | | | | | | | |
| EUR | | 2,750 | | Receives | | 6-month EURIBOR
(pays semi-annually) | | 0.40%
(pays annually) | | | 10/4/23 | | | | (52,749 | ) | | | 2,914 | | | | (49,835 | ) |
| | | | | | | | |
| EUR | | 32 | | Receives | | 6-month EURIBOR
(pays semi-annually) | | 1.47%
(pays annually) | | | 4/5/48 | | | | (2,750 | ) | | | — | | | | (2,750 | ) |
| | | | | | | | |
| EUR | | 100 | | Receives | | 6-month EURIBOR
(pays semi-annually) | | 1.49%
(pays annually) | | | 4/18/48 | | | | (9,059 | ) | | | — | | | | (9,059 | ) |
| | | | | | | | |
| EUR | | 15 | | Receives | | 6-month EURIBOR
(pays semi-annually) | | 1.60%
(pays annually) | | | 5/18/48 | | | | (1,789 | ) | | | 388 | | | | (1,401 | ) |
| | | | | | | | |
| EUR | | 11 | | Receives | | 6-month EURIBOR
(pays semi-annually) | | 1.54%
(pays annually) | | | 5/29/48 | | | | (1,183 | ) | | | — | | | | (1,183 | ) |
| | | | | | | | |
| EUR | | 38 | | Receives | | 6-month EURIBOR
(pays semi-annually) | | 1.50%
(pays annually) | | | 6/4/48 | | | | (3,404 | ) | | | — | | | | (3,404 | ) |
| | | | | | | | |
| MXN | | 64,000 | | Pays | | Mexico Interbank TIIE 28 Day
(pays monthly) | | 8.45%
(pays monthly) | | | 1/3/24 | | | | 38,625 | | | | — | | | | 38,625 | |
| | | | | | | | |
| MXN | | 63,000 | | Pays | | Mexico Interbank TIIE 28 Day
(pays monthly) | | 8.38%
(pays monthly) | | | 1/18/24 | | | | 28,717 | | | | (5 | ) | | | 28,712 | |
| | | | | | | | |
| MXN | | 10,140 | | Receives | | Mexico Interbank TIIE 28 Day
(pays monthly) | | 9.36%
(pays monthly) | | | 12/3/38 | | | | (24,770 | ) | | | — | | | | (24,770 | ) |
| | | | | | | | |
| USD | | 600 | | Receives | | 3-monthUSD-LIBOR
(pays quarterly) | | 2.64%
(pays semi-annually) | | | 3/8/21 | | | | (4,189 | ) | | | — | | | | (4,189 | ) |
| | | | | | | | |
| USD | | 345 | | Receives | | 3-monthUSD-LIBOR
(pays quarterly) | | 2.87%
(pays semi-annually) | | | 5/16/21 | | | | (2,296 | ) | | | (9 | ) | | | (2,305 | ) |
| | | | | | | | |
| USD | | 1,916 | | Receives | | 3-monthUSD-LIBOR
(pays quarterly) | | 1.87%
(pays semi-annually) | | | 9/18/22 | | | | 37,450 | | | | — | | | | 37,450 | |
| | | | | | | | |
| USD | | 440 | | Receives | | 3-monthUSD-LIBOR
(pays quarterly) | | 2.07%
(pays semi-annually) | | | 10/20/22 | | | | 4,842 | | | | (91 | ) | | | 4,751 | |
| | | | |
| | 12 | | See Notes to Financial Statements. |
Eaton Vance
Emerging Markets Debt Opportunities Fund
January 31, 2019
Portfolio of Investments (Unaudited) — continued
| | | | | | | | | | | | | | | | | | | | | | | | |
| Centrally Cleared Interest Rate Swaps (continued) | |
| | | | | | | |
Notional Amount
(000’s omitted) | | Fund
Pays/Receives
Floating Rate | | Floating Rate | | Annual
Fixed Rate | | Termination
Date | | | Value | | | Unamortized
Upfront
Receipts
(Payments) | | | Unrealized
Appreciation
(Depreciation) | |
| | | | | | | | |
| USD | | 420 | | Receives | | 3-month USD-LIBOR
(pays quarterly) | | 2.69%
(pays semi-annually) | | | 2/6/23 | | | $ | (5,390 | ) | | $ | — | | | $ | (5,390 | ) |
| | | | | | | | |
| USD | | 645 | | Receives | | 3-monthUSD-LIBOR
(pays quarterly) | | 2.64%
(pays semi-annually) | | | 2/12/23 | | | | (6,882 | ) | | | — | | | | (6,882 | ) |
| | | | | | | | |
| USD | | 1,100 | | Receives | | 3-monthUSD-LIBOR
(pays quarterly) | | 2.66%
(pays semi-annually) | | | 2/12/23 | | | | (12,790 | ) | | | (4,595 | ) | | | (17,385 | ) |
| | | | | | | | |
| USD | | 600 | | Receives | | 3-monthUSD-LIBOR
(pays quarterly) | | 2.79%
(pays semi-annually) | | | 3/14/23 | | | | (10,263 | ) | | | — | | | | (10,263 | ) |
| | | | | | | | |
| USD | | 1,000 | | Receives | | 3-monthUSD-LIBOR
(pays quarterly) | | 3.02%
(pays semi-annually) | | | 5/17/23 | | | | (20,440 | ) | | | 172 | | | | (20,268 | ) |
| | | | | | | | |
| USD | | 235 | | Receives | | 3-monthUSD-LIBOR
(pays quarterly) | | 2.88%
(pays semi-annually) | | | 7/10/23 | | | | (3,432 | ) | | | — | | | | (3,432 | ) |
| | | | | | | | |
| USD | | 200 | | Receives | | 3-monthUSD-LIBOR
(pays quarterly) | | 2.88%
(pays semi-annually) | | | 7/11/23 | | | | (2,946 | ) | | | (122 | ) | | | (3,068 | ) |
| | | | | | | | |
| USD | | 200 | | Receives | | 3-monthUSD-LIBOR
(pays quarterly) | | 2.90%
(pays semi-annually) | | | 7/19/23 | | | | (3,126 | ) | | | — | | | | (3,126 | ) |
| | | | | | | | |
| USD | | 345 | | Receives | | 3-monthUSD-LIBOR
(pays quarterly) | | 3.11%
(pays semi-annually) | | | 9/27/23 | | | | (11,477 | ) | | | 9 | | | | (11,468 | ) |
| | | | | | | | |
| USD | | 271 | | Receives | | 3-monthUSD-LIBOR
(pays quarterly) | | 3.09%
(pays semi-annually) | | | 9/28/23 | | | | (8,767 | ) | | | — | | | | (8,767 | ) |
| | | | | | | | |
| USD | | 265 | | Receives | | 3-monthUSD-LIBOR
(pays quarterly) | | 3.08%
(pays semi-annually) | | | 10/2/23 | | | | (8,464 | ) | | | — | | | | (8,464 | ) |
| | | | | | | | |
| USD | | 350 | | Receives | | 3-monthUSD-LIBOR
(pays quarterly) | | 3.06%
(pays semi-annually) | | | 10/2/23 | | | | (10,925 | ) | | | (40 | ) | | | (10,965 | ) |
| | | | | | | | |
| USD | | 244 | | Receives | | 3-monthUSD-LIBOR
(pays quarterly) | | 3.08%
(pays semi-annually) | | | 10/3/23 | | | | (7,787 | ) | | | — | | | | (7,787 | ) |
| | | | | | | | |
| USD | | 191 | | Receives | | 3-monthUSD-LIBOR
(pays quarterly) | | 3.15%
(pays semi-annually) | | | 10/19/23 | | | | (6,795 | ) | | | — | | | | (6,795 | ) |
| | | | | | | | |
| USD | | 164 | | Receives | | 3-monthUSD-LIBOR
(pays quarterly) | | 3.19%
(pays semi-annually) | | | 10/23/23 | | | | (6,124 | ) | | | 908 | | | | (5,216 | ) |
| | | | | | | | |
| USD | | 430 | | Receives | | 3-monthUSD-LIBOR
(pays quarterly) | | 3.12%
(pays semi-annually) | | | 10/27/23 | | | | (15,045 | ) | | | — | | | | (15,045 | ) |
| | | | | | | | |
| USD | | 354 | | Receives | | 3-monthUSD-LIBOR
(pays quarterly) | | 3.09%
(pays semi-annually) | | | 10/31/23 | | | | (11,612 | ) | | | — | | | | (11,612 | ) |
| | | | | | | | |
| USD | | 600 | | Receives | | 3-monthUSD-LIBOR
(pays quarterly) | | 3.22%
(pays semi-annually) | | | 11/13/23 | | | | (19,211 | ) | | | — | | | | (19,211 | ) |
| | | | | | | | |
| USD | | 615 | | Receives | | 3-monthUSD-LIBOR
(pays quarterly) | | 3.01%
(pays semi-annually) | | | 11/23/23 | | | | (13,644 | ) | | | — | | | | (13,644 | ) |
| | | | | | | | |
| USD | | 411 | | Receives | | 3-monthUSD-LIBOR
(pays quarterly) | | 3.00%
(pays semi-annually) | | | 11/23/23 | | | | (8,925 | ) | | | — | | | | (8,925 | ) |
| | | | | | | | |
| USD | | 622 | | Receives | | 3-monthUSD-LIBOR
(pays quarterly) | | 2.78%
(pays semi-annually) | | | 12/20/23 | | | | (6,897 | ) | | | — | | | | (6,897 | ) |
| | | | | | | | |
| USD | | 390 | | Receives | | 3-monthUSD-LIBOR
(pays quarterly) | | 2.71%
(pays semi-annually) | | | 12/24/23 | | | | (3,161 | ) | | | — | | | | (3,161 | ) |
| | | | | | | | |
| USD | | 450 | | Receives | | 3-monthUSD-LIBOR
(pays quarterly) | | 2.57%
(pays semi-annually) | | | 1/4/24 | | | | (695 | ) | | | — | | | | (695 | ) |
| | | | |
| | 13 | | See Notes to Financial Statements. |
Eaton Vance
Emerging Markets Debt Opportunities Fund
January 31, 2019
Portfolio of Investments (Unaudited) — continued
| | | | | | | | | | | | | | | | | | | | | | | | | | |
| Centrally Cleared Interest Rate Swaps (continued) | |
| | | | | | | |
Notional Amount (000’s omitted) | | Fund
Pays/Receives
Floating Rate | | | Floating Rate | | Annual
Fixed Rate | | Termination
Date | | | Value | | | Unamortized
Upfront
Receipts
(Payments) | | | Unrealized
Appreciation
(Depreciation) | |
| | | | | | | | |
| USD | | 250 | | | Receives | | | 3-month USD-LIBOR
(pays quarterly) | | 2.66%
(pays semi-annually) | | | 1/11/24 | | | $ | (1,463 | ) | | $ | — | | | $ | (1,463 | ) |
| | | | | | | | |
| USD | | 1,242 | | | Receives | | | 3-monthUSD-LIBOR
(pays quarterly) | | 2.18%
(pays semi-annually) | | | 9/19/27 | | | | 36,843 | | | | — | | | | 36,843 | |
| | | | | | | | |
| USD | | 410 | | | Receives | | | 3-monthUSD-LIBOR
(pays quarterly) | | 2.32%
(pays semi-annually) | | | 10/4/27 | | | | 7,327 | | | | (133 | ) | | | 7,194 | |
| | | | | | | | |
| USD | | 1,614 | | | Receives | | | 3-monthUSD-LIBOR
(pays quarterly) | | 2.88%
(pays semi-annually) | | | 6/1/28 | | | | (32,726 | ) | | | — | | | | (32,726 | ) |
| | | | | | | | |
| USD | | 693 | | | Receives | | | 3-monthUSD-LIBOR
(pays quarterly) | | 3.13%
(pays semi-annually) | | | 9/28/28 | | | | (34,208 | ) | | | — | | | | (34,208 | ) |
| | | | | | | | |
| USD | | 283 | | | Receives | | | 3-monthUSD-LIBOR
(pays quarterly) | | 3.12%
(pays semi-annually) | | | 10/2/28 | | | | (13,516 | ) | | | — | | | | (13,516 | ) |
| | | | | | | | |
| USD | | 386 | | | Receives | | | 3-monthUSD-LIBOR
(pays quarterly) | | 3.11%
(pays semi-annually) | | | 10/2/28 | | | | (18,281 | ) | | | 196 | | | | (18,085 | ) |
| | | | | | | | |
| USD | | 1,076 | | | Receives | | | 3-monthUSD-LIBOR
(pays quarterly) | | 3.29%
(pays semi-annually) | | | 11/13/28 | | | | (60,705 | ) | | | — | | | | (60,705 | ) |
| | | | | | | | |
| USD | | 2,244 | | | Receives | | | 3-monthUSD-LIBOR
(pays quarterly) | | 3.25%
(pays semi-annually) | | | 11/13/28 | | | | (118,098 | ) | | | — | | | | (118,098 | ) |
| | | | | | | | |
| USD | | 500 | | | Receives | | | 3-monthUSD-LIBOR
(pays quarterly) | | 2.87%
(pays semi-annually) | | | 12/20/28 | | | | (9,058 | ) | | | 99 | | | | (8,959 | ) |
| | | | | | | | |
| USD | | 267 | | | Receives | | | 3-monthUSD-LIBOR
(pays quarterly) | | 2.72%
(pays semi-annually) | | | 1/15/29 | | | | (1,422 | ) | | | 58 | | | | (1,364 | ) |
| | | | | | | | |
| USD | | 247 | | | Receives | | | 3-monthUSD-LIBOR
(pays quarterly) | | 2.75%
(pays semi-annually) | | | 1/18/29 | | | | (2,011 | ) | | | — | | | | (2,011 | ) |
| | | | | | | | |
| USD | | 233 | | | Receives | | | 3-monthUSD-LIBOR
(pays quarterly) | | 2.76%
(pays semi-annually) | | | 1/18/29 | | | | (2,081 | ) | | | — | | | | (2,081 | ) |
| | | | | | | | |
| USD | | 278 | | | Receives | | | 3-month USD-LIBOR
(pays quarterly) | | 2.76%
(payssemi-annually) | | | 1/22/29 | | | | (2,493 | ) | | | — | | | | (2,493 | ) |
| | | | | | | | |
| USD | | 101 | | | Receives | | | 3-monthUSD-LIBOR
(pays quarterly) | | 2.92%
(pays semi-annually) | | | 4/16/48 | | | | (3,096 | ) | | | — | | | | (3,096 | ) |
| | | | | | | | |
| USD | | 105 | | | Receives | | | 3-monthUSD-LIBOR
(pays quarterly) | | 2.91%
(pays semi-annually) | | | 4/17/48 | | | | (2,954 | ) | | | — | | | | (2,954 | ) |
| | | | | | | | |
| USD | | 27 | | | Receives | | | 3-monthUSD-LIBOR
(pays quarterly) | | 3.12%
(pays semi-annually) | | | 5/18/48 | | | | (1,706 | ) | | | 187 | | | | (1,519 | ) |
| | | | | | | | |
| USD | | 32 | | | Receives | | | 3-monthUSD-LIBOR
(pays quarterly) | | 3.02%
(pays semi-annually) | | | 5/29/48 | | | | (1,395 | ) | | | — | | | | (1,395 | ) |
| | | | | | | | |
| USD | | 322 | | | Receives | | | 3-monthUSD-LIBOR
(pays quarterly) | | 3.14%
(pays semi-annually) | | | 9/25/48 | | | | (24,453 | ) | | | (477 | ) | | | (24,930 | ) |
| | | | | | | | |
| USD | | 523 | | | Receives | | | 3-monthUSD-LIBOR
(pays quarterly) | | 3.12%
(pays semi-annually) | | | 10/1/48 | | | | (38,225 | ) | | | — | | | | (38,225 | ) |
| | | | | | | | |
| USD | | 229 | | | Receives | | | 3-monthUSD-LIBOR
(pays quarterly) | | 3.22%
(pays semi-annually) | | | 10/9/48 | | | | (21,332 | ) | | | (1,720 | ) | | | (23,052 | ) |
| | | | | | | | |
| USD | | 2,011 | | | Receives | | | 3-monthUSD-LIBOR
(pays quarterly) | | 3.33%
(pays semi-annually) | | | 11/13/48 | | | | (219,415 | ) | | | — | | | | (219,415 | ) |
| | | | | | | | |
| USD | | 1,136 | | | Receives | | | 3-monthUSD-LIBOR
(pays quarterly) | | 2.95%
(pays semi-annually) | | | 12/20/48 | | | | (33,929 | ) | | | — | | | | (33,929 | ) |
| | | | | | | | |
Total | | | | | | | | | | | | | | | | $ | (755,020 | ) | | $ | 10,860 | | | $ | (744,160 | ) |
| | | | |
| | 14 | | See Notes to Financial Statements. |
Eaton Vance
Emerging Markets Debt Opportunities Fund
January 31, 2019
Portfolio of Investments (Unaudited) — continued
| | | | | | | | | | | | | | | | | | | | |
| Interest Rate Swaps | |
| | | | | | |
| Counterparty | | Notional
Amount
(000’s omitted) | | | Fund
Pays/Receives
Floating Rate | | Floating Rate | | Annual
Fixed Rate | | Termination
Date | | | Value/Unrealized
Appreciation
(Depreciation) | |
| | | | | | | |
| Bank of America, N.A. | | MXN | | | 2,844 | | | Pays | | Mexico Interbank TIIE 28 Day
(pays monthly) | | 6.63%
(pays monthly) | | $ | 3/19/24 | | | $ | (9,718 | ) |
| | | | | | | |
| Bank of America, N.A. | | THB | | | 70,000 | | | Pays | | 6-month THB Fixing Rate
(pays semi-annually) | | 1.81%
(pays semi-annually) | | | 1/15/23 | | | | (7,423 | ) |
| | | | | | | |
| Deutsche Bank AG | | THB | | | 23,680 | | | Pays | | 6-month THB Fixing Rate
(pays semi-annually) | | 2.13%
(pays semi-annually) | | | 11/19/23 | | | | 9,245 | |
| | | | | | | |
Total | | | | | | | | | | | | | | | | | | $ | (7,896 | ) |
| | | | | | | | | | | | | | | | | | | | | | | | |
| Centrally Cleared Credit Default Swaps — Sell Protection | |
| | | | | | | |
| Reference Entity | | Notional Amount*
(000’s omitted) | | Contract Annual
Fixed Rate** | | Termination
Date | | | Current
Market Annual Fixed Rate*** | | | Value | | | Unamortized
Upfront
Receipts
(Payments) | | | Unrealized
Appreciation | |
| | | | | | | |
Argentina
| | $1,071 | | 5.00%
(pays quarterly)(1) | | | 12/20/23 | | | | 6.21 | % | | $ | (43,817 | ) | | $ | 95,417 | | | $ | 51,600 | |
| | | | | | | |
Total | | $1,071 | | | | | | | | | | | | $ | (43,817 | ) | | $ | 95,417 | | | $ | 51,600 | |
| | | | | | | | | | | | | | | | | | | | | | | | | | | | |
| Credit Default Swaps — Sell Protection | |
| | | | | | | | |
| Reference Entity | | Counterparty | | Notional Amount* (000’s omitted) | | | Contract Annual
Fixed Rate** | | Termination
Date | | | Current
Market Annual Fixed Rate*** | | | Value | | | Unamortized
Upfront
Receipts
(Payments) | | | Unrealized
Appreciation
(Depreciation) | |
| | | | | | | | |
| Bahamas | | Deutsche Bank AG | | $ | 600 | | | 1.00%
(pays quarterly)(1) | | | 6/20/22 | | | | 1.83 | % | | $ | (15,084 | ) | | $ | 36,491 | | | $ | 21,407 | |
| | | | | | | | |
| Turkey | | Goldman Sachs International | | | 1,750 | | | 1.00%
(pays quarterly)(1) | | | 12/20/27 | | | | 3.61 | | | | (304,816 | ) | | | 224,656 | | | | (80,160 | ) |
| | | | | | | |
Total | | $ | 2,350 | | | | | | | | | | | | | $ | (319,900 | ) | | $ | 261,147 | | | $ | (58,753 | ) |
| * | If the Fund is the seller of credit protection, the notional amount is the maximum potential amount of future payments the Fund could be required to make if a credit event, as defined in the credit default swap agreement, were to occur. At January 31, 2019, such maximum potential amount for all open credit default swaps in which the Fund is the seller was $3,421,000. |
| ** | The contract annual fixed rate represents the fixed rate of interest received by the Fund (as a seller of protection) on the notional amount of the credit default swap contract. |
| *** | Current market annual fixed rates, utilized in determining the net unrealized appreciation or depreciation as of period end, serve as an indicator of the market’s perception of the current status of the payment/performance risk associated with the credit derivative. The current market annual fixed rate of a particular reference entity reflects the cost, as quoted by the pricing vendor, of selling protection against default of that entity as of period end and may include upfront payments required to be made to enter into the agreement. The higher the fixed rate, the greater the market perceived risk of a credit event involving the reference entity. A rate identified as “Defaulted” indicates a credit event has occurred for the reference entity. |
| (1) | Upfront payment is exchanged with the counterparty as a result of the standardized trading coupon. |
| | | | |
| | 15 | | See Notes to Financial Statements. |
Eaton Vance
Emerging Markets Debt Opportunities Fund
January 31, 2019
Portfolio of Investments (Unaudited) — continued
Abbreviations:
| | | | |
| | |
| BADLAR | | – | | Buenos Aires Deposits of Large Amount Rate |
| | |
| EURIBOR | | – | | Euro Interbank Offered Rate |
| | |
| LIBOR | | – | | London Interbank Offered Rate |
Currency Abbreviations:
| | | | |
| | |
| ARS | | – | | Argentine Peso |
| | |
| BAM | | – | | Bosnia-Herzegovina Convertible Mark |
| | |
| BRL | | – | | Brazilian Real |
| | |
| COP | | – | | Colombian Peso |
| | |
| DOP | | – | | Dominican Peso |
| | |
| EGP | | – | | Egyptian Pound |
| | |
| EUR | | – | | Euro |
| | |
| GEL | | – | | Georgian Lari |
| | |
| IDR | | – | | Indonesian Rupiah |
| | |
| LKR | | – | | Sri Lankan Rupee |
| | | | |
| | |
| MAD | | – | | Moroccan Dirham |
| | |
| MXN | | – | | Mexican Peso |
| | |
| PEN | | – | | Peruvian Sol |
| | |
| RSD | | – | | Serbian Dinar |
| | |
| THB | | – | | Thai Baht |
| | |
| TRY | | – | | New Turkish Lira |
| | |
| UAH | | – | | Ukrainian Hryvnia |
| | |
| UGX | | – | | Ugandan Shilling |
| | |
| USD | | – | | United States Dollar |
| | |
| XOF | | – | | West African CFA Franc |
| | | | |
| | 16 | | See Notes to Financial Statements. |
Eaton Vance
Emerging Markets Debt Opportunities Fund
January 31, 2019
Statement of Assets and Liabilities (Unaudited)
| | | | |
| Assets | | January 31, 2019 | |
| |
Unaffiliated investments, at value (identified cost, $123,291,590) | | $ | 122,847,149 | |
| |
Affiliated investment, at value (identified cost, $3,164,592) | | | 3,164,722 | |
| |
Cash | | | 612,181 | |
|
Deposits for derivatives collateral — | |
| |
Financial futures contracts | | | 52,240 | |
| |
Centrally cleared swap contracts | | | 2,127,511 | |
| |
Foreign currency, at value (identified cost, $1,488,394) | | | 1,487,828 | |
| |
Interest receivable | | | 2,275,792 | |
| |
Dividends receivable from affiliated investment | | | 9,730 | |
| |
Receivable for Fund shares sold | | | 1,399,882 | |
| |
Receivable for open forward foreign currency exchange contracts | | | 2,569,674 | |
| |
Receivable for open swap contracts | | | 30,652 | |
| |
Receivable for opennon-deliverable bond forward contracts | | | 24,016 | |
| |
Tax reclaims receivable | | | 17,620 | |
| |
Receivable from affiliate | | | 16,462 | |
| |
Total assets | | $ | 136,635,459 | |
|
| Liabilities | |
| |
Payable for investments purchased | | $ | 1,338,266 | |
| |
Payable for when-issued securities | | | 1,270,000 | |
| |
Payable for Fund shares redeemed | | | 461,862 | |
| |
Payable for variation margin on open financial futures contracts | | | 10,210 | |
| |
Payable for variation margin on open centrally cleared swap contracts | | | 130,939 | |
| |
Payable for open forward foreign currency exchange contracts | | | 1,915,082 | |
| |
Payable for open swap contracts | | | 97,301 | |
| |
Upfront receipts on opennon-centrally cleared swap contracts | | | 261,147 | |
|
Payable to affiliate: | |
| |
Investment adviser and administration fee | | | 70,048 | |
| |
Distribution and service fees | | | 1,393 | |
| |
Accrued foreign capital gains taxes | | | 10,704 | |
| |
Accrued expenses | | | 143,121 | |
| |
Total liabilities | | $ | 5,710,073 | |
| |
Net Assets | | $ | 130,925,386 | |
|
| Sources of Net Assets | |
| |
Common shares, $0.001 par value, 1,000,000,000 shares authorized (see Note 7), 14,957,731 shares issued and outstanding | | $ | 14,958 | |
| |
Additionalpaid-in capital | | | 139,324,227 | |
| |
Accumulated loss | | | (8,413,799 | ) |
| |
Total | | $ | 130,925,386 | |
| | | | |
| | 17 | | See Notes to Financial Statements. |
Eaton Vance
Emerging Markets Debt Opportunities Fund
January 31, 2019
Statement of Assets and Liabilities (Unaudited) — continued
| | | | |
| Class A Shares | | January 31, 2019 | |
| |
Net Assets | | $ | 6,594,747 | |
| |
Shares Outstanding | | | 754,213 | |
|
Net Asset Value and Redemption Price Per Share | |
| |
(net assets ÷ shares outstanding) | | $ | 8.74 | |
|
Maximum Offering Price Per Share | |
| |
(100 ÷ 95.25 of net asset value per share) | | $ | 9.18 | |
| |
| Class I Shares | | | | |
| |
Net Assets | | $ | 48,479,840 | |
| |
Shares Outstanding | | | 5,526,635 | |
|
Net Asset Value, Offering Price and Redemption Price Per Share | |
| |
(net assets ÷ shares outstanding) | | $ | 8.77 | |
|
| Class R6 Shares | |
| |
Net Assets | | $ | 75,850,799 | |
| |
Shares Outstanding | | | 8,676,883 | |
|
Net Asset Value, Offering Price and Redemption Price Per Share | |
| |
(net assets ÷ shares outstanding) | | $ | 8.74 | |
On sales of $50,000 or more, the offering price of Class A shares is reduced.
| | | | |
| | 18 | | See Notes to Financial Statements. |
Eaton Vance
Emerging Markets Debt Opportunities Fund
January 31, 2019
Statement of Operations (Unaudited)
| | | | |
| Investment Income | | Six Months Ended January 31, 2019 | |
| |
Interest (net of foreign taxes, $126,106) | | $ | 4,549,180 | |
| |
Dividends from affiliated investment | | | 162,314 | |
| |
Total investment income | | $ | 4,711,494 | |
|
| Expenses | |
| |
Investment adviser and administration fee | | $ | 395,587 | |
|
Distribution and service fees | |
| |
Class A | | | 7,491 | |
| |
Directors’ fees and expenses | | | 3,821 | |
| |
Custodian fee | | | 151,631 | |
| |
Transfer and dividend disbursing agent fees | | | 19,618 | |
| |
Legal and accounting services | | | 54,026 | |
| |
Printing and postage | | | 20,571 | |
| |
Registration fees | | | 35,234 | |
| |
Miscellaneous | | | 16,448 | |
| |
Total expenses | | $ | 704,427 | |
|
Deduct — | |
| |
Allocation of expenses to affiliate | | $ | 163,207 | |
| |
Total expense reductions | | $ | 163,207 | |
| |
Net expenses | | $ | 541,220 | |
| |
Net investment income | | $ | 4,170,274 | |
|
| Realized and Unrealized Gain (Loss) | |
|
Net realized gain (loss) — | |
| |
Investment transactions (net of foreign capital gains taxes of $1,609) | | $ | (3,350,572 | ) |
| |
Investment transactions — affiliated investment | | | (2,025 | ) |
| |
Financial futures contracts | | | (29,932 | ) |
| |
Swap contracts | | | (611,800 | ) |
| |
Foreign currency transactions | | | (104,605 | ) |
| |
Forward foreign currency exchange contracts | | | (1,273,762 | ) |
| |
Non-deliverable bond forward contracts | | | (13,626 | ) |
| |
Net realized loss | | $ | (5,386,322 | ) |
|
Change in unrealized appreciation (depreciation) — | |
| |
Investments (including net of decrease of $2,806 in accrued foreign capital gains taxes) | | $ | 2,184,210 | |
| |
Investments — affiliated investment | | | 131 | |
| |
Financial futures contracts | | | (55,014 | ) |
| |
Swap contracts | | | (457,947 | ) |
| |
Foreign currency | | | 64,588 | |
| |
Forward foreign currency exchange contracts | | | 908,658 | |
| |
Non-deliverable bond forward contracts | | | 24,016 | |
| |
Net change in unrealized appreciation (depreciation) | | $ | 2,668,642 | |
| |
Net realized and unrealized loss | | $ | (2,717,680 | ) |
| |
Net increase in net assets from operations | | $ | 1,452,594 | |
| | | | |
| | 19 | | See Notes to Financial Statements. |
Eaton Vance
Emerging Markets Debt Opportunities Fund
January 31, 2019
Statements of Changes in Net Assets
| | | | | | | | |
| Increase (Decrease) in Net Assets | | Six Months Ended
January 31, 2019
(Unaudited) | | | Year Ended July 31, 2018 | |
|
From operations — | |
| | |
Net investment income | | $ | 4,170,274 | | | $ | 7,140,064 | |
| | |
Net realized loss | | | (5,386,322 | ) | | | (1,727,494 | ) |
| | |
Net change in unrealized appreciation (depreciation) | | | 2,668,642 | | | | (3,788,374 | ) |
| | |
Net increase in net assets from operations | | $ | 1,452,594 | | | $ | 1,624,196 | |
|
Distributions to shareholders(1) | |
| | |
Class A | | $ | (225,044 | ) | | $ | (145,243 | ) |
| | |
Class I | | | (1,659,218 | ) | | | (1,216,052 | ) |
| | |
Class R6 | | | (2,822,465 | ) | | | (5,231,531 | ) |
| | |
Total distributions to shareholders | | $ | (4,706,727 | ) | | $ | (6,592,826 | ) |
|
Tax return of capital to shareholders | |
| | |
Class A | | $ | — | | | $ | (28,155 | ) |
| | |
Class I | | | — | | | | (237,022 | ) |
| | |
Class R6 | | | — | | | | (669,095 | ) |
| | |
Total tax return of capital to shareholders | | $ | — | | | $ | (934,272 | ) |
|
Transactions in common shares — | |
|
Proceeds from sale of shares | |
| | |
Class A | | $ | 2,876,021 | | | $ | 9,114,427 | |
| | |
Class I | | | 30,896,304 | | | | 47,866,531 | |
| | |
Class R6 | | | 2,462,859 | | | | 3,303,838 | |
| | |
Net asset value of shares issued to shareholders in payment of distributions declared | | | | | | | | |
| | |
Class A | | | 207,749 | | | | 161,522 | |
| | |
Class I | | | 1,659,196 | | | | 1,453,048 | |
| | |
Class R6 | | | 2,822,465 | | | | 5,537,410 | |
| | |
Cost of shares redeemed | | | | | | | | |
| | |
Class A | | | (1,195,795 | ) | | | (4,504,089 | ) |
| | |
Class I | | | (21,795,864 | ) | | | (9,722,348 | ) |
| | |
Class R6 | | | (1,626,151 | ) | | | (1,809,618 | ) |
| | |
Net increase in net assets from Fund share transactions | | $ | 16,306,784 | | | $ | 51,400,721 | |
| | |
Net increase in net assets | | $ | 13,052,651 | | | $ | 45,497,819 | |
| |
| Net Assets | | | | |
| | |
At beginning of period | | $ | 117,872,735 | | | $ | 72,374,916 | |
| | |
At end of period | | $ | 130,925,386 | | | $ | 117,872,735 | (2) |
| (1) | For the year ended July 31, 2018, the source of distributions was from net investment income. |
| (2) | Includes accumulated distributions in excess of net investment income of $(1,870,665) at July 31, 2018. The requirement to disclose the corresponding amount as of January 31, 2019 was eliminated. |
| | | | |
| | 20 | | See Notes to Financial Statements. |
Eaton Vance
Emerging Markets Debt Opportunities Fund
January 31, 2019
Financial Highlights
| | | | | | | | | | | | | | | | |
| | | Class A | |
| | | |
| | | Six Months Ended
January 31, 2019
(Unaudited) | | | Year Ended July 31, | | | Period Ended July 31, 2016(1) | |
| | | 2018 | | | 2017 | |
| | | | |
Net asset value — Beginning of period | | $ | 9.010 | | | $ | 9.460 | | | $ | 9.400 | | | $ | 8.730 | |
| | | | |
| Income (Loss) From Operations | | | | | | | | | | | | | | | | |
| | | | |
Net investment income(2) | | $ | 0.286 | | | $ | 0.675 | | | $ | 0.608 | | | $ | 0.544 | |
| | | | |
Net realized and unrealized gain (loss) | | | (0.234 | ) | | | (0.399 | ) | | | 0.214 | | | | 0.244 | |
| | | | |
Total income from operations | | $ | 0.052 | | | $ | 0.276 | | | $ | 0.822 | | | $ | 0.788 | |
| | | | |
| Less Distributions | | | | | | | | | | | | | | | | |
| | | | |
From net investment income | | $ | (0.322 | ) | | $ | (0.646 | ) | | $ | (0.762 | ) | | $ | (0.118 | ) |
| | | | |
Tax return of capital | | | — | | | | (0.080 | ) | | | — | | | | — | |
| | | | |
Total distributions | | $ | (0.322 | ) | | $ | (0.726 | ) | | $ | (0.762 | ) | | $ | (0.118 | ) |
| | | | |
Net asset value — End of period | | $ | 8.740 | | | $ | 9.010 | | | $ | 9.460 | | | $ | 9.400 | |
| | | | |
Total Return(3)(4) | | | 0.70 | %(5) | | | 2.82 | % | | | 9.18 | % | | | 9.16 | %(5) |
| | | | |
| Ratios/Supplemental Data | | | | | | | | | | | | | | | | |
| | | | |
Net assets, end of period (000’s omitted) | | $ | 6,595 | | | $ | 4,840 | | | $ | 330 | | | $ | 45 | |
| | | | |
Ratios (as a percentage of average daily net assets): | | | | | | | | | | | | | | | | |
| | | | |
Expenses(4) | | | 1.15 | %(6) | | | 1.15 | % | | | 1.16 | %(7) | | | 1.15 | %(6) |
| | | | |
Net investment income | | | 6.57 | %(6) | | | 7.19 | % | | | 6.46 | % | | | 6.74 | %(6) |
| | | | |
Portfolio Turnover | | | 24 | %(5) | | | 80 | % | | | 70 | % | | | 85 | %(8) |
| (1) | For the period from commencement of operations on September 3, 2015 to July 31, 2016. |
| (2) | Computed using average shares outstanding. |
| (3) | Returns are historical and are calculated by determining the percentage change in net asset value with all distributions reinvested and do not reflect the effect of sales charges. |
| (4) | The investment adviser and administrator reimbursed certain operating expenses (equal to 0.27%, 0.29%, 0.34% and 1.15% of average daily net assets for the six months ended January 31, 2019, the years ended July 31, 2018 and 2017 and the period from commencement of operations on September 3, 2015 to July 31, 2016, respectively). Absent this reimbursement, total return would be lower. |
| (7) | Includes interest expense of 0.01% for the year ended July 31, 2017. |
| (8) | For the year ended July 31, 2016. |
| | | | |
| | 21 | | See Notes to Financial Statements. |
Eaton Vance
Emerging Markets Debt Opportunities Fund
January 31, 2019
Financial Highlights — continued
| | | | | | | | | | | | | | | | |
| | | Class I | |
| | | |
| | | Six Months Ended
January 31, 2019
(Unaudited) | | | Year Ended July 31, | | | Period Ended July 31, 2016(1) | |
| | | 2018 | | | 2017 | |
| | | | |
Net asset value — Beginning of period | | $ | 9.030 | | | $ | 9.490 | | | $ | 9.420 | | | $ | 8.730 | |
| | | | |
| Income (Loss) From Operations | | | | | | | | | | | | | | | | |
| | | | |
Net investment income(2) | | $ | 0.298 | | | $ | 0.705 | | | $ | 0.649 | | | $ | 0.560 | |
| | | | |
Net realized and unrealized gain (loss) | | | (0.224 | ) | | | (0.413 | ) | | | 0.204 | | | | 0.270 | |
| | | | |
Total income from operations | | $ | 0.074 | | | $ | 0.292 | | | $ | 0.853 | | | $ | 0.830 | |
| | | | |
| Less Distributions | | | | | | | | | | | | | | | | |
| | | | |
From net investment income | | $ | (0.334 | ) | | $ | (0.669 | ) | | $ | (0.783 | ) | | $ | (0.140 | ) |
| | | | |
Tax return of capital | | | — | | | | (0.083 | ) | | | — | | | | — | |
| | | | |
Total distributions | | $ | (0.334 | ) | | $ | (0.752 | ) | | $ | (0.783 | ) | | $ | (0.140 | ) |
| | | | |
Net asset value — End of period | | $ | 8.770 | | | $ | 9.030 | | | $ | 9.490 | | | $ | 9.420 | |
| | | | |
Total Return(3)(4) | | | 0.95 | %(5) | | | 2.98 | % | | | 9.51 | % | | | 9.67 | %(5) |
| | | | |
| Ratios/Supplemental Data | | | | | | | | | | | | | | | | |
| | | | |
Net assets, end of period (000’s omitted) | | $ | 48,480 | | | $ | 38,756 | | | $ | 1,060 | | | $ | 34 | |
| | | | |
Ratios (as a percentage of average daily net assets): | | | | | | | | | | | | | | | | |
| | | | |
Expenses(4) | | | 0.90 | %(6) | | | 0.90 | % | | | 0.91 | %(7) | | | 0.90 | %(6) |
| | | | |
Net investment income | | | 6.83 | %(6) | | | 7.48 | % | | | 6.90 | % | | | 6.84 | %(6) |
| | | | |
Portfolio Turnover | | | 24 | %(5) | | | 80 | % | | | 70 | % | | | 85 | %(8) |
| (1) | For the period from commencement of operations on September 3, 2015 to July 31, 2016. |
| (2) | Computed using average shares outstanding. |
| (3) | Returns are historical and are calculated by determining the percentage change in net asset value with all distributions reinvested. |
| (4) | The investment adviser and administrator reimbursed certain operating expenses (equal to 0.27%, 0.29%, 0.34% and 1.15% of average daily net assets for the six months ended January 31, 2019, the years ended July 31, 2018 and 2017 and the period from commencement of operations on September 3, 2015 to July 31, 2016, respectively). Absent this reimbursement, total return would be lower. |
| (7) | Includes interest expense of 0.01% for the year ended July 31, 2017. |
| (8) | For the year ended July 31, 2016. |
| | | | |
| | 22 | | See Notes to Financial Statements. |
Eaton Vance
Emerging Markets Debt Opportunities Fund
January 31, 2019
Financial Highlights — continued
| | | | | | | | | | | | | | | | | | | | | | | | |
| | | Class R6 | |
| | |
| | | Six Months Ended
January 31, 2019
(Unaudited) | | | Year Ended July 31, | |
| | | 2018 | | | 2017 | | | 2016 | | | 2015 | | | 2014 | |
| | | | | | |
Net asset value — Beginning of period | | $ | 9.000 | | | $ | 9.460 | | | $ | 9.390 | | | $ | 9.060 | | | $ | 9.880 | | | $ | 9.610 | |
| | | | | | |
| Income (Loss) From Operations | | | | | | | | | | | | | | | | | | | | | | | | |
| | | | | | |
Net investment income(1) | | $ | 0.299 | | | $ | 0.725 | | | $ | 0.625 | | | $ | 0.591 | | | $ | 0.546 | | | $ | 0.452 | |
| | | | | | |
Net realized and unrealized gain (loss) | | | (0.223 | ) | | | (0.431 | ) | | | 0.230 | | | | (0.119 | )(2) | | | (1.005 | ) | | | 0.169 | |
| | | | | | |
Total income (loss) from operations | | $ | 0.076 | | | $ | 0.294 | | | $ | 0.855 | | | $ | 0.472 | | | $ | (0.459 | ) | | $ | 0.621 | |
| | | | | | |
| Less Distributions | | | | | | | | | | | | | | | | | | | | | | | | |
| | | | | | |
From net investment income | | $ | (0.336 | ) | | $ | (0.670 | ) | | $ | (0.785 | ) | | $ | (0.142 | ) | | $ | (0.361 | ) | | $ | (0.329 | ) |
| | | | | | |
From net realized gain | | | — | | | | — | | | | — | | | | — | | | | — | | | | (0.022 | ) |
| | | | | | |
Tax return of capital | | | — | | | | (0.084 | ) | | | — | | | | — | | | | — | | | | — | |
| | | | | | |
Total distributions | | $ | (0.336 | ) | | $ | (0.754 | ) | | $ | (0.785 | ) | | $ | (0.142 | ) | | $ | (0.361 | ) | | $ | (0.351 | ) |
| | | | | | |
Net asset value — End of period | | $ | 8.740 | | | $ | 9.000 | | | $ | 9.460 | | | $ | 9.390 | | | $ | 9.060 | | | $ | 9.880 | |
| | | | | | |
Total Return(3)(4) | | | 0.97 | %(5) | | | 3.02 | % | | | 9.57 | % | | | 5.37 | % | | | (4.55 | )% | | | 6.64 | % |
| | | | | | |
| Ratios/Supplemental Data | | | | | | | | | | | | | | | | | | | | | | | | |
| | | | | | |
Net assets, end of period (000’s omitted) | | $ | 75,851 | | | $ | 74,277 | | | $ | 70,985 | | | $ | 64,407 | | | $ | 48,141 | | | $ | 50,478 | |
| | | | | | |
Ratios (as a percentage of average daily net assets): | | | | | | | | | | | | | | | | | | | | | | | | |
| | | | | | |
Expenses(4)(6) | | | 0.85 | %(7) | | | 0.85 | % | | | 0.86 | %(8) | | | 0.85 | % | | | 0.85 | % | | | 0.85 | % |
| | | | | | |
Net investment income | | | 6.88 | %(7) | | | 7.64 | % | | | 6.65 | % | | | 6.68 | % | | | 5.82 | % | | | 4.66 | % |
| | | | | | |
Portfolio Turnover | | | 24 | %(5) | | | 80 | % | | | 70 | % | | | 85 | % | | | 74 | % | | | 90 | % |
| (1) | Computed using average shares outstanding. |
| (2) | The per share amount is not in accord with the net realized and unrealized gain (loss) on investments for the period because of the timing of sales of Fund shares and the amount of the per share realized and unrealized gains and losses at such time. |
| (3) | Returns are historical and are calculated by determining the percentage change in net asset value with all distributions reinvested. |
| (4) | The investment adviser and administrator reimbursed certain operating expenses (equal to 0.27%, 0.29%, 0.34%, 0.49%, 0.43% and 1.01% of average daily net assets for the six months ended January 31, 2019 and the years ended July 31, 2018, 2017, 2016, 2015 and 2014, respectively). Absent this reimbursement, total return would be lower. |
| (6) | Excludes the effect of custody fee credits, if any, of less than 0.005%. Effective September 1, 2015, custody fee credits, which were earned on cash deposit balances, were discontinued by the custodian. |
| (8) | Includes interest expense of 0.01% for the year ended July 31, 2017. |
| | | | |
| | 23 | | See Notes to Financial Statements. |
Eaton Vance
Emerging Markets Debt Opportunities Fund
January 31, 2019
Notes to Financial Statements (Unaudited)
1 Significant Accounting Policies
Eaton Vance Emerging Markets Debt Opportunities Fund (the Fund) is anon-diversified series of Eaton Vance Series Fund, Inc. (the Corporation). The Corporation is a Maryland corporation registered under the Investment Company Act of 1940, as amended (the 1940 Act), as anopen-end management investment company. The Fund’s investment objective is total return. Effective September 3, 2015, the Fund designated its existing shares as Class R6 and established two new classes of shares named Class A and Class I. Class A shares are generally sold subject to a sales charge imposed at time of purchase. Class I and Class R6 shares are sold at net asset value and are not subject to a sales charge. Each class represents apro-rata interest in the Fund, but votes separately on class-specific matters and (as noted below) is subject to different expenses. Realized and unrealized gains and losses and net investment income and losses, other than class-specific expenses, are allocated daily to each class of shares based on the relative net assets of each class to the total net assets of the Fund.Sub-accounting, recordkeeping and similar administrative fees payable to financial intermediaries, which are a component of transfer and dividend disbursing agent fees on the Statement of Operations, are not allocated to Class R6 shares. Each class of shares differs in its distribution plan and certain other class-specific expenses.
The following is a summary of significant accounting policies of the Fund. The policies are in conformity with accounting principles generally accepted in the United States of America (U.S. GAAP). The Fund is an investment company and follows accounting and reporting guidance in the Financial Accounting Standards Board (FASB) Accounting Standards Codification Topic 946.
A Investment Valuation — The following methodologies are used to determine the market value or fair value of investments.
Debt Obligations.Debt obligations are generally valued on the basis of valuations provided by third party pricing services, as derived from such services’ pricing models. Inputs to the models may include, but are not limited to, reported trades, executable bid and ask prices, broker/dealer quotations, prices or yields of securities with similar characteristics, interest rates, anticipated prepayments, benchmark curves or information pertaining to the issuer, as well as industry and economic events. The pricing services may use a matrix approach, which considers information regarding securities with similar characteristics to determine the valuation for a security. Short-term debt obligations purchased with a remaining maturity of sixty days or less for which a valuation from a third party pricing service is not readily available may be valued at amortized cost, which approximates fair value.
Derivatives. Financial futures contracts are valued at the closing settlement price established by the board of trade or exchange on which they are traded. Forward foreign currency exchange contracts are generally valued at the mean of the average bid and average ask prices that are reported by currency dealers to a third party pricing service at the valuation time. Such third party pricing service valuations are supplied for specific settlement periods and the Fund’s forward foreign currency exchange contracts are valued at an interpolated rate between the closest preceding and subsequent settlement period reported by the third party pricing service.Non-deliverable bond forward contracts are generally valued based on the current price of the underlying bond as provided by a third party pricing service and current interest rates. Swaps are normally valued using valuations provided by a third party pricing service. Such pricing service valuations are based on the present value of fixed and projected floating rate cash flows over the term of the swap contract, and in the case of credit default swaps, based on credit spread quotations obtained from broker/dealers and expected default recovery rates determined by the pricing service using proprietary models. Future cash flows on swaps are discounted to their present value using swap rates provided by electronic data services or by broker/dealers.
Foreign Securities and Currencies.Foreign securities and currencies are valued in U.S. dollars, based on foreign currency exchange rate quotations supplied by a third party pricing service. The pricing service uses a proprietary model to determine the exchange rate. Inputs to the model include reported trades and implied bid/ask spreads.
Affiliated Fund.The Fund may invest in Eaton Vance Cash Reserves Fund, LLC (Cash Reserves Fund), an affiliated investment company managed by Eaton Vance Management (EVM). While Cash Reserves Fund is not a registered money market mutual fund, it conducts all of its investment activities in accordance with the requirements of Rule2a-7 under the 1940 Act. Investments in Cash Reserves Fund are valued at the closing net asset value per unit on the valuation day. Cash Reserves Fund generally values its investment securities based on available market quotations provided by a third party pricing service.
Fair Valuation.Investments for which valuations or market quotations are not readily available or are deemed unreliable are valued at fair value using methods determined in good faith by or at the direction of the Trustees of the Fund in a manner that fairly reflects the security’s value, or the amount that the Fund might reasonably expect to receive for the security upon its current sale in the ordinary course. Each such determination is based on a consideration of relevant factors, which are likely to vary from one pricing context to another. These factors may include, but are not limited to, the type of security, the existence of any contractual restrictions on the security’s disposition, the price and extent of public trading in similar securities of the issuer or of comparable companies or entities, quotations or relevant information obtained from broker/dealers or other market participants, information obtained from the issuer, analysts, and/or the appropriate stock exchange (for exchange-traded securities), an analysis of the company’s or entity’s financial condition, and an evaluation of the forces that influence the issuer and the market(s) in which the security is purchased and sold.
B Investment Transactions — Investment transactions for financial statement purposes are accounted for on a trade date basis. Realized gains and losses on investments sold are determined on the basis of identified cost.
C Income — Interest income is recorded on the basis of interest accrued, adjusted for amortization of premium or accretion of discount. Inflation adjustments to the principal amount of inflation-adjusted bonds and notes are reflected as interest income. Dividend income is recorded on theex-dividend date for dividends received in cash and/or securities. Withholding taxes on foreign interest and capital gains have been provided for in accordance with the Fund’s understanding of the applicable countries’ tax rules and rates.
Eaton Vance
Emerging Markets Debt Opportunities Fund
January 31, 2019
Notes to Financial Statements (Unaudited) — continued
D Federal and Other Taxes — The Fund’s policy is to comply with the provisions of the Internal Revenue Code applicable to regulated investment companies and to distribute to shareholders each year substantially all of its net investment income, and all or substantially all of its net realized capital gains. Accordingly, no provision for federal income or excise tax is necessary.
In addition to the requirements of the Internal Revenue Code, the Fund may also be subject to local taxes on the recognition of capital gains in certain countries. In determining the daily net asset value, the Fund estimates the accrual for such taxes, if any, based on the unrealized appreciation on certain portfolio securities and the related tax rates. Taxes attributable to unrealized appreciation are included in the change in unrealized appreciation (depreciation) on investments. Capital gains taxes on securities sold are included in net realized gain (loss) on investments.
As of January 31, 2019, the Fund had no uncertain tax positions that would require financial statement recognition,de-recognition, or disclosure. The Fund files a U.S. federal income tax return annually after its fiscalyear-end, which is subject to examination by the Internal Revenue Service for a period of three years from the date of filing.
E Foreign Currency Translation — Investment valuations, other assets, and liabilities initially expressed in foreign currencies are translated each business day into U.S. dollars based upon current exchange rates. Purchases and sales of foreign investment securities and income and expenses denominated in foreign currencies are translated into U.S. dollars based upon currency exchange rates in effect on the respective dates of such transactions. Recognized gains or losses on investment transactions attributable to changes in foreign currency exchange rates are recorded for financial statement purposes as net realized gains and losses on investments. That portion of unrealized gains and losses on investments that results from fluctuations in foreign currency exchange rates is not separately disclosed.
F Unfunded Loan Commitments — The Fund may enter into certain loan agreements all or a portion of which may be unfunded. The Fund is obligated to fund these commitments at the borrower’s discretion. These commitments, if any, are disclosed in the accompanying Portfolio of Investments.
G Use of Estimates — The preparation of the financial statements in conformity with U.S. GAAP requires management to make estimates and assumptions that affect the reported amounts of assets and liabilities at the date of the financial statements and the reported amounts of income and expense during the reporting period. Actual results could differ from those estimates.
H Indemnifications — The Corporation’s Articles of Incorporation provide that no Director or officer of the Corporation shall be liable, to the fullest extent permitted by Maryland law and the 1940 Act, to the Corporation or to its shareholders for money damages. Additionally, in the normal course of business, the Fund enters into agreements with service providers that may contain indemnification clauses. The Fund’s maximum exposure under these arrangements is unknown as this would involve future claims that may be made against the Fund that have not yet occurred.
I Financial Futures Contracts — Upon entering into a financial futures contract, the Fund is required to deposit with the broker, either in cash or securities, an amount equal to a certain percentage of the contract amount (initial margin). Subsequent payments, known as variation margin, are made or received by the Fund each business day, depending on the daily fluctuations in the value of the underlying security, and are recorded as unrealized gains or losses by the Fund. Gains (losses) are realized upon the expiration or closing of the financial futures contracts. Should market conditions change unexpectedly, the Fund may not achieve the anticipated benefits of the financial futures contracts and may realize a loss. Futures contracts have minimal counterparty risk as they are exchange traded and the clearinghouse for the exchange is substituted as the counterparty, guaranteeing counterparty performance.
J Forward Foreign Currency Exchange andNon-Deliverable Bond Forward Contracts — The Fund may enter into forward foreign currency exchange contracts for the purchase or sale of a specific foreign currency at a fixed price on a future date. The forward foreign currency exchange contracts are adjusted by the daily exchange rate of the underlying currency and any gains or losses are recorded as unrealized until such time as the contracts have been closed. The Fund may also enter intonon-deliverable bond forward contracts for the purchase or sale of a bond denominated in anon-deliverable foreign currency at a fixed price on a future date. Fornon-deliverable bond forward contracts, unrealized gains and losses, based on changes in the value of the contract, and realized gains and losses are accounted for as described above. Risks may arise upon entering these contracts from the potential inability of counterparties to meet the terms of their contracts and, in the case of forward foreign currency exchange contracts, from movements in the value of a foreign currency relative to the U.S. dollar.
K Interest Rate Swaps — Swap contracts are privately negotiated agreements between the Fund and a counterparty. Certain swap contracts may be centrally cleared (“centrally cleared swaps”), whereby all payments made or received by the Fund pursuant to the contract are with a central clearing party (CCP) rather than the original counterparty. The CCP guarantees the performance of the original parties to the contract. Upon entering into centrally cleared swaps, the Fund is required to deposit with the CCP, either in cash or securities, an amount of initial margin determined by the CCP, which is subject to adjustment.
Pursuant to interest rate swap agreements, the Fund either makes floating-rate payments to the counterparty (or CCP in the case of centrally cleared swaps) based on a benchmark interest rate in exchange for fixed-rate payments or the Fund makes fixed-rate payments to the counterparty (or CCP in the case of a centrally cleared swap) in exchange for payments on a floating benchmark interest rate. Payments received or made, including amortization of upfront payments/receipts, are recorded as realized gains or losses. During the term of the outstanding swap agreement, changes in the underlying value of the swap are recorded as unrealized gains or losses. For centrally cleared swaps, the daily change in valuation is recorded as a receivable or payable for variation margin and settled in cash with the CCP daily. The value of the swap is determined by changes in the relationship between two rates of interest.
Eaton Vance
Emerging Markets Debt Opportunities Fund
January 31, 2019
Notes to Financial Statements (Unaudited) — continued
The Fund is exposed to credit loss in the event ofnon-performance by the swap counterparty. In the case of centrally cleared swaps, counterparty risk is minimal due to protections provided by the CCP. Risk may also arise from movements in interest rates.
L Credit Default Swaps — When the Fund is the buyer of a credit default swap contract, the Fund is entitled to receive the par (or other agreed-upon) value of a referenced debt obligation (or basket of debt obligations) from the counterparty (or CCP in the case of a centrally cleared swap) to the contract if a credit event by a third party, such as a U.S. or foreign corporate issuer or sovereign issuer, on the debt obligation occurs. In return, the Fund pays the counterparty a periodic stream of payments over the term of the contract provided that no credit event has occurred. If no credit event occurs, the Fund would have spent the stream of payments and received no proceeds from the contract. When the Fund is the seller of a credit default swap contract, it receives the stream of payments, but is obligated to pay to the buyer of the protection an amount up to the notional amount of the swap and in certain instances take delivery of securities of the reference entity upon the occurrence of a credit event, as defined under the terms of that particular swap agreement. Credit events are contract specific but may include bankruptcy, failure to pay, restructuring, obligation acceleration and repudiation/moratorium. If the Fund is a seller of protection and a credit event occurs, the maximum potential amount of future payments that the Fund could be required to make would be an amount equal to the notional amount of the agreement. This potential amount would be partially offset by any recovery value of the respective referenced obligation, or net amount received from the settlement of a buy protection credit default swap agreement entered into by the Fund for the same referenced obligation. As the seller, the Fund may create economic leverage to its portfolio because, in addition to its total net assets, the Fund is subject to investment exposure on the notional amount of the swap. The interest fee paid or received on the swap contract, which is based on a specified interest rate on a fixed notional amount, is accrued daily as a component of unrealized appreciation (depreciation) and is recorded as realized gain upon receipt or realized loss upon payment. The Fund also records an increase or decrease to unrealized appreciation (depreciation) in an amount equal to the daily valuation. For centrally cleared swaps, the daily change in valuation is recorded as a receivable or payable for variation margin and settled in cash with the CCP daily. All upfront payments and receipts, if any, are amortized over the life of the swap contract as realized gains or losses. Those upfront payments or receipts fornon-centrally cleared swaps are recorded as other assets or other liabilities, respectively, net of amortization. For financial reporting purposes, unamortized upfront payments or receipts, if any, are netted with unrealized appreciation or depreciation on swap contracts to determine the market value of swaps as presented in Notes 8 and 11. The Fund segregates assets in the form of cash or liquid securities in an amount equal to the notional amount of the credit default swaps of which it is the seller. The Fund segregates assets in the form of cash or liquid securities in an amount equal to any unrealized depreciation of the credit default swaps of which it is the buyer,marked-to-market on a daily basis. These transactions involve certain risks, including the risk that the seller may be unable to fulfill the transaction. In the case of centrally cleared swaps, counterparty risk is minimal due to protections provided by the CCP.
M Interim Financial Statements — The interim financial statements relating to January 31, 2019 and for the six months then ended have not been audited by an independent registered public accounting firm, but in the opinion of the Fund’s management, reflect all adjustments, consisting only of normal recurring adjustments, necessary for the fair presentation of the financial statements.
2 Distributions to Shareholders and Income Tax Information
It is the present policy of the Fund to make monthly distributions of all or substantially all of its net investment income and to distribute annually all or substantially all of its net realized capital gains. Distributions to shareholders are recorded on theex-dividend date. Distributions are declared separately for each class of shares. Shareholders may reinvest income and capital gain distributions in additional shares of the same class of the Fund at the net asset value as of theex-dividend date or, at the election of the shareholder, receive distributions in cash. Distributions to shareholders are determined in accordance with income tax regulations, which may differ from U.S. GAAP. As required by U.S. GAAP, only distributions in excess of tax basis earnings and profits are reported in the financial statements as a return of capital. Permanent differences between book and tax accounting relating to distributions are reclassified topaid-in capital. For tax purposes, distributions from short-term capital gains are considered to be from ordinary income.
At July 31, 2018, the Fund had a late year ordinary loss of $4,336,821 which it has elected to defer to the following taxable year pursuant to income tax regulations. Late year ordinary losses represent certain specified losses realized in that portion of a taxable year after October 31 that are treated as ordinary for tax purposes plus ordinary losses attributable to that portion of a taxable year after December 31.
The cost and unrealized appreciation (depreciation) of investments, including open derivative contracts, of the Fund at January 31, 2019, as determined on a federal income tax basis, were as follows:
| | | | |
| |
Aggregate cost | | $ | 124,335,835 | |
| |
Gross unrealized appreciation | | $ | 5,561,230 | |
| |
Gross unrealized depreciation | | | (4,021,020 | ) |
| |
Net unrealized appreciation | | $ | 1,540,210 | |
Eaton Vance
Emerging Markets Debt Opportunities Fund
January 31, 2019
Notes to Financial Statements (Unaudited) — continued
3 Investment Adviser and Administration Fee and Other Transactions with Affiliates
The investment adviser and administration fee is earned by EVM as compensation for investment advisory and administrative services rendered to the Fund. The fee is computed at an annual rate of 0.65% of the Fund’s average daily net assets up to $500 million and is payable monthly. On net assets of $500 million and over, the annual fee is reduced. For the six months ended January 31, 2019, the investment adviser and administration fee amounted to $395,587 or 0.65% (annualized) of the Fund’s average daily net assets. The Fund invests its cash in Cash Reserves Fund. EVM does not currently receive a fee for advisory services provided to Cash Reserves Fund.
EVM has agreed to reimburse the Fund’s expenses to the extent that total annual operating expenses (relating to ordinary operating expenses only) exceed 1.15%, 0.90% and 0.85% of the Fund’s average daily net assets for Class A, Class I and Class R6, respectively. This agreement may be changed or terminated after November 30, 2019. Pursuant to this agreement, EVM was allocated $163,207 of the Fund’s operating expenses for the six months ended January 31, 2019.
EVM providessub-transfer agency and related services to the Fund pursuant to aSub-Transfer Agency Support Services Agreement. For the six months ended January 31, 2019, EVM earned $628 from the Fund pursuant to such agreement, which is included in transfer and dividend disbursing agent fees on the Statement of Operations. The Fund was informed that Eaton Vance Distributors, Inc. (EVD), an affiliate of EVM and the Fund’s principal underwriter, received $484 as its portion of the sales charge on sales of Class A shares for the six months ended January 31, 2019. EVD also received distribution and service fees from Class A shares (see Note 4).
Directors and officers of the Fund who are members of EVM’s organization receive remuneration for their services to the Fund out of the investment adviser and administration fee. Directors of the Fund who are not affiliated with EVM may elect to defer receipt of all or a percentage of their annual fees in accordance with the terms of the Directors Deferred Compensation Plan. For the six months ended January 31, 2019, no significant amounts have been deferred. Certain officers and Directors of the Fund are officers of EVM.
4 Distribution Plan
The Fund has in effect a distribution plan for Class A shares (Class A Plan) pursuant to Rule12b-1 under the 1940 Act. Pursuant to the Class A Plan, the Fund pays EVD a distribution and service fee of 0.25% per annum of its average daily net assets attributable to Class A shares for distribution services and facilities provided to the Fund by EVD, as well as for personal services and/or the maintenance of shareholder accounts. Distribution and service fees paid or accrued to EVD for the six months ended January 31, 2019 amounted to $7,491 for Class A shares.
Distribution and service fees are subject to the limitations contained in the Financial Industry Regulatory Authority Rule 2341(d).
5 Contingent Deferred Sales Charges
Class A shares may be subject to a 1% contingent deferred sales charge (CDSC) if redeemed within 18 months of purchase (depending on the circumstances of purchase). Generally, the CDSC is based upon the lower of the net asset value at date of redemption or date of purchase. No charge is levied on shares acquired by reinvestment of dividends or capital gain distributions. For the six months ended January 31, 2019, the Fund was informed that EVD received no CDSCs paid by Class A shareholders.
6 Purchases and Sales of Investments
Purchases and sales of investments, other than short-term obligations and including paydowns, aggregated $49,394,831 and $18,081,700, respectively, for the six months ended January 31, 2019.
Eaton Vance
Emerging Markets Debt Opportunities Fund
January 31, 2019
Notes to Financial Statements (Unaudited) — continued
7 Common Shares
The Corporation’s Articles of Incorporation permit the Directors to issue one billion full and fractional common shares of the Fund ($0.001 par value per share). The Corporation’s authorized shares are subdivided into 300 million shares for each of Class A, Class I and Class R6 and 100 million shares for Class C, which has not commenced operations. Transactions in Fund shares were as follows:
| | | | | | | | |
| Class A | | Six Months Ended
January 31, 2019
(Unaudited) | | | Year Ended
July 31, 2018 | |
| | |
Sales | | | 330,503 | | | | 968,809 | |
| | |
Issued to shareholders electing to receive payments of distributions in Fund shares | | | 24,184 | | | | 17,293 | |
| | |
Redemptions | | | (137,868 | ) | | | (483,551 | ) |
| | |
Net increase | | | 216,819 | | | | 502,551 | |
| | |
| Class I | | Six Months Ended
January 31, 2019
(Unaudited) | | | Year Ended
July 31, 2018 | |
| | |
Sales | | | 3,564,665 | | | | 5,059,206 | |
| | |
Issued to shareholders electing to receive payments of distributions in Fund shares | | | 192,615 | | | | 155,112 | |
| | |
Redemptions | | | (2,520,459 | ) | | | (1,036,263 | ) |
| | |
Net increase | | | 1,236,821 | | | | 4,178,055 | |
| | |
| Class R6 | | Six Months Ended
January 31, 2019
(Unaudited) | | | Year Ended
July 31, 2018 | |
| | |
Sales | | | 287,506 | | | | 349,799 | |
| | |
Issued to shareholders electing to receive payments of distributions in Fund shares | | | 328,713 | | | | 587,052 | |
| | |
Redemptions | | | (189,540 | ) | | | (190,805 | ) |
| | |
Net increase | | | 426,679 | | | | 746,046 | |
At January 31, 2019, Eaton Vance Short Duration Strategic Income Fund, an Eaton Vance collective investment trust and donor advised funds (established and maintained by a public charity) managed by EVM owned in the aggregate 57.9% of the value of the outstanding shares of the Fund.
8 Financial Instruments
The Fund may trade in financial instruments withoff-balance sheet risk in the normal course of its investing activities. These financial instruments may include forward foreign currency exchange contracts,non-deliverable bond forward contracts, financial futures contracts and swap contracts and may involve, to a varying degree, elements of risk in excess of the amounts recognized for financial statement purposes. The notional or contractual amounts of these instruments represent the investment the Fund has in particular classes of financial instruments and do not necessarily represent the amounts potentially subject to risk. The measurement of the risks associated with these instruments is meaningful only when all related and offsetting transactions are considered. A summary of obligations under these financial instruments at January 31, 2019 is included in the Portfolio of Investments. At January 31, 2019, the Fund had sufficient cash and/or securities to cover commitments under these contracts.
In the normal course of pursuing its investment objective, the Fund is subject to the following risks:
Credit Risk: The Fund enters into credit default swap contracts to enhance total return and/or as a substitute for the purchase or sale of securities.
Foreign Exchange Risk: The Fund engages in forward foreign currency exchange contracts to enhance total return, to seek to hedge against fluctuations in currency exchange rates and/or as a substitute for the purchase or sale of securities or currencies.
Eaton Vance
Emerging Markets Debt Opportunities Fund
January 31, 2019
Notes to Financial Statements (Unaudited) — continued
Interest Rate Risk: The Fund utilizes various interest rate derivatives includingnon-deliverable bond forward contracts, interest rate futures contracts and interest rate swaps to enhance total return, to seek to hedge against fluctuations in interest rates, and/or to change the effective duration of its portfolio.
The Fund enters intoover-the-counter (OTC) derivatives that may contain provisions whereby the counterparty may terminate the contract under certain conditions, including but not limited to a decline in the Fund’s net assets below a certain level over a certain period of time, which would trigger a payment by the Fund for those derivatives in a liability position. At January 31, 2019, the fair value of derivatives with credit-related contingent features in a net liability position was $2,252,123. The aggregate fair value of assets pledged as collateral by the Fund for such liability was $1,126,538 at January 31, 2019.
The OTC derivatives in which the Fund invests are subject to the risk that the counterparty to the contract fails to perform its obligations under the contract. To mitigate this risk, the Fund has entered into an International Swaps and Derivatives Association, Inc. Master Agreement (“ISDA Master Agreement”) or similar agreement with substantially all its derivative counterparties. An ISDA Master Agreement is a bilateral agreement between the Fund and a counterparty that governs certain OTC derivatives and typically contains, among other things,set-off provisions in the event of a default and/or termination event as defined under the relevant ISDA Master Agreement. Under an ISDA Master Agreement, the Fund may, under certain circumstances, offset with the counterparty certain derivative financial instruments’ payables and/or receivables with collateral held and/or posted and create one single net payment. The provisions of the ISDA Master Agreement typically permit a single net payment in the event of default including the bankruptcy or insolvency of the counterparty. However, bankruptcy or insolvency laws of a particular jurisdiction may impose restrictions on or prohibitions against the right of offset in bankruptcy or insolvency. Certain ISDA Master Agreements allow counterparties to OTC derivatives to terminate derivative contracts prior to maturity in the event the Fund’s net assets decline by a stated percentage or the Fund fails to meet the terms of its ISDA Master Agreements, which would cause the counterparty to accelerate payment by the Fund of any net liability owed to it.
The collateral requirements for derivatives traded under an ISDA Master Agreement are governed by a Credit Support Annex to the ISDA Master Agreement. Collateral requirements are determined at the close of business each day and are typically based on changes in market values for each transaction under an ISDA Master Agreement and netted into one amount for such agreement. Generally, the amount of collateral due from or to a counterparty is subject to a minimum transfer threshold amount before a transfer is required, which may vary by counterparty. Collateral pledged for the benefit of the Fund and/or counterparty is held in segregated accounts by the Fund’s custodian and cannot be sold,re-pledged, assigned or otherwise used while pledged. The portion of such collateral representing cash, if any, is reflected as deposits for derivatives collateral and, in the case of cash pledged by a counterparty for the benefit of the Fund, a corresponding liability on the Statement of Assets and Liabilities. Securities pledged by the Fund as collateral, if any, are identified as such in the Portfolio of Investments.
The fair value of open derivative instruments (not considered to be hedging instruments for accounting disclosure purposes) by risk exposure at January 31, 2019 was as follows:
| | | | | | | | | | | | | | | | |
| | | Fair Value | |
| Statement of Assets and Liabilities Caption | | Credit | | | Foreign
Exchange | | | Interest Rate | | | Total | |
| | | | |
Not applicable | | $ | — | | | $ | — | | | $ | 217,514 | * | | $ | 217,514 | |
| | | | |
Receivable for open forward foreign currency exchange contracts | | | — | | | | 2,569,674 | | | | — | | | | 2,569,674 | |
| | | | |
Receivable/Payable for open swap contracts; Upfront receipts on opennon-centrally cleared swap contracts | | | — | | | | — | | | | 9,245 | | | | 9,245 | |
| | | | |
Receivable for opennon-deliverable bond forward contracts | | | | | | | | | | | 24,016 | | | | 24,016 | |
| | | | |
Total Asset Derivatives | | $ | — | | | $ | 2,569,674 | | | $ | 250,775 | | | $ | 2,820,449 | |
| | | | |
Derivatives not subject to master netting or similar agreements | | $ | — | | | $ | — | | | $ | 217,514 | | | $ | 217,514 | |
| | | | |
Total Asset Derivatives subject to master netting or similar agreements | | $ | — | | | $ | 2,569,674 | | | $ | 33,261 | | | $ | 2,602,935 | |
Eaton Vance
Emerging Markets Debt Opportunities Fund
January 31, 2019
Notes to Financial Statements (Unaudited) — continued
| | | | | | | | | | | | | | | | |
| | | Credit | | | Foreign
Exchange | | | Interest Rate | | | Total | |
| | | | |
Not applicable | | $ | (43,817 | )* | | $ | — | | | $ | (1,027,759 | )* | | $ | (1,071,576 | ) |
| | | | |
Payable for open forward foreign currency exchange contracts | | | — | | | | (1,915,082 | ) | | | — | | | | (1,915,082 | ) |
| | | | |
Payable/Receivable for open swap contracts; Upfront receipts on opennon-centrally cleared swap contracts | | | (319,900 | ) | | | — | | | | (17,141 | ) | | | (337,041 | ) |
| | | | |
Total Liability Derivatives | | $ | (363,717 | ) | | $ | (1,915,082 | ) | | $ | (1,044,900 | ) | | $ | (3,323,699 | ) |
| | | | |
Derivatives not subject to master netting or similar agreements | | $ | (43,817 | ) | | $ | — | | | $ | (1,027,759 | ) | | $ | (1,071,576 | ) |
| | | | |
Total Liability Derivatives subject to master netting or similar agreements | | $ | (319,900 | ) | | $ | (1,915,082 | ) | | $ | (17,141 | ) | | $ | (2,252,123 | ) |
| * | For futures contracts and centrally cleared swap contracts, amount represents value as shown in the Portfolio of Investments. Only the current day’s variation margin on open futures contracts and centrally cleared swap contracts is reported within the Statement of Assets and Liabilities as Receivable or Payable for variation margin on open financial futures contracts and centrally cleared swap contracts, as applicable. |
The Fund’s derivative assets and liabilities at fair value by risk, which are reported gross in the Statement of Assets and Liabilities, are presented in the table above. The following tables present the Fund’s derivative assets and liabilities by counterparty, net of amounts available for offset under a master netting agreement and net of the related collateral received by the Fund for such assets and pledged by the Fund for such liabilities as of January 31, 2019.
| | | | | | | | | | | | | | | | | | | | |
| Counterparty | | Derivative Assets
Subject to
Master Netting
Agreement | | | Derivatives
Available
for Offset | | | Non-cash
Collateral
Received(a) | | | Cash
Collateral
Received(a) | | | Net Amount
of Derivative
Assets(b) | |
| | | | | |
Bank of America, N.A. | | $ | 376,806 | | | $ | (314,187 | ) | | $ | — | | | $ | — | | | $ | 62,619 | |
| | | | | |
BNP Paribas | | | 14,799 | | | | (10,608 | ) | | | — | | | | — | | | | 4,191 | |
| | | | | |
Credit Agricole Corporate and Investment Bank | | | 92,173 | | | | (3,362 | ) | | | — | | | | — | | | | 88,811 | |
| | | | | |
Deutsche Bank AG | | | 146,019 | | | | (116,245 | ) | | | — | | | | — | | | | 29,774 | |
| | | | | |
Goldman Sachs International | | | 628,724 | | | | (628,724 | ) | | | — | | | | — | | | | — | |
| | | | | |
Standard Chartered Bank | | | 1,220,939 | | | | (1,018,909 | ) | | | — | | | | — | | | | 202,030 | |
| | | | | |
UBS AG | | | 123,475 | | | | (57,266 | ) | | | — | | | | — | | | | 66,209 | |
| | | | | |
| | | $ | 2,602,935 | | | $ | (2,149,301 | ) | | $ | — | | | $ | — | | | $ | 453,634 | |
Eaton Vance
Emerging Markets Debt Opportunities Fund
January 31, 2019
Notes to Financial Statements (Unaudited) — continued
| | | | | | | | | | | | | | | | | | | | |
| Counterparty | | Derivative Liabilities
Subject to
Master Netting
Agreement | | | Derivatives
Available
for Offset | | | Non-cash
Collateral
Pledged(a) | | | Cash
Collateral
Pledged(a) | | | Net Amount of Derivative
Liabilities(c) | |
| | | | | |
Bank of America, N.A. | | $ | (314,187 | ) | | $ | 314,187 | | | $ | — | | | $ | — | | | $ | — | |
| | | | | |
BNP Paribas | | | (10,608 | ) | | | 10,608 | | | | — | | | | — | | | | — | |
| | | | | |
Credit Agricole Corporate and Investment Bank | | | (3,362 | ) | | | 3,362 | | | | — | | | | — | | | | — | |
| | | | | |
Deutsche Bank AG | | | (116,245 | ) | | | 116,245 | | | | — | | | | — | | | | — | |
| | | | | |
Goldman Sachs International | | | (726,064 | ) | | | 628,724 | | | | 97,340 | | | | — | | | | — | |
| | | | | |
ICBC Standard Bank plc | | | (1,249 | ) | | | — | | | | — | | | | — | | | | (1,249 | ) |
| | | | | |
JPMorgan Chase Bank, N.A. | | | (4,233 | ) | | | — | | | | — | | | | — | | | | (4,233 | ) |
| | | | | |
Standard Chartered Bank | | | (1,018,909 | ) | | | 1,018,909 | | | | — | | | | — | | | | — | |
| | | | | |
UBS AG | | | (57,266 | ) | | | 57,266 | | | | — | | | | — | | | | — | |
| | | | | |
| | | $ | (2,252,123 | ) | | $ | 2,149,301 | | | $ | 97,340 | | | $ | — | | | $ | (5,482 | ) |
| (a) | In some instances, the total collateral received and/or pledged may be more than the amount shown due to overcollateralization. |
| (b) | Net amount represents the net amount due from the counterparty in the event of default. |
| (c) | Net amount represents the net amount payable to the counterparty in the event of default. |
The effect of derivative instruments (not considered to be hedging instruments for accounting disclosure purposes) on the Statement of Operations by risk exposure for the six months ended January 31, 2019 was as follows:
| | | | | | | | | | | | |
| Statement of Operations Caption | | Credit | | | Foreign
Exchange | | | Interest Rate | |
| | | |
Net realized gain (loss) — | | | | | | | | | | | | |
| | | |
Financial futures contracts | | $ | — | | | $ | — | | | $ | (29,932 | ) |
| | | |
Swap contracts | | | (114,556 | ) | | | — | | | | (497,244 | ) |
| | | |
Forward foreign currency exchange contracts | | | — | | | | (1,273,762 | ) | | | — | |
| | | |
Non-deliverable bond forward contracts | | | — | | | | — | | | | (13,626 | ) |
| | | |
Total | | $ | (114,556 | ) | | $ | (1,273,762 | ) | | $ | (540,802 | ) |
| | | |
Change in unrealized appreciation (depreciation) — | | | | | | | | | | | | |
| | | |
Financial futures contracts | | $ | — | | | $ | — | | | $ | (55,014 | ) |
| | | |
Swap contracts | | | 120,216 | | | | — | | | | (578,163 | ) |
| | | |
Forward foreign currency exchange contracts | | | — | | | | 908,658 | | | | — | |
| | | |
Non-deliverable bond forward contracts | | | — | | | | — | | | | 24,016 | |
| | | |
Total | | $ | 120,216 | | | $ | 908,658 | | | $ | (609,161 | ) |
Eaton Vance
Emerging Markets Debt Opportunities Fund
January 31, 2019
Notes to Financial Statements (Unaudited) — continued
The average notional cost of futures contracts and average notional amounts of other derivative contracts outstanding during the six months ended January 31, 2019, which are indicative of the volume of these derivative types, were approximately as follows:
| | | | | | | | | | | | | | |
Futures
Contracts — Short | | | Forward
Foreign Currency Exchange Contracts* | | | Non-deliverable
Bond Forward
Contracts | | | Swap Contracts | |
| | | |
| | $2,111,000 | | | $ | 100,694,000 | | | $ | 432,000 | | | $ | 38,454,000 | |
| * | The average notional amount for forward foreign currency exchange contracts is based on the absolute value of notional amounts of currency purchased and currency sold. |
9 Line of Credit
The Fund participates with other portfolios and funds managed by EVM and its affiliates in a $625 million unsecured line of credit agreement with a group of banks, which is in effect through October 29, 2019. Borrowings are made by the Fund solely to facilitate the handling of unusual and/or unanticipated short-term cash requirements. Interest is charged to the Fund based on its borrowings at an amount above either the Eurodollar rate or Federal Funds rate. In addition, a fee computed at an annual rate of 0.15% on the daily unused portion of the line of credit is allocated among the participating portfolios and funds at the end of each quarter. Because the line of credit is not available exclusively to the Fund, it may be unable to borrow some or all of its requested amounts at any particular time. The Fund did not have any significant borrowings or allocated fees during the six months ended January 31, 2019.
10 Risks Associated with Foreign Investments
The Fund’s investments in foreign instruments can be adversely affected by changes in currency exchange rates and political, economic and market developments abroad. In emerging or less developed countries, these risks can be more significant. Investment markets in emerging market countries are typically substantially smaller, less liquid and more volatile than the major markets in developed countries. Emerging market countries may have relatively unstable governments and economies. Emerging market investments often are subject to speculative trading, which typically contributes to volatility.
The Fund may have difficulties enforcing its legal or contractual rights in a foreign country. Economic data as reported by foreign governments and other issuers may be delayed, inaccurate or fraudulent. In the event of a default by a sovereign entity, there are typically no assets to be seized or cash flows to be attached. Furthermore, the willingness or ability of a foreign government to renegotiate defaulted debt may be limited.
11 Fair Value Measurements
Under generally accepted accounting principles for fair value measurements, a three-tier hierarchy to prioritize the assumptions, referred to as inputs, is used in valuation techniques to measure fair value. The three-tier hierarchy of inputs is summarized in the three broad levels listed below.
| • | | Level 1 – quoted prices in active markets for identical investments |
| • | | Level 2 – other significant observable inputs (including quoted prices for similar investments, interest rates, prepayment speeds, credit risk, etc.) |
| • | | Level 3 – significant unobservable inputs (including a fund’s own assumptions in determining the fair value of investments) |
In cases where the inputs used to measure fair value fall in different levels of the fair value hierarchy, the level disclosed is determined based on the lowest level input that is significant to the fair value measurement in its entirety. The inputs or methodology used for valuing securities are not necessarily an indication of the risk associated with investing in those securities.
Eaton Vance
Emerging Markets Debt Opportunities Fund
January 31, 2019
Notes to Financial Statements (Unaudited) — continued
At January 31, 2019, the hierarchy of inputs used in valuing the Fund’s investments and open derivative instruments, which are carried at value, were as follows:
| | | | | | | | | | | | | | | | |
| Asset Description | | Level 1 | | | Level 2 | | | Level 3 | | | Total | |
| | | | |
Foreign Government Bonds | | $ | — | | | $ | 70,361,888 | | | $ | — | | | $ | 70,361,888 | |
| | | | |
Foreign Corporate Bonds | | | — | | | | 14,253,595 | | | | — | | | | 14,253,595 | |
| | | | |
Sovereign Loans | | | — | | | | 4,795,042 | | | | 2,246,732 | | | | 7,041,774 | |
| | | | |
Credit Linked Notes | | | — | | | | 839,965 | | | | — | | | | 839,965 | |
| | | | |
Short-Term Investments — | | | | | | | | | | | | | | | | |
| | | | |
Foreign Government Securities | | | — | | | | 17,871,386 | | | | — | | | | 17,871,386 | |
| | | | |
U.S. Treasury Obligations | | | — | | | | 12,478,540 | | | | — | | | | 12,478,540 | |
| | | | |
Other | | | — | | | | 3,164,723 | | | | — | | | | 3,164,723 | |
| | | | |
Total Investments | | $ | — | | | $ | 123,765,139 | | | $ | 2,246,732 | | | $ | 126,011,871 | |
| | | | |
Forward Foreign Currency Exchange Contracts | | $ | — | | | $ | 2,569,674 | | | $ | — | | | $ | 2,569,674 | |
| | | | |
Non-deliverable Bond Forward Contracts | | | — | | | | 24,016 | | | | — | | | | 24,016 | |
| | | | |
Swap Contracts | | | — | | | | 226,759 | | | | — | | | | 226,759 | |
| | | | |
Total | | $ | — | | | $ | 126,585,588 | | | $ | 2,246,732 | | | $ | 128,832,320 | |
| | |
Liability Description | | | | | | | | | |
| | | | |
Forward Foreign Currency Exchange Contracts | | $ | — | | | $ | (1,915,082 | ) | | $ | — | | | $ | (1,915,082 | ) |
| | | | |
Futures Contracts | | | (55,225 | ) | | | — | | | | — | | | | (55,225 | ) |
| | | | |
Swap Contracts | | | — | | | | (1,353,392 | ) | | | — | | | | (1,353,392 | ) |
| | | | |
Total | | $ | (55,225 | ) | | $ | (3,268,474 | ) | | $ | — | | | $ | (3,323,699 | ) |
Eaton Vance
Emerging Markets Debt Opportunities Fund
January 31, 2019
Special Meeting of Shareholders (Unaudited)
The Fund held a Special Meeting of Shareholders on September 20, 2018 to elect the five Directors listed below. The other Directors named herein continue to serve as Directors. The results of the vote with respect to the Fund were as follows:
| | | | | | | | |
| | | Number of Shares | |
| Nominee for Director | | For | | | Withheld | |
| | |
Mark R. Fetting | | | 11,662,661 | | | | 265,488 | |
| | |
Keith Quinton | | | 11,662,661 | | | | 265,488 | |
| | |
Marcus L. Smith | | | 11,662,661 | | | | 265,488 | |
| | |
Susan J. Sutherland | | | 11,662,661 | | | | 265,488 | |
| | |
Scott E. Wennerholm | | | 11,662,661 | | | | 265,488 | |
Results are rounded to the nearest whole number.
Eaton Vance
Emerging Markets Debt Opportunities Fund
January 31, 2019
Officers and Directors
Officers of Eaton Vance Emerging Markets Debt Opportunities Fund
Payson F. Swaffield
President
Maureen A. Gemma
Vice President, Secretary and
Chief Legal Officer
James F. Kirchner
Treasurer
Richard F. Froio
Chief Compliance Officer
Directors of Eaton Vance Emerging Markets Debt Opportunities Fund
William H. Park
Chairperson
Thomas E. Faust Jr.*
Mark R. Fetting
Cynthia E. Frost
George J. Gorman
Valerie A. Mosley
Helen Frame Peters
Keith Quinton(1)
Marcus L. Smith(1)
Susan J. Sutherland
Scott E. Wennerholm
| (1) | Messrs. Quinton and Smith began serving as Directors effective October 1, 2018. |
Eaton Vance Funds
IMPORTANT NOTICES
Privacy. The Eaton Vance organization is committed to ensuring your financial privacy. Each of the financial institutions identified below has in effect the following policy (“Privacy Policy”) with respect to nonpublic personal information about its customers:
| • | | Only such information received from you, through application forms or otherwise, and information about your Eaton Vance fund transactions will be collected. This may include information such as name, address, social security number, tax status, account balances and transactions. |
| • | | None of such information about you (or former customers) will be disclosed to anyone, except as permitted by law (which includes disclosure to employees necessary to service your account). In the normal course of servicing a customer’s account, Eaton Vance may share information with unaffiliated third parties that perform various required services such as transfer agents, custodians and broker-dealers. |
| • | | Policies and procedures (including physical, electronic and procedural safeguards) are in place that are designed to protect the confidentiality of such information. |
| • | | We reserve the right to change our Privacy Policy at any time upon proper notification to you. Customers may want to review our Privacy Policy periodically for changes by accessing the link on our homepage: www.eatonvance.com. |
Our pledge of privacy applies to the following entities within the Eaton Vance organization: the Eaton Vance Family of Funds, Eaton Vance Management, Eaton Vance Investment Counsel, Eaton Vance Distributors, Inc., Eaton Vance Trust Company, Eaton Vance Management (International) Limited, Eaton Vance Advisers International Ltd., Eaton Vance Management’s Real Estate Investment Group and Boston Management and Research. In addition, our Privacy Policy applies only to those Eaton Vance customers who are individuals and who have a direct relationship with us. If a customer’s account (i.e., fund shares) is held in the name of a third-party financial advisor/broker-dealer, it is likely that only such advisor’s privacy policies apply to the customer. This notice supersedes all previously issued privacy disclosures. For more information about Eaton Vance’s Privacy Policy, please call1-800-262-1122.
Delivery of Shareholder Documents.The Securities and Exchange Commission (SEC) permits funds to deliver only one copy of shareholder documents, including prospectuses, proxy statements and shareholder reports, to fund investors with multiple accounts at the same residential or post office box address. This practice is often called “householding” and it helps eliminate duplicate mailings to shareholders.Eaton Vance, or your financial advisor, may household the mailing of your documents indefinitely unless you instruct Eaton Vance, or your financial advisor, otherwise.If you would prefer that your Eaton Vance documents not be householded, please contact Eaton Vance at1-800-262-1122, or contact your financial advisor. Your instructions that householding not apply to delivery of your Eaton Vance documents will typically be effective within 30 days of receipt by Eaton Vance or your financial advisor.
Portfolio Holdings.Each Eaton Vance Fund and its underlying Portfolio(s) (if applicable) will file a schedule of portfolio holdings on FormN-Q with the SEC for the first and third quarters of each fiscal year. The FormN-Q will be available on the Eaton Vance website at www.eatonvance.com, by calling Eaton Vance at1-800-262-1122 or in the EDGAR database on the SEC’s website at www.sec.gov. FormN-Q may also be reviewed and copied at the SEC’s public reference room in Washington, D.C. (call1-800-732-0330 for information on the operation of the public reference room).
Proxy Voting.From time to time, funds are required to vote proxies related to the securities held by the funds. The Eaton Vance Funds or their underlying Portfolios (if applicable) vote proxies according to a set of policies and procedures approved by the Funds’ and Portfolios’ Boards. You may obtain a description of these policies and procedures and information on how the Funds or Portfolios voted proxies relating to portfolio securities during the most recent12-month period ended June 30, without charge, upon request, by calling1-800-262-1122 and by accessing the SEC’s website at www.sec.gov.
Investment Adviser and Administrator
Eaton Vance Management
Two International Place
Boston, MA 02110
Principal Underwriter*
Eaton Vance Distributors, Inc.
Two International Place
Boston, MA 02110
(617)482-8260
Custodian
State Street Bank and Trust Company
State Street Financial Center, One Lincoln Street
Boston, MA 02111
Transfer Agent
BNY Mellon Investment Servicing (US) Inc.
Attn: Eaton Vance Funds
P.O. Box 9653
Providence, RI 02940-9653
(800)262-1122
Fund Offices
Two International Place
Boston, MA 02110
| * | FINRA BrokerCheck. Investors may check the background of their Investment Professional by contacting the Financial Industry Regulatory Authority (FINRA). FINRA BrokerCheck is a free tool to help investors check the professional background of current and former FINRA-registered securities firms and brokers. FINRA BrokerCheck is available by calling1-800-289-9999 and at www.FINRA.org. The FINRA BrokerCheck brochure describing this program is available to investors at www.FINRA.org. |

14265 1.31.19
Item 2. Code of Ethics
Not required in this filing.
Item 3. Audit Committee Financial Expert
Not required in this filing.
Item 4. Principal Accountant Fees and Services
Not required in this filing.
Item 5. Audit Committee of Listed Registrants
Not applicable.
Item 6. Schedule of Investments
Please see schedule of investments contained in the Report to Stockholders included under Item 1 of this FormN-CSR.
Item 7. Disclosure of Proxy Voting Policies and Procedures forClosed-End Management Investment Companies
Not applicable.
Item 8. Portfolio Managers ofClosed-End Management Investment Companies
Not applicable.
Item 9. Purchases of Equity Securities byClosed-End Management Investment Company and Affiliated Purchasers
Not applicable.
Item 10. Submission of Matters to a Vote of Security Holders
No material changes.
Item 11. Controls and Procedures
(a) It is the conclusion of the registrant’s principal executive officer and principal financial officer that the effectiveness of the registrant’s current disclosure controls and procedures (such disclosure controls and procedures having been evaluated within 90 days of the date of this filing) provide reasonable assurance that the information required to be disclosed by the registrant has been recorded, processed, summarized and reported within the time period specified in the Commission’s rules and forms and that the information required to be disclosed by the registrant has been accumulated and communicated to the registrant’s principal executive officer and principal financial officer in order to allow timely decisions regarding required disclosure.
(b) There have been no changes in the registrant’s internal controls over financial reporting during the second fiscal quarter of the period covered by this report that has materially affected, or is reasonably likely to materially affect, the registrant’s internal control over financial reporting.
Item 12. Disclosure of Securities Lending Activities forClosed-End Management Investment Companies
Not applicable.
Item 13. Exhibits
| (a)(1) | Registrant’s Code of Ethics – Not applicable (please see Item 2). |
| (a)(2)(i) | Treasurer’s Section 302 certification. |
| (a)(2)(ii) | President’s Section 302 certification. |
| (b) | Combined Section 906 certification. |
Signatures
Pursuant to the requirements of the Securities Exchange Act of 1934 and the Investment Company Act of 1940, the registrant has duly caused this report to be signed on its behalf by the undersigned, thereunto duly authorized.
| | |
| Eaton Vance Series Fund, Inc. |
| |
| By: | | /s/ Payson F. Swaffield |
| | Payson F. Swaffield |
| | President |
| |
| Date: | | March 22, 2019 |
Pursuant to the requirements of the Securities Exchange Act of 1934 and the Investment Company Act of 1940, this report has been signed below by the following persons on behalf of the registrant and in the capacities and on the dates indicated.
| | |
| By: | | /s/ James F. Kirchner |
| | James F. Kirchner |
| | Treasurer |
| |
| Date: | | March 22, 2019 |
| |
| By: | | /s/ Payson F. Swaffield |
| | Payson F. Swaffield |
| | President |
| |
| Date: | | March 22, 2019 |