Exhibit 99.1
CNH Industrial Capital ABS SFVegas 2023 Conference Las Vegas, February 26 - March 1, 2023
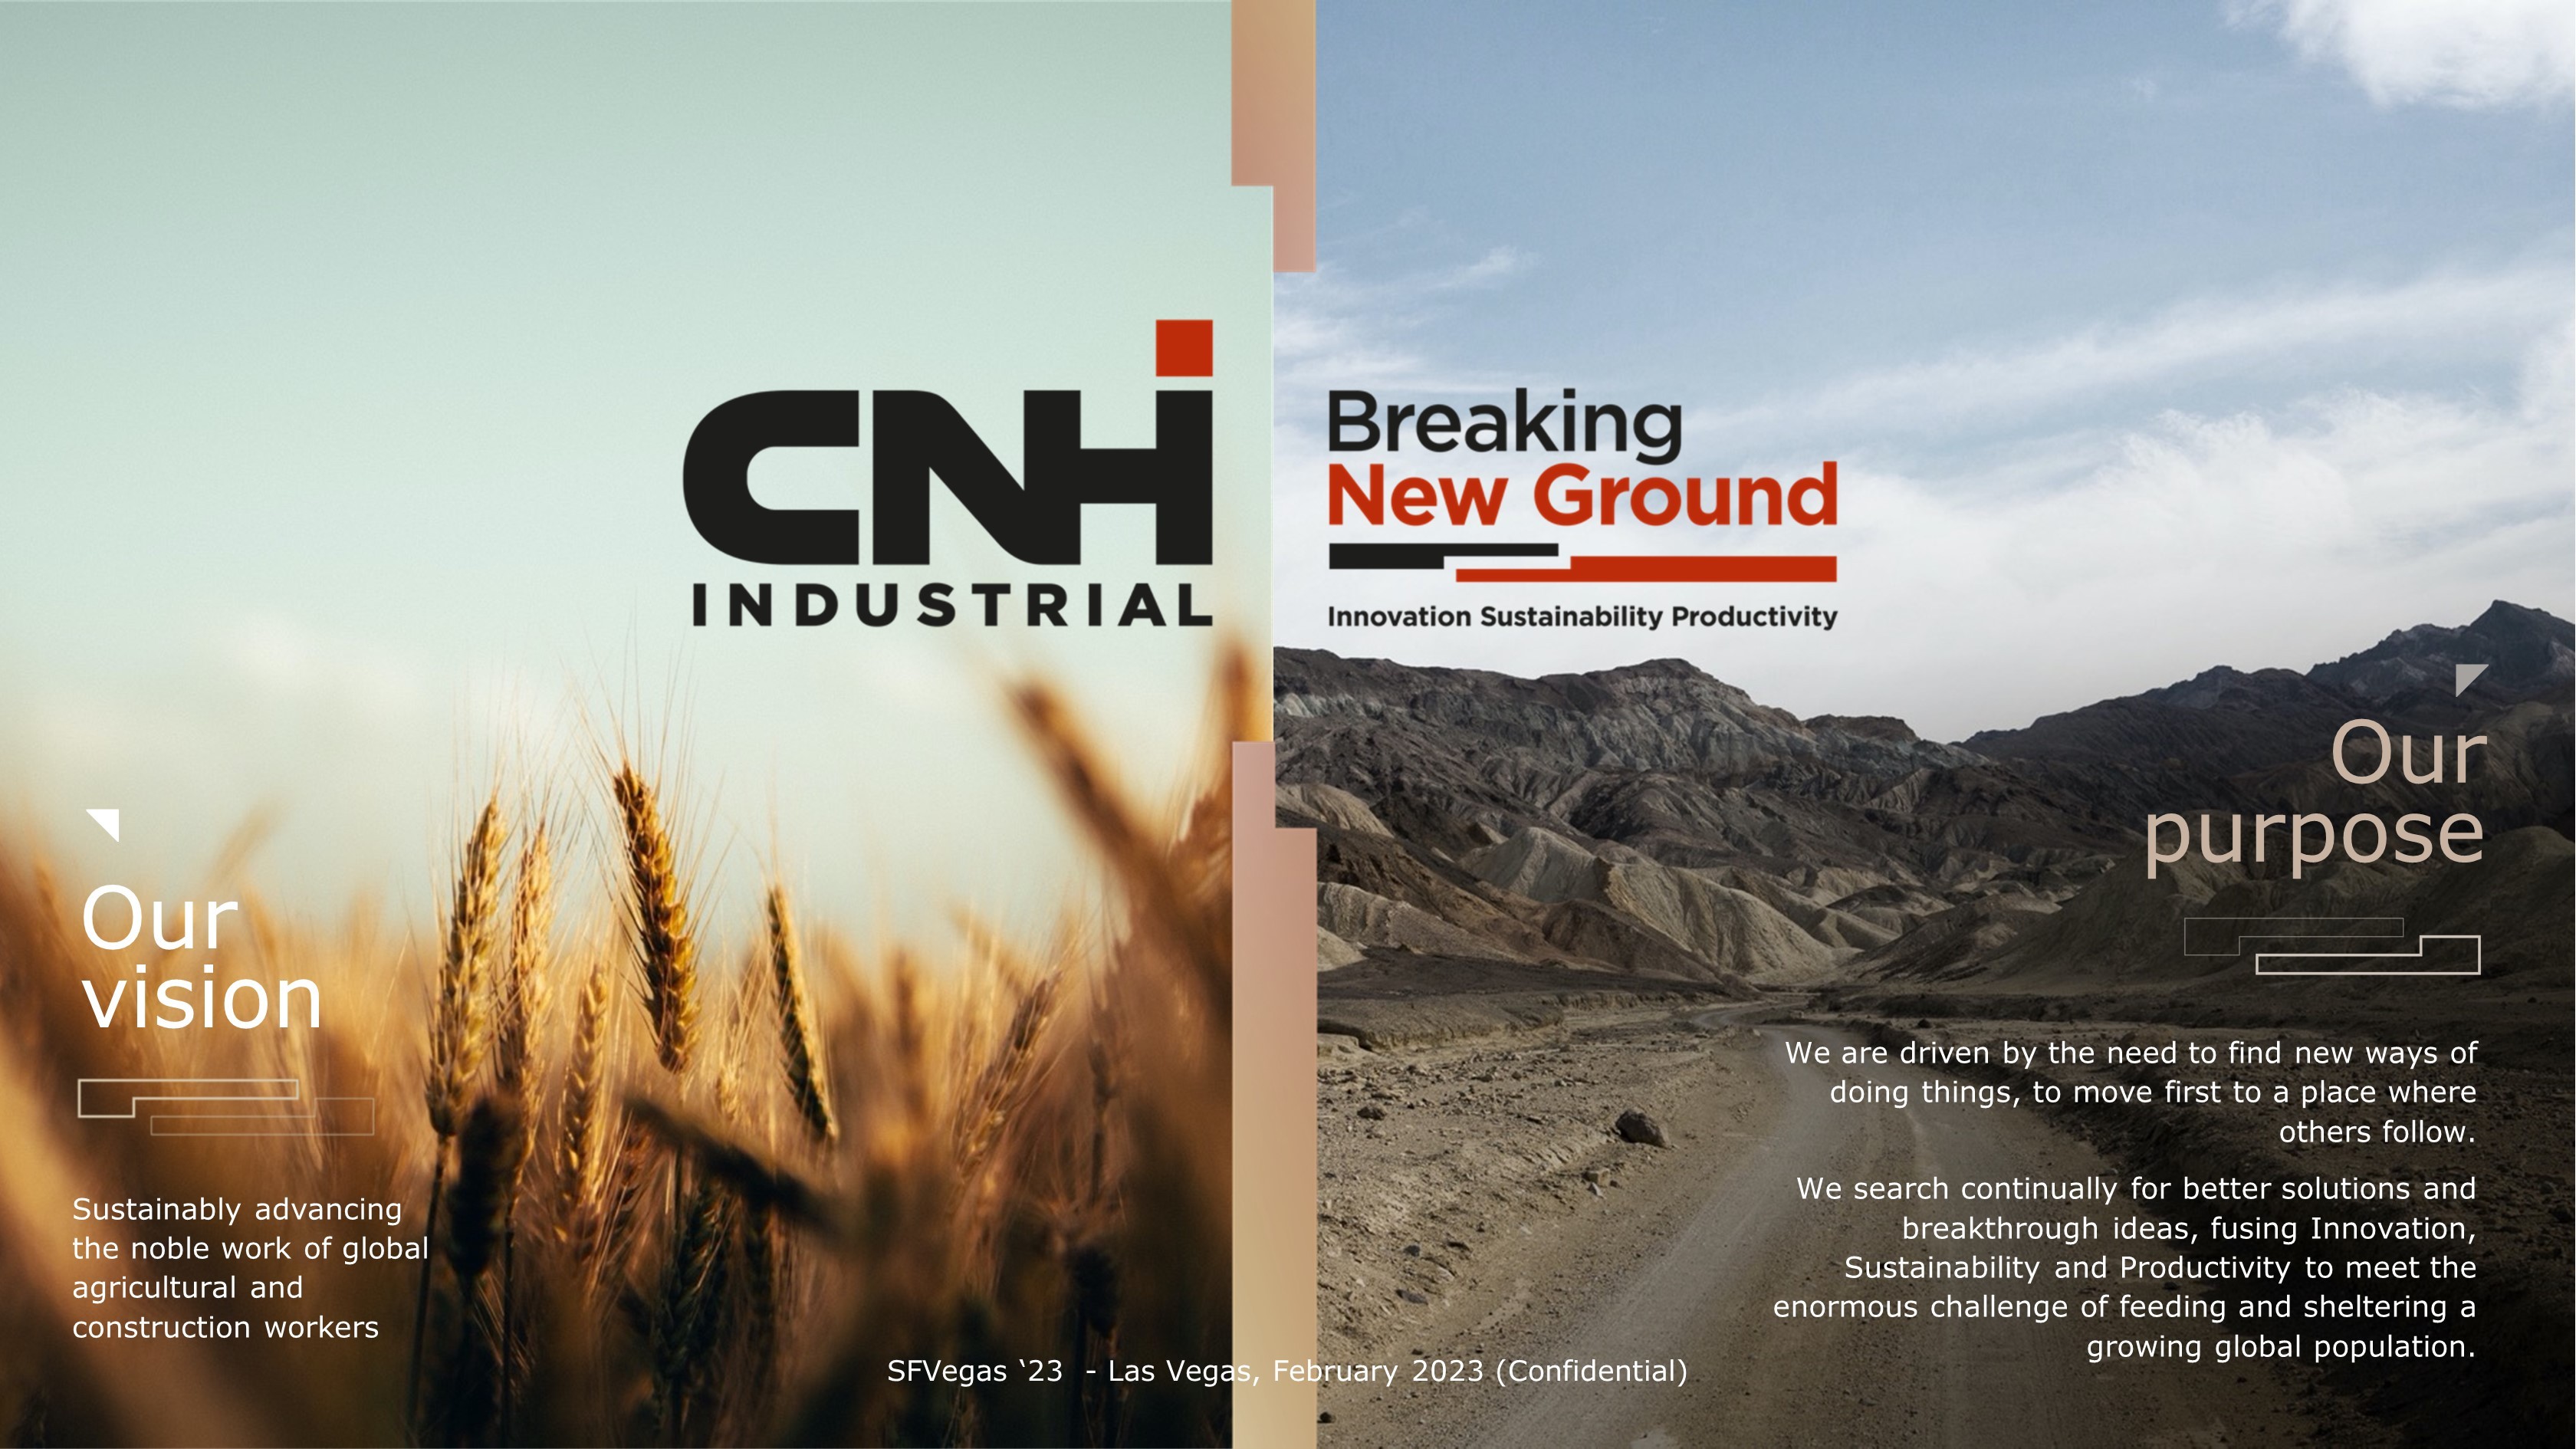
Corporate Presentation 2022 Confidential – July 2022 We are driven by the need to find new ways of doing things, to move first to a place where others follow. We search continually for better solutions and breakthrough ideas, fusing Innovation, Sustainability and Productivity to meet the enormous challenge of feeding and sheltering a growing global population. Our purpose Sustainably advancing the noble work of global agricultural and construction workers Our vision SFVegas ‘23 - Las Vegas, February 2023 (Confidential)
SFVegas ‘23 – Las Vegas, February 2023 (Confidential) Cautionary Note Regarding Forward - Looking Statements All statements other than statements of historical fact contained in this presentation; including competitive strengths; busi nes s strategy; future financial position or operating results; budgets; projections with respect to revenue, income, capital expenditures, dividends, liquidity, capital structure or other financial items; costs; and plans and ob jectives of management regarding operations, products and services, are forward - looking statements. Forward - looking statements also include statements regarding the future performance of CNH Industrial and its subsidiaries on a stand - alone basis. These statements may include terminology such as “may,” “will,” “expect,” “could,” “should,” “intend,” “estimate,” “anticipate,” “believe,” “outlook,” “continue,” “remain,” “on track,” “design,” “tar get ,” “objective,” “goal,” “forecast,” “projection,” “prospects,” “plan,” or similar terminology. Forward - looking statements, including those related to the COVID - 19 pandemic, are not guarantees of future performance. Rather, they are based on current views and assumptions and involve known and unknown risks, uncertainties and other factors, many of which are outside our control and are difficult to predict. If any of these risks an d u ncertainties materialize (or they occur with a degree of severity that the Company is unable to predict) or other assumptions underlying any of the forward - looking statements prove to be incorrect, including any assumptions regarding strategic plans, the actual results or developments may differ materially from any future results or developments expressed or implied by the forward - looking statements. Factors, risks and uncertainties that could cause actual results to differ materially from those contemplated by the forward - loo king statements include, among others: the continued uncertainties related to the unknown duration and economic, operational and financial impacts of the global COVID - 19 pandemic and the actions taken or contemplated by governm ental authorities or others in connection with the pandemic on our business, our employees, customers and suppliers; supply chain disruptions, including delays caused by mandated shutdowns, industry capacity constrain ts, material availability, and global logistics delays and constraints; disruption caused by business responses to COVID - 19, including remote working arrangements, which may create increased vulnerability to cybersecurity or data privacy incidents; our ability to execute business continuity plans as a result of COVID - 19; the many interrelated factors that affect consumer confidence and worldwide demand for capital goods and capital goods - related produ cts, including demand uncertainty caused by COVID - 19; general economic conditions in each of our markets, including the significant economic uncertainty and volatility caused by the war in the Ukraine and COVID - 19; cha nges in government policies regarding banking, monetary and fiscal policy; legislation, particularly pertaining to capital goods - related issues such as agriculture, the environment, debt relief and subsidy program po licies, trade and commerce and infrastructure development; government policies on international trade and investment, including sanctions, import quotas, capital controls and tariffs; volatility in international trade cau sed by the imposition of tariffs, sanctions, embargoes, and trade wars; actions of competitors in the various industries in which CNH Industrial North America competes; development and use of new technologies and technological dif ficulties; the interpretation of, or adoption of new, compliance requirements with respect to engine emissions, safety or other aspects of CNH Industrial’s products; production difficulties, including capacity and suppl y c onstraints and excess inventory levels; labor relations; interest rates and currency exchange rates; inflation and deflation; energy prices; prices for agricultural commodities; housing starts and other construction activity; our ability to obtain financing or to refinance existing debt; restrictive covenants in our debt agreements; actions by rating agencies concerning the ratings on our debt and asset - backed securities and the credit rating of CNHI; price p ressure on new and used equipment; security breaches, cybersecurity attacks, technology failures, and other disruptions to the information technology infrastructure of the Company and its CNH Industrial North America dealer s; security breaches with respect to CNH Industrial’s products; political and civil unrest; volatility and deterioration of capital and financial markets, including other pandemics and terrorist attacks; our ability to realize t he anticipated benefits from our business initiatives as part of CNHI’s strategic plan; CNHI’s failure to realize, or a delay in realizing, all of the anticipated benefits of its acquisitions, joint ventures, strategic alliances or di vestitures and other similar risks and uncertainties, and our and CNHI’s success in managing the risks involved in the foregoing. Forward - looking statements are based upon assumptions relating to the factors described in this presentation, which are sometime s based upon estimates and data received from third parties. Such estimates and data are often revised. Actual results may differ materially from the forward - looking statements as a result of a number of risks and unc ertainties, many of which are outside of our control. CNH Industrial Capital expressly disclaims any intention or obligation to provide, update or revise any forward - looking statements to reflect any change in expectations or any change in events, conditions or circumstances on which these forward - looking statements are based. All future written and oral forward - looking statements by CNH Industrial Capital or persons acting on the behalf of CNH Industri al Capital are expressly qualified in their entirety by the cautionary statements contained herein or referred to above. Additional factors could cause actual results to differ from those expressed or implied by the forward - looking statements includ ed in the Company’s filings with the SEC (including, but not limited to, the factors discussed in our annual report on Form 10 - K and quarterly reports submitted on Form 10 - Q). FINANCIAL MEASURES We monitor our operations through the use of various key financial measures that may not be comparable to other similarly titled measures of other companies . Accordingly, investors and analysts should exercise appropriate caution in comparing these supplemental financial measures to similarly titled financial measures reported by other companies . Management believes these financial measures provide comparable measures of its financial performance based on normalized operational factors, which then facilitate management’s ability to identify operational trends, as well as make decisions regarding future spending, resource allocations and other operational decisions . Certain financial measures are defined as “LTM” meaning Last Twelve Months . All numbers are prepared according to US GAAP, except as otherwise noted . See CNH Industrial’s Investor Relations>Events and Presentations site for non - GAAP definitions and reconciliations available within certain Presentations and Press Releases : https : //www . cnhindustrial . com/en - US/Investor - Relations/events_and_presentations/events_and_presentations . Certain sums may not equal total due to rounding . Forward Looking Statements 3
SFVegas ‘23 – Las Vegas, February 2023 (Confidential) Index Our Company Our Captive Finance Company Industry Update Our ABS Program Backup 4

SFVegas ‘23 – Las Vegas, February 2023 (Confidential) 5 Chapter 1 Our Company
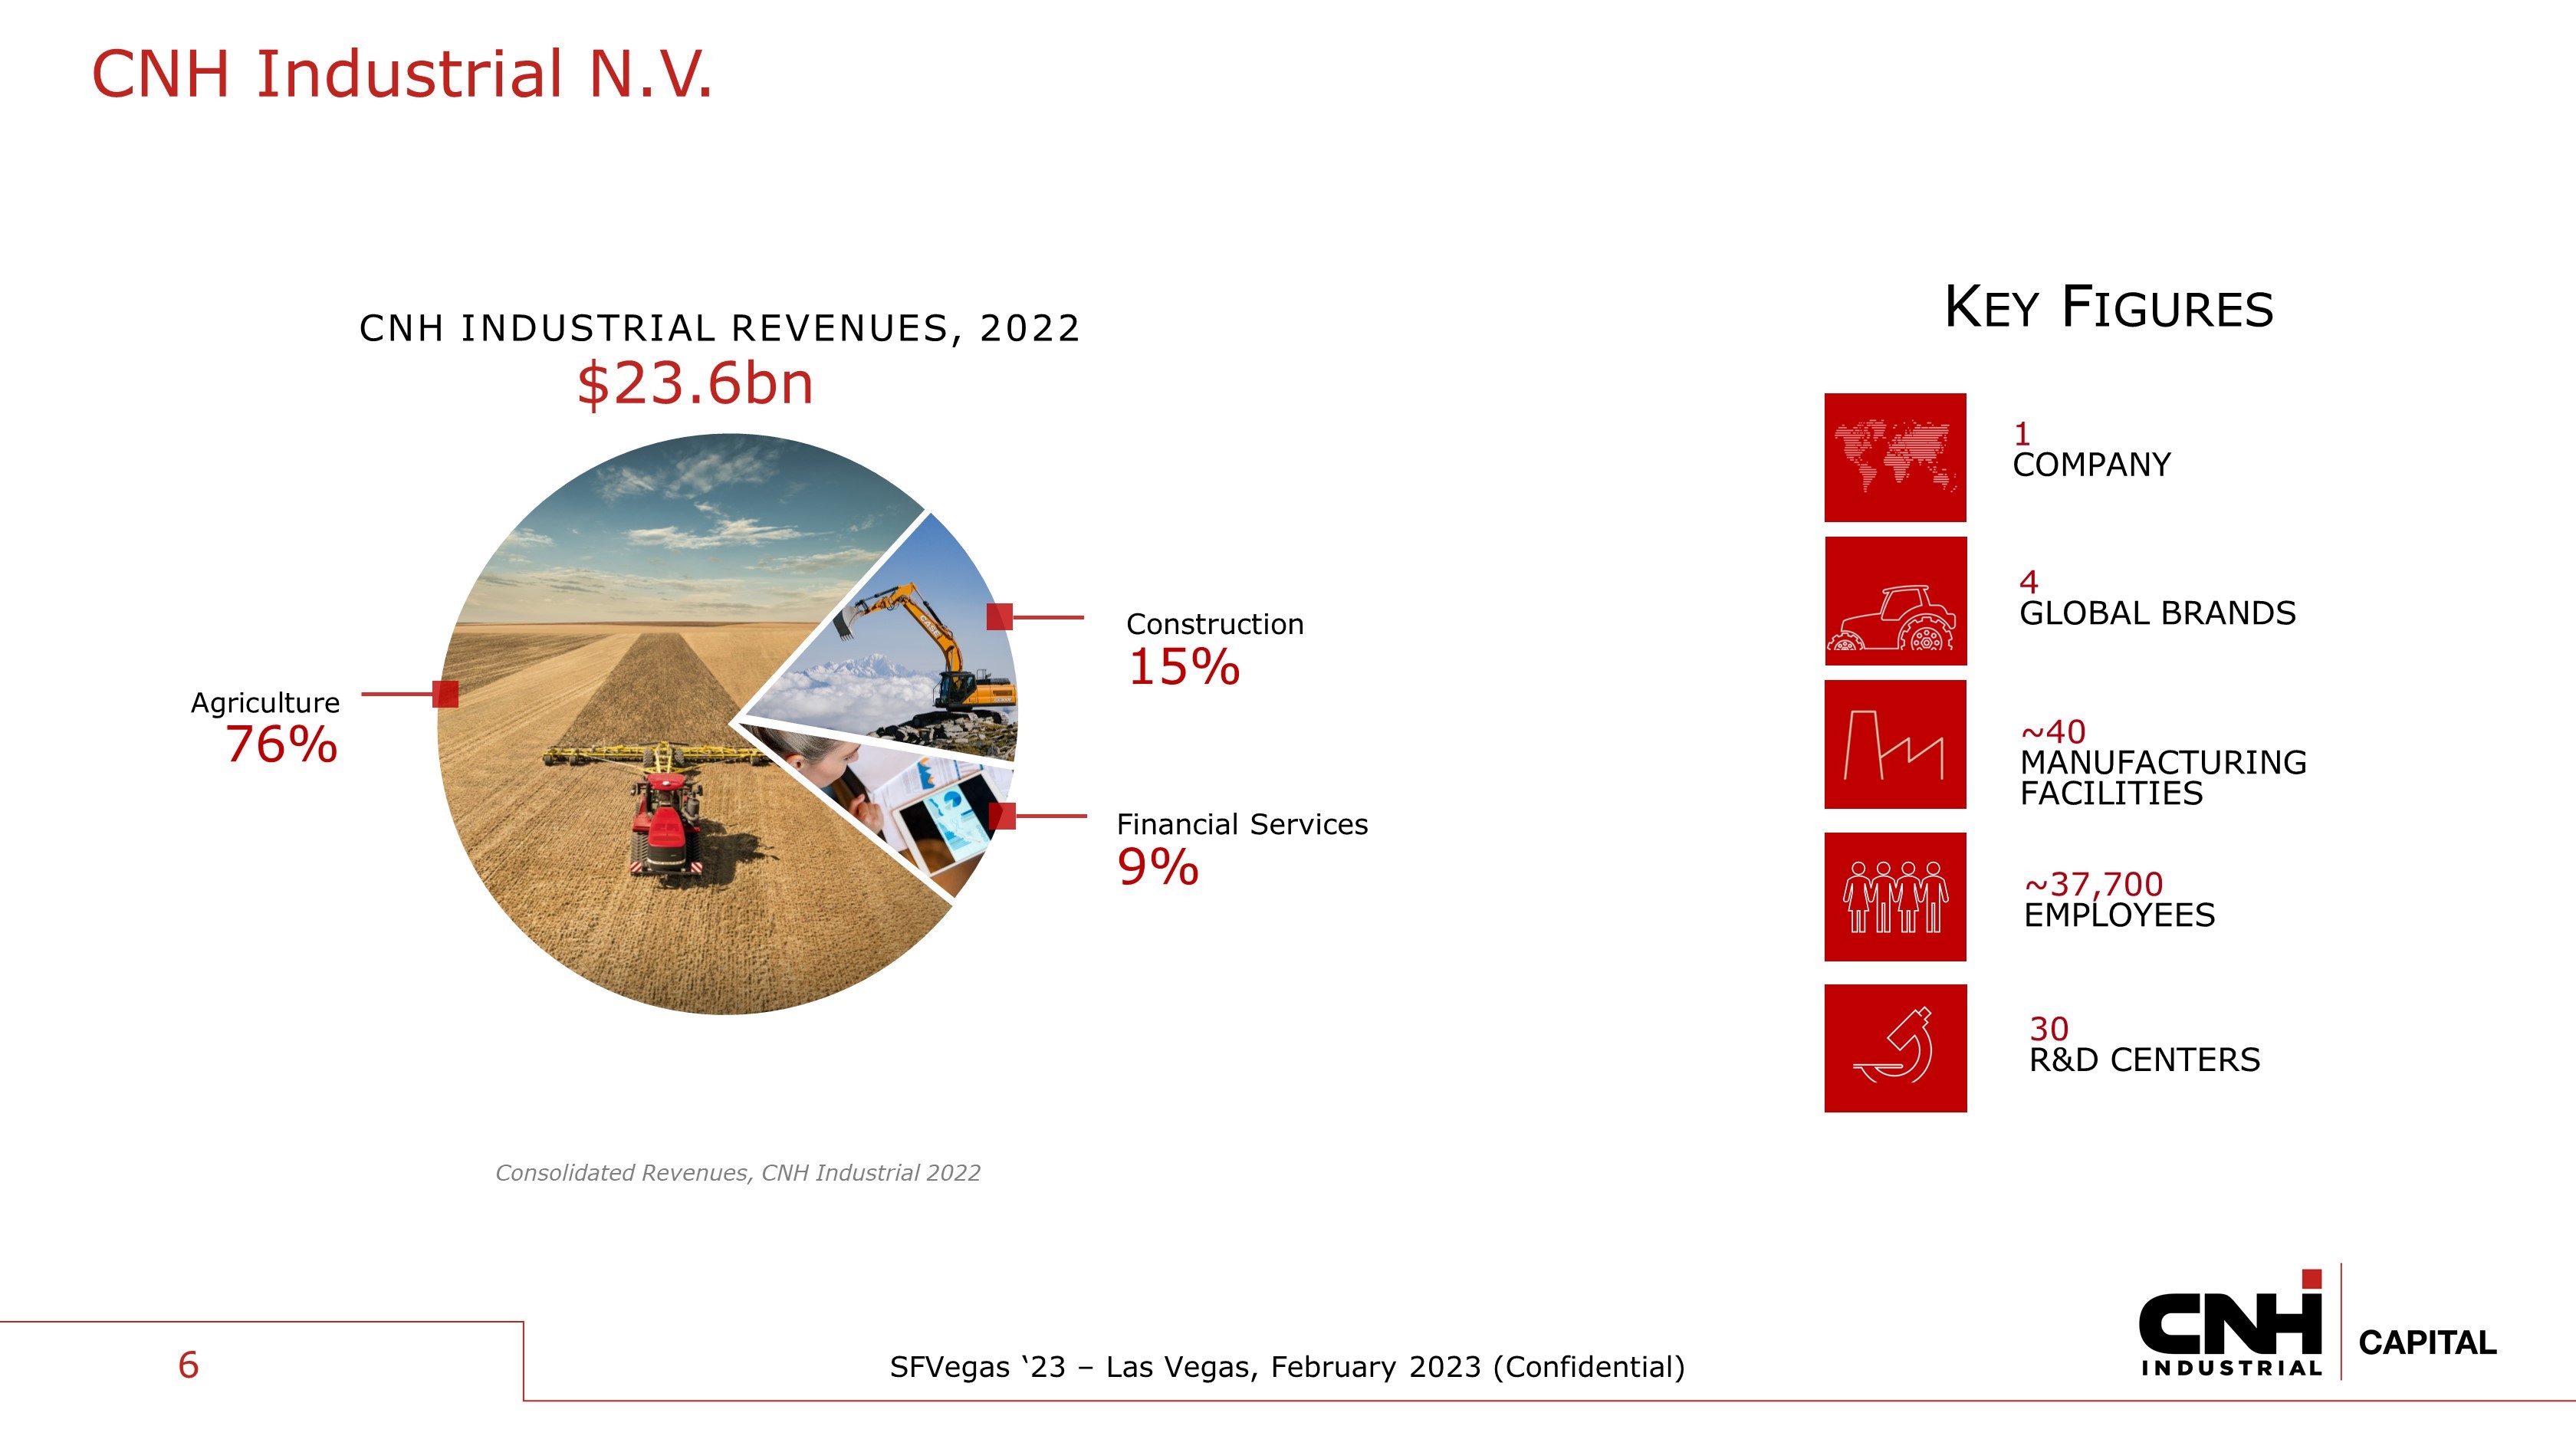
SFVegas ‘23 – Las Vegas, February 2023 (Confidential) 6 CNH Industrial N.V. CNH INDUSTRIAL REVENUES, 2022 Agriculture 76% Construction 15% Financial Services 9% $23.6bn Consolidated Revenues, CNH Industrial 2022 ~40 MANUFACTURING FACILITIES ~37,700 EMPLOYEES 30 R&D CENTERS K EY F IGURES 1 COMPANY 4 GLOBAL BRANDS
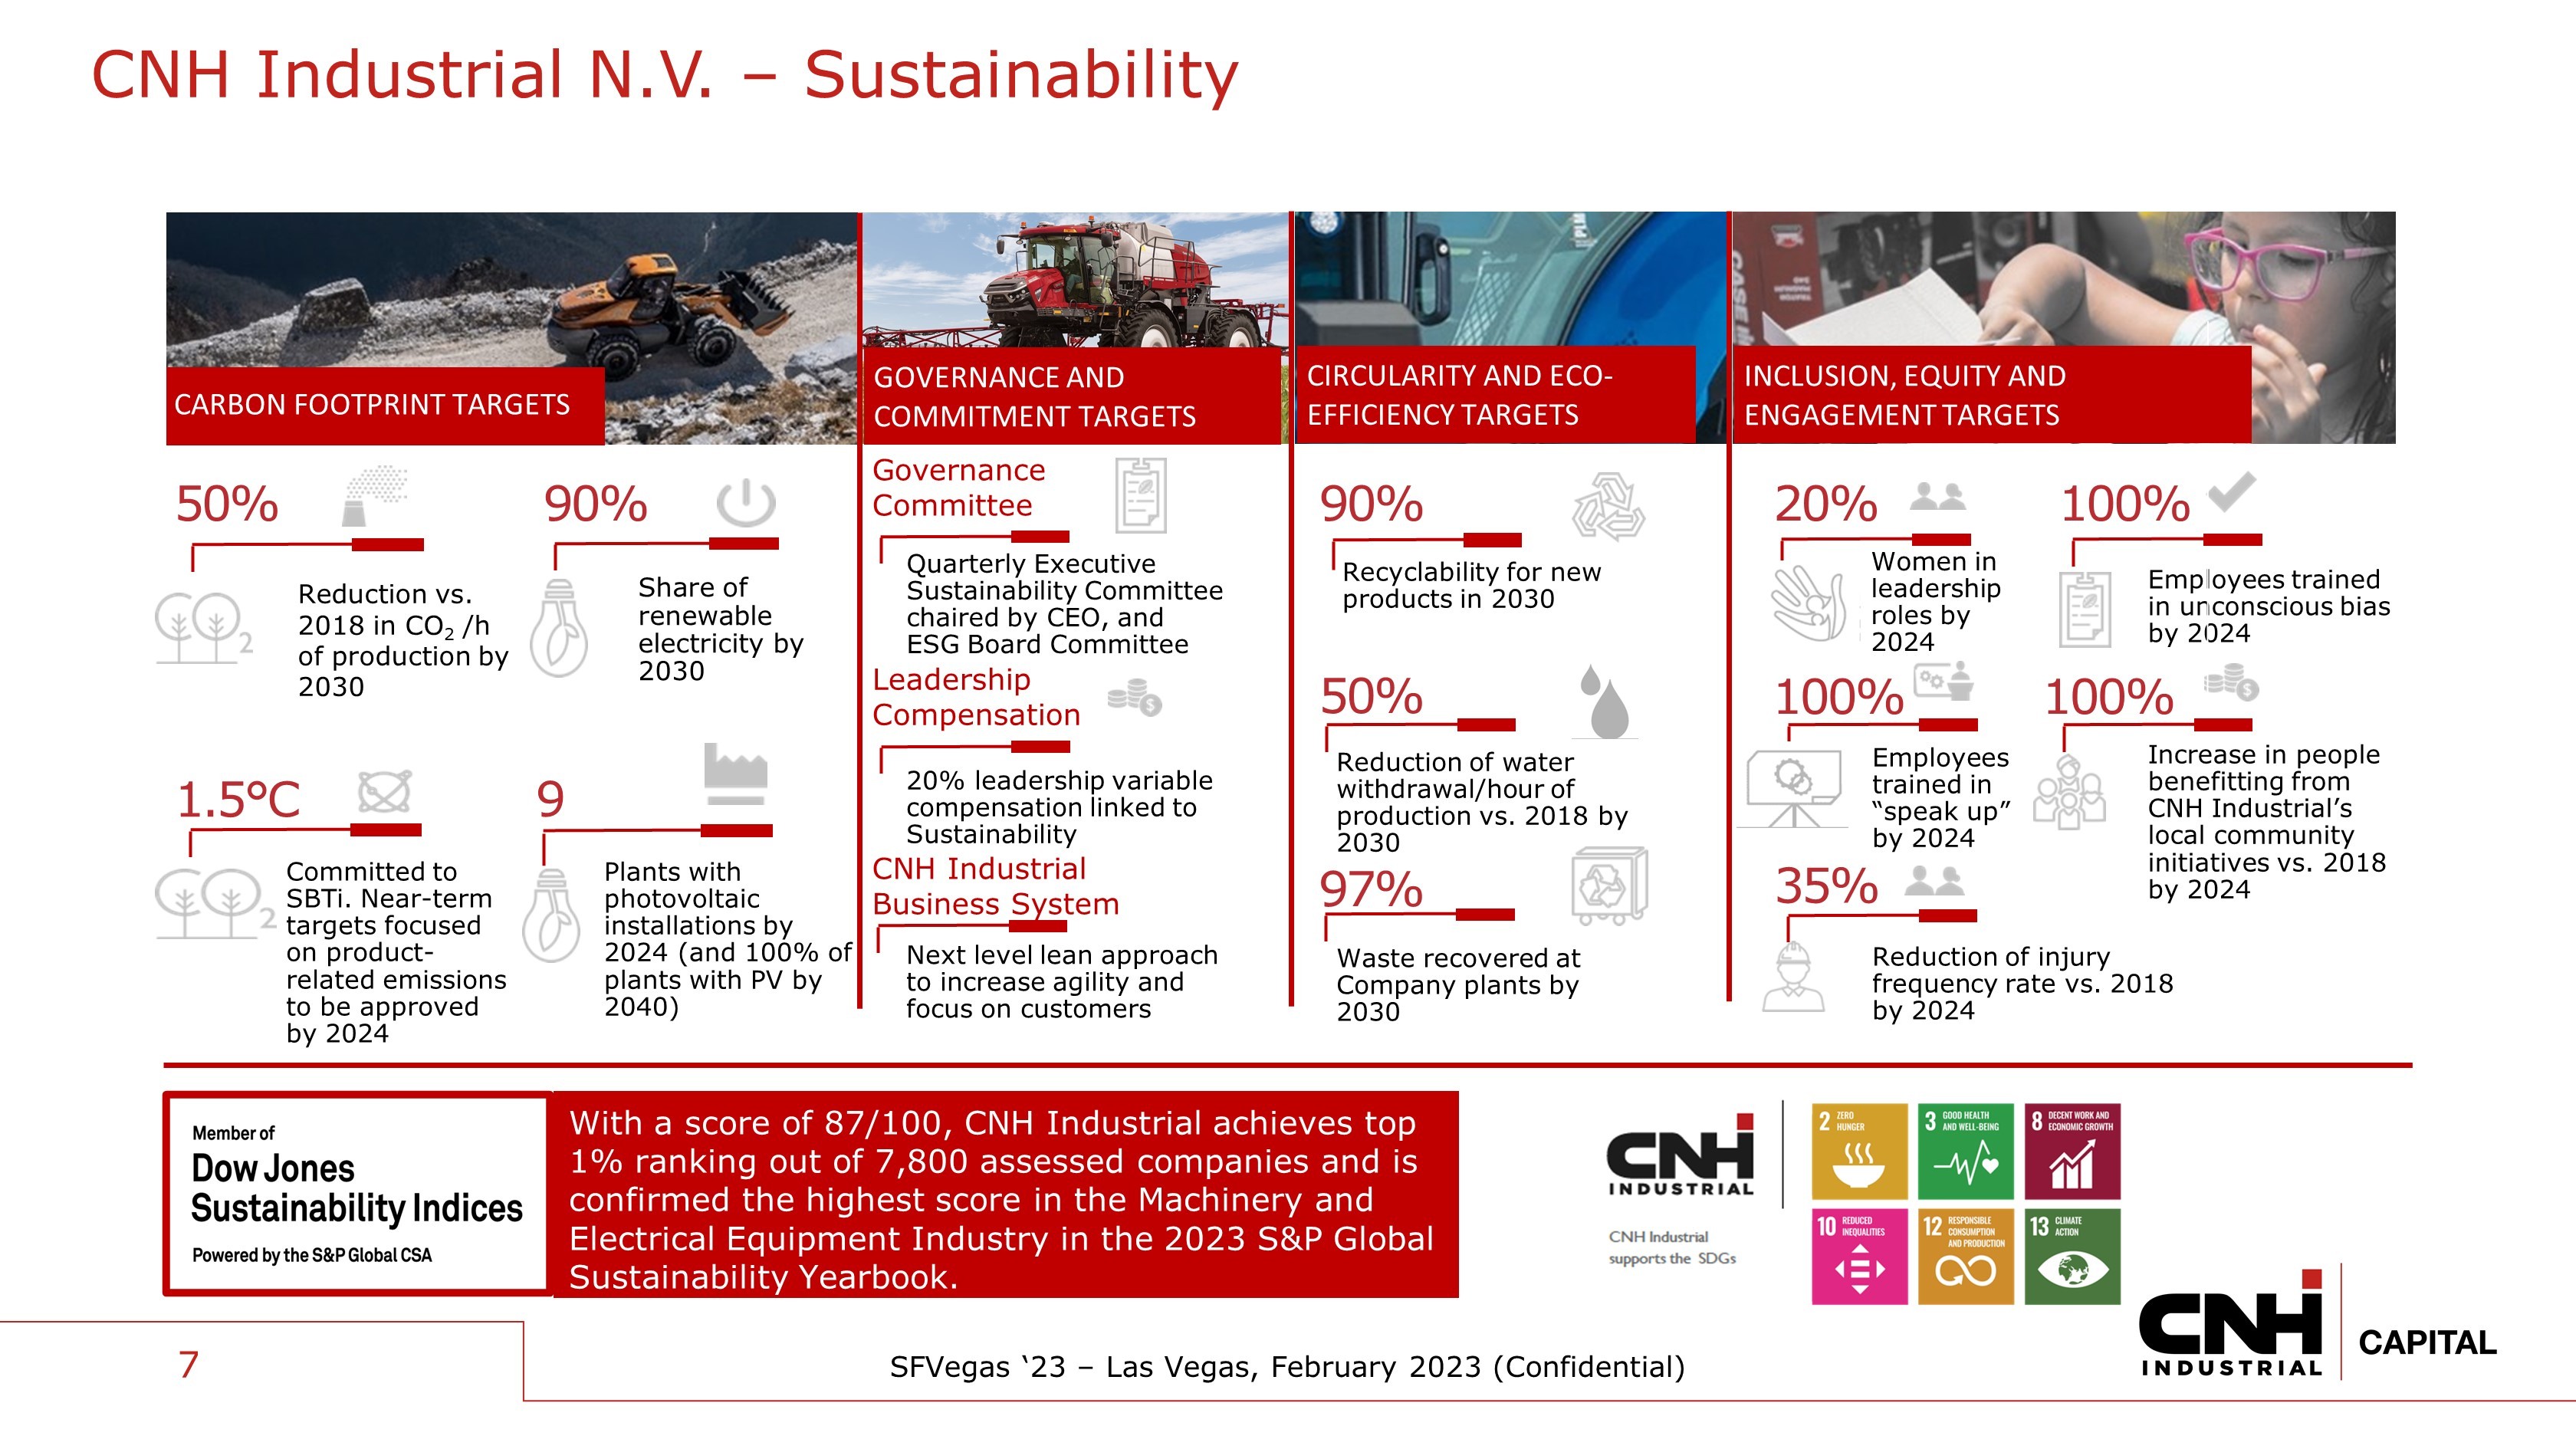
SFVegas ‘23 – Las Vegas, February 2023 (Confidential) Employees trained in “speak up” by 2024 100% invested in local communities 100% Women in leadership roles by 2024 20% Employees trained in unconscious bias by 2024 100 % Quarterly Executive Sustainability Committee chaired by CEO, and ESG Board Committee CARBON FOOTPRINT TARGETS CIRCULARITY AND ECO - EFFICIENCY TARGETS INCLUSION, EQUITY AND ENGAGEMENT TARGETS GOVERNANCE AND COMMITMENT TARGETS 50 % Reduction vs. 2018 in CO 2 /h of production by 2030 Recyclability for new products in 2030 Increase in people benefitting from CNH Industrial’s local community initiatives vs. 2018 by 2024 1.5 ° C Committed to SBTi. Near - term targets focused on product - related emissions to be approved by 2024 With a score of 87/100, CNH Industrial achieves top 1% ranking out of 7,800 assessed companies and is confirmed the highest score in the Machinery and Electrical Equipment Industry in the 2023 S&P Global Sustainability Yearbook. 7 CNH Industrial N.V. – Sustainability Plants with photovoltaic installations by 2024 (and 100% of plants with PV by 2040) 9 20% leadership variable compensation linked to Sustainability Next level lean approach to increase agility and focus on customers 35 % Reduction of injury frequency rate vs. 2018 by 2024 Share of renewable electricity by 2030 90 % 90% 50 % Reduction of water withdrawal/hour of production vs. 2018 by 2030 97% Waste recovered at Company plants by 2030 Governance Committee Leadership Compensation CNH Industrial Business System
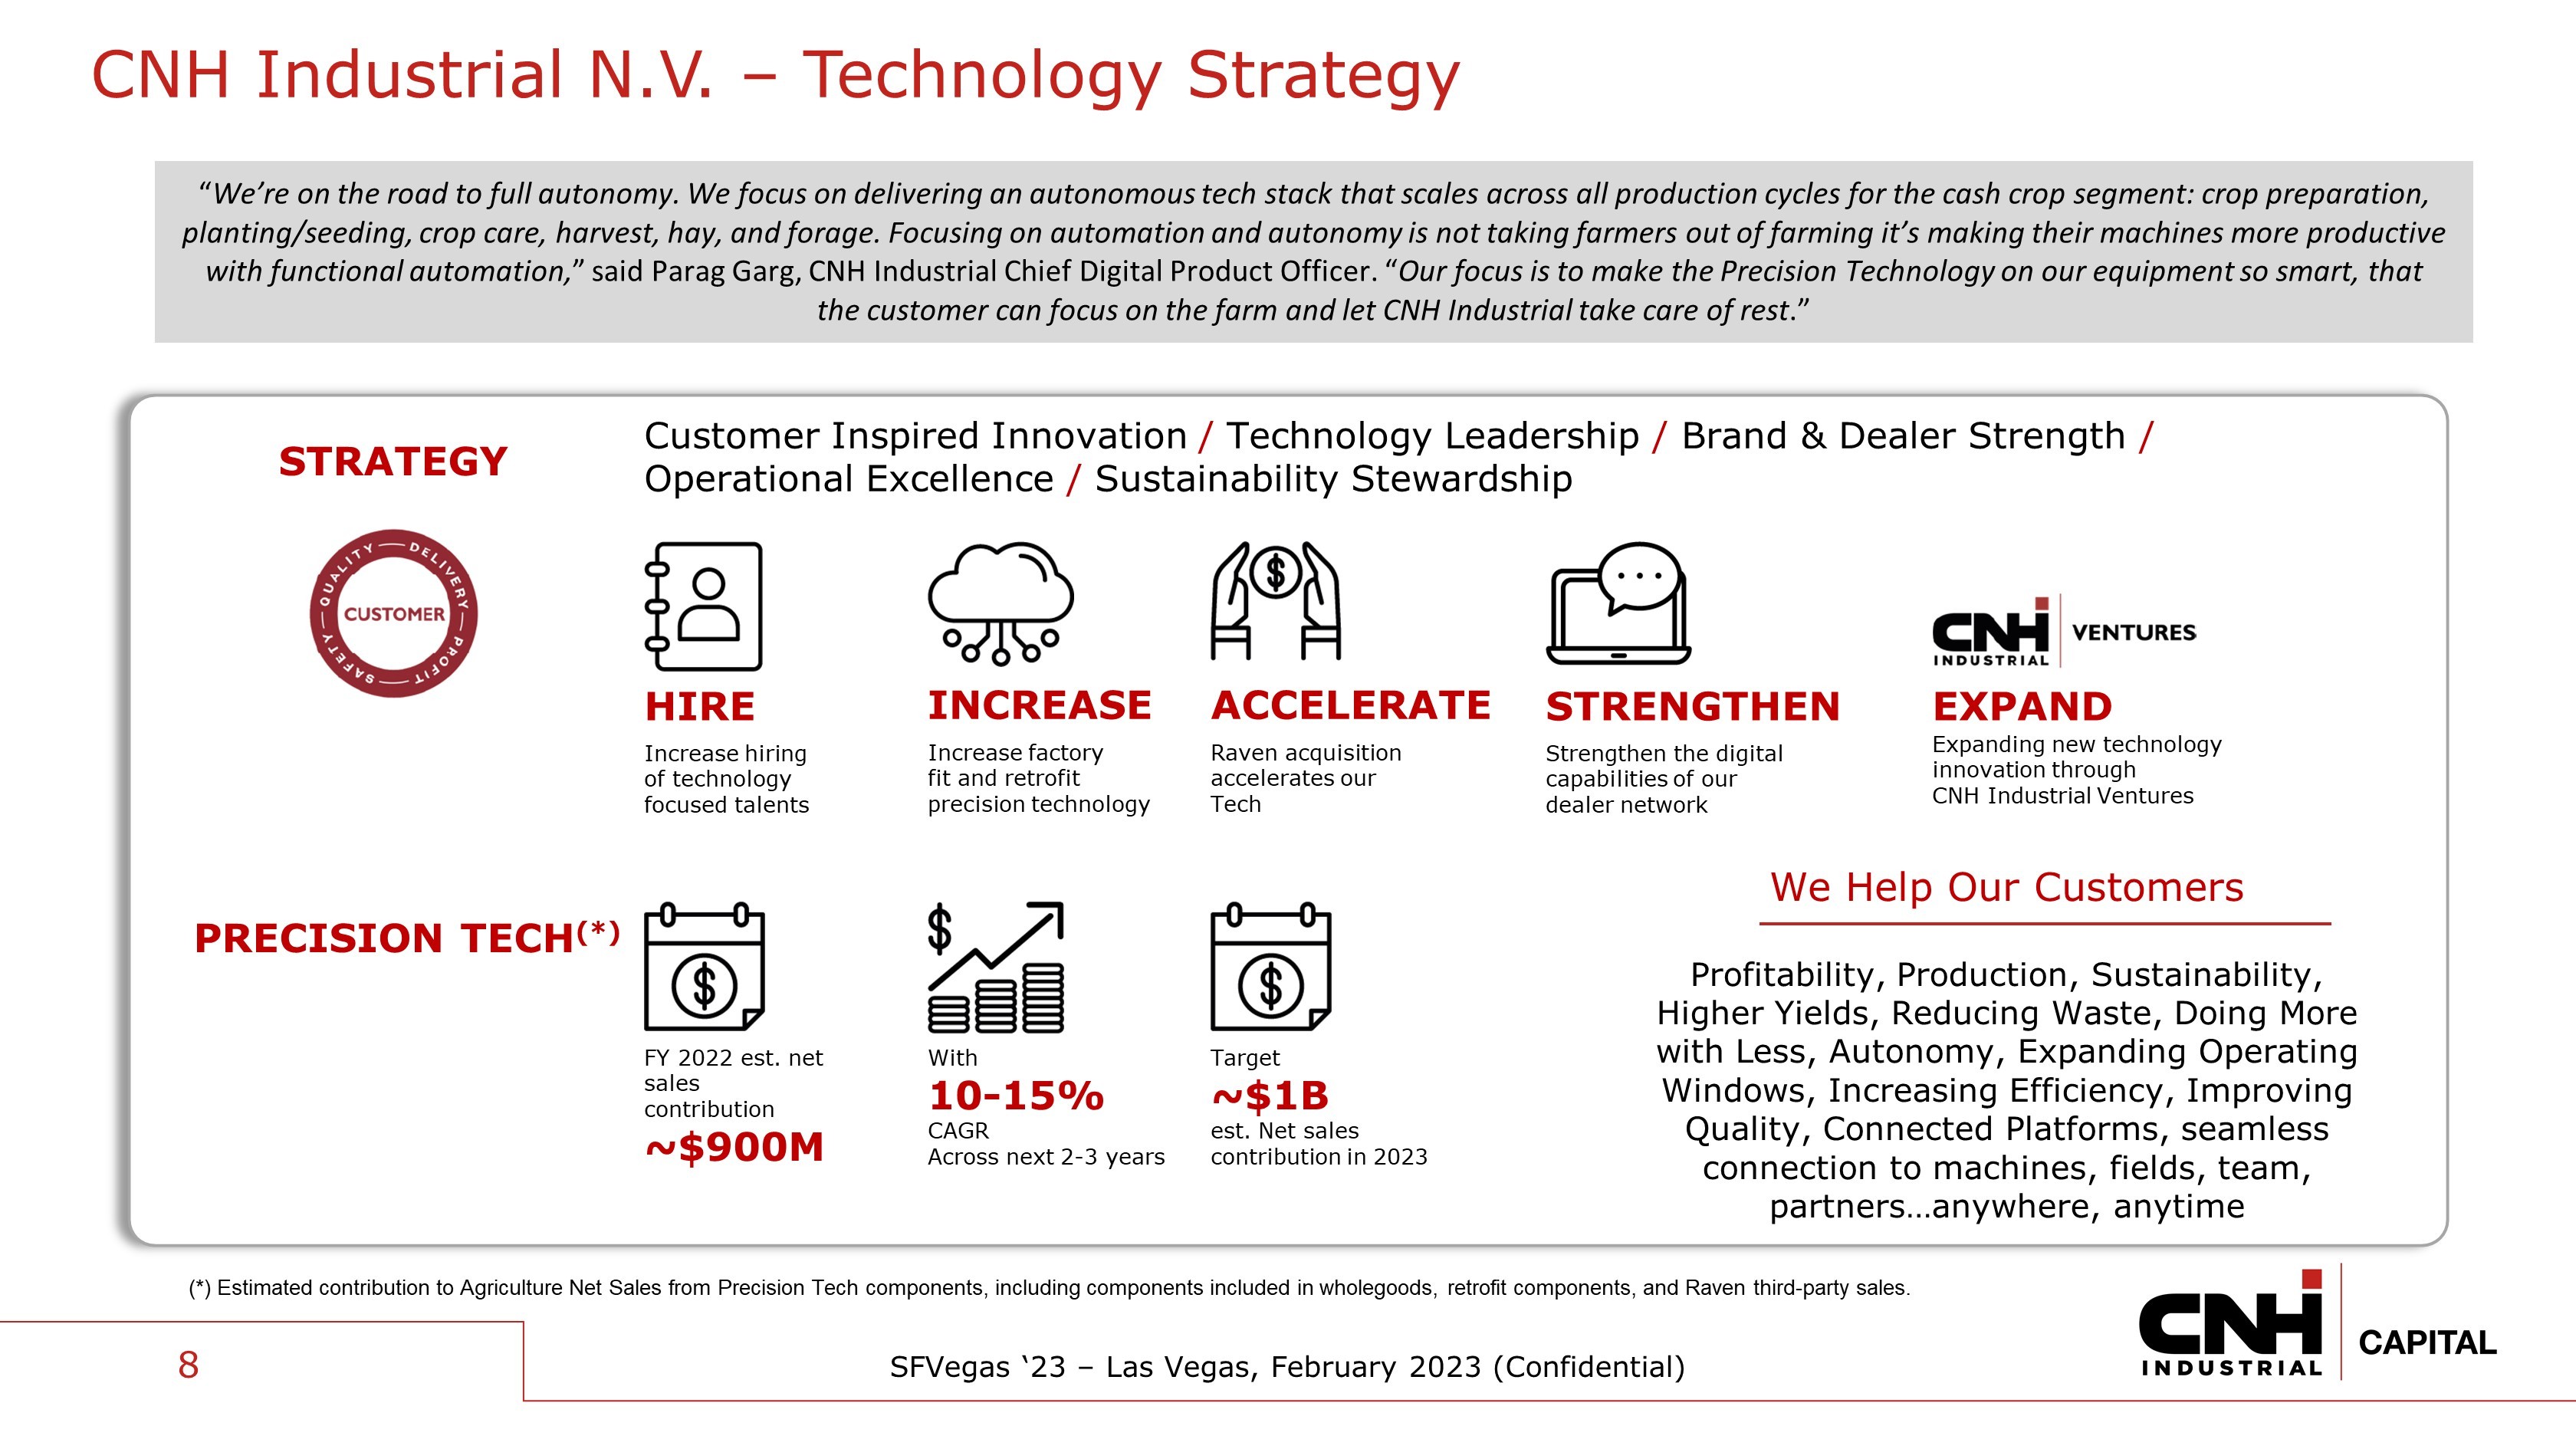
SFVegas ‘23 – Las Vegas, February 2023 (Confidential) Increase hiring of technology focused talents HIRE 8 “ We’re on the road to full autonomy. We focus on delivering an autonomous tech stack that scales across all production cycles for the cash crop segment: crop preparation, planting/seeding, crop care, harvest, hay, and forage. Focusing on automation and autonomy is not taking farmers out of farmi ng it’s making their machines more productive with functional automation, ” said Parag Garg, CNH Industrial Chief Digital Product Officer . “ Our focus is to make the Precision Technology on our equipment so smart, that the customer can focus on the farm and let CNH Industrial take care of rest .” CNH Industrial N.V. – Technology Strategy Profitability, Production, Sustainability, Higher Yields, Reducing Waste, Doing More with Less, Autonomy, Expanding Operating Windows, Increasing Efficiency, Improving Quality, Connected Platforms, seamless connection to machines, fields, team, partners…anywhere, anytime We Help Our Customers Increase factory fit and retrofit precision technology INCREASE Raven acquisition accelerates our Tech ACCELERATE Strengthen the digital capabilities of our dealer network STRENGTHEN Expanding new technology innovation through CNH Industrial Ventures EXPAND Customer Inspired Innovation / Technology Leadership / Brand & Dealer Strength / Operational Excellence / Sustainability Stewardship STRATEGY PRECISION TECH (*) (*) Estimated contribution to Agriculture Net Sales from Precision Tech components, including components included in wholegoods , retrofit components, and Raven third - party sales. FY 2022 est. net sales contribution ~$900M With 10 - 15% CAGR Across next 2 - 3 years Target ~$1B est. Net sales contribution in 2023
SFVegas ‘23 – Las Vegas, February 2023 (Confidential) 9 Our Captive Finance Company Chapter 2
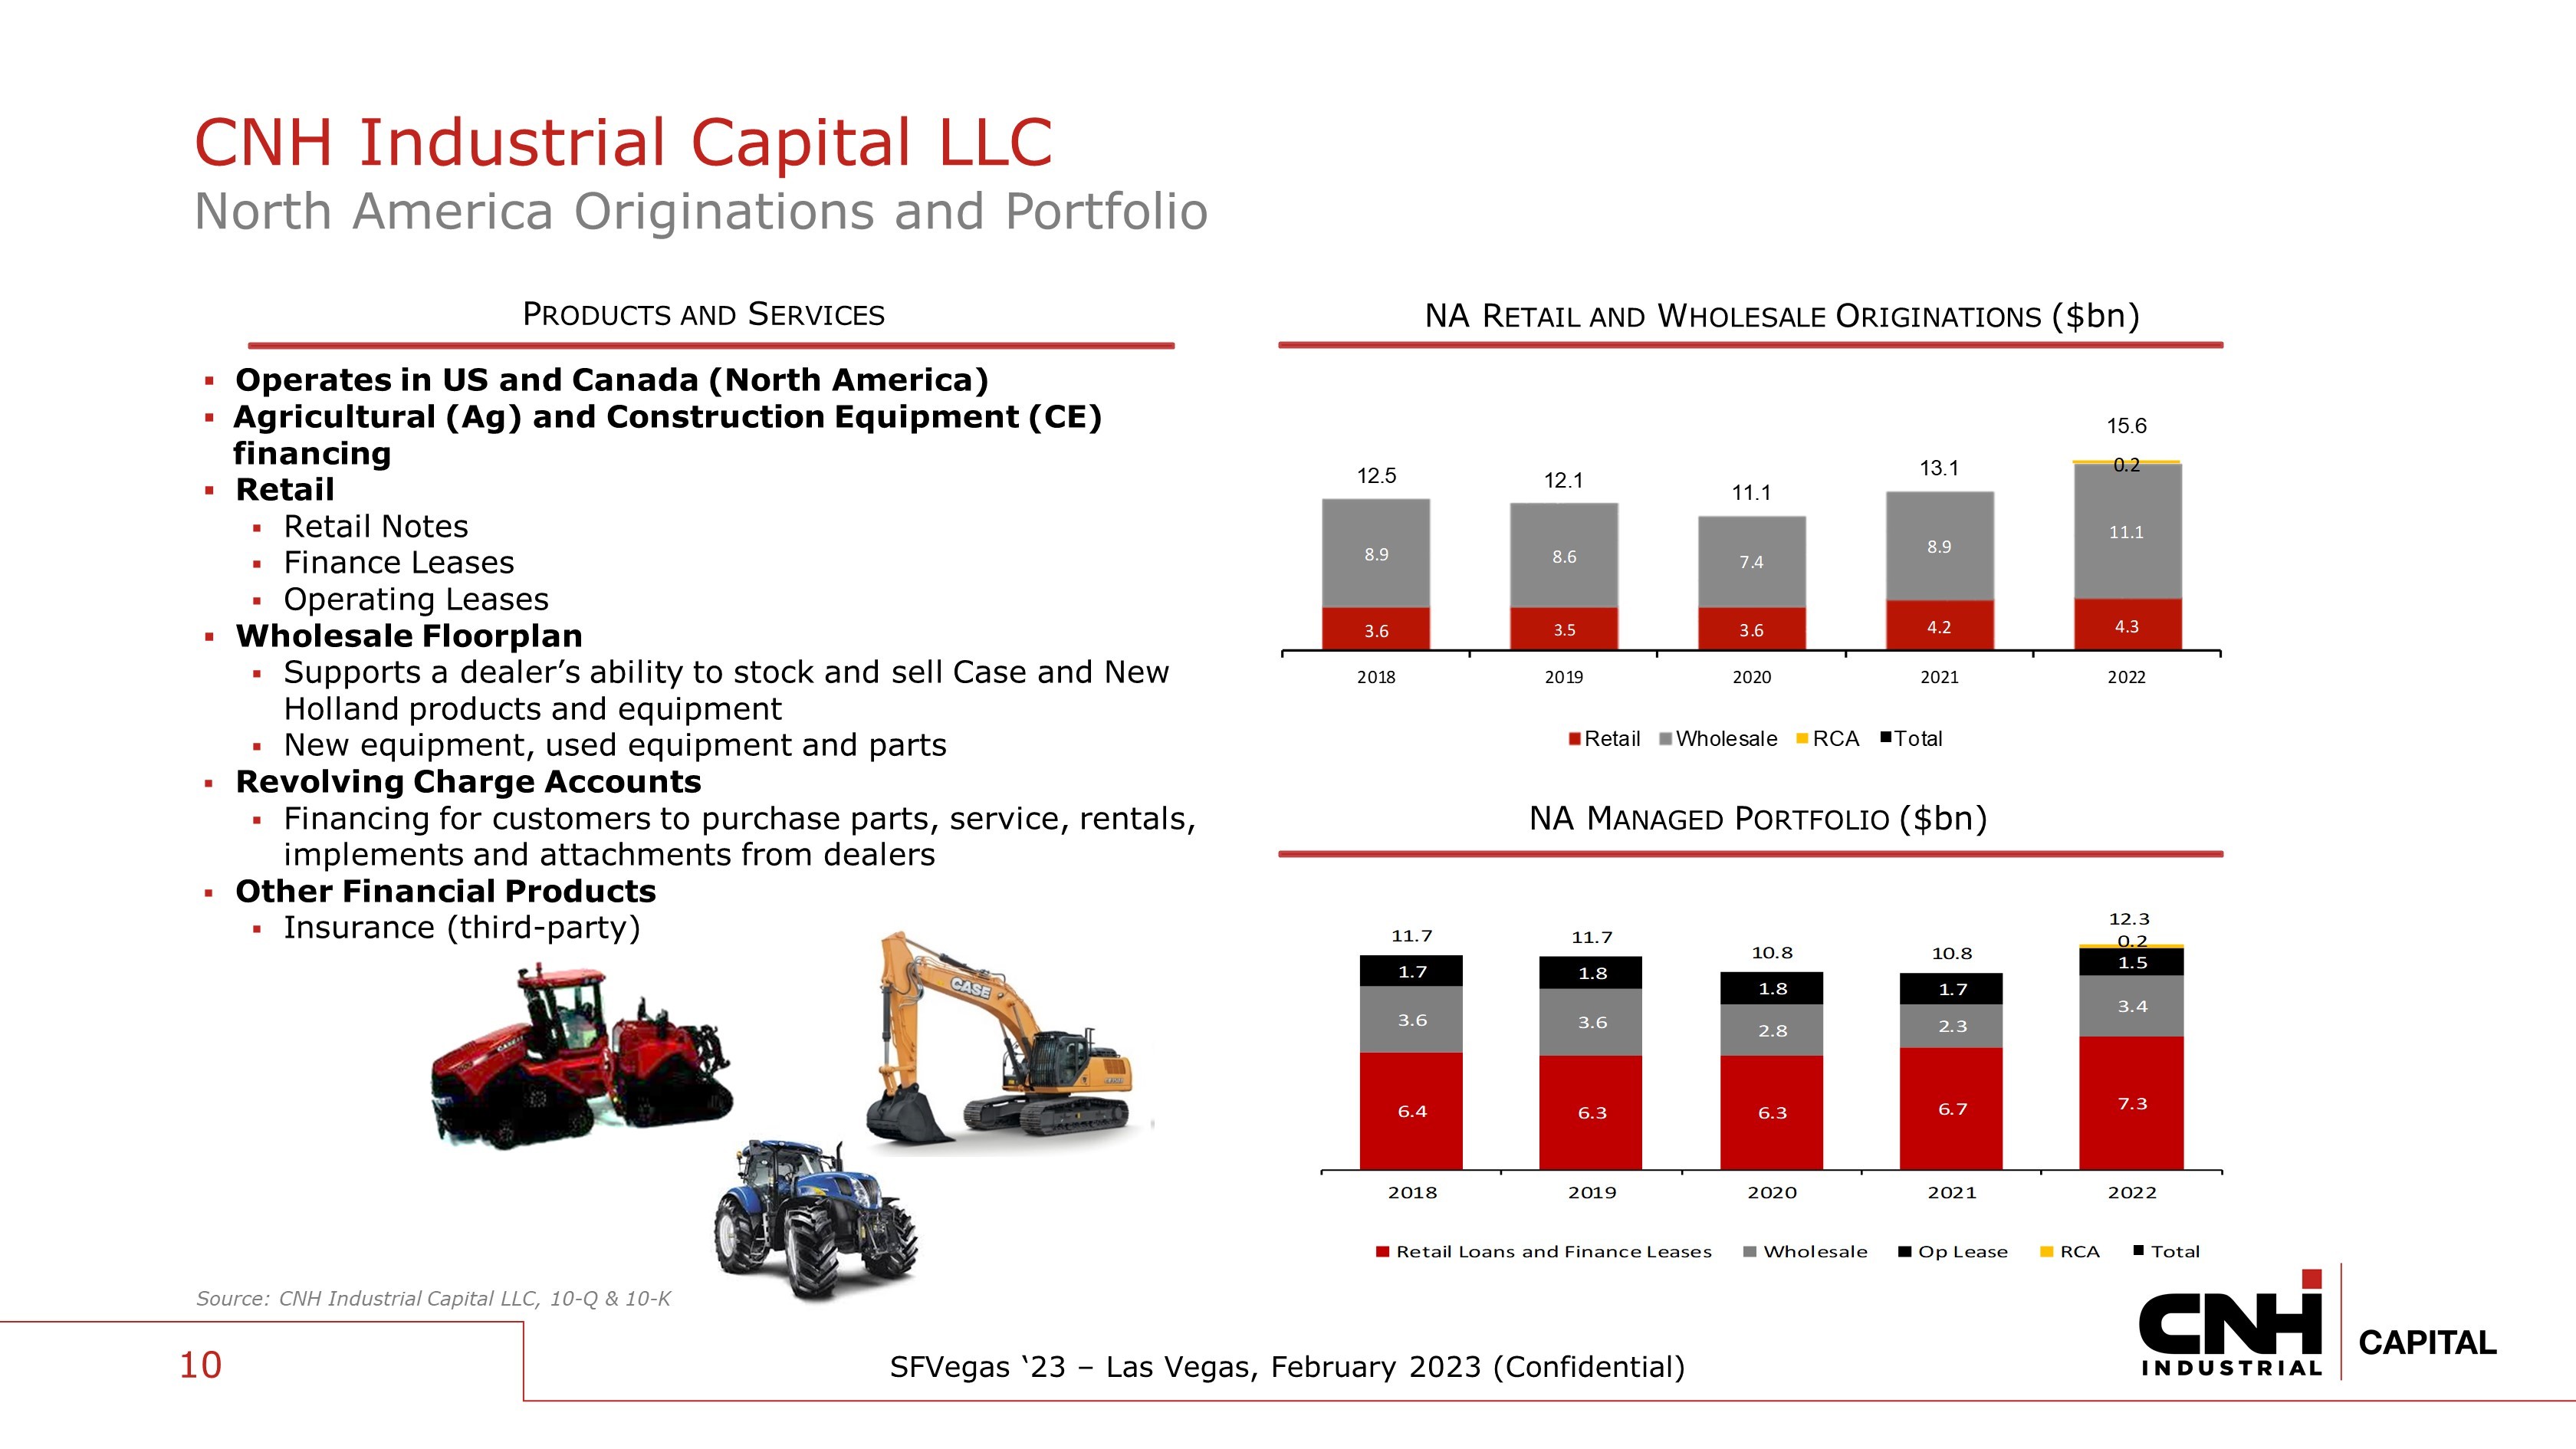
SFVegas ‘23 – Las Vegas, February 2023 (Confidential) 6.4 6.3 6.3 6.7 7.3 3.6 3.6 2.8 2.3 3.4 1.7 1.8 1.8 1.7 1.5 0.2 11.7 11.7 10.8 10.8 12.3 -1 1 3 5 7 9 11 13 15 2018 2019 2020 2021 2022 Retail Loans and Finance Leases Wholesale Op Lease RCA Total 10 CNH Industrial Capital LLC North America Originations and Portfolio NA M ANAGED P ORTFOLIO ($ bn ) NA R ETAIL AND W HOLESALE O RIGINATIONS ($ bn ) P RODUCTS AND S ERVICES ▪ Operates in US and Canada (North America) ▪ Agricultural (Ag) and Construction Equipment (CE) financing ▪ Retail ▪ Retail Notes ▪ Finance Leases ▪ Operating Leases ▪ Wholesale Floorplan ▪ Supports a dealer’s ability to stock and sell Case and New Holland products and equipment ▪ New equipment, used equipment and parts ▪ Revolving Charge Accounts ▪ Financing for customers to purchase parts, service, rentals, implements and attachments from dealers ▪ Other Financial Products ▪ Insurance (third - party) Source: CNH Industrial Capital LLC, 10 - Q & 10 - K 3.6 3.5 3.6 4.2 4.3 8.9 8.6 7.4 8.9 11.1 0.2 12.5 12.1 11.1 13.1 15.6 2018 2019 2020 2021 2022 Retail Wholesale RCA Total
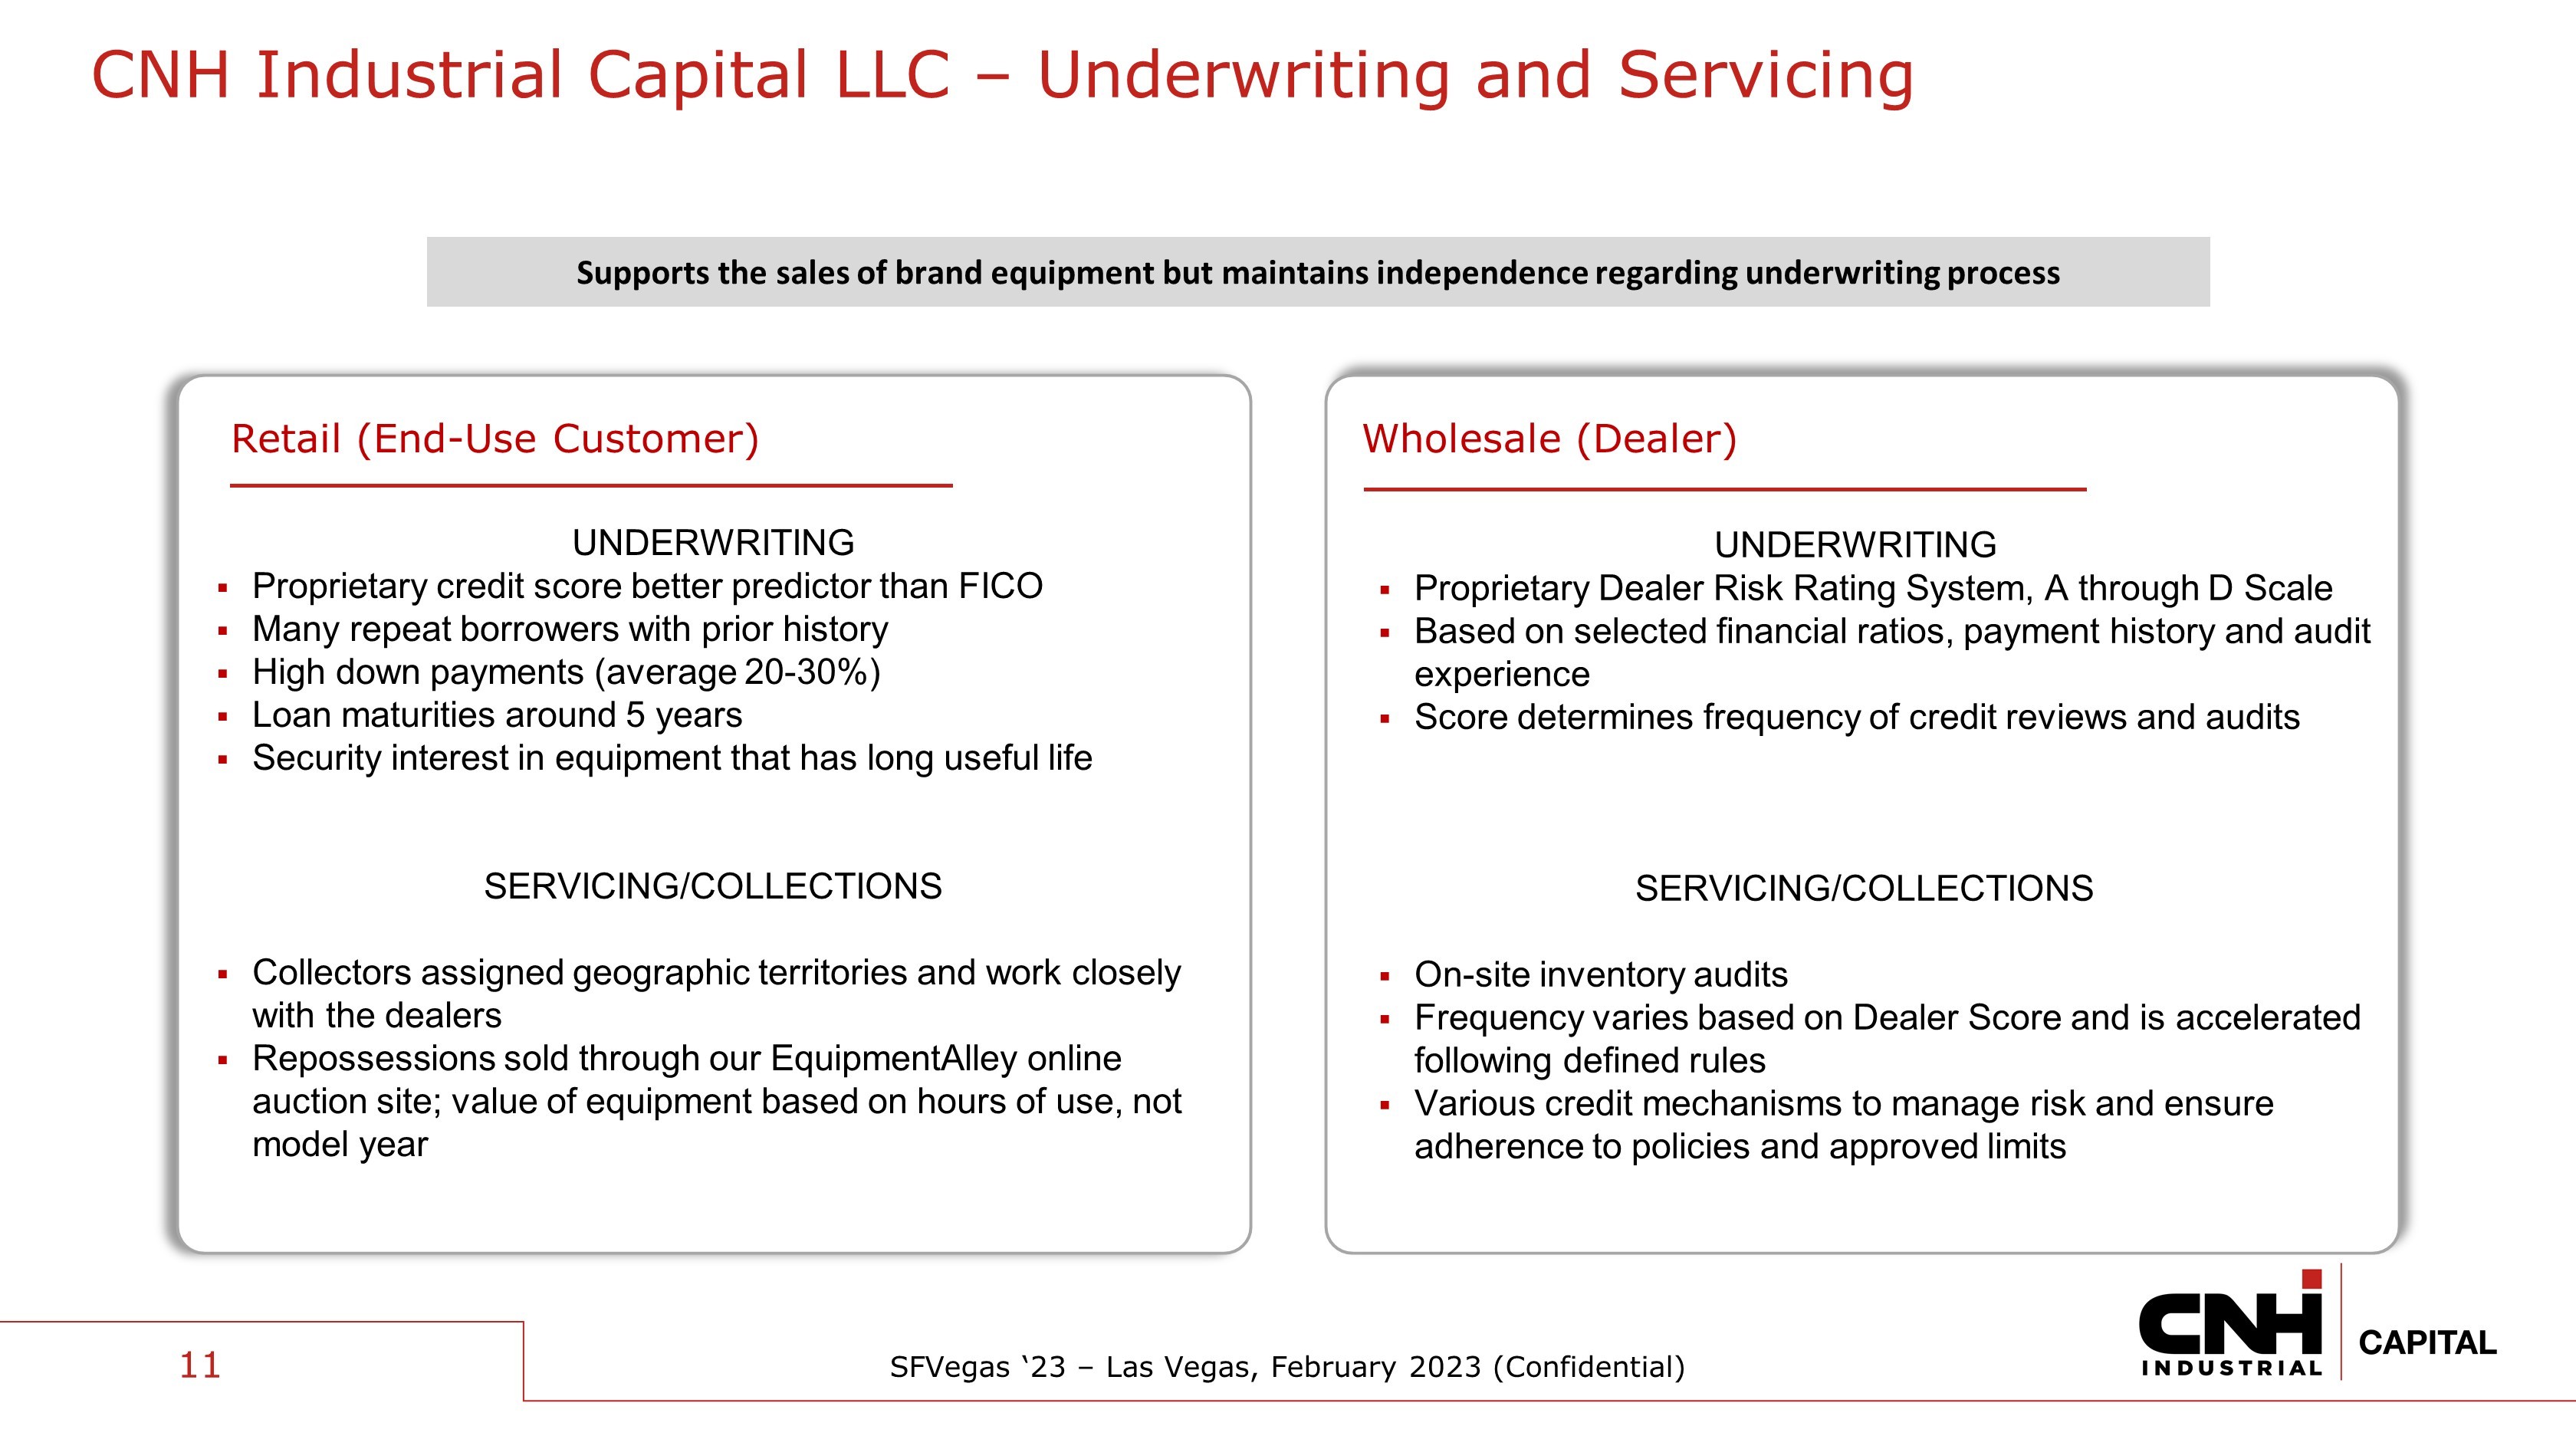
SFVegas ‘23 – Las Vegas, February 2023 (Confidential) UNDERWRITING ▪ Proprietary credit score better predictor than FICO ▪ Many repeat borrowers with prior history ▪ High down payments (average 20 - 30%) ▪ Loan maturities around 5 years ▪ Security interest in equipment that has long useful life SERVICING/COLLECTIONS ▪ Collectors assigned geographic territories and work closely with the dealers ▪ Repossessions sold through our EquipmentAlley online auction site; value of equipment based on hours of use, not model year Retail (End - Use Customer) UNDERWRITING ▪ Proprietary Dealer Risk Rating System, A through D Scale ▪ Based on selected financial ratios, payment history and audit experience ▪ Score determines frequency of credit reviews and audits SERVICING/COLLECTIONS ▪ On - site inventory audits ▪ Frequency varies based on Dealer Score and is accelerated following defined rules ▪ Various credit mechanisms to manage risk and ensure adherence to policies and approved limits Wholesale (Dealer) 11 Supports the sales of brand equipment but maintains independence regarding underwriting process CNH Industrial Capital LLC – Underwriting and Servicing
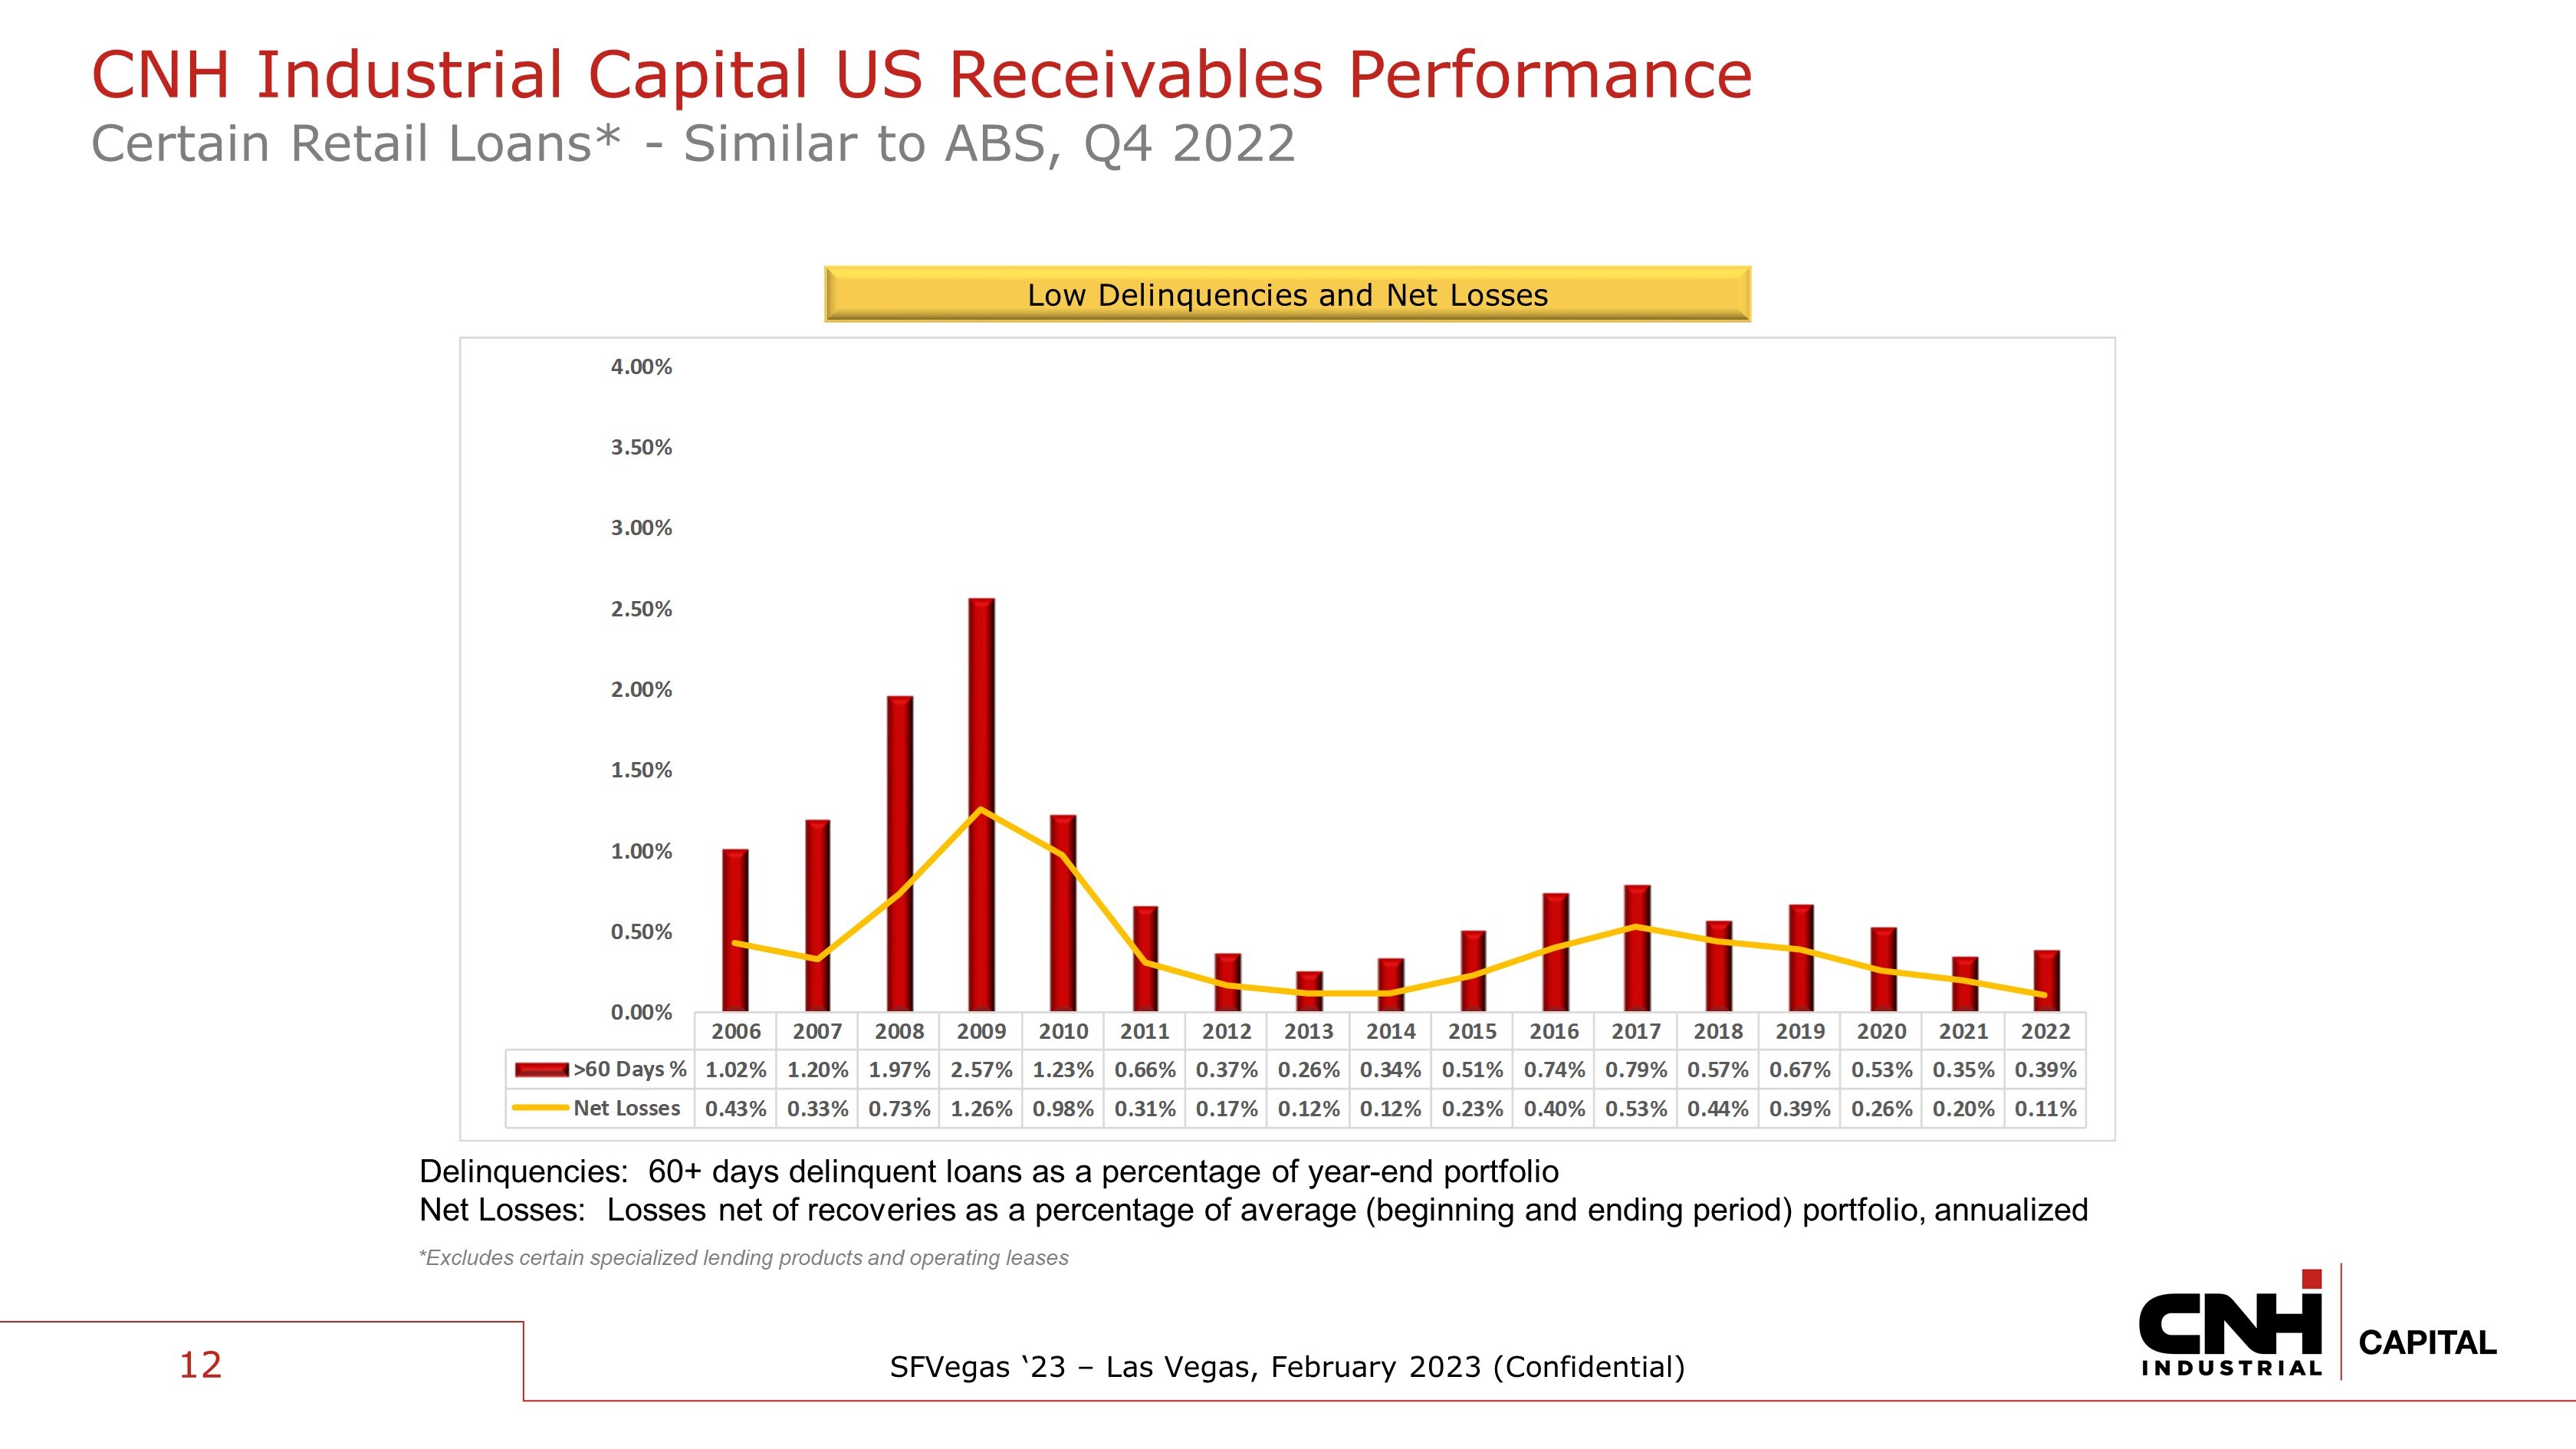
SFVegas ‘23 – Las Vegas, February 2023 (Confidential) Delinquencies: 60+ days delinquent loans as a percentage of year - end portfolio Net Losses: Losses net of recoveries as a percentage of average (beginning and ending period) portfolio, annualized Low Delinquencies and Net Losses *Excludes certain specialized lending products and operating leases 12 CNH Industrial Capital US Receivables Performance Certain Retail Loans* - Similar to ABS, Q4 2022 2006 2007 2008 2009 2010 2011 2012 2013 2014 2015 2016 2017 2018 2019 2020 2021 2022 >60 Days % 1.02% 1.20% 1.97% 2.57% 1.23% 0.66% 0.37% 0.26% 0.34% 0.51% 0.74% 0.79% 0.57% 0.67% 0.53% 0.35% 0.39% Net Losses 0.43% 0.33% 0.73% 1.26% 0.98% 0.31% 0.17% 0.12% 0.12% 0.23% 0.40% 0.53% 0.44% 0.39% 0.26% 0.20% 0.11% 0.00% 0.50% 1.00% 1.50% 2.00% 2.50% 3.00% 3.50% 4.00%

SFVegas ‘23 – Las Vegas, February 2023 (Confidential) 13 Chapter 3 Industry Update
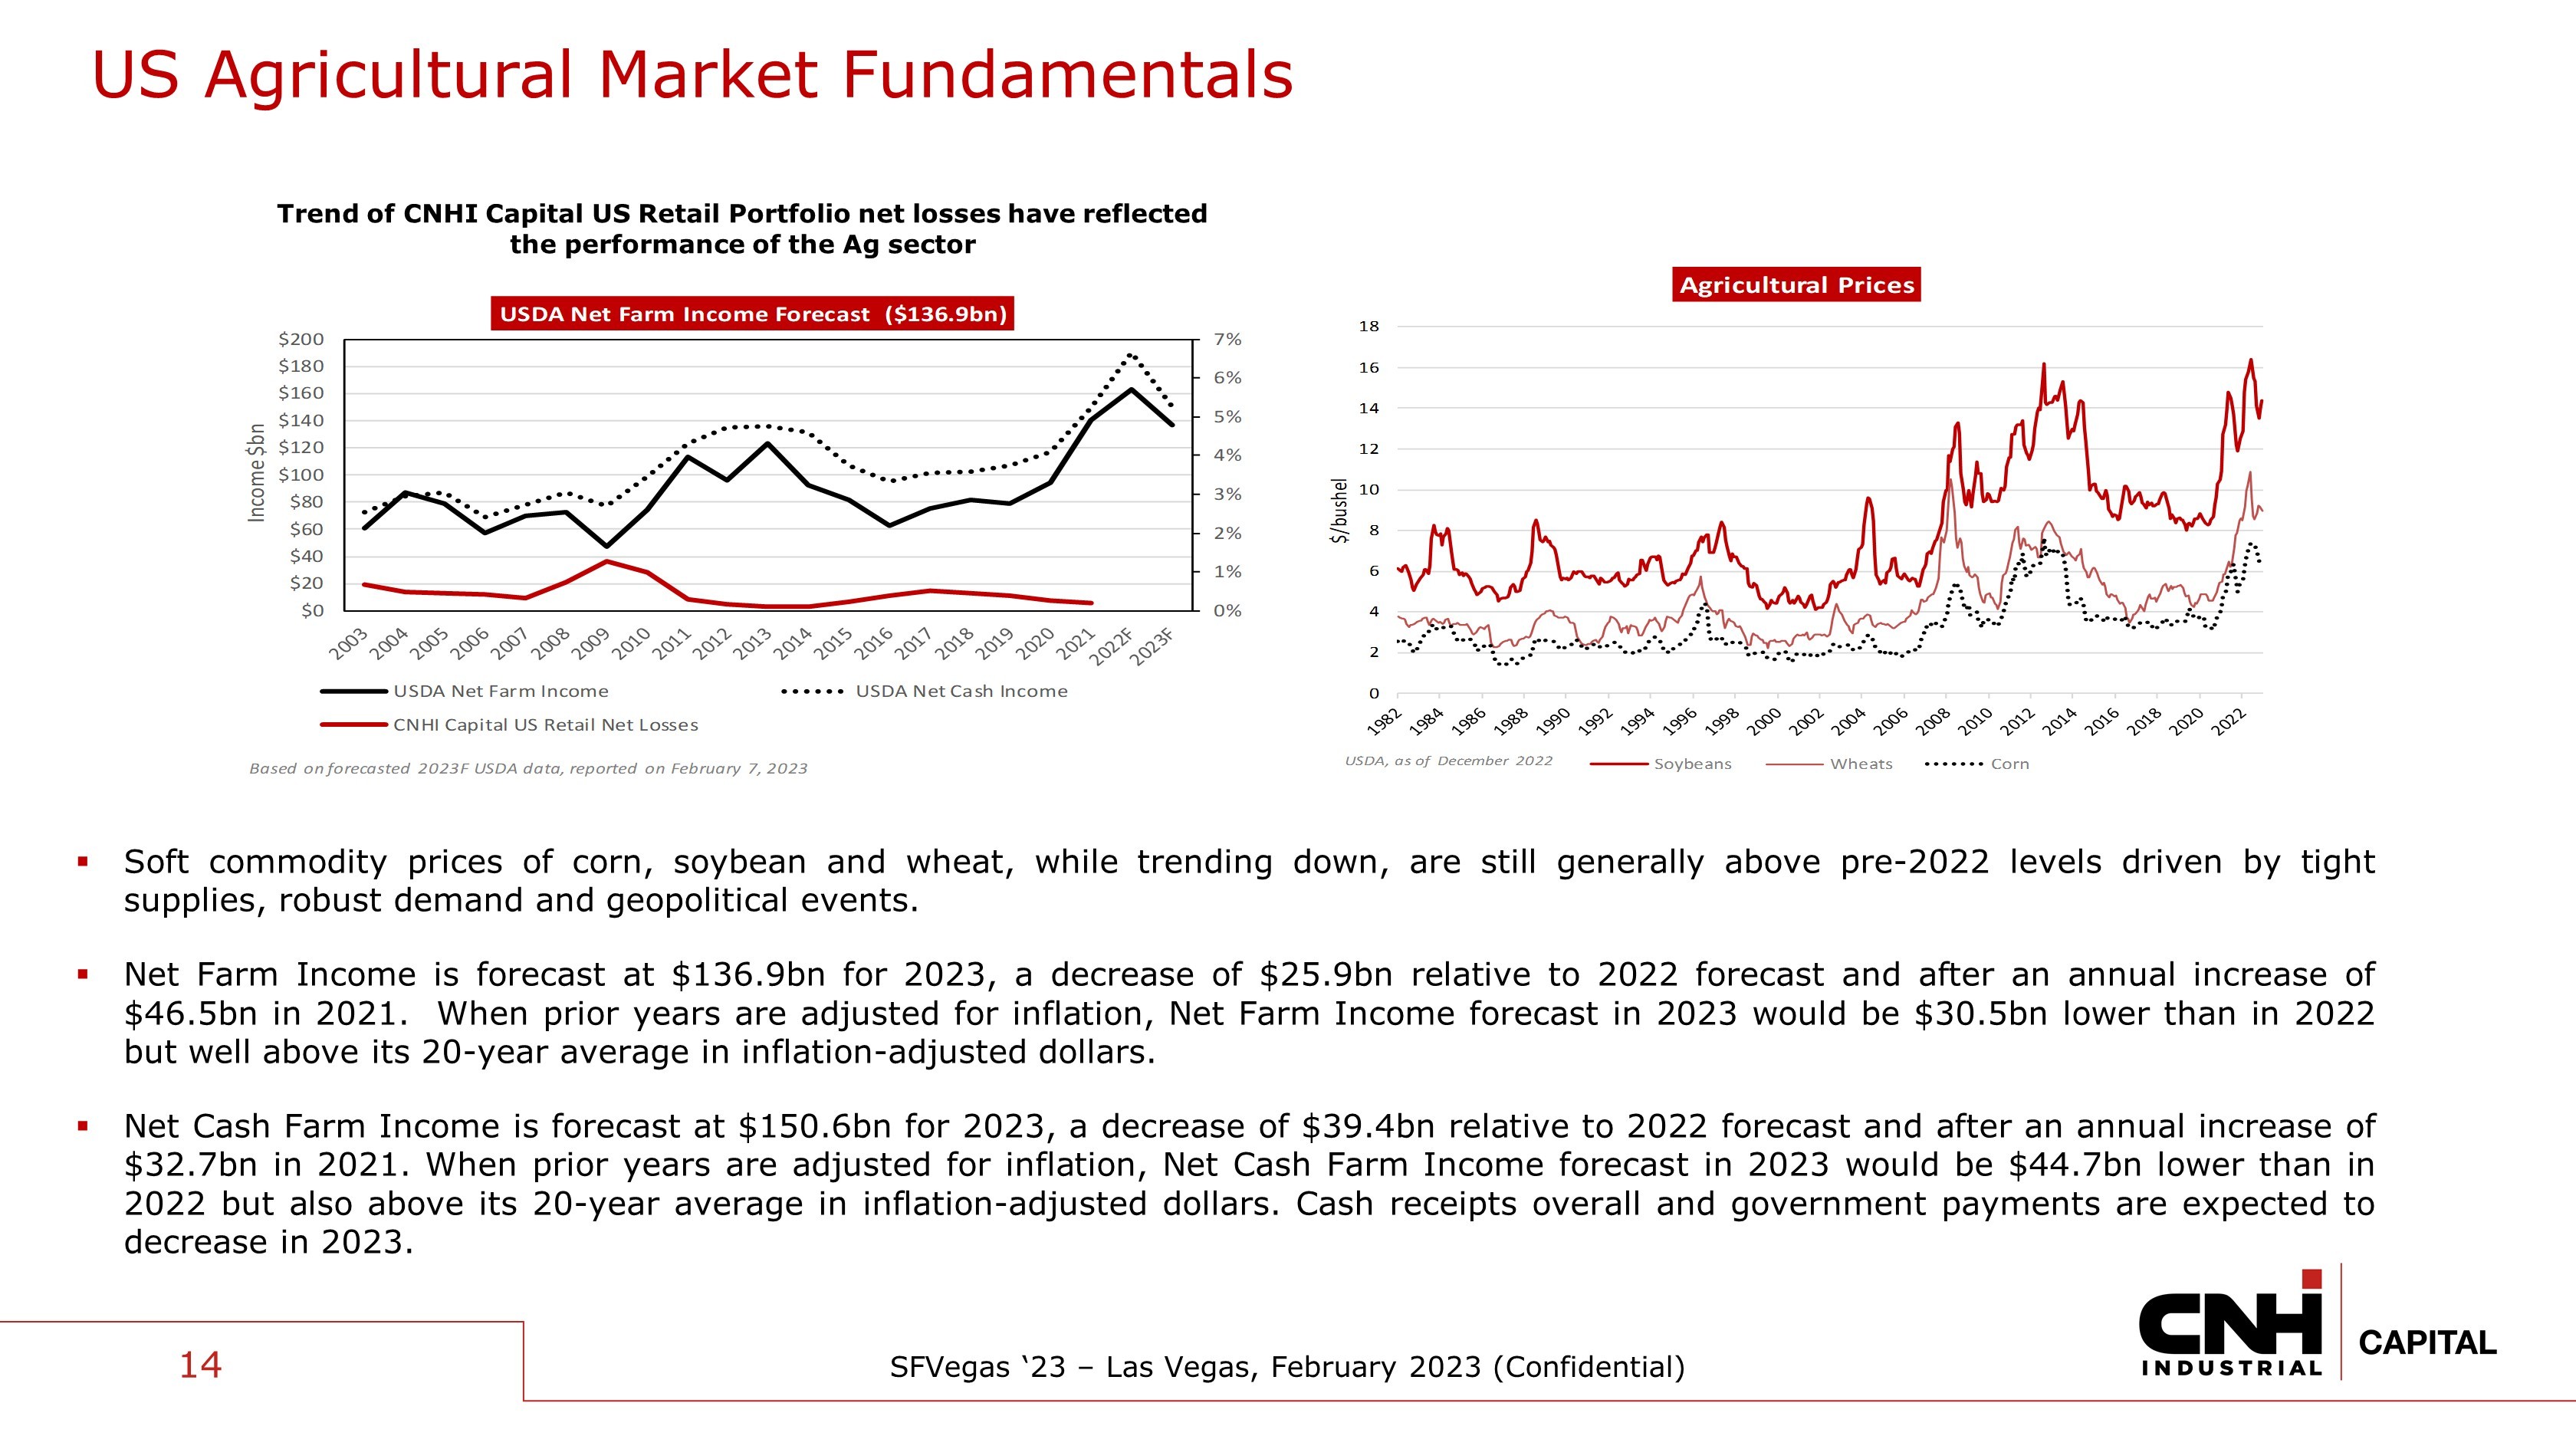
SFVegas ‘23 – Las Vegas, February 2023 (Confidential) 14 US Agricultural Market Fundamentals ▪ Soft commodity prices of corn, soybean and wheat, while trending down, are still generally above pre - 2022 levels driven by tight supplies, robust demand and geopolitical events . ▪ Net Farm Income is forecast at $ 136 . 9 bn for 2023 , a decrease of $ 25 . 9 bn relative to 2022 forecast and after an annual increase of $ 46 . 5 bn in 2021 . When prior years are adjusted for inflation, Net Farm Income forecast in 2023 would be $ 30 . 5 bn lower than in 2022 but well above its 20 - year average in inflation - adjusted dollars . ▪ Net Cash Farm Income is forecast at $ 150 . 6 bn for 2023 , a decrease of $ 39 . 4 bn relative to 2022 forecast and after an annual increase of $ 32 . 7 bn in 2021 . When prior years are adjusted for inflation, Net Cash Farm Income forecast in 2023 would be $ 44 . 7 bn lower than in 2022 but also above its 20 - year average in inflation - adjusted dollars . Cash receipts overall and government payments are expected to decrease in 2023 . Trend of CNHI Capital US Retail Portfolio net losses have reflected the performance of the Ag sector 0% 1% 2% 3% 4% 5% 6% 7% $0 $20 $40 $60 $80 $100 $120 $140 $160 $180 $200 Income $bn USDA Net Farm Income Forecast ($136.9bn) USDA Net Farm Income USDA Net Cash Income CNHI Capital US Retail Net Losses Based on forecasted 2023F USDA data, reported on February 7, 2023 0 2 4 6 8 10 12 14 16 18 $/bushel Agricultural Prices Soybeans Wheats Corn USDA , as of December 2022
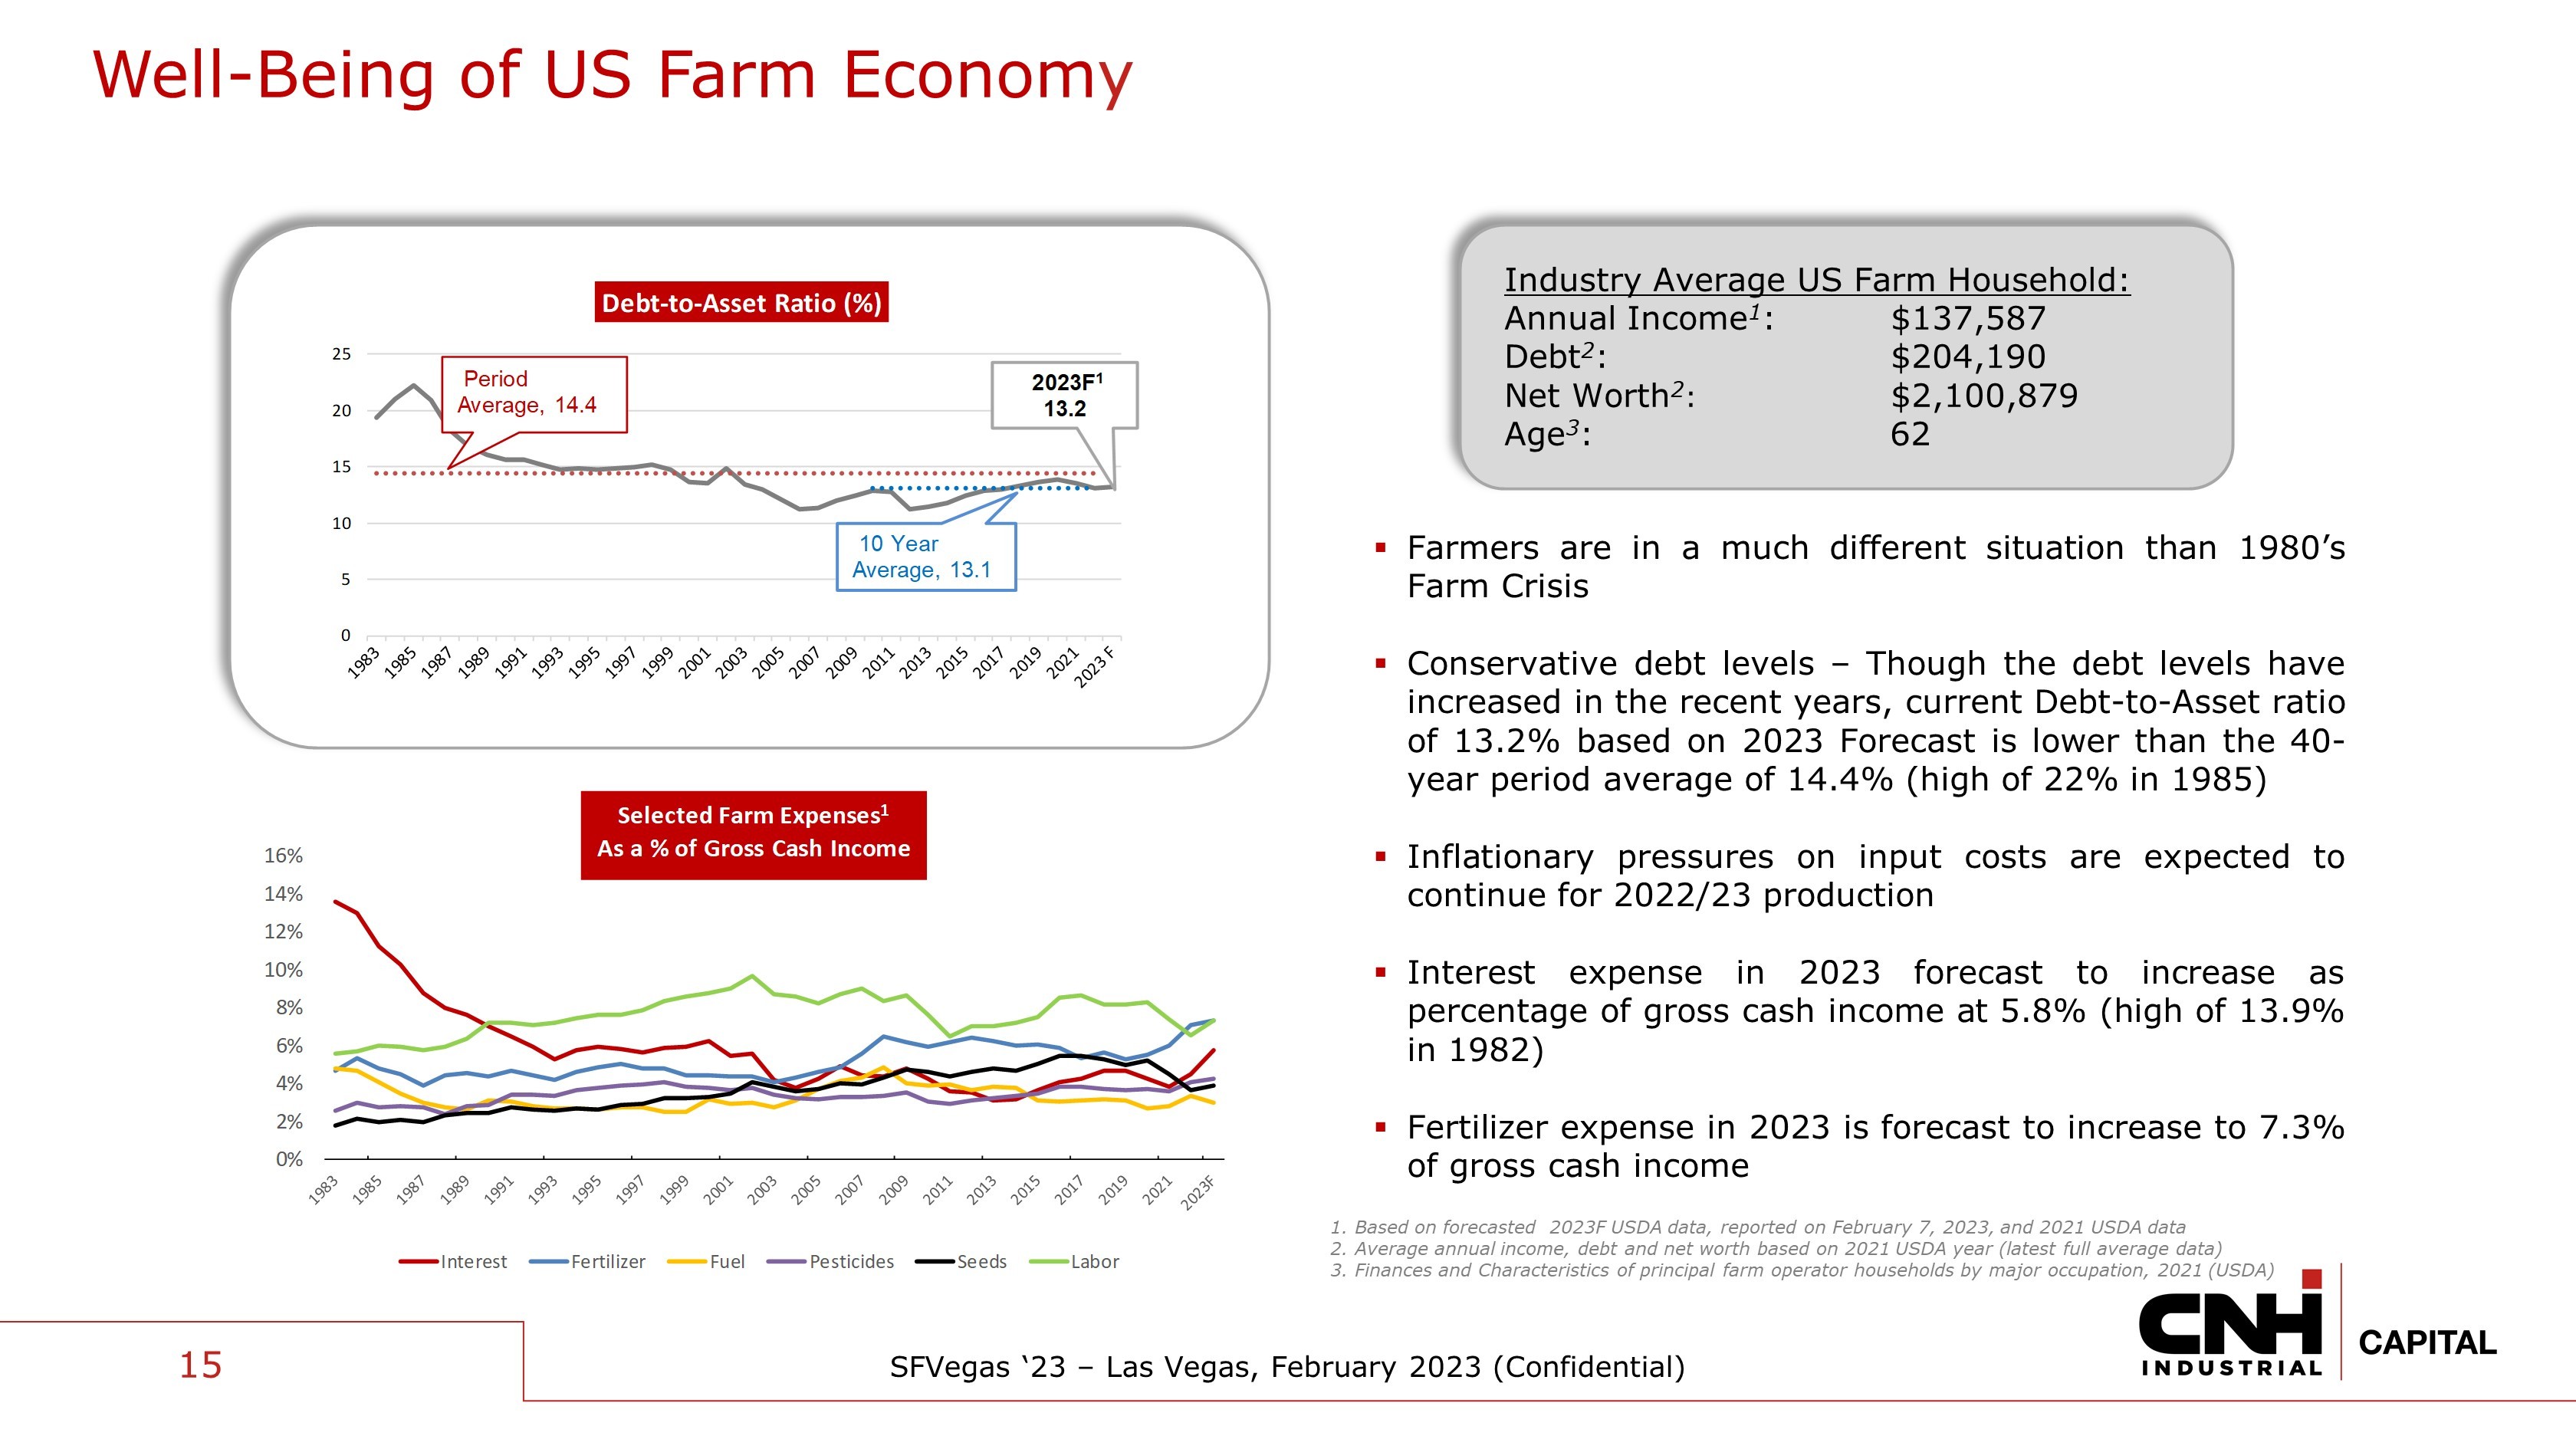
SFVegas ‘23 – Las Vegas, February 2023 (Confidential) 1. Based on forecasted 2023F USDA data, reported on February 7, 2023, and 2021 USDA data 2. Average annual income, debt and net worth based on 2021 USDA year (latest full average data) 3. Finances and Characteristics of principal farm operator households by major occupation, 2021 (USDA) ▪ Farmers are in a much different situation than 1980 ’s Farm Crisis ▪ Conservative debt levels – Though the debt levels have increased in the recent years, current Debt - to - Asset ratio of 13 . 2 % based on 2023 Forecast is lower than the 40 - year period average of 14 . 4 % (high of 22 % in 1985 ) ▪ Inflationary pressures on input costs are expected to continue for 2022 / 23 production ▪ Interest expense in 2023 forecast to increase as percentage of gross cash income at 5 . 8 % (high of 13 . 9 % in 1982 ) ▪ Fertilizer expense in 2023 is forecast to increase to 7 . 3 % of gross cash income Industry Average US Farm Household: Annual Income 1 : $137,587 Debt 2 : $204,190 Net Worth 2 : $2,100,879 Age 3 : 62 15 Well - Being of US Farm Econom y 0 5 10 15 20 25 Debt - to - Asset Ratio (%) Period Average, 14.4 10 Year Average, 13.1 2023F 1 13.2 0% 2% 4% 6% 8% 10% 12% 14% 16% Interest Fertilizer Fuel Pesticides Seeds Labor Selected Farm Expenses 1 As a % of Gross Cash Income
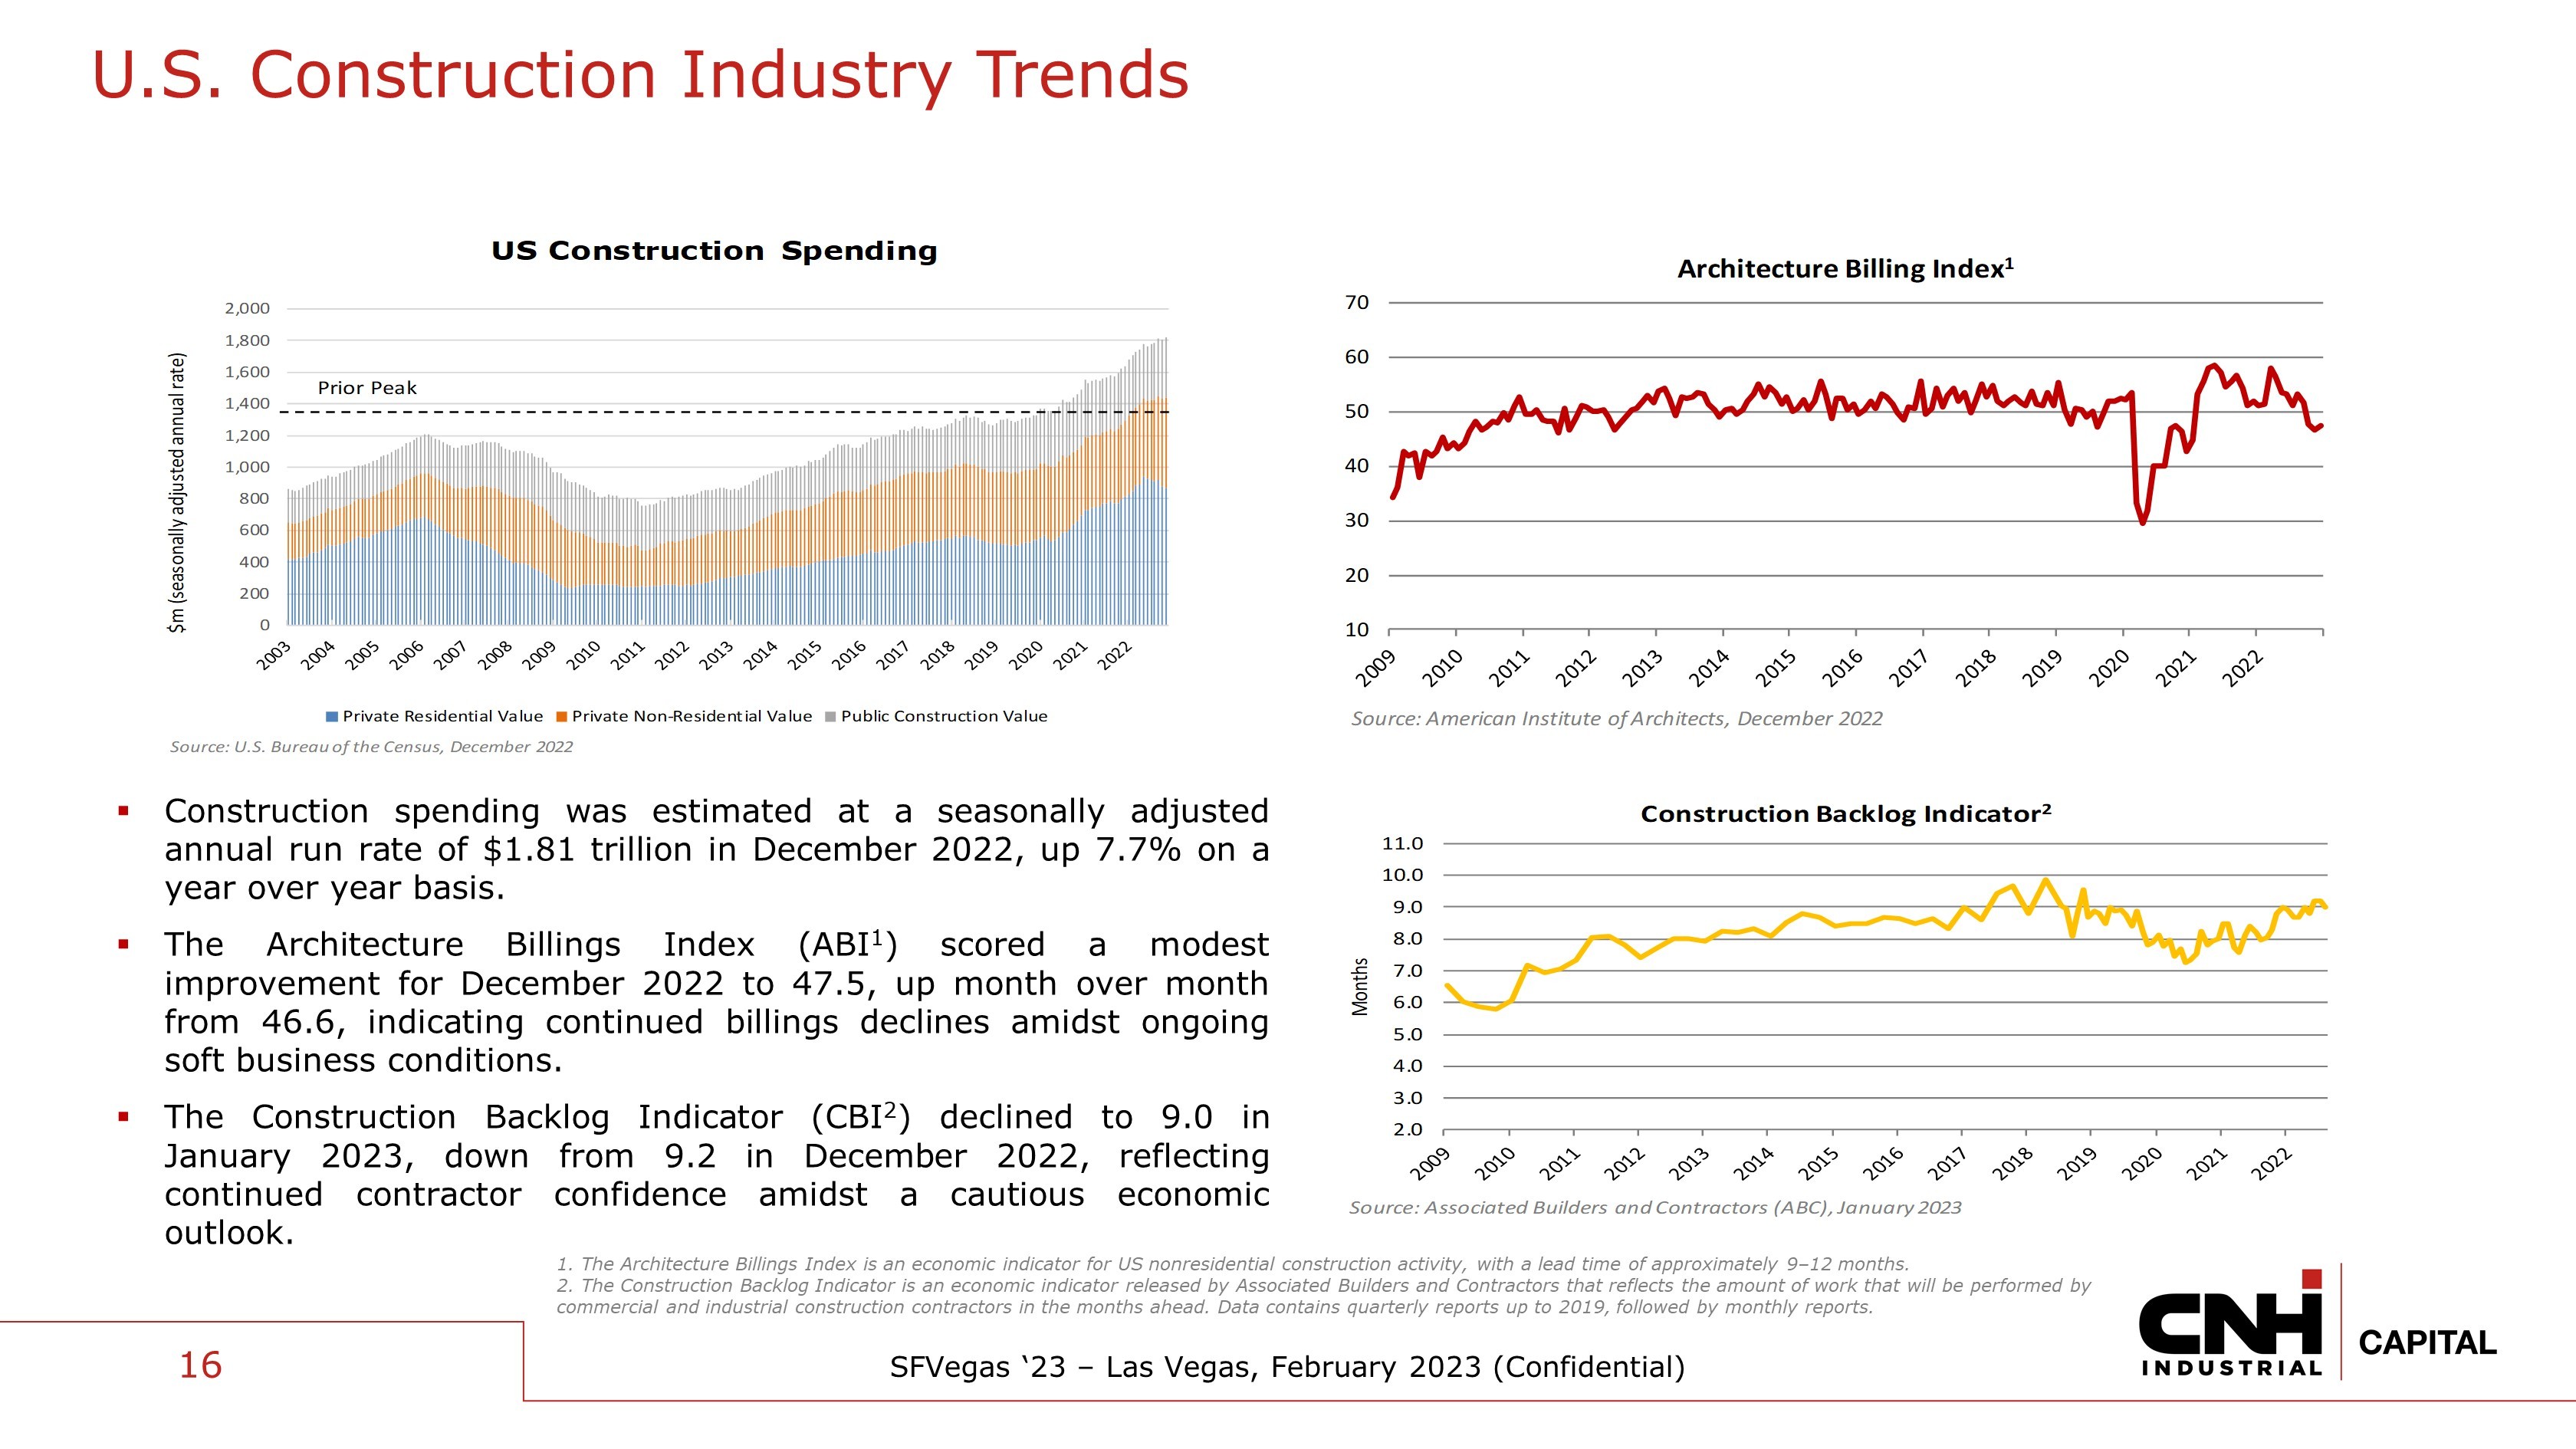
SFVegas ‘23 – Las Vegas, February 2023 (Confidential) 16 U.S. Construction Industry Trends 1. The Architecture Billings Index is an economic indicator for US nonresidential construction activity, with a lead time of app roximately 9 – 12 months. 2. The Construction Backlog Indicator is an economic indicator released by Associated Builders and Contractors that reflects the amount of work that will be performed by commercial and industrial construction contractors in the months ahead. Data contains quarterly reports up to 2019, followed by monthly reports. ▪ Construction spending was estimated at a seasonally adjusted annual run rate of $ 1 . 81 trillion in December 2022 , up 7 . 7 % on a year over year basis . ▪ The Architecture Billings Index (ABI 1 ) scored a modest improvement for December 2022 to 47 . 5 , up month over month from 46 . 6 , indicating continued billings declines amidst ongoing soft business conditions . ▪ The Construction Backlog Indicator (CBI 2 ) declined to 9 . 0 in January 2023 , down from 9 . 2 in December 2022 , reflecting continued contractor confidence amidst a cautious economic outlook . 0 200 400 600 800 1,000 1,200 1,400 1,600 1,800 2,000 $m (seasonally adjusted annual rate) US Construction Spending Private Residential Value Private Non-Residential Value Public Construction Value Prior Peak Source: U.S. Bureau of the Census, December 2022 10 20 30 40 50 60 70 Architecture Billing Index 1 Source: American Institute of Architects, December 2022 2.0 3.0 4.0 5.0 6.0 7.0 8.0 9.0 10.0 11.0 Months Construction Backlog Indicator 2 Source: Associated Builders and Contractors (ABC), January 2023

SFVegas ‘23 – Las Vegas, February 2023 (Confidential) 17 Chapter 4 Our ABS Program
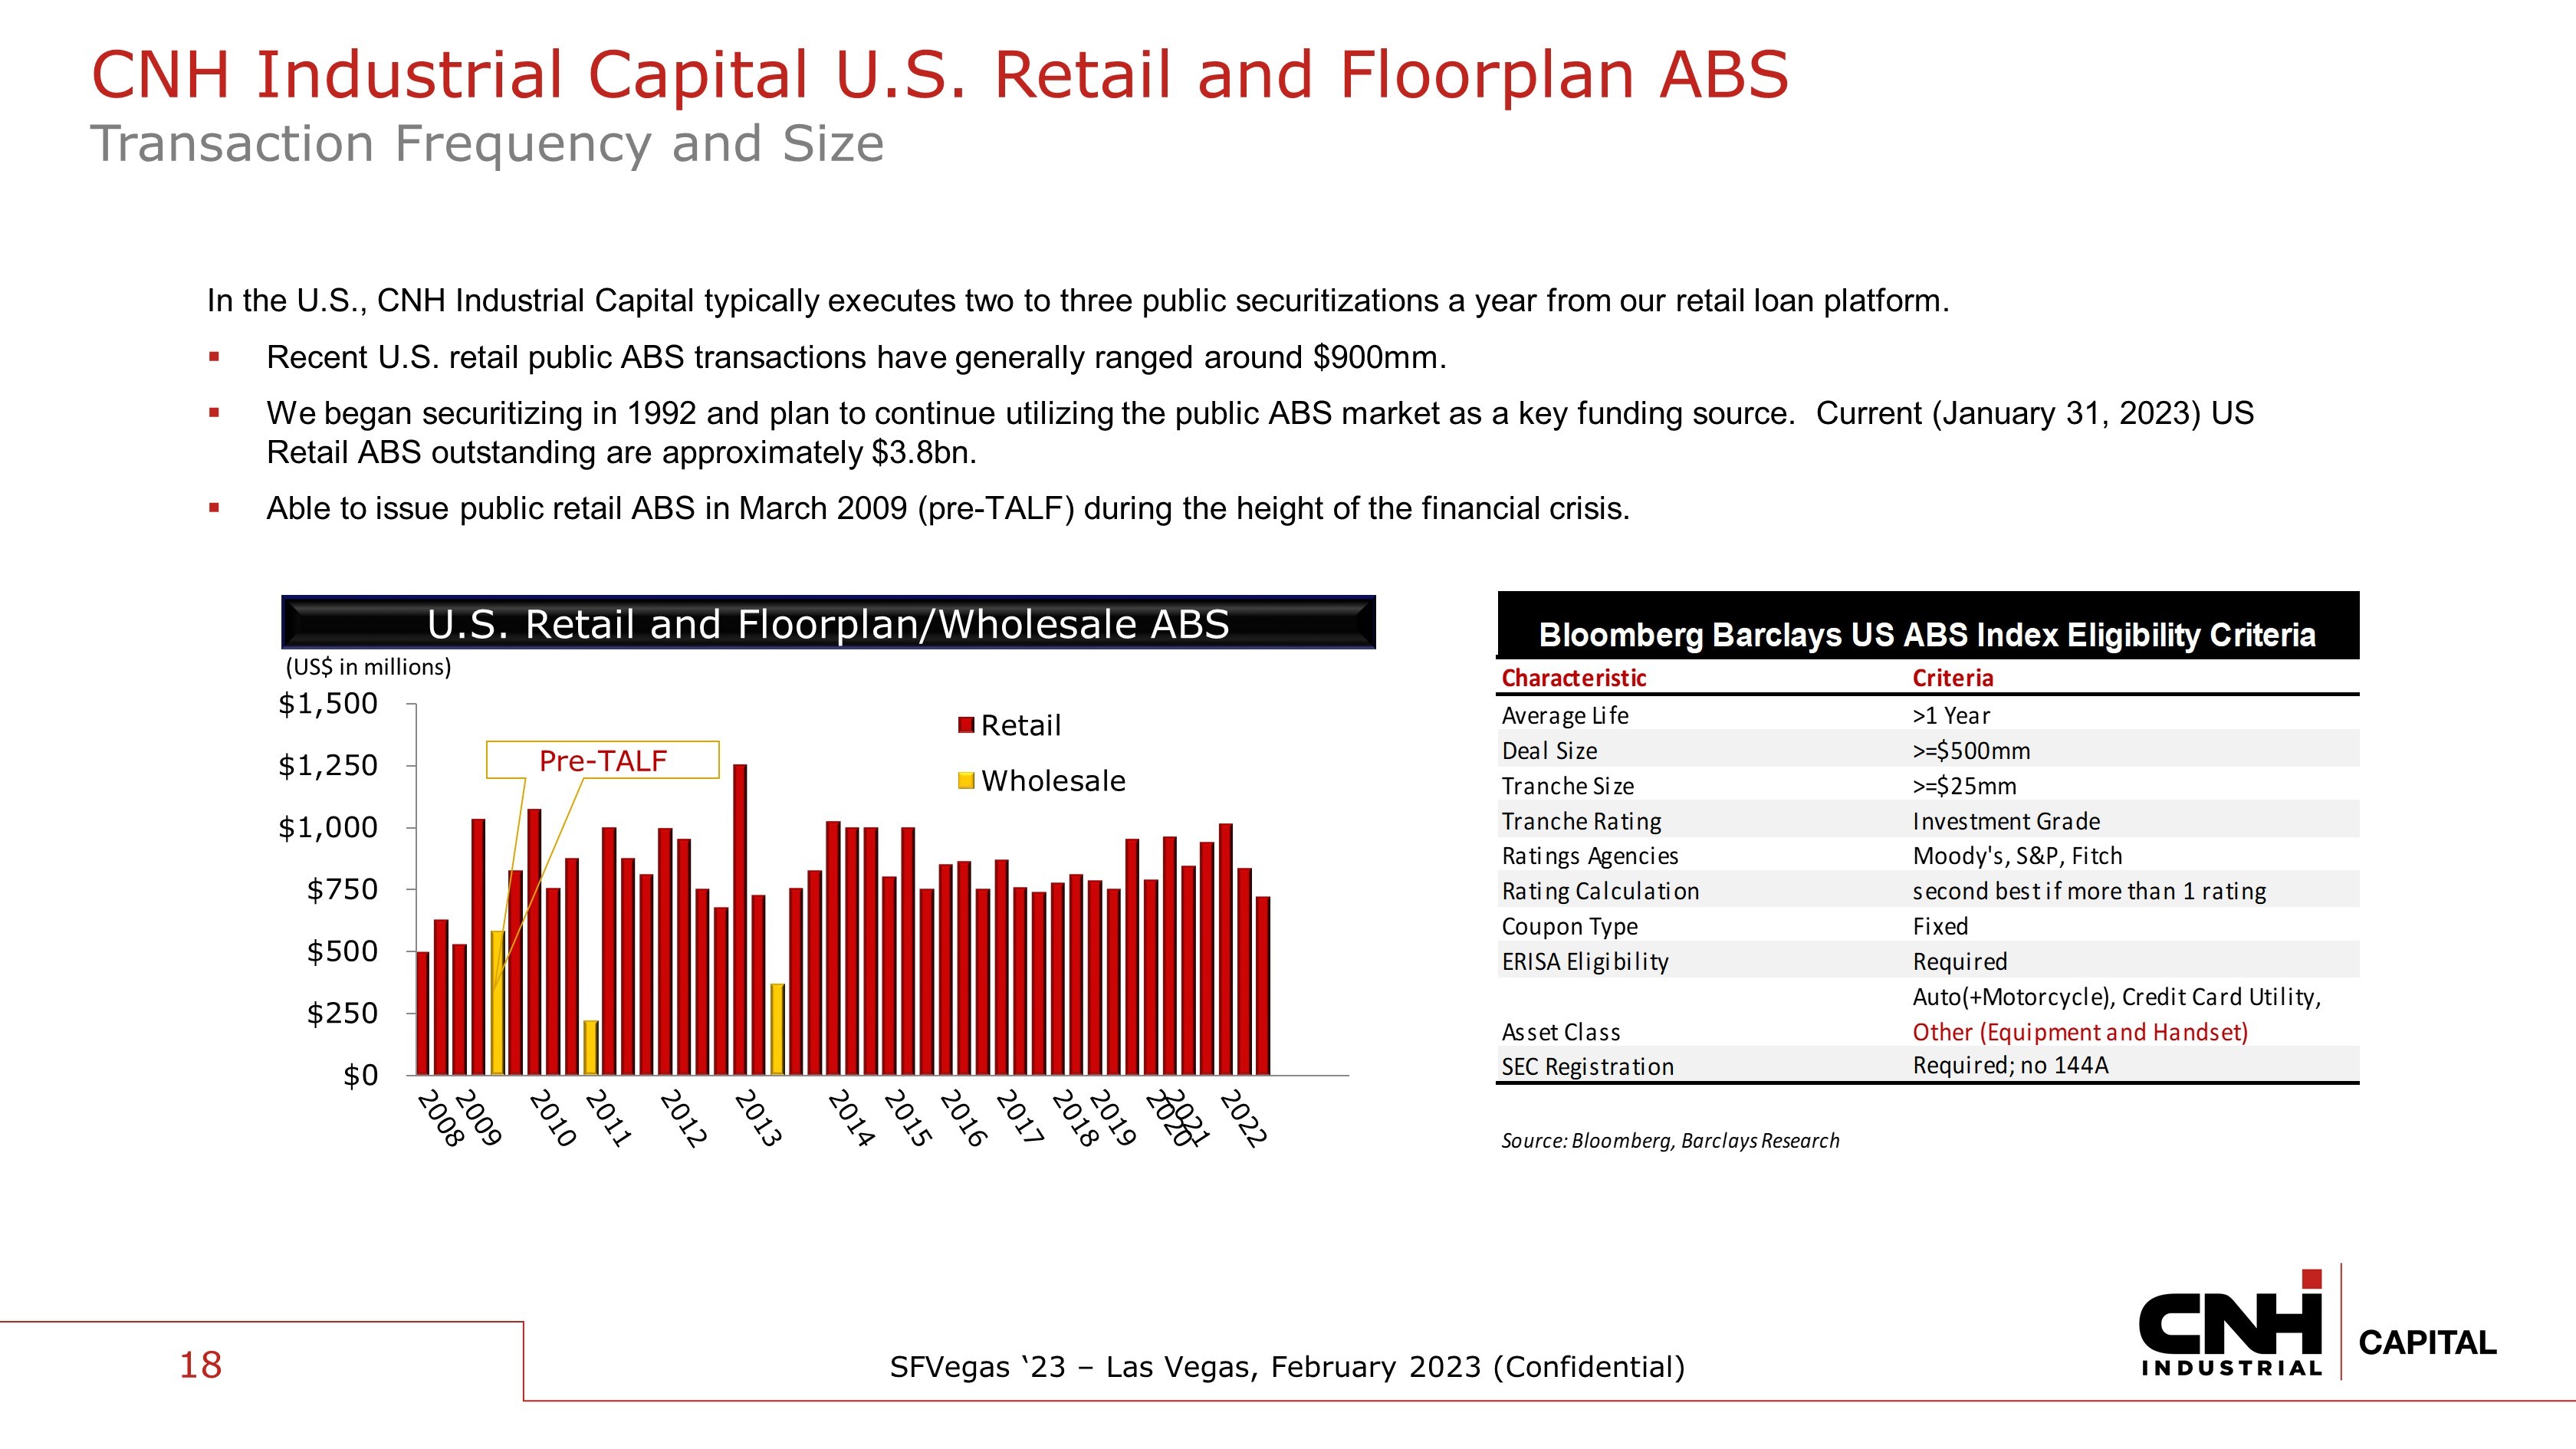
SFVegas ‘23 – Las Vegas, February 2023 (Confidential) In the U.S., CNH Industrial Capital typically executes two to three public securitizations a year from our retail loan platfo rm. ▪ Recent U.S. retail public ABS transactions have generally ranged around $900mm. ▪ We began securitizing in 1992 and plan to continue utilizing the public ABS market as a key funding source. Current (January 31 , 2023) US Retail ABS outstanding are approximately $3.8bn. ▪ Able to issue public retail ABS in March 2009 (pre - TALF) during the height of the financial crisis. 18 Characteristic Criteria Average Life >1 Year Deal Size >=$500mm Tranche Size >=$25mm Tranche Rating Investment Grade Ratings Agencies Moody's, S&P, Fitch Rating Calculation second best if more than 1 rating Coupon Type Fixed ERISA Eligibility Required Asset Class Auto(+Motorcycle), Credit Card Utility, Other (Equipment and Handset) SEC Registration Required; no 144A Source: Bloomberg, Barclays Research Bloomberg Barclays US ABS Index Eligibility Criteria CNH Industrial Capital U.S. Retail and Floorplan ABS Transaction Frequency and Size U.S. Retail and Floorplan/Wholesale ABS (US$ in millions) $0 $250 $500 $750 $1,000 $1,250 $1,500 Retail Wholesale Pre - TALF
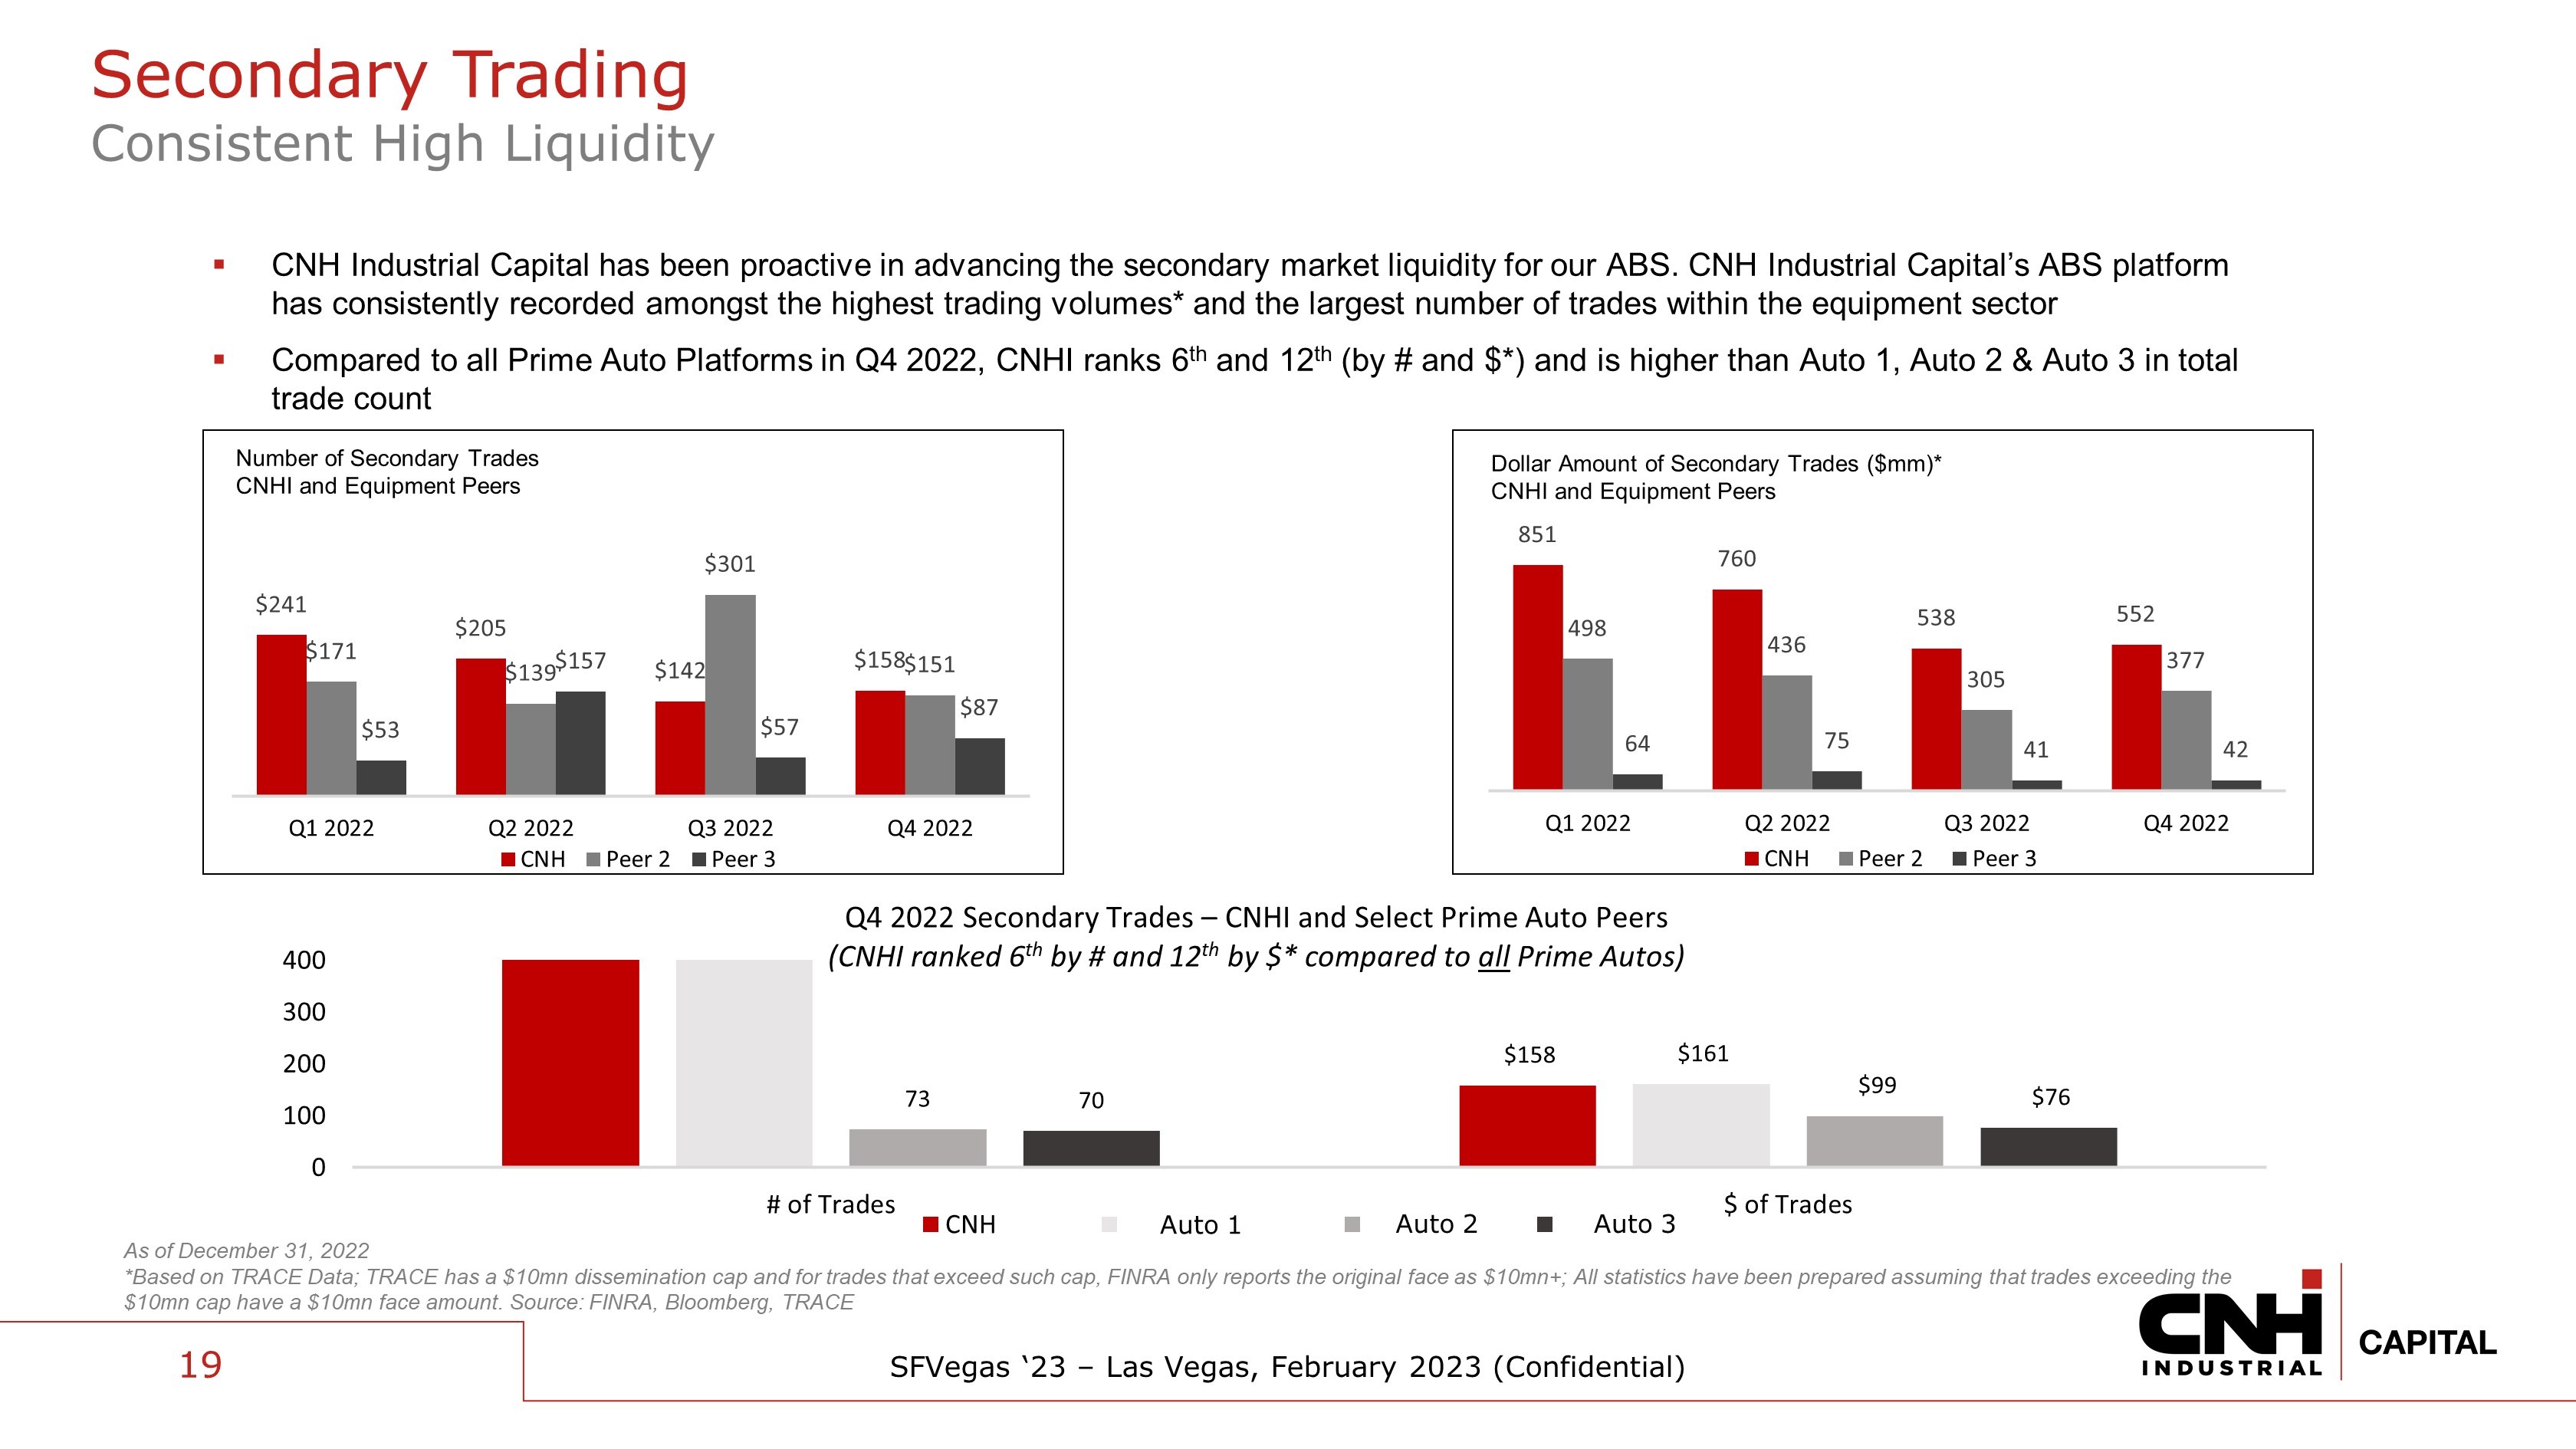
SFVegas ‘23 – Las Vegas, February 2023 (Confidential) ▪ CNH Industrial Capital has been proactive in advancing the secondary market liquidity for our ABS. CNH Industrial Capital’s A BS platform has consistently recorded amongst the highest trading volumes* and the largest number of trades within the equipment sector ▪ Compared to all Prime Auto Platforms in Q4 2022, CNHI ranks 6 th and 12 th (by # and $*) and is higher than Auto 1 , Auto 2 & Auto 3 in total trade count As of December 31 , 2022 *Based on TRACE Data; TRACE has a $10mn dissemination cap and for trades that exceed such cap, FINRA only reports the origina l f ace as $10mn+; All statistics have been prepared assuming that trades exceeding the $10mn cap have a $10mn face amount. Source: FINRA, Bloomberg, TRACE Number of Secondary Trades CNHI and Equipment Peers Dollar Amount of Secondary Trades ($mm)* CNHI and Equipment Peers 19 Secondary Trading Consistent High Liquidity $158 $161 73 $99 70 $76 0 100 200 300 400 # of Trades $ of Trades Q4 2022 Secondary Trades – CNHI and Select Prime Auto Peers (CNHI ranked 6 th by # and 12 th by $* compared to all Prime Autos) CNH Mercedes BMW VW $241 $205 $142 $158 $171 $139 $301 $151 $53 $157 $57 $87 Q1 2022 Q2 2022 Q3 2022 Q4 2022 CNH Peer 2 Peer 3 851 760 538 552 498 436 305 377 64 75 41 42 Q1 2022 Q2 2022 Q3 2022 Q4 2022 CNH Peer 2 Peer 3 Auto 1 Auto 2 Auto 3
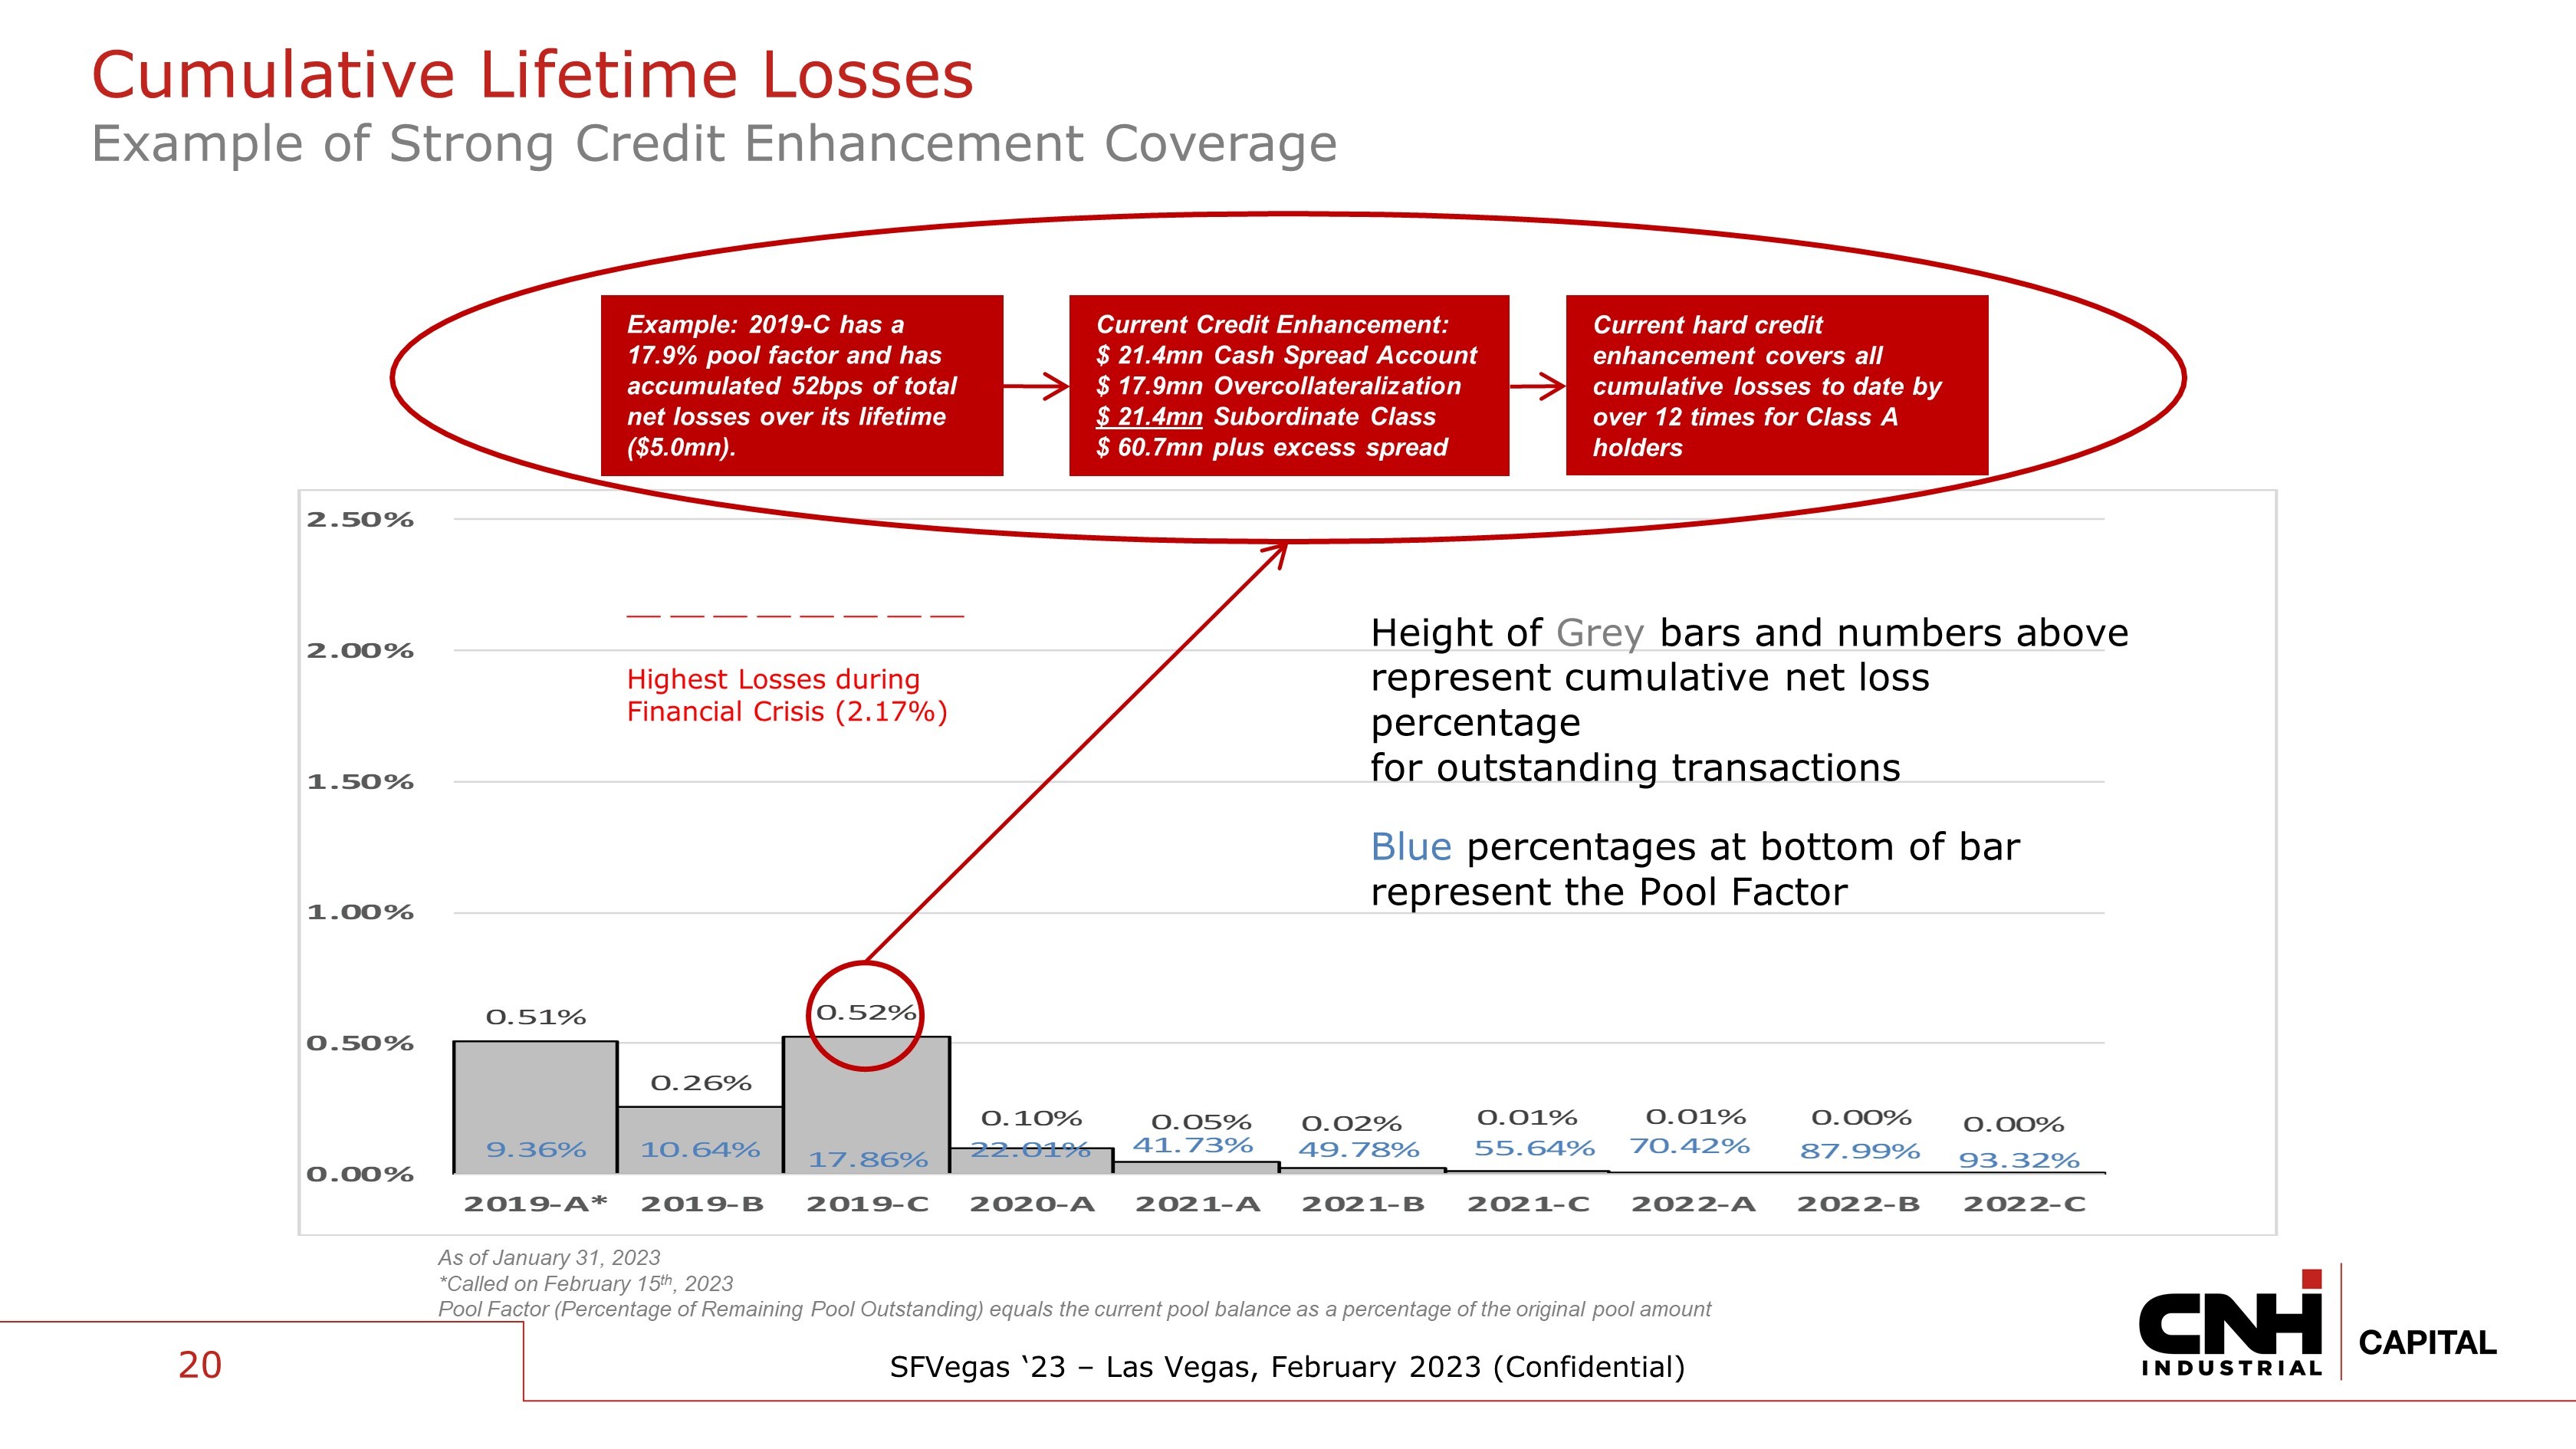
SFVegas ‘23 – Las Vegas, February 2023 (Confidential) 0.51% 0.26% 0.52% 0.10% 0.05% 0.02% 0.01% 0.01% 0.00% 0.00% 9.36% 10.64% 17.86% 22.01% 41.73% 49.78% 55.64% 70.42% 87.99% 93.32% 0.00% 0.50% 1.00% 1.50% 2.00% 2.50% 2019-A* 2019-B 2019-C 2020-A 2021-A 2021-B 2021-C 2022-A 2022-B 2022-C Example: 2019 - C has a 17.9% pool factor and has accumulated 52bps of total net losses over its lifetime ($5.0mn). As of January 31, 2023 *Called on February 15 th , 2023 Pool Factor (Percentage of Remaining Pool Outstanding) equals the current pool balance as a percentage of the original pool a mou nt Current Credit Enhancement: $ 21.4mn Cash Spread Account $ 17.9mn Overcollateralization $ 21.4mn Subordinate Class $ 60.7mn plus excess spread 20 Current hard credit enhancement covers all cumulative losses to date by over 12 times for Class A holders __ __ __ __ __ __ __ __ Highest Losses during Financial Crisis (2.17%) Height of Grey bars and numbers above represent cumulative net loss percentage for outstanding transactions Blue percentages at bottom of bar represent the Pool Factor 20 Cumulative Lifetime Losses Example of Strong Credit Enhancement Coverage
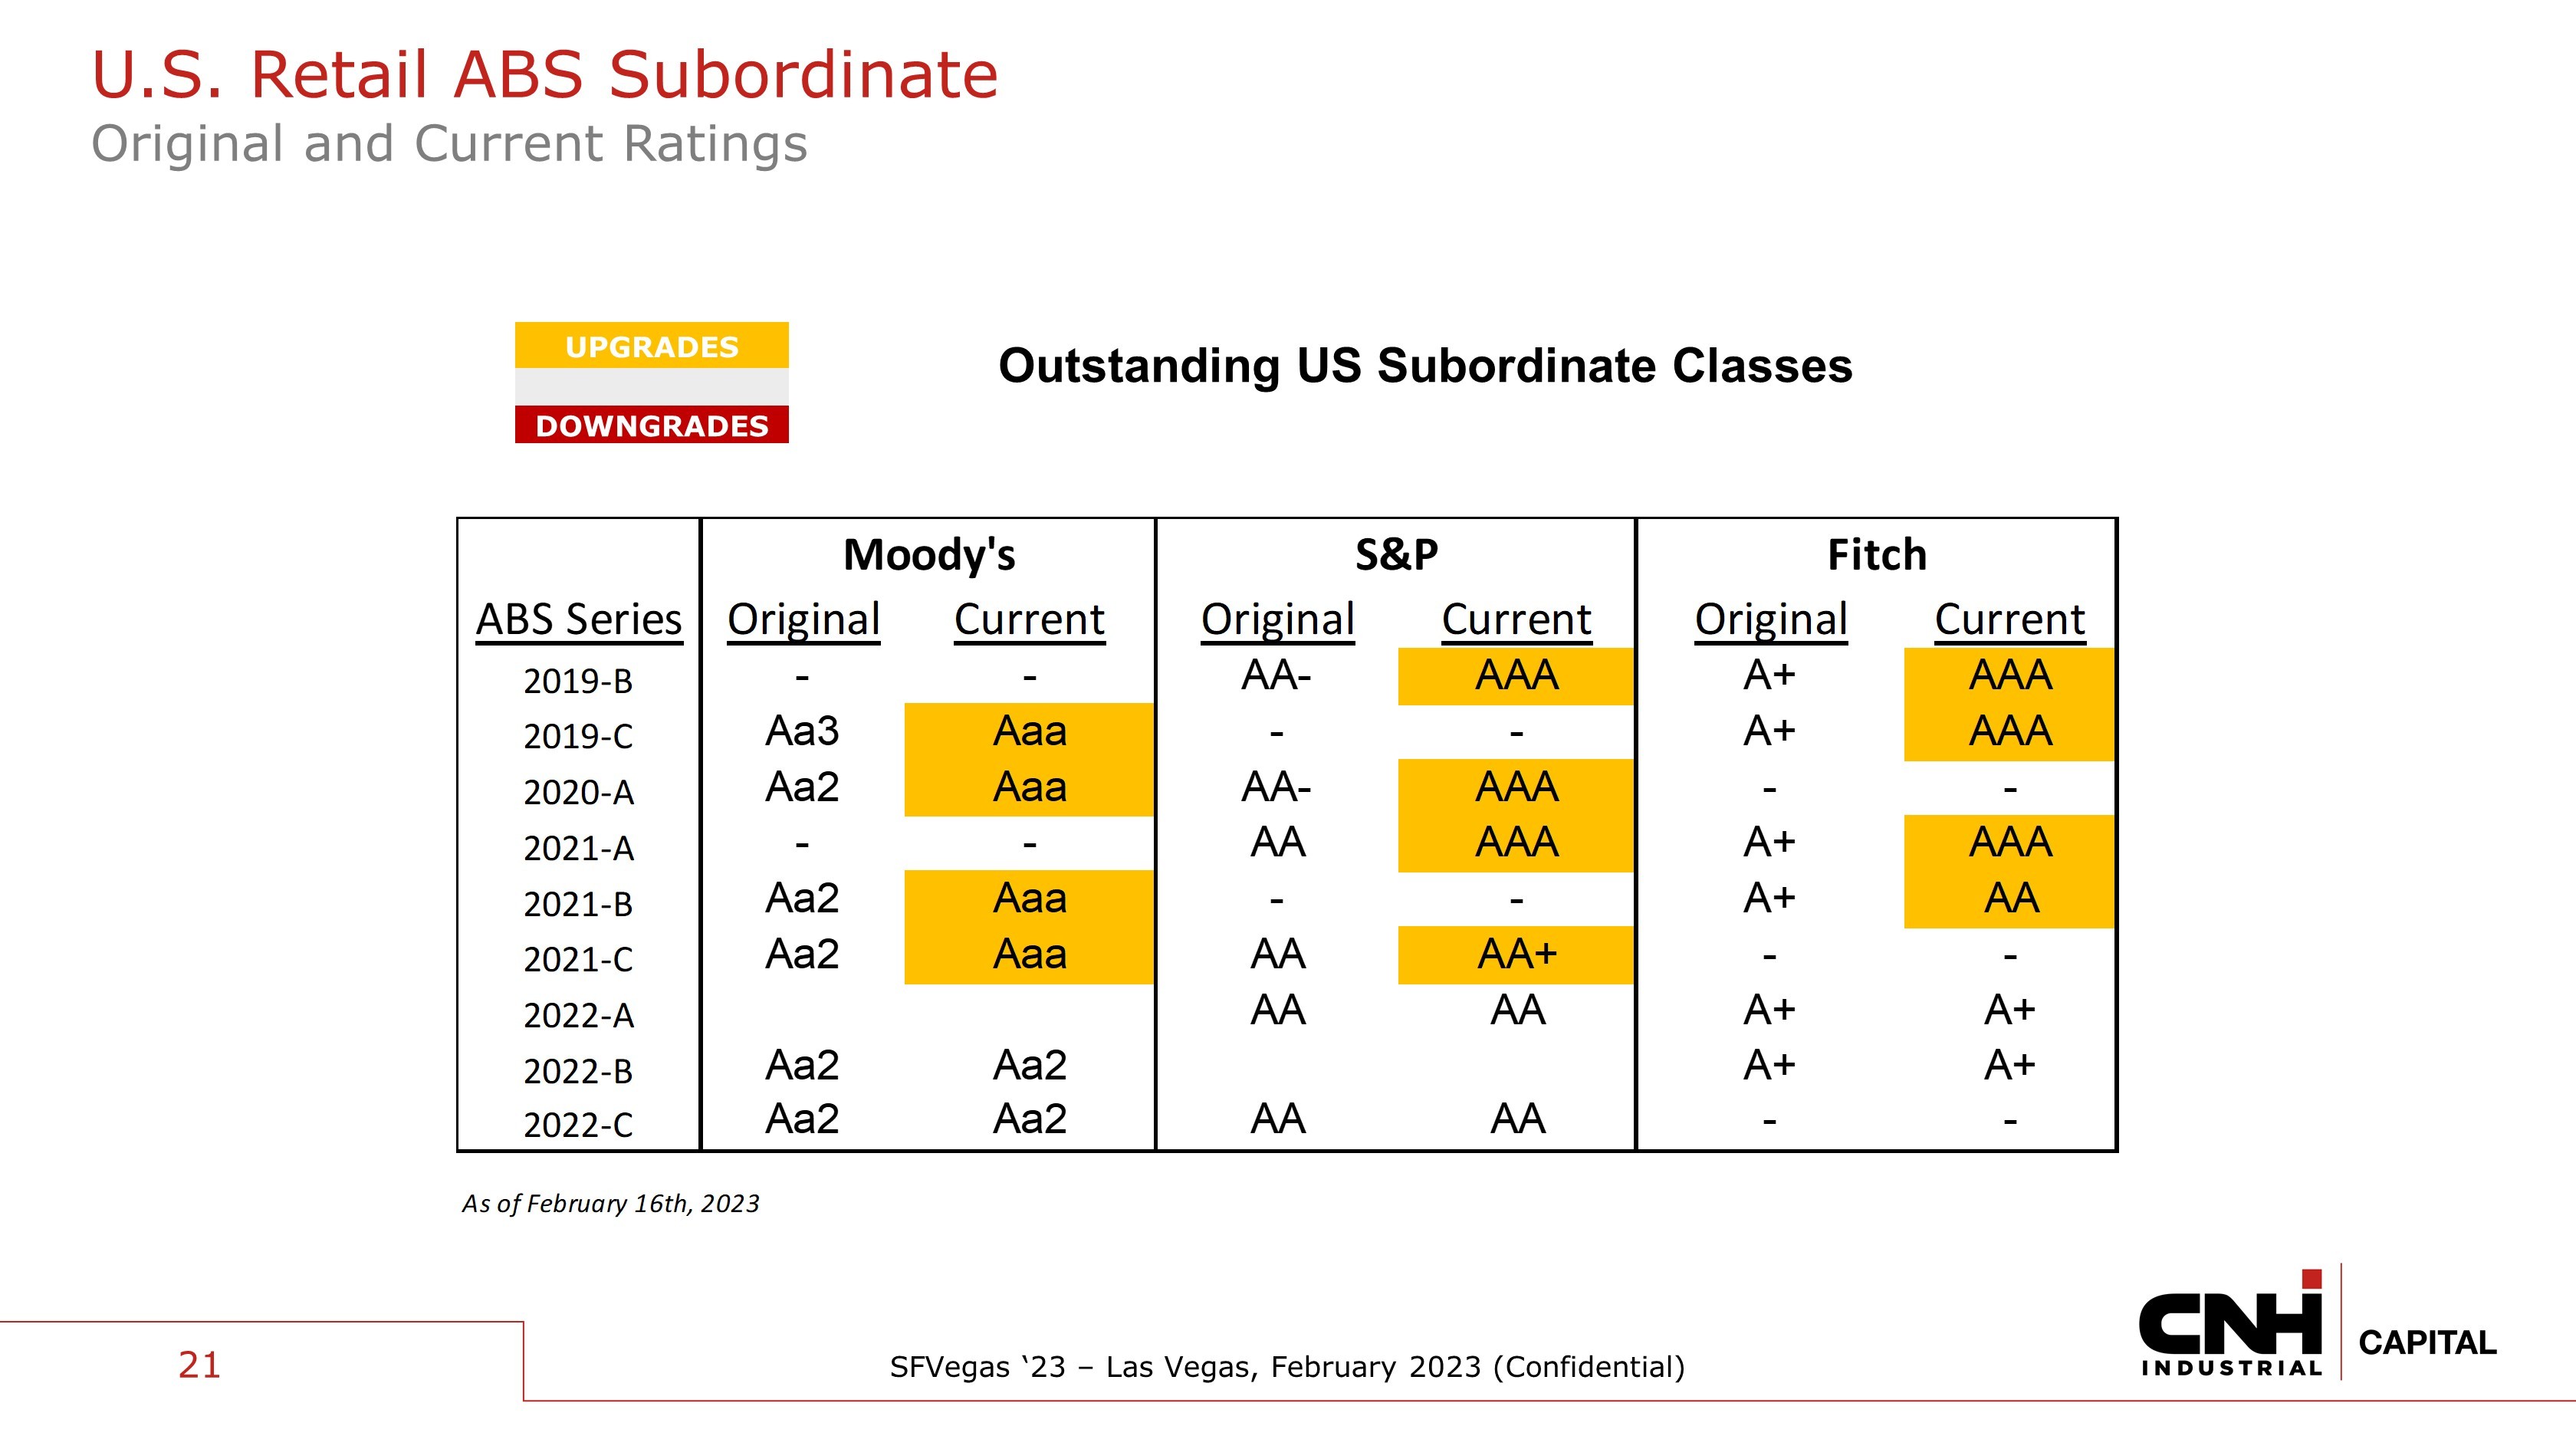
SFVegas ‘23 – Las Vegas, February 2023 (Confidential) Outstanding US Subordinate Classes UPGRADES DOWNGRADES 21 U.S. Retail ABS Subordinate Original and Current Ratings Original Current Original Current Original Current 2019-B - - AA- AAA A+ AAA 2019-C Aa3 Aaa - - A+ AAA 2020-A Aa2 Aaa AA- AAA - - 2021-A - - AA AAA A+ AAA 2021-B Aa2 Aaa - - A+ AA 2021-C Aa2 Aaa AA AA+ - - 2022-A AA AA A+ A+ 2022-B Aa2 Aa2 A+ A+ 2022-C Aa2 Aa2 AA AA - - ABS Series Moody's S&P Fitch As of February 16th, 2023
SFVegas ‘23 – Las Vegas, February 2023 (Confidential) 22 Strategic relationship with well positioned Parent Company Leading and profitable equipment lender Disciplined underwriting and servicing High quality portfolio performance Profitable, IG captive with diverse funding Farmers’ strong financial condition counters agriculture market cyclicality T HANK YOU !