UNITED STATES
SECURITIES AND EXCHANGE COMMISSION
Washington, D.C. 20549
FORM N-CSR
CERTIFIED SHAREHOLDER REPORT OF REGISTERED MANAGEMENT INVESTMENT COMPANIES
Investment Company Act file number 811-22717
First Trust Exchange-Traded Fund VI
(Exact name of registrant as specified in charter)
120 East Liberty Drive, Suite 400
Wheaton, IL 60187
(Address of principal executive offices) (Zip code)
W. Scott Jardine, Esq.
First Trust Portfolios L.P.
120 East Liberty Drive, Suite 400
Wheaton, IL 60187
(Name and address of agent for service)
Registrant’s telephone number, including area code: (630) 765-8000
Date of fiscal year end: September 30
Date of reporting period: March 31, 2021
Form N-CSR is to be used by management investment companies to file reports with the Commission not later than 10 days after the transmission to stockholders of any report that is required to be transmitted to stockholders under Rule 30e-1 under the Investment Company Act of 1940 (17 CFR 270.30e-1). The Commission may use the information provided on Form N-CSR in its regulatory, disclosure review, inspection, and policymaking roles.
A registrant is required to disclose the information specified by Form N-CSR, and the Commission will make this information public. A registrant is not required to respond to the collection of information contained in Form N-CSR unless the Form displays a currently valid Office of Management and Budget (“OMB”) control number. Please direct comments concerning the accuracy of the information collection burden estimate and any suggestions for reducing the burden to Secretary, Securities and Exchange Commission, 100 F Street, NE, Washington, DC 20549p. The OMB has reviewed this collection of information under the clearance requirements of 44 U.S.C. § 3507.
Item 1. Report to Stockholders.
The registrant’s semi-annual report transmitted to shareholders pursuant to Rule 30e-1 under the Investment Company Act of 1940 is as follows:

Book 1
First Trust NASDAQ Technology Dividend Index Fund (TDIV)
Multi-Asset Diversified Income Index Fund (MDIV)
First Trust S&P International Dividend Aristocrats ETF (FID)
First Trust BuyWrite Income ETF (FTHI)
First Trust Hedged BuyWrite Income ETF (FTLB)
First Trust Rising Dividend Achievers ETF (RDVY)
First Trust Dorsey Wright Focus 5 ETF (FV)
First Trust RBA American Industrial Renaissance® ETF (AIRR)
First Trust Dorsey Wright Momentum & Dividend ETF (DDIV)
First Trust Dorsey Wright International Focus 5 ETF (IFV)
First Trust Dorsey Wright Dynamic Focus 5 ETF (FVC)
For the Six Months Ended
March 31, 2021
| 2 | |
| 3 | |
| Fund Performance Overview | |
| 4 | |
| 6 | |
| 8 | |
| 11 | |
| 13 | |
| 15 | |
| 17 | |
| 19 | |
| 21 | |
| 23 | |
| 25 | |
| 27 | |
| 28 | |
| Portfolio of Investments | |
| 30 | |
| 32 | |
| 38 | |
| 41 | |
| 50 | |
| 59 | |
| 61 | |
| 62 | |
| 64 | |
| 66 | |
| 67 | |
| 68 | |
| 70 | |
| 72 | |
| 78 | |
| 89 | |
| 103 |


| Performance | |||||||
| Average Annual Total Returns | Cumulative Total Returns | ||||||
| 6 Months Ended 3/31/21 | 1 Year Ended 3/31/21 | 5 Years Ended 3/31/21 | Inception (8/13/12) to 3/31/21 | 5 Years Ended 3/31/21 | Inception (8/13/12) to 3/31/21 | ||
| Fund Performance | |||||||
| NAV | 24.34% | 55.53% | 17.70% | 15.11% | 125.92% | 236.81% | |
| Market Price | 24.47% | 55.58% | 17.75% | 15.11% | 126.34% | 236.90% | |
| Index Performance | |||||||
| NASDAQ Technology Dividend IndexSM | 24.77% | 56.67% | 18.48% | 15.86% | 133.43% | 256.37% | |
| S&P 500® Index | 19.07% | 56.35% | 16.29% | 15.13% | 112.71% | 237.22% | |
| S&P 500® Information Technology Index | 14.02% | 66.61% | 27.64% | 21.80% | 238.74% | 448.66% | |
| Sector Allocation | % of Total Investments |
| Information Technology | 75.7% |
| Communication Services | 21.4 |
| Industrials | 2.4 |
| Health Care | 0.5 |
| Consumer Discretionary | 0.0% * |
| Total | 100.0% |
| * | Amount is less than 0.05%. |
| Top Ten Holdings | % of Total Investments |
| Cisco Systems, Inc. | 8.6% |
| International Business Machines Corp. | 8.4 |
| Microsoft Corp. | 7.6 |
| Apple, Inc. | 7.5 |
| Broadcom, Inc. | 7.3 |
| Texas Instruments, Inc. | 4.1 |
| Oracle Corp. | 4.1 |
| Intel Corp. | 3.9 |
| QUALCOMM, Inc. | 3.6 |
| Shaw Communications, Inc., Class B | 2.8 |
| Total | 57.9% |
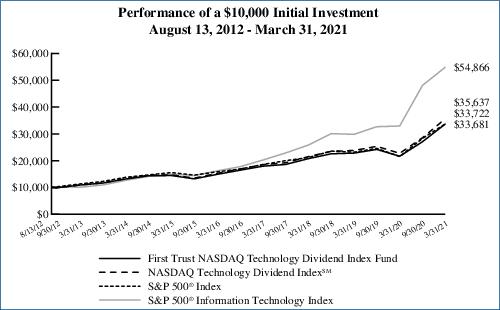
Performance figures assume reinvestment of all distributions and do not reflect the deduction of taxes that a shareholder would pay on Fund distributions or the redemption or sale of Fund shares. An index is a statistical composite that tracks a specified financial market or sector. Unlike the Fund, the indices do not actually hold a portfolio of securities and therefore do not incur the expenses incurred by the Fund. These expenses negatively impact the performance of the Fund. The Fund’s past performance does not predict future performance.
| Performance | |||||||
| Average Annual Total Returns | Cumulative Total Returns | ||||||
| 6 Months Ended 3/31/21 | 1 Year Ended 3/31/21 | 5 Years Ended 3/31/21 | Inception (8/13/12) to 3/31/21 | 5 Years Ended 3/31/21 | Inception (8/13/12) to 3/31/21 | ||
| Fund Performance | |||||||
| NAV | 23.08% | 46.39% | 3.40% | 3.63% | 18.18% | 36.06% | |
| Market Price | 23.18% | 46.65% | 3.41% | 3.63% | 18.25% | 36.07% | |
| Index Performance | |||||||
| NASDAQ US Multi-Asset Diversified Income IndexSM | 23.50% | 47.63% | 4.01% | 4.29% | 21.73% | 43.73% | |
| S&P 500® Index | 19.07% | 56.35% | 16.29% | 15.13% | 112.71% | 237.22% | |
| Dow Jones U.S. Select DividendTM Index* | 42.55% | 61.70% | 11.18% | 12.55% | 69.90% | 177.49% | |
| * | The Dow Jones U.S. Select DividendTM Index represents 100 of the United States’ leading stocks by dividend yield. |
| Sector Allocation | % of Total Investments |
| Financials | 22.2% |
| Energy | 19.4 |
| Other* | 19.2 |
| Real Estate | 16.2 |
| Utilities | 8.1 |
| Consumer Staples | 7.6 |
| Industrials | 2.3 |
| Health Care | 2.1 |
| Information Technology | 1.8 |
| Communication Services | 0.8 |
| Materials | 0.3 |
| Total | 100.0% |
| * | Exchange-traded fund with holdings representing multiple sectors. |
| Top Ten Holdings | % of Total Investments |
| First Trust Tactical High Yield ETF | 19.2% |
| Starwood Property Trust, Inc. | 1.7 |
| Annaly Capital Management, Inc. | 1.6 |
| National Health Investors, Inc. | 1.5 |
| Industrial Logistics Properties Trust | 1.4 |
| PBF Logistics, L.P. | 1.4 |
| USA Compression Partners, L.P. | 1.3 |
| Energy Transfer, L.P. | 1.3 |
| Phillips 66 Partners, L.P. | 1.2 |
| National Retail Properties, Inc. | 1.1 |
| Total | 31.7% |
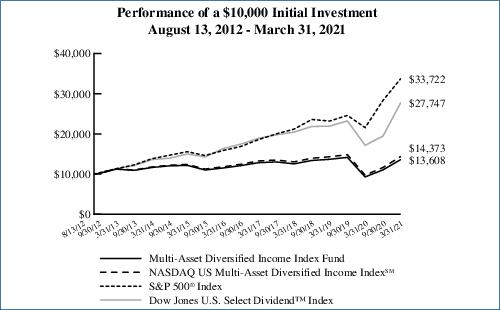
Performance figures assume reinvestment of all distributions and do not reflect the deduction of taxes that a shareholder would pay on Fund distributions or the redemption or sale of Fund shares. An index is a statistical composite that tracks a specified financial market or sector. Unlike the Fund, the indices do not actually hold a portfolio of securities and therefore do not incur the expenses incurred by the Fund. These expenses negatively impact the performance of the Fund. The Fund’s past performance does not predict future performance.
| Performance | |||||||
| Average Annual Total Returns | Cumulative Total Returns | ||||||
| 6 Months Ended 3/31/21 | 1 Year Ended 3/31/21 | 5 Years Ended 3/31/21 | Inception (8/22/13) to 3/31/21 | 5 Years Ended 3/31/21 | Inception (8/22/13) to 3/31/21 | ||
| Fund Performance | |||||||
| NAV | 25.61% | 40.98% | 5.26% | 3.02% | 29.22% | 25.39% | |
| Market Price | 26.36% | 42.26% | 5.52% | 3.12% | 30.84% | 26.33% | |
| Index Performance | |||||||
| S&P International Dividend Aristocrats Index(1) | 27.02% | 42.77% | N/A | N/A | N/A | N/A | |
| Dow Jones EPAC Select DividendTM Index(2) | 28.64% | 46.40% | 7.29% | 4.24% | 42.18% | 37.19% | |
| MSCI World ex USA Index | 20.53% | 45.86% | 8.92% | 5.88% | 53.32% | 54.46% | |
| (1) | On August 30, 2018, the Fund’s underlying index changed from the NASDAQ International Multi-Asset Diversified Income IndexSM to the S&P International Dividend Aristocrats Index (the “Index”). Therefore, the Fund’s performance and historical returns shown for the periods prior to August 30, 2018, are not necessarily indicative of the performance that the Fund, based on its current index, would have generated. Since the Index had an inception date of April 30, 2018, it was not in existence for all of the periods disclosed. The old index was terminated on November 23, 2018, so performance data does not exist for these time periods. |
| (2) | The Dow Jones EPAC Select DividendTM Index measures the performance of a selected group of companies, from non-U.S. developed markets (Europe, Pacific Asia, and Canada), that have provided relatively high dividend yields on a consistent basis over time. |
| Sector Allocation | % of Total Investments |
| Financials | 25.5% |
| Utilities | 20.5 |
| Real Estate | 12.6 |
| Communication Services | 10.1 |
| Consumer Staples | 9.8 |
| Consumer Discretionary | 6.2 |
| Energy | 5.4 |
| Industrials | 3.7 |
| Health Care | 2.6 |
| Materials | 2.3 |
| Information Technology | 1.3 |
| Total | 100.0% |
| Country Allocation | % of Total Investments |
| Canada | 27.0% |
| Japan | 16.9 |
| Hong Kong | 14.8 |
| United Kingdom | 11.1 |
| Switzerland | 4.1 |
| Finland | 3.9 |
| France | 3.5 |
| South Korea | 2.7 |
| Spain | 2.5 |
| United Arab Emirates | 1.8 |
| Bermuda | 1.7 |
| Australia | 1.5 |
| Mexico | 1.4 |
| Belgium | 1.4 |
| South Africa | 1.3 |
| Cayman Islands | 1.2 |
| Sweden | 1.1 |
| Singapore | 1.1 |
| Germany | 1.0 |
| Total | 100.0% |
| Top Ten Holdings | % of Total Investments |
| Enagas S.A. | 2.5% |
| SmartCentres Real Estate Investment Trust | 2.0 |
| Power Assets Holdings Ltd. | 2.0 |
| Japan Tobacco, Inc. | 2.0 |
| Pembina Pipeline Corp. | 1.9 |
| Keyera Corp. | 1.9 |
| Shaw Communications, Inc., Class B | 1.8 |
| Henderson Land Development Co., Ltd. | 1.7 |
| CK Infrastructure Holdings Ltd. | 1.7 |
| China Overseas Land & Investment Ltd. | 1.7 |
| Total | 19.2% |
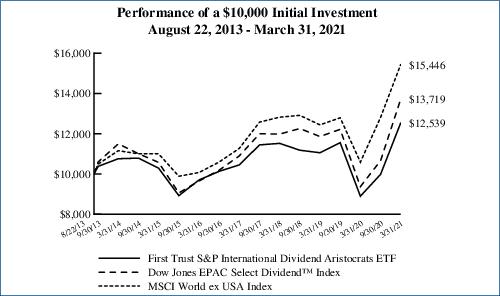
Performance figures assume reinvestment of all distributions and do not reflect the deduction of taxes that a shareholder would pay on Fund distributions or the redemption or sale of Fund shares. An index is a statistical composite that tracks a specified financial market or sector. Unlike the Fund, the indices do not actually hold a portfolio of securities and therefore do not incur the expenses incurred by the Fund. These expenses negatively impact the performance of the Fund. The Fund’s past performance does not predict future performance.
| Performance | |||||||
| Average Annual Total Returns | Cumulative Total Returns | ||||||
| 6 Months Ended 3/31/21 | 1 Year Ended 3/31/21 | 5 Years Ended 3/31/21 | Inception (1/6/14) to 3/31/21 | 5 Years Ended 3/31/21 | Inception (1/6/14) to 3/31/21 | ||
| Fund Performance | |||||||
| NAV | 12.92% | 27.54% | 5.77% | 5.41% | 32.36% | 46.39% | |
| Market Price | 12.56% | 28.05% | 5.78% | 5.42% | 32.43% | 46.47% | |
| Index Performance | |||||||
| CBOE S&P 500 BuyWrite Monthly Index* | 13.71% | 32.20% | 6.67% | 6.01% | 38.08% | 52.45% | |
| S&P 500® Index | 19.07% | 56.35% | 16.29% | 13.60% | 112.71% | 151.37% | |
| * | The CBOE S&P 500 BuyWrite Monthly Index is a benchmark index designed to track the performance of a hypothetical buy-write strategy on the S&P 500® Index. |
| Sector Allocation | % of Total Investments |
| Financials | 17.7% |
| Health Care | 17.0 |
| Information Technology | 17.0 |
| Consumer Discretionary | 11.2 |
| Communication Services | 9.8 |
| Materials | 8.9 |
| Energy | 6.6 |
| Industrials | 5.7 |
| Consumer Staples | 4.2 |
| Real Estate | 1.9 |
| Total | 100.0% |
| Fund Allocation | % of Net Assets |
| Common Stocks | 94.7% |
| Real Estate Investment Trusts | 3.4 |
| Master Limited Partnerships | 0.2 |
| Call Options Written | (2.4) |
| Net Other Assets and Liabilities | 4.1 |
| Total | 100.0% |
| Top Ten Holdings | % of Total Investments |
| Apple, Inc. | 4.1% |
| Microsoft Corp. | 3.7 |
| Cardinal Health, Inc. | 2.7 |
| Arrow Electronics, Inc. | 2.7 |
| Campbell Soup Co. | 2.6 |
| Berry Global Group, Inc. | 2.5 |
| Bank of New York Mellon (The) Corp. | 2.5 |
| Amazon.com, Inc. | 2.4 |
| MGM Resorts International | 2.4 |
| Lumen Technologies, Inc. | 2.4 |
| Total | 28.0% |

Performance figures assume reinvestment of all distributions and do not reflect the deduction of taxes that a shareholder would pay on Fund distributions or the redemption or sale of Fund shares. An index is a statistical composite that tracks a specified financial market or sector. Unlike the Fund, the indices do not actually hold a portfolio of securities and therefore do not incur the expenses incurred by the Fund. These expenses negatively impact the performance of the Fund. The Fund’s past performance does not predict future performance.
| Performance | |||||||
| Average Annual Total Returns | Cumulative Total Returns | ||||||
| 6 Months Ended 3/31/21 | 1 Year Ended 3/31/21 | 5 Years Ended 3/31/21 | Inception (1/6/14) to 3/31/21 | 5 Years Ended 3/31/21 | Inception (1/6/14) to 3/31/21 | ||
| Fund Performance | |||||||
| NAV | 10.06% | 11.54% | 4.23% | 3.85% | 23.05% | 31.45% | |
| Market Price | 10.06% | 10.63% | 4.23% | 3.86% | 23.01% | 31.48% | |
| Index Performance | |||||||
| CBOE S&P 500 95-110 Collar Index* | 11.84% | 28.80% | 14.24% | 10.36% | 94.58% | 104.02% | |
| S&P 500® Index | 19.07% | 56.35% | 16.29% | 13.60% | 112.71% | 151.37% | |
| * | The CBOE S&P 500 95-110 Collar Index is designed to protect an investment in S&P 500® stocks against market declines. The passive collar strategy reflected by the index entails: holding the stocks in the S&P 500® Index; buying three-month S&P 500® put options to protect this S&P 500® portfolio from market decreases; and selling one-month S&P 500® call options to help finance the cost of the put options. |
| Sector Allocation | % of Total Investments |
| Financials | 17.7% |
| Health Care | 17.0 |
| Information Technology | 16.9 |
| Consumer Discretionary | 11.2 |
| Communication Services | 9.8 |
| Materials | 8.9 |
| Energy | 6.7 |
| Industrials | 5.8 |
| Consumer Staples | 4.1 |
| Real Estate | 1.9 |
| Total | 100.0% |
| Fund Allocation | % of Net Assets |
| Common Stocks | 95.2% |
| Real Estate Investment Trusts | 3.4 |
| Put Options Purchased | 1.4 |
| Master Limited Partnerships | 0.2 |
| Call Options Written | (3.0) |
| Net Other Assets and Liabilities | 2.8 |
| Total | 100.0% |
| Top Ten Holdings | % of Total Investments |
| Apple, Inc. | 4.1% |
| Microsoft Corp. | 3.7 |
| Cardinal Health, Inc. | 2.7 |
| Arrow Electronics, Inc. | 2.7 |
| Campbell Soup Co. | 2.6 |
| Berry Global Group, Inc. | 2.5 |
| Bank of New York Mellon (The) Corp. | 2.5 |
| MGM Resorts International | 2.4 |
| Amazon.com, Inc. | 2.4 |
| Lumen Technologies, Inc. | 2.3 |
| Total | 27.9% |

Performance figures assume reinvestment of all distributions and do not reflect the deduction of taxes that a shareholder would pay on Fund distributions or the redemption or sale of Fund shares. An index is a statistical composite that tracks a specified financial market or sector. Unlike the Fund, the indices do not actually hold a portfolio of securities and therefore do not incur the expenses incurred by the Fund. These expenses negatively impact the performance of the Fund. The Fund’s past performance does not predict future performance.
| Performance | |||||||
| Average Annual Total Returns | Cumulative Total Returns | ||||||
| 6 Months Ended 3/31/21 | 1 Year Ended 3/31/21 | 5 Years Ended 3/31/21 | Inception (1/6/14) to 3/31/21 | 5 Years Ended 3/31/21 | Inception (1/6/14) to 3/31/21 | ||
| Fund Performance | |||||||
| NAV | 40.21% | 80.32% | 18.84% | 14.13% | 137.07% | 160.05% | |
| Market Price | 40.27% | 80.33% | 18.87% | 14.14% | 137.29% | 160.15% | |
| Index Performance | |||||||
| NASDAQ US Rising Dividend Achievers Index | 40.70% | 81.60% | 19.50% | 14.75% | 143.72% | 170.40% | |
| Dow Jones U.S. Select DividendTM Index* | 42.55% | 61.70% | 11.18% | 11.15% | 69.90% | 114.78% | |
| * | The Dow Jones U.S. Select DividendTM Index represents 100 of the United States’ leading stocks by dividend yield. |
| Sector Allocation | % of Total Investments |
| Information Technology | 37.1% |
| Financials | 31.2 |
| Consumer Discretionary | 10.0 |
| Materials | 6.0 |
| Industrials | 6.0 |
| Health Care | 4.0 |
| Communication Services | 3.7 |
| Consumer Staples | 2.0 |
| Total | 100.0% |
| Top Ten Holdings | % of Total Investments |
| Applied Materials, Inc. | 2.3% |
| Lam Research Corp. | 2.2 |
| PulteGroup, Inc. | 2.1 |
| Texas Instruments, Inc. | 2.1 |
| DR Horton, Inc. | 2.1 |
| Cisco Systems, Inc. | 2.1 |
| Oracle Corp. | 2.1 |
| HP, Inc. | 2.1 |
| Skyworks Solutions, Inc. | 2.1 |
| Accenture PLC, Class A | 2.1 |
| Total | 21.3% |

Performance figures assume reinvestment of all distributions and do not reflect the deduction of taxes that a shareholder would pay on Fund distributions or the redemption or sale of Fund shares. An index is a statistical composite that tracks a specified financial market or sector. Unlike the Fund, the indices do not actually hold a portfolio of securities and therefore do not incur the expenses incurred by the Fund. These expenses negatively impact the performance of the Fund. The Fund’s past performance does not predict future performance.
| Performance | |||||||
| Average Annual Total Returns | Cumulative Total Returns | ||||||
| 6 Months Ended 3/31/21 | 1 Year Ended 3/31/21 | 5 Years Ended 3/31/21 | Inception (3/5/14) to 3/31/21 | 5 Years Ended 3/31/21 | Inception (3/5/14) to 3/31/21 | ||
| Fund Performance | |||||||
| NAV | 30.88% | 72.18% | 16.16% | 12.44% | 111.52% | 129.09% | |
| Market Price | 30.67% | 72.31% | 16.16% | 12.43% | 111.52% | 128.99% | |
| Index Performance | |||||||
| Dorsey Wright Focus Five Index | 31.11% | 72.83% | 16.48% | 12.82% | 114.43% | 134.65% | |
| S&P 500® Index | 19.07% | 56.35% | 16.29% | 13.46% | 112.71% | 144.17% | |
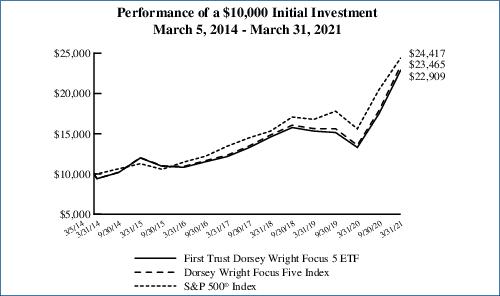
Performance figures assume reinvestment of all distributions and do not reflect the deduction of taxes that a shareholder would pay on Fund distributions or the redemption or sale of Fund shares. An index is a statistical composite that tracks a specified financial market or sector. Unlike the Fund, the indices do not actually hold a portfolio of securities and therefore do not incur the expenses incurred by the Fund. These expenses negatively impact the performance of the Fund. The Fund’s past performance does not predict future performance.
| Performance | |||||||
| Average Annual Total Returns | Cumulative Total Returns | ||||||
| 6 Months Ended 3/31/21 | 1 Year Ended 3/31/21 | 5 Years Ended 3/31/21 | Inception (3/10/14) to 3/31/21 | 5 Years Ended 3/31/21 | Inception (3/10/14) to 3/31/21 | ||
| Fund Performance | |||||||
| NAV | 57.74% | 102.15% | 18.43% | 10.83% | 133.00% | 106.62% | |
| Market Price | 57.89% | 102.76% | 18.46% | 10.85% | 133.23% | 106.83% | |
| Index Performance | |||||||
| Richard Bernstein Advisors American Industrial Renaissance® Index | 58.31% | 103.80% | 19.28% | 11.67% | 141.45% | 117.98% | |
| S&P 500® Index | 19.07% | 56.35% | 16.29% | 13.45% | 112.71% | 143.65% | |
| S&P 500® Industrials Index | 28.88% | 69.61% | 13.72% | 11.27% | 90.20% | 112.48% | |
| Russell 2500® Index | 41.33% | 89.40% | 15.93% | 11.17% | 109.41% | 111.14% | |
| Sector Allocation | % of Total Investments |
| Industrials | 89.4% |
| Financials | 10.6 |
| Total | 100.0% |
| Top Ten Holdings | % of Total Investments |
| Comfort Systems USA, Inc. | 3.6% |
| Generac Holdings, Inc. | 3.5 |
| APi Group Corp. | 3.3 |
| Atkore International Group, Inc. | 3.2 |
| Quanta Services, Inc. | 3.2 |
| MYR Group, Inc. | 3.2 |
| Astec Industries, Inc. | 3.1 |
| EMCOR Group, Inc. | 3.1 |
| MasTec, Inc. | 3.1 |
| Hubbell, Inc. | 3.0 |
| Total | 32.3% |

Performance figures assume reinvestment of all distributions and do not reflect the deduction of taxes that a shareholder would pay on Fund distributions or the redemption or sale of Fund shares. An index is a statistical composite that tracks a specified financial market or sector. Unlike the Fund, the indices do not actually hold a portfolio of securities and therefore do not incur the expenses incurred by the Fund. These expenses negatively impact the performance of the Fund. The Fund’s past performance does not predict future performance.
| Performance | |||||||
| Average Annual Total Returns | Cumulative Total Returns | ||||||
| 6 Months Ended 3/31/21 | 1 Year Ended 3/31/21 | 5 Years Ended 3/31/21 | Inception (3/10/14) to 3/31/21 | 5 Years Ended 3/31/21 | Inception (3/10/14) to 3/31/21 | ||
| Fund Performance | |||||||
| NAV | 40.21% | 67.42% | 9.07% | 8.38% | 54.37% | 76.46% | |
| Market Price | 40.33% | 67.67% | 9.12% | 8.39% | 54.72% | 76.55% | |
| Index Performance | |||||||
| Dorsey Wright Momentum Plus Dividend Yield Index(1) | 40.87% | 68.96% | N/A | N/A | N/A | N/A | |
| Dow Jones U.S. Select DividendTM Index(2) | 42.55% | 61.70% | 11.18% | 11.01% | 69.90% | 109.05% | |
| S&P 500® Index | 19.07% | 56.35% | 16.29% | 13.45% | 112.71% | 143.65% | |
| (1) | On September 6, 2018, the Fund’s underlying index changed from the Richard Bernstein Advisors Quality Income Index to the Dorsey Wright Momentum Plus Dividend Yield Index (the “Index”). Therefore, the Fund’s performance and historical returns shown for the periods prior to September 6, 2018, are not necessarily indicative of the performance that the Fund, based on its current index, would have generated. Since the Index had an inception date of July 2, 2018, it was not in existence for all of the periods disclosed. |
| (2) | The Dow Jones U.S. Select DividendTM Index represents 100 of the United States’ leading stocks by dividend yield. |
| Sector Allocation | % of Total Investments |
| Financials | 43.2% |
| Real Estate | 20.2 |
| Industrials | 8.7 |
| Energy | 8.4 |
| Information Technology | 6.6 |
| Consumer Discretionary | 5.5 |
| Consumer Staples | 2.7 |
| Communication Services | 2.0 |
| Materials | 1.5 |
| Utilities | 1.2 |
| Total | 100.0% |
| Top Ten Holdings | % of Total Investments |
| Starwood Property Trust, Inc. | 6.1% |
| ONEOK, Inc. | 5.5 |
| Simon Property Group, Inc. | 5.3 |
| VICI Properties, Inc. | 3.5 |
| Seagate Technology PLC | 3.3 |
| Santander Consumer USA Holdings, Inc. | 3.0 |
| Comerica, Inc. | 3.0 |
| STORE Capital Corp. | 2.9 |
| Invesco, Ltd. | 2.8 |
| First Horizon Corp. | 2.7 |
| Total | 38.1% |

Performance figures assume reinvestment of all distributions and do not reflect the deduction of taxes that a shareholder would pay on Fund distributions or the redemption or sale of Fund shares. An index is a statistical composite that tracks a specified financial market or sector. Unlike the Fund, the indices do not actually hold a portfolio of securities and therefore do not incur the expenses incurred by the Fund. These expenses negatively impact the performance of the Fund. The Fund’s past performance does not predict future performance.
| Performance | |||||||
| Average Annual Total Returns | Cumulative Total Returns | ||||||
| 6 Months Ended 3/31/21 | 1 Year Ended 3/31/21 | 5 Years Ended 3/31/21 | Inception (7/22/14) to 3/31/21 | 5 Years Ended 3/31/21 | Inception (7/22/14) to 3/31/21 | ||
| Fund Performance | |||||||
| NAV | 22.43% | 68.77% | 7.95% | 3.66% | 46.61% | 27.23% | |
| Market Price | 22.66% | 68.67% | 7.97% | 3.68% | 46.75% | 27.35% | |
| Index Performance | |||||||
| Dorsey Wright International Focus Five Index | 22.65% | 69.33% | 8.98% | 4.12% | 53.75% | 31.05% | |
| MSCI ACWI ex USA Index | 21.10% | 49.41% | 9.76% | 4.70% | 59.29% | 35.95% | |

Performance figures assume reinvestment of all distributions and do not reflect the deduction of taxes that a shareholder would pay on Fund distributions or the redemption or sale of Fund shares. An index is a statistical composite that tracks a specified financial market or sector. Unlike the Fund, the indices do not actually hold a portfolio of securities and therefore do not incur the expenses incurred by the Fund. These expenses negatively impact the performance of the Fund. The Fund’s past performance does not predict future performance.
| Performance | |||||||
| Average Annual Total Returns | Cumulative Total Returns | ||||||
| 6 Months Ended 3/31/21 | 1 Year Ended 3/31/21 | 5 Years Ended 3/31/21 | Inception (3/17/16) to 3/31/21 | 5 Years Ended 3/31/21 | Inception (3/17/16) to 3/31/21 | ||
| Fund Performance | |||||||
| NAV | 30.91% | 52.37% | 11.79% | 11.89% | 74.55% | 76.12% | |
| Market Price | 30.88% | 52.60% | 11.77% | 11.88% | 74.42% | 76.07% | |
| Index Performance | |||||||
| Dorsey Wright Dynamic Focus Five Index | 31.11% | 53.01% | 12.11% | 12.22% | 77.07% | 78.74% | |
| S&P 500® Index | 19.07% | 56.35% | 16.29% | 16.39% | 112.71% | 114.81% | |
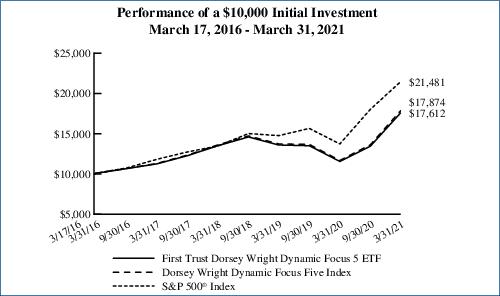
Performance figures assume reinvestment of all distributions and do not reflect the deduction of taxes that a shareholder would pay on Fund distributions or the redemption or sale of Fund shares. An index is a statistical composite that tracks a specified financial market or sector. Unlike the Fund, the indices do not actually hold a portfolio of securities and therefore do not incur the expenses incurred by the Fund. These expenses negatively impact the performance of the Fund. The Fund’s past performance does not predict future performance.
| Beginning Account Value October 1, 2020 | Ending Account Value March 31, 2021 | Annualized Expense Ratio Based on the Six-Month Period (a) | Expenses Paid During the Six-Month Period | |
| First Trust NASDAQ Technology Dividend Index Fund (TDIV) | ||||
| Actual | $1,000.00 | $1,243.40 | 0.50% | $2.80 |
| Hypothetical (5% return before expenses) | $1,000.00 | $1,022.44 | 0.50% | $2.52 |
| Multi-Asset Diversified Income Index Fund (MDIV) (b) | ||||
| Actual | $1,000.00 | $1,230.80 | 0.48% | $2.67 |
| Hypothetical (5% return before expenses) | $1,000.00 | $1,022.54 | 0.48% | $2.42 |
| First Trust S&P International Dividend Aristocrats ETF (FID) | ||||
| Actual | $1,000.00 | $1,256.10 | 0.60% | $3.37 |
| Hypothetical (5% return before expenses) | $1,000.00 | $1,021.94 | 0.60% | $3.02 |
| First Trust BuyWrite Income ETF (FTHI) | ||||
| Actual | $1,000.00 | $1,129.20 | 0.85% | $4.51 |
| Hypothetical (5% return before expenses) | $1,000.00 | $1,020.69 | 0.85% | $4.28 |
| First Trust Hedged BuyWrite Income ETF (FTLB) | ||||
| Actual | $1,000.00 | $1,100.60 | 0.85% | $4.45 |
| Hypothetical (5% return before expenses) | $1,000.00 | $1,020.69 | 0.85% | $4.28 |
| First Trust Rising Dividend Achievers ETF (RDVY) | ||||
| Actual | $1,000.00 | $1,402.10 | 0.50% | $2.99 |
| Hypothetical (5% return before expenses) | $1,000.00 | $1,022.44 | 0.50% | $2.52 |
| Beginning Account Value October 1, 2020 | Ending Account Value March 31, 2021 | Annualized Expense Ratio Based on the Six-Month Period (a) | Expenses Paid During the Six-Month Period | |
| First Trust Dorsey Wright Focus 5 ETF (FV) (b) | ||||
| Actual | $1,000.00 | $1,308.80 | 0.30% | $1.73 |
| Hypothetical (5% return before expenses) | $1,000.00 | $1,023.44 | 0.30% | $1.51 |
| First Trust RBA American Industrial Renaissance® ETF (AIRR) | ||||
| Actual | $1,000.00 | $1,577.40 | 0.70% | $4.50 |
| Hypothetical (5% return before expenses) | $1,000.00 | $1,021.44 | 0.70% | $3.53 |
| First Trust Dorsey Wright Momentum & Dividend ETF (DDIV) | ||||
| Actual | $1,000.00 | $1,402.10 | 0.60% | $3.59 |
| Hypothetical (5% return before expenses) | $1,000.00 | $1,021.94 | 0.60% | $3.02 |
| First Trust Dorsey Wright International Focus 5 ETF (IFV) (b) | ||||
| Actual | $1,000.00 | $1,224.30 | 0.30% | $1.66 |
| Hypothetical (5% return before expenses) | $1,000.00 | $1,023.44 | 0.30% | $1.51 |
| First Trust Dorsey Wright Dynamic Focus 5 ETF (FVC) (b) | ||||
| Actual | $1,000.00 | $1,309.10 | 0.30% | $1.73 |
| Hypothetical (5% return before expenses) | $1,000.00 | $1,023.44 | 0.30% | $1.51 |
| (a) | Expenses are equal to the annualized expense ratios as indicated in the table multiplied by the average account value over the period (October 1, 2020 through March 31, 2021), multiplied by 182/365 (to reflect the six-month period). |
| (b) | Annualized expense ratio and expenses paid during the six-month period do not include fees and expenses of the underlying funds in which the Fund invests. |
| Shares | Description | Value | ||
| COMMON STOCKS – 99.9% | ||||
| Aerospace & Defense – 1.4% | ||||
| 102,091 | L3Harris Technologies, Inc. | $20,691,804 | ||
| Commercial Services & Supplies – 0.1% | ||||
| 106,240 | Pitney Bowes, Inc. | 875,418 | ||
| Communications Equipment – 10.2% | ||||
| 26,864 | ADTRAN, Inc. | 448,091 | ||
| 8,023 | AudioCodes Ltd. | 216,461 | ||
| 2,476,562 | Cisco Systems, Inc. | 128,063,021 | ||
| 9,676 | Comtech Telecommunications Corp. | 240,352 | ||
| 102,329 | Gilat Satellite Networks Ltd. | 1,070,361 | ||
| 293,174 | Juniper Networks, Inc. | 7,426,097 | ||
| 65,858 | Motorola Solutions, Inc. | 12,384,597 | ||
| 124,447 | Telefonaktiebolaget LM Ericsson, ADR | 1,641,456 | ||
| 151,490,436 | ||||
| Diversified Telecommunication Services – 11.1% | ||||
| 996,085 | AT&T, Inc. | 30,151,493 | ||
| 78,053 | ATN International, Inc. | 3,833,963 | ||
| 649,692 | BCE, Inc. | 29,327,097 | ||
| 282,102 | Chunghwa Telecom Co., Ltd., ADR | 11,041,472 | ||
| 56,922 | Cogent Communications Holdings, Inc. | 3,913,957 | ||
| 2,260,443 | Lumen Technologies, Inc. | 30,176,914 | ||
| 1,386,269 | TELUS Corp. | 27,628,341 | ||
| 502,366 | Verizon Communications, Inc. | 29,212,583 | ||
| 165,285,820 | ||||
| Electronic Equipment, Instruments & Components – 0.6% | ||||
| 35,977 | CDW Corp. | 5,963,188 | ||
| 80,139 | National Instruments Corp. | 3,460,802 | ||
| 9,423,990 | ||||
| Health Care Providers & Services – 0.1% | ||||
| 35,706 | Premier, Inc., Class A | 1,208,648 | ||
| Health Care Technology – 0.4% | ||||
| 87,527 | Cerner Corp. | 6,291,441 | ||
| Industrial Conglomerates – 0.4% | ||||
| 15,172 | Roper Technologies, Inc. | 6,119,474 | ||
| Interactive Media & Services – 0.1% | ||||
| 10,960 | Autohome, Inc., ADR | 1,022,239 | ||
| Shares | Description | Value | ||
| Interactive Media & Services (Continued) | ||||
| 10,143 | JOYY, Inc., ADR | $950,704 | ||
| 1,972,943 | ||||
| Internet & Direct Marketing Retail – 0.1% | ||||
| 7,264 | Shutterstock, Inc. | 646,787 | ||
| IT Services – 10.0% | ||||
| 58,898 | Amdocs Ltd. | 4,131,695 | ||
| 165,200 | Cognizant Technology Solutions Corp., Class A | 12,905,424 | ||
| 17,284 | CSG Systems International, Inc. | 775,879 | ||
| 320,961 | Infosys Ltd., ADR | 6,008,390 | ||
| 934,359 | International Business Machines Corp. | 124,512,680 | ||
| 28,327 | Switch, Inc., Class A | 460,597 | ||
| 148,794,665 | ||||
| Media – 2.8% | ||||
| 1,595,682 | Shaw Communications, Inc., Class B | 41,838,782 | ||
| Professional Services – 0.5% | ||||
| 56,719 | Leidos Holdings, Inc. | 5,460,906 | ||
| 26,009 | Science Applications International Corp. | 2,174,092 | ||
| 7,634,998 | ||||
| Semiconductors & Semiconductor Equipment – 27.1% | ||||
| 152,633 | Analog Devices, Inc. | 23,670,326 | ||
| 175,606 | Applied Materials, Inc. | 23,460,961 | ||
| 234,707 | Broadcom, Inc. | 108,824,248 | ||
| 9,281 | Brooks Automation, Inc. | 757,794 | ||
| 7,827 | CMC Materials, Inc. | 1,383,735 | ||
| 914,144 | Intel Corp. | 58,505,216 | ||
| 45,044 | KLA Corp. | 14,882,537 | ||
| 16,183 | Kulicke & Soffa Industries, Inc. | 794,747 | ||
| 32,095 | Lam Research Corp. | 19,104,228 | ||
| 67,462 | Microchip Technology, Inc. | 10,471,452 | ||
| 6,260 | Monolithic Power Systems, Inc. | 2,211,095 | ||
| 59,172 | NXP Semiconductors N.V. | 11,913,690 | ||
| 7,420 | Power Integrations, Inc. | 604,582 | ||
| 407,971 | QUALCOMM, Inc. | 54,092,875 | ||
| 21,104 | Silicon Motion Technology Corp., ADR | 1,253,366 | ||
| 45,322 | Skyworks Solutions, Inc. | 8,315,680 | ||
| 322,526 | Texas Instruments, Inc. | 60,954,189 | ||
| 46,080 | United Microelectronics Corp., ADR | 419,789 | ||
| 401,620,510 | ||||
| Software – 14.7% | ||||
| 20,070 | Absolute Software Corp. | 278,371 | ||
| Shares | Description | Value | ||
| COMMON STOCKS (Continued) | ||||
| Software (Continued) | ||||
| 17,421 | American Software, Inc., Class A | $360,615 | ||
| 37,877 | CDK Global, Inc. | 2,047,631 | ||
| 33,503 | Citrix Systems, Inc. | 4,702,481 | ||
| 9,905 | Ebix, Inc. | 317,257 | ||
| 17,706 | InterDigital, Inc. | 1,123,446 | ||
| 40,873 | Intuit, Inc. | 15,656,811 | ||
| 478,197 | Microsoft Corp. | 112,744,507 | ||
| 387,684 | NortonLifeLock, Inc. | 8,242,162 | ||
| 115,291 | Open Text Corp. | 5,500,533 | ||
| 861,288 | Oracle Corp. | 60,436,579 | ||
| 18,104 | Progress Software Corp. | 797,662 | ||
| 18,511 | SAP SE, ADR | 2,272,966 | ||
| 53,569 | SS&C Technologies Holdings, Inc. | 3,742,866 | ||
| 218,223,887 | ||||
| Technology Hardware, Storage & Peripherals – 13.0% | ||||
| 916,406 | Apple, Inc. | 111,938,993 | ||
| 1,114,909 | Hewlett Packard Enterprise Co. | 17,548,668 | ||
| 808,114 | HP, Inc. | 25,657,619 | ||
| 35,479 | Logitech International S.A. | 3,707,555 | ||
| 178,114 | NetApp, Inc. | 12,943,544 | ||
| 220,137 | Seagate Technology PLC | 16,895,515 | ||
| 202,681 | Xerox Holdings Corp. | 4,919,068 | ||
| 193,610,962 | ||||
| Wireless Telecommunication Services – 7.3% | ||||
| 344,662 | PLDT, Inc., ADR | 9,016,358 | ||
| 642,332 | Rogers Communications, Inc., Class B | 29,611,505 | ||
| 134,537 | Shenandoah Telecommunications Co. | 6,566,751 | ||
| 1,430,544 | Telephone & Data Systems, Inc. | 32,845,290 | ||
| 1,617,045 | Vodafone Group PLC, ADR | 29,802,140 | ||
| 107,842,044 | ||||
| Total Investments – 99.9% | 1,483,572,609 | |||
| (Cost $1,066,985,532) (a) | ||||
| Net Other Assets and Liabilities – 0.1% | 1,870,520 | |||
| Net Assets – 100.0% | $1,485,443,129 | |||
| (a) | Aggregate cost for financial reporting purposes approximates the aggregate cost for federal income tax purposes. As of March 31, 2021, the aggregate gross unrealized appreciation for all investments in which there was an excess of value over tax cost was $428,027,107 and the aggregate gross unrealized depreciation for all investments in which there was an excess of tax cost over value was $11,440,030. The net unrealized appreciation was $416,587,077. |
| ADR | American Depositary Receipt |
| Total Value at 3/31/2021 | Level 1 Quoted Prices | Level 2 Significant Observable Inputs | Level 3 Significant Unobservable Inputs | |
| Common Stocks* | $ 1,483,572,609 | $ 1,483,572,609 | $ — | $ — |
| * | See Portfolio of Investments for industry breakout. |
| Shares/ Units | Description | Value | ||
| COMMON STOCKS – 21.9% | ||||
| Aerospace & Defense – 0.7% | ||||
| 8,408 | General Dynamics Corp. | $1,526,556 | ||
| 4,225 | Lockheed Martin Corp. | 1,561,138 | ||
| 3,087,694 | ||||
| Beverages – 0.3% | ||||
| 10,446 | PepsiCo, Inc. | 1,477,587 | ||
| Biotechnology – 0.9% | ||||
| 20,085 | AbbVie, Inc. | 2,173,599 | ||
| 30,941 | Gilead Sciences, Inc. | 1,999,717 | ||
| 4,173,316 | ||||
| Capital Markets – 0.7% | ||||
| 33,834 | Bank of New York Mellon (The) Corp. | 1,600,010 | ||
| 58,083 | Virtu Financial, Inc., Class A | 1,803,477 | ||
| 3,403,487 | ||||
| Communications Equipment – 0.4% | ||||
| 32,984 | Cisco Systems, Inc. | 1,705,603 | ||
| Containers & Packaging – 0.3% | ||||
| 22,845 | Sonoco Products Co. | 1,446,088 | ||
| Diversified Telecommunication Services – 0.5% | ||||
| 37,606 | Verizon Communications, Inc. | 2,186,789 | ||
| Electric Utilities – 4.7% | ||||
| 31,471 | Alliant Energy Corp. | 1,704,469 | ||
| 21,486 | American Electric Power Co., Inc. | 1,819,864 | ||
| 21,755 | Duke Energy Corp. | 2,100,010 | ||
| 37,573 | Edison International | 2,201,778 | ||
| 43,699 | Exelon Corp. | 1,911,394 | ||
| 52,328 | Hawaiian Electric Industries, Inc. | 2,324,933 | ||
| 16,366 | IDACORP, Inc. | 1,636,109 | ||
| 37,124 | NRG Energy, Inc. | 1,400,689 | ||
| 81,038 | OGE Energy Corp. | 2,622,390 | ||
| 28,080 | Pinnacle West Capital Corp. | 2,284,308 | ||
| 34,824 | Southern (The) Co. | 2,164,660 | ||
| 22,170,604 | ||||
| Food & Staples Retailing – 0.4% | ||||
| 35,194 | Walgreens Boots Alliance, Inc. | 1,932,151 | ||
| Food Products – 3.0% | ||||
| 18,286 | Bunge Ltd. | 1,449,531 | ||
| 29,735 | Campbell Soup Co. | 1,494,779 | ||
| 72,483 | Flowers Foods, Inc. | 1,725,095 | ||
| 28,672 | General Mills, Inc. | 1,758,167 | ||
| 17,096 | Ingredion, Inc. | 1,537,272 | ||
| 12,511 | JM Smucker (The) Co. | 1,583,017 | ||
| 30,712 | Kellogg Co. | 1,944,070 | ||
| 60,134 | Kraft Heinz (The) Co. | 2,405,360 | ||
| 13,897,291 | ||||
| Gas Utilities – 0.9% | ||||
| 44,330 | National Fuel Gas Co. | 2,216,057 | ||
| Shares/ Units | Description | Value | ||
| COMMON STOCKS (Continued) | ||||
| Gas Utilities (Continued) | ||||
| 28,381 | Spire, Inc. | $2,097,072 | ||
| 4,313,129 | ||||
| Health Care Providers & Services – 0.4% | ||||
| 32,091 | Cardinal Health, Inc. | 1,949,528 | ||
| Household Products – 0.3% | ||||
| 11,568 | Kimberly-Clark Corp. | 1,608,530 | ||
| Industrial Conglomerates – 0.4% | ||||
| 8,761 | 3M Co. | 1,688,069 | ||
| Insurance – 1.0% | ||||
| 37,333 | Mercury General Corp. | 2,270,220 | ||
| 28,402 | Safety Insurance Group, Inc. | 2,392,868 | ||
| 4,663,088 | ||||
| IT Services – 1.0% | ||||
| 21,056 | International Business Machines Corp. | 2,805,923 | ||
| 79,744 | Western Union (The) Co. | 1,966,487 | ||
| 4,772,410 | ||||
| Media – 0.3% | ||||
| 26,077 | John Wiley & Sons, Inc., Class A | 1,413,373 | ||
| Multi-Utilities – 1.7% | ||||
| 30,173 | Consolidated Edison, Inc. | 2,256,940 | ||
| 13,515 | DTE Energy Co. | 1,799,387 | ||
| 80,443 | NiSource, Inc. | 1,939,481 | ||
| 29,564 | Public Service Enterprise Group, Inc. | 1,780,049 | ||
| 7,775,857 | ||||
| Oil, Gas & Consumable Fuels – 0.8% | ||||
| 873,648 | EnLink Midstream, LLC | 3,747,950 | ||
| Pharmaceuticals – 0.8% | ||||
| 20,302 | Merck & Co., Inc. | 1,565,081 | ||
| 58,307 | Pfizer, Inc. | 2,112,463 | ||
| 3,677,544 | ||||
| Technology Hardware, Storage & Peripherals – 0.4% | ||||
| 24,792 | Seagate Technology PLC | 1,902,786 | ||
| Thrifts & Mortgage Finance – 0.7% | ||||
| 243,949 | New York Community Bancorp, Inc. | 3,078,636 | ||
| Tobacco – 0.9% | ||||
| 86,976 | Altria Group, Inc. | 4,449,692 | ||
| Trading Companies & Distributors – 0.4% | ||||
| 20,574 | MSC Industrial Direct Co., Inc., Class A | 1,855,569 | ||
Total Common Stocks | 102,376,771 | |||
| (Cost $91,130,312) | ||||
| REAL ESTATE INVESTMENT TRUSTS – 19.8% | ||||
| Diversified REITs – 0.7% | ||||
| 21,056 | PS Business Parks, Inc. | 3,254,837 | ||
| Shares/ Units | Description | Value | ||
| REAL ESTATE INVESTMENT TRUSTS (Continued) | ||||
| Health Care REITs – 3.5% | ||||
| 136,966 | Healthcare Realty Trust, Inc. | $4,152,809 | ||
| 234,249 | Medical Properties Trust, Inc. | 4,984,819 | ||
| 98,483 | National Health Investors, Inc. | 7,118,351 | ||
| 16,255,979 | ||||
| Industrial REITs – 3.9% | ||||
| 16,553 | EastGroup Properties, Inc. | 2,371,714 | ||
| 56,952 | First Industrial Realty Trust, Inc. | 2,607,832 | ||
| 40,421 | Hannon Armstrong Sustainable Infrastructure Capital, Inc. | 2,267,618 | ||
| 289,242 | Industrial Logistics Properties Trust | 6,690,167 | ||
| 12,110 | Innovative Industrial Properties, Inc. | 2,181,738 | ||
| 34,918 | Terreno Realty Corp. | 2,017,213 | ||
| 18,136,282 | ||||
| Mortgage REITs – 3.2% | ||||
| 862,273 | Annaly Capital Management, Inc. | 7,415,548 | ||
| 313,863 | Starwood Property Trust, Inc. | 7,764,970 | ||
| 15,180,518 | ||||
| Office REITs – 1.3% | ||||
| 15,707 | Alexandria Real Estate Equities, Inc. | 2,580,660 | ||
| 54,189 | Kilroy Realty Corp. | 3,556,424 | ||
| 6,137,084 | ||||
| Residential REITs – 0.6% | ||||
| 21,002 | American Homes 4 Rent, Class A | 700,207 | ||
| 36,107 | Equity LifeStyle Properties, Inc. | 2,297,849 | ||
| 2,998,056 | ||||
| Retail REITs – 1.1% | ||||
| 119,971 | National Retail Properties, Inc. | 5,287,122 | ||
| Specialized REITs – 5.5% | ||||
| 9,113 | American Tower Corp. | 2,178,554 | ||
| 102,103 | CubeSmart | 3,862,556 | ||
| 24,880 | Extra Space Storage, Inc. | 3,297,844 | ||
| 41,595 | Life Storage, Inc. | 3,575,090 | ||
| 65,663 | PotlatchDeltic Corp. | 3,474,886 | ||
| 14,851 | Public Storage | 3,664,633 | ||
| 11,324 | Safehold, Inc. | 793,812 | ||
| 172,194 | VICI Properties, Inc. | 4,862,759 | ||
| 25,710,134 | ||||
Total Real Estate Investment Trusts | 92,960,012 | |||
| (Cost $84,095,314) | ||||
| MASTER LIMITED PARTNERSHIPS – 19.4% | ||||
| Energy Equipment & Services – 1.3% | ||||
| 394,666 | USA Compression Partners, L.P. | 6,042,337 | ||
| Industrial Conglomerates – 0.9% | ||||
| 78,224 | Icahn Enterprises, L.P. | 4,202,193 | ||
| Oil, Gas & Consumable Fuels – 17.2% | ||||
| 311,476 | Black Stone Minerals, L.P. | 2,716,071 | ||
| 57,523 | Cheniere Energy Partners, L.P. | 2,390,081 | ||
| 171,195 | CrossAmerica Partners, L.P. | 3,180,803 | ||
| Shares/ Units | Description | Value | ||
| MASTER LIMITED PARTNERSHIPS (Continued) | ||||
| Oil, Gas & Consumable Fuels (Continued) | ||||
| 88,271 | Delek Logistics Partners, L.P. | $3,176,873 | ||
| 777,540 | Energy Transfer, L.P. | 5,971,507 | ||
| 144,401 | Enterprise Products Partners, L.P. | 3,179,710 | ||
| 38,233 | Enviva Partners, L.P. | 1,847,801 | ||
| 161,502 | Global Partners, L.P. | 3,449,683 | ||
| 146,035 | Holly Energy Partners, L.P. | 2,790,729 | ||
| 267,400 | KNOT Offshore Partners, L.P. | 4,762,394 | ||
| 77,404 | Magellan Midstream Partners, L.P. | 3,356,237 | ||
| 174,377 | MPLX, L.P. | 4,469,282 | ||
| 230,073 | NuStar Energy, L.P. | 3,931,948 | ||
| 431,637 | PBF Logistics, L.P. | 6,353,697 | ||
| 182,213 | Phillips 66 Partners, L.P. | 5,770,686 | ||
| 355,615 | Plains All American Pipeline, L.P. | 3,236,096 | ||
| 337,308 | Plains GP Holdings, L.P., Class A | 3,170,695 | ||
| 381,044 | Shell Midstream Partners, L.P. | 5,083,127 | ||
| 196,943 | Sprague Resources, L.P. | 4,311,082 | ||
| 120,366 | Sunoco, L.P. | 3,832,453 | ||
| 156,333 | Teekay LNG Partners, L.P. | 2,249,632 | ||
| 110,126 | Viper Energy Partners, L.P. | 1,603,435 | ||
| 80,834,022 | ||||
Total Master Limited Partnerships | 91,078,552 | |||
| (Cost $85,566,122) | ||||
| EXCHANGE-TRADED FUNDS – 19.2% | ||||
| Capital Markets – 19.2% | ||||
| 1,846,014 | First Trust Tactical High Yield ETF (a) | 89,808,581 | ||
| (Cost $90,340,027) | ||||
| Shares | Description | Stated Rate | Stated Maturity | Value | ||||
| $25 PAR PREFERRED SECURITIES – 19.3% | ||||||||
| Banks – 9.0% | ||||||||
| 136,271 | Bank of America Corp., Series EE | 6.00% | (b) | 3,406,775 | ||||
| 121,787 | Bank of America Corp., Series GG | 6.00% | (b) | 3,312,606 | ||||
| 119,040 | Bank of America Corp., Series HH | 5.88% | (b) | 3,248,602 | ||||
| 130,778 | Bank of America Corp., Series K (c) | 6.45% | 12/15/66 | 3,480,003 | ||||
| 140,270 | Citigroup Capital XIII, 3 Mo. LIBOR + 6.37% (d) | 6.58% | 10/30/40 | 3,773,263 | ||||
| 134,889 | Citigroup, Inc., Series J (c) | 7.13% | (b) | 3,794,428 | ||||
| 129,726 | Citigroup, Inc., Series K (c) | 6.88% | (b) | 3,676,435 | ||||
| 137,835 | JPMorgan Chase & Co., Series AA | 6.10% | (b) | 3,509,279 | ||||
| 139,129 | JPMorgan Chase & Co., Series BB | 6.15% | (b) | 3,550,572 | ||||
| 118,567 | JPMorgan Chase & Co., Series EE | 6.00% | (b) | 3,258,221 | ||||
| 138,428 | US Bancorp, Series F (c) | 6.50% | (b) | 3,600,512 | ||||
| 121,665 | Wells Fargo & Co., Series R (c) | 6.63% | (b) | 3,485,702 | ||||
| 42,096,398 | ||||||||
| Capital Markets – 4.5% | ||||||||
| 134,992 | Charles Schwab (The) Corp., Series C | 6.00% | (b) | 3,417,998 | ||||
| 132,983 | Charles Schwab (The) Corp., Series D | 5.95% | (b) | 3,372,449 | ||||
| 119,099 | Goldman Sachs Group (The), Inc., Series K (c) | 6.38% | (b) | 3,403,849 | ||||
| 143,196 | Goldman Sachs Group (The), Inc., Series N | 6.30% | (b) | 3,638,610 | ||||
| 127,767 | Morgan Stanley, Series E (c) | 7.13% | (b) | 3,687,356 | ||||
| Shares | Description | Stated Rate | Stated Maturity | Value | ||||
| $25 PAR PREFERRED SECURITIES (Continued) | ||||||||
| Capital Markets (Continued) | ||||||||
| 127,120 | Morgan Stanley, Series F (c) | 6.88% | (b) | $3,578,428 | ||||
| 21,098,690 | ||||||||
| Electric Utilities – 0.7% | ||||||||
| 132,851 | PPL Capital Funding, Inc., Series B | 5.90% | 04/30/73 | 3,444,826 | ||||
| Food Products – 2.5% | ||||||||
| 133,335 | CHS, Inc. | 8.00% | (b) | 4,024,050 | ||||
| 143,408 | CHS, Inc., Series 1 | 7.88% | (b) | 4,120,112 | ||||
| 133,338 | CHS, Inc., Series 4 | 7.50% | (b) | 3,838,801 | ||||
| 11,982,963 | ||||||||
| Insurance – 2.6% | ||||||||
| 155,395 | Hartford Financial Services Group (The), Inc. (c) | 7.88% | 04/15/42 | 4,170,802 | ||||
| 163,129 | PartnerRe Ltd., Series H | 7.25% | (b) | 4,122,270 | ||||
| 136,788 | Prudential PLC | 6.75% | (b) | 3,783,556 | ||||
| 12,076,628 | ||||||||
Total $25 Par Preferred Securities | 90,699,505 | |||||||
| (Cost $91,576,986) | ||||||||
Total Investments – 99.6% | 466,923,421 | ||
| (Cost $442,708,761) (e) | |||
Net Other Assets and Liabilities – 0.4% | 1,669,508 | ||
Net Assets – 100.0% | $468,592,929 |
| (a) | Investment in an affiliated fund. |
| (b) | Perpetual maturity. |
| (c) | Fixed-to-floating or fixed-to-variable rate security. The interest rate shown reflects the fixed rate in effect at March 31, 2021. At a predetermined date, the fixed rate will change to a floating rate or a variable rate. |
| (d) | Floating rate security. |
| (e) | Aggregate cost for financial reporting purposes approximates the aggregate cost for federal income tax purposes. As of March 31, 2021, the aggregate gross unrealized appreciation for all investments in which there was an excess of value over tax cost was $30,410,044 and the aggregate gross unrealized depreciation for all investments in which there was an excess of tax cost over value was $6,195,384. The net unrealized appreciation was $24,214,660. |
| LIBOR | London Interbank Offered Rate |
| Total Value at 3/31/2021 | Level 1 Quoted Prices | Level 2 Significant Observable Inputs | Level 3 Significant Unobservable Inputs | |
Common Stocks* | $ 102,376,771 | $ 102,376,771 | $ — | $ — |
Real Estate Investment Trusts* | 92,960,012 | 92,960,012 | — | — |
Master Limited Partnerships* | 91,078,552 | 91,078,552 | — | — |
Exchange-Traded Funds* | 89,808,581 | 89,808,581 | — | — |
$25 Par Preferred Securities* | 90,699,505 | 90,699,505 | — | — |
Total Investments | $ 466,923,421 | $ 466,923,421 | $— | $— |
| * | See Portfolio of Investments for industry breakout. |
| Shares | Description | Value | ||
| COMMON STOCKS – 94.6% | ||||
| Aerospace & Defense – 2.4% | ||||
| 62,240 | BAE Systems PLC | $433,310 | ||
| 118,500 | Singapore Technologies Engineering Ltd. | 342,674 | ||
| 775,984 | ||||
| Auto Components – 1.2% | ||||
| 22,400 | Yokohama Rubber (The) Co., Ltd. | 400,560 | ||
| Banks – 8.2% | ||||
| 3,545 | Bank of Montreal | 315,995 | ||
| 5,974 | Bank of Nova Scotia (The) | 373,737 | ||
| 3,844 | Canadian Imperial Bank of Commerce | 376,386 | ||
| 76,153 | Emirates NBD Bank PJSC | 238,422 | ||
| 89,257 | First Abu Dhabi Bank PJSC | 354,778 | ||
| 73,900 | Mitsubishi UFJ Financial Group, Inc. | 394,912 | ||
| 3,079 | Royal Bank of Canada | 283,889 | ||
| 4,729 | Toronto-Dominion Bank (The) | 308,418 | ||
| 2,646,537 | ||||
| Beverages – 1.4% | ||||
| 91,923 | Arca Continental S.A.B. de C.V. | 451,981 | ||
| Capital Markets – 3.9% | ||||
| 40,670 | Ashmore Group PLC | 219,449 | ||
| 25,945 | IG Group Holdings PLC | 322,268 | ||
| 14,855 | IGM Financial, Inc. | 452,731 | ||
| 10,000 | SBI Holdings, Inc. | 270,941 | ||
| 1,265,389 | ||||
| Construction & Engineering – 1.3% | ||||
| 10,450 | Bouygues S.A. | 418,989 | ||
| Consumer Finance – 0.8% | ||||
| 20,400 | Credit Saison Co., Ltd. | 244,671 | ||
| Diversified Telecommunication Services – 6.0% | ||||
| 10,328 | BCE, Inc. | 466,227 | ||
| 6,389 | Elisa OYJ | 383,160 | ||
| 12,600 | Nippon Telegraph & Telephone Corp. | 323,407 | ||
| 761 | Swisscom AG | 408,218 | ||
| 17,431 | TELUS Corp. | 347,177 | ||
| 1,928,189 | ||||
| Electric Utilities – 8.8% | ||||
| 29,500 | Chugoku Electric Power (The) Co., Inc. | 362,073 | ||
| 93,219 | CK Infrastructure Holdings Ltd. | 553,983 | ||
| 40,235 | CLP Holdings, Ltd. | 390,752 | ||
| 8,300 | Emera, Inc. | 369,395 | ||
| 19,460 | Fortum OYJ | 519,400 | ||
| Shares | Description | Value | ||
| Electric Utilities (Continued) | ||||
| 109,485 | Power Assets Holdings Ltd. | $646,423 | ||
| 2,842,026 | ||||
| Food & Staples Retailing – 1.2% | ||||
| 31,160 | SPAR Group (The) Ltd. | 400,879 | ||
| Food Products – 2.5% | ||||
| 5,128 | Danone S.A. | 351,796 | ||
| 42,684 | Tate & Lyle PLC | 451,452 | ||
| 803,248 | ||||
| Gas Utilities – 5.1% | ||||
| 63,040 | APA Group | 479,778 | ||
| 111,530 | Beijing Enterprises Holdings Ltd. | 393,807 | ||
| 36,230 | Enagas S.A. | 786,858 | ||
| 1,660,443 | ||||
| Household Durables – 2.2% | ||||
| 10,538 | JM AB | 356,437 | ||
| 17,200 | Sekisui House Ltd. | 368,777 | ||
| 725,214 | ||||
| Independent Power & Renewable Electricity Producers – 2.9% | ||||
| 14,980 | Capital Power Corp. | 433,892 | ||
| 27,900 | Electric Power Development Co., Ltd. | 487,321 | ||
| 921,213 | ||||
| Insurance – 12.4% | ||||
| 7,160 | Ageas S.A./N.V. | 432,925 | ||
| 1,259 | Allianz SE | 320,459 | ||
| 1,478 | Baloise Holding AG | 251,455 | ||
| 15,012 | Great-West Lifeco, Inc. | 399,460 | ||
| 115,561 | Legal & General Group PLC | 444,641 | ||
| 16,261 | Manulife Financial Corp. | 349,753 | ||
| 9,900 | MS&AD Insurance Group Holdings, Inc. | 290,495 | ||
| 45,307 | Phoenix Group Holdings PLC | 458,583 | ||
| 15,849 | Power Corp. of Canada | 416,561 | ||
| 646 | Swiss Life Holding AG | 317,549 | ||
| 809 | Zurich Insurance Group AG | 345,290 | ||
| 4,027,171 | ||||
| Internet & Direct Marketing Retail – 1.2% | ||||
| 107,881 | Moneysupermarket.com Group PLC | 396,500 | ||
| Leisure Products – 1.4% | ||||
| 17,000 | Sankyo Co., Ltd. | 450,314 | ||
| Media – 1.8% | ||||
| 22,045 | Shaw Communications, Inc., Class B | 573,272 | ||
| Shares | Description | Value | ||
| COMMON STOCKS (Continued) | ||||
| Metals & Mining – 1.2% | ||||
| 19,600 | Asahi Holdings, Inc. | $374,918 | ||
| Multi-Utilities – 2.5% | ||||
| 11,705 | ATCO Ltd., Class I | 388,583 | ||
| 16,080 | Canadian Utilities Ltd., Class A | 431,718 | ||
| 820,301 | ||||
| Oil, Gas & Consumable Fuels – 5.3% | ||||
| 29,964 | Keyera Corp. | 622,789 | ||
| 21,584 | Pembina Pipeline Corp. | 623,458 | ||
| 10,423 | TC Energy Corp. | 477,814 | ||
| 1,724,061 | ||||
| Paper & Forest Products – 1.1% | ||||
| 10,025 | UPM-Kymmene OYJ | 360,096 | ||
| Personal Products – 1.2% | ||||
| 60,305 | Hengan International Group Co., Ltd. | 396,391 | ||
| Pharmaceuticals – 2.6% | ||||
| 27,840 | GlaxoSmithKline PLC | 494,337 | ||
| 3,527 | Sanofi | 348,468 | ||
| 842,805 | ||||
| Real Estate Management & Development – 8.0% | ||||
| 209,265 | China Overseas Land & Investment Ltd. | 543,748 | ||
| 124,250 | Henderson Land Development Co., Ltd. | 557,791 | ||
| 103,758 | New World Development Co. Ltd. | 536,534 | ||
| 344,735 | Sino Land Co., Ltd. | 479,803 | ||
| 30,485 | Sun Hung Kai Properties Ltd. | 461,936 | ||
| 2,579,812 | ||||
| Technology Hardware, Storage & Peripherals – 1.3% | ||||
| 288,209 | Lenovo Group Ltd. | 410,027 | ||
| Tobacco – 3.4% | ||||
| 33,000 | Japan Tobacco, Inc. | 633,326 | ||
| 6,318 | KT&G Corp. | 454,416 | ||
| 1,087,742 | ||||
| Water Utilities – 1.0% | ||||
| 202,560 | Guangdong Investment Ltd. | 329,866 | ||
| Wireless Telecommunication Services – 2.3% | ||||
| 11,200 | KDDI Corp. | 343,409 | ||
| Shares | Description | Value | ||
| Wireless Telecommunication Services (Continued) | ||||
| 1,635 | SK Telecom Co., Ltd. | $397,283 | ||
| 740,692 | ||||
| Total Common Stocks | 30,599,291 | |||
| (Cost $28,936,617) | ||||
| REAL ESTATE INVESTMENT TRUSTS – 4.5% | ||||
| Equity Real Estate Investment Trusts – 4.5% | ||||
| 460 | Japan Metropolitan Fund Investment Corp. | 469,867 | ||
| 168,345 | Primary Health Properties PLC | 343,943 | ||
| 30,520 | SmartCentres Real Estate Investment Trust | 652,074 | ||
| Total Real Estate Investment Trusts | 1,465,884 | |||
| (Cost $1,410,589) | ||||
| Total Investments – 99.1% | 32,065,175 | |||
| (Cost $30,347,206) (a) | ||||
| Net Other Assets and Liabilities – 0.9% | 304,581 | |||
| Net Assets – 100.0% | $32,369,756 | |||
| (a) | Aggregate cost for financial reporting purposes approximates the aggregate cost for federal income tax purposes. As of March 31, 2021, the aggregate gross unrealized appreciation for all investments in which there was an excess of value over tax cost was $2,108,552 and the aggregate gross unrealized depreciation for all investments in which there was an excess of tax cost over value was $390,583. The net unrealized appreciation was $1,717,969. |
| Total Value at 3/31/2021 | Level 1 Quoted Prices | Level 2 Significant Observable Inputs | Level 3 Significant Unobservable Inputs | |
| Common Stocks* | $ 30,599,291 | $ 30,599,291 | $ — | $ — |
| Real Estate Investment Trusts* | 1,465,884 | 1,465,884 | — | — |
| Total Investments | $ 32,065,175 | $ 32,065,175 | $— | $— |
| * | See Portfolio of Investments for industry breakout. |
| Currency Exposure Diversification | % of Total Investments |
| Canadian Dollar | 27.0% |
| Hong Kong Dollar | 17.8 |
| Japanese Yen | 16.9 |
| Euro | 12.2 |
| British Pound Sterling | 11.1 |
| Swiss Franc | 4.1 |
| South Korean Won | 2.7 |
| United Arab Emirates Dirham | 1.8 |
| Australian Dollar | 1.5 |
| Mexican Peso | 1.4 |
| South African Rand | 1.3 |
| Swedish Krona | 1.1 |
| Singapore Dollar | 1.1 |
| Total | 100.0% |
| Shares | Description | Value | ||
| COMMON STOCKS – 94.7% | ||||
| Aerospace & Defense – 0.3% | ||||
| 842 | Hexcel Corp. (a) | $47,152 | ||
| 1,002 | Spirit AeroSystems Holdings, Inc., Class A | 48,747 | ||
| 2,712 | Triumph Group, Inc. (a) | 49,847 | ||
| 1,572 | Virgin Galactic Holdings, Inc. (a) | 48,150 | ||
| 193,896 | ||||
| Airlines – 0.5% | ||||
| 732 | Alaska Air Group, Inc. (a) | 50,662 | ||
| 1,000 | Delta Air Lines, Inc. (a) | 48,280 | ||
| 2,505 | JetBlue Airways Corp. (a) | 50,952 | ||
| 855 | SkyWest, Inc. (a) | 46,580 | ||
| 834 | Southwest Airlines Co. (a) | 50,924 | ||
| 900 | United Airlines Holdings, Inc. (a) | 51,786 | ||
| 299,184 | ||||
| Auto Components – 0.3% | ||||
| 15,064 | American Axle & Manufacturing Holdings, Inc. (a) | 145,518 | ||
| 3,220 | Modine Manufacturing Co. (a) | 47,560 | ||
| 193,078 | ||||
| Automobiles – 0.2% | ||||
| 3,910 | Ford Motor Co. (a) | 47,897 | ||
| 902 | General Motors Co. (a) | 51,829 | ||
| 99,726 | ||||
| Banks – 7.0% | ||||
| 7,051 | Associated Banc-Corp. | 150,468 | ||
| 3,841 | Atlantic Union Bankshares Corp. | 147,341 | ||
| 10,279 | First Commonwealth Financial Corp. | 147,709 | ||
| 4,241 | Hilltop Holdings, Inc. | 144,745 | ||
| 5,629 | Home BancShares, Inc. | 152,264 | ||
| 3,855 | JPMorgan Chase & Co. (b) | 586,847 | ||
| 13,034 | Prosperity Bancshares, Inc. (b) | 976,116 | ||
| 4,707 | S&T Bancorp, Inc. | 157,685 | ||
| 62,648 | Valley National Bancorp (b) | 860,784 | ||
| 16,717 | Zions Bancorp N.A. (b) | 918,766 | ||
| 4,242,725 | ||||
| Biotechnology – 2.1% | ||||
| 3,188 | AbbVie, Inc. | 345,005 | ||
| 1,066 | Amgen, Inc. | 265,232 | ||
| 1,834 | Gilead Sciences, Inc. | 118,531 | ||
| 1,501 | Incyte Corp. (a) | 121,986 | ||
| 1,037 | Ligand Pharmaceuticals, Inc. (a) | 158,091 | ||
| 263 | Regeneron Pharmaceuticals, Inc. (a) | 124,436 | ||
| 562 | Vertex Pharmaceuticals, Inc. (a) | 120,768 | ||
| 1,254,049 | ||||
| Building Products – 0.1% | ||||
| 565 | Fortune Brands Home & Security, Inc. | 54,138 | ||
| Capital Markets – 6.8% | ||||
| 31,292 | Bank of New York Mellon (The) Corp. (b) | 1,479,799 | ||
| 3,594 | Goldman Sachs Group (The), Inc. (b) | 1,175,238 | ||
| 3,707 | Lazard Ltd., Class A | 161,291 | ||
| Shares | Description | Value | ||
| COMMON STOCKS (Continued) | ||||
| Capital Markets (Continued) | ||||
| 12,607 | Northern Trust Corp. (b) | $1,325,122 | ||
| 4,141,450 | ||||
| Chemicals – 2.7% | ||||
| 499 | Albemarle Corp. | 72,909 | ||
| 1,540 | CF Industries Holdings, Inc. | 69,885 | ||
| 2,660 | Chemours (The) Co. | 74,241 | ||
| 1,596 | Corteva, Inc. | 74,405 | ||
| 1,143 | Dow, Inc. | 73,083 | ||
| 967 | DuPont de Nemours, Inc. | 74,730 | ||
| 630 | Eastman Chemical Co. | 69,376 | ||
| 342 | Ecolab, Inc. | 73,212 | ||
| 8,026 | Element Solutions, Inc. (b) | 146,796 | ||
| 700 | FMC Corp. | 77,427 | ||
| 1,020 | Ingevity Corp. (a) | 77,041 | ||
| 658 | LyondellBasell Industries N.V., Class A | 68,465 | ||
| 7,775 | Orion Engineered Carbons S.A. (a) | 153,323 | ||
| 509 | PPG Industries, Inc. | 76,482 | ||
| 865 | RPM International, Inc. | 79,450 | ||
| 8,762 | Tredegar Corp. | 131,518 | ||
| 2,849 | Valvoline, Inc. | 74,273 | ||
| 813 | Westlake Chemical Corp. | 72,186 | ||
| 1,190 | WR Grace & Co. | 71,233 | ||
| 1,610,035 | ||||
| Commercial Services & Supplies – 0.4% | ||||
| 2,908 | BrightView Holdings, Inc. (a) | 49,058 | ||
| 3,862 | Matthews International Corp., Class A | 152,742 | ||
| 702 | Stericycle, Inc. (a) | 47,392 | ||
| 249,192 | ||||
| Communications Equipment – 1.7% | ||||
| 34,243 | Juniper Networks, Inc. (b) | 867,375 | ||
| 5,370 | NetScout Systems, Inc. (a) | 151,219 | ||
| 1,018,594 | ||||
| Consumer Finance – 0.2% | ||||
| 1,942 | Nelnet, Inc., Class A (b) | 141,261 | ||
| Containers & Packaging – 3.0% | ||||
| 24,101 | Berry Global Group, Inc. (a) (b) | 1,479,802 | ||
| 2,806 | Greif, Inc., Class A | 159,942 | ||
| 12,168 | O-I Glass, Inc. (a) | 179,356 | ||
| 1,819,100 | ||||
| Diversified Consumer Services – 0.4% | ||||
| 290 | Bright Horizons Family Solutions, Inc. (a) | 49,720 | ||
| 2,401 | H&R Block, Inc. | 52,342 | ||
| 10,889 | Laureate Education, Inc., Class A (a) | 147,982 | ||
| 250,044 | ||||
| Diversified Financial Services – 1.0% | ||||
| 2,369 | Berkshire Hathaway, Inc., Class B (a) (b) | 605,208 | ||
| Diversified Telecommunication Services – 4.2% | ||||
| 29,786 | AT&T, Inc. (b) | 901,622 | ||
| 105,401 | Lumen Technologies, Inc. (b) | 1,407,103 | ||
| Shares | Description | Value | ||
| COMMON STOCKS (Continued) | ||||
| Diversified Telecommunication Services (Continued) | ||||
| 3,833 | Verizon Communications, Inc. (b) | $222,889 | ||
| 2,531,614 | ||||
| Electrical Equipment – 2.3% | ||||
| 68,779 | Vertiv Holdings Co. (b) | 1,375,580 | ||
| Electronic Equipment, Instruments & Components – 3.1% | ||||
| 14,318 | Arrow Electronics, Inc. (a) (b) | 1,586,721 | ||
| 3,920 | Avnet, Inc. | 162,719 | ||
| 10,467 | TTM Technologies, Inc. (a) | 151,771 | ||
| 1,901,211 | ||||
| Energy Equipment & Services – 0.1% | ||||
| 875 | Nabors Industries Ltd. (a) | 81,769 | ||
| Entertainment – 1.2% | ||||
| 234 | Madison Square Garden Sports Corp., Class A (a) | 41,994 | ||
| 420 | Netflix, Inc. (a) (b) | 219,097 | ||
| 2,509 | Walt Disney (The) Co. (a) (b) | 462,961 | ||
| 724,052 | ||||
| Food & Staples Retailing – 0.8% | ||||
| 2,472 | Ingles Markets, Inc., Class A | 152,399 | ||
| 7,714 | Rite Aid Corp. (a) | 157,828 | ||
| 4,930 | United Natural Foods, Inc. (a) | 162,394 | ||
| 472,621 | ||||
| Food Products – 2.6% | ||||
| 30,751 | Campbell Soup Co. (b) | 1,545,853 | ||
| Health Care Equipment & Supplies – 3.3% | ||||
| 3,296 | Abbott Laboratories | 394,993 | ||
| 393 | ABIOMED, Inc. (a) | 125,261 | ||
| 225 | Align Technology, Inc. (a) | 121,844 | ||
| 3,060 | Boston Scientific Corp. (a) | 118,269 | ||
| 1,180 | Danaher Corp. | 265,594 | ||
| 1,970 | DENTSPLY SIRONA, Inc. | 125,706 | ||
| 242 | IDEXX Laboratories, Inc. (a) | 118,413 | ||
| 220 | Intuitive Surgical, Inc. (a) | 162,567 | ||
| 2,455 | Medtronic PLC | 290,009 | ||
| 14,225 | SmileDirectClub, Inc. (a) | 146,660 | ||
| 492 | Stryker Corp. | 119,841 | ||
| 1,989,157 | ||||
| Health Care Providers & Services – 6.9% | ||||
| 1,134 | AmerisourceBergen Corp. | 133,891 | ||
| 367 | Anthem, Inc. | 131,735 | ||
| 26,924 | Cardinal Health, Inc. (b) | 1,635,633 | ||
| 1,976 | Centene Corp. (a) | 126,286 | ||
| 2,377 | CVS Health Corp. (b) | 178,822 | ||
| 10,197 | DaVita, Inc. (a) (b) | 1,098,931 | ||
| 1,881 | Henry Schein, Inc. (a) | 130,241 | ||
| 679 | McKesson Corp. | 132,432 | ||
| 1,649 | UnitedHealth Group, Inc. | 613,543 | ||
| 4,181,514 | ||||
| Shares | Description | Value | ||
| COMMON STOCKS (Continued) | ||||
| Hotels, Restaurants & Leisure – 4.1% | ||||
| 1,802 | Bloomin’ Brands, Inc. (a) | $48,744 | ||
| 21 | Booking Holdings, Inc. (a) | 48,927 | ||
| 1,710 | Carnival Corp. (a) | 45,383 | ||
| 836 | Cheesecake Factory (The), Inc. (a) | 48,914 | ||
| 1,133 | Dave & Buster’s Entertainment, Inc. (a) | 54,271 | ||
| 2,659 | Denny’s Corp. (a) | 48,154 | ||
| 297 | Expedia Group, Inc. (a) | 51,120 | ||
| 386 | Hilton Worldwide Holdings, Inc. (a) | 46,675 | ||
| 547 | Hyatt Hotels Corp., Class A (a) | 45,237 | ||
| 753 | Las Vegas Sands Corp. (a) | 45,752 | ||
| 324 | Marriott International, Inc., Class A (a) | 47,988 | ||
| 229 | McDonald’s Corp. | 51,328 | ||
| 38,102 | MGM Resorts International (b) | 1,447,495 | ||
| 1,456 | Norwegian Cruise Line Holdings Ltd. (a) | 40,171 | ||
| 512 | Royal Caribbean Cruises Ltd. (a) | 43,832 | ||
| 2,078 | Ruth’s Hospitality Group, Inc. (a) | 51,597 | ||
| 1,011 | Scientific Games Corp., Class A (a) | 38,944 | ||
| 998 | SeaWorld Entertainment, Inc. (a) | 49,571 | ||
| 996 | Six Flags Entertainment Corp. (a) | 46,284 | ||
| 444 | Starbucks Corp. | 48,516 | ||
| 157 | Vail Resorts, Inc. (a) | 45,791 | ||
| 736 | Wyndham Hotels & Resorts, Inc. | 51,358 | ||
| 361 | Wynn Resorts Ltd. (a) | 45,258 | ||
| 2,491,310 | ||||
| Household Products – 0.6% | ||||
| 2,644 | Beazer Homes USA, Inc. (a) | 55,313 | ||
| 2,305 | Procter & Gamble (The) Co. | 312,166 | ||
| 367,479 | ||||
| Insurance – 0.3% | ||||
| 1,208 | Hanover Insurance Group (The), Inc. | 156,388 | ||
| Interactive Media & Services – 4.0% | ||||
| 360 | Alphabet, Inc., Class A (a) | 742,507 | ||
| 358 | Alphabet, Inc., Class C (a) | 740,570 | ||
| 3,206 | Facebook, Inc., Class A (a) (b) | 944,263 | ||
| 2,427,340 | ||||
| Internet & Direct Marketing Retail – 2.4% | ||||
| 470 | Amazon.com, Inc. (a) (b) | 1,454,218 | ||
| IT Services – 1.0% | ||||
| 1,502 | Alliance Data Systems Corp. | 168,359 | ||
| 2,200 | Visa, Inc., Class A (b) | 465,806 | ||
| 634,165 | ||||
| Life Sciences Tools & Services – 1.0% | ||||
| 110 | Mettler-Toledo International, Inc. (a) | 127,126 | ||
| 943 | PerkinElmer, Inc. | 120,977 | ||
| 728 | Thermo Fisher Scientific, Inc. (b) | 332,245 | ||
| 580,348 | ||||
| Machinery – 0.7% | ||||
| 652 | Astec Industries, Inc. | 49,174 | ||
| 4,097 | CIRCOR International, Inc. (a) | 142,658 | ||
| 5,909 | Enerpac Tool Group Corp. | 154,343 | ||
| Shares | Description | Value | ||
| COMMON STOCKS (Continued) | ||||
| Machinery (Continued) | ||||
| 1,058 | Navistar International Corp. (a) | $46,584 | ||
| 1,473 | TriMas Corp. (a) | 44,661 | ||
| 437,420 | ||||
| Marine – 0.2% | ||||
| 10,501 | Atlas Corp. | 143,339 | ||
| Media – 0.3% | ||||
| 3,061 | iHeartMedia, Inc., Class A (a) | 55,557 | ||
| 7,781 | MSG Networks, Inc., Class A (a) | 117,026 | ||
| 172,583 | ||||
| Metals & Mining – 3.1% | ||||
| 9,287 | Alamos Gold, Inc., Class A | 72,531 | ||
| 3,362 | AngloGold Ashanti Ltd., ADR | 73,863 | ||
| 3,572 | Barrick Gold Corp. (a) | 70,726 | ||
| 6,001 | Cia de Minas Buenaventura SAA, ADR (a) | 60,190 | ||
| 7,907 | DRDGOLD Ltd., ADR (a) | 74,800 | ||
| 6,316 | Eldorado Gold Corp. (a) | 68,150 | ||
| 4,358 | First Majestic Silver Corp. (a) | 67,898 | ||
| 10,337 | Fortuna Silver Mines, Inc. (a) | 66,880 | ||
| 646 | Franco-Nevada Corp. | 80,937 | ||
| 2,145 | Freeport-McMoRan, Inc. | 70,635 | ||
| 10,897 | Kinross Gold Corp. (b) | 72,683 | ||
| 2,090 | Kirkland Lake Gold Ltd. | 70,642 | ||
| 4,162 | MAG Silver Corp. (a) | 62,472 | ||
| 1,266 | Newmont Corp. | 76,302 | ||
| 1,153 | Nucor Corp. | 92,551 | ||
| 2,259 | Pan American Silver Corp. | 67,838 | ||
| 7,068 | Pretium Resources, Inc. (a) | 73,295 | ||
| 510 | Reliance Steel & Aluminum Co. | 77,668 | ||
| 673 | Royal Gold, Inc. | 72,428 | ||
| 11,552 | Sandstorm Gold Ltd. (a) | 78,553 | ||
| 13,358 | Silvercorp Metals, Inc. | 65,588 | ||
| 9,358 | SilverCrest Metals, Inc. (a) | 75,613 | ||
| 4,913 | SSR Mining, Inc. | 70,158 | ||
| 7,347 | Warrior Met Coal, Inc. | 125,854 | ||
| 1,961 | Wheaton Precious Metals Corp. | 74,930 | ||
| 1,863,185 | ||||
| Multiline Retail – 0.3% | ||||
| 262 | Dollar General Corp. | 53,086 | ||
| 3,080 | Macy’s, Inc. (a) | 49,865 | ||
| 1,311 | Nordstrom, Inc. (a) | 49,648 | ||
| 275 | Target Corp. | 54,469 | ||
| 207,068 | ||||
| Oil, Gas & Consumable Fuels – 6.2% | ||||
| 5,933 | APA Corp. | 106,201 | ||
| 3,456 | Bonanza Creek Energy, Inc. (a) | 123,483 | ||
| 1,166 | Chevron Corp. | 122,185 | ||
| 1,938 | Cimarex Energy Co. | 115,098 | ||
| 9,111 | CNX Resources Corp. (a) | 133,932 | ||
| 2,215 | ConocoPhillips | 117,329 | ||
| 5,285 | CVR Energy, Inc. | 101,366 | ||
| 5,262 | Delek US Holdings, Inc. | 114,606 | ||
| Shares | Description | Value | ||
| COMMON STOCKS (Continued) | ||||
| Oil, Gas & Consumable Fuels (Continued) | ||||
| 25,329 | DHT Holdings, Inc. (b) | $150,201 | ||
| 1,533 | Diamondback Energy, Inc. | 112,660 | ||
| 1,720 | EOG Resources, Inc. | 124,752 | ||
| 2,096 | Exxon Mobil Corp. | 117,020 | ||
| 5,313 | Green Plains, Inc. (a) | 143,823 | ||
| 3,144 | HollyFrontier Corp. | 112,492 | ||
| 10,299 | Magnolia Oil & Gas Corp., Class A (a) | 118,233 | ||
| 10,048 | Marathon Oil Corp. | 107,313 | ||
| 2,184 | Marathon Petroleum Corp. | 116,822 | ||
| 6,611 | Murphy Oil Corp. | 108,486 | ||
| 4,154 | Occidental Petroleum Corp. | 110,579 | ||
| 4,614 | Ovintiv, Inc. | 109,905 | ||
| 6,701 | Par Pacific Holdings, Inc. (a) | 94,618 | ||
| 7,667 | PBF Energy, Inc., Class A (a) | 108,488 | ||
| 3,158 | PDC Energy, Inc. (a) | 108,635 | ||
| 1,458 | Phillips 66 | 118,885 | ||
| 793 | Pioneer Natural Resources Co. | 125,944 | ||
| 14,609 | Range Resources Corp. (a) | 150,911 | ||
| 1,702 | Renewable Energy Group, Inc. (a) | 112,400 | ||
| 9,124 | Scorpio Tankers, Inc. | 168,429 | ||
| 18,328 | SFL Corp., Ltd. | 146,991 | ||
| 1,631 | Valero Energy Corp. | 116,780 | ||
| 3,684 | World Fuel Services Corp. | 129,677 | ||
| 3,748,244 | ||||
| Pharmaceuticals – 3.5% | ||||
| 4,186 | Bristol-Myers Squibb Co. | 264,262 | ||
| 1,443 | Eli Lilly & Co. | 269,581 | ||
| 3,822 | Johnson & Johnson (b) | 628,146 | ||
| 4,665 | Merck & Co., Inc. | 359,625 | ||
| 9,734 | Pfizer, Inc. | 352,663 | ||
| 8,657 | Viatris, Inc. (a) | 120,938 | ||
| 808 | Zoetis, Inc. | 127,244 | ||
| 2,122,459 | ||||
| Professional Services – 0.1% | ||||
| 1,298 | Heidrick & Struggles International, Inc. | 46,365 | ||
| Real Estate Management & Development – 0.1% | ||||
| 2,380 | Kennedy-Wilson Holdings, Inc. | 48,100 | ||
| Road & Rail – 0.7% | ||||
| 2,437 | Avis Budget Group, Inc. (a) | 176,780 | ||
| 769 | Lyft, Inc., Class A (a) | 48,585 | ||
| 2,073 | Ryder System, Inc. | 156,823 | ||
| 879 | Uber Technologies, Inc. (a) | 47,914 | ||
| 430,102 | ||||
| Semiconductors & Semiconductor Equipment – 1.2% | ||||
| 3,802 | Intel Corp. (b) | 243,328 | ||
| 6,927 | Magnachip Semiconductor Corp. (a) | 172,482 | ||
| 621 | NVIDIA Corp. | 331,571 | ||
| 747,381 | ||||
| Software – 4.3% | ||||
| 447 | Adobe, Inc. (a) (b) | 212,490 | ||
| 5,156 | Avaya Holdings Corp. (a) | 144,523 | ||
| Shares | Description | Value | ||
| COMMON STOCKS (Continued) | ||||
| Software (Continued) | ||||
| 9,413 | Microsoft Corp. (b) | $2,219,303 | ||
| 2,576,316 | ||||
| Specialty Retail – 2.9% | ||||
| 282 | Advance Auto Parts, Inc. | 51,744 | ||
| 11,055 | Designer Brands, Inc., Class A (a) | 192,357 | ||
| 3,118 | Genesco, Inc. (a) | 148,105 | ||
| 5,940 | Guess?, Inc. | 139,590 | ||
| 986 | Home Depot (The), Inc. (b) | 300,977 | ||
| 6,709 | Michaels Cos (The), Inc. (a) | 147,195 | ||
| 10,027 | Penske Automotive Group, Inc. (b) | 804,567 | ||
| 1,784,535 | ||||
| Technology Hardware, Storage & Peripherals – 5.3% | ||||
| 20,170 | Apple, Inc. (b) | 2,463,766 | ||
| 10,530 | NetApp, Inc. (b) | 765,215 | ||
| 3,228,981 | ||||
| Textiles, Apparel & Luxury Goods – 0.2% | ||||
| 9,240 | Fossil Group, Inc. (a) | 114,576 | ||
| Thrifts & Mortgage Finance – 0.5% | ||||
| 3,183 | HomeStreet, Inc. | 140,275 | ||
| 12,445 | Kearny Financial Corp. | 150,335 | ||
| 290,610 | ||||
| Tobacco – 0.2% | ||||
| 10,717 | Vector Group Ltd. | 149,502 | ||
| Trading Companies & Distributors – 0.2% | ||||
| 16,373 | MRC Global, Inc. (a) | 147,848 | ||
| Transportation Infrastructure – 0.1% | ||||
| 1,533 | Macquarie Infrastructure Corp. (a) | 48,765 | ||
Total Common Stocks | 57,393,678 | |||
| (Cost $51,608,689) | ||||
| REAL ESTATE INVESTMENT TRUSTS – 3.4% | ||||
| Equity Real Estate Investment Trusts – 1.8% | ||||
| 2,424 | Acadia Realty Trust | 45,983 | ||
| 661 | Centerspace | 44,948 | ||
| 10,104 | Columbia Property Trust, Inc. | 172,779 | ||
| 1,421 | Douglas Emmett, Inc. | 44,619 | ||
| 12,737 | Empire State Realty Trust, Inc., Class A | 141,763 | ||
| 447 | Federal Realty Investment Trust | 45,348 | ||
| 2,992 | Host Hotels & Resorts, Inc. (a) | 50,415 | ||
| 2,739 | iStar, Inc. | 48,700 | ||
| 1,454 | JBG SMITH Properties | 46,223 | ||
| 1,423 | MGM Growth Properties LLC | 46,418 | ||
| 2,058 | Pebblebrook Hotel Trust | 49,989 | ||
| 2,665 | Piedmont Office Realty Trust, Inc., Class A | 46,291 | ||
| 4,220 | RPT Realty | 48,150 | ||
| 2,316 | Seritage Growth Properties, Class A (a) | 42,499 | ||
| 3,865 | Service Properties Trust | 45,839 | ||
| 2,002 | Washington Real Estate Investment Trust | 44,244 | ||
| 1,818 | Weingarten Realty Investors | 48,922 | ||
| Shares | Description | Value | ||
| REAL ESTATE INVESTMENT TRUSTS (Continued) | ||||
| Equity Real Estate Investment Trusts (Continued) | ||||
| 675 | Welltower, Inc. | $48,350 | ||
| 1,061,480 | ||||
| Mortgage Real Estate Investment Trusts – 1.6% | ||||
| 94,686 | Annaly Capital Management, Inc. (b) | 814,300 | ||
| 14,054 | New Residential Investment Corp. | 158,107 | ||
| 972,407 | ||||
Total Real Estate Investment Trusts | 2,033,887 | |||
| (Cost $1,975,119) | ||||
| MASTER LIMITED PARTNERSHIPS – 0.2% | ||||
| Oil, Gas & Consumable Fuels – 0.2% | ||||
| 7,489 | Black Stone Minerals, L.P. | 65,304 | ||
| 2,253 | Sunoco, L.P. | 71,735 | ||
Total Master Limited Partnerships | 137,039 | |||
| (Cost $141,925) | ||||
Total Investments – 98.3% | 59,564,604 | |||
| (Cost $53,725,733) (c) | ||||
| Number of Contracts | Description | Notional Amount | Exercise Price | Expiration Date | Value | |||||
| CALL OPTIONS WRITTEN – (2.4)% | ||||||||||
| (15) | S&P 500® Index | $(5,959,335) | $3,800.00 | Apr 2021 | (277,650) | |||||
| (10) | S&P 500® Index | (3,972,890) | 3,825.00 | Apr 2021 | (176,900) | |||||
| (10) | S&P 500® Index | (3,972,890) | 3,850.00 | Apr 2021 | (146,700) | |||||
| (11) | S&P 500® Index | (4,370,179) | 3,925.00 | May 2021 | (140,635) | |||||
| (10) | S&P 500® Index | (3,972,890) | 3,950.00 | May 2021 | (116,340) | |||||
| (12) | S&P 500® Index | (4,767,468) | 3,975.00 | May 2021 | (113,340) | |||||
| (13) | S&P 500® Index | (5,164,757) | 3,850.00 | Jun 2021 | (275,106) | |||||
| (13) | S&P 500® Index | (5,164,757) | 3,975.00 | Jun 2021 | (152,100) | |||||
| (7) | S&P 500® Index | (2,781,023) | 4,000.00 | Jun 2021 | (70,910) | |||||
Total Call Options Written | (1,469,681) | |||||||||
| (Premiums received $1,397,736) | ||||||||||
Net Other Assets and Liabilities – 4.1% | 2,501,592 | ||
Net Assets – 100.0% | $60,596,515 |
| (a) | Non-income producing security. |
| (b) | All or a portion of this security is pledged to cover index options written. |
| (c) | Aggregate cost for financial reporting purposes approximates the aggregate cost for federal income tax purposes. As of March 31, 2021, the aggregate gross unrealized appreciation for all investments in which there was an excess of value over tax cost was $6,590,884 and the aggregate gross unrealized depreciation for all investments in which there was an excess of tax cost over value was $823,958. The net unrealized appreciation was $5,766,926. The unrealized amounts presented are inclusive of derivative contracts. |
| ADR | American Depositary Receipt |
| ASSETS TABLE | ||||
| Total Value at 3/31/2021 | Level 1 Quoted Prices | Level 2 Significant Observable Inputs | Level 3 Significant Unobservable Inputs | |
Common Stocks* | $ 57,393,678 | $ 57,393,678 | $ — | $ — |
Real Estate Investment Trusts* | 2,033,887 | 2,033,887 | — | — |
Master Limited Partnerships* | 137,039 | 137,039 | — | — |
Total Investments | $ 59,564,604 | $ 59,564,604 | $— | $— |
LIABILITIES TABLE | ||||
| Total Value at 3/31/2021 | Level 1 Quoted Prices | Level 2 Significant Observable Inputs | Level 3 Significant Unobservable Inputs | |
Call Options Written | $ (1,469,681) | $ (1,469,681) | $ — | $ — |
| * | See Portfolio of Investments for industry breakout. |
| Shares | Description | Value | ||
| COMMON STOCKS – 95.2% | ||||
| Aerospace & Defense – 0.3% | ||||
| 74 | Hexcel Corp. (a) | $4,144 | ||
| 89 | Spirit AeroSystems Holdings, Inc., Class A | 4,330 | ||
| 244 | Triumph Group, Inc. (a) | 4,485 | ||
| 138 | Virgin Galactic Holdings, Inc. (a) | 4,227 | ||
| 17,186 | ||||
| Airlines – 0.5% | ||||
| 64 | Alaska Air Group, Inc. (a) | 4,429 | ||
| 88 | Delta Air Lines, Inc. (a) | 4,249 | ||
| 219 | JetBlue Airways Corp. (a) | 4,454 | ||
| 74 | SkyWest, Inc. (a) | 4,032 | ||
| 73 | Southwest Airlines Co. (a) | 4,457 | ||
| 79 | United Airlines Holdings, Inc. (a) | 4,546 | ||
| 26,167 | ||||
| Auto Components – 0.3% | ||||
| 1,306 | American Axle & Manufacturing Holdings, Inc. (a) | 12,616 | ||
| 281 | Modine Manufacturing Co. (a) | 4,150 | ||
| 16,766 | ||||
| Automobiles – 0.2% | ||||
| 340 | Ford Motor Co. (a) | 4,165 | ||
| 79 | General Motors Co. (a) | 4,539 | ||
| 8,704 | ||||
| Banks – 7.1% | ||||
| 612 | Associated Banc-Corp. | 13,060 | ||
| 332 | Atlantic Union Bankshares Corp. | 12,736 | ||
| 887 | First Commonwealth Financial Corp. | 12,746 | ||
| 365 | Hilltop Holdings, Inc. | 12,457 | ||
| 488 | Home BancShares, Inc. | 13,200 | ||
| 334 | JPMorgan Chase & Co. (b) | 50,845 | ||
| 1,125 | Prosperity Bancshares, Inc. (b) | 84,251 | ||
| 407 | S&T Bancorp, Inc. | 13,635 | ||
| 5,424 | Valley National Bancorp (b) | 74,526 | ||
| 1,451 | Zions Bancorp N.A. (b) | 79,747 | ||
| 367,203 | ||||
| Biotechnology – 2.1% | ||||
| 274 | AbbVie, Inc. | 29,652 | ||
| 92 | Amgen, Inc. | 22,891 | ||
| 157 | Gilead Sciences, Inc. | 10,147 | ||
| 127 | Incyte Corp. (a) | 10,321 | ||
| 89 | Ligand Pharmaceuticals, Inc. (a) | 13,568 | ||
| 23 | Regeneron Pharmaceuticals, Inc. (a) | 10,882 | ||
| 48 | Vertex Pharmaceuticals, Inc. (a) | 10,315 | ||
| 107,776 | ||||
| Building Products – 0.1% | ||||
| 49 | Fortune Brands Home & Security, Inc. | 4,695 | ||
| Capital Markets – 6.9% | ||||
| 2,705 | Bank of New York Mellon (The) Corp. (b) | 127,920 | ||
| 312 | Goldman Sachs Group (The), Inc. | 102,024 | ||
| 320 | Lazard Ltd., Class A | 13,923 | ||
| Shares | Description | Value | ||
| COMMON STOCKS (Continued) | ||||
| Capital Markets (Continued) | ||||
| 1,090 | Northern Trust Corp. (b) | $114,570 | ||
| 358,437 | ||||
| Chemicals – 2.7% | ||||
| 43 | Albemarle Corp. | 6,283 | ||
| 134 | CF Industries Holdings, Inc. | 6,081 | ||
| 232 | Chemours (The) Co. | 6,475 | ||
| 138 | Corteva, Inc. | 6,434 | ||
| 99 | Dow, Inc. | 6,330 | ||
| 84 | DuPont de Nemours, Inc. | 6,491 | ||
| 54 | Eastman Chemical Co. | 5,946 | ||
| 30 | Ecolab, Inc. | 6,422 | ||
| 703 | Element Solutions, Inc. | 12,858 | ||
| 60 | FMC Corp. | 6,637 | ||
| 88 | Ingevity Corp. (a) | 6,647 | ||
| 57 | LyondellBasell Industries N.V., Class A | 5,931 | ||
| 681 | Orion Engineered Carbons S.A. (a) | 13,429 | ||
| 44 | PPG Industries, Inc. | 6,611 | ||
| 74 | RPM International, Inc. | 6,797 | ||
| 764 | Tredegar Corp. | 11,468 | ||
| 245 | Valvoline, Inc. | 6,387 | ||
| 71 | Westlake Chemical Corp. | 6,304 | ||
| 103 | WR Grace & Co. | 6,166 | ||
| 139,697 | ||||
| Commercial Services & Supplies – 0.4% | ||||
| 251 | BrightView Holdings, Inc. (a) | 4,234 | ||
| 337 | Matthews International Corp., Class A | 13,328 | ||
| 60 | Stericycle, Inc. (a) | 4,051 | ||
| 21,613 | ||||
| Communications Equipment – 1.7% | ||||
| 2,939 | Juniper Networks, Inc. (b) | 74,445 | ||
| 463 | NetScout Systems, Inc. (a) | 13,038 | ||
| 87,483 | ||||
| Consumer Finance – 0.2% | ||||
| 168 | Nelnet, Inc., Class A | 12,220 | ||
| Containers & Packaging – 3.0% | ||||
| 2,091 | Berry Global Group, Inc. (a) (b) | 128,387 | ||
| 240 | Greif, Inc., Class A | 13,680 | ||
| 1,063 | O-I Glass, Inc. (a) | 15,669 | ||
| 157,736 | ||||
| Diversified Consumer Services – 0.4% | ||||
| 25 | Bright Horizons Family Solutions, Inc. (a) | 4,286 | ||
| 206 | H&R Block, Inc. | 4,491 | ||
| 938 | Laureate Education, Inc., Class A (a) | 12,748 | ||
| 21,525 | ||||
| Diversified Financial Services – 1.0% | ||||
| 204 | Berkshire Hathaway, Inc., Class B (a) | 52,116 | ||
| Diversified Telecommunication Services – 4.2% | ||||
| 2,557 | AT&T, Inc. (b) | 77,401 | ||
| 9,048 | Lumen Technologies, Inc. (b) | 120,791 | ||
| Shares | Description | Value | ||
| COMMON STOCKS (Continued) | ||||
| Diversified Telecommunication Services (Continued) | ||||
| 329 | Verizon Communications, Inc. | $19,131 | ||
| 217,323 | ||||
| Electrical Equipment – 2.3% | ||||
| 5,976 | Vertiv Holdings Co. (b) | 119,520 | ||
| Electronic Equipment, Instruments & Components – 3.2% | ||||
| 1,237 | Arrow Electronics, Inc. (a) (b) | 137,084 | ||
| 337 | Avnet, Inc. | 13,989 | ||
| 889 | TTM Technologies, Inc. (a) | 12,891 | ||
| 163,964 | ||||
| Energy Equipment & Services – 0.1% | ||||
| 75 | Nabors Industries Ltd. (a) | 7,009 | ||
| Entertainment – 1.2% | ||||
| 20 | Madison Square Garden Sports Corp., Class A (a) | 3,589 | ||
| 37 | Netflix, Inc. (a) | 19,301 | ||
| 215 | Walt Disney (The) Co. (a) (b) | 39,672 | ||
| 62,562 | ||||
| Food & Staples Retailing – 0.8% | ||||
| 211 | Ingles Markets, Inc., Class A | 13,008 | ||
| 669 | Rite Aid Corp. (a) | 13,688 | ||
| 425 | United Natural Foods, Inc. (a) | 13,999 | ||
| 40,695 | ||||
| Food Products – 2.5% | ||||
| 2,610 | Campbell Soup Co. (b) | 131,205 | ||
| Health Care Equipment & Supplies – 3.3% | ||||
| 284 | Abbott Laboratories | 34,035 | ||
| 35 | ABIOMED, Inc. (a) | 11,155 | ||
| 20 | Align Technology, Inc. (a) | 10,831 | ||
| 265 | Boston Scientific Corp. (a) | 10,242 | ||
| 101 | Danaher Corp. | 22,733 | ||
| 170 | DENTSPLY SIRONA, Inc. | 10,848 | ||
| 21 | IDEXX Laboratories, Inc. (a) | 10,275 | ||
| 19 | Intuitive Surgical, Inc. (a) | 14,040 | ||
| 212 | Medtronic PLC | 25,044 | ||
| 1,236 | SmileDirectClub, Inc. (a) | 12,743 | ||
| 42 | Stryker Corp. | 10,230 | ||
| 172,176 | ||||
| Health Care Providers & Services – 6.9% | ||||
| 98 | AmerisourceBergen Corp. | 11,571 | ||
| 31 | Anthem, Inc. | 11,127 | ||
| 2,320 | Cardinal Health, Inc. (b) | 140,940 | ||
| 169 | Centene Corp. (a) | 10,801 | ||
| 204 | CVS Health Corp. | 15,347 | ||
| 875 | DaVita, Inc. (a) | 94,299 | ||
| 163 | Henry Schein, Inc. (a) | 11,286 | ||
| 58 | McKesson Corp. | 11,312 | ||
| 141 | UnitedHealth Group, Inc. | 52,462 | ||
| 359,145 | ||||
| Shares | Description | Value | ||
| COMMON STOCKS (Continued) | ||||
| Hotels, Restaurants & Leisure – 4.2% | ||||
| 158 | Bloomin’ Brands, Inc. (a) | $4,274 | ||
| 2 | Booking Holdings, Inc. (a) | 4,660 | ||
| 151 | Carnival Corp. (a) | 4,008 | ||
| 74 | Cheesecake Factory (The), Inc. (a) | 4,330 | ||
| 100 | Dave & Buster’s Entertainment, Inc. (a) | 4,790 | ||
| 232 | Denny’s Corp. (a) | 4,201 | ||
| 26 | Expedia Group, Inc. (a) | 4,475 | ||
| 34 | Hilton Worldwide Holdings, Inc. (a) | 4,111 | ||
| 48 | Hyatt Hotels Corp., Class A (a) | 3,970 | ||
| 65 | Las Vegas Sands Corp. (a) | 3,949 | ||
| 29 | Marriott International, Inc., Class A (a) | 4,295 | ||
| 20 | McDonald’s Corp. | 4,483 | ||
| 3,314 | MGM Resorts International (b) | 125,899 | ||
| 127 | Norwegian Cruise Line Holdings Ltd. (a) | 3,504 | ||
| 45 | Royal Caribbean Cruises Ltd. (a) | 3,852 | ||
| 180 | Ruth’s Hospitality Group, Inc. (a) | 4,469 | ||
| 90 | Scientific Games Corp., Class A (a) | 3,467 | ||
| 87 | SeaWorld Entertainment, Inc. (a) | 4,321 | ||
| 87 | Six Flags Entertainment Corp. (a) | 4,043 | ||
| 39 | Starbucks Corp. | 4,262 | ||
| 14 | Vail Resorts, Inc. (a) | 4,083 | ||
| 64 | Wyndham Hotels & Resorts, Inc. | 4,466 | ||
| 32 | Wynn Resorts Ltd. (a) | 4,012 | ||
| 217,924 | ||||
| Household Products – 0.6% | ||||
| 233 | Beazer Homes USA, Inc. (a) | 4,874 | ||
| 197 | Procter & Gamble (The) Co. | 26,680 | ||
| 31,554 | ||||
| Insurance – 0.3% | ||||
| 104 | Hanover Insurance Group (The), Inc. | 13,464 | ||
| Interactive Media & Services – 4.0% | ||||
| 31 | Alphabet, Inc., Class A (a) | 63,938 | ||
| 31 | Alphabet, Inc., Class C (a) | 64,127 | ||
| 275 | Facebook, Inc., Class A (a) | 80,996 | ||
| 209,061 | ||||
| Internet & Direct Marketing Retail – 2.4% | ||||
| 40 | Amazon.com, Inc. (a) | 123,763 | ||
| IT Services – 1.1% | ||||
| 131 | Alliance Data Systems Corp. | 14,684 | ||
| 191 | Visa, Inc., Class A (b) | 40,440 | ||
| 55,124 | ||||
| Life Sciences Tools & Services – 1.0% | ||||
| 10 | Mettler-Toledo International, Inc. (a) | 11,557 | ||
| 81 | PerkinElmer, Inc. | 10,391 | ||
| 62 | Thermo Fisher Scientific, Inc. | 28,296 | ||
| 50,244 | ||||
| Machinery – 0.7% | ||||
| 56 | Astec Industries, Inc. | 4,223 | ||
| 357 | CIRCOR International, Inc. (a) | 12,431 | ||
| 513 | Enerpac Tool Group Corp. | 13,399 | ||
| Shares | Description | Value | ||
| COMMON STOCKS (Continued) | ||||
| Machinery (Continued) | ||||
| 90 | Navistar International Corp. (a) | $3,963 | ||
| 127 | TriMas Corp. (a) | 3,851 | ||
| 37,867 | ||||
| Marine – 0.2% | ||||
| 897 | Atlas Corp. | 12,244 | ||
| Media – 0.3% | ||||
| 266 | iHeartMedia, Inc., Class A (a) | 4,828 | ||
| 666 | MSG Networks, Inc., Class A (a) | 10,017 | ||
| 14,845 | ||||
| Metals & Mining – 3.1% | ||||
| 802 | Alamos Gold, Inc., Class A | 6,264 | ||
| 289 | AngloGold Ashanti Ltd., ADR | 6,349 | ||
| 308 | Barrick Gold Corp. (a) | 6,098 | ||
| 537 | Cia de Minas Buenaventura SAA, ADR (a) | 5,386 | ||
| 674 | DRDGOLD Ltd., ADR (a) | 6,376 | ||
| 548 | Eldorado Gold Corp. (a) | 5,913 | ||
| 382 | First Majestic Silver Corp. (a) | 5,951 | ||
| 910 | Fortuna Silver Mines, Inc. (a) | 5,888 | ||
| 55 | Franco-Nevada Corp. | 6,891 | ||
| 189 | Freeport-McMoRan, Inc. | 6,224 | ||
| 945 | Kinross Gold Corp. | 6,303 | ||
| 180 | Kirkland Lake Gold Ltd. | 6,084 | ||
| 365 | MAG Silver Corp. (a) | 5,479 | ||
| 109 | Newmont Corp. | 6,569 | ||
| 100 | Nucor Corp. | 8,027 | ||
| 198 | Pan American Silver Corp. | 5,946 | ||
| 612 | Pretium Resources, Inc. (a) | 6,346 | ||
| 44 | Reliance Steel & Aluminum Co. | 6,701 | ||
| 58 | Royal Gold, Inc. | 6,242 | ||
| 1,001 | Sandstorm Gold Ltd. (a) | 6,807 | ||
| 1,173 | Silvercorp Metals, Inc. | 5,759 | ||
| 820 | SilverCrest Metals, Inc. (a) | 6,626 | ||
| 427 | SSR Mining, Inc. | 6,097 | ||
| 643 | Warrior Met Coal, Inc. | 11,015 | ||
| 170 | Wheaton Precious Metals Corp. | 6,496 | ||
| 161,837 | ||||
| Multiline Retail – 0.3% | ||||
| 23 | Dollar General Corp. | 4,660 | ||
| 270 | Macy’s, Inc. (a) | 4,371 | ||
| 115 | Nordstrom, Inc. (a) | 4,355 | ||
| 24 | Target Corp. | 4,754 | ||
| 18,140 | ||||
| Oil, Gas & Consumable Fuels – 6.2% | ||||
| 515 | APA Corp. | 9,218 | ||
| 294 | Bonanza Creek Energy, Inc. (a) | 10,505 | ||
| 101 | Chevron Corp. | 10,584 | ||
| 167 | Cimarex Energy Co. | 9,918 | ||
| 769 | CNX Resources Corp. (a) | 11,304 | ||
| 192 | ConocoPhillips | 10,170 | ||
| 459 | CVR Energy, Inc. | 8,804 | ||
| 452 | Delek US Holdings, Inc. | 9,845 | ||
| Shares | Description | Value | ||
| COMMON STOCKS (Continued) | ||||
| Oil, Gas & Consumable Fuels (Continued) | ||||
| 2,169 | DHT Holdings, Inc. (b) | $12,862 | ||
| 132 | Diamondback Energy, Inc. | 9,701 | ||
| 149 | EOG Resources, Inc. | 10,807 | ||
| 182 | Exxon Mobil Corp. | 10,161 | ||
| 465 | Green Plains, Inc. (a) | 12,588 | ||
| 273 | HollyFrontier Corp. | 9,768 | ||
| 882 | Magnolia Oil & Gas Corp., Class A (a) | 10,125 | ||
| 873 | Marathon Oil Corp. | 9,324 | ||
| 190 | Marathon Petroleum Corp. | 10,163 | ||
| 574 | Murphy Oil Corp. | 9,419 | ||
| 359 | Occidental Petroleum Corp. | 9,557 | ||
| 397 | Ovintiv, Inc. | 9,456 | ||
| 568 | Par Pacific Holdings, Inc. (a) | 8,020 | ||
| 665 | PBF Energy, Inc., Class A (a) | 9,410 | ||
| 273 | PDC Energy, Inc. (a) | 9,391 | ||
| 125 | Phillips 66 | 10,192 | ||
| 68 | Pioneer Natural Resources Co. | 10,800 | ||
| 1,249 | Range Resources Corp. (a) | 12,902 | ||
| 149 | Renewable Energy Group, Inc. (a) | 9,840 | ||
| 791 | Scorpio Tankers, Inc. | 14,602 | ||
| 1,576 | SFL Corp., Ltd. | 12,639 | ||
| 141 | Valero Energy Corp. | 10,096 | ||
| 318 | World Fuel Services Corp. | 11,194 | ||
| 323,365 | ||||
| Pharmaceuticals – 3.5% | ||||
| 362 | Bristol-Myers Squibb Co. | 22,853 | ||
| 123 | Eli Lilly & Co. | 22,979 | ||
| 328 | Johnson & Johnson | 53,907 | ||
| 400 | Merck & Co., Inc. | 30,836 | ||
| 841 | Pfizer, Inc. | 30,469 | ||
| 744 | Viatris, Inc. (a) | 10,394 | ||
| 70 | Zoetis, Inc. | 11,023 | ||
| 182,461 | ||||
| Professional Services – 0.1% | ||||
| 111 | Heidrick & Struggles International, Inc. | 3,965 | ||
| Real Estate Management & Development – 0.1% | ||||
| 204 | Kennedy-Wilson Holdings, Inc. | 4,123 | ||
| Road & Rail – 0.7% | ||||
| 212 | Avis Budget Group, Inc. (a) | 15,379 | ||
| 66 | Lyft, Inc., Class A (a) | 4,170 | ||
| 180 | Ryder System, Inc. | 13,617 | ||
| 77 | Uber Technologies, Inc. (a) | 4,197 | ||
| 37,363 | ||||
| Semiconductors & Semiconductor Equipment – 1.2% | ||||
| 328 | Intel Corp. | 20,992 | ||
| 595 | Magnachip Semiconductor Corp. (a) | 14,816 | ||
| 54 | NVIDIA Corp. | 28,832 | ||
| 64,640 | ||||
| Software – 4.3% | ||||
| 39 | Adobe, Inc. (a) | 18,540 | ||
| 446 | Avaya Holdings Corp. (a) | 12,501 | ||
| Shares | Description | Value | ||
| COMMON STOCKS (Continued) | ||||
| Software (Continued) | ||||
| 808 | Microsoft Corp. (b) | $190,502 | ||
| 221,543 | ||||
| Specialty Retail – 3.0% | ||||
| 25 | Advance Auto Parts, Inc. | 4,587 | ||
| 1,004 | Designer Brands, Inc., Class A (a) | 17,470 | ||
| 273 | Genesco, Inc. (a) | 12,967 | ||
| 517 | Guess?, Inc. | 12,150 | ||
| 85 | Home Depot (The), Inc. | 25,946 | ||
| 569 | Michaels Cos (The), Inc. (a) | 12,484 | ||
| 866 | Penske Automotive Group, Inc. (b) | 69,488 | ||
| 155,092 | ||||
| Technology Hardware, Storage & Peripherals – 5.3% | ||||
| 1,736 | Apple, Inc. (b) | 212,052 | ||
| 913 | NetApp, Inc. (b) | 66,348 | ||
| 278,400 | ||||
| Textiles, Apparel & Luxury Goods – 0.2% | ||||
| 807 | Fossil Group, Inc. (a) | 10,007 | ||
| Thrifts & Mortgage Finance – 0.5% | ||||
| 275 | HomeStreet, Inc. | 12,119 | ||
| 1,061 | Kearny Financial Corp. | 12,817 | ||
| 24,936 | ||||
| Tobacco – 0.2% | ||||
| 931 | Vector Group Ltd. | 12,987 | ||
| Trading Companies & Distributors – 0.2% | ||||
| 1,425 | MRC Global, Inc. (a) | 12,868 | ||
| Transportation Infrastructure – 0.1% | ||||
| 131 | Macquarie Infrastructure Corp. (a) | 4,167 | ||
Total Common Stocks | 4,954,907 | |||
| (Cost $4,613,000) | ||||
| REAL ESTATE INVESTMENT TRUSTS – 3.4% | ||||
| Equity Real Estate Investment Trusts – 1.8% | ||||
| 210 | Acadia Realty Trust | 3,984 | ||
| 56 | Centerspace | 3,808 | ||
| 870 | Columbia Property Trust, Inc. | 14,877 | ||
| 123 | Douglas Emmett, Inc. | 3,862 | ||
| 1,094 | Empire State Realty Trust, Inc., Class A | 12,176 | ||
| 39 | Federal Realty Investment Trust | 3,957 | ||
| 259 | Host Hotels & Resorts, Inc. (a) | 4,364 | ||
| 237 | iStar, Inc. | 4,214 | ||
| 125 | JBG SMITH Properties | 3,974 | ||
| 123 | MGM Growth Properties LLC | 4,012 | ||
| 179 | Pebblebrook Hotel Trust | 4,348 | ||
| 230 | Piedmont Office Realty Trust, Inc., Class A | 3,995 | ||
| 360 | RPT Realty | 4,108 | ||
| 201 | Seritage Growth Properties, Class A (a) | 3,688 | ||
| 338 | Service Properties Trust | 4,009 | ||
| 173 | Washington Real Estate Investment Trust | 3,823 | ||
| 158 | Weingarten Realty Investors | 4,252 | ||
| Shares | Description | Value | ||
| REAL ESTATE INVESTMENT TRUSTS (Continued) | ||||
| Equity Real Estate Investment Trusts (Continued) | ||||
| 58 | Welltower, Inc. | $4,154 | ||
| 91,605 | ||||
| Mortgage Real Estate Investment Trusts – 1.6% | ||||
| 8,125 | Annaly Capital Management, Inc. (b) | 69,875 | ||
| 1,224 | New Residential Investment Corp. | 13,770 | ||
| 83,645 | ||||
Total Real Estate Investment Trusts | 175,250 | |||
| (Cost $170,183) | ||||
| MASTER LIMITED PARTNERSHIPS – 0.2% | ||||
| Oil, Gas & Consumable Fuels – 0.2% | ||||
| 651 | Black Stone Minerals, L.P. | 5,677 | ||
| 192 | Sunoco, L.P. | 6,113 | ||
Total Master Limited Partnerships | 11,790 | |||
| (Cost $12,216) | ||||
Total Investments – 98.8% | 5,141,947 | |||
| (Cost $4,795,399) (c) | ||||
| Number of Contracts | Description | Notional Amount | Exercise Price | Expiration Date | Value | |||||
| PUT OPTIONS PURCHASED – 1.4% | ||||||||||
| 3 | S&P 500® Index | $1,191,867 | $3,500.00 | Sep 2021 | 24,927 | |||||
| 3 | S&P 500® Index | 1,191,867 | 3,400.00 | Dec 2021 | 33,102 | |||||
| 1 | S&P 500® Index | 397,289 | 3,500.00 | Mar 2022 | 16,840 | |||||
Total Put Options Purchased | 74,869 | |||||||||
| (Cost $148,322) | ||||||||||
| CALL OPTIONS WRITTEN – (3.0)% | ||||||||||
| (3) | S&P 500® Index | (1,191,867) | 3,800.00 | Apr 2021 | (55,530) | |||||
| (2) | S&P 500® Index | (794,578) | 3,925.00 | May 2021 | (25,570) | |||||
| (1) | S&P 500® Index | (397,289) | 3,950.00 | May 2021 | (11,634) | |||||
| (3) | S&P 500® Index | (1,191,867) | 3,850.00 | Jun 2021 | (63,486) | |||||
Total Call Options Written | (156,220) | |||||||||
| (Premiums received $133,958) | ||||||||||
Net Other Assets and Liabilities – 2.8% | 143,771 | ||
Net Assets – 100.0% | $5,204,367 |
| (a) | Non-income producing security. |
| (b) | All or a portion of this security is pledged to cover index options written. |
| (c) | Aggregate cost for financial reporting purposes approximates the aggregate cost for federal income tax purposes. As of March 31, 2021, the aggregate gross unrealized appreciation for all investments in which there was an excess of value over tax cost was $404,780 and the aggregate gross unrealized depreciation for all investments in which there was an excess of tax cost over value was $153,947. The net unrealized appreciation was $250,833. The unrealized amounts presented are inclusive of derivative contracts. |
| ADR | American Depositary Receipt |
| ASSETS TABLE | ||||
| Total Value at 3/31/2021 | Level 1 Quoted Prices | Level 2 Significant Observable Inputs | Level 3 Significant Unobservable Inputs | |
Common Stocks* | $ 4,954,907 | $ 4,954,907 | $ — | $ — |
Real Estate Investment Trusts* | 175,250 | 175,250 | — | — |
Master Limited Partnerships* | 11,790 | 11,790 | — | — |
Total Investments | 5,141,947 | 5,141,947 | — | — |
Put Options Purchased | 74,869 | 58,029 | 16,840 | — |
Total | $ 5,216,816 | $ 5,199,976 | $ 16,840 | $— |
LIABILITIES TABLE | ||||
| Total Value at 3/31/2021 | Level 1 Quoted Prices | Level 2 Significant Observable Inputs | Level 3 Significant Unobservable Inputs | |
Call Options Written | $ (156,220) | $ (156,220) | $ — | $ — |
| * | See Portfolio of Investments for industry breakout. |
| Shares | Description | Value | ||
| COMMON STOCKS – 99.7% | ||||
| Banks – 9.8% | ||||
| 1,620,558 | Bank of America Corp. | $62,699,389 | ||
| 850,690 | Citigroup, Inc. | 61,887,697 | ||
| 407,042 | JPMorgan Chase & Co. | 61,964,004 | ||
| 351,209 | PNC Financial Services Group (The), Inc. | 61,605,571 | ||
| 857,110 | Popular, Inc. | 60,271,975 | ||
| 308,428,636 | ||||
| Capital Markets – 5.7% | ||||
| 1,339,523 | Bank of New York Mellon (The) Corp. | 63,346,043 | ||
| 181,152 | Goldman Sachs Group (The), Inc. | 59,236,704 | ||
| 748,507 | Morgan Stanley | 58,129,053 | ||
| 180,711,800 | ||||
| Chemicals – 2.0% | ||||
| 228,782 | Air Products & Chemicals, Inc. | 64,365,528 | ||
| Communications Equipment – 2.1% | ||||
| 1,275,556 | Cisco Systems, Inc. | 65,959,001 | ||
| Consumer Finance – 4.0% | ||||
| 1,372,611 | Ally Financial, Inc. | 62,055,743 | ||
| 441,160 | American Express Co. | 62,397,671 | ||
| 124,453,414 | ||||
| Diversified Financial Services – 1.8% | ||||
| 1,840,353 | Jefferies Financial Group, Inc. | 55,394,625 | ||
| Entertainment – 2.0% | ||||
| 684,346 | Activision Blizzard, Inc. | 63,644,178 | ||
| Food Products – 2.0% | ||||
| 1,097,326 | Archer-Daniels-Midland Co. | 62,547,582 | ||
| Health Care Providers & Services – 4.0% | ||||
| 174,678 | Anthem, Inc. | 62,700,668 | ||
| 151,025 | Humana, Inc. | 63,317,231 | ||
| 126,017,899 | ||||
| Household Durables – 4.2% | ||||
| 743,297 | DR Horton, Inc. | 66,242,629 | ||
| 1,269,200 | PulteGroup, Inc. | 66,556,848 | ||
| 132,799,477 | ||||
| Industrial Conglomerates – 2.0% | ||||
| 291,366 | Honeywell International, Inc. | 63,246,818 | ||
| Insurance – 9.9% | ||||
| 1,216,530 | Aflac, Inc. | 62,262,005 | ||
| 543,389 | Allstate (The) Corp. | 62,435,396 | ||
| 1,574,134 | Fidelity National Financial, Inc. | 64,004,288 | ||
| Shares | Description | Value | ||
| Insurance (Continued) | ||||
| 920,578 | Hartford Financial Services Group (The), Inc. | $61,485,405 | ||
| 1,009,539 | MetLife, Inc. | 61,369,876 | ||
| 311,556,970 | ||||
| IT Services – 10.1% | ||||
| 234,519 | Accenture PLC, Class A | 64,785,874 | ||
| 335,987 | Automatic Data Processing, Inc. | 63,323,470 | ||
| 811,277 | Cognizant Technology Solutions Corp., Class A | 63,376,959 | ||
| 174,444 | Mastercard, Inc., Class A | 62,110,786 | ||
| 297,975 | Visa, Inc., Class A | 63,090,247 | ||
| 316,687,336 | ||||
| Leisure Products – 1.9% | ||||
| 619,954 | Brunswick Corp. | 59,125,013 | ||
| Machinery – 3.9% | ||||
| 234,554 | Cummins, Inc. | 60,775,287 | ||
| 275,636 | Snap-on, Inc. | 63,600,251 | ||
| 124,375,538 | ||||
| Media – 1.7% | ||||
| 1,444,852 | Fox Corp., Class A | 52,173,606 | ||
| Metals & Mining – 1.9% | ||||
| 1,005,822 | Newmont Corp. | 60,620,892 | ||
| Paper & Forest Products – 2.0% | ||||
| 1,149,186 | Louisiana-Pacific Corp. | 63,733,855 | ||
| Semiconductors & Semiconductor Equipment – 14.6% | ||||
| 536,619 | Applied Materials, Inc. | 71,692,298 | ||
| 964,071 | Intel Corp. | 61,700,544 | ||
| 113,965 | Lam Research Corp. | 67,836,527 | ||
| 121,186 | NVIDIA Corp. | 64,704,841 | ||
| 474,140 | QUALCOMM, Inc. | 62,866,223 | ||
| 353,150 | Skyworks Solutions, Inc. | 64,795,962 | ||
| 351,552 | Texas Instruments, Inc. | 66,439,812 | ||
| 460,036,207 | ||||
| Software – 4.1% | ||||
| 269,439 | Microsoft Corp. | 63,525,633 | ||
| 936,537 | Oracle Corp. | 65,716,801 | ||
| 129,242,434 | ||||
| Specialty Retail – 3.9% | ||||
| 521,327 | Best Buy Co., Inc. | 59,853,553 | ||
| 354,856 | Williams-Sonoma, Inc. | 63,590,195 | ||
| 123,443,748 | ||||
| Technology Hardware, Storage & Peripherals – 6.1% | ||||
| 517,049 | Apple, Inc. | 63,157,535 | ||
| Shares | Description | Value | ||
| COMMON STOCKS (Continued) | ||||
| Technology Hardware, Storage & Peripherals (Continued) | ||||
| 2,064,212 | HP, Inc. | $65,538,731 | ||
| 879,322 | NetApp, Inc. | 63,900,330 | ||
| 192,596,596 | ||||
| Total Investments – 99.7% | 3,141,161,153 | |||
| (Cost $2,752,542,132) (a) | ||||
| Net Other Assets and Liabilities – 0.3% | 8,298,426 | |||
| Net Assets – 100.0% | $3,149,459,579 | |||
| (a) | Aggregate cost for financial reporting purposes approximates the aggregate cost for federal income tax purposes. As of March 31, 2021, the aggregate gross unrealized appreciation for all investments in which there was an excess of value over tax cost was $410,911,122 and the aggregate gross unrealized depreciation for all investments in which there was an excess of tax cost over value was $22,292,101. The net unrealized appreciation was $388,619,021. |
| Total Value at 3/31/2021 | Level 1 Quoted Prices | Level 2 Significant Observable Inputs | Level 3 Significant Unobservable Inputs | |
| Common Stocks* | $ 3,141,161,153 | $ 3,141,161,153 | $ — | $ — |
| * | See Portfolio of Investments for industry breakout. |
| Shares | Description | Value | ||
| EXCHANGE-TRADED FUNDS – 100.0% | ||||
| Capital Markets (a) – 100.0% | ||||
| 9,137,168 | First Trust Consumer Discretionary AlphaDEX® Fund | $531,783,177 | ||
| 9,423,529 | First Trust Industrials/Producer Durables AlphaDEX® Fund | 533,842,918 | ||
| 16,292,776 | First Trust Nasdaq Transportation ETF | 536,664,490 | ||
| 3,378,723 | First Trust NASDAQ-100- Technology Sector Index Fund | 487,211,857 | ||
| 4,209,910 | First Trust Technology AlphaDEX® Fund | 478,372,073 | ||
| Total Investments – 100.0% | 2,567,874,515 | |||
| (Cost $1,640,292,951) (b) | ||||
| Net Other Assets and Liabilities – 0.0% | 634,765 | |||
| Net Assets – 100.0% | $2,568,509,280 | |||
| (a) | Represents investments in affiliated funds. |
| (b) | Aggregate cost for financial reporting purposes approximates the aggregate cost for federal income tax purposes. As of March 31, 2021, the aggregate gross unrealized appreciation for all investments in which there was an excess of value over tax cost was $927,581,564 and the aggregate gross unrealized depreciation for all investments in which there was an excess of tax cost over value was $0. The net unrealized appreciation was $927,581,564. |
| Total Value at 3/31/2021 | Level 1 Quoted Prices | Level 2 Significant Observable Inputs | Level 3 Significant Unobservable Inputs | |
| Exchange-Traded Funds* | $ 2,567,874,515 | $ 2,567,874,515 | $ — | $ — |
| * | See Portfolio of Investments for industry breakout. |
| Shares | Description | Value | ||
| COMMON STOCKS – 100.0% | ||||
| Banks – 10.6% | ||||
| 18,582 | 1st Source Corp. | $884,132 | ||
| 40,334 | Associated Banc-Corp. | 860,728 | ||
| 23,908 | Bryn Mawr Bank Corp. | 1,088,053 | ||
| 63,466 | First Commonwealth Financial Corp. | 912,006 | ||
| 39,909 | First Financial Bancorp | 957,816 | ||
| 19,594 | First Financial Corp. | 881,926 | ||
| 19,272 | First Merchants Corp. | 896,148 | ||
| 45,385 | First Midwest Bancorp, Inc. | 994,385 | ||
| 73,255 | FNB Corp. | 930,339 | ||
| 56,070 | Fulton Financial Corp. | 954,872 | ||
| 22,859 | German American Bancorp, Inc. | 1,056,543 | ||
| 17,972 | Heartland Financial USA, Inc. | 903,273 | ||
| 13,491 | Lakeland Financial Corp. | 933,442 | ||
| 89,871 | Macatawa Bank Corp. | 894,216 | ||
| 27,948 | Mercantile Bank Corp. | 907,472 | ||
| 30,026 | MidWestOne Financial Group, Inc. | 929,905 | ||
| 44,542 | Old National Bancorp | 861,442 | ||
| 25,871 | Peoples Bancorp, Inc. | 858,141 | ||
| 19,270 | QCR Holdings, Inc. | 909,929 | ||
| 37,931 | West Bancorporation, Inc. | 913,758 | ||
| 18,528,526 | ||||
| Commercial Services & Supplies – 7.0% | ||||
| 57,975 | Clean Harbors, Inc. (a) | 4,873,379 | ||
| 78,069 | Heritage-Crystal Clean, Inc. (a) | 2,118,012 | ||
| 124,183 | U.S. Ecology, Inc. (a) | 5,170,980 | ||
| 12,162,371 | ||||
| Construction & Engineering – 36.3% | ||||
| 128,898 | Aegion Corp. (a) | 3,705,817 | ||
| 279,147 | APi Group Corp. (a) (b) (c) | 5,772,760 | ||
| 78,179 | Arcosa, Inc. | 5,088,671 | ||
| 84,558 | Comfort Systems USA, Inc. | 6,322,402 | ||
| 74,200 | Construction Partners, Inc., Class A (a) | 2,217,096 | ||
| 24,170 | Dycom Industries, Inc. (a) | 2,244,184 | ||
| 48,591 | EMCOR Group, Inc. | 5,449,967 | ||
| 56,672 | MasTec, Inc. (a) | 5,310,166 | ||
| 76,536 | MYR Group, Inc. (a) | 5,485,335 | ||
| 59,002 | Northwest Pipe Co. (a) | 1,971,847 | ||
| 45,658 | NV5 Global, Inc. (a) | 4,409,193 | ||
| 139,590 | Primoris Services Corp. | 4,624,617 | ||
| 63,213 | Quanta Services, Inc. | 5,561,480 | ||
| 125,549 | Sterling Construction Co., Inc. (a) | 2,912,737 | ||
| 108,980 | Tutor Perini Corp. (a) | 2,065,171 | ||
| 63,141,443 | ||||
| Electrical Equipment – 16.1% | ||||
| 92,947 | Array Technologies, Inc. (a) | 2,771,679 | ||
| Shares | Description | Value | ||
| Electrical Equipment (Continued) | ||||
| 77,470 | Atkore International Group, Inc. (a) | $5,570,093 | ||
| 77,562 | Encore Wire Corp. | 5,206,737 | ||
| 18,595 | Generac Holdings, Inc. (a) | 6,088,933 | ||
| 28,039 | Hubbell, Inc. | 5,240,209 | ||
| 92,628 | Powell Industries, Inc. | 3,137,310 | ||
| 28,014,961 | ||||
| Machinery – 30.0% | ||||
| 72,304 | Astec Industries, Inc. | 5,453,168 | ||
| 116,252 | Blue Bird Corp. (a) | 2,909,787 | ||
| 106,299 | Douglas Dynamics, Inc. | 4,905,699 | ||
| 108,347 | Evoqua Water Technologies Corp. (a) | 2,849,526 | ||
| 136,669 | Federal Signal Corp. | 5,234,423 | ||
| 370,830 | Mueller Water Products, Inc., Class A | 5,150,829 | ||
| 18,996 | Proto Labs, Inc. (a) | 2,312,763 | ||
| 25,895 | RBC Bearings, Inc. (a) | 5,095,359 | ||
| 110,778 | Shyft Group (The), Inc. | 4,120,942 | ||
| 83,427 | SPX Corp. (a) | 4,861,291 | ||
| 141,208 | TriMas Corp. (a) | 4,281,426 | ||
| 263,581 | Wabash National Corp. | 4,955,323 | ||
| 52,130,536 | ||||
| Total Investments – 100.0% | 173,977,837 | |||
| (Cost $147,566,407) (d) | ||||
| Net Other Assets and Liabilities – 0.0% | 68,935 | |||
| Net Assets – 100.0% | $174,046,772 | |||
| (a) | Non-income producing security. |
| (b) | This security may be resold to qualified foreign investors and foreign institutional buyers under Regulation S of the Securities Act of 1933, as amended (the “1933 Act”). |
| (c) | This security is exempt from registration upon resale under Rule 144A of the 1933 Act and may be resold in transactions exempt from registration, normally to qualified institutional buyers. This security is not restricted on the foreign exchange where it trades freely without any additional registration. As such, it does not require the additional disclosure required of restricted securities. |
| (d) | Aggregate cost for financial reporting purposes approximates the aggregate cost for federal income tax purposes. As of March 31, 2021, the aggregate gross unrealized appreciation for all investments in which there was an excess of value over tax cost was $27,777,834 and the aggregate gross unrealized depreciation for all investments in which there was an excess of tax cost over value was $1,366,404. The net unrealized appreciation was $26,411,430. |
| Total Value at 3/31/2021 | Level 1 Quoted Prices | Level 2 Significant Observable Inputs | Level 3 Significant Unobservable Inputs | |
| Common Stocks* | $ 173,977,837 | $ 173,977,837 | $ — | $ — |
| * | See Portfolio of Investments for industry breakout. |
| Shares | Description | Value | ||
| COMMON STOCKS – 73.3% | ||||
| Aerospace & Defense – 1.4% | ||||
| 6,458 | Raytheon Technologies Corp. | $499,010 | ||
| Air Freight & Logistics – 1.2% | ||||
| 2,528 | United Parcel Service, Inc., Class B | 429,735 | ||
| Banks – 23.8% | ||||
| 8,673 | Bank of America Corp. | 335,558 | ||
| 20,113 | Citizens Financial Group, Inc. | 887,989 | ||
| 14,344 | Comerica, Inc. | 1,029,039 | ||
| 23,136 | Fifth Third Bancorp | 866,443 | ||
| 55,605 | First Horizon Corp. | 940,280 | ||
| 59,330 | Huntington Bancshares, Inc. | 932,668 | ||
| 3,073 | JPMorgan Chase & Co. | 467,803 | ||
| 44,850 | KeyCorp | 896,103 | ||
| 3,605 | PNC Financial Services Group (The), Inc. | 632,353 | ||
| 41,958 | Regions Financial Corp. | 866,852 | ||
| 8,673 | Zions Bancorp N.A. | 476,668 | ||
| 8,331,756 | ||||
| Capital Markets – 6.1% | ||||
| 1,340 | Ameriprise Financial, Inc. | 311,483 | ||
| 15,120 | Ares Management Corp., Class A | 847,173 | ||
| 39,168 | Invesco, Ltd. | 987,817 | ||
| 2,146,473 | ||||
| Chemicals – 1.6% | ||||
| 11,859 | CF Industries Holdings, Inc. | 538,161 | ||
| Consumer Finance – 5.0% | ||||
| 6,791 | Ally Financial, Inc. | 307,021 | ||
| 38,756 | Santander Consumer USA Holdings, Inc. | 1,048,738 | ||
| 9,820 | Synchrony Financial | 399,281 | ||
| 1,755,040 | ||||
| Energy Equipment & Services – 1.8% | ||||
| 28,684 | Baker Hughes Co. | 619,861 | ||
| Food & Staples Retailing – 1.0% | ||||
| 4,446 | Sysco Corp. | 350,078 | ||
| Food Products – 1.7% | ||||
| 7,606 | Bunge Ltd. | 602,928 | ||
| Household Durables – 4.5% | ||||
| 1,965 | Garmin Ltd. | 259,085 | ||
| 16,674 | Leggett & Platt, Inc. | 761,168 | ||
| 2,568 | Whirlpool Corp. | 565,859 | ||
| 1,586,112 | ||||
| Shares | Description | Value | ||
| Independent Power & Renewable Electricity Producers – 1.2% | ||||
| 15,671 | AES (The) Corp. | $420,139 | ||
| Insurance – 2.0% | ||||
| 15,242 | American International Group, Inc. | 704,333 | ||
| Machinery – 3.6% | ||||
| 1,271 | Cummins, Inc. | 329,329 | ||
| 1,320 | Illinois Tool Works, Inc. | 292,406 | ||
| 2,770 | Snap-on, Inc. | 639,150 | ||
| 1,260,885 | ||||
| Media – 1.9% | ||||
| 2,041 | Nexstar Media Group, Inc., Class A | 286,618 | ||
| 8,673 | ViacomCBS, Inc., Class B | 391,152 | ||
| 677,770 | ||||
| Oil, Gas & Consumable Fuels – 6.6% | ||||
| 17,493 | Devon Energy Corp. | 382,222 | ||
| 37,866 | ONEOK, Inc. | 1,918,292 | ||
| 2,300,514 | ||||
| Semiconductors & Semiconductor Equipment – 3.2% | ||||
| 1,532 | Broadcom, Inc. | 710,327 | ||
| 2,226 | Texas Instruments, Inc. | 420,692 | ||
| 1,131,019 | ||||
| Specialty Retail – 1.0% | ||||
| 1,105 | Home Depot (The), Inc. | 337,301 | ||
| Technology Hardware, Storage & Peripherals – 3.3% | ||||
| 15,161 | Seagate Technology PLC | 1,163,607 | ||
| Trading Companies & Distributors – 2.4% | ||||
| 4,940 | Fastenal Co. | 248,383 | ||
| 2,237 | Watsco, Inc. | 583,298 | ||
| 831,681 | ||||
| Total Common Stocks | 25,686,403 | |||
| (Cost $22,430,018) | ||||
| REAL ESTATE INVESTMENT TRUSTS – 26.2% | ||||
| Equity Real Estate Investment Trusts – 20.1% | ||||
| 2,345 | EastGroup Properties, Inc. | 335,992 | ||
| 6,458 | Extra Space Storage, Inc. | 856,008 | ||
| 8,991 | Invitation Homes, Inc. | 287,622 | ||
| 16,169 | Simon Property Group, Inc. | 1,839,547 | ||
| 29,751 | STORE Capital Corp. | 996,659 | ||
| 16,695 | Ventas, Inc. | 890,511 | ||
| Shares | Description | Value | ||
| REAL ESTATE INVESTMENT TRUSTS (Continued) | ||||
| Equity Real Estate Investment Trusts (Continued) | ||||
| 42,674 | VICI Properties, Inc. | $1,205,114 | ||
| 17,782 | Weyerhaeuser Co. | 633,039 | ||
| 7,044,492 | ||||
| Mortgage Real Estate Investment Trusts – 6.1% | ||||
| 85,977 | Starwood Property Trust, Inc. | 2,127,071 | ||
| Total Real Estate Investment Trusts | 9,171,563 | |||
| (Cost $7,616,328) | ||||
| Total Investments – 99.5% | 34,857,966 | |||
| (Cost $30,046,346) (a) | ||||
| Net Other Assets and Liabilities – 0.5% | 192,322 | |||
| Net Assets – 100.0% | $35,050,288 | |||
| (a) | Aggregate cost for financial reporting purposes approximates the aggregate cost for federal income tax purposes. As of March 31, 2021, the aggregate gross unrealized appreciation for all investments in which there was an excess of value over tax cost was $4,860,669 and the aggregate gross unrealized depreciation for all investments in which there was an excess of tax cost over value was $49,049. The net unrealized appreciation was $4,811,620. |
| Total Value at 3/31/2021 | Level 1 Quoted Prices | Level 2 Significant Observable Inputs | Level 3 Significant Unobservable Inputs | |
| Common Stocks* | $ 25,686,403 | $ 25,686,403 | $ — | $ — |
| Real Estate Investment Trusts* | 9,171,563 | 9,171,563 | — | — |
| Total Investments | $ 34,857,966 | $ 34,857,966 | $— | $— |
| * | See Portfolio of Investments for industry breakout. |
| Shares | Description | Value | ||
| EXCHANGE-TRADED FUNDS – 100.0% | ||||
| Capital Markets (a) – 100.0% | ||||
| 1,444,491 | First Trust BICK Index Fund | $54,342,762 | ||
| 948,086 | First Trust Chindia ETF | 58,231,442 | ||
| 1,393,907 | First Trust Europe AlphaDEX® Fund | 56,676,259 | ||
| 1,044,548 | First Trust Germany AlphaDEX® Fund | 56,112,805 | ||
| 899,264 | First Trust Switzerland AlphaDEX® Fund | 55,538,545 | ||
| Total Investments – 100.0% | 280,901,813 | |||
| (Cost $222,968,529) (b) | ||||
| Net Other Assets and Liabilities – 0.0% | 127,520 | |||
| Net Assets – 100.0% | $281,029,333 | |||
| (a) | Represents investments in affiliated funds. |
| (b) | Aggregate cost for financial reporting purposes approximates the aggregate cost for federal income tax purposes. As of March 31, 2021, the aggregate gross unrealized appreciation for all investments in which there was an excess of value over tax cost was $57,933,284 and the aggregate gross unrealized depreciation for all investments in which there was an excess of tax cost over value was $0. The net unrealized appreciation was $57,933,284. |
| Total Value at 3/31/2021 | Level 1 Quoted Prices | Level 2 Significant Observable Inputs | Level 3 Significant Unobservable Inputs | |
| Exchange-Traded Funds* | $ 280,901,813 | $ 280,901,813 | $ — | $ — |
| * | See Portfolio of Investments for industry breakout. |
| Shares | Description | Value | ||
| EXCHANGE-TRADED FUNDS – 100.0% | ||||
| Capital Markets (a) – 100.0% | ||||
| 804,283 | First Trust Consumer Discretionary AlphaDEX® Fund | $46,809,271 | ||
| 829,490 | First Trust Industrials/Producer Durables AlphaDEX® Fund | 46,990,608 | ||
| 1,434,143 | First Trust Nasdaq Transportation ETF | 47,238,949 | ||
| 297,406 | First Trust NASDAQ-100-Technology Sector Index Fund | 42,885,945 | ||
| 370,570 | First Trust Technology AlphaDEX® Fund | 42,107,869 | ||
| Total Investments – 100.0% | 226,032,642 | |||
| (Cost $166,906,959) (b) | ||||
| Net Other Assets and Liabilities – 0.0% | 53,978 | |||
| Net Assets – 100.0% | $226,086,620 | |||
| (a) | Represents investments in affiliated funds. |
| (b) | Aggregate cost for financial reporting purposes approximates the aggregate cost for federal income tax purposes. As of March 31, 2021, the aggregate gross unrealized appreciation for all investments in which there was an excess of value over tax cost was $59,125,683 and the aggregate gross unrealized depreciation for all investments in which there was an excess of tax cost over value was $0. The net unrealized appreciation was $59,125,683. |
| Total Value at 3/31/2021 | Level 1 Quoted Prices | Level 2 Significant Observable Inputs | Level 3 Significant Unobservable Inputs | |
| Exchange-Traded Funds* | $ 226,032,642 | $ 226,032,642 | $ — | $ — |
| * | See Portfolio of Investments for industry breakout. |
| First Trust NASDAQ Technology Dividend Index Fund (TDIV) | Multi-Asset Diversified Income Index Fund (MDIV) | First Trust S&P International Dividend Aristocrats ETF (FID) | First Trust BuyWrite Income ETF (FTHI) | ||||
| ASSETS: | |||||||
Investments, at value - Unaffiliated | $ 1,483,572,609 | $ 377,114,840 | $ 32,065,175 | $ 59,564,604 | |||
Investments, at value - Affiliated | — | 89,808,581 | — | — | |||
Total investments, at value | 1,483,572,609 | 466,923,421 | 32,065,175 | 59,564,604 | |||
Cash | 587,573 | 383,684 | 930,801 | 2,459,286 | |||
Cash held at broker | — | — | — | 9,308 | |||
Foreign currency | — | — | 33,251 | — | |||
Options purchased, at value | — | — | — | — | |||
| Receivables: | |||||||
Dividends | 1,724,866 | 1,473,719 | 180,031 | 75,765 | |||
Dividend reclaims | 172,631 | 4,153 | 37,403 | 977 | |||
Fund shares sold | — | — | — | — | |||
Investment securities sold | — | — | 1,136,444 | — | |||
Total Assets | 1,486,057,679 | 468,784,977 | 34,383,105 | 62,109,940 | |||
| LIABILITIES: | |||||||
Options written, at value | — | — | — | 1,469,681 | |||
| Payables: | |||||||
Investment advisory fees | 614,550 | 192,048 | 15,916 | 43,744 | |||
Fund shares redeemed | — | — | — | — | |||
Investment securities purchased | — | — | 1,997,433 | — | |||
Total Liabilities | 614,550 | 192,048 | 2,013,349 | 1,513,425 | |||
NET ASSETS | $1,485,443,129 | $468,592,929 | $32,369,756 | $60,596,515 | |||
| NET ASSETS consist of: | |||||||
Paid-in capital | $ 1,083,094,588 | $ 699,167,960 | $ 35,812,347 | $ 73,393,748 | |||
Par value | 275,550 | 289,500 | 18,500 | 28,742 | |||
Accumulated distributable earnings (loss) | 402,072,991 | (230,864,531) | (3,461,091) | (12,825,975) | |||
NET ASSETS | $1,485,443,129 | $468,592,929 | $32,369,756 | $60,596,515 | |||
NET ASSET VALUE, per share | $53.91 | $16.19 | $17.50 | $21.08 | |||
Number of shares outstanding (unlimited number of shares authorized, par value $0.01 per share) | 27,555,000 | 28,950,002 | 1,850,002 | 2,874,201 | |||
Investments, at cost - Unaffiliated | $1,066,985,532 | $352,368,734 | $30,347,206 | $53,725,733 | |||
Investments, at cost - Affiliated | $— | $90,340,027 | $— | $— | |||
Total investments, at cost | $1,066,985,532 | $442,708,761 | $30,347,206 | $53,725,733 | |||
Foreign currency, at cost (proceeds) | $— | $— | $33,290 | $— | |||
Premiums received on options written | $— | $— | $— | $1,397,736 | |||
Premiums paid on options purchased | $— | $— | $— | $— |
| First Trust Hedged BuyWrite Income ETF (FTLB) | First Trust Rising Dividend Achievers ETF (RDVY) | First Trust Dorsey Wright Focus 5 ETF (FV) | First Trust RBA American Industrial Renaissance® ETF (AIRR) | First Trust Dorsey Wright Momentum & Dividend ETF (DDIV) | First Trust Dorsey Wright International Focus 5 ETF (IFV) | First Trust Dorsey Wright Dynamic Focus 5 ETF (FVC) | ||||||
| $ 5,141,947 | $ 3,141,161,153 | $— | $ 173,977,837 | $ 34,857,966 | $— | $— | ||||||
| — | — | 2,567,874,515 | — | — | 280,901,813 | 226,032,642 | ||||||
| 5,141,947 | 3,141,161,153 | 2,567,874,515 | 173,977,837 | 34,857,966 | 280,901,813 | 226,032,642 | ||||||
| 135,797 | 5,752,139 | 1,275,248 | 125,565 | 74,381 | 200,005 | 110,834 | ||||||
| 4,582 | — | — | — | — | — | — | ||||||
| — | — | — | — | — | — | — | ||||||
| 74,869 | — | — | — | — | — | — | ||||||
| 6,529 | 3,669,398 | — | 24,201 | 137,342 | — | — | ||||||
| 639 | — | — | — | 5,616 | — | — | ||||||
| — | 29,581,896 | 2,210,071 | 8,067,120 | — | — | — | ||||||
| — | — | — | — | 1,458,444 | — | — | ||||||
| 5,364,363 | 3,180,164,586 | 2,571,359,834 | 182,194,723 | 36,533,749 | 281,101,818 | 226,143,476 | ||||||
| 156,220 | — | — | — | — | — | — | ||||||
| 3,776 | 1,206,882 | 641,127 | 84,017 | 17,530 | 72,485 | 56,856 | ||||||
| — | — | — | — | 1,465,931 | — | — | ||||||
| — | 29,498,125 | 2,209,427 | 8,063,934 | — | — | — | ||||||
| 159,996 | 30,705,007 | 2,850,554 | 8,147,951 | 1,483,461 | 72,485 | 56,856 | ||||||
| $ 5,204,367 | $ 3,149,459,579 | $ 2,568,509,280 | $ 174,046,772 | $ 35,050,288 | $ 281,029,333 | $ 226,086,620 | ||||||
| $ 7,283,803 | $ 2,578,461,111 | $ 1,782,167,324 | $ 173,150,645 | $ 43,300,223 | $ 375,211,576 | $ 206,620,092 | ||||||
| 2,500 | 693,000 | 575,500 | 43,000 | 12,000 | 122,500 | 66,000 | ||||||
| (2,081,936) | 570,305,468 | 785,766,456 | 853,127 | (8,261,935) | (94,304,743) | 19,400,528 | ||||||
| $ 5,204,367 | $ 3,149,459,579 | $ 2,568,509,280 | $ 174,046,772 | $ 35,050,288 | $ 281,029,333 | $ 226,086,620 | ||||||
| $20.82 | $45.45 | $44.63 | $40.48 | $29.21 | $22.94 | $34.26 | ||||||
| 250,002 | 69,300,002 | 57,550,002 | 4,300,002 | 1,200,002 | 12,250,002 | 6,600,002 | ||||||
| $4,795,399 | $2,752,542,132 | $— | $147,566,407 | $30,046,346 | $— | $— | ||||||
| $— | $— | $1,640,292,951 | $— | $— | $222,968,529 | $166,906,959 | ||||||
| $4,795,399 | $2,752,542,132 | $1,640,292,951 | $147,566,407 | $30,046,346 | $222,968,529 | $166,906,959 | ||||||
| $— | $— | $— | $— | $— | $— | $— | ||||||
| $133,958 | $— | $— | $— | $— | $— | $— | ||||||
| $148,322 | $— | $— | $— | $— | $— | $— |
| First Trust NASDAQ Technology Dividend Index Fund (TDIV) | Multi-Asset Diversified Income Index Fund (MDIV) | First Trust S&P International Dividend Aristocrats ETF (FID) | First Trust BuyWrite Income ETF (FTHI) | |||||
| INVESTMENT INCOME: | ||||||||
Dividends - Unaffiliated | $ 18,891,236 | $ 7,821,364 | $ 550,142 | $ 819,437 | ||||
Dividends - Affiliated | — | 2,480,170 | — | — | ||||
Interest | 64 | 77 | — | (1,179) | ||||
Foreign withholding tax | (564,217) | — | (60,924) | (3,015) | ||||
Other | — | 3 | — | 9 | ||||
Total investment income | 18,327,083 | 10,301,614 | 489,218 | 815,252 | ||||
| EXPENSES: | ||||||||
Investment advisory fees | 3,379,948 | 1,376,382 | 73,599 | 258,023 | ||||
Total expenses | 3,379,948 | 1,376,382 | 73,599 | 258,023 | ||||
Fees waived by the investment advisor | — | (269,398) | — | — | ||||
Net expenses | 3,379,948 | 1,106,984 | 73,599 | 258,023 | ||||
NET INVESTMENT INCOME (LOSS) | 14,947,135 | 9,194,630 | 415,619 | 557,229 | ||||
| NET REALIZED AND UNREALIZED GAIN (LOSS): | ||||||||
| Net realized gain (loss) on: | ||||||||
Investments - Unaffiliated | (10,368,110) | 14,061,295 | 123,811 | 2,633,725 | ||||
Investments - Affiliated | — | (2,273) | — | — | ||||
In-kind redemptions - Unaffiliated | 129,467,956 | 4,346,805 | — | 4,689,275 | ||||
In-kind redemptions - Affiliated | — | (18,881) | — | — | ||||
Written options contracts | — | — | — | (2,593,486) | ||||
Purchased options contracts | — | — | — | — | ||||
Foreign currency transactions | — | — | 7,197 | — | ||||
Net realized gain (loss) | 119,099,846 | 18,386,946 | 131,008 | 4,729,514 | ||||
| Net change in unrealized appreciation (depreciation) on: | ||||||||
Investments - Unaffiliated | 157,689,304 | 64,406,229 | 4,712,726 | 2,232,456 | ||||
Investments - Affiliated | — | 2,823,345 | — | — | ||||
Written options contracts | — | — | — | (310,103) | ||||
Purchased options contracts | — | — | — | — | ||||
Foreign currency translation | — | — | (3,689) | — | ||||
Net change in unrealized appreciation (depreciation) | 157,689,304 | 67,229,574 | 4,709,037 | 1,922,353 | ||||
NET REALIZED AND UNREALIZED GAIN (LOSS) | 276,789,150 | 85,616,520 | 4,840,045 | 6,651,867 | ||||
NET INCREASE (DECREASE) IN NET ASSETS RESULTING FROM OPERATIONS | $ 291,736,285 | $ 94,811,150 | $ 5,255,664 | $ 7,209,096 | ||||
| First Trust Hedged BuyWrite Income ETF (FTLB) | First Trust Rising Dividend Achievers ETF (RDVY) | First Trust Dorsey Wright Focus 5 ETF (FV) | First Trust RBA American Industrial Renaissance® ETF (AIRR) | First Trust Dorsey Wright Momentum & Dividend ETF (DDIV) | First Trust Dorsey Wright International Focus 5 ETF (IFV) | First Trust Dorsey Wright Dynamic Focus 5 ETF (FVC) | |||||||
| $67,829 | $22,367,833 | $— | $343,516 | $516,541 | $— | $— | |||||||
| — | — | 2,572,111 | — | — | 1,532,407 | 235,034 | |||||||
| (158) | 110 | 23 | 1 | 3 | 201 | 2 | |||||||
| (266) | (68,038) | — | — | — | — | — | |||||||
| 8 | — | — | — | — | — | — | |||||||
| 67,413 | 22,299,905 | 2,572,134 | 343,517 | 516,544 | 1,532,608 | 235,036 | |||||||
| 21,481 | 4,884,287 | 3,523,017 | 291,698 | 88,807 | 389,980 | 331,533 | |||||||
| 21,481 | 4,884,287 | 3,523,017 | 291,698 | 88,807 | 389,980 | 331,533 | |||||||
| — | — | — | — | — | — | — | |||||||
| 21,481 | 4,884,287 | 3,523,017 | 291,698 | 88,807 | 389,980 | 331,533 | |||||||
| 45,932 | 17,415,618 | (950,883) | 51,819 | 427,737 | 1,142,628 | (96,497) | |||||||
| 138,438 | (25,977,557) | — | 1,775,922 | 1,283,915 | — | — | |||||||
| — | — | (2,219,386) | — | — | 9,496,199 | (198,987) | |||||||
| 550,194 | 300,126,336 | — | 1,515,240 | 5,411,868 | — | — | |||||||
| — | — | 388,470,620 | — | — | 2,327,823 | 27,567,549 | |||||||
| (102,554) | — | — | — | — | — | — | |||||||
| (196,530) | — | — | — | — | — | — | |||||||
| — | — | — | — | — | — | — | |||||||
| 389,548 | 274,148,779 | 386,251,234 | 3,291,162 | 6,695,783 | 11,824,022 | 27,368,562 | |||||||
| 78,069 | 331,749,895 | — | 28,739,227 | 2,595,841 | — | — | |||||||
| — | — | 232,690,416 | — | — | 35,688,640 | 31,567,314 | |||||||
| (78,445) | — | — | — | — | — | — | |||||||
| 20,047 | — | — | — | — | — | — | |||||||
| — | — | — | — | — | — | — | |||||||
| 19,671 | 331,749,895 | 232,690,416 | 28,739,227 | 2,595,841 | 35,688,640 | 31,567,314 | |||||||
| 409,219 | 605,898,674 | 618,941,650 | 32,030,389 | 9,291,624 | 47,512,662 | 58,935,876 | |||||||
| $455,151 | $623,314,292 | $617,990,767 | $32,082,208 | $9,719,361 | $48,655,290 | $58,839,379 |
| First Trust NASDAQ Technology Dividend Index Fund (TDIV) | Multi-Asset Diversified Income Index Fund (MDIV) | ||||||
| Six Months Ended 3/31/2021 (Unaudited) | Year Ended 9/30/2020 | Six Months Ended 3/31/2021 (Unaudited) | Year Ended 9/30/2020 | ||||
| OPERATIONS: | |||||||
Net investment income (loss) | $ 14,947,135 | $ 25,584,561 | $ 9,194,630 | $ 22,694,265 | |||
Net realized gain (loss) | 119,099,846 | 55,107,604 | 18,386,946 | (141,123,206) | |||
Net change in unrealized appreciation (depreciation) | 157,689,304 | 50,196,118 | 67,229,574 | (47,081,173) | |||
Net increase (decrease) in net assets resulting from operations | 291,736,285 | 130,888,283 | 94,811,150 | (165,510,114) | |||
| DISTRIBUTIONS TO SHAREHOLDERS FROM: | |||||||
Investment operations | (15,541,868) | (25,845,943) | (12,524,256) | (29,891,031) | |||
Return of capital | — | — | — | (6,494,411) | |||
Total distributions to shareholders | (15,541,868) | (25,845,943) | (12,524,256) | (36,385,442) | |||
| SHAREHOLDER TRANSACTIONS: | |||||||
Proceeds from shares sold | 266,455,350 | 417,634,746 | 744,042 | 134,635,982 | |||
Cost of shares redeemed | (302,484,051) | (287,956,521) | (55,163,664) | (207,999,717) | |||
Net increase (decrease) in net assets resulting from shareholder transactions | (36,028,701) | 129,678,225 | (54,419,622) | (73,363,735) | |||
Total increase (decrease) in net assets | 240,165,716 | 234,720,565 | 27,867,272 | (275,259,291) | |||
| NET ASSETS: | |||||||
Beginning of period | 1,245,277,413 | 1,010,556,848 | 440,725,657 | 715,984,948 | |||
End of period | $1,485,443,129 | $1,245,277,413 | $468,592,929 | $440,725,657 | |||
| CHANGES IN SHARES OUTSTANDING: | |||||||
Shares outstanding, beginning of period | 28,405,000 | 25,205,000 | 32,600,002 | 38,850,002 | |||
Shares sold | 5,150,000 | 9,900,000 | 50,000 | 8,900,000 | |||
Shares redeemed | (6,000,000) | (6,700,000) | (3,700,000) | (15,150,000) | |||
Shares outstanding, end of period | 27,555,000 | 28,405,000 | 28,950,002 | 32,600,002 | |||
| First Trust S&P International Dividend Aristocrats ETF (FID) | First Trust BuyWrite Income ETF (FTHI) | |||||
| Six Months Ended 3/31/2021 (Unaudited) | Year Ended 9/30/2020 | Six Months Ended 3/31/2021 (Unaudited) | Year Ended 9/30/2020 | |||
| $ 415,619 | $ 699,823 | $ 557,229 | $ 778,752 | |||
| 131,008 | (721,222) | 4,729,514 | (9,889,308) | |||
| 4,709,037 | (3,017,870) | 1,922,353 | (865,038) | |||
| 5,255,664 | (3,039,269) | 7,209,096 | (9,975,594) | |||
| (388,830) | (721,161) | (1,435,617) | (781,626) | |||
| — | — | — | (2,497,607) | |||
| (388,830) | (721,161) | (1,435,617) | (3,279,233) | |||
| 9,112,879 | 18,764,075 | 17,029,124 | 39,555,388 | |||
| — | (16,291,697) | (21,938,847) | (46,722,420) | |||
| 9,112,879 | 2,472,378 | (4,909,723) | (7,167,032) | |||
| 13,979,713 | (1,288,052) | 863,756 | (20,421,859) | |||
| 18,390,043 | 19,678,095 | 59,732,759 | 80,154,618 | |||
| $32,369,756 | $18,390,043 | $60,596,515 | $59,732,759 | |||
| 1,300,002 | 1,150,002 | 3,124,201 | 3,574,201 | |||
| 550,000 | 1,150,000 | 850,000 | 1,800,000 | |||
| — | (1,000,000) | (1,100,000) | (2,250,000) | |||
| 1,850,002 | 1,300,002 | 2,874,201 | 3,124,201 | |||
| First Trust Hedged BuyWrite Income ETF (FTLB) | First Trust Rising Dividend Achievers ETF (RDVY) | ||||||
| Six Months Ended 3/31/2021 (Unaudited) | Year Ended 9/30/2020 | Six Months Ended 3/31/2021 (Unaudited) | Year Ended 9/30/2020 | ||||
| OPERATIONS: | |||||||
Net investment income (loss) | $ 45,932 | $ 65,150 | $ 17,415,618 | $ 21,146,569 | |||
Net realized gain (loss) | 389,548 | (655,602) | 274,148,779 | (19,747,798) | |||
Net change in unrealized appreciation (depreciation) | 19,671 | (221,236) | 331,749,895 | 26,519,084 | |||
Net increase (decrease) in net assets resulting from operations | 455,151 | (811,688) | 623,314,292 | 27,917,855 | |||
| DISTRIBUTIONS TO SHAREHOLDERS FROM: | |||||||
Investment operations | (82,501) | (66,215) | (17,706,801) | (21,259,226) | |||
Return of capital | — | (145,536) | — | — | |||
Total distributions to shareholders | (82,501) | (211,751) | (17,706,801) | (21,259,226) | |||
| SHAREHOLDER TRANSACTIONS: | |||||||
Proceeds from shares sold | 2,999,740 | 2,225,023 | 2,520,492,231 | 768,157,359 | |||
Cost of shares redeemed | (2,974,588) | (5,313,879) | (1,268,737,362) | (314,875,007) | |||
Net increase (decrease) in net assets resulting from shareholder transactions | 25,152 | (3,088,856) | 1,251,754,869 | 453,282,352 | |||
Total increase (decrease) in net assets | 397,802 | (4,112,295) | 1,857,362,360 | 459,940,981 | |||
| NET ASSETS: | |||||||
Beginning of period | 4,806,565 | 8,918,860 | 1,292,097,219 | 832,156,238 | |||
End of period | $5,204,367 | $4,806,565 | $3,149,459,579 | $1,292,097,219 | |||
| CHANGES IN SHARES OUTSTANDING: | |||||||
Shares outstanding, beginning of period | 250,002 | 400,002 | 39,550,002 | 26,150,002 | |||
Shares sold | 150,000 | 100,000 | 58,500,000 | 23,650,000 | |||
Shares redeemed | (150,000) | (250,000) | (28,750,000) | (10,250,000) | |||
Shares outstanding, end of period | 250,002 | 250,002 | 69,300,002 | 39,550,002 | |||
| First Trust Dorsey Wright Focus 5 ETF (FV) | First Trust RBA American Industrial Renaissance® ETF (AIRR) | |||||
| Six Months Ended 3/31/2021 (Unaudited) | Year Ended 9/30/2020 | Six Months Ended 3/31/2021 (Unaudited) | Year Ended 9/30/2020 | |||
| $ (950,883) | $ 6,401,620 | $ 51,819 | $ (89,967) | |||
| 386,251,234 | 31,497,770 | 3,291,162 | (2,398,150) | |||
| 232,690,416 | 200,093,791 | 28,739,227 | (810,384) | |||
| 617,990,767 | 237,993,181 | 32,082,208 | (3,298,501) | |||
| — | (7,981,650) | (54,300) | (144,765) | |||
| — | — | — | — | |||
| — | (7,981,650) | (54,300) | (144,765) | |||
| 538,717,366 | 147,416,934 | 99,330,278 | 12,492,884 | |||
| (635,690,527) | (678,198,985) | (4,824,738) | (28,435,922) | |||
| (96,973,161) | (530,782,051) | 94,505,540 | (15,943,038) | |||
| 521,017,606 | (300,770,520) | 126,533,448 | (19,386,304) | |||
| 2,047,491,674 | 2,348,262,194 | 47,513,324 | 66,899,628 | |||
| $2,568,509,280 | $2,047,491,674 | $174,046,772 | $47,513,324 | |||
| 60,050,002 | 79,250,002 | 1,850,002 | 2,500,002 | |||
| 12,550,000 | 4,850,000 | 2,600,000 | 550,000 | |||
| (15,050,000) | (24,050,000) | (150,000) | (1,200,000) | |||
| 57,550,002 | 60,050,002 | 4,300,002 | 1,850,002 | |||
| First Trust Dorsey Wright Momentum & Dividend ETF (DDIV) | First Trust Dorsey Wright International Focus 5 ETF (IFV) | ||||||
| Six Months Ended 3/31/2021 (Unaudited) | Year Ended 9/30/2020 | Six Months Ended 3/31/2021 (Unaudited) | Year Ended 9/30/2020 | ||||
| OPERATIONS: | |||||||
Net investment income (loss) | $ 427,737 | $ 1,180,697 | $ 1,142,628 | $ 10,938,339 | |||
Net realized gain (loss) | 6,695,783 | (13,664,469) | 11,824,022 | (66,943,279) | |||
Net change in unrealized appreciation (depreciation) | 2,595,841 | (284,910) | 35,688,640 | 29,254,408 | |||
Net increase (decrease) in net assets resulting from operations | 9,719,361 | (12,768,682) | 48,655,290 | (26,750,532) | |||
| DISTRIBUTIONS TO SHAREHOLDERS FROM: | |||||||
Investment operations | (316,521) | (1,297,931) | (1,298,965) | (11,181,681) | |||
Return of capital | — | — | — | — | |||
Total distributions to shareholders | (316,521) | (1,297,931) | (1,298,965) | (11,181,681) | |||
| SHAREHOLDER TRANSACTIONS: | |||||||
Proceeds from shares sold | 23,921,144 | 34,251,548 | 27,345,487 | 20,996,726 | |||
Cost of shares redeemed | (27,758,053) | (35,013,136) | (12,124,591) | (218,369,257) | |||
Net increase (decrease) in net assets resulting from shareholder transactions | (3,836,909) | (761,588) | 15,220,896 | (197,372,531) | |||
Total increase (decrease) in net assets | 5,565,931 | (14,828,201) | 62,577,221 | (235,304,744) | |||
| NET ASSETS: | |||||||
Beginning of period | 29,484,357 | 44,312,558 | 218,452,112 | 453,756,856 | |||
End of period | $35,050,288 | $29,484,357 | $281,029,333 | $218,452,112 | |||
| CHANGES IN SHARES OUTSTANDING: | |||||||
Shares outstanding, beginning of period | 1,400,002 | 1,700,002 | 11,600,002 | 23,800,002 | |||
Shares sold | 900,000 | 1,300,000 | 1,250,000 | 1,150,000 | |||
Shares redeemed | (1,100,000) | (1,600,000) | (600,000) | (13,350,000) | |||
Shares outstanding, end of period | 1,200,002 | 1,400,002 | 12,250,002 | 11,600,002 | |||
| First Trust Dorsey Wright Dynamic Focus 5 ETF (FVC) | ||
| Six Months Ended 3/31/2021 (Unaudited) | Year Ended 9/30/2020 | |
| $ (96,497) | $ 1,791,678 | |
| 27,368,562 | 2,141,868 | |
| 31,567,314 | (17,899,725) | |
| 58,839,379 | (13,966,179) | |
| — | (2,183,455) | |
| — | — | |
| — | (2,183,455) | |
| 48,049,549 | 17,694,882 | |
| (104,556,307) | (246,044,671) | |
| (56,506,758) | (228,349,789) | |
| 2,332,621 | (244,499,423) | |
| 223,753,999 | 468,253,422 | |
| $226,086,620 | $223,753,999 | |
| 8,550,002 | 17,700,002 | |
| 1,450,000 | 750,000 | |
| (3,400,000) | (9,900,000) | |
| 6,600,002 | 8,550,002 | |
| Six Months Ended 3/31/2021 (Unaudited) | Year Ended September 30, | ||||||||||
| 2020 | 2019 | 2018 | 2017 | 2016 | |||||||
Net asset value, beginning of period | $ 43.84 | $ 40.09 | $ 38.38 | $ 32.39 | $ 29.33 | $ 24.23 | |||||
| Income from investment operations: | |||||||||||
Net investment income (loss) | 0.54 | 0.93 | 0.97 | 0.96 | 0.80 | 0.80 | |||||
Net realized and unrealized gain (loss) | 10.09 | 3.77 | 1.71 | 5.90 | 3.01 | 5.02 | |||||
Total from investment operations | 10.63 | 4.70 | 2.68 | 6.86 | 3.81 | 5.82 | |||||
| Distributions paid to shareholders from: | |||||||||||
Net investment income | (0.56) | (0.95) | (0.97) | (0.87) | (0.75) | (0.72) | |||||
Net asset value, end of period | $53.91 | $43.84 | $40.09 | $38.38 | $32.39 | $29.33 | |||||
Total return (a) | 24.34% | 11.91% | 7.21% | 21.37% | 13.10% | 24.31% | |||||
| Ratios to average net assets/supplemental data: | |||||||||||
Net assets, end of period (in 000’s) | $ 1,485,443 | $ 1,245,277 | $ 1,010,557 | $ 948,172 | $ 717,616 | $ 572,100 | |||||
Ratio of total expenses to average net assets | 0.50% (b) | 0.50% | 0.50% | 0.50% | 0.50% | 0.50% | |||||
Ratio of net investment income (loss) to average net assets | 2.21% (b) | 2.28% | 2.59% | 2.70% | 2.64% | 3.01% | |||||
Portfolio turnover rate (c) | 15% | 49% | 37% | 27% | 26% | 30% | |||||
| (a) | Total return is calculated assuming an initial investment made at the net asset value at the beginning of the period, reinvestment of all distributions at net asset value during the period, and redemption at net asset value on the last day of the period. The returns presented do not reflect the deduction of taxes that a shareholder would pay on Fund distributions or the redemption or sale of Fund shares. Total return is calculated for the time period presented and is not annualized for periods of less than a year. |
| (b) | Annualized. |
| (c) | Portfolio turnover is calculated for the time period presented and is not annualized for periods of less than a year and does not include securities received or delivered from processing creations or redemptions and in-kind transactions. |
| Six Months Ended 3/31/2021 (Unaudited) | Year Ended September 30, | ||||||||||
| 2020 | 2019 | 2018 | 2017 | 2016 | |||||||
Net asset value, beginning of period | $ 13.52 | $ 18.43 | $ 18.54 | $ 19.22 | $ 18.89 | $ 18.37 | |||||
| Income from investment operations: | |||||||||||
Net investment income (loss) | 0.30 | 0.57 | 0.83 | 0.87 | 0.81 | 0.83 | |||||
Net realized and unrealized gain (loss) | 2.78 | (4.52) | 0.18 | (0.36) | 0.59 | 0.94 | |||||
Total from investment operations | 3.08 | (3.95) | 1.01 | 0.51 | 1.40 | 1.77 | |||||
| Distributions paid to shareholders from: | |||||||||||
Net investment income | (0.41) | (0.79) | (0.77) | (0.76) | (0.82) | (0.85) | |||||
Return of capital | — | (0.17) | (0.35) | (0.43) | (0.25) | (0.40) | |||||
Total distributions | (0.41) | (0.96) | (1.12) | (1.19) | (1.07) | (1.25) | |||||
Net asset value, end of period | $16.19 | $13.52 | $18.43 | $18.54 | $19.22 | $18.89 | |||||
Total return (a) | 23.08% | (21.89)% | 5.74% | 2.82% | 7.56% | 9.86% | |||||
| Ratios to average net assets/supplemental data: | |||||||||||
Net assets, end of period (in 000’s) | $ 468,593 | $ 440,726 | $ 715,985 | $ 683,960 | $ 850,403 | $ 873,524 | |||||
Ratio of total expenses to average net assets (b) | 0.60% (c) | 0.60% | 0.60% | 0.60% | 0.60% | 0.60% | |||||
Ratio of net expenses to average net assets (b) | 0.48% (c) | 0.47% | 0.48% | 0.48% | 0.48% | 0.48% | |||||
Ratio of net investment income (loss) to average net assets | 4.01% (c) | 3.86% | 4.58% | 4.62% | 4.25% | 4.25% | |||||
Portfolio turnover rate (d) | 45% | 106% | 73% | 84% | 82% | 115% | |||||
| (a) | Total return is calculated assuming an initial investment made at the net asset value at the beginning of the period, reinvestment of all distributions at net asset value during the period, and redemption at net asset value on the last day of the period. The returns presented do not reflect the deduction of taxes that a shareholder would pay on Fund distributions or the redemption or sale of Fund shares. Total return is calculated for the time period presented and is not annualized for periods of less than a year. |
| (b) | The Fund indirectly bears its proportionate share of fees and expenses incurred by the underlying funds in which the Fund invests. This ratio does not include these indirect fees and expenses. |
| (c) | Annualized. |
| (d) | Portfolio turnover is calculated for the time period presented and is not annualized for periods of less than a year and does not include securities received or delivered from processing creations or redemptions and in-kind transactions. |
| Six Months Ended 3/31/2021 (Unaudited) | Year Ended September 30, | ||||||||||
| 2020 | 2019 | 2018 | 2017 | 2016 | |||||||
Net asset value, beginning of period | $ 14.15 | $ 17.11 | $ 17.19 | $ 18.52 | $ 17.28 | $ 15.85 | |||||
| Income from investment operations: | |||||||||||
Net investment income (loss) | 0.25 | 0.64 | 0.63 | 0.85 | 0.77 | 0.77 | |||||
Net realized and unrealized gain (loss) | 3.35 | (2.93) | (0.08) | (1.26) | 1.39 | 1.34 | |||||
Total from investment operations | 3.60 | (2.29) | 0.55 | (0.41) | 2.16 | 2.11 | |||||
| Distributions paid to shareholders from: | |||||||||||
Net investment income | (0.25) | (0.67) | (0.63) | (0.92) | (0.92) | (0.68) | |||||
Net asset value, end of period | $17.50 | $14.15 | $17.11 | $17.19 | $18.52 | $17.28 | |||||
Total return (a) | 25.61% | (13.62)% | 3.38% | (2.35)% | 12.96% | 13.57% | |||||
| Ratios to average net assets/supplemental data: | |||||||||||
Net assets, end of period (in 000’s) | $ 32,370 | $ 18,390 | $ 19,678 | $ 13,753 | $ 12,038 | $ 12,962 | |||||
Ratio of total expenses to average net assets | 0.60% (b) | 0.60% | 0.60% | 0.69% (c) | 0.70% | 0.70% | |||||
Ratio of net investment income (loss) to average net assets | 3.39% (b) | 4.03% | 4.01% | 4.70% | 4.36% | 4.52% | |||||
Portfolio turnover rate (d) | 61% | 81% | 44% | 196% (e) | 129% | 151% | |||||
| (a) | Total return is calculated assuming an initial investment made at the net asset value at the beginning of the period, reinvestment of all distributions at net asset value during the period, and redemption at net asset value on the last day of the period. The returns presented do not reflect the deduction of taxes that a shareholder would pay on Fund distributions or the redemption or sale of Fund shares. Total return is calculated for the time period presented and is not annualized for periods of less than a year. |
| (b) | Annualized. |
| (c) | On August 30, 2018, the Fund also reduced the annual management fee payable to First Trust, from 0.70% of the Fund’s average daily net assets to 0.60% of the Fund’s average daily net assets. |
| (d) | Portfolio turnover is calculated for the time period presented and is not annualized for periods of less than a year and does not include securities received or delivered from processing creations or redemptions and in-kind transactions. |
| (e) | The variation in the portfolio turnover rate is due to the change in the Fund’s underlying index effective August 30, 2018, which resulted in a complete rebalance of the Fund’s portfolio. |
| Six Months Ended 3/31/2021 (Unaudited) | Year Ended September 30, | ||||||||||
| 2020 | 2019 | 2018 | 2017 | 2016 | |||||||
Net asset value, beginning of period | $ 19.12 | $ 22.43 | $ 23.28 | $ 22.54 | $ 20.57 | $ 19.12 | |||||
| Income from investment operations: | |||||||||||
Net investment income (loss) | 0.17 | 0.23 | 0.40 | 0.35 | 0.30 | 0.34 | |||||
Net realized and unrealized gain (loss) | 2.27 | (2.58) | (0.29) | 1.35 | 2.60 | 2.06 | |||||
Total from investment operations | 2.44 | (2.35) | 0.11 | 1.70 | 2.90 | 2.40 | |||||
| Distributions paid to shareholders from: | |||||||||||
Net investment income | (0.48) | (0.23) | (0.86) | (0.96) | (0.13) | (0.35) | |||||
Return of capital | — | (0.73) | (0.10) | — | (0.80) | (0.60) | |||||
Total distributions | (0.48) | (0.96) | (0.96) | (0.96) | (0.93) | (0.95) | |||||
Net asset value, end of period | $21.08 | $19.12 | $22.43 | $23.28 | $22.54 | $20.57 | |||||
Total return (a) | 12.92% | (10.63)% | 0.72% | 8.12% | 13.93% | 12.80% | |||||
| Ratios to average net assets/supplemental data: | |||||||||||
Net assets, end of period (in 000’s) | $ 60,597 | $ 59,733 | $ 80,155 | $ 66,898 | $ 52,385 | $ 7,198 | |||||
Ratio of total expenses to average net assets | 0.85% (b) | 0.85% | 0.85% | 0.85% | 0.87% (c) | 0.85% | |||||
Ratio of net investment income (loss) to average net assets | 1.84% (b) | 1.10% | 1.43% | 1.34% | 1.43% | 1.78% | |||||
Portfolio turnover rate (d) | 124% | 210% | 209% | 239% | 315% (e) | 139% | |||||
| (a) | Total return is calculated assuming an initial investment made at the net asset value at the beginning of the period, reinvestment of all distributions at net asset value during the period, and redemption at net asset value on the last day of the period. The returns presented do not reflect the deduction of taxes that a shareholder would pay on Fund distributions or the redemption or sale of Fund shares. Total return is calculated for the time period presented and is not annualized for periods of less than a year. |
| (b) | Annualized. |
| (c) | Includes reorganization fees. If this reorganization fee was not included, the expense ratio would have been 0.85%. |
| (d) | Portfolio turnover is calculated for the time period presented and is not annualized for periods of less than a year and does not include securities received or delivered from processing creations or redemptions and in-kind transactions. |
| (e) | The variation in the portfolio turnover rate is due to the rebalance of the portfolio that occurred shortly after the reorganization of FTHI with the First Trust Dividend and Income Fund. |
| Six Months Ended 3/31/2021 (Unaudited) | Year Ended September 30, | ||||||||||
| 2020 | 2019 | 2018 | 2017 | 2016 | |||||||
Net asset value, beginning of period | $ 19.23 | $ 22.30 | $ 22.92 | $ 22.27 | $ 20.38 | $ 19.05 | |||||
| Income from investment operations: | |||||||||||
Net investment income (loss) | 0.18 | 0.21 | 0.27 | 0.40 | 0.38 | 0.24 | |||||
Net realized and unrealized gain (loss) | 1.74 | (2.62) | (0.23) | 0.91 | 2.14 | 1.74 | |||||
Total from investment operations | 1.92 | (2.41) | 0.04 | 1.31 | 2.52 | 1.98 | |||||
| Distributions paid to shareholders from: | |||||||||||
Net investment income | (0.33) | (0.21) | (0.58) | (0.66) | (0.63) | (0.36) | |||||
Return of capital | — | (0.45) | (0.08) | — | — | (0.29) | |||||
Total distributions | (0.33) | (0.66) | (0.66) | (0.66) | (0.63) | (0.65) | |||||
Net asset value, end of period | $20.82 | $19.23 | $22.30 | $22.92 | $22.27 | $20.38 | |||||
Total return (a) | 10.06% | (10.98)% | 0.29% | 5.95% | 12.57% | 10.53% | |||||
| Ratios to average net assets/supplemental data: | |||||||||||
Net assets, end of period (in 000’s) | $ 5,204 | $ 4,807 | $ 8,919 | $ 13,751 | $ 7,794 | $ 4,077 | |||||
Ratio of total expenses to average net assets | 0.85% (b) | 0.85% | 0.85% | 0.85% | 0.85% | 0.85% | |||||
Ratio of net investment income (loss) to average net assets | 1.82% (b) | 0.96% | 1.40% | 1.32% | 1.45% | 1.79% | |||||
Portfolio turnover rate (c) | 127% | 207% | 205% | 219% | 184% | 143% | |||||
| (a) | Total return is calculated assuming an initial investment made at the net asset value at the beginning of the period, reinvestment of all distributions at net asset value during the period, and redemption at net asset value on the last day of the period. The returns presented do not reflect the deduction of taxes that a shareholder would pay on Fund distributions or the redemption or sale of Fund shares. Total return is calculated for the time period presented and is not annualized for periods of less than a year. |
| (b) | Annualized. |
| (c) | Portfolio turnover is calculated for the time period presented and is not annualized for periods of less than a year and does not include securities received or delivered from processing creations or redemptions and in-kind transactions. |
| Six Months Ended 3/31/2021 (Unaudited) | Year Ended September 30, | ||||||||||
| 2020 | 2019 | 2018 | 2017 | 2016 | |||||||
Net asset value, beginning of period | $ 32.67 | $ 31.82 | $ 31.54 | $ 27.84 | $ 22.12 | $ 20.34 | |||||
| Income from investment operations: | |||||||||||
Net investment income (loss) | 0.32 | 0.58 | 0.54 | 0.41 | 0.34 | 0.53 | |||||
Net realized and unrealized gain (loss) | 12.79 | 0.86 | 0.27 | 3.68 | 5.73 | 1.86 | |||||
Total from investment operations | 13.11 | 1.44 | 0.81 | 4.09 | 6.07 | 2.39 | |||||
| Distributions paid to shareholders from: | |||||||||||
Net investment income | (0.33) | (0.59) | (0.53) | (0.39) | (0.35) | (0.54) | |||||
Net realized gain | — | — | — | — | — | (0.07) | |||||
Total distributions | (0.33) | (0.59) | (0.53) | (0.39) | (0.35) | (0.61) | |||||
Net asset value, end of period | $45.45 | $32.67 | $31.82 | $31.54 | $27.84 | $22.12 | |||||
Total return (a) | 40.21% | 4.61% | 2.72% | 14.78% | 27.53% | 11.98% | |||||
| Ratios to average net assets/supplemental data: | |||||||||||
Net assets, end of period (in 000’s) | $ 3,149,460 | $ 1,292,097 | $ 832,156 | $ 690,709 | $ 271,405 | $ 27,646 | |||||
Ratio of total expenses to average net assets | 0.50% (b) | 0.50% | 0.50% | 0.50% | 0.50% | 0.50% | |||||
Ratio of net investment income (loss) to average net assets | 1.78% (b) | 1.89% | 1.85% | 1.50% | 1.60% | 2.50% | |||||
Portfolio turnover rate (c) | 57% | 62% | 63% | 40% | 46% | 66% | |||||
| (a) | Total return is calculated assuming an initial investment made at the net asset value at the beginning of the period, reinvestment of all distributions at net asset value during the period, and redemption at net asset value on the last day of the period. The returns presented do not reflect the deduction of taxes that a shareholder would pay on Fund distributions or the redemption or sale of Fund shares. Total return is calculated for the time period presented and is not annualized for periods of less than a year. |
| (b) | Annualized. |
| (c) | Portfolio turnover is calculated for the time period presented and is not annualized for periods of less than a year and does not include securities received or delivered from processing creations or redemptions and in-kind transactions. |
| Six Months Ended 3/31/2021 (Unaudited) | Year Ended September 30, | ||||||||||
| 2020 | 2019 | 2018 | 2017 | 2016 | |||||||
Net asset value, beginning of period | $ 34.10 | $ 29.63 | $ 30.93 | $ 26.17 | $ 22.91 | $ 21.91 | |||||
| Income from investment operations: | |||||||||||
Net investment income (loss) | (0.02) | 0.09 | 0.11 | 0.09 | 0.21 | 0.16 | |||||
Net realized and unrealized gain (loss) | 10.55 | 4.49 | (1.31) | 4.83 | 3.25 | 0.96 | |||||
Total from investment operations | 10.53 | 4.58 | (1.20) | 4.92 | 3.46 | 1.12 | |||||
| Distributions paid to shareholders from: | |||||||||||
Net investment income | — | (0.11) | (0.10) | (0.16) | (0.20) | (0.12) | |||||
Net asset value, end of period | $44.63 | $34.10 | $29.63 | $30.93 | $26.17 | $22.91 | |||||
Total return (a) | 30.88% | 15.50% | (3.92)% | 18.91% | 15.16% | 5.10% | |||||
| Ratios to average net assets/supplemental data: | |||||||||||
Net assets, end of period (in 000’s) | $ 2,568,509 | $ 2,047,492 | $ 2,348,262 | $ 2,858,225 | $ 2,397,352 | $ 3,055,465 | |||||
Ratio of total expenses to average net assets (b) | 0.30% (c) | 0.30% | 0.30% | 0.30% | 0.30% | 0.30% | |||||
Ratio of net investment income (loss) to average net assets | (0.08)% (c) | 0.30% | 0.34% | 0.30% | 0.74% | 0.62% | |||||
Portfolio turnover rate (d) | 21% | 72% | 65% | 44% | 66% | 42% | |||||
| (a) | Total return is calculated assuming an initial investment made at the net asset value at the beginning of the period, reinvestment of all distributions at net asset value during the period, and redemption at net asset value on the last day of the period. The returns presented do not reflect the deduction of taxes that a shareholder would pay on Fund distributions or the redemption or sale of Fund shares. Total return is calculated for the time period presented and is not annualized for periods of less than a year. |
| (b) | The Fund indirectly bears its proportionate share of fees and expenses incurred by the underlying funds in which the Fund invests. This ratio does not include these indirect fees and expenses. |
| (c) | Annualized. |
| (d) | Portfolio turnover is calculated for the time period presented and is not annualized for periods of less than a year and does not include securities received or delivered from processing creations or redemptions and in-kind transactions. |
| Six Months Ended 3/31/2021 (Unaudited) | Year Ended September 30, | ||||||||||
| 2020 | 2019 | 2018 | 2017 | 2016 | |||||||
Net asset value, beginning of period | $ 25.68 | $ 26.76 | $ 27.93 | $ 26.04 | $ 20.49 | $ 15.31 | |||||
| Income from investment operations: | |||||||||||
Net investment income (loss) | 0.01 | (0.03) | 0.10 (a) | 0.09 | 0.08 (a) | 0.08 (a) | |||||
Net realized and unrealized gain (loss) | 14.81 | (0.98) | (1.21) | 1.88 | 5.53 | 5.16 | |||||
Total from investment operations | 14.82 | (1.01) | (1.11) | 1.97 | 5.61 | 5.24 | |||||
| Distributions paid to shareholders from: | |||||||||||
Net investment income | (0.02) | (0.07) | (0.06) | (0.08) | (0.06) | (0.06) | |||||
Net asset value, end of period | $40.48 | $25.68 | $26.76 | $27.93 | $26.04 | $20.49 | |||||
Total return (b) | 57.74% | (3.81)% | (3.95)% | 7.56% | 27.39% | 34.27% | |||||
| Ratios to average net assets/supplemental data: | |||||||||||
Net assets, end of period (in 000’s) | $ 174,047 | $ 47,513 | $ 66,900 | $ 195,500 | $ 169,282 | $ 20,492 | |||||
Ratio of total expenses to average net assets | 0.70% (c) | 0.70% | 0.70% | 0.70% | 0.70% | 0.70% | |||||
Ratio of net investment income (loss) to average net assets | 0.12% (c) | (0.18)% | 0.40% | 0.32% | 0.33% | 0.47% | |||||
Portfolio turnover rate (d) | 17% | 45% | 58% | 35% | 52% | 62% | |||||
| (a) | Based on average shares outstanding. |
| (b) | Total return is calculated assuming an initial investment made at the net asset value at the beginning of the period, reinvestment of all distributions at net asset value during the period, and redemption at net asset value on the last day of the period. The returns presented do not reflect the deduction of taxes that a shareholder would pay on Fund distributions or the redemption or sale of Fund shares. Total return is calculated for the time period presented and is not annualized for periods of less than a year. |
| (c) | Annualized. |
| (d) | Portfolio turnover is calculated for the time period presented and is not annualized for periods of less than a year and does not include securities received or delivered from processing creations or redemptions and in-kind transactions. |
| Six Months Ended 3/31/2021 (Unaudited) | Year Ended September 30, | ||||||||||
| 2020 | 2019 | 2018 | 2017 | 2016 | |||||||
Net asset value, beginning of period | $ 21.06 | $ 26.07 | $ 25.15 | $ 24.54 | $ 22.11 | $ 20.10 | |||||
| Income from investment operations: | |||||||||||
Net investment income (loss) | 0.38 | 0.68 | 0.78 | 0.65 | 0.60 | 0.55 | |||||
Net realized and unrealized gain (loss) | 8.05 | (4.95) | 0.86 | 0.59 | 2.44 | 1.96 | |||||
Total from investment operations | 8.43 | (4.27) | 1.64 | 1.24 | 3.04 | 2.51 | |||||
| Distributions paid to shareholders from: | |||||||||||
Net investment income | (0.28) | (0.74) | (0.72) | (0.63) | (0.61) | (0.50) | |||||
Net asset value, end of period | $29.21 | $21.06 | $26.07 | $25.15 | $24.54 | $22.11 | |||||
Total return (a) | 40.21% | (16.49)% | 6.87% | 5.10% | 13.93% | 12.52% | |||||
| Ratios to average net assets/supplemental data: | |||||||||||
Net assets, end of period (in 000’s) | $ 35,050 | $ 29,484 | $ 44,313 | $ 37,727 | $ 28,221 | $ 22,107 | |||||
Ratio of total expenses to average net assets | 0.60% (b) | 0.60% | 0.60% | 0.69% (c) | 0.70% | 0.70% | |||||
Ratio of net investment income (loss) to average net assets | 2.89% (b) | 2.81% | 3.50% | 2.79% | 2.61% | 2.79% | |||||
Portfolio turnover rate (d) | 112% | 193% | 160% | 297% (e) | 150% | 136% | |||||
| (a) | Total return is calculated assuming an initial investment made at the net asset value at the beginning of the period, reinvestment of all distributions at net asset value during the period, and redemption at net asset value on the last day of the period. The returns presented do not reflect the deduction of taxes that a shareholder would pay on Fund distributions or the redemption or sale of Fund shares. Total return is calculated for the time period presented and is not annualized for periods of less than a year. |
| (b) | Annualized. |
| (c) | On September 6, 2018, the Fund also reduced the annual management fee payable to First Trust, from 0.70% of the Fund’s average daily net assets to 0.60% of the Fund’s average daily net assets. |
| (d) | Portfolio turnover is calculated for the time period presented and is not annualized for periods of less than a year and does not include securities received or delivered from processing creations or redemptions and in-kind transactions. |
| (e) | The variation in the portfolio turnover rate is due to the change in the Fund’s underlying index effective September 6, 2018, which resulted in a complete rebalance of the Fund’s portfolio. |
| Six Months Ended 3/31/2021 (Unaudited) | Year Ended September 30, | ||||||||||
| 2020 | 2019 | 2018 | 2017 | 2016 | |||||||
Net asset value, beginning of period | $ 18.83 | $ 19.07 | $ 20.33 | $ 21.35 | $ 17.55 | $ 17.08 | |||||
| Income from investment operations: | |||||||||||
Net investment income (loss) | 0.10 | 0.56 | 0.37 | 0.33 | 0.25 | 0.22 | |||||
Net realized and unrealized gain (loss) | 4.12 | (0.23) | (1.26) | (0.93) | 3.73 | 0.52 | |||||
Total from investment operations | 4.22 | 0.33 | (0.89) | (0.60) | 3.98 | 0.74 | |||||
| Distributions paid to shareholders from: | |||||||||||
Net investment income | (0.11) | (0.57) | (0.35) | (0.42) | (0.18) | (0.27) | |||||
Return of capital | — | — | (0.02) | — | — | — | |||||
Total distributions | (0.11) | (0.57) | (0.37) | (0.42) | (0.18) | (0.27) | |||||
Net asset value, end of period | $22.94 | $18.83 | $19.07 | $20.33 | $21.35 | $17.55 | |||||
Total return (a) | 22.43% | 1.75% | (4.42)% | (2.91)% | 22.71% | 4.35% | |||||
| Ratios to average net assets/supplemental data: | |||||||||||
Net assets, end of period (in 000’s) | $ 281,029 | $ 218,452 | $ 453,757 | $ 774,665 | $ 794,132 | $ 450,042 | |||||
Ratio of total expenses to average net assets (b) | 0.30% (c) | 0.30% | 0.30% | 0.30% | 0.30% | 0.30% | |||||
Ratio of net investment income (loss) to average net assets | 0.88% (c) | 3.19% | 1.89% | 1.57% | 1.59% | 1.14% | |||||
Portfolio turnover rate (d) | 22% | 29% | 42% | 0% | 49% | 58% | |||||
| (a) | Total return is calculated assuming an initial investment made at the net asset value at the beginning of the period, reinvestment of all distributions at net asset value during the period, and redemption at net asset value on the last day of the period. The returns presented do not reflect the deduction of taxes that a shareholder would pay on Fund distributions or the redemption or sale of Fund shares. Total return is calculated for the time period presented and is not annualized for periods of less than a year. |
| (b) | The Fund indirectly bears its proportionate share of fees and expenses incurred by the underlying funds in which the Fund invests. This ratio does not include these indirect fees and expenses. |
| (c) | Annualized. |
| (d) | Portfolio turnover is calculated for the time period presented and is not annualized for periods of less than a year and does not include securities received or delivered from processing creations or redemptions and in-kind transactions. |
| Six Months Ended 3/31/2021 (Unaudited) | Year Ended September 30, | ||||||||||
| 2020 | 2019 | 2018 | 2017 | 2016 | |||||||
Net asset value, beginning of period | $ 26.17 | $ 26.45 | $ 28.80 | $ 24.36 | $ 21.32 | $ 20.02 | |||||
| Income from investment operations: | |||||||||||
Net investment income (loss) | (0.01) | 0.13 | 0.22 | 0.08 | 0.17 | 0.09 | |||||
Net realized and unrealized gain (loss) | 8.10 | (0.25) | (2.37) | 4.51 | 3.04 | 1.25 | |||||
Total from investment operations | 8.09 | (0.12) | (2.15) | 4.59 | 3.21 | 1.34 | |||||
| Distributions paid to shareholders from: | |||||||||||
Net investment income | — | (0.16) | (0.20) | (0.15) | (0.16) | (0.04) | |||||
Net realized gain | — | — | — | — | (0.01) | — | |||||
Total distributions | — | (0.16) | (0.20) | (0.15) | (0.17) | (0.04) | |||||
Net asset value, end of period | $34.26 | $26.17 | $26.45 | $28.80 | $24.36 | $21.32 | |||||
Total return (b) | 30.91% | (0.46)% | (7.46)% | 18.91% | 15.13% | 6.68% | |||||
| Ratios to average net assets/supplemental data: | |||||||||||
Net assets, end of period (in 000’s) | $ 226,087 | $ 223,754 | $ 468,253 | $ 620,537 | $ 328,881 | $ 234,540 | |||||
Ratio of total expenses to average net assets (c) | 0.30% (d) | 0.30% | 0.30% | 0.30% | 0.30% | 0.30% (d) | |||||
Ratio of net investment income (loss) to average net assets | (0.09)% (d) | 0.54% | 0.79% | 0.32% | 0.80% | 1.45% (d) | |||||
Portfolio turnover rate (e) | 21% | 225% | 90% | 42% | 54% | 15% | |||||
| (a) | Inception date is March 17, 2016, which is consistent with the commencement of investment operations and is the date the initial creation units were established. |
| (b) | Total return is calculated assuming an initial investment made at the net asset value at the beginning of the period, reinvestment of all distributions at net asset value during the period, and redemption at net asset value on the last day of the period. The returns presented do not reflect the deduction of taxes that a shareholder would pay on Fund distributions or the redemption or sale of Fund shares. Total return is calculated for the time period presented and is not annualized for periods of less than a year. |
| (c) | The Fund indirectly bears its proportionate share of fees and expenses incurred by the underlying funds in which the Fund invests. This ratio does not include these indirect fees and expenses. |
| (d) | Annualized. |
| (e) | Portfolio turnover is calculated for the time period presented and is not annualized for periods of less than a year and does not include securities received or delivered from processing creations or redemptions and in-kind transactions. |
| Fund | Index |
| First Trust NASDAQ Technology Dividend Index Fund | NASDAQ Technology Dividend IndexSM(1) |
| Multi-Asset Diversified Income Index Fund | NASDAQ US Multi-Asset Diversified Income IndexSM(1) |
| First Trust S&P International Dividend Aristocrats ETF | S&P International Dividend Aristocrats Index(2) |
| First Trust Rising Dividend Achievers ETF | NASDAQ US Rising Dividend Achievers Index(1) |
| First Trust Dorsey Wright Focus 5 ETF | Dorsey Wright Focus Five Index(3) |
| First Trust RBA American Industrial Renaissance® ETF | Richard Bernstein Advisors American Industrial Renaissance® Index(4) |
| First Trust Dorsey Wright Momentum & Dividend ETF | Dorsey Wright Momentum Plus Dividend Yield Index(1) |
| First Trust Dorsey Wright International Focus 5 ETF | Dorsey Wright International Focus Five Index(3) |
| First Trust Dorsey Wright Dynamic Focus 5 ETF | Dorsey Wright Dynamic Focus Five Index(3) |
| 1) | the credit conditions in the relevant market and changes thereto; |
| 2) | the liquidity conditions in the relevant market and changes thereto; |
| 3) | the interest rate conditions in the relevant market and changes thereto (such as significant changes in interest rates); |
| 4) | issuer-specific conditions (such as significant credit deterioration); and |
| 5) | any other market-based data the Advisor’s Pricing Committee considers relevant. In this regard, the Advisor’s Pricing Committee may use last-obtained market-based data to assist it when valuing portfolio securities using amortized cost. |
| 1) | the type of security; |
| 2) | the size of the holding; |
| 3) | the initial cost of the security; |
| 4) | transactions in comparable securities; |
| 5) | price quotes from dealers and/or third-party pricing services; |
| 6) | relationships among various securities; |
| 7) | information obtained by contacting the issuer, analysts, or the appropriate stock exchange; |
| 8) | an analysis of the issuer’s financial statements; and |
| 9) | the existence of merger proposals or tender offers that might affect the value of the security. |
| 1) | the value of similar foreign securities traded on other foreign markets; |
| 2) | ADR trading of similar securities; |
| 3) | closed-end fund or exchange-traded fund trading of similar securities; |
| 4) | foreign currency exchange activity; |
| 5) | the trading prices of financial products that are tied to baskets of foreign securities; |
| 6) | factors relating to the event that precipitated the pricing problem; |
| 7) | whether the event is likely to recur; and |
| 8) | whether the effects of the event are isolated or whether they affect entire markets, countries or regions. |
| • | Level 1 – Level 1 inputs are quoted prices in active markets for identical investments. An active market is a market in which transactions for the investment occur with sufficient frequency and volume to provide pricing information on an ongoing basis. |
| • | Level 2 – Level 2 inputs are observable inputs, either directly or indirectly, and include the following: |
| o | Quoted prices for similar investments in active markets. |
| o | Quoted prices for identical or similar investments in markets that are non-active. A non-active market is a market where there are few transactions for the investment, the prices are not current, or price quotations vary substantially either over time or among market makers, or in which little information is released publicly. |
| o | Inputs other than quoted prices that are observable for the investment (for example, interest rates and yield curves observable at commonly quoted intervals, volatilities, prepayment speeds, loss severities, credit risks, and default rates). |
| o | Inputs that are derived principally from or corroborated by observable market data by correlation or other means. |
| • | Level 3 – Level 3 inputs are unobservable inputs. Unobservable inputs may reflect the reporting entity’s own assumptions about the assumptions that market participants would use in pricing the investment. |
| Security Name | Shares at 3/31/2021 | Value at 9/30/2020 | Purchases | Sales | Change in Unrealized Appreciation (Depreciation) | Realized Gain (Loss) | Value at 3/31/2021 | Dividend Income |
| First Trust Tactical High Yield ETF | 1,846,014 | $ 91,385,726 | $ 6,711,189 | $ (11,090,525) | $ 2,823,345 | $ (21,154) | $ 89,808,581 | $ 2,480,170 |
| Security Name | Shares at 3/31/2021 | Value at 9/30/2020 | Purchases | Sales | Change in Unrealized Appreciation (Depreciation) | Realized Gain (Loss) | Value at 3/31/2021 | Dividend Income | ||||||
| First Trust Consumer Discretionary AlphaDEX® Fund | 9,137,168 | $ 400,825,212 | $ 107,039,577 | $ (120,588,074) | $ 137,979,260 | $ 6,527,202 | $ 531,783,177 | $ 858,524 | ||||||
| First Trust Dow Jones Internet Index Fund | — | 408,238,044 | 97,681,774 | (580,715,664) | (253,844,665) | 328,640,511 | — | — | ||||||
| First Trust Industrials/Producer Durables AlphaDEX® Fund | 9,423,529 | — | 498,857,150 | (6,482,575) | 41,357,468 | 110,875 | 533,842,918 | 602,582 | ||||||
| First Trust Nasdaq Transportation ETF | 16,292,776 | 401,360,989 | 109,592,029 | (134,200,944) | 155,603,152 | 4,309,264 | 536,664,490 | 703,451 | ||||||
| First Trust NASDAQ-100-Technology Sector Index Fund | 3,378,723 | 412,866,145 | 107,414,876 | (126,379,391) | 77,181,095 | 16,129,132 | 487,211,857 | 407,554 | ||||||
| First Trust Technology AlphaDEX® Fund | 4,209,910 | 423,428,260 | 113,728,202 | (163,732,745) | 74,414,106 | 30,534,250 | 478,372,073 | — | ||||||
| $2,046,718,650 | $1,034,313,608 | $(1,132,099,393) | $232,690,416 | $386,251,234 | $2,567,874,515 | $2,572,111 |
| Security Name | Shares at 3/31/21 | Value at 9/30/2020 | Purchases | Sales | Change in Unrealized Appreciation (Depreciation) | Realized Gain (Loss) | Value at 3/31/21 | Dividend Income | ||||||
| First Trust BICK Index Fund | 1,444,491 | $ 43,485,202 | $ 5,728,237 | $ (7,295,704) | $ 11,702,326 | $ 722,701 | $ 54,342,762 | $ 164,344 | ||||||
| First Trust China AlphaDEX® Fund | — | 37,830,104 | 2,985,145 | (44,231,573) | (6,091,898) | 9,508,222 | — | — | ||||||
| First Trust Chindia ETF | 948,086 | 46,198,623 | 5,954,796 | (6,932,045) | 11,766,776 | 1,243,292 | 58,231,442 | 109,441 | ||||||
| First Trust Europe AlphaDEX® Fund | 1,393,907 | — | 54,457,049 | (505,435) | 2,714,205 | 10,440 | 56,676,259 | 830,918 | ||||||
| First Trust Germany AlphaDEX® Fund | 1,044,548 | 47,933,240 | 5,684,271 | (7,075,402) | 9,486,301 | 84,395 | 56,112,805 | 293,074 | ||||||
| First Trust Switzerland AlphaDEX® Fund | 899,264 | 42,792,105 | 8,752,326 | (2,371,788) | 6,110,930 | 254,972 | 55,538,545 | 134,630 | ||||||
| $218,239,274 | $83,561,824 | $(68,411,947) | $35,688,640 | $11,824,022 | $280,901,813 | $1,532,407 |
| Security Name | Shares at 3/31/2021 | Value at 9/30/2020 | Purchases | Sales | Change in Unrealized Appreciation (Depreciation) | Realized Gain (Loss) | Value at 3/31/2021 | Dividend Income | ||||||
| First Trust Consumer Discretionary AlphaDEX® Fund | 804,283 | $ 43,803,183 | $ 9,539,212 | $ (20,231,059) | $ 11,300,652 | $ 2,397,283 | $ 46,809,271 | $ 78,147 | ||||||
| First Trust Dow Jones Internet Index Fund | — | 44,613,117 | 8,953,983 | (60,777,610) | (8,066,392) | 15,276,902 | — | — | ||||||
| First Trust Industrials/Producer Durables AlphaDEX® Fund | 829,490 | — | 45,683,062 | (2,389,369) | 3,649,756 | 47,159 | 46,990,608 | 53,490 | ||||||
| First Trust Nasdaq Transportation ETF | 1,434,143 | 43,861,695 | 9,786,537 | (21,512,450) | 13,860,206 | 1,242,961 | 47,238,949 | 65,533 | ||||||
| First Trust NASDAQ-100-Technology Sector Index Fund | 297,406 | 45,118,981 | 9,584,938 | (20,818,559) | 5,923,980 | 3,076,605 | 42,885,945 | 37,864 | ||||||
| First Trust Technology AlphaDEX® Fund | 370,570 | 46,273,279 | 10,174,379 | (24,566,553) | 4,899,112 | 5,327,652 | 42,107,869 | — | ||||||
| $223,670,255 | $93,722,111 | $(150,295,600) | $31,567,314 | $27,368,562 | $226,032,642 | $235,034 |
| Distributions paid from Ordinary Income | Distributions paid from Capital Gains | Distributions paid from Return of Capital | |||
First Trust NASDAQ Technology Dividend Index Fund | $ 25,845,943 | $ — | $ — | ||
Multi-Asset Diversified Income Index Fund | 29,891,031 | — | 6,494,411 | ||
First Trust S&P International Dividend Aristocrats ETF | 721,161 | — | — | ||
First Trust BuyWrite Income ETF | 781,626 | — | 2,497,607 | ||
First Trust Hedged BuyWrite Income ETF | 66,215 | — | 145,536 | ||
First Trust Rising Dividend Achievers ETF | 21,259,226 | — | — | ||
First Trust Dorsey Wright Focus 5 ETF | 7,981,650 | — | — | ||
First Trust RBA American Industrial Renaissance® ETF | 144,765 | — | — | ||
First Trust Dorsey Wright Momentum & Dividend ETF | 1,297,931 | — | — | ||
First Trust Dorsey Wright International Focus 5 ETF | 11,181,681 | — | — | ||
First Trust Dorsey Wright Dynamic Focus 5 ETF | 2,183,455 | — | — |
| Undistributed Ordinary Income | Accumulated Capital and Other Gain (Loss) | Net Unrealized Appreciation (Depreciation) | |||
First Trust NASDAQ Technology Dividend Index Fund | $ 1,390,200 | $ (119,073,455) | $ 243,561,829 | ||
Multi-Asset Diversified Income Index Fund | — | (271,313,191) | (41,838,234) | ||
First Trust S&P International Dividend Aristocrats ETF | 119,233 | (5,172,768) | (3,274,390) | ||
First Trust BuyWrite Income ETF | — | (22,148,128) | 3,548,674 | ||
First Trust Hedged BuyWrite Income ETF | — | (2,720,799) | 266,213 | ||
First Trust Rising Dividend Achievers ETF | 758,492 | (80,086,660) | 44,026,145 | ||
First Trust Dorsey Wright Focus 5 ETF | — | (525,969,254) | 693,744,943 | ||
First Trust RBA American Industrial Renaissance® ETF | 15,327 | (28,598,861) | (2,591,247) | ||
First Trust Dorsey Wright Momentum & Dividend ETF | 46,318 | (19,919,073) | 2,207,980 | ||
First Trust Dorsey Wright International Focus 5 ETF | 5,874 | (163,878,136) | 22,211,194 | ||
First Trust Dorsey Wright Dynamic Focus 5 ETF | — | (63,443,243) | 24,004,392 |
| Non-Expiring Capital Loss Carryforward | |
First Trust NASDAQ Technology Dividend Index Fund | $ 119,073,455 |
Multi-Asset Diversified Income Index Fund | 271,313,191 |
First Trust S&P International Dividend Aristocrats ETF | 5,172,768 |
First Trust BuyWrite Income ETF | 22,148,128 |
First Trust Hedged BuyWrite Income ETF | 2,720,799 |
First Trust Rising Dividend Achievers ETF | 80,086,660 |
First Trust Dorsey Wright Focus 5 ETF | 525,969,254 |
First Trust RBA American Industrial Renaissance® ETF | 28,598,861 |
First Trust Dorsey Wright Momentum & Dividend ETF | 19,919,073 |
First Trust Dorsey Wright International Focus 5 ETF | 163,878,136 |
First Trust Dorsey Wright Dynamic Focus 5 ETF | 63,443,243 |
| Fund | Licensor |
| First Trust NASDAQ Technology Dividend Index Fund | Nasdaq, Inc. |
| Multi-Asset Diversified Income Index Fund | Nasdaq, Inc. |
| First Trust S&P International Dividend Aristocrats ETF | S&P Dow Jones Indices, LLC |
| First Trust Rising Dividend Achievers ETF | Nasdaq, Inc. |
| First Trust Dorsey Wright Focus 5 ETF | Dorsey, Wright & Associates, LLC |
| First Trust RBA American Industrial Renaissance® ETF | Richard Bernstein Advisors LLC |
| First Trust Dorsey Wright Momentum & Dividend ETF | Nasdaq, Inc. |
| First Trust Dorsey Wright International Focus 5 ETF | Dorsey, Wright & Associates, LLC |
| First Trust Dorsey Wright Dynamic Focus 5 ETF | Dorsey, Wright & Associates, LLC |
| Rate | |
| First Trust NASDAQ Technology Dividend Index Fund | 0.50% |
| Multi-Asset Diversified Income Index Fund | 0.60% |
| First Trust S&P International Dividend Aristocrats ETF | 0.60% |
| First Trust BuyWrite Income ETF | 0.85% |
| First Trust Hedged BuyWrite Income ETF | 0.85% |
| First Trust Rising Dividend Achievers ETF | 0.50% |
| First Trust Dorsey Wright Focus 5 ETF | 0.30% |
| First Trust RBA American Industrial Renaissance® ETF | 0.70% |
| First Trust Dorsey Wright Momentum & Dividend ETF | 0.60% |
| First Trust Dorsey Wright International Focus 5 ETF | 0.30% |
| First Trust Dorsey Wright Dynamic Focus 5 ETF | 0.30% |
| Purchases | Sales | ||
| First Trust NASDAQ Technology Dividend Index Fund | $ 205,875,390 | $ 206,344,489 | |
| Multi-Asset Diversified Income Index Fund | 203,260,841 | 207,500,903 | |
| First Trust S&P International Dividend Aristocrats ETF | 16,210,618 | 14,766,888 | |
| First Trust BuyWrite Income ETF | 74,168,234 | 79,681,973 | |
| First Trust Hedged BuyWrite Income ETF | 6,145,943 | 6,508,547 | |
| First Trust Rising Dividend Achievers ETF | 1,120,675,067 | 1,122,448,608 | |
| First Trust Dorsey Wright Focus 5 ETF | 495,764,197 | 493,752,975 | |
| First Trust RBA American Industrial Renaissance® ETF | 14,915,668 | 14,914,509 | |
| First Trust Dorsey Wright Momentum & Dividend ETF | 32,340,250 | 32,250,736 | |
| First Trust Dorsey Wright International Focus 5 ETF | 56,221,476 | 56,292,287 | |
| First Trust Dorsey Wright Dynamic Focus 5 ETF | 45,683,063 | 45,497,308 | |
| Purchases | Sales | ||
| First Trust NASDAQ Technology Dividend Index Fund | $ 265,463,180 | $ 302,639,217 | |
| Multi-Asset Diversified Income Index Fund | 738,523 | 54,920,832 | |
| First Trust S&P International Dividend Aristocrats ETF | 7,516,023 | — | |
| First Trust BuyWrite Income ETF | 17,111,757 | 22,398,748 | |
| First Trust Hedged BuyWrite Income ETF | 3,042,543 | 3,026,608 | |
| First Trust Rising Dividend Achievers ETF | 2,513,261,581 | 1,266,554,327 | |
| First Trust Dorsey Wright Focus 5 ETF | 538,549,411 | 638,346,418 | |
| First Trust RBA American Industrial Renaissance® ETF | 99,291,932 | 4,822,221 | |
| First Trust Dorsey Wright Momentum & Dividend ETF | 23,773,473 | 27,682,516 | |
| First Trust Dorsey Wright International Focus 5 ETF | 27,340,348 | 12,119,660 | |
| First Trust Dorsey Wright Dynamic Focus 5 ETF | 48,039,048 | 104,798,292 |
| Asset Derivatives | Liability Derivatives | |||||||||
| Derivative Instrument | Risk Exposure | Statements of Assets and Liabilities Location | Value | Statements of Assets and Liabilities Location | Value | |||||
| Options | Equity Risk | — | $ — | Options written, at value | $ 1,469,681 | |||||
| Asset Derivatives | Liability Derivatives | |||||||||
| Derivative Instrument | Risk Exposure | Statements of Assets and Liabilities Location | Value | Statements of Assets and Liabilities Location | Value | |||||
| Options | Equity Risk | Options purchased, at value | $ 74,869 | Options written, at value | $ 156,220 | |||||
| Equity Risk | ||
| Statements of Operations Location | FTHI | FTLB |
| Net realized gain (loss) on Purchased options contracts | $— | $(196,530) |
| Net realized gain (loss) on Written options contracts | (2,593,486) | (102,554) |
| Net change in unrealized gain (loss) on Purchased options contracts | — | 20,047 |
| Net change in unrealized gain (loss) on Written options contracts | (310,103) | (78,445) |
| NOT FDIC INSURED | NOT BANK GUARANTEED | MAY LOSE VALUE |
FUND ACCOUNTANT &
TRANSFER AGENT
PUBLIC ACCOUNTING FIRM

Book 2
First Trust SMID Cap Rising Dividend Achievers ETF (SDVY)
First Trust Indxx Innovative Transaction & Process ETF (LEGR)
First Trust Nasdaq Artificial Intelligence and Robotics ETF (ROBT)
First Trust Dorsey Wright Momentum & Value ETF (DVLU)
First Trust Dorsey Wright Momentum & Low Volatility ETF (DVOL)
First Trust International Developed Capital Strength ETF (FICS)
For the Six Months Ended
March 31, 2021
| 2 | |
| 3 | |
| Fund Performance Overview | |
| 4 | |
| 6 | |
| 8 | |
| 10 | |
| 12 | |
| 14 | |
| 16 | |
| 17 | |
| Portfolio of Investments | |
| 19 | |
| 22 | |
| 25 | |
| 28 | |
| 30 | |
| 32 | |
| 34 | |
| 36 | |
| 38 | |
| 40 | |
| 46 | |
| 54 |


| Performance | ||||
| Average Annual Total Returns | Cumulative Total Returns | |||
| 6 Months Ended 3/31/21 | 1 Year Ended 3/31/21 | Inception (11/1/17) to 3/31/21 | Inception (11/1/17) to 3/31/21 | |
| Fund Performance | ||||
| NAV | 55.82% | 101.26% | 12.57% | 49.78% |
| Market Price | 56.12% | 101.90% | 12.65% | 50.15% |
| Index Performance | ||||
| Nasdaq US Small Mid Cap Rising Dividend Achievers™ Index | 56.50% | 102.77% | 13.28% | 53.01% |
| S&P 1000® Index | 45.16% | 86.95% | 12.96% | 51.53% |
| Sector Allocation | % of Total Investments |
| Financials | 29.3% |
| Industrials | 26.6 |
| Consumer Discretionary | 16.0 |
| Information Technology | 14.3 |
| Materials | 5.0 |
| Consumer Staples | 3.9 |
| Communication Services | 2.9 |
| Utilities | 1.0 |
| Energy | 1.0 |
| Total | 100.0% |
| Top Ten Holdings | % of Total Investments |
| Systemax, Inc. | 1.1% |
| TTEC Holdings, Inc. | 1.1 |
| Entegris, Inc. | 1.1 |
| UFP Industries, Inc. | 1.1 |
| PulteGroup, Inc. | 1.1 |
| Employers Holdings, Inc. | 1.1 |
| MGIC Investment Corp. | 1.1 |
| IDEX Corp. | 1.1 |
| SLM Corp. | 1.1 |
| Strategic Education, Inc. | 1.1 |
| Total | 11.0% |
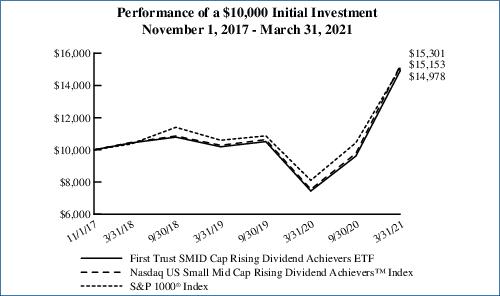
Performance figures assume reinvestment of all distributions and do not reflect the deduction of taxes that a shareholder would pay on Fund distributions or the redemption or sale of Fund shares. An index is a statistical composite that tracks a specified financial market or sector. Unlike the Fund, the indices do not actually hold a portfolio of securities and therefore do not incur the expenses incurred by the Fund. These expenses negatively impact the performance of the Fund. The Fund’s past performance does not predict future performance.
| Performance | ||||
| Average Annual Total Returns | Cumulative Total Returns | |||
| 6 Months Ended 3/31/21 | 1 Year Ended 3/31/21 | Inception (1/24/18) to 3/31/21 | Inception (1/24/18) to 3/31/21 | |
| Fund Performance | ||||
| NAV | 27.94% | 61.44% | 11.00% | 39.39% |
| Market Price | 28.52% | 62.39% | 11.11% | 39.81% |
| Index Performance | ||||
| Indxx Blockchain Index | 28.77% | 62.66% | 12.06% | 43.63% |
| S&P 500® Index | 19.07% | 56.35% | 13.31% | 48.79% |
| Sector Allocation | % of Total Long-Term Investments |
| Financials | 35.7% |
| Information Technology | 34.3 |
| Communication Services | 8.6 |
| Consumer Discretionary | 8.0 |
| Industrials | 5.7 |
| Utilities | 3.7 |
| Consumer Staples | 1.7 |
| Energy | 1.5 |
| Materials | 0.8 |
| Total | 100.0% |
| Top Ten Holdings | % of Total Long-Term Investments |
| Texas Instruments, Inc. | 1.4% |
| International Business Machines Corp. | 1.4 |
| Oracle Corp. | 1.4 |
| Swisscom AG | 1.4 |
| Deutsche Telekom AG | 1.4 |
| Accenture PLC, Class A | 1.4 |
| Tata Consultancy Services Ltd. | 1.4 |
| NVIDIA Corp. | 1.4 |
| AT&T, Inc. | 1.4 |
| China CITIC Bank Corp., Ltd., Class H | 1.4 |
| Total | 14.0% |

Performance figures assume reinvestment of all distributions and do not reflect the deduction of taxes that a shareholder would pay on Fund distributions or the redemption or sale of Fund shares. An index is a statistical composite that tracks a specified financial market or sector. Unlike the Fund, the indices do not actually hold a portfolio of securities and therefore do not incur the expenses incurred by the Fund. These expenses negatively impact the performance of the Fund. The Fund’s past performance does not predict future performance.
| Performance | ||||
| Average Annual Total Returns | Cumulative Total Returns | |||
| 6 Months Ended 3/31/21 | 1 Year Ended 3/31/21 | Inception (2/21/18) to 3/31/21 | Inception (2/21/18) to 3/31/21 | |
| Fund Performance | ||||
| NAV | 33.54% | 91.44% | 19.81% | 75.26% |
| Market Price | 33.97% | 91.47% | 19.95% | 75.87% |
| Index Performance | ||||
| Nasdaq CTA Artificial Intelligence and Robotics IndexSM | 33.92% | 92.31% | 20.71% | 79.36% |
| S&P 500® Index | 19.07% | 56.35% | 15.40% | 56.00% |
| Sector Allocation | % of Total Long-Term Investments |
| Information Technology | 61.4% |
| Industrials | 19.9 |
| Consumer Discretionary | 8.2 |
| Health Care | 8.2 |
| Communication Services | 1.9 |
| Real Estate | 0.4 |
| Total | 100.0% |
| Top Ten Holdings | % of Total Long-Term Investments |
| Hexagon AB, Class B | 2.3% |
| Elbit Systems Ltd. | 2.2 |
| Obic Co., Ltd. | 2.2 |
| AeroVironment, Inc. | 2.2 |
| Trimble, Inc. | 2.2 |
| Ciena Corp. | 2.2 |
| QinetiQ Group PLC | 2.2 |
| Dassault Systemes SE | 2.1 |
| Synopsys, Inc. | 2.1 |
| Gentex Corp. | 2.1 |
| Total | 21.8% |
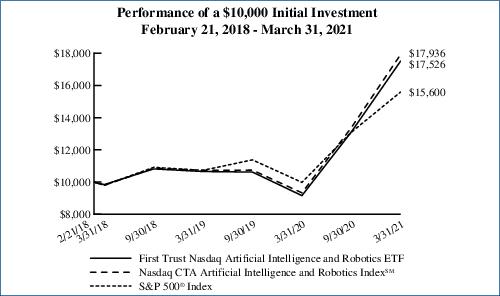
Performance figures assume reinvestment of all distributions and do not reflect the deduction of taxes that a shareholder would pay on Fund distributions or the redemption or sale of Fund shares. An index is a statistical composite that tracks a specified financial market or sector. Unlike the Fund, the indices do not actually hold a portfolio of securities and therefore do not incur the expenses incurred by the Fund. These expenses negatively impact the performance of the Fund. The Fund’s past performance does not predict future performance.
| Performance | ||||
| Average Annual Total Returns | Cumulative Total Returns | |||
| 6 Months Ended 3/31/21 | 1 Year Ended 3/31/21 | Inception (9/5/18) to 3/31/21 | Inception (9/5/18) to 3/31/21 | |
| Fund Performance | ||||
| NAV | 48.84% | 87.07% | 6.09% | 16.40% |
| Market Price | 48.97% | 87.09% | 6.13% | 16.50% |
| Index Performance | ||||
| Dorsey Wright Momentum Plus Value Index | 49.48% | 88.31% | 6.73% | 18.19% |
| S&P 500® Index | 19.07% | 56.35% | 15.38% | 44.39% |
| Sector Allocation | % of Total Investments |
| Financials | 42.9% |
| Consumer Discretionary | 24.6 |
| Industrials | 5.9 |
| Communication Services | 5.7 |
| Information Technology | 4.9 |
| Energy | 4.3 |
| Real Estate | 3.7 |
| Consumer Staples | 2.8 |
| Materials | 2.8 |
| Health Care | 2.4 |
| Total | 100.0% |
| Top Ten Holdings | % of Total Investments |
| Invesco, Ltd. | 3.4% |
| General Motors Co. | 3.3 |
| Mohawk Industries, Inc. | 3.1 |
| Santander Consumer USA Holdings, Inc. | 3.1 |
| L Brands, Inc. | 3.0 |
| Nexstar Media Group, Inc., Class A | 3.0 |
| AutoNation, Inc. | 2.9 |
| Bunge Ltd. | 2.8 |
| Whirlpool Corp. | 2.8 |
| WestRock Co. | 2.8 |
| Total | 30.2% |

Performance figures assume reinvestment of all distributions and do not reflect the deduction of taxes that a shareholder would pay on Fund distributions or the redemption or sale of Fund shares. An index is a statistical composite that tracks a specified financial market or sector. Unlike the Fund, the indices do not actually hold a portfolio of securities and therefore do not incur the expenses incurred by the Fund. These expenses negatively impact the performance of the Fund. The Fund’s past performance does not predict future performance.
| Performance | ||||
| Average Annual Total Returns | Cumulative Total Returns | |||
| 6 Months Ended 3/31/21 | 1 Year Ended 3/31/21 | Inception (9/5/18) to 3/31/21 | Inception (9/5/18) to 3/31/21 | |
| Fund Performance | ||||
| NAV | 10.02% | 38.18% | 9.89% | 27.38% |
| Market Price | 10.06% | 38.31% | 9.90% | 27.44% |
| Index Performance | ||||
| Dorsey Wright Momentum Plus Low Volatility Index | 10.34% | 39.15% | 10.61% | 29.54% |
| S&P 500® Index | 19.07% | 56.35% | 15.38% | 44.39% |
| Sector Allocation | % of Total Investments |
| Health Care | 25.2% |
| Industrials | 22.0 |
| Communication Services | 12.5 |
| Consumer Discretionary | 12.3 |
| Information Technology | 8.9 |
| Financials | 8.4 |
| Consumer Staples | 6.1 |
| Materials | 2.9 |
| Real Estate | 1.7 |
| Total | 100.0% |
| Top Ten Holdings | % of Total Investments |
| Alphabet, Inc., Class A | 3.1% |
| Garmin Ltd. | 2.9 |
| Dollar General Corp. | 2.9 |
| Watsco, Inc. | 2.9 |
| Toro (The) Co. | 2.8 |
| Target Corp. | 2.8 |
| Charter Communications, Inc., Class A | 2.8 |
| Morningstar, Inc. | 2.8 |
| Agilent Technologies, Inc. | 2.8 |
| Danaher Corp. | 2.8 |
| Total | 28.6% |
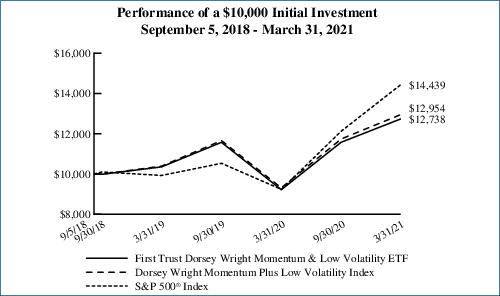
Performance figures assume reinvestment of all distributions and do not reflect the deduction of taxes that a shareholder would pay on Fund distributions or the redemption or sale of Fund shares. An index is a statistical composite that tracks a specified financial market or sector. Unlike the Fund, the indices do not actually hold a portfolio of securities and therefore do not incur the expenses incurred by the Fund. These expenses negatively impact the performance of the Fund. The Fund’s past performance does not predict future performance.
| Performance | ||
| Cumulative Total Returns | ||
| Inception (12/15/20) to 3/31/21 | ||
| Fund Performance | ||
| NAV | 4.42% | |
| Market Value | 4.82% | |
| Index Performance | ||
| The International Developed Capital Strength IndexSM | 5.23% | |
| MSCI World ex USA Index | 6.04% |
| Sector Allocation | % of Total Investments |
| Industrials | 27.2% |
| Information Technology | 17.1 |
| Health Care | 14.5 |
| Financials | 12.3 |
| Consumer Staples | 9.1 |
| Consumer Discretionary | 8.9 |
| Materials | 6.8 |
| Communication Services | 4.1 |
| Total | 100.0% |
| Top Ten Holdings | % of Total Investments |
| Epiroc AB, Class A | 2.9% |
| Tokyo Electron Ltd. | 2.8 |
| Sony Corp. | 2.7 |
| Kuehne + Nagel International AG | 2.6 |
| Partners Group Holding AG | 2.5 |
| BHP Group Ltd. | 2.5 |
| Logitech International S.A. | 2.4 |
| Atlas Copco AB, Class A | 2.4 |
| Constellation Software, Inc. | 2.4 |
| Hong Kong Exchanges & Clearing Ltd. | 2.4 |
| Total | 25.6% |

Performance figures assume reinvestment of all distributions and do not reflect the deduction of taxes that a shareholder would pay on Fund distributions or the redemption or sale of Fund shares. An index is a statistical composite that tracks a specified financial market or sector. Unlike the Fund, the indices do not actually hold a portfolio of securities and therefore do not incur the expenses incurred by the Fund. These expenses negatively impact the performance of the Fund. The Fund’s past performance does not predict future performance.
| Beginning Account Value October 1, 2020 | Ending Account Value March 31, 2021 | Annualized Expense Ratio Based on the Six-Month Period | Expenses Paid During the Six-Month Period (a) | |
| First Trust SMID Cap Rising Dividend Achievers ETF (SDVY) | ||||
| Actual | $1,000.00 | $1,558.20 | 0.60% | $3.83 |
| Hypothetical (5% return before expenses) | $1,000.00 | $1,021.94 | 0.60% | $3.02 |
| First Trust Indxx Innovative Transaction & Process ETF (LEGR) | ||||
| Actual | $1,000.00 | $1,279.40 | 0.65% | $3.69 |
| Hypothetical (5% return before expenses) | $1,000.00 | $1,021.69 | 0.65% | $3.28 |
| First Trust Nasdaq Artificial Intelligence and Robotics ETF (ROBT) | ||||
| Actual | $1,000.00 | $1,335.40 | 0.65% | $3.78 |
| Hypothetical (5% return before expenses) | $1,000.00 | $1,021.69 | 0.65% | $3.28 |
| First Trust Dorsey Wright Momentum & Value ETF (DVLU) | ||||
| Actual | $1,000.00 | $1,488.40 | 0.60% | $3.72 |
| Hypothetical (5% return before expenses) | $1,000.00 | $1,021.94 | 0.60% | $3.02 |
| First Trust Dorsey Wright Momentum & Low Volatility ETF (DVOL) | ||||
| Actual | $1,000.00 | $1,100.20 | 0.60% | $3.14 |
| Hypothetical (5% return before expenses) | $1,000.00 | $1,021.94 | 0.60% | $3.02 |
| Beginning Account Value December 15, 2020 (b) | Ending Account Value March 31, 2021 | Annualized Expense Ratio Based on the Number of Days In the Period | Expenses Paid During the Period December 15, 2020 (b) to March 31, 2021 (c) | |
| First Trust International Developed Capital Strength ETF (FICS) | ||||
| Actual | $1,000.00 | $1,044.20 | 0.70% | $2.10 |
| Hypothetical (5% return before expenses) | $1,000.00 | $1,021.44 | 0.70% | $3.53 |
| (a) | Expenses are equal to the annualized expense ratios as indicated in the table multiplied by the average account value over the period (October 1, 2020 through March 31, 2021), multiplied by 182/365 (to reflect the six-month period). |
| (b) | Inception date. |
| (c) | Actual expenses are equal to the annualized expense ratios as indicated in the table multiplied by the average account value over the period (December 15, 2020 through March 31, 2021), multiplied by 107/365. Hypothetical expenses are assumed for the most recent six-month period. |
| Shares | Description | Value | ||
| COMMON STOCKS – 99.6% | ||||
| Aerospace & Defense – 1.0% | ||||
| 1,874 | Huntington Ingalls Industries, Inc. | $385,763 | ||
| Air Freight & Logistics – 1.0% | ||||
| 3,580 | Expeditors International of Washington, Inc. | 385,530 | ||
| Auto Components – 1.0% | ||||
| 7,574 | BorgWarner, Inc. | 351,131 | ||
| Banks – 15.2% | ||||
| 15,935 | Associated Banc-Corp. | 340,053 | ||
| 8,404 | Cathay General Bancorp | 342,715 | ||
| 6,623 | Eagle Bancorp, Inc. | 352,410 | ||
| 4,686 | East West Bancorp, Inc. | 345,827 | ||
| 21,066 | First Horizon Corp. | 356,226 | ||
| 9,767 | Hilltop Holdings, Inc. | 333,348 | ||
| 17,838 | KeyCorp | 356,403 | ||
| 2,389 | M&T Bank Corp. | 362,196 | ||
| 5,065 | Popular, Inc. | 356,171 | ||
| 4,627 | Prosperity Bancshares, Inc. | 346,516 | ||
| 17,232 | Regions Financial Corp. | 356,013 | ||
| 1,540 | Signature Bank | 348,194 | ||
| 7,589 | Synovus Financial Corp. | 347,197 | ||
| 3,713 | Western Alliance Bancorp | 350,656 | ||
| 4,469 | Wintrust Financial Corp. | 338,750 | ||
| 6,426 | Zions Bancorp N.A. | 353,173 | ||
| 5,585,848 | ||||
| Building Products – 5.1% | ||||
| 5,441 | A.O. Smith Corp. | 367,866 | ||
| 3,540 | Advanced Drainage Systems, Inc. | 366,001 | ||
| 3,051 | Allegion PLC | 383,267 | ||
| 3,492 | Simpson Manufacturing Co., Inc. | 362,225 | ||
| 5,191 | UFP Industries, Inc. | 393,685 | ||
| 1,873,044 | ||||
| Capital Markets – 3.0% | ||||
| 2,655 | Evercore, Inc., Class A | 349,770 | ||
| 8,419 | Lazard Ltd., Class A | 366,311 | ||
| 3,076 | Raymond James Financial, Inc. | 376,994 | ||
| 1,093,075 | ||||
| Chemicals – 2.0% | ||||
| 2,497 | Celanese Corp. | 374,076 | ||
| 2,837 | Stepan Co. | 360,611 | ||
| 734,687 | ||||
| Commercial Services & Supplies – 2.0% | ||||
| 2,791 | Tetra Tech, Inc. | 378,795 | ||
| 1,613 | UniFirst Corp. | 360,844 | ||
| 739,639 | ||||
| Shares | Description | Value | ||
| Construction & Engineering – 1.0% | ||||
| 5,927 | Arcosa, Inc. | $385,789 | ||
| Consumer Finance – 2.1% | ||||
| 8,110 | Ally Financial, Inc. | 366,653 | ||
| 21,560 | SLM Corp. | 387,433 | ||
| 754,086 | ||||
| Diversified Consumer Services – 1.1% | ||||
| 4,210 | Strategic Education, Inc. | 386,941 | ||
| Diversified Financial Services – 0.9% | ||||
| 10,865 | Jefferies Financial Group, Inc. | 327,037 | ||
| Electric Utilities – 1.0% | ||||
| 9,940 | NRG Energy, Inc. | 375,036 | ||
| Electronic Equipment, Instruments & Components – 4.0% | ||||
| 4,596 | Cognex Corp. | 381,422 | ||
| 3,718 | Dolby Laboratories, Inc., Class A | 367,041 | ||
| 8,239 | Methode Electronics, Inc. | 345,873 | ||
| 14,921 | Vishay Intertechnology, Inc. | 359,298 | ||
| 1,453,634 | ||||
| Food & Staples Retailing – 1.0% | ||||
| 1,776 | Casey’s General Stores, Inc. | 383,954 | ||
| Food Products – 1.0% | ||||
| 98 | Seaboard Corp. | 361,619 | ||
| Household Durables – 5.2% | ||||
| 8,187 | KB Home | 380,941 | ||
| 6,426 | MDC Holdings, Inc. | 381,704 | ||
| 7,488 | PulteGroup, Inc. | 392,671 | ||
| 6,701 | Toll Brothers, Inc. | 380,148 | ||
| 1,683 | Whirlpool Corp. | 370,849 | ||
| 1,906,313 | ||||
| Industrial Conglomerates – 1.0% | ||||
| 2,340 | Carlisle Cos., Inc. | 385,117 | ||
| Insurance – 6.0% | ||||
| 3,144 | American Financial Group, Inc. | 358,730 | ||
| 3,437 | Cincinnati Financial Corp. | 354,320 | ||
| 14,320 | CNO Financial Group, Inc. | 347,833 | ||
| 9,083 | Employers Holdings, Inc. | 391,114 | ||
| 8,937 | Fidelity National Financial, Inc. | 363,379 | ||
| 6,816 | First American Financial Corp. | 386,126 | ||
| 2,201,502 | ||||
| Shares | Description | Value | ||
| COMMON STOCKS (Continued) | ||||
| Internet & Direct Marketing Retail – 1.0% | ||||
| 3,984 | Shutterstock, Inc. | $354,735 | ||
| IT Services – 4.1% | ||||
| 8,598 | Genpact Ltd. | 368,166 | ||
| 4,260 | MAXIMUS, Inc. | 379,311 | ||
| 3,945 | TTEC Holdings, Inc. | 396,275 | ||
| 14,905 | Western Union (The) Co. | 367,557 | ||
| 1,511,309 | ||||
| Leisure Products – 3.8% | ||||
| 8,662 | Acushnet Holdings Corp. | 358,001 | ||
| 3,666 | Brunswick Corp. | 349,626 | ||
| 2,539 | Johnson Outdoors, Inc., Class A | 362,442 | ||
| 5,140 | Sturm Ruger & Co., Inc. | 339,600 | ||
| 1,409,669 | ||||
| Machinery – 7.1% | ||||
| 2,540 | AGCO Corp. | 364,871 | ||
| 3,897 | Crane Co. | 365,967 | ||
| 5,249 | Graco, Inc. | 375,934 | ||
| 1,851 | IDEX Corp. | 387,451 | ||
| 3,061 | Oshkosh Corp. | 363,218 | ||
| 1,631 | Snap-on, Inc. | 376,337 | ||
| 3,554 | Toro (The) Co. | 366,560 | ||
| 2,600,338 | ||||
| Media – 1.9% | ||||
| 206 | Cable One, Inc. | 376,642 | ||
| 15,908 | EW Scripps (The) Co., Class A | 306,547 | ||
| 683,189 | ||||
| Metals & Mining – 2.0% | ||||
| 3,501 | Royal Gold, Inc. | 376,778 | ||
| 5,261 | Worthington Industries, Inc. | 352,960 | ||
| 729,738 | ||||
| Multiline Retail – 1.0% | ||||
| 5,197 | Big Lots, Inc. | 354,955 | ||
| Oil, Gas & Consumable Fuels – 1.0% | ||||
| 9,983 | World Fuel Services Corp. | 351,402 | ||
| Paper & Forest Products – 1.0% | ||||
| 6,787 | Louisiana-Pacific Corp. | 376,407 | ||
| Personal Products – 1.8% | ||||
| 1,508 | Medifast, Inc. | 319,425 | ||
| 6,808 | Nu Skin Enterprises, Inc., Class A | 360,075 | ||
| 679,500 | ||||
| Professional Services – 5.1% | ||||
| 4,610 | Booz Allen Hamilton Holding Corp. | 371,243 | ||
| Shares | Description | Value | ||
| Professional Services (Continued) | ||||
| 4,181 | Insperity, Inc. | $350,117 | ||
| 2,981 | Jacobs Engineering Group, Inc. | 385,354 | ||
| 7,026 | Kforce, Inc. | 376,594 | ||
| 4,808 | Robert Half International, Inc. | 375,360 | ||
| 1,858,668 | ||||
| Road & Rail – 1.0% | ||||
| 2,240 | Landstar System, Inc. | 369,734 | ||
| Semiconductors & Semiconductor Equipment – 4.1% | ||||
| 15,441 | Amkor Technology, Inc. | 366,106 | ||
| 2,150 | CMC Materials, Inc. | 380,099 | ||
| 3,538 | Entegris, Inc. | 395,548 | ||
| 1,586 | Universal Display Corp. | 375,517 | ||
| 1,517,270 | ||||
| Software – 1.0% | ||||
| 8,406 | Progress Software Corp. | 370,368 | ||
| Specialty Retail – 2.9% | ||||
| 4,593 | Dick’s Sporting Goods, Inc. | 349,757 | ||
| 6,083 | Rent-A-Center, Inc. | 350,746 | ||
| 2,104 | Williams-Sonoma, Inc. | 377,037 | ||
| 1,077,540 | ||||
| Technology Hardware, Storage & Peripherals – 1.0% | ||||
| 5,196 | NetApp, Inc. | 377,593 | ||
| Thrifts & Mortgage Finance – 2.1% | ||||
| 28,132 | MGIC Investment Corp. | 389,628 | ||
| 16,203 | Radian Group, Inc. | 376,720 | ||
| 766,348 | ||||
| Trading Companies & Distributors – 2.1% | ||||
| 6,161 | Boise Cascade Co. | 368,612 | ||
| 9,639 | Systemax, Inc. | 396,356 | ||
| 764,968 | ||||
| Wireless Telecommunication Services – 1.0% | ||||
| 16,191 | Telephone & Data Systems, Inc. | 371,745 | ||
| Total Investments – 99.6% | 36,595,221 | |||
| (Cost $34,496,249) (a) | ||||
| Net Other Assets and Liabilities – 0.4% | 152,072 | |||
| Net Assets – 100.0% | $36,747,293 | |||
| (a) | Aggregate cost for financial reporting purposes approximates the aggregate cost for federal income tax purposes. As of March 31, 2021, the aggregate gross unrealized appreciation for all investments in which there was an excess of value over tax cost was $2,328,832 and the aggregate gross unrealized depreciation for all investments in which there was an excess of tax cost over value was $229,860. The net unrealized appreciation was $2,098,972. |
| Total Value at 3/31/2021 | Level 1 Quoted Prices | Level 2 Significant Observable Inputs | Level 3 Significant Unobservable Inputs | |
| Common Stocks* | $ 36,595,221 | $ 36,595,221 | $ — | $ — |
| * | See Portfolio of Investments for industry breakout. |
| Shares | Description | Value | ||
| COMMON STOCKS – 99.9% | ||||
| Aerospace & Defense – 0.8% | ||||
| 5,640 | Airbus SE (a) | $638,518 | ||
| Automobiles – 2.5% | ||||
| 7,121 | Bayerische Motoren Werke AG | 738,795 | ||
| 7,755 | Daimler AG | 691,257 | ||
| 955 | Tesla, Inc. (a) | 637,873 | ||
| 2,067,925 | ||||
| Banks – 24.6% | ||||
| 64,093 | Axis Bank Ltd. (a) | 611,399 | ||
| 119,612 | Banco Bilbao Vizcaya Argentaria S.A. | 620,830 | ||
| 191,495 | Banco Santander S.A. | 650,568 | ||
| 1,807,890 | Bank of China Ltd., Class H | 688,357 | ||
| 1,128,023 | Bank of Communications Co., Ltd., Class H | 718,246 | ||
| 274,695 | Barclays PLC | 704,069 | ||
| 10,684 | BNP Paribas S.A. (a) | 650,011 | ||
| 183,554 | BOC Hong Kong Holdings Ltd. | 641,038 | ||
| 2,193,128 | China CITIC Bank Corp., Ltd., Class H | 1,114,323 | ||
| 1,293,006 | China Construction Bank Corp., Class H | 1,087,748 | ||
| 1,513,016 | China Everbright Bank Co., Ltd., Class H | 659,771 | ||
| 85,154 | China Merchants Bank Co., Ltd., Class H | 650,093 | ||
| 9,121 | Citigroup, Inc. | 663,553 | ||
| 31,700 | DBS Group Holdings Ltd. | 678,444 | ||
| 7,984 | HDFC Bank, Ltd., ADR (a) | 620,277 | ||
| 112,618 | HSBC Holdings PLC | 657,040 | ||
| 38,341 | ICICI Bank, Ltd., ADR (a) | 614,606 | ||
| 56,475 | ING Groep N.V., ADR | 690,689 | ||
| 4,334 | JPMorgan Chase & Co. | 659,765 | ||
| 9,689 | KBC Group N.V. | 704,462 | ||
| 24,826 | Kotak Mahindra Bank Ltd. (a) | 595,236 | ||
| 298,515 | Lloyds Banking Group PLC, ADR | 692,555 | ||
| 111,416 | Nordea Bank Abp | 1,098,960 | ||
| 862,550 | Postal Savings Bank of China Co., Ltd., Class H (b) (c) | 644,630 | ||
| 7,231 | Royal Bank of Canada | 666,711 | ||
| 87,296 | Skandinaviska Enskilda Banken AB, Class A | 1,064,031 | ||
| 61,837 | UniCredit S.p.A. | 653,589 | ||
| 35,094 | Westpac Banking Corp. | 650,664 | ||
| 20,151,665 | ||||
| Capital Markets – 7.1% | ||||
| 14,622 | Bank of New York Mellon (The) Corp. | 691,474 | ||
| 3,251 | CME Group, Inc. | 663,952 | ||
| 49,951 | Credit Suisse Group AG | 523,319 | ||
| 4,014 | Deutsche Boerse AG | 667,013 | ||
| Shares | Description | Value | ||
| Capital Markets (Continued) | ||||
| 1,955 | Goldman Sachs Group (The), Inc. | $639,285 | ||
| 6,197 | London Stock Exchange Group PLC | 592,897 | ||
| 4,640 | Nasdaq, Inc. | 684,215 | ||
| 550 | Partners Group Holding AG | 702,375 | ||
| 43,309 | UBS Group AG | 670,610 | ||
| 5,835,140 | ||||
| Communications Equipment – 3.0% | ||||
| 13,703 | Cisco Systems, Inc. | 708,582 | ||
| 163,092 | Nokia Oyj, ADR (a) (d) | 645,844 | ||
| 81,627 | Telefonaktiebolaget LM Ericsson, Class B | 1,079,986 | ||
| 2,434,412 | ||||
| Diversified Telecommunication Services – 6.2% | ||||
| 36,933 | AT&T, Inc. | 1,117,962 | ||
| 56,237 | Deutsche Telekom AG | 1,132,347 | ||
| 2,115 | Swisscom AG | 1,134,534 | ||
| 226,347 | Telefonica S.A., ADR (d) | 1,025,352 | ||
| 12,046 | Verizon Communications, Inc. | 700,475 | ||
| 5,110,670 | ||||
| Electric Utilities – 2.4% | ||||
| 25,775 | Endesa S.A. | 681,906 | ||
| 51,408 | Iberdrola S.A. | 662,243 | ||
| 8,351 | Verbund AG | 607,180 | ||
| 1,951,329 | ||||
| Electronic Equipment, Instruments & Components – 0.8% | ||||
| 1,106 | Samsung SDI Co., Ltd. | 644,983 | ||
| Food & Staples Retailing – 1.7% | ||||
| 19,138 | Kroger (The) Co. | 688,776 | ||
| 5,061 | Walmart, Inc. | 687,436 | ||
| 1,376,212 | ||||
| Household Durables – 1.7% | ||||
| 295,803 | Haier Smart Home Co., Ltd., Class D | 666,580 | ||
| 6,479 | Sony Corp., ADR | 686,839 | ||
| 1,353,419 | ||||
| Industrial Conglomerates – 1.4% | ||||
| 5,133 | Honeywell International, Inc. | 1,114,220 | ||
| Insurance – 4.0% | ||||
| 51,181 | AIA Group Ltd. | 620,827 | ||
| 2,615 | Allianz SE | 665,608 | ||
| Shares | Description | Value | ||
| COMMON STOCKS (Continued) | ||||
| Insurance (Continued) | ||||
| 13,928 | American International Group, Inc. | $643,613 | ||
| 24,623 | AXA S.A. | 660,813 | ||
| 62,086 | China Life Insurance Co., Ltd., ADR | 646,315 | ||
| 3,237,176 | ||||
| Interactive Media & Services – 1.1% | ||||
| 4,006 | Baidu, Inc., ADR (a) | 871,505 | ||
| Internet & Direct Marketing Retail – 3.8% | ||||
| 4,532 | Alibaba Group Holding Ltd., ADR (a) | 1,027,540 | ||
| 351 | Amazon.com, Inc. (a) | 1,086,022 | ||
| 12,121 | JD.com, Inc., ADR (a) | 1,022,164 | ||
| 3,135,726 | ||||
| IT Services – 14.7% | ||||
| 4,096 | Accenture PLC, Class A | 1,131,520 | ||
| 6,263 | Capgemini SE | 1,065,704 | ||
| 14,070 | Cognizant Technology Solutions Corp., Class A | 1,099,148 | ||
| 7,400 | Fujitsu Ltd. | 1,069,316 | ||
| 57,180 | Infosys Ltd., ADR | 1,070,410 | ||
| 8,581 | International Business Machines Corp. | 1,143,504 | ||
| 1,739 | Mastercard, Inc., Class A | 619,171 | ||
| 4,298 | PayPal Holdings, Inc. (a) | 1,043,726 | ||
| 25,906 | Tata Consultancy Services Ltd. | 1,125,991 | ||
| 2,956 | Visa, Inc., Class A | 625,874 | ||
| 162,109 | Wipro Ltd., ADR | 1,027,771 | ||
| 11,880 | Worldline S.A. (a) (b) (c) | 995,279 | ||
| 12,017,414 | ||||
| Marine – 1.3% | ||||
| 476 | AP Moller - Maersk A.S., Class B | 1,105,720 | ||
| Metals & Mining – 0.8% | ||||
| 18,395 | BHP Group Ltd. | 632,928 | ||
| Multi-Utilities – 1.3% | ||||
| 75,014 | Engie S.A. | 1,064,864 | ||
| Oil, Gas & Consumable Fuels – 1.5% | ||||
| 492,400 | PTT PCL | 646,029 | ||
| 15,221 | Royal Dutch Shell PLC, ADR, Class A | 596,815 | ||
| 1,242,844 | ||||
| Professional Services – 2.1% | ||||
| 14,500 | Recruit Holdings Co., Ltd. | 707,289 | ||
| Shares | Description | Value | ||
| Professional Services (Continued) | ||||
| 370 | SGS S.A. | $1,049,537 | ||
| 1,756,826 | ||||
| Semiconductors & Semiconductor Equipment – 10.2% | ||||
| 13,431 | Advanced Micro Devices, Inc. (a) | 1,054,334 | ||
| 16,463 | Infineon Technologies AG | 698,014 | ||
| 17,232 | Intel Corp. | 1,102,848 | ||
| 12,216 | Micron Technology, Inc. (a) | 1,077,573 | ||
| 2,099 | NVIDIA Corp. | 1,120,719 | ||
| 9,048 | Taiwan Semiconductor Manufacturing Co., Ltd., ADR | 1,070,197 | ||
| 6,236 | Texas Instruments, Inc. | 1,178,542 | ||
| 8,652 | Xilinx, Inc. | 1,071,983 | ||
| 8,374,210 | ||||
| Software – 4.8% | ||||
| 4,600 | Microsoft Corp. | 1,084,542 | ||
| 16,184 | Oracle Corp. | 1,135,631 | ||
| 3,097 | salesforce.com, Inc. (a) | 656,162 | ||
| 8,616 | SAP SE | 1,055,058 | ||
| 3,931,393 | ||||
| Technology Hardware, Storage & Peripherals – 0.8% | ||||
| 9,263 | Samsung Electronics Co., Ltd. | 666,232 | ||
| Wireless Telecommunication Services – 1.3% | ||||
| 81,900 | Softbank Corp. | 1,064,016 | ||
| Total Common Stocks | 81,779,347 | |||
| (Cost $68,312,801) | ||||
| MONEY MARKET FUNDS – 0.6% | ||||
| 508,657 | Goldman Sachs Financial Square Treasury Obligations Fund - Institutional Class - 0.02% (e) (f) | 508,657 | ||
| (Cost $508,657) | ||||
| Total Investments – 100.5% | 82,288,004 | |||
| (Cost $68,821,458) (g) | ||||
| Net Other Assets and Liabilities – (0.5)% | (411,218) | |||
| Net Assets – 100.0% | $81,876,786 | |||
| (a) | Non-income producing security. |
| (b) | This security may be resold to qualified foreign investors and foreign institutional buyers under Regulation S of the Securities Act of 1933, as amended (the “1933 Act”). |
| (c) | This security is exempt from registration upon resale under Rule 144A of the 1933 Act and may be resold in transactions exempt from registration, normally to qualified institutional buyers. This security is not restricted on the foreign exchange where it trades freely without any additional registration. As such, it does not require the additional disclosure required of restricted securities. |
| (d) | All or a portion of this security is on loan (see Note 2E - Securities Lending in the Notes to Financial Statements). The remaining contractual maturity of all of the securities lending transactions is overnight and continuous. The aggregate value of such securities is $469,701 and the total value of the collateral held by the Fund is $508,657. |
| (e) | Rate shown reflects yield as of March 31, 2021. |
| (f) | This security serves as collateral for securities on loan. |
| (g) | Aggregate cost for financial reporting purposes approximates the aggregate cost for federal income tax purposes. As of March 31, 2021, the aggregate gross unrealized appreciation for all investments in which there was an excess of value over tax cost was $14,014,672 and the aggregate gross unrealized depreciation for all investments in which there was an excess of tax cost over value was $548,126. The net unrealized appreciation was $13,466,546. |
| ADR | American Depositary Receipt |
| Total Value at 3/31/2021 | Level 1 Quoted Prices | Level 2 Significant Observable Inputs | Level 3 Significant Unobservable Inputs | |
| Common Stocks: | ||||
| Oil, Gas & Consumable Fuels | $ 1,242,844 | $ 596,815 | $ 646,029 | $ — |
| Other industry categories* | 80,536,503 | 80,536,503 | — | — |
| Money Market Funds | 508,657 | 508,657 | — | — |
| Total Investments | $ 82,288,004 | $ 81,641,975 | $ 646,029 | $— |
| * | See Portfolio of Investments for industry breakout. |
| Security Lending Agency Agreement | |
| Total gross amount presented on the Statements of Assets and Liabilities (1) | $469,701 |
| Non-cash Collateral (2) | (469,701) |
| Net Amount | $— |
| (1) | The amount presented on the Statements of Assets and Liabilities, which is included in “Investments, at value,” is not offset and is shown on a gross basis. |
| (2) | At March 31, 2021, the value of the collateral received from each borrower exceeded the value of the related securities loaned. This amount is disclosed on the Portfolio of Investments. |
| Currency Exposure Diversification | % of Total Investments |
| United States Dollar | 47.8% |
| Euro | 20.7 |
| Hong Kong Dollar | 8.3 |
| Swiss Franc | 5.0 |
| Japanese Yen | 3.5 |
| Indian Rupee | 2.8 |
| Swedish Krona | 2.6 |
| British Pound Sterling | 2.4 |
| South Korean Won | 1.6 |
| Australian Dollar | 1.6 |
| Danish Krone | 1.3 |
| Singapore Dollar | 0.8 |
| Canadian Dollar | 0.8 |
| Thai Baht | 0.8 |
| Total | 100.0% |
| Shares | Description | Value | ||
| COMMON STOCKS – 99.4% | ||||
| Aerospace & Defense – 6.6% | ||||
| 42,310 | AeroVironment, Inc. (a) | $4,910,499 | ||
| 35,823 | Elbit Systems Ltd. | 5,065,218 | ||
| 1,114,899 | QinetiQ Group PLC | 4,856,919 | ||
| 14,832,636 | ||||
| Auto Components – 4.3% | ||||
| 6,135 | Aptiv PLC (a) | 846,016 | ||
| 6,369 | Continental AG | 841,748 | ||
| 15,300 | Denso Corp. | 1,015,210 | ||
| 131,643 | Gentex Corp. | 4,695,706 | ||
| 10,917 | Magna International, Inc. | 961,133 | ||
| 51,673 | Veoneer, Inc. (a) | 1,264,955 | ||
| 9,624,768 | ||||
| Automobiles – 0.7% | ||||
| 20,080 | NIO, Inc., ADR (a) | 782,718 | ||
| 1,361 | Tesla, Inc. (a) | 909,053 | ||
| 1,691,771 | ||||
| Communications Equipment – 2.2% | ||||
| 89,276 | Ciena Corp. (a) | 4,885,183 | ||
| Electrical Equipment – 3.4% | ||||
| 49,215 | ABB Ltd. | 1,487,151 | ||
| 10,701 | Emerson Electric Co. | 965,444 | ||
| 62,400 | Mitsubishi Electric Corp. | 950,441 | ||
| 11,200 | Nidec Corp. | 1,358,970 | ||
| 5,837 | Rockwell Automation, Inc. | 1,549,373 | ||
| 9,523 | Schneider Electric SE | 1,454,583 | ||
| 7,765,962 | ||||
| Electronic Equipment, Instruments & Components – 11.3% | ||||
| 17,193 | Cognex Corp. | 1,426,847 | ||
| 140,998 | Delta Electronics, Inc. | 1,423,174 | ||
| 15,193 | FARO Technologies, Inc. (a) | 1,315,258 | ||
| 55,605 | Hexagon AB, Class B | 5,129,174 | ||
| 3,000 | Keyence Corp. | 1,362,023 | ||
| 31,981 | National Instruments Corp. | 1,381,099 | ||
| 17,600 | Omron Corp. | 1,373,348 | ||
| 370,600 | Topcon Corp. | 4,491,716 | ||
| 62,821 | Trimble, Inc. (a) | 4,886,846 | ||
| 75,000 | Yokogawa Electric Corp. | 1,380,447 | ||
| 2,843 | Zebra Technologies Corp., Class A (a) | 1,379,367 | ||
| 25,549,299 | ||||
| Entertainment – 0.4% | ||||
| 46,700 | DeNA Co., Ltd. | 911,857 | ||
| Health Care Equipment & Supplies – 4.5% | ||||
| 285,136 | Accuray, Inc. (a) | 1,411,423 | ||
| 1,252,021 | Asensus Surgical, Inc. (a) | 4,069,068 | ||
| Shares | Description | Value | ||
| Health Care Equipment & Supplies (Continued) | ||||
| 235,300 | CYBERDYNE, Inc. (a) (b) | $1,357,929 | ||
| 1,927 | Intuitive Surgical, Inc. (a) | 1,423,938 | ||
| 7,859 | Medtronic PLC | 928,384 | ||
| 3,788 | Stryker Corp. | 922,681 | ||
| 10,113,423 | ||||
| Health Care Technology – 0.8% | ||||
| 7,244 | Omnicell, Inc. (a) | 940,778 | ||
| 4,158 | Teladoc Health, Inc. (a) | 755,717 | ||
| 1,696,495 | ||||
| Household Durables – 2.0% | ||||
| 37,527 | iRobot Corp. (a) | 4,585,049 | ||
| Industrial Conglomerates – 0.4% | ||||
| 5,918 | Siemens AG | 971,605 | ||
| Interactive Media & Services – 1.1% | ||||
| 455 | Alphabet, Inc., Class A (a) | 938,446 | ||
| 3,243 | Baidu, Inc., ADR (a) | 705,515 | ||
| 2,754 | NAVER Corp. | 917,392 | ||
| 2,561,353 | ||||
| Internet & Direct Marketing Retail – 1.2% | ||||
| 3,866 | Alibaba Group Holding Ltd., ADR (a) | 876,538 | ||
| 297 | Amazon.com, Inc. (a) | 918,942 | ||
| 9,793 | JD.com, Inc., ADR (a) | 825,844 | ||
| 2,621,324 | ||||
| IT Services – 5.6% | ||||
| 9,727 | Akamai Technologies, Inc. (a) | 991,181 | ||
| 59,380 | Atos SE (a) | 4,632,115 | ||
| 10,393 | Endava PLC, ADR (a) | 880,183 | ||
| 7,729 | International Business Machines Corp. | 1,029,967 | ||
| 27,600 | Obic Co., Ltd. | 5,042,655 | ||
| 12,576,101 | ||||
| Life Sciences Tools & Services – 2.5% | ||||
| 10,600 | Illumina, Inc. (a) | 4,071,036 | ||
| 3,363 | Tecan Group AG | 1,492,295 | ||
| 5,563,331 | ||||
| Machinery – 9.4% | ||||
| 29,453 | ANDRITZ AG | 1,324,246 | ||
| 64,089 | ATS Automation Tooling Systems, Inc. (a) | 1,349,913 | ||
| 26,832 | Cargotec OYJ, Class B | 1,450,577 | ||
| 14,900 | Daifuku Co., Ltd. | 1,458,713 | ||
| 2,633 | Deere & Co. | 985,111 | ||
| Shares | Description | Value | ||
| COMMON STOCKS (Continued) | ||||
| Machinery (Continued) | ||||
| 35,754 | Duerr AG | $1,488,469 | ||
| 41,641 | ExOne (The) Co. (a) (b) | 1,305,862 | ||
| 5,700 | FANUC Corp. | 1,347,975 | ||
| 23,200 | Hirata Corp. | 1,437,363 | ||
| 9,622 | John Bean Technologies Corp. | 1,282,997 | ||
| 41,000 | Kawasaki Heavy Industries, Ltd. (a) | 1,015,326 | ||
| 9,747 | Proto Labs, Inc. (a) | 1,186,697 | ||
| 37,582 | SFA Engineering Corp. | 1,346,543 | ||
| 53,600 | Shibaura Machine Co., Ltd. | 1,353,010 | ||
| 42,051 | Valmet OYJ | 1,529,203 | ||
| 28,400 | Yaskawa Electric Corp. | 1,413,267 | ||
| 21,275,272 | ||||
| Pharmaceuticals – 0.4% | ||||
| 5,801 | Johnson & Johnson | 953,394 | ||
| Semiconductors & Semiconductor Equipment – 7.0% | ||||
| 10,877 | Advanced Micro Devices, Inc. (a) | 853,844 | ||
| 41,404 | Ambarella, Inc. (a) | 4,156,548 | ||
| 17,075 | Brooks Automation, Inc. | 1,394,174 | ||
| 15,124 | Intel Corp. | 967,936 | ||
| 4,563 | KLA Corp. | 1,507,615 | ||
| 2,588 | NVIDIA Corp. | 1,381,811 | ||
| 7,779 | NXP Semiconductors N.V. | 1,566,224 | ||
| 10,426 | QUALCOMM, Inc. | 1,382,383 | ||
| 11,275 | Taiwan Semiconductor Manufacturing Co., Ltd., ADR | 1,333,607 | ||
| 11,041 | Teradyne, Inc. | 1,343,469 | ||
| 15,887,611 | ||||
| Software – 33.9% | ||||
| 13,659 | ANSYS, Inc. (a) | 4,638,050 | ||
| 27,094 | Appian Corp. (a) | 3,602,147 | ||
| 3,331 | Autodesk, Inc. (a) | 923,187 | ||
| 5,857 | Avalara, Inc. (a) | 781,500 | ||
| 98,124 | AVEVA Group PLC | 4,629,068 | ||
| 463,435 | BlackBerry Ltd. (a) (b) | 3,906,757 | ||
| 217,591 | Blue Prism Group PLC (a) | 3,809,631 | ||
| 3,561,396 | BrainChip Holdings Ltd. (a) | 1,406,630 | ||
| 33,011 | Cadence Design Systems, Inc. (a) | 4,522,177 | ||
| 22,322 | Dassault Systemes SE | 4,774,687 | ||
| 93,600 | Dynatrace, Inc. (a) | 4,515,264 | ||
| 2,009 | Fair Isaac Corp. (a) | 976,474 | ||
| 3,956 | Microsoft Corp. | 932,706 | ||
| 10,202 | Netcompany Group A.S. (c) (d) | 971,428 | ||
| 20,291 | Nice Ltd., ADR (a) | 4,422,829 | ||
| 104,429 | Nuance Communications, Inc. (a) | 4,557,282 | ||
| 12,999 | Palo Alto Networks, Inc. (a) | 4,186,458 | ||
| 35,191 | Pegasystems, Inc. | 4,023,739 | ||
| 140,000 | PKSHA Technology, Inc. (a) | 3,784,331 | ||
| Shares | Description | Value | ||
| Software (Continued) | ||||
| 98,260 | PROS Holdings, Inc. (a) | $4,176,050 | ||
| 6,713 | PTC, Inc. (a) | 924,044 | ||
| 8,731 | ServiceNow, Inc. (a) | 4,366,460 | ||
| 18,994 | Synopsys, Inc. (a) | 4,706,333 | ||
| 39,389 | Veritone, Inc. (a) (b) | 944,548 | ||
| 76,481,780 | ||||
| Technology Hardware, Storage & Peripherals – 1.3% | ||||
| 39,620 | 3D Systems Corp. (a) | 1,087,173 | ||
| 12,518 | Samsung Electronics Co., Ltd. | 900,344 | ||
| 56,200 | Seiko Epson Corp. (b) | 913,615 | ||
| 2,901,132 | ||||
| Wireless Telecommunication Services – 0.4% | ||||
| 9,900 | SoftBank Group Corp. | 834,202 | ||
| Total Common Stocks | 224,283,548 | |||
| (Cost $181,362,589) | ||||
| REAL ESTATE INVESTMENT TRUSTS – 0.4% | ||||
| Equity Real Estate Investment Trusts – 0.4% | ||||
| 1,418 | Equinix, Inc. | 963,659 | ||
| (Cost $970,793) | ||||
| MONEY MARKET FUNDS – 1.7% | ||||
| 3,905,862 | Goldman Sachs Financial Square Treasury Obligations Fund - Institutional Class - 0.02% (e) (f) | 3,905,862 | ||
| (Cost $3,905,862) | ||||
| Total Investments – 101.5% | 229,153,069 | |||
| (Cost $186,239,244) (g) | ||||
| Net Other Assets and Liabilities – (1.5)% | (3,491,165) | |||
| Net Assets – 100.0% | $225,661,904 | |||
| (a) | Non-income producing security. |
| (b) | All or a portion of this security is on loan (see Note 2E - Securities Lending in the Notes to Financial Statements). The remaining contractual maturity of all of the securities lending transactions is overnight and continuous. The aggregate value of such securities is $3,745,706 and the total value of the collateral held by the Fund is $3,905,862. |
| (c) | This security may be resold to qualified foreign investors and foreign institutional buyers under Regulation S of the Securities Act of 1933, as amended (the “1933 Act”). |
| (d) | This security is exempt from registration upon resale under Rule 144A of the 1933 Act and may be resold in transactions exempt from registration, normally to qualified institutional buyers. This security is not restricted on the foreign exchange where it trades freely without any additional registration. As such, it does not require the additional disclosure required of restricted securities. |
| (e) | Rate shown reflects yield as of March 31, 2021. |
| (f) | This security serves as collateral for securities on loan. |
| (g) | Aggregate cost for financial reporting purposes approximates the aggregate cost for federal income tax purposes. As of March 31, 2021, the aggregate gross unrealized appreciation for all investments in which there was an excess of value over tax cost was $45,345,588 and the aggregate gross unrealized depreciation for all investments in which there was an excess of tax cost over value was $2,431,763. The net unrealized appreciation was $42,913,825. |
| ADR | American Depositary Receipt |
| Total Value at 3/31/2021 | Level 1 Quoted Prices | Level 2 Significant Observable Inputs | Level 3 Significant Unobservable Inputs | |
| Common Stocks* | $ 224,283,548 | $ 224,283,548 | $ — | $ — |
| Real Estate Investment Trusts* | 963,659 | 963,659 | — | — |
| Money Market Funds | 3,905,862 | 3,905,862 | — | — |
| Total Investments | $ 229,153,069 | $ 229,153,069 | $— | $— |
| * | See Portfolio of Investments for industry breakout. |
| Security Lending Agency Agreement | |
| Total gross amount presented on the Statements of Assets and Liabilities (1) | $3,745,706 |
| Non-cash Collateral (2) | (3,745,706) |
| Net Amount | $— |
| (1) | The amount presented on the Statements of Assets and Liabilities, which is included in “Investments, at value,” is not offset and is shown on a gross basis. |
| (2) | At March 31, 2021, the value of the collateral received from each borrower exceeded the value of the related securities loaned. This amount is disclosed on the Portfolio of Investments. |
| Currency Exposure Diversification | % of Total Investments |
| United States Dollar | 62.5% |
| Japanese Yen | 14.3 |
| Euro | 8.1 |
| British Pound Sterling | 5.8 |
| Swedish Krona | 2.2 |
| Israeli Shekel | 2.2 |
| South Korean Won | 1.4 |
| Swiss Franc | 1.3 |
| New Taiwan Dollar | 0.6 |
| Australian Dollar | 0.6 |
| Canadian Dollar | 0.6 |
| Danish Krone | 0.4 |
| Total | 100.0% |
| Shares | Description | Value | ||
| COMMON STOCKS – 96.4% | ||||
| Automobiles – 4.3% | ||||
| 11,551 | General Motors Co. (a) | $663,720 | ||
| 5,141 | Harley-Davidson, Inc. | 206,154 | ||
| 869,874 | ||||
| Banks – 19.9% | ||||
| 7,879 | Bank of America Corp. | 304,838 | ||
| 9,557 | Citizens Financial Group, Inc. | 421,942 | ||
| 3,894 | Comerica, Inc. | 279,356 | ||
| 3,187 | East West Bancorp, Inc. | 235,201 | ||
| 10,500 | Fifth Third Bancorp | 393,225 | ||
| 28,906 | First Horizon Corp. | 488,800 | ||
| 14,084 | Huntington Bancshares, Inc. | 221,400 | ||
| 1,383 | JPMorgan Chase & Co. | 210,534 | ||
| 21,588 | KeyCorp | 431,328 | ||
| 2,155 | PNC Financial Services Group (The), Inc. | 378,009 | ||
| 16,214 | Regions Financial Corp. | 334,981 | ||
| 5,352 | Zions Bancorp N.A. | 294,146 | ||
| 3,993,760 | ||||
| Biotechnology – 0.8% | ||||
| 975 | United Therapeutics Corp. (a) | 163,088 | ||
| Capital Markets – 6.6% | ||||
| 962 | Ameriprise Financial, Inc. | 223,617 | ||
| 26,690 | Invesco, Ltd. | 673,122 | ||
| 5,541 | Morgan Stanley | 430,314 | ||
| 1,327,053 | ||||
| Communications Equipment – 0.9% | ||||
| 3,180 | Ciena Corp. (a) | 174,010 | ||
| Construction & Engineering – 1.6% | ||||
| 3,622 | Quanta Services, Inc. | 318,664 | ||
| Consumer Finance – 7.5% | ||||
| 12,211 | Ally Financial, Inc. | 552,059 | ||
| 22,824 | Santander Consumer USA Holdings, Inc. | 617,618 | ||
| 8,076 | Synchrony Financial | 328,370 | ||
| 1,498,047 | ||||
| Containers & Packaging – 2.8% | ||||
| 10,674 | WestRock Co. | 555,582 | ||
| Distributors – 2.5% | ||||
| 11,920 | LKQ Corp. (a) | 504,574 | ||
| Food Products – 2.8% | ||||
| 7,040 | Bunge Ltd. | 558,061 | ||
| Health Care Providers & Services – 1.6% | ||||
| 1,461 | DaVita, Inc. (a) | 157,452 | ||
| Shares | Description | Value | ||
| Health Care Providers & Services (Continued) | ||||
| 704 | Molina Healthcare, Inc. (a) | $164,567 | ||
| 322,019 | ||||
| Household Durables – 5.9% | ||||
| 3,234 | Mohawk Industries, Inc. (a) | 621,930 | ||
| 2,522 | Whirlpool Corp. | 555,723 | ||
| 1,177,653 | ||||
| Insurance – 5.4% | ||||
| 11,885 | American International Group, Inc. | 549,206 | ||
| 10,580 | Athene Holding Ltd., Class A (a) | 533,232 | ||
| 1,082,438 | ||||
| IT Services – 2.6% | ||||
| 16,662 | DXC Technology Co. (a) | 520,854 | ||
| Leisure Products – 1.3% | ||||
| 2,647 | Brunswick Corp. | 252,444 | ||
| Machinery – 1.5% | ||||
| 1,338 | Snap-on, Inc. | 308,730 | ||
| Media – 5.7% | ||||
| 4,224 | Nexstar Media Group, Inc., Class A | 593,176 | ||
| 12,060 | ViacomCBS, Inc., Class B | 543,906 | ||
| 1,137,082 | ||||
| Oil, Gas & Consumable Fuels – 4.3% | ||||
| 17,141 | Devon Energy Corp. | 374,531 | ||
| 15,195 | Targa Resources Corp. | 482,441 | ||
| 856,972 | ||||
| Professional Services – 1.2% | ||||
| 1,874 | Jacobs Engineering Group, Inc. | 242,252 | ||
| Real Estate Management & Development – 2.7% | ||||
| 3,042 | Jones Lang LaSalle, Inc. (a) | 544,640 | ||
| Specialty Retail – 10.6% | ||||
| 6,339 | AutoNation, Inc. (a) | 590,922 | ||
| 9,842 | L Brands, Inc. (a) | 608,826 | ||
| 1,112 | Lithia Motors, Inc., Class A | 433,780 | ||
| 2,829 | Williams-Sonoma, Inc. | 506,957 | ||
| 2,140,485 | ||||
| Technology Hardware, Storage & Peripherals – 1.4% | ||||
| 3,798 | Seagate Technology PLC | 291,496 | ||
| Thrifts & Mortgage Finance – 1.0% | ||||
| 4,443 | Essent Group Ltd. | 210,998 | ||
| Shares | Description | Value | ||
| COMMON STOCKS (Continued) | ||||
| Trading Companies & Distributors – 1.5% | ||||
| 948 | United Rentals, Inc. (a) | $312,186 | ||
| Total Common Stocks | 19,362,962 | |||
| (Cost $15,870,122) | ||||
| REAL ESTATE INVESTMENT TRUSTS – 3.4% | ||||
| Equity Real Estate Investment Trusts – 1.0% | ||||
| 7,004 | VICI Properties, Inc. | 197,793 | ||
| Mortgage Real Estate Investment Trusts – 2.4% | ||||
| 19,651 | Starwood Property Trust, Inc. | 486,165 | ||
| Total Real Estate Investment Trusts | 683,958 | |||
| (Cost $506,907) | ||||
| Total Investments – 99.8% | 20,046,920 | |||
| (Cost $16,377,029) (b) | ||||
| Net Other Assets and Liabilities – 0.2% | 38,977 | |||
| Net Assets – 100.0% | $20,085,897 | |||
| (a) | Non-income producing security. |
| (b) | Aggregate cost for financial reporting purposes approximates the aggregate cost for federal income tax purposes. As of March 31, 2021, the aggregate gross unrealized appreciation for all investments in which there was an excess of value over tax cost was $3,688,808 and the aggregate gross unrealized depreciation for all investments in which there was an excess of tax cost over value was $18,917. The net unrealized appreciation was $3,669,891. |
| Total Value at 3/31/2021 | Level 1 Quoted Prices | Level 2 Significant Observable Inputs | Level 3 Significant Unobservable Inputs | |
| Common Stocks* | $ 19,362,962 | $ 19,362,962 | $ — | $ — |
| Real Estate Investment Trusts* | 683,958 | 683,958 | — | — |
| Total Investments | $ 20,046,920 | $ 20,046,920 | $— | $— |
| * | See Portfolio of Investments for industry breakout. |
| Shares | Description | Value | ||
| COMMON STOCKS – 98.3% | ||||
| Air Freight & Logistics – 1.5% | ||||
| 10,257 | United Parcel Service, Inc., Class B | $1,743,587 | ||
| Beverages – 4.4% | ||||
| 28,271 | Brown-Forman Corp., Class B | 1,949,851 | ||
| 33,922 | Monster Beverage Corp. (a) | 3,089,955 | ||
| 5,039,806 | ||||
| Biotechnology – 1.9% | ||||
| 12,670 | United Therapeutics Corp. (a) | 2,119,311 | ||
| Capital Markets – 6.5% | ||||
| 26,205 | Intercontinental Exchange, Inc. | 2,926,575 | ||
| 14,057 | Morningstar, Inc. | 3,163,387 | ||
| 9,113 | Nasdaq, Inc. | 1,343,803 | ||
| 7,433,765 | ||||
| Chemicals – 1.0% | ||||
| 1,550 | Sherwin-Williams (The) Co. | 1,143,915 | ||
| Containers & Packaging – 1.9% | ||||
| 25,062 | Ball Corp. | 2,123,754 | ||
| Electronic Equipment, Instruments & Components – 1.5% | ||||
| 25,523 | Amphenol Corp., Class A | 1,683,752 | ||
| Entertainment – 1.0% | ||||
| 6,290 | Take-Two Interactive Software, Inc. (a) | 1,111,443 | ||
| Health Care Equipment & Supplies – 8.6% | ||||
| 13,938 | Danaher Corp. | 3,137,165 | ||
| 3,195 | IDEXX Laboratories, Inc. (a) | 1,563,345 | ||
| 15,097 | STERIS PLC | 2,875,677 | ||
| 7,751 | West Pharmaceutical Services, Inc. | 2,184,077 | ||
| 9,760,264 | ||||
| Health Care Providers & Services – 1.1% | ||||
| 11,891 | DaVita, Inc. (a) | 1,281,493 | ||
| Household Durables – 2.9% | ||||
| 25,315 | Garmin Ltd. | 3,337,783 | ||
| Industrial Conglomerates – 1.5% | ||||
| 4,157 | Roper Technologies, Inc. | 1,676,684 | ||
| Insurance – 1.8% | ||||
| 16,711 | Arthur J. Gallagher & Co. | 2,085,031 | ||
| Interactive Media & Services – 3.1% | ||||
| 1,698 | Alphabet, Inc., Class A (a) | 3,502,159 | ||
| Shares | Description | Value | ||
| Internet & Direct Marketing Retail – 2.6% | ||||
| 937 | Amazon.com, Inc. (a) | $2,899,153 | ||
| IT Services – 4.7% | ||||
| 5,098 | Accenture PLC, Class A | 1,408,323 | ||
| 36,984 | Black Knight, Inc. (a) | 2,736,446 | ||
| 5,566 | Visa, Inc., Class A | 1,178,489 | ||
| 5,323,258 | ||||
| Life Sciences Tools & Services – 11.6% | ||||
| 24,786 | Agilent Technologies, Inc. | 3,151,292 | ||
| 7,851 | Bio-Techne Corp. | 2,998,532 | ||
| 1,512 | Mettler-Toledo International, Inc. (a) | 1,747,403 | ||
| 18,988 | PerkinElmer, Inc. | 2,435,971 | ||
| 6,167 | Thermo Fisher Scientific, Inc. | 2,814,496 | ||
| 13,147,694 | ||||
| Machinery – 7.9% | ||||
| 25,492 | Graco, Inc. | 1,825,737 | ||
| 13,160 | IDEX Corp. | 2,754,651 | ||
| 5,566 | Illinois Tool Works, Inc. | 1,232,981 | ||
| 30,829 | Toro (The) Co. | 3,179,703 | ||
| 8,993,072 | ||||
| Media – 6.8% | ||||
| 5,133 | Charter Communications, Inc., Class A (a) | 3,167,164 | ||
| 20,295 | Liberty Broadband Corp., Class A (a) | 2,945,819 | ||
| 31,380 | New York Times (The) Co., Class A | 1,588,455 | ||
| 7,701,438 | ||||
| Multiline Retail – 5.7% | ||||
| 16,309 | Dollar General Corp. | 3,304,529 | ||
| 16,012 | Target Corp. | 3,171,497 | ||
| 6,476,026 | ||||
| Personal Products – 1.7% | ||||
| 6,508 | Estee Lauder (The) Cos., Inc., Class A | 1,892,852 | ||
| Pharmaceuticals – 2.0% | ||||
| 14,643 | Zoetis, Inc. | 2,305,980 | ||
| Professional Services – 2.2% | ||||
| 14,177 | Verisk Analytics, Inc. | 2,504,934 | ||
| Road & Rail – 2.7% | ||||
| 9,274 | JB Hunt Transport Services, Inc. | 1,558,681 | ||
| 6,320 | Old Dominion Freight Line, Inc. | 1,519,391 | ||
| 3,078,072 | ||||
| Software – 2.8% | ||||
| 7,362 | Tyler Technologies, Inc. (a) | 3,125,390 | ||
| Shares | Description | Value | ||
| COMMON STOCKS (Continued) | ||||
| Textiles, Apparel & Luxury Goods – 1.1% | ||||
| 9,757 | NIKE, Inc., Class B | $1,296,608 | ||
| Trading Companies & Distributors – 6.2% | ||||
| 51,071 | Fastenal Co. | 2,567,850 | ||
| 12,464 | Watsco, Inc. | 3,249,988 | ||
| 3,045 | WW Grainger, Inc. | 1,220,832 | ||
| 7,038,670 | ||||
| Wireless Telecommunication Services – 1.6% | ||||
| 14,835 | T-Mobile US, Inc. (a) | 1,858,677 | ||
| Total Common Stocks | 111,684,571 | |||
| (Cost $100,422,850) | ||||
| REAL ESTATE INVESTMENT TRUSTS – 1.7% | ||||
| Equity Real Estate Investment Trusts – 1.7% | ||||
| 14,109 | Extra Space Storage, Inc. | 1,870,148 | ||
| (Cost $1,568,758) | ||||
| Total Investments – 100.0% | 113,554,719 | |||
| (Cost $101,991,608) (b) | ||||
| Net Other Assets and Liabilities – 0.0% | 9,139 | |||
| Net Assets – 100.0% | $113,563,858 | |||
| (a) | Non-income producing security. |
| (b) | Aggregate cost for financial reporting purposes approximates the aggregate cost for federal income tax purposes. As of March 31, 2021, the aggregate gross unrealized appreciation for all investments in which there was an excess of value over tax cost was $12,133,487 and the aggregate gross unrealized depreciation for all investments in which there was an excess of tax cost over value was $570,376. The net unrealized appreciation was $11,563,111. |
| Total Value at 3/31/2021 | Level 1 Quoted Prices | Level 2 Significant Observable Inputs | Level 3 Significant Unobservable Inputs | |
| Common Stocks* | $ 111,684,571 | $ 111,684,571 | $ — | $ — |
| Real Estate Investment Trusts* | 1,870,148 | 1,870,148 | — | — |
| Total Investments | $ 113,554,719 | $ 113,554,719 | $— | $— |
| * | See Portfolio of Investments for industry breakout. |
| Shares | Description | Value | ||
| COMMON STOCKS – 99.5% | ||||
| Beverages – 2.2% | ||||
| 1,682 | Diageo PLC | $69,321 | ||
| Biotechnology – 1.6% | ||||
| 156 | Genmab A.S. (a) | 51,326 | ||
| Capital Markets – 9.9% | ||||
| 336 | Deutsche Boerse AG | 55,834 | ||
| 504 | Euronext N.V. (b) (c) | 50,770 | ||
| 1,252 | Hong Kong Exchanges & Clearing Ltd. | 73,663 | ||
| 2,282 | Japan Exchange Group, Inc. | 53,482 | ||
| 61 | Partners Group Holding AG | 77,900 | ||
| 311,649 | ||||
| Chemicals – 2.1% | ||||
| 226 | Sika AG | 64,561 | ||
| Commercial Services & Supplies – 1.8% | ||||
| 8,281 | Rentokil Initial PLC (a) | 55,300 | ||
| Construction & Engineering – 4.3% | ||||
| 2,720 | Skanska AB, Class B | 68,207 | ||
| 1,768 | Taisei Corp. | 68,181 | ||
| 136,388 | ||||
| Diversified Financial Services – 2.3% | ||||
| 899 | Investor AB, Class B | 71,686 | ||
| Entertainment – 1.8% | ||||
| 104 | Nintendo Co., Ltd. | 58,056 | ||
| Food & Staples Retailing – 1.8% | ||||
| 1,712 | Alimentation Couche-Tard, Inc., Class B | 55,200 | ||
| Food Products – 1.7% | ||||
| 489 | Nestle S.A. | 54,501 | ||
| Health Care Equipment & Supplies – 1.9% | ||||
| 502 | Hoya Corp. | 58,961 | ||
| Household Durables – 2.7% | ||||
| 808 | Sony Corp. | 84,613 | ||
| Household Products – 1.7% | ||||
| 1,689 | Essity AB, Class B | 53,357 | ||
| IT Services – 6.3% | ||||
| 30 | Adyen N.V. (a) (b) (c) | 66,967 | ||
| 837 | CGI, Inc. (a) | 69,720 | ||
| 1,970 | Nomura Research Institute Ltd. | 60,937 | ||
| 197,624 | ||||
| Shares | Description | Value | ||
| Machinery – 8.9% | ||||
| 1,218 | Atlas Copco AB, Class A | $74,139 | ||
| 3,935 | Epiroc AB, Class A | 89,122 | ||
| 653 | Kone OYJ, Class B | 53,344 | ||
| 211 | Schindler Holding AG | 61,973 | ||
| 278,578 | ||||
| Marine – 2.6% | ||||
| 285 | Kuehne + Nagel International AG | 81,325 | ||
| Metals & Mining – 2.5% | ||||
| 2,249 | BHP Group Ltd. | 77,383 | ||
| Multiline Retail – 2.2% | ||||
| 1,691 | Wesfarmers Ltd. | 67,649 | ||
| Paper & Forest Products – 2.2% | ||||
| 2,754 | Mondi PLC | 70,238 | ||
| Personal Products – 1.7% | ||||
| 796 | Kao Corp. | 52,573 | ||
| Pharmaceuticals – 10.9% | ||||
| 543 | AstraZeneca PLC | 54,249 | ||
| 1,424 | Chugai Pharmaceutical Co., Ltd. | 57,732 | ||
| 811 | Novo Nordisk A.S., Class B | 54,945 | ||
| 169 | Roche Holding AG | 54,617 | ||
| 573 | Sanofi | 56,612 | ||
| 1,194 | Shionogi & Co., Ltd. | 64,183 | ||
| 342,338 | ||||
| Professional Services – 5.8% | ||||
| 22 | SGS S.A. | 62,405 | ||
| 698 | Thomson Reuters Corp. | 61,146 | ||
| 673 | Wolters Kluwer N.V. | 58,498 | ||
| 182,049 | ||||
| Road & Rail – 1.9% | ||||
| 517 | Canadian National Railway Co. | 59,998 | ||
| Semiconductors & Semiconductor Equipment – 2.8% | ||||
| 210 | Tokyo Electron Ltd. | 88,741 | ||
| Software – 5.5% | ||||
| 53 | Constellation Software, Inc. | 74,017 | ||
| 6,275 | Sage Group (The) PLC | 53,012 | ||
| 371 | SAP SE | 45,430 | ||
| 172,459 | ||||
| Technology Hardware, Storage & Peripherals – 2.4% | ||||
| 720 | Logitech International S.A. | 75,523 | ||
| Textiles, Apparel & Luxury Goods – 4.0% | ||||
| 62 | Hermes International | 68,636 | ||
| Shares | Description | Value | ||
| COMMON STOCKS (Continued) | ||||
| Textiles, Apparel & Luxury Goods (Continued) | ||||
| 84 | Kering S.A. | $57,981 | ||
| 126,617 | ||||
| Trading Companies & Distributors – 1.8% | ||||
| 1,746 | Bunzl PLC | 55,915 | ||
| Wireless Telecommunication Services – 2.2% | ||||
| 2,226 | KDDI Corp. | 68,253 | ||
| Total Investments – 99.5% | 3,122,182 | |||
| (Cost $3,010,241) (d) | ||||
| Net Other Assets and Liabilities – 0.5% | 15,111 | |||
| Net Assets – 100.0% | $3,137,293 | |||
| (a) | Non-income producing security. |
| (b) | This security may be resold to qualified foreign investors and foreign institutional buyers under Regulation S of the Securities Act of 1933, as amended (the “1933 Act”). |
| (c) | This security is exempt from registration upon resale under Rule 144A of the 1933 Act and may be resold in transactions exempt from registration, normally to qualified institutional buyers. This security is not restricted on the foreign exchange where it trades freely without any additional registration. As such, it does not require the additional disclosure required of restricted securities. |
| (d) | Aggregate cost for financial reporting purposes approximates the aggregate cost for federal income tax purposes. As of March 31, 2021, the aggregate gross unrealized appreciation for all investments in which there was an excess of value over tax cost was $176,489 and the aggregate gross unrealized depreciation for all investments in which there was an excess of tax cost over value was $64,548. The net unrealized appreciation was $111,941. |
| Total Value at 3/31/2021 | Level 1 Quoted Prices | Level 2 Significant Observable Inputs | Level 3 Significant Unobservable Inputs | |
| Common Stocks* | $ 3,122,182 | $ 3,122,182 | $ — | $ — |
| * | See Portfolio of Investments for industry breakout. |
| Currency Exposure Diversification | % of Total Investments |
| Japanese Yen | 22.9% |
| Swiss Franc | 17.1 |
| Euro | 16.5 |
| British Pound Sterling | 11.5 |
| Swedish Krona | 11.4 |
| Canadian Dollar | 10.2 |
| Australian Dollar | 4.6 |
| Danish Krone | 3.4 |
| Hong Kong Dollar | 2.4 |
| Total | 100.0% |
| First Trust SMID Cap Rising Dividend Achievers ETF (SDVY) | First Trust Indxx Innovative Transaction & Process ETF (LEGR) | First Trust Nasdaq Artificial Intelligence and Robotics ETF (ROBT) | |||
| ASSETS: | |||||
Investments, at value | $ 36,595,221 | $ 82,288,004 | $ 229,153,069 | ||
Cash | 144,544 | 1,582,298 | 186,519 | ||
Foreign currency | — | 432,256 | 52,047 | ||
| Receivables: | |||||
Dividends | 20,421 | 121,802 | 258,820 | ||
Fund shares sold | — | 357 | — | ||
Dividend reclaims | 87 | 56,311 | 41,972 | ||
Securities lending income | — | 593 | 2,119 | ||
Investment securities sold | — | 2,760 | 93 | ||
Total Assets | 36,760,273 | 84,484,381 | 229,694,639 | ||
| LIABILITIES: | |||||
| Payables: | |||||
Collateral for securities on loan | — | 508,657 | 3,905,862 | ||
Investment advisory fees | 12,980 | 42,291 | 126,873 | ||
Investment securities purchased | — | 2,008,921 | — | ||
Deferred foreign capital gains tax | — | 47,726 | — | ||
Total Liabilities | 12,980 | 2,607,595 | 4,032,735 | ||
NET ASSETS | $36,747,293 | $81,876,786 | $225,661,904 | ||
| NET ASSETS consist of: | |||||
Paid-in capital | $ 32,683,041 | $ 73,660,905 | $ 172,283,598 | ||
Par value | 13,000 | 20,500 | 43,500 | ||
Accumulated distributable earnings (loss) | 4,051,252 | 8,195,381 | 53,334,806 | ||
NET ASSETS | $36,747,293 | $81,876,786 | $225,661,904 | ||
NET ASSET VALUE, per share | $28.27 | $39.94 | $51.88 | ||
Number of shares outstanding (unlimited number of shares authorized, par value $0.01 per share) | 1,300,002 | 2,050,002 | 4,350,002 | ||
Investments, at cost | $34,496,249 | $68,821,458 | $186,239,244 | ||
Foreign currency, at cost (proceeds) | $— | $435,097 | $52,162 | ||
Securities on loan, at value | $— | $469,701 | $3,745,706 |
| First Trust Dorsey Wright Momentum & Value ETF (DVLU) | First Trust Dorsey Wright Momentum & Low Volatility ETF (DVOL) | First Trust International Developed Capital Strength ETF (FICS) | ||
| $ 20,046,920 | $ 113,554,719 | $ 3,122,182 | ||
| 18,817 | 44,522 | 1,276 | ||
| — | — | 4,348 | ||
| 28,912 | 22,832 | 9,971 | ||
| — | — | — | ||
| 566 | — | 1,358 | ||
| — | — | — | ||
| — | — | — | ||
| 20,095,215 | 113,622,073 | 3,139,135 | ||
| — | — | — | ||
| 9,318 | 58,215 | 1,842 | ||
| — | — | — | ||
| — | — | — | ||
| 9,318 | 58,215 | 1,842 | ||
| $ 20,085,897 | $ 113,563,858 | $ 3,137,293 | ||
| $ 21,215,284 | $ 106,335,856 | $ 3,008,030 | ||
| 9,000 | 46,000 | 1,000 | ||
| (1,138,387) | 7,182,002 | 128,263 | ||
| $ 20,085,897 | $ 113,563,858 | $ 3,137,293 | ||
| $22.32 | $24.69 | $31.37 | ||
| 900,002 | 4,600,002 | 100,002 | ||
| $16,377,029 | $101,991,608 | $3,010,241 | ||
| $— | $— | $4,361 | ||
| $— | $— | $— |
| First Trust SMID Cap Rising Dividend Achievers ETF (SDVY) | First Trust Indxx Innovative Transaction & Process ETF (LEGR) | First Trust Nasdaq Artificial Intelligence and Robotics ETF (ROBT) | ||||
| INVESTMENT INCOME: | ||||||
Dividends | $ 154,841 | $ 490,461 | $ 806,158 | |||
Interest | 1 | 4 | 17 | |||
Securities lending income (net of fees) | — | 3,290 | 35,730 | |||
Foreign withholding tax | (262) | (40,383) | (65,855) | |||
Other | 40 | — | 13 | |||
Total investment income | 154,620 | 453,372 | 776,063 | |||
| EXPENSES: | ||||||
Investment advisory fees | 43,501 | 183,132 | 596,506 | |||
Total expenses | 43,501 | 183,132 | 596,506 | |||
NET INVESTMENT INCOME (LOSS) | 111,119 | 270,240 | 179,557 | |||
| NET REALIZED AND UNREALIZED GAIN (LOSS): | ||||||
| Net realized gain (loss) on: | ||||||
Investments | (181,577) | (50,691) | (1,332,366) | |||
In-kind redemptions | 3,537,585 | — | 18,196,515 | |||
Foreign currency transactions | — | 1,070 | (3,368) | |||
Net realized gain (loss) | 3,356,008 | (49,621) | 16,860,781 | |||
| Net change in unrealized appreciation (depreciation) on: | ||||||
Investments | 2,345,712 | 11,914,765 | 25,300,678 | |||
Foreign currency translation | — | (4,224) | (3,126) | |||
Deferred foreign capital gains tax | — | (47,726) | — | |||
Net change in unrealized appreciation (depreciation) | 2,345,712 | 11,862,815 | 25,297,552 | |||
NET REALIZED AND UNREALIZED GAIN (LOSS) | 5,701,720 | 11,813,194 | 42,158,333 | |||
NET INCREASE (DECREASE) IN NET ASSETS RESULTING FROM OPERATIONS | $ 5,812,839 | $ 12,083,434 | $ 42,337,890 | |||
| (a) | Inception date is December 15, 2020, which is consistent with the commencement of investment operations and is the date the initial creation units were established. |
| First Trust Dorsey Wright Momentum & Value ETF (DVLU) | First Trust Dorsey Wright Momentum & Low Volatility ETF (DVOL) | First Trust International Developed Capital Strength ETF (FICS) (a) | |||
| $152,596 | $453,185 | $26,632 | |||
| 1 | 4 | — | |||
| — | — | — | |||
| — | — | (2,568) | |||
| — | 19 | — | |||
| 152,597 | 453,208 | 24,064 | |||
| 49,499 | 363,840 | 6,333 | |||
| 49,499 | 363,840 | 6,333 | |||
| 103,098 | 89,368 | 17,731 | |||
| (114,022) | (1,375,273) | 3,832 | |||
| 3,799,567 | 10,172,771 | — | |||
| — | — | (181) | |||
| 3,685,545 | 8,797,498 | 3,651 | |||
| 2,624,091 | 2,845,300 | 111,941 | |||
| — | — | (90) | |||
| — | — | — | |||
| 2,624,091 | 2,845,300 | 111,851 | |||
| 6,309,636 | 11,642,798 | 115,502 | |||
| $6,412,734 | $11,732,166 | $133,233 |
| First Trust SMID Cap Rising Dividend Achievers ETF (SDVY) | First Trust Indxx Innovative Transaction & Process ETF (LEGR) | ||||||
| Six Months Ended 3/31/2021 (Unaudited) | Year Ended 9/30/2020 | Six Months Ended 3/31/2021 (Unaudited) | Year Ended 9/30/2020 | ||||
| OPERATIONS: | |||||||
Net investment income (loss) | $ 111,119 | $ 162,281 | $ 270,240 | $ 453,430 | |||
Net realized gain (loss) | 3,356,008 | (1,190,794) | (49,621) | 37,362 | |||
Net change in unrealized appreciation (depreciation) | 2,345,712 | (179,227) | 11,862,815 | 2,606,926 | |||
Net increase (decrease) in net assets resulting from operations | 5,812,839 | (1,207,740) | 12,083,434 | 3,097,718 | |||
| DISTRIBUTIONS TO SHAREHOLDERS FROM: | |||||||
Investment operations | (112,980) | (168,006) | (192,295) | (485,781) | |||
| SHAREHOLDER TRANSACTIONS: | |||||||
Proceeds from shares sold | 38,648,279 | 5,819,163 | 27,705,341 | 7,989,565 | |||
Cost of shares redeemed | (17,650,745) | (1,521,463) | — | (9,369,188) | |||
Net increase (decrease) in net assets resulting from shareholder transactions | 20,997,534 | 4,297,700 | 27,705,341 | (1,379,623) | |||
Total increase (decrease) in net assets | 26,697,393 | 2,921,954 | 39,596,480 | 1,232,314 | |||
| NET ASSETS: | |||||||
Beginning of period | 10,049,900 | 7,127,946 | 42,280,306 | 41,047,992 | |||
End of period | $36,747,293 | $10,049,900 | $81,876,786 | $42,280,306 | |||
| CHANGES IN SHARES OUTSTANDING: | |||||||
Shares outstanding, beginning of period | 550,002 | 350,002 | 1,350,002 | 1,400,002 | |||
Shares sold | 1,400,000 | 300,000 | 700,000 | 250,000 | |||
Shares redeemed | (650,000) | (100,000) | — | (300,000) | |||
Shares outstanding, end of period | 1,300,002 | 550,002 | 2,050,002 | 1,350,002 | |||
| (a) | Inception date is December 15, 2020, which is consistent with the commencement of investment operations and is the date the initial creation units were established. |
| First Trust Nasdaq Artificial Intelligence and Robotics ETF (ROBT) | First Trust Dorsey Wright Momentum & Value ETF (DVLU) | First Trust Dorsey Wright Momentum & Low Volatility ETF (DVOL) | First Trust International Developed Capital Strength ETF (FICS) | |||||||||
| Six Months Ended 3/31/2021 (Unaudited) | Year Ended 9/30/2020 | Six Months Ended 3/31/2021 (Unaudited) | Year Ended 9/30/2020 | Six Months Ended 3/31/2021 (Unaudited) | Year Ended 9/30/2020 | Period Ended 3/31/2021 (Unaudited) (a) | ||||||
| $ 179,557 | $ 133,687 | $ 103,098 | $ 263,118 | $ 89,368 | $ 1,270,511 | $ 17,731 | ||||||
| 16,860,781 | 284,158 | 3,685,545 | (4,306,138) | 8,797,498 | (7,723,375) | 3,651 | ||||||
| 25,297,552 | 19,323,739 | 2,624,091 | 442,804 | 2,845,300 | 1,459,243 | 111,851 | ||||||
| 42,337,890 | 19,741,584 | 6,412,734 | (3,600,216) | 11,732,166 | (4,993,621) | 133,233 | ||||||
| (186,850) | (123,270) | (92,340) | (275,921) | (96,690) | (1,537,266) | (4,970) | ||||||
| 104,710,760 | 52,562,180 | 19,427,523 | 13,377,808 | 64,267,019 | 161,964,199 | 3,009,030 | ||||||
| (41,748,538) | (13,075,070) | (19,982,206) | (14,632,747) | (87,012,663) | (161,928,165) | — | ||||||
| 62,962,222 | 39,487,110 | (554,683) | (1,254,939) | (22,745,644) | 36,034 | 3,009,030 | ||||||
| 105,113,262 | 59,105,424 | 5,765,711 | (5,131,076) | (11,110,168) | (6,494,853) | 3,137,293 | ||||||
| 120,548,642 | 61,443,218 | 14,320,186 | 19,451,262 | 124,674,026 | 131,168,879 | — | ||||||
| $225,661,904 | $ 120,548,642 | $ 20,085,897 | $ 14,320,186 | $ 113,563,858 | $ 124,674,026 | $ 3,137,293 | ||||||
| 3,100,002 | 1,950,002 | 950,002 | 1,050,002 | 5,550,002 | 5,750,002 | — | ||||||
| 2,050,000 | 1,550,000 | 1,050,000 | 800,000 | 2,700,000 | 7,450,000 | 100,002 | ||||||
| (800,000) | (400,000) | (1,100,000) | (900,000) | (3,650,000) | (7,650,000) | — | ||||||
| 4,350,002 | 3,100,002 | 900,002 | 950,002 | 4,600,002 | 5,550,002 | 100,002 | ||||||
| Six Months Ended 3/31/2021 (Unaudited) | Year Ended | Period Ended 9/30/2018 (a) | |||||
| 9/30/2020 | 9/30/2019 | ||||||
Net asset value, beginning of period | $ 18.27 | $ 20.37 | $ 21.28 | $ 19.94 | |||
| Income from investment operations: | |||||||
Net investment income (loss) | 0.16 | 0.33 | 0.35 | 0.26 | |||
Net realized and unrealized gain (loss) | 10.01 | (2.08) | (0.92) | 1.31 | |||
Total from investment operations | 10.17 | (1.75) | (0.57) | 1.57 | |||
| Distributions paid to shareholders from: | |||||||
Net investment income | (0.17) | (0.35) | (0.34) | (0.23) | |||
Net asset value, end of period | $28.27 | $18.27 | $20.37 | $21.28 | |||
Total return (b) | 55.82% | (8.56)% | (2.59)% | 7.92% | |||
| Ratios to average net assets/supplemental data: | |||||||
Net assets, end of period (in 000’s) | $ 36,747 | $ 10,050 | $ 7,128 | $ 4,257 | |||
Ratio of total expenses to average net assets | 0.60% (c) | 0.60% | 0.60% | 0.60% (c) | |||
Ratio of net investment income (loss) to average net assets | 1.53% (c) | 1.83% | 1.95% | 1.49% (c) | |||
Portfolio turnover rate (d) | 98% | 76% | 78% | 72% | |||
| (a) | Inception date is November 1, 2017, which is consistent with the commencement of investment operations and is the date the initial creation units were established. |
| (b) | Total return is calculated assuming an initial investment made at the net asset value at the beginning of the period, reinvestment of all distributions at net asset value during the period, and redemption at net asset value on the last day of the period. The returns presented do not reflect the deduction of taxes that a shareholder would pay on Fund distributions or the redemption or sale of Fund shares. Total return is calculated for the time period presented and is not annualized for periods of less than a year. |
| (c) | Annualized. |
| (d) | Portfolio turnover is calculated for the time period presented and is not annualized for periods of less than a year and does not include securities received or delivered from processing creations or redemptions and in-kind transactions. |
| Six Months Ended 3/31/2021 (Unaudited) | Year Ended | Period Ended 9/30/2018 (a) | |||||
| 9/30/2020 | 9/30/2019 | ||||||
Net asset value, beginning of period | $ 31.32 | $ 29.32 | $ 30.31 | $ 29.99 | |||
| Income from investment operations: | |||||||
Net investment income (loss) | 0.17 | 0.35 | 0.59 | 0.26 | |||
Net realized and unrealized gain (loss) | 8.57 | 2.02 | (0.93) | 0.29 | |||
Total from investment operations | 8.74 | 2.37 | (0.34) | 0.55 | |||
| Distributions paid to shareholders from: | |||||||
Net investment income | (0.12) | (0.37) | (0.65) | (0.23) | |||
Net asset value, end of period | $39.94 | $31.32 | $29.32 | $30.31 | |||
Total return (b) | 27.94% | 8.13% | (1.08)% | 1.87% | |||
| Ratios to average net assets/supplemental data: | |||||||
Net assets, end of period (in 000’s) | $ 81,877 | $ 42,280 | $ 41,048 | $ 50,017 | |||
Ratio of total expenses to average net assets | 0.65% (c) | 0.65% | 0.65% | 0.65% (c) | |||
Ratio of net investment income (loss) to average net assets | 0.96% (c) | 1.12% | 1.95% | 1.63% (c) | |||
Portfolio turnover rate (d) | 24% | 25% | 35% | 53% | |||
| (a) | Inception date is January 24, 2018, which is consistent with the commencement of investment operations and is the date the initial creation units were established. |
| (b) | Total return is calculated assuming an initial investment made at the net asset value at the beginning of the period, reinvestment of all distributions at net asset value during the period, and redemption at net asset value on the last day of the period. The returns presented do not reflect the deduction of taxes that a shareholder would pay on Fund distributions or the redemption or sale of Fund shares. Total return is calculated for the time period presented and is not annualized for periods of less than a year. |
| (c) | Annualized. |
| (d) | Portfolio turnover is calculated for the time period presented and is not annualized for periods of less than a year and does not include securities received or delivered from processing creations or redemptions and in-kind transactions. |
| Six Months Ended 3/31/2021 (Unaudited) | Year Ended | Period Ended 9/30/2018 (a) | |||||
| 9/30/2020 | 9/30/2019 | ||||||
Net asset value, beginning of period | $ 38.89 | $ 31.51 | $ 32.23 | $ 29.91 | |||
| Income from investment operations: | |||||||
Net investment income (loss) | 0.04 | 0.04 | 0.17 | 0.12 | |||
Net realized and unrealized gain (loss) | 13.00 | 7.39 | (0.75) | 2.31 | |||
Total from investment operations | 13.04 | 7.43 | (0.58) | 2.43 | |||
| Distributions paid to shareholders from: | |||||||
Net investment income | (0.05) | (0.05) | (0.14) | (0.11) | |||
Net asset value, end of period | $51.88 | $38.89 | $31.51 | $32.23 | |||
Total return (b) | 33.54% | 23.60% | (1.81)% | 8.15% | |||
| Ratios to average net assets/supplemental data: | |||||||
Net assets, end of period (in 000’s) | $ 225,662 | $ 120,549 | $ 61,443 | $ 32,226 | |||
Ratio of total expenses to average net assets | 0.65% (c) | 0.65% | 0.65% | 0.65% (c) | |||
Ratio of net investment income (loss) to average net assets | 0.20% (c) | 0.15% | 0.68% | 0.62% (c) | |||
Portfolio turnover rate (d) | 20% | 34% | 43% | 67% | |||
| (a) | Inception date is February 21, 2018, which is consistent with the commencement of investment operations and is the date the initial creation units were established. |
| (b) | Total return is calculated assuming an initial investment made at the net asset value at the beginning of the period, reinvestment of all distributions at net asset value during the period, and redemption at net asset value on the last day of the period. The returns presented do not reflect the deduction of taxes that a shareholder would pay on Fund distributions or the redemption or sale of Fund shares. Total return is calculated for the time period presented and is not annualized for periods of less than a year. |
| (c) | Annualized. |
| (d) | Portfolio turnover is calculated for the time period presented and is not annualized for periods of less than a year and does not include securities received or delivered from processing creations or redemptions and in-kind transactions. |
| Six Months Ended 3/31/2021 (Unaudited) | Year Ended | Period Ended 9/30/2018 (a) | |||||
| 9/30/2020 | 9/30/2019 | ||||||
Net asset value, beginning of period | $ 15.07 | $ 18.52 | $ 19.46 | $ 19.98 | |||
| Income from investment operations: | |||||||
Net investment income (loss) | 0.11 | 0.25 | 0.33 | 0.02 | |||
Net realized and unrealized gain (loss) | 7.24 | (3.44) | (0.94) | (0.54) | |||
Total from investment operations | 7.35 | (3.19) | (0.61) | (0.52) | |||
| Distributions paid to shareholders from: | |||||||
Net investment income | (0.10) | (0.26) | (0.33) | — | |||
Net asset value, end of period | $22.32 | $15.07 | $18.52 | $19.46 | |||
Total return (b) | 48.84% | (17.19)% | (3.04)% | (2.60)% | |||
| Ratios to average net assets/supplemental data: | |||||||
Net assets, end of period (in 000’s) | $ 20,086 | $ 14,320 | $ 19,451 | $ 13,625 | |||
Ratio of total expenses to average net assets | 0.60% (c) | 0.60% | 0.60% | 0.60% (c) | |||
Ratio of net investment income (loss) to average net assets | 1.25% (c) | 1.56% | 2.01% | 3.61% (c) | |||
Portfolio turnover rate (d) | 131% | 205% | 152% | 0% | |||
| (a) | Inception date is September 5, 2018, which is consistent with the commencement of investment operations and is the date the initial creation units were established. |
| (b) | Total return is calculated assuming an initial investment made at the net asset value at the beginning of the period, reinvestment of all distributions at net asset value during the period, and redemption at net asset value on the last day of the period. The returns presented do not reflect the deduction of taxes that a shareholder would pay on Fund distributions or the redemption or sale of Fund shares. Total return is calculated for the time period presented and is not annualized for periods of less than a year. |
| (c) | Annualized. |
| (d) | Portfolio turnover is calculated for the time period presented and is not annualized for periods of less than a year and does not include securities received or delivered from processing creations or redemptions and in-kind transactions. |
| Six Months Ended 3/31/2021 (Unaudited) | Year Ended | Period Ended 9/30/2018 (a) | |||||
| 9/30/2020 | 9/30/2019 | ||||||
Net asset value, beginning of period | $ 22.46 | $ 22.81 | $ 19.94 | $ 19.97 | |||
| Income from investment operations: | |||||||
Net investment income (loss) | 0.02 | 0.28 | 0.29 | 0.03 | |||
Net realized and unrealized gain (loss) | 2.23 | (0.30) | 2.85 | (0.06) | |||
Total from investment operations | 2.25 | (0.02) | 3.14 | (0.03) | |||
| Distributions paid to shareholders from: | |||||||
Net investment income | (0.02) | (0.33) | (0.27) | — | |||
Net asset value, end of period | $24.69 | $22.46 | $22.81 | $19.94 | |||
Total return (b) | 10.02% | 0.03% | 15.93% | (0.15)% | |||
| Ratios to average net assets/supplemental data: | |||||||
Net assets, end of period (in 000’s) | $ 113,564 | $ 124,674 | $ 131,169 | $ 13,960 | |||
Ratio of total expenses to average net assets | 0.60% (c) | 0.60% | 0.60% | 0.60% (c) | |||
Ratio of net investment income (loss) to average net assets | 0.15% (c) | 1.21% | 2.37% | 3.81% (c) | |||
Portfolio turnover rate (d) | 59% | 187% | 81% | 0% | |||
| (a) | Inception date is September 5, 2018, which is consistent with the commencement of investment operations and is the date the initial creation units were established. |
| (b) | Total return is calculated assuming an initial investment made at the net asset value at the beginning of the period, reinvestment of all distributions at net asset value during the period, and redemption at net asset value on the last day of the period. The returns presented do not reflect the deduction of taxes that a shareholder would pay on Fund distributions or the redemption or sale of Fund shares. Total return is calculated for the time period presented and is not annualized for periods of less than a year. |
| (c) | Annualized. |
| (d) | Portfolio turnover is calculated for the time period presented and is not annualized for periods of less than a year and does not include securities received or delivered from processing creations or redemptions and in-kind transactions. |
| Period Ended 3/31/2021 (a) (Unaudited) | |
Net asset value, beginning of period | $ 30.09 |
| Income from investment operations: | |
Net investment income (loss) | 0.18 |
Net realized and unrealized gain (loss) | 1.15 |
Total from investment operations | 1.33 |
| Distributions paid to shareholders from: | |
Net investment income | (0.05) |
Net asset value, end of period | $31.37 |
Total return (b) | 4.42% |
| Ratios to average net assets/supplemental data: | |
Net assets, end of period (in 000’s) | $ 3,137 |
Ratio of total expenses to average net assets | 0.70% (c) |
Ratio of net investment income (loss) to average net assets | 1.96% (c) |
Portfolio turnover rate (d) | 0% |
| (a) | Inception date is December 15, 2020, which is consistent with the commencement of investment operations and is the date the initial creation units were established. |
| (b) | Total return is calculated assuming an initial investment made at the net asset value at the beginning of the period, reinvestment of all distributions at net asset value during the period, and redemption at net asset value on the last day of the period. The return presented does not reflect the deduction of taxes that a shareholder would pay on Fund distributions or the redemption or sale of Fund shares. Total return is calculated for the time period presented and is not annualized for periods of less than a year. |
| (c) | Annualized. |
| (d) | Portfolio turnover is calculated for the time period presented and is not annualized for periods of less than a year and does not include securities received or delivered from processing creations or redemptions and in-kind transactions. |
| Fund | Index |
| First Trust SMID Cap Rising Dividend Achievers ETF | Nasdaq US Small Mid Cap Rising Dividend AchieversTM Index |
| First Trust Indxx Innovative Transaction & Process ETF | Indxx Blockchain Index |
| First Trust Nasdaq Artificial Intelligence and Robotics ETF | Nasdaq CTA Artificial Intelligence and Robotics IndexSM |
| First Trust Dorsey Wright Momentum & Value ETF | Dorsey Wright Momentum Plus Value Index |
| First Trust Dorsey Wright Momentum & Low Volatility ETF | Dorsey Wright Momentum Plus Low Volatility Index |
| First Trust International Developed Capital Strength ETF | The International Developed Capital Strength IndexSM |
| 1) | the type of security; |
| 2) | the size of the holding; |
| 3) | the initial cost of the security; |
| 4) | transactions in comparable securities; |
| 5) | price quotes from dealers and/or third-party pricing services; |
| 6) | relationships among various securities; |
| 7) | information obtained by contacting the issuer, analysts, or the appropriate stock exchange; |
| 8) | an analysis of the issuer’s financial statements; and |
| 9) | the existence of merger proposals or tender offers that might affect the value of the security. |
| 1) | the value of similar foreign securities traded on other foreign markets; |
| 2) | ADR trading of similar securities; |
| 3) | closed-end fund or exchange-traded fund trading of similar securities; |
| 4) | foreign currency exchange activity; |
| 5) | the trading prices of financial products that are tied to baskets of foreign securities; |
| 6) | factors relating to the event that precipitated the pricing problem; |
| 7) | whether the event is likely to recur; and |
| 8) | whether the effects of the event are isolated or whether they affect entire markets, countries or regions. |
| • | Level 1 – Level 1 inputs are quoted prices in active markets for identical investments. An active market is a market in which transactions for the investment occur with sufficient frequency and volume to provide pricing information on an ongoing basis. |
| • | Level 2 – Level 2 inputs are observable inputs, either directly or indirectly, and include the following: |
| o | Quoted prices for similar investments in active markets. |
| o | Quoted prices for identical or similar investments in markets that are non-active. A non-active market is a market where there are few transactions for the investment, the prices are not current, or price quotations vary substantially either over time or among market makers, or in which little information is released publicly. |
| o | Inputs other than quoted prices that are observable for the investment (for example, interest rates and yield curves observable at commonly quoted intervals, volatilities, prepayment speeds, loss severities, credit risks, and default rates). |
| o | Inputs that are derived principally from or corroborated by observable market data by correlation or other means. |
| • | Level 3 – Level 3 inputs are unobservable inputs. Unobservable inputs may reflect the reporting entity’s own assumptions about the assumptions that market participants would use in pricing the investment. |
| Distributions paid from Ordinary Income | Distributions paid from Capital Gains | Distributions paid from Return of Capital | |||
First Trust SMID Cap Rising Dividend Achievers ETF | $ 168,006 | $ — | $ — | ||
First Trust Indxx Innovative Transaction & Process ETF | 485,781 | — | — | ||
First Trust Nasdaq Artificial Intelligence and Robotics ETF | 123,270 | — | — | ||
First Trust Dorsey Wright Momentum & Value ETF | 275,921 | — | — | ||
First Trust Dorsey Wright Momentum & Low Volatility ETF | 1,537,266 | — | — |
| Undistributed Ordinary Income | Accumulated Capital and Other Gain (Loss) | Net Unrealized Appreciation (Depreciation) | |||
First Trust SMID Cap Rising Dividend Achievers ETF | $ 6,823 | $ (1,261,317) | $ (394,113) | ||
First Trust Indxx Innovative Transaction & Process ETF | 27,536 | (4,530,587) | 807,293 | ||
First Trust Nasdaq Artificial Intelligence and Robotics ETF | 156,520 | (3,637,596) | 14,664,842 | ||
First Trust Dorsey Wright Momentum & Value ETF | 14,942 | (8,508,324) | 1,034,601 | ||
First Trust Dorsey Wright Momentum & Low Volatility ETF | 270 | (13,161,705) | 8,707,961 |
| Non-Expiring Capital Loss Carryforward | |
First Trust SMID Cap Rising Dividend Achievers ETF | $ 1,261,317 |
First Trust Indxx Innovative Transaction & Process ETF | 4,530,587 |
First Trust Nasdaq Artificial Intelligence and Robotics ETF | 3,637,596 |
First Trust Dorsey Wright Momentum & Value ETF | 8,508,324 |
First Trust Dorsey Wright Momentum & Low Volatility ETF | 13,161,705 |
| Purchases | Sales | ||
| First Trust SMID Cap Rising Dividend Achievers ETF | $ 15,515,918 | $ 15,533,472 | |
| First Trust Indxx Innovative Transaction & Process ETF | 15,700,391 | 12,378,905 | |
| First Trust Nasdaq Artificial Intelligence and Robotics ETF | 41,770,355 | 35,161,715 | |
| First Trust Dorsey Wright Momentum & Value ETF | 21,157,503 | 21,120,801 | |
| First Trust Dorsey Wright Momentum & Low Volatility ETF | 71,295,903 | 71,264,306 | |
| First Trust International Developed Capital Strength ETF | 25,690 | 4,183 | |
| Purchases | Sales | ||
| First Trust SMID Cap Rising Dividend Achievers ETF | $ 38,517,864 | $ 17,645,121 | |
| First Trust Indxx Innovative Transaction & Process ETF | 24,617,458 | — | |
| First Trust Nasdaq Artificial Intelligence and Robotics ETF | 97,408,825 | 41,406,226 | |
| First Trust Dorsey Wright Momentum & Value ETF | 19,413,493 | 20,020,175 | |
| First Trust Dorsey Wright Momentum & Low Volatility ETF | 64,245,063 | 86,958,494 | |
| First Trust International Developed Capital Strength ETF | 2,984,902 | — |
| NOT FDIC INSURED | NOT BANK GUARANTEED | MAY LOSE VALUE |
FUND ACCOUNTANT &
TRANSFER AGENT
PUBLIC ACCOUNTING FIRM
Item 2. Code of Ethics.
Not applicable.
Item 3. Audit Committee Financial Expert.
Not applicable.
Item 4. Principal Accountant Fees and Services.
Not applicable.
Item 5. Audit Committee of Listed Registrants.
Not applicable.
Items 6. Schedule of Investments.
Schedules of Investments in securities of unaffiliated issuers as of the close of the reporting period are included as part of the report to shareholders filed under Item 1 of this form.
Item 7. Disclosure of Proxy Voting Policies and Procedures for Closed-End Management Investment Companies.
Not applicable.
Item 8. Portfolio Managers of Closed-End Management Investment Companies.
Not applicable.
Item 9. Purchases of Equity Securities by Closed-End Management Investment Company and Affiliated Purchasers.
Not applicable.
Item 10. Submission of Matters to a Vote of Security Holders.
There have been no material changes to the procedures by which the shareholders may recommend nominees to the registrant’s board of directors, where those changes were implemented after the registrant last provided disclosure in response to the requirements of Item 407(c)(2)(iv) of Regulation S-K (17 CFR 229.407) (as required by Item 22(b)(15) of Schedule 14A (17 CFR 240.14a-101)), or this Item.
Item 11. Controls and Procedures.
| (a) | The registrant’s principal executive and principal financial officers, or persons performing similar functions, have concluded that the registrant’s disclosure controls and procedures (as defined in Rule 30a-3(c) under the Investment Company Act of 1940, as amended (the “1940 Act”) (17 CFR 270.30a-3 (c))) are effective, as of a date within 90 days of the filing date of the report that includes the disclosure required by this paragraph, based on their evaluation of these controls and procedures required by Rule 30a-3(b) under the 1940 Act (17 CFR 270.30a-3(b)) and Rules 13a-15(b) or 15d-15(b) under the Securities Exchange Act of 1934, as amended (17 CFR 240.13a-15(b) or 240.15d-15 (b)). |
| (b) | There were no changes in the registrant’s internal control over financial reporting (as defined in Rule 30a-3(d) under the 1940 Act (17 CFR 270.30a-3(d)) that occurred during the period covered by this report have materially affected, or are reasonably likely to materially affect, the registrant’s internal control over financial reporting. |
Item 12. Disclosure of Securities Lending Activities for Closed-End Management Investment Companies.
| (a) | Not applicable. |
| (b) | Not applicable. |
Item 13. Exhibits.
| (a)(1) | Not applicable. |
| (a)(2) | Certifications pursuant to Rule 30a-2(a) under the 1940 Act and Section 302 of the Sarbanes-Oxley Act of 2002 are attached hereto. |
| (a)(3) | Not applicable. |
| (a)(4) | Not applicable. |
| (b) | Certifications pursuant to Rule 30a-2(b) under the 1940 Act and Section 906 of the Sarbanes-Oxley Act of 2002 are attached hereto. |
SIGNATURES
Pursuant to the requirements of the Securities Exchange Act of 1934 and the Investment Company Act of 1940, the registrant has duly caused this report to be signed on its behalf by the undersigned, thereunto duly authorized.
| (registrant) | First Trust Exchange-Traded Fund VI |
| By (Signature and Title)* | /s/ James M. Dykas | |
| James M. Dykas, President and Chief Executive Officer (principal executive officer) |
| Date: | June 7, 2021 |
Pursuant to the requirements of the Securities Exchange Act of 1934 and the Investment Company Act of 1940, this report has been signed below by the following persons on behalf of the registrant and in the capacities and on the dates indicated.
| By (Signature and Title)* | /s/ James M. Dykas | |
| James M. Dykas, President and Chief Executive Officer (principal executive officer) |
| Date: | June 7, 2021 |
| By (Signature and Title)* | /s/ Donald P. Swade | |
| Donald P. Swade, Treasurer, Chief Financial Officer and Chief Accounting Officer (principal financial officer) |
| Date: | June 7, 2021 |
* Print the name and title of each signing officer under his or her signature.