united states
securities and exchange commission
washington, d.c. 20549
form n-csr
certified shareholder report of registered management
investment companies
Investment Company Act file number 811-22718
Two Roads Shared Trust
(Exact name of registrant as specified in charter)
225 Pictoria Drive, Suite 450 Cincinnati, OH 45246
(Address of principal executive offices) (Zip code)
Richard Malinowski, Gemini Fund Services, LLC.
80 Arkay Drive Suite 110, Hauppauge, NY 11788
(Name and address of agent for service)
Registrant's telephone number, including area code: 631-470-2619
Date of fiscal year end: 10/31
Date of reporting period:10/31/19
ITEM 1. REPORTS TO SHAREHOLDERS.
Redwood Funds
Beginning on January 1, 2021, as permitted by regulations adopted by the Securities and Exchange Commission, paper copies of the Funds’ shareholder reports like this one will no longer be sent by mail, unless you specifically request paper copies of the reports. Instead, the reports will be made available on the Funds’ website www.redwoodmutualfunds.com, and you will be notified by mail each time a report is posted and provided with a website link to access the report.
If you already elected to receive shareholder reports electronically, you will not be affected by this change and you need not take any action. You may elect to receive shareholder reports and other communications from the Funds electronically or to continue receiving paper copies of shareholder reports, which are available free of charge, by contacting your financial intermediary (such as a broker-dealer or bank) or, if you are a direct investor, by following the instructions included with paper Fund documents that have been mailed to you.
Dear Shareholder,
Redwood Managed Volatility Fund (RWDIX):5.10%*
| * | Class I – From November 1, 2018 through October 31, 2019 |
Source: Gemini Fund Services.
During the Redwood Managed Volatility Fund’s (the “Fund”) fiscal year, the Federal Reserve cut interest rates and yields subsequently fell. The U.S. 10-Year Treasury Bond Yield fell from a peak of 3.24% (11/8/18, Source: Bloomberg) to a low of 1.46% (9/3/19, Source: Bloomberg). The Fund posted modest gains of 5.10% (Source: Gemini) . The Fund’s performance was mainly driven by two factors. First, a volatile environment caused risk markets to sell off aggressively during Q4 of 2018 (10/1/18-12/31/18). Utilizing our quantitative risk-management process, the Fund sold risk-assets and moved predominantly into a defensive position. However, due to the same risk discipline, risk-assets were not reinvested until mid-January of 2019. The Fund in 2019 derived most of its total return from derivative products, such as total-return swaps and CDX, tied to U.S. corporate high-yield bond exposure, during what we believe to be favorable risk-adjusted environments.
Capital markets are infinitely complex. Every day, new information becomes available that changes the risk and return dynamic of any investment. In our view, capital markets are only a tool to capture opportunities in favorable risk-return dynamic, wherever they exist to work towards an investor’s long-term goal or objective. We do not attempt to forecast or suggest what may lie ahead. Instead, we utilize a disciplined, quantitative approach, aiming to minimize the subjectivity of investing.
The views in this report are those of the Fund’s management. This report contains certain forward-looking statements about factors that may affect the performance of the Fund in the future. These statements are based on the Fund’s management’s predictions and expectations concerning certain future events such as the performance of the economy as a whole and of specific industry sectors. Management believes these forward-looking statements are reasonable, although they are inherently uncertain and difficult to predict.
1
Dear Shareholder,
Redwood Managed Municipal Income Fund (RWMIX):9.62%*
| * | Class I – From November 1, 2018 through October 31, 2019 |
Source: Gemini Fund Services.
During the Redwood Managed Income Municipal Fund’s (the “Fund”) fiscal year, the Federal Reserve cut interest rates and yields subsequently fell. The U.S. 10-Year Treasury Bond Yield fell from a peak of 3.24% (11/8/18, Source: Bloomberg) to a low of 1.46% (9/3/19, Source: Bloomberg).
The Fund posted gains of 9.62% (Source: Gemini). During the period, the Fund was mostly invested in high-yield municipal bond funds to derive exposure to the high-yield municipal bond market. High Yield Municipals, historically longer in duration, initially experienced some headwinds when yields initially spiked during Q4 of 2018 (10/1/18-12/31/18) . However, municipals subsequently benefitted from some tailwind due to the unexpected drop-in yields in 2019.
Capital markets are infinitely complex. Every day, new information becomes available that changes the risk and return dynamic of any investment. In our view, capital markets are only a tool to capture opportunities in favorable risk-return dynamic, wherever they exist to work towards an investor’s long-term goal or objective. We do not attempt to forecast or suggest what may lie ahead. Instead, we utilize a quantitative approach, aiming to minimize the subjectivity of investing.
The views in this report are those of the Fund’s management. This report contains certain forward-looking statements about factors that may affect the performance of the Fund in the future. These statements are based on the Fund’s management’s predictions and expectations concerning certain future events such as the performance of the economy as a whole and of specific industry sectors. Management believes these forward-looking statements are reasonable, although they are inherently uncertain and difficult to predict.
2
Dear Shareholder,
Redwood AlphaFactor® Tactical Core Fund (RWTIX):6.00%*
| * | Class I – From November 1, 2018 through October 31, 2019 |
Source: Gemini Fund Services.
During the Redwood AlphaFactor® Tactical Core Fund’s (the “Fund”) fiscal year, U.S. large-cap equities, represented by the S&P 500 Index** sold-off aggressively during Q4 of 2018 (10/1/18-12/31/18), at one point reaching a drawdown of almost -20%. The volatility spike put pressure on all risk assets. However, during 2019, equities recovered back towards highs, potentially due to the Federal Reserve reversing course by cutting short term interest rates, stronger than expected economic data and corporate earnings.
The Fund posted gains of 6.00% (Source: Gemini). During most of the period, the Fund was invested in a portfolio of stocks following its quantitative methodology. However, the Fund went into a defensive, or risk-off position, during the end of 2018 as a response to our quantitative, tactical risk management process that incorporates technical and fundamental factors suggesting a higher risk environment. The defensive position achieved the objective of helping to limit drawdown, with peak to trough drawdown less than -13% vs. the S&P 500 Index’s peak to trough drawdown of greater than -19%. However, in 2019, the Fund did not reinvest back into equities until mid -February, thereby missing a portion of the recovery in equities. While invested in equities, the Fund’s under -exposure to factors such as growth and size contributed to equity underperformance versus the S&P 500 Index, which returned [14.33%] for the year ended October 31, 2019. This short term underperformance does not alter the larger body of research by Redwood and others that indicates growth and large cap size factors do not add value over longer periods of time on a risk adjusted basis versus the opposite factor exposures of value and smaller cap size. The Fund will continue to implement its disciplined quantitative stock selection and risk management processes based on the larger body of research.
Capital markets are infinitely complex. Every day, new information becomes available that changes the risk and return dynamic of any investment. In our view, capital markets are only a tool to capture opportunities in favorable risk-return dynamic, wherever they exist to work towards an investor’s long-term goal or objective. We do not attempt to forecast or suggest what may lie ahead. Instead, we utilize a quantitative approach, aiming to minimize the subjectivity of investing.
| ** | Standard and Poor’s 500 Total Return Index is a capitalization-weighted index of 500 stocks. The index is designed to measure performance of the broad domestic economy through changes in the aggregate market value of 500 stocks representing all major industries. Investors cannot invest directly in an index or benchmark. Index returns are gross of any fees, brokerage commissions or other expenses of investing. |
The views in this report are those of the Fund’s management. This report contains certain forward-looking statements about factors that may affect the performance of the Fund in the future. These statements are based on the Fund’s management’s predictions and expectations concerning certain future events such as the performance of the economy as a whole and of specific industry sectors. Management believes these forward-looking statements are reasonable, although they are inherently uncertain and difficult to predict.
3
Dear Shareholder,
Redwood AlphaFactor® Tactical International Fund (RWIIX):0.04%*
| * | Class I – From November 1, 2018 through October 31, 2018 |
Source: Gemini Fund Services.
During the Redwood AlphaFactor® Tactical International Fund’s (the “Fund”) fiscal year, international equities, represented by the MSCI All Country World ex-US Index** (MSCI ACWI ex-US) sold-off aggressively during Q4 of 2018 (10/1/18-12/31/18), at one point reaching a drawdown of almost -20%. The volatility spike put pressure on all risk assets. Equities, however recovered back towards highs, potentially due to the Federal Reserve reversing course by cutting short term interest rates, stronger than expected economic data, and corporate earnings.
The Fund posted gains of 0.04% (Source: Gemini). During most of the period, the fund was invested in a portfolio of international stock exposure following its quantitative methodology. However, the fund went into a defensive, or risk-off, position, during the end of 2018 as a response to our quantitative, tactical risk management process that incorporates technical and fundamental factors suggesting a higher risk environment. The defensive position achieved the objective of helping to limit drawdown, with peak to trough drawdown less than -1% vs. the MSCI ACWI ex US peak to trough drawdown of greater than - 13%, the Fund did not reinvest back into equities until mid-February, missing a portion of the recovery in equities. International equities also lagged U.S. equities – perhaps a function of global trade risk. The Fund will continue to implement its disciplined quantitative stock selection and risk management process.
Capital markets are infinitely complex. Every day, new information becomes available that changes the risk and return dynamic of any investment. In our view, capital markets are only a tool to capture opportunities in favorable risk-return dynamic, wherever they exist to work towards an investor’s long-term goal or objective. We do not attempt to forecast or suggest what may lie ahead. Instead, we utilize a quantitative approach, aiming to minimize the subjectivity of investing.
| ** | The Morgan Stanley Capital International All Country World Index Ex-U.S. (MSCI ACWI Ex-U.S.) is a market-capitalization-weighted index maintained by Morgan Stanley Capital International (MSCI). It is designed to provide a broad measure of stock performance throughout the world, with the exception of U.S.-based companies. The MSCI All Country World Index Ex-U.S. includes both developed and emerging markets. Investors cannot invest directly in an index or benchmark. Index returns are gross of any fees, brokerage commissions or other expenses of investing. |
The views in this report are those of the Fund’s management. This report contains certain forward-looking statements about factors that may affect the performance of the Fund in the future. These statements are based on the Fund’s management’s predictions and expectations concerning certain future events such as the performance of the economy as a whole and of specific industry sectors. Management believes these forward-looking statements are reasonable, although they are inherently uncertain and difficult to predict.
4
Dear Shareholder,
Redwood Systematic Macro Trend (“SMarT”) Fund (RWSIX):4.16%*
| * | Class I – From November 1, 2018 through October 31, 2019 |
Source: Gemini Fund Services.
During the Redwood Systematic Macro Trend (“SMarT”) Fund’s (the “Fund”) fiscal year, U.S. large-cap equities, represented by the S&P 500 Index** sold-off aggressively during Q4 of 2018 (10/1/18-12/31/18), at one point reaching a drawdown of almost -20%. The volatility spike put pressure on all risk assets. Equities, however recovered back towards highs, potentially due to the Federal Reserve reversing course by cutting short term interest rates, stronger than expected economic data, and corporate earnings.
The Fund posted gains of 4.16% (Source: Gemini). During most of the period, the Fund was invested in a combination of exposures including U.S. equity, convertible bond, preferred stock, high yield corporate bond, and international stock. However, the Fund went into a defensive, or risk-off position, during the end of 2018 as a response to our quantitative, tactical risk management process that incorporates technical and fundamental factors suggesting a higher risk environment. The defensive position achieved the objective of helping to limit drawdown, with peak to trough drawdown less than -7% vs. the S&P 500 Index peak to trough drawdown of greater than -19%, the Fund did not reinvest in risk assets until mid-February, missing a portion of the recovery in equities. The Fund will continue to implement its disciplined quantitative security selection and risk management process.
Capital markets are infinitely complex. Every day, new information becomes available that changes the risk and return dynamic of any investment. In our view, capital markets are only a tool to capture opportunities in favorable risk-return dynamic, wherever they exist to work towards an investor’s long-term goal or objective. We do not attempt to forecast or suggest what may lie ahead. Instead, we utilize a quantitative approach, aiming to minimize the subjectivity of investing.
| ** | Standard and Poor’s 500 Total Return Index is a capitalization-weighted index of 500 stocks. The index is designed to measure performance of the broad domestic economy through changes in the aggregate market value of 500 stocks representing all major industries. Investors cannot invest directly in an index or benchmark. Index returns are gross of any fees, brokerage commissions or other expenses of investing. |
The views in this report are those of the Fund’s management. This report contains certain forward-looking statements about factors that may affect the performance of the Fund in the future. These statements are based on the Fund’s management’s predictions and expectations concerning certain future events such as the performance of the economy as a whole and of specific industry sectors. Management believes these forward-looking statements are reasonable, although they are inherently uncertain and difficult to predict.
5
Dear Shareholder,
Redwood Activist Leaders™ (RWLIX):4.02%*
| * | Class I – From November 1, 2018 through October 31, 2019 |
Source: Gemini Fund Services.
During the Redwood Activist Leaders™ Fund’s (the “Fund”) fiscal year, U.S. large-cap equities, represented by the S&P 500 Index** sold-off aggressively during Q4 of 2018 (10/1/18-12/31/18) at one point reaching a drawdown of almost -20% in 2018. The volatility spike put pressure on all risk assets. Equities, however, recovered back towards highs, potentially due to the Federal Reserve reversing course by cutting short term interest rates, stronger than expected economic data, and corporate earnings.
The Fund posted gains of 4.02% (Source: Gemini). During most of the period, the fund was invested in a portfolio of stocks based on its quantitative process rooted in 13D filings. The Fund is expected to have higher volatility than U.S. large cap indices, as the goal is to invest in stocks subject to activism, which may impact a stock’s volatility on the upside, and the downside. The strategy also has, on average, a lower market capitalization, and a portfolio composition that reflects value factors more than growth factors relative to the S&P 500 Index.
Capital markets are infinitely complex. Every day, new information becomes available that changes the risk and return dynamic of any investment. In our view, capital markets are only a tool to capture opportunities in favorable risk-return dynamic, wherever they exist to work towards an investor’s long-term goal or objective. We do not attempt to forecast or suggest what may lie ahead. Instead, we utilize a quantitative approach, aiming to minimize the subjectivity of investing.
| ** | Standard and Poor’s 500 Total Return Index is a capitalization-weighted index of 500 stocks. The index is designed to measure performance of the broad domestic economy through changes in the aggregate market value of 500 stocks representing all major industries. Investors cannot invest directly in an index or benchmark. Index returns are gross of any fees, brokerage commissions or other expenses of investing. |
The views in this report are those of the Fund’s management. This report contains certain forward-looking statements about factors that may affect the performance of the Fund in the future. These statements are based on the Fund’s management’s predictions and expectations concerning certain future events such as the performance of the economy as a whole and of specific industry sectors. Management believes these forward-looking statements are reasonable, although they are inherently uncertain and difficult to predict.
3911-NLD-12/12/2019
6
| Redwood Managed Volatility Fund |
| PORTFOLIO REVIEW |
| October 31, 2019 (Unaudited) |
The Fund’s performance figures* for the periods ended October 31, 2019, compared to its benchmark:
| Annualized Three | Annualized Five | Annualized Since | ||
| One Year | Years | Years | Inception(a) | |
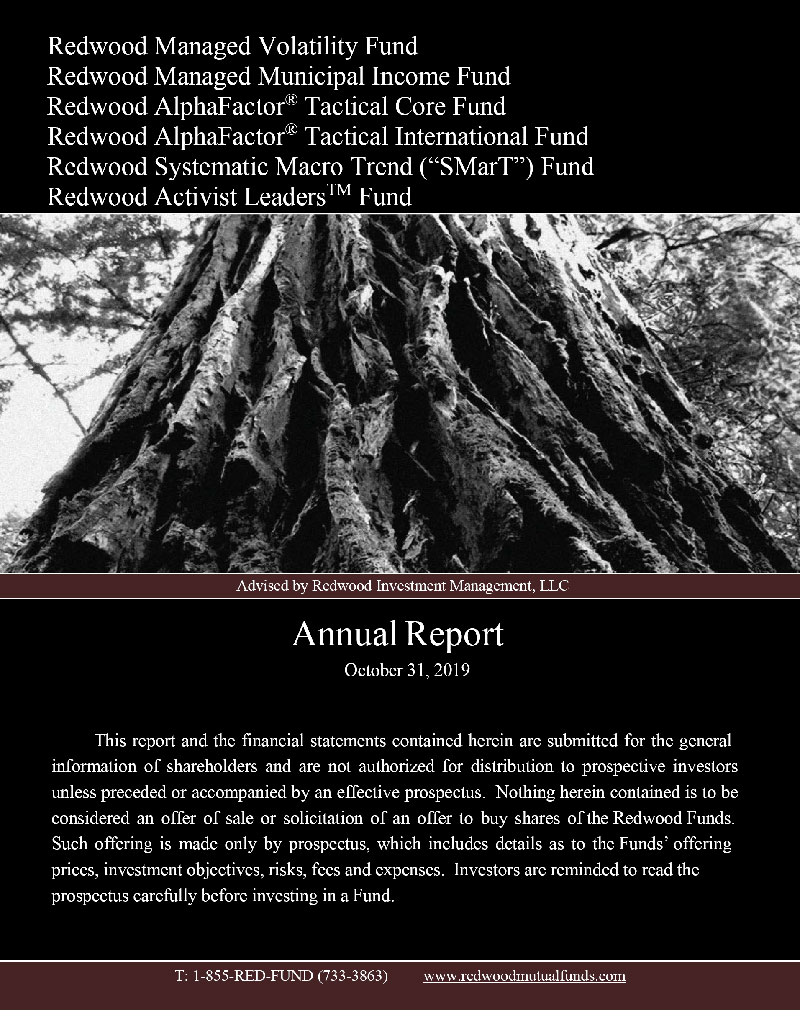
| Class I | 5.10% | 3.52% | 3.29% | 3.46% |
| Class N | 4.93% | 3.27% | 3.04% | 3.23% |
| Class Y | 5.34% | 3.59% | 3.38% | 3.58% |
| Bank of America Merrill Lynch 3-5 Yr Treasury Index(b) | 7.81% | 2.05% | 2.16% | 2.14% |
| * | The performance data quoted here represents past performance. Current performance may be lower or higher than the performance data quoted above. Past performance is no guarantee of future results. The investment return and principal value of an investment will fluctuate so that investor’s shares, when redeemed, may be worth more or less than their original cost. The returns shown do not reflect the deduction of taxes that a shareholder would pay on Fund distributions or on the redemption of Fund shares. The Fund’s total annual operating expenses after expense waiver are 1.50% for Class I shares, 1.74% for Class N shares, and 1.43% for Class Y shares per the February 28, 2019 prospectus. The Fund’s advisor has contractually agreed to reduce the Fund’s fees and/or absorb expenses of the Fund until at least March 1, 2020 to ensure that total annual Fund operating expenses after expense waiver and reimbursement (exclusive of any taxes, front-end or contingent deferred loads, brokerage fees and commissions, borrowing costs (such as interest and dividend expense on securities sold short), expenses of other investment companies in which the Fund may invest, or extraordinary expenses such as litigation) will not exceed 1.67%, 1.92% and 1.43% of average daily net assets attributable to Class I, Class N and Class Y shares, respectively. This agreement may be terminated by the Fund’s Board of Trustees on 60 days’ written notice to the advisor. These fee waivers and expense reimbursements are subject to possible recoupment from the Fund in future years on a rolling three year basis (within three years of when the amount was waived or reimbursed) if such recoupment can be achieved within the foregoing expense limits as well as any expense limitation that was in effect at the time the reimbursement was made. For performance information current to the most recent month-end, please call toll-free 1-855-733-3863. |
| (a) | Redwood Managed Volatility Fund commenced operations on December 19, 2013. |
| (b) | Bank of America Merrill Lynch 3-5 Year Treasury Index is an unmanaged index which includes U.S. Treasury securities with maturities of 3 to 4.99 years. The index is produced by Bank of America Merrill Lynch, Pierce, Fenner & Smith, Inc. Investors can not invest directly in an index or benchmark. Index returns are gross of any fees, brokerage commissions or other expenses of investing. |
Comparison of the Change in Value of a $20,000,000 Investment ^
| ^ | Performance shown is for Class Y shares. The performance of the Fund’s other classes may be greater or less than the line shown due to differences in loads and fees paid by shareholders in different share classes. |
| PORTFOLIO COMPOSITION | |||
| October 31, 2019 | |||
| % of Net Assets | |||
| U.S. Government Obligations | 92.7% | ||
| Cash and Other Assets Less Liabilities | 7.3% | ||
| Total | 100.0% | ||
| Please refer to the Portfolio of Investments for a detailed listing of the Fund’s holdings. | |||
7
| Redwood Managed Municipal Income Fund |
| PORTFOLIO REVIEW |
| October 31, 2019 (Unaudited) |
The Fund’s performance figures* for the periods ended October 31, 2019, compared to its benchmark:
| One Year | Since Inception(a) | |
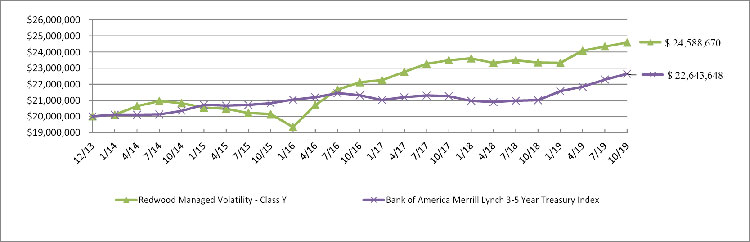
| Class I | 9.62% | 6.06% |
| Class N | 9.35% | 5.81% |
| Bloomberg Barclays U.S. Municipal Bond Index(b) | 9.42% | 4.97% |
| * | The performance data quoted here represents past performance. Current performance may be lower or higher than the performance data quoted above. Past performance is no guarantee of future results. The investment return and principal value of an investment will fluctuate so that investor’s shares, when redeemed, may be worth more or less than their original cost. The returns shown do not reflect the deduction of taxes that a shareholder would pay on Fund distributions or on the redemption of Fund shares. The Fund’s total annual operating expenses are 1.52% for Class I shares and 1.73% for Class N shares per the February 28, 2019 prospectus, as supplemented. The Fund’s advisor has contractually agreed to reduce the Fund’s fees and/or absorb expenses of the Fund until at least March 1, 2020 to ensure that total annual Fund operating expenses after expense waiver and reimbursement (exclusive of any taxes, front-end or contingent deferred loads, brokerage fees and commissions, borrowing costs (such as interest and dividend expenses on securities sold short), expenses of other investment companies in which the Fund may invest, and extraordinary expenses such as litigation) will not exceed 1.00% and 1.25% of average daily net assets attributable to Class N and Class I shares, respectively. This agreement may be terminated by the Fund’s Board of Trustees on 60 days’ written notice to the advisor. These fee waivers and expense reimbursements are subject to possible recoupment from the Fund in future years on a rolling three year basis (within three years of when the amount was waived or reimbursed) if such recoupment can be achieved within the foregoing expense limits as well as any expense limitation that was in effect at the time the reimbursement was made. For performance information current to the most recent month-end, please call toll-free 1-855-733-3863. |
| (a) | Redwood Managed Municipal Income Fund commenced operations on March 9, 2017. |
| (b) | The Bloomberg Barclays U.S. Municipal Bond Index covers the U.S. dollar denominated long-term tax exempt bond market. The index has four main sectors: state and local general obligation bonds, revenue bonds. Investors cannot invest directly in an index or benchmark. Index returns are gross of any fees, brokerage commissions or other expenses of investing. |
Comparison of the Change in Value of a $250,000 Investment^
| ^ | Performance shown is for Class I shares. The performance of the Fund’s other classes may be greater or less than the line shown due to differences in loads and fees paid by shareholders in different share classes. |
| PORTFOLIO COMPOSITION | |||
| October 31, 2019 | |||
| % of Net Assets | |||
| Mutual Funds | 98.1% | ||
| Short-Term Investments | 0.3% | ||
| Cash and Other Assets Less Liabilities | 1.6% | ||
| Total | 100.0% | ||
| Please refer to the Portfolio of Investments for a detailed listing of the Fund’s holdings. | |||
8
| Redwood AlphaFactor®Tactical Core Fund |
| PORTFOLIO REVIEW |
| October 31, 2019 (Unaudited) |
The Fund’s performance figures* for the periods ended October 31, 2019, compared to its benchmark:
| One Year | Since Inception(a) | |
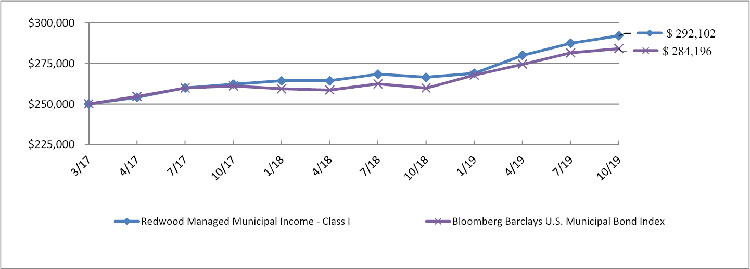
| Class I | 6.00% | 5.98% |
| Class N | 5.72% | 5.79% |
| Redwood AlphaFactor® Tactical Focused Index(b) | 9.52% | 23.06% |
| S&P 500 Total Return Index(c) | 14.33% | 12.10% |
| * | The performance data quoted here represents past performance. Current performance may be lower or higher than the performance data quoted above. Past performance is no guarantee of future results. The investment return and principal value of an investment will fluctuate so that investor’s shares, when redeemed, may be worth more or less than their original cost. The returns shown do not reflect the deduction of taxes that a shareholder would pay on Fund distributions or on the redemption of Fund shares. The Fund’s total annual operating expenses after expense waivers are 1.20% for Class I shares and 1.45% for Class N shares per the February 28, 2019 prospectus, as supplemented. The Fund’s advisor has contractually agreed to reduce the Fund’s fees and/or absorb expenses of the Fund until at least March 1, 2020 to ensure that total annual Fund operating expenses after expense waiver and reimbursement (exclusive of any taxes, front-end or contingent deferred loads, brokerage fees and commissions, borrowing costs (such as interest and dividend expenses on securities sold short), expenses of other investment companies in which the Fund may invest, and extraordinary expenses such as litigation) will not exceed 1.45% and 1.20% of average daily net assets attributable to Class N and Class I shares, respectively. This agreement may be terminated by the Fund’s Board of Trustees on 60 days’ written notice to the advisor. These fee waivers and expense reimbursements are subject to possible recoupment from the Fund in future years on a rolling three year basis (within three years of when the amount was waived or reimbursed) if such recoupment can be achieved within the foregoing expense limits as well as any expense limitation that was in effect at the time the reimbursement was made. For performance information current to the most recent month-end, please call toll-free 1-855-733-3863. |
| (a) | Redwood AlphaFactor®Tactical Core Fund commenced operations on March 9, 2017. |
| (b) | The Redwood AlphaFactor®Tactical Focused Index, the Fund adviser’s proprietary index, utilizes a quantitative factor-based investment methodology focused on the largest 1,000 U.S. common stocks based on market capitalization, with a tactical overlay that seeks to determine when equity exposure should be turned on or off. Investors cannot invest directly in an index or benchmark. Index returns are gross of any fees, brokerage commissions or other expenses of investing. |
| (c) | Standard and Poor’s 500 Total Return Index is a capitalization-weighted index of 500 stocks. The index is designed to measure performance of the broad domestic economy through changes in the aggregate market value of 500 stocks representing all major industries. Investors cannot invest directly in an index or benchmark. Index returns are gross of any fees, brokerage commissions or other expenses of investing. |
Comparison of the Change in Value of a $250,000 Investment^
| ^ | Performance shown is for Class I shares. The performance of the Fund’s other classes may be greater or less than the line shown due to differences in loads and fees paid by shareholders in different share classes. |
| PORTFOLIO COMPOSITION | |||
| October 31, 2019 | |||
| % of Net Assets | |||
| Semiconductors | 10.5% | ||
| Pharmaceuticals | 10.4% | ||
| Banks | 9.5% | ||
| Diversified Financial Services | 9.5% | ||
| Computers | 9.1% | ||
| Retail | 9.1% | ||
| Insurance | 6.6% | ||
| Biotechnology | 3.5% | ||
| Commercial Services | 3.4% | ||
| Machinery - Diversified | 3.3% | ||
| Other/Cash and Equivalents | 25.1% | ||
| Total | 100.0% | ||
| Please refer to the Portfolio of Investments for a detailed listing of the Fund’s holdings. | |||
9
| Redwood AlphaFactor®Tactical International Fund |
| PORTFOLIO REVIEW |
| October 31, 2019 (Unaudited) |
The Fund’s performance figures* for the periods ended October 31, 2019 compared to its benchmark:
| One Year | Since Inception(a) | |
| Class I | 0.04% | (0.60)% |
| Class N | (0.16)% | (0.81)% |
| Redwood AlphaFactor® Tactical International Index(b) | 2.67% | 4.76% |
| MSCI AC World Index ex-US Net(c) | 11.27% | 0.74% |
| * | The performance data quoted here represents past performance. Current performance may be lower or higher than the performance data quoted above. Past performance is no guarantee of future results. The investment return and principal value of an investment will fluctuate so that investor’s shares, when redeemed, may be worth more or less than their original cost. The returns shown do not reflect the deduction of taxes that a shareholder would pay on Fund distributions or on the redemption of Fund shares. The Fund’s total annual operating expenses after expense waivers are 1.33% for Class I shares and 1.58% for Class N shares per the February 28, 2019 prospectus. The Fund’s adviser has contractually agreed to reduce the Fund’s fees and/or absorb expenses of the Fund until at least March 1, 2020 to ensure that total annual Fund operating expenses after expense waiver and reimbursement (exclusive of any taxes, front-end or deferred loads, brokerage fees and commissions, borrowing costs (such as interest and dividend expenses on securities sold short), expenses of other investment companies in which the Fund may invest, or extraordinary expenses such as litigation) will not exceed 1.45% and 1.20% of average daily net assets attributable to Class N and Class I shares, respectively. This agreement may be terminated by the Fund’s Board of Trustees on 60 days’ written notice to the adviser. These fee waivers and expense reimbursements are subject to possible recoupment from the Fund in future years on a rolling three year basis (within three years of when the amount was waived or reimbursed) if such recoupment can be achieved within the foregoing expense limits as well as any expense limitation that was in effect at the time the reimbursement was made. For performance information current to the most recent month-end, please call toll-free 1-855-733-3863. |
| (a) | Redwood AlphaFactor®Tactical International Fund commenced operations on November 2, 2017. |
| (b) | The Redwood AlphaFactor®Tactical International Index, the Fund advisor’s proprietary index, utilizes a quantitative, factor-based, investment methodology focused on large and middle capitalization stocks of both developed and emerging markets outside of the U.S., typically companies with market capitalization greater than $2 billion. The Strategy also employs a multi-factor tactical risk management overlay that seeks to exit positions during periods identified by the advisor as above-average risk. Investors cannot invest directly in an index or benchmark. Index returns are gross of any fees, brokerage commissions or other expenses of investing. |
| (c) | The Morgan Stanley Capital International All Country World Index Ex-U.S. (MSCI ACWI Ex-U.S.) is a market-capitalization-weighted index maintained by Morgan Stanley Capital International (MSCI). It is designed to provide a broad measure of stock performance throughout the world, with the exception of U.S.-based companies. The MSCI All Country World Index Ex-U.S. includes both developed and emerging markets. Investors cannot invest directly in an index or benchmark. Index returns are gross of any fees, brokerage commissions or other expenses of investing. |
Comparison of the Change in Value of a $10,000 Investment ^
| ^ | Performance shown is for Class I shares. The performance of the Fund’s other classes may be greater or less than the line shown due to differences in loads and fees paid by shareholders in different share classes. |
| PORTFOLIO COMPOSITION | |||
| October 31, 2019 | |||
| % of Net Assets | |||
| U.S. Government Obligations | 38.5% | ||
| Oil & Gas | 9.2% | ||
| Telecommunications | 4.9% | ||
| Insurance | 4.4% | ||
| Pharmaceuticals | 3.4% | ||
| Food | 3.4% | ||
| Distribution / Wholesale | 2.9% | ||
| Retail | 2.9% | ||
| Banks | 2.9% | ||
| Software | 1.9% | ||
| Other/Cash and Equivalents | 25.6% | ||
| Total | 100.0% | ||
| Please refer to the Portfolio of Investments for a detailed listing of the Fund’s holdings. | |||
10
| Redwood Systematic Macro Trend (“SMarT”) Fund |
| PORTFOLIO REVIEW |
| October 31, 2019 (Unaudited) |
The Fund’s performance figures* for the periods ended October 31, 2019, compared to its benchmark:
| One Year | Since Inception(a) | |
| Class I | 4.16% | 1.42% |
| Class N | 3.90% | 1.16% |
| MS Category Avg-Tactical Allocation(b) | 6.41% | 2.08% |
| Composite Index(c) | 13.07% | 7.21% |
| * | The performance data quoted here represents past performance. Current performance may be lower or higher than the performance data quoted above. Past performance is no guarantee of future results. The investment return and principal value of an investment will fluctuate so that investor’s shares, when redeemed, may be worth more or less than their original cost. The returns shown do not reflect the deduction of taxes that a shareholder would pay on Fund distributions or on the redemption of Fund shares. The Fund’s total annual operating expenses after expense waivers are 1.58% for Class I shares and 1.83% for Class N shares per the February 28, 2019 prospectus. The Fund’s adviser has contractually agreed to reduce the Fund’s fees and/or absorb expenses of the Fund until at least March 1, 2020 to ensure that total annual Fund operating expenses after expense waiver and reimbursement (exclusive of any taxes, front-end or deferred loads, brokerage fees and commissions, borrowing costs (such as interest and dividend expenses on securities sold short, expenses of other investment companies in which the Fund may invest, or extraordinary expenses such as litigation) will not exceed 1.55% and 1.30% of average daily net assets attributable to Class N and Class I shares, respectively. This agreement may be terminated by the Fund’s Board of Trustees on 60 days’ written notice to the adviser. These fee waivers and expense reimbursements are subject to possible recoupment from the Fund in future years on a rolling three year basis (within three years of when the amount was waived or reimbursed) if such recoupment can be achieved within the foregoing expense limits as well as any expense limitation that was in effect at the time the reimbursement was made. For performance information current to the most recent month-end, please call toll-free 1-855-733-3863. |
| (a) | Redwood Systematic Macro Trend (“SMarT”) Fund commenced operations on November 2, 2017. |
| (b) | The MS Category Avg-Tactical Allocation Index. Tactical asset allocation strategy is the process by which the asset of a fund is changed on a short-term basis to take advantage of perceived differences in relative values of the various asset classes. The MS Category Avg–Tactical Allocation Index is the average of all funds defined categorized as Tactical Allocation by Morningstar. Investors cannot invest directly in an index or benchmark. Index returns are gross of any fees, brokerage commissions or other expenses of investing. |
| (c) | The Composite Index is a blend of 40% S&P 500 Total Return Index and 60% Bloomberg Barclays US Aggregate Bond Index. Standard and Poor’s 500 Total Return Index is a capitalization-weighted index of 500 stocks. The index is designed to measure performance of the broad domestic economy through changes in the aggregate market value of 500 stocks representing all major industries. Bloomberg Barclays US Aggregate Bond Index is a broad based, market-capitalization weighted bond market index representing intermediate term investment grade bonds traded in the United States. Investors cannot invest directly in an index or benchmark. Index returns are gross of any fees, brokerage commissions or other expenses of investing. |
Comparison of the Change in Value of a $10,000 Investment^
| ^ | Performance shown is for Class I shares. The performance of the Fund’s other classes may be greater or less than the line shown due to differences in loads and fees paid by shareholders in different share classes. |
| PORTFOLIO COMPOSITION | |||
| October 31, 2019 | |||
| % of Net Assets | |||
| U.S. Government Obligations | 51.2% | ||
| Exchange Traded Funds | 19.9% | ||
| Electric | 2.1% | ||
| Diversified Financial Services | 1.9% | ||
| Pharmaceuticals | 1.8% | ||
| Computers | 1.7% | ||
| REITS | 1.7% | ||
| Telecommunications | 1.3% | ||
| Retail | 1.2% | ||
| Oil & Gas | 1.2% | ||
| Other/Cash and Equivalents | 16.0% | ||
| Total | 100.0% | ||
| Please refer to the Portfolio of Investments for a detailed listing of the Fund’s holdings. | |||
11
| Redwood Activist LeadersTM Fund |
| PORTFOLIO REVIEW |
| October 31, 2019 (Unaudited) |
The Fund’s performance figures* for the periods ended October 31, 2019, compared to its benchmark:
| One Year | Since Inception(a) | |
| Class I | 4.02% | 1.41% |
| Class N | 3.58% | 1.10% |
| Redwood Activist LeadersTM Index(b) | 4.58% | 6.66% |
| S&P 500 Total Return Index(c) | 14.33% | 10.71% |
| * | The performance data quoted here represents past performance. Current performance may be lower or higher than the performance data quoted above. Past performance is no guarantee of future results. The investment return and principal value of an investment will fluctuate so that investor’s shares, when redeemed, may be worth more or less than their original cost. The returns shown do not reflect the deduction of taxes that a shareholder would pay on Fund distributions or on the redemption of Fund shares. The Fund’s total annual operating expenses after expense waivers are 0.90% for Class I shares and 1.15% for Class N shares per the February 28, 2019 prospectus. The Fund’s adviser has contractually agreed to reduce the Fund’s fees and/or absorb expenses of the Fund until at least March 1, 2020 to ensure that total annual Fund operating expenses after expense waiver and reimbursement (exclusive of any taxes, front-end or deferred loads, brokerage fees and commissions, borrowing costs (such as interest and dividend expenses on short sales), expenses of other investment companies in which the Fund may invest, and extraordinary expenses such as litigation) will not exceed 1.15% and 0.90% of average daily net assets attributable to Class N and Class I shares, respectively. This agreement may be terminated by the Fund’s Board of Trustees on 60 days’ written notice to the adviser. These fee waivers and expense reimbursements are subject to possible recoupment from the Fund in future years on a rolling three year basis (within the three years after the fees have been waived or reimbursed) if such recoupment can be achieved within the foregoing expense limits as well as any expense limitation that was in effect at the time the reimbursement was made. For performance information current to the most recent month-end, please call toll-free 1-855-733-3863. |
| (a) | Redwood Activist LeadersTM Fund commenced operations on November 2, 2017. |
| (b) | Redwood Activist LeadersTMIndex, the Fund adviser’s proprietary index, focuses on stocks that are the target of shareholder activism utilizing a proprietary selection methodology built on the foundation of tracking public SEC 13D filings of Activist LeadersTMas defined by the advisor. Investors cannot invest directly in an index or benchmark. Index returns are gross of any fees, brokerage commissions or other expenses of investing. |
| (c) | Standard and Poor’s 500 Total Return Index is a capitalization-weighted index of 500 stocks. The index is designed to measure performance of the broad domestic economy through changes in the aggregate market value of 500 stocks representing all major industries. Investors cannot invest directly in an index or benchmark. Index returns are gross of any fees, brokerage commissions or other expenses of investing. |
Comparison of the Change in Value of a $10,000 Investment^

| ’^ | Performance shown is for Class I shares. The performance of the Fund’s other classes may be greater or less than the line shown due to differences in loads and fees paid by shareholders in different share classes. |
| PORTFOLIO COMPOSITION | |||
| October 31, 2019 | |||
| % of Net Assets | |||
| Retail | 10.7% | ||
| Software | 8.0% | ||
| Computers | 8.0% | ||
| Food | 5.3% | ||
| Biotechnology | 5.3% | ||
| Distribution / Wholesale | 5.3% | ||
| Commercial Services | 5.3% | ||
| Pharmaceuticals | 5.3% | ||
| Auto Parts & Equipment | 5.2% | ||
| Machinery - Diversified | 2.7% | ||
| Other/Cash and Equivalents | 38.9% | ||
| Total | 100.0% | ||
| Please refer to the Portfolio of Investments for a detailed listing of the Fund’s holdings. | |||
12
| Redwood Managed Volatility Fund |
| PORTFOLIO OF INVESTMENTS |
| October 31, 2019 |
| Principal Amount | Interest Rate | Maturity Date | Fair Value | |||||||||
| U.S. GOVERNMENT OBLIGATIONS - 92.7% | $ | 10,000,000 | 1.93% | 11/21/2019 | $ | 9,991,569 | ||||||
| U.S. TREASURY BILLS*+ - 92.7% | 13,000,000 | 1.65% | 1/2/2020 | 12,965,465 | ||||||||
| 298,000,000 | 1.61% | 1/23/2020 | 296,960,712 | |||||||||
| TOTAL U.S. GOVERNMENT OBLIGATIONS (COST - $319,849,750) | 319,917,746 | |||||||||||
| TOTAL INVESTMENTS - 92.7% (Cost - $319,849,750) | $ | 319,917,746 | ||||||||||
| CASH, OTHER ASSETS AND LIABILITIES - NET - 7.3% | 25,247,725 | |||||||||||
| TOTAL NET ASSETS - 100.0% | $ | 345,165,471 | ||||||||||
| + | Interest rate shown is the discounted rate at time of purchase of US Treasury Bill as of October 31, 2019. |
| * | All or portion of this security is segregated as collateral for swaps. |
| CREDIT DEFAULT SWAP | ||||||||||||||||||||||||
| Notional | Upfront Premiums | Pay/Receive | Unrealized | |||||||||||||||||||||
| Amount | Paid (Received) | Reference Entity (I) | Counterparty | Expiration Date | Fixed Rate | Fixed Rate | Value | Gain (Loss) | ||||||||||||||||
| $ | 194,000,000 | $ | 12,842,859 | To Sell Protection - CDX | BNP | 12/20/2024 | Receive | 5.00% | $ | 15,016,829 | $ | 2,173,970 | ||||||||||||
| HYS33 SWAP 5YR PRC, pays | ||||||||||||||||||||||||
| Quarterly | ||||||||||||||||||||||||
| $ | 15,016,829 | $ | 2,173,970 | |||||||||||||||||||||
| (1) | If the Fund is a seller of protection and a credit event occurs, as defined under the terms of that particular swap agreement, the Fund will either (i) pay the buyer of protection an amount equal to the notional amount of the swap and take delivery of the referenced obligation or underlying securities comprising the referenced index or (ii) pay a net settlement amount in the form of cash or securities equal to the notional amount of the swap less the recovery value of the referenced obligation or underlying securities comprising of the referenced index. The swap itself does not have a credit rating, however the underlying holdings of the swap are comprised of non-investment grade entities, with ratings of B and BB. |
| TOTAL RETURN SWAPS ** | ||||||||||||||||||
| Unrealized | ||||||||||||||||||
| Number of | Appreciation | |||||||||||||||||
| Security | Shares | Notional Value | Interest Rate Payable | Termination Date | Counterparty | (Depreciation) | ||||||||||||
| Barclays U.S. Corporation High Yield -Institutional Class | 4,700 | $ | 10,000,000 | 1-Mth USD_LIBOR - 42 bps | 10/1/2020 | SocGen/Goldman Sachs | $ | 8,700 | ||||||||||
| BlackRock High Yield Bond Portfolio - Institutional Shares | 6,907,788 | 53,059,618 | 3-Mth USD_LIBOR + 120 bps | 1/9/2022 | Barclays | 20,630 | ||||||||||||
| Invesco Senior Loan ETF - Institutional Shares | 660,000 | 14,909,400 | 1-Mth USD_LIBOR - 50 bps | 6/10/2020 | Barclays | (137,331 | ) | |||||||||||
| Ishares IBOXX High Yield Corporate Bond | 178,084 | 15,523,582 | 1-Mth USD_LIBOR - 10 bps | 4/6/2020 | Barclays | (65,236 | ) | |||||||||||
| Neuberger Berman High Income Bond Fund - Institutional Class | 2,859,738 | 24,511,355 | 3-Mth USD_LIBOR + 120 bps | 1/9/2022 | Barclays | (12,618 | ) | |||||||||||
| Vanguard High-Yield Corporate Fund - Admiral Shares | 7,617,226 | 44,871,814 | 3-Mth USD_LIBOR + 120 bps | 1/15/2022 | Barclays | 266,005 | ||||||||||||
| Total | $ | 80,150 | ||||||||||||||||
| ** | The swaps provide exposure to the total returns on the securities that are calculated on a daily basis. Under the terms of the swaps, the Advisor has the ability to periodically adjust the notional level of the swaps. In addition, the Fund will receive the total return on the securities, including dividends and provide a fee to the counterparty. The swaps are reset monthly. |
The accompanying notes are an integral part of these financial statements.
13
| Redwood Managed Municipal Income Fund |
| PORTFOLIO OF INVESTMENTS |
| October 31, 2019 |
| Shares | Fair Value | |||||||
| MUTUAL FUNDS - 98.1% | ||||||||
| DEBT FUNDS - 98.1% | ||||||||
| 2,573,695 | Invesco Oppenheimer Rochester High Yield Municipal Fund - Institutional Class | $ | 20,306,451 | |||||
| 1,314,287 | Lord Abbett High Yield Municipal Bond Fund - Institutional Class | 16,481,165 | ||||||
| 2,084,356 | MainStay MacKay High Yield Municipal Bond Fund - Institutional Class | 27,075,786 | ||||||
| 2,047,541 | MFS Municipal High Income Fund - Institutional Class | 17,404,095 | ||||||
| 487,014 | Northern High Yield Municipal Fund - Institutional Class | 4,344,166 | ||||||
| 5,095,793 | Nuveen High Yield Municipal Bond Fund - Institutional Class | 91,418,519 | ||||||
| TOTAL MUTUAL FUNDS (Cost - $166,978,740) | 177,030,182 | |||||||
| Interest Rate | ||||||||||
| SHORT-TERM INVESTMENTS - 0.3% | ||||||||||
| MONEY MARKET FUNDS - 0.3% | ||||||||||
| 168,364 | BlackRock Liquidity Funds MuniCash Portfolio - Institutional Class | 1.04% + | 168,381 | |||||||
| 114,307 | JP Morgan Municipal Money Market Fund - Institutional Class | 0.99% + | 114,307 | |||||||
| 218,347 | JP Morgan Tax Free Money Market Fund - Institutional Class | 0.98% + | 218,347 | |||||||
| TOTAL SHORT-TERM INVESTMENTS (Cost - $501,035) | 501,035 | |||||||||
| TOTAL INVESTMENTS - 98.4% (Cost - $167,479,775) | $ | 177,531,217 | ||||||||
| CASH, OTHER ASSETS AND LIABILITIES - NET - 1.6% | 2,899,093 | |||||||||
| TOTAL NET ASSETS - 100.0% | $ | 180,430,310 | ||||||||
| + | Variable rate security. 7 day yield as of October 31, 2019. |
The accompanying notes are an integral part of these financial statements.
14
| Redwood Alphafactor Tactical Core Fund |
| PORTFOLIO OF INVESTMENTS |
| October 31, 2019 |
| Shares | Fair Value | |||||||
| COMMON STOCK - 93.9% | ||||||||
| AEROSPACE / DEFENSE - 3.2% | ||||||||
| 43,222 | Spirit AeroSystems Holdings, Inc. | $ | 3,536,424 | |||||
| BANKS - 9.5% | ||||||||
| 78,325 | CIT Group, Inc. | 3,359,359 | ||||||
| 51,515 | Citigroup, Inc. | 3,701,868 | ||||||
| 224,548 | Regions Financial Corp. | 3,615,223 | ||||||
| 10,676,450 | ||||||||
| BIOTECHNOLOGY - 3.5% | ||||||||
| 18,284 | Amgen, Inc. | 3,899,063 | ||||||
| COMMERCIAL SERVICES - 3.4% | ||||||||
| 42,205 | ManpowerGroup, Inc. | 3,837,279 | ||||||
| COMPUTERS - 9.1% | ||||||||
| 234,822 | Hewlett Packard Enterprise Co. | 3,853,429 | ||||||
| 189,278 | HP, Inc. | 3,287,759 | ||||||
| 59,708 | Western Digital Corp. | 3,083,918 | ||||||
| 10,225,106 | ||||||||
| DIVERSIFIED FINANCIAL SERVICES - 9.5% | ||||||||
| 44,044 | Discover Financial Services | 3,534,971 | ||||||
| 123,531 | Franklin Resources, Inc. | 3,403,279 | ||||||
| 105,546 | Synchrony Financial | 3,733,162 | ||||||
| 10,671,412 | ||||||||
| ELECTRIC - 3.2% | ||||||||
| 90,154 | NRG Energy, Inc. | 3,616,979 | ||||||
| ELECTRONICS - 3.3% | ||||||||
| 129,519 | Gentex Corp. | 3,633,008 | ||||||
| INSURANCE - 6.6% | ||||||||
| 79,708 | Assured Guaranty Ltd. | 3,739,899 | ||||||
| 84,225 | Athene Holding Ltd. * | 3,651,154 | ||||||
| 7,391,053 | ||||||||
| MACHINERY - DIVERSIFIED - 3.3% | ||||||||
| 21,712 | Rockwell Automation, Inc. | 3,734,247 | ||||||
| OFFICE / BUSINESS EQUIPMENT - 3.0% | ||||||||
| 100,037 | Xerox Holdings Corp. | 3,394,255 | ||||||
| PHARMACEUTICALS - 10.4% | ||||||||
| 47,026 | AbbVie, Inc. | 3,740,918 | ||||||
| 75,683 | Cardinal Health, Inc. | 3,742,524 | ||||||
| 94,488 | Herbalife Nutrition Ltd. * | 4,220,779 | ||||||
| 11,704,221 | ||||||||
The accompanying notes are an integral part of these financial statements.
15
| Redwood Alphafactor Tactical Core Fund |
| PORTFOLIO OF INVESTMENTS(Continued) |
| October 31, 2019 |
| Shares | Fair Value | |||||||
| COMMON STOCK - 93.9% (Continued) | ||||||||
| RETAIL - 9.1% | ||||||||
| 40,561 | Starbucks Corp. | $ | 3,429,838 | |||||
| 64,525 | Walgreens Boots Alliance, Inc. | 3,534,679 | ||||||
| 31,616 | Yum! Brands, Inc. | 3,215,663 | ||||||
| 10,180,180 | ||||||||
| SEMICONDUCTORS - 10.5% | ||||||||
| 13,055 | Broadcom, Inc. | 3,823,157 | ||||||
| 15,544 | Lam Research Corp. | 4,213,046 | ||||||
| 46,656 | QUALCOMM, Inc. | 3,753,009 | ||||||
| 11,789,212 | ||||||||
| SOFTWARE - 3.2% | ||||||||
| 64,783 | Oracle Corp. | 3,530,026 | ||||||
| TELECOMMUNICATIONS - 3.1% | ||||||||
| 72,181 | Cisco Systems, Inc. | 3,429,319 | ||||||
| TOTAL COMMON STOCK (Cost - $101,628,005) | 105,248,234 | |||||||
| REITS - 3.3% | ||||||||
| 32,108 | Camden Property Trust | |||||||
| TOTAL REITS (Cost - $3,276,855) | 3,672,192 | |||||||
| Interest Rate | ||||||||||
| SHORT-TERM INVESTMENTS - 0.0% ** | ||||||||||
| MONEY MARKET FUNDS - 0.0% ** | ||||||||||
| 28 | JPMorgan 100% US Treasury Securities Money Market Fund-Institutional Class | 1.62% + | 28 | |||||||
| 28 | JPMorgan US Government Money Market Fund-Institutional Class | 1.67% + | 28 | |||||||
| TOTAL SHORT-TERM INVESTMENTS (Cost - $56) | 56 | |||||||||
| TOTAL INVESTMENTS - 97.2% (Cost - $104,904,916) | $ | 108,920,482 | ||||||||
| CASH, OTHER ASSETS AND LIABILITIES - NET - 2.8% | 3,175,658 | |||||||||
| TOTAL NET ASSETS - 100.0% | $ | 112,096,140 | ||||||||
| * | Non-Income producing security. |
| ** | Represents less than 0.05% |
| + | Variable rate security. 7 day yield as of October 31, 2019. |
The accompanying notes are an integral part of these financial statements.
16
| Redwood AlphaFactor® Tactical International Fund |
| PORTFOLIO OF INVESTMENTS |
| October 31, 2019 |
| Shares | Fair Value | |||||||
| COMMON STOCK - 53.0% | ||||||||
| AIRLINES - 1.0% | ||||||||
| 29,964 | Air Canada * | $ | 1,069,207 | |||||
| AUTO MANUFACTURERS - 1.0% | ||||||||
| 15,300 | Toyota Motor Corp. | 1,067,412 | ||||||
| AUTO PARTS & EQUIPMENT - 1.0% | ||||||||
| 19,488 | Magna International Inc | 1,050,055 | ||||||
| BANKS - 2.9% | ||||||||
| 87,167 | Banco Santander Brasil SA | 1,029,658 | ||||||
| 28,614 | Shinhan Financial Group Co. Ltd. * | 1,045,249 | ||||||
| 18,537 | Toronto-Dominion Bank | 1,060,728 | ||||||
| 3,135,635 | ||||||||
| BEVERAGES - 1.0% | ||||||||
| 19,748 | Coca-Cola European Partners PLC | 1,056,715 | ||||||
| BUILDING MATERIALS - 1.0% | ||||||||
| 17,907 | Anhui Conch Cement Co. Ltd. (ADRS) | 531,713 | ||||||
| 35,935 | HeidelbergCement AG (ADRS) | 534,170 | ||||||
| 1,065,883 | ||||||||
| COMMERCIAL SERVICES - 1.9% | ||||||||
| 17,858 | Adecco Group AG (ADRS) | 528,775 | ||||||
| 43,461 | Atlantia SpA (ADRS) | 533,266 | ||||||
| 253,152 | CCR SA * | 1,046,812 | ||||||
| 2,108,853 | ||||||||
| COMPUTERS - 1.9% | ||||||||
| 13,559 | CGI, Inc. * | 1,056,165 | ||||||
| 9,452 | Check Point Software Technologies Ltd. * | 1,062,499 | ||||||
| 2,118,664 | ||||||||
| DISTRIBUTION / WHOLESALE - 2.9% | ||||||||
| 50,400 | Itochu Corp. | 1,058,771 | ||||||
| 150,400 | Marubeni Corp. | 1,065,412 | ||||||
| 30,800 | Toyota Tsusho Corporation | 1,074,104 | ||||||
| 3,198,287 | ||||||||
| FOOD - 3.4% | ||||||||
| 40,102 | Empire Company Limited | 1,066,966 | ||||||
| 21,176 | Koninklijke Ahold Delhaize NV (ADRS) | 527,071 | ||||||
| 19,888 | Loblaw Cos Ltd. | 1,062,832 | ||||||
| 27,500 | Seven & i Holdings Co. Ltd. | 1,042,967 | ||||||
| 3,699,836 | ||||||||
| HOME FURNISHINGS - 1.0% | ||||||||
| 18,100 | Sony Corp. | 1,109,223 | ||||||
| INSURANCE - 4.4% | ||||||||
| 41,670 | China Life Insurance Co. Ltd. (ADRS) | 534,626 | ||||||
| 44,773 | Great-West Lifeco, Inc. | 1,091,094 | ||||||
| 56,483 | Manulife Financial Corp. | 1,054,155 | ||||||
| 45,893 | Power Corp of Canada | 1,064,266 | ||||||
| 45,415 | Power Financial Corp. | 1,064,239 | ||||||
| 4,808,380 | ||||||||
| INTERNET - 1.0% | ||||||||
| 21,100 | Trend Micro, Inc. | 1,073,493 | ||||||
The accompanying notes are an integral part of these financial statements.
17
| Redwood AlphaFactor® Tactical International Fund |
| PORTFOLIO OF INVESTMENTS (Continued) |
| October 31, 2019 |
| Shares | Fair Value | |||||||
| COMMON STOCK - 53.0% (Continued) | ||||||||
| IRON / STEEL - 0.9% | ||||||||
| 87,006 | Vale SA * | $ | 1,023,855 | |||||
| MEDIA - 1.4% | ||||||||
| 45,742 | Quebecor, Inc. | 1,065,637 | ||||||
| 7,162 | Wolters Kluwer NV (ADRS) | 527,839 | ||||||
| 1,593,476 | ||||||||
| MINING - 1.0% | ||||||||
| 2,815 | Korea Zinc Co. Ltd. * | 1,051,285 | ||||||
| OFFICE / BUSINESS EQUIPMENT - 1.0% | ||||||||
| 24,200 | Fujifilm Holdings Corp. | 1,070,034 | ||||||
| OIL & GAS - 9.2% | ||||||||
| 41,596 | Canadian Natural Resources Ltd. | 1,051,016 | ||||||
| 71,910 | Cosan SA Industria e Comercio * | 1,029,998 | ||||||
| 29,398 | Ecopetrol SA (ADRS) | 536,514 | ||||||
| 28,605 | Equinor ASA (ADRS) | 529,479 | ||||||
| 42,587 | Imperial Oil Ltd. | 1,062,771 | ||||||
| 228,100 | JXTG Holdings, Inc. | 1,074,827 | ||||||
| 147,048 | Petrobras Distribuidora S.A. | 1,040,296 | ||||||
| 129,563 | Petroleo Brasileiro SA * | 1,054,733 | ||||||
| 8,740 | Royal Dutch Shell PLC (ADRS) | 509,455 | ||||||
| 35,133 | Suncor Energy, Inc. | 1,046,759 | ||||||
| 222,507 | Ultrapar Participacoes S.A. * | 1,042,586 | ||||||
| 9,978,434 | ||||||||
| PHARMACEUTICALS - 3.4% | ||||||||
| 62,600 | Astellas Pharma, Inc. | 1,076,195 | ||||||
| 11,613 | GlaxoSmithKline PLC (ADRS) | 531,875 | ||||||
| 6,050 | Novartis AG (ADRS) | 529,012 | ||||||
| 9,523 | Novo Nordisk A/S (ADRS) | 525,860 | ||||||
| 59,800 | Sumitomo Dainippon Pharma Co. Ltd. | 1,052,122 | ||||||
| 3,715,064 | ||||||||
| RETAIL - 2.9% | ||||||||
| 35,518 | Alimentation Couche-Tard, Inc. | 1,067,418 | ||||||
| 41,500 | FamilyMart UNY Holdings Co. Ltd. | 1,034,957 | ||||||
| 54,700 | USS Co. Ltd. | 1,065,614 | ||||||
| 3,167,989 | ||||||||
| SEMICONDUCTORS - 1.0% | ||||||||
| 9,233 | NXP Semiconductors NV | 1,049,607 | ||||||
| SOFTWARE - 1.9% | ||||||||
| 3,704 | NetEase Inc (ADRS) | 1,058,825 | ||||||
| 92,900 | Nexon Co. Ltd. * | 1,078,484 | ||||||
| 2,137,309 | ||||||||
The accompanying notes are an integral part of these financial statements.
18
| Redwood AlphaFactor® Tactical International Fund |
| PORTFOLIO OF INVESTMENTS (Continued) |
| October 31, 2019 |
| Shares | Fair Value | |||||||
| COMMON STOCK - 53.0% (Continued) | ||||||||
| TELECOMMUNICATIONS - 4.9% | ||||||||
| 30,306 | Deutsche Telekom AG (ADRS) | $ | 533,083 | |||||
| 38,800 | KDDI Corp. | 1,076,372 | ||||||
| 89,471 | LG Uplus Corp. * | 1,034,325 | ||||||
| 39,600 | NTT Docomo, Inc. | 1,089,774 | ||||||
| 69,287 | Telefonica SA (ADRS) | 531,431 | ||||||
| 17,633 | Telekomunikasi Indonesia Persero Tbk PT (ADRS) | 509,241 | ||||||
| 60,715 | Telia Co. AB (ADRS) | 533,078 | ||||||
| 5,307,304 | ||||||||
| WATER - 1.0% | ||||||||
| 77,090 | Cia de Saneamento Basico do Estado de Sao Paulo * | 1,050,232 | ||||||
| TOTAL COMMON STOCK (Cost - $57,236,527) | 57,706,232 | |||||||
| Interest Rate | ||||||||||
| SHORT-TERM INVESTMENTS - 0.0% ** | ||||||||||
| MONEY MARKET FUNDS - 0.0% ** | ||||||||||
| 26 | BlackRock Liquidity Funds T-Fund - Institutional Shares | 1.70% + | 26 | |||||||
| 5 | Goldman Sachs Financial Square Prime Obligations Fund - Institutional Shares | 1.96% + | 5 | |||||||
| 52 | Morgan Stanley Institutional Liquidity Funds - Institutional Shares | 1.95% + | 52 | |||||||
| TOTAL SHORT-TERM INVESTMENTS (Cost - $83) | 83 | |||||||||
| Principal | Interest | Maturity | ||||||||||||||
| Amount | Rate | Date | Fair Value | |||||||||||||
| U.S. GOVERNMENT OBLIGATIONS - 38.5% | $ | 3,000,000 | 1.55 - 1.63% | 1/9/2020 | 2,991,217 | |||||||||||
| U.S. TREASURY BILL^ - 38.5% | 39,000,000 | 1.61% | 1/23/2020 | 38,863,986 | ||||||||||||
| TOTAL U.S. GOVERNMENT OBLIGATIONS (COST - $41,846,340) | 41,855,203 | |||||||||||||||
| TOTAL INVESTMENTS - 91.5% (Cost - $99,082,950) | $ | 99,561,518 | ||||||||||||||
| CASH, OTHER ASSETS AND LIABILITIES - NET - 8.5% | 9,293,965 | |||||||||||||||
| TOTAL NET ASSETS - 100.0% | $ | 108,855,483 | ||||||||||||||
| + | Variable rate security. 7 day yield as of October 31, 2019. |
| ^ | Interest rate shown is the yield at time of purchase of U.S. Treasury Bill. |
| ** | Represents less than 0.05% |
| * | Non-Income producing security |
ADRS - American Depositary Receipts
PLC - Public Limited Company
The accompanying notes are an integral part of these financial statements.
19
| Redwood AlphaFactor® Tactical International Fund |
| PORTFOLIO OF INVESTMENTS (Continued) |
| October 31, 2019 |
| Portfolio Composition as of October 31, 2019 | ||||
| %of Market | ||||
| Holdings by Country | Value | |||
| United States | 42.04 | % | ||
| Japan | 17.19 | % | ||
| Canada | 16.00 | % | ||
| Brazil | 8.35 | % | ||
| Korea | 3.14 | % | ||
| Netherlands | 2.63 | % | ||
| China | 2.13 | % | ||
| Great Britain | 1.60 | % | ||
| Germany | 1.07 | % | ||
| Israel | 1.07 | % | ||
| Switzerland | 1.06 | % | ||
| Colombia | 0.54 | % | ||
| Italy | 0.54 | % | ||
| Sweden | 0.54 | % | ||
| Spain | 0.53 | % | ||
| Norway | 0.53 | % | ||
| Denmark | 0.53 | % | ||
| Indonesia | 0.51 | % | ||
| 100.0 | % | |||
The accompanying notes are an integral part of these financial statements.
20
| Redwood AlphaFactor® Tactical International Fund |
| PORTFOLIO OF INVESTMENTS (Continued) |
| October 31, 2019 |
TOTAL RETURN SWAPS *
| Appreciation | ||||||||||||||||
| Security | Number of Shares | Notional Value | Interest Rate Payable | Termination Date | Counterparty | (Depreciation) | ||||||||||
| Aboitiz Power Corp. | 1,227,600 | $ | 962,929 | 1-Mth LIBOR + 0.85% | 11/02/2020 | Barclays | $ | 3,523 | ||||||||
| Adecco N Ord Adecco Group Ag-reg | 8,906 | 490,418 | 1-Mth LIBOR + 0.35% | 09/09/2020 | Barclays | 29,058 | ||||||||||
| Advanced Info Service-for Rg | 134,600 | 1,035,949 | 1-Mth LIBOR + 0.85% | 09/09/2020 | Barclays | (20,651 | ) | |||||||||
| Anhui Conch Cement Co. Ltd-h | 89,000 | 4,245,981 | 1-Mth HIBOR + 0.40% | 09/09/2020 | Barclays | (17,467 | ) | |||||||||
| Ap Moeller-Maersk | 877 | 7,061,414 | 1-Mth DKCIBOR + 0.40% | 11/02/2020 | Barclays | (1,543 | ) | |||||||||
| Atlantia Ord Atlantia Spa | 21,649 | 518,229 | 1-Mth EIBOR + 0.40% | 09/09/2020 | Barclays | (45,291 | ) | |||||||||
| Baic Motor Corp. Ltd. | 1,731,500 | 8,422,189 | 1-Mth HIBOR + 0.40% | 11/03/2020 | Barclays | 3,513 | ||||||||||
| Bank Leumi LE-Israel | 145,647 | 3,741,045 | 1-Mth ILSTELBOR + 1.5% | 10/30/2020 | Barclays | (1,062 | ) | |||||||||
| Caitong SEC Co, | 756,200 | 1,069,342 | 1-Mth LIBOR + 0.85% | 10/30/2020 | Barclays | 133 | ||||||||||
| Catcher Technology Co, Ltd. | 124,000 | 1,052,190 | 1-Mth LIBOR + 0.80% | 11/03/2020 | Barclays | (1,221 | ) | |||||||||
| China Galaxy SEC | 2,057,000 | 8,259,061 | 1-Mth HIBOR + 0.40% | 11/03/2020 | Barclays | (1,338 | ) | |||||||||
| China International Capital | 577,600 | 8,301,787 | 1-Mth HIBOR + 0.40% | 11/03/2020 | Barclays | (2,425 | ) | |||||||||
| China Life Insurance Co-h | 207,000 | 3,973,156 | 1-Mth HIBOR + 0.40% | 09/09/2020 | Barclays | 25,389 | ||||||||||
| China Merch SEC | 457,978 | 1,070,478 | 1-Mth LIBOR + 0.85% | 10/30/2020 | Barclays | (296 | ) | |||||||||
| China Yangtze Power | 425,200 | 1,082,134 | 1-Mth LIBOR + 0.85% | 10/30/2020 | Barclays | (2,725 | ) | |||||||||
| Deutsche Telekom | 30,229 | 477,222 | 1-Mth LIBOR + 0.40% | 11/02/2020 | Barclays | (637 | ) | |||||||||
| Ecopetrol Sa | 587,241 | 499,944 | 3-Mth LIBOR + 1.5% | 09/09/2020 | Barclays | 23,659 | ||||||||||
| Electricity Gen Pub | 90,700 | 1,046,315 | 1-Mth LIBOR + 0.85% | 11/03/2020 | Barclays | (3,994 | ) | |||||||||
| Epiroc AB-A | 94,399 | 10,264,032 | 1-Mth STIBOR + 0.35% | 11/02/2020 | Barclays | (1,277 | ) | |||||||||
| Equinor ASA | 28,233 | 4,808,196 | 1-Mth NIBOR + 0.40% | 11/02/2020 | Barclays | (630 | ) | |||||||||
| Genting Sp Genting Singapore Ltd. | 1,543,500 | 1,406,875 | 1-Mth SOR + 0.40% | 09/09/2020 | Barclays | 29,529 | ||||||||||
| Glaxosmithkline Glaxosmithkline Plc | 23,049 | 387,504 | 1-Mth LIBOR + 0.50% | 09/09/2020 | Barclays | 24,185 | ||||||||||
| Globalwafers | 86,000 | 1,032,387 | 1-Mth LIBOR + 0.80% | 11/03/2020 | Barclays | (1,195 | ) | |||||||||
| Grupo Aeroport Del | 63,620 | 1,045,816 | 3-Mth LIBOR + 0.50% | 10/30/2020 | Barclays | (526 | ) | |||||||||
| Grupo Mex Sab De | 394,891 | 1,042,733 | 3-Mth LIBOR + 0.50% | 10/30/2020 | Barclays | 3,403 | ||||||||||
| Gudang Garam TBK PT | 265,500 | 1,066,752 | 1-Mth LIBOR + 0.85% | 11/03/2020 | Barclays | (5,660 | ) | |||||||||
| Guosen SEC Co. Ltd.-A | 616,000 | 1,069,068 | 1-Mth LIBOR + 0.85% | 10/29/2020 | Barclays | 1,757 | ||||||||||
| Heidelbergcement AG | 7,174 | 478,505 | 1-Mth LIBOR + 0.40% | 11/02/2020 | Barclays | (639 | ) | |||||||||
| Industrial SEC Co,-A | 1,187,020 | 1,078,645 | 1-Mth LIBOR + 0.85% | 10/30/2020 | Barclays | (2,205 | ) | |||||||||
| iShares MSCI ACWI U | 113,957 | 5,240,420 | 3-Mth LIBOR + 0.45% | 09/09/2020 | Barclays | 150,430 | ||||||||||
| Jiangxi Copper Co. | 916,000 | 8,426,009 | 1-Mth HIBOR + 0.40% | 11/03/2020 | Barclays | (1,017 | ) | |||||||||
| Kasikornbank PCL | 235,500 | 1,092,178 | 1-Mth LIBOR + 0.85% | 11/03/2020 | Barclays | (4,175 | ) | |||||||||
| Koninkijke Aho Koninklijke Ahold Delhaize N | 21,125 | 461,491 | 1-Mth EIBOR + 0.40% | 09/09/2020 | Barclays | 9,913 | ||||||||||
| Krung Thai Bank | 1,941,200 | 1,071,348 | 1-Mth LIBOR + 0.85% | 11/03/2020 | Barclays | (107,015 | ) | |||||||||
| NEC Corp. | 26,400 | 113,690,280 | 1-Mth LIBOR + 0.35% | 11/02/2020 | Barclays | (1,575 | ) | |||||||||
| Novartis N Ord Novartis Ag-reg | 6,040 | 533,296 | 1-Mth LIBOR + 0.35% | 09/09/2020 | Barclays | (14,977 | ) | |||||||||
| Novozymes B Ord Novozymes A/s-b Shares | 9,551 | 3,498,426 | 1-Mth DKCIBOR + 0.40% | 11/02/2020 | Barclays | (626 | ) | |||||||||
| Orion OYJ | 23,409 | 931,390 | 1-Mth LIBOR + 0.40% | 11/02/2020 | Barclays | (1,246 | ) | |||||||||
| Petronas DAGA BHD | 187,900 | 1,065,750 | 1-Mth LIBOR + 0.85% | 11/03/2020 | Barclays | (6,297 | ) | |||||||||
| Petronas Gas BHD | 266,700 | 1,068,774 | 1-Mth LIBOR + 0.85% | 11/03/2020 | Barclays | (6,697 | ) | |||||||||
| Proximus | 34,890 | 961,673 | 1-Mth LIBOR + 0.40% | 11/02/2020 | Barclays | (1,285 | ) | |||||||||
| Ptt Exploration & Prod-for | 246,900 | 1,002,686 | 1-Mth LIBOR + 0.85% | 09/09/2020 | Barclays | (22,153 | ) | |||||||||
| Royal Dutch Shell | 17,685 | 392,724 | 1-Mth LIBOR + 0.40% | 11/02/2020 | Barclays | (609 | ) | |||||||||
| RTL Group | 20,860 | 952,282 | 1-Mth LIBOR + 0.40% | 11/02/2020 | Barclays | (2,120 | ) | |||||||||
| SAIC Motor Corp. Ltd. | 321,000 | 1,073,328 | 1-Mth LIBOR + 0.85% | 11/04/2020 | Barclays | (1,107 | ) | |||||||||
| Shaanxi Coal Industry Co. L-a | 880,896 | 1,133,469 | 1-Mth LIBOR + 0.85% | 09/09/2020 | Barclays | (88,476 | ) | |||||||||
| Swedish Match O Swedish Match Ab | 22,568 | 9,243,602 | 1-Mth STIBOR + 0.35% | 09/09/2020 | Barclays | 101,927 | ||||||||||
| Taiwan High Speed Rail Corp. | 896,000 | 1,091,149 | 1-Mth LIBOR + 0.75% | 09/09/2020 | Barclays | (34,773 | ) | |||||||||
| Telefonica Sa O Telefonica Sa | 69,202 | 465,041 | 1-Mth EIBOR + 0.35% | 09/09/2020 | Barclays | 10,543 | ||||||||||
| Telekomunikasi Indonesia | 1,742,800 | 511,860 | 1-Mth LIBOR + 0.85% | 11/03/2020 | Barclays | (1,573 | ) | |||||||||
| Telenet Grp Hld Telenet Group Holding Nv | 22,154 | 960,822 | 1-Mth EIBOR + 0.40% | 09/09/2020 | Barclays | 12,440 | ||||||||||
| Teliasonera Ord Telia Co. Ab | 120,615 | 5,149,025 | 1-Mth STIBOR + 0.35% | 09/09/2020 | Barclays | (3,117 | ) | |||||||||
| United Microelectric Corp. | 2,235,000 | 1,029,888 | 1-Mth LIBOR + 0.80% | 11/03/2020 | Barclays | (1,981 | ) | |||||||||
| Weichai Power Co. Ltd-h | 661,000 | 8,492,462 | 1-Mth HIBOR + 0.40% | 09/09/2020 | Barclays | (43,587 | ) | |||||||||
| Wolters Kluwer Wolters Kluwer | 7,165 | 470,588 | 1-Mth EIBOR + 0.40% | 09/09/2020 | Barclays | 802 | ||||||||||
| Total | $ | (24,984 | ) | |||||||||||||
| * | The swaps provide exposure to the total returns on the securities that are calculated on a daily basis. Under the terms of the swaps, the Advisor has the ability to periodically adjust the notional level of the swaps. In addition, the Fund will receive the total return on the securities, including dividends and provide a fee to the counterparty. The swap do not reset; payments only occur at termination. |
The accompanying notes are an integral part of these financial statements.
21
| Redwood Systematic Macro Trend (“SMarT”) Fund |
| PORTFOLIO OF INVESTMENTS |
| October 31, 2019 |
| Shares | Fair Value | |||||||
| COMMON STOCK - 21.2% | ||||||||
| ADVERTISING - 0.9% | ||||||||
| 15,541 | Interpublic Group of Cos, Inc. | $ | 338,017 | |||||
| 4,092 | Omnicom Group, Inc. | 315,861 | ||||||
| 653,878 | ||||||||
| AGRICULTURE - 0.9% | ||||||||
| 7,111 | Altria Group, Inc. | 318,502 | ||||||
| 4,310 | Philip Morris International, Inc. | 351,006 | ||||||
| 669,508 | ||||||||
| APPAREL - 0.5% | ||||||||
| 15,092 | Tapestry, Inc. | 390,279 | ||||||
| AUTO MANUFACTURERS - 0.4% | ||||||||
| 33,873 | Ford Motor Co. | 290,969 | ||||||
| BEVERAGES - 0.4% | ||||||||
| 6,052 | Molson Coors Brewing Co | 319,061 | ||||||
| BIOTECHNOLOGY - 0.4% | ||||||||
| 4,902 | Gilead Sciences, Inc. | 312,306 | ||||||
| CHEMICALS - 0.9% | ||||||||
| 4,741 | Eastman Chemical Co. | 360,506 | ||||||
| 4,017 | LyondellBasell Industries NV | 360,325 | ||||||
| 720,831 | ||||||||
| COMMERCIAL SERVICES - 0.4% | ||||||||
| 15,019 | Nielsen Holdings PLC | 302,783 | ||||||
| COMPUTERS - 1.7% | ||||||||
| 2,300 | International Business Machines Corp. | 307,579 | ||||||
| 6,477 | NetApp, Inc. | 361,935 | ||||||
| 6,189 | Seagate Technology PLC | 359,148 | ||||||
| 5,451 | Western Digital Corp. | 281,544 | ||||||
| 1,310,206 | ||||||||
| COSMETICS / PERSONAL CARE - 0.5% | ||||||||
| 32,678 | Coty, Inc. | 382,006 | ||||||
| DIVERSIFIED FINANCIAL SERVICES - 1.9% | ||||||||
| 19,704 | Invesco Ltd. | 331,421 | ||||||
| 30,000 | TD Ameritrade Holding Corp. | 1,151,400 | ||||||
| 1,482,821 | ||||||||
| ELECTRIC - 2.1% | ||||||||
| 11,137 | CenterPoint Energy, Inc. | 323,753 | ||||||
| 4,011 | Dominion Energy, Inc. | 331,108 | ||||||
| 3,341 | Duke Energy Corp. | 314,923 | ||||||
| 10,527 | PPL Corp. | 352,549 | ||||||
| 5,349 | Southern Co. | 335,168 | ||||||
| 1,657,501 | ||||||||
| FOOD - 0.5% | ||||||||
| 12,147 | Kraft Heinz Co. | 392,713 | ||||||
The accompanying notes are an integral part of these financial statements.
22
| Redwood Systematic Macro Trend (“SMarT”) Fund |
| PORTFOLIO OF INVESTMENTS (Continued) |
| October 31, 2019 |
| Shares | Fair Value | |||||||
| COMMON STOCK - 21.2% (Continued) | ||||||||
| FOREST PRODUCTS & PAPER - 0.4% | ||||||||
| 7,941 | International Paper Co. | $ | 346,863 | |||||
| IRON / STEEL - 0.4% | ||||||||
| 6,336 | Nucor Corp. | 341,194 | ||||||
| MACHINERY - CONSTRUCTION & MINING - 0.5% | ||||||||
| 2,611 | Caterpillar, Inc. | 359,796 | ||||||
| MACHINERY - DIVERSIFIED - 0.5% | ||||||||
| 2,075 | Cummins, Inc. | 357,896 | ||||||
| MISCELLANEOUS MANUFACTURING - 0.8% | ||||||||
| 1,924 | 3M Co. | 317,441 | ||||||
| 3,828 | Eaton Corp PLC | 333,457 | ||||||
| 650,898 | ||||||||
| OIL & GAS - 1.2% | ||||||||
| 4,541 | Exxon Mobil Corp. | 306,835 | ||||||
| 8,247 | Helmerich & Payne, Inc. | 309,262 | ||||||
| 7,199 | Occidental Petroleum Corp. | 291,559 | ||||||
| 907,656 | ||||||||
| OIL & GAS SERVICES - 0.4% | ||||||||
| 9,624 | Schlumberger Ltd. | 314,609 | ||||||
| PACKAGING & CONTAINERS - 0.4% | ||||||||
| 9,069 | Westrock Co. | 338,909 | ||||||
| PHARMACEUTICALS - 1.8% | ||||||||
| 4,723 | AbbVie, Inc. | 375,715 | ||||||
| 6,466 | Bristol-Myers Squibb Co. | 370,954 | ||||||
| 7,196 | Cardinal Health, Inc. | 355,842 | ||||||
| 8,745 | Pfizer, Inc. | 335,546 | ||||||
| 1,438,057 | ||||||||
| PIPELINES - 0.4% | ||||||||
| 13,156 | Williams Cos, Inc. | 293,510 | ||||||
| RETAIL - 1.2% | ||||||||
| 19,568 | Gap, Inc. | 318,176 | ||||||
| 18,634 | L Brands, Inc. | 317,523 | ||||||
| 21,004 | Macy’s, Inc. | 318,421 | ||||||
| 954,120 | ||||||||
| SEMICONDUCTORS - 0.4% | ||||||||
| 1,101 | Broadcom, Inc. | 322,428 | ||||||
The accompanying notes are an integral part of these financial statements.
23
| Redwood Systematic Macro Trend (“SMarT”) Fund |
| PORTFOLIO OF INVESTMENTS (Continued) |
| October 31, 2019 |
| Shares | Fair Value | |||||||
| COMMON STOCK - 21.2% (Continued) | ||||||||
| TELECOMMUNICATIONS - 1.3% | ||||||||
| 8,810 | AT&T, Inc. | $ | 339,097 | |||||
| 27,364 | CenturyLink, Inc. | 354,090 | ||||||
| 5,335 | Verizon Communications, Inc. | 322,607 | ||||||
| 1,015,794 | ||||||||
| TOTAL COMMON STOCK (Cost - $16,116,128) | 16,526,592 | |||||||
| EXCHANGE TRADED FUNDS - 19.9% | ||||||||
| EQUITY FUNDS - 19.9% | ||||||||
| 47,859 | iShares Core S&P Small-Cap ETF | 3,800,962 | ||||||
| 118,971 | Schwab International Small-Cap Equity ETF | 3,933,181 | ||||||
| 36,945 | Vanguard FTSE All World ex-US Small-Cap ETF | 3,904,717 | ||||||
| 24,649 | Vanguard Small-Cap ETF | 3,855,843 | ||||||
| TOTAL EXCHANGE TRADED FUNDS (Cost - $15,069,392) | 15,494,703 | |||||||
| REITS - 1.7% | ||||||||
| 9,733 | Iron Mountain, Inc. | 319,242 | ||||||
| 16,867 | Kimco Realty Corp. | 363,653 | ||||||
| 10,915 | Macerich Co. | 300,163 | ||||||
| 2,083 | Simon Property Group, Inc. | 313,866 | ||||||
| TOTAL REITS ( Cost - $1,365,330) | 1,296,924 | |||||||
| Interest Rate | ||||||||||
| SHORT-TERM INVESTMENTS - 0.0% ** | ||||||||||
| MONEY MARKET FUNDS - 0.0% ** | ||||||||||
| 29,125 | JPMorgan 100% US Treasury Securities Money Market Fund-Institutional Class | 1.62% + | 29,125 | |||||||
| 23 | JPMorgan US Government Money Market Fund-Institutional Class | 1.67% + | 23 | |||||||
| 24 | JPMorgan US Treasury Plus Money Market Fund-Institutional Class | 1.62% + | 24 | |||||||
| TOTAL SHORT-TERM INVESTMENTS (Cost - $29,172) | 29,172 | |||||||||
| Principal Amount | Interest Rate | Maturity Date | Fair Value | |||||||||||||
| U.S. GOVERNMENT OBLIGATIONS - 51.2% | $ | 2,000,000 | 1.77% | 12/26/2019 | 1,995,317 | |||||||||||
| U.S. TREASURY BILL* - 51.2% | 35,000,000 | 1.65% | 1/2/2020 | 34,907,022 | ||||||||||||
| 3,000,000 | 1.62% | 1/9/2020 | 2,991,217 | |||||||||||||
| TOTAL U.S. GOVERNMENT OBLIGATIONS (COST - $39,886,091) | 39,893,556 | |||||||||||||||
| TOTAL INVESTMENTS - 94.0% (Cost - $72,466,113) | $ | 73,240,947 | ||||||||||||||
| CASH, OTHER ASSETS AND LIABILITIES - NET - 6.0% | 4,712,012 | |||||||||||||||
| TOTAL NET ASSETS - 100.0% | $ | 77,952,959 | ||||||||||||||
| * | Interest rate shown is the discounted rate at time of purchase of US Treasury Bill as of October 31, 2019. |
| ** | Represents less than 0.05% |
| + | Variable rate security. 7 day yield as of October 31, 2019. |
ETF - Exchange Traded Fund
FTSE - Financial Times Stock Exchange
PLC - Public Limited Company
S&P - Standard and Poor’s
The accompanying notes are an integral part of these financial statements.
24
| Redwood Systematic Macro Trend (“SMarT”) Fund |
| PORTFOLIO OF INVESTMENTS (Continued) |
| October 31, 2019 |
Total Return Swaps *
| Unrealized | ||||||||||||||||
| Appreciation | ||||||||||||||||
| Security | Number of Shares | Notional Value | Interest Rate Payable | Termination Date | Counterparty | (Depreciation) | ||||||||||
| Ishares Core S&P Small Cap ETF | 44,146 | $ | 3,436,325 | 1-Mth LIBOR + 40 bps | 6/24/2020 | Barclays | $ | 63,091 | ||||||||
| Ishares IBOXX High Yield Corporate Bond | 139,500 | 12,160,215 | 1-Mth LIBOR - 10 bps | 4/6/2020 | Barclays | (51,102 | ) | |||||||||
| Ishares Preferred & Income | 328,130 | 12,314,719 | 1-Mth LIBOR + 35 bps | 4/6/2020 | Barclays | (1,474 | ) | |||||||||
| ISHARES S&P 500 GROWTH ETF | 39,768 | 7,159,433 | 1-Mth LIBOR + 40 bps | 8/16/2020 | Barclays | 108,387 | ||||||||||
| SPDR BBG BARC Convertible | 228,745 | 11,997,675 | 1-Mth LIBOR + 40 bps | 4/6/2020 | Barclays | 181,526 | ||||||||||
| Total | $ | 300,428 | ||||||||||||||
| * | The swaps provide exposure to the total returns on the securities that are calculated on a daily basis. Under the terms of the swaps, the Advisor has the ability to periodically adjust the notional level of the swaps. In addition, the Fund will receive the total return on the securities, including dividends and provide a fee to the counterparty. The swaps are reset monthly. |
The accompanying notes are an integral part of these financial statements.
25
| Redwood Activist LeadersTM Fund |
| PORTFOLIO OF INVESTMENTS |
| October 31, 2019 |
| Shares | Fair Value | |||||||
| COMMON STOCK - 98.9% | ||||||||
| AUTO MANUFACTURERS - 2.7% | ||||||||
| 36,286 | Navistar International Corp. * | $ | 1,135,026 | |||||
| AUTO PARTS & EQUIPMENT- 5.2% | ||||||||
| 51,994 | Adient PLC | 1,101,753 | ||||||
| 87,877 | Tenneco, Inc. | 1,106,371 | ||||||
| 2,208,124 | ||||||||
| BIOTECHNOLOGY - 5.3% | ||||||||
| 97,743 | Innoviva, Inc. * | 1,135,774 | ||||||
| 21,274 | Medicines Co. * | 1,116,672 | ||||||
| 2,252,446 | ||||||||
| CHEMICALS - 2.7% | ||||||||
| 54,650 | GCP Applied Technologies, Inc. * | 1,129,069 | ||||||
| COMMERCIAL SERVICES - 5.3% | ||||||||
| 83,624 | Hertz Global Holdings, Inc. * | 1,129,760 | ||||||
| 55,611 | Nielsen Holdings PLC | 1,121,118 | ||||||
| 2,250,878 | ||||||||
| COMPUTERS - 8.0% | ||||||||
| 184,109 | Conduent, Inc. * | 1,137,794 | ||||||
| 35,984 | ForeScout Technologies, Inc. * | 1,106,868 | ||||||
| 19,501 | Seagate Technology PLC | 1,131,643 | ||||||
| 3,376,305 | ||||||||
| DISTRIBUTION / WHOLESALE - 5.3% | ||||||||
| 32,857 | LKQ Corp. * | 1,116,809 | ||||||
| 22,633 | WESCO International, Inc. * | 1,135,045 | ||||||
| 2,251,854 | ||||||||
| DIVERSIFIED FINANCIAL SERVICES - 2.7% | ||||||||
| 134,822 | SLM Corp. | 1,137,898 | ||||||
| ELECTRONICS - 2.7% | ||||||||
| 48,723 | nVent Electric PLC | 1,123,552 | ||||||
| FOOD - 5.3% | ||||||||
| 24,332 | Campbell Soup Co. | 1,126,815 | ||||||
| 47,729 | Hain Celestial Group, Inc. * | 1,128,314 | ||||||
| 2,255,129 | ||||||||
| HEALTHCARE-SERVICES - 2.7% | ||||||||
| 17,334 | Magellan Health, Inc. * | 1,124,977 | ||||||
| HOUSEWARES - 2.7% | ||||||||
| 59,108 | Newell Brands, Inc. | 1,121,279 | ||||||
The accompanying notes are an integral part of these financial statements.
26
| Redwood Activist LeadersTMFund |
| PORTFOLIO OF INVESTMENTS (Continued) |
| October 31, 2019 |
| Shares | Fair Value | |||||||
| COMMON STOCK - 98.9% (Continued) | ||||||||
| INTERNET - 2.7% | ||||||||
| 49,463 | Symantec Corp. | $ | 1,131,713 | |||||
| LEISURE TIME - 2.7% | ||||||||
| 55,874 | Callaway Golf Co. | 1,129,772 | ||||||
| LODGING - 2.7% | ||||||||
| 91,679 | Caesars Entertainment Corp. * | 1,125,818 | ||||||
| MACHINERY-DIVERSIFIED - 2.7% | ||||||||
| 60,105 | Welbilt, Inc. * | 1,139,591 | ||||||
| MISCELLANEOUS MANUFACTURING - 2.7% | ||||||||
| 56,864 | Trinity Industries, Inc. | 1,124,770 | ||||||
| OFFICE & BUSINESS EQUIPMENT - 2.7% | ||||||||
| 33,207 | Xerox Holdings Corp. | 1,126,713 | ||||||
| PHARMACEUTICALS - 5.3% | ||||||||
| 25,414 | Herbalife Nutrition Ltd. * | 1,135,243 | ||||||
| 110,051 | Ironwood Pharmaceuticals, Inc. * | 1,104,912 | ||||||
| 2,240,155 | ||||||||
| PIPELINES - 2.7% | ||||||||
| 18,258 | Cheniere Energy, Inc. * | 1,123,780 | ||||||
| PRIVATE EQUITY - 2.7% | ||||||||
| 39,323 | KKR & Co., Inc. | 1,133,682 | ||||||
| RETAIL - 10.7% | ||||||||
| 56,749 | Bloomin’ Brands, Inc. | 1,124,198 | ||||||
| 1,445 | Chipotle Mexican Grill, Inc. * | 1,124,441 | ||||||
| 19,143 | Papa John’s International, Inc. | 1,120,823 | ||||||
| 9,039 | Tiffany & Co. | 1,125,446 | ||||||
| 4,494,908 | ||||||||
| SAVINGS & LOANS - 2.7% | ||||||||
| 93,745 | Investors Bancorp, Inc. | 1,129,627 | ||||||
| SOFTWARE - 8.0% | ||||||||
| 67,250 | Box, Inc. * | 1,137,870 | ||||||
| 132,515 | Cloudera, Inc. * | 1,123,727 | ||||||
| 22,565 | CommVault Systems, Inc. * | 1,120,804 | ||||||
| 3,382,401 | ||||||||
| TOTAL COMMON STOCK (Cost - $40,023,379) | 41,649,467 | |||||||
| TOTAL INVESTMENTS - 98.9% (Cost - $40,023,379) | $ | 41,649,467 | ||||||
| CASH, OTHER ASSETS AND LIABILITIES - NET - 1.1% | 478,162 | |||||||
| TOTAL NET ASSETS - 100.0% | $ | 42,127,629 | ||||||
| * | Non-Income producing security. |
PLC - Public Limited Company
The accompanying notes are an integral part of these financial statements.
27
| Redwood Funds |
| STATEMENTS OF ASSETS AND LIABILITIES |
| October 31, 2019 |
| Redwood Managed | Redwood Managed | Redwood AlphaFactor® | ||||||||||
| Volatility Fund | Municipal Income Fund | Tactical Core Fund | ||||||||||
| Assets: | ||||||||||||
| Investment Securities: | ||||||||||||
| At Cost | $ | 319,849,750 | $ | 167,479,775 | $ | 104,904,916 | ||||||
| At Fair Value | 319,917,746 | 177,531,217 | 108,920,482 | |||||||||
| Cash | 14,748,516 | * | 2,290,324 | * | 3,128,933 | |||||||
| Unrealized Appreciation on Swap Contracts | 2,469,305 | — | — | |||||||||
| Deposit at Broker for open Swap Contracts | 9,027,113 | — | — | |||||||||
| Receivable for Fund Shares Sold | 211,237 | 127,897 | 85,477 | |||||||||
| Dividends and Interest Receivable | — | 585,008 | 57,824 | |||||||||
| Prepaid Expenses and Other Assets | 49,165 | 25,474 | 54,662 | |||||||||
| Total Assets | 346,423,082 | 180,559,920 | 112,247,378 | |||||||||
| Liabilities: | ||||||||||||
| Distribution (12b-1) Fees Payable | 1,248 | 19 | 133 | |||||||||
| Swap Interest Payable | 375,418 | — | — | |||||||||
| Unrealized Depreciation on Swap Contracts | 215,185 | — | ||||||||||
| Investment Advisory Fees Payable | 328,587 | 13,877 | 61,877 | |||||||||
| Payable for Fund Shares Redeemed | 262,664 | 111,285 | 27,273 | |||||||||
| Payable to Related Parties | 15,807 | 4,429 | 2,769 | |||||||||
| Accrued Expenses and Other Liabilities | 58,702 | — | 59,186 | |||||||||
| Total Liabilities | 1,257,611 | 1 29,610 | 151,238 | |||||||||
| Net Assets | $ | 345,165,471 | $180,430, 310 | $ | 112,096,140 | |||||||
| Class I Net Assets | $ | 64,402,940 | $ | 180,341,788 | $ | 111,451,573 | ||||||
| Shares of Beneficial Interest Outstanding (no par value; unlimited shares authorized) | 4,255,218 | 11,081,880 | 7,115,961 | |||||||||
| Net Asset Value (Net Assets/Shares Outstanding), Offering and Redemption Price Per Share | $ | 15.14 | $ | 16.27 | $ | 15.66 | ||||||
| Class N Net Assets | $ | 5,821,436 | $ | 88,522 | $ | 644,567 | ||||||
| Shares of Beneficial Interest Outstanding (no par value; unlimited shares authorized) | 379,838 | 5,239 | 41,261 | |||||||||
| Net Asset Value (Net Assets/Shares Outstanding), Offering and Redemption Price Per Share | $ | 15.33 | $ | 16.90 | $ | 15.62 | ||||||
| Class Y Net Assets | $ | 274,941,095 | ||||||||||
| Shares of Beneficial Interest Outstanding (no par value; unlimited shares authorized) | 18,032,195 | |||||||||||
| Net Asset Value (Net Assets/Shares Outstanding), Offering and Redemption Price Per Share | $ | 15.25 | ||||||||||
| Net Assets Consist Of: | ||||||||||||
| Paid-in-Capital | $ | 360,288,609 | $ | 172,295,479 | $ | 110,371,673 | ||||||
| Accumulated Earnings (Deficits) | (15,123,138 | ) | 8,134,831 | 1,724,467 | ||||||||
| Net Assets | $ | 345,165,471 | $ | 180,430,310 | $ | 112,096,140 | ||||||
| * | All or portion of the cash is held in a segregated Barclays account. |
The accompanying notes are an integral part of these financial statements.
28
| Redwood Funds |
| STATEMENTS OF ASSETS AND LIABILITIES |
| October 31, 2019 |
| Redwood AlphaFactor® | Redwood Systematic | Redwood Activist | ||||||||||
| Tactical International Fund | Macro Trend “SMarT” Fund | LeadersTMFund | ||||||||||
| Assets: | ||||||||||||
| Investment Securities: | ||||||||||||
| At Cost | $ | 99,082,950 | $ | 72,466,113 | $ | 40,023,379 | ||||||
| At Fair Value | 99,561,518 | 73,240,947 | 41,649,467 | |||||||||
| Cash | 11,395,139 | * | 4,343,956 | 674,197 | ||||||||
| Receivable for securities sold | 36,047,668 | — | 2,338,610 | |||||||||
| Unrealized Appreciation on Swap Contracts | 430,204 | 353,004 | — | |||||||||
| Foreign Cash | 369,221 | — | — | |||||||||
| Receivable for Fund Shares Sold | 71,500 | 45,308 | 21,048 | |||||||||
| Dividends and Interest Receivable | 1,394,435 | 93,569 | 11,433 | |||||||||
| Prepaid Expenses and Other Assets | 19,475 | 14,520 | 12,669 | |||||||||
| Total Assets | 149,289,160 | 78,091,304 | 44,707,424 | |||||||||
| Liabilities: | ||||||||||||
| Payable for Investments Purchased | 39,775,987 | — | 2,541,073 | |||||||||
| Distribution (12b-1) Fees Payable | 7 | 16 | — | |||||||||
| Unrealized Depreciation on Swap Contracts | 455,188 | 52,576 | — | |||||||||
| Investment Advisory Fees Payable | 62,203 | 52,696 | 15,613 | |||||||||
| Payable for Fund Shares Redeemed | 120,909 | 13,122 | 7,348 | |||||||||
| Payable to Related Parties | 1,527 | 1,239 | 1,779 | |||||||||
| Accrued Expenses and Other Liabilities | 17,856 | 18,696 | 13,982 | |||||||||
| Total Liabilities | 40,433,677 | 138,345 | 2,579,795 | |||||||||
| Net Assets | $ | 108,855,483 | $ | 77,952,959 | $ | 42,127,629 | ||||||
| Class I Net Assets | $ | 108,823,375 | $ | 77,875,080 | $ | 42,127,614 | ||||||
| Shares of Beneficial Interest Outstanding (no par value; unlimited shares authorized) | 7,560,455 | 5,283,739 | 2,860,062 | |||||||||
| Net Asset Value (Net Assets/Shares Outstanding), Offering and Redemption Price Per Share | $ | 14.39 | $ | 14.74 | $ | 14.73 | ||||||
| Class N Net Assets | $ | 32,108 | $ | 77,879 | $ | 15 | ||||||
| Shares of Beneficial Interest Outstanding (no par value; unlimited shares authorized) | 2,204 | 5,226 | 1 | |||||||||
| Net Asset Value (Net Assets/Shares Outstanding), Offering and Redemption Price Per Share | $ | 14.57 | $ | 14.90 | $ | 14.67 | ** | |||||
| Net Assets Consist Of: | ||||||||||||
| Paid-in-Capital | $ | 114,981,777 | $ | 79,325,118 | $ | 44,584,349 | ||||||
| Accumulated Earnings (Deficits) | (6,126,294 | ) | (1,372,159 | ) | (2,456,720 | ) | ||||||
| Net Assets | $ | 108,855,483 | $ | 77,952,959 | $ | 42,127,629 | ||||||
| * | All or portion of the cash is held in a segregated Barclays account. |
| ** | NAV does not recalculate due to rounding of shares of beneficial interest outstanding. |
The accompanying notes are an integral part of these financial statements.
29
| Redwood Funds |
| STATEMENTS OF OPERATIONS |
| For the Year Ended October 31, 2019 |
| Redwood Managed | Redwood Managed | Redwood AlphaFactor® | ||||||||||
| Volatility Fund | Municipal Income Fund | Tactical Core Fund | ||||||||||
| Investment Income: | ||||||||||||
| Dividend Income | $ | — | $ | 6,640,419 | $ | 1,700,321 | ||||||
| Interest Income | 4,635,290 | 351,376 | 346,522 | |||||||||
| Total Investment Income | 4,635,290 | 6,991,795 | 2,046,843 | |||||||||
| Expenses: | ||||||||||||
| Investment Advisory Fees | 4,229,173 | 1,184,758 | 793,626 | |||||||||
| Distribution (12b-1) Fees | 29,372 | 296 | 1,867 | |||||||||
| Third Party Administrative Servicing Fees | 427,240 | 208,516 | 135,450 | |||||||||
| Administrative Fees | 174,097 | 91,363 | 42,328 | |||||||||
| Transfer Agent Fees | 149,665 | 132,579 | 14,170 | |||||||||
| Registration Fees | 76,545 | 41,782 | 37,995 | |||||||||
| Printing Expense | 64,329 | 23,075 | 8,758 | |||||||||
| Legal fees | 47,248 | 41,758 | 41,041 | |||||||||
| Insurance Expense | 44,243 | 12,114 | 9,082 | |||||||||
| Fund Accounting Fees | 43,555 | 25,874 | 21,139 | |||||||||
| Custody Fees | 42,707 | 23,159 | 12,384 | |||||||||
| Chief Compliance Officer Fees | 15,569 | 13,197 | 8,041 | |||||||||
| Trustees’ Fees | 14,055 | 15,822 | 15,339 | |||||||||
| Audit Fees | 13,988 | 12,637 | 16,336 | |||||||||
| Miscellaneous Expenses | 3,508 | 15,130 | 4,387 | |||||||||
| Total Expenses | 5,375,294 | 1,842,060 | 1,161,943 | |||||||||
| Fees Reimbursed by the Advisor | (409,145 | ) | (148,961 | ) | (100,519 | ) | ||||||
| Net Expenses | 4,966,149 | 1,693,099 | 1,061,424 | |||||||||
| Net Investment Income (Loss) | (330,859 | ) | 5,298,696 | 985,419 | ||||||||
| Net Realized and Unrealized Gain (Loss) on Investments: | ||||||||||||
| Net Realized Gain (Loss) from Security Transactions: | ||||||||||||
| Investments | (13,193,737 | ) | 10,820 | (2,862,415 | ) | |||||||
| Swap Contracts | 18,578,610 | — | — | |||||||||
| Net Change in Unrealized Appreciation on: | ||||||||||||
| Investments | 9,428,826 | 10,051,442 | 7,903,674 | |||||||||
| Swap Contracts | 2,533,280 | — | — | |||||||||
| Net Realized and Unrealized Gain on Investments | 17,346,979 | 10,062,262 | 5,041,259 | |||||||||
| Net Increase in Net Assets Resulting From Operations | $ | 17,016,120 | $ | 15,360,958 | $ | 6,026,678 | ||||||
The accompanying notes are an integral part of these financial statements.
30
| Redwood Funds |
| STATEMENTS OF OPERATIONS |
| For the Year Ended October 31, 2019 |
| Redwood AlphaFactor® | Redwood Systematic | Redwood Activist | ||||||||||
| Tactical International Fund | Macro Trend “SMarT” Fund | LeadersTMFund | ||||||||||
| Investment Income: | ||||||||||||
| Dividend Income (Less: Foreign Withholding Tax $114,847, $0, $0) | $ | 927,234 | $ | 1,051,634 | $ | 483,403 | ||||||
| Interest Income | 1,325,786 | 764,719 | 5,848 | |||||||||
| Total Investment Income | 2,253,020 | 1,816,353 | 489,251 | |||||||||
| Expenses: | ||||||||||||
| Investment Advisory Fees | 845,781 | 643,768 | 206,235 | |||||||||
| Distribution (12b-1) Fees - Class N | 218 | 287 | 66 | |||||||||
| Third Party Administrative Servicing Fees | 128,259 | 83,556 | 41,041 | |||||||||
| Administrative Fees | 54,748 | 33,585 | 19,709 | |||||||||
| Registration Fees | 14,262 | 26,676 | 18,658 | |||||||||
| Legal fees | 34,802 | 21,108 | 20,303 | |||||||||
| Fund Accounting Fees | 21,393 | 19,148 | 17,561 | |||||||||
| Custody Fees | 17,166 | 6,898 | 5,759 | |||||||||
| Audit Fees | 13,848 | 13,271 | 13,228 | |||||||||
| Trustees’ Fees | 12,082 | 16,557 | 12,132 | |||||||||
| Transfer Agent Fees | 11,847 | 8,999 | 7,321 | |||||||||
| Insurance Expense | 7,600 | 6,026 | 2,958 | |||||||||
| Printing Expense | 8,914 | 8,673 | 6,057 | |||||||||
| Chief Compliance Officer Fees | 5,373 | 4,358 | 3,864 | |||||||||
| Miscellaneous Expenses | 8,507 | 7,138 | 4,416 | |||||||||
| Total Expenses | 1,184,800 | 900,048 | 379,308 | |||||||||
| Fees Reimbursed by the Advisor | (55,962 | ) | (62,061 | ) | (69,602 | ) | ||||||
| Net Expenses | 1,128,838 | 837,987 | 309,706 | |||||||||
| Net Investment Income | 1,124,182 | 978,366 | 179,545 | |||||||||
| Net Realized and Unrealized Gain (Loss) on Investments: | ||||||||||||
| Net Realized Gain (Loss) from Security Transactions: | ||||||||||||
| Investments and Foreign Exchange Transactions | (377,108 | ) | (3,098,640 | ) | (3,699,977 | ) | ||||||
| Swap Contracts | (1,660,061 | ) | 855,925 | — | ||||||||
| Net Change in Unrealized Appreciation (Depreciation) on: | ||||||||||||
| Investments and Foreign Exchange Transactions | 482,408 | 3,969,297 | 5,109,328 | |||||||||
| Swap Contracts | (24,984 | ) | 300,428 | — | ||||||||
| Net Realized and Unrealized Gain (Loss) on Investments | (1,579,745 | ) | 2,027,010 | 1,409,351 | ||||||||
| Net Increase (Decrease) in Net Assets Resulting From Operations | $ | (455,563 | ) | $ | 3,005,376 | $ | 1,588,896 | |||||
The accompanying notes are an integral part of these financial statements.
31
| Redwood Managed Volatility Fund |
| STATEMENTS OF CHANGES IN NET ASSETS |
| For the | For the | |||||||
| Year Ended | Year Ended | |||||||
| October 31, 2019 | October 31, 2018 | |||||||
| Operations: | ||||||||
| Net Investment Income | $ | (330,859 | ) | $ | 13,036,867 | |||
| Net Realized Gain (Loss) on Investments and Swaps | 5,384,873 | (3,824,827 | ) | |||||
| Net Change in Unrealized Appreciation (Depreciation) on Investments and Swaps | 11,962,106 | (12,508,280 | ) | |||||
| Net Increase (Decrease) in Net Assets Resulting From Operations | 17,016,120 | (3,296,240 | ) | |||||
| Distributions to Shareholders: | ||||||||
| Total Distributions Paid: | ||||||||
| Class I | (1,829,356 | ) | (4,264,701 | ) | ||||
| Class N | (188,233 | ) | (1,338,745 | ) | ||||
| Class Y | (8,714,219 | ) | (22,509,687 | ) | ||||
| Net Decrease in Net Assets Resulting From Distributions to Shareholders | (10,731,808 | ) | (28,113,133 | ) | ||||
| Capital Transactions: | ||||||||
| Class I Shares: | ||||||||
| Proceeds from Shares Issued | 35,053,715 | 25,385,126 | ||||||
| Distributions Reinvested | 1,665,038 | 3,688,511 | ||||||
| Redemption Fee Proceeds | — | 2,681 | ||||||
| Cost of Shares Redeemed | (25,408,852 | ) | (47,783,718 | ) | ||||
| Total From Capital Transactions: Class I | 11,309,901 | (18,707,400 | ) | |||||
| Class N Shares: | ||||||||
| Proceeds from Shares Issued | 4,215,053 | 5,565,868 | ||||||
| Distributions Reinvested | 179,614 | 1,297,950 | ||||||
| Redemption Fee Proceeds | — | 909 | ||||||
| Cost of Shares Redeemed | (12,287,694 | ) | (16,418,449 | ) | ||||
| Total From Capital Transactions: Class N | (7,893,027 | ) | (9,553,722 | ) | ||||
| Class Y Shares: | ||||||||
| Proceeds from Shares Issued | 104,876,459 | 135,738,820 | ||||||
| Distributions Reinvested | 8,118,519 | 20,309,801 | ||||||
| Redemption Fee Proceeds | — | 15,242 | ||||||
| Cost of Shares Redeemed | (127,980,235 | ) | (196,186,881 | ) | ||||
| Total From Capital Transactions: Class Y | (14,985,257 | ) | (40,123,018 | ) | ||||
| Total Decrease in Net Assets | (5,284,071 | ) | (99,793,513 | ) | ||||
| Nets Assets: | ||||||||
| Beginning of Year | 350,449,542 | 450,243,055 | ||||||
| End of Year | $ | 345,165,471 | $ | 350,449,542 | ||||
| SHARE ACTIVITY | ||||||||
| Class I: | ||||||||
| Shares Sold | 2,340,197 | 1,654,381 | ||||||
| Shares Reinvested | 111,117 | 242,119 | ||||||
| Shares Redeemed | (1,700,759 | ) | (3,129,144 | ) | ||||
| Net increase (decrease) in shares of beneficial interest outstanding | 750,555 | (1,232,644 | ) | |||||
| Class N: | ||||||||
| Shares Sold | 284,326 | 360,864 | ||||||
| Shares Reinvested | 12,098 | 85,209 | ||||||
| Shares Redeemed | (817,089 | ) | (1,081,018 | ) | ||||
| Net decrease in shares of beneficial interest outstanding | (520,665 | ) | (634,944 | ) | ||||
| Class Y: | ||||||||
| Shares Sold | 6,968,219 | 8,781,115 | ||||||
| Shares Reinvested | 538,706 | 1,326,798 | ||||||
| Shares Redeemed | (8,540,712 | ) | (12,888,351 | ) | ||||
| Net decrease in shares of beneficial interest outstanding | (1,033,787 | ) | (2,780,439 | ) | ||||
The accompanying notes are an integral part of these financial statements.
32
| Redwood Managed Municipal Income Fund |
| STATEMENTS OF CHANGES IN NET ASSETS |
| For the | For the | |||||||
| Year Ended | Year Ended | |||||||
| October 31, 2019 | October 31, 2018 | |||||||
| Operations: | ||||||||
| Net Investment Income | $ | 5,298,696 | $ | 2,805,036 | ||||
| Net Realized Gain (Loss) on Investments | 10,820 | (1,799,904 | ) | |||||
| Net Change in Unrealized Appreciation (Depreciation) on Investments | 10,051,442 | (517,462 | ) | |||||
| Net Increase in Net Assets Resulting From Operations | 15,360,958 | 487,670 | ||||||
| Distributions to Shareholders: | ||||||||
| Total Distributions Paid: | ||||||||
| Class I | (5,263,370 | ) | (2,891,500 | ) | ||||
| Class N | (1,470 | ) | (2,657 | ) | ||||
| Net Decrease in Net Assets Resulting From Distributions to Shareholders | (5,264,840 | ) | (2,894,157 | ) | ||||
| Capital Transactions: | ||||||||
| Class I Shares: | ||||||||
| Proceeds from Shares Issued | 70,220,747 | 158,086,866 | ||||||
| Distributions Reinvested | 4,957,585 | 2,771,551 | ||||||
| Cost of Shares Redeemed | (74,953,051 | ) | (35,048,961 | ) | ||||
| Total From Capital Transactions: Class I | 225,281 | 125,809,456 | ||||||
| Class N Shares: | ||||||||
| Proceeds from Shares Issued | 9,042 | 208,169 | ||||||
| Distributions Reinvested | 1,470 | 2,657 | ||||||
| Cost of Shares Redeemed | (92,995 | ) | (47,096 | ) | ||||
| Total From Capital Transactions: Class N | (82,483 | ) | 163,730 | |||||
| Total Increase in Net Assets | 10,238,916 | 123,566,699 | ||||||
| Nets Assets: | ||||||||
| Beginning of Year | 170,191,394 | 46,624,695 | ||||||
| End of Year | $ | 180,430,310 | $ | 170,191,394 | ||||
| SHARE ACTIVITY | ||||||||
| Class I: | ||||||||
| Shares Sold | 4,418,180 | 10,174,283 | ||||||
| Shares Reinvested | 311,287 | 178,979 | ||||||
| Shares Redeemed | (4,753,004 | ) | (2,264,076 | ) | ||||
| Net increase (decrease) in shares of beneficial interest outstanding | (23,537 | ) | 8,089,185 | |||||
| Class N: | ||||||||
| Shares Sold | 565 | 13,181 | ||||||
| Shares Reinvested | 93 | 168 | ||||||
| Shares Redeemed | (5,781 | ) | (2,987 | ) | ||||
| Net increase (decrease) in shares of beneficial interest outstanding | (5,123 | ) | 10,362 | |||||
The accompanying notes are an integral part of these financial statements.
33
| Redwood AlphaFactor® Tactical Core Fund |
| STATEMENTS OF CHANGES IN NET ASSETS |
| For the | For the | |||||||
| Year Ended | Year Ended | |||||||
| October 31, 2019 | October 31, 2018 | |||||||
| Operations: | ||||||||
| Net Investment Income | $ | 985,419 | $ | 865,760 | ||||
| Net Realized Gain (Loss) on Investments | (2,862,415 | ) | 5,912,134 | |||||
| Net Change in Unrealized Appreciation (Depreciation) on Investments | 7,903,674 | (5,972,064 | ) | |||||
| Net Increase in Net Assets Resulting From Operations | 6,026,678 | 805,830 | ||||||
| Distributions to Shareholders: | ||||||||
| Total Distributions Paid: | ||||||||
| Class I | (6,673,139 | ) | (1,080,117 | ) | ||||
| Class N | (92,693 | ) | (4,805 | ) | ||||
| Net Decrease in Net Assets Resulting From Distributions to Shareholders | (6,765,832 | ) | (1,084,922 | ) | ||||
| Capital Transactions: | ||||||||
| Class I Shares: | ||||||||
| Proceeds from Shares Issued | 54,800,959 | 43,846,982 | ||||||
| Distributions Reinvested | 6,648,433 | 1,076,875 | ||||||
| Cost of Shares Redeemed | (19,834,219 | ) | (35,933,478 | ) | ||||
| Total From Capital Transactions: Class I | 41,615,173 | 8,990,379 | ||||||
| Class N Shares: | ||||||||
| Proceeds from Shares Issued | 469,226 | 821,008 | ||||||
| Distributions Reinvested | 92,693 | 4,805 | ||||||
| Cost of Shares Redeemed | (753,075 | ) | (198,106 | ) | ||||
| Total From Capital Transactions: Class N | (191,156 | ) | 627,707 | |||||
| Total Increase in Net Assets | 40,684,863 | 9,338,994 | ||||||
| Nets Assets: | ||||||||
| Beginning of Year | 71,411,277 | 62,072,283 | ||||||
| End of Year | $ | 112,096,140 | $ | 71,411,277 | ||||
| SHARE ACTIVITY | ||||||||
| Class I: | ||||||||
| Shares Sold | 3,642,031 | 2,574,952 | ||||||
| Shares Reinvested | 450,741 | 63,160 | ||||||
| Shares Redeemed | (1,308,168 | ) | (2,093,688 | ) | ||||
| Net increase in shares of beneficial interest outstanding | 2,784,604 | 544,424 | ||||||
| Class N: | ||||||||
| Shares Sold | 30,930 | 48,563 | ||||||
| Shares Reinvested | 6,289 | 282 | ||||||
| Shares Redeemed | (50,306 | ) | (11,527 | ) | ||||
| Net increase (decrease) in shares of beneficial interest outstanding | (13,087 | ) | 37,318 | |||||
The accompanying notes are an integral part of these financial statements.
34
| Redwood AlphaFactor® Tactical International Fund |
| STATEMENT OF CHANGES IN NET ASSETS |
| For the | For the Period | |||||||
| Year Ended | November 2. 2017 | |||||||
| October 31, 2019 | Through October 31, 2018* | |||||||
| Operations: | ||||||||
| Net Investment Income | $ | 1,124,182 | $ | 347,237 | ||||
| Net Realized Loss on Investments | (2,037,169 | ) | (3,901,940 | ) | ||||
| Net Change in Unrealized Appreciation (Depreciation) on Investments | 457,424 | (269 | ) | |||||
| Net Decrease in Net Assets Resulting From Operations | (455,563 | ) | (3,554,972 | ) | ||||
| Distributions to Shareholders: | ||||||||
| Distributions from Paid in Capital: | ||||||||
| Class I | (248,502 | ) | (470,930 | ) | ||||
| Class N | (102 | ) | (742 | ) | ||||
| (248,604 | ) | (471,672 | ) | |||||
| Total Distributions Paid: | ||||||||
| Class I | (1,648,926 | ) | (1,258 | ) | ||||
| Class N | (679 | ) | — | |||||
| (1,649,605 | ) | (1,258 | ) | |||||
| Net Decrease in Net Assets Resulting From Distributions to Shareholders | (1,898,209 | ) | (472,930 | ) | ||||
| Capital Transactions: | ||||||||
| Class I Shares: | ||||||||
| Proceeds from Shares Issued | 44,124,261 | 94,190,208 | ||||||
| Distributions Reinvested | 1,896,687 | 472,135 | ||||||
| Cost of Shares Redeemed | (16,465,887 | ) | (9,009,068 | ) | ||||
| Total From Capital Transactions: Class I | 29,555,061 | 85,653,275 | ||||||
| Class N Shares: | ||||||||
| Proceeds from Shares Issued | 45,040 | 195,302 | ||||||
| Distributions Reinvested | 781 | 742 | ||||||
| Cost of Shares Redeemed | (172,904 | ) | (40,140 | ) | ||||
| Total From Capital Transactions: Class N | (127,083 | ) | 155,904 | |||||
| Total Increase in Net Assets | 27,074,206 | 81,781,277 | ||||||
| Nets Assets: | ||||||||
| Beginning of Period | 81,781,277 | — | ||||||
| End of Period | $ | 108,855,483 | $ | 81,781,277 | ||||
| SHARE ACTIVITY | ||||||||
| Class I: | ||||||||
| Shares Sold | 2,990,948 | 6,141,557 | ||||||
| Shares Reinvested | 128,058 | 32,112 | ||||||
| Shares Redeemed | (1,124,334 | ) | (607,887 | ) | ||||
| Net increase in shares of beneficial interest outstanding | 1,994,672 | 5,565,783 | ||||||
| Class N: | ||||||||
| Shares Sold | 3,002 | 13,076 | ||||||
| Shares Reinvested | 53 | 51 | ||||||
| Shares Redeemed | (11,275 | ) | (2,702 | ) | ||||
| Net increase (decrease) in shares of beneficial interest outstanding | (8,220 | ) | 10,424 | |||||
| * | Fund commenced operations on November 2, 2017. |
The accompanying notes are an integral part of these financial statements.
35
| Redwood Systematic Macro Trend (“SMarT”) Fund |
| STATEMENT OF CHANGES IN NET ASSETS |
| For the | For the Period | |||||||
| Year Ended | November 2. 2017 | |||||||
| October 31, 2019 | Through October 31, 2018* | |||||||
| Operations: | ||||||||
| Net Investment Income | $ | 978,366 | $ | 1,074,712 | ||||
| Net Realized Gain (Loss) on Investments | (2,242,715 | ) | 279,044 | |||||
| Net Change in Unrealized Appreciation (Depreciation) on Investments | 4,269,725 | (3,194,463 | ) | |||||
| Net Increase (Decrease) in Net Assets Resulting From Operations | 3,005,376 | (1,840,707 | ) | |||||
| Distributions to Shareholders: | ||||||||
| Total Distributions Paid: | ||||||||
| Class I | (1,457,765 | ) | (1,082,341 | ) | ||||
| Class N | (1,487 | ) | (2,009 | ) | ||||
| Net Decrease in Net Assets Resulting From Distributions to Shareholders | (1,459,252 | ) | (1,084,350 | ) | ||||
| Capital Transactions: | ||||||||
| Class I Shares: | ||||||||
| Proceeds from Shares Issued | 29,409,379 | 64,820,562 | ||||||
| Distributions Reinvested | 1,452,254 | 1,082,256 | ||||||
| Cost of Shares Redeemed | (10,224,474 | ) | (7,289,612 | ) | ||||
| Total From Capital Transactions: Class I | 20,637,159 | 58,613,206 | ||||||
| Class N Shares: | ||||||||
| Proceeds from Shares Issued | 48,825 | 174,655 | ||||||
| Distributions Reinvested | 1,487 | 2,009 | ||||||
| Cost of Shares Redeemed | (111,432 | ) | (34,017 | ) | ||||
| Total From Capital Transactions: Class N | (61,120 | ) | 142,647 | |||||
| Total Increase in Net Assets | 22,122,163 | 55,830,796 | ||||||
| Nets Assets: | ||||||||
| Beginning of Period | 55,830,796 | — | ||||||
| End of Period | $ | 77,952,959 | $ | 55,830,796 | ||||
| SHARE ACTIVITY | ||||||||
| Class I: | ||||||||
| Shares Sold | 2,045,005 | 4,256,106 | ||||||
| Shares Reinvested | 101,223 | 71,781 | ||||||
| Shares Redeemed | (708,812 | ) | (481,564 | ) | ||||
| Net increase in shares of beneficial interest outstanding | 1,437,416 | 3,846,323 | ||||||
| Class N: | ||||||||
| Shares Sold | 3,354 | 11,577 | ||||||
| Shares Reinvested | 105 | 133 | ||||||
| Shares Redeemed | (7,695 | ) | (2,247 | ) | ||||
| Net increase (decrease) in shares of beneficial interest outstanding | (4,236 | ) | 9,462 | |||||
| * | Fund commenced operations on November 2, 2017. |
The accompanying notes are an integral part of these financial statements.
36
| Redwood Activist LeadersTM Fund |
| STATEMENT OF CHANGES IN NET ASSETS |
| For the | For the Period | |||||||
| Year Ended | November 2. 2017 | |||||||
| October 31, 2019 | Through October 31, 2018* | |||||||
| Operations: | ||||||||
| Net Investment Income | $ | 179,545 | $ | 33,351 | ||||
| Net Realized Gain (Loss) on Investments | (3,699,977 | ) | 670,231 | |||||
| Net Change in Unrealized Appreciation (Depreciation) on Investments | 5,109,328 | (3,483,240 | ) | |||||
| Net Increase (Decrease) in Net Assets Resulting From Operations | 1,588,896 | (2,779,658 | ) | |||||
| Distributions to Shareholders: | ||||||||
| Distributions from Paid in Capital: | ||||||||
| Class I | (6,456 | ) | — | |||||
| Class N | (12 | ) | — | |||||
| (6,468 | ) | — | ||||||
| Distributions Paid: | ||||||||
| Class I | (1,233,526 | ) | (36,979 | ) | ||||
| Class N | (2,198 | ) | (24 | ) | ||||
| Total Distributions to Shareholders | (1,235,724 | ) | (37,003 | ) | ||||
| Net Decrease in Net Assets Resulting From Distributions to Shareholders | (1,242,192 | ) | (37,003 | ) | ||||
| Capital Transactions: | ||||||||
| Class I Shares: | ||||||||
| Proceeds from Shares Issued | 15,831,030 | 44,625,822 | ||||||
| Distributions Reinvested | 1,239,662 | 36,974 | ||||||
| Cost of Shares Redeemed | (5,985,293 | ) | (11,153,874 | ) | ||||
| Total From Capital Transactions: Class I | 11,085,399 | 33,508,922 | ||||||
| Class N Shares: | ||||||||
| Proceeds from Shares Issued | 7,105 | 81,358 | ||||||
| Distributions Reinvested | 2,209 | 24 | ||||||
| Cost of Shares Redeemed | (71,958 | ) | (15,473 | ) | ||||
| Total From Capital Transactions: Class N | (62,644 | ) | 65,909 | |||||
| Total Increase in Net Assets | 11,369,459 | 30,758,170 | ||||||
| Nets Assets: | ||||||||
| Beginning of Period | 30,758,170 | — | ||||||
| End of Period | $ | 42,127,629 | $ | 30,758,170 | ||||
| SHARE ACTIVITY | ||||||||
| Class I: | ||||||||
| Shares Sold | 1,113,059 | 2,763,890 | ||||||
| Shares Reinvested | 96,543 | 2,386 | ||||||
| Shares Redeemed | (422,465 | ) | (693,351 | ) | ||||
| Net increase in shares of beneficial interest outstanding | 787,137 | 2,072,925 | ||||||
| Class N: | ||||||||
| Shares Sold | 483 | 5,162 | ||||||
| Shares Reinvested | 174 | — | ||||||
| Shares Redeemed | (4,854 | ) | (965 | ) | ||||
| Net increase (decrease) in shares of beneficial interest outstanding | (4,197 | ) | 4,197 | |||||
| * | Fund commenced operations on November 2, 2017. |
The accompanying notes are an integral part of these financial statements.
37
| Redwood Managed Volatility Fund |
| FINANCIAL HIGHLIGHTS |
| Per Share Data and Ratios for a Share of Beneficial Interest Outstanding Throughout Each Year Presented |
| Class I | ||||||||||||||||||||
| For the | For the | For the | For the | For the | ||||||||||||||||
| Year Ended | Year Ended | Year Ended | Year Ended | Year Ended | ||||||||||||||||
| October 31, 2019 | October 31, 2018 | October 31, 2017 | October 31, 2016 | October 31, 2015 | ||||||||||||||||
| Net Asset Value, Beginning of Year | $ | 14.86 | $ | 15.95 | $ | 15.66 | $ | 14.60 | $ | 15.28 | ||||||||||
| Activity from Investment Operations: | ||||||||||||||||||||
| Net Investment Income (Loss) (a) | (0.01 | ) | 0.45 | 0.43 | 0.40 | 0.13 | ||||||||||||||
| Net Realized and Unrealized Gain (Loss) on Investments | 0.78 | (0.55 | ) | 0.51 | 1.00 | (0.65 | ) | |||||||||||||
| Total From Operations | 0.77 | (0.10 | ) | 0.94 | 1.40 | (0.52 | ) | |||||||||||||
| Less Distributions: | ||||||||||||||||||||
| From Net Investment Income | (0.49 | ) | (0.99 | ) | (0.65 | ) | (0.34 | ) | (0.16 | ) | ||||||||||
| Total Distributions | (0.49 | ) | (0.99 | ) | (0.65 | ) | (0.34 | ) | (0.16 | ) | ||||||||||
| Paid-in-Capital from Redemption Fees | — | 0.00 | (d) | 0.00 | (d) | 0.00 | (d) | 0.00 | (d) | |||||||||||
| Net Asset Value, End of Year | $ | 15.14 | $ | 14.86 | $ | 15.95 | $ | 15.66 | $ | 14.60 | ||||||||||
| Total Return (b) | 5.10 | % | (0.65 | )% | 6.24 | % | 9.72 | % | (3.39 | )% | ||||||||||
| Net Assets, End of Year (000’s) | $ | 64,403 | $ | 52,093 | $ | 75,575 | $ | 44,383 | $ | 48,132 | ||||||||||
| Ratio of Expenses to Average Net Assets (c)(e) | 1.58 | % | 1.50 | % | 1.43 | % | 1.52 | % | 1.73 | % | ||||||||||
| Ratio of Net Investment Income to Average Net Assets (c)(e) | (0.05 | )% | 2.94 | % | 2.72 | % | 2.71 | % | 0.88 | % | ||||||||||
| Portfolio Turnover Rate | 2 | % | 217 | % | 110 | % | 111 | % | 519 | % | ||||||||||
| Class N | ||||||||||||||||||||
| For the | For the | For the | For the | For the | ||||||||||||||||
| Year Ended | Year Ended | Year Ended | Year Ended | Year Ended | ||||||||||||||||
| October 31, 2019 | October 31, 2018 | October 31, 2017 | October 31, 2016 | October 31, 2015 | ||||||||||||||||
| Net Asset Value, Beginning of Year | $ | 14.84 | $ | 15.94 | $ | 15.65 | $ | 14.58 | $ | 15.28 | ||||||||||
| Activity from Investment Operations: | ||||||||||||||||||||
| Net Investment Income (Loss) (a) | (0.04 | ) | 0.40 | 0.38 | 0.36 | 0.10 | ||||||||||||||
| Net Realized and Unrealized Gain (Loss) on Investments | 0.76 | (0.54 | ) | 0.52 | 1.01 | (0.66 | ) | |||||||||||||
| Total From Operations | 0.72 | (0.14 | ) | 0.90 | 1.37 | (0.56 | ) | |||||||||||||
| Less Distributions: | ||||||||||||||||||||
| From Net Investment Income | (0.23 | ) | (0.96 | ) | (0.61 | ) | (0.30 | ) | (0.14 | ) | ||||||||||
| Total Distributions | (0.23 | ) | (0.96 | ) | (0.61 | ) | (0.30 | ) | (0.14 | ) | ||||||||||
| Paid-in-Capital from Redemption Fees | — | 0.00 | (d) | 0.00 | (d) | 0.00 | (d) | 0.00 | (d) | |||||||||||
| Net Asset Value, End of Year | $ | 15.33 | $ | 14.84 | $ | 15.94 | $ | 15.65 | $ | 14.58 | ||||||||||
| Total Return (b) | 4.93 | % | (0.97 | )% | 5.99 | % | 9.51 | % | (3.69 | )% | ||||||||||
| Ratios/Supplemental Data | ||||||||||||||||||||
| Net Assets, End of Year (000s) | $ | 5,821 | $ | 13,364 | $ | 24,473 | $ | 24,263 | $ | 20,107 | ||||||||||
| Ratio of Expenses to Average Net Assets (c) | 1.84 | % | 1.74 | % | 1.68 | % | 1.77 | % | 1.99 | % | ||||||||||
| Ratio of Net Investment Income to Average Net Assets (c)(e) | (0.23 | )% | 2.61 | % | 2.42 | % | 2.46 | % | 0.68 | % | ||||||||||
| Portfolio Turnover Rate | 2 | % | 217 | % | 110 | % | 111 | % | 519 | % | ||||||||||
| (a) | Per share amounts are calculated using the average shares method, which more appropriately presents the per share data for the period. |
| (b) | Total returns are historical in nature and assume changes in share price, reinvestment of dividends and capital gains distributions, if any. Total returns for periods less than one year are not annualized. |
| (c) | Does not include expenses of other investment companies in which the Fund invests. |
| (d) | Amount is less than $0.005 per share. |
| (e) | Recognition of net investment income by the Fund is affected by the timing of declaration of dividends by underlying investment companies in which the Fund invests. |
The accompanying notes are an integral part of these financial statements.
38
| Redwood Managed Volatility Fund |
| FINANCIAL HIGHLIGHTS |
| Per Share Data and Ratios for a Share of Beneficial Interest Outstanding Throughout Each Year Presented |
| Class Y | ||||||||||||||||||||
| For the | For the | For the | For the | For the | ||||||||||||||||
| Year Ended | Year Ended | Year Ended | Year Ended | Year Ended | ||||||||||||||||
| October 31, 2019 | October 31, 2018 | October 31, 2017 | October 31, 2016 | October 31, 2015 | ||||||||||||||||
| Net Asset Value, Beginning of Year | $ | 14.95 | $ | 16.03 | $ | 15.74 | $ | 14.66 | $ | 15.32 | ||||||||||
| Activity from Investment Operations: | ||||||||||||||||||||
| Net Investment Income (a) | 0.02 | 0.46 | 0.43 | 0.40 | 0.17 | |||||||||||||||
| Net Realized and Unrealized Gain (Loss) on Investments | 0.77 | (0.55 | ) | 0.51 | 1.02 | (0.66 | ) | |||||||||||||
| Total From Operations | 0.79 | (0.09 | ) | 0.94 | 1.42 | (0.49 | ) | |||||||||||||
| Less Distributions: | ||||||||||||||||||||
| From Net Investment Income | (0.49 | ) | (0.99 | ) | (0.65 | ) | (0.34 | ) | (0.17 | ) | ||||||||||
| Total Distributions | (0.49 | ) | (0.99 | ) | (0.65 | ) | (0.34 | ) | (0.17 | ) | ||||||||||
| Paid-in-Capital from Redemption Fees | — | 0.00 | (f) | 0.00 | (f) | 0.00 | (f) | 0.00 | (f) | |||||||||||
| Net Asset Value, End of Year | $ | 15.25 | $ | 14.95 | $ | 16.03 | $ | 15.74 | $ | 14.66 | ||||||||||
| Total Return (b) | 5.34 | % | (0.64 | )% | 6.20 | % | 9.82 | % | (3.25 | )% | ||||||||||
| Net Assets, End of Year (000’s) | $ | 274,941 | $ | 284,993 | $ | 350,196 | $ | 208,186 | $ | 207,455 | ||||||||||
| Ratio of gross expenses to average net assets (c) | 1.58 | % (d) | 1.46 | % (d) | 1.43 | % | 1.52 | % (d) | 1.72 | % (d) | ||||||||||
| Ratio of net expenses to average net assets (c) | 1.43 | % | 1.48 | % (e) | 1.50 | % | 1.50 | % | 1.50 | % | ||||||||||
| Ratio of Net Investment Income to Average Net Assets (c)(g) | 0.12 | % | 3.01 | % | 2.72 | % | 2.69 | % | 1.15 | % | ||||||||||
| Portfolio Turnover Rate | 2 | % | 217 | % | 110 | % | 111 | % | 519 | % | ||||||||||
| (a) | Per share amounts are calculated using the average shares method, which more appropriately presents the per share data for the period. |
| (b) | Total returns are historical in nature and assume changes in share price, reinvestment of dividends and capital gains distributions, if any. Had the Advisor not absorbed a portion of Fund expenses, total returns would have been lower. In periods where the Advisor recaptures a portion of the Funds expenses total returns would have been higher. Total returns for periods less than one year are not annualized. |
| (c) | Does not include expenses of other investment companies in which the Fund invests |
| (d) | Represents the ratio of expenses to average net assets absent fee waivers and/or expense reimbursements by the Advisor |
| (e) | Represents the ratio of expenses to average net assets inclusive of the Advisor’s recapture of waived/expense reimbursed fees from prior periods. |
| (f) | Amount is less than $0.005 per share. |
| (g) | Recognition of net investment income by the Fund is affected by the timing of declaration of dividends by underlying investment companies in which the Fund invests. |
The accompanying notes are an integral part of these financial statements.
39
| Redwood Managed Municipal Income Fund |
| FINANCIAL HIGHLIGHTS |
| Per Share Data and Ratios for a Share of Beneficial Interest Outstanding Throughout The Periods Presented |
| Class I | Class N | |||||||||||||||||||||||
| For the | For the | For the | For the | For the | For the | |||||||||||||||||||
| Year Ended | Year Ended | Period Ended | Year Ended | Year Ended | Period Ended | |||||||||||||||||||
| October 31, 2019 | October 31, 2018 | October 31, 2017 * | October 31, 2019 | October 31, 2018 | October 31, 2017 * | |||||||||||||||||||
| Net Asset Value, Beginning of Period | $ | 15.31 | $ | 15.46 | $ | 15.00 | $ | 15.61 | $ | 15.72 | $ | 15.00 | ||||||||||||
| Activity from Investment Operations: | ||||||||||||||||||||||||
| Net Investment Income (a) | 0.50 | 0.42 | 0.37 | 0.45 | 0.33 | — | ||||||||||||||||||
| Net Realized and Unrealized Gain (Loss) on Investments | 0.95 | (0.18 | ) | 0.37 | 1.00 | (0.12 | ) | 0.72 | ||||||||||||||||
| Total From Operations | 1.45 | 0.24 | 0.74 | 1.45 | 0.21 | 0.72 | ||||||||||||||||||
| Less Distributions: | ||||||||||||||||||||||||
| From Net Investment Income | (0.49 | ) | (0.39 | ) | (0.28 | ) | (0.16 | ) | (0.32 | ) | — | |||||||||||||
| Total Distributions | (0.49 | ) | (0.39 | ) | (0.28 | ) | (0.16 | ) | (0.32 | ) | — | |||||||||||||
| Net Asset Value, End of Period | $ | 16.27 | $ | 15.31 | $ | 15.46 | $ | 16.90 | $ | 15.61 | $ | 15.72 | ||||||||||||
| Total Return (b) | 9.62 | % | 1.64 | % | 4.93 | % (i) | 9.35 | % | 1.31 | % | 4.80 | % (i) | ||||||||||||
| Net Assets, End of Period (000’s) | $ | 180,342 | $ | 170,030 | $ | 46,625 | $ | 89 | $ | 162 | $ | 16 | (h) | |||||||||||
| Ratio of Gross Expenses to Average Net Assets including interest expense (e) | 1.09 | % (g) | 1.04 | % | 1.44 | % (c,g) | 1.34 | % (g) | 1.25 | % | 1.69 | % (c,g) | ||||||||||||
| Ratio of Net Expenses to Average Net Assets including interest expense (e) | 1.00 | % | 1.04 | % | 1.23 | % (c) | 1.25 | % | 1.25 | % | 1.48 | % (c) | ||||||||||||
| Ratio of Gross Expenses to Average Net Assets excluding interest expense (e) | 1.09 | % (g) | 0.96 | % | 1.22 | % (c,g) | 1.34 | % (g) | 1.22 | % | 1.47 | % (c,g) | ||||||||||||
| Ratio of Net Expenses to Average Net Assets excluding interest expense (e) | 1.00 | % | 0.96 | % | 1.00 | % (c) | 1.25 | % | 1.22 | % | 1.25 | % (c) | ||||||||||||
| Ratio of Net Investment Income to Average Net Assets (e,f) | 3.13 | % | 2.73 | % | 3.77 | % (c) | 2.78 | % | 2.08 | % | 0.00 | % (c) | ||||||||||||
| Portfolio Turnover Rate | 7 | % | 280 | % | 24 | % (d) | 7 | % | 280 | % | 24 | % (d) | ||||||||||||
| * | Fund commenced operations on March 9, 2017 |
| (a) | Per share amounts are calculated using the average shares method, which more appropriately presents the per share data for the period. |
| (b) | Total returns are historical in nature and assume changes in share price, reinvestment of dividends and capital gains distributions, if any. Total returns for periods less than one year are not annualized. |
| (c) | Annualized. |
| (d) | Not annualized. |
| (e) | Does not include expenses of other investment companies in which the Fund invests. |
| (f) | Recognition of net investment income by the Fund is affected by the timing of declaration of dividends by underlying investment companies in which the Fund invests. |
| (g) | Represents the ratio of expenses to average net assets absent fee waivers and/or expense reimbursements by the Advisor. |
| (h) | Amount is actual; not presented in thousands. |
| (i) | Includes adjustments in accordance with accounting principles generally accepted in the United States and, consequently, the net asset value for financial reporting purposes and the returns based upon those net asset values may differ from the net asset values and returns for shareholder transactions. |
The accompanying notes are an integral part of these financial statements.
40
| Redwood AlphaFactor® Tactical Core Fund |
| FINANCIAL HIGHLIGHTS |
| Per Share Data and Ratios for a Share of Beneficial Interest Outstanding Throughout The Periods Presented |
| Class I | Class N | |||||||||||||||||||||||
| For the | For the | For the | For the | For the | For the | |||||||||||||||||||
| Year Ended | Year Ended | Period Ended | Year Ended | Year Ended | Period Ended | |||||||||||||||||||
| October 31, 2019 | October 31, 2018 | October 31, 2017* | October 31, 2019 | October 31, 2018 | October 31, 2017 * | |||||||||||||||||||
| Net Asset Value, Beginning of Period | $ | 16.28 | $ | 1 6.32 | $ | 15.00 | $ | 16.25 | $ | 1 6.32 | $ | 15.00 | ||||||||||||
| Activity from Investment Operations: | ||||||||||||||||||||||||
| Net Investment Income (Loss) (a) | 0.17 | 0.19 | 0.07 | 0 .13 | 0.13 | (0.14 | ) | |||||||||||||||||
| Net Realized and Unrealized Gain on Investments | 0.71 | — | 1.25 | 0 .71 | 0.02 | 1.46 | ||||||||||||||||||
| Total From Operations | 0.88 | 0.19 | 1.32 | 0.84 | 0.15 | 1.32 | ||||||||||||||||||
| Less Distributions: | ||||||||||||||||||||||||
| From Net Investment Income | (0.09 | ) | (0.13 | ) | — | (0.06 | ) | (0.12 | ) | — | ||||||||||||||
| From Net Realized Gains | (1.41 | ) | (0.10 | ) | — | (1.41 | ) | (0.10 | ) | — | ||||||||||||||
| Total Distributions | (1.50 | ) | (0.23 | ) | — | (1.47 | ) | (0.22 | ) | — | ||||||||||||||
| Net Asset Value, End of Period | $ | 15.66 | $ | 16.28 | $ | 16.32 | $ | 15.62 | $ | 16.25 | $ | 16.32 | ||||||||||||
| Total Return (b) | 6.00 | % | 1.12 | % | 8.80 | % | 5.72 | % | 0.89 | % | 8.80 | % | ||||||||||||
| Net Assets, End of Period (000’s) | $ | 111,452 | $ | 70,528 | $ | 61,794 | $ | 645 | $ | 883 | $ | 278 | (h) | |||||||||||
| Ratio of Gross Expenses to Average Net Assets (e,f) | 1.31 | % | 1.21 | % | 1.37 | % (c) | 1.56 | % | 1.47 | % | 1.62 | % (c) | ||||||||||||
| Ratio of Net Expenses to Average Net Assets (e) | 1.20 | % | 1.20 | % | 1.20 | % (c) | 1.45 | % | 1.45 | % | 1.45 | % (c) | ||||||||||||
| Ratio of Net Investment Income (Loss) to Average Net Assets (e,g) | 1.15 | % | 1.10 | % | 0.71 | % (c) | 0.87 | % | 0.78 | % | (1.33 | )% (c) | ||||||||||||
| Portfolio Turnover Rate | 146 | % | 128 | % | 8 | % (d) | 146 | % | 128 | % | 8 | % (d) | ||||||||||||
| * | Fund commenced operations on March 9, 2017 |
| (a) | Per share amounts are calculated using the average shares method, which more appropriately presents the per share data for the period. |
| (b) | Total returns are historical in nature and assume changes in share price, reinvestment of dividends and capital gains distributions, if any. Total returns for periods less than one year are not annualized. |
| (c) | Annualized. |
| (d) | Not annualized. |
| (e) | Does not include expenses of other investment companies in which the Fund invests. |
| (f) | Represents the ratio of expenses to average net assets absent fee waivers and/or expense reimbursements by the Advisor. |
| (g) | Recognition of net investment income by the Fund is affected by the timing of declaration of dividends by underlying investment companies in which the Fund invests. |
| (h) | Amount is actual; not presented in thousands. |
The accompanying notes are an integral part of these financial statements.
41
| Redwood AlphaFactor® Tactical International Fund |
| FINANCIAL HIGHLIGHTS |
| Per Share Data and Ratios for a Share of Beneficial Interest Outstanding Throughout The Periods Presented |
| Class I | Class N | |||||||||||||||
| For the | For the Period | For the | For the Period | |||||||||||||
| Year Ended, | November 2, 2017 | Year Ended, | November 2, 2017 | |||||||||||||
| October 31, 2019 | Through October 31, 2018 * | October 31, 2019 | Through October 31, 2018 * | |||||||||||||
| Net Asset Value, Beginning of Period | $ | 14.67 | $ | 15.00 | $ | 14.66 | $ | 15.00 | ||||||||
| Activity from Investment Operations: | ||||||||||||||||
| Net Investment Income (a) | 0.18 | 0.08 | 0.17 | 0.06 | ||||||||||||
| Net Realized and Unrealized Loss on Investments | (0.17 | ) | (0.32 | ) | (0.19 | ) | (0.33 | ) | ||||||||
| Total From Operations | 0.01 | (0.24 | ) | (0.02 | ) | (0.27 | ) | |||||||||
| Less Distributions: | ||||||||||||||||
| From Paid in Capital | (0.02 | ) | (0.09 | ) | (0.02 | ) | (0.07 | ) | ||||||||
| From Net Investment Income | (0.27 | ) | (0.00 | ) (h) | (0.05 | ) | (0.00 | ) (h) | ||||||||
| Total Distributions | (0.29 | ) | (0.09 | ) | (0.07 | ) | (0.07 | ) | ||||||||
| Net Asset Value, End of Period | $ | 14.39 | $ | 14.67 | $ | 14.57 | $ | 14.66 | ||||||||
| Total Return (b) | 0.04 | % | (1.58 | )% | (0.16 | )% | (1.79 | )% | ||||||||
| Net Assets, End of Period (000’s) | $ | 108,823 | $ | 81,628 | $ | 32 | $ | 153 | ||||||||
| Ratio of Gross Expenses to Average Net Assets (e,f) | 1.26 | % | 1.23 | % (c) | 1.51 | % | 1.51 | % (c) | ||||||||
| Ratio of Net Expenses to Average Net Assets (e) | 1.20 | % | 1.20 | % (c) | 1.45 | % | 1.45 | % (c) | ||||||||
| Ratio of Net Investment Income (Loss) to Average Net Assets (e,g) | 1.19 | % | 0.55 | % (c) | 1.17 | % | 0.38 | % (c) | ||||||||
| Portfolio Turnover Rate | 344 | % | 682 | % (d) | 344 | % | 682 | % (d) | ||||||||
| * | Fund commenced operations on November 2, 2017 |
| (a) | Per share amounts are calculated using the average shares method, which more appropriately presents the per share data for the period. |
| (b) | Total returns are historical in nature and assume changes in share price, reinvestment of dividends and capital gains distributions, if any. Total returns for periods less than one year are not annualized. |
| (c) | Annualized. |
| (d) | Not annualized. |
| (e) | Does not include expenses of other investment companies in which the Fund invests. |
| (f) | Represents the ratio of expenses to average net assets absent fee waivers and/or expense reimbursements by the Advisor. |
| (g) | Recognition of net investment income by the Fund is affected by the timing of declaration of dividends by underlying investment companies in which the Fund invests. |
| (h) | Amount represents less than $0.005. |
The accompanying notes are an integral part of these financial statements.
42
| Redwood Systematic Macro Trend (“SMarT”) Fund |
| FINANCIAL HIGHLIGHTS |
| Per Share Data and Ratios for a Share of Beneficial Interest Outstanding Throughout The Periods Presented |
| Class I | Class N | |||||||||||||||
| For the | For the Period | For the | For the Period | |||||||||||||
| Year Ended | November 2, 2017 | Year Ended | November 2, 2017 | |||||||||||||
| October 31, 2019 | Through October 31, 2018 * | October 31, 2019 | Through October 31, 2018 * | |||||||||||||
| Net Asset Value, Beginning of Period | $ | 14.48 | $ | 15.00 | $ | 14.47 | $ | 15.00 | ||||||||
| Activity from Investment Operations: | ||||||||||||||||
| Net Investment Income (a) | 0.22 | 0.35 | 0.20 | 0.28 | ||||||||||||
| Net Realized and Unrealized Gain (Loss) on Investments | 0.37 | (0.53 | ) | 0.36 | (0.50 | ) | ||||||||||
| Total From Operations | 0.59 | (0.18 | ) | 0.56 | (0.22 | ) | ||||||||||
| Less Distributions: | ||||||||||||||||
| From Net Realized Gains | (0.00 | ) (h) | — | (0.00 | ) (h) | — | ||||||||||
| From Net Investment Income | (0.33 | ) | (0.34 | ) | (0.13 | ) | (0.31 | ) | ||||||||
| Total Distributions | (0.33 | ) | (0.34 | ) | (0.13 | ) | (0.31 | ) | ||||||||
| Net Asset Value, End of Period | $ | 14.74 | $ | 14.48 | $ | 14.90 | $ | 14.47 | ||||||||
| Total Return (b) | 4.16 | % | (1.27 | )% | 3.90 | % | (1.52 | )% | ||||||||
| Net Assets, End of Period (000’s) | $ | 77,875 | $ | 55,694 | $ | 78 | $ | 137 | ||||||||
| Ratio of Gross Expenses to Average Net Assets (e,f) | 1.40 | % | 1.41 | % (c) | 1.65 | % | 1.67 | % (c) | ||||||||
| Ratio of Net Expenses to Average Net Assets (e) | 1.30 | % | 1.30 | % (c) | 1.55 | % | 1.55 | % (c) | ||||||||
| Ratio of Net Investment Income (Loss) to Average Net Assets (e,g) | 1.52 | % | 2.30 | % (c) | 1.42 | % | 1.85 | % (c) | ||||||||
| Portfolio Turnover Rate | 256 | % | 20 | % (d) | 256 | % | 20 | % (d) | ||||||||
| * | Fund commenced operations on November 2, 2017 |
| (a) | Per share amounts are calculated using the average shares method, which more appropriately presents the per share data for the period. |
| (b) | Total returns are historical in nature and assume changes in share price, reinvestment of dividends and capital gains distributions, if any. Total returns for periods less than one year are not annualized |
| (c) | Annualized. |
| (d) | Not annualized. |
| (e) | Does not include expenses of other investment companies in which the Fund invests |
| (f) | Represents the ratio of expenses to average net assets absent fee waivers and/or expense reimbursements by the Advisor |
| (g) | Recognition of net investment income by the Fund is affected by the timing of declaration of dividends by underlying investment companies in which the Fund invests |
| (h) | Amount represents less than $0.005. |
The accompanying notes are an integral part of these financial statements.
43
| Redwood Activist LeadersTM Fund |
| FINANCIAL HIGHLIGHTS |
| Per Share Data and Ratios for a Share of Beneficial Interest Outstanding Throughout The Period Presented |
| Class I | Class N | |||||||||||||||
| For the | For the Period | For the | For the Period | |||||||||||||
| Year Ended | November 2, 2017 | Year Ended | November 2, 2017 | |||||||||||||
| October 31, 2019 | Through October 31, 2018 * | October 31, 2019 | Through October 31, 2018 * | |||||||||||||
| Net Asset Value, Beginning of Period | $ | 14.81 | $ | 15.00 | $ | 14.79 | $ | 15.00 | ||||||||
| Activity from Investment Operations: | ||||||||||||||||
| Net Investment Income (Loss) (a) | 0.08 | 0.02 | 0.06 | (0.02 | ) | |||||||||||
| Net Realized and Unrealized Gain (Loss) on Investments | 0.42 | (0.19 | ) | 0.38 | (0.18 | ) | ||||||||||
| Total From Operations | 0.50 | (0.17 | ) | 0.44 | (0.20 | ) | ||||||||||
| Less Distributions: | ||||||||||||||||
| From Paid in Capital | 0.00 | (h) | — | 0.00 | (h) | — | ||||||||||
| From Net Investment Income | (0.58 | ) | (0.02 | ) | (0.56 | ) | (0.01 | ) | ||||||||
| Total Distributions | (0.58 | ) | (0.02 | ) | (0.56 | ) | (0.01 | ) | ||||||||
| Paid-in-Capital from Redemption Fees | — | 0.00 | (h) | — | 0.00 | (h) | ||||||||||
| Net Asset Value, End of Period | $ | 14.73 | $ | 14.81 | $ | 14.67 | $ | 14.79 | ||||||||
| Total Return (b) | 4.02 | % | (1.14 | )% | 3.58 | % | (1.34 | )% | ||||||||
| Ratios/Supplemental Data | ||||||||||||||||
| Net Assets, End of Period | $ | 42,127,614 | $ | 30,696,083 | $ | 15 | $ | 62,087 | ||||||||
| Ratio of Gross Expenses to Average Net Assets (e,f) | 1.10 | % | 1.16 | % (c) | 1.35 | % | 1.40 | % (c) | ||||||||
| Ratio of Net Expenses to Average Net Assets (e) | 0.90 | % | 0.90 | % (c) | 1.15 | % | 1.15 | % (c) | ||||||||
| Ratio of Net Investment Income (Loss) to Average Net Assets (e,g) | 0.52 | % | 0.11 | % (c) | 0.40 | % | (0.11 | )% (c) | ||||||||
| Portfolio Turnover Rate | 92 | % | 111 | % (d) | 92 | % | 111 | % (d) | ||||||||
| * | Fund commenced operations on November 2, 2017 |
| (a) | Per share amounts are calculated using the average shares method, which more appropriately presents the per share data for the period. |
| (b) | Total returns are historical in nature and assume changes in share price, reinvestment of dividends and capital gains distributions, if any. Total returns for periods less than one year are not annualized. |
| (c) | Annualized. |
| (d) | Not annualized. |
| (e) | Does not include expenses of other investment companies in which the Fund invests. |
| (f) | Represents the ratio of expenses to average net assets absent fee waivers and/or expense reimbursements by the Advisor. |
| (g) | Recognition of net investment income by the Fund is affected by the timing of declaration of dividends by underlying investment companies in which the Fund invests. |
| (h) | Amount represents less than $0.005. |
The accompanying notes are an integral part of these financial statements.
44
| Redwood Funds |
| NOTES TO FINANCIAL STATEMENTS |
| October 31, 2019 |
| 1. | ORGANIZATION |
Redwood Managed Volatility Fund (the “Managed Volatility Fund”), Redwood Managed Municipal Income Fund (the “Municipal Income Fund”), Redwood AlphaFactor® Tactical Core Fund (the “Tactical Core Fund”), Redwood AlphaFactor®Tactical International Fund (the “Tactical International Fund”), Redwood Systematic Macro Trend (“SMarT”) Fund (the “SMarT Fund”), Redwood Activist Leaders™ Fund (the “Activist Leaders Fund”), each a (“Fund”) and collectively, (the “Funds”) are each a series of shares of beneficial interest of the Two Roads Shared Trust (the “Trust”), a statutory trust organized under the laws of the State of Delaware on June 8, 2012, and registered under the Investment Company Act of 1940, as amended (the “1940 Act”), as diversified, open-end management investment companies. The Managed Volatility Fund commenced investment operations on December 19, 2013. The Municipal Income Fund and Tactical Core Fund commenced operations on March 9, 2017. The Activist Leaders Fund, Tactical International Fund, and SMarT Fund commenced operations on November 2, 2017. The Managed Volatility Fund’s investment objective is to seek a combination of total return and prudent management of portfolio downside volatility and downside loss. The Municipal Income Fund seeks to generate tax-efficient income, while focusing on managing downside risk. The Tactical Core Fund seeks to generate long-term total return with capital preservation as a secondary objective. The Activist Leader Fund seeks to generate long-term capital growth. The Tactical International Fund seeks to generate long-term total return with capital preservation as a secondary objective. The SMarT Fund seeks to generate capital appreciation while focusing on managing downside risk.
The Managed Volatility Fund offers Class I, Class N and Class Y shares. The Municipal Income Fund, Tactical Core Fund, Tactical International Fund, SMarT Fund, and Activist Leaders Fund each offer Class I and Class N shares. All classes are sold at NAV. Each share class of a Fund represents an interest in the same assets of that Fund and classes are identical except for differences in their fees and ongoing service and distribution charges. All classes of shares have equal voting privileges except that each class has exclusive voting rights with respect to its service and/or distribution plans. Each Fund’s income, expenses (other than class specific distribution fees) and realized and unrealized gains and losses are allocated proportionately each day based upon the relative net assets of each class of the Fund.
| 2. | SUMMARY OF SIGNIFICANT ACCOUNTING POLICIES |
The following is a summary of significant accounting policies followed by the Funds in preparation of its financial statements. These policies are in conformity with accounting principles generally accepted in the United States of America (“GAAP”). The preparation of financial statements requires management to make estimates and assumptions that affect the reported amounts of assets and liabilities and disclosure of contingent assets and liabilities at the date of the financial statements and the reported amounts of income and expenses for the period. Actual results could differ from those estimates. The Funds are investment companies and accordingly follow the investment company accounting and reporting guidance of the Financial Accounting Standards Board (“FASB”) Accounting Standard Codification Topic 946 “Financial Services – Investment Companies”.
Security Valuation – Securities listed on an exchange are valued at the last reported sale price at the close of the regular trading session of the exchange on the business day the value is being determined, or in the case of securities listed on NASDAQ at the NASDAQ Official Closing Price. In the absence of a sale such securities shall be valued at the mean between the last bid and ask prices on the day of valuation. Total return swaps on exchange-listed securities shall be valued at the last quoted sales price or, in the absence of a sale, at the mean between the current bid and ask prices on the day of valuation on each underlying exchange-listed security. Exchange listed swaps shall be valued at the last quoted sales price or, in the absence of a sale, at the mean between the current bid and ask prices on the day of valuation. Short-term debt obligations, excluding U.S. Treasury Bills, having 60 days or less remaining until maturity, at time of purchase, may be valued at amortized cost.
Valuation of Underlying Funds –The Funds may invest in portfolios of open-end or closed-end investment companies (the “Underlying Funds”). The Underlying Funds value securities in their portfolios for which market quotations are readily available at their market values (generally the last reported sale price) and all other securities and assets at their fair value to the methods established by the board of directors of the Underlying Funds.
Open-end funds are valued at their respective net asset values as reported by such investment companies. The shares of many closed-end investment companies, after their initial public offering, frequently trade at a price per share, which is different than the net asset value per share. The difference represents a market premium or market discount of such shares.
45
| Redwood Funds |
| NOTES TO FINANCIAL STATEMENTS (Continued) |
| October 31, 2019 |
There can be no assurances that the market discount or premium on shares of any closed-end investment company purchased by the Funds will not change.
The Funds may hold securities, such as private investments, interests in commodity pools, other non-traded securities or temporarily illiquid securities, for which market quotations are not readily available or are determined to be unreliable. These securities will be valued using the “fair value” procedures approved by the Board. The Board has delegated execution of these procedures to a fair value team composed of one or more representatives from each of the (i) Trust, (ii) administrator, and (iii) advisor. The team may also enlist third party consultants such as a valuation specialist at a public accounting firm, valuation consultant or financial officer of a security issuer on an as-needed basis to assist in determining a security-specific fair value. The Board has also engaged a third party valuation firm to, as needed, attend valuation meetings held by the Trust, review minutes of such meetings and report to the Board on a quarterly basis. The Board reviews and ratifies the execution of this process and the resultant fair value prices at least quarterly to assure the process produces reliable results.
Fair Valuation Process –The applicable investments are valued collectively via inputs from each group within the fair value team. For example, fair value determinations are required for the following securities: (i) securities for which market quotations are insufficient or not readily available on a particular business day (including securities for which there is a short and temporary lapse in the provision of a price by the regular pricing source); (ii) securities for which, in the judgment of the advisor, the prices or values available do not represent the fair value of the instrument; factors which may cause the advisor to make such a judgment include, but are not limited to, the following: only a bid price or an ask price is available; the spread between bid and ask prices is substantial; the frequency of sales; the thinness of the market; the size of reported trades; and actions of the securities markets, such as the suspension or limitation of trading; (iii) securities determined to be illiquid; and (iv) securities with respect to which an event that will affect the value thereof has occurred (a “significant event”) since the closing prices were established on the principal exchange on which they are traded, but prior to a Fund’s calculation of its net asset value. Specifically, interests in commodity pools or managed futures pools are valued on a daily basis by reference to the closing market prices of each futures contract or other asset held by a pool, as adjusted for pool expenses. Restricted or illiquid securities, such as private investments or non-traded securities are valued via inputs from the advisor based upon the current bid for the security from two or more independent dealers or other parties reasonably familiar with the facts and circumstances of the security (who should take into consideration all relevant factors as may be appropriate under the circumstances). If the advisor is unable to obtain a current bid from such independent dealers or other independent parties, the fair value team shall determine the fair value of such security using the following factors: (i) the type of security; (ii) the cost at date of purchase; (iii) the size and nature of the Fund’s holdings; (iv) the discount from market value of unrestricted securities of the same class at the time of purchase and subsequent thereto; (v) information as to any transactions or offers with respect to the security; (vi) the nature and duration of restrictions on disposition of the security and the existence of any registration rights; (vii) how the yield of the security compares to similar securities of companies of similar or equal creditworthiness; (viii) the level of recent trades of similar or comparable securities; (ix) the liquidity characteristics of the security; (x) current market conditions; and (xi) the market value of any securities into which the security is convertible or exchangeable.
The Funds utilize various methods to measure the fair value of all of its investments on a recurring basis. GAAP establishes a hierarchy that prioritizes inputs to valuation methods. The three levels of input are:
Level 1 – Unadjusted quoted prices in active markets for identical assets and liabilities that the Funds have the ability to access.
Level 2 – Observable inputs other than quoted prices included in Level 1 that are observable for the asset or liability, either directly or indirectly. These inputs may include quoted prices for the identical instrument on an inactive market, prices for similar instruments, interest rates, prepayment speeds, credit risk, yield curves, default rates and similar data.
Level 3 –Unobservable inputs for the asset or liability, to the extent relevant observable inputs are not available, representing the Funds own assumptions about the assumptions a market participant would use in valuing the asset or liability, and would be based on the best information available.
The availability of observable inputs can vary from security to security and is affected by a wide variety of factors, including, for example, the type of security, whether the security is new and not yet established in the marketplace, the liquidity of markets, and other characteristics particular to the security. To the extent that valuation is based on models or inputs that
46
| Redwood Funds |
| NOTES TO FINANCIAL STATEMENTS (Continued) |
| October 31, 2019 |
are less observable or unobservable in the market, the determination of fair value requires more judgment. Accordingly, the degree of judgment exercised in determining fair value is greatest for instruments categorized in Level 3.
The inputs used to measure fair value may fall into different levels of the fair value hierarchy. In such cases, for disclosure purposes, the level in the fair value hierarchy within which the fair value measurement falls in its entirety, is determined based on the lowest level input that is significant to the fair value measurement in its entirety.
The inputs or methodology used for valuing securities are not necessarily an indication of the risk associated with investing in those securities. The following tables summarize the inputs used as of October 31, 2019 for the Funds’ assets and liabilities measured at fair value:
| Redwood Managed Volatility Fund | ||||||||||||||||
| Assets | Level 1 | Level 2 | Level 3 | Total | ||||||||||||
| U.S. Government Obligations | $ | 319,917,746 | $ | — | $ | — | $ | 319,917,746 | ||||||||
| Total | $ | 319,917,746 | $ | — | $ | — | $ | 319,917,746 | ||||||||
| Derivatives | ||||||||||||||||
| Swaps * | $ | — | $ | 2,469,305 | $ | — | $ | 2,469,305 | ||||||||
| Total | $ | — | $ | 2,469,305 | $ | — | $ | 2,469,305 | ||||||||
| Liabilities | Level 1 | Level 2 | Level 3 | Total | ||||||||||||
| Swaps * | $ | — | $ | 215,185 | $ | — | $ | 215,185 | ||||||||
| Total | $ | — | $ | 215,185 | $ | — | $ | 215,185 | ||||||||
| Redwood Managed Municipal Income Fund | ||||||||||||||||
| Assets | Level 1 | Level 2 | Level 3 | Total | ||||||||||||
| Mutual Funds | $ | 177,030,182 | $ | — | $ | — | $ | 177,030,182 | ||||||||
| Short Term Investments | 501,035 | — | — | 501,035 | ||||||||||||
| Total | $ | 177,531,217 | $ | — | $ | — | $ | 177,531,217 | ||||||||
| Redwood AlphaFactor® Tactical Core Fund | ||||||||||||||||
| Assets | Level 1 | Level 2 | Level 3 | Total | ||||||||||||
| Common Stock | $ | 105,248,234 | $ | — | $ | — | $ | 105,248,234 | ||||||||
| REITS | 3,672,192 | — | — | 3,672,192 | ||||||||||||
| Short-Term Investments | 56 | — | — | 56 | ||||||||||||
| Total | $ | 108,920,482 | $ | — | $ | — | $ | 108,920,482 | ||||||||
47
| Redwood Funds |
| NOTES TO FINANCIAL STATEMENTS (Continued) |
| October 31, 2019 |
| Redwood AlphaFactor® Tactical International Fund | ||||||||||||||||
| Assets | Level 1 | Level 2 | Level 3 | Total | ||||||||||||
| Common Stock | $ | 57,706,232 | $ | — | $ | — | $ | 57,706,232 | ||||||||
| Short-Term Investments | 83 | — | — | 83 | ||||||||||||
| U.S. Government Obligations | 41,855,203 | — | — | 41,855,203 | ||||||||||||
| Total | $ | 99,561,518 | $ | — | $ | — | $ | 99,561,518 | ||||||||
| Derivatives | ||||||||||||||||
| Swaps * | $ | — | $ | 430,204 | $ | — | $ | 430,204 | ||||||||
| Total | $ | — | $ | 430,204 | $ | — | $ | 430,204 | ||||||||
| Liabilities | ||||||||||||||||
| Derivatives | ||||||||||||||||
| Swaps * | $ | — | $ | 455,188 | $ | — | $ | 455,188 | ||||||||
| Total | $ | — | $ | 455,188 | $ | — | $ | 455,188 | ||||||||
| Redwood Systematic Macro Trend (“SMarT”) Fund | ||||||||||||||||
| Assets | Level 1 | Level 2 | Level 3 | Total | ||||||||||||
| Common Stocks | $ | 16,526,592 | $ | — | $ | — | $ | 16,526,592 | ||||||||
| Exchange Traded Funds | 15,494,703 | — | — | 15,494,703 | ||||||||||||
| REITS | 1,296,924 | — | — | 1,296,924 | ||||||||||||
| Short-Term Investments | 29,172 | — | — | 29,172 | ||||||||||||
| U.S. Government Obligations | 39,893,556 | — | — | 39,893,556 | ||||||||||||
| Total | $ | 73,240,947 | $ | — | $ | — | $ | 73,240,947 | ||||||||
| Derivatives | ||||||||||||||||
| Swaps * | $ | — | $ | 353,004 | $ | — | $ | 353,004 | ||||||||
| Total | $ | — | $ | 353,004 | $ | — | $ | 353,004 | ||||||||
| Liabilities | ||||||||||||||||
| Derivatives | ||||||||||||||||
| Swaps * | $ | — | $ | 52,576 | $ | — | $ | 52,576 | ||||||||
| Total | $ | — | $ | 52,576 | $ | — | $ | 52,576 | ||||||||
| Redwood Activist Leaders™ Fund | ||||||||||||||||
| Assets | Level 1 | Level 2 | Level 3 | Total | ||||||||||||
| Common Stock | $ | 41,649,467 | — | — | $ | 41,649,467 | ||||||||||
| Total | $ | 41,649,467 | $ | — | $ | — | $ | 41,649,467 | ||||||||
The Funds did not hold any Level 3 securities during the period.
| * | Net unrealized gain (loss) of swap contracts is reported in the above table. |
Swap Agreements – The Funds are subject to equity price risk and/or interest rate risk in the normal course of pursuing their respective investment objectives. The Funds may enter into various swap transactions for investment purposes or to manage interest rate, equity, foreign exchange (currency) or credit risk. These would be two-party contracts entered into primarily to exchange the returns (or differentials in rates of returns) earned or realized on particular pre-determined investments or instruments. The average month end notional value of the total return swaps that the Managed Volatility
48
| Redwood Funds |
| NOTES TO FINANCIAL STATEMENTS (Continued) |
| October 31, 2019 |
Fund, Tactical International Fund and SMarT Fund invested in during the year ended October 31, 2019 was $136,710,699, $94,922,024 and $24,334,202, respectively.
Credit Default Swaps– Credit default swaps (“CDS”) are typically two-party (bilateral) financial contracts that transfer credit exposure between the two parties. One party to a CDS (referred to as the credit protection “buyer”) receives credit protection or sheds credit risk, whereas the other party to a CDS (referred to as the credit protection “seller”) is selling credit protection or taking on credit risk. The seller typically receives pre-determined periodic payments from the other party. These payments are in consideration for agreeing to make compensating specific payments to the buyer should a negative credit event occur, such as (1) bankruptcy or (2) failure to pay interest or principal on a reference debt instrument, with respect to a specified issuer or one of the reference issuers in a CDS portfolio. In general, CDS may be used by the Funds to obtain credit risk exposure similar to that of a direct investment in high yield bonds. Credit default swaps involve risks because they are difficult to value, are highly susceptible to liquidity and credit risk, and generally pay a return to the party that has paid the premium only in the event of an actual default by the issuer of the underlying obligation (as opposed to a credit downgrade or other indication of financial difficulty). The Fund bears the loss of the amount expected to be received under a swap agreement in the event of the default or bankruptcy of a swap counterparty. The maximum risk of loss for sell protection on a credit default swap is the notional value of the total underlying amount of the swap.
The amounts to be exchanged or “swapped” between parties are calculated with respect to the notional amount. Changes in the value of swap agreements are recognized as unrealized gains or losses in the Statements of Operations by “marking to market” on a daily basis to reflect the value of the swap agreement at the end of each trading day. Payments received or paid at the beginning of the agreement are reflected as such on the Statements of Assets and Liabilities and may be referred to as upfront payments. A liquidation payment received or made at the termination of the swap agreement is recorded as a realized gain or loss on the Statements of Operations. The maximum pay-outs for these contracts are limited to the notional amount of each swap. CDS may involve greater risks than if the Funds had invested in the referenced obligation directly and are subject to general market risk, liquidity risk, counterparty risk and credit risk. The average month end notional value of the credit default swaps that the Managed Volatility Fund invested in during the year ended October 31, 2019 was $155,860,000.
Impact of Derivatives on the Statement of Assets and Liabilities and Statement of Operations–The following is a summary of the location of derivative investments in the Statement of Assets and Liabilities as of October 31, 2019:
| Derivative Investment Type | Location on the Statement of Assets and Liabilities | |
| Credit Default Swap Contracts | Unrealized Appreciation on Swap Contracts | |
| Total Return Swap Contracts | Unrealized Appreciation (Depreciation) on Swap Contracts |
The following table sets forth the fair value of derivative contracts by primary risk exposure as of October 31, 2019:
| Redwood Managed Volatility Fund | ||||||||
| Derivatives Investment Value | ||||||||
| Interest Rate | ||||||||
| Derivative Investment Type | Risk | Equity Risk | ||||||
| Credit Default Swap Contracts | $ | 2,173,970 | $ | — | ||||
| Total Return Swap Contracts | — | 80,150 | ||||||
| Total | $ | 2,173,970 | $ | 80,150 | ||||
| Redwood AlphaFactor®Tactical International Fund | ||||
| Derivatives Investment Value | ||||
| Derivative Investment Type | Equity Risk | |||
| Total Return Swap Contracts | $ | (24,984 | ) | |
49
| Redwood Funds |
| NOTES TO FINANCIAL STATEMENTS (Continued) |
| October 31, 2019 |
| Redwood Systematic Macro Trend (“SMarT”) Fund | ||||
| Derivatives Investment Value | ||||
| Derivative Investment Type | Equity Risk | |||
| Total Return Swap Contracts | $ | 300,428 | ||
The following is a summary of the location of derivative investments on the Statements of Operations for the year ended October 31, 2019:
| Derivative Investment Type | Location of Gain/Loss on Derivative | |
| Swap Contracts | Net realized gain (loss) on Swap Contracts | |
| Net change in unrealized appreciation (depreciation) on Swap Contracts | ||
The following is a summary of the realized gain (loss) and changes in unrealized appreciation (depreciation) on derivative investments recognized in the Statements of Operations categorized by primary risk exposure for the year ended October 31, 2019:
| Managed Volatility Fund | ||||||||||||
| Realized gain/(loss) on derivatives recognized in the Statement of Operations | ||||||||||||
| Total for the | ||||||||||||
| Year Ended October 31, | ||||||||||||
| Derivative Investment Type | Interest Rate Risk | Equity Risk | 2019 | |||||||||
| Credit Default Swap Contracts | $ | 8,951,984 | $ | — | $ | 8,951,984 | ||||||
| Total Return Swap Contracts | — | 9,626,626 | 9,626,626 | |||||||||
| Changes in unrealized appreciation/(depreciation) on derivatives recognized in the Statement of Operations | ||||||||||||
| Total for the Year Ended | ||||||||||||
| Derivative Investment Type | Interest Rate Risk | Equity Risk | October 31, 2019 | |||||||||
| Credit Default Swap Contracts | $ | 2,453,130 | $ | — | $ | 2,453,130 | ||||||
| Total Return Swap Contracts | — | 80,150 | 80,150 | |||||||||
| Tactical International Fund | ||||||||
| Realized gain/(loss) on derivatives recognized in the Statement of Operations | ||||||||
| Total For the Year Ended | ||||||||
| Derivative Investment Type | Equity Risk | October 31, 2019 | ||||||
| Total Return Swap Contracts | $ | (1,660,061 | ) | $ | (1,660,061 | ) | ||
| Changes in unrealized appreciation/(depreciation) on derivatives recognized in the Statement of Operations | ||||||||
| Total for the Year Ended | ||||||||
| Derivative Investment Type | Equity Risk | October 31, 2019 | ||||||
| Total Return Swap Contracts | $ | (24,984 | ) | $ | (24,984 | ) | ||
50
| Redwood Funds |
| NOTES TO FINANCIAL STATEMENTS (Continued) |
| October 31, 2019 |
| Systematic Macro Trend (“SMarT”) Fund | ||||||||
| Realized gain/(loss) on derivatives recognized in the Statement of Operations | ||||||||
| Total for the Year Ended | ||||||||
| Derivative Investment Type | Equity Risk | October 31, 2019 | ||||||
| Total Return Swap Contracts | $ | 855,925 | $ | 855,925 | ||||
| Changes in unrealized appreciation/(depreciation) on derivatives recognized in the Statement of Operations | ||||||||
| Total for the Year Ended | ||||||||
| Derivative Investment Type | Equity Risk | October 31, 2019 | ||||||
| Total Return Swap Contracts | $ | 300,428 | $ | 300,428 | ||||
The notional value of the derivative instruments outstanding as of October 31, 2019 as disclosed in the Portfolio of Investments and the amounts realized and changes in unrealized gains and losses on derivative instruments during the period as disclosed above and within the Statements of Operations serve as indicators of the volume of derivative activity for each Fund.
Offsetting of Financial Assets and Derivative Assets – The following tables presents the Funds’ asset and liability derivatives available for offset under a master netting arrangement net of collateral pledged as of October 31, 2019.
| Managed Volatility Fund | ||||||||||||||||||||||||
| Gross Amounts Not Offset in the | ||||||||||||||||||||||||
| Assets | Statement of Assets & Liabilities | |||||||||||||||||||||||
| Gross Amounts | Net Amounts of | |||||||||||||||||||||||
| Offset in the | Assets Presented in | |||||||||||||||||||||||
| Gross Amounts of | Statement of Assets & | the Statement of | Financial | Cash Collateral | ||||||||||||||||||||
| Description | Recognized Assets | Liabilities | Assets & Liabilities | Instruments | Pledged | Net Amount | ||||||||||||||||||
| Swap Contracts | $ | 2,469,305 | $ | — | $ | 2,469,305 | $ | (215,185 | ) | $ | — | (1) | $ | 2,254,120 | ||||||||||
| Total | $ | 2,469,305 | $ | — | $ | 2,469,305 | $ | (215,185 | ) | $ | — | $ | 2,254,120 | |||||||||||
| . | ||||||||||||||||||||||||
| Gross Amounts Not Offset in the | ||||||||||||||||||||||||
| Liabilities | Statement of Assets & Liabilities | |||||||||||||||||||||||
| Gross Amounts | Net Amounts of | |||||||||||||||||||||||
| Offset in the | Assets Presented in | |||||||||||||||||||||||
| Gross Amounts of | Statement of Assets & | the Statement of | Financial | Cash Collateral | ||||||||||||||||||||
| Description | Recognized Liabilities | Liabilities | Assets & Liabilities | Instruments | Pledged | Net Amount | ||||||||||||||||||
| Swap Contracts | $ | (215,185 | ) | $ | — | $ | (215,185 | ) | $ | 215,185 | $ | — | (1) | $ | — | |||||||||
| Total | $ | (215,185 | ) | $ | — | $ | (215,185 | ) | $ | 215,185 | $ | — | $ | — | ||||||||||
51
| Redwood Funds |
| NOTES TO FINANCIAL STATEMENTS (Continued) |
| October 31, 2019 |
| Redwood AlphaFactor® Tactical International Fund | ||||||||||||||||||||||||
| Gross Amounts Not Offset in the | ||||||||||||||||||||||||
| Assets | Statement of Assets & Liabilities | |||||||||||||||||||||||
| Gross Amounts | Net Amounts of | |||||||||||||||||||||||
| Offset in the | Liabilities Presented in | |||||||||||||||||||||||
| Gross Amounts of | Statement of Assets & | the Statement of | Financial | Cash Collateral | ||||||||||||||||||||
| Description | Recognized Assets | Liabilities | Assets & Liabilities | Instruments | Pledged | Net Amount | ||||||||||||||||||
| Swap Contracts | $ | 430,204 | $ | — | $ | 430,204 | $ | (430,204 | ) | $ | — | (1) | $ | — | ||||||||||
| Total | $ | 430,204 | $ | — | $ | 430,204 | $ | (430,204 | ) | $ | — | $ | — | |||||||||||
| Gross Amounts Not Offset in the | ||||||||||||||||||||||||
| Liabilities | Statement of Assets & Liabilities | |||||||||||||||||||||||
| Gross Amounts | Net Amounts of | |||||||||||||||||||||||
| Offset in the | Liabilities Presented in | |||||||||||||||||||||||
| Gross Amounts of | Statement of Assets & | the Statement of | Financial | Cash Collateral | ||||||||||||||||||||
| Description | Recognized Liabilities | Liabilities | Assets & Liabilities | Instruments | Pledged | Net Amount | ||||||||||||||||||
| Swap Contracts | $ | (455,188 | ) | $ | — | $ | (455,188 | ) | $ | 430,204 | $ | 24,984 | (1) | $ | — | |||||||||
| Total | $ | (455,188 | ) | $ | — | $ | (455,188 | ) | $ | 430,204 | $ | 24,984 | $ | — | ||||||||||
| Redwood Systematic Mactro Trend “SMarT” Fund | ||||||||||||||||||||||||
| Gross Amounts Not Offset in the | ||||||||||||||||||||||||
| Assets | Statement of Assets & Liabilities | |||||||||||||||||||||||
| Gross Amounts | Net Amounts of | |||||||||||||||||||||||
| Offset in the | Assets Presented in | |||||||||||||||||||||||
| Gross Amounts of | Statement of Assets & | the Statement of | Financial | Cash Collateral | ||||||||||||||||||||
| Description | Recognized Assets | Liabilities | Assets & Liabilities | Instruments | Pledged | Net Amount | ||||||||||||||||||
| Swap Contracts | $ | 353,004 | $ | — | $ | 353,004 | $ | (52,576 | ) | $ | — | (1) | $ | 300,428 | ||||||||||
| Total | $ | 353,004 | $ | — | $ | 353,004 | $ | (52,576 | ) | $ | — | $ | 300,428 | |||||||||||
| Gross Amounts Not Offset in the | ||||||||||||||||||||||||
| Liabilities | Statement of Assets & Liabilities | |||||||||||||||||||||||
| Gross Amounts | Net Amounts of | |||||||||||||||||||||||
| Offset in the | Assets Presented in | |||||||||||||||||||||||
| Gross Amounts of | Statement of Assets & | the Statement of | Financial | Cash Collateral | ||||||||||||||||||||
| Description | Recognized Liabilities | Liabilities | Assets & Liabilities | Instruments | Pledged | Net Amount | ||||||||||||||||||
| Swap Contracts | $ | (52,576 | ) | $ | — | $ | (52,576 | ) | $ | 52,576 | $ | — | (1) | $ | — | |||||||||
| Total | $ | (52,576 | ) | $ | — | $ | (52,576 | ) | $ | 52,576 | $ | — | $ | — | ||||||||||
| (1) | The amount is limited to the derivative liability balance and accordingly, does not include excess collateral pledged |
Security Transactions and Related Income – Security transactions are accounted for on trade date basis. Interest income is recognized on an accrual basis. Discounts are accreted and premiums are amortized on securities purchased over the lives of the respective securities. Dividend income is recorded on the ex-dividend date. Realized gains or losses from sales of securities are determined by comparing the identified cost of the security lot sold with the net sales proceeds.
Dividends and Distributions to Shareholders –Dividends from net investment income are declared and distributed monthly for Managed Volatility Fund, Municipal Income Fund, Activist Leaders Fund, Tactical International Fund and SMarT
52
| Redwood Funds |
| NOTES TO FINANCIAL STATEMENTS (Continued) |
| October 31, 2019 |
Fund. The Tactical Core Fund makes distributions annually. Distributable net realized capital gains are declared and distributed annually. Dividends from net investment income and distributions from net realized gains are recorded on ex dividend date and determined in accordance with federal income tax regulations, which may differ from GAAP. These “book/tax” differences are considered either temporary (i.e., deferred losses, capital loss carry forwards) or permanent in nature. To the extent these differences are permanent in nature, such amounts are reclassified within the composition of net assets based on their federal tax-basis treatment; temporary differences do not require reclassification.
Federal Income Taxes– It is each Fund’s policy to qualify as a regulated investment company by complying with the provisions of the Internal Revenue Code that are applicable to regulated investment companies and to distribute substantially all of their taxable income and net realized gains to shareholders. Therefore, no federal income tax provision has been recorded.
The Funds recognize the tax benefits of uncertain tax positions only where the position is “more likely than not” to be sustained assuming examination by tax authorities. Management has analyzed the Funds’ tax positions, and has concluded that no liability for unrecognized tax benefits should be recorded related to uncertain tax positions taken on returns filed for the open tax years ended October 31, 2016 to October 31, 2018 for the Managed Volatility Fund, the open tax year ended October 31, 2017 to October 31, 2018 for the Municipal Income Fund and Tactical Core Fund, and the open tax year ended October 31, 2018 for the Tactical International Fund, SMarT Fund, and the Activist Leaders Fund or positions expected to be taken in the Funds’ October 31, 2019 year-end tax returns. The Funds identify their major tax jurisdictions as U.S. Federal, Ohio and foreign jurisdictions where the Funds make significant investments; however the Funds are not aware of any tax positions for which it is reasonably expected that the total amounts of unrecognized tax benefits will change materially in the next twelve months. The Funds recognize interest and penalties, if any, related to unrecognized tax benefits as income tax expense in the Statement of Operations. During the period, the Funds did not incur any interest or penalties.
Expenses– Expenses of the Trust that are directly identifiable to a specific fund are charged to that fund. Expenses, which are not readily identifiable to a specific fund, are allocated in such a manner as deemed equitable, taking into consideration the nature and type of expense and the relative sizes of the funds in the Trust.
Indemnification–The Trust indemnifies its officers and trustees for certain liabilities that may arise from the performance of their duties to the Trust. Additionally, in the normal course of business, the Funds enter into contracts that contain a variety of representations and warranties and which provide general indemnities. The Funds’ maximum exposure under these arrangements is unknown, as this would involve future claims that may be made against the Funds that have not yet occurred. However, the Funds expect the risk of loss due to these warranties and indemnities to be remote.
| 3. | INVESTMENT TRANSACTIONS AND ASSOCIATED RISKS |
The cost of purchases and proceeds from the sale of securities, other than short-term investments, for the year ended October 31, 2019: amounted to the following:
| Fund | Purchases | Sales | ||||||
| Managed Volatility Fund | $ | 405,374 | $ | 339,445,139 | ||||
| Municipal Income Fund | 176,967,920 | 10,000,000 | ||||||
| Tactical Core Fund | 136,479,117 | 101,817,965 | ||||||
| Tactical International Fund | 160,916,911 | 103,384,330 | ||||||
| SMarT Fund | 75,267,709 | 98,092,392 | ||||||
| Activist Leaders Fund | 40,958,428 | 30,878,408 | ||||||
The Funds’ investments in securities, financial instruments and derivatives expose them to various risks, certain of which are discussed below. Please refer to the Funds’ prospectus and statement of additional information for a full listing of risks associated with each Fund’s investments. The Risks associated with a Fund’s investments include, but are not limited to:
Managed Volatility Fund: active trading risk, asset allocation risk, bank loan risk, borrowing risk, cash positions risk, counterparty risk, credit default swaps risk, credit risk, cyber security risk, derivatives risk, fixed income risk, gap risk, high-
53
| Redwood Funds |
| NOTES TO FINANCIAL STATEMENTS (Continued) |
| October 31, 2019 |
yield fixed income securities (“junk bonds”) risk, leveraging risk, liquidity risk, managed volatility strategy risk, management risk, market events risk, market risk, model risk, rules-based strategy risk, swap risk, swaptions risk, U.S. government securities risk and valuation risk.
Tactical Core Fund: active trading risk, cash positions risk, cybersecurity risk, derivatives risk, equity risk, gap risk, index tracking error risk, insurance sector risk, investment companies and ETFs risk, management risk, market capitalization risk, market events risk, market risk, model risk, money market instrument risk, retail sector risk, rules-based strategy risk, underlying fund risk and U.S. government securities risk.
Municipal Income Fund: active trading risk, asset allocation risk, borrowing risk, cash positions risk, counterparty risk, credit risk, cybersecurity risk, derivatives risk, fixed income securities risk, gap risk, high yield risk, investment companies and ETFs risk, leveraging risk, liquidity risk, management risk, market events risk, market risk, model risk, money market instrument risk, municipal bond risk, rules-based strategy risk, swap risk, taxability risk, underlying fund risk and U.S. government securities risk.
Activist Leaders Fund: activist risk, cybersecurity risk, derivatives risk, equity risk, gap risk, geographic and sector risk, index tracking error risk, market capitalization risk, market events risk, market risk, passive investment risk and quantitative investing risk.
Tactical International Fund: American depositary receipts risk, cash positions risk, cybersecurity risk, derivatives risk, emerging markets risk, equity risk, foreign (non-U.S.) investment risk, gap risk, geographic and sector risk, index tracking error risk, investment companies and ETFs risk, liquidity risk, market capitalization risk, market events risk, market risk, money market instrument risk, passive investment risk, quantitative investing risk, U.S. government securities risk and valuation risk.
SMarT Fund: bank loan risk, borrowing risk, cash positions risk, counterparty risk, credit risk, currency risk, cybersecurity risk, derivatives risk, emerging markets risk, equity risk, fixed income securities risk, foreign (non-U.S.) investment risk, gap risk, high yield risk, investment companies and ETFs risk, leveraging risk, liquidity risk, management risk, market capitalization risk, market events risk, market risk, money market instrument risk, quantitative investing risk, real estate investment trusts risk, swap risk, U.S. government securities risk and valuation risk.
Derivatives Risk – The Funds may invest in derivative instruments. The derivative instruments held by the Funds may be more volatile than other instruments. The risks associated with investments in derivatives also include leverage, liquidity, interest rate, market, credit and management risks, mispricing or improper valuations. Changes in the market value of a derivative may not correlate perfectly with the underlying asset, rate or index, and a Fund could lose more than the principal amount invested. In addition, if a derivative is being used for hedging purposes there can be no assurance given that each derivative position will achieve a perfect correlation with the security or currency against which it is being hedged, or that a particular derivative position will be available when sought by the portfolio manager.
Equity Risk – The Tactical Core Fund, Activist Leaders Fund, Tactical International Fund, and SMarT Fund are subject to equity risk. The market value of equities, such as common stocks or equity related investments, such as futures and options, may decline due to general market conditions, such as political or macroeconomic factors. Additionally, equities may decline in value due to specific factors affecting a related industry or industries. Equity securities are susceptible to general market fluctuations volatile increases and decreases in value as market confidence in and perceptions of their issuers change. Each equity security and equity related investments generally have greater market price volatility than fixed income securities.
Fixed Income Risk – The Managed Volatility Fund, Municipal Income Fund and SMarT Fund are subject to fixed income securities risk. When a Fund invests in fixed income securities, the value of your investment in the Fund will fluctuate with changes in interest rates. Typically a rise in interest rates causes a decline in the value of fixed income securities or derivatives owned by a Fund. In general, the market price of fixed income securities with longer maturities will increase or decrease more in response to changes in interest rates than shorter-term securities.
Index Tracking Error Risk – The Tactical Core Fund, Activist Leaders Fund and Tactical International Fund are each subject to index tracking error risk. As with all index funds, the performance of a Fund and its Index may differ from each other for a
54
| Redwood Funds |
| NOTES TO FINANCIAL STATEMENTS (Continued) |
| October 31, 2019 |
variety of reasons. For example, the Fund incurs operating expenses and portfolio transaction costs not incurred by the Index. In addition, the Fund may not be fully invested in securities of the Index at all times or may hold securities not included in the Index.
Investment Companies and ETFs Risk – When a Fund invests in other investment companies, including ETFs and closed-end funds, it will bear additional expenses based on its pro rata share of the other investment company’s or ETF’s operating expenses, including management fees in addition to those paid by the Fund. The risk of owning an investment company or ETF generally reflects the risk of owning the underlying investments held by the investment company or ETF. The Fund will also bear brokerage costs when it purchases and sells ETFs.
Market Risk – Overall equity market risk may affect the value of individual instruments in which the Fund invests. Factors such as domestic and foreign (non-U.S.) economic growth and market conditions, real or perceived adverse economic or political conditions, inflation, changes in interest rate levels, lack of liquidity in the bond markets, volatility in the equities market or adverse investor sentiment affect the securities market. When the value of the Fund’s investments does down, your investment in the Fund decreases in value and you could lose money.
Municipal Bond Risk – The underlying funds in which the Municipal Income Fund may invest may be affected significantly by the economic, regulatory or political developments affecting the ability of issuers of debt securities whose interest is, in the opinion of bond counsel for the issuer at the time of issuance, exempt from federal income tax to pay interest or repay principal.
Swap Risk – The Managed Volatility Fund, Municipal Income, SMarT Fund, and Tactical International Fund are each subject to swap risk. Swap agreements are subject to the risk that the counterparty to the swap will default on its obligation to pay the Fund and the risk that the Fund will not be able to meet its obligations to pay the counterparty to the swap. In addition, there is the risk that a swap may be terminated by the Fund or the counterparty in accordance with its terms. If a swap were to terminate, the Fund may be unable to implement its investment strategies and the Fund may not be able to seek to achieve its investment objective. See Note 2 to the Financial Statements for further discussion of swaps and credit default swaps.
| 4. | INVESTMENT ADVISORY AGREEMENT AND TRANSACTIONS WITH RELATED PARTIES |
Advisory Fees – Redwood Investment Management, LLC serves as the Funds’ Investment Advisor (the “Advisor”). Pursuant to investment advisory agreements with the Funds, the Advisor, under the oversight of the Board, directs the daily operations of the Funds and supervises the performance of administrative and professional services provided by others. As compensation for its services and the related expenses borne by the Advisor, the Funds pay the Advisor an investment advisory fee, computed and accrued daily and paid monthly, at an annual rate of average daily net assets as follows:
| Fund | Management Fee | |
| Managed Volatility Fund | 1.25% | |
| Municipal Income Fund | 0.70% | |
| Tactical Core Fund | 0.90% | |
| Tactical International Fund | 0.90% | |
| SMarT Fund | 1.00% | |
| Activist Leaders Fund | 0.60% |
The Advisor has contractually agreed to reduce its fees and/or absorb expenses of the Funds, until at least March 1, 2020 to ensure that Total Annual Fund Operating Expenses after fee waiver and/or reimbursement (exclusive of any taxes, short selling expenses, interest, brokerage commissions, expenses incurred in connection with any merger or reorganization, indirect expenses, expenses of other investment companies in which the Funds may invest, or extraordinary expenses such as litigation) will not exceed the expense limitations of the Funds’ average daily net assets for each Fund’s share classes, as listed in the table below, subject to possible recoupment from the Funds in future years on a rolling three year basis (within the three years after the fees have been waived or reimbursed) if such recoupment can be achieved within the foregoing expense limits as well as any expense limit that was in effect at the time the reimbursement was made. No recoupment amount will
55
| Redwood Funds |
| NOTES TO FINANCIAL STATEMENTS (Continued) |
| October 31, 2019 |
be paid to the Advisor in any fiscal quarter unless the Board has determined in advance that a recoupment is in the best interest of the applicable Fund and its shareholders. The expense limitations are as follows:
| Fund | Expense Limitation | |||||
| Class I | Class N | Class Y | ||||
| Managed Volatility Fund * | 1.67% | 1.92% | 1.43% | |||
| Municipal Income Fund | 1.00% | 1.25% | ||||
| Tactical Core Fund | 1.20% | 1.45% | ||||
| Tactical International Fund | 1.20% | 1.45% | ||||
| SMarT Fund | 1.30% | 1.55% | ||||
| Activist Leaders Fund | 0.90% | 1.15% | ||||
During the year ended October 31, 2019, the Advisor reimbursed $409,145, $148,961, $100,519, $55,962, $62,061, and $69,602 to the Managed Volatility Fund, Municipal Income Fund, Tactical Core Fund, Tactical International Fund, SMarT Fund and Activist Leaders Fund, respectively. Cumulative expenses subject to recapture will expire on October 31 of the following years:
| Managed | AlphaFactor® | Systematic | ||||||||||||||||||||||
| Managed | Municipal Income | AlphaFactor® | Tactical | Macro Trend | Activist Leaders | |||||||||||||||||||
| Year | Volatility Fund | Fund | Tactical Core Fund | International Fund | (“SMarT”) Fund | Fund | ||||||||||||||||||
| 2020 | $ | — | $ | 45,756 | $ | 39,609 | $ | — | $ | — | $ | — | ||||||||||||
| 2021 | 298,755 | — | 10,685 | 20,123 | 50,647 | 80,576 | ||||||||||||||||||
| 2022 | 409,145 | 148,961 | 100,519 | 55,962 | 62,061 | 69,602 | ||||||||||||||||||
| Total | $ | 707,900 | $ | 194,717 | $ | 150,813 | $ | 76,085 | $ | 112,708 | $ | 150,178 | ||||||||||||
The Board has adopted the Trust’s Master Distribution and Shareholder Servicing Plan (the “Plan”) pursuant to Rule 12b-1 under the 1940 Act with respect to Class N shares of each of the Funds. The Plan provides that a monthly service and/or distribution fee is calculated by the Funds at an annual rate of 0.25% of its average daily net assets for Class N and is paid to Northern Lights Distributors, LLC (the “Distributor”) to provide compensation for ongoing shareholder servicing and distribution-related activities or services and/or maintenance of the Funds’ shareholder accounts not otherwise required to be provided by the Advisor. During the year ended October 31, 2019, Class N paid $29,372, $296, $1,867, $218, $287, and $66, in distribution fees for the Managed Volatility Fund, Municipal Income Fund, Tactical Core Fund, Tactical International Fund, SMarT Fund and Activist Leaders Fund respectively.
The Distributor acts as each Fund’s principal underwriter in a continuous public offering of each Fund’s share classes.
In addition, certain affiliates of the Distributor provide services to the Funds as follows:
Gemini Fund Services, LLC (“GFS”) – GFS, an affiliate of the Distributor, provides administration, fund accounting, and transfer agent services to the Trust. Pursuant to separate servicing agreements with GFS, the Funds pay GFS customary fees for providing administration, fund accounting and transfer agency services to the Funds. Certain officers of the Trust are also officers of GFS, and are not paid any fees directly by the Funds for serving in such capacities.
Northern Lights Compliance Services, LLC (“NLCS”) – NLCS, an affiliate of GFS and the Distributor, provides a Chief Compliance Officer to the Trust, as well as related compliance services, pursuant to a consulting agreement between NLCS and the Trust. Under the terms of such agreement, NLCS receives customary fees from the Funds.
Blu Giant, LLC (“Blu Giant”),an affiliate of GFS and the Distributor, provides EDGAR conversion and filing services as well as print management services for the Funds on an ad-hoc basis. For the provision of these services, BluGiant receives customary fees from the Funds.
56
| Redwood Funds |
| NOTES TO FINANCIAL STATEMENTS (Continued) |
| October 31, 2019 |
On February 1, 2019, NorthStar Financial Services Group, LLC, the parent company of GFS and its affiliated companies including NLD, NLCS and Blu Giant (collectively, the “Gemini Companies”), sold its interest in the Gemini Companies to a third party private equity firm that contemporaneously acquired Ultimus Fund Solutions, LLC (an independent mutual fund administration firm) and its affiliates (collectively, the “Ultimus Companies”). As a result of these separate transactions, the Gemini Companies and the Ultimus Companies are now indirectly owned through a common parent entity, The Ultimus Group, LLC.
| 5. | AGGREGATE UNREALIZED APPRECIATION AND DEPRECIATION – TAX BASIS |
The identified cost of investments in securities owned by the Funds for federal income tax purposes, and their respective gross unrealized appreciation and depreciation at October 31, 2019, were as follows:
| Tax Net | ||||||||||||||||
| Cost for Federal | Unrealized | Unrealized | Unrealized | |||||||||||||
| Portfolio | Tax Purposes | Appreciation | Depreciation | App/Dep | ||||||||||||
| Redwood Managed Volatility Fund | $ | 319,849,750 | $ | 67,996 | $ | — | $ | 67,996 | ||||||||
| Redwood Managed Municipal Income Fund | 167,479,775 | 10,051,442 | — | 10,051,442 | ||||||||||||
| Redwood AlphaFactor® Tactical Core Fund | 104,977,819 | 7,151,011 | (3,208,348 | ) | 3,942,663 | |||||||||||
| Redwood AlphaFactor® International Fund | 100,068,244 | 729,708 | (1,236,434 | ) | (506,726 | ) | ||||||||||
| Redwood Systematic Macro Trends (“SMarT”) Fund | 72,446,256 | 49,095,331 | (48,300,640 | ) | 794,691 | |||||||||||
| Redwood Activist Leaders™ Fund | 41,589,229 | 3,805,435 | (3,745,197 | ) | 60,238 | |||||||||||
| 6. | DISTRIBUTION TO SHAREHOLDERS & TAX COMPONENTS OF CAPITAL |
The tax character of distributions paid during the following years was as follows:
| For the period ended October 31, 2019: | ||||||||||||||||||||
| Ordinary | Long-Term | Return | Tax-Exempt | |||||||||||||||||
| Portfolio | Income | Capital Gains | of Capital | Income | Total | |||||||||||||||
| Redwood Managed Volatility Fund | $ | 10,731,808 | $ | — | $ | — | $ | — | $ | 10,731,808 | ||||||||||
| Redwood Managed Municipal Income Fund | 140,980 | — | — | 5,123,860 | 5,264,840 | |||||||||||||||
| Redwood AlphaFactor® Tactical Core Fund | 6,678,688 | 87,144 | — | — | 6,765,832 | |||||||||||||||
| Redwood AlphaFactor® International Fund | 1,649,605 | — | 248,604 | — | 1,898,209 | |||||||||||||||
| Redwood Systematic Macro Trends (“SMarT”) Fund | 1,449,713 | 9,539 | — | — | 1,459,252 | |||||||||||||||
| Redwood Activist Leaders™ Fund | 1,235,724 | — | 6,468 | — | 1,242,192 | |||||||||||||||
| For the period ended October 31, 2018: | ||||||||||||||||||||
| Ordinary | Long-Term | Return | Tax-Exempt | |||||||||||||||||
| Portfolio | Income | Capital Gains | of Capital | Income | Total | |||||||||||||||
| Redwood Managed Volatility Fund | $ | 28,113,133 | $ | — | $ | — | $ | — | $ | 28,113,133 | ||||||||||
| Redwood Managed Municipal Income Fund | 297,527 | — | 36,661 | 2,559,969 | 2,894,157 | |||||||||||||||
| Redwood AlphaFactor® Tactical Core Fund | 1,084,922 | — | — | — | 1,084,922 | |||||||||||||||
| Redwood AlphaFactor® International Fund | 472,930 | — | — | — | 472,930 | |||||||||||||||
| Redwood Systematic Macro Trends (“SMarT”) Fund | 1,084,350 | — | — | — | 1,084,350 | |||||||||||||||
| Redwood Activist Leaders™ Fund | 37,004 | — | — | — | 37,004 | |||||||||||||||
57
| Redwood Funds |
| NOTES TO FINANCIAL STATEMENTS (Continued) |
| October 31, 2019 |
As of October 31, 2019, the components of accumulated earnings/(deficit) on a tax basis were as follows:
| Undistributed | Undistributed | Undistributed | Post October | Capital Loss | Other | Unrealized | Total | |||||||||||||||||||||||||
| Ordinary | Ordinary | Long-Term | Loss and | Carry | Book/Tax | Appreciation/ | Accumulated | |||||||||||||||||||||||||
| Portfolio | Tax-Exempt Income | Income | Capital Gains | Late Year Loss | Forwards | Differences | (Depreciation) | Earnings/(Deficits) | ||||||||||||||||||||||||
| Redwood Managed Volatility Fund | $ | — | $ | 3,503,314 | $ | — | $ | — | $ | (18,694,448 | ) | $ | — | $ | 67,996 | $ | (15,123,138 | ) | ||||||||||||||
| Redwood Managed Municipal Income Fund | — | 15,137 | — | — | (1,950,467 | ) | 18,719 | 10,051,442 | 8,134,831 | |||||||||||||||||||||||
| Redwood AlphaFactor® Tactical Core Fund | — | 975,062 | — | — | (3,193,258 | ) | — | 3,942,663 | 1,724,467 | |||||||||||||||||||||||
| Redwood AlphaFactor® International Fund | — | — | — | — | (5,623,139 | ) | — | (503,155 | ) | (6,126,294 | ) | |||||||||||||||||||||
| Redwood Systematic Macro Trends (“SMarT”) Fund | — | 902,214 | — | — | (3,069,064 | ) | — | 794,691 | (1,372,159 | ) | ||||||||||||||||||||||
| Redwood Activist Leaders™ Fund | — | — | — | — | (2,516,958 | ) | — | 60,238 | (2,456,720 | ) | ||||||||||||||||||||||
The difference between book basis and tax basis accumulated net investment income (loss), accumulated net realized gains (losses), and unrealized appreciation (depreciation) from investments is primarily attributable to the mark to market treatment of swaps, tax deferral of losses on wash sales and tax adjustments for accrued dividends payable, real estate investment trusts, C-Corporation return of capital distributions and partnerships. In addition, the unrealized appreciation (depreciation) in the table above includes unrealized foreign currency gains (losses) of $3,571.
At October 31, 2019, the Fund had capital loss carry forwards for federal income tax purposes available to offset future capital gains as follows:
| Non-Expiring | ||||||||||||||||
| Portfolio | Short-Term | Long-Term | Total | CLCF Utilized | ||||||||||||
| Redwood Managed Volatility Fund | $ | 5,896,717 | $ | 12,797,731 | $ | 18,694,448 | $ | — | ||||||||
| Redwood Managed Municipal Income Fund | 1,950,467 | — | 1,950,467 | 10,820 | ||||||||||||
| Redwood AlphaFactor® Tactical Core Fund | 2,561,131 | 632,127 | 3,193,258 | — | ||||||||||||
| Redwood AlphaFactor® International Fund | 5,623,139 | — | 5,623,139 | — | ||||||||||||
| Redwood Systematic Macro Trends (“SMarT”) Fund | 3,069,064 | — | 3,069,064 | — | ||||||||||||
| Redwood Activist Leaders™ Fund | 387,354 | 2,129,604 | 2,516,958 | — | ||||||||||||
Permanent book and tax differences, primarily attributable to the book/tax basis treatment of non-deductible expenses and the return of capital distributions, resulted in reclassifications for the period ended October 31, 2019 as follows:
| Paid | Accumulated | |||||||
| In | Earnings | |||||||
| Portfolio | Capital | (Losses) | ||||||
| Redwood Managed Volatility Fund | $ | — | $ | — | ||||
| Redwood Managed Municipal Income Fund | — | — | ||||||
| Redwood AlphaFactor® Tactical Core Fund | — | — | ||||||
| Redwood AlphaFactor® International Fund | — | — | ||||||
| Redwood Systematic Macro Trends (“SMarT”) Fund | — | — | ||||||
| Redwood Activist Leaders™ Fund | (6,468 | ) | 6,468 | |||||
| 7. | UNDERLYING INVESTMENT IN OTHER INVESTMENT COMPANIES |
The Managed Municipal Income Fund currently seeks to achieve its investment objective by investing a portion of its assets in Nuveen High Yield Municipal Bond Fund-Institutional Class (the “Security”). The Fund may redeem its investments from the Security at any time if the Advisor determines that it is in the best interest of the Fund and its shareholders to do so.
58
| Redwood Funds |
| NOTES TO FINANCIAL STATEMENTS (Continued) |
| October 31, 2019 |
The performance of the Fund will be directly affected by the performance of the Security. The annual report of the Security, along with the report of the independent registered public accounting firm is included in the Security’s N-CSR’s available at “www.sec.gov”. As of October 31, 2019, the percentage of the Managed Municipal Income Fund’s net assets invested in the security was 50.7%.
| 8. | BENEFICIAL OWNERSHIP |
The beneficial ownership, either directly or indirectly, of more than 25% of the voting securities of a Fund creates presumption of control of the Fund, under Section 2(a)(9) of the 1940 Act. As of October 31, 2019, the companies that held more than 25% of the voting securities of the Funds, and may be deemed to control the respective Fund, are as follows:
| Tactical | ||||||||||||||||||||||||
| Managed | Municipal | Tactical Core | International | Activist | ||||||||||||||||||||
| Owner | Volatility Fund | Income Fund | Fund | Fund | SMarT Fund | Leaders Fund | ||||||||||||||||||
| Charles Schwab(1) | — | — | 27.6 | % | 34.1 | % | 30.2 | % | 62.1 | % | ||||||||||||||
| National Financial Services(1) | 29.1 | % | 30.2 | % | — | — | — | — | ||||||||||||||||
| TD Ameritrade(1) | 42.3 | % | 51.3 | % | 61.4 | % | 60.7 | % | 65.0 | % | 34.4 | % | ||||||||||||
| (1) | These owners are comprised of multiple investors and accounts. |
| 9. | RECENT ACCOUNTING PRONOUNCEMENTS |
In August 2018, FASB issued ASU No. 2018-13, which changed certain fair value measurement disclosure requirements. The ASU, in addition to other modifications and additions, removed the requirement to disclose the amount and reasons for transfers between Level 1 and Level 2 of the fair value hierarchy, and the policy for the timing of transfers between levels. For investment companies, the amendments are effective for financial statements issued for fiscal years beginning after December 15, 2019, and interim periods within those fiscal years. These amendments have been adopted with these financial statements.
| 10. | SUBSEQUENT EVENTS |
Subsequent events after the date of the Statements of Assets and Liabilities have been evaluated through the date the financial statements were issued. Management has determined that no events or transactions occurred requiring adjustment or disclosure in the financial statements.
59

| GRANT THORNTON LLP | REPORT OF INDEPENDENT REGISTERED PUBLIC ACCOUNTING FIRM | ||||
| Two Commerce Square | |||||
| 2001 Market Street, Suite 700 | |||||
| Philadelphia, PA 19103 | |||||
| D+1 215 561 4200 | |||||
| F+1 215 561 1066 | |||||
Board of Trustees of the Two Roads Shared Trust and Shareholders of
Opinion on the financial statements
We have audited the accompanying statements of assets and liabilities, including the portfolios of investments, of Redwood Managed Volatility Fund, Redwood Managed Municipal Income Fund, Redwood AlphaFactor® Tactical Core Fund, Redwood AlphaFactor® Tactical International Fund, Redwood Systematic Macro Trend (“SMarT”) Fund, and Redwood Activist Leaders™ Fund (six of the funds in the Two Roads Shared Trust) (collectively, the “Funds”) as of October 31, 2019, the related statements of operations, changes in net assets and the financial highlights for each of the periods indicated in the table below, and the related notes (collectively referred to as the “financial statements”). The accompanying financial highlights for the year ended October 31, 2015 of Redwood Managed Volatility Fund were audited by other auditors whose report thereon dated December 29, 2015 expressed an unqualified opinion on those financial highlights. In our opinion, the financial statements present fairly, in all material respects, the financial position of the Funds as of October 31, 2019, and the results of their operations, changes in their net assets, and their financial highlights for each of the periods indicated in the table below, in conformity with accounting principles generally accepted in the United States of America. | |||||
| Fund | Statement of Operations | Statements of Changes in Net Assets | Financial Highlights | ||
| Redwood Managed Volatility Fund | For the year ended October 31, 2019 | For each of the two years in the period ended October 31, 2019 | For each of the four years in the period ended October 31, 2019 | ||
| Redwood Managed Municipal Income Fund | For the year ended October 31, 2019 | For each of the two years in the period ended October 31, 2019 | For each of the two years in the period ended October 31, 2019 and for the period March 9, 2017 (commencement of operations) through October 31, 2017 | ||
| Redwood AlphaFactor® Tactical Core Fund | For the year ended October 31, 2019 | For each of the two years in the period ended October 31, 2019 | For each of the two years in the period ended October 31, 2019 and for the period March 9, 2017 (commencement of operations) through October 31, 2017 | ||
| GT.COM | Grant Thornton LLP is the U.S. member firm of Grant Thornton International Ltd (GTIL). GTIL and each of its member firms are separate legal entities and are not a worldwide partnership. | ||||
60
| Fund | Statement of Operations | Statements of Changes in Net Assets | Financial Highlights | ||
| Redwood AlphaFactor® Tactical International Fund | For the year ended October 31, 2019 | For the year ended October 31, 2019 and for the period November 2, 2017 (commencement of operations) through October 31, 2018 | For the year ended October 31, 2019 and for period November 2, 2017 (commencement of operations) through October 31, 2018 | ||
| Redwood Systematic Macro Trend (“SMarT”) Fund | For the year ended October 31, 2019 | For the year ended October 31, 2019 and for the period November 2, 2017 (commencement of operations) through October 31, 2018 | For the year ended October 31, 2019 and for period November 2, 2017 (commencement of operations) through October 31, 2018 | ||
| Redwood Activist Leaders™ Fund | For the year ended October 31, 2019 | For the year ended October 31, 2019 and for the period November 2, 2017 (commencement of operations) through October 31, 2018 | For the year ended October 31, 2019 and for period November 2, 2017 (commencement of operations) through October 31, 2018 | ||
Basis for opinion
These financial statements are the responsibility of the Funds’ management. Our responsibility is to express an opinion on the Funds’ financial statements based on our audits. We are a public accounting firm registered with the Public Company Accounting Oversight Board (United States) (“PCAOB”) and are required to be independent with respect to the Funds in accordance with the U.S. federal securities laws and the applicable rules and regulations of the Securities and Exchange Commission and the PCAOB.
We conducted our audits in accordance with the standards of the PCAOB. Those standards require that we plan and perform the audit to obtain reasonable assurance about whether the financial statements are free of material misstatement, whether due to error or fraud. The Funds are not required to have, nor were we engaged to perform, an audit of their internal control over financial reporting. As part of our audits we are required to obtain an understanding of internal control over financial reporting but not for the purpose of expressing an opinion on the effectiveness of the Funds’ internal control over financial reporting. Accordingly, we express no such opinion.
Our audits included performing procedures to assess the risks of material misstatement of the financial statements, whether due to error or fraud, and performing procedures that respond to those risks. Such procedures included examining, on a test basis, evidence supporting the amounts and disclosures in the financial statements. Our audits also included evaluating the accounting principles used and significant estimates made by management, as well as evaluating the overall presentation of the financial statements. Our procedures included confirmation of securities owned as of October 31, 2019, by correspondence with the custodian and brokers. We believe that our audits provide a reasonable basis for our opinion.
We have served as the Funds’ auditor since 2016.
Philadelphia, Pennsylvania December 30, 2019 | |||||

61
| Redwood Funds |
| EXPENSE EXAMPLES (Unaudited) |
| October 31, 2019 |
As a shareholder of the Funds you incur two types of costs: (1) transaction costs (such as front-end loads and redemption fees) and (2) ongoing costs, including advisory fees, distribution and/or service (12b-1 fees) fees and other Fund expenses. This example is intended to help you understand your ongoing costs (in dollars) of investing in the Funds and to compare these costs with the ongoing costs of investing in other mutual funds. Please note, the expenses shown in the tables are meant to highlight ongoing costs only and do not reflect any transactional costs.
This example is based on an investment of $1,000 invested for the period of time beginning May 1, 2019 and held through October 31, 2019.
Actual Expenses: The “Actual Expenses” column in the table below provides information about actual account values and actual expenses. You may use the information below, together with the amount you invested, to estimate the expenses that you paid over the period. Simply divide your account value by $1,000 (for example, an $8,600 account value divided by $1,000 = 8.6), then multiply the result by the number in the table under the heading entitled “Expenses Paid During Period” to estimate the expenses you paid on your account during this period.
Hypothetical Examples for Comparison Purposes: The “Hypothetical” column in the table below provides information about hypothetical account values and hypothetical expenses based on the Funds’ actual expense ratio and an assumed rate of return of 5% per year before expenses, which is not the Funds’ actual return. The hypothetical account values and expenses may not be used to estimate the actual ending account balances or expenses you paid for the period. You may use this information to compare this 5% hypothetical example with the 5% hypothetical examples that appear in the shareholder reports of other funds.
Please note that the expenses shown in the table are meant to highlight your ongoing costs only and do not reflect any transactional costs such as front-end sales charges (loads). Therefore, the table is useful in comparing ongoing costs only, and will not help you determine the relative total costs of owning different funds. In addition, if these transactional costs were included, your costs would have been higher.
| Hypothetical | |||||||||||||
| Actual | (5% return before expenses) | ||||||||||||
| Fund’s | Beginning | Ending | Expenses | Ending | Expenses | ||||||||
| Annualized | Account Value | Account Value | Paid During | Account Value | Paid During | ||||||||
| Class I | Expense Ratio | 5/1/19 | 10/31/19 | Period* | 10/31/19 | Period* | |||||||
| Redwood Managed Volatility Fund | 1.58% | $1,000.00 | $1,019.90 | $8.04 | $1,017.24 | $8.03 | |||||||
| Redwood Managed Municipal Income Fund | 1.00% | $1,000.00 | $1,043.10 | $5.15 | $1,020.16 | $5.09 | |||||||
| Redwood AlphaFactor® Tactical Core Fund | 1.20% | $1,000.00 | $1,000.60 | $6.05 | $1,019.16 | $6.11 | |||||||
| Redwood AlphaFactor® Tactical International Fund | 1.20% | $1,000.00 | $957.40 | $5.92 | $1,019.16 | $6.11 | |||||||
| Redwood Systematic Macro Trend “SMarT” Fund | 1.30% | $1,000.00 | $1,020.50 | $6.62 | $1,018.65 | $6.61 | |||||||
| Redwood Activist Leaders™ Fund | 0.90% | $1,000.00 | $983.80 | $4.50 | $1,020.67 | $4.58 | |||||||
| Class N | |||||||||||||
| Redwood Managed Volatility Fund | 1.84% | $1,000.00 | $1,018.80 | $9.36 | $1,015.93 | $9.35 | |||||||
| Redwood Managed Municipal Income Fund | 1.25% | $1,000.00 | $1,041.50 | $6.43 | $1,018.90 | $6.36 | |||||||
| Redwood AlphaFactor® Tactical Core Fund | 1.45% | $1,000.00 | $999.40 | $7.31 | $1,017.90 | $7.38 | |||||||
| Redwood AlphaFactor® Tactical International Fund | 1.45% | $1,000.00 | $956.80 | $7.15 | $1,017.90 | $7.38 | |||||||
| Redwood Systematic Macro Trend “SMarT” Fund | 1.55% | $1,000.00 | $1,019.20 | $7.89 | $1,017.39 | $7.88 | |||||||
| Redwood Activist Leaders™ Fund | 1.15% | $1,000.00 | $982.60 | $5.75 | $1,019.41 | $5.85 | |||||||
| Class Y | |||||||||||||
| Redwood Managed Volatility Fund | 1.43% | $1,000.00 | $1,021.10 | $7.28 | $1,018.00 | $7.27 | |||||||
| * | Expenses are equal to the average account value over the period, multiplied by the Funds’ annualized expense ratio, multiplied by the number of days in the period ended October 31, 2019, (184) divided by the number of days in the fiscal year (365). |
62
Approval of Advisory Agreements
Redwood AlphaFactor Tactical Core Fund and Redwood Managed Municipal Income Fund
At a meeting held on November 29-30, 2018 (the “Meeting”), the Board of Trustees (the “Board”) of Two Roads Shares Trust (the “Trust”), each of whom is not an “interested person” of the Trust (the “Independent Trustees” or the “Trustees”), as such term is defined under Section 2(a)(19) of the Investment Company Act of 1940, as amended (the “1940 Act”), considered the reapproval of the investment advisory agreement (the “Advisory Agreement”) between Redwood Investment Management, LLC (“Redwood” or the “Adviser”) and the Trust, on behalf of the Redwood AlphaFactor Tactical Core Fund (“Redwood Tactical Fund”) and Redwood Managed Municipal Income Fund (“Redwood Municipal Fund” and together with the Redwood Tactical Fund, the “Redwood Funds”).
In connection with the Board’s consideration of the Agreement, the Board received written materials in advance of the Meeting, which included information regarding: (i) the nature, extent, and quality of services to be provided to the Redwood Funds by Redwood; (ii) a description of the Adviser’s investment management personnel; (iii) an overview of the Adviser’s operations and financial condition; (iv) a description of the Adviser’s brokerage practices (including any soft dollar arrangements); (v) a comparison of the Redwood Funds’ advisory fees and overall expenses with those of comparable mutual funds; (vi) the anticipated level of profitability from the Adviser’s fund-related operations; (vii) the Adviser’s compliance policies and procedures, including policies and procedures for personal securities transactions, business continuity and information security and (viii) information regarding the performance record of the Redwood Funds as compared to other mutual funds with similar investment strategies.
Throughout the process, including at the meeting, the Board had numerous opportunities to ask questions of and request additional materials from Redwood. During the Meeting, the Board was advised by, and met, in executive session with, the Board’s independent legal counsel, and received a memorandum from such independent counsel regarding their responsibilities under applicable law. The Board also noted that the evaluation process with respect to the Adviser was an ongoing one and that in this regard, the Board took into account discussions with management and information provided to the Board at prior meetings with respect to the services provided by the Adviser.
Matters considered by the Board in connection with its approval of the Agreement included, among others, the following:
Nature, Extent and Quality of Services. The Board reviewed materials provided by Redwood related to the Advisory Agreement with the Trust with respect to each of the Redwood Tactical Fund and Redwood Municipal Fund. These materials included the Advisory Agreement; a description of the manner in which investment decisions are made and executed; an overview of the personnel that perform services for each Redwood Fund and their background and experience; a review of the financial condition of Redwood; Redwood’s compliance policies and procedures, including a Code of Ethics containing provisions reasonably necessary to prevent Access Persons,
63
as that term is defined in Rule 17j-1 under the 1940 Act, from engaging in conduct prohibited by Rule 17j-1(b); and an independent report prepared by Broadridge, an independent third party data provider, analyzing the performance record, fees and expenses of each of the Redwood Tactical Fund and Redwood Municipal Fund as compared to other mutual funds with similar investment strategies.
In reaching its conclusions with respect to the nature and quality of services to be provided by Redwood under the Advisory Agreement, the Board considered Redwood’s employees’ investment management, risk management, operations and compliance experience. With respect to the Redwood Tactical Fund, the Board discussed that Redwood’s investment approach was designed to track the performance of Redwood’s proprietary index, the Redwood AlphaFactor® Tactical Focused Index, which invested in common stocks both directly and through investments in other investment companies. With respect to the Redwood Municipal Fund, the Board discussed that under the Fund’s investment strategy, the Fund held a diversified portfolio of primarily high-yield municipal open-end mutual funds, closed-end funds, or ETFs. The Board also considered Redwood’s best execution policies and soft dollar use, including that Redwood was compliant with SEC guidance with respect to soft dollars.
The Board noted that Redwood had allocated appropriate resources and staff to operate its compliance program, including the implementation of trading procedures reasonably designed to mitigate conflicts among accounts, that Redwood had adopted cybersecurity and business continuity policies and procedures, that Redwood’s risk management and associated policies appeared to be operating effectively and that Redwood identified and monitored risks. The Board also considered the experience and tenure of key personnel, noting the qualifications of the professional staff, as well as certain staffing additions. The Board noted that the Adviser had recently hired a new Chief Compliance Officer and that outside compliance consulting groups were used to help perform certain compliance functions for Redwood. The Board concluded that Redwood had sufficient quality and depth of personnel, resources, investment methods and compliance policies and procedures to perform its duties under the Advisory Agreement and that the nature, overall quality and extent of the advisory services provided by Redwood to each of the Redwood Tactical Fund and Redwood Municipal Fund were satisfactory and reliable.
Performance. Among other data, with respect to the Redwood Tactical Fund, the Board considered the Fund’s performance for the one-year and since inception periods ended September 30, 2018 as compared to the Redwood Tactical Fund’s benchmark index and against a group of peer funds (the “Redwood Tactical Peer Group”) provided by Broadridge, an independent third-party data provider. The Board considered that the Redwood Tactical Fund had underperformed the median of the Redwood Tactical Peer Group and its Morningstar category (Mid-Cap Value) for the one-year period, and had performed in line with the Redwood Tactical Peer Group since inception. The Board took into account management’s discussion of the Redwood Tactical Fund’s Peer Group and the Morningstar category assigned by Broadridge and the differences in the Fund’s investment strategy from the other funds. The Board also discussed the Fund’s risk-adjusted returns and results relative to the Peer Group and Morningstar category, which suggested a focus on risk management processes, and discussed the performance of the Fund’s overlay strategy. The
64
Board also took into account the relatively short period of time since the Fund had commenced operations and noted its continuing monitoring of Fund performance. The Board concluded that the overall performance of the Redwood Tactical Fund was acceptable.
With respect to the Redwood Municipal Fund, the Board considered the Fund’s performance for the one-year and since inception periods ended September 30, 2018 as compared to the Redwood Municipal Fund’s benchmark index and against a group of peer funds (the “Redwood Municipal Peer Group”) provided by Broadridge. The Board considered that the Redwood Municipal Fund had significantly outperformed the median of the Redwood Municipal Peer Group for both the one-year and since inception periods, and had underperformed the Morningstar category (High Yield Muni) for each period. The Board also discussed the Fund’s risk-adjusted returns and results relative to the Peer Group and Morningstar category and discussed the effect of the Fund’s tactical overlay strategy. The Board also took into account the relatively short period of time since the Fund had commenced operations, and noted its continuing monitoring of Fund performance. The Board took into account management’s discussion of the Redwood Municipal Fund’s Peer Group and the Morningstar category assigned by Broadridge and the differences between the Fund’s investment strategy and the other funds’ investment strategies. The Board concluded that the overall performance of the Redwood Municipal Fund was satisfactory.
Fees and Expenses. As to the costs of the services provided by Redwood, the Board considered a comparison of each of the Redwood Tactical Fund’s and Redwood Municipal Fund’s contractual advisory fee and net expense ratio to those of the Redwood Tactical Peer Group, Redwood Municipal Peer Group, and Morningstar categories, respectively. With respect to the Redwood Tactical Fund, the Board noted that the Fund’s contractual advisory fee was above the median of the Redwood Tactical Peer Group and above the median of its Morningstar category, but was not the highest. The Board also considered that the net operating expenses of the Redwood Tactical Fund were above the median of the Redwood Tactical Peer Group and its Morningstar category. With respect to the Redwood Municipal Fund, the Board noted that the Fund’s contractual advisory fee was above the median of its Morningstar category and equal to the median of the Redwood Municipal Peer Group. The Board also considered that the net operating expenses of the Redwood Municipal Fund were above the median of the Redwood Municipal Peer Group and above the median of its Morningstar category. The Board noted that neither the Redwood Tactical Fund’s nor the Redwood Municipal Fund’s gross or net expense ratio was the highest in its respective category, and also took into account each Redwood Fund’s size and the associated impact on expenses. The Board also took into account management’s discussion of the respective Peer Groups selected by Broadridge and the differences between each of the Redwood Funds and the other funds in the Peer Groups.
With respect to the Redwood Tactical Fund, the Board also noted that Redwood had agreed to reimburse expenses to limit net annual operating expenses to 1.45% and 1.20% (exclusive of (i) any front-end or contingent deferred loads; (ii) brokerage fees and commissions; (iii) acquired fund fees and expenses; (iv) borrowing costs (such as interest and dividend expense on securities sold short); (v) taxes; and (vi) extraordinary expenses, such as litigation expenses) of the average net assets attributable to Class N and Class I shares of the Fund, respectively. With respect to the
65
Redwood Municipal Fund, the Board also noted that Redwood had agreed to reimburse expenses to limit net annual operating expenses to 1.25% and 1.00% (exclusive of (i) any front-end or contingent deferred loads; (ii) brokerage fees and commissions; (iii) acquired fund fees and expenses; (iv) borrowing costs (such as interest and dividend expense on securities sold short); (v) taxes; and (vi) extraordinary expenses, such as litigation expenses) of the average net assets attributable to Class N and Class I shares of the Fund, respectively.
Based upon the factors above, the Board concluded that for each of the Redwood Tactical Fund and Redwood Municipal Fund, the contractual advisory fee was not unreasonable.
Profitability. The Board considered Redwood’s profitability and whether these profits were reasonable in light of the services provided to each of the Redwood Tactical Fund and Redwood Municipal Fund. The Board reviewed a profitability analysis prepared by Redwood based on current asset levels of each of the Redwood Tactical Fund and Redwood Municipal Fund, and considered the total profits of Redwood from its relationship with each Redwood Fund. The Board concluded that Redwood’s profitability from its relationship with each of the Redwood Tactical Fund and Redwood Municipal Fund was not excessive.
Economies of Scale. The Board considered whether Redwood would realize economies of scale with respect to its management of each of the Redwood Tactical Fund and Redwood Municipal Fund as the Redwood Funds grew and whether fee levels reflected these economies. The Board noted the asset levels at which the Adviser currently anticipated that economies of scale could be reached with respect to each Redwood Fund. The Board considered the profitability analysis included in the Board Materials, and noted that while expenses of managing each of the Redwood Funds as a percentage of assets under management were expected to decrease as each of the Redwood Tactical Fund’s and Redwood Municipal Fund’s assets continued to grow, at current asset levels, economies of scale have not yet been reached. The Board acknowledged Redwood’s statement regarding the expected capacity of each Redwood Fund, and noted that it would revisit whether economies of scale exist in the future as assets of each Redwood Fund increased over time.
Other Benefits. The Board also considered the character and amount of other direct and incidental benefits to be received by Redwood from its association with the Redwood Funds. The Board considered that Redwood anticipated the potential for an increased ability to cross-sell the Redwood Funds as one direct, indirect or ancillary material “fall-out” benefits from its relationship with the Redwood Funds.
Conclusion. The Board, having requested and received such information from Redwood as it believed reasonably necessary to evaluate the terms of the Advisory Agreement, and having been advised by independent counsel that the Board had appropriately considered and weighed all relevant factors, determined that approval of the Advisory Agreement for an additional one-year term was in the best interests of each of the Redwood Tactical Fund and Redwood Municipal Fund and each such Fund’s respective shareholders. In considering the proposed Advisory Agreement’s renewal, the Board did not identify any one factor as all important, and each Independent Trustee may have considered different factors as more important.
66
Redwood Managed Volatility Fund
At a meeting held on June 18-19, 2019 (the “Meeting”), the Board of Trustees (the “Board”) of Two Roads Shared Trust (the “Trust”), including all of those trustees who are not “interested persons” of the Trust (as such term is defined in the Investment Company Act of 1940, as amended (the “1940 Act”)), which independent Trustees constitute all of the Trustees, considered the reapproval of the investment advisory agreement (the “Advisory Agreement”) between Redwood Investment Management, LLC (“Redwood” or the “Adviser”) and the Trust, on behalf of the Redwood Managed Volatility Fund (the “Fund”), a series of the Trust.
In connection with the Board’s consideration of the Advisory Agreement, the Board received written materials in advance of the Meeting, which included information regarding: (i) the nature, extent, and quality of services provided to the Fund by the Adviser; (ii) a description of the Adviser’s investment management personnel; (iii) an overview of the Adviser’s respective operations and financial condition; (iv) a description of the Adviser’s brokerage practices (including any soft dollar arrangements); (v) a comparison of the Fund’s advisory fee and overall expenses with those of comparable mutual funds; (vi) the level of profitability from the Adviser’s fund-related operations; (vii) the Adviser’s respective compliance policies and procedures, including policies and procedures for personal securities transactions, business continuity and information security; and (viii) information regarding the performance record of the Fund as compared to other funds with similar investment strategies.
Throughout the process, including at the meeting, the Board had numerous opportunities to ask questions of and request additional materials from the Adviser. During the Meeting, the Board was advised by, and met in executive session with, the Board’s independent legal counsel, and received a memorandum from such independent counsel regarding its responsibilities under applicable law. The Board also noted that the evaluation process with respect to the Adviser was an ongoing one and that in this regard, the Board took into account discussions with management and information provided to the Board at prior meetings with respect to the services provided by the Adviser.
Matters considered by the Board in connection with its approval of the Advisory Agreement included, among others, the following:
Nature, Extent and Quality of Services. The Board reviewed materials provided by Redwood related to the Advisory Agreement with the Trust on behalf of the Fund, including the Advisory Agreement; a description of the manner in which investment decisions are made and executed; a review of the financial condition of Redwood; an overview of the personnel that perform advisory, compliance and operational services for the Fund, including any changes in key personnel; Redwood’s compliance policies and procedures, including its business continuity policy and information systems security policy and a Code of Ethics containing provisions reasonably necessary to prevent Access Persons, as that term is defined in Rule 17j-1 under the 1940 Act from engaging in conduct prohibited by Rule 17j-1(b); information regarding risk management processes; an annual review of the operation of Redwood’s compliance program; information regarding Redwood’s compliance and regulatory history; and an independent report prepared by Broadridge analyzing the performance record, fees and expenses of the Fund as compared to other mutual funds with similar investment strategies.
67
In reaching its conclusions with respect to the nature and quality of services to be provided by Redwood under the Advisory Agreement, the Board considered that Redwood’s employees have extensive asset management, risk management, operations and compliance experience. The Board considered that Redwood continued to employ quantitative and tactical investment strategies in the Fund that require a level of sophistication to execute and that there have been no significant changes in Redwood’s investment strategies other than the expansion to manage additional strategies and accounts. The Board noted that Redwood had allocated appropriate resources and staff to operate its compliance program, including the implementation of trading procedures reasonably designed to mitigate conflicts among accounts, that Redwood had adopted cybersecurity and business continuity policies and procedures, that Redwood’s risk management and associated policies appeared to be operating effectively and that Redwood identified and monitored risks. The Board also considered Redwood’s brokerage practice and the experience and tenure of key personnel, noting the qualifications of the professional staff and that Redwood had added additional staffing as the firm continued to grow. The Board concluded that Redwood had sufficient quality and depth of personnel, resources, investment methods and compliance policies and procedures to perform its duties under the Advisory Agreement and that the nature, overall quality and extent of the advisory services provided by Redwood to the Fund were satisfactory and reliable.
Performance. The Board considered the performance of the Fund. The Board considered, among other performance data, the Fund’s performance, including for the one-year, three-year, and since inception periods ended March 31, 2019 as compared to the Fund’s benchmark index and against the performance of a group of peer funds (the “Peer Group”) provided by Broadridge. The Board considered that the Fund had underperformed the median of the Peer Group and the Fund’s primary benchmark for the one-year period, outperformed its peer group and benchmark for the three-year period, and slightly underperformed the median of its Peer Group, but had outperformed its benchmark for the five-year period.
The Board also took into account management’s discussion of the Fund’s performance and considered the Morningstar category in which the Fund had been placed, noting the differences between the Fund’s investment strategies and the investment strategies of other funds in the Peer Group. The Board also considered that the Fund’s performance over the three-year period suggested a consistent focus and process with respect to downside risk volatility. The Board concluded that the Fund’s performance was satisfactory and that it was meeting investment objectives.
Fees and Expenses. As to the costs of the services provided by Redwood, with respect to the Fund, the Board considered a comparison of the Fund’s advisory fee and net operating expense ratios to those of the funds in the Peer Group as set forth in the report provided by Broadridge generally useful, the Board ascertained certain errors in the Broadridge. The Board noted that the Fund’s advisory fee was above the Peer Group median, but that the total net operating expenses were below the Peer Group median. The Board took into account Redwood’s discussion of the Fund’s expenses, and also considered the level of the Fund’s net operating expenses as contained in the Fund’s most recent prospectus. The Board considered the Fund’s expense ratio, noting that
68
Redwood had agreed to limit the Fund’s net annual operating expenses to 1.67%, 1.92% and 1.43% (exclusive of any front-end or contingent deferred loads; brokerage fees and commissions; acquired fund fees and expenses; borrowing costs (such as interest and dividend expense on securities sold short); taxes; and extraordinary expenses, such as litigation expenses) of the average net assets of Class I, Class N and Class Y shares of the Fund, respectively.
In considering the level of the advisory fee with respect to the Fund, the Board also took into account the cost of other accounts managed by Redwood, if any, that used a similar investment strategy, noting that differences were attributable to the differences in the management of these different kinds of accounts.
Based on the factors above, the Board concluded that the advisory fee of the Fund was not unreasonable.
Profitability. The Board considered Redwood’s profitability and whether these profits were reasonable in light of the services provided to the Fund. The Board reviewed a profitability analysis prepared by Redwood based on current asset levels of the Fund, and considered the total profits of Redwood from its relationship with the Fund. The Board noted the direct and indirect costs of operating the Fund and that Redwood continued to reimburse operating expenses of the Fund. The Board concluded that Redwood’s profitability from its relationship with the Fund was not excessive.
Economies of Scale. The Board considered whether Redwood would realize economies of scale with respect to its management of the Fund as the Fund grows and whether fee levels reflected these economies of scale for the benefit of shareholders. The Board noted that the advisory fees did not currently have breakpoints. The Board considered Redwood’s discussion of the Fund’s advisory fee structure. The Board also noted that the Adviser was currently reimbursing expenses related to the Fund. The Board considered the profitability analysis included in the Board Materials, and noted that while expenses of managing the Fund as a percentage of assets under management are expected to decrease as the Fund’s assets continue to grow, at current asset levels, economies of scale had not yet been reached. The Board noted that it would revisit whether economies of scale should be taken into account in the future once the Fund has achieved sufficient scale.
Other Benefits. The Board also considered the character and amount of any other direct and incidental benefits to be received by Redwood from its association with the Fund. The Board considered that with respect to the Fund, Redwood may potentially benefit from an increased ability to cross-sell through turnkey investment model implementations, and that Redwood did not anticipate receiving any other direct, indirect or ancillary material “fall-out” benefits from its relationship with the Fund.
Conclusion. The Board, having requested and received such information from Redwood as it believed reasonably necessary to evaluate the terms of the Advisory Agreement, and having been advised by independent counsel that the Board had appropriately considered and weighed all relevant factors, determined that approval of the Advisory Agreement for an additional one-year term was in the best interests of the Fund and its shareholders. In considering the Advisory
69
Agreement renewal, the Board did not identify any one factor as all important and each Independent Trustee may have considered different factors as more important.
70
Redwood Activist Leaders Fund, Redwood AlphaFactor Tactical International Fund and Redwood Systematic Macro Trend (“SMART”) Fund
At a meeting held on September 11-12, 2019 (the “Meeting”), the Board of Trustees (the “Board”) of Two Roads Shares Trust (the “Trust”), each of whom is not an “interested person” of the Trust (the “Independent Trustees” or the “Trustees”), as such is term defined under Section 2(a)(19) of the Investment Company Act of 1940, as amended (the “1940 Act”), considered the reapproval of the investment advisory agreement (the “Advisory Agreement”) between Redwood Investment Management, LLC (“Redwood” or the “Adviser”) and the Trust, on behalf of the Redwood Activist Leaders Fund, AlphaFactor Tactical International Fund and Systematic Macro Trend (“SMART”) Fund (together, the “Redwood Funds”).
In connection with the Board’s consideration of the Agreement, the Board received written materials in advance of the Meeting, which included information regarding: (i) the nature, extent, and quality of services to be provided to the Redwood Funds by Redwood; (ii) a description of the Adviser’s investment management personnel; (iii) an overview of the Adviser’s operations and financial condition; (iv) a description of the Adviser’s brokerage practices (including any soft dollar arrangements); (v) a comparison of the Redwood Funds’ advisory fees and overall expenses with those of comparable mutual funds; (vi) the anticipated level of profitability from the Adviser’s fund-related operations; (vii) the Adviser’s compliance policies and procedures, including policies and procedures for personal securities transactions, business continuity and information security and (viii) information regarding the performance of the Redwood Funds as compared to other mutual funds with similar investment strategies.
Throughout the process, including at the meeting, the Board had numerous opportunities to ask questions of and request additional materials from Redwood. During the Meeting, the Board was advised by, and met, in executive session with, the Board’s independent legal counsel, and received a memorandum from such independent counsel regarding their responsibilities under applicable law.
The Board noted that the evaluation process with respect to Redwood is an ongoing one. In this regard, the Board also took into account discussions with management and information provided to the Board at prior meetings with respect to the services provided by Redwood to the Fund, including quarterly performance reports prepared by management containing reviews of investment results and prior presentations from the Adviser with respect to the Fund. The information received and considered by the Board in connection with the Meeting and throughout the year was both written and oral.
Matters considered by the Board in connection with its approval of the Agreement included, among others, the following:
Nature, Extent and Quality of Services. The Board reviewed materials provided by Redwood related to the Advisory Agreement with the Trust with respect to each of the Redwood Funds, including the Advisory Agreement, a description of the manner in which investment decisions are made and executed; an overview of the personnel that perform services for the Redwood Funds and their background and experience; a summary of the financial condition of Redwood; a written
71
report containing Redwood’s performance commentary for the prior quarterly period; Redwood’s compliance policies and procedures, including a Code of Ethics containing provisions reasonably necessary to prevent Access Persons, as that term is defined in Rule 17j-1 under the 1940 Act, from engaging in conduct prohibited by Rule 17j-1(b); and an independent report prepared by Broadridge, an independent third party data provider, analyzing the performance record, fees and expenses of the Redwood Funds as compared to other mutual funds with similar investment strategies.
In reaching its conclusions with respect to the nature and quality of services to be provided by Redwood under the Advisory Agreement, the Board considered Redwood’s asset management, risk management, operations, and compliance experience. The Board considered that the investment strategies used in the Redwood Funds employ quantitative and tactical investment elements and require a significant level of sophistication to execute. The Board also noted that on a regular basis it receives and reviews information from the Trust’s Chief Compliance Officer (CCO) regarding Redwood’s compliance policies and procedures established pursuant to Rule 38a-1 under the 1940 Act. The Board also considered the operation and robustness of Redwood’s compliance program, and that Redwood had added personnel to its compliance and operations functions.
In considering the nature, extent, and quality of the services provided by Redwood, the Board also took into account its knowledge, acquired through discussions and reports during the preceding year and in past years, of Redwood’s management and the quality of the performance of Redwood’s duties.
The Board concluded that Redwood had sufficient quality and depth of personnel, resources, investment methodologies and compliance policies and procedures to perform its duties under the Advisory Agreement with respect to each of the Redwood Funds and that the nature, overall quality and extent of the management services provided by Redwood to the Redwood Funds was satisfactory and reliable.
Performance. In considering the Redwood Fund’s performance, the Board noted that it reviews at its regularly scheduled meetings information about each of the Redwood Fund’s performance results. Among other data, the Board considered each Redwood Fund’s performance for the one-year, and since inception periods ended June 30, 2019 as compared to each Redwood Fund’s benchmark index and against a group of peer funds (the “Peer Group”) provided by Broadridge, an independent third-party data provider. The Board noted that while it found the data provided by the independent third-party generally useful it recognized its limitations, including in particular that the data may vary depending on the end date selected and that the results of the performance comparisons may vary depending on the selection of the peer group. The Board considered that the Redwood AlphaFactor Tactical International Fund had outperformed the median of its Peer Group and Morningstar category for both the one-year and since inception periods. The Board also noted that the Redwood Activist Leaders Fund and Redwood Systematic Macro Trend (“SMarT”) Fund had underperformed the median of their respective Peer Groups and Morningstar categories for both the one-year and since inception (November 2, 2017) periods. The Board took into account the short operating history of each Fund and noted that this period did not reflect returns
72
over a full market cycle. The Board also noted that that Redwood was actively monitoring the performance of each Redwood Fund. The Board concluded that the overall performance of each of the Redwood Funds was satisfactory or, in the case of underperformance, was being appropriately monitored.
Fees and Expenses. As to the costs of the services provided by Redwood, the Board considered a comparison, compiled by Morningstar, of each Redwood Fund’s advisory fee and operating expenses with those of certain peer funds with similar investment objectives and strategies (each a “Peer Group”) and with those of other funds in the respective Morningstar category for each Redwood Fund as selected by Morningstar.
With respect to the Redwood Activist Leaders Fund, the Board noted, among other data, that the advisory fee was higher than the median of the Fund’s Peer Group and Morningstar category (Mid-Cap Blend Category), but was not the highest in the Fund’s Peer Group or Morningstar category. With respect to the Redwood AlphaFactor Tactical International Fund, the Board noted, among other data, that the advisory fee was the highest of its Peer Group and of its Morningstar category (Foreign Large Blend Category). With respect to the SMarT Fund, the Board noted, among other data, that the advisory fee was roughly equal to the median of the Peer Group and higher than the median of its Morningstar category (Allocation – 30%-50% Equity) as selected by Morningstar. The Board noted that each advisory fee was within a not excessive range of its respective Morningstar category.
The Board took into account that Redwood had agreed to reimburse expenses to limit net annual operating expenses (exclusive of (i) any front-end or contingent deferred loads; (ii) brokerage fees and commissions; (iii) acquired fund fees and expenses; (iv) borrowing costs (such as interest and dividend expense on securities sold short); (v) taxes; and (vi) extraordinary expenses, such as litigation expenses) to 1.15%, and 0.90% for Class N and Class I shares, respectively, of the Redwood Activist Leaders Fund, 1.45% and 1.20% for Class N and I shares, respectively, for the Redwood AlphaFactor Tactical International Fund, and 1.55% and 1.30% for Class N and Class I Shares, respectively, for the SMarT Fund. The Board also noted that Redwood currently did not manage any other accounts or funds where a management fee was charged that are similarly managed as the Redwood Funds.
With respect to SMarT Fund, the Board also determined that the services provided by Redwood under the Advisory Agreement were in addition to, rather than duplicative of, the advisory services provided to the underlying funds in which the Fund invests.
The Board concluded that the contractual advisory fees respect to each Fund was not unreasonable.
Profitability. The Board considered Redwood’s profitability and whether these profits were reasonable in light of the services provided to each of the Redwood Funds. The Board reviewed a profitability analysis prepared by Redwood based on current asset levels of each of the Redwood Funds and considered the total profits of Redwood from its relationship with each of the Redwood Funds on a Fund-by-Fund basis and for such Redwood Funds in the aggregate. The Board concluded that Redwood’s profitability from its relationship with the Redwood Funds, after taking into account a reasonable allocation of costs, was not excessive.
73
Economies of Scale. The Board considered whether Redwood would realize economies of scale with respect to its management of the Redwood Funds as the Redwood Funds grew and whether fee levels reflected these economies. The Board noted that that although each Redwood Fund’s current advisory fee does not include breakpoints, the Redwood Funds’ future shareholders should benefit from each Redwood Fund’s growth. The Board considered the profitability analysis included in the Board Materials, and noted that while expenses of managing each Redwood Fund as a percentage of assets under management were expected to decrease as the Redwood Funds’ assets continued to grow, at current asset levels, economies of scale have not yet been reached. The Board noted that it would revisit whether economies of scale exist in the future once each Redwood Fund had achieved sufficient scale.
Other Benefits. The Board also considered the character and amount of other direct and incidental benefits to be received by Redwood from its association with the Redwood Funds. The Board considered that Redwood uses each of the Redwood Funds as components of model portfolios it builds for its clients and that expanding its offering of mutual funds will result in a greater number and type of model portfolios offered by Redwood. Redwood did not anticipate receiving any other direct, indirect or ancillary material “fall-out” benefits from its relationship with the Funds.
Conclusion. The Board, having requested and received such information from Redwood as it believed reasonably necessary to evaluate the terms of the Advisory Agreement, and having been advised by independent counsel that the Board had appropriately considered and weighed all relevant factors, determined that approval of the Advisory Agreement for an additional one-year term was in the best interests of each Redwood Fund and its shareholders.
In considering the Advisory Agreement renewal, the Board considered a variety of factors, including those discussed above, and also considered other factors (including conditions and trends prevailing generally in the economy, the securities markets, and the industry). The Board did not identify any one factor as all important, and each Independent Trustee may have considered different factors as more important. The Board’s conclusions may be based in part on its consideration of the advisory arrangements in prior years and on the Board’s ongoing regular review of fund performance and operations throughout the year.
74
| Redwood Funds |
| SUPPLEMENTAL INFORMATION (Unaudited)(Continued) |
| October 31, 2019 |
Trustees and Officers.The Trustees and officers of the Trust, together with information as to their principal business occupations during the past five years and other information, are shown below. Unless otherwise noted, the address of each Trustee and Officer is 225 Pictoria Drive, Suite 450, Cincinnati, OH 45246.
Independent Trustees *
| Name, Address, Year of Birth | Position(s) Held with Registrant | Term and Length Served | Principal Occupation(s) During Past 5 Years | Number of Portfolios Overseen In The Fund Complex** | Other Directorships Held During Past 5 Years |
| Mark Garbin Year of Birth: 1951 | Trustee | Indefinite, Since 2012 | Managing Principal, Coherent Capital Management LLC (since 2008) | 8 | Northern Lights Fund Trust (since 2013); Northern Lights Variable Trust (since 2013); Forethought Variable Insurance Trust (since 2013); OHA Mortgage Strategies Fund (offshore), Ltd. (2014 -2017); Altegris KKR Commitments Master Fund (since 2014); and OFI Carlyle Tactical Private Credit Fund (since March 2018) |
| Mark D. Gersten Year of Birth: 1950 | Chairman, Trustee | Indefinite, Since 2012 | Independent Consultant (since 2012); Senior Vice President – Global Fund Administration Mutual Funds & Alternative Funds, AllianceBernstein LP (1985 – 2011) | 8 | Northern Lights Fund Trust (since 2013); Northern Lights Variable Trust (since 2013); Altegris KKR Commitments Master Fund (since 2014); previously, Ramius Archview Credit and Distressed Fund (2015-2017); and Schroder Global Series Trust (2012 to 2017) |
| Neil M. Kaufman Year of Birth: 1960 | Trustee, Audit Committee Chairman | Indefinite, Since 2012 | Managing Member, Kaufman & Associates, LLC (legal services)(Since 2016); Partner, Abrams Fensterman, Fensterman, Eisman, Formato, Ferrara & Wolf, LLP (legal services)(2010-2016) | 8 | Altegris KKR Commitments Master Fund (since 2014) |
| Anita K. Krug Year of Birth: 1969 | Trustee | Indefinite, Since 2012 | Dean (since 2019) Chicago Kent Law School; Interim Vice Chancellor for Academic Affairs (2018-2019) University of Washington Bothell; Interim Dean (2017- 2018), Professor (since 2016), Associate Professor (2014-2016); and Assistant Professor (2010-2014), University of Washington School of Law | 8 | Altegris KKR Commitments Master Fund (since 2014); Centerstone Investors Trust (since 2016) |
| * | Information is as of October 31, 2019. |
| ** | As of October 31, 2019, the Trust was comprised of 20 active portfolios managed by seven unaffiliated investment advisers and two affiliated investment advisers. The term “Fund Complex” applies only to those funds that are (i) advised by a common investment adviser or by an investment adviser that is an affiliated person of the investment adviser of any of the other funds of the Trust or (ii) hold themselves out to investors as related companies for purposes of investment and investor services. The Funds do not share the same investment adviser with any other series of the Trust, other than the Redwood Managed Volatility Portfolio and LeaderShares™ AlphaFactor US Core Equity ETF, or hold themselves out as related to any other series of the Trust for investment purposes. |
10/31/19 – Two Roadsv2
75
| Redwood Funds |
| SUPPLEMENTAL INFORMATION (Unaudited)(Continued) |
| October 31, 2019 |
Officers of the Trust*
| Name, Address, Year of Birth | Position(s) Held with Registrant | Principal Occupation(s) During Past 5 Years | Number of Portfolios Overseen In The Fund Complex** | Other Directorships Held During Past 5 Years |
| James Colantino 80 Arkay Drive Hauppauge, NY 11788 Year of Birth: 1969 | President Since Feb. 2017 Treasurer (2012 to 2017) | Senior Vice President (2012-present); Vice President (2004 to 2012); Gemini Fund Services, LLC | N/A | N/A |
| Laura Szalyga 80 Arkay Drive Hauppauge, NY 11788 Year of Birth: 1978 | Treasurer Since Feb. 2017 | Vice President, Gemini Fund Services, LLC (since 2015); Assistant Vice President, Gemini Fund Services, LLC (2011-2014) | N/A | N/A |
| Richard A. Malinowski 80 Arkay Drive Hauppauge, NY 11788 Year of Birth: 1983 | Vice President Since Sep. 2018 Secretary Since 2013 | Senior Vice President (since 2017); Vice President and Counsel (2016-2017) and Assistant Vice President (2012 – 2016), Gemini Fund Services, LLC | N/A | N/A |
| William B. Kimme Year of Birth: 1962 | Chief Compliance Officer Since Inception | Senior Compliance Officer, Northern Lights Compliance Services, LLC (September 2011 -present) | N/A | N/A |
| * | Information is as of October 31, 2019. |
| ** | As of October 31, 2019, the Trust was comprised of 20 active portfolios managed by seven unaffiliated investment advisers and two affiliated investment advisers. The term “Fund Complex” applies only to those funds that are (i) advised by a common investment adviser or by an investment adviser that is an affiliated person of the investment adviser of any of the other funds of the Trust or (ii) hold themselves out to investors as related companies for purposes of investment and investor services. The Funds do not share the same investment adviser with any other series of the Trust, other than the Redwood Managed Volatility Portfolio and LeaderShares™ AlphaFactor US Core Equity ETF or hold themselves out as related to any other series of the Trust for investment purposes. |
The Fund’s Statement of Additional Information (“SAI”) includes additional information about the Trustees and is available free of charge, upon request, by calling toll-free at 1-855-733-3863.
10/31/19 – Two Roadsv2
76
| PRIVACY NOTICE | |||||||||
| FACTS | WHAT DOES TWO ROADS SHARED TRUST DO WITH YOUR PERSONAL INFORMATION | ||||||||
| Why? | Financial companies choose how they share your personal information. Federal law gives consumers the right to limit some but not all sharing. Federal law also requires us to tell you how we collect, share, and protect your personal information. Please read this notice carefully to understand what we do. | ||||||||
| What? | THE TYPES OF PERSONAL INFORMATION WE COLLECT AND SHARE DEPENDS ON THE PRODUCT OR SERVICE THAT YOU HAVE WITH US. THIS INFORMATION CAN INCLUDE: | ||||||||
| ● Social Security number and income | |||||||||
| ● Account transactions and transaction history | |||||||||
| ● Investment experience and purchase history | |||||||||
| When you areno longer our customer, we continue to share your information as described in this notice. | |||||||||
| How? | All financial companies need to share customers’ personal information to run their everyday business. In the section below, we list the reasons financial companies can share their customers’ personal information; the reason Two Roads Shared Trust chooses to share and whether you can limit this sharing. | ||||||||
| Reasons we can share your personal information | Does Two Roads Shared Trust share? | Can you limit this sharing? |
| For our everyday business purposes – such as to process your transactions, maintain your account(s), respond to court orders and legal investigations, or report to credit bureaus | YES | NO |
| For our marketing purposes – to offer our products and services to you | NO | We do not share |
| For joint marketing with other financial companies | NO | We do not share |
| For our affiliates’ everyday business purposes – information about your transactions and experiences | NO | We do not share |
| For our affiliates’ everyday business purposes – information about your creditworthiness | NO | We do not share |
| For our affiliates to market to you | NO | We do not share |
| For nonaffiliates to market to you | NO | We do not share |
| Questions? | Call 1-402-895-1600 | |
77
What we do
| How does Two Roads Shared Trust protect my personal information? | To protect your personal information from unauthorized access and use, we use security measures that comply with federal law. These measures include computer safeguards and secured files and buildings.
Our service providers are held accountable for adhering to strict policies and procedures to prevent any misuse of your nonpublic personal information. |
| How does Two Roads Shared Trust collect my personal information? | We collect your personal information, for example, when you |
| ● open an account or give us contact information | |
| ● provide account information or give us your income information | |
| ● make deposits or withdrawals from your account | |
| We also collect your personal information from other companies. | |
| Why can’t I limit all sharing? | Federal law gives you the right to limit only |
| ● sharing for affiliates’ everyday business purposes – information about your creditworthiness | |
| ● affiliates from using your information to market to you | |
| ● sharing for nonaffiliates to market to you | |
| State laws and individual companies may give you additional rights to limit sharing | |
| Definitions | |
| Affiliates | Companies related by common ownership or control. They can be financial and nonfinancial companies. |
| ● Two Roads Shared Trust has no affiliates. | |
| Nonaffiliates | Companies not related by common ownership or control. They can be financial and nonfinancial companies. |
| ● Two Roads Shared Trust does not share with nonaffiliates so they can market to you. | |
| Joint marketing | A formal agreement between nonaffiliates financial companies that together market financial products or services to you. |
| ● Two Roads Shared Trust does not jointly market. | |
78
Proxy Voting Policy
Information regarding how the Funds vote proxies relating to portfolio securities for the 12 month period ended April 30th as well as a description of the policies and procedures that the Funds used to determine how to vote proxies is available without charge, upon request, by calling 1-855-852-8998 or by referring to the Securities and Exchange Commission’s (“SEC”) website at http://www.sec.gov.
Portfolio Holdings
Each Fund files its complete schedule of portfolio holdings with the SEC for the first and third quarters of each fiscal year on Form N-Q, or as an exhibit to its report on Form N-Q’s successor form, Form N-Port. Form N-Q and Form N-Port are available on the SEC’s website athttp://www.sec.gov. The information on Form N-Q is available without charge, upon request, by calling 1-855-733-3863.
| Investment Advisor |
| Redwood Investment Management, LLC |
| 4110 N Scottsdale Rd, Suite 125 |
| Scottsdale, AZ 85251 |
| Administrator |
| Gemini Fund Services, LLC |
| 80 Arkay Drive, Suite 110 |
| Hauppauge, NY 11788 |
ITEM 2. CODE OF ETHICS.
| (a) | The registrant has, as of the end of the period covered by this report, adopted a code of ethics that applies to the registrant's principal executive officer, principal financial officer, and principal accounting officer or controller, or persons performing similar functions, regardless of whether these individuals are employed by the registrant or a third party. |
| (b) | During the period covered by this report, there were no amendments to any provision of the code of ethics. |
| (c) | During the period covered by this report, there were no waivers or implicit waivers of a provision of the code of ethics. |
ITEM 3. AUDIT COMMITTEE FINANCIAL EXPERT.
| The registrant’s Board of Trustees has determined that Mark Gersten is an audit committee financial expert, as defined in Item 3 of Form N-CSR. Mr Gersten is independent for purposes of this Item 3. |
ITEM 4. PRINCIPAL ACCOUNTANT FEES AND SERVICES.
| (a) | Audit Fees. The aggregate fees billed for each of the last two fiscal years for professional services rendered by the registrant's principal accountant for the audit of the registrant's annual financial statements or services that are normally provided by the accountant in connection with statutory and regulatory filings or engagements for those fiscal years are as follows:
|
| Trust Series | 2019 | 2018 | ||||||
| Redwood Managed Volatility Fund | $ | 16,750 | $ | 15,000 | ||||
| Redwood Managed Municipal Income Fund | $ | 15,750 | $ | 15,500 | ||||
| Redwood AlphaFactor® Tactical Core Fund | $ | 15,500 | $ | 15,000 | ||||
| Redwood AlphaFactor® Tactical International Fund | $ | 16,500 | $ | 15,500 | ||||
| Redwood Systematic Macro Trend Fund | $ | 15,500 | $ | 15,500 | ||||
| Redwood Activist Leaders Fund | $ | 15,000 | $ | 15,500 | ||||
| (b) | Audit-Related Fees. There were no fees billed in each of the last two fiscal years for assurances and related services by the principal accountant that are reasonably related to the performance of the audit of the registrant’s financial statements and are not reported under paragraph (a) of this item. |
| (c) | Tax Fees. The aggregate fees billed in each of the last two fiscal years for professional services rendered by the principal accountant for tax compliance are as follows: |
| Trust Series | 2019 | 2018 |
| Redwood Managed Volatility Fund | $2,900 | $2,800 |
| Redwood Managed Municipal Income Fund | $2,900 | $2,800 |
| Redwood AlphaFactor® Tactical Core Fund | $2,900 | $2,800 |
| Redwood AlphaFactor® Tactical International Fund | $2,900 | $3,000 |
| Redwood Systematic Macro Trend Fund | $2,900 | $2,800 |
| Redwood Activist Leaders Fund | $2,900 | $2,800 |
| (d) | All Other Fees. The aggregate fees billed in each of the last two fiscal years for products and services provided by the registrant’s principal accountant, other than the services reported in paragraphs (a) through (c) of this item were $0 for the fiscal year ended October 31, 2019. |
| (e)(1) | The audit committee does not have pre-approval policies and procedures. Instead, the audit committee or audit committee chairman approves on a case-by-case basis each audit or non-audit service before the principal accountant is engaged by the registrant. |
| (e)(2) | There were no services described in each of paragraphs (b) through (d) of this Item that were approved by the audit committee pursuant to paragraph (c)(7)(i)(C) of Rule 2-01 of Regulation S-X. |
| f) | Not applicable. The percentage of hours expended on the principal accountant's engagement to audit the registrant's financial statements for the most recent fiscal year that were attributed to work performed by persons other than the principal accountant's full-time, permanent employees was zero percent (0%). |
| (g) | All non-audit fees billed by the registrant's principal accountant for services rendered to the registrant for the fiscal year ended October 31, 2019 are disclosed in (b)-(d) above. There were no audit or non-audit services performed by the registrant's principal accountant for the registrant's adviser. |
ITEM 5. AUDIT COMMITTEE OF LISTED REGISTRANTS.
Not applicable
ITEM 6. SCHEDULE OF INVESTMENT
Included in annual report to shareholders filed under item 1 of this form.
ITEM 7. DISCLOSURE OF PROXY VOTING POLICIES AND PROCEDURES FOR CLOSED-END MANAGEMENT INVESTMENT COMPANIES.
Not applicable Fund is an open-end management investment company
ITEM 8. PORTFOLIO MANAGERS OF CLOSED-END MANAGEMENT INVESTMENT COMPANIES
Not applicable Fund is an open-end management investment company
ITEM 9. PURCHASES OF EQUITY SECURITIES BY CLOSED-END MANAGEMENT INVESTMENT COMPANY AND AFFILIATED PURCHASERS.
Not applicable Fund is an open-end management investment company
ITEM 10. SUBMISSION OF MATTERS TO A VOTE OF SECURITY HOLDERS.
Not applicable at this time.
ITEM 11. CONTROLS AND PROCEDURES.
| (a) | The registrant's principal executive and principal financial officers, or persons performing similar functions, have concluded that the registrant's disclosure controls and procedures (as defined in Rule 30a-3(c) under the 1940 Act, are effective, as of a date within 90 days of the filing date of this report, based on the evaluation of these controls and procedures required by Rule 30a-3(b) under the 1940 Act and Rule 15d-15(b) under the Securities Exchange Act of 1934, as amended. |
| (b) | There were no changes in the registrant's internal control over financial reporting (as defined in Rule 30a-3(d) under the 1940 Act) that occurred during the period covered by this report that have materially affected, or are reasonably likely to materially affect, the registrant's internal control over financial reporting. |
ITEM 12. DISCLOSURE OF SECURITIES LENDING ACTIVITIES FOR CLOSED-END MANAGEMENT INVESTMENT COMPANIES.
Not applicable Fund is an open-end management investment company
ITEM 13. EXHIBITS
| (1) | Code of Ethics for Principal Executive and Senior Financial Officers is attached hereto. |
| (2) | Certifications pursuant to Section 302 of the Sarbanes-Oxley Act of 2002 are filed herewith. |
| (3) | Certifications pursuant to Section 906 of the Sarbanes-Oxley Act of 2002 are filed herewith. |
SIGNATURES
Pursuant to the requirements of the Securities Exchange Act of 1934 and the Investment Company Act of 1940, the registrant has duly caused this report to be signed on its behalf by the undersigned, thereunto duly authorized.
Two Roads Shared Trust
| By James Colantino | /s/James Colantino |
| President/Principal Executive Officer, | |
| Date: January 9, 2020 | |
Pursuant to the requirements of the Securities Exchange Act of 1934 and the Investment Company Act of 1940, this report has been signed below by the following person on behalf of the registrant and in the capacities and on the date indicated.
| By James Colantino | /s/James Colantino |
| President/Principal Executive Officer | |
| Date: January 9, 2020 | |
Pursuant to the requirements of the Securities Exchange Act of 1934 and the Investment Company Act of 1940, this report has been signed below by the following person on behalf of the registrant and in the capacities and on the date indicated.
| By Laura Szalyga | /s/ Laura Szalyga |
| Treasurer/Principal Financial Officer | |
| Date: January 9, 2020 | |