united states
securities and exchange commission
washington, d.c. 20549
form n-csr
certified shareholder report of registered management
investment companies
Investment Company Act file number 811-22718
Two Roads Shared Trust
(Exact name of registrant as specified in charter)
225 Pictoria Drive, Suite 450 Cincinnati, OH 45246
(Address of principal executive offices) (Zip code)
Richard Malinowski, Gemini Fund Services, LLC.
80 Arkay Drive Suite 110, Hauppauge, NY 11788
(Name and address of agent for service)
Registrant's telephone number, including area code: 631-470-2619
Date of fiscal year end: 10/31
Date of reporting period:10/31/19
ITEM 1. REPORTS TO SHAREHOLDERS.
Beginning on January 1, 2021, as permitted by regulations adopted by the Securities and Exchange Commission, paper copies of the Fund’s shareholder reports like this one will no longer be sent by mail, unless you specifically request paper copies of the reports. Instead, the reports will be made available on the Fund’s websitewww.leadersharesetfs.com, and you will be notified by mail each time a report is posted and provided with a website link to access the report.
If you already elected to receive shareholder reports electronically, you will not be affected by this change and you need not take any action. You may elect to receive shareholder reports and other communications from the Fund electronically or to continue receiving paper copies of shareholder reports, which are available free of charge, by contacting your financial intermediary (such as a broker-dealer or bank) or, if you are a direct investor, by following the instructions included with paper Fund documents that have been mailed to you.
Dear Shareholder,
LeaderShares™ AlphaFactor® US Core Equity ETF (LSAF):12.16%*
| * | From November 1, 2018 through October 31, 2019 |
Source: Gemini Fund Services.
During the LeaderShares™ AlphaFactor® US Core Equity ETF’s (the “Fund”) fiscal year ended October 31, 2019, U.S. large-cap equities, represented by the S&P 500 Index** sold-off aggressively during Q4 of 2018 (10/1/18-12/31/18), at one point reaching a drawdown of almost -20%. The volatility spike put pressure on all risk assets. Equities, however recovered back towards highs, potentially due to the Federal Reserve reversing course by cutting short term interest rates, stronger than expected economic data, and corporate earnings.
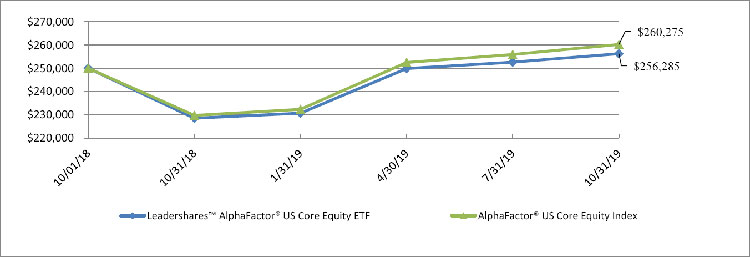
The Fund posted gains of 12.16% (Source: Gemini) during the year ended October 31, 2019, as compared to the 13.30% return of the benchmark AlphaFactor® US Core Equity Index. During the period, the Fund was invested in a portfolio of stocks based on its quantitative selection methodology. The Fund’s under-exposure to quantitative factors such as growth and size seemed to drive slight equity underperformance against the S&P 500 Index, which returned 14.33% for the reporting period, although generally systematic correlation to the overall U.S. equity market was as expected on both down and up trends. The Fund will continue to implement its disciplined quantitative stock selection process.
Capital markets are infinitely complex. Every day, new information becomes available that changes the risk and return dynamic of any investment. In our view, capital markets are only a tool to capture opportunities in favorable risk-return dynamic, wherever they exist to work towards an investor’s long-term goal or objective. We do not attempt to forecast or suggest what may lie ahead. Instead, we utilize a quantitative approach, aiming to minimize the subjectivity of investing.
| ** | Standard and Poor’s 500 Total Return Index is a capitalization-weighted index of 500 stocks. The index is designed to measure performance of the broad domestic economy through changes in the aggregate market value of 500 stocks representing all major industries. Investors cannot invest directly in an index or benchmark. Index returns are gross of any fees, brokerage commissions or other expenses of investing. |
The views in this report are those of the Fund’s management. This report contains certain forward-looking statements about factors that may affect the performance of the Fund in the future. These statements are based on the Fund’s management’s predictions and expectations concerning certain future events such as the performance of the economy as a whole and of specific industry sectors. Management believes these forward-looking statements are reasonable, although they are inherently uncertain and difficult to predict.
3911-NLD-12/12/2019
1
| LeaderSharesTMAlphaFactor® US Core Equity ETF |
| PORTFOLIO REVIEW |
| October 31, 2019 (Unaudited) |
The Fund’s performance figures* for the period ended October 31, 2019, compared to its benchmark:
| One Year | Since Inception(a) | |
| LeaderShares™ AlphaFactor® US Core Equity ETF - NAV | 12.16% | 2.32% |
| LeaderShares™ AlphaFactor® US Core Equity ETF - Market Price | 12.20% | 2.78% |
| AlphaFactor®US Core Equity Index(b) | 13.30% | 3.58% |
| * | The performance data quoted here represents past performance. Current performance may be lower or higher than the performance data quoted above. Past performance is no guarantee of future results. The investment return and principal value of an investment will fluctuate so that investor’s shares, when redeemed, may be worth more or less than their original cost. The returns shown do not reflect the deduction of taxes that a shareholder would pay on Fund distributions or on the redemption of Fund shares. The Fund’s per share net asset value or “NAV” is the value of one share of the Fund as calculated in accordance with the standard formula for valuing shares. The NAV return is based on the NAV of the Fund and the market return is based on the market price per share of the Fund. The price used to calculate market return (“Market Price”) is determined by using the midpoint between the highest bid and the lowest offer on the primary stock exchange on which shares of the Fund are listed for trading, as of the time that the Fund’s NAV is calculated. Since shares of the Fund did not trade in the secondary market until after the Fund’s inception, for the period from inception (10/1/2018) to the first day of secondary market trading shares of the Fund, the NAV of the Fund is used as a proxy for the Market Price to calculate market returns. Market and NAV returns assume that dividends and capital gain distributions have been reinvested in the Fund at Market Price and NAV, respectively. The Fund’s total annual operating expenses are 0.75% per the February 28, 2019 prospectus. Please see the Financial Highlights for a more recent expense ratio. For performance information current to the most recent month-end, please call toll-free 1-480-757-4277. |
| (a) | As of the close of business on the day of commencement of trading October 1, 2018 |
| (b) | The AlphaFactor® US Core Equity Index, the Fund advisor’s proprietary index, utilizes a quantitative rules-based investment methodology that applies a multi-factor ranking process and is focused on the largest 1,000 U.S. common stocks based on market capitalization. Companies within this group of the top 1,000 market capitalizations may be considered large or mid-cap companies. |
Comparison of the Change in Value of a $250,000 Investment
| PORTFOLIO ANALYSIS | |||
| October 31, 2019 | |||
| Percent of | |||
| Top 10 Industries | Net Assets | ||
| Retail | 9.8% | ||
| Diversified Financial Services | 7.9% | ||
| Insurance | 7.7% | ||
| Electronics | 6.8% | ||
| Semiconductors | 5.3% | ||
| Software | 4.9% | ||
| Banks | 4.0% | ||
| Transportation | 4.0% | ||
| Internet | 3.8% | ||
| Lodging | 3.0% | ||
| Other/Cash and Equivalents | 42.8% | ||
| Total | 100.0% | ||
| Please refer to the Portfolio of Investments for a detailed listing of the Fund’s holdings. | |||
2
| LeaderSharesTMAlphaFactor® US Core Equity ETF |
| PORTFOLIO OF INVESTMENTS |
| October 31, 2019 |
| Shares | Fair Value | |||||||
| COMMON STOCK - 98.1% | ||||||||
| ADVERTISING - 1.0% | ||||||||
| 9,168 | Omnicom Group, Inc. | $ | 707,678 | |||||
| AEROSPACE / DEFENSE - 2.1% | ||||||||
| 27,688 | Arconic, Inc. | 760,589 | ||||||
| 3,650 | Raytheon Co. | 774,566 | ||||||
| 1,535,155 | ||||||||
| AIRLINES - 1.9% | ||||||||
| 12,430 | Delta Air Lines, Inc. | 684,644 | ||||||
| 8,149 | United Airlines Holdings, Inc. * | 740,255 | ||||||
| 1,424,899 | ||||||||
| APPAREL - 1.1% | ||||||||
| 7,935 | Carter’s, Inc. | 795,404 | ||||||
| AUTO PARTS & EQUIPMENT - 0.9% | ||||||||
| 15,452 | Allison Transmission Holdings, Inc. | 673,862 | ||||||
| BANKS - 4.0% | ||||||||
| 24,678 | Bank of America Corp. | 771,681 | ||||||
| 8,426 | Bank of Hawaii Corp. | 735,674 | ||||||
| 6,130 | JPMorgan Chase & Co. | 765,760 | ||||||
| 13,268 | Popular, Inc. | 722,575 | ||||||
| 2,995,690 | ||||||||
| BIOTECHNOLOGY - 1.1% | ||||||||
| 3,721 | Amgen, Inc. | 793,503 | ||||||
| BUILDING MATERIALS - 3.0% | ||||||||
| 16,367 | Johnson Controls International PLC | 709,182 | ||||||
| 2,986 | Lennox International, Inc. | 738,617 | ||||||
| 17,360 | Masco Corp. | 802,900 | ||||||
| 2,250,699 | ||||||||
| CHEMICALS - 2.8% | ||||||||
| 9,401 | Ashland Global Holdings, Inc. | 727,355 | ||||||
| 5,910 | Celanese Corp. | 715,996 | ||||||
| 14,869 | CF Industries Holdings, Inc. | 674,309 | ||||||
| 2,117,660 | ||||||||
| COMMERCIAL SERVICES - 1.0% | ||||||||
| 30,679 | H&R Block, Inc. | 766,668 | ||||||
| COMPUTERS - 2.0% | ||||||||
| 10,916 | Amdocs Ltd. | 711,723 | ||||||
| 3,234 | Apple, Inc. | 804,490 | ||||||
| 1,516,213 | ||||||||
| DISTRIBUTION / WHOLESALE - 1.0% | ||||||||
| 2,439 | WW Grainger, Inc. | 753,261 | ||||||
| DIVERSIFIED FINANCIAL SERVICES - 7.9% | ||||||||
| 21,675 | Ally Financial, Inc. | 663,905 | ||||||
| 8,906 | Discover Financial Services | 714,796 | ||||||
| 8,820 | LPL Financial Holdings, Inc. | 713,009 | ||||||
| 2,660 | Mastercard, Inc. | 736,315 | ||||||
| 57,083 | Navient Corp. | 786,033 | ||||||
| 21,268 | Synchrony Financial | 752,249 | ||||||
| 4,125 | Visa, Inc. | 737,797 | ||||||
| 31,183 | Western Union Co. | 781,446 | ||||||
| 5,885,550 | ||||||||
| ELECTRIC - 2.9% | ||||||||
| 10,798 | Evergy, Inc. | 690,100 | ||||||
| 18,166 | NRG Energy, Inc. | 728,820 | ||||||
| 26,972 | Vistra Energy Corp. | 729,053 | ||||||
| 2,147,973 | ||||||||
| ELECTRONICS - 6.8% | ||||||||
| 9,394 | Agilent Technologies, Inc. | 711,596 | ||||||
| 6,900 | Allegion PLC | 800,676 | ||||||
| 16,362 | Avnet, Inc. | 647,281 | ||||||
| 26,215 | Gentex Corp. | 735,331 | ||||||
| 4,270 | Honeywell International, Inc. | 737,557 | ||||||
| 7,385 | Keysight Technologies, Inc. * | 745,220 | ||||||
| 3,200 | Waters Corp. * | 677,184 | ||||||
| 5,054,845 | ||||||||
| ENGINEERING AND CONSTRUCTION - 1.0% | ||||||||
| 7,874 | Jacobs Engineering Group, Inc. | 736,849 | ||||||
The accompanying notes are an integral part of these financial statements.
3
| LeaderSharesTMAlphaFactor® US Core Equity ETF |
| PORTFOLIO OF INVESTMENTS (Continued) |
| October 31, 2019 |
| Shares | Fair Value | |||||||
| COMMON STOCK - 98.1% (Continued) | ||||||||
| HEALTHCARE-PRODUCTS - 1.0% | ||||||||
| 11,411 | Henry Schein, Inc. * | $ | 714,157 | |||||
| HEALTHCARE-SERVICES - 0.9% | ||||||||
| 4,889 | Universal Health Services, Inc. | 672,042 | ||||||
| HOME BUILDERS - 0.9% | ||||||||
| 17,674 | Toll Brothers, Inc. | 702,895 | ||||||
| HOME FURNISHINGS - 1.0% | ||||||||
| 11,155 | Dolby Laboratories, Inc. | 717,601 | ||||||
| HOUSEHOLD PRODUCTS/WARES - 0.9% | ||||||||
| 4,739 | Clorox Co. | 699,903 | ||||||
| INSURANCE - 7.7% | ||||||||
| 13,703 | Aflac, Inc. | 728,451 | ||||||
| 3,719 | Aon PLC | 718,362 | ||||||
| 16,095 | Assured Guaranty Ltd. | 755,177 | ||||||
| 7,509 | Globe Life, Inc. | 730,851 | ||||||
| 5,326 | Hanover Insurance Group, Inc. | 701,487 | ||||||
| 13,981 | Loews Corp. | 685,069 | ||||||
| 15,328 | MetLife, Inc. | 717,197 | ||||||
| 13,233 | Voya Financial, Inc. | 714,053 | ||||||
| 5,750,647 | ||||||||
| INTERNET - 3.8% | �� | |||||||
| 365 | Booking Holdings, Inc. * | 747,801 | ||||||
| 5,915 | CDW Corp. | 756,588 | ||||||
| 18,571 | eBay, Inc. | 654,628 | ||||||
| 30,711 | Symantec Corp. | 702,668 | ||||||
| 2,861,685 | ||||||||
| LODGING - 3.0% | ||||||||
| 22,553 | Hilton Grand Vacations, Inc. * | 783,266 | ||||||
| 7,806 | Hilton Worldwide Holdings, Inc. | 756,870 | ||||||
| 15,755 | Wyndham Destinations, Inc. | 731,190 | ||||||
| 2,271,326 | ||||||||
| MACHINERY-CONSTRUCTION AND MINING - 1.1% | ||||||||
| 9,575 | Oshkosh Corp. | 817,514 | ||||||
| MEDIA - 2.0% | ||||||||
| 25,326 | Altice USA, Inc. * | 783,840 | ||||||
| 17,035 | Sinclair Broadcast Group, Inc. | 678,674 | ||||||
| 1,462,514 | ||||||||
| METAL FABRICATE / HARDWARE - 1.0% | ||||||||
| 5,219 | Valmont Industries, Inc. | 715,995 | ||||||
| MISCELLANEOUS MANUFACTURING - 2.1% | ||||||||
| 4,985 | Carlisle Cos., Inc. | 759,066 | ||||||
| 4,607 | Illinois Tool Works, Inc. | 776,648 | ||||||
| 1,535,714 | ||||||||
| OFFICE/BUSINESS EQUIPMENT - 1.1% | ||||||||
| 23,684 | Xerox Holdings Corp. | 803,598 | ||||||
| OIL & GAS - 2.1% | ||||||||
| 13,367 | HollyFrontier Corp. | 734,383 | ||||||
| 6,990 | Phillips 66 | 816,572 | ||||||
| 1,550,955 | ||||||||
The accompanying notes are an integral part of these financial statements.
4
| LeaderSharesTMAlphaFactor® US Core Equity ETF |
| PORTFOLIO OF INVESTMENTS (Continued) |
| October 31, 2019 |
| Shares | Fair Value | |||||||
| COMMON STOCK - 98.1% (Continued) | ||||||||
| PHARMACEUTICALS - 3.0% | ||||||||
| 6,418 | Eli Lilly & Co. | $ | 731,331 | |||||
| 5,275 | McKesson Corp. | 701,575 | ||||||
| 25,156 | Premier, Inc. * | 819,582 | ||||||
| 2,252,488 | ||||||||
| RETAIL - 9.8% | ||||||||
| 661 | AutoZone, Inc. * | 756,435 | ||||||
| 17,758 | Dick’s Sporting Goods, Inc. | 691,319 | ||||||
| 17,015 | Foot Locker, Inc. | 740,323 | ||||||
| 6,578 | Lowe’s Cos, Inc. | 734,171 | ||||||
| 1,810 | O’Reilly Automotive, Inc. * | 788,273 | ||||||
| 15,394 | Penske Automotive Group, Inc. | 749,996 | ||||||
| 6,581 | Ross Stores, Inc. | 721,738 | ||||||
| 8,188 | Starbucks Corp. | 692,377 | ||||||
| 7,999 | Tractor Supply Co. | 760,065 | ||||||
| 2,897 | Ulta Beauty, Inc. * | 675,436 | ||||||
| 7,310,133 | ||||||||
| SEMICONDUCTORS - 5.3% | ||||||||
| 14,423 | Applied Materials, Inc. | 782,592 | ||||||
| 14,035 | Intel Corp. | 793,399 | ||||||
| 3,108 | Lam Research Corp. | 842,392 | ||||||
| 9,748 | Qorvo, Inc. * | 788,223 | ||||||
| 12,503 | Teradyne, Inc. | 765,434 | ||||||
| 3,972,040 | ||||||||
| SOFTWARE - 4.9% | ||||||||
| 5,942 | Aspen Technology, Inc. * | 683,984 | ||||||
| 5,784 | Broadridge Financial Solutions, Inc. | 724,272 | ||||||
| 10,549 | Cerner Corp. | 708,049 | ||||||
| 7,473 | Citrix Systems, Inc. | 813,511 | ||||||
| 13,095 | Oracle Corp. | 713,547 | ||||||
| 3,643,363 | ||||||||
| TELECOMMUNICATIONS - 2.0% | ||||||||
| 14,588 | Cisco Systems, Inc. | 693,076 | ||||||
| 6,163 | Ubiquiti, Inc. | 780,174 | ||||||
| 1,473,250 | ||||||||
| TRANSPORTATION - 4.0% | ||||||||
| 10,353 | CSX Corp. | 727,505 | ||||||
| 6,397 | Landstar System, Inc. | 723,821 | ||||||
| 4,233 | Old Dominion Freight Line, Inc. | 770,745 | ||||||
| 4,403 | Union Pacific Corp. | 728,520 | ||||||
| 2,950,591 | ||||||||
| TOTAL COMMON STOCK (Cost - $70,502,238) | 73,034,320 | |||||||
| REAL ESTATE INVESTMENT TRUST (REIT) - 1.0% | ||||||||
| 3,007 | SBA Communications Corp. | |||||||
| TOTAL REAL ESTATE INVESTMENT TRUST (Cost - $690,316) | 723,635 | |||||||
| TOTAL INVESTMENTS - 99.1% (Cost - $71,192,554) | $ | 73,757,955 | ||||||
| CASH, OTHER ASSETS AND LIABILITIES - NET - 0.9% | 653,749 | |||||||
| TOTAL NET ASSETS - 100.0% | $ | 74,411,704 | ||||||
| * | Non-Income producing security. |
PLC - Public Limited Company
The accompanying notes are an integral part of these financial statements.
5
| LeaderSharesTMAlphaFactor® US Core Equity ETF |
| STATEMENT OF ASSETS AND LIABILITIES |
| October 31, 2019 |
| ASSETS | ||||
| Investment securities: | ||||
| At cost | $ | 71,192,554 | ||
| At fair value | $ | 73,757,955 | ||
| Cash | 641,296 | |||
| Dividends and interest receivable | 39,506 | |||
| Prepaid expenses | 7,805 | |||
| TOTAL ASSETS | 74,446,562 | |||
| LIABILITIES | ||||
| Investment advisory fees payable | 34,858 | |||
| TOTAL LIABILITIES | 34,858 | |||
| NET ASSETS | $ | 74,411,704 | ||
| Net Assets Consist Of: | ||||
| Paid in capital | $ | 73,967,625 | ||
| Accumulated earnings | 444,079 | |||
| NET ASSETS | $ | 74,411,704 | ||
| Net Asset Value Per Share: | ||||
| Net Assets | $ | 74,411,704 | ||
| Shares of beneficial interest outstanding ($0 par value, unlimited shares authorized) | 2,925,000 | |||
| Net asset value (Net Assets ÷ Shares Outstanding) | $ | 25.44 | ||
The accompanying notes are an integral part of these financial statements.
6
| LeaderSharesTMAlphaFactor® US Core Equity ETF |
| STATEMENT OF OPERATIONS |
| For the Year Ended October 31, 2019 |
| INVESTMENT INCOME | ||||
| Dividends (Less: Foreign Withholding Expense of $719) | $ | 935,369 | ||
| TOTAL INVESTMENT INCOME | 935,369 | |||
| EXPENSES | ||||
| Investment advisory fees | 461,448 | |||
| TOTAL EXPENSES | 461,448 | |||
| NET INVESTMENT INCOME | 473,921 | |||
| REALIZED AND UNREALIZED GAIN/(LOSS) ON INVESTMENTS | ||||
| Net realized gain/(loss) on: | ||||
| Investments | (2,161,025 | ) | ||
| In-kind redemptions | 4,300,596 | |||
| 2,139,571 | ||||
| Unrealized appreciation on: | ||||
| Investments | 5,007,886 | |||
| NET REALIZED AND UNREALIZED GAIN ON INVESTMENTS | 7,147,457 | |||
| NET INCREASE IN NET ASSETS RESULTING FROM OPERATIONS | $ | 7,621,378 | ||
The accompanying notes are an integral part of these financial statements.
7
| LeaderSharesTMAlphaFactor® US Core Equity ETF |
| STATEMENTS OF CHANGES IN NET ASSETS |
| For the Year | For the Period | |||||||
| Ended | Ended | |||||||
| October 31, 2019 | October 31, 2018 * | |||||||
| FROM OPERATIONS | ||||||||
| Net investment gain (loss) | $ | 473,921 | $ | (334 | ) | |||
| Net realized loss on investments | (2,161,025 | ) | — | |||||
| Net realized gain/(loss) on in-kind redemptions | 4,300,596 | (83,374 | ) | |||||
| Unrealized appreciation (depreciation) on investments | 5,007,886 | (2,442,485 | ) | |||||
| Net increase (decrease) in net assets resulting from operations | 7,621,378 | (2,526,193 | ) | |||||
| DISTRIBUTIONS TO SHAREHOLDERS | ||||||||
| Total distributions paid | (447,090 | ) | — | |||||
| Net decrease in net assets resulting from distributions to shareholders | (447,090 | ) | — | |||||
| FROM SHARES OF BENEFICIAL INTEREST | ||||||||
| Proceeds from shares sold | 53,641,177 | 56,194,166 | ||||||
| Cost of shares redeemed | (37,252,588 | ) | (2,819,146 | ) | ||||
| Net increase in net assets resulting from shares of beneficial interest | 16,388,589 | 53,375,020 | ||||||
| TOTAL INCREASE IN NET ASSETS | 23,562,877 | 50,848,827 | ||||||
| NET ASSETS | ||||||||
| Beginning of Period | 50,848,827 | — | ||||||
| End of Period | $ | 74,411,704 | $ | 50,848,827 | ||||
| SHARE ACTIVITY | ||||||||
| Shares sold | 2,200,000 | 2,350,000 | ||||||
| Shares redeemed | (1,500,000 | ) | (125,000 | ) | ||||
| Net increase in shares of beneficial interest outstanding | 700,000 | 2,225,000 | ||||||
| * | Fund commenced operation on October 1, 2018. |
The accompanying notes are an integral part of these financial statements.
8
| LeaderSharesTMAlphaFactor® US Core Equity ETF |
| FINANCIAL HIGHLIGHTS |
| Per Share Data and Ratios for a Share of Beneficial Interest Outstanding Throughout The Periods Presented |
| For the Year | For the Period | |||||||
| Ended | Ended | |||||||
| October 31, 2019 | October 31, 2018* | |||||||
| Net asset value, beginning of period | $ | 22.85 | $ | 25.00 | ||||
| Activity from investment operations: | ||||||||
| Net investment gain/(loss) (1) | 0.18 | (0.00 | ) ** | |||||
| Net realized and unrealized gain/(loss) on investments | 2.58 | (2.15 | ) | |||||
| Total from investment operations | 2.76 | (2.15 | ) | |||||
| Less distributions from: | ||||||||
| Net investment income | (0.17 | ) | — | |||||
| Total distributions | (0.17 | ) | — | |||||
| Net asset value, end of period | $ | 25.44 | $ | 22.85 | ||||
| Market price, end of period | $ | 25.45 | $ | 22.86 | ||||
| Total return (2) | 12.16 | % | (8.60 | )% (4) | ||||
| Net assets, at end of period (000s) | $ | 74,412 | $ | 50,849 | ||||
| Ratio of expenses to average net assets | 0.75 | % | 0.75 | % (3) | ||||
| Ratio of net investment income/(loss) to average net assets | 0.77 | % | (0.01 | )% (3) | ||||
| Portfolio Turnover Rate (5) | 193 | % | 0 | % (4) | ||||
| * | Fund commenced operation on October 1, 2018. |
| ** | Represents less than $0.01 per share. |
| (1) | Per share amounts calculated using the average shares method, which more appropriately presents the per share data for each year. |
| (2) | Total return is calculated assuming a purchase of shares at net asset value on the first day and a sale at net asset value on the last day of the period. Distributions are assumed, for the purpose of this calculation, to be reinvested at the ex-dividend date net asset value per share on their respective payment dates. |
| (3) | Annualized. |
| (4) | Not annualized. |
| (5) | Portfolio turnover rate excludes portfolio securities received or delivered as a result of processing capital share transactions in Creation Units. (Note 7) |
The accompanying notes are an integral part of these financial statements.
9
| LeaderSharesTMAlphaFactor® US Core Equity ETF |
| NOTES TO FINANCIAL STATEMENTS |
| October 31, 2019 |
| 1. | ORGANIZATION |
The LeaderSharesTM AlphaFactor® US Core Equity ETF (the “Fund”) is a series of shares of beneficial interest of the Two Roads Shared Trust (the “Trust”), a statutory trust organized under the laws of the State of Delaware on June 8, 2012, and registered under the Investment Company Act of 1940, as amended (the “1940 Act”), as a diversified, open-end management investment company. The Fund seeks to provide investment results that correspond generally, before fees and expenses, to the performance of the AlphaFactor® US Core Equity Index. The Fund commenced operations on October 1, 2018.
| 2. | SIGNIFICANT ACCOUNTING POLICIES |
The following is a summary of significant accounting policies followed by the Fund in preparation of its financial statements. These policies are in conformity with accounting principles generally accepted in the United States of America (“GAAP”). The preparation of financial statements requires management to make estimates and assumptions that affect the reported amounts of assets and liabilities and disclosure of contingent assets and liabilities at the date of the financial statements and the reported amounts of income and expenses for the period. Actual results could differ from those estimates. The Fund is an investment company and accordingly follows the investment company accounting and reporting guidance of the Financial Accounting Standards Board (“FASB”) Accounting Standards Codification Topic 946 “Financial Services – Investment Companies” including FASB Accounting Standards Update ASU 2013-08.
Securities valuation – Securities listed on an exchange are valued at the last reported sale price at the close of the regular trading session of the exchange on the business day the value is being determined, or in the case of securities listed on NASDAQ at the NASDAQ Official Closing Price. In the absence of a sale, such securities shall be valued at the mean between the current bid and ask prices on the day of valuation. Short-term debt obligations having 60 days or less remaining until maturity, at time of purchase may be valued at amortized cost (which approximates fair value). Investments in open-end investment companies are valued at net asset value.
The Fund may hold securities, such as private investments, interests in commodity pools, other non-traded securities or temporarily illiquid securities, for which market quotations are not readily available or are determined to be unreliable. These securities will be valued using the “fair value” procedures approved by the Board. The Board has delegated execution of these procedures to a fair value committee composed of one or more representatives from each of the (i) Trust, (ii) administrator, and (iii) advisor. The committee may also enlist third party consultants such as a valuation specialist at a public accounting firm, valuation consultant or financial officer of a security issuer on an as-needed basis to assist in determining a security-specific fair value. The Board has also engaged a third party valuation firm to, as needed, attend valuation meetings held by the Trust, review minutes of such meetings and report to the Board on a quarterly basis. The Board reviews and ratifies the execution of this process and the resultant fair value prices at least quarterly to assure the process produces reliable results.
Fair Valuation Process – The applicable investments are valued collectively via inputs from each group within the fair value committee. For example, fair value determinations are required for the following securities: (i) securities for which market quotations are insufficient or not readily available on a
10
| LeaderSharesTMAlphaFactor® US Core Equity ETF |
| NOTES TO FINANCIAL STATEMENTS (Continued) |
| October 31, 2019 |
particular business day (including securities for which there is a short and temporary lapse in the provision of a price by the regular pricing source); (ii) securities for which, in the judgment of the advisor, the prices or values available do not represent the fair value of the instrument; factors which may cause the advisor to make such a judgment include, but are not limited to, the following: only a bid price or an ask price is available; the spread between bid and ask prices is substantial; the frequency of sales; the thinness of the market; the size of reported trades; and actions of the securities markets, such as the suspension or limitation of trading; (iii) securities determined to be illiquid; and (iv) securities with respect to which an event that will affect the value thereof has occurred (a “significant event”) since the closing prices were established on the principal exchange on which they are traded, but prior to a Fund’s calculation of its net asset value. Specifically, interests in commodity pools or managed futures pools are valued on a daily basis by reference to the closing market prices of each futures contract or other asset held by a pool, as adjusted for pool expenses. Restricted or illiquid securities, such as private investments or non-traded securities are valued via inputs from the advisor based upon the current bid for the security from two or more independent dealers or other parties reasonably familiar with the facts and circumstances of the security (who should take into consideration all relevant factors as may be appropriate under the circumstances). If the advisor is unable to obtain a current bid from such independent dealers or other independent parties, the fair value committee shall determine the fair value of such security using the following factors: (i) the type of security; (ii) the cost at date of purchase; (iii) the size and nature of the Fund’s holdings; (iv) the discount from market value of unrestricted securities of the same class at the time of purchase and subsequent thereto; (v) information as to any transactions or offers with respect to the security; (vi) the nature and duration of restrictions on disposition of the security and the existence of any registration rights; (vii) how the yield of the security compares to similar securities of companies of similar or equal creditworthiness; (viii) the level of recent trades of similar or comparable securities; (ix) the liquidity characteristics of the security; (x) current market conditions; and (xi) the market value of any securities into which the security is convertible or exchangeable.
In unusual circumstances, securities may be valued at their fair value as determined in good faith by the Trust’s Fair Value Committee and in accordance with the Trust’s Portfolio Securities Valuation Procedures (the “Procedures”). The Board will review the fair value method in use for securities requiring a fair market value determination at least quarterly. The Procedures consider, among others, the following factors to determine a security’s fair value: the nature and pricing history (if any) of the security; whether any dealer quotations for the security are available; and possible valuation methodologies that could be used to determine the fair value of the security.
The Fund utilizes various methods to measure the fair value of all of its investments on a recurring basis. GAAP establishes a hierarchy that prioritizes inputs to valuation methods. The three levels of input are:
Level 1 – Unadjusted quoted prices in active markets for identical assets and liabilities that the Fund has the ability to access.
Level 2 – Observable inputs other than quoted prices included in Level 1 that are observable for the asset or liability, either directly or indirectly. These inputs may include quoted prices for the identical instrument on an inactive market, prices for similar instruments, interest rates, prepayment speeds, credit risk, yield curves, default rates and similar data.
11
| LeaderSharesTMAlphaFactor® US Core Equity ETF |
| NOTES TO FINANCIAL STATEMENTS (Continued) |
| October 31, 2019 |
Level 3 – Unobservable inputs for the asset or liability, to the extent relevant observable inputs are not available, representing the Fund’s own assumptions about the assumptions a market participant would use in valuing the asset or liability, and would be based on the best information available.
The availability of observable inputs can vary from security to security and is affected by a wide variety of factors, including, for example, the type of security, whether the security is new and not yet established in the marketplace, the liquidity of markets, and other characteristics particular to the security. To the extent that valuation is based on models or inputs that are less observable or unobservable in the market, the determination of fair value requires more judgment. Accordingly, the degree of judgment exercised in determining fair value is greatest for instruments categorized in Level 3.
The inputs used to measure fair value may fall into different levels of the fair value hierarchy. In such cases, for disclosure purposes, the level in the fair value hierarchy within which the fair value measurement falls in its entirety, is determined based on the lowest level input that is significant to the fair value measurement in its entirety.
The inputs or methodology used for valuing securities are not necessarily an indication of the risk associated with investing in those securities. The following tables summarize the inputs used as of October 31, 2019 for the Fund’s investments measured at fair value:
| Assets * | Level 1 | Level 2 | Level 3 | Total | ||||||||||||
| Common Stock | $ | 73,034,320 | $ | — | $ | — | $ | 73,034,320 | ||||||||
| Real Estate Investment Trust | 723,635 | — | — | 723,635 | ||||||||||||
| Total | $ | 73,757,955 | $ | — | $ | — | $ | 73,757,955 | ||||||||
The Fund did not hold any Level 3 securities during the year.
| * | See Portfolio of Investments for industry classification. |
Security Transactions and Related Income – Security transactions are accounted for on the trade date. Interest income is recognized on an accrual basis. Discounts are accreted and premiums are amortized on securities purchased over the lives of the respective securities. Dividend income is recorded on the ex-dividend date. Realized gains or losses from sales of securities are determined by comparing the identified cost of the security lot sold with the net sales proceeds. Withholding taxes on foreign dividends have been provided for in accordance with the Fund’s understanding of the applicable country’s tax rules and rates.
Dividends and Distributions to Shareholders – Dividends from net investment income, if any, are declared and paid quarterly. Distributable net realized capital gains, if any, are declared and distributed annually. Dividends from net investment income and distributions from net realized gains are determined in accordance with federal income tax regulations, which may differ from GAAP. These “book/tax” differences are considered either temporary (e.g., deferred losses) or permanent in nature. To the extent these differences are permanent in nature, such amounts are reclassified within the composition of net assets based on their federal tax-basis treatment; temporary differences do not require reclassification. Quarterly distributions in excess of ordinary taxable income are treated as returns of capital. Dividends and distributions to shareholders are recorded on the ex-dividend date.
12
| LeaderSharesTMAlphaFactor® US Core Equity ETF |
| NOTES TO FINANCIAL STATEMENTS (Continued) |
| October 31, 2019 |
Federal Income Taxes – It is the Fund’s policy to qualify as a regulated investment company by complying with the provisions of the Internal Revenue Code that are applicable to regulated investment companies and to distribute substantially all of its taxable income and net realized gains to shareholders. Therefore, no federal income tax provision has been recorded.
The Fund recognizes the tax benefits of uncertain tax positions only where the position is “more likely than not” to be sustained assuming examination by tax authorities. Management has analyzed the Fund’s tax positions, and has concluded that no liability for unrecognized tax benefits should be recorded related to uncertain tax positions taken on returns filed for the open tax year ended October 31, 2018 or positions expected to be taken in the Fund’s October 31, 2019 year-end tax returns. The Fund identifies its major tax jurisdictions as U.S. Federal, Ohio and foreign jurisdictions where the Fund makes significant investments; however the Fund is not aware of any tax positions for which it is reasonably expected that the total amounts of unrecognized tax benefits will change materially in the next twelve months.
The Fund recognizes interest and penalties, if any, related to unrecognized tax benefits as income tax expense in the Statement of Operations. During the period, the Fund did not incur any interest or penalties.
Indemnification – The Trust indemnifies its officers and Trustees for certain liabilities that may arise from the performance of their duties to the Trust. Additionally, in the normal course of business, the Fund enters into contracts that contain a variety of representations and warranties and which provide general indemnities. The Fund’s maximum exposure under these arrangements is unknown, as this would involve future claims that may be made against the Fund that have not yet occurred. However, the risk of loss due to these warranties and indemnities appears to be remote.
| 3. | INVESTMENT TRANSACTIONS |
For the year ended October 31, 2019, cost of purchases and proceeds from sales of portfolio securities (excluding in-kind transactions and short-term investments), amounted to $123,090,439 and $123,214,736, respectively.
For the year ended October 31, 2019, cost of purchases and proceeds from sales of portfolio securities for in-kind transactions amounted to $53,604,600 and $37,560,626, respectively.
| 4. | INVESTMENT ADVISORY AGREEMENT AND TRANSACTIONS WITH RELATED PARTIES |
Redwood Investment Management, LLC serves as the Fund’s Investment Advisor (the “Advisor”). Pursuant to investment advisory agreements with the Fund, the Advisor, under the oversight of the Board, directs the daily operations of the Fund and supervises the performance of administrative and professional services provided by others. As compensation for its services and the related expenses borne by the Advisor, the Fund pays the Advisor a unitary management fee, computed and accrued daily and paid monthly, at an annual rate of 0.75% of the Fund’s average daily net assets. For the year ended October 31, 2019, the Fund incurred advisory fees in the amount of $461,448.
13
| LeaderSharesTMAlphaFactor® US Core Equity ETF |
| NOTES TO FINANCIAL STATEMENTS (Continued) |
| October 31, 2019 |
The Advisor’s unitary management fee is designed to pay the Fund’s expenses and to compensate the Advisor for providing services for the Fund. Out of the unitary management fee, the Advisor pays substantially all expenses of the Fund, including the costs of transfer agency, custody, fund administration, legal, audit and other services and Independent Trustees’ fees, but not payments under the Fund’s 12b-1 plan, brokerage expenses, taxes, interest (including borrowing costs and dividend expenses on securities sold short), litigation expense and other extraordinary expenses (including litigation to which the Trust or the Fund may be a party and indemnification of the Trustees and officers with respect thereto). The Advisor, and not the Fund’s shareholders, would benefit from any reduction in fees paid for third-party services, including reductions based on increases in net assets.
The Fund has adopted a distribution and service plan (“Plan”) pursuant to Rule 12b-1 under the 1940 Act. Under the Plan, the Fund is authorized to pay distribution fees to the distributor and other firms that provide distribution and shareholder services (“Service Providers”). If a Service Provider provides these services, the Fund may pay fees at an annual rate not to exceed 0.25% of average daily net assets, pursuant to Rule 12b-1 under the 1940 Act. No distribution or service fees are currently paid by the Fund, and there are no current plans to impose these fees. In the event Rule 12b-1 fees were charged, over time they would increase the cost of an investment in the Fund. Northern Lights Distributors, LLC, the Fund’s distributor, its affiliates, and the Fund’s Advisor or its affiliates may, at their own expense and out of their own legitimate profits, provide additional cash payments to financial intermediaries who sell shares of the Fund, including affiliates of the Advisor.
Gemini Fund Services, LLC (“GFS”) –GFS, an affiliate of the Distributor, provides administration and fund accounting services to the Fund. Pursuant to a separate servicing agreement with GFS, the advisor on behalf of the Fund pays GFS customary fees for providing administration and fund accounting services to the Fund. Certain officers of the Trust are also officers of GFS, and are not paid any fees directly by the Fund for serving in such capacities. For the year ended October 31, 2019 the advisor paid GFS $40,612.
Northern Lights Compliance Services, LLC (“NLCS”) – NLCS, an affiliate of GFS and the Distributor, provides a Chief Compliance Officer to the Trust, as well as related compliance services, pursuant to a consulting agreement between NLCS and the Fund. Under the terms of such agreement, NLCS receives customary fees from the Trust. The Chief Compliance Officer of the Trust is also an officer of NLCS, and is not paid any fees directly by the Fund for serving in such capacity. For the year ended October 31, 2019 the advisor paid NLCS $7,189.
Blu Giant, LLC (“Blu Giant”) – Blu Giant, an affiliate of GFS and the Distributor, provides EDGAR conversion and filing services as well as print management services for the Fund on an ad-hoc basis. For the provision of these services, Blu Giant receives customary fees from the advisor on behalf of the Fund. For the year ended October 31, 2019 the advisor paid Blu Giant $19,599.
On February 1, 2019, NorthStar Financial Services Group, LLC, the parent company of GFS and its affiliated companies including NLD, NLCS and Blu Giant (collectively, the “Gemini Companies”), sold its interest in the Gemini Companies to a third party private equity firm that contemporaneously acquired Ultimus Fund Solutions, LLC (an independent mutual fund administration firm) and its affiliates (collectively, the “Ultimus Companies”). As a result of these separate transactions, the Gemini Companies and the Ultimus Companies are now indirectly owned through a common parent entity, The Ultimus Group, LLC.
14
| LeaderSharesTMAlphaFactor® US Core Equity ETF |
| NOTES TO FINANCIAL STATEMENTS (Continued) |
| October 31, 2019 |
| 5. | AGGREGATE UNREALIZED APPRECIATION AND DEPRECIATION – TAX BASIS |
The identified cost of investments in securities owned by the Fund for federal income tax purposes and its respective gross unrealized appreciation and depreciation at October 31, 2019, was as follows:
| Net Unrealized | ||||||||||||||
| Gross Unrealized | Gross Unrealized | Appreciation/ | ||||||||||||
| Tax Cost | Appreciation | Depreciation | (Depreciation) | |||||||||||
| $ | 71,216,687 | $ | 3,551,962 | $ | (1,010,694 | ) | $ | 2,541,268 | ||||||
| 6. | DISTRIBUTIONS TO SHAREHOLDERS AND TAX COMPONENTS OF CAPITAL |
The tax character of fund distributions paid for the year ended October 31, 2019 was as follows:
| Fiscal Year Ended | ||||
| October 31, 2019 | ||||
| Ordinary Income | $ | 447,090 | ||
| Long-Term Capital Gain | — | |||
| Return of Capital | — | |||
| $ | 447,090 | |||
There were no distributions for the fiscal year ended October 31, 2018.
As of October 31, 2019, the components of accumulated earnings/ (deficit) on a tax basis were as follows:
| Undistributed | Undistributed | Post October Loss | Capital Loss | Other | Unrealized | Total | ||||||||||||||||||||
| Ordinary | Long-Term | and | Carry | Book/Tax | Appreciation/ | Accumulated | ||||||||||||||||||||
| Income | Gains | Late Year Loss | Forwards | Differences | (Depreciation) | Earnings/(Deficits) | ||||||||||||||||||||
| $ | 15,642 | $ | — | $ | — | $ | (2,112,831 | ) | $ | — | $ | 2,541,268 | $ | 444,079 | ||||||||||||
The difference between book basis and tax basis undistributed net investment income/(loss), accumulated net realized gain/(loss), and unrealized appreciation/(depreciation) from investments is primarily attributable to the tax deferral of losses on wash sales and C-Corporation return of capital distributions.
At October 31, 2019, the Funds had capital loss carry forwards for federal income tax purposes available to offset future capital gains, as follows:
| Non-Expiring | Non-Expiring | |||||||||
| Short-Term | Long-Term | Total | ||||||||
| $ | 2,112,831 | $ | — | $ | 2,112,831 | |||||
15
| LeaderSharesTMAlphaFactor® US Core Equity ETF |
| NOTES TO FINANCIAL STATEMENTS (Continued) |
| October 31, 2019 |
Permanent book and tax differences, primarily attributable to the book/tax basis treatment of realized gain (loss) on in-kind redemptions resulted in reclassifications for the Fund for the year ended October 31, 2019 as follows:
| Paid | ||||||
| In | Accumulated | |||||
| Capital | Earnings (Losses) | |||||
| $ | 4,287,390 | $ | (4,287,390 | ) | ||
| 7. | CAPITAL SHARE TRANSACTIONS |
Shares are not individually redeemable and may be redeemed by the Fund at NAV only in large blocks known as “Creation Units.” Shares are created and redeemed by the Fund only in Creation Unit size aggregations of 25,000 shares. Only Authorized Participants are permitted to purchase or redeem Creation Units from the Fund. An Authorized Participant is either (i) a broker-dealer or other participant in the clearing process through the Continuous Net Settlement System of the National Securities Clearing Corporation or (ii) a Depository Trust Company participant and, in each case, must have executed a Participant Agreement with the distributor. Such transactions are generally permitted on an in-kind basis, with a balancing cash component to equate the transaction to the NAV per share of the Fund on the transaction date. Cash may be substituted equivalent to the value of certain securities generally when they are not available in sufficient quantity for delivery, not eligible for trading by the Authorized Participant or as a result of other market circumstances. In addition, the Fund may impose transaction fees on purchases and redemptions of Fund shares to cover the custodial and other costs incurred by the Fund in effecting trades. A fixed fee payable to the custodian may be imposed on each creation and redemption transaction regardless of the number of Creation Units involved in the transaction (“Fixed Fee”). Purchases and redemptions of Creation Units for cash or involving cash-in-lieu are required to pay an additional variable charge to compensate the Fund and its ongoing shareholders for brokerage and market impact expenses relating to Creation Unit transactions (“Variable Charge,” and together with the Fixed Fee, the “Transaction Fees”). Transactions in capital shares for the Fund are disclosed in the Statements of Changes in Net Assets.
Investors who use the services of a broker, or other such intermediary may be charged a fee for such services. The Transaction Fees for the Fund are listed in the table below:
| Fee for In-Kind and | Minimum Additional Variable | Maximum Additional Variable | ||||||
| Cash Purchases | Charge for Cash Purchases* | Charge for Cash Purchases* | ||||||
| $600 | 0.20% | 2.00% |
| * | As a percentage of the amount invested. |
| 8. | PRINCIPAL INVESTMENT RISKS |
The Fund’s investments in securities, financial instruments and derivatives expose it to various risks, certain of which are discussed below. Please refer to the Fund’s prospectus and statement of additional
16
| LeaderSharesTMAlphaFactor® US Core Equity ETF |
| NOTES TO FINANCIAL STATEMENTS (Continued) |
| October 31, 2019 |
information for a full listing of risks associated with the Fund’s investments, which include, but are not limited to authorized participant concentration risk, calculation methodology risk, consumer discretionary sector risk, derivatives risk, equity risk, ETF structure risks, financials sector risk, fluctuation of net asset value risk, gap risk, index tracking error risk, industrials sector risk, industry concentration risk, information technology sector risk, management risk, market capitalization risk, market risk, market events risk, passive investment risk and rules-based strategy risk.
ETF Structure Risks. The Fund is structured as an ETF and as a result is subject to the special risks, including:
| ● | Not Individually Redeemable. Shares are not individually redeemable and may be redeemed by the Fund at NAV only in large blocks known as “Creation Units.” You may incur brokerage costs purchasing enough shares to constitute a Creation Unit. |
| ● | Trading Issues. Trading in shares on the Exchange may be halted due to market conditions or for reasons that, in the view of the Exchange, make trading in shares inadvisable, such as extraordinary market volatility. There can be no assurance that shares will continue to meet the listing requirements of the Exchange. An active trading market for the Fund’s shares may not be developed or maintained. If the Fund’s shares are traded outside a collateralized settlement system, the number of financial institutions that can act as authorized participants that can post collateral on an agency basis is limited, which may limit the market for the Fund’s shares. |
| ● | Market Price Variance Risk. The market prices of shares will fluctuate in response to changes in NAV and supply and demand for shares and will include a “bid-ask spread” charged by the exchange specialists, market makers or other participants that trade the particular security. There may be times when the market price and the NAV vary significantly. This means that shares may trade at a discount to NAV. If a shareholder purchases shares at a time when the market price is at a premium to the NAV or sells shares at a time when the market price is at a discount to NAV, the shareholder may sustain losses. In times of market stress, market makers may step away from their role market making in shares of ETFs and in executing trades, which can lead to differences between the market value of Fund shares and the Fund’s net asset value. The market price for the Fund’s shares may deviate from the Fund’s net asset value, particularly during times of market stress, with the result that investors may pay significantly more or significantly less for Fund shares than the Fund’s net asset value, which is reflected in the bid and ask price for Fund shares or in the closing price. When all or a portion of an ETF’s underlying securities trade in a market that is closed when the market for the Fund’s shares is open, there may be changes from the last quote of the closed market and the quote from the Fund’s domestic trading day, which could lead to differences between the market value of the Fund’s shares and the Fund’s net asset value. In stressed market conditions, the market for the Fund’s shares may become less liquid in response to the deteriorating liquidity of the Fund’s portfolio. This adverse effect on the liquidity of the Fund’s shares may, in turn, lead |
17
| LeaderSharesTMAlphaFactor® US Core Equity ETF |
| NOTES TO FINANCIAL STATEMENTS (Continued) |
| October 31, 2019 |
to differences between the market value of the Fund’s shares and the Fund’s net asset value.
Equity Risk. Equity securities are susceptible to general market fluctuations and volatile increases and decreases in value as market confidence in and perceptions of their issuers change. Factors that may influence the price of equity securities include developments affecting a specific company or industry, or the changing economic, political or market conditions.
Fluctuation of Net Asset Value Risk. The NAV of the Fund’s shares will generally fluctuate with changes in the market value of the Fund’s holdings. The market prices of the shares will generally fluctuate in accordance with changes in NAV as well as the relative supply of and demand for the shares on the Exchange. The Advisor cannot predict whether the shares will trade below, at or above their NAV. Price differences may be due, in large part, to the fact that supply and demand forces at work in the secondary trading market for the shares will be closely related to, but not identical to, the same forces influencing the prices of the Fund’s holdings trading individually or in the aggregate at any point in time.
Index Tracking Error Risk. As with all index funds, the performance of the Fund and the Index may differ from each other for a variety of reasons. For example, the Fund incurs operating expenses and portfolio transaction costs not incurred by the Index. In addition, the Fund may not be fully invested in the securities of the Index at all times or may hold securities not included in the Index.
| 9. | RECENT ACCOUNTING PRONOUNCEMENTS |
In August 2018, FASB issued ASU No. 2018-13, which changed certain fair value measurement disclosure requirements. The ASU, in addition to other modifications and additions, removed the requirement to disclose the amount and reasons for transfers between Level 1 and Level 2 of the fair value hierarchy, and the policy for the timing of transfers between levels. For investment companies, the amendments are effective for financial statements issued for fiscal years beginning after December 15, 2019, and interim periods within those fiscal years. Early adoption is permitted and the Fund has adopted these amendments with these financial statements.
| 10. | SUBSEQUENT EVENTS |
Subsequent events after the date of the Statements of Assets and Liabilities have been evaluated through the date the financial statements were issued. Management has determined that no events or transactions occurred requiring adjustment or disclosure in the financial statements.
18

| GRANT THORNTON LLP | REPORT OF INDEPENDENT REGISTERED PUBLIC ACCOUNTING FIRM | |
| Two Commerce Square | ||
| 2001 Market Street, Suite 700 | ||
| Philadelphia, PA 19103 | ||
| D+1 215 561 4200 | ||
| F+1 215 561 1066 | ||
Board of Trustees of the Two Roads Shared Trust
Opinion on the financial statements
We have audited the accompanying statement of assets and liabilities, including the portfolio of investments, of LeaderShares™ AlphaFactor® US Core Equity ETF (a fund in the Two Roads Shared Trust) (the “Fund”) as of October 31, 2019, the related statement of operations for the year then ended, and the statements of changes in net assets and the financial highlights for the year ended October 31, 2019 and for the period October 1, 2018 (commencement of operations) through October 31, 2018, and the related notes (collectively referred to as the “financial statements”). In our opinion, the financial statements present fairly, in all material respects, the financial position of the Fund as of October 31, 2019, and the results of its operations for the year then ended, the changes in its net assets and its financial highlights for the year ended October 31, 2019 and for the period October 1, 2018 (commencement of operations) through October 31, 2018 in conformity with accounting principles generally accepted in the United States of America.
Basis for opinion
These financial statements are the responsibility of the Fund’s management. Our responsibility is to express an opinion on the Fund’s financial statements based on our audits. We are a public accounting firm registered with the Public Company Accounting Oversight Board (United States) (“PCAOB”) and are required to be independent with respect to the Fund in accordance with the U.S. federal securities laws and the applicable rules and regulations of the Securities and Exchange Commission and the PCAOB.
We conducted our audits in accordance with the standards of the PCAOB. Those standards require that we plan and perform the audit to obtain reasonable assurance about whether the financial statements are free of material misstatement, whether due to error or fraud. The Fund is not required to have, nor were we engaged to perform, an audit of its internal control over financial reporting. As part of our audits we are required to obtain an understanding of internal control over financial reporting but not for the purpose of expressing an opinion on the effectiveness of the Fund’s internal control over financial reporting. Accordingly, we express no such opinion. | ||
| GT.COM | Grant Thornton LLP is the U.S. member firm of Grant Thornton International Ltd (GTIL). GTIL and each of its member firms are separate legal entities and are not a worldwide partnership. |
19
Our audits included performing procedures to assess the risks of material misstatement of the financial statements, whether due to error or fraud, and performing procedures that respond to those risks. Such procedures included examining, on a test basis, evidence supporting the amounts and disclosures in the financial statements. Our audits also included evaluating the accounting principles used and significant estimates made by management, as well as evaluating the overall presentation of the financial statements. Our procedures included confirmation of securities owned as of October 31, 2019, by correspondence with the custodian. We believe that our audits provide a reasonable basis for our opinion.
We have served as the Fund’s auditor since 2016.
Philadelphia, Pennsylvania December 30, 2019 |
20
| LeaderShares™ AlphaFactor® US Core Equity ETF |
| EXPENSE EXAMPLES (Unaudited) |
| October 31, 2019 |
As a shareholder of the Fund, you incur two types of costs: (1) transaction costs, including brokerage commissions on purchases and sales of Fund shares; (2) ongoing costs, including a unitary management fee and other Fund expenses. This example is intended to help you understand your ongoing costs (in dollars) of investing in the Fund and to compare these costs with the ongoing costs of investing in other mutual funds.
The example is based on an investment of $1,000 invested at the beginning of the period and held for the entire period from May 1, 2019 through October 31, 2019.
Actual Expenses
The “Actual” expenses line in the table below provides information about actual account values and actual expenses. You may use the information below, together with the amount you invested, to estimate the expenses that you paid over the period. Simply divide your account value by $1,000 (for example, an $8,600 account value divided by $1,000 = 8.6), then multiply the result by the number in the table under the heading entitled “Expenses Paid During Period” to estimate the expenses you paid on your account during this period.
Hypothetical Example for Comparison Purposes
The “Hypothetical” line in the table below provides information about hypothetical account values and hypothetical expenses based on the Fund’s actual expense ratio and an assumed rate of return of 5% per year before expenses, which is not the Fund’s actual return. The hypothetical account values and expenses may not be used to estimate the actual ending account balances or expenses you paid for the period. You may use this information to compare this 5% hypothetical example with the 5% hypothetical examples that appear in the shareholder reports of other funds.
Please note that the expenses shown in the table are meant to highlight your ongoing costs only and do not reflect any transactional costs, such as brokerage commissions paid on purchases and sales of Fund shares. Therefore, the table is useful in comparing ongoing costs only, and will not help you determine the relative total costs of owning different funds. In addition, if these transactional costs were included, your costs would have been higher.
| Beginning | Ending | Expenses Paid | Expenses Ratio | |||||||||||||
| Account Value | Account Value | During Period* | During Period** | |||||||||||||
| 5/1/19 | 10/31/19 | 5/1/19 - 10/31/19 | 5/1/19 - 10/31/19 | |||||||||||||
| Actual | $ | 1,000.00 | $ | 1,025.60 | $ | 3.83 | 0.75 | % | ||||||||
| Hypothetical | $ | 1,000.00 | $ | 1,021.42 | $ | 3.82 | 0.75 | % | ||||||||
| (5% return before expenses) | ||||||||||||||||
| * | Expenses are equal to the average account value over the period, multiplied by the Fund’s annualized expense ratio, multiplied by the number of days in the period (184) divided by the number of days in the fiscal year (365). |
| ** | Annualized. |
21
| LeaderSharesTMAlphaFactor® US Core Equity ETF |
| SUPPLEMENTAL INFORMATION (Unaudited)(Continued) |
| October 31, 2019 |
Trustees and Officers.The Trustees and officers of the Trust, together with information as to their principal business occupations during the past five years and other information, are shown below. Unless otherwise noted, the address of each Trustee and Officer is 225 Pictoria Drive, Suite 450, Cincinnati, OH 45246.
Independent Trustees *
| Name, Address, Year of Birth | Position(s) Held with Registrant | Term and Length Served | Principal Occupation(s) During Past 5 Years | Number of Portfolios Overseen In The Fund Complex** | Other Directorships Held During Past 5 Years |
| Mark Garbin Year of Birth: 1951 | Trustee | Indefinite, Since 2012 | Managing Principal, Coherent Capital Management LLC (since 2008) | [8] | Northern Lights Fund Trust (since 2013); Northern Lights Variable Trust (since 2013); Forethought Variable Insurance Trust (since 2013); OHA Mortgage Strategies Fund (offshore), Ltd. (2014-2017); Altegris KKR Commitments Master Fund (since 2014); and OFI Carlyle Tactical Private Credit Fund (since March 2018) |
| Mark D. Gersten Year of Birth: 1950 | Chairman, Trustee | Indefinite, Since 2012 | Independent Consultant (since 2012); Senior Vice President – Global Fund Administration Mutual Funds & Alternative Funds, AllianceBernstein LP (1985 – 2011) | [8] | Northern Lights Fund Trust (since 2013); Northern Lights Variable Trust (since 2013); Altegris KKR Commitments Master Fund (since 2014); previously, Ramius Archview Credit and Distressed Fund (2015-2017); and Schroder Global Series Trust (2012 to 2017) |
| Neil M. Kaufman Year of Birth: 1960 | Trustee, Audit Committee Chairman | Indefinite, Since 2012 | Managing Member, Kaufman & Associates, LLC (legal services)(Since 2016); Partner, Abrams Fensterman, Fensterman, Eisman, Formato, Ferrara & Wolf, LLP (legal services)(2010-2016) | [8] | Altegris KKR Commitments Master Fund (since 2014) |
| Anita K. Krug Year of Birth: 1969 | Trustee | Indefinite, Since 2012 | Dean (since 2019) Chicago Kent Law School; Interim Vice Chancellor for Academic Affairs (2018-2019) University of Washington Bothell; Interim Dean (2017-2018), Professor (since 2016), Associate Professor (2014-2016); and Assistant Professor (2010-2014), University of Washington School of Law | [8] | Altegris KKR Commitments Master Fund (since 2014); Centerstone Investors Trust (since 2016) |
| * | Information is as of October 31, 2019. |
| ** | As of October 31, 2019, the Trust was comprised of 20 active portfolios managed by seven unaffiliated investment advisers and two affiliated investment advisers. The term “Fund Complex” applies only to those funds that are (i) advised by a common investment adviser or by an investment adviser that is an affiliated person of the investment adviser of any of the other funds of the Trust or (ii) hold themselves out to investors as related companies for purposes of investment and investor services. The Fund does not hold itself out as related to any other series of the Trust for investment purposes. The Fund’s investment adviser also serves as investment adviser to the following fund of the Trust: Redwood Managed Volatility Fund, Redwood Managed Municipal Income Fund, Redwood AlphaFactor® Tactical Core Fund, Redwood AlphaFactor® Tactical International Fund, Redwood Systematic Macro Trend Fund, Redwood Activist Leaders Fund and Redwood Managed Volatility Portfolio, each another series of the Trust. |
10/31/19 – Two Roadsv2
22
| LeaderSharesTMAlphaFactor® US Core Equity ETF |
| SUPPLEMENTAL INFORMATION (Unaudited)(Continued) |
| October 31, 2019 |
Officers of the Trust*
| Name, Address, Year of Birth | Position(s) Held with Registrant | Principal Occupation(s) During Past 5 Years | Number of Portfolios Overseen In The Fund Complex** | Other Directorships Held During Past 5 Years |
| James Colantino 80 Arkay Drive Hauppauge, NY 11788 Year of Birth: 1969 | President Since Feb. 2017 Treasurer (2012 to 2017) | Senior Vice President (2012-present); Vice President (2004 to 2012); Gemini Fund Services, LLC | N/A | N/A |
| Laura Szalyga 80 Arkay Drive Hauppauge, NY 11788 Year of Birth: 1978 | Treasurer Since Feb. 2017 | Vice President, Gemini Fund Services, LLC (since 2015); Assistant Vice President, Gemini Fund Services, LLC (2011-2014) | N/A | N/A |
| Richard A. Malinowski 80 Arkay Drive Hauppauge, NY 11788 Year of Birth: 1983 | Vice President Since Sep. 2018 Secretary Since 2013 | Senior Vice President (since 2017); Vice President and Counsel (2016-2017) and Assistant Vice President (2012 – 2016), Gemini Fund Services, LLC | N/A | N/A |
| William B. Kimme Year of Birth: 1962 | Chief Compliance Officer Since Inception | Senior Compliance Officer, Northern Lights Compliance Services, LLC (September 2011 -present) | N/A | N/A |
| * | Information is as of October 31, 2019. |
| ** | As of October 31, 2019, the Trust was comprised of 20 active portfolios managed by seven unaffiliated investment advisers and two affiliated investment advisers. The term “Fund Complex” applies only to those funds that are (i) advised by a common investment adviser or by an investment adviser that is an affiliated person of the investment adviser of any of the other funds of the Trust or (ii) hold themselves out to investors as related companies for purposes of investment and investor services. The Fund does not hold itself out as related to any other series of the Trust for investment purposes. The Funds’ investment adviser also serves as investment adviser to the following funds of the Trust: Redwood Managed Volatility Fund, Redwood Managed Municipal Income Fund, Redwood AlphaFactor® Tactical Core Fund, Redwood AlphaFactor® Tactical International Fund, Redwood Systematic Macro Trend Fund, Redwood Activist Leaders Fund and Redwood Managed Volatility Portfolio each another series of the Trust. |
The Fund’s Statement of Additional Information (“SAI”) includes additional information about the Trustees and is available free of charge, upon request, by calling toll-free at 1-855-733-3863.
10/31/19 – Two Roadsv2
23
PRIVACY NOTICE
| FACTS | WHAT DOES TWO ROADS SHARED TRUST DO WITH YOUR PERSONAL INFORMATION |
| Why? | Financial companies choose how they share your personal information. |
| Federal law gives consumers the right to limit some but not all sharing. | |
Federal law also requires us to tell you how we collect, share, and protect your personal information. Please read this notice carefully to understand what we do. | |
| What? | THE TYPES OF PERSONAL INFORMATION WE COLLECT AND SHARE DEPENDS ON THE PRODUCT OR SERVICE THAT YOU HAVE WITH US. THIS INFORMATION CAN INCLUDE: |
| ● Social Security number and income | |
| ● Account transactions and transaction history | |
| ● Investment experience and purchase history | |
| When you areno longer our customer, we continue to share your information as described in this notice. | |
| How? | All financial companies need to share customers’ personal information to run their everyday business. In the section below, we list the reasons financial companies can share their customers’ personal information; the reason Two Roads Shared Trust chooses to share and whether you can limit this sharing. |
| Reasons we can share your personal information | Does Two Roads Shared Trust share? | Can you limit this sharing? |
| For our everyday business purposes – | YES | NO |
| such as to process your transactions, maintain your account(s), respond to court orders and legal investigations, or report to credit bureaus | ||
| For our marketing purposes – | NO | We do not share |
| to offer our products and services to you | ||
| For joint marketing with other financial companies | NO | We do not share |
| For our affiliates’ everyday business purposes – | NO | We do not share |
| information about your transactions and experiences | ||
| For our affiliates’ everyday business purposes – | NO | We do not share |
| information about your creditworthiness | ||
| For our affiliates to market to you | NO | We do not share |
| For nonaffiliates to market to you | NO | We do not share |
| Questions? | Call 1-402-895-1600 |
24
What we do
| How does Two Roads Shared Trust protect my personal information? | To protect your personal information from unauthorized access and use, we use security measures that comply with federal law.
These measures include computer safeguards and secured files and buildings. |
| Our service providers are held accountable for adhering to strict policies and procedures to prevent any misuse of your nonpublic personal information. | |
| How does Two Roads Shared Trust | We collect your personal information, for example, when you |
| collect my personal information? | |
| ● open an account or give us contact information | |
| ● provide account information or give us your income information | |
| ● make deposits or withdrawals from your account | |
| We also collect your personal information from other companies. | |
| Why can’t I limit all sharing? | Federal law gives you the right to limit only |
| ● sharing for affiliates’ everyday business purposes – information about your creditworthiness | |
| ● affiliates from using your information to market to you | |
| ● sharing for nonaffiliates to market to you | |
| State laws and individual companies may give you additional rights to limit sharing | |
| Definitions | |
| Affiliates | Companies related by common ownership or control. They can be financial and nonfinancial companies. |
| ● Two Roads Shared Trust has no affiliates. | |
| Nonaffiliates | Companies not related by common ownership or control. They can be financial and nonfinancial companies. |
| ● Two Roads Shared Trust does not share with nonaffiliates so they can market to you. | |
| Joint marketing | A formal agreement between nonaffiliates financial companies that together market financial products or services to you. |
| ● Two Roads Shared Trust does not jointly market. |
25
Proxy Voting Policy
Information regarding how the Funds vote proxies relating to portfolio securities for the 12 month period ended June 30th as well as a description of the policies and procedures that the Funds used to determine how to vote proxies is available without charge, upon request, by calling 1-480-757-4277 or by referring to the Securities and Exchange Commission’s (“SEC”) website at http://www.sec.gov.
Portfolio Holdings
Each Fund files its complete schedule of portfolio holdings with the SEC for the first and third quarters of each fiscal year on Form N-Q (or as an exhibit to its reports on Form N-Q’s successor form, Form N-PORT). Forms N-Q and Forms N-PORT are available on the SEC’s website athttp://www.sec.gov. The information on Forms N-Q and Forms N-PORT is available without charge, upon request, by calling 1-480-757-4277.
| Investment Advisor |
| Redwood Investment Management, LLC |
| 4110 N Scottsdale Rd, Suite 125 |
| Scottsdale, AZ 85251 |
| Administrator |
| Gemini Fund Services, LLC |
| 80 Arkay Drive, Suite 110 |
| Hauppauge, NY 11788 |
ITEM 2. CODE OF ETHICS.
| (a) | The registrant has, as of the end of the period covered by this report, adopted a code of ethics that applies to the registrant's principal executive officer, principal financial officer, and principal accounting officer or controller, or persons performing similar functions, regardless of whether these individuals are employed by the registrant or a third party. |
| (b) | During the period covered by this report, there were no amendments to any provision of the code of ethics. |
| (c) | During the period covered by this report, there were no waivers or implicit waivers of a provision of the code of ethics. |
ITEM 3. AUDIT COMMITTEE FINANCIAL EXPERT.
| The registrant’s Board of Trustees has determined that Mark Gersten is an audit committee financial expert, as defined in Item 3 of Form N-CSR. Mr. Gersten is independent for purposes of this Item 3. |
ITEM 4. PRINCIPAL ACCOUNTANT FEES AND SERVICES.
| (a) | Audit Fees. The aggregate fees billed for each of the last two fiscal years for professional services rendered by the registrant's principal accountant for the audit of the registrant's annual financial statements or services that are normally provided by the accountant in connection with statutory and regulatory filings or engagements for those fiscal years are as follows:
|
| Trust Series | 2019 | 2018 | |
| LeaderShares AlphaFactor US Core Equity ETF | $15,500 | $15,000 |
| (b) | Audit-Related Fees. There were no fees billed in each of the last two fiscal years for assurances and related services by the principal accountant that are reasonably related to the performance of the audit of the registrant’s financial statements and are not reported under paragraph (a) of this item. |
| (c) | Tax Fees. The aggregate fees billed in each of the last two fiscal years for professional services rendered by the principal accountant for tax compliance are as follows: |
| Trust Series | 2019 | 2018 | ||
| LeaderShares AlphaFactor US Core Equity ETF | $2,900 | $2,800 |
| (d) | All Other Fees. The aggregate fees billed in each of the last two fiscal years for products and services provided by the registrant’s principal accountant, other than the services reported in paragraphs (a) through (c) of this item were $0 for the fiscal year ended October 31, 2019. |
| (e)(1) | The audit committee does not have pre-approval policies and procedures. Instead, the audit committee or audit committee chairman approves on a case-by-case basis each audit or non-audit service before the principal accountant is engaged by the registrant. |
| (e)(2) | There were no services described in each of paragraphs (b) through (d) of this Item that were approved by the audit committee pursuant to paragraph (c)(7)(i)(C) of Rule 2-01 of Regulation S-X. |
| f) | Not applicable. The percentage of hours expended on the principal accountant's engagement to audit the registrant's financial statements for the most recent fiscal year that were attributed to work performed by persons other than the principal accountant's full-time, permanent employees was zero percent (0%). |
| (g) | All non-audit fees billed by the registrant's principal accountant for services rendered to the registrant for the fiscal year ended October 31, 2018 are disclosed in (b)-(d) above. There were no audit or non-audit services performed by the registrant's principal accountant for the registrant's adviser. |
ITEM 5. AUDIT COMMITTEE OF LISTED REGISTRANTS.
Not applicable
ITEM 6. SCHEDULE OF INVESTMENT
Included in annual report to shareholders filed under item 1 of this form.
ITEM 7. DISCLOSURE OF PROXY VOTING POLICIES AND PROCEDURES FOR CLOSED-END MANAGEMENT INVESTMENT COMPANIES.
Not applicable Fund is an open-end management investment company
ITEM 8. PORTFOLIO MANAGERS OF CLOSED-END MANAGEMENT INVESTMENT COMPANIES
Not applicable Fund is an open-end management investment company
ITEM 9. PURCHASES OF EQUITY SECURITIES BY CLOSED-END MANAGEMENT INVESTMENT COMPANY AND AFFILIATED PURCHASERS.
Not applicable Fund is an open-end management investment company
ITEM 10. SUBMISSION OF MATTERS TO A VOTE OF SECURITY HOLDERS.
Not applicable at this time.
ITEM 11. CONTROLS AND PROCEDURES.
| (a) | The registrant's principal executive and principal financial officers, or persons performing similar functions, have concluded that the registrant's disclosure controls and procedures (as defined in Rule 30a-3(c) under the 1940 Act, are effective, as of a date within 90 days of the filing date of this report, based on the evaluation of these controls and procedures required by Rule 30a-3(b) under the 1940 Act and Rule 15d-15(b) under the Securities Exchange Act of 1934, as amended. |
| (b) | There were no changes in the registrant's internal control over financial reporting (as defined in Rule 30a-3(d) under the 1940 Act) that occurred during the period covered by this report that have materially affected, or are reasonably likely to materially affect, the registrant's internal control over financial reporting. |
ITEM 12. DISCLOSURE OF SECURITIES LENDING ACTIVITIES FOR CLOSED-END MANAGEMENT INVESTMENT COMPANIES.
Not applicable Fund is an open-end management investment company
ITEM 13. EXHIBITS
| (1) | Code of Ethics for Principal Executive and Senior Financial Officers is attached hereto. |
| (2) | Certifications pursuant to Section 302 of the Sarbanes-Oxley Act of 2002 are filed herewith. |
| (3) | Certifications pursuant to Section 906 of the Sarbanes-Oxley Act of 2002 are filed herewith. |
SIGNATURES
Pursuant to the requirements of the Securities Exchange Act of 1934 and the Investment Company Act of 1940, the registrant has duly caused this report to be signed on its behalf by the undersigned, thereunto duly authorized.
Two Roads Shared Trust
| By James Colantino | /s/James Colantino |
| President/Principal Executive Officer, | |
| Date: January 9, 2020 | |
Pursuant to the requirements of the Securities Exchange Act of 1934 and the Investment Company Act of 1940, this report has been signed below by the following person on behalf of the registrant and in the capacities and on the date indicated.
| By James Colantino | /s/James Colantino |
| President/Principal Executive Officer | |
| Date: January 9, 2020 | |
Pursuant to the requirements of the Securities Exchange Act of 1934 and the Investment Company Act of 1940, this report has been signed below by the following person on behalf of the registrant and in the capacities and on the date indicated.
| By Laura Szalyga | /s/ Laura Szalyga |
| Treasurer/Principal Financial Officer | |
| Date: January 9, 2020 | |