united states
securities and exchange commission
washington, d.c. 20549
form n-csr
certified shareholder report of registered management
investment companies
Investment Company Act file number 811-22718
Two Roads Shared Trust
(Exact name of registrant as specified in charter)
225 Pictoria Drive, Suite 450, Cincinnati, OH 45246
(Address of principal executive offices) (Zip code)
Richard Malinowski, Gemini Fund Services, LLC.
80 Arkay Drive Suite 110, Hauppauge, NY 11788
(Name and address of agent for service)
Registrant's telephone number, including area code: 631-470-2619
Date of fiscal year end: 10/31
Date of reporting period:10/31/19
ITEM 1. REPORTS TO SHAREHOLDERS.
 |
| Annual Report |
| October 31, 2019 |
| Recurrent MLP & Infrastructure Fund |
| Class I Shares (RMLPX) |
| 1-833-RECURRENT |
| (1-833-732-8773) |
| www.recurrentadvisors.com |
| Distributed by Northern Lights Distributors, LLC |
| Member FINRA |
This report and the financial statements contained herein are submitted for the general information of shareholders and are not authorized for distribution to prospective investors unless preceded or accompanied by an effective prospectus, which contains information about the Fund’s investment objective, risks, fees and expenses. Investors are reminded to read the prospectus carefully before investing in the Fund.
Beginning on January 1, 2021, as permitted by regulations adopted by the Securities and Exchange Commission, paper copies of the Fund’s shareholder reports like this one will no longer be sent by mail, unless you specifically request paper copies of the reports. Instead, the reports will be made available on the Fund’s website www.recurrentadvisors.com, and you will be notified by mail each time a report is posted and provided with a website link to access the report.
If you already elected to receive shareholder reports electronically, you will not be affected by this change and you need not take any action. You may elect to receive shareholder reports and other communications from the Fund electronically or to continue receiving paper copies of shareholder reports, which are available free of charge, by contacting your financial intermediary (such as a broker-dealer or bank) or, if you are a direct investor, by following the instructions included with paper Fund documents that have been mailed to you.
1

Recurrent MLP & Infrastructure Fund – FY 2019 at a glance
Before discussing the performance of the Recurrent MLP & Infrastructure Fund (“RMLPX”), Recurrent’s principals want to thank all of our clients for their trust and support. We have enjoyed meeting the vast majority of you personally and communicating with you telephonically and electronically throughout the year. As a result of your support, RMLPX has experienced significant growth in assets under management (“AUM”) throughout FY 2019, with significantly more asset growth compared to most peers as defined by the Morningstar, Inc “Energy Limited Partnership” category.
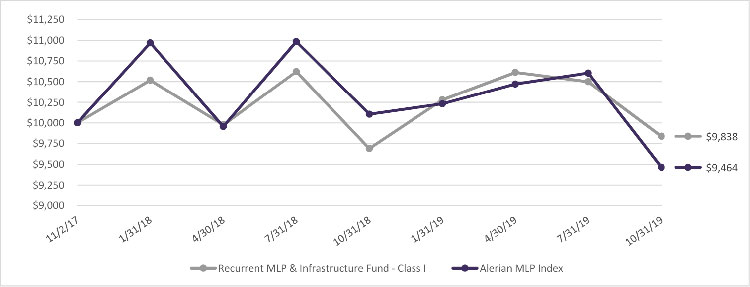
During FY 2019 (from November 2, 2018 through October 31, 2019), RMLPX generated +1.53% total returns, exceeding the -6.36% total return of the Alerian MLP Index (AMZ) by +7.89%. From inception date of November 2, 2017 through October 31, 2019, RMLPX has returned -0.81% on an annualized basis, exceeding the AMZ’s -2.73% annualized total return by +1.92%.
During FY 2019, volatility continued in the commodity markets, with the WTI crude oil benchmark plunging from $65/bbl in early November 2018 to $45/bbl by late December, before recovering meaningfully to $65/bbl in late April 2019. From the increase in US-China trade tensions in May 2019 through the end of October, WTI was effectively rangebound between $50/bbl and $60/bbl.
For the 12 months ended October 31, 2019, RMLPX ranked in the top 14% of 104 Energy Limited Partnership Funds ranked by Morningstar, Inc, based on total return, outpacing 86% of our competitors (in addition to the AMZ).
The performance data quoted here represents past performance. For performance data current to the most recent month end, please call (833)-RECURRENT. Current performance may be lower or higher than the performance data quoted above. Past performance is no guarantee of future results. The investment return and principal value of an investment in the Fund will fluctuate so that investors’ shares, when redeemed, may be worth more or less than their original cost. Total Annual Operating Expenses are 7.39% for RMLPX; although the Adviser has agreed to cap total fund expenses for the fund at 1.25% through at least March 1, 2020.
© 2019 Morningstar. All Rights Reserved. The information contained herein: (1) is proprietary to Morningstar and/or its content providers; (2) may not be copied or distributed; and (3) is not warranted to be accurate, complete or timely. Neither Morningstar nor its content providers are responsible for any damages or losses arising from any use of this information. Past performance is no guarantee of future results. Morningstar Percentile Rankings are based on the average annual total returns of the funds in the category for the periods stated and do not include any sales charges or redemption fees. The highest (or most favorable) percentile rank is 1 and the lowest (or least favorable) percentile rank is 100. Rankings for each share class will vary due to different expenses.
2
Recurrent MLP & Infrastructure Fund – Market Outlook
We continue to believe that future returns in “real assets” such as energy-related pipeline infrastructure and midstream equities have potential to outperform broader equities and fixed income securities after a multi-year period of underperformance. Our belief is informed by 2 key factors:
| 1. | Dramatic improvement in midstream balance sheets in the past 3 years |
| 2. | More recent improvement in shareholder governance in midstream |
Meaningful midstream debt reduction has occurred, in contrast to other sectors of the economy
We are especially encouraged by recent efforts made by midstream companies to reduce their debt levels – an effort which stands in stark contrast to other high-yield equities, such as utilities and REITs, as shown in the chart below. Midstream MLPs continue to offer high yield spreads vs. fixed income despite much lower debt loads. Meanwhile, utility debt has increased while yields have fallen, and REITs have reduced debt slightly but have seen yields remain relatively low.
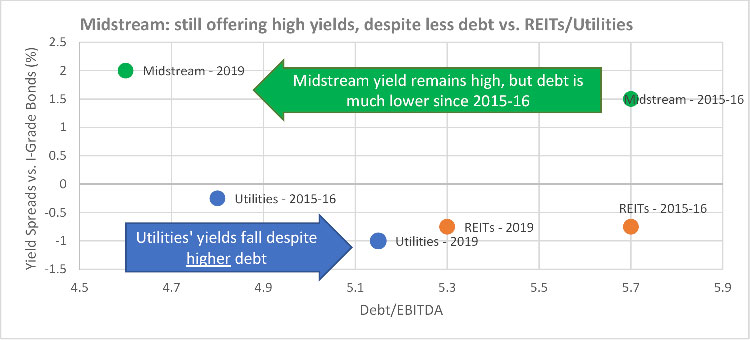
Source: Recurrent research, Bloomberg. “Midstream” based on AMZ constituents; REITs based on S&P REIT Index constituents; Utilities based on S&P Utilities Index constituents.
3
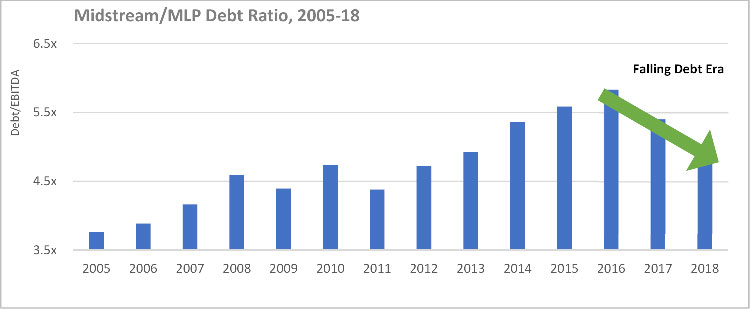
Source: Recurrent research, Bloomberg. Midstream debt/EBITDA ratio based on AMZ constituents.
Our analysis shows that midstream companies, after accumulating significant debt during the nearly decade-long oil and gas boom from 2008 through 2015, are now focused on reducing debt and maintaining prudent financial metrics, including lower dividend payout ratios, lesser reliance on external capital markets. These actions have already meaningfully reduced midstream infrastructure companies’ debt outstanding and made for a more attractive proposition to equity investors.
Shareholder governance, which has plagued midstream stocks in the past, has meaningfully improved
As we discuss further below, while some midstream corporate structures historically tilted the distribution of economic outcomes towards management and insiders and away from common shareholders, we would note that midstream governance hasdramatically improved since 2015, a result of 1) the desire to reduce MLP payouts to conserve cash flow and pay down debt and 2) investors’ increasing unwillingness to invest significant new capital in certain structures with misaligned incentives and limited shareholder rights.
For the sake of our discussion, we classify midstream companies into qualitative categories below. Shareholder agreements can have almost infinite shades of grey between them (especially within MLP/LLC category below, where board voting rights are curtailed but can still vary dramatically from company to company).
4
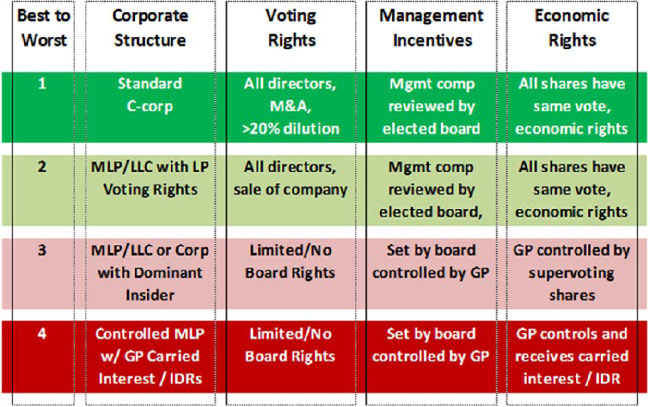
Source: Public Filings, Recurrent research
Since 2015, unsustainably high debt loads and high payouts led many midstream companies to eliminate or acquire their governance-lite MLP subsidiaries (and those MLPs’ associated heavy payout burdens), while the low valuations of other MLPs and LLCs led to their consolidation through mergers and “take private” activity. The result is a universe of companies that is increasingly dominated by companies with voting rights and rapidly falling debt loads, an attractive combination.
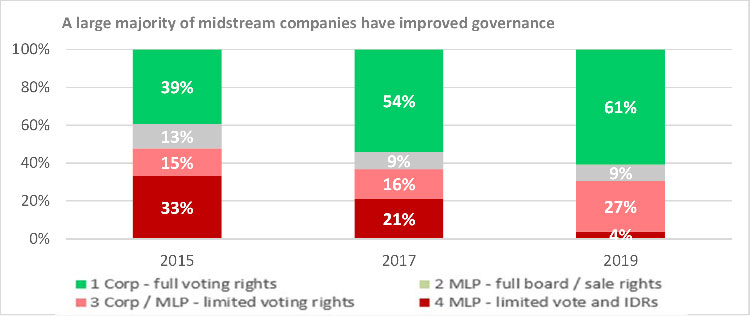
Source: Bloomberg, Alerian Indices, Public Filings, Recurrent research
Note: Percentage weightings based on Alerian MLP Index (AMZ), inclusive of US and Canada-based midstream corporations
5
Looking forward: midstream investing as “shale” matures
For the last several years in the oil market, unconventional “shale” resources have provided a “rapid response” source of supply that has kept a lid on commodity prices while delivering generally rising oil and gas production in North America. While many market commentators suggested that stable crude prices above $50/bbl and rising oil and gas production would be sufficient to drive midstream stocks and MLPs meaningfully higher, we examined the evidence and offer a counterpoint: these two often-cited factors have historically been poor predictors of midstream stock performance. Instead, we believe that midstream stocks can largely control their own destiny, since long-term stock performance is more dependent on prudent financial policies: reasonable payouts, debt reduction, and sensible capital allocation.
Many midstream financial metrics have improved meaningfully over the past 12 months, and midstream has been rewarded with significant outperformance compared with oil producing stocks (S&P Exploration and Production Index – SIOSP – is down -40.73% during the 12 months ended October 31, 2019 vs. AMZ down -6.59%). Despite midstream’s relative resilience, many investors have wondered: “can midstream outperform if oil producers are struggling and commodity prices and US oil and gas production volumes are flat?”
Historical evidence offers us some comfort: for the decade from year-end 1995 through year-end 2005, WTI averaged <$30/bbl, US oil production declined 3% annually, and the AMZ delivered an annual total return of +11.37%. More recently, we have seen scenarios where well-capitalized midstream companies with prudent financial policies have meaningfully outperformed the AMZ, and we continue to look for companies whose financial metrics are improving at a faster-than-average rate vs. the Alerian MLP Index, believing that these companies will continue to lead the midstream recovery.
We thank you again for your confidence, and we believe that as midstream companies maintain financial discipline, returns could surprise to the upside in 2020.
Best regards,
Brad Olsen and Mark Laskin
Co-Founders and Portfolio Managers
Recurrent Investment Advisors (Advisor of the Recurrent MLP & Infrastructure Fund)
The views in this report are those of the Fund’s management. This report contains certain forward-looking statements about factors that may affect the performance of the Fund in the future. These statements are based on the Fund’s management’s predictions and expectations concerning certain future events such as the performance of the economy as a whole and of specific industry sectors. Management believes these forward-looking statements are reasonable, although they are inherently uncertain and difficult to predict.
6
Recurrent MLP & Infrastructure Fund (RMLPX) Portfolio Commentary – FY 2019
RMLPX generally performed well in up and down markets during a year marked by trade-related uncertainty and commodity market volatility. RMLPX outperformed the AMZ meaningfully during the trade-related selloff during the final months of 2018, and then outperformed during the broad equity and commodity rally from December through April. In the last several months of FY 2019, RMLPX outperformed the AMZ again as Recurrent’s portfolio managers made efforts to avoid excessive situations with significant counterparty exposure to E&Ps with poor credit or E&Ps experiencing signs of financial distress.
Looking forward, we are encouraged by midstream company valuations which appear low compared to historical levels, as well as improving balance sheets, which we believe will leave more debt-adjusted cash flow available to reward MLP equityholders.
| Recurrent MLP & Infrastructure Historical Performance Detail | ||||||||||
| All Data as of | Inception to Date | |||||||||
| 10/31/2019 | Year to Date | Last 12 months | (annualized) | |||||||
| Recurrent MLP & Infra (RMLPX) | +10.48% | +1.53% | -0.81% | |||||||
| Alerian MLP Index (AMZ) | +4.18% | -6.36% | -2.73% | |||||||
| RMLPX vs. AMZ Relative Performance | +6.30% | +7.89% | +1.92% | |||||||
During FY 2019, the Recurrent MLP & Infrastructure Fund gained +1.53% on a total return basis, outperforming the Alerian MLP Index’s -6.36% total return by +7.89%.
| Top 10 RMLPX Holdings | ||||||||
| Recurrent MLP & Infrastructure - as of October 31, 2019 | ||||||||
| Rank | Ticker | Company | Subsector | % of Port | ||||
| 1 | ET | Energy Transfer LP | Gas Infra | 6.7% | ||||
| 2 | PBA | Pembina Pipeline Corp | Unregulated Oil/NGL | 6.6% | ||||
| 3 | KMI | Kinder Morgan Inc. | Gas Infra | 6.5% | ||||
| 4 | EPD | Enterprise Products Partners LP | Unregulated Oil/NGL | 6.2% | ||||
| 5 | PAGP | Plains GP Holdings LP | Unregulated Oil/NGL | 6.2% | ||||
| 6 | WMB | Williams Companies | Gas Infra | 5.1% | ||||
| 7 | ALA.CA | AltaGas Ltd. | Gas Infra | 5.0% | ||||
| 8 | ENB | Enbridge Inc | Regulated Oil/NGL | 5.0% | ||||
| 9 | OKE | ONEOK Inc. | Gas Infra | 4.9% | ||||
| 10 | KEY.CA | Keyera Corp. | Gathering and Processing | 4.7% | ||||
| Top 10 RMLPX Holdings as a% of Portfolio: | 57.1% | |||||||
Portfolio holdings are subject to change at any time and should not be considered investment advice.
| RMLPX Top 5 Performance Contributors and Detractors in FY 2019 | ||||||||||
| Company | Ticker | Contribution (bps) | Company | Ticker | Contribution (bps) | |||||
| Buckeye Partners | BPL | +198 | Equitrans Midstream | ETRN | -271 | |||||
| Enbridge Inc | ENB | +132 | Energy Transfer | ET | -184 | |||||
| EQT GP Holdings | EQGP | +125 | Enable Midstream | ENBL | -141 | |||||
| Kinder Morgan Inc | KMI | +124 | Marathon Petroleum | MPC | -135 | |||||
| Western Gas Partners | WES | +108 | Altus Midstream | ALTM | -127 | |||||
Portfolio holdings are subject to change at any time and should not be considered investment advice.
7
Top 5 Contributors to Performance
Buckeye Partners (BPL)
As one of the oldest MLPs in the market (1986 IPO), Buckeye enjoys stable cash flows across pipeline and storage assets, primarily located in the contiguous 48 US states. Despite stable cash flows and many of the “toll road” business dynamics that midstream investors generally find appealing, aggressive acquisition activity had led to high levels of debt by 2018 for BPL, and by 2019 its credit rating was in jeopardy. In May 2019, BPL received a takeout bid from an Australian pension fund, who recognized that BPL’s assets remained attractive, despite a mismanaged balance sheet. BPL ceased trading in November 2019.
Enbridge Inc. (ENB)
After stumbles in 2017 and 2018 as a result of high debt and structural complexity, Enbridge enjoyed a stronger 2019, after consolidating various subsidiaries in credit- and equity-accretive acquisitions. While regulatory entanglements related to ENB’s Line 3 project remain, ENB’s high yield and falling debt levels have made the largely-regulated asset profile a key holding in our portfolio.
EQT GP Holdings (EQGP)
While Northeast gas production companies, such as parent company EQT, faced headwinds in recent years, midstream operators such as EQT Midstream, controlled via EQT GP Holdings, have continued to enjoy the benefits of stable and growing production and secure contracts for providing short- and long-haul gathering and transportation services. In early FY 2019 (late calendar 2018), EQGP received a $20/share takeout offer from EQT Midstream’s newly-created subsidiary, Equitrans (ETRN), which caused the stock to rally. RMLPX largely redeployed these proceeds in ETRN after the close in January 2019.
Kinder Morgan Inc (KMI)
KMI meaningfully accelerated a multi-year plan to reduce its debt load in August 2018, with a sale of their premier Canadian asset, TransMountain. As a result of the accelerated debt reduction made possible by the sale of TransMountain, KMI has returned to a solidly investment grade profile and attracted a broader audience of equity investors. KMI has since continued to announce asset sales and new accretive projects in the Permian, while achieving a new, lower debt level than previously targeted. While KMI tends to trade with low correlation to other midstream MLP companies, we continue to view the debt reduction process as the key driver of long-term outperformance.
Western Gas Partners (WES)
For years, Western Gas Partners was a premier growth MLP, sponsored by large-cap E&P company Anadarko Petroleum (APC). WES enjoyed assets that were deeply integrated into the fastest-growing APC geographic areas, offered participation rights in all new APC infrastructure construction projects, and was provided additional acquisition opportunities from APC’s existing infrastructure asset portfolio. While WES was a long-term portfolio holding, WES’s future was made much less clear by APC’s intent to put themselves up for sale, culminating in a bidding war between Chevron (CVX) and Occidental (OXY).
Top 5 Detractors from Performance
Equitrans Midstream Corp (ETRN)
8
After the acquisition of EQGP (see above), EQT Corp (EQT) consolidated its midstream ownership stakes in a newly-formed company, called Equitrans Midstream (ETRN). Even after its creation and spinoff by EQT, ETRN enjoyed a close integration with investment grade gas producer EQT. Most of ETRN’s growth projects also relied on EQT’s continued growth and financial health. EQT’s acquisition of Rice Energy (RICE) has led EQT to pursue a higher-growth strategy, leading to higher debt at the EQT level, while larger infrastructure projects anchored by EQT have temporarily run afoul of state-level regulators, halting ETRN’s cash flow growth and causing $2bn to sit idle on ETRN’s balance sheet. While we believe the regulatory outcome is likely positive, and that EQT will preserve its investment grade rating, the dual overhang has created pressure on ETRN.
Energy Transfer (ET)
Long a poster child for the structural complexity and aggressive leverage of the MLP sector, ET turned over a new leaf in Q3 2018, announcing a structural streamlining that would dramatically reduce payouts and lead to a drastic reduction in ET leverage, while making all common unitholders (from the CEO to the smallest retail account) economically fungible, although management retained general partner control of the ET entity. With ET’s common units relieved of the structural general partner complexity which had drained billions of dollars from common unitholders over time, we believed that investors would have greater interest in ET’s diversified, high-growth asset base and generally high return on assets. Instead, ET has languished since its streamlining transaction, and remains looking for new institutional owners to replace its longtime retail investor base.
Enable Midstream (ENBL)
As we’ve discussed the several key obstacles faced by MLPs in FY 2019, we’ve clearly highlighted the following 2 issues:
| 1) | Excessive debt loads |
| 2) | Misaligned corporate governance / management incentives |
In the case of Enable, the balance sheet has always been highly-conservative – investment grade rated, and backed by two creditworthy utilities (OGE and Centerpoint – although the latter has called ENBL ownership “non-core”). Which brings us to #2 – ENBL has excellent gathering and processing assets, but ENBL management is incentivized to maximize the value of CNP and OGE ownership stake, which generally aligns with common unitholder interests, but not always. For example, ENBL might not be valued at the valuation their quality assets would command in an open market, because ultimately OGE and CNP manage the assets in light of their own corporate strategy. Utility ownership has perhaps limited ENBL’s growth, but has also maintained a highly-creditworthy debt profile, and given ENBL’s double-digit, well-secured yield, we remain bullish on this MLP.
Marathon Petroleum (MPC)
Historically viewed as a refining company, MPC has emerged as one of the most significant investors in North American midstream assets over the past 5 years. While many midstream companies have shied away from growth projects due to high leverage and limited capital access, MPC has used significant free cash flow generation to fund a buildout of Marcellus/Utica gas gathering and processing in WV, PA, OH and Permian and Midcontinent gas services in OK and TX. While MPC retains significant refining exposure, its $5bn of
9
midstream EBITDA and $2bn of retail EBITDA now represents a significant majority of corporate cash flow, and its balance sheet is significantly less levered than midstream pure-play companies.
Altus Midstream (ALTM)
Coming into 2019, Altus Midstream appeared to possess several highly-attractive attributes, most valuable of which was a portfolio of call options to participate in regulated Permian pipeline projects at fixed double-digit returns, along with a less-valuable midstream gathering agreement in West Texas working closely with sponsor Apache Corp (APA). While Apache’s Alpine High drilling target was speculative, even Alpine High bears were surprised when APA drastically reduced the multi-year outlook for Alpine High only months after the IPO of ALTM. While significant value remains within the pipeline project portfolio, the questions raised by APA’s short-sighted development plans in Alpine High have dogged ALTM, and we’ve since exited the position.
Investments cannot be made in an index. Unmanaged index returns do not reflect any fees, expenses or sales charges. Past performance is no guarantee of future results and the index performance shown is not indicative of the performance of the Recurrent Funds.
Alerian MLP Index - is a composite of the 50 most prominent energy master limited partnerships calculated by Standard & Poor’s using a float-adjusted market capitalization methodology.
S&P 500 Index - is an unmanaged composite of 500 large capitalization companies. This index is widely used by professional investors as a performance benchmark for large-cap stocks.
S&P REIT Index - The S&P United States REIT Index defines and measures the investable universe of publicly traded real estate investment trusts domiciled in the United States.
S&P Utility Index - The S&P 500 Utilities Index comprises those companies included in the S&P 500 that are classified as members of the GICS® utilities sector.
S&P Oil & Gas Exploration & Production Select Industry Index - The index comprises stocks in the S&P Total Market Index that are classified in the GICS oil & gas exploration & production sub-industry.
EBITDA - Earnings before interest, taxes, depreciation and amortization. EBITDA is a non-GAAP metric, typically used as a measure of a company’s operating cash flow, excluding changes in working capital.
Investors should carefully consider the investment objectives, risks, charges and expenses of the Recurrent Fund. This and other important information about the Fund is contained in the prospectus, which can be obtained by calling 832-241-5900. The prospectus should be read carefully before investing. The Recurrent Fund is distributed by Northern Lights Distributors, LLC, member FINRA/SIPC. Recurrent Investment Advisors is not affiliated with Northern Lights Distributors, LLC.
Important Risk Disclosure (RMLPX)
Mutual Funds involve risk including the potential loss of principal. Higher turnover and frequent trading my result is higher costs. Cash available for distribution by MLP’s may vary and could be affected by the entity’s operations, including capital expenditures, operating, acquisition, construction, exploration and borrowing costs, reducing the amount of cash and MLP has available for distribution. The Fund may focus on one or more industries, sectors or geographic regions of the economy and the value of an investment may fluctuate more widely than if it were diversified. Tax risks associated with the Fund include fund structure risk, MLP tax risk, and tax estimation/NAV risk. Cyber-attacks or failures affecting the Fund or service providers may adversely impact the Fund or its shareholders.
The Fund invests primarily in the energy sector and infrastructure industry and is susceptible to adverse economic, environmental, and regulatory concerns. Additional risks include acquisition, catastrophic event, commodity price, depletion, natural resource, supply/demand and weather risk. The purchase of IPO shares may involve high transaction cost, market and liquidity risks. The investment strategies employed by the Advisor may not result in an increase in value or performance. Overall equity market risk may affect the value of individual instruments in which the Fund invests. Holders of MLP’s have limited control and voting rights, additionally, there are certain tax risks and conflicts of interest between holders of MLP’s and the general partner. The Fund is newly-formed and may not grow to or maintain economically viable size, not be successful implementing its investment strategy, which could result in the Fund being liquidated. (3900-NLD-12/10/2019)
10
| Recurrent MLP & Infrastructure Fund |
| PORTFOLIO REVIEW (Unaudited) |
| October 31, 2019 |
The Fund’s performance figures* for the periods ended October 31, 2019, compared to its benchmarks:
| Annualized | ||||
| One Year | Since Inception (a) | |||
| Recurrent MLP & Infrastructure Fund - Class I | 1.53% | (0.81)% | ||
| Alerian MLP Index ** | (6.36)% | (2.73)% |
| (a) | Inception date is November 2, 2017. |
| * | The performance data quoted is historical. Past performance is no guarantee of future results. Current performance may be higher or lower than the performance data quoted. The principal value and investment return of an investment will fluctuate so that your shares, when redeemed, may be worth more or less than their original cost. Total returns for periods of less than one year are not annualized. Total returns would have been lower absent the advisor fee waiver. The returns shown do not reflect the deduction of taxes that a shareholder would pay on Fund distributions or on the redemptions of Fund shares. The Advisor has contractually agreed to waive fees and/or reimburse expenses to the Fund until at least March 1, 2020 but only to the extent necessary to maintain the Fund’s total annual operating expenses after expense waiver and reimbursement (excluding any front-end or contingent deferred loads; brokerage fees and commissions; borrowing costs such as interest and dividend expenses on securities sold short, taxes; and extraordinary expenses, such as litigation expenses) at 1.25% for Class I shares, per the most recent prospectus dated February 28, 2019. The Fund’s estimated total annual fund operating expense ratio, gross of fee waivers or expense reimbursements are 7.39% for Class I per the Fund’s Prospectus dated February 28, 2019. These fee waivers and expense reimbursements are subject to possible recoupment from the Fund in future years on a rolling three year basis (within three years after the fees have been waived or reimbursed) if such recoupment can be achieved without exceeding the foregoing expense limits as well as any expense limitation that was in effect at the time the reimbursement was made. For performance information current to the most recent month-end, please call 1-877-594-1249. |
| ** | The Alerian MLP Index is a float-adjusted, capitalization-weighted index, whose constituents represent approximately 85% of total float-adjusted market capitalization. This index provides a comprehensive benchmark for investors to track the performance of the energy MLP sector. Investors cannot invest directly in an index. |
Comparison of Change in Value of a $10,000 Investment
Since Inception November 2, 2017 through October 31, 2019
| Holdings by type of investment | % of Net Assets | |||
| Common Stocks | 73.3 | % | ||
| MLP & MLP Related Securities | 23.7 | % | ||
| Short-Term Investment | 2.6 | % | ||
| Other Assets Less Liabilities | 0.4 | % | ||
| 100.0 | % | |||
Please refer to the Portfolio of Investments that follows in this annual report for a detail of the Fund’s holdings.
11
| Recurrent MLP & Infrastructure Fund |
| PORTFOLIO OF INVESTMENTS |
| October 31, 2019 |
| Shares | Security | Fair Value | ||||||
| COMMON STOCKS - 73.3% | ||||||||
| ELECTRIC - 2.4% | ||||||||
| 13,877 | Pinnacle West Capital Corp. | $ | 1,306,103 | |||||
| OIL & GAS - 10.7% | ||||||||
| 121,796 | Cenovus Energy, Inc. | 1,034,048 | ||||||
| 35,843 | Marathon Petroleum Corp. | 2,292,160 | ||||||
| 21,631 | Phillips 66 | 2,526,933 | ||||||
| 5,853,141 | ||||||||
| OIL & GAS SERVICES - 3.0% | ||||||||
| 169,383 | Archrock, Inc. | 1,632,852 | ||||||
| PIPELINES - 57.2% | ||||||||
| 188,897 | Altagas Ltd. | 2,753,655 | ||||||
| 40,324 | Cheniere Energy, Inc. * | 2,481,942 | ||||||
| 74,838 | Enbridge, Inc. | 2,724,852 | ||||||
| 61,853 | EnLink Midstream LLC | 386,581 | ||||||
| 149,634 | Equitrans Midstream Corp. | 2,082,905 | ||||||
| 111,078 | Keyera Corp. | 2,580,143 | ||||||
| 178,825 | Kinder Morgan, Inc. | 3,572,924 | ||||||
| 38,250 | ONEOK, Inc. | 2,670,998 | ||||||
| 102,766 | Pembina Pipeline Corp. | 3,613,253 | ||||||
| 182,162 | Plains GP Holdings LP | 3,380,927 | ||||||
| 46,288 | TC Energy Corp. | 2,329,675 | ||||||
| 124,820 | Williams Cos., Inc. (The) | 2,784,734 | ||||||
| 31,362,589 | ||||||||
| TOTAL COMMON STOCKS (Cost - $40,258,574) | 40,154,685 | |||||||
| MLP & MLP RELATED SECURITIES - 23.7% | ||||||||
| OIL & GAS - 4.4% | ||||||||
| 71,342 | Sunoco LP | 2,397,805 | ||||||
| PIPELINES - 17.6% | ||||||||
| 32,387 | Crestwood Equity Partners LP | 1,170,466 | ||||||
| 139,000 | Enable Midstream Partners LP | 1,402,510 | ||||||
| 290,365 | Energy Transfer LP | 3,655,695 | ||||||
| 130,907 | Enterprise Products Partners LP | 3,407,509 | ||||||
| 9,636,180 | ||||||||
| TRANSPORTATION - 1.7% | ||||||||
| 93,160 | Golar LNG Partners LP | 948,369 | ||||||
| TOTAL MLP & MLP RELATED SECURITIES (Cost - $14,124,280) | 12,982,354 | |||||||
| SHORT-TERM INVESTMENT - 2.6% | ||||||||
| MONEY MARKET FUND - 2.6% | ||||||||
| 1,396,995 | Federated Government Obligations Fund - Institutional Class, 1.71% ^ | 1,396,995 | ||||||
| TOTAL SHORT-TERM INVESTMENT (Cost - $1,396,995) | ||||||||
| TOTAL INVESTMENTS - 99.6% (Cost - $55,779,849) | $ | 54,534,034 | ||||||
| OTHER ASSETS LESS LIABILITIES - 0.4% | 230,865 | |||||||
| NET ASSETS - 100.0% | $ | 54,764,899 | ||||||
| ^ | Money Market Fund; interest rate reflects seven day effective yield on October 31, 2019. |
| * | Non-income producing security. |
The accompanying notes are an integral part of these financial statements.
12
| Recurrent MLP & Infrastructure Fund |
| STATEMENT OF ASSETS AND LIABILITIES |
| October 31, 2019 |
| ASSETS | ||||
| Investment securities: | ||||
| At cost | $ | 55,779,849 | ||
| At fair value | $ | 54,534,034 | ||
| Cash | 19,529 | |||
| Receivable for Fund shares sold | 1,981 | |||
| Interest and dividends receivable | 246,028 | |||
| Prepaid expenses & other assets | 41,060 | |||
| TOTAL ASSETS | 54,842,632 | |||
| LIABILITIES | ||||
| Advisory fees payable | 32,983 | |||
| Payable to related parties | 233 | |||
| Audit and tax fees | 32,298 | |||
| Legal fees | 7,206 | |||
| Printing fees | 3,587 | |||
| Accrued expenses and other liabilities | 1,426 | |||
| TOTAL LIABILITIES | 77,733 | |||
| NET ASSETS | $ | 54,764,899 | ||
| Net Assets Consist Of: | ||||
| Paid in capital ($0 par value, unlimited shares authorized) | $ | 55,944,489 | ||
| Accumulated losses | (1,179,590 | ) | ||
| NET ASSETS | $ | 54,764,899 | ||
| Net Asset Value Per Share: | ||||
| Class I Shares: | ||||
| Net Assets | $ | 54,764,899 | ||
| Shares of beneficial interest outstanding ($0 par value, unlimited shares authorized) | 3,188,339 | |||
| Net asset value (Net Assets ÷ Shares Outstanding), offering price and redemption price per share | $ | 17.18 |
The accompanying notes are an integral part of these financial statements.
13
| Recurrent MLP & Infrastructure Fund |
| STATEMENT OF OPERATIONS |
| For the Year Ended October 31, 2019 |
| INVESTMENT INCOME | ||||
| Dividends (Foreign taxes withheld: $40,670) | $ | 1,355,252 | ||
| Interest | 22,590 | |||
| TOTAL INVESTMENT INCOME | 1,377,842 | |||
| EXPENSES | ||||
| Investment advisory fees | 280,228 | |||
| Administrative services fees | 63,372 | |||
| Audit and tax fees | 31,235 | |||
| Legal fees | 42,482 | |||
| Transfer agent fees | 30,665 | |||
| Chief compliance officer fees | 31,563 | |||
| Trustees fees and expenses | 10,973 | |||
| Registration fees | 21,288 | |||
| Printing and postage expenses | 16,597 | |||
| Custodian fees | 2,802 | |||
| Third party administrative services fees | 11,091 | |||
| Tax expense | 10,058 | |||
| Insurance fees | 121 | |||
| Other expenses | 4,739 | |||
| TOTAL EXPENSES | 557,214 | |||
| Less: Fees waived by the Advisor | (156,362 | ) | ||
| NET EXPENSES | 400,852 | |||
| NET INVESTMENT INCOME | 976,990 | |||
| REALIZED AND UNREALIZED GAIN/(LOSS) ON INVESTMENTS | ||||
| Net realized gain/(loss) on: | ||||
| Investments | (383,619 | ) | ||
| Foreign currency translations | 1,254 | |||
| Total realized loss | (382,365 | ) | ||
| Net change in unrealized appreciation/(depreciation) on: | ||||
| Investments | (601,895 | ) | ||
| Foreign currency translations | 53 | |||
| Total unrealized depreciation | (601,842 | ) | ||
| NET REALIZED AND UNREALIZED LOSS ON INVESTMENTS | (984,207 | ) | ||
| NET DECREASE IN NET ASSETS RESULTING FROM OPERATIONS | $ | (7,217 | ) |
The accompanying notes are an integral part of these financial statements.
14
| Recurrent MLP & Infrastructure Fund |
| STATEMENTS OF CHANGES IN NET ASSETS |
| Year Ended | Period Ended | |||||||
| October 31, | October 31, | |||||||
| 2019 | 2018 (a) | |||||||
| FROM OPERATIONS | ||||||||
| Net investment income | $ | 976,990 | $ | 179,646 | ||||
| Net realized loss on investments | (382,365 | ) | (143,089 | ) | ||||
| Net change in unrealized depreciation on investments | (601,842 | ) | (643,920 | ) | ||||
| Net decrease in net assets resulting from operations | (7,217 | ) | (607,363 | ) | ||||
| DISTRIBUTIONS TO SHAREHOLDERS | ||||||||
| Total distributions paid | (516,268 | ) | — | |||||
| Return of capital | (2,105,916 | ) | (312,200 | ) | ||||
| Net decrease in net assets from distributions to shareholders | (2,622,184 | ) | (312,200 | ) | ||||
| FROM SHARES OF BENEFICIAL INTEREST | ||||||||
| Proceeds from shares sold: | 50,561,038 | 10,161,046 | ||||||
| Net asset value of shares issued in reinvestment of distributions: | 1,471,481 | 284,477 | ||||||
| Payments for shares redeemed: | (3,229,260 | ) | (934,919 | ) | ||||
| Net increase in net assets from shares of beneficial interest | 48,803,259 | 9,510,604 | ||||||
| TOTAL INCREASE IN NET ASSETS | 46,173,858 | 8,591,041 | ||||||
| NET ASSETS | ||||||||
| Beginning of period | 8,591,041 | — | ||||||
| End of period | $ | 54,764,899 | $ | 8,591,041 | ||||
| SHARE ACTIVITY | ||||||||
| Shares sold | 2,815,597 | 507,580 | ||||||
| Shares reinvested | 80,713 | 14,936 | ||||||
| Shares redeemed | (181,633 | ) | (48,854 | ) | ||||
| Net increase in shares of beneficial interest outstanding | 2,714,677 | 473,662 | ||||||
| (a) | Recurrent MLP & Infrastructure Fund commenced operations on November 2, 2017. |
The accompanying notes are an integral part of these financial statements.
15
| Recurrent MLP & Infrastructure Fund |
| FINANCIAL HIGHLIGHTS |
| Per Share Data and Ratios for a Share of Beneficial Interest Outstanding Throughout Each Period |
| Class I(1) | ||||||||
| For the Year Ended | For the Period Ended | |||||||
| October 31, | October 31, | |||||||
| 2019 | 2018 | |||||||
| Net asset value, beginning of period | $ | 18.14 | $ | 20.00 | ||||
| Activity from investment operations: | ||||||||
| Net investment income (2) | 0.58 | 0.97 | ||||||
| Net realized and unrealized loss on investments (3) | (0.24 | ) | (1.53 | ) | ||||
| Total from investment operations | 0.34 | (0.56 | ) | |||||
| Less distributions from: | ||||||||
| Net investment income | (0.25 | ) | — | |||||
| Return of capital | (1.05 | ) | (1.30 | ) | ||||
| Total distributions | (1.30 | ) | (1.30 | ) | ||||
| Net asset value, end of period | $ | 17.18 | $ | 18.14 | ||||
| Total return (4) | 1.53 | % | (3.10 | )% | ||||
| Net assets, at end of period (000’s) | $ | 54,765 | $ | 8,591 | ||||
| Ratio of gross expenses to average net assets (5) | 1.75 | % | 7.39 | % | ||||
| Ratio of net expenses to average net assets (5)(6) | 1.25 | % | 1.25 | % | ||||
| Ratio of net investment income to average net assets | 3.13 | % | 4.85 | % (7) | ||||
| Portfolio Turnover Rate | 52 | % | 116 | % (8) | ||||
| (1) | The Recurrent MLP & Infrastructure Fund commenced operations on November 2, 2017. |
| (2) | Per share amounts calculated using the average shares method, which more appropriately presents the per share data for the period. |
| (3) | Net realized and unrealized gain/(loss) on investments per share are balancing amounts necessary to reconcile the change in net asset value per share for the period, and may not reconcile with aggregate gains/(losses) in the statement of operations due to the share transactions for the period. |
| (4) | Total returns are historical and assume changes in share price and reinvestment of dividends and distributions. Total returns for periods of less than one year are not annualized. Total returns would be lower absent fee waivers. |
| (5) | Does not include the expenses of other investment companies in which the Fund invests, if any. |
| (6) | Represents the ratio of expenses to average net assets net of fee waivers and/or expense reimbursements by the Advisor. |
| (7) | Annualized. |
| (8) | Not annualized. |
The accompanying notes are an integral part of these financial statements.
16
| Recurrent MLP & Infrastructure Fund |
| NOTES TO FINANCIAL STATEMENTS |
| October 31, 2019 |
| 1. | ORGANIZATION |
Recurrent MLP & Infrastructure Fund (the “Fund”), is a series of shares of beneficial interest of the Two Roads Shared Trust (the “Trust”), a statutory trust organized under the laws of the State of Delaware on June 8, 2012, and is registered under the Investment Company Act of 1940, as amended (the “1940 Act”), as a non-diversified, open-end management investment company. The Fund offers Class I shares. The Fund commenced investment operations for Class I shares on November 2, 2017. The Fund’s investment objective is to seek total return including substantial current income from a portfolio of master limited partnerships (“MLPs”) and energy infrastructure investments.
| 2. | SIGNIFICANT ACCOUNTING POLICIES |
The following is a summary of significant accounting policies followed by the Fund in preparation of its financial statements. These policies are in conformity with U.S. generally accepted accounting principles in the United States of America (“U.S. GAAP”). The preparation of the financial statements requires management to make estimates and assumptions that affect the reported amounts of assets and liabilities and disclosure of contingent assets and liabilities at the date of the financial statements and the reported amounts of income and expenses for the period. Actual results could differ from those estimates. The Fund is a registered investment company and accordingly follows the investment company accounting and reporting guidance of the Financial Accounting Standards Board (“FASB”) Accounting Standard Codification Topic 946 “Financial Services – Investment Companies”.
Securities Valuation – Securities listed on an exchange are valued at the last reported sale price at the close of the regular trading session of the exchange on the business day the value is being determined, or in the case of securities listed on NASDAQ at the NASDAQ Official Closing Price. In the absence of a sale, such securities shall be valued at the mean between the current bid and ask prices on the primary exchange on the day of valuation. Short-term debt obligations having 60 days or less remaining until maturity, at the time of purchase, may be valued at amortized cost.
Valuation of Underlying Funds – The Fund may invest in portfolios of open-end or closed-end investment companies (the “Underlying Funds”). The Underlying Funds value securities in their portfolios for which market quotations are readily available at their market values (generally the last reported sale price) and all other securities and assets at their fair value according to the methods established by the board of directors of the Underlying Funds.
Open-end investment companies are valued at their respective net asset values as reported by such investment companies. The shares of many closed-end investment companies, after their initial public offering, frequently trade at a price per share, which is different than the net asset value per share. The difference represents a market premium or market discount of such shares. There can be no assurances that the market discount or market premium on shares of any closed-end investment company purchased by the Fund will not change.
Master Limited Partnerships (“MLPs”) –An MLP is an entity receiving partnership taxation treatment under the Internal Revenue Code of 1986, as amended (the “Code”) the partnership interests or “units” of which are traded on securities exchanges like shares of corporate stock. To qualify as an MLP for U.S. federal income tax purposes, an entity must receive at least 90% of its income from qualifying sources such as interest, dividends, income and gain from mineral or natural resources activities, income and gain from the transportation or storage of certain fuels, and, in certain circumstances, income and gain from commodities or futures, forwards and options with respect to commodities. For this purpose, mineral or natural resources activities include exploration, development, production, mining, refining, marketing and transportation (including pipelines) of oil and gas, minerals, geothermal energy, fertilizer, timber or industrial source carbon dioxide.
A typical MLP consists of a general partner and limited partners; however, some entities receiving partnership taxation treatment under the Code are established as limited liability companies (LLCs). The general partner of an MLP manages the partnership, has an ownership stake in the partnership and in some cases the general partners are eligible to receive an incentive distribution. The limited partners provide capital to the partnership, receive common units of the partnership, have a limited role in the operation and management of the partnership and are entitled to receive cash distributions with respect to their units. Currently, most MLPs operate in the energy, natural resources and real estate sectors. Due to their partnership structure, MLPs generally do not pay income taxes. Thus, unlike investors in corporate securities, direct MLP investors are generally not subject to double taxation (i.e., corporate level tax and tax on corporate dividends).
17
| Recurrent MLP & Infrastructure Fund |
| NOTES TO FINANCIAL STATEMENTS (Continued) |
| October 31, 2019 |
The Fund may hold securities, such as private investments, interests in commodity pools, other non-traded securities or temporarily illiquid securities, for which market quotations are not readily available or are determined to be unreliable. These securities will be valued using the “fair value” procedures approved by the Board. The Board has delegated execution of these procedures to a fair value committee composed of one or more representatives from each of the (i) Trust, (ii) administrator, and (iii) advisor. The committee may also enlist third party consultants such a valuation specialist at a public accounting firm, valuation consultant or financial officer of a security issuer on an as-needed basis to assist in determining a security-specific fair value. The Board has also engaged a third party valuation firm to, as needed, attend valuation meetings held by the Trust, review minutes of such meetings and report to the Board on a quarterly basis. The Board reviews and ratifies the execution of this process and the resultant fair value prices at least quarterly to assure the process produces reliable results.
Fair Valuation Process – The applicable investments are valued collectively via inputs from each group within the fair value committee. For example, fair value determinations are required for the following securities: (i) securities for which market quotations are insufficient or not readily available on a particular business day (including securities for which there is a short and temporary lapse in the provision of a price by the regular pricing source); (ii) securities for which, in the judgment of the advisor, the prices or values available do not represent the fair value of the instrument; factors which may cause the advisor to make such a judgment include, but are not limited to, the following: only a bid price or an asked price is available; the spread between bid and asked prices is substantial; the frequency of sales; the thinness of the market; the size of reported trades; and actions of the securities markets, such as the suspension or limitation of trading; (iii) securities determined to be illiquid; and (iv) securities with respect to which an event that will affect the value thereof has occurred (a “significant event”) since the closing prices were established on the principal exchange on which they are traded, but prior to a Fund’s calculation of its net asset value. Specifically, interests in commodity pools or managed futures pools are valued on a daily basis by reference to the closing market prices of each futures contract or other asset held by a pool, as adjusted for pool expenses. Restricted or illiquid securities, such as private investments or non-traded securities are valued via inputs from the advisor based upon the current bid for the security from two or more independent dealers or other parties reasonably familiar with the facts and circumstances of the security (who should take into consideration all relevant factors as may be appropriate under the circumstances). If the advisor is unable to obtain a current bid from such independent dealers or other independent parties, the fair value committee shall determine the fair value of such security using the following factors: (i) the type of security; (ii) the cost at date of purchase; (iii) the size and nature of the Fund’s holdings; (iv) the discount from market value of unrestricted securities of the same class at the time of purchase and subsequent thereto; (v) information as to any transactions or offers with respect to the security; (vi) the nature and duration of restrictions on disposition of the security and the existence of any registration rights; (vii) how the yield of the security compares to similar securities of companies of similar or equal creditworthiness; (viii) the level of recent trades of similar or comparable securities; (ix) the liquidity characteristics of the security; (x) current market conditions; and (xi) the market value of any securities into which the security is convertible or exchangeable.
The Fund utilizes various methods to measure the fair value of all of its investments on a recurring basis. U.S. GAAP establishes a hierarchy that prioritizes inputs to valuation methods. The three levels of input are:
Level 1 – Unadjusted quoted prices in active markets for identical assets and liabilities that a Fund has the ability to access.
Level 2 – Observable inputs other than quoted prices included in Level 1 that are observable for the asset or liability, either directly or indirectly. These inputs may include quoted prices for the identical instrument in an inactive market, prices for similar instruments, interest rates, prepayment speeds, credit risk, yield curves, default rates and similar data.
Level 3 – Unobservable inputs for the asset or liability, to the extent relevant observable inputs are not available; representing a Fund’s own assumptions about the assumptions a market participant would use in valuing the asset or liability, and would be based on the best information available.
18
| Recurrent MLP & Infrastructure Fund |
| NOTES TO FINANCIAL STATEMENTS (Continued) |
| October 31, 2019 |
The availability of observable inputs can vary from security to security and is affected by a wide variety of factors, including, for example, the type of security, whether the security is new and not yet established in the marketplace, the liquidity of markets, and other characteristics particular to the security. To the extent that valuation is based on models or inputs that are less observable or unobservable in the market, the determination of fair value requires more judgment. Accordingly, the degree of judgment exercised in determining fair value is greatest for instruments categorized in Level 3.
The inputs used to measure fair value may fall into different levels of the fair value hierarchy. In such cases, for disclosure purposes, the level in the fair value hierarchy within which the fair value measurement falls in its entirety, is determined based on the lowest level input that is significant to the fair value measurement in its entirety.
The inputs or methodology used for valuing securities are not necessarily an indication of the risk associated with investing in those securities. The following tables summarize the inputs used as of October 31, 2019 for the Fund’s assets and liabilities measured at fair value:
| Assets * | Level 1 | Level 2 | Level 3 | Total | ||||||||||||
| Common Stocks | $ | 40,154,685 | $ | — | $ | — | $ | 40,154,685 | ||||||||
| MLP & MLP Related Securities | 12,982,354 | — | — | 12,982,354 | ||||||||||||
| Short-Term Investment | 1,396,995 | — | — | 1,396,995 | ||||||||||||
| Total Investments | $ | 54,534,034 | $ | — | $ | — | $ | 54,534,034 | ||||||||
| * | Refer to the Portfolio of Investments for classification. |
The Fund did not hold any Level 3 securities during the year ended October 31, 2019.
Security Transactions and Investment Income – Security transactions are accounted for on trade date basis. Interest income is recognized on an accrual basis. Discounts are accreted and premiums are amortized on securities purchased over the lives of the respective securities. Dividend income is recorded on the ex-dividend date. Realized gains or losses from sales of securities are determined by comparing the identified cost of the security lot sold with the net sales proceeds.
Foreign Currency Translations –The accounting records of the Fund are maintained in U.S. dollars. Investment securities and other assets and liabilities denominated in a foreign currency, and income receipts and expense payments are translated into U.S. dollars using the prevailing exchange rate at the London market close. Purchases and sales of securities are translated into U.S. dollars at the contractual currency rates established at the approximate time of the trade.
Net realized gains and losses on foreign currency transactions represent net gains and losses from currency realized between the trade and settlement dates on securities transactions and the difference between income accrued versus income received. The effects of changes in foreign currency exchange rates on investments in securities are included with the net realized and unrealized gain or loss on investments.
Dividends and Distributions to Shareholders –Dividends from net investment income are declared and distributed quarterly for the Fund. Dividends from net realized capital gains are distributed annually. Dividends from net investment income and distributions from net realized gains are recorded on ex-dividend date and determined in accordance with federal income tax regulations, which may differ from U.S. GAAP. These “book/tax” differences are considered either temporary (i.e., deferred losses, capital loss carry forwards) or permanent in nature. To the extent these differences are permanent in nature, such amounts are reclassified within the composition of net assets based on their federal tax-basis treatment. Temporary differences do not require reclassification.
Federal Income Taxes– It is the Fund’s policy to qualify as a regulated investment company by complying with the provisions of the Internal Revenue Code that are applicable to regulated investment companies and to distribute substantially all of their taxable income and net realized gains to shareholders. Therefore, no federal income tax provision has been recorded.
The Fund recognizes the tax benefits of uncertain tax positions only where the position is “more likely than not” to be sustained assuming examination by tax authorities. Management has analyzed the Fund’s tax positions and has concluded that no liability for unrecognized tax benefits should be recorded related to uncertain tax positions taken on returns filed for
19
| Recurrent MLP & Infrastructure Fund |
| NOTES TO FINANCIAL STATEMENTS (Continued) |
| October 31, 2019 |
open tax year ended October 31, 2018 or expected to be taken in the Fund’s October 31, 2019 year-end tax returns. The Fund identifies its major tax jurisdictions as U.S. Federal, Ohio, and foreign jurisdictions where the Fund makes significant investments. The Fund is not aware of any tax positions for which it is reasonably possible that the total amounts of unrecognized tax benefits will change materially in the next twelve months.
Expenses– Expenses of the Trust that are directly identifiable to a specific fund are charged to that fund. Expenses, which are not readily identifiable to a specific fund, are allocated in such a manner as deemed equitable, taking into consideration the nature and type of expense and the relative sizes of the funds in the Trust.
Indemnification – The Trust indemnifies its officers and Trustees for certain liabilities that may arise from the performance of their duties to the Trust. Additionally, in the normal course of business, the Fund enter into contracts that contain a variety of representations and warranties and which provide general indemnities. The Fund’s maximum exposure under these arrangements is unknown, as this would involve future claims that may be made against the Fund that have not yet occurred. However, the risk of loss due to these warranties and indemnities appears to be remote.
| 3. | INVESTMENT TRANSACTIONS AND ASSOCIATED RISKS |
For the year ended October 31, 2019, the aggregate purchases and sales of investments (excluding short-term investments) was $62,149,813 and $16,046,890, respectively.
Please refer to the Fund’s prospectus and statement of additional information (“SAI”) for a full listing of risks associated with the Fund’s investments. These and other risks are also discussed more fully in the Fund’s prospectus and SAI which include but are not limited to active trading risk, cash flow risk, concentration risk, cybersecurity risk, energy sector focus risk, energy infrastructure industry focus risks (including acquisition risk, catastrophic event risk, commodity price risk, depletion risk, environmental and regulatory risk, interest rate risk, natural resources risk, supply and demand risk, and weather risk), equity risk, gap risk, geographic and sector risk, IPO risk, liquidity risk, leveraging risk, management risk, market capitalization risk, market events risk, market risk, master limited partnership risk, MLP tax risk, non-diversification risk, and RIC qualification risk.
Concentration Risk – Because the Fund may focus on one or more industries or sectors of the economy, its performance depends in large part on the performance of those sectors or industries. As a result, the value of an investment may fluctuate more widely than it would in a fund that is diversified across industries and sectors.
Equity Risk– The Fund is subject to equity risk. The market value of equities, such as common stocks or equity related investments, such as futures and options, may decline due to general market conditions, such as political or macroeconomic factors. Additionally, equities may decline in value due to specific factors affecting a related industry or industries. Equity securities are susceptible volatile increases and decreases in value as market confidence in and perceptions of their issuers change. Each equity security and equity related investments generally have greater market price volatility than fixed income securities.
Market Risk – Overall securities market risk may affect the value of individual instruments in which a Fund invests. Factors such as domestic and foreign economic growth and market conditions, real or perceived adverse economic or political conditions, inflation, changes in interest rate levels, lack of liquidity in the bond market, volatility in the equities market or adverse investor sentiment, affect the securities markets. When the value of the Fund’s investments goes down, your investment in the Fund decreases in value and you could lose money.
Master Limited Partnership Risk – An investment in MLP units involves certain risks which differ from an investment in the securities of a corporation. Holders of MLP units have limited control and voting rights on matters affecting the partnership. In addition, there are certain tax risks associated with an investment in MLP units and conflicts of interest exist between common unit holders of MLPs and the general partner, including those arising from incentive distribution payments.
MLP Tax Risk – Historically, MLPs have been able to offset a significant portion of their taxable income with tax deductions, including depreciation and amortization expense deductions. A change in current tax law, or a change in the business of a given MLP, could result in an MLP being treated as a corporation or other form of taxable entity for U.S. federal income tax purposes, which would result in the MLP being required to pay U.S. federal income tax, excise tax or
20
| Recurrent MLP & Infrastructure Fund |
| NOTES TO FINANCIAL STATEMENTS (Continued) |
| October 31, 2019 |
another form of tax on its taxable income. The classification of an MLP as a corporation or other form of taxable entity for U.S. federal income tax purposes could reduce the amount of cash available for distribution by the MLP and could cause any such distributions received by the MLP Fund to be taxed as dividend income, return of capital, or capital gain. Therefore, if any MLPs owned by the Fund were treated as corporations or other forms of taxable entity for U.S. federal income tax purposes, the after-tax return to a Fund with respect to its investment in such MLPs could be materially reduced which could cause a material decrease in the net asset value per share (“NAV”) of the Fund’s shares.
| 4. | INVESTMENT ADVISORY AGREEMENT AND TRANSACTION WITH RELATED PARTIES |
Recurrent Investment Advisors, LLC serves as the Fund’s investment advisor. Pursuant to an advisory agreement with the Trust on behalf of the Fund, the Advisor, under the oversight of the Board, directs the daily operations of the Fund and supervises the performance of administrative and professional services provided by others. As compensation for its services and the related expenses borne by the Advisor, the Fund pays the Advisor a fee computed and accrued daily paid monthly, based on the Fund’s average daily net assets and is computed at the annual rate of 0.90%. Pursuant to the advisory agreement, the Fund incurred $280,228 in advisory fees for the year ended October 31, 2019. As of October 31, 2019, the amount due to Advisor from the Fund was $32,983.
The Advisor has contractually agreed to reduce the Fund’s fees and/or absorb expenses of the Fund until at least March 1, 2020 to ensure that total annual Fund operating expenses after expense waiver and reimbursement (exclusive of any front-end or contingent deferred loads; brokerage fees and commissions; acquired fund fees and expenses; borrowing costs, such as interest and dividend expenses on securities sold short; taxes; and extraordinary expenses, such as litigation expenses) will not exceed 1.25% of average daily net assets attributable to Class I shares of the Fund. This agreement may be terminated by the Trust’s Board of Trustees on 60 days’ written notice to the advisor. These fee waivers and expense reimbursements are subject to possible recoupment from the Fund in future years on a rolling three year basis (within the three years after the fees have been waived or reimbursed) if such recoupment can be achieved without exceeding the foregoing expense limits as well as any expense limitation that was in effect at the time the reimbursement was made. For the year ended October 31, 2019, the Advisor waived $156,362 in fees and reimbursed expenses for the Fund.
Cumulative expenses previously waived or reimbursed subject to the aforementioned conditions will expire as presented in the table below:
| MLP & Infrastructure Fund | ||||
| 10/31/2021 | $ | 227,498 | ||
| 10/31/2022 | $ | 156,362 | ||
The distributor of the Fund is Northern Lights Distributors, LLC (the “Distributor”), an affiliate of Gemini Fund Services, LLC. The Trust, on behalf of the Fund, has adopted the Trust’s Distribution and Shareholder Servicing Plan pursuant to Rule 12b-1 under the Investment Company Act of 1940 (the “Plan”), as amended, to pay for certain distribution activities and shareholder services. During the year ended October 31, 2019, the Fund did not pay distribution related charges pursuant to the Plan.
In addition, certain affiliates of the Distributor provide services to the Fund as follows:
Gemini Fund Services, LLC (“GFS”)
GFS, an affiliate of the Distributor, provides administration, fund accounting, and transfer agent services to the Trust. Pursuant to separate servicing agreements with GFS, the Fund pays GFS customary fees for providing administration, fund accounting and transfer agency services to the Fund. Certain officers of the Trust are also officers of GFS, and are not paid any fees directly by the Fund for serving in such capacities.
Northern Lights Compliance Services, LLC (“NLCS”)
NLCS, an affiliate of GFS and the Distributor, provides a Chief Compliance Officer to the Trust, as well as related compliance services, pursuant to a consulting agreement between NLCS and the Trust. Under the terms of such agreement, NLCS receives customary fees from the Fund.
21
| Recurrent MLP & Infrastructure Fund |
| NOTES TO FINANCIAL STATEMENTS (Continued) |
| October 31, 2019 |
Blu Giant, LLC (“Blu Giant”), an affiliate of GFS and the Distributor, provides EDGAR conversion and filing services as well as print management services for the Fund on an ad-hoc basis. For the provision of these services, Blu Giant receives customary fees from the Fund.
On February 1, 2019, NorthStar Financial Services Group, LLC, the parent company of Gemini Fund Services, LLC (“GFS”) and its affiliated companies including Northern Lights Distributors, LLC (“NLD”), Northern Lights Compliance Services, LLC (“NLCS”) and Blu Giant, LLC (“Blu Giant”) (collectively, the “Gemini Companies”), sold its interest in the Gemini Companies to a third party private equity firm that contemporaneously acquired Ultimus Fund Solutions, LLC (an independent mutual fund administration firm) and its affiliates (collectively, the “Ultimus Companies”). As a result of these separate transactions, the Gemini Companies and the Ultimus Companies are now indirectly owned through a common parent entity, The Ultimus Group, LLC.
| 5. | AGGREGATE UNREALIZED APPRECIATION AND DEPRECIATION – TAX BASIS |
The identified cost of investments in securities owned by the Fund for federal income tax purposes, and its respective gross unrealized appreciation and depreciation at October 31, 2019, were as follows:
| Gross | Gross | Net Unrealized | ||||||||||||
| Tax | Unrealized | Unrealized | Appreciation/ | |||||||||||
| Cost | Appreciation | Depreciation | (Depreciation) | |||||||||||
| $ | 55,649,231 | $ | 2,725,083 | $ | (3,840,280 | ) | $ | (1,115,197 | ) | |||||
| 6. | DISTRIBUTIONS TO SHAREHOLDERS AND TAX COMPONENTS OF CAPITAL |
The tax character of dividends paid during the period ended October 31, 2019 as a Regulated Investment Company (RIC) effective November 1, 2018 and the C-Corp entity for the period ended October 31, 2018 were as follows:
| Fiscal Year Ended | Fiscal Year Ended | |||||||
| October 31, 2019 | October 31, 2018 | |||||||
| Ordinary Income | $ | 516,268 | $ | — | ||||
| Return of Capital | 2,105,916 | 312,200 | ||||||
| $ | 2,622,184 | $ | 312,200 | |||||
As of October 31, 2019, the components of accumulated earnings/(deficit) on a tax basis were as follows:
| Undistributed | Undistributed | Post October Loss | Capital Loss | Other | Unrealized | Total | ||||||||||||||||||||
| Ordinary | Long-Term | and | Carry | Book/Tax | Appreciation/ | Accumulated | ||||||||||||||||||||
| Income | Gains | Late Year Loss | Forwards | Differences | (Depreciation) | Earnings/(Deficits) | ||||||||||||||||||||
| $ | — | $ | — | $ | — | $ | (64,446 | ) | $ | — | $ | (1,115,144 | ) | $ | (1,179,590 | ) | ||||||||||
The difference between book basis and tax basis unrealized depreciation and undistributed net investment income/loss is primarily attributable to tax adjustments for partnerships and the tax deferral of losses on wash sales.
22
| Recurrent MLP & Infrastructure Fund |
| NOTES TO FINANCIAL STATEMENTS (Continued) |
| October 31, 2019 |
At October 31, 2019, the Fund had capital loss carry forwards (CLCF) for federal income tax purposes available to offset future capital gains (including prior year losses of 127,544 incurred as a C-Corp and carried forward to the Fund), utilized capital loss carryforwards and had capital loss carryforwards subject to expiration as follows:
| Non-Expiring | Non-Expiring | |||||||||||||||||
| Expiring | Short-Term | Long-Term | Total | CLCF Utilized | ||||||||||||||
| $ | — | $ | 53,950 | $ | 10,496 | $ | 64,446 | $ | 63,098 | |||||||||
Permanent book and tax differences, primarily attributable to non deductible expenses, the carryover of tax adjustments from partnerships, wash sales and distributions related to the entity status conversion from a C-Corp to a Regulated Investment Company (RIC) resulted in reclassifications for the Fund for the fiscal year ended October 31, 2019 as follows:
| Paid | ||||||
| In | Accumulated | |||||
| Capital | Losses | |||||
| $ | 48,742 | $ | (48,742 | ) | ||
| 7. | CONTROL OWNERSHIP |
The beneficial ownership, either directly or indirectly, of more than 25% of the voting securities of the Fund creates presumption of control of the Fund, under Section 2(a) 9 of the Act. As of October 31, 2019, Pershing LLC and Charles Schwab & Co., Inc. held approximately 42% and 38% of the voting securities of the Fund, respectively.
| 8. | NEW ACCOUNTING PRONOUNCEMENTS |
In August 2018, the FASB issued Accounting Standards Update (“ASU”) No. 2018-13, which changes certain fair value measurement disclosure requirements. The new ASU, in addition to other modifications and additions, removes the requirement to disclose the amount and reasons for transfers between Level 1 and Level 2 of the fair value hierarchy, and the policy for the timing of transfers between levels. For investment companies, the amendments are effective for financial statements issued for fiscal years beginning after December 15, 2019, and interim periods within those fiscal years. Early adoption is permitted and the Fund has adopted these amendments early.
| 9. | SUBSEQUENT EVENTS |
Subsequent events after the date of the Statements of Assets and Liabilities have been evaluated through the date the financial statements were issued. Management has determined that no events or transactions occurred requiring adjustment or disclosure in the financial statements.
23
Report of Independent Registered Public Accounting Firm
To the Board of Trustees of Two Roads Shared Trust
and the Shareholders of Recurrent MLP & Infrastructure Fund
Opinion on the Financial Statements
We have audited the accompanying statement of assets and liabilities, including the portfolio of investments, of Recurrent MLP & Infrastructure Fund (the Fund) as of October 31, 2019, the related statement of operations for the year then ended, the statements of changes in net assets for the year then ended and the period from November 2, 2017 (commencement of operations) through October 31, 2018, including the related notes, and the financial highlights for the year then ended and period from November 2, 2017 (commencement of operations) through October 31, 2018 (collectively, the financial statements). In our opinion, the financial statements present fairly, in all material respects, the financial position of the Fund as of October 31, 2019, the results of its operations for the year then ended, the changes in its net assets for each of the two years in the period then ended, and the financial highlights for each of the two years in the period then ended, in conformity with accounting principles generally accepted in the United States of America.
Basis for Opinion
These financial statements are the responsibility of the Fund’s management. Our responsibility is to express an opinion on the Fund’s financial statements based on our audit. We are a public accounting firm registered with the Public Company Accounting Oversight Board (United States) (PCAOB) and are required to be independent with respect to the Fund in accordance with U.S. federal securities laws and the applicable rules and regulations of the Securities and Exchange Commission and the PCAOB.
We conducted our audit in accordance with the standards of the PCAOB. Those standards require that we plan and perform the audit to obtain reasonable assurance about whether the financial statements are free of material misstatement, whether due to error or fraud. The Fund is not required to have, nor were we engaged to perform, an audit of its internal control over financial reporting. As part of our audit, we are required to obtain an understanding of internal control over financial reporting but not for the purpose of expressing an opinion on the effectiveness of the Fund’s internal control over financial reporting. Accordingly, we express no such opinion.
Our audit included performing procedures to assess the risks of material misstatement of the financial statements, whether due to error or fraud, and performing procedures that respond to those risks. Such procedures included examining, on a test basis, evidence regarding the amounts and disclosures in the financial statements. Our audit also included evaluating the accounting principles used and significant estimates made by management, as well as evaluating the overall presentation of the financial statements. Our procedures included confirmation of securities owned as of October 31, 2019, by correspondence with the custodians and brokers. We believe that our audit provides a reasonable basis for our opinion.
/s/ RSM US LLP
We have served as the auditor of one or more Recurrent Investment Advisors, LLC advised investment companies since 2017.
Denver, Colorado
December 27, 2019
24
| Recurrent MLP & Infrastructure Fund |
| EXPENSE EXAMPLES (Unaudited) |
| October 31, 2019 |
As a shareholder of the Fund, you incur two types of costs: (1) transaction costs; (2) ongoing costs, including management fees; and other Fund expenses. This example is intended to help you understand your ongoing costs (in dollars) of investing in the Fund and compare these costs with the ongoing costs of investing in other mutual funds.
The example is based on an investment of $1,000 invested at the beginning of the period* and held for the entire period from May 1, 2019 through October 31, 2019.
Actual Expenses
The “Actual Expenses” line in the table below provides information about actual account values and actual expenses. You may use the information below, together with the amount you invested, to estimate the expenses that you paid over the period. Simply divide your account value by $1,000 (for example, an $8,600 account value divided by $1,000 = 8.6), then multiply the result by the number in the table under the heading entitled “Expenses Paid During Period” to estimate the expenses you paid on your account during this period.
Hypothetical Example for Comparison Purposes
The “Hypothetical” line in the table below provides information about hypothetical account values and hypothetical expenses based on the Fund’s actual expense ratio and an assumed rate of return of 5% per year before expenses, which is not the Fund’s actual return. The hypothetical account values and expenses may not be used to estimate the actual ending account balances or expenses you paid for the period. You may use this information to compare this 5% hypothetical example with the 5% hypothetical examples that appear in the shareholder reports of other funds.
Please note that the expenses shown in the table are meant to highlight your ongoing costs only and do not reflect any transactional costs, such as sales loads, or redemption fees. Therefore, the table is useful in comparing ongoing costs only, and will not help you determine the relative total costs of owning different funds. In addition, if these transactional costs were included, your costs would have been higher.
| Hypothetical (5% return before | |||||||||||||
| Actual | expenses) | ||||||||||||
| Fund’s | Beginning | ||||||||||||
| Annualized | Account | Ending | Expenses Paid | Ending | Expenses Paid | ||||||||
| Expense Ratio | Value | Account Value | During Period | Account Value | During Period | ||||||||
| Class I: | |||||||||||||
| Recurrent MLP & Infrastructure Fund* | 1.30% | $1,000.00 | $927.10 | $6.31 | $1,018.65 | $6.61 | |||||||
| * | Expense information is equal to the average account value over the period, multiplied by the Fund’s annualized expense ratio, multiplied by the number of days in the period (184) divided by the number of days in the fiscal year (365). |
25
| Recurrent Natural Resources Fund |
| SUPPLEMENTAL INFORMATION (Unaudited) |
| October 31, 2019 |
Approval of Advisory Agreement – Recurrent MLP & Infrastructure Fund
At a meeting held on June 18 and 19, 2019 (the “Meeting”), the Board of Trustees (the “Board”) of Two Roads Shared Trust (the “Trust”), including all of those trustees who are not “interested persons” of the Trust (as such term is defined in the 1940 Act), which independent Trustees constitute all of the Trustees, considered the re-approval of the investment advisory agreement (the “Advisory Agreement”) between Recurrent Investment Advisors, LLC (“Recurrent” or the “Adviser”) and the Trust, on behalf of the Recurrent MLP & Infrastructure Fund (the “Fund”), a series of the Trust.
In connection with the Board’s consideration of the Advisory Agreement, the Board received written materials in advance of the Meeting, which included information regarding: (i) the nature, extent, and quality of services provided to the Fund by the Adviser; (ii) a description of the Adviser’s investment management personnel; (iii) an overview of the Adviser’s operations and financial condition; (iv) a description of the Adviser’s brokerage practices (including any soft dollar arrangements); (v) a comparison of the Fund’s advisory fee and overall expenses with those of comparable funds; (vi) the level of anticipated profitability from the Adviser’s fund-related operations; (vii) the Adviser’s compliance policies and procedures, including policies and procedures for personal securities transactions, business continuity and information security; and (viii) information regarding the performance record of other funds with similar investment strategies.
Throughout the process, including at the meeting, the Board had numerous opportunities to ask questions of and request additional materials from the Adviser. During the Meeting, the Board was advised by, and met in executive session with, the Board’s independent legal counsel, and received a memorandum from such independent counsel regarding its responsibilities under applicable law. The Board also noted that the evaluation process with respect to the Adviser was an ongoing one and that in this regard, the Board took into account discussions with management and information provided to the Board at prior meetings with respect to the services provided by the Adviser.
Matters considered by the Board in connection with its approval of the Advisory Agreement included, among others, the following:
Nature, Extent and Quality of Services.The Board reviewed materials provided by Recurrent related to the Advisory Agreement with the Trust regarding the Fund, including the Advisory Agreement; a description of the manner in which investment decisions are made and executed; a review of the financial condition of Recurrent; an overview of the personnel that service the Fund and their background and experience; information regarding Recurrent’s risk management processes and liquidity management; Recurrent’s compliance policies and procedures, including its business continuity plans and cybersecurity policies and a Code of Ethics containing provisions reasonably necessary to prevent Access Persons, as that term is defined in Rule 17j-1 under the 1940 Act, from engaging in conduct prohibited by Rule 17j-1(b); a written risk assessment of Recurrent’s compliance program and the use of an outside compliance consultant; information regarding Recurrent’s compliance and regulatory history; and an
26
| Recurrent Natural Resources Fund |
| SUPPLEMENTAL INFORMATION (Unaudited)(Continued) |
| October 31, 2019 |
independent report prepared by Broadridge, an independent third-party data provider, analyzing the performance record, fees and expenses of the Fund as compared to other mutual funds with similar investment strategies. The Board also noted that on a regular basis it received and reviewed information from the Trust’s CCO regarding the Fund’s compliance policies and procedures established pursuant to Rule 38a-1 under the Investment Company Act of 1940, which included evaluating the regulatory compliance systems of Recurrent and procedures reasonably designed to assure compliance with the federal securities laws.
In reaching its conclusions, the Board considered the experience and qualifications of Recurrent’s management team and Recurrent’s commitment to the operation of Recurrent’s compliance program. The Board also considered Recurrent’s policies and procedures in the areas of business continuity and with respect to information systems security and the Trust’s CCO’s review and evaluation of the same, which found them to be satisfactory. The Board considered Recurrent’s current equity ownership structure and the changes made to the Fund over the past fiscal year. The Board also considered the significant risks assumed by the Adviser in connection with the services provided to the Fund, including entrepreneurial risk in sponsoring new funds and ongoing risks including investment, operational, enterprise, litigation, regulatory and compliance risks with respect to the Fund, and also considered the growth of the Fund since the inception of both the Adviser and the Fund. The Board concluded that Recurrent had sufficient quality and depth of personnel, resources, investment methodologies and compliance policies and procedures to perform its duties under the Advisory Agreement and that the nature, overall quality and extent of the management services provided by Recurrent to the Fund were satisfactory.
Performance.Among other data, the Board considered a report prepared by Broadridge, which included the Fund’s performance for the one-year and since-inception periods ended March 31, 2019, as compared to the Fund’s Morningstar category and as compared to a group of funds selected by Broadridge that employ similar investment strategies as the Fund (the “Peer Group”). The Board also considered the Fund’s performance as compared to its benchmark index as included in the Broadridge report.
The Board considered, among other data, that the Fund outperformed the median of the Peer Group and its Morningstar category for the one-year and since inception periods ended March 31, 2019, as well as the benchmark index included in the Morningstar report. The Board further considered Recurrent’s performance on both an absolute and risk-adjusted basis, including with respect to performance volatility. It was noted that the Adviser had taken into consideration the benefits and drawbacks of the C-corp versus RIC tax structure and had taken steps to adjust the Fund’s portfolio in an attempt to minimize its volatility. The Board concluded that the Fund’s overall performance was satisfactory and that Recurrent was capable of obtaining an acceptable level of investment returns for shareholders.
Fees and Expenses. As to the costs of the services to be provided by the Adviser, the Board considered, among other data, a comparison of the Fund’s contractual advisory fee and net operating expense ratio to those of the funds within the Peer Group and to its Morningstar category, as provided by Broadridge. The Board noted that the Adviser’s contractual advisory fee was equal to the median of the Peer Group, and that it was lower than the Peer Group average. The Board
27
| Recurrent Natural Resources Fund |
| SUPPLEMENTAL INFORMATION (Unaudited)(Continued) |
| October 31, 2019 |
also noted that the Fund’s net total expenses after taking into account the Fund’s current expense limitation agreement was equal to the median of the Peer Group. The Board noted that the Adviser had agreed to reimburse expenses to limit net annual operating expenses to 1.25% of the average net assets of the Fund’s Class I shares (exclusive of any front-end or contingent deferred loads; brokerage fees and commissions; acquired fund fees and expenses; borrowing costs (such as interest and dividend expense on securities sold short); taxes; and extraordinary expenses, such as litigation expenses). The Board also took into account the amount of the advisory fee to be retained by Recurrent and the services to be provided, and noted that the Adviser had just recently begun to retain a portion of the advisory fee. The Board concluded that the advisory fee paid to Recurrent was not unreasonable.
Profitability.The Board considered Recurrent’s profitability and whether these profits are excessive in light of the services provided to the Fund. The Board reviewed a profitability analysis prepared by Recurrent based on current asset levels. The Board concluded that because Recurrent’s relationship with the Fund was not currently profitable, profitability was not excessive.
Economies of Scale.The Board considered whether Recurrent would realize economies of scale with respect to its management of the Fund as it grows and whether fee levels reflected these economies of scale for the benefit of shareholders. The Board considered the profitability analysis provided by Recurrent, and noted that while costs of managing the Fund as a percentage of assets under management are expected to decrease as the Fund’s assets continue to grow, at current asset levels, economies of scale had not yet been reached. The Board noted that it would revisit whether economies of scale exist in the future once the Fund has achieved sufficient size.
Other Benefits. The Board also considered the character and amount of any other direct and incidental benefits to be received by Recurrent from its association with the Fund. The Board noted that Recurrent did not believe that it received any direct, indirect or ancillary material “fall-out” benefits from its relationship with the Fund at this time, although noted that potential benefits of scale were possible in the future when the Fund reached the requisite levels of assets under management. The Board considered these potential benefits appeared to be not unreasonable.
Conclusion.The Board, having requested and received such information from Recurrent as it believed reasonably necessary to evaluate the terms of the Advisory Agreement, and having been advised by independent counsel that the Board had appropriately considered and weighed all relevant factors, determined that the renewal of the Advisory Agreement for a subsequent one-year term was in the best interests of the Fund and its shareholders. In considering the Advisory Agreement, the Board did not identify any one factor as all important, and each Independent Trustee may have considered different factors as more important.
28
| Recurrent MLP & Infrastructure Fund |
| SUPPLEMENTAL INFORMATION (Unaudited)(Continued) |
| October 31, 2019 |
Trustees and Officers.The Trustees and officers of the Trust, together with information as to their principal business occupations during the past five years and other information, are shown below. Unless otherwise noted, the address of each Trustee and Officer is 17645 Wright Street, Suite 200, Omaha, NE 68130.
Independent Trustees *
| Name, Address, Year of Birth | Position(s) Held with Registrant | Term and Length Served | Principal Occupation(s) During Past 5 Years | Number of Portfolios Overseen In The Fund Complex** | Other Directorships Held During Past 5 Years |
| Mark Garbin Year of Birth: 1951 | Trustee | Indefinite, Since 2012 | Managing Principal, Coherent Capital Management LLC (since 2008) | 1 | Northern Lights Fund Trust (since 2013); Northern Lights Variable Trust (since 2013); Forethought Variable Insurance Trust (since 2013); OHA Mortgage Strategies Fund (offshore), Ltd. (2014 - 2017); Altegris KKR Commitments Master Fund (since 2014); and OFI Carlyle Tactical Private Credit Fund (since March 2018) |
| Mark D. Gersten Year of Birth: 1950 | Chairman, Trustee | Indefinite, Since 2012 | Independent Consultant (since 2012); Senior Vice President – Global Fund Administration Mutual Funds & Alternative Funds, AllianceBernstein LP (1985 – 2011) | 1 | Northern Lights Fund Trust (since 2013); Northern Lights Variable Trust (since 2013); Altegris KKR Commitments Master Fund (since 2014); previously, Ramius Archview Credit and Distressed Fund (2015-2017); and Schroder Global Series Trust (2012 to 2017) |
| Neil M. Kaufman Year of Birth: 1960 | Trustee, Audit Committee Chairman | Indefinite, Since 2012 | Managing Member, Kaufman & Associates, LLC (legal services)(Since 2016); Partner, Abrams Fensterman, Fensterman, Eisman, Formato, Ferrara & Wolf, LLP (legal services)(2010-2016) | 1 | Altegris KKR Commitments Master Fund (since 2014) |
| Anita K. Krug Year of Birth: 1969 | Trustee | Indefinite, Since 2012 | Dean (since 2019) Chicago Kent Law School; Interim Vice Chancellor for Academic Affairs (2018-2019) University of Washington Bothell; Interim Dean (2017- 2018), Professor (since 2016), Associate Professor (2014-2016); and Assistant Professor (2010-2014), University of Washington School of Law | 1 | Altegris KKR Commitments Master Fund (since 2014); Centerstone Investors Trust (since 2016) |
| * | Information is as of October 31, 2019. |
| ** | As of October 31, 2019, the Trust was comprised of 20 active portfolios managed by seven unaffiliated investment advisers and two affiliated investment advisers. The term “Fund Complex” applies only to those funds that are (i) advised by a common investment adviser or by an investment adviser that is an affiliated person of the investment adviser of any of the other funds of the Trust or (ii) hold themselves out to investors as related companies for purposes of investment and investor services. The Fund does not share the same investment adviser with any other series of the Trust or hold itself out as related to any other series of the Trust for investment purposes. |
10/31/19 – Two Roadsv2
29
| Recurrent MLP & Infrastructure Fund |
| SUPPLEMENTAL INFORMATION (Unaudited)(Continued) |
| October 31, 2019 |
Officers of the Trust*
| Name, Address, Year of Birth | Position(s) Held with Registrant | Principal Occupation(s) During Past 5 Years | Number of Portfolios Overseen In The Fund Complex** | Other Directorships Held During Past 5 Years |
| James Colantino 80 Arkay Drive Hauppauge, NY 11788 Year of Birth: 1969 | President Since Feb. 2017 Treasurer (2012 to 2017) | Senior Vice President (2012-present); Vice President (2004 to 2012); Gemini Fund Services, LLC | N/A | N/A |
| Laura Szalyga 80 Arkay Drive Hauppauge, NY 11788 Year of Birth: 1978 | Treasurer Since Feb. 2017 | Vice President, Gemini Fund Services, LLC (since 2015); Assistant Vice President, Gemini Fund Services, LLC (2011-2014) | N/A | N/A |
| Richard A. Malinowski 80 Arkay Drive Hauppauge, NY 11788 Year of Birth: 1983 | Vice President Since Sep. 2018 Secretary Since 2013 | Senior Vice President (since 2017); Vice President and Counsel (2016-2017) and Assistant Vice President (2012 – 2016), Gemini Fund Services, LLC | N/A | N/A |
| William B. Kimme Year of Birth: 1962 | Chief Compliance Officer Since Inception | Senior Compliance Officer, Northern Lights Compliance Services, LLC (September 2011 - present) | N/A | N/A |
| * | Information is as of October 31, 2019. |
| ** | As of October 31, 2019, the Trust was comprised of 20 active portfolios managed by seven unaffiliated investment advisers and two affiliated investment advisers. The term “Fund Complex” applies only to those funds that are (i) advised by a common investment adviser or by an investment adviser that is an affiliated person of the investment adviser of any of the other funds of the Trust or (ii) hold themselves out to investors as related companies for purposes of investment and investor services. The Fund does not share the same investment adviser with any other series of the Trust or hold itself out as related to any other series of the Trust for investment purposes. |
The Fund’s Statement of Additional Information (“SAI”) includes additional information about the Trustees and is available free of charge, upon request, by calling toll-free at 1-833-732-8773.
10/31/19 – Two Roadsv2
30
| PRIVACY NOTICE | |||||||||
| FACTS | WHAT DOES TWO ROADS SHARED TRUST DO WITH YOUR PERSONAL INFORMATION | ||||||||
| Why? | Financial companies choose how they share your personal information. Federal law gives consumers the right to limit some but not all sharing. Federal law also requires us to tell you how we collect, share, and protect your personal information. Please read this notice carefully to understand what we do. | ||||||||
| What? | THE TYPES OF PERSONAL INFORMATION WE COLLECT AND SHARE DEPENDS ON THE PRODUCT OR SERVICE THAT YOU HAVE WITH US. THIS INFORMATION CAN INCLUDE: | ||||||||
| ● Social Security number and income | |||||||||
| ● Account transactions and transaction history | |||||||||
| ● Investment experience and purchase history | |||||||||
| When you areno longer our customer, we continue to share your information as described in this notice. | |||||||||
| How? | All financial companies need to share customers’ personal information to run their everyday business. In the section below, we list the reasons financial companies can share their customers’ personal information; the reason Two Roads Shared Trust chooses to share and whether you can limit this sharing. | ||||||||
| Reasons we can share your personal information | Does Two Roads Shared Trust share? | Can you limit this sharing? |
| For our everyday business purposes – such as to process your transactions, maintain your account(s), respond to court orders and legal investigations, or report to credit bureaus | YES | NO |
| For our marketing purposes – to offer our products and services to you | NO | We do not share |
| For joint marketing with other financial companies | NO | We do not share |
| For our affiliates’ everyday business purposes – information about your transactions and experiences | NO | We do not share |
| For our affiliates’ everyday business purposes – information about your creditworthiness | NO | We do not share |
| For our affiliates to market to you | NO | We do not share |
| For nonaffiliates to market to you | NO | We do not share |
| Questions? | Call 1-402-895-1600 | |
31
What we do
| How does Two Roads Shared Trust protect my personal information? | To protect your personal information from unauthorized access and use, we use security measures that comply with federal law. These measures include computer safeguards and secured files and buildings.
Our service providers are held accountable for adhering to strict policies and procedures to prevent any misuse of your nonpublic personal information. |
| How does Two Roads Shared Trust collect my personal information? | We collect your personal information, for example, when you |
| ● open an account or give us contact information | |
| ● provide account information or give us your income information | |
| ● make deposits or withdrawals from your account | |
| We also collect your personal information from other companies. | |
| Why can’t I limit all sharing? | Federal law gives you the right to limit only |
| ● sharing for affiliates’ everyday business purposes – information about your creditworthiness | |
| ● affiliates from using your information to market to you | |
| ● sharing for nonaffiliates to market to you | |
| State laws and individual companies may give you additional rights to limit sharing | |
| Definitions | |
| Affiliates | Companies related by common ownership or control. They can be financial and nonfinancial companies. |
| ● Two Roads Shared Trust has no affiliates. | |
| Nonaffiliates | Companies not related by common ownership or control. They can be financial and nonfinancial companies. |
| ● Two Roads Shared Trust does not share with nonaffiliates so they can market to you. | |
| Joint marketing | A formal agreement between nonaffiliates financial companies that together market financial products or services to you. |
| ● Two Roads Shared Trust does not jointly market. | |
32
PROXY VOTING POLICY
Information regarding how the Fund voted proxies relating to portfolio securities for the most recent twelve month period ended June 30 as well as a description of the policies and procedures that the Fund uses to determine how to vote proxies is available without charge, upon request, by calling 1-833-RECURRENT (1-833-732-8773) or by referring to the Securities and Exchange Commission’s (“SEC”) website at http://www.sec.gov.
PORTFOLIO HOLDINGS
The Fund files its complete schedule of portfolio holdings with the SEC for the first and third quarters of each fiscal year on Form N-Q or as an exhibit to its report on Form N-Q’s successor form, Form N-PORT. Form N-Q and Form N-PORT are available on the SEC’s website at http://www.sec.gov. The information on Form N-Q and Form N-PORT are available without charge, upon request, by calling 1-833-RECURRENT (1-833-732-8773).
| INVESTMENT ADVISOR |
| Recurrent Investment Advisors, LLC |
| 3801 Kirby Drive, Suite 654 |
| Houston, TX 77098 |
| ADMINISTRATOR |
| Gemini Fund Services, LLC |
| 17645 Wright Street, Ste. 200 |
| Omaha, NE 68130 |
This report and the financial statements contained herein are submitted for the general information of shareholders and are not authorized for distribution to prospective investors unless preceded or accompanied by an effective prospectus. Nothing contained herein is to be considered an offer of sale or solicitation of an offer to buy shares of the Fund. Such offering is made only by a prospectus, which contains information about the Fund’s investment objective, risks, fees and expenses. Investors are reminded to read the prospectus carefully before investing in the Fund.
ITEM 2. CODE OF ETHICS.
| (a) | The registrant has, as of the end of the period covered by this report, adopted a code of ethics that applies to the registrant's principal executive officer, principal financial officer, and principal accounting officer or controller, or persons performing similar functions, regardless of whether these individuals are employed by the registrant or a third party. |
| (b) | During the period covered by this report, there were no amendments to any provision of the code of ethics. |
| (c) | During the period covered by this report, there were no waivers or implicit waivers of a provision of the code of ethics. |
ITEM 3. AUDIT COMMITTEE FINANCIAL EXPERT.
| The registrant’s Board of Trustees has determined that it does not have an audit committee financial expert serving on its audit committee. At this time, the registrant believes that the experience provided by each member of the audit committee together offer the registrant adequate oversight for the registrant’s level of financial complexity. |
ITEM 4. PRINCIPAL ACCOUNTANT FEES AND SERVICES.
| (a) | Audit Fees. The aggregate fees billed for each of the last two fiscal years for professional services rendered by the registrant's principal accountant for the audit of the registrant's annual financial statements or services that are normally provided by the accountant in connection with statutory and regulatory filings or engagements for those fiscal years are as follows:
2019: $17,500 2018: $17,500 |
| (b) | Audit-Related Fees. There were no fees billed in each of the last two fiscal years for assurances and related services by the principal accountant that are reasonably related to the performance of the audit of the registrant’s financial statements and are not reported under paragraph (a) of this item. |
| (c) | Tax Fees. The aggregate fees billed in each of the last two fiscal years for professional services rendered by the principal accountant for tax compliance are as follows:
2019: $9,500 2018: $0 |
| (d) | All Other Fees. The aggregate fees billed in each of the last two fiscal years for products and services provided by the registrant’s principal accountant, other than the services reported in paragraphs (a) through (c) of this item were $0 and $0 for the fiscal years ended October 31, 2014 and 2013 respectively. |
| (e)(1) | The audit committee does not have pre-approval policies and procedures. Instead, the audit committee or audit committee chairman approves on a case-by-case basis each audit or non-audit service before the principal accountant is engaged by the registrant. |
| (e)(2) | There were no services described in each of paragraphs (b) through (d) of this Item that were approved by the audit committee pursuant to paragraph (c)(7)(i)(C) of Rule 2-01 of Regulation S-X. |
| f) | Not applicable. The percentage of hours expended on the principal accountant's engagement to audit the registrant's financial statements for the most recent fiscal year that were attributed to work performed by persons other than the principal accountant's full-time, permanent employees was zero percent (0%). |
| (g) | All non-audit fees billed by the registrant's principal accountant for services rendered to the registrant for the fiscal years ended October 31, 2015 and 2014 respectively are disclosed in (b)-(d) above. There were no audit or non-audit services performed by the registrant's principal accountant for the registrant's adviser. |
ITEM 5. AUDIT COMMITTEE OF LISTED REGISTRANTS.
Not applicable
ITEM 6. SCHEDULE OF INVESTMENT
Included in annual report to shareholders filed under item 1 of this form.
ITEM 7. DISCLOSURE OF PROXY VOTING POLICIES AND PROCEDURES FOR CLOSED-END MANAGEMENT INVESTMENT COMPANIES.
Not applicable Fund is an open-end management investment company
ITEM 8. PORTFOLIO MANAGERS OF CLOSED-END MANAGEMENT INVESTMENT COMPANIES
Not applicable Fund is an open-end management investment company
ITEM 9. PURCHASES OF EQUITY SECURITIES BY CLOSED-END MANAGEMENT INVESTMENT COMPANY AND AFFILIATED PURCHASERS.
Not applicable Fund is an open-end management investment company
ITEM 10. SUBMISSION OF MATTERS TO A VOTE OF SECURITY HOLDERS.
Not applicable at this time.
ITEM 11. CONTROLS AND PROCEDURES.
| (a) | The registrant's principal executive and principal financial officers, or persons performing similar functions, have concluded that the registrant's disclosure controls and procedures (as defined in Rule 30a-3(c) under the 1940 Act, are effective, as of a date within 90 days of the filing date of this report, based on the evaluation of these controls and procedures required by Rule 30a-3(b) under the 1940 Act and Rule 15d-15(b) under the Securities Exchange Act of 1934, as amended. |
| (b) | There were no changes in the registrant's internal control over financial reporting (as defined in Rule 30a-3(d) under the 1940 Act) that occurred during the period covered by this report that have materially affected, or are reasonably likely to materially affect, the registrant's internal control over financial reporting. |
ITEM 12. EXHIBITS
| (1) | Code of Ethics for Principal Executive and Senior Financial Officers is attached hereto. |
| (2) | Certifications pursuant to Section 302 of the Sarbanes-Oxley Act of 2002 are filed herewith. |
| (3) | Certifications pursuant to Section 906 of the Sarbanes-Oxley Act of 2002 are filed herewith. |
SIGNATURES
Pursuant to the requirements of the Securities Exchange Act of 1934 and the Investment Company Act of 1940, the registrant has duly caused this report to be signed on its behalf by the undersigned, thereunto duly authorized.
Two Roads Shared Trust
| By James Colantino | /s/ James Colantino |
| Principal Executive Officer, | |
| Date: 1/8/2020 | |
Pursuant to the requirements of the Securities Exchange Act of 1934 and the Investment Company Act of 1940, this report has been signed below by the following person on behalf of the registrant and in the capacities and on the date indicated.
| By James Colantino | /s/ James Colantino |
| Principal Executive Officer | |
| Date: 1/8/2020 | |
Pursuant to the requirements of the Securities Exchange Act of 1934 and the Investment Company Act of 1940, this report has been signed below by the following person on behalf of the registrant and in the capacities and on the date indicated.
| By Laura Szalyga | /s/ Laura Szalyga |
| Principal Financial Officer | |
| Date: 1/8/2020 | |