united states
securities and exchange commission
washington, d.c. 20549
form n-csr
certified shareholder report of registered management
investment companies
Investment Company Act file number 811-22718
Two Roads Shared Trust
(Exact name of registrant as specified in charter)
225 Pictoria Drive, Suite 450, Cincinnati, OH 45246
(Address of principal executive offices) (Zip code)
Rich Malinowski, Gemini Fund Services, LLC.
80 Arkay Drive Suite 110, Hauppauge, NY 11788
(Name and address of agent for service)
Registrant's telephone number, including area code: 631-470-2600
Date of fiscal year end: 7/31
Date of reporting period:7/31/19
ITEM 1. REPORTS TO SHAREHOLDERS.
 |
| Hanlon Managed Income Fund |
| Class A | HANAX |
| Class C | HANCX |
| Class I | HANIX |
| Class R | HANRX |
| Hanlon Tactical Dividend and Momentum Fund |
| Class A | HTDAX |
| Class C | HTDCX |
| Class I | HTDIX |
| Class R | HTDRX |
| Annual Report | |
| July 31, 2019 | |
| www.HanlonFunds.com | |
| 1-844-828-3212 | |
| Distributed by Northern Lights Distributors, LLC | |
| Member FINRA | |
| This report and the financial statements contained herein are submitted for the general information of shareholders and are not authorized for distribution to prospective investors unless preceded or accompanied by an effective prospectus. Nothing contained herein is to be considered an offer of sale or solicitation of an offer to buy shares of the Funds. Such offering is made only by a prospectus, which contains information about each Fund’s investment objective, risks, fees and expenses. Investors are reminded to read the Funds’ prospectus carefully before investing in the Funds. | |
Beginning on January 1, 2021, as permitted by regulations adopted by the Securities and Exchange Commission, paper copies of the Funds’ shareholder reports like this one will no longer be sent by mail, unless you specifically request paper copies of the reports. Instead, the reports will be made available on the Funds’ website www.hanlonfunds.com, and you will be notified by mail each time a report is posted and provided with a website link to access the report.
If you already elected to receive shareholder reports electronically, you will not be affected by this change and you need not take any action. You may elect to receive shareholder reports and other communications from the Funds electronically or to continue receiving paper copies of shareholder reports, which are available free of charge, by contacting your financial intermediary (such as a broker-dealer or bank) or, if you are a direct investor, by following the instructions included with paper Fund documents that have been mailed to you.
| Dear Fellow Shareholders, |

| Sean Hanlon, CFP® |
| Chairman, CEO and Co-Chief Investment Officer |
The Hanlon Managed Income Fund’s (“the Fund”) investment strategy attempts to achieve our core tactical mission of providing current income, capital preservation, and positive risk-adjusted returns. The Fund is designed to adjust to changes in market conditions, shifting to cash when we identify signs of potential market downturns. Clients can use the Managed Income Fund to attempt to generate, although there is no guarantee, potentially higher returns than the traditional “40” portion of aggregate bond exposure of the classic “60/40” balanced portfolio.
Thank you,

1
Commentary
Note: The following commentary pertains to the Fund’s semiannual reporting period from February 1, 2019 to July 31, 2019.
Since the US Federal Reserve backed off their auto-pilot approach of steady interest rate increases in January, most fixed income asset classes have delivered attractive returns. The benchmark 10-Year US Treasury yield has defied all expectations, steadily declining well below the 2% threshold in a move that nearly no economist or investor forecasted. The reality has quickly set in that the Trump tax cuts and deregulation have not spurred the anticipated uptick in economic growth and inflation, and with global uncertainty over a range of events from the US-China trade war to the UK Brexit, a global slowdown appears unavoidable.
The question on the table for investors is now whether we are on the brink of a recession. For much of 2018, investors fretted over the prospects of a yield-curve inversion, and we are seeing a partial inversion with the three-month yield at 2.069% and the 10-year yield at 2.015% as of July 31st. Despite this seemingly negative indicator, economic data is not screaming recession. This notion is supported by historically low spreads on high yield bonds, backed by low – and still declining – default rates. Rather, the downward pressure on bond yields may be a byproduct of the consistent lack of inflation, something the Fed is keenly aware of as the data has consistently come in below its 2% target.
As mentioned above, corporate defaults have not increased thus far in 2019, which has pushed spreads on high yield bonds lower. While defaults are highly unlikely to suddenly spike in 2019, there may be limited upside in the asset class – particularly on BB bonds which have outperformed their lower-rated counterparts - as investors have piled back into high yield bonds as they search for income. As of July 31st, the yield on high yield bonds was lower than that of floating-rate bank loans, even though the latter is senior on the credit ladder and less exposed to default risk.
Performance Update
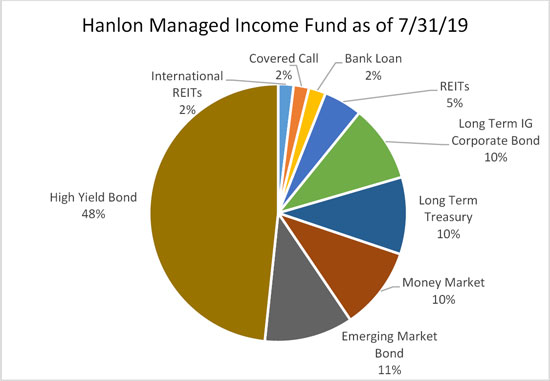
The Hanlon Managed Income Fund invests in a variety of fixed income asset classes, including High Yield Bonds, Bank Loans, International Developed Market Bonds, Emerging Market Bonds, Municipal Bonds, REITs, and Preferred Stocks. In addition, the Fund can also invest in equities, primarily utilizing ETFs focused on high-dividend-paying stocks.
High Yield Bonds represented the largest asset class exposure in the fund during the semiannual period (2/1/19 – 7/31/19), with a 29% allocation at the start of the period. High Yield exposure was scaled up to approximately 40% early in February and then approximately 50% in early March. High Yield positions were exited completely on May 10th in response to a tactical sell signal. On June 10th the signal reversed back to a buy and 50% exposure was maintained for the duration of the semiannual period. The tactical High Yield exit avoided some volatility but ultimately did not add to performance,
2
as during the period from May 10th – June 10th, the Bank of America Merrill Lynch US Master II Index recovered and gained 56 basis points.
30% of the Fund was allocated to a tactical fixed income rotation strategy, which produced positive results. The Fund holds 3 positions at a time, each at a 10% weighting. The Fund held Preferred Stocks, Convertible Bonds, and Emerging Market Bonds within the rotation strategy at the beginning of the period. In early March, Preferred Stocks were sold in favor of Long-Term Treasuries, which has been maintained for the duration of the semiannual period. Since early April, the rotation strategy has called for an allocation to Long Term Investment Grade Corporate Bonds. Both these positions have been solid contributors to the Fund’s performance.
For the annual period from 8/1/18 – 7/31/19 the Fund returned 1.27%. Due to the Fund’s conservative risk profile, it is benchmarked against 3-month Treasury Bills, which returned 2.33% during the same period. As of July 31, 2019, the Fund had the following weightings.
The views in this report are those of the Fund’s management. This report contains certain forward-looking statements about factors that may affect the performance of the Fund in the future. These statements are based on the Fund’s management’s predictions and expectations concerning certain future events such as the performance of the economy as a whole and of specific industry sectors. Management believes these forward-looking statements are reasonable, although they are inherently uncertain and difficult to predict.
1194-NLD-8/27/2019
3
| Dear Fellow Shareholders, |
|
| Sean Hanlon, CFP® |
| Chairman, CEO and Co-Chief Investment Officer |
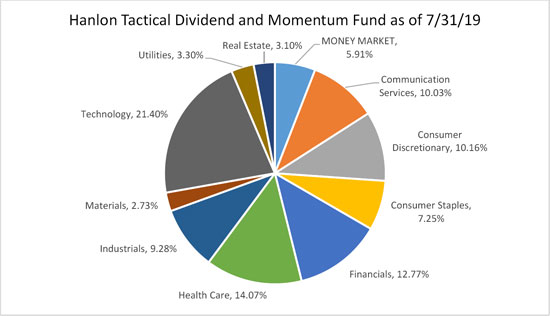
We launched the Hanlon Tactical Dividend and Momentum Fund (“TDM”, “the Fund”) with the goal of protecting our investors from large market drawdowns and providing positive, risk-adjusted returns. The Fund invests in the 11 major equity economic sectors, weighted up to their respective S&P 500 market capitalizations. This approach attempts to closely track the broader equity market during times when the market is steadily advancing. When a given sector displays relative weakness, we will attempt to reduce or eliminate exposure, while remaining in the other sectors. In extreme times, we may exit the markets completely and ride out the volatility in cash or short-term fixed income positions.
Thank you,
4
Commentary
Note: The following commentary pertains to the Fund’s semiannual reporting period from February 1, 2019 to July 31, 2019.
At the beginning of February, US equity markets had recouped some of the damage taken during their steep December plunge, with the S&P 500 index regaining support levels above the 2700 mark. At the time, it was uncertain whether January’s 8% rally marked a V-shaped recovery, or just a temporary respite before another move to the downside. Investors were struggling to gauge the impact of the US-China trade war on global growth, but stronger-than-anticipated earnings data was enough evidence that the selloff was something of an overreaction, and the S&P was able to push ahead 2800, a crucial level marked by a triple-top in the fall of 2018, just before the December selloff.
Since then, US equities have enjoyed a somewhat smooth, steady uptrend, aside from one small pullback in May after an escalation in the trade dispute. The high-flying tech sector, which fell the hardest during the late-2018 selloff, have resumed leadership, gaining roughly 22% during the semiannual period. Energy has been the weakest sector, as oil prices have been locked in the range between $50-$60 per barrel (for US West Texas Intermediate Crude). Healthcare stocks have also struggled for much of the year, as political figures from both sides have taken issue with high prescription drug prices.
For some time now, three factors have been driving equity markets – namely, corporate earnings, the Federal Reserve (the Fed) interest rate policy, and the US-China trade war. At first glance, the first of the two aforementioned factors seem to be supportive for equities. Corporations have managed to continue to grow earnings, albeit slowly, and more importantly have not significantly cut forward guidance for the remainder of the year. While the Fed won’t commit to additional rate cuts, it will most likely continue to accommodate markets with at least one more, and possibly two, rate cuts to close out 2019. However, the trade war remains the wild card, and could drive the other two factors. If the trade war truly spirals out of control, we will see a real impact on corporate earnings, which could lead to a decrease in corporate investment and hiring, along with other economic components that are closely monitored by the Fed.
This trade war uncertainty is difficult to forecast and can change with one tweet. We must trust the underlying earnings and economic data, but also keep a vigilant eye on the geopolitical drama playing out before us. The ability to swiftly execute tactical portfolio changes could be of utmost importance in the coming months if the situation escalates and begins to derail global growth in a meaningful way.
5
Performance Update
The Hanlon Tactical Dividend and Momentum Fund (“TDM”, “the Fund”) began February partially invested in the 11 major US equity sectors. Weightings were scaled up to fully invested mid-February. In early March the Fund exited Energy until early May, at which point Energy was repurchased and Healthcare was sold. Energy, Financials, Real Estate, and Materials were liquidated in mid-May, and by early June the Fund had sold all positions except for Consumer Staples. Signals gradually flipped back to buys in June, and by June 21st the Fund was roughly 94% invested, holding all sectors aside from Energy. The Fund retained this position through the end of the semiannual reporting period (7/31/19).
During the annual period from 8/1/18-7/31/19, the class I shares (ticker HTDIX) returned -2.09%. The tactical trades during the period were ultimately a detractor to performance, as the Fund lagged its benchmark, the S&P 500 Index, which returned 8.10% during the same time period. The Fund tracked S&P 500 closely up until June, at which point the May selloff had triggered sell signals across nearly all sectors. In the June calendar month, the S&P bounced sharply off the lows for a 7.05% gain. The Fund, being mostly in cash, posted a return of just 1.05% during June. From the time Fund re-entered most sectors on June 21st until July 31st, performance was once again comparable to the S&P 500 Index. Therefore, nearly all the underperformance can be traced to the month of June, when the Fund had temporarily gone defensive. This Tactical sell was unfortunate, but the signals functioned as designed, picking up a breakdown in momentum and seeking out defensive positioning. False alarms, in which markets selloff quickly but rebound immediately, are difficult to completely avoid in any Tactical trading system. We remain confident in the validity of the signals and their ability to detect signs of market weakness that may lead to extreme portfolio drawdowns. The Fund’s positioning as of July 31st, 2019 is shown below.
6
Insert 1
The views in this report are those of the Fund’s management. This report contains certain forward-looking statements about factors that may affect the performance of the Fund in the future. These statements are based on the Fund’s management’s predictions and expectations concerning certain future events such as the performance of the economy as a whole and of specific industry sectors. Management believes these forward-looking statements are reasonable, although they are inherently uncertain and difficult to predict.
1195-NLD-8/27/2019
7
| Hanlon Managed Income Fund |
| PORTFOLIO REVIEW (Unaudited) |
| July 31, 2019 |
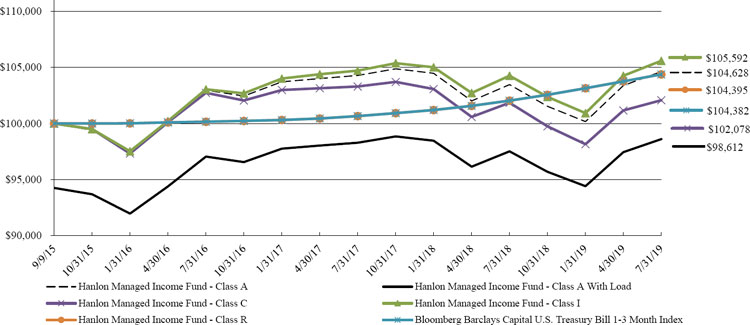
The Fund’s performance figures* for each periods ended July 31, 2019, compared to its benchmark:
| One Year | Since Inception (a) | |
| Hanlon Managed Income Fund - Class A | 1.12% | 1.17% |
| Hanlon Managed Income Fund - Class Awith load | (4.65)% | (0.36)% |
| Hanlon Managed Income Fund - Class C | 0.23% | 0.53% |
| Hanlon Managed Income Fund - Class I | 1.27% | 1.41% |
| Hanlon Managed Income Fund - Class R | 0.86% | 1.11% |
| Bloomberg Barclays Capital U.S. Treasury Bill 1-3 Month Index (b) | 2.30% | 1.11% |
Comparison of the Change in Value of a $100,000 Investment
| * | The performance data quoted is historical.Past performance is no guarantee of future results. Current performance may be higher or lower than the performance data quoted. The principal value and investment return of an investment will fluctuate so that your shares, when redeemed, may be worth more or less than their original cost. The returns shown do not reflect the deduction of taxes that a shareholder would pay on Fund distributions or on the redemptions of Fund shares. Returns greater than 1 year are annualized. The total annual operating expenses as stated in the fee table of the Fund’s prospectus dated November 28, 2018 are 2.07%, 2.82%, 1.82% and 2.22%, for Class A, Class C, Class I and Class R shares, respectively. Hanlon Investment Management, Inc. (the “Advisor”) has contractually agreed to reduce the Fund’s fees and/or absorb expenses of the Fund until at least November 28, 2019 to ensure that total annual Fund operating expenses (exclusive of any front-end or contingent deferred loads; brokerage fees and commissions; expenses of other investment companies in which the Fund may invest (“acquired fund fees and expenses”); borrowing costs, such as interest and dividend expense on securities sold short; taxes; and extraordinary expenses, such as litigation expenses) of the Fund do not exceed 1.70%, 2.45%, 1.45%, and 1.85% of average daily net assets attributable to Class A, Class C, Class I, and Class R shares, respectively. This agreement may be terminated with respect to the Fund by the Board of Trustees on 60 days’ written notice to the Advisor. These expense reimbursements are subject to possible recoupment from the Fund in future years on a rolling three-year basis (within three years after the fees have been waived or reimbursed) if such recoupment can be achieved within the foregoing expense limits. Class A Shares are subject to a maximum sales charge of 5.75% imposed on purchases. Class C shares are subject to a contingent deferred sales charge of 1.00% on redemptions made within one year of purchase. For investments in Class A shares of $1 million or more, there is a contingent deferred sales charge of 1.00% on redemptions made within one year of purchase. For performance information current to the most recent month-end, please call 1-844-828-3212. |
| (a) | Inception date is September 9, 2015. |
| (b) | The Bloomberg Barclays Capital U.S. Treasury Bill 1-3 Month Index includes all publicly issued zero-coupon U.S. Treasury Bills that have a remaining maturity of less than 3 months and more than 1 month, are rated investment grade, and have $250 million or more of outstanding face value. In addition, the securities must be denominated in U.S. dollars and must be fixed rate and non convertible. Unlike a mutual fund, an index does not reflect any trading costs or management fees. Investors cannot directly invest in an index. |
| Portfolio Composition as of July 31, 2019 | ||||
| Holdings By Investment Type | % of Net Assets | |||
| Exchange Traded Funds - Debt | 79.8 | % | ||
| Money Market Fund | 9.0 | % | ||
| Exchange Traded Funds - Equity | 7.2 | % | ||
| Collateral For Securities Loaned | 3.2 | % | ||
| Closed Ended Funds - Debt | 2.2 | % | ||
| REITs | 1.9 | % | ||
| Liabilities In Excess of Other Assets | (3.3 | )% | ||
| 100.0 | % | |||
Please refer to the Portfolio of Investments in this annual report for a detailed listing of the Fund’s holdings.
8
| Hanlon Tactical Dividend and Momentum Fund |
| PORTFOLIO REVIEW (Unaudited) |
| July 31, 2019 |
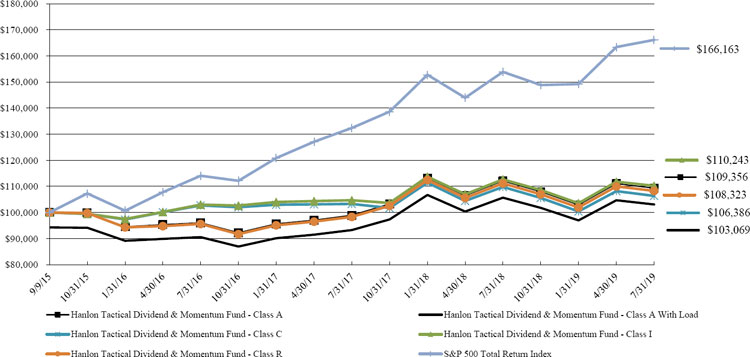
The Fund’s performance figures* for each periods ended July 31, 2019, compared to its benchmark:
| One Year | Since Inception (a) | |
| Hanlon Tactical Dividend and Momentum Fund - Class A | (2.48)% | 2.33% |
| Hanlon Tactical Dividend and Momentum Fund - Class Awith load | (8.08)% | 0.78% |
| Hanlon Tactical Dividend and Momentum Fund - Class C | (3.13)% | 1.60% |
| Hanlon Tactical Dividend and Momentum Fund - Class I | (2.18)% | 2.54% |
| Hanlon Tactical Dividend and Momentum Fund - Class R | (2.55)% | 2.08% |
| S&P 500 Total Return Index (b) | 7.99% | 13.94% |
Comparison of the Change in Value of a $100,000 Investment
| * | The performance data quoted is historical.Past performance is no guarantee of future results. Current performance may be higher or lower than the performance data quoted. The principal value and investment return of an investment will fluctuate so that your shares, when redeemed, may be worth more or less than their original cost. The returns shown do not reflect the deduction of taxes that a shareholder would pay on Fund distributions or on the redemptions of Fund shares. Returns greater than 1 year are annualized. The total annual operating expenses as stated in the fee table of the Fund’s prospectus dated November 28, 2018 are 1.76%, 2.51%, 1.51% and 1.91% for Class A, Class C, Class I and Class R shares, respectively. The Advisor has contractually agreed to reduce the Fund’s fees and/or absorb expenses of the Fund until at least November 28, 2019 to ensure that total annual Fund operating expenses (exclusive of any front-end or contingent deferred loads; brokerage fees and commissions; expenses of other investment companies in which the Fund may invest (“acquired fund fees and expenses”); borrowing costs, such as interest and dividend expense on securities sold short; taxes; and extraordinary expenses, such as litigation expenses) of the Fund do not exceed 1.70%, 2.45%, 1.45%, and 1.85% of average daily net assets attributable to Class A, Class C, Class I, and Class R shares, respectively. This agreement may be terminated with respect to the Fund by the Board of Trustees on 60 days’ written notice to the Advisor. These expense reimbursements are subject to possible recoupment from the Fund in future years on a rolling three-year basis (within three years after the fees have been waived or reimbursed) if such recoupment can be achieved within the foregoing expense limits. Class A shares are subject to a maximum sales charge imposed on purchases of 5.75%. Class C shares are subject to a contingent deferred sales charge of 1.00% on redemptions made within one year of purchase. For investments in Class A shares of $1 million or more, there is a contingent deferred sales charge of 1.00% on redemptions made within one year of purchase. For performance information current to the most recent month-end, please call 1-844-828-3212. |
| (a) | Inception date is September 9, 2015. |
| (b) | The S&P 500 Total Return Index is an unmanaged free-float capitalization-weighted index which measures the performance of 500 large-cap common stocks actively traded in the United States. Unlike a mutual fund, an index does not reflect any trading costs or management fees. Investors cannot directly invest in an index. |
| Portfolio Composition as of July 31, 2019 | ||||
| Holdings By Investment Type | % of Net Assets | |||
| Exchange Traded Funds - Equity | 96.0 | % | ||
| Money Market Fund | 4.2 | % | ||
| Liabilities in Excess of Other Assets | (0.2 | )% | ||
| 100.0 | % | |||
Please refer to the Portfolio of Investments in this annual report for a detailed listing of the Fund’s holdings.
9
| Hanlon Managed Income Fund |
| PORTFOLIO OF INVESTMENTS |
| July 31, 2019 |
| Shares | Fair Value | |||||||
| CLOSED ENDED FUNDS - 2.2% | ||||||||
| DEBT FUNDS - 2.2% | ||||||||
| 75,025 | Eagle Point Credit Co., Inc. ^ | $ | 1,294,932 | |||||
| 20,000 | Highland Income Fund | 270,600 | ||||||
| 134,697 | Nuveen Floating Rate Income Fund ^ | 1,314,643 | ||||||
| TOTAL DEBT FUNDS (Cost - $2,883,058) | 2,880,175 | |||||||
| EXCHANGE TRADED FUNDS - 87.0% | ||||||||
| EQUITY FUNDS - 7.2% | ||||||||
| 119,069 | Global X Nasdaq 100 Covered Call ETF | 2,760,019 | ||||||
| 46,721 | Vanguard Global ex-U.S. Real Estate ETF | 2,699,539 | ||||||
| 47,568 | Vanguard Real Estate ETF | 4,228,320 | ||||||
| TOTAL EQUITY FUNDS (Cost - $9,020,862) | 9,687,878 | |||||||
| DEBT FUNDS - 79.8% | ||||||||
| 196,352 | iShares 0-5 Year High Yield Corporate Bond ETF | 9,144,113 | ||||||
| 100,933 | iShares 20+ Year Treasury Bond ETF ^ | 13,412,986 | ||||||
| 179,170 | iShares iBoxx High Yield Corporate Bond ETF | 15,575,248 | ||||||
| 143,547 | SPDR Bloomberg Barclays High Yield Bond ETF ^ | 15,587,769 | ||||||
| 336,510 | SPDR Bloomberg Barclays Short Term High Yield Bond ETF | 9,136,247 | ||||||
| 41,115 | SPDR DoubleLine Emerging Markets Fixed Income ETF ^ | 2,112,694 | ||||||
| 528,115 | VanEck Vectors Fallen Angel High Yield Bond ETF ^ | 15,505,456 | ||||||
| 372,920 | VanEck Vectors J.P. Morgan EM Local Currency Bond ETF | 12,903,032 | ||||||
| 138,463 | Vanguard Long-Term Corporate Bond ETF | 13,484,912 | ||||||
| TOTAL DEBT FUNDS (Cost - $104,881,492) | 106,862,457 | |||||||
| TOTAL EXCHANGE TRADED FUNDS(Cost - $113,902,354) | 116,550,335 | |||||||
| REIT - 1.9% | ||||||||
| 68,513 | Gaming and Leisure Properties, Inc. | 2,583,625 | ||||||
| TOTAL REITS (Cost - $2,265,946) | ||||||||
| SHORT-TERM INVESTMENTS - 12.2% | ||||||||
| COLLATERAL FOR SECURITIES LOANED - 3.2% | ||||||||
| 383,580 | Dreyfus Government Cash Management, Investor Class 2.18% + (a) | 383,580 | ||||||
| 3,862,400 | Milestone Treasury Obligations Fund, Institutional Class 2.15% + (a)(b) | 3,862,400 | ||||||
| TOTAL COLLATERAL FOR SECURITIES LOANED (Cost - $4,245,980) | 4,245,980 | |||||||
| MONEY MARKET FUND - 9.0% | ||||||||
| 12,026,147 | Morgan Stanley Institutional Liquidity Funds - Treasury Securities Portfolio, Institutional Class, 1.99% + (Cost - $12,026,147) | 12,026,147 | ||||||
| TOTAL SHORT-TERM INVESTMENTS(Cost - $16,272,127) | 16,272,127 | |||||||
| TOTAL INVESTMENTS - 103.3% (Cost - $135,323,485) | $ | 138,286,262 | ||||||
| LIABILITIES IN EXCESS OF OTHER ASSETS - (3.3)% | (4,443,120 | ) | ||||||
| NET ASSETS - 100.0% | $ | 133,843,142 | ||||||
ETF - Exchange Traded Fund
SPDR - Standard & Poor’s Depositary Receipt
| ^ | All or a portion of this security is on loan. The market value of loaned securities is $27,121,113. |
| + | Money market fund; interest rate reflects seven-day effective yield on July 31, 2019. |
| (a) | Security was purchased with cash received as collateral for securities on loan at July 31, 2019. Total collateral had a value of $4,245,980 at July 31, 2019. Additional collateral received from the borrower not disclosed in the Portfolio of Investments had a value of $23,431,383 as of July 31, 2019. |
| (b) | The Milestone Treasury Obligations Fund is managed by CLS Investments, LLC, an affiliate of the Distributor. |
The accompanying notes are an integral part of these financial statements.
10
| Hanlon Tactical Dividend and Momentum Fund |
| PORTFOLIO OF INVESTMENTS |
| July 31, 2019 |
| Shares | Fair Value | |||||||
| EXCHANGE TRADED FUNDS - 96.0% | ||||||||
| EQUITY FUNDS - 96.0% | ||||||||
| 265,108 | Communication Services Select Sector SPDR Fund ^ | $ | 13,462,184 | |||||
| 110,832 | Consumer Discretionary Select Sector SPDR Fund | 13,379,639 | ||||||
| 169,537 | Consumer Staples Select Sector SPDR Fund | 10,075,584 | ||||||
| 603,539 | Financial Select Sector SPDR Fund ^ | 17,049,977 | ||||||
| 199,332 | Health Care Select Sector SPDR Fund | 18,167,118 | ||||||
| 156,058 | Industrial Select Sector SPDR Fund ^ | 12,144,434 | ||||||
| 61,102 | Materials Select Sector SPDR Fund | 3,564,691 | ||||||
| 106,446 | Real Estate Select Sector SPDR Fund | 3,982,145 | ||||||
| 350,804 | Technology Select Sector SPDR Fund ^ | 28,334,439 | ||||||
| 70,707 | Utilities Select Sector SPDR Fund ^ | 4,210,602 | ||||||
| TOTAL EXCHANGE TRADED FUNDS (Cost - $120,487,610) | 124,370,813 | |||||||
| SHORT-TERM INVESTMENTS - 4.2% | ||||||||
| MONEY MARKET FUND - 4.2% | ||||||||
| 5,435,088 | Morgan Stanley Institutional Liquidity Funds - Treasury Securities Portfolio, Institutional Class, 1.99% + | 5,435,088 | ||||||
| TOTAL SHORT-TERM INVESTMENTS (Cost - $5,435,088) | ||||||||
| TOTAL INVESTMENTS - 100.2% (Cost - $125,922,698) | $ | 129,805,901 | ||||||
| LIABILITIES IN EXCESS OF OTHER ASSETS - (0.2)% | (263,611 | ) | ||||||
| NET ASSETS - 100.0% | $ | 129,542,290 | ||||||
ETF - Exchange Traded Fund
SPDR - Standard & Poor’s Depositary Receipt
| ^ | All or a portion of this security is on loan. The market value of loaned securities is $24,085,758. Collateral received from the borrower not disclosed in the Portfolio of Investments had a value of $24,780,110 as of July 31, 2019. |
| + | Money market fund; interest rate reflects seven-day effective yield on July 31, 2019. |
The accompanying notes are an integral part of these financial statements.
11
| Hanlon Funds |
| STATEMENTS OF ASSETS AND LIABILITIES |
| July 31, 2019 |
| Hanlon Managed | Hanlon Tactical | |||||||
| Income Fund | Dividend and Momentum Fund | |||||||
| ASSETS | ||||||||
| Investment securities: | ||||||||
| Investments at cost | $ | 135,323,485 | $ | 125,922,698 | ||||
| Investments at value | $ | 138,286,262 | $ | 129,805,901 | ||||
| Dividends and interest receivable | 74,532 | 11,723 | ||||||
| Receivable for fund shares sold | 13,113 | 20,773 | ||||||
| Securities lending income receivable | 2,743 | 3,417 | ||||||
| Prepaid expenses and other assets | 38,108 | 36,775 | ||||||
| TOTAL ASSETS | 138,414,758 | 129,878,589 | ||||||
| LIABILITIES | ||||||||
| Due to custodian - overdraft | 53 | 69 | ||||||
| Securities lending collateral | 4,245,980 | — | ||||||
| Investment advisory fees payable | 116,824 | 111,395 | ||||||
| Payable for Fund shares repurchased | 103,461 | 128,947 | ||||||
| Payable to related parties | 24,736 | 17,620 | ||||||
| Distribution (12b-1) fees payable | 7,188 | 11,738 | ||||||
| Accrued expenses and other liabilities | 73,374 | 66,530 | ||||||
| TOTAL LIABILITIES | 4,571,616 | 336,299 | ||||||
| NET ASSETS | $ | 133,843,142 | $ | 129,542,290 | ||||
| COMPOSITION OF NET ASSETS: | ||||||||
| Paid in capital | $ | 157,559,498 | $ | 130,320,468 | ||||
| Accumulated losses | (23,716,356 | ) | (778,178 | ) | ||||
| NET ASSETS | $ | 133,843,142 | $ | 129,542,290 | ||||
| NET ASSET VALUE PER SHARE: | ||||||||
| Class A Shares: | ||||||||
| Net Assets | $ | 10,203,745 | $ | 12,037,866 | ||||
| Shares of beneficial interest outstanding ($0 par value, unlimited shares authorized) | 1,110,885 | 1,106,997 | ||||||
| Net asset value (Net Assets ÷ Shares Outstanding) and redemption price per share | $ | 9.19 | $ | 10.87 | ||||
| Maximum offering price per share (net asset value plus maximum sales charge of 5.75%) (a) | $ | 9.75 | $ | 11.53 | ||||
| Class C Shares: | ||||||||
| Net Assets | $ | 1,746,413 | $ | 1,528,671 | ||||
| Shares of beneficial interest outstanding ($0 par value, unlimited shares authorized) | 191,514 | 145,170 | ||||||
| Net asset value (Net Assets ÷ Shares Outstanding), offering price and redemption price per share (b) | $ | 9.12 | $ | 10.53 | ||||
| Class I Shares: | ||||||||
| Net Assets | $ | 111,722,013 | $ | 92,978,221 | ||||
| Shares of beneficial interest outstanding ($0 par value, unlimited shares authorized) | 12,228,844 | 8,656,473 | ||||||
| Net asset value (Net Assets ÷ Shares Outstanding), offering price and redemption price per share | $ | 9.14 | $ | 10.74 | ||||
| Class R Shares: | ||||||||
| Net Assets | $ | 10,170,971 | $ | 22,997,532 | ||||
| Shares of beneficial interest outstanding ($0 par value, unlimited shares authorized) | 1,110,903 | 2,149,037 | ||||||
| Net asset value (Net Assets ÷ Shares Outstanding), offering price and redemption price per share | $ | 9.16 | $ | 10.70 | ||||
| (a) | For investments in Class A shares of $1 million or more, there is a deferred sales charge of 1.00% of the original purchase price on redemptions made within one year of purchase. |
| (b) | Class C shares sold within one year of purchases are subject to a contingent deferred sales charge of 1.00% of the original purchase price. |
The accompanying notes are an integral part of these financial statements.
12
| Hanlon Funds |
| STATEMENTS OF OPERATIONS |
| For the Year Ended July 31, 2019 |
| Hanlon Managed | Hanlon Tactical | |||||||
| Income Fund | Dividend and Momentum Fund | |||||||
| INVESTMENT INCOME | ||||||||
| Dividends (net of foreign tax withheld of $0 and $5,222) | $ | 6,843,985 | $ | 1,795,754 | ||||
| Interest | 546,429 | 598,469 | ||||||
| Securities lending income (net) | 266,327 | 71,273 | ||||||
| TOTAL INVESTMENT INCOME | 7,656,741 | 2,465,496 | ||||||
| EXPENSES | ||||||||
| Investment advisory fees | 1,512,353 | 1,388,538 | ||||||
| Distribution (12b-1) fees: | ||||||||
| Class A | 28,324 | 31,060 | ||||||
| Class C | 23,313 | 17,748 | ||||||
| Class R | 45,333 | 97,599 | ||||||
| Third party administrative servicing fees | 142,643 | 119,370 | ||||||
| Administration fees | 122,605 | 112,778 | ||||||
| Transfer agent fees | 113,339 | 52,339 | ||||||
| Accounting services fees | 54,264 | 53,015 | ||||||
| Registration fees | 51,012 | 49,419 | ||||||
| Custodian fees | 38,741 | 47,423 | ||||||
| Legal fees | 30,000 | 25,999 | ||||||
| Audit fees | 21,199 | 20,699 | ||||||
| Printing and postage expenses | 19,498 | 16,002 | ||||||
| Insurance expense | 16,889 | 13,610 | ||||||
| Compliance officer fees | 15,489 | 15,082 | ||||||
| Trustees’ fees and expenses | 14,001 | 14,001 | ||||||
| Other expenses | 5,001 | 4,500 | ||||||
| TOTAL EXPENSES | 2,254,004 | 2,079,182 | ||||||
| Less: Fees waived by the Administrator | (1,056 | ) | (1,012 | ) | ||||
| NET EXPENSES | 2,252,948 | 2,078,170 | ||||||
| NET INVESTMENT INCOME | 5,403,793 | 387,326 | ||||||
| REALIZED AND UNREALIZED GAIN (LOSS) ON INVESTMENTS | ||||||||
| Net realized gain (loss) from security transactions | (7,087,644 | ) | 10,406,209 | |||||
| Net change in unrealized appreciation (depreciation) on investments | 2,570,432 | (14,672,482 | ) | |||||
| NET REALIZED AND UNREALIZED LOSS ON INVESTMENTS | (4,517,212 | ) | (4,266,273 | ) | ||||
| NET INCREASE (DECREASE) IN NET ASSETS RESULTING FROM OPERATIONS | $ | 886,581 | $ | (3,878,947 | ) | |||
The accompanying notes are an integral part of these financial statements.
13
| Hanlon Managed Income Fund |
| STATEMENTS OF CHANGES IN NET ASSETS |
| For the | For the | |||||||
| Year Ended | Year Ended | |||||||
| July 31, 2019 | July 31, 2018 | |||||||
| FROM OPERATIONS | ||||||||
| Net investment income | $ | 5,403,793 | $ | 9,311,129 | ||||
| Net realized loss from security transactions | (7,087,644 | ) | (8,415,095 | ) | ||||
| Distributions of realized gains from underlying investment companies | — | 5,609 | ||||||
| Net change in unrealized appreciation (depreciation) on investments | 2,570,432 | (2,724,147 | ) | |||||
| Net increase (decrease) in net assets resulting from operations | 886,581 | (1,822,504 | ) | |||||
| DISTRIBUTIONS TO SHAREHOLDERS | ||||||||
| From net investment income: | ||||||||
| Class A | — | (613,430 | ) | |||||
| Class C | — | (89,689 | ) | |||||
| Class I | — | (8,182,181 | ) | |||||
| Class R | — | (426,870 | ) | |||||
| From return of capital: | ||||||||
| Class A | (9,898 | ) | (12 | ) | ||||
| Class C | (1,710 | ) | (3 | ) | ||||
| Class I | (109,577 | ) | (141 | ) | ||||
| Class R | (9,898 | ) | (11 | ) | ||||
| Total distributions paid * | ||||||||
| Class A | (387,940 | ) | — | |||||
| Class C | (66,778 | ) | — | |||||
| Class I | (4,693,521 | ) | — | |||||
| Class R | (379,455 | ) | — | |||||
| Net decrease in net assets resulting from distributions to shareholders | (5,658,777 | ) | (9,312,337 | ) | ||||
| FROM SHARES OF BENEFICIAL INTEREST | ||||||||
| Proceeds from shares sold: | ||||||||
| Class A | 2,034,840 | 2,205,235 | ||||||
| Class C | 155,730 | 2,036,059 | ||||||
| Class I | 9,943,700 | 13,965,208 | ||||||
| Class R | 1,213,566 | 1,389,092 | ||||||
| Net asset value of shares issued in reinvestment of distributions: | ||||||||
| Class A | 336,757 | 484,348 | ||||||
| Class C | 49,823 | 72,102 | ||||||
| Class I | 242,277 | 687,089 | ||||||
| Class R | 389,353 | 426,881 | ||||||
| Payments for shares redeemed: | ||||||||
| Class A | (4,910,936 | ) | (19,393,238 | ) | ||||
| Class C | (1,454,719 | ) | (1,767,002 | ) | ||||
| Class I | (51,037,839 | ) | (189,057,207 | ) | ||||
| Class R | (3,469,820 | ) | (6,717,343 | ) | ||||
| Net decrease in net assets resulting from shares of beneficial interest | (46,507,268 | ) | (195,668,776 | ) | ||||
| TOTAL DECREASE IN NET ASSETS | (51,279,464 | ) | (206,803,617 | ) | ||||
| NET ASSETS | ||||||||
| Beginning of Year | 185,122,606 | 391,926,223 | ||||||
| End of Year ** | $ | 133,843,142 | $ | 185,122,606 | ||||
| SHARE ACTIVITY | ||||||||
| Class A: | ||||||||
| Shares Sold | 223,904 | 230,201 | ||||||
| Shares Reinvested | 37,317 | 50,422 | ||||||
| Shares Redeemed | (537,385 | ) | (2,009,699 | ) | ||||
| Net decrease in shares of beneficial interest outstanding | (276,164 | ) | (1,729,076 | ) | ||||
| Class C: | ||||||||
| Shares Sold | 16,884 | 210,801 | ||||||
| Shares Reinvested | 5,587 | 7,570 | ||||||
| Shares Redeemed | (163,005 | ) | (184,836 | ) | ||||
| Net increase (decrease) in shares of beneficial interest outstanding | (140,534 | ) | 33,535 | |||||
| Class I: | ||||||||
| Shares Sold | 1,097,375 | 1,462,125 | ||||||
| Shares Reinvested | 26,939 | 71,686 | ||||||
| Shares Redeemed | (5,593,773 | ) | (19,735,300 | ) | ||||
| Net decrease in shares of beneficial interest outstanding | (4,469,459 | ) | (18,201,489 | ) | ||||
| Class R: | ||||||||
| Shares Sold | 132,435 | 146,781 | ||||||
| Shares Reinvested | 43,346 | 44,655 | ||||||
| Shares Redeemed | (382,428 | ) | (696,907 | ) | ||||
| Net decrease in shares of beneficial interest outstanding | (206,647 | ) | (505,471 | ) | ||||
| * | Distributions from net investment income and net realized capital gains, if applicable, are combined for the year ended July 31, 2019. See “New Accounting Pronouncements” in the Notes to Financial Statements for more information. The dividends and distributions to shareholders for the year ended July 31, 2018 have not been reclassified to conform to the current year presentation. |
| ** | Net Assets - End of Year includes undistributed net investment income of $0 as of July 31, 2018. |
The accompanying notes are an integral part of these financial statements.
14
| Hanlon Tactical Dividend and Momentum Fund |
| STATEMENTS OF CHANGES IN NET ASSETS |
| For the | For the | |||||||
| Year Ended | Year Ended | |||||||
| July 31, 2019 | July 31, 2018 | |||||||
| FROM OPERATIONS | ||||||||
| Net investment income | $ | 387,326 | $ | 493,948 | ||||
| Net realized gain from security transactions | 10,406,209 | 8,125,199 | ||||||
| Net change in unrealized appreciation (depreciation) on investments | (14,672,482 | ) | 12,928,239 | |||||
| Net increase (decrease) in net assets resulting from operations | (3,878,947 | ) | 21,547,386 | |||||
| DISTRIBUTIONS TO SHAREHOLDERS | ||||||||
| From net investment income: | ||||||||
| Class A | — | (49,326 | ) | |||||
| Class I | — | (772,336 | ) | |||||
| Class R | — | (43,699 | ) | |||||
| From return of capital: | ||||||||
| Class A | (1,701 | ) | (2,061 | ) | ||||
| Class I | — | (13,623 | ) | |||||
| Class R | (14,196 | ) | (3,261 | ) | ||||
| Total distributions paid * | ||||||||
| Class A | (2,201 | ) | — | |||||
| Class I | (330,705 | ) | — | |||||
| Net decrease in net assets resulting from distributions to shareholders | (348,803 | ) | (884,306 | ) | ||||
| FROM SHARES OF BENEFICIAL INTEREST | ||||||||
| Proceeds from shares sold: | ||||||||
| Class A | 1,947,498 | 1,988,947 | ||||||
| Class C | 127,444 | 500,546 | ||||||
| Class I | 9,548,550 | 20,218,365 | ||||||
| Class R | 2,688,517 | 3,123,626 | ||||||
| Net asset value of shares issued in reinvestment of distributions: | ||||||||
| Class A | 3,683 | 48,698 | ||||||
| Class I | 13,568 | 61,470 | ||||||
| Class R | — | 46,960 | ||||||
| Payments for shares redeemed: | ||||||||
| Class A | (3,460,974 | ) | (11,161,854 | ) | ||||
| Class C | (664,012 | ) | (1,676,532 | ) | ||||
| Class I | (23,654,274 | ) | (62,527,690 | ) | ||||
| Class R | (6,069,001 | ) | (13,626,167 | ) | ||||
| Net decrease in net assets resulting from shares of beneficial interest | (19,519,001 | ) | (63,003,631 | ) | ||||
| TOTAL DECREASE IN NET ASSETS | (23,746,751 | ) | (42,340,551 | ) | ||||
| NET ASSETS | ||||||||
| Beginning of Year | 153,289,041 | 195,629,592 | ||||||
| End of Year ** | $ | 129,542,290 | $ | 153,289,041 | ||||
| SHARE ACTIVITY | ||||||||
| Class A: | ||||||||
| Shares Sold | 183,665 | 186,571 | ||||||
| Shares Reinvested | 372 | 4,555 | ||||||
| Shares Redeemed | (321,148 | ) | (1,054,879 | ) | ||||
| Net decrease in shares of beneficial interest outstanding | (137,111 | ) | (863,753 | ) | ||||
| Class C: | ||||||||
| Shares Sold | 12,295 | 49,079 | ||||||
| Shares Redeemed | (63,948 | ) | (162,046 | ) | ||||
| Net decrease in shares of beneficial interest outstanding | (51,653 | ) | (112,967 | ) | ||||
| Class I: | ||||||||
| Shares Sold | 884,200 | 1,902,923 | ||||||
| Shares Reinvested | 1,389 | 5,827 | ||||||
| Shares Redeemed | (2,226,744 | ) | (6,020,441 | ) | ||||
| Net decrease in shares of beneficial interest outstanding | (1,341,155 | ) | (4,111,691 | ) | ||||
| Class R: | ||||||||
| Shares Sold | 251,456 | 298,354 | ||||||
| Shares Reinvested | — | 4,455 | ||||||
| Shares Redeemed | (573,211 | ) | (1,321,378 | ) | ||||
| Net decrease in shares of beneficial interest outstanding | (321,755 | ) | (1,018,569 | ) | ||||
| * | Distributions from net investment income and net realized capital gains, if applicable, are combined for the year ended July 31, 2019. See “New Accounting Pronouncements” in the Notes to Financial Statements for more information. The dividends and distributions to shareholders for the year ended July 31, 2018 have not been reclassified to conform to the current year presentation. |
| ** | Net Assets - End of Year includes undistributed net investment income of $(54,420) as of July 31, 2018. |
The accompanying notes are an integral part of these financial statements.
15
| Hanlon Managed Income Fund |
| FINANCIAL HIGHLIGHTS |
| Per Share Data and Ratios for a Share of Beneficial Interest Outstanding Throughout Each Period |
| Class A | ||||||||||||||||
| Year Ended | Year Ended | Year Ended | Period Ended | |||||||||||||
| July 31, | July 31, | July 31, | July 31, | |||||||||||||
| 2019 | 2018 | 2017 | 2016 (1) | |||||||||||||
| Net asset value, beginning of period | $ | 9.42 | $ | 9.81 | $ | 10.15 | $ | 10.00 | ||||||||
| Activity from investment operations: | ||||||||||||||||
| Net investment income (2) | 0.31 | 0.32 | 0.35 | 0.22 | ||||||||||||
| Net realized and unrealized gain (loss) on investments | (0.22 | ) | (0.40 | ) | (0.21 | ) | 0.07 | |||||||||
| Total from investment operations | 0.09 | (0.08 | ) | 0.14 | 0.29 | |||||||||||
| Less distributions from: | ||||||||||||||||
| Net investment income | (0.31 | ) | (0.31 | ) | (0.36 | ) | (0.14 | ) | ||||||||
| Net realized gains | — | — | (0.12 | ) | — | |||||||||||
| Return of capital | (0.01 | ) | (0.00 | ) (3) | (0.00 | ) (3) | — | |||||||||
| Total distributions | (0.32 | ) | (0.31 | ) | (0.48 | ) | (0.14 | ) | ||||||||
| Net asset value, end of period | $ | 9.19 | $ | 9.42 | $ | 9.81 | $ | 10.15 | ||||||||
| Total return (4) | 1.12 | % (5) | (0.79 | )% | 1.28 | % | 2.97 | % (5) | ||||||||
| Net assets, at end of period (000’s) | $ | 10,204 | $ | 13,072 | $ | 30,566 | $ | 56,249 | ||||||||
| Ratio of expenses to average net assets (6) | 1.68 | % | 1.67 | % | 1.50 | % | 1.40 | % (7) | ||||||||
| Ratio of net investment income to average net assets (8) | 3.35 | % | 3.30 | % | 3.47 | % | 2.54 | % (7) | ||||||||
| Portfolio Turnover Rate | 484 | % | 157 | % | 933 | % | 599 | % (5) | ||||||||
| (1) | The Hanlon Managed Income Fund commenced operations on September 9, 2015. |
| (2) | Per share amounts calculated using the average shares method, which appropriately presents the per share data for the period. |
| (3) | Represents less than $0.005 per share. |
| (4) | Total returns are historical in nature and exclude the effect of applicable sales charges and assumes reinvestment of dividends. |
| (5) | Not annualized. |
| (6) | The ratios of expenses and net investment income to average net assets do not reflect the Fund’s proportionate share of income and expenses of underlying investment companies in which the Fund invests. |
| (7) | Annualized. |
| (8) | Recognition of net investment income by the Fund is affected by the timing and declaration of dividends by the underlying investment companies in which the Fund invests. |
The accompanying notes are an integral part of these financial statements.
16
| Hanlon Managed Income Fund |
| FINANCIAL HIGHLIGHTS |
| Per Share Data and Ratios for a Share of Beneficial Interest Outstanding Throughout Each Period |
| Class C | ||||||||||||||||
| Year Ended | Year Ended | Year Ended | Period Ended | |||||||||||||
| July 31, | July 31, | July 31, | July 31, | |||||||||||||
| 2019 | 2018 | 2017 | 2016 (1) | |||||||||||||
| Net asset value, beginning of period | $ | 9.36 | $ | 9.74 | $ | 10.09 | $ | 10.00 | ||||||||
| Activity from investment operations: | ||||||||||||||||
| Net investment income (2) | 0.25 | 0.23 | 0.26 | 0.22 | ||||||||||||
| Net realized and unrealized gain (loss) on investments | (0.24 | ) | (0.37 | ) | (0.20 | ) | 0.04 | |||||||||
| Total from investment operations | 0.01 | (0.14 | ) | 0.06 | 0.26 | |||||||||||
| Less distributions from: | ||||||||||||||||
| Net investment income | (0.24 | ) | (0.24 | ) | (0.29 | ) | (0.17 | ) | ||||||||
| Net realized gains | — | — | (0.12 | ) | — | |||||||||||
| Return of capital | (0.01 | ) | (0.00 | ) (3) | (0.00 | ) (3) | — | |||||||||
| Total distributions | (0.25 | ) | (0.24 | ) | (0.41 | ) | (0.17 | ) | ||||||||
| Net asset value, end of period | $ | 9.12 | $ | 9.36 | $ | 9.74 | $ | 10.09 | ||||||||
| Total return (4) | 0.23 | % | (1.40 | )% | 0.55 | % | 2.73 | % (5) | ||||||||
| Net assets, at end of period (000’s) | $ | 1,746 | $ | 3,107 | $ | 2,907 | $ | 2,315 | ||||||||
| Ratio of expenses to average net assets (6) | 2.43 | % | 2.42 | % | 2.25 | % | 2.22 | % (7) | ||||||||
| Ratio of net investment income to average net assets (8) | 2.79 | % | 2.38 | % | 2.58 | % | 2.52 | % (7) | ||||||||
| Portfolio Turnover Rate | 484 | % | 157 | % | 933 | % | 599 | % (5) | ||||||||
| (1) | The Hanlon Managed Income Fund commenced operations on September 9, 2015. |
| (2) | Per share amounts calculated using the average shares method, which appropriately presents the per share data for the period. |
| (3) | Represents less than $0.005 per share. |
| (4) | Total returns are historical in nature and exclude the effect of applicable sales charges and assumes reinvestment of dividends. |
| (5) | Not annualized. |
| (6) | The ratios of expenses and net investment income to average net assets do not reflect the Fund’s proportionate share of income and expenses of underlying investment companies in which the Fund invests. |
| (7) | Annualized. |
| (8) | Recognition of net investment income by the Fund is affected by the timing and declaration of dividends by the underlying investment companies in which the Fund invests. |
The accompanying notes are an integral part of these financial statements.
17
| Hanlon Managed Income Fund |
| FINANCIAL HIGHLIGHTS |
| Per Share Data and Ratios for a Share of Beneficial Interest Outstanding Throughout Each Period |
| Class I | ||||||||||||||||
| Year Ended | Year Ended | Year Ended | Period Ended | |||||||||||||
| July 31, | July 31, | July 31, | July 31, | |||||||||||||
| 2019 | 2018 | 2017 | 2016 (1) | |||||||||||||
| Net asset value, beginning of period | $ | 9.38 | $ | 9.76 | $ | 10.10 | $ | 10.00 | ||||||||
| Activity from investment operations: | ||||||||||||||||
| Net investment income (loss) (2) | 0.33 | 0.34 | 0.37 | (0.05 | ) (3) | |||||||||||
| Net realized and unrealized gain (loss) on investments | (0.22 | ) | (0.38 | ) | (0.22 | ) | 0.35 | |||||||||
| Total from investment operations | 0.11 | (0.04 | ) | 0.15 | 0.30 | |||||||||||
| Less distributions from: | ||||||||||||||||
| Net investment income | (0.34 | ) | (0.34 | ) | (0.37 | ) | (0.20 | ) | ||||||||
| Net realized gains | — | — | (0.12 | ) | — | |||||||||||
| Return of capital | (0.01 | ) | (0.00 | ) (4) | (0.00 | ) (4) | — | |||||||||
| Total distributions | (0.35 | ) | (0.34 | ) | (0.49 | ) | (0.20 | ) | ||||||||
| Net asset value, end of period | $ | 9.14 | $ | 9.38 | $ | 9.76 | $ | 10.10 | ||||||||
| Total return (5) | 1.27 | % | (0.43 | )% | 1.61 | % | 3.05 | % (6) | ||||||||
| Net assets, at end of period (000’s) | $ | 111,722 | $ | 156,565 | $ | 340,624 | $ | 500,760 | ||||||||
| Ratio of expenses to average net assets (7) | 1.43 | % | 1.42 | % | 1.25 | % | 1.36 | % (8) | ||||||||
| Ratio of net investment income (loss) to average net assets (9) | 3.64 | % | 3.52 | % | 3.72 | % | (0.48 | )% (3,8) | ||||||||
| Portfolio Turnover Rate | 484 | % | 157 | % | 933 | % | 599 | % (6) | ||||||||
| (1) | The Hanlon Managed Income Fund commenced operations on September 9, 2015. |
| (2) | Per share amounts calculated using the average shares method, which appropriately presents the per share data for the period. |
| (3) | The amount of net investment loss on investment per share for the period ended July 31, 2016 does not accord with the amounts in the Statements of Operations due to the timing of purchases and sales of Fund shares in relation to fluctuating market values. |
| (4) | Represents less than $0.005 per share. |
| (5) | Total returns are historical in nature and exclude the effect of applicable sales charges and assumes reinvestment of dividends. |
| (6) | Not annualized. |
| (7) | The ratios of expenses and net investment income to average net assets do not reflect the Fund’s proportionate share of income and expenses of underlying investment companies in which the Fund invests. |
| (8) | Annualized. |
| (9) | Recognition of net investment income by the Fund is affected by the timing and declaration of dividends by the underlying investment companies in which the Fund invests. |
The accompanying notes are an integral part of these financial statements.
18
| Hanlon Managed Income Fund |
| FINANCIAL HIGHLIGHTS |
| Per Share Data and Ratios for a Share of Beneficial Interest Outstanding Throughout Each Period |
| Class R | ||||||||||||||||
| Year Ended | Year Ended | Year Ended | Period Ended | |||||||||||||
| July 31, | July 31, | July 31, | July 31, | |||||||||||||
| 2019 | 2018 | 2017 | 2016 (1) | |||||||||||||
| Net asset value, beginning of period | $ | 9.40 | $ | 9.78 | $ | 10.12 | $ | 10.00 | ||||||||
| Activity from investment operations: | ||||||||||||||||
| Net investment income (2) | 0.29 | 0.29 | 0.33 | 0.25 | ||||||||||||
| Net realized and unrealized gain (loss) on investments | (0.22 | ) | (0.37 | ) | (0.21 | ) | 0.06 | |||||||||
| Total from investment operations | 0.07 | (0.08 | ) | 0.12 | 0.31 | |||||||||||
| Less distributions from: | ||||||||||||||||
| Net investment income | (0.30 | ) | (0.30 | ) | (0.34 | ) | (0.19 | ) | ||||||||
| Net realized gains | — | — | (0.12 | ) | — | |||||||||||
| Return of capital | (0.01 | ) | (0.00 | ) (3) | (0.00 | ) (3) | — | |||||||||
| Total distributions | (0.31 | ) | (0.30 | ) | (0.46 | ) | (0.19 | ) | ||||||||
| Net asset value, end of period | $ | 9.16 | $ | 9.40 | $ | 9.78 | $ | 10.12 | ||||||||
| Total return (4) | 0.86 | % | (0.82 | )% | 1.13 | % | 3.20 | % (5) | ||||||||
| Net assets, at end of period (000’s) | $ | 10,171 | $ | 12,379 | $ | 17,829 | $ | 30,376 | ||||||||
| Ratio of expenses to average net assets (6) | 1.83 | % | 1.82 | % | 1.65 | % | 1.67 | % (7) | ||||||||
| Ratio of net investment income to average net assets (8) | 3.23 | % | 3.03 | % | 3.36 | % | 2.86 | % (7) | ||||||||
| Portfolio Turnover Rate | 484 | % | 157 | % | 933 | % | 599 | % (5) | ||||||||
| (1) | The Hanlon Managed Income Fund commenced operations on September 9, 2015. |
| (2) | Per share amounts calculated using the average shares method, which appropriately presents the per share data for the period. |
| (3) | Represents less than $0.005 per share. |
| (4) | Total returns are historical in nature and exclude the effect of applicable sales charges and assumes reinvestment of dividends. |
| (5) | Not annualized. |
| (6) | The ratios of expenses and net investment income to average net assets do not reflect the Fund’s proportionate share of income and expenses of underlying investment companies in which the Fund invests. |
| (7) | Annualized. |
| (8) | Recognition of net investment income by the Fund is affected by the timing and declaration of dividends by the underlying investment companies in which the Fund invests. |
The accompanying notes are an integral part of these financial statements.
19
| Hanlon Tactical Dividend and Momentum Fund |
| FINANCIAL HIGHLIGHTS |
| Per Share Data and Ratios for a Share of Beneficial Interest Outstanding Throughout Each Period |
| Class A | ||||||||||||||||
| Year Ended | Year Ended | Year Ended | Period Ended | |||||||||||||
| July 31, | July 31, | July 31, | July 31, | |||||||||||||
| 2019 | 2018 | 2017 | 2016 (1) | |||||||||||||
| Net asset value, beginning of period | $ | 11.15 | $ | 9.87 | $ | 9.58 | $ | 10.00 | ||||||||
| Activity from investment operations: | ||||||||||||||||
| Net investment income (2) | 0.02 | 0.01 | 0.05 | 0.06 | ||||||||||||
| Net realized and unrealized gain (loss) on investments | (0.30 | ) | 1.30 | 0.24 | (0.45 | ) | ||||||||||
| Total from investment operations | (0.28 | ) | 1.31 | 0.29 | (0.39 | ) | ||||||||||
| Less distributions from: | ||||||||||||||||
| Net investment income | (0.00 | ) (3) | (0.03 | ) | — | (0.03 | ) | |||||||||
| Return of capital | (0.00 | ) (3) | (0.00 | ) (3) | — | — | ||||||||||
| Total distributions | (0.00 | ) (3) | (0.03 | ) | — | (0.03 | ) | |||||||||
| Net asset value, end of period | $ | 10.87 | $ | 11.15 | $ | 9.87 | $ | 9.58 | ||||||||
| Total return (4) | (2.48 | )% | 13.28 | % | 3.03 | % | (3.92 | )% (5) | ||||||||
| Net assets, at end of period (000’s) | $ | 12,038 | $ | 13,867 | $ | 20,812 | $ | 53,517 | ||||||||
| Ratio of expenses to average net assets (6) | 1.64 | % | 1.62 | % | 1.53 | % | 1.40 | % (7) | ||||||||
| Ratio of net investment income to average net assets (6,8) | 0.14 | % | 0.13 | % | 0.57 | % | 0.75 | % (7) | ||||||||
| Portfolio Turnover Rate | 226 | % | 48 | % | 384 | % | 579 | % (5) | ||||||||
| (1) | The Hanlon Tactical Dividend & Momentum Fund commenced operations on September 9, 2015. |
| (2) | Per share amounts calculated using the average shares method, which appropriately presents the per share data for the period. |
| (3) | Represents less than $0.005 per share. |
| (4) | Total returns are historical in nature and exclude the effect of applicable sales charges and assumes reinvestment of dividends. |
| (5) | Not annualized. |
| (6) | The ratios of expenses and net investment income to average net assets do not reflect the Fund’s proportionate share of income and expenses of underlying investment companies in which the Fund invests. |
| (7) | Annualized. |
| (8) | Recognition of net investment income by the Fund is affected by the timing and declaration of dividends by the underlying investment companies in which the Fund invests. |
The accompanying notes are an integral part of these financial statements.
20
| Hanlon Tactical Dividend and Momentum Fund |
| FINANCIAL HIGHLIGHTS |
| Per Share Data and Ratios for a Share of Beneficial Interest Outstanding Throughout Each Period |
| Class C | ||||||||||||||||
| Year Ended | Year Ended | Year Ended | Period Ended | |||||||||||||
| July 31, | July 31, | July 31, | July 31, | |||||||||||||
| 2019 | 2018 | 2017 | 2016 (1) | |||||||||||||
| Net asset value, beginning of period | $ | 10.87 | $ | 9.68 | $ | 9.53 | $ | 10.00 | ||||||||
| Activity from investment operations: | ||||||||||||||||
| Net investment loss (2,3) | (0.07 | ) | (0.06 | ) | (0.03 | ) | (0.00 | ) (4) | ||||||||
| Net realized and unrealized gain (loss) on investments | (0.27 | ) | 1.25 | 0.24 | (0.44 | ) | ||||||||||
| Total from investment operations | (0.34 | ) | 1.19 | 0.21 | (0.44 | ) | ||||||||||
| Less distributions from: | ||||||||||||||||
| Net investment income | — | — | (0.06 | ) | (0.03 | ) | ||||||||||
| Total distributions | — | — | (0.06 | ) | (0.03 | ) | ||||||||||
| Net asset value, end of period | $ | 10.53 | $ | 10.87 | $ | 9.68 | $ | 9.53 | ||||||||
| Total return (5) | (3.13 | )% | 12.29 | % | 2.28 | % | (4.38 | )% (6) | ||||||||
| Net assets, at end of period (000’s) | $ | 1,529 | $ | 2,140 | $ | 2,997 | $ | 2,778 | ||||||||
| Ratio of expenses to average net assets (7) | 2.39 | % | 2.37 | % | 2.28 | % | 2.23 | % (8) | ||||||||
| Ratio of net investment loss to average net assets (7,9) | (0.64 | )% | (0.61 | )% | (0.31 | )% | (0.08 | )% (3,8) | ||||||||
| Portfolio Turnover Rate | 226 | % | 48 | % | 384 | % | 579 | % (6) | ||||||||
| (1) | The Hanlon Tactical Dividend & Momentum Fund commenced operations on September 9, 2015. |
| (2) | Per share amounts calculated using the average shares method, which appropriately presents the per share data for the period. |
| (3) | The amount of net investment loss on investment per share for the period ended does not accord with the amounts in the Statements of Operations due to the timing of purchases and sales of Fund shares in relation to fluctuating market values. |
| (4) | Represents less than $0.005 per share. |
| (5) | Total returns are historical in nature and exclude the effect of applicable sales charges and assumes reinvestment of dividends. |
| (6) | Not annualized. |
| (7) | The ratios of expenses and net investment income to average net assets do not reflect the Fund’s proportionate share of income and expenses of underlying investment companies in which the Fund invests. |
| (8) | Annualized. |
| (9) | Recognition of net investment income by the Fund is affected by the timing and declaration of dividends by the underlying investment companies in which the Fund invests. |
The accompanying notes are an integral part of these financial statements.
21
| Hanlon Tactical Dividend and Momentum Fund |
| FINANCIAL HIGHLIGHTS |
| Per Share Data and Ratios for a Share of Beneficial Interest Outstanding Throughout Each Period |
| Class I | ||||||||||||||||
| Year Ended | Year Ended | Year Ended | Period Ended | |||||||||||||
| July 31, | July 31, | July 31, | July 31, | |||||||||||||
| 2019 | 2018 | 2017 | 2016 (1) | |||||||||||||
| Net asset value, beginning of period | $ | 11.02 | $ | 9.77 | $ | 9.58 | $ | 10.00 | ||||||||
| Activity from investment operations: | ||||||||||||||||
| Net investment income (loss) (2) | 0.04 | 0.04 | 0.07 | (0.02 | ) (3) | |||||||||||
| Net realized and unrealized gain (loss) on investments | (0.28 | ) | 1.28 | 0.24 | (0.37 | ) | ||||||||||
| Total from investment operations | (0.24 | ) | 1.32 | 0.31 | (0.39 | ) | ||||||||||
| Less distributions from: | ||||||||||||||||
| Net investment income | (0.04 | ) | (0.07 | ) | (0.12 | ) | (0.03 | ) | ||||||||
| Return of capital | (0.00 | ) (4) | (0.00 | ) (4) | — | — | ||||||||||
| Total distributions | (0.04 | ) | (0.07 | ) | (0.12 | ) | (0.03 | ) | ||||||||
| Net asset value, end of period | $ | 10.74 | $ | 11.02 | $ | 9.77 | $ | 9.58 | ||||||||
| Total return (5) | (2.18 | )% | 13.53 | % | 3.28 | % | (3.88 | )% (6) | ||||||||
| Net assets, at end of period (000’s) | $ | 92,978 | $ | 110,151 | $ | 137,869 | $ | 289,029 | ||||||||
| Ratio of expenses to average net assets (7) | 1.39 | % | 1.37 | % | 1.28 | % | 1.44 | % (8) | ||||||||
| Ratio of net investment income (loss) to average net assets (7,9) | 0.38 | % | 0.39 | % | 0.81 | % | (0.17 | )% (3,8) | ||||||||
| Portfolio Turnover Rate | 226 | % | 48 | % | 384 | % | 579 | % (6) | ||||||||
| (1) | The Hanlon Tactical Dividend & Momentum Fund commenced operations on September 9, 2015. |
| (2) | Per share amounts calculated using the average shares method, which appropriately presents the per share data for the period. |
| (3) | The amount of net investment loss on investment per share for the period ended July 31, 2016 does not accord with the amounts in the Statements of Operations due to the timing of purchases and sales of Fund shares in relation to fluctuating market values. |
| (4) | Represents less than $0.005 per share. |
| (5) | Total returns are historical in nature and exclude the effect of applicable sales charges and assumes reinvestment of dividends. |
| (6) | Not annualized. |
| (7) | The ratios of expenses and net investment income to average net assets do not reflect the Fund’s proportionate share of income and expenses of underlying investment companies in which the Fund invests. |
| (8) | Annualized. |
| (9) | Recognition of net investment income by the Fund is affected by the timing and declaration of dividends by the underlying investment companies in which the Fund invests. |
The accompanying notes are an integral part of these financial statements.
22
| Hanlon Tactical Dividend and Momentum Fund |
| FINANCIAL HIGHLIGHTS |
| Per Share Data and Ratios for a Share of Beneficial Interest Outstanding Throughout Each Period |
| Class R | ||||||||||||||||
| Year Ended | Year Ended | Year Ended | Period Ended | |||||||||||||
| July 31, | July 31, | July 31, | July 31, | |||||||||||||
| 2019 | 2018 | 2017 | 2016 (1) | |||||||||||||
| Net asset value, beginning of period | $ | 10.98 | $ | 9.73 | $ | 9.53 | $ | 10.00 | ||||||||
| Activity from investment operations: | ||||||||||||||||
| Net investment income (loss) (2) | (0.00 | ) (3) | (0.00 | ) (3) | 0.04 | 0.05 | ||||||||||
| Net realized and unrealized gain (loss) on investments | (0.28 | ) | 1.27 | 0.23 | (0.49 | ) | ||||||||||
| Total from investment operations | (0.28 | ) | 1.27 | 0.27 | (0.44 | ) | ||||||||||
| Less distributions from: | ||||||||||||||||
| Net investment income | — | (0.02 | ) | (0.07 | ) | (0.03 | ) | |||||||||
| Return of capital | — | (0.00 | ) (3) | — | — | |||||||||||
| Total distributions | — | (0.02 | ) | (0.07 | ) | (0.03 | ) | |||||||||
| Net asset value, end of period | $ | 10.70 | $ | 10.98 | $ | 9.73 | $ | 9.53 | ||||||||
| Total return (4) | (2.55 | )% | 13.03 | % | 2.85 | % | (4.38 | )% (5) | ||||||||
| Net assets, at end of period (000’s) | $ | 22,998 | $ | 27,131 | $ | 33,952 | $ | 85,499 | ||||||||
| Ratio of expenses to average net assets (6) | 1.79 | % | 1.77 | % | 1.68 | % | 1.66 | % (7) | ||||||||
| Ratio of net investment income (loss) to average net assets (6,8) | (0.01 | )% | (0.03 | )% | 0.45 | % | 0.56 | % (7) | ||||||||
| Portfolio Turnover Rate | 226 | % | 48 | % | 384 | % | 579 | % (5) | ||||||||
| (1) | The Hanlon Tactical Dividend & Momentum Fund commenced operations on September 9, 2015. |
| (2) | Per share amounts calculated using the average shares method, which appropriately presents the per share data for the period. |
| (3) | Represents less than $0.005 per share. |
| (4) | Total returns are historical in nature and exclude the effect of applicable sales charges and assumes reinvestment of dividends. |
| (5) | Not annualized. |
| (6) | The ratios of expenses and net investment income to average net assets do not reflect the Fund’s proportionate share of income and expenses of underlying investment companies in which the Fund invests. |
| (7) | Annualized. |
| (8) | Recognition of net investment income by the Fund is affected by the timing and declaration of dividends by the underlying investment companies in which the Fund invests. |
The accompanying notes are an integral part of these financial statements.
23
| Hanlon Funds |
| NOTES TO FINANCIAL STATEMENTS |
| July 31, 2019 |
| 1. | ORGANIZATION |
The Hanlon Managed Income Fund and the Hanlon Tactical Dividend and Momentum Fund (the “Funds”), are each a series of shares of beneficial interest of the Two Roads Shared Trust (the “Trust”), a statutory trust organized under the laws of the State of Delaware on June 8, 2012, and registered under the Investment Company Act of 1940, as amended (the “1940 Act”), as an open-end management investment company. The Funds commenced operations on September 9, 2015. The investment objective of the Hanlon Managed Income Fund is to provide current income, capital preservation and positive risk-adjusted returns. As of September 9, 2018, the Fund is a diversified fund and must comply with the diversification requirements of Section 5(b)(1) of the 1940 Act. Prior to September 9, 2018, the Fund was non-diversified. The investment objective of the Hanlon Tactical Dividend and Momentum Fund is to provide capital appreciation and current income, and the Fund is diversified.
The Funds each offer Class A, Class C, Class I and Class R shares. Class A shares of each Fund are offered at net asset value plus a maximum sales charge of 5.75%. Class C, Class I and Class R shares of each Fund are offered at net asset value. Investments of more than $1 million in Class A shares of each Fund are subject to a contingent deferred sales charge of 1.00% of the original purchase price on redemptions made within one year of purchase. Class C shares of each fund are subject to a contingent deferred sales charge of 1.00% of the original purchase price on redemptions made within one year of purchase. Each share class represents an interest in the same assets of the Fund and classes are identical except for differences in their fees and ongoing service and distribution charges. All classes of shares have equal voting privileges except that each class has exclusive voting rights with respect to its service and/or distribution plans. Each Fund’s income, expenses (other than class specific distribution fees) and realized and unrealized gains and losses are allocated proportionately each day based upon the relative net assets of each class.
| 2. | SUMMARY OF SIGNIFICANT ACCOUNTING POLICIES |
The following is a summary of significant accounting policies followed by the Funds in preparation of their financial statements. These policies are in conformity with accounting principles generally accepted in the United States of America (“GAAP”). The preparation of financial statements requires management to make estimates and assumptions that affect the reported amounts of assets and liabilities and disclosure of contingent assets and liabilities at the date of the financial statements and the reported amounts of income and expenses for the period. Actual results could differ from those estimates. Each Fund is an investment company and accordingly follows the investment company accounting and reporting guidance of the Financial Accounting Standards Board (“FASB”) Accounting Standard Codification Topic 946 “Financial Services – Investment Companies”.
Security Valuation–Securities listed on an exchange are valued at the last reported sale price at the close of the regular trading session of the primary exchange on the business day the value is being determined, or in the case of securities listed on NASDAQ at the NASDAQ Official Closing Price (“NOCP”). In the absence of a sale such securities shall be valued at the mean between the last bid and ask prices on the day of valuation. Debt securities, including U.S. government obligation (other than short-term obligations) are valued each day by an independent pricing service approved by the Trust’s Board of Trustees (the “Board”) based on methods which include consideration of: yields or prices of securities of comparable quality, coupon, maturity and type, indications as to values from dealers, and general market conditions or market quotations from a major market maker in the securities. Short-term debt obligations having 60 days or less remaining until maturity, at time of purchase, may be valued at amortized cost. Investments in open-end investment companies are valued at net asset value.
The Funds may hold securities, such as private investments, interests in commodity pools, other non-traded securities or temporarily illiquid securities, for which market quotations are not readily available or are determined to be unreliable. These securities will be valued using the “fair value” procedures approved by the Board. The Board has delegated execution of these procedures to a fair value team composed of one or more representatives from each of the (i) Trust, (ii) administrator, and (iii) advisor. The team may also enlist third party consultants such as a valuation specialist at a public accounting firm, valuation consultant or financial officer of a security issuer on an as-needed basis to assist in determining a security-specific fair value. The Board has also engaged a third party valuation firm to, as needed, attend valuation meetings held by the Trust, review minutes of such meetings and report to the Board on a quarterly basis. The Board reviews and ratifies the execution of this process and the resultant fair value prices at least quarterly to assure the process produces reliable results.
Valuation of Underlying Funds–The Funds may invest in portfolios of open-end or closed-end investment companies (the “Underlying Funds”). The Underlying Funds value securities in their portfolios for which market quotations are readily available at their market values (generally the last reported sale price) and all other securities and assets at their fair value to the methods established by the board of directors of the Underlying Funds.
24
| Hanlon Funds |
| NOTES TO FINANCIAL STATEMENTS (Continued) |
| July 31, 2019 |
Open-ended funds are valued at their respective net asset values as reported by such investment companies. The shares of many closed-end investment companies, after their initial public offering, frequently trade at a price per share, which is different than the net asset value per share. The difference represents a market premium or market discount of such shares. There can be no assurances that the market discount or market premium on shares of any closed-end investment company purchased by a Fund will not change.
Exchange Traded Funds–The Funds may invest in exchange traded funds (“ETFs”). ETFs are a type of index fund bought and sold on a securities exchange. An ETF trades like common stock and represents a fixed portfolio of securities designed to track the performance and dividend yield of a particular domestic or foreign market index. The Funds may purchase an ETF to gain exposure to a portion of the U.S. or a foreign market. The risks of owning an ETF generally reflect the risks of owning the underlying securities they are designed to track, although the lack of liquidity on an ETF could result in it being more volatile. Additionally, ETFs have fees and expenses that reduce their value.
Fair Valuation Process–The applicable investments are valued collectively via inputs from each group within the fair value team. For example, fair value determinations are required for the following securities: (i) securities for which market quotations are insufficient or not readily available on a particular business day (including securities for which there is a short and temporary lapse in the provision of a price by the regular pricing source); (ii) securities for which, in the judgment of the advisor, the prices or values available do not represent the fair value of the instrument; factors which may cause the advisor to make such a judgment include, but are not limited to, the following: only a bid price or an asked price is available; the spread between bid and asked prices is substantial; the frequency of sales; the thinness of the market; the size of reported trades; and actions of the securities markets, such as the suspension or limitation of trading; (iii) securities determined to be illiquid; and (iv) securities with respect to which an event that will affect the value thereof has occurred (a “significant event”) since the closing prices were established on the principal exchange on which they are traded, but prior to a Fund’s calculation of its net asset value. Specifically, interests in commodity pools or managed futures pools are valued on a daily basis by reference to the closing market prices of each futures contract or other asset held by a pool, as adjusted for pool expenses. Restricted or illiquid securities, such as private investments or non-traded securities are valued via inputs from the advisor based upon the current bid for the security from two or more independent dealers or other parties reasonably familiar with the facts and circumstances of the security (who should take into consideration all relevant factors as may be appropriate under the circumstances). If the advisor is unable to obtain a current bid from such independent dealers or other independent parties, the fair value team shall determine the fair value of such security using the following factors: (i) the type of security; (ii) the cost at date of purchase; (iii) the size and nature of the Fund’s holdings; (iv) the discount from market value of unrestricted securities of the same class at the time of purchase and subsequent thereto; (v) information as to any transactions or offers with respect to the security; (vi) the nature and duration of restrictions on disposition of the security and the existence of any registration rights; (vii) how the yield of the security compares to similar securities of companies of similar or equal creditworthiness; (viii) the level of recent trades of similar or comparable securities; (ix) the liquidity characteristics of the security; (x) current market conditions; and (xi) the market value of any securities into which the security is convertible or exchangeable.
The Funds utilize various methods to measure the fair value of all of each Fund’s investments on a recurring basis. GAAP establishes a hierarchy that prioritizes inputs to valuation methods. The three levels of input are:
Level 1–Unadjusted quoted prices in active markets for identical assets and liabilities that the Funds have the ability to access.
Level 2–Observable inputs other than quoted prices included in Level 1 that are observable for the asset or liability, either directly or indirectly. These inputs may include quoted prices for the identical instrument on an inactive market, prices for similar instruments, interest rates, prepayment speeds, credit risk, yield curves, default rates and similar data.
Level 3–Unobservable inputs for the asset or liability, to the extent relevant observable inputs are not available, representing the Funds’ own assumptions about the assumptions a market participant would use in valuing the asset or liability, and would be based on the best information available.
The availability of observable inputs can vary from security to security and is affected by a wide variety of factors, including, for example, the type of security, whether the security is new and not yet established in the marketplace, the liquidity of markets, and other characteristics particular to the security. To the extent that valuation is based on models or inputs that are less observable or unobservable in the market, the determination of fair value requires more judgment. Accordingly, the degree of judgment exercised in determining fair value is greatest for instruments categorized in Level 3.
The inputs used to measure fair value may fall into different levels of the fair value hierarchy. In such cases, for disclosure purposes, the level in the fair value hierarchy within which the fair value measurement falls in its entirety, is determined based on the lowest level input that is significant to the fair value measurement in its entirety.
25
| Hanlon Funds |
| NOTES TO FINANCIAL STATEMENTS (Continued) |
| July 31, 2019 |
The inputs or methodology used for valuing securities are not necessarily an indication of the risk associated with investing in those securities. The following tables summarize the inputs used as of July 31, 2019 for the Funds’ assets and liabilities measured at fair value:
Hanlon Managed Income Fund
| Assets * | Level 1 | Level 2 | Level 3 | Total | ||||||||||||
| Closed Ended Funds | $ | 2,880,175 | $ | — | $ | — | $ | 2,880,175 | ||||||||
| Exchange Traded Funds | 116,550,335 | — | — | 116,550,335 | ||||||||||||
| REIT | 2,583,625 | — | — | 2,583,625 | ||||||||||||
| Short-Term Investments | 16,272,127 | — | — | 16,272,127 | ||||||||||||
| Total | $ | 138,286,262 | $ | — | $ | — | $ | 138,286,262 | ||||||||
Hanlon Tactical Dividend and Momentum Fund
| Assets * | Level 1 | Level 2 | Level 3 | Total | ||||||||||||
| Exchange Traded Funds | $ | 124,370,813 | $ | — | $ | — | $ | 124,370,813 | ||||||||
| Short-Term Investments | 5,435,088 | — | — | 5,435,088 | ||||||||||||
| Total | $ | 129,805,901 | $ | — | $ | — | $ | 129,805,901 | ||||||||
The Funds did not hold any Level 2 or Level 3 securities during the period.
There were no transfers into or out of Level 1 and Level 2 during the period. It is the Funds’ policy to recognize transfers into or out of any Level at the end of the reporting period.
| * | Refer to the Portfolio of Investments for industry classification. |
Security Transactions and Related Income – Security transactions are accounted for on trade date basis. Interest income is recognized on an accrual basis. Discounts are accreted and premiums are amortized on securities purchased over the lives of the respective securities. Dividend income is recorded on the ex-dividend date. Realized gains or losses from sales of securities are determined by comparing the identified cost of the security lot sold with the net sales proceeds.
Dividends and Distributions to Shareholders– For the Hanlon Managed Income Fund, dividends from net investment income are declared and distributed monthly, and annually for the Hanlon Tactical Dividend and Momentum Fund. Distributable net realized capital gains are declared and distributed annually. Dividends from net investment income and distributions from net realized gains are recorded on ex dividend date and determined in accordance with federal income tax regulations, which may differ from GAAP. These “book/tax” differences are considered either temporary (i.e., deferred losses, capital loss carry forwards) or permanent in nature. To the extent these differences are permanent in nature, such amounts are reclassified within the composition of net assets based on their federal tax-basis treatment; temporary differences do not require reclassification.
Federal Income Taxes– It is the Funds’ policy to qualify as a regulated investment company by complying with the provisions of the Internal Revenue Code that are applicable to regulated investment companies and to distribute substantially all of its taxable income and net realized gains to shareholders. Therefore, no federal income tax provision is required.
The Funds recognize the tax benefits of uncertain tax positions only where the position is “more likely than not” to be sustained assuming examination by tax authorities. Management has analyzed the Funds’ tax positions and has concluded that no liability for unrecognized tax benefits should be recorded related to uncertain tax positions taken on returns filed for open tax years ended 2016 - 2018, or expected to be taken in the Funds’ July 31, 2019 tax return. Each Fund identifies its major tax jurisdictions as U.S. Federal and Ohio, and foreign jurisdictions where a Fund makes significant investments. The Funds are not aware of any tax positions for which it is reasonably possible that the total amounts of unrecognized tax benefits will change materially in the next twelve months.
Expenses– Expenses of the Trust that are directly identifiable to a specific fund are charged to that fund. Expenses, which are not readily identifiable to a specific fund, are allocated in such a manner as deemed equitable, taking into consideration the nature and type of expense and the relative sizes of the funds in the Trust.
26
| Hanlon Funds |
| NOTES TO FINANCIAL STATEMENTS (Continued) |
| July 31, 2019 |
Indemnification– The Trust indemnifies its officers and trustees for certain liabilities that may arise from the performance of their duties to the Trust. Additionally, in the normal course of business, the Funds enter into contracts that contain a variety of representations and warranties and which provide general indemnities. The Funds’ maximum exposure under these arrangements is unknown, as this would involve future claims that may be made against a Fund that have not yet occurred. However, the Funds expect the risk of loss due to these warranties and indemnities to be remote.
Investment Risk – The Fund’s investments expose the funds to various risks, certain of which are discussed below. Please refer to each Fund’s prospectus and statement of additional information (“SAI”) for a full listing of risks associated with each Fund’s investments. These risks include but are not limited to cash positions risk, cybersecurity risk, emerging markets risk, equity risk, fixed income securities risk, foreign (non-U.S. ) investment risk, hedging transactions risk, high-yield risk, investment companies and ETFs risk, issuer-specific risk, leveraging risk, large capitalization risk, management risk, market events risk, market risk, portfolio turnover risk, real estate securities risk, REIT risk, rules-based strategy risk, sector risk, small number of holdings risk, securities lending risk, short sales risk, and technology securities risk.
Equity Risk– Equity securities are susceptible to general market fluctuations and volatile increases and decreases in value as market confidence in and perceptions of their issuers change.
Fixed Income Securities Risk– The Hanlon Managed Income Fund is subject to fixed income securities risk. When the Fund invests directly or indirectly in fixed income securities, the value of an investment in the Fund will fluctuate with changes in interest rates. Typically, a rise in interest rates causes a decline in the value of fixed income securities. In general, the market price of fixed income securities with longer maturities will increase or decrease more in response to changes in interest rates than shorter-term securities. Other risk factors include credit risk (the debtor may default) and prepayment risk (the debtor may pay its obligation early, reducing the amount of interest payments). These risks could affect the value of a particular investment by the Fund, possibly causing the Fund’s share price and total return to be reduced and fluctuate more than other types of investments.
Cash Positions Risk– A Fund may hold a significant position in cash and/or cash equivalent securities. When a Fund’s investment in cash or cash equivalent securities increases, the Fund may not participate in market advances or declines to the same extent that it would if the Fund were more fully invested.
Investment Companies and ETFs Risk– When a Fund invests in other investment companies, including ETFs, it will bear additional expense based upon its pro rata share of the other investment company’s or ETF’s operating expense, including the potential duplication of management fees. The risk of owning an investment company or ETF generally reflects the risks of owning the underlying investments the investment company or ETF holds. A Fund also will incur brokerage costs when it purchases and sells ETFs.
Securities Lending Risk– A Fund may lend portfolio securities to institutions, such as banks and certain broker-dealers. A Fund may experience a loss or delay in the recovery of its securities if the borrowing institution breaches its agreement with the Fund.
| 3. | INVESTMENT TRANSACTIONS |
The cost of purchases and proceeds from the sale of securities, other than short-term investments, for the year ended July 31, 2019 amounted to $616,804,222 and $649,968,603, respectively, for the Hanlon Managed Income Fund and $261,084,089 and $285,240,874, respectively, for the Hanlon Tactical Dividend and Momentum Fund.
| 4. | INVESTMENT ADVISORY AGREEMENT AND TRANSACTIONS WITH RELATED PARTIES |
Hanlon Investment Management, Inc. serves as the Funds’ Investment Advisor (the “Advisor”). Pursuant to an Investment Advisory Agreement with the Funds, the Advisor, under the oversight of the Board, directs the daily operations of the Funds and supervises the performance of administrative and professional services provided by others. As compensation for its services and the related expenses borne by the Advisor, the Funds pay the Advisor an investment advisory fee, computed and accrued daily and paid monthly, at an annual rate of 1.00% of each Funds’ average daily net assets. For the year ended July 31, 2019 the Advisor earned advisory fees of $1,512,353 and $1,388,538 for the Hanlon Managed Income Fund and the Hanlon Tactical Dividend and Momentum Fund, respectively.
27
| Hanlon Funds |
| NOTES TO FINANCIAL STATEMENTS (Continued) |
| July 31, 2019 |
The Advisor has contractually agreed to reduce its fees and/or absorb expenses of the Funds (the “Waiver Agreement”), until at least November 28, 2019, to ensure that total annual operating expenses of each Fund after fee waiver and/or reimbursement (exclusive of any front-end or contingent deferred loads; brokerage fees and commissions; expenses of other investment companies in which a Fund may invest (“acquired fund fees and expenses”); borrowing costs, such as interest and dividend expense on securities sold short; taxes; and extraordinary expenses, such as litigation expenses) will not exceed 1.70%, 2.45%, 1.45% and 1.85% of each Funds’ average daily net assets for Class A, Class C, Class I and Class R shares, respectively. This Waiver Agreement may be terminated with respect to a Fund by the Board of Trustees on 60 days’ written notice to the Advisor. These expense reimbursements are subject to possible recoupment from a Fund in future years on a rolling three-year basis (within three years after the fees have been waived or reimbursed) if such recoupment can be achieved within the foregoing expense limits. No reimbursement will be paid to the Advisor in any fiscal quarter unless the Board has determined in advance that a reimbursement is in the best interest of a Fund and its shareholders. For the year ended July 31, 2019 the Advisor did not waive any fees for the Hanlon Managed Income Fund and the Hanlon Tactical Dividend and Momentum Fund.
Distributor – The distributor of the Funds is Northern Lights Distributors, LLC (the “Distributor”). The Board has adopted, on behalf of the Funds, the Trust’s Master Distribution and Shareholder Servicing Plans for Class A, Class C, and Class R shares (the “Plans”), as amended, pursuant to Rule 12b-1 under the 1940 Act, to pay for certain distribution activities and shareholder services. Under the Plans, the Funds may pay 0.25% per year of the average daily net assets of Class A shares, 1.00% of the average daily net assets for Class C shares and 0.40% of the average daily net assets for Class R shares for such distribution and shareholder service activities. For the fiscal year ended July 31, 2019, the Hanlon Managed Income Fund incurred distribution fees of $28,324, $23,313 and $45,333 for Class A, Class C and Class R shares, respectively. For the year ended July 31, 2019 the Hanlon Tactical Dividend and Momentum Fund incurred distribution fees of $31,060, $17,748 and $97,599 for Class A, Class C and Class R shares, respectively.
The Distributor acts as the Funds’ principal underwriter in a continuous public offering of the Funds’ shares. During the year ended July 31, 2019, the Distributor received $0 and $1,774 in underwriting commissions for sales of Class A and Class C shares, respectively, of the Hanlon Managed Income Fund, of which $0 and $216 was retained by the principal underwriter for Class A and Class C shares, respectively. During the year ended July 31, 2019, the Distributor received $505 and $1,557 in underwriting commissions for sales of Class A and Class C shares, respectively, of the Hanlon Tactical Dividend and Momentum Fund, of which $65 and $789 for Class A and Class C shares, respectively, was retained by the principal underwriter.
In addition, certain affiliates of the Distributor provide services to the Funds as follows:
Gemini Fund Services, LLC (“GFS”)– GFS, an affiliate of the Distributor, provides administration, fund accounting, and transfer agent services to the Trust. Pursuant to separate servicing agreements with GFS, each Fund pays GFS customary fees for providing administration, fund accounting and transfer agency services to the Fund. Certain officers of the Trust are also officers of GFS, and are not paid any fees directly by the Funds for serving in such capacities. During the year ended July 31, 2019 GFS waived fees in the amount of $1,056 and $1,012 for the Hanlon Managed Income Fund and the Hanlon Tactical Dividend and Momentum Fund respectively.
Northern Lights Compliance Services, LLC (“NLCS”)– NLCS, an affiliate of GFS and the Distributor, provides a Chief Compliance Officer to the Trust, as well as related compliance services, pursuant to a consulting agreement between NLCS and the Trust. Under the terms of such agreement, NLCS receives customary fees from the Funds.
BluGiant, LLC (“BluGiant”),an affiliate of GFS and the Distributor, provides EDGAR conversion and filing services as well as print management services for the Funds on an ad-hoc basis. For the provision of these services, BluGiant receives customary fees from the Funds.
Effective February 1, 2019, NorthStar Financial Services Group, LLC, the parent company of GFS and its affiliated companies including NLD, NLCS and Blu Giant (collectively, the “Gemini Companies”), sold its interest in the Gemini Companies to a third party private equity firm that contemporaneously acquired Ultimus Fund Solutions, LLC (an independent mutual fund administration firm) and its affiliates (collectively, the “Ultimus Companies”). As a result of these separate transactions, the Gemini Companies and the Ultimus Companies are now indirectly owned through a common parent entity, The Ultimus Group, LLC.
28
| Hanlon Funds |
| NOTES TO FINANCIAL STATEMENTS (Continued) |
| July 31, 2019 |
| 5. | AGGREGATE UNREALIZED APPRECIATION AND DEPRECIATION – TAX BASIS |
| Gross | Gross | Net Unrealized | ||||||||||||||
| Tax | Unrealized | Unrealized | Appreciation | |||||||||||||
| Fund | Cost | Appreciation | Depreciation | (Depreciation) | ||||||||||||
| Hanlon Managed Income Fund | $ | 135,323,485 | $ | 3,109,467 | $ | (146,690 | ) | $ | 2,962,777 | |||||||
| Hanlon Tactical Dividend and Momentum Fund | $ | 126,413,431 | $ | 4,019,706 | $ | (627,236 | ) | $ | 3,392,470 | |||||||
| 6. | DISTRIBUTIONS TO SHAREHOLDERS AND TAX COMPONENTS OF CAPITAL |
The tax character of distributions paid for the periods ended July 31, 2019 and July 31, 2018 was as follows:
| For the period ended July 31, 2019: | ||||||||||||||||
| Ordinary | Long-Term | Return | ||||||||||||||
| Portfolio | Income | Capital Gains | of Capital | Total | ||||||||||||
| Hanlon Managed Income Fund | $ | 5,527,694 | $ | — | $ | 131,083 | $ | 5,658,777 | ||||||||
| Hanlon Tactical Dividend and Momentum Fund | 332,906 | — | 15,897 | 348,803 | ||||||||||||
| For the period ended July 31, 2018: | ||||||||||||||||
| Ordinary | Long-Term | Return | ||||||||||||||
| Portfolio | Income | Capital Gains | of Capital | Total | ||||||||||||
| Hanlon Managed Income Fund | $ | 9,312,170 | $ | — | $ | 167 | $ | 9,312,337 | ||||||||
| Hanlon Tactical Dividend and Momentum Fund | 865,361 | — | 18,945 | $ | 884,306 | |||||||||||
As of July 31, 2019, the components of accumulated earnings/(deficit) on a tax basis were as follows:
| Undistributed | Undistributed | Undistributed | Post October Loss | Capital Loss | Other | Unrealized | Total | |||||||||||||||||||||||||
| Ordinary | Ordinary | Long-Term | and | Carry | Book/Tax | Appreciation/ | Accumulated | |||||||||||||||||||||||||
| Portfolio | Tax-Exempt Income | Income | Capital Gains | Late Year Loss | Forwards | Differences | (Depreciation) | Earnings/(Deficits) | ||||||||||||||||||||||||
| Hanlon Managed Income Fund | $ | — | $ | — | $ | — | $ | (6,524,882 | ) | $ | (20,154,251 | ) | $ | — | $ | 2,962,777 | $ | (23,716,356 | ) | |||||||||||||
| Hanlon Tactical Dividend and Momentum Fund | — | — | — | — | (4,170,648 | ) | — | 3,392,470 | (778,178 | ) | ||||||||||||||||||||||
The difference between book basis and tax basis unrealized appreciation/(depreciation), accumulated net investment loss and accumulated net realized losses from investments is primarily attributable to the tax deferral of losses on wash sales.
Capital losses incurred after October 31 within the fiscal year are deemed to arise on the first business day of the following fiscal year for tax purposes. The following Funds incurred and elected to defer such capital losses as follows:
| Post October | ||||
| Portfolio | Losses | |||
| Hanlon Managed Income Fund | $ | 6,524,882 | ||
| Hanlon Tactical Dividend and Momentum Fund | — | |||
At July 31, 2019, the Funds had capital loss carry forwards for federal income tax purposes available to offset future capital gains and utilized capital loss carryforwards as follows:
| Non-Expiring | ||||||||||||||||||||
| Portfolio | Short-Term | Long-Term | Total | Expiration | CLCF Utilized | |||||||||||||||
| Hanlon Managed Income Fund | $ | 12,780,322 | $ | 7,373,929 | $ | 20,154,251 | $ | — | $ | — | ||||||||||
| Hanlon Tactical Dividend and Momentum Fund | 4,170,648 | — | 4,170,648 | — | 10,876,367 | |||||||||||||||
29
| Hanlon Funds |
| NOTES TO FINANCIAL STATEMENTS (Continued) |
| July 31, 2019 |
Permanent book and tax differences, primarily attributable to tax return updates of return of capital distributions from underlying investment companies resulted in reclassifications for the fiscal year ended July 31, 2019 as follows:
| Paid | ||||||||
| In | Accumulated | |||||||
| Portfolio | Capital | Earnings (Losses) | ||||||
| Hanlon Managed Income Fund | $ | (123,901 | ) | $ | 123,901 | |||
| Hanlon Tactical Dividend and Momentum Fund | — | — | ||||||
| 7. | CONTROL OWNERSHIP |
The beneficial ownership, either directly or indirectly, of more than 25% of the voting securities of a Fund creates a presumption of control of the Fund, under Section 2(a)9 of the 1940 Act. As of July 31, 2019, Pershing LLC held 79.38% and 69.50% of the voting securities of the Hanlon Managed Income Fund and the Hanlon Tactical Dividend and Momentum Fund, respectively, for the benefit of others.
| 8. | SECURITIES LENDING |
Under an agreement with the BNY Mellon Corp. (“BNY Mellon”), the Funds can lend their portfolio securities to brokers, dealers and other financial institutions approved by the Board to earn additional income. Loans are collateralized by cash, in an amount at least equal to the market value of the securities loaned plus accrued interest, which is invested in highly liquid, short-term instruments such as repurchase agreements collateralized by U.S. Government securities and money market funds in accordance with the Funds’ security lending procedures. A portion of the income generated by the investment in the collateral, net of any rebates paid by BNY Mellon to the borrowers is remitted to BNY Mellon as lending agent, and the remainder is paid to the Funds. The Funds continue to receive interest or dividends on the securities loaned. The Funds have the right under the Master Securities Lending Agreement to recover the securities from the borrower on demand; if the borrower fails to deliver the securities on a timely basis, the Funds could experience delays or losses on recovery. Additionally, the Funds are subject to the risk of loss from investments made with the cash received as collateral. The Funds manage credit exposure arising from these lending transactions by, in appropriate circumstances, entering into master netting agreements and collateral agreements with third party borrowers that provide in the event of default (such as bankruptcy or a borrower’s failure to pay or perform), the right to net a third party borrower’s rights and obligations under such agreement and liquidate and set off collateral against the net amount owed by the counterparty.
At July 31, 2019, each Fund had loaned securities and received cash collateral for the loan. This cash was invested in the Dreyfus Government Cash Management and Milestone Treasury Obligations Fund as shown in the Schedules of Investments. The Milestone Treasury Obligations Fund is managed by CLS Investments, LLC, an affiliate of the Distributor. The Funds receive compensation relating to the lending of the Funds’ securities.
The market values of loaned securities and collateral and percentage of total investment income the Funds received from the investment of cash collateral retained by the lending agent, BNY Mellon, were as follows:
| Market Value of | Market Value of | Percentage of Total | ||||||||||
| Fund | Loaned Securities | Collateral | Investment Income | |||||||||
| Hanlon Managed Income Fund | $ | 27,121,113 | $ | 27,677,363 | 3.37 | % | ||||||
| Hanlon Tactical Dividend and Momentum Fund | $ | 24,085,758 | $ | 24,780,110 | 2.89 | % | ||||||
30
| Hanlon Funds |
| NOTES TO FINANCIAL STATEMENTS (Continued) |
| July 31, 2019 |
| Gross Amounts Not Offset in | ||||||||||||||||
| the Statement of Assets and | ||||||||||||||||
| Liabilities | ||||||||||||||||
| Gross Amounts | ||||||||||||||||
| Recognized in | Financial | Cash | ||||||||||||||
| Statements of Assets | Instruments | Collateral | Net Amount | |||||||||||||
| and Liabilities | Pledged | Pledged | of Assets | |||||||||||||
| Hanlon Managed Income Fund Description of Liability Securities lending collateral | $ | 4,245,980 | $ | — | $ | 4,245,980 | (1) | $ | — | |||||||
| (1) | The amount is limited to the liability balance and accordingly does not include excess collateral pledged. |
The following table sets forth the remaining contractual maturity of the collateral held as of July 31, 2019:
| Remaining Contractual Maturity of the Collateral Held as of July 31, 2019 | ||||||||||||||||||||
| Overnight and | Up to | Greater than | ||||||||||||||||||
| Hanlon Managed Income Fund | Continuous | 30 Days | 30-90 days | 90 days | Total | |||||||||||||||
| Dreyfus Government Cash Management | $ | 383,580 | $ | — | $ | — | $ | — | $ | 383,580 | ||||||||||
| Milestone Treasury Obligations Fund | 3,862,400 | — | — | — | 3,862,400 | |||||||||||||||
| U.S. Government | — | 2,099,660 | 278,495 | 21,053,228 | 23,431,383 | |||||||||||||||
| Total securities lending | $ | 4,245,980 | $ | 2,099,660 | $ | 278,495 | $ | 21,053,228 | $ | 27,677,363 | ||||||||||
| Remaining Contractual Maturity of the Collateral Held as of July 31, 2019 | ||||||||||||||||||||
| Overnight and | Up to | Greater than | ||||||||||||||||||
| Hanlon Tactical Dividend and Momentum Fund | Continuous | 30 Days | 30-90 days | 90 days | Total | |||||||||||||||
| U.S. Government | $ | — | $ | 37,752 | $ | 549,576 | $ | 24,192,782 | $ | 24,780,110 | ||||||||||
| Total securities lending | $ | — | $ | 37,752 | $ | 549,576 | $ | 24,192,782 | $ | 24,780,110 | ||||||||||
The fair value of the securities loaned for the Hanlon Managed Income Fund and the Hanlon Tactical Dividend and Momentum Fund totaled $27,121,113 and $24,085,758 at July 31, 2019, respectively. The securities loaned are noted in the Portfolios of Investments. The fair value of the “Collateral for Securities Loaned” on the Portfolio of Investments includes only cash collateral received and reinvested that totaled $4,245,980 and $0 for the Hanlon Managed Income Fund and the Hanlon Tactical Dividend and Momentum Fund at July 31, 2019, respectively. These amounts are offset by a liability recorded as “Securities lending collateral.” At July 31, 2019, the Hanlon Managed Income Fund and Hanlon Tactical Dividend and Momentum Fund had received non-cash collateral of $23,431,383 and $24,780,110.
| 9. | NEW ACCOUNTING PRONOUNCEMENTS |
In August 2018, the Securities and Exchange Commission adopted amendments to certain disclosure requirements under Regulation S-X to conform to US GAAP, including: (i) an amendment to require presentation of the total, rather than the components, of distributable earnings on the Statement of Assets and Liabilities; and (ii) an amendment to require presentation of the total, rather than the components, of distributions to shareholders, except for tax return of capital distributions, on the Statements of Changes in Net Assets. The amendments also removed the requirement for parenthetical disclosure of undistributed net investment income on the Statements of Changes in Net Assets. These amendments have been adopted with these financial statements.
In August 2018, the FASB issued Accounting Standards Update (“ASU”) No. 2018-13, which changes certain fair value measurement disclosure requirements. The new ASU, in addition to other modifications and additions, removes the requirement to disclose the amount and reasons for transfers between Level 1 and Level 2 of the fair value hierarchy, and the policy for the timing of transfers between levels. For investment companies, the amendments are effective for financial statements issued for fiscal years beginning
31
| Hanlon Funds |
| NOTES TO FINANCIAL STATEMENTS (Continued) |
| July 31, 2019 |
after December 15, 2019, and interim periods within those fiscal years. Early adoption is allowed. At this time, management is evaluating the implications of the ASU and any impact on the financial statement disclosures.
| 10. | SUBSEQUENT EVENTS |
Subsequent events after the date of the Statements of Assets and Liabilities have been evaluated through the date the financial statements were issued. Management has determined that no events or transactions occurred requiring adjustment or disclosure in the financial statements.
32

GRANT THORNTON LLP
D +1 215 561 4200
|
REPORT OF INDEPENDENT REGISTERED PUBLIC ACCOUNTING FIRM
Board of Trustees of the Two Roads Shared Trust
Opinion on the financial statements
We have audited the accompanying statements of assets and liabilities, including the portfolio of investments, of Hanlon Managed Income Fund and Hanlon Tactical Dividend and Momentum Fund (two of the funds in the Two Roads Shared Trust) (collectively, the “Funds”) as of July 31, 2019, and the related statements of operations for the year then ended, and the statements of changes in net assets for each of the two years in the period ended July 31, 2019, and financial highlights for each of the three years in the period ended July 31, 2019 and for the period from September 9, 2015 (date of commencement of operations) through July 31, 2016, and the related notes (collectively referred to as the “financial statements”). In our opinion, the financial statements present fairly, in all material respects, the financial position of the Funds as of July 31, 2019, and the results of their operations for the year then ended, and the changes in their net assets for each of the two years in the period ended July 31, 2019, and their financial highlights for each of the three years in the period ended July 31, 2019 and for the period from September 9, 2015 (date of commencement of operations) through July 31, 2016, in conformity with accounting principles generally accepted in the United States of America.
Basis for opinion
These financial statements are the responsibility of the Funds’ management. Our responsibility is to express an opinion on the Funds’ financial statements based on our audits. We are a public accounting firm registered with the Public Company Accounting Oversight Board (United States) (“PCAOB”) and are required to be independent with respect to the Funds in accordance with the U.S. federal securities laws and the applicable rules and regulations of the Securities and Exchange Commission and the PCAOB.
We conducted our audits in accordance with the standards of the PCAOB. Those standards require that we plan and perform the audit to obtain reasonable assurance about whether the financial statements are free of material misstatement, whether due to error or fraud. The Funds are not required to have, nor were we engaged to perform, an audit of their internal control over financial reporting. As part of our audit we are required to obtain an understanding of internal control over financial reporting but not for the purpose of expressing an opinion on the effectiveness of the Funds’ internal control over financial reporting. Accordingly, we express no such opinion. | |
| GT.COM | Grant Thornton LLP is the U.S. member firm of Grant Thornton International Ltd (GTIL). GTIL and each of its member firms are separate legal entities and are not a worldwide partnership. |
33
Our audits included performing procedures to assess the risks of material misstatement of the financial statements, whether due to error or fraud, and performing procedures that respond to those risks. Such procedures included examining, on a test basis, evidence supporting the amounts and disclosures in the financial statements. Our audits also included evaluating the accounting principles used and significant estimates made by management, as well as evaluating the overall presentation of the financial statements. Our procedures included confirmation of securities owned as of July 31, 2019, by correspondence with the custodians. We believe that our audits provide a reasonable basis for our opinion.
We have served as the Funds’ auditor since 2016.
Philadelphia, Pennsylvania |

34
| Hanlon Funds |
| EXPENSE EXAMPLE (Unaudited) |
| July 31, 2019 |
As a shareholder of a Fund, you incur two types of costs: (1) transaction costs, including sales charges (loads) on purchases and deferred sales charges on certain redemptions; (2) ongoing costs, including management fees; distribution and/or service (12b-1) fees; and other Fund expenses. This example is intended to help you understand your ongoing costs (in dollars) of investing in a Fund and to compare these costs with the ongoing costs of investing in other mutual funds.
The example is based on an investment of $1,000 invested at the beginning of the period and held for the entire period from February 1, 2019 through July 31, 2019.
Actual Expenses
The “Actual Expenses” line in the table below provides information about actual account values and actual expenses. You may use the information below; together with the amount you invested, to estimate the expenses that you paid over the period. Simply divide your account value by $1,000 (for example, an $8,600 account value divided by $1,000 = 8.6), then multiply the result by the number in the table under the heading entitled “Expenses Paid During Period” to estimate the expenses you paid on your account during this period.
Hypothetical Example for Comparison Purposes
The “Hypothetical” line in the table below provides information about hypothetical account values and hypothetical expenses based on the Funds’ actual expense ratio and an assumed rate of return of 5% per year before expenses, which is not the Funds’ actual return. The hypothetical account values and expenses may not be used to estimate the actual ending account balances or expenses you paid for the period. You may use this information to compare this 5% hypothetical example with the 5% hypothetical examples that appear in the shareholder reports of other funds.
Please note that the expenses shown in the table are meant to highlight your ongoing costs only and do not reflect any transactional costs, such as sales charges (loads), or redemption fees. Therefore, the table is useful in comparing ongoing costs only, and will not help you determine the relative total costs of owning different funds. In addition, if these transactional costs were included, your costs would have been higher.
| Hypothetical | |||||||
| Actual | (5% return before expenses) | ||||||
| Fund’s | Beginning | Ending | Ending | ||||
| Annualized | Account | Account | Expenses | Account | Expenses | ||
| Expense | Value | Value | Paid During | Value | Paid During | ||
| Ratio | 2/1/19 | 7/31/19 | Period * | 7/31/19 | Period * | ||
| Hanlon Managed | |||||||
| Income Fund – Class A | 1.64% | $1,000.00 | $1044.60 | $ 8.31 | $1,016.66 | $ 8.20 | |
| Hanlon Managed | |||||||
| Income Fund – Class C | 2.39% | $1,000.00 | $1040.00 | $ 12.09 | $1,012.94 | $ 11.93 | |
| Hanlon Managed | |||||||
| Income Fund – Class I | 1.39% | $1,000.00 | $1046.30 | $ 7.05 | $1,017.90 | $ 6.95 | |
| Hanlon Managed | |||||||
| Income Fund – Class R | 1.79% | $1,000.00 | $1043.80 | $ 9.07 | $1,015.92 | $ 8.95 | |
| Hanlon Tactical Dividend and | |||||||
| Momentum Fund – Class A | 1.65% | $1,000.00 | $1062.60 | $ 8.44 | $1,016.61 | $ 8.25 | |
| Hanlon Tactical Dividend and | |||||||
| Momentum Fund – Class C | 2.40% | $1,000.00 | $1059.40 | $ 12.25 | $1,012.89 | $ 11.98 | |
| Hanlon Tactical Dividend and | |||||||
| Momentum Fund – Class I | 1.40% | $1,000.00 | $1064.40 | $ 7.17 | $1,017.85 | $ 7.00 | |
| Hanlon Tactical Dividend and | |||||||
| Momentum Fund – Class R | 1.80% | $1,000.00 | $1062.60 | $ 9.21 | $1,015.87 | $ 9.00 | |
| * | Expenses are equal to the Fund’s annualized expense ratio, multiplied by the number of days in the period (181) divided by the number of days in the fiscal year (365). |
35
| Hanlon Funds |
| SUPPLEMENTAL INFORMATION (Unaudited) |
| July 31, 2019 |
Approval of Advisory Agreement – Hanlon Managed Income Fund and the Hanlon Tactical Dividend and Momentum Fund
At a meeting held on June 18-19, 2019 (the “Meeting”), the Board of Trustees (the “Board”) of Two Roads Shared Trust (the “Trust”), each of whom is not an “interested person” of the Trust (the “Independent Trustees” or “Trustees”), as such term is defined under Section 2(a)(19) of the Investment Company Act of 1940 (the “1940 Act”), considered the approval of an investment advisory agreement (the “Agreement”) between Hanlon Investment Management, Inc. (“Hanlon” or the “Adviser”) and the Trust on behalf of the Hanlon Managed Income Fund and the Hanlon Tactical Dividend and Momentum Fund (the “Hanlon Tactical Fund” and each a “Hanlon Fund” and together, the “Hanlon Funds”), each a series of the Trust.
In connection with the Board’s consideration of the Agreement, the Board received written materials in advance of the Meeting, which included information regarding: (i) the nature, extent, and quality of services to be provided to the Hanlon Funds by Hanlon; (ii) a description of the Adviser’s investment management personnel; (iii) an overview of the Adviser’s operations and financial condition; (iv) a description of the Adviser’s brokerage practices (including any soft dollar arrangements); (v) a comparison of each Fund’s advisory fee and overall expenses with those of comparable mutual funds; (vi) the anticipated level of profitability from the Adviser’s fund-related operations; and (vii) the Adviser’s compliance policies and procedures, including policies and procedures for personal securities transactions, business continuity and information security.
Throughout the process, including at the Meeting, the Board had numerous opportunities to ask questions of and request additional materials from Hanlon. The Board was also advised by, and met, in executive session with, the Board’s independent legal counsel, and received a memorandum from such independent counsel regarding the Board’s responsibilities under applicable law.
Matters considered by the Board in connection with its approval of the Agreement included, among others, the following:
Nature, Extent and Quality of Services. The Board reviewed materials provided by Hanlon related to the Advisory Agreement with the Trust with respect to each of the Hanlon Funds, including the Advisory Agreement, a description of the manner in which investment decisions are made and executed; an overview of the personnel that perform services for the Hanlon Funds and their background and experience; a review of the financial condition of Hanlon; Hanlon’s compliance policies and procedures, including a Code of Ethics containing provisions reasonably necessary to prevent Access Persons, as that term is defined in Rule 17j-1 under the 1940 Act, from engaging in conduct prohibited by Rule 17j-1(b); and an independent report prepared by Broadridge, an independent third-party data provider, analyzing the performance record, fees and expenses of each Hanlon Fund as compared to other mutual funds with similar investment strategies.
In reaching its conclusions with respect to the nature and quality of services to be provided by Hanlon under the Advisory Agreement, the Board considered that Hanlon’s employees have
36
| Hanlon Funds |
| SUPPLEMENTAL INFORMATION (Unaudited) (Continued) |
| July 31, 2019 |
extensive asset management, risk management, operations and compliance experience. The Board took into account that Hanlon had previously implemented changes to the Hanlon Tactical Fund’s investment strategy, which resulted in improved performance, and that Hanlon more recently implemented changes to the Hanlon Managed Income Fund’s investment strategy, which changes also resulted in recently improved performance. The Board noted Hanlon’s commitment to increasing its assets under management and to creating positive performance for each of the Hanlon Funds. The Board noted that Hanlon allocated appropriate resources and staff to operate its compliance program, including the implementation of trading procedures reasonably designed to mitigate conflicts among accounts, that Hanlon had adopted cybersecurity and business continuity policies and procedures, that Hanlon’s risk management and associated policies appeared to be operating effectively and that Hanlon identified and monitored risks. The Board also considered the experience and tenure of key personnel, noting the qualifications of the professional staff. The Board concluded that Hanlon had sufficient quality and depth of personnel, resources, investment methods and compliance policies and procedures to perform its duties under the Advisory Agreement and that the nature, overall quality and extent of the advisory services provided by Hanlon to the Hanlon Funds were satisfactory.
Performance. Among other data, the Board considered each Hanlon Fund’s performance for the one-year, three-year, and since inception periods ended March 31, 2019 as compared to each Hanlon Fund’s benchmark index and against a group of peer funds (each, a “Peer Group”) provided by Broadridge. For the Hanlon Managed Income Fund, the Board considered that the Fund had underperformed the median of its Peer Group and Morningstar category for each of the reported periods. The Board took into account Hanlon’s discussion of the Hanlon Managed Income Fund’s performance relative to the Peer Group and the Morningstar category, including the differences between the Hanlon Managed Income Fund’s investment strategy and those of the funds in the Peer Group and Morningstar category due to its tactical nature, which may not always generate returns that correlate with high yield bond funds. The Board took into account Hanlon’s discussion regarding the Hanlon Managed Income Fund’s underperformance, the executed modifications to the Fund’s investment strategy, and the resulting recently improved returns.
With respect to the Hanlon Tactical Fund, the Board considered that following changes made by Hanlon to the Fund’s strategy to address underperformance, the Hanlon Tactical Fund had shown some improvement over the three-year period, although it continued to underperform the median of its Peer Group and Morningstar category for the three-year and since inception periods ended March 31, 2019. The Board concluded that, with respect to the Hanlon Managed Income Fund, the underperformance was being addressed, that the overall performance of the Hanlon Tactical Fund was satisfactory, and that the performance of each of the Funds was being monitored and/or addressed.
Fees and Expenses. As to the costs of the services provided by Hanlon, the Board considered a comparison of each Hanlon Fund’s contractual advisory fee and net expense ratios to those of the Peer Group.
The Board noted that the Hanlon Managed Income Fund’s contractual advisory fee was slightly above the median of its Peer Group. The Board considered that the Hanlon Managed Income Fund’s net operating expense ratio (Class I Shares) was above the median of its Peer
37
| Hanlon Funds |
| SUPPLEMENTAL INFORMATION (Unaudited) (Continued) |
| July 31, 2019 |
Group, but was not the highest. The Board also noted that Hanlon had agreed to reimburse expenses to limit net annual operating expenses to 1.70%, 2.45%, 1.45%, and 1.85% of the average net assets (exclusive of any front-end or contingent deferred loads; brokerage fees and commissions; acquired fund fees and expenses; borrowing costs (such as interest and dividend expense on securities sold short); taxes; and extraordinary expenses, such as litigation expenses) of the average net assets of Class A, Class C, Class I, and Class R shares of the Hanlon Managed Income Fund, respectively.
With respect to the Hanlon Tactical Fund, the Board noted that Hanlon’s contractual advisory fee was equal to the median of the Hanlon Tactical Fund’s Peer Group. The Board also considered that the Hanlon Tactical Fund’s net operating expense ratio (Class I shares) was slightly below the median of the Peer Group. The Board noted that Hanlon has agreed to reimburse expenses to limit net annual operating expenses to 1.70%, 2.45%, 1.45%, and 1.85% (exclusive of any front-end or contingent deferred loads; brokerage fees and commissions; acquired fund fees and expenses; borrowing costs (such as interest and dividend expense on securities sold short); taxes; and extraordinary expenses, such as litigation expenses) of the average net assets of Class A, Class C, Class I, and Class R shares of the Hanlon Tactical Fund, respectively.
In considering the level of the advisory fee with respect to each Fund, the Board also took into account the cost of other accounts managed by Hanlon, if any, that used a similar investment strategy, noting that differences were attributable to the differences in the management of these different kinds of accounts.
Based upon the factors above, the Board concluded that the advisory fee for each Hanlon Fund was not unreasonable.
Profitability. The Board considered Hanlon’s profitability and whether these profits were reasonable in light of the services provided to each Hanlon Fund. The Board reviewed a profitability analysis prepared by Hanlon based on current asset levels of each of the Hanlon Funds, and considered the total profits of Hanlon from its relationship with each Hanlon Fund. The Board considered its discussion with the Adviser regarding Hanlon’s methodology in calculating profitability. The Board concluded that Hanlon’s profitability from its relationship with each of the Hanlon Funds, after taking into account all facts and circumstances, was not excessive.
Economies of Scale. The Board considered whether Hanlon would realize economies of scale with respect to its management of each Hanlon Fund as each Hanlon Fund grew and whether fee levels reflected these economies. The Board noted that the advisory fees did not currently have breakpoints. The Board considered Hanlon’s discussion of each Hanlon Fund’s advisory fee structure. The Board considered the profitability analysis included in the Board Materials, and noted that while expenses of managing each Hanlon Fund as a percentage of assets under management are expected to decrease as each Hanlon Fund’s assets continue to grow, at current asset levels, economies of scale have not yet been reached. The Board noted that it would revisit whether economies of scale exist in the future once the Hanlon Funds have achieved sufficient scale.
38
| Hanlon Funds |
| SUPPLEMENTAL INFORMATION (Unaudited) (Continued) |
| July 31, 2019 |
Other Benefits. The Board also considered the character and amount of other direct and incidental benefits to be received by Hanlon from its association with the Hanlon Funds. The Board noted that Hanlon had identified potential “fall-out” benefits that it may receive including enhanced trading efficiencies from utilizing a pooled investment vehicle as compared to individual client accounts and brand recognition and reputation. The Board considered that these benefits are expected and appeared to be not unreasonable.
Conclusion. The Board, having requested and received such information from Hanlon as it believed reasonably necessary to evaluate the terms of the Advisory Agreement, and having been advised by independent counsel that the Board had appropriately considered and weighed all relevant factors, determined that approval of the Advisory Agreement for an additional one-year term was in the best interests of each of the Hanlon Funds and its shareholders. In considering the proposed Advisory Agreement’s renewal, the Board did not identify any one factor as all important, and each Independent Trustee may have considered different factors as more important.
39
| Hanlon Funds |
| SUPPLEMENTAL INFORMATION (Unaudited) |
| July 31, 2019 |
Trustees and Officers.The Trustees and officers of the Trust, together with information as to their principal business occupations during the past five years and other information, are shown below. Unless otherwise noted, the address of each Trustee and Officer is 225 Pictoria Drive, Suite 450, Cincinnati, Ohio 45246.
Independent Trustees *
| Name, Address, Year of Birth | Position(s) Held with Registrant | Term and Length Served | Principal Occupation(s) During Past 5 Years | Number of Portfolios Overseen In The Fund Complex** | Other Directorships Held During Past 5 Years |
| Mark Garbin Year of Birth: 1951 | Trustee | Indefinite, Since 2012 | Managing Principal, Coherent Capital Management LLC (since 2008) | 2 | Northern Lights Fund Trust (since 2013); Northern Lights Variable Trust (since 2013); Forethought Variable Insurance Trust (since 2013); OHA Mortgage Strategies Fund (offshore), Ltd. (2014 - 2017); Altegris KKR Commitments Master Fund (since 2014); and OFI Carlyle Private Credit Fund (since March 2018) |
| Mark D. Gersten Year of Birth: 1950 | Chairman, Trustee | Indefinite, Since 2012 | Independent Consultant (since 2012); Senior Vice President – Global Fund Administration Mutual Funds & Alternative Funds, AllianceBernstein LP (1985 – 2011) | 2 | Northern Lights Fund Trust (since 2013); Northern Lights Variable Trust (since 2013); Altegris KKR Commitments Master Fund (since 2014); previously, Ramius Archview Credit and Distressed Fund (2015-2017); and Schroder Global Series Trust (2012 to 2017) |
| Neil M. Kaufman Year of Birth: 1960 | Trustee, Audit Committee Chairman | Indefinite, Since 2012 | Managing Member, Kaufman & Associates, LLC (legal services) (Since 2016); Partner, Abrams Fensterman, Fensterman, Eisman, Formato, Ferrara & Wolf, LLP (legal services) (2010-2016) | 2 | Altegris KKR Commitments Master Fund (since 2014) |
| Anita K. Krug Year of Birth: 1969 | Trustee | Indefinite, Since 2012 | Dean (since 2019) Chicago Kent Law School; Interim Vice Chancellor for Academic Affairs (2018-2019) University of Washington Bothell; Interim Dean (2017- 2018), Professor (since 2016), Associate Professor (2014-2016); and Assistant Professor (2010-2014), University of Washington School of Law | 2 | Altegris KKR Commitments Master Fund (since 2014); Centerstone Investors Trust (since 2016) |
| * | Information is as of August 1, 2019. |
| ** | As of August 1, 2019, the Trust was comprised of 19 active portfolios managed by seven unaffiliated investment advisers and two affiliated investment advisers. The term “Fund Complex” applies only to those funds that are (i) advised by a common investment adviser or by an investment adviser that is an affiliated person of the investment adviser of any of the other funds of the Trust or (ii) hold themselves out to investors as related companies for purposes of investment and investor services. The Funds do not hold themselves out as related to any other series within the Trust. |
7/31/19 – Two Roadsv1
40
| Hanlon Funds |
| SUPPLEMENTAL INFORMATION (Unaudited) (Continued) |
| July 31, 2019 |
Officers of the Trust*
| Name, Address, Year of Birth | Position(s) Held with Registrant | Principal Occupation(s) During Past 5 Years | Number of Portfolios Overseen In The Fund Complex** | Other Directorships Held During Past 5 Years |
| James Colantino 80 Arkay Drive Hauppauge, NY 11788 Year of Birth: 1969 | President Since Feb. 2017 Treasurer (2012 to 2017) | Senior Vice President (2012- present); Vice President (2004 to 2012); Gemini Fund Services, LLC. | N/A | N/A |
| Laura Szalyga 80 Arkay Drive Hauppauge, NY 11788 Year of Birth: 1978 | Treasurer Since Feb. 2017 | Vice President, Gemini Fund Services, LLC (since 2015); Assistant Vice President, Gemini Fund Services, LLC (2011-2014). | N/A | N/A |
| Richard A. Malinowski 80 Arkay Drive Hauppauge, NY 11788 Year of Birth: 1983 | Vice President Since Sep. 2018 Secretary Since 2013 | Senior Vice President (since 2017); Vice President and Counsel (2016-2017) and Assistant Vice President (2012 – 2016), Gemini Fund Services, LLC | N/A | N/A |
| William B. Kimme Year of Birth: 1962 | Chief Compliance Officer Since Inception | Senior Compliance Officer, Northern Lights Compliance Services, LLC (September 2011 - present) | N/A | N/A |
| * | Information is as of August 1, 2019. |
| ** | As of August 1, 2019, the Trust was comprised of 19 active portfolios managed by seven unaffiliated investment advisers and two affiliated investment advisers. The term “Fund Complex” applies only to those funds that are (i) advised by a common investment adviser or by an investment adviser that is an affiliated person of the investment adviser of any of the other funds of the Trust or (ii) hold themselves out to investors as related companies for purposes of investment and investor services. The Funds do not hold themselves out as related to any other series within the Trust. |
The Funds, Statement of Additional Information (“SAI”) includes additional information about the Trustees and is available free of charge, upon request, by calling toll-free at 1-844-828-3212.
7/31/19 – Two Roadsv1
41
PRIVACY NOTICE
| FACTS | WHAT DOES TWO ROADS SHARED TRUST DO WITH YOUR PERSONAL INFORMATION |
| Why? | Financial companies choose how they share your personal information. |
| Federal law gives consumers the right to limit some but not all sharing. | |
| Federal law also requires us to tell you how we collect, share, and protect your personal information. Please read this notice carefully to understand what we do. | |
| What? | THE TYPES OF PERSONAL INFORMATION WE COLLECT AND SHARE DEPENDS ON THE PRODUCT OR SERVICE THAT YOU HAVE WITH US. THIS INFORMATION CAN INCLUDE: |
| ● Social Security number and income | |
| ● Account transactions and transaction history | |
| ● Investment experience and purchase history | |
| When you areno longer our customer, we continue to share your information as described in this notice. | |
| How? | All financial companies need to share customers’ personal information to run their everyday business. In the section below, we list the reasons financial companies can share their customers’ personal information; the reason Two Roads Shared Trust chooses to share and whether you can limit this sharing. |
| Reasons we can share your personal information | Does Two Roads Shared Trust share? | Can you limit this sharing? |
| For our everyday business purposes – | ||
| such as to process your transactions, maintain your account(s), respond to court orders and legal investigations, or report to credit bureaus | YES | NO |
| For our marketing purposes – | NO | We do not share |
| to offer our products and services to you | ||
| For joint marketing with other financial companies | NO | We do not share |
| For our affiliates’ everyday business purposes – | NO | We do not share |
| information about your transactions and experiences | ||
| For our affiliates’ everyday business purposes – | NO | We do not share |
| information about your creditworthiness | ||
| For our affiliates to market to you | NO | We do not share |
| For nonaffiliates to market to you | NO | We do not share |
| Questions? | Call 1-402-895-1600 |
42
What we do
| How does Two Roads Shared Trust protect my personal information? | To protect your personal information from unauthorized access and use, we use security measures that comply with federal law. These measures include computer safeguards and secured files and buildings. |
| Our service providers are held accountable for adhering to strict policies and procedures to prevent any misuse of your nonpublic personal information. | |
| How does Two Roads Shared Trust | We collect your personal information, for example, when you |
| collect my personal information? | |
| ● open an account or give us contact information | |
| ● provide account information or give us your income information | |
| ● make deposits or withdrawals from your account | |
| We also collect your personal information from other companies. | |
| Why can’t I limit all sharing? | Federal law gives you the right to limit only |
| ● sharing for affiliates’ everyday business purposes – information about your creditworthiness | |
| ● affiliates from using your information to market to you | |
| ● sharing for nonaffiliates to market to you | |
| State laws and individual companies may give you additional rights to limit sharing | |
| Definitions | |
| Affiliates | Companies related by common ownership or control. They can be financial and nonfinancial companies. |
| ● Two Roads Shared Trust has no affiliates. | |
| Nonaffiliates | Companies not related by common ownership or control. They can be financial and nonfinancial companies. |
| ● Two Roads Shared Trust does not share with nonaffiliates so they can market to you. | |
| Joint marketing | A formal agreement between nonaffiliates financial companies that together market financial products or services to you. |
| ● Two Roads Shared Trust does not jointly market. |
43
This Page Intentionally Left Blank
PROXY VOTING POLICY
Information regarding how the Funds voted proxies relating to portfolio securities for the most recent twelve month period ended June 30 as well as a description of the policies and procedures that the Funds use to determine how to vote proxies is available without charge, upon request, by calling 1-844-828-3212 or by referring to the Securities and Exchange Commission’s (“SEC”) website at http://www.sec.gov.
PORTFOLIO HOLDINGS
Each Fund files its complete schedule of portfolio holdings with the SEC for the first and third quarters of each fiscal year on Form N-Q (or as an exhibit to its reports on Form N-Q’s successor form, Form N-PORT). Form N-Q and Form N-PORT are available on the SEC’s website at http://www.sec.gov. The information on Form N-Q and Form N-PORT is available without charge, upon request, by calling 1-844-828-3212.
| INVESTMENT ADVISOR |
| Hanlon Investment Management, Inc. |
| 3393 Bargaintown Road |
| Egg Harbor Township, NJ 08234 |
| ADMINISTRATOR |
| Gemini Fund Services, LLC |
| 80 Arkay Drive |
| Hauppauge, NY 11788 |
ITEM 2. CODE OF ETHICS.
| (a) | The registrant has, as of the end of the period covered by this report, adopted a code of ethics that applies to the registrant's principal executive officer, principal financial officer, and principal accounting officer or controller, or persons performing similar functions, regardless of whether these individuals are employed by the registrant or a third party. |
| (c) | During the period covered by this report, there were no amendments to any provision of the code of ethics. |
| (d) | During the period covered by this report, there were no waivers or implicit waivers of a provision of the code of ethics. |
ITEM 3. AUDIT COMMITTEE FINANCIAL EXPERT.
| The Registrant’s board of trustees has determined that Mark Gersten is the audit committee financial expert, as defined in Item 3 of Form N-CSR. Mr. Gersten is “independent” for purposes of this Item 3. |
ITEM 4. PRINCIPAL ACCOUNTANT FEES AND SERVICES.
| (a) | Audit Fees. The aggregate fees billed for the last two fiscal year for professional services rendered by the registrant's principal accountant for the audit of the registrant's annual financial statements or services that are normally provided by the accountant in connection with statutory and regulatory filings or engagements for those fiscal years are as follows:
|
| Trust Series | 2018 | 2019 | |
| Hanlon Managed Income Fund | 15,500 | 16,500 | |
| Hanlon Tactical Dividend and Momentum Fund | 15,500 | 16,500 |
| (b) | Audit-Related Fees. There were no fees billed in the last fiscal year for assurances and related services by the principal accountant that are reasonably related to the performance of the audit of the registrant’s financial statements and are not reported under paragraph (a) of this item. |
| (c) | Tax Fees. The aggregate fees billed in the last fiscal year for professional services rendered by the principal accountant for tax compliance are as follows: |
| Trust Series | 2018 | 2019 | |
| Hanlon Managed Income Fund | 2,800 | 2,900 | |
| Hanlon Tactical Dividend and Momentum Fund | 2,800 | 2,900 |
| (d) | All Other Fees. The aggregate fees billed in the last two fiscal years for products and services provided by the registrant’s principal accountant, other than the services reported in paragraphs (a) through (c) of this item were: |
Fiscal years ended July 31, 2018 $0 Fiscal years ended July 31, 2019 $0 | |
| (e)(1) | The audit committee does not have pre-approval policies and procedures. Instead, the audit committee or audit committee chairman, subject to ratification by the audit committee, approves, on a case-by-case basis each audit or non-audit service before the principal accountant is engaged by the registrant. |
| (e)(2) | There were no services described in each of paragraphs (b) through (d) of this Item that were approved by the audit committee pursuant to paragraph (c)(7)(i)(C) of Rule 2-01 of Regulation S-X. |
| f) | Not applicable. The percentage of hours expended on the principal accountant's engagement to audit the registrant's financial statements for the most recent fiscal year that were attributed to work performed by persons other than the principal accountant's full-time, permanent employees was zero percent (0%). |
| (g) | All non-audit fees billed by the registrant's principal accountant for services rendered to the registrant for the fiscal year ended July 31, 2019 is disclosed in (b)-(d) above. There were no audit or non-audit services performed by the registrant's principal accountant for the registrant's adviser. |
ITEM 5. AUDIT COMMITTEE OF LISTED REGISTRANTS.
Not applicable.
ITEM 6. SCHEDULE OF INVESTMENTS
Included in annual report to shareholders filed under item 1 of this form.
ITEM 7. DISCLOSURE OF PROXY VOTING POLICIES AND PROCEDURES FOR CLOSED-END MANAGEMENT INVESTMENT COMPANIES.
Not applicable. Fund is an open-end management investment company.
ITEM 8. PORTFOLIO MANAGERS OF CLOSED-END MANAGEMENT INVESTMENT COMPANIES
Not applicable. Fund is an open-end management investment company.
ITEM 9. PURCHASES OF EQUITY SECURITIES BY CLOSED-END MANAGEMENT INVESTMENT COMPANY AND AFFILIATED PURCHASERS.
Not applicable. Fund is an open-end management investment company.
ITEM 10. SUBMISSION OF MATTERS TO A VOTE OF SECURITY HOLDERS.
Not applicable at this time.
ITEM 11. CONTROLS AND PROCEDURES.
| (a) | The registrant's principal executive and principal financial officers, or persons performing similar functions, have concluded that the registrant's disclosure controls and procedures (as defined in Rule 30a-3(c) under the 1940 Act, are effective, as of a date within 90 days of the filing date of this report, based on the evaluation of these controls and procedures required by Rule 30a-3(b) under the 1940 Act and Rule 15d-15(b) under the Securities Exchange Act of 1934, as amended. |
| (b) | There were no changes in the registrant's internal control over financial reporting (as defined in Rule 30a-3(d) under the 1940 Act) that occurred during the period covered by this report that have materially affected, or are reasonably likely to materially affect, the registrant's internal control over financial reporting. |
Item 12. DISCLOSURE OF SECURITIES LENDING ACTIVITES FOR CLOSED-END MANAGEMENT INVESTMENT COMPANIES.
Not applicable. Fund is an open-end management investment company.
ITEM 13. EXHIBITS
| (1) | Code of Ethics for Principal Executive and Senior Financial Officers is attached hereto. |
| (2) | Certifications pursuant to Section 302 of the Sarbanes-Oxley Act of 2002 are filed herewith. |
| (3) | Certifications pursuant to Section 906 of the Sarbanes-Oxley Act of 2002 are filed herewith. |
SIGNATURES
Pursuant to the requirements of the Securities Exchange Act of 1934 and the Investment Company Act of 1940, the registrant has duly caused this report to be signed on its behalf by the undersigned, thereunto duly authorized.
Two Roads Shared Trust
| By James Colantino | /s/ James Colantino |
| Principal Executive Officer/President | |
| Date: 10/7/2019 | |
Pursuant to the requirements of the Securities Exchange Act of 1934 and the Investment Company Act of 1940, this report has been signed below by the following person on behalf of the registrant and in the capacities and on the date indicated.
| By Laura Szalyga | /s/ Laura Szalyga |
| Principal Financial Officer/Treasurer | |
| Date: 10/7/2019 | |