united states
securities and exchange commission
washington, d.c. 20549
form n-csr
certified shareholder report of registered management
investment companies
Investment Company Act file number 811-22718
Two Roads Shared Trust
(Exact name of registrant as specified in charter)
17645 Wright Street, Omaha, NE 68130
(Address of principal executive offices) (Zip code)
Richard Malinowski, Gemini Fund Services, LLC.
80 Arkay Drive Suite 110, Hauppauge, NY 11788
(Name and address of agent for service)
Registrant's telephone number, including area code: 631-470-2600
Date of fiscal year end: 4/30
Date of reporting period:4/30/19
ITEM 1. REPORTS TO SHAREHOLDERS.
 |
| Anfield Capital Diversified Alternatives ETF |
| DALT |
| April 30, 2019 |
| Annual Report |
| Advised by: |
| Regents Park Funds, LLC |
| 4041 MacArthur Blvd., Suite 155 |
| Newport Beach, CA 92660 |
| RegentsParkFunds.com |
| 1-866-866-4848 |
| Distributed by Northern Lights Distributors, LLC |
| Member FINRA |
Beginning on January 1, 2021, as permitted by regulations adopted by the Securities and Exchange Commission, paper copies of the Fund’s shareholder reports like this one will no longer be sent by mail, unless you specifically request paper copies of the reports. Instead, the reports will be made available on the Fund’s website www.RegentsParkFunds.com, and you will be notified by mail each time a report is posted and provided with a website link to access the report.
If you already elected to receive shareholder reports electronically, you will not be affected by this change and you need not take any action. You may elect to receive shareholder reports and other communications from the Fund electronically or to continue receiving paper copies of shareholder reports, which are available free of charge, by contacting your financial intermediary (such as a broker-dealer or bank) or, if you are a direct investor, by following the instructions included with paper Fund documents that have been mailed to you.
 |  |
June 2019
Annual Letter to Shareholders of the Anfield Capital Diversified Alternatives ETF (DALT)
Principal Investment Strategy
DALT is an actively managed exchange-traded fund (“ETF”) and seeks to achieve its investment objective by investing primarily in alternative asset classes and securities that represent sectors, market segments or asset classes that do not represent the general investment universe. The Fund will implement this strategy primarily through investments in unaffiliated ETFs, closed-end funds (“CEFs”), business development companies (“BDCs”) and real estate investment trusts (“REITs”). The market segments and sectors represented in these securities will typically have a lower correlation to the general equity and fixed income markets and whose performance and volatility is affected by factors different from those that determine the direction of the equity and fixed income markets.
Alternative sectors and asset class categories may include but are not limited to:
| ● | Frontier technology companies at the forefront of major technical innovations in computing, medical sciences and nano-technology |
| ● | Companies in frontier markets or involved in infrastructure development and resource exploitation |
| ● | Traditional alternatives such as private equity, private debt, and hedge funds |
| ● | Long and short positions (including leveraged positions) in stocks, bonds, cash, and derivatives (futures, options, and forward contracts) on individual securities and indices |
| ● | Energy and commodity related securities |
| ● | Long and short volatility strategies |
| ● | Multi-asset / market neutral |
| ● | Absolute return / macro & event driven |
| ● | Real Estate |
Update on the Fund’s Performance and Outlook
In the most recent semi-annual letter to our shareholders, we noted our desire to reduce the overall equity risk exposure of the Fund. Steps taken to meet this objective include a transition from an equal-weighted approach to security allocation to a risk-weighted approach, as well as the ability to short the broad equity market through futures contracts. In addition, we have placed a higher emphasis on finding potential investments with higher yield-to-risk metrics, which we believe helps dampen volatility without necessarily reducing returns.
The team is pleased with the results of these changes thus far, as the Fund has bounced back from a difficult Q4 2018 and is up 15.26% year-to-date net of all fees and expenses, as of April 30, 2019. This compares with 15.96% for the MSCI All Country World Index (ACWI) and 1.90% for the Bloomberg Barclays Global Aggregate Bond Index (Gl. Agg) over the same time period. Relative to a 50% ACWI / 50% Gl. Agg benchmark, the Fund has returned 648 basis points of alpha year-to-date. In the fiscal year ended April 30, 2019, the Fund returned 6.30% net of all fees and expenses compared with the ACWI’s 5.06% and the Gl. Agg’s 0.94%.
On the risk front, the Fund’s 6-month and 1-year beta is 0.529 and 0.514 (beta is a measure of correlation or price sensitivity to the S&P 500 index), respectively, while the inception correlation to the S&P 500 is 0.656, according to Bloomberg. Taken together, these metrics provide us with a risk picture that is within our target range of 50-60% equity market risk exposure in the portfolio.
Overall, we are satisfied with the Fund’s results thus far and are optimistic about what the future holds.
1
Economic and Market Commentary
| ● | Global equity indices were positive in April on a total return basis: the S&P 500 was up over 4%, the MSCI EAFE Index increased by nearly 3%, and the MSCI Emerging Market Index approximately 2% |
| ● | The U.S. 10 Year Treasury yield began April at 2.41% and finished at 2.51% having peaked at 2.60% during the middle of the month |
| ● | Fixed income markets were broadly flat, with the Bloomberg Barclay’s U.S. Aggregate Bond Index returning 0.03%, and the shorter-term U.S. Government Credit/ 1-3 Year up 0.23% |
| ● | U.S. Q1 2019 GDP estimates came in at an annual rate of 3.2%, exceeding expectations of 2% growth. This was followed by a strong jobs report, as the Bureau of Labor Statistics reported 263,000 jobs were added in April and unemployment dropped to 3.6%. In addition, average hourly earnings increased 3.2% year-over-year, another consecutive print with wage gains greater than 3% on an annual basis. |
| ● | European economies managed only modest growth in the first quarter of the year. Eurostat, the statistical office of the European Union, reported that GDP rose by 0.4% in the euro area compared with the previous quarter, while in the fourth quarter of 2018, growth rose by 0.2%. |
| ● | The outlook for Germany was particularly grim, as the Ifo Business Climate Index fell from 99.7 points in March to 99.2 points in April. “Companies are less satisfied with their current business situation,” according to the Ifo Institute for Economic Research. “March’s gentle optimism regarding the coming months has evaporated.” |
| ● | China’s first quarter GDP rose 6.4% YoY, the same as that of the fourth quarter last year, 0.4% lower than that of the same period last year and 0.2% lower than that of 2018 |
On behalf of the entire staff at Anfield Capital Management and Regents Park Funds, we thank you for your continued support.

David Young, CFA
CEO & Founder
The views in this report are those of the Fund’s management. This report contains certain forward-looking statements about factors that may affect the performance of the Fund in the future. These statements are based on the Fund’s management’s predictions and expectations concerning future events such as the performance of the economy as a whole, and of specific industry sectors. Management believes these forward-looking statements are reasonable, although they are inherently uncertain and difficult to predict.
4790-NLD-6/26/2019
2
| Anfield Capital Diversified Alternatives ETF |
| PORTFOLIO REVIEW (Unaudited) |
| April 30, 2019 |
The Fund’s performance figures(*) for the periods ended April 30, 2019, compared to its benchmarks:
| Since | ||||
| One Year | Inception **** | |||
| Anfield Capital Diversified Alternatives ETF - NAV | 6.30% | 4.57% | ||
| Anfield Capital Diversified Alternatives ETF - Market Price | 6.07% | 4.35% | ||
| Bloomberg Barclays Global Aggregate Bond Index ** | 0.94% | 1.11% | ||
| MSCI All Country World Equity Index *** | 5.06% | 6.85% |
| * | The performance data quoted here represents past performance. Current performance may be lower or higher than the performance data quoted above. Investment return and principal value will fluctuate, so that shares, when redeemed, may be worth more or less than their original cost. The returns shown do not reflect the deduction of taxes that a shareholder would pay on Fund distributions or on the redemptions of Fund shares. Past performance is no guarantee of future results. Performance figures for periods less than 1 year are not annualized. The Fund’s adviser has contractually agreed to reduce the Fund’s fees and/or absorb expenses of the Fund until at least September 30, 2019 to ensure that total annual Fund operating expenses after fee waiver and reimbursement (exclusive of any front-end or contingent deferred loads, brokerage fees and commissions, acquired fund fees and expenses, fees and expenses associated with investments in other collective investment vehicles or derivative instruments (including, for example, option and swap fees and expenses), borrowing costs (such as interest and dividend expense on securities sold short), taxes and extraordinary expenses, such as litigation expenses) will not exceed 1.30% of average daily net assets. This agreement may be terminated by the Fund’s Board of Trustees on 60 days’ written notice to the adviser. These fee waivers and expense reimbursements are subject to possible recoupment from the Fund in future years on a rolling three year basis (within the three years after the fees have been waived or reimbursed) if such recoupment can be achieved within the foregoing expense limits. Please review the Fund’s most recent prospectus for more detail on the expense waiver. |
The Fund’s per share net asset value or “NAV” is the value of one share of the Fund as calculated in accordance with the standard formula for valuing exchange traded fund shares. The NAV return is based on the NAV of the Fund and the market return is based on the market price per share of the Fund. The price used to calculate market return (“Market Price”) is determined by using the midpoint between the highest bid and the lowest offer on the primary stock exchange on which shares of the Fund are listed for trading, as of the time that the Fund’s NAV is calculated. Market Price and NAV returns assume that dividends and capital gain distributions have been reinvested in the Fund at Market Price and NAV, respectively.
| ** | The Bloomberg Barclays Global Aggregate Bond Index is a flagship measure of global investment grade debt from twenty-four local currency markets. This multi-currency benchmark includes treasury, government-related, corporate and securitized fixed-rate bonds from both developed and emerging markets issuers. The Fund’s portfolio holdings may differ significantly from the securities held in the Index, and unlike a mutual fund, an unmanaged index assumes no transaction costs, taxes, management fees or other expenses. Investors may not invest directly in an index. |
| *** | The MSCI All Country World Equity Index is a market capitalization weighted index designed to provide a broad measure of equity-market performance throughout the world. The index is maintained by Morgan Stanley Capital International (MSCI), and is comprised of stocks from both developed and emerging markets. The Fund’s portfolio holdings may differ significantly from the securities held in the Index, and unlike a mutual fund, an unmanaged index assumes no transaction costs, taxes, management fees or other expenses. Investors may not invest directly in an index. |
| **** | As of the close of business on the day of commencement of trading on September 29, 2017. |
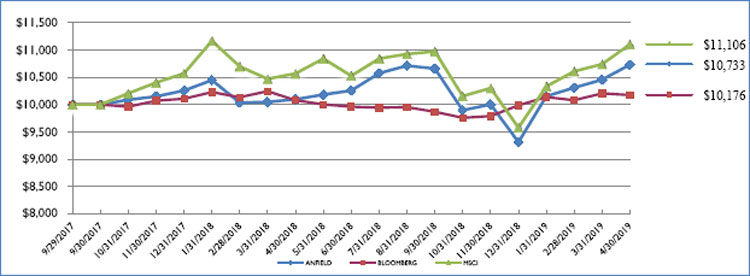
Comparison of the Change in Value of a $10,000 Investment
3
| Anfield Capital Diversified Alternatives ETF |
| PORTFOLIO REVIEW (Unaudited)(Continued) |
| April 30, 2019 |
| Portfolio Composition as of April 30, 2019: | ||||
| Compositions | Percentage of Net Assets | |||
| Closed-End Funds | 19.2 | % | ||
| Real Estate | 14.6 | % | ||
| Listed Business Development Companies | 12.2 | % | ||
| Preferred | 9.7 | % | ||
| Broad Market | 6.9 | % | ||
| Healthcare | 4.7 | % | ||
| Global Allocation | 3.5 | % | ||
| Emerging Markets | 3.4 | % | ||
| Equity Hedge Diversified | 3.4 | % | ||
| Index Related | 3.1 | % | ||
| Other Assets Less Liabilities | 19.3 | % | ||
| 100.0 | % | |||
Please refer to the Schedule of Investments in this Annual Report for a detailed analysis of the Fund’s holdings.
4
| Anfield Capital Diversified Alternatives ETF |
| SCHEDULE OF INVESTMENTS |
| April 30, 2019 |
| Shares | Fair Value | |||||||
| COMMON STOCKS - 14.5% | ||||||||
| FINANCIALS - 2.3% | ||||||||
| 29,086 | Blackstone Group LP | $ | 1,147,734 | |||||
| LISTED BUSINESS DEVELOPMENT COMPANIES - 12.2% | ||||||||
| 200,994 | Ares Capital Corp. | 3,617,892 | ||||||
| 63,969 | Main Street Capital Corp. | 2,524,856 | ||||||
| 6,142,748 | ||||||||
| TOTAL COMMON STOCKS (Cost $6,737,463) | 7,290,482 | |||||||
| CLOSED-END FUNDS - 19.2% | ||||||||
| 57,431 | AllianzGI Equity & Convertible Income Fund | 1,264,056 | ||||||
| 107,864 | Cushing Renaissance Fund | 1,779,756 | ||||||
| 130,897 | Eaton Vance Tax-Managed Buy-Write Opportunities Fund | 2,015,814 | ||||||
| 18,434 | Neuberger Berman Real Estate Securities Income Fund | 91,156 | ||||||
| 184,514 | Nuveen All Cap Energy MLP Opportunities Fund | 1,223,328 | ||||||
| 300,144 | Oxford Lane Capital Corp. | 3,265,567 | ||||||
| TOTAL CLOSED-END FUNDS (Cost $9,849,935) | 9,639,677 | |||||||
| EXCHANGE TRADED FUNDS - 60.9% | ||||||||
| BROAD MARKET - 6.9% | ||||||||
| 17,467 | iShares Edge MSCI USA Size Factor ETF | 1,595,611 | ||||||
| 52,770 | iShares MSCI Saudi Arabia ETF | 1,854,866 | ||||||
| 3,450,477 | ||||||||
| CONSERVATIVE ALLOCATION - 1.1% | ||||||||
| 31,928 | YieldShares High Income ETF | 571,831 | ||||||
| EMERGING MARKETS - 3.4% | ||||||||
| 59,436 | iShares MSCI Frontier 100 ETF | 1,684,416 | ||||||
| EQUITY HEDGE DIVERSIFIED - 3.4% | ||||||||
| 43,434 | First Trust Exchange-Traded Fund III-First Trust Long/Short Equity ETF | 1,731,279 | ||||||
| GLOBAL ALLOCATION - 3.5% | ||||||||
| 105,181 | Arrow Dow Jones Global Yield ETF | 1,747,519 | ||||||
| HEALTHCARE - 4.7% | ||||||||
| 18,065 | Invesco Dynamic Biotechnology & Genome ETF | 942,852 | ||||||
| 24,202 | iShares Global Healthcare ETF | 1,442,197 | ||||||
| 2,385,049 | ||||||||
| INDEX RELATED - 3.1% | ||||||||
| 28,823 | SPDR Bloomberg Barclays Convertible Securities ETF | 1,542,031 | ||||||
| LARGE-CAP - 3.0% | ||||||||
| 69,845 | Invesco S&P 500 BuyWrite ETF | 1,496,778 | ||||||
| MATERIALS - 2.6% | ||||||||
| 19,746 | iShares Global Materials ETF | 1,297,312 | ||||||
| PREFERRED - 9.7% | ||||||||
| 132,587 | iShares Preferred & Income Securities ETF | 4,855,336 | ||||||
| REAL ESTATE - 14.6% | ||||||||
| 66,858 | iShares Mortgage Real Estate ETF | 2,951,112 | ||||||
| 81,787 | IQ US Real Estate Small Cap ETF | 2,053,672 | ||||||
| 26,994 | Vanguard Real Estate ETF | 2,342,269 | ||||||
| 7,347,053 | ||||||||
See accompanying notes to financial statements.
5
| Anfield Capital Diversified Alternatives ETF |
| SCHEDULE OF INVESTMENTS (Continued) |
| April 30, 2019 |
| Shares | Fair Value | |||||||
| EXCHANGE TRADED FUNDS - 60.9% (Continued) | ||||||||
| RETAIL - 2.7% | ||||||||
| 25,879 | ProShares Long Online/Short Stores ETF * | $ | 1,363,083 | |||||
| TECHNOLOGY - 2.2% | ||||||||
| 18,042 | First Trust Cloud Computing ETF | 1,095,871 | ||||||
| TOTAL EXCHANGE TRADED FUNDS(Cost $29,668,211) | 30,568,035 | |||||||
| EXCHANGE TRADED NOTE - 2.1% | ||||||||
| 14,249 | VelocityShares Daily Inverse VIX Medium Term ETN * | 1,075,087 | ||||||
| TOTAL EXCHANGE TRADED NOTE(Cost $962,256) | 1,075,087 | |||||||
| REAL ESTATE INVESTMENT TRUST (REIT) - 2.5% | ||||||||
| 22,546 | CyrusOne, Inc. | 1,255,587 | ||||||
| TOTAL REAL ESTATE INVESTMENT TRUST (REIT) (Cost $1,247,341) | 1,255,587 | |||||||
| TOTAL INVESTMENTS - 99.2% (Cost $48,465,206) | $ | 49,828,868 | ||||||
| OTHER ASSETS LESS LIABILITIES - 0.8% | 389,907 | |||||||
| NET ASSETS - 100.0% | $ | 50,218,775 | ||||||
ETF - Exchange Traded Fund
ETN - Exchange Traded Note
LP - Limited Partnership
| * | Non-income producing securities. |
| FUTURES CONTRACTS | ||||||||||||||||
| Short | Notional | Unrealized | ||||||||||||||
| Contracts | Description | Maturity | Counterparty | Value ** | Depreciation | |||||||||||
| 10 | S&P 500 E-Mini Future | June 2019 | Interactive Brokers | $ | 1,474,250 | $ | (5,588 | ) | ||||||||
| Net Unrealized Depreciation on Future Contracts | $ | (5,588 | ) | |||||||||||||
| ** | The amounts shown are the underlying reference notional amounts to stock exchange indices and equities upon which the fair value of the futures contracts held by Anfield Capital Diversified Alternatives ETF are based. Notional values do not represent the current fair value of, and are not necessarily indicative of the future cash flows of Anfield Capital Diversified Alternatives ETF’s futures contracts. Further, the underlying price changes in relation to the variables specified by the notional values affects the fair value of these derivative financial instruments. The notional values as set forth within this schedule do not purport to represent economic value at risk to Anfield Capital Diversified Alternatives ETF. |
See accompanying notes to financial statements.
6
| Anfield Capital Diversified Alternatives ETF |
| STATEMENT OF ASSETS AND LIABILITIES |
| April 30, 2019 |
| ASSETS | ||||
| Investment securities: | ||||
| At cost | $ | 48,465,206 | ||
| At fair value | $ | 49,828,868 | ||
| Cash | 112,755 | |||
| Deposits at broker for futures contracts | 301,248 | |||
| Dividends receivable | 57,052 | |||
| Prepaid expenses and other assets | 310 | |||
| TOTAL ASSETS | 50,300,233 | |||
| LIABILITIES | ||||
| Investment advisory fees payable | 36,225 | |||
| Payable to related parties | 6,628 | |||
| Unrealized depreciation on futures contracts | 5,588 | |||
| Accrued expenses and other liabilities | 33,017 | |||
| TOTAL LIABILITIES | 81,458 | |||
| NET ASSETS | $ | 50,218,775 | ||
| Net Assets Consist Of: | ||||
| Paid in capital (a) | $ | 49,594,453 | ||
| Accumulated earnings | 624,322 | |||
| NET ASSETS | $ | 50,218,775 | ||
| Net Asset Value Per Share: | ||||
| Shares: | ||||
| Net Assets | $ | 50,218,775 | ||
| Shares of beneficial interest outstanding (a) | 4,900,000 | |||
| Net asset value (Net Assets ÷ Shares Outstanding), offering price and redemption price per share | $ | 10.25 | ||
| (a) | Unlimited number of shares of beneficial interest authorized, no par value. |
See accompanying notes to financial statements.
7
| Anfield Capital Diversified Alternatives ETF |
| STATEMENT OF OPERATIONS |
| For the Year Ended April 30, 2019 |
| INVESTMENT INCOME | ||||
| Dividends | $ | 1,782,772 | ||
| TOTAL INVESTMENT INCOME | 1,782,772 | |||
| EXPENSES | ||||
| Investment advisory fees | 288,344 | |||
| Legal fees | 57,618 | |||
| Administrative services fees | 42,833 | |||
| Compliance officer fees | 23,772 | |||
| Printing and postage expenses | 14,515 | |||
| Audit fees | 17,486 | |||
| Transfer agent fees | 11,017 | |||
| Custodian fees | 18,427 | |||
| Trustees’ fees and expenses | 3,020 | |||
| Insurance expense | 1,792 | |||
| Other expenses | 8,786 | |||
| TOTAL EXPENSES | 487,610 | |||
| Less: Fees waived and expenses reimbursed by the Advisor | (18,173 | ) | ||
| NET EXPENSES | 469,437 | |||
| NET INVESTMENT INCOME | 1,313,335 | |||
| REALIZED AND UNREALIZED GAIN (LOSS) ON INVESTMENTS | ||||
| Net realized loss from investments | (889,726 | ) | ||
| Net realized loss from futures contracts | (20 | ) | ||
| Distributions of realized gains by underlying investment companies | 21,554 | |||
| Net change in unrealized appreciation on investments | 2,250,595 | |||
| Net change in unrealized depreciation on futures contracts | (5,588 | ) | ||
| NET REALIZED AND UNREALIZED GAIN ON INVESTMENTS | 1,376,815 | |||
| NET INCREASE IN NET ASSETS RESULTING FROM OPERATIONS | $ | 2,690,150 | ||
See accompanying notes to financial statements.
8
| Anfield Capital Diversified Alternatives ETF |
| STATEMENTS OF CHANGES IN NET ASSETS |
| For the | For the | |||||||
| Year Ended | Period Ended | |||||||
| April 30, 2019 | April 30, 2018 * | |||||||
| FROM OPERATIONS | ||||||||
| Net investment income | $ | 1,313,335 | $ | 280,237 | ||||
| Distributions of realized gains by underlying investment companies | 21,554 | 4,261 | ||||||
| Net realized loss from investments and futures contracts | (889,746 | ) | — | |||||
| Net change in unrealized appreciation (depreciation) on investments and futures contracts | 2,245,007 | (886,933 | ) | |||||
| Net increase (decrease) in net assets resulting from operations | 2,690,150 | (602,435 | ) | |||||
| DISTRIBUTIONS TO SHAREHOLDERS | ||||||||
| From net investment income | — | (271,057 | ) | |||||
| Total distributions paid ** | (1,238,228 | ) | — | |||||
| Net decrease in net assets from distributions to shareholders | (1,238,228 | ) | (271,057 | ) | ||||
| FROM SHARES OF BENEFICIAL INTEREST | ||||||||
| Proceeds from shares sold | 25,265,770 | 26,295,837 | ||||||
| Payments for shares redeemed | (1,921,262 | ) | — | |||||
| Net increase in net assets from shares of beneficial interest | 23,344,508 | 26,295,837 | ||||||
| TOTAL INCREASE IN NET ASSETS | 24,796,430 | 25,422,345 | ||||||
| NET ASSETS | ||||||||
| Beginning of Year/Period | 25,422,345 | — | ||||||
| End of Year/Period *** | $ | 50,218,775 | $ | 25,422,345 | ||||
| SHARE ACTIVITY | ||||||||
| Shares Sold | 2,550,000 | 2,550,000 | ||||||
| Shares Redeemed | (200,000 | ) | — | |||||
| Net increase in shares from beneficial interest outstanding | 2,350,000 | 2,550,000 | ||||||
| * | The Anfield Capital Diversified Alternatives ETF commenced operations on September 28, 2017. |
| ** | Distributions from net investment income and net realized capital gains are combined for the year ended April 30, 2019. See “Recent Accounting Pronouncements and Reporting Updates” in the Notes to Financial Statements for more information. The dividends and distributions to shareholders for the period ended April 30, 2018 have not been reclassified to conform to the current year presentation. |
| *** | Net Assets - End of Period includes distributions in excess of net investment income of $36,582 for Anfield Capital Diversified Alternatives ETF as of April 30, 2018. |
See accompanying notes to financial statements.
9
| Anfield Capital Diversified Alternatives ETF |
| FINANCIAL HIGHLIGHTS |
| Per Share Data and Ratios for a Share of Beneficial Interest Outstanding Throughout each Year or Period Presented |
| For the | For the | |||||||
| Year Ended | Period Ended | |||||||
| April 30, 2019 | April 30, 2018 (a) | |||||||
| Net asset value, beginning of year/period | $ | 9.97 | $ | 10.00 | ||||
| Activity from investment operations: | ||||||||
| Net investment income (b) | 0.36 | 0.17 | ||||||
| Net realized and unrealized loss on investments | 0.05 | (0.02 | ) | |||||
| Total from investment operations | 0.41 | 0.15 | ||||||
| Less distributions from: | ||||||||
| Net investment income | (0.13 | ) | (0.18 | ) | ||||
| Total distributions | (0.13 | ) | (0.18 | ) | ||||
| Net asset value, end of year/period | $ | 10.25 | $ | 9.97 | ||||
| Market price, end of year/period | $ | 10.23 | $ | 9.97 | ||||
| Total return (c)(d) | 6.30 | % | 0.96 | % (e)(f) | ||||
| Market Price Total return (c)(d) | 6.07 | % | 0.86 | % (e) | ||||
| Net assets, end of year/period (000s) | $ | 50,219 | $ | 25,422 | ||||
| Ratio of gross expenses to average net assets (h) | 1.35 | % | 2.13 | % (g) | ||||
| Ratio of net expenses to average net assets | 1.30 | % | 1.30 | % (g) | ||||
| Ratio of net investment income to average net assets (i) | 3.64 | % | 2.83 | % (g) | ||||
| Portfolio Turnover Rate | 50 | % | 0 | % (e) | ||||
| (a) | The Anfield Capital Diversified Alternatives ETF shares commenced operations on September 28, 2017. |
| (b) | Per share amounts calculated using the average shares method, which more appropriately presents the per share data for the year/period. |
| (c) | Total return is calculated assuming a purchase of shares at net asset value on the first day and a sale at net asset value on the last day of the year/period. Distributions are assumed, for the purpose of this calculation, to be reinvested at the ex-dividend date net asset value per share on their respective payment dates. Total return would have been lower absent fee waiver/expense reimbursement. |
| (d) | Includes adjustments in accordance with accounting principles generally accepted in the United States and, consequently, the net asset value for financial reporting purposes and the returns based upon those net asset values may differ from the net asset values and returns for shareholder transactions. |
| (e) | Not annualized. |
| (f) | Represents total return based on net asset values per share from commencement of investment operations on September 28, 2017 through April 30, 2018. Total return based on net asset value per share, as of the close of business on the day of commencement of trading on the BATS on September 29, 2017 through April 30, 2018 was 0.96%. |
| (g) | Annualized. |
| (h) | Represents the ratio of expenses to average net assets absent fee waivers and/or expense reimbursements by the Adviser. |
| (i) | Recognition of net investment income by the Fund is affected by the timing of the declaration of dividends by the underlying investment companies in which the Fund invests. |
See accompanying notes to financial statements.
10
| Anfield Capital Diversified Alternatives ETF |
| NOTES TO FINANCIAL STATEMENTS |
| April 30, 2019 |
| (1) | ORGANIZATION |
The Anfield Capital Diversified Alternatives ETF (the “Fund”) is a series of shares of beneficial interest of the Two Roads Shared Trust (the “Trust”), a statutory trust organized under the laws of the State of Delaware on June 8, 2012, and is registered under the Investment Company Act of 1940, as amended (the “1940 Act”), as a diversified, open-end management investment company. The Fund commenced operations on September 28, 2017. The Fund is an actively managed exchange traded fund (“ETF”) that is a fund of funds. The Fund’s investment objective is to seek to provide capital growth and income. It seeks to achieve its investment objective by investing primarily in alternative asset classes and securities that represent sectors, market segments or asset classes that do not represent the general investment universe.
| (2) | SIGNIFICANT ACCOUNTING POLICIES |
The following is a summary of significant accounting policies followed by the Fund in the preparation of its financial statements. These policies are in conformity with accounting principles generally accepted in the United States of America (“GAAP”), and require management to make estimates and assumptions that affect the reported amounts of assets and liabilities and disclosure of contingent assets and liabilities at the date of the financial statements and the reported amounts of increases and decreases in net assets from operations during the reporting period. Actual results could differ from those estimates. The Fund is an investment company and accordingly follows the investment company accounting and reporting guidance of the Financial Accounting Standards Board (FASB) Accounting Standard Codification Topic 946 “Financial Services – Investment Companies” including FASB Accounting Standard Update ASU 2013-08.
Security Valuation – Securities listed on an exchange are valued at the last reported sale price at the close of the regular trading session of the exchange on the business day the value is being determined, or in the case of securities listed on NASDAQ at the NASDAQ Official Closing Price. In the absence of a sale such securities shall be valued at the mean between the current bid and ask prices on the day of valuation. Short-term debt obligations having 60 days or less remaining until maturity, at time of purchase may be valued at amortized cost (which approximates fair value). Futures contracts listed for trading on a securities exchange or board of trade (whether domestic or foreign) for which market quotations are readily available shall be valued at the final settled price for the respective futures or futures options or, if no settled price is available, at the last sale price as of the close of business prior to the valuation time. Investments in open-end investment companies are valued at net asset value.
The Fund may hold securities, such as private investments, interests in commodity pools, other non-traded securities or temporarily illiquid securities, for which market quotations are not readily available or are determined to be unreliable. These securities will be valued using the “fair value” procedures approved by the Board. The Board has delegated execution of these procedures to a fair value team composed of one or more representatives from each of the (i) Trust, (ii) administrator, and (iii) advisor. The team may also enlist third party consultants such a valuation specialist at a public accounting firm, valuation consultant or financial officer of a security issuer on an as-needed basis to assist in determining a security-specific fair value. The Board has also engaged a third party valuation firm to, as needed, attend valuation meetings held by the Trust, review minutes of such meetings and report to the Board on a quarterly basis. The Board reviews and ratifies the execution of this process and the resultant fair value prices at least quarterly to assure the process produces reliable results.
Fair Valuation Process –The applicable investments are valued collectively via inputs from each group within the fair value team. For example, fair value determinations are required for the following securities: (i) securities for which market quotations are insufficient or not readily available on a particular business day (including securities for which there is a short and temporary lapse in the provision of a price by the regular pricing source); (ii) securities for which, in the judgment of the advisor, the prices or values available do not represent the fair value of the instrument; factors which may cause the advisor to make such a judgment include, but are not limited to, the following: only a bid price or an asked price is available; the spread between bid and asked prices is substantial; the frequency of sales; the thinness of the market; the size of reported trades; and actions of the
11
| Anfield Capital Diversified Alternatives ETF |
| NOTES TO FINANCIAL STATEMENTS (Continued) |
| April 30, 2019 |
securities markets, such as the suspension or limitation of trading; (iii) securities determined to be illiquid; and (iv) securities with respect to which an event that will affect the value thereof has occurred (a “significant event”) since the closing prices were established on the principal exchange on which they are traded, but prior to a Fund’s calculation of its net asset value. Specifically, interests in commodity pools or managed futures pools are valued on a daily basis by reference to the closing market prices of each futures contract or other asset held by a pool, as adjusted for pool expenses. Restricted or illiquid securities, such as private investments or non-traded securities are valued via inputs from the advisor based upon the current bid for the security from two or more independent dealers or other parties reasonably familiar with the facts and circumstances of the security (who should take into consideration all relevant factors as may be appropriate under the circumstances). If the advisor is unable to obtain a current bid from such independent dealers or other independent parties, the fair value team shall determine the fair value of such security using the following factors: (i) the type of security; (ii) the cost at date of purchase; (iii) the size and nature of the Fund’s holdings; (iv) the discount from market value of unrestricted securities of the same class at the time of purchase and subsequent thereto; (v) information as to any transactions or offers with respect to the security; (vi) the nature and duration of restrictions on disposition of the security and the existence of any registration rights; (vii) how the yield of the security compares to similar securities of companies of similar or equal creditworthiness; (viii) the level of recent trades of similar or comparable securities; (ix) the liquidity characteristics of the security; (x) current market conditions; and (xi) the market value of any securities into which the security is convertible or exchangeable.
Valuation of Underlying Funds – The Fund may invest in portfolios of open-end or closed-end investment companies (the “Underlying Funds”). Investment companies are valued at their respective net asset values as reported by such investment companies. Open-end investment companies value securities in their portfolios for which market quotations are readily available at their market values (generally the last reported sale price) and all other securities and assets at their fair value to the methods established by the board of directors of the open-end funds. The shares of many closed-end investment companies and ETFs, after their initial public offering, frequently trade at a price per share, which is different than the net asset value per share. The difference represents a market premium or market discount of such shares. There can be no assurances that the market discount or market premium on shares of any closed-end investment company or ETF purchased by the Fund will not change.
Exchange Traded Funds – The Fund may invest in ETFs, are a type of fund bought and sold on a securities exchange. An ETF trades like common stock and represents a fixed portfolio of securities. The risks of owning an ETF generally reflect the risks of owning the underlying securities in which it invests, although the lack of liquidity on an ETF could result in it being more volatile. Additionally, ETFs have fees and expenses that reduce their value.
Exchange Traded Notes – The Funds may invest in exchange traded notes (“ETNs”). ETNs are a type of debt security that is linked to the performance of underlying securities. The risks of owning ETNs generally reflect the risks of owning the underlying securities they are designed to track. In addition, ETNs are subject to credit risk generally to the same extent as debt securities.
Time Deposits – Time deposits are issued by a depository institution in exchange for the deposit of funds. The issuer agrees to pay the amount deposited plus interest to the depositor on the date specified with respect to the deposit. Time deposits do not trade in the secondary market prior to maturity. However, some time deposits may be redeemable prior to maturity and may be subject to withdrawal penalties.
In unusual circumstances, securities may be valued at their fair value as determined in good faith by the Trust’s Fair Value Committee and in accordance with the Trust’s Portfolio Securities Valuation Procedures (the “Procedures”). The Board will review the fair value method in use for securities requiring a fair market value determination at least quarterly. The Procedures consider, among others, the following factors to determine a security’s fair value: the nature and pricing history (if any) of the security; whether any dealer quotations for the security are available; and possible valuation methodologies that could be used to determine the fair value of the security.
12
| Anfield Capital Diversified Alternatives ETF |
| NOTES TO FINANCIAL STATEMENTS (Continued) |
| April 30, 2019 |
The Fund utilizes various methods to measure the fair value of all of its investments on a recurring basis. GAAP establishes a hierarchy that prioritizes inputs to valuation methods. The three levels of input are:
Level 1 – Unadjusted quoted prices in active markets for identical assets and liabilities that the Fund has the ability to access.
Level 2 – Observable inputs other than quoted prices included in Level 1 that are observable for the asset or liability, either directly or indirectly. These inputs may include quoted prices for the identical instrument on an inactive market, prices for similar instruments, interest rates, prepayment speeds, credit risk, yield curves, default rates and similar data.
Level 3 – Unobservable inputs for the asset or liability, to the extent relevant observable inputs are not available, representing the Fund’s own assumptions about the assumptions a market participant would use in valuing the asset or liability, and would be based on the best information available.
The availability of observable inputs can vary from security to security and is affected by a wide variety of factors, including, for example, the type of security, whether the security is new and not yet established in the marketplace, the liquidity of markets, and other characteristics particular to the security. To the extent that valuation is based on models or inputs that are less observable or unobservable in the market, the determination of fair value requires more judgment. Accordingly, the degree of judgment exercised in determining fair value is greatest for instruments categorized in Level 3.
The inputs used to measure fair value may fall into different levels of the fair value hierarchy. In such cases, for disclosure purposes, the level in the fair value hierarchy within which the fair value measurement falls in its entirety, is determined based on the lowest level input that is significant to the fair value measurement in its entirety.
The inputs or methodology used for valuing securities are not necessarily an indication of the risk associated with investing in those securities. The following tables summarize the inputs used as of April 30, 2019 for the Fund’s assets and liabilities measured at fair value:
| Assets* | Level 1 | Level 2 | Level 3 | Total | ||||||||||||
| Common Stocks | $ | 7,290,482 | $ | — | $ | — | $ | 7,290,482 | ||||||||
| Closed-End Funds | 9,639,677 | — | — | 9,639,677 | ||||||||||||
| Exchange Traded Funds | 30,568,035 | — | — | 30,568,035 | ||||||||||||
| Exchange Traded Note | 1,075,087 | — | — | 1,075,087 | ||||||||||||
| Real Estate Investment Trust (REIT) | 1,255,587 | — | — | 1,255,587 | ||||||||||||
| Total | $ | 49,828,868 | $ | — | $ | — | $ | 49,828,868 | ||||||||
| Liabilities* | Level 1 | Level 2 | Level 3 | Total | ||||||||||||
| Futures contracts** | $ | 5,588 | $ | — | $ | — | $ | 5,588 | ||||||||
The Fund did not hold any Level 3 securities during the period.
| * | Refer to the Schedule of Investments for portfolio composition. |
| ** | Net depreciation of futures contracts is reported in the table above. |
13
| Anfield Capital Diversified Alternatives ETF |
| NOTES TO FINANCIAL STATEMENTS (Continued) |
| April 30, 2019 |
Offsetting of Financial Assets and Derivative Assets
The Fund’s policy is to recognize a net asset or liability equal to the net variation margin for futures contracts. During the year ended April 30, 2019, the Fund was not subject to any master netting arrangements. The following table shows additional information regarding the offsetting of assets and liabilities at April 30, 2019 for the Fund.
| Gross Amounts Not Offset in the Statement of | ||||||||||||||||||||||||
| Liabilities: | Assets & Liabilities | |||||||||||||||||||||||
| Net Amounts of | ||||||||||||||||||||||||
| Gross Amounts Offset | Liabilities Presented in | |||||||||||||||||||||||
| Gross Amounts of | in the Statement of | the Statement of Assets | Cash Collateral | |||||||||||||||||||||
| Description | Recognized Liabilities | Assets & Liabilities | & Liabilities | Financial Instruments | Pledged * | Net Amount | ||||||||||||||||||
| Futures Contracts | $ | (5,588 | ) | $ | — | $ | (5,588 | ) | $ | — | $ | 5,588 | $ | — | ||||||||||
| Total | $ | (5,588 | ) | $ | — | $ | (5,588 | ) | $ | — | $ | 5,588 | $ | — | ||||||||||
| * | Collateral pledged is limited to the net outstanding amount due to/from one individual counterparty. The actual collateral amounts pledged may exceed these amounts and fluctuate in value. Total cash collateral pledged for futures contracts is $301,248. |
Impact of Derivatives on the Statements of Assets and Liabilities and Statements of Operations
The derivative instruments outstanding as of April 30, 2019 as disclosed in the Schedule of Investments and the amounts of realized and changes in unrealized gains and losses on derivative instruments during the period as disclosed in the Statements of Operations serve as indicators of the volume of derivative activity for the Fund.
The following is a summary of the location of derivative investments on the Fund’s Statements of Assets and Liabilities as of April 30, 2019:
| Liability Derivatives | ||||||
| Contract Type/Primary | ||||||
| Risk Exposure | Balance Sheet Location | Fair Value | ||||
| Equity Contract | Unrealized depreciation on futures contracts | $ | (5,588 | ) | ||
The following is a summary of the location of derivative investments on the Fund’s Statements of Operations as of April 30, 2019:
| Derivative Investment Type | Location of Gain (Loss) on Derivatives | |
| Equity Futures Contracts | Net realized loss from futures contracts; | |
| Net change in unrealized depreciation on futures contracts |
The following is a summary of the Fund’s realized loss and unrealized depreciation on derivative investments recognized in the Statements of Operations categorized by primary risk exposure for the year ended April 30, 2019:
| Realized loss on derivatives recognized in the Statements of Operations | ||||||||
| Total for the | ||||||||
| Derivative Investment Type | Equity Risk | Year ended April 30, 2019 | ||||||
| Futures contracts | $ | (20 | ) | $ | (20 | ) | ||
| Net change in unrealized depreciation on derivatives recognized in the Statements of Operations | ||||||||
| Total for the | ||||||||
| Derivative Investment Type | Equity Risk | Year ended April 30, 2019 | ||||||
| Futures contracts | $ | (5,588 | ) | $ | (5,588 | ) | ||
14
| Anfield Capital Diversified Alternatives ETF |
| NOTES TO FINANCIAL STATEMENTS (Continued) |
| April 30, 2019 |
Security Transactions and Related Income
Security transactions are accounted for on trade date basis. Interest income is recognized on an accrual basis. Discounts are accreted and premiums are amortized on securities purchased over the lives of the respective securities. Dividend income is recorded on the ex-dividend date. Realized gains or losses from sales of securities are determined by comparing the identified cost of the security lot sold with the net sales proceeds.
Dividends and Distributions to Shareholders
Ordinarily, dividends from net investment income, if any, are declared and paid monthly by the Fund. The Fund distributes its net realized capital gains, if any, to shareholders annually. Dividends from net investment income and distributions from net realized gains are recorded on ex-dividend date and determined in accordance with federal income tax regulations, which may differ from GAAP. These “book/tax” differences are considered either temporary (i.e., deferred losses, capital loss carry forwards) or permanent in nature. To the extent these differences are permanent in nature, such amounts are reclassified within the composition of net assets based on their federal tax-basis treatment; temporary differences do not require reclassification.
Federal Income Taxes
The Fund intends to continue to comply with the requirements of the Internal Revenue Code applicable to regulated investment companies and to distribute all of its taxable income to its shareholders. Therefore, no provision for federal income tax is required. The Fund recognizes the tax benefits of uncertain tax positions only where the position is “more likely than not” to be sustained assuming examination by tax authorities. Management has analyzed the Fund’s tax positions and has concluded that no liability for unrecognized tax benefits should be recorded related to uncertain tax positions taken on returns filed for the open tax year ended April 30, 2018, or expected to be taken in the Fund’s April 30, 2019 year-end tax returns. The Fund identified its major tax jurisdictions as U.S. Federal and foreign jurisdictions where the Fund makes significant investments. The Funds are not aware of any tax positions for which it is reasonably possible that the total amounts of unrecognized tax benefits will change materially in the next twelve months.
Expenses
Expenses of the Trust that are directly identifiable to a specific fund are charged to that fund. Expenses, which are not readily identifiable to a specific fund, are allocated in such a manner as deemed equitable (as determined by the Board), taking into consideration the nature and type of expense and the relative sizes of the funds in the Trust.
Indemnification
The Trust indemnifies its officers and trustees for certain liabilities that may arise from the performance of their duties to the Fund and Trust. Additionally, in the normal course of business, the Fund enters into contracts that contain a variety of representations and warranties which provide general indemnities. The Fund’s maximum exposure under these arrangements is unknown, as this would involve future claims that may be made against the Fund that have not yet occurred. However, the Fund expects the risk of loss due to these warranties and indemnities to be remote.
| (3) | INVESTMENT TRANSACTIONS |
For the year ended April 30, 2019, cost of purchases and proceeds from sales of portfolio securities (excluding in-kind transactions and short-term investments) for the Fund amounted to $16,470,277 and $16,065,100. For the year ended April 30, 2019, cost of purchases and proceeds from sales of portfolio securities for in-kind transactions, amounted to $24,856,103 and $1,883,824.
15
| Anfield Capital Diversified Alternatives ETF |
| NOTES TO FINANCIAL STATEMENTS (Continued) |
| April 30, 2019 |
| (4) | INVESTMENT ADVISORY AGREEMENT AND TRANSACTIONS WITH RELATED PARTIES |
Regents Park Funds, LLC serves as the Fund’s investment adviser (the “Adviser”). Pursuant to an Investment Advisory Agreement with the Fund, the Adviser, subject to the authority of the Board, is responsible for managing the day to day operations of the Fund, including: selecting the overall investment strategies; monitoring and evaluating Sub-Adviser (as defined below) performance; and providing related administrative services and facilities. Anfield Group, LLC (“Anfield Group”), which is wholly owned by the David Young and Sandra G. Glain Family Trust, wholly owns Regents Park. As compensation for its services, the Fund pays to the Adviser an annual advisory fee (computed daily and paid monthly) at an annual rate of 0.80% of its average daily net assets. For the year ended April 30, 2019, the Fund incurred Advisory Fees of $288,344.
The Adviser has engaged Anfield Capital Management, LLC (“Anfield” or the “Sub-Adviser”) to serve as Sub-Adviser to the Fund. Anfield Group owns a 92% majority interest in Anfield. The Sub-Adviser is an affiliate of the Adviser. The Sub-Adviser, with respect to the portion of the Fund’s assets allocated to the Sub-Adviser, is responsible for selecting investments and assuring that investments are made in accordance with the Fund’s investment objective, policies and restrictions. The Adviser compensates the Sub-Adviser for its services from the management fees received from the Fund, which are computed and accrued daily and paid monthly and do not impact the financial statements of the Fund.
The Adviser, pursuant to an Expense Limitation Agreement (the “Agreement”) has contractually agreed to reduce the Fund’s fees and/or absorb expenses of the Fund until at least September 30, 2019 to ensure that total annual Fund operating expenses after fee waiver and reimbursement (exclusive of any taxes, interest, brokerage commissions, expenses incurred in connection with any merger or reorganization, indirect expenses, expenses of other investment companies in which the Fund may invest, or extraordinary expenses such as litigation) will not exceed 1.30% of average daily net assets. This Agreement may be terminated by the Fund’s Board of Trustees on 60 days’ written notice to the Adviser. These fee waivers and expense reimbursements are subject to possible recoupment from the Fund in future years on a rolling three-year basis (within the three years after the fees have been waived or reimbursed) if such recoupment can be achieved within the foregoing expense limits. No reimbursement amount will be paid to the Adviser in any fiscal quarter unless the Board has determined in advance that a reimbursement is in the best interest of the Fund and its shareholders.
For the fiscal year ended April 30, 2019 the Adviser waived fees in the amount of $18,173. As of the Fund’s most recent fiscal year end, April 30, 2019, fee waivers subject to recoupment by the Adviser are $100,343; $82,170 expiring during the fiscal year ending April 30, 2021 and $18,173 expiring in the fiscal year ended April 30, 2022.
The Trust, with respect to the Fund, has adopted a distribution and service plan (“Plan”) pursuant to Rule 12b-1 under the 1940 Act. Under the Plan, the Fund is authorized to pay distribution fees to Northern Lights Distibutors, LLC (the “Distributor” or “NLD”) and other firms that provide distribution and shareholder services (“Service Providers”). If a Service Provider provides these services, the Fund may pay fees at an annual rate not to exceed 0.25% of average daily net assets, pursuant to Rule 12b-1 under the 1940 Act.
No distribution or service fees are currently paid by the Fund and there are no current plans to impose these fees. In the event Rule 12b-1 fees were charged, over time they would increase the cost of an investment in the Fund.
In addition, certain affiliates of the Distributor provide services to the Fund as follows:
Gemini Fund Services, LLC (“GFS”), an affiliate of the Distributor, provides administration and fund accounting services to the Trust. Pursuant to separate servicing agreements with GFS, the Fund pays GFS customary fees for providing administration and fund accounting services to the Fund. Certain officers of the Trust are also officers of GFS, and are not paid any fees directly by the Fund for servicing in such capacities.
16
| Anfield Capital Diversified Alternatives ETF |
| NOTES TO FINANCIAL STATEMENTS (Continued) |
| April 30, 2019 |
BluGiant, LLC (“BluGiant”), BluGiant, an affiliate of GFS and the Distributor, provides EDGAR conversion and filing services as well as print management services for the Fund on an ad-hoc basis. For the provision of these services, BluGiant receives customary fees from the Fund.
Northern Lights Compliance Services, LLC (“NLCS”), an affiliate of GFS and the Distributor, provides a Chief Compliance Officer to the Trust, as well as related compliance services, pursuant to a consulting agreement between NLCS and the Trust. Under the terms of such agreement, NLCS receives customary fees from the Fund.
Effective February 1, 2019, NorthStar Financial Services Group, LLC, the parent company of GFS and its affiliated companies including NLD, NLCS and BluGiant (collectively, the “Gemini Companies”), sold its interest in the Gemini Companies to a third party private equity firm that contemporaneously acquired Ultimus Fund Solutions, LLC (an independent mutual fund administration firm) and its affiliates (collectively, the “Ultimus Companies”). As a result of these separate transactions, the Gemini Companies and the Ultimus Companies are now indirectly owned through a common parent entity, The Ultimus Group, LLC.
| (5) | DISTRIBUTIONS TO SHAREHOLDERS AND TAX COMPONENTS OF CAPITAL |
The Statement of Assets and Liabilities represents cost for financial reporting purposes. Aggregate cost for federal tax purposes is $48,653,744 for the Anfield Capital Diversified Alternatives ETF, and differs from market value by net unrealized appreciation (depreciation) which consisted of:
| Gross unrealized appreciation: | $ | 2,148,967 | ||
| Gross unrealized depreciation: | $ | (979,431 | ) | |
| Net unrealized appreciation: | $ | 1,169,536 | ||
The tax character of Fund distributions paid for the fiscal years ended April 30, 2019 and April 30, 2018 was as follows:
| Fiscal Year Ended | Fiscal Year Ended | |||||||
| April 30, 2019 | April 30, 2018 | |||||||
| Ordinary Income | $ | 1,227,453 | $ | 266,953 | ||||
| Long-Term Capital Gain | — | 4,104 | ||||||
| Return of Capital | 10,775 | — | ||||||
| $ | 1,238,228 | $ | 271,057 | |||||
As of April 30, 2019, the components of accumulated earnings/(deficit) on a tax basis were as follows:
| Undistributed | Undistributed | Post October Loss | Capital Loss | Other | Unrealized | Total | ||||||||||||||||||||
| Ordinary | Long-Term | and | Carry | Book/Tax | Appreciation/ | Accumulated | ||||||||||||||||||||
| Income | Gains | Late Year Loss | Forwards | Differences | (Depreciation) | Earnings/(Deficits) | ||||||||||||||||||||
| $ | — | $ | — | $ | — | $ | (545,214 | ) | $ | — | $ | 1,169,536 | $ | 624,322 | ||||||||||||
The difference between book basis and tax basis undistributed net investment income/(loss), accumulated net realized gain/(loss), and unrealized appreciation/(depreciation) from investments is primarily attributable to the tax deferral of losses on wash sales, mark-to-market on futures contracts, and adjustments for partnerships and C-Corporation return of capital distributions.
17
| Anfield Capital Diversified Alternatives ETF |
| NOTES TO FINANCIAL STATEMENTS (Continued) |
| April 30, 2019 |
At April 30, 2019, the Fund had capital loss carry forwards for federal income tax purposes available to offset future capital gains as follows:
| Non-Expiring | Non-Expiring | |||||||||
| Short-Term | Long-Term | Total | ||||||||
| $ | 545,214 | $ | — | $ | 545,214 | |||||
Permanent book and tax differences, primarily attributable to tax adjustments for realized gain/(loss) on in-kind redemptions, the reclassification of Fund distributions, and adjustments for partnerships and C-Corporation return of capital distributions resulted in reclassification for the year ended April 30, 2019 as follows:
| Paid In | Accumulated | |||||
| Capital | Earnings (Losses) | |||||
| $ | (18,868 | ) | $ | 18,868 | ||
| (6) | CAPITAL SHARE TRANSACTIONS |
Shares are not individually redeemable and may be redeemed by the Fund at NAV only in large blocks known as “Creation Units.” Shares are created and redeemed by the Fund only in Creation Unit size aggregations of 25,000 shares. Only Authorized Participants or transactions done through an Authorized Participant are permitted to purchase or redeem Creation Units from the Fund. An Authorized Participant is either (i) a broker-dealer or other participant in the clearing process through the Continuous Net Settlement System of the National Securities Clearing Corporation or (ii) a DTC participant and, in each case, must have executed a Participant Agreement with the Distributor. Such transactions are generally permitted on an in-kind basis, with a balancing cash component to equate the transaction to the NAV per share of the Fund on the transaction date. Cash may be substituted equivalent to the value of certain securities generally when they are not available in sufficient quantity for delivery, not eligible for trading by the Authorized Participant or as a result of other market circumstances. In addition, the Fund may impose transaction fees on purchases and redemptions of Fund shares to cover the custodial and other costs incurred by the Funds in effecting trades. A fixed fee payable to the Custodian may be imposed on each creation and redemption transaction regardless of the number of Creation Units involved in the transaction (“Fixed Fee”). Purchases and redemptions of Creation Units for cash or involving cash-in-lieu are required to pay an additional variable charge to compensate the Fund and its ongoing shareholders for brokerage and market impact expenses relating to Creation Unit transactions (“Variable Charge,” and together with the Fixed Fee, the “Transaction Fees”). Transactions in capital shares for the Fund are disclosed in the Statements of Changes in Net Assets.
The Transaction Fees for the Fund are listed in the table below:
| Fee for In-Kind and Cash Purchases | Maximum Additional Variable Charge for | ||||
| Cash Purchases* | |||||
| $250 | 2.00% |
| * | The maximum Transaction Fee may be up to 2.00% of the amount invested. |
| (7) | PRINCIPLE INVESTMENT RISKS |
The Fund’s investments in securities, financial instruments and derivatives expose it to various risks, certain of which are discussed below. Please refer to the Fund’s prospectus and statement of additional information for a full listing of risks associated with the Fund’s investments which include, but are not limited to: authorized participant concentration risk, commodity risk, convertible securities risk, cybersecurity risk, derivatives risk, emerging markets risk, energy risks, foreign securities risk, futures risk, gap risk, leverage risk, limited history of operations
18
| Anfield Capital Diversified Alternatives ETF |
| NOTES TO FINANCIAL STATEMENTS (Continued) |
| April 30, 2019 |
risk, management risk, newly-formed company risk, options risk, preferred stock risk, REITs risk, securities market risk, and small and medium capitalization stock risk.
Underlying Fund Risk – Each underlying fund, including each ETF, is subject to specific risks, depending on the nature of the underlying fund. These risks could include liquidity risk, sector risk, foreign and related currency risk, as well as risks associated with real estate investments and commodities. Investors in the Fund will indirectly bear fees and expenses charged by the underlying investment companies in which the Fund invests in addition to the Fund’s direct fees and expenses.
BDC Risk –BDCs have little or no operating history and may carry risks similar to those of a private equity or venture capital fund. BDC company securities are not redeemable at the option of the shareholder and they may trade in the market at a discount to their net asset value. A significant portion of a BDC’s investments are recorded at fair value as determined by its board of directors, which may create uncertainty as to the value of the BDC’s investments. Non-traded BDCs are illiquid and it may not be possible to redeem shares or to do so without paying a substantial penalty. Publicly-traded BDCs usually trade at a discount to their net asset value because they invest in unlisted securities and have limited access to capital markets.
Derivatives Risk – The derivative instruments in which the Fund may invest, including futures, options, credit default swaps, total return swaps, repurchase agreements and other similar instruments, may be more volatile than other instruments. The risks associated with investments in derivatives also include liquidity, interest rate, market, credit and management risks, mispricing or improper valuation. Changes in the market value of the derivative may not correlate perfectly with the underlying asset, rate or index, and the Fund could lose more than the principal amount invested. In addition, if a derivative is being used for hedging purposes there can be no assurance given that each derivative position will achieve a perfect correlation with the security or currency against which it is being hedged, or that a particular derivative position will be available when sought by the portfolio manager.
ETF Structure Risks:The Fund is structured as an ETF and as a result is subject to the special risks, including:
| ● | Not Individually Redeemable. Shares are not individually redeemable and may be redeemed by the Fund at NAV only in large blocks known as “Creation Units.” You may incur brokerage costs purchasing enough Shares to constitute a Creation Unit. |
| ● | Trading Issues.Trading in Shares on the Cboe BZX Exchange, Inc. (the “Exchange”) may be halted due to market conditions or for reasons that, in the view of the Exchange, make trading in Shares inadvisable, such as extraordinary market volatility. There can be no assurance that Shares will continue to meet the listing requirements of the Exchange. An active trading market for the Fund’s shares may not be developed or maintained. If the Fund’s shares are traded outside a collateralized settlement system, the number of financial institutions that can act as authorized participants that can post collateral on an agency basis is limited, which may limit the market for the Fund’s shares. |
| ● | Market Price Variance Risk.The market prices of Shares will fluctuate in response to changes in NAV and supply and demand for Shares and will include a “bid-ask spread” charged by the exchange specialists, market makers or other participants that trade the particular security. There may be times when the market price and the NAV vary significantly and you may pay more than NAV when buying Shares on the secondary market, and you may receive less than NAV when you sell those Shares. The market price of Shares, like the price of any exchange-traded security, includes a “bid-ask spread” charged by the exchange specialists, market makers or other participants that trade the particular security. In times of severe market disruption, the bid-ask spread often increases significantly. This means that Shares may trade at a discount to NAV and the discount is likely to be greatest when the price of Shares is falling fastest, which may be the time that you most want to sell your Shares. The Fund’s investment results are measured based upon the daily NAV of the Fund over a period of time. Investors purchasing and selling Shares in the secondary market may not experience investment results consistent with those experienced by those creating and redeeming directly with the Fund. |
19
| Anfield Capital Diversified Alternatives ETF |
| NOTES TO FINANCIAL STATEMENTS (Continued) |
| April 30, 2019 |
| ● | In times of market stress, market makers may step away from their role market making in shares of ETFs and in executing trades, which can lead to differences between the market value of Fund shares and the Fund’s NAV. |
| ● | The market price for the Fund’s shares may deviate from the Fund’s net asset value, particularly during times of market stress, with the result that investors may pay significantly more or significantly less for Fund shares than the Fund’s NAV, which is reflected in the bid and ask price for Fund shares or in the closing price. |
| ● | When all or a portion of an ETFs underlying securities trade in a market that is closed when the market for the Fund’s shares is open, there may be changes from the last quote of the closed market and the quote from the Fund’s domestic trading day, which could lead to differences between the market value of the Fund’s shares and the Fund’s NAV. |
| ● | In stressed market conditions, the market for the Fund’s shares may become less liquid in response to the deteriorating liquidity of the Fund’s portfolio. This adverse effect on the liquidity of the Fund’s shares may, in turn, lead to differences between the market value of the Fund’s shares and the Fund’s NAV. |
Fluctuation of Net Asset Value Risk:The NAV of the Fund’s shares will generally fluctuate with changes in the market value of the Fund’s holdings. The market prices of the Shares will generally fluctuate in accordance with changes in NAV as well as the relative supply of and demand for the shares on the Exchange. The Fund’s Sub- Adviser cannot predict whether the shares will trade below, at or above their NAV. Price differences may be due, in large part, to the fact that supply and demand forces at work in the secondary trading market for the Shares will be closely related to, but not identical to, the same forces influencing the prices of the Fund’s holdings trading individually or in the aggregate at any point in time. In addition, unlike conventional ETFs, the Fund is not an index fund. The Fund is actively managed and does not seek to replicate the performance of a specified index. Index based ETFs have generally traded at prices which closely correspond to NAV per share. Actively managed ETFs have a limited trading history and, therefore, there can be no assurance as to whether and/or the extent to which the Shares will trade at premiums or discounts to NAV.
| (8) | RECENT ACCOUNTING PRONOUNCEMENTS AND REPORTING UPDATES |
In August 2018, the FASB issued No. 2018-13, which changes certain fair value measurement disclosure requirements. The new ASU, in addition to other modifications and additions, removes the requirement to disclose the amount and reasons for transfers between Level 1 and Level 2 of the fair value hierarchy, and the policy for the timing of transfers between levels. For investment companies, the amendments are effective for financial statements issued for fiscal years beginning after December 15, 2019, and interim periods within those fiscal years. Early adoption is allowed. These amendments have been adopted with these financial statements.
In August 2018, the Securities and Exchange Commission adopted amendments to certain disclosure requirements under Regulation S-X to conform to US GAAP, including: (i) an amendment to require presentation of the total, rather than the components, of distributable earnings on the Statement of Assets and Liabilities; and (ii) an amendment to require presentation of the total, rather than the components, of distributions to shareholders, except for tax return of capital distributions, on the Statement of Changes in Net Assets. The amendments also removed the requirement for parenthetical disclosure of undistributed net investment income on the Statement of Changes in Net Assets. These amendments have been adopted with these financial statements.
20
| Anfield Capital Diversified Alternatives ETF |
| NOTES TO FINANCIAL STATEMENTS (Continued) |
| April 30, 2019 |
| (9) | SUBSEQUENT EVENTS |
Subsequent events after the Statement of Assets and Liabilities date have been evaluated through the date the financial statements were issued. Management has determined that no events or transactions occurred requiring adjustment or disclosure in the financial statements.
21
Report of Independent Registered Public Accounting Firm
To the Board of Trustees of Two Roads Shared Trust
and the Shareholders of Anfield Capital Diversified Alternatives EFT
Opinion on the Financial Statements
We have audited the accompanying statement of assets and liabilities, including the schedule of investments, of Anfield Capital Diversified Alternatives ETF (the Fund), as of April 30, 2019, and the related statement of operations for the year then ended, the statements of changes in net assets and financial highlights, including the related notes, for the year then ended and for the period from September 28, 2017 (commencement of operations) through April 30, 2018 (collectively, the financial statements). In our opinion, the financial statements present fairly, in all material respects, the financial position of the Fund as of April 30, 2019, and the results of its operations, the changes in its net assets and financial highlights for the year then ended and for the period from September 28, 2017 (commencement of operations) through April 30, 2018, in conformity with accounting principles generally accepted in the United States of America.
Basis for Opinion
These financial statements are the responsibility of the Fund’s management. Our responsibility is to express an opinion on the Fund’s financial statements based on our audit. We are a public accounting firm registered with the Public Company Accounting Oversight Board (United States) (PCAOB) and are required to be independent with respect to the Fund in accordance with the U.S. federal securities laws and the applicable rules and regulations of the Securities and Exchange Commission and the PCAOB.
We conducted our audit in accordance with the standards of the PCAOB. Those standards require that we plan and perform the audit to obtain reasonable assurance about whether the financial statements are free of material misstatement, whether due to error or fraud. The Fund is not required to have, nor were we engaged to perform, an audit of its internal control over financial reporting. As part of our audit, we are required to obtain an understanding of internal control over financial reporting but not for the purpose of expressing an opinion on the effectiveness of the Fund’s internal control over financial reporting. Accordingly, we express no such opinion.
Our audit included performing procedures to assess the risks of material misstatement of the financial statements, whether due to error or fraud, and performing procedures that respond to those risks. Such procedures included examining, on a test basis, evidence regarding the amounts and disclosures in the financial statements. Our audit also included evaluating the accounting principles used and significant estimates made by management, as well as evaluating the overall presentation of the financial statements. Our procedures included confirmation of securities owned as of April 30, 2019, by correspondence with the custodians and brokers. We believe that our audit provides a reasonable basis for our opinion.
/s/ RSM US LLP
We have served as the auditor to one or more of the Regent Park advised investment companies since 2015.
Denver, Colorado
July 1, 2019
22
| Anfield Capital Diversified Alternatives ETF |
| ADDITIONAL INFORMATION (Unaudited) |
| April 30, 2019 |
Approval of Advisory Agreement – Anfield Capital Diversified Alternatives ETF
At a meeting held on March 6 and 7, 2019 (the “Meeting”), the Board of Trustees (the “Board”) of Two Roads Shared Trust (the “Trust”), including all of those trustees who are not “interested persons” of the Trust (as such term is defined in the 1940 Act), which independent Trustees constitute all of the Trustees, considered the approval of an investment advisory agreement (the “Advisory Agreement”) between Regents Park Funds, LLC (“Regents Park” or the “Adviser”) and the Trust, and an investment sub-advisory agreement (the “Sub-Advisory Agreement,” and with the Advisory Agreement, the “Agreements”) between Anfield Capital Management, LLC (“Anfield” or the “Sub-Adviser”) and the Trust, each on behalf of the Anfield Capital Diversified Alternatives ETF (the “Fund”), a series of the Trust.
In connection with the Board’s consideration of the Agreements, the Board received written materials in advance of the Meeting, which included information regarding: (i) the nature, extent, and quality of services provided to the Fund by the Adviser and the Sub-Adviser; (ii) a description of the Adviser’s and Sub-Adviser’s investment management personnel; (iii) an overview of the Adviser’s and Sub-Adviser’s respective operations and financial condition; (iv) a description of the Adviser’s and Sub-Adviser’s brokerage practices (including any soft dollar arrangements); (v) a comparison of the Fund’s advisory fee and overall expenses with those of comparable mutual funds; (vi) the level of profitability from the Adviser’s and Sub-Adviser’s fund-related operations; (vii) the Adviser’s and Sub-Adviser’s respective compliance policies and procedures, including policies and procedures for personal securities transactions, business continuity and information security; and (viii) information regarding the performance record of the Fund as compared to other funds with similar investment strategies.
Throughout the process, including at the meeting, the Board had numerous opportunities to ask questions of and request additional materials from the Adviser and Sub-Adviser. During the Meeting, the Board was advised by, and met in executive session with, the Board’s independent legal counsel, and received a memorandum from such independent counsel regarding its responsibilities under applicable law.
Matters considered by the Board in connection with its approval of the Agreements included, among others, the following:
Nature, Extent and Quality of Services. The Board reviewed materials provided by Regents Park related to the Advisory Agreement with respect to the Fund, including the Advisory Agreement; an overview of the personnel that perform services for the Fund and their background and experience; a review of the financial condition of Regents Park; information regarding risk management processes and liquidity management; the compliance policies and procedures of Regents Park, including its business continuity and cybersecurity policies and a Code of Ethics that contained provisions reasonably necessary to prevent Access Persons, as that term is defined in Rule 17j-1 under the 1940 Act, from engaging in conduct prohibited by Rule 17j-1(b); the use of an outside compliance consultant; information regarding Regent Park’s compliance and regulatory history; and an independent report prepared by Broadridge analyzing the performance record, fees and expenses of the Fund as compared to those of a peer group of other mutual funds with similar investment strategies as selected by Broadridge. The Board also noted that on a regular basis it received and reviewed information from the Trust’s CCO regarding the Fund’s compliance policies and procedures established pursuant to Rule 38a-1 under the Investment Company Act of 1940, which included evaluating the regulatory compliance systems of the Adviser and procedures reasonably designed to assure compliance with the federal securities laws.
The Board considered that Regents Park acted as the investment adviser to the Fund, and delegated day-to–day investment decisions of the Fund to Anfield as the Fund’s Sub-Adviser. The Board considered the oversight and supervisory role performed by Regents Park for the Fund, and noted that Regents Park generally provided management, compliance and operational support to the Fund, and had formed a Sub-Adviser Oversight Committee to accomplish these functions. The Board considered that in connection with its oversight of Anfield, Regents Park received daily reports from the Sub-Adviser. The Board also considered Regents Park’s policies and procedures in the areas of business continuity and with respect to information systems security and the Trust’s CCO’s review and
23
| Anfield Capital Diversified Alternatives ETF |
| ADDITIONAL INFORMATION (Unaudited) (Continued) |
| April 30, 2019 |
evaluation of the same, which found them to be satisfactory. In addition, the Board considered its familiarity with Regents Park’s personnel obtained from the Board’s oversight of the Fund and of other funds in the Trust advised by Regents Park or Anfield, as well as the affiliation between Regents Park and Anfield and any potential conflicts of interest with the Sub-Advisers.
The Board concluded that the management of Regents Park had the skills, experience and sophistication necessary to effectively oversee Anfield and concluded that Regents Park had sufficient quality and depth of personnel, resources, and compliance policies and procedures for performing its duties.
The Board considered the materials submitted by Anfield related to the Sub-Advisory Agreement, including the Sub-Advisory Agreement; an overview of the Fund’s investment strategies, including a description of the manner in which investment decisions were made and executed; risk management processes and liquidity management; information relating to Anfield’s financial condition; an overview of the personnel that perform services for the Fund and their background and experience, including the portfolio management team with respect to the Fund and the Sub-Adviser’s compliance policies and procedures, inclusive of its business continuity policy and cybersecurity policy and a Code of Ethics containing provisions reasonably necessary to prevent Access Persons, as that term is defined in Rule 17j-1 under the 1940 Act, from engaging in conduct prohibited by Rule 17j-1(b).
The Board considered Anfield’s current level of staffing and the firm’s overall resources, as well as information received relating to the Sub-Adviser’s internal compensation program. The Board considered the qualifications, experience and performance of Anfield’s investment and compliance personnel who provide services to the Fund and noted the overlap between certain personnel at Anfield and Regents Park. The Board also considered, among other things, Anfield’s compliance programs and any disciplinary history and noted Anfield’s risk assessment and monitoring processes. The Board considered the Sub-Adviser’s policies and procedures in the areas of business continuity and with respect to information systems security and the Trust’s CCO’s review and evaluation of the same, which found them to be satisfactory. The Board took into account the recent changes and enhancements made at Anfield with respect to its compliance program and operational staff. The Board also reviewed the Sub-Adviser’s regulatory history, including whether it was involved in any regulatory actions or investigations as well as material litigation, and any settlements and amelioratory actions undertaken, as appropriate. The Board noted that the Trust’s CCO and his staff conducted regular, periodic compliance reviews with the Sub-Adviser and presented reports to the Board regarding the same, which included evaluating the regulatory compliance systems of the Sub-Adviser and procedures reasonably designed to assure compliance with the federal securities laws. After discussion and taking into account the report provided by the CCO, the Board concluded that Anfield had sufficient quality and depth of personnel, resources, investment methods and compliance policies and procedures for performing its duties under its Sub-Advisory Agreement.
Performance. Among other data, the Board considered the performance of the Fund as compared to that of a group of funds that employ a similar investment strategy, as provided by Broadridge, an independent third-party data provider (the “Peer Group”). The Board noted that while it found the data provided by Broadridge generally useful, it recognized the data’s limitations, including in particular that the data may vary depending on the performance-period end-date selected and that the results of the performance comparisons may vary depending on the selection of the performance peer group. The Board also noted Regents Park’s role in monitoring the performance, investment style and risk-adjusted performance of the Sub-Adviser.
With respect to the Fund, the Board considered that Anfield is responsible for the day-to-day management of the Fund’s investment portfolio. Among other data, the Board considered the performance of the Fund for the one-year and since inception periods ended December 31, 2018 as compared to the Fund’s benchmark index and against the Fund’s Peer Group provided by Broadridge. The Board considered that although the Fund had underperformed the median of the Fund’s Peer Group, primary benchmark, and its Morningstar category (multi-alternative) for the one-year period, the Fund had outperformed each of the Peer Group, primary benchmark and Morningstar category and was in the first quartile for the since inception period. The Board also took into account management’s discussion of the Fund’s performance and the relatively short period of time since the Fund had commenced operations, as well as the differences in the Fund’s investment strategy relative to the funds in the Peer
24
| Anfield Capital Diversified Alternatives ETF |
| ADDITIONAL INFORMATION (Unaudited) (Continued) |
| April 30, 2019 |
Group as selected by Broadridge. The Board concluded that the overall performance of the Fund was satisfactory and that Anfield was capable of obtaining an acceptable level of investment returns for shareholders.
Fees and Expenses. As to the costs of the services to be provided by Regents Park and Anfield to the Fund, the Board considered, among other data, a comparison of the Fund’s contractual advisory fee and net expense ratio to those of the Fund’s Peer Group.
The Board noted that with respect to the Fund, Regents Park’s advisory fee was lower than the median of the Peer Group. The Board also noted that the Fund’s net expense ratio was above the median of its Peer Group. The Board took into account that the Adviser had agreed to reimburse expenses to limit net annual operating expenses to 1.30% of the Fund’s average net assets (exclusive of any front-end or contingent deferred loads; brokerage fees and commissions, acquired fund fees and expenses, fees and expenses associated with investments in other collective investment vehicles or derivative instruments (including for example option and swap fees and expenses) borrowing costs (such as interest and dividend expense on securities sold short), taxes, and extraordinary expenses, such as litigation expenses).
With respect to the Fund’s sub-advisory fees, the Board considered that the Fund pays an advisory fee to the Adviser and that, in turn, the Adviser pays a sub-advisory fee to the Sub-Adviser. The Board also took into account the amount of the advisory fee to be retained by Regents Park and the services to be provided with respect to the Fund by the Adviser and the Sub-Adviser. In considering the level of the Fund’s advisory and sub-advisory fee, which is paid by the Adviser and not the Fund, the Board also took into account the cost of other accounts managed by the Adviser and Sub-Adviser that used a similar investment strategy, if any, noting that differences were attributable to the differences in the management of these different kinds of accounts.
The Board also received information regarding the nature and scope (including their significance to the Adviser and its affiliates and to the Sub-Adviser) of any material relationships with respect to the Sub-Adviser and received information and took into account any other potential conflicts of interest the Adviser might have in connection with the Sub-Advisory Agreement with respect to the Fund.
The Board concluded that the contractual advisory fee and sub-advisory fee with respect to the Fund was not unreasonable.
Profitability. The Board considered the profitability of each of Regents Park and Anfield and whether these profits are excessive in light of the services provided to the Fund. The Board reviewed a profitability analysis prepared by each of the Adviser and Sub-Adviser based on the Fund’s current asset levels and concluded that the relationships of Regents Park and Anfield with respect to the Fund were not currently profitable and, therefore, that each entities profitability was not excessive.
Economies of Scale. The Board considered whether any of Regents Park or Anfield would realize economies of scale with respect to its advisory or sub-advisory services provided to the Fund. The Board considered the profitability analyses included in the Board Materials and noted that expenses of managing the Fund as a percentage of assets under management were expected to decrease as the Fund’s assets continue to grow. The Board noted that at current asset levels, economies of scale were not a relevant consideration and that it would revisit whether economies of scale exist in the future once the Fund has achieved sufficient size.
Other Benefits. The Board also considered the character and amount of other direct and incidental benefits to be received by each of Regents Park and Anfield from its association with the Fund. The Board noted that none of Regents Park and Anfield believed they would receive any direct, indirect or ancillary material “fall-out” benefits from its relationship with the Fund, although the Board noted that certain reputational benefits may result from their
25
| Anfield Capital Diversified Alternatives ETF |
| ADDITIONAL INFORMATION (Unaudited) (Continued) |
| April 30, 2019 |
relationships with the Fund. The Board considered these benefits would be expected and appeared not to be unreasonable.
Conclusion. The Board, having requested and received such information from each of Regents Park and Anfield as it believed reasonably necessary to evaluate the terms of the Advisory Agreement and Sub-Advisory Agreement, and having been advised by independent counsel that the Board had appropriately considered and weighed all relevant factors, determined that approval of the Advisory Agreement and Sub-Advisory Agreement with respect to the Fund for an additional one-year term was in the best interests of the Fund and its shareholders. In considering the proposed Advisory Agreement and Sub-Advisory Agreement renewals, the Board did not identify any one factor as all important, and each Independent Trustee may have considered different factors as more important.
26
| Anfield Capital Diversified Alternatives ETF |
| EXPENSE EXAMPLES (Unaudited) |
| April 30, 2019 |
As a shareholder of the Fund, you incur two types of costs: (1) transaction costs for purchasing and selling shares; and (2) ongoing costs, including management fees and other fund expenses. This example is intended to help you understand your ongoing costs (in dollars) of investing in the Fund and to compare these costs with the ongoing costs of investing in other mutual funds.
The Example is based on an investment of $1,000 invested at the beginning of the six-month period and held for the entire six-month period from November 1, 2018 to April 30, 2019 (the ’‘period’’).
Actual Expenses
The first line of the table below provides information about actual account values and actual expenses. You may use the information in this line, together with the amount you invested, to estimate the expenses that you paid over the period. Simply divide your account value by $1,000 (for example, an $8,600 account value divided by $1,000 = 8.6), then multiply the result by the number in the first line under the heading entitled ’‘Expenses Paid During the Period’’ to estimate the expenses you paid on your account during this period.
Hypothetical Example for Comparison Purposes
The second line of the table below provides information about hypothetical account values and hypothetical expenses based on the Fund’s actual expense ratio and an assumed rate of return of 5% per year before expenses, which is not the Fund’s actual return. The hypothetical account values and expenses may not be used to estimate the actual ending account balance or expenses you paid for the period. You may use this information to compare the ongoing costs of investing in the Fund and other funds. To do so, compare this 5% hypothetical example with the 5% hypothetical examples that appear in the shareholder reports of the other funds. Please note that the expenses shown in the table are meant to highlight your ongoing costs only and do not reflect any transactional costs, such as brokerage commissions on purchases or sales of Fund shares. Therefore, the second line of the table is useful in comparing ongoing costs only, and will not help you determine the relative total costs of owning different funds. In addition, if these transactional costs were included, your costs would have been higher.
| Beginning | Ending | Expenses Paid | Expense Ratio | |||||||||||
| Account Value | Account Value | During Period | During the Period | |||||||||||
| Actual | 11/1/18 | 4/30/19 | 11/1/18-4/30/19* | 11/1/18-4/30/19 | ||||||||||
| $1,000.00 | $1,084.50 | $6.72 | 1.30% | |||||||||||
| Beginning | Ending | Expenses Paid | Expense Ratio | |||||||||||
| Hypothetical | Account Value | Account Value | During Period | During the Period | ||||||||||
| (5% return before expenses) | 11/1/18 | 4/30/19 | 11/1/18-4/30/19* | 11/1/18-4/30/19 | ||||||||||
| $1,000.00 | $1,018.35 | $6.51 | 1.30% |
| * | Expenses are equal to the average account value over the period, multiplied by the Fund’s annualized expense ratio, multiplied by the number of days in the period (181) divided by the number of days in the fiscal year (365). |
27
| Anfield Capital Diversified Alternatives ETF |
| SUPPLEMENTAL INFORMATION (Unaudited) |
| April 30, 2019 |
Trustees and Officers. The Trustees and officers of the Trust, together with information as to their principal business occupations during the past five years and other information, are shown below. Unless otherwise noted, the address of each Trustee and Officer is 17645 Wright Street, Suite 200, Omaha, Nebraska 68130.
Independent Trustees *
| Name, Address, Year of Birth | Position(s) Held with Registrant | Term and Length Served | Principal Occupation(s) During Past 5 Years | Number of Portfolios Overseen In The Fund Complex** | Other Directorships Held During Past 5 Years |
| Mark Garbin Year of Birth: 1951 | Trustee | Indefinite, Since 2012 | Managing Principal, Coherent Capital Management LLC (since 2008) | 5 | Northern Lights Fund Trust (since 2013); Northern Lights Variable Trust (for series not affiliated with the Funds since 2013); Forethought Variable Insurance Trust (since 2013); Northern Lights Variable Trust (since 2013); OHA Mortgage Strategies Fund (offshore), Ltd. (2014-2017); and Altegris KKR Commitments Master Fund (since 2014); and OFI Carlyle Private Credit Fund (since March 2018) |
| Mark D. Gersten Year of Birth: 1950 | Chairman, Trustee | Indefinite, Since 2012 | Independent Consultant (since 2012); Senior Vice President – Global Fund Administration Mutual Funds & Alternative Funds, AllianceBernstein LP (1985 – 2011). | 5 | Northern Lights Fund Trust (since 2013); Northern Lights Variable Trust (for series not affiliated with the Funds since 2013); Altegris KKR Commitments Master Fund (since 2014); previously, Ramius Archview Credit and Distressed Fund (2015-2017); and Schroder Global Series Trust (2012 to 2017) |
| Neil M. Kaufman Year of Birth: 1960 | Trustee, Audit Committee Chairman | Indefinite, Since 2012 | Managing Member, Kaufman & Associates, LLC (legal services)(Since 2016); Partner, Abrams Fensterman, Fensterman, Eisman, Formato, Ferrara & Wolf, LLP (legal services) (2010-2016) | 5 | Altegris KKR Commitments Master Fund (since 2014) |
| Anita K. Krug Year of Birth: 1969 | Trustee | Indefinite, Since 2012 | Interim Vice Chancellor for Academic Affairs (since 2018) University of Washington Bothell; Interim Dean (2017-2018), Professor (since 2016), Associate Professor (2014-2016); and Assistant Professor (2010-2014), University of Washington School of Law | 5 | Altegris KKR Commitments Master Fund (since 2014); Centerstone Investors Trust (since 2016) |
| * | Information is as of April 30, 2019. |
| ** | As of April 30, 2019, the Trust was comprised of 20 active portfolios managed by seven unaffiliated investment advisers and two affiliated investment advisers. The term “Fund Complex” applies only to those funds that (i) are advised by a common investment adviser or by an investment adviser that is an affiliated person of the investment adviser of any of the other funds in the Trust or (ii) hold themselves out to investors as related companies for purposes of investment and investor services. The Fund does not hold itself out as related to any other series within the Trust except for the Anfield Universal Fixed Income Fund, which is advised by the Fund’s Sub-Adviser, and the Affinity Small Cap Fund (which liquidated as of the close of business on May 17, 2019), Affinity World Leaders Equity ETF and Anfield Universal Fixed Income ETF, which are advised by the Fund’s adviser. |
4/30/19 – Two Roadsv1
28
| Anfield Capital Diversified Alternatives ETF |
| SUPPLEMENTAL INFORMATION (Unaudited)(Continued) |
| April 30, 2019 |
Officers of the Trust*
| Name, Address, Year of Birth | Position(s) Held with Registrant | Principal Occupation(s) During Past 5 Years | Number of Portfolios Overseen In The Fund Complex** | Other Directorships Held During Past 5 Years |
| James Colantino 80 Arkay Drive Hauppauge, NY 11788 Year of Birth: 1969 | President Since Feb. 2017 Treasurer (2012 to 2017) | Senior Vice President (2012- present); Vice President (2004 to 2012); Gemini Fund Services, LLC. | N/A | N/A |
| Laura Szalyga 80 Arkay Drive Hauppauge, NY 11788 Year of Birth: 1978 | Treasurer Since Feb. 2017 | Vice President, Gemini Fund Services, LLC (since 2015); Assistant Vice President, Gemini Fund Services, LLC (2011-2014). | N/A | N/A |
| Richard A. Malinowski 80 Arkay Drive Hauppauge, NY 11788 Year of Birth: 1983 | Vice President Since Sep. 2018 Secretary Since 2013 | Senior Vice President (since 2017); Vice President and Counsel (2016-2017) and Assistant Vice President (2012 – 2016), Gemini Fund Services, LLC | N/A | N/A |
| William B. Kimme Year of Birth: 1962 | Chief Compliance Officer Since Inception | Senior Compliance Officer, Northern Lights Compliance Services, LLC (September 2011 -present) | N/A | N/A |
| * | Information is as of April 30, 2019. |
| ** | As of April 30, 2019, the Trust was comprised of 20 active portfolios managed by seven unaffiliated investment advisers and two affiliated investment advisers. The term “Fund Complex” applies only to those funds that (i) are advised by a common investment adviser or by an investment adviser that is an affiliated person of the investment adviser of any of the other funds in the Trust or (ii) hold themselves out to investors as related companies for purposes of investment and investor services. The Fund does not hold itself out as related to any other series within the Trust except for the Anfield Universal Fixed Income Fund, which is advised by the Fund’s Sub-Adviser, and the Affinity Small Cap Fund (which liquidated as of the close of business on May 17, 2019), Affinity World Leaders Equity ETF and Anfield Universal Fixed Income ETF, which are advised by the Fund’s adviser. |
The Fund’s Statement of Additional Information (“SAI”) includes additional information about the Trustees and is available free of charge, upon request, by calling toll-free at 1-866-866-4848.
4/30/19 – Two Roadsv1
29
| PRIVACY NOTICE | |||||||||
| FACTS | WHAT DOES TWO ROADS SHARED TRUST DO WITH YOUR PERSONAL INFORMATION | ||||||||
| Why? | Financial companies choose how they share your personal information. Federal law gives consumers the right to limit some but not all sharing. Federal law also requires us to tell you how we collect, share, and protect your personal information. Please read this notice carefully to understand what we do. | ||||||||
| What? | THE TYPES OF PERSONAL INFORMATION WE COLLECT AND SHARE DEPENDS ON THE PRODUCT OR SERVICE THAT YOU HAVE WITH US. THIS INFORMATION CAN INCLUDE: | ||||||||
| ● Social Security number and income | |||||||||
| ● Account transactions and transaction history | |||||||||
| ● Investment experience and purchase history | |||||||||
| When you areno longer our customer, we continue to share your information as described in this notice. | |||||||||
| How? | All financial companies need to share customers’ personal information to run their everyday business. In the section below, we list the reasons financial companies can share their customers’ personal information; the reason Two Roads Shared Trust chooses to share and whether you can limit this sharing. | ||||||||
| Reasons we can share your personal information | Does Two Roads Shared Trust share? | Can you limit this sharing? |
| For our everyday business purposes – such as to process your transactions, maintain your account(s), respond to court orders and legal investigations, or report to credit bureaus | YES | NO |
| For our marketing purposes – to offer our products and services to you | NO | We do not share |
| For joint marketing with other financial companies | NO | We do not share |
| For our affiliates’ everyday business purposes – information about your transactions and experiences | NO | We do not share |
| For our affiliates’ everyday business purposes – information about your creditworthiness | NO | We do not share |
| For our affiliates to market to you | NO | We do not share |
| For nonaffiliates to market to you | NO | We do not share |
| Questions? | Call 1-402-895-1600 | |
30
What we do
| How does Two Roads Shared Trust protect my personal information? | To protect your personal information from unauthorized access and use, we use security measures that comply with federal law. These measures include computer safeguards and secured files and buildings.
Our service providers are held accountable for adhering to strict policies and procedures to prevent any misuse of your nonpublic personal information. |
| How does Two Roads Shared Trust collect my personal information? | We collect your personal information, for example, when you |
| ● open an account or give us contact information | |
| ● provide account information or give us your income information | |
| ● make deposits or withdrawals from your account | |
| We also collect your personal information from other companies. | |
| Why can’t I limit all sharing? | Federal law gives you the right to limit only |
| ● sharing for affiliates’ everyday business purposes – information about your creditworthiness | |
| ● affiliates from using your information to market to you | |
| ● sharing for nonaffiliates to market to you | |
| State laws and individual companies may give you additional rights to limit sharing | |
| Definitions | |
| Affiliates | Companies related by common ownership or control. They can be financial and nonfinancial companies. |
| ● Two Roads Shared Trust has no affiliates. | |
| Nonaffiliates | Companies not related by common ownership or control. They can be financial and nonfinancial companies. |
| ● Two Roads Shared Trust does not share with nonaffiliates so they can market to you. | |
| Joint marketing | A formal agreement between nonaffiliates financial companies that together market financial products or services to you. |
| ● Two Roads Shared Trust does not jointly market. | |
31
Proxy Voting Policy
Information regarding how the Fund votes proxies relating to portfolio securities for the twelve month period ended June 30th as well as a description of the policies and procedures that the Fund used to determine how to vote proxies is available without charge, upon request, by calling 1-866-866-4848 or by referring to the Securities and Exchange Commission’s (“SEC”) website at http://www.sec.gov.
Portfolio Holdings
The Fund files its complete schedule of portfolio holdings with the SEC for the first and third quarters of each fiscal year on Form N-Q (or as an exhibit to its reports on Form N-Q’s successor form, Form N-PORT). Form N-Q and Form N-PORT is available on the SEC’s website athttp://www.sec.gov. The information on Form N-Q and Form N-PORT is available without charge, upon request, by calling 1-866-866-4848.
| Adviser |
| Regents Park Funds, LLC |
| 4041 MacArthur Blvd., Suite 155 |
| Newport Beach, CA 92660 |
| Administrator |
| Gemini Fund Services, LLC |
| 80 Arkay Drive, Suite 110 |
| Hauppauge, NY 11788 |
This report and the financial statements contained herein are submitted for the general information of shareholders and are not authorized for distribution to prospective investors unless preceded or accompanied by an effective prospectus, which contains information about the Fund’s investment objective, risks, fees and expenses. Investors are reminded to read the prospectus carefully before investing in the Fund.
ITEM 2. CODE OF ETHICS.
| (a) | The registrant has, as of the end of the period covered by this report, adopted a code of ethics that applies to the registrant's principal executive officer, principal financial officer, and principal accounting officer or controller, or persons performing similar functions, regardless of whether these individuals are employed by the registrant or a third party. |
| (b) | During the period covered by this report, there were no amendments to any provision of the code of ethics. |
| (c) | During the period covered by this report, there were no waivers or implicit waivers of a provision of the code of ethics. |
ITEM 3. AUDIT COMMITTEE FINANCIAL EXPERT.
| The Registrant’s board of trustees has determined that Mark Gersten is an audit committee financial expert, as defined in Item 3 of Form N-CSR. Mr. Gersten is independent for purposes of this Item 3. |
ITEM 4. PRINCIPAL ACCOUNTANT FEES AND SERVICES.
| (a) | Audit Fees |
| Trust Series | 2019 | 2018 |
| Anfield Capital Diversified Alternatives ETF | $16,500 | $16,000 |
| (b) | Audit-Related Fees – None |
| (c) | Tax Fees |
| Trust Series | 2019 | 2018 |
| Anfield Capital Diversified Alternatives ETF | $3,250 | $3,000 |
| (d) | All Other Fees – None |
| (e)(1) | The audit committee does not have pre-approval policies and procedures. Instead, the audit committee or audit committee chairman approves on a case-by-case basis each audit or non-audit service before the principal accountant is engaged by the registrant. |
| (e)(2) | There were no services described in each of paragraphs (b) through (d) of this Item that were approved by the audit committee pursuant to paragraph (c)(7)(i)(C) of Rule 2-01 of Regulation S-X. |
| f) | Not applicable. The percentage of hours expended on the principal accountant's engagement to audit the registrant's financial statements for the most recent fiscal year that were attributed to work performed by persons other than the principal accountant's full-time, permanent employees was zero percent (0%). |
| (g) | All non-audit fees billed by the registrant's principal accountant for services rendered to the registrant for the fiscal year ended April 30, 2018 are disclosed in (b)-(d) above. There were no audit or non-audit services performed by the registrant's principal accountant for the registrant's adviser. |
ITEM 5. AUDIT COMMITTEE OF LISTED REGISTRANTS.
Not applicable
ITEM 6. SCHEDULE OF INVESTMENT
Included in annual report to shareholders filed under item 1 of this form.
ITEM 7. DISCLOSURE OF PROXY VOTING POLICIES AND PROCEDURES FOR CLOSED-END MANAGEMENT INVESTMENT COMPANIES.
Not applicable Fund is an open-end management investment company
ITEM 8. PORTFOLIO MANAGERS OF CLOSED-END MANAGEMENT INVESTMENT COMPANIES
Not applicable Fund is an open-end management investment company
ITEM 9. PURCHASES OF EQUITY SECURITIES BY CLOSED-END MANAGEMENT INVESTMENT COMPANY AND AFFILIATED PURCHASERS.
Not applicable Fund is an open-end management investment company
ITEM 10. SUBMISSION OF MATTERS TO A VOTE OF SECURITY HOLDERS.
Not applicable at this time.
ITEM 11. CONTROLS AND PROCEDURES.
| (a) | The registrant's principal executive and principal financial officers, or persons performing similar functions, have concluded that the registrant's disclosure controls and procedures (as defined in Rule 30a-3(c) under the 1940 Act, are effective, as of a date within 90 days of the filing date of this report, based on the evaluation of these controls and procedures required by Rule 30a-3(b) under the 1940 Act and Rule 15d-15(b) under the Securities Exchange Act of 1934, as amended. |
| (b) | There were no changes in the registrant's internal control over financial reporting (as defined in Rule 30a-3(d) under the 1940 Act) that occurred during the period covered by this report that have materially affected, or are reasonably likely to materially affect, the registrant's internal control over financial reporting. |
ITEM 12. Disclosure of Securities Lending Activities For Closed-End Management Investment Companies. Not applicable to open-end investment companies.
ITEM 13. EXHIBITS
| (1) | Code of Ethics for Principal Executive and Senior Financial Officers is attached hereto. |
| (2) | Certifications pursuant to Section 302 of the Sarbanes-Oxley Act of 2002 are filed herewith. |
| (3) | Certifications pursuant to Section 906 of the Sarbanes-Oxley Act of 2002 are filed herewith. |
SIGNATURES
Pursuant to the requirements of the Securities Exchange Act of 1934 and the Investment Company Act of 1940, the registrant has duly caused this report to be signed on its behalf by the undersigned, thereunto duly authorized.
Two Roads Shared Trust
| By James Colantino | /s/ James Colantino |
| Principal Executive Officer/President, | |
| Date: July 8, 2019 | |
Pursuant to the requirements of the Securities Exchange Act of 1934 and the Investment Company Act of 1940, this report has been signed below by the following person on behalf of the registrant and in the capacities and on the date indicated.
| By Laura Szalyga | /s/ Laura Szalyga |
| Principal Financial Officer/Treasurer | |
| Date: July 8, 2019 | |