united states
securities and exchange commission
washington, d.c. 20549
form n-csr
certified shareholder report of registered management
investment companies
Investment Company Act file number 811-22718
Two Roads Shared Trust
(Exact name of registrant as specified in charter)
17645 Wright Street, Suite 200, Omaha, NE 68130
(Address of principal executive offices) (Zip code)
Richard Malinowski, Gemini Fund Services, LLC.
80 Arkay Drive Suite 110, Hauppauge, NY 11788
(Name and address of agent for service)
Registrant's telephone number, including area code: 631-470-2734
Date of fiscal year end: 4/30
Date of reporting period:4/30/19
ITEM 1. REPORTS TO SHAREHOLDERS.
HOLBROOK INCOME FUND

Class I Shares (HOBIX)
Investor Class Shares (HOBEX)
| Annual Report |
| April 30, 2019 |
Advised by:
Holbrook Holdings, Inc.
2670 NW Lovejoy St.
Portland, OR 97210
www.holbrookholdings.com
1-877-345-8646
Distributed by Northern Lights Distributors, LLC
Member FINRA
Beginning on January 1, 2021, as permitted by regulations adopted by the Securities and Exchange Commission, paper copies of the Fund’s shareholder reports like this one will no longer be sent by mail, unless you specifically request paper copies of the reports. Instead, the reports will be made available on the Fund’s website www.holbrookholdings.com, and you will be notified by mail each time a report is posted and provided with a website link to access the report.
If you already elected to receive shareholder reports electronically, you will not be affected by this change and you need not take any action. You may elect to receive shareholder reports and other communications from the Fund electronically by contacting your financial intermediary (such as a broker-dealer or bank) or, if you are a direct investor, by following the instructions included with paper Fund documents that have been mailed to you.
6501-NLD-06/10/2019
Holbrook Income Fund Annual Shareholder Letter
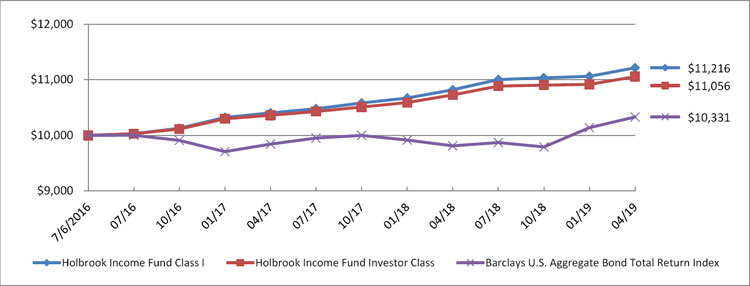
The Holbrook Income Fund (the “Fund”) remains committed to pursuing its investment objectives of providing its shareholders current income and mitigating the risks of a rising interest rate environment. To these ends, we are pleased with our performance for the 2019 calendar year. For the 12-month reporting period ended April 30, 2019, the Holbrook Income Fund had a one-year return of 3.66% net of fees versus its benchmark, the Barclays US Aggregate Bond Total Return Index,1 which returned 5.29% over the same time-period. From its inception date of July 6, 2016 to April 30, 2019, the Holbrook Income Fund had an annualized gain of 4.16% versus its benchmark which had an annualized return of 1.16% for that same period.
We have made some tactical adjustments within the fund given our outlook for the next twelve months. We have positioned the portfolio to take advantage of a few themes. One, we expect the yield curve to steepen over the next twelve months, particularly the spread between the thirty-year treasury rate and the five-year treasury rate. As a result, we have almost 5% of the portfolio in issues whose coupons float based on this spread. We are minimizing our high-yield exposure, which is currently below 5% of the portfolio. And finally, we have decreased our exposure to libor-based floaters in favor of fixed-coupons with maturities between three and five years. We believe the Federal Reserve will embark on a rate-cutting cycle over the next year.
Thank you for your support of the Holbrook Income Fund,

Scott Carmack
CEO Holbrook Holdings Inc.
Portfolio Manager
| 1 | Barclays U.S. Aggregate Bond Total Return Index- The Barclays US Aggregate Bond Total Return Index is a broad-based flagship benchmark that measures the investment grade, US dollar-denominated, fixed-rate taxable bond market. The index includes Treasuries, government-related and corporate securities, MBS (agency fixed-rate and hybrid ARM pass-throughs), ABS and CMBS (agency and non-agency). |
1
| Holbrook Income Fund |
| Portfolio Review (Unaudited) |
| April 30, 2019 |
The Fund’s performance figures* for each period ended April 30, 2019, compared to its benchmark:
| Annualized | ||
| 1 Year Return | Since Inception (a) | |
| Class I | 3.66% | 4.16% |
| Investor Class | 3.05% | 3.63% |
| Bloomberg Barclays U.S. Aggregate Bond Total Return Index (b) | 5.29% | 1.16% |
| * | The performance data quoted here represents past performance. Current performance may be lower or higher than the performance data quoted above. Investment return and principal value will fluctuate, so that shares, when redeemed, may be worth more or less than their original cost. The returns shown do not reflect the deduction of taxes that a shareholder would pay on Fund distributions or on the redemptions of Fund shares. Past performance is no guarantee of future results. Per the fee table in the prospectus dated August 28, 2018, the Fund’s total annual operating expenses are 4.43% for Class I and 4.93% for Investor Class shares. After fee waivers or reimbursements by the Advisor, the Fund’s total annual operating expenses are 1.34% for Class I and 1.84% for Investor Class shares. The Fund’s adviser has contractually agreed to reduce the Fund’s fees and/or absorb expenses of the Fund until at least September 1, 2019 to ensure that total annual Fund operating expenses after fee waiver and reimbursement (exclusive of any taxes, interest, brokerage commissions, expenses incurred in connection with any merger or reorganization, indirect expenses, expenses of other investment companies in which the Fund may invest, or extraordinary expenses such as litigation) will not exceed 1.30% and 1.80% of average daily net assets attributable to Class I shares and Investor Class shares, respectively. This agreement may be terminated by the Fund’s Board of Trustees on 60 days’ written notice to the adviser. These fee waivers and expense reimbursements are subject to possible recoupment from the Fund in future years on a rolling three year basis (within the three years after the fees have been waived or reimbursed) if such recoupment can be achieved within the foregoing expense limits. For performance information current to the most recent month-end, please call toll-free 1-877-345-8646 or visitwww.holbrookholdings.com. |
| (a) | Inception date is July 6, 2016 for Class I and Investor Class. |
| (b) | The Bloomberg Barclays U.S. Aggregate Bond Total Return Index, is made up of the Barclays Capital U.S. Government/Corporate Bond Index, Mortgage-Backed Securities Index, and Asset-Backed Securities Index, including securities that are of investment grade quality or better, have at least one year to maturity, and have an outstanding par value of at least $100 million. Investors cannot invest directly in an index. |
Comparison of the Change in Value of a $10,000 Investment
| Top 10 Holdings by Industry | % of Net Assets | |||
| Investment Companies | 35.9 | % | ||
| Banks | 7.9 | % | ||
| REITs | 5.0 | % | ||
| Financial Services - Closed End Funds | 4.6 | % | ||
| Diversified Financial Services | 4.3 | % | ||
| Retail | 4.1 | % | ||
| Computers | 3.3 | % | ||
| Pharmaceuticals | 3.0 | % | ||
| United States Government Securities | 2.3 | % | ||
| Private Equity | 2.1 | % | ||
| Other Assets Less Liabilities | 27.5 | % | ||
| 100.0 | % | |||
Please refer to the Portfolio of Investments in this Annual report for a detailed analysis of the Fund’s holdings.
2
| Holbrook Income Fund |
| Portfolio of Investments |
| April 30, 2019 |
| Shares | Variable Rate (%) | Coupon % | Maturity | Fair Value | ||||||||||
| PREFERRED STOCK - 45.1% | ||||||||||||||
| BANKS - 1.9% | ||||||||||||||
| 34,568 | Customers Bancorp, Inc. | 3 Month LIBOR + 5.300% | 7.000 | + | Perpetual | $ | 892,891 | |||||||
| COUNTRY FUNDS-CLOSED-END - 2.0% | ||||||||||||||
| 25,440 | Priority Income Fund, Inc. | 6.250 | 12/31/2023 | 638,544 | ||||||||||
| 12,511 | Priority Income Fund, Inc. | 6.375 | 6/30/2025 | 313,526 | ||||||||||
| 952,070 | ||||||||||||||
| DIVERSIFIED FINANCIAL SERVICES - 3.7% | ||||||||||||||
| 14,398 | B. Riley Financial, Inc. | 7.500 | 10/31/2021 | 366,305 | ||||||||||
| 11,357 | B. Riley Financial, Inc. | 7.375 | 5/31/2023 | 300,279 | ||||||||||
| 15,700 | B. Riley Financial, Inc. | 6.875 | 9/30/2023 | 401,920 | ||||||||||
| 11,600 | Medley LLC | 7.250 | 1/30/2024 | 210,540 | ||||||||||
| 10,681 | Medley LLC | 6.875 | 8/15/2026 | 191,831 | ||||||||||
| 10,700 | RAIT Financial Trust | 7.125 | 8/30/2019 | 243,425 | ||||||||||
| 1,714,300 | ||||||||||||||
| FINANCIAL SERVICES-CLOSED END FUNDS - 2.6% | ||||||||||||||
| 7,482 | Eagle Point Credit Co., Inc. | 7.750 | 6/30/2022 | 191,539 | ||||||||||
| 3,336 | Eagle Point Credit Co., Inc. | 6.750 | 9/30/2027 | 85,419 | ||||||||||
| 23,900 | Kayne Anderson MLP/Midstream Investment Co. | 3.500 | 4/15/2020 | 601,802 | ||||||||||
| 13,000 | OFS Credit Co., Inc. | 6.875 | 3/31/2024 | 328,445 | ||||||||||
| 1,207,205 | ||||||||||||||
| GAS - 0.6% | ||||||||||||||
| 10,645 | Global Partners LP | 3 Month LIBOR + 6.774% | 9.750 | + | Perpetual | 270,915 | ||||||||
| INSURANCE - 0.5% | ||||||||||||||
| 13,994 | AmTrust Financial Services, Inc. | 7.750 | Perpetual | 165,829 | ||||||||||
| 7,505 | Atlas Financial Holdings, Inc. | 6.625 | 4/26/2022 | 89,872 | ||||||||||
| 255,701 | ||||||||||||||
| INVESTMENT COMPANIES - 30.2% | ||||||||||||||
| 37,567 | Capital Southwest Corp. | 5.950 | 12/15/2022 | 964,533 | ||||||||||
| 19,600 | Capitala Finance Corp. | 6.000 | 5/31/2022 | 493,332 | ||||||||||
| 31,745 | Capitala Finance Corp. | 5.750 | 5/31/2022 | 811,244 | ||||||||||
| 31,900 | CM Finance, Inc. | 6.125 | 7/1/2023 | 815,045 | ||||||||||
| 22,839 | Fidus Investment Corp. | 6.000 | 2/15/2024 | 575,771 | ||||||||||
| 38,902 | Gladstone Capital Corp. | 6.125 | 11/1/2023 | 999,392 | ||||||||||
| 4,159 | Gladstone Investment Corp. | 6.250 | 9/30/2023 | 105,555 | ||||||||||
| 3,000 | Gladstone Investment Corp. | 6.375 | 8/31/2025 | 77,280 | ||||||||||
| 39,190 | Great Elm Capital Corp. | 6.500 | 9/18/2022 | 992,879 | ||||||||||
| 10,900 | Great Elm Capital Corp. | 6.750 | 1/31/2025 | 276,860 | ||||||||||
| 23,600 | Harvest Capital Credit Corp. | 6.125 | 9/15/2022 | 596,372 | ||||||||||
| 7,011 | Horizon Technology Finance Corp. | 6.250 | 9/15/2022 | 180,078 | ||||||||||
| 11,503 | Medley Capital Corp. | 6.500 | 1/30/2021 | 288,840 | ||||||||||
| 6,989 | Medley Capital Corp. | 6.125 | 3/30/2023 | 174,795 | ||||||||||
| 43,000 | Monroe Capital Corp. | 5.750 | 10/31/2023 | 1,077,150 | ||||||||||
| 17,028 | MVC Capital, Inc. | 6.250 | 11/30/2022 | 437,279 | ||||||||||
| 26,700 | New Mountain Finance Corp. | 5.750 | 10/1/2023 | 680,049 | ||||||||||
| 10,000 | Newtek Business Services Corp. | 7.500 | 9/30/2022 | 264,600 | ||||||||||
| 5,700 | Newtek Business Services Corp. | 6.250 | 3/1/2023 | 146,376 | ||||||||||
| 7,000 | OFS Capital Corp. | 6.500 | 10/31/2025 | 176,400 | ||||||||||
| 20,000 | Oxford Square Capital Corp. | 6.250 | 4/30/2026 | 500,200 | ||||||||||
| 42,000 | Portman Ridge Finance Corp. | 6.125 | 9/30/2022 | 1,062,600 | ||||||||||
| 13,228 | RiverNorth Marketplace Lending Corporation | 5.875 | 10/31/2024 | 333,875 | ||||||||||
| 10,000 | Saratoga Investment Corp. | 6.250 | 8/31/2025 | 255,500 | ||||||||||
| 2,735 | Stellus Capital Investment Corp. | 5.750 | 9/15/2022 | 69,879 | ||||||||||
| 27,498 | THL Credit, Inc. | 6.750 | 12/30/2022 | 696,249 | ||||||||||
| 26,780 | THL Credit, Inc. | 6.125 | 10/30/2023 | 685,300 | ||||||||||
| 10,575 | TriplePoint Venture Growth BDC Corp. | 5.750 | 7/15/2022 | 270,191 | ||||||||||
| 5,000 | WhiteHorse Finance, Inc. | 6.500 | 11/30/2025 | 131,200 | ||||||||||
| 14,138,824 | ||||||||||||||
| REITS - 3.6% | ||||||||||||||
| 35,565 | Ready Capital Corp. | 6.500 | 4/30/2021 | 910,108 | ||||||||||
| 26,520 | Sotherly Hotels LP | 7.250 | 2/15/2021 | 672,150 | ||||||||||
| 8,330 | Wheeler Real Estate Investment Trust, Inc. | 8.750 | Perpetual | 121,285 | ||||||||||
| 1,703,543 | ||||||||||||||
| TOTAL PREFERRED STOCK (Cost - $20,753,432) | 21,135,449 | |||||||||||||
See accompanying notes to financial statements.
3
| Holbrook Income Fund |
| Portfolio of Investments (Continued) |
| April 30, 2019 |
| Principal | Variable Rate (%) | Coupon % | Maturity | Fair Value | ||||||||||
| CORPORATE BONDS - 46.3% | ||||||||||||||
| AUTO MANUFACTURERS - 1.9% | ||||||||||||||
| $ | 200,000 | Ford Motor Credit Co LLC | 3 Month LIBOR + 0.790% | 3.387 | + | 6/12/2020 | $ | 199,804 | ||||||
| 200,000 | Ford Motor Credit Co LLC | 3 Month LIBOR + 0.810% | 3.408 | + | 4/5/2021 | 197,814 | ||||||||
| 500,000 | General Motors Financial Co., Inc. | 3 Month LIBOR + 1.550% | 4.147 | + | 1/14/2022 | 503,312 | ||||||||
| 900,930 | ||||||||||||||
| BANKS - 6.0% | ||||||||||||||
| 15,000 | Bank of America Corp. | 4(CMS30-CMS5-.25) | 0.176 | + | 2/28/2024 | 11,663 | ||||||||
| 46,000 | Bank of America Corp. | CPI YOY + 1.100% | 2.651 | + | 11/19/2024 | 46,978 | ||||||||
| 50,000 | Bank of Nova Scotia | 3.750 | 1/30/2024 | 49,459 | ||||||||||
| 500,000 | Barclays Bank PLC | CPI YOY + 0.800% | 2.351 | + | 8/24/2021 | 493,250 | ||||||||
| 5,000 | Barclays Bank PLC | 4(CMS30-CMS5-.25) | 0.276 | + | 6/17/2033 | 3,170 | ||||||||
| 40,000 | Goldman Sachs Group, Inc. | 4(CMS30-CMS5-.20) | 0.244 | + | 2/11/2028 | 29,044 | ||||||||
| 40,000 | Goldman Sachs Group, Inc. | 4(CMS30-CMS5-.15) | 0.576 | + | 2/28/2028 | 29,328 | ||||||||
| 35,000 | Goldman Sachs Group, Inc. | 4(CMS30-CMS5-.20) | 0.440 | + | 3/22/2028 | 25,301 | ||||||||
| 25,000 | Goldman Sachs Group, Inc. | 4(CMS30-CMS5-.25) | 0.000 | + | 5/23/2028 | 17,757 | ||||||||
| 45,000 | Goldman Sachs Group, Inc. | 4(CMS30-CMS5-.20) | 0.424 | + | 6/6/2028 | 34,079 | ||||||||
| 5,000 | Goldman Sachs Group, Inc. | 5(CMS30-CMS5-.33) | 1.645 | + | 3/19/2029 | 4,103 | ||||||||
| 45,000 | HSBC USA, Inc. | 4.6(CMS30-CMS5-.30) | 1.421 | + | 12/4/2028 | 37,544 | ||||||||
| 120,000 | JPMorgan Chase & Co. | 4(CMS30-CMS5-.275) | 0.168 | + | 9/20/2023 | 107,160 | ||||||||
| 815,000 | Manufacturers & Traders Trust Co. | 1 Month LIBOR + 1.215% | 3.694 | + | 12/28/2020 | 815,473 | ||||||||
| 100,000 | Morgan Stanley | CPI YOY + 2.000% | 3.551 | + | 5/17/2023 | 100,625 | ||||||||
| 100,000 | Morgan Stanley | 4(CMS30-CMS5-.20) | 0.604 | + | 6/28/2028 | 69,340 | ||||||||
| 61,000 | Natixis US Medium-Term Note Program LLC | 5(CMS30-CMS5-.34) | 1.690 | + | 9/30/2028 | 41,480 | ||||||||
| 55,000 | Royal Bank of Canada | CPI YOY + 1.000% | 2.520 | + | 1/28/2020 | 55,242 | ||||||||
| 200,000 | UBS AG Jersey Branch | USISDA10 | 2.600 | + | 12/30/2019 | 196,500 | ||||||||
| 350,000 | Wells Fargo & Co. | CPI YOY + 1.000% | 2.863 | + | 2/24/2027 | 330,785 | ||||||||
| 300,000 | Wells Fargo Bank NA | 3 Month LIBOR + 0.510% | 3.102 | + | 10/22/2021 | 301,030 | ||||||||
| 2,799,311 | ||||||||||||||
| BEVERAGES - 0.6% | ||||||||||||||
| 300,000 | Constellation Brands, Inc. | 3 Month LIBOR + 0.700% | 3.384 | + | 11/15/2021 | 300,253 | ||||||||
| CHEMICALS - 1.8% | ||||||||||||||
| 306,000 | DowDuPont, Inc. | 3 Month LIBOR + 0.710% | 3.394 | + | 11/15/2020 | 308,493 | ||||||||
| 500,000 | LyondellBasell Industries NV | 6.000 | 11/15/2021 | 532,896 | ||||||||||
| 841,389 | ||||||||||||||
| COMMERICAL SERVICES - 0.6% | ||||||||||||||
| 300,000 | Equifax, Inc. | 3 Month LIBOR + 0.870% | 3.554 | + | 8/15/2021 | 299,231 | ||||||||
| COMPUTERS - 3.3% | ||||||||||||||
| 800,000 | Apple, Inc. | 3.000 | 2/9/2024 | 808,157 | ||||||||||
| 150,000 | Diebold Nixdorf, Inc. | 8.500 | 4/15/2024 | 126,000 | ||||||||||
| 600,000 | Hewlett Packard Enterprise Co. | 3 Month LIBOR + 0.720% | 3.318 | + | 10/5/2021 | 600,168 | ||||||||
| 1,534,325 | ||||||||||||||
| COSMETICS/PERSONAL CARE - 1.0% | ||||||||||||||
| 500,000 | Colgate-Palmolive Co. | 1.950 | 2/1/2023 | 491,383 | ||||||||||
| DIVERSIFED FINANCIAL SERVICES - 0.6% | ||||||||||||||
| 300,000 | American Express Co. | 3 Month LIBOR + 0.600% | 3.165 | + | 11/5/2021 | 301,483 | ||||||||
| ELECTRONICS - 1.1% | ||||||||||||||
| 500,000 | Tech Data Corp. | 3.700 | 2/15/2022 | 502,879 | ||||||||||
| FINANCIAL SERVICES-CLOSED-END FUNDS - 2.0% | ||||||||||||||
| 950,000 | Nuveen Senior Income Fund | 2.000 | 11/1/2021 | 945,250 | ||||||||||
| FOOD - 1.9% | ||||||||||||||
| 300,000 | Campbell Soup Co. | 3 Month LIBOR + 0.630% | 3.241 | + | 3/15/2021 | 298,912 | ||||||||
| 300,000 | Conagra Brands, Inc. | 3 Month LIBOR + 0.500% | 3.092 | + | 10/9/2020 | 299,280 | ||||||||
| 300,000 | Kraft Heinz Foods Co. | 3 Month LIBOR + 0.570% | 3.267 | + | 2/10/2021 | 300,026 | ||||||||
| 898,218 | ||||||||||||||
| HEALTHCARE - PRODUCTS - 0.6% | ||||||||||||||
| 300,000 | Becton Dickinson and Co. | 3 Month LIBOR + 1.030% | 3.638 | + | 6/6/2022 | 302,042 | ||||||||
| INSURANCE - 1.2% | ||||||||||||||
| 500,000 | Berkshire Hathaway, Inc. | 2.750 | 3/15/2023 | 501,642 | ||||||||||
| 50,000 | Prudential Financial, Inc. | CPI YOY + 2.000% | 3.520 | + | 11/2/2020 | 49,902 | ||||||||
| 551,544 | ||||||||||||||
| INTERNET - 1.1% | ||||||||||||||
| 500,000 | Amazon.com, Inc. | 2.500 | 11/29/2022 | 498,994 | ||||||||||
| INVESTMENT COMPANIES - 3.9% | ||||||||||||||
| 300,000 | FS Investment Corp. | 4.750 | 5/15/2022 | 299,757 | ||||||||||
| 25,000 | Main Street Capital Corp. | 4.500 | 12/1/2019 | 25,143 | ||||||||||
| 1,000,000 | Main Street Capital Corp. | 5.200 | 5/1/2024 | 1,004,031 | ||||||||||
| 500,000 | Owl Rock Capital Corp. | 5.250 | 4/15/2024 | 502,967 | ||||||||||
| 1,831,898 | ||||||||||||||
See accompanying notes to financial statements.
4
| Holbrook Income Fund |
| Portfolio of Investments (Continued) |
| April 30, 2019 |
| Principal | Variable Rate (%) | Coupon % | Maturity | Fair Value | ||||||||||
| CORPORATE BONDS - 46.3% (Continued) | ||||||||||||||
| MACHINERY - DIVERSIFIED - 1.3% | ||||||||||||||
| $ | 300,000 | John Deere Capital Corp. | 3 Month LIBOR + 0.260% | 2.861 | + | 9/10/2021 | $ | 300,084 | ||||||
| 300,000 | Wabtec Corp. | 3 Month LIBOR + 1.300% | 3.911 | + | 9/15/2021 | 300,169 | ||||||||
| 600,253 | ||||||||||||||
| MINING - 1.1% | ||||||||||||||
| 500,000 | Kinross Gold Corp. | 5.950 | 3/15/2024 | 540,630 | ||||||||||
| OIL & GAS - 1.5% | ||||||||||||||
| 579,000 | Phillips 66 | 3 Month LIBOR + 0.600% | 3.246 | + | 2/26/2021 | 579,045 | ||||||||
| 106,000 | Texaco Capital, Inc. | 3 Month LIBOR - 0.225% | 2.340 | + | 11/4/2038 | 105,869 | ||||||||
| 684,914 | ||||||||||||||
| OIL & GAS SERVICES - 0.5% | ||||||||||||||
| 250,000 | SESI LLC | 7.125 | 12/15/2021 | 213,750 | ||||||||||
| PHARMACEUTICALS - 3.0% | ||||||||||||||
| 500,000 | Bristol-Myers Squibb Co. | 3.250 | 11/1/2023 | 506,750 | ||||||||||
| 400,000 | Cardinal Health, Inc. | 3 Month LIBOR + 0.770% | 3.381 | + | 6/15/2022 | 399,154 | ||||||||
| 500,000 | Johnson & Johnson | 2.250 | 3/3/2022 | 497,703 | ||||||||||
| 1,403,607 | ||||||||||||||
| PIPELINES - 0.4% | ||||||||||||||
| 170,000 | Andeavor Logistics LP / Tesoro Logistics Finance Corp. | 6.250 | 10/15/2022 | 175,100 | ||||||||||
| PRIVATE EQUITY - 0.8% | ||||||||||||||
| 400,000 | Hercules Capital, Inc. | 4.625 | 10/23/2022 | 391,582 | ||||||||||
| REITS - 1.4% | ||||||||||||||
| 900,000 | CBL & Associates LP | 5.250 | 12/1/2023 | 643,500 | ||||||||||
| RETAIL - 4.1% | ||||||||||||||
| 600,000 | Dollar Tree, Inc. | 3 Month LIBOR + 0.700% | 3.288 | + | 4/17/2020 | 600,051 | ||||||||
| 800,000 | Walmart, Inc. | 3.400 | 6/26/2023 | 822,431 | ||||||||||
| 500,000 | Walmart, Inc. | 2.850 | 7/8/2024 | 502,889 | ||||||||||
| 1,925,371 | ||||||||||||||
| SEMICONDUCTORS - 1.1% | ||||||||||||||
| 500,000 | Intel Corp. | 2.700 | 12/15/2022 | 501,804 | ||||||||||
| SOFTWARE - 1.7% | ||||||||||||||
| 800,000 | Microsoft Corp. | 2.875 | 2/6/2024 | 808,273 | ||||||||||
| TELECOMMUNICATIONS - 1.8% | ||||||||||||||
| 300,000 | AT&T, Inc. | 3 Month LIBOR + 0.950% | 3.547 | + | 7/15/2021 | 303,438 | ||||||||
| 500,000 | Qwest Corp. | 6.750 | 12/1/2021 | 534,118 | ||||||||||
| 837,556 | ||||||||||||||
| TOTAL CORPORATE BONDS (Cost - $21,802,681) | 21,725,470 | |||||||||||||
| CONVERTIBLE BONDS- 3.3% | ||||||||||||||
| CHEMICALS - 0.2% | ||||||||||||||
| 100,000 | Aceto Corp. | 2.000 | 11/1/2020 | 92,375 | ||||||||||
| INVESTMENT COMPANIES - 1.8% | ||||||||||||||
| 800,000 | BlackRock Capital Investment Corp. | 5.000 | 6/15/2022 | 800,969 | ||||||||||
| 50,000 | Prospect Capital Corp. | 4.750 | 4/15/2020 | 50,560 | ||||||||||
| 851,529 | ||||||||||||||
| PRIVATE EQUITY - 1.3% | ||||||||||||||
| 600,000 | Hercules Capital, Inc. | 4.375 | 2/1/2022 | 597,794 | ||||||||||
| TOTAL CONVERTIBLE BOND (Cost - $1,496,727) | 1,541,698 | |||||||||||||
| Coupon % | Maturity | Fair Value | ||||||||||||
| UNITED STATES GOVERNMENT SECURITIES - 2.3% | ||||||||||||||
| 1,079,250 | ^ | United States Treasury Inflation Indexed Bonds | 0.125 | 4/15/2020 | $ | 1,073,950 | ||||||||
| TOTAL UNITED STATES GOVERNMENT SECURITIES (Cost - $1,067,531) | 1,073,950 | |||||||||||||
| Shares | ||||||||||||||
| SHORT-TERM INVESTMENTS - 3.6% | ||||||||||||||
| 1,689,884 | Fidelity Institutional Money Market Portfolio, Class I, 2.31% * | |||||||||||||
| TOTAL SHORT-TERM INVESTMENTS (Cost - $1,689,884) | 1,689,884 | |||||||||||||
| TOTAL INVESTMENTS - 100.6% (Cost - $46,810,255) | $ | 47,166,451 | ||||||||||||
| LIABILITIES LESS OTHER ASSETS - (0.6)% | (277,005 | ) | ||||||||||||
| NET ASSETS - 100.0% | $ | 46,889,446 | ||||||||||||
| + | Variable rate security, rate shown represents the rate at April 30, 2019. |
| * | Rate shown represents the rate at April 30, 2019, is subject to change and resets daily. |
| ^ | Principal amount for accrual purposes is periodically adjusted based on changes in the Consumer Price Index. |
Perpetual - Perpetual bonds are fixed income instruments without defined maturity dates
LIBOR - London Interbank Offered Rate
CMS5 - 5 Year Swap Rate
CMS30 - 30 Year Swap Rate
CPI YOY - Consumer Price Index Year over Year
USISDA10 - 10 Year Swap Rate
See accompanying notes to financial statements.
5
| Holbrook Income Fund |
| Statement of Assets and Liabilities |
| April 30, 2019 |
| ASSETS | ||||
| Investment securities: | ||||
| At cost | $ | 46,810,255 | ||
| At fair value | $ | 47,166,451 | ||
| Interest receivable | 230,302 | |||
| Receivable for Fund shares sold | 42,514 | |||
| Prepaid expenses and other assets | 22,552 | |||
| TOTAL ASSETS | 47,461,819 | |||
| LIABILITIES | ||||
| Payable for securities purchased | $ | 151,389 | ||
| Payable for Fund shares redeemed | 374,320 | |||
| Dividends payable | 2,112 | |||
| Investment advisory fees payable | 28,349 | |||
| Distribution (12b-1) fees payable | 2,389 | |||
| Payable to related parties | 1,467 | |||
| Accrued expenses and other liabilities | 12,347 | |||
| TOTAL LIABILITIES | 572,373 | |||
| NET ASSETS | $ | 46,889,446 | ||
| NET ASSETS CONSIST OF: | ||||
| Paid in capital | $ | 46,979,005 | ||
| Accumulated earnings | (89,559 | ) | ||
| NET ASSETS | $ | 46,889,446 | ||
| NET ASSET VALUE PER SHARE: | ||||
| Class I Shares: | ||||
| Net Assets | $ | 40,723,719 | ||
| Shares of beneficial interest outstanding [$0 par value, unlimited shares authorized] | 4,020,894 | |||
| Net asset value (Net Assets ÷ Shares Outstanding) and redemption price per share | $ | 10.13 | ||
| Investor Class Shares: | ||||
| Net Assets | $ | 6,165,727 | ||
| Shares of beneficial interest outstanding [$0 par value, unlimited shares authorized] | 608,688 | |||
| Net asset value (Net Assets ÷ Shares Outstanding) and redemption price per share | $ | 10.13 |
See accompanying notes to financial statements.
6
| Holbrook Income Fund |
| Statement of Operations |
| For the Year Ended April 30, 2019 |
| INVESTMENT INCOME | ||||
| Dividend | $ | 855,821 | ||
| Interest | 473,734 | |||
| TOTAL INVESTMENT INCOME | 1,329,555 | |||
| EXPENSES | ||||
| Investment advisory fees | 209,008 | |||
| Distribution (12b-1) fees: | ||||
| Investor Class | 16,699 | |||
| Administrative services fees | 44,259 | |||
| Accounting services fees | 30,674 | |||
| Legal fees | 26,999 | |||
| Compliance officer fees | 20,998 | |||
| Transfer agent fees | 20,601 | |||
| Third party Administration servicing fees | 16,713 | |||
| Audit fees | 16,181 | |||
| Registration fees | 15,976 | |||
| Trustees fees and expenses | 13,404 | |||
| Printing and postage expenses | 10,404 | |||
| Custodian fees | 5,000 | |||
| Insurance expense | 863 | |||
| Other expenses | 3,122 | |||
| TOTAL EXPENSES | 450,901 | |||
| Less: Fees waived by the Advisor | (93,307 | ) | ||
| NET EXPENSES | 357,594 | |||
| NET INVESTMENT INCOME | 971,961 | |||
| REALIZED AND UNREALIZED GAIN (LOSS) ON INVESTMENTS | ||||
| Net realized loss from: | ||||
| Investments | (432,185 | ) | ||
| Realized loss on investments | (432,185 | ) | ||
| Net change in unrealized appreciation on: | ||||
| Investments | 368,047 | |||
| Unrealized appreciation on investments | 368,047 | |||
| NET REALIZED AND UNREALIZED LOSS ON INVESTMENTS | (64,138 | ) | ||
| NET INCREASE IN NET ASSETS RESULTING FROM OPERATIONS | $ | 907,823 |
See accompanying notes to financial statements.
7
| Holbrook Income Fund |
| Statements of Changes in Net Assets |
| For the | For the | |||||||
| Year Ended | Year Ended | |||||||
| April 30, 2019 | April 30, 2018 | |||||||
| FROM OPERATIONS | ||||||||
| Net investment income | $ | 971,961 | $ | 217,264 | ||||
| Net realized gain(loss) from investments | (432,185 | ) | 86,814 | |||||
| Unrealized appreciation/depreciation from investments | 368,047 | (13,983 | ) | |||||
| Net increase in net assets resulting from operations | 907,823 | 290,095 | ||||||
| DISTRIBUTIONS TO SHAREHOLDERS | ||||||||
| From net realized gains: | ||||||||
| Class I | — | (2,732 | ) | |||||
| Investor Class | — | (67 | ) | |||||
| From net investment income: | ||||||||
| Class I | — | (213,966 | ) | |||||
| Investor Class | — | (3,737 | ) | |||||
| Total Distributions paid*: | ||||||||
| Class I | (945,279 | ) | — | |||||
| Investor Class | (124,733 | ) | — | |||||
| Net decrease in net assets resulting from distributions to shareholders | (1,070,012 | ) | (220,502 | ) | ||||
| FROM SHARES OF BENEFICIAL INTEREST | ||||||||
| Proceeds from shares sold: | ||||||||
| Class I | 37,686,322 | 15,559,175 | ||||||
| Investor Class | 7,372,297 | 192,500 | ||||||
| Net asset value of shares issued in reinvestment of distributions: | ||||||||
| Class I | 939,667 | 214,094 | ||||||
| Investor Class | 116,330 | 533 | ||||||
| Payments for shares redeemed: | ||||||||
| Class I | (11,745,537 | ) | (2,148,507 | ) | ||||
| Investor Class | (1,431,821 | ) | (87,975 | ) | ||||
| Net increase in net assets from shares of beneficial interest | 32,937,258 | 13,729,820 | ||||||
| TOTAL INCREASE IN NET ASSETS | 32,775,069 | 13,799,413 | ||||||
| NET ASSETS | ||||||||
| Beginning of Year | 14,114,377 | 314,964 | ||||||
| End of Year** | $ | 46,889,446 | $ | 14,114,377 | ||||
| SHARE ACTIVITY | ||||||||
| Class I: | ||||||||
| Shares Sold | 3,713,978 | 1,535,369 | ||||||
| Shares Reinvested | 93,026 | 21,083 | ||||||
| Shares Redeemed | (1,156,636 | ) | (211,713 | ) | ||||
| Net increase in shares of beneficial interest outstanding | 2,650,368 | 1,344,739 | ||||||
| Investor Class: | ||||||||
| Shares Sold | 723,805 | 18,958 | ||||||
| Shares Reinvested | 11,561 | 52 | ||||||
| Shares Redeemed | (142,244 | ) | (8,683 | ) | ||||
| Net increase in shares of beneficial interest outstanding | 593,122 | 10,327 | ||||||
| * | Distributions from net investment income and net realized capital gains are combined for the year ended April 30, 2019. See “New Accounting Pronouncements” in the Notes to Financial Statements for more information. The dividends and distributions to shareholders for the year ended April 30, 2018 have not been reclassified to conform to the current year presentation. |
| ** | Net Assets - End of period includes distributions in excess of net investment income of $12,194 as of April 30, 2018. |
See accompanying notes to financial statements.
8
| Holbrook Income Fund |
| Financial Highlights |
Per Share Data and Ratios for a Share of Beneficial Interest Outstanding Throughout each Year/Period
| Class I | Investor Class | |||||||||||||||||||||||
| Year Ended | Year Ended | Period Ended | Year Ended | Year Ended | Period Ended | |||||||||||||||||||
| April 30, 2019 | April 30, 2018 | April 30, 2017(1) | April 30, 2019 | April 30, 2018 | April 30, 2017(1) | |||||||||||||||||||
| Net asset value, beginning of year/period | $ | 10.18 | $ | 10.15 | $ | 10.00 | $ | 10.19 | $ | 10.15 | $ | 10.00 | ||||||||||||
| Activity from investment operations: | ||||||||||||||||||||||||
| Net investment income (2) | 0.38 | 0.41 | 0.25 | 0.33 | 0.34 | 0.16 | ||||||||||||||||||
| Net realized and unrealized gain (loss) on investments | (0.01 | ) | (0.02 | ) (9) | 0.15 | (0.02 | ) | 0.01 | 0.20 | |||||||||||||||
| Total from investment operations | 0.37 | 0.39 | 0.40 | 0.31 | 0.35 | 0.36 | ||||||||||||||||||
| Less distributions from: | ||||||||||||||||||||||||
| Net investment income | (0.39 | ) | (0.36 | ) | (0.25 | ) | (0.34 | ) | (0.31 | ) | (0.21 | ) | ||||||||||||
| Net realized gains | (0.03 | ) | (0.00 | ) * | — | (0.03 | ) | (0.00 | ) * | — | ||||||||||||||
| Total distributions | (0.42 | ) | (0.36 | ) | (0.25 | ) | (0.37 | ) | (0.31 | ) | (0.21 | ) | ||||||||||||
| Net asset value, end of year/period | $ | 10.13 | $ | 10.18 | $ | 10.15 | $ | 10.13 | $ | 10.19 | $ | 10.15 | ||||||||||||
| Total return (3) | 3.66 | % | 4.00 | % | 4.03 | % (4) | 3.05 | % | 3.53 | % | 3.63 | % (4) | ||||||||||||
| Net assets, at end of year/period (000s) | $ | 40,723 | $ | 13,956 | $ | 262 | $ | 6,166 | $ | 158 | $ | 53 | ||||||||||||
| Ratio of gross expenses to average net assets (5,7) | 1.66 | % | 4.39 | % | 91.70 | % (6) | 2.16 | % | 4.89 | % | 89.19 | % (6) | ||||||||||||
| Ratio of net expenses to average net assets (7) | 1.30 | % | 1.30 | % | 1.30 | % (6) | 1.80 | % | 1.80 | % | 1.80 | % (6) | ||||||||||||
| Ratio of net investment income to average net assets (7,8) | 3.78 | % | 4.02 | % | 3.11 | % (6) | 3.23 | % | 3.30 | % | 1.97 | % (6) | ||||||||||||
| Portfolio Turnover Rate | 78 | % | 138 | % | 109 | % (4) | 78 | % | 138 | % | 109 | % (4) | ||||||||||||
| (1) | Fund commenced investment operations on July 6, 2016. |
| (2) | The net investment income per share data was determined using the average shares outstanding throughout each year/period. |
| (3) | Total returns are historical in nature and assume changes in share price, reinvestment of dividends and capital gains distributions, if any. Had the Advisor not absorbed a portion of Fund expenses, total returns would have been lower. |
| (4) | Not Annualized. |
| (5) | Represents the ratio of expenses to average net assets absent fee waivers and/or expense reimbursements by the Advisor. |
| (6) | Annualized. |
| (7) | Does not include expenses of other investment companies in which the Fund invests. |
| (8) | Recognition of net investment income by the Fund is affected by the timing of declaration of dividends by underlying investment companies in which the Fund invests. |
| (9) | Realized and unrealized gains per share in this caption are balancing amounts necessary to reconcile the change in net asset value per share for the period, and may not reconcile with the aggregate gains and losses in the statement of operations due to the timing of share transactions for the period. |
| * | Per share amount represents less than $0.01 per share. |
See accompanying notes to financial statements.
9
| Holbrook Income Fund |
| Notes to Financial Statements |
| April 30, 2019 |
| 1. | ORGANIZATION |
The Holbrook Income Fund (the “Fund”), is a series of shares of beneficial interest of the Two Roads Shared Trust (the “Trust”), a statutory trust organized under the laws of the State of Delaware on June 8, 2012, and is registered under the Investment Company Act of 1940, as amended (the “1940 Act”), as a diversified, open-end management investment company. The Fund commenced investment operations on July 6, 2016. The investment objective is to provide current income, with a secondary objective of capital preservation in a rising interest rate environment.
The Fund offers Class I and Investor Class shares. Both classes of shares are sold at net asset value without an initial sales charge. Class I shares are not subject to 12b-1 distribution fees, but have a higher minimum initial investment than the Investor Class shares. Each share class represents an interest in the same assets of the Fund and classes are identical except for differences in their ongoing service and distribution charges. All classes of shares have equal voting privileges except that each class has exclusive voting rights with respect to its service and/or distribution plans. The Fund’s income, expenses (other than class specific distribution fees) and realized and unrealized gains and losses are allocated proportionately each day based upon the relative net assets of each class.
| 2. | SUMMARY OF SIGNIFICANT ACCOUNTING POLICIES |
The following is a summary of significant accounting policies followed by the Fund in preparation of its financial statements. These policies are in conformity with accounting principles generally accepted in the United States of America (“GAAP”). The preparation of financial statements requires management to make estimates and assumptions that affect the reported amounts of assets and liabilities and disclosure of contingent assets and liabilities at the date of the financial statements and the reported amounts of income and expenses for the period. Actual results could differ from those estimates. The Fund is an investment company and accordingly follows the investment company accounting and reporting guidance of the Financial Accounting Standards Board (“FASB”) Accounting Standard Codification Topic 946 “Financial Services – Investment Companies” including FASB Accounting Standard Update ASU 2013-08.
Security Valuation – Securities listed on an exchange are valued at the last reported sale price at the close of the regular trading session of the exchange on the business day the value is being determined, or in the case of securities listed on NASDAQ at the NASDAQ Official Closing Price (“NOCP”). In the absence of a sale such securities shall be valued at the mean between the last bid and ask prices on the day of valuation. Debt securities (other than short-term obligations) are valued each day by an independent pricing service approved by the Trust’s Board of Trustees (the “Board”) based on methods which include consideration of: yields or prices of securities of comparable quality, coupon, maturity and type, indications as to values from dealers, and general market conditions or market quotations from a major market maker in the securities. Short-term debt obligations having 60 days or less remaining until maturity, at time of purchase, may be valued at amortized cost. Investments in open-end investment companies are valued at net asset value.
The Fund may hold securities, such as private investments, interests in commodity pools, other non-traded securities or temporarily illiquid securities, for which market quotations are not readily available or are determined to be unreliable. These securities will be valued using the “fair value” procedures approved by the Board. The Board has delegated execution of these procedures to a fair value team composed of one or more representatives from each of the (i) Trust, (ii) administrator, and (iii) advisor. The team may also enlist third party consultants such a valuation specialist at a public accounting firm, valuation consultant or financial officer of a security issuer on an as-needed basis to assist in determining a security-specific fair value. The Board has also engaged a third party valuation firm to, as needed, attend valuation meetings held by the Trust, review minutes of such meetings and report to the Board on a quarterly basis. The Board reviews and ratifies the execution of this process and the resultant fair value prices at least quarterly to assure the process produces reliable results.
Fair Valuation Process.The applicable investments are valued collectively via inputs from each group within the fair value team. For example, fair value determinations are required for the following securities: (i) securities for which market quotations are insufficient or not readily available on a particular business day (including securities for which there is a short
10
| Holbrook Income Fund |
| Notes to Financial Statements (Continued) |
| April 30, 2019 |
and temporary lapse in the provision of a price by the regular pricing source); (ii) securities for which, in the judgment of the advisor, the prices or values available do not represent the fair value of the instrument; factors which may cause the advisor to make such a judgment include, but are not limited to, the following: only a bid price or an asked price is available; the spread between bid and asked prices is substantial; the frequency of sales; the thinness of the market; the size of reported trades; and actions of the securities markets, such as the suspension or limitation of trading; (iii) securities determined to be illiquid; and (iv) securities with respect to which an event that will affect the value thereof has occurred (a “significant event”) since the closing prices were established on the principal exchange on which they are traded, but prior to a Fund’s calculation of its net asset value. Specifically, interests in commodity pools or managed futures pools are valued on a daily basis by reference to the closing market prices of each futures contract or other asset held by a pool, as adjusted for pool expenses. Restricted or illiquid securities, such as private investments or non-traded securities are valued via inputs from the advisor based upon the current bid for the security from two or more independent dealers or other parties reasonably familiar with the facts and circumstances of the security (who should take into consideration all relevant factors as may be appropriate under the circumstances). If the advisor is unable to obtain a current bid from such independent dealers or other independent parties, the fair value team shall determine the fair value of such security using the following factors: (i) the type of security; (ii) the cost at date of purchase; (iii) the size and nature of the Fund’s holdings; (iv) the discount from market value of unrestricted securities of the same class at the time of purchase and subsequent thereto; (v) information as to any transactions or offers with respect to the security; (vi) the nature and duration of restrictions on disposition of the security and the existence of any registration rights; (vii) how the yield of the security compares to similar securities of companies of similar or equal creditworthiness; (viii) the level of recent trades of similar or comparable securities; (ix) the liquidity characteristics of the security; (x) current market conditions; and (xi) the market value of any securities into which the security is convertible or exchangeable.
The Fund utilizes various methods to measure the fair value of all of its investments on a recurring basis. GAAP establishes a hierarchy that prioritizes inputs to valuation methods. The three levels of input are:
Level 1 – Unadjusted quoted prices in active markets for identical assets and liabilities that the Fund has the ability to access.
Level 2 – Observable inputs other than quoted prices included in Level 1 that are observable for the asset or liability, either directly or indirectly. These inputs may include quoted prices for the identical instrument on an inactive market, prices for similar instruments, interest rates, prepayment speeds, credit risk, yield curves, default rates and similar data.
Level 3 – Unobservable inputs for the asset or liability, to the extent relevant observable inputs are not available, representing the Fund’s own assumptions about the assumptions a market participant would use in valuing the asset or liability, and would be based on the best information available.
The availability of observable inputs can vary from security to security and is affected by a wide variety of factors, including, for example, the type of security, whether the security is new and not yet established in the marketplace, the liquidity of markets, and other characteristics particular to the security. To the extent that valuation is based on models or inputs that are less observable or unobservable in the market, the determination of fair value requires more judgment. Accordingly, the degree of judgment exercised in determining fair value is greatest for instruments categorized in Level 3.
The inputs used to measure fair value may fall into different levels of the fair value hierarchy. In such cases, for disclosure purposes, the level in the fair value hierarchy within which the fair value measurement falls in its entirety, is determined based on the lowest level input that is significant to the fair value measurement in its entirety.
11
| Holbrook Income Fund |
| Notes to Financial Statements (Continued) |
| April 30, 2019 |
The inputs or methodology used for valuing securities are not necessarily an indication of the risk associated with investing in those securities. The following tables summarize the inputs used as of April 30, 2019, for the Fund’s assets and liabilities measured at fair value:
| Assets * | Level 1 | Level 2 | Level 3 | Total | |||||||||||||||
| Preferred Stock | $ | 21,135,449 | $ | — | $ | — | $ | 21,135,449 | |||||||||||
| Corporate Bonds | — | 21,725,470 | — | 21,725,470 | |||||||||||||||
| Convertible Bonds | — | 1,541,698 | — | 1,541,698 | |||||||||||||||
| United States Government Securities | — | 1,073,950 | — | 1,073,950 | |||||||||||||||
| Short-Term Investments | 1,689,884 | — | — | 1,689,884 | |||||||||||||||
| Total Assets | $ | 22,825,333 | $ | 24,341,118 | $ | — | $ | 47,166,451 | |||||||||||
| * | Refer to the Portfolio of Investments for classifications. |
The Fund did not hold any Level 3 securities during the period.
Security Transactions and Related Income – Security transactions are accounted for on a trade date basis. Interest income is recognized on an accrual basis. Discounts are accreted and premiums are amortized on securities purchased over the lives of the respective securities. Dividend income is recorded on the ex-dividend date. Realized gains or losses from sales of securities are determined by comparing the identified cost of the security lot sold with the net sales proceeds.
Dividends and Distributions to Shareholders – Dividends from net investment income are declared daily and distributed monthly. Distributable net realized capital gains are declared and distributed annually. Dividends from net investment income and distributions from net realized gains are recorded on ex dividend date and determined in accordance with federal income tax regulations, which may differ from GAAP. These “book/tax” differences are considered either temporary (i.e., deferred losses, capital loss carry forwards) or permanent in nature. To the extent these differences are permanent in nature, such amounts are reclassified within the composition of net assets based on their federal tax-basis treatment; temporary differences do not require reclassification.
Federal Income Taxes – It is the Fund’s policy to qualify as a regulated investment company by complying with the provisions of the Internal Revenue Code that are applicable to regulated investment companies and to distribute substantially all of its taxable income and net realized gains to shareholders. Therefore, no federal income tax provision has been recorded.
The Fund recognizes the tax benefits of uncertain tax positions only where the position is “more likely than not” to be sustained assuming examination by tax authorities. Management has analyzed the Fund’s tax positions and has concluded that no liability for unrecognized tax benefits should be recorded related to uncertain tax positions taken on returns filed for open tax years ended April 30, 2017 to April 30, 2018, or expected to be taken in the Fund’s April 30, 2019 year-end tax returns. The Fund identifies its major tax jurisdictions as U.S. Federal, Nebraska and foreign jurisdictions where the Fund makes significant investments; however, the Fund is not aware of any tax positions for which it is reasonably expected that the total amounts of unrecognized tax benefits will change materially in the next twelve months.
The Fund’s investments in securities, financial instruments and derivatives expose it to various risks, certain of which are discussed below. Please refer to the Fund’s prospectus and statement of additional information for a full listing of risks associated with the Fund’s investments which include, but are not limited to Business Development Company (“BDC”) Risk, Closed end Fund Risk, Collateralized Loan Obligations Risk, Credit Risk, Currency Risk, Cybersecurity Risk, Derivatives Risk, Emerging Markets Risk, Foreign (Non-U.S.) Investment Risk, Gap Risk, High Yield Risk, Investment Companies and Exchange-Traded Funds (“ETFs”) Risk, Limited History of Operations, Liquidity Risk, Management Risk, Market Risk, Market Events Risk, Quantitative Investing Risk, Underlying Fund Risk, U.S. Government Securities Risk and Valuation Risk.
12
| Holbrook Income Fund |
| Notes to Financial Statements (Continued) |
| April 30, 2019 |
Fixed Income Risk – When the Fund invests in fixed income securities or derivatives, the value of your investment in the Fund will fluctuate with changes in interest rates. Typically, a rise in interest rates causes a decline in the value of fixed income securities or derivatives owned by the Fund. In general, the market price of fixed income securities with longer maturities or durations will increase or decrease more in response to changes in interest rates than shorter-term securities. Other risk factors include credit risk (the debtor may default) and prepayment risk (the debtor may pay its obligation early, reducing the amount of interest payments). These risks could affect the value of a particular investment by the Fund, possibly causing the Fund’s share price and total return to be reduced and fluctuate more than other types of investments.
Preferred Stock Risk – The value of preferred stocks will fluctuate with changes in interest rates. Typically, a rise in interest rates causes a decline in the value of preferred stock. Preferred stocks are also subject to credit risk, which is the possibility that an issuer of preferred stock will fail to make its dividend payments. Preferred stock prices tend to move more slowly upwards than common stock prices.
Treasury Inflation Protected Securities Risk – The value of inflation protected securities issued by the U.S. Treasury (“TIPS”) generally fluctuates in response to inflationary concerns. As inflationary expectations increase, TIPS will become more attractive, because they protect future interest payments against inflation. Conversely, as inflationary concerns decrease, TIPS will become less attractive and less valuable.
Please refer to the Fund’s prospectus for a full listing of risks associated with the Fund’s investments.
Expenses – Expenses of the Trust that are directly identifiable to a specific fund are charged to that fund. Expenses, which are not readily identifiable to a specific fund, are allocated in such a manner as deemed equitable, taking into consideration the nature and type of expense and the relative sizes of the funds in the Trust.
Indemnification – The Trust indemnifies its officers and trustees for certain liabilities that may arise from the performance of their duties to the Trust. Additionally, in the normal course of business, the Fund enters into contracts that contain a variety of representations and warranties and which provide general indemnities. The Fund’s maximum exposure under these arrangements is unknown, as this would involve future claims that may be made against the Fund that have not yet occurred. However, the risk of loss due to these warranties and indemnities appears to be remote.
| 3. | INVESTMENT TRANSACTIONS |
The cost of purchases and proceeds from the sale of securities, other than short-term investments, for the year ended April 30, 2019, amounted to $51,835,605 and $19,971,524 respectively.
| 4. | INVESTMENT ADVISORY AGREEMENT AND TRANSACTIONS WITH RELATED PARTIES |
Advisory Fees – Holbrook Holdings, Inc. serves as the Fund’s Investment Advisor (the “Advisor”). Pursuant to an Investment Advisory Agreement with the Fund, the Advisor, under the oversight of the Board, directs the daily operations of the Fund and supervises the performance of administrative and professional services provided by others. As compensation for its services and the related expenses borne by the Advisor, the Fund pays the Advisor an investment advisory fee, computed and accrued daily and paid monthly, at an annual rate of 0.80% of the Fund’s average daily net assets.
The Advisor has contractually agreed to reduce its fees and/or absorb expenses of the Fund (The “Waiver Agreement”), until at least September 1, 2020, to ensure that Total Annual Fund Operating Expenses after fee waiver and/or reimbursement (exclusive of any taxes, short selling expenses, interest, brokerage commissions, expenses incurred in connection with any merger or reorganization, indirect expenses, expenses of other investment companies in which the Fund may invest, or extraordinary expenses such as litigation) will not exceed 1.30% and 1.80% of the Fund’s average daily net assets for Class I and Investor Class shares, respectively, subject to possible recoupment from the Fund in future years on a rolling three year basis (within the three years after the fees have been waived or reimbursed) if such recoupment can be achieved within the foregoing expense limits.
13
| Holbrook Income Fund |
| Notes to Financial Statements (Continued) |
| April 30, 2019 |
If the Advisor waives any fee or reimburses any expense pursuant to the Waiver Agreement, and the Fund’s Operating Expenses are subsequently less than 1.30% and 1.80% of average daily net assets attributable to Class I and Investor Class shares, respectively, the Advisor shall be entitled to reimbursement by the Fund for such waived fees or reimbursed expenses provided that such reimbursement does not cause the Fund’s expenses to exceed 1.30% and 1.80% of average daily net assets for Class I and Investor Class shares, respectively. If Fund Operating Expenses attributable to Class I and Investor Class shares subsequently exceed 1.30% and 1.80% per annum of the average daily net assets, the reimbursements shall be suspended. During the year ended April 30, 2019, the Advisor has waived/reimbursed $93,307 in expenses to the Fund which may be recaptured by April 30, 2022. During the period ended April 30, 2017 the Advisor has waived/reimbursed $160,022 in expenses to the fund which may be recaptured by April 30, 2020. During the period ended April 30, 2018 the Advisor has waived/reimbursed $167,689 in expenses to the fund which may be recaptured by April 30, 2021.
The Board has adopted the Trust’s Master Distribution and Shareholder Servicing Plan (the “Plan”) pursuant to Rule 12b-1 under the 1940 Act. The Plan provides that a monthly service and/or distribution fee is calculated by the Fund at an annual rate of 0.50% of its average daily net assets for the Investor Class and is paid to Northern Lights Distributors, LLC (the “Distributor”) to provide compensation for ongoing shareholder servicing and distribution-related activities or services and/or maintenance of the Fund’s shareholder accounts not otherwise required to be provided by the Advisor. For the year ended April 30, 2019, pursuant to the Plan, the Investor Class paid $16,699.
The Distributor acts as the Fund’s principal underwriter in a continuous public offering of the Fund’s Class I and Investor Class shares. For the year ended April 30, 2019, the Distributor received $0 and $0 in underwriting commissions for sales of Class I and Investor Class shares, respectively, of which $0 and $0 was retained by the principal underwriter or other affiliated broker-dealers for Class I and Investor Class shares, respectively.
In addition, certain affiliates of the Distributor provide services to the Fund(s) as follows:
Gemini Fund Services, LLC (“GFS”)– GFS, an affiliate of the Distributor, provides administration, fund accounting, and transfer agent services to the Trust. Pursuant to separated servicing agreements with GFS, the Fund pays GFS customary fees for providing administration, fund accounting and transfer agency services to the Fund. Certain officers of the Trust are also officers of GFS, and are not paid any fees directly by the Fund for serving in such capacities.
Northern Lights Compliance Services, LLC (“NLCS”) – NLCS, an affiliate of GFS and the Distributor, provides a Chief Compliance Officer to the Trust, as well as related compliance services, pursuant to a consulting agreement between NLCS and the Trust. Under the terms of such agreement, NLCS receives customary fees from the Fund.
Blu Giant, LLC (“Blu Giant”) – Blu Giant, an affiliate of GFS and the Distributor, provides EDGAR conversion and filing services as well as print management services for the Fund on an ad-hoc basis. For the provision of these services, Blu Giant receives customary fees from the Fund.
Effective February 1, 2019, NorthStar Financial Services Group, LLC, the parent company of Gemini Fund Services, LLC (“GFS”) and its affiliated companies including Northern Lights Distributors, LLC (“NLD”), Northern Lights Compliance Services, LLC (“NLCS”) and Blu Giant, LLC (“Blu Giant”) (collectively, the “Gemini Companies”), sold its interest in the Gemini Companies to a third party private equity firm that contemporaneously acquired Ultimus Fund Solutions, LLC (an independent mutual fund administration firm) and its affiliates (collectively, the “Ultimus Companies”). As a result of these separate transactions, the Gemini Companies and the Ultimus Companies are now indirectly owned through a common parent entity, The Ultimus Group, LLC.
14
| Holbrook Income Fund |
| Notes to Financial Statements (Continued) |
| April 30, 2019 |
| 5. | AGGREGATE UNREALIZED APPRECIATION AND DEPRECIATION – TAX BASIS |
The identified cost of investments in securities owned by the Fund for federal income tax purposes and its respective gross unrealized appreciation and depreciation at April 30, 2019, were as follows:
| Gross | Gross | Net Unrealized | ||||||||||||
| Tax | Unrealized | Unrealized | Appreciation/ | |||||||||||
| Cost | Appreciation | Depreciation | (Depreciation) | |||||||||||
| 46,899,092 | 587,219 | (319,860 | ) | 267,359 | ||||||||||
| 6. | DISTRIBUTIONS TO SHAREHOLDERS AND TAX COMPONENTS OF CAPITAL |
The tax character of distributions paid during the periods ended April 30, 2019 and April 30, 2018 was as follows:
| Fiscal Year Ended | Fiscal Period Ended | |||||||
| April 30, 2019 | April 30, 2018 | |||||||
| Ordinary Income | $ | 1,068,790 | $ | 219,827 | ||||
As of April 30, 2019, the components of accumulated earnings/ (deficit) on a tax basis were as follows:
| Undistributed | Undistributed | Post October Loss | Capital Loss | Other | Unrealized | Total | ||||||||||||||||||||
| Ordinary | Long-Term | and | Carry | Book/Tax | Appreciation/ | Accumulated | ||||||||||||||||||||
| Income | Gains | Late Year Loss | Forwards | Differences | (Depreciation) | Earnings/(Deficits) | ||||||||||||||||||||
| $ | 35,810 | $ | — | $ | — | $ | (390,616 | ) | $ | (2,112 | ) | $ | 267,359 | $ | (89,559 | ) | ||||||||||
The difference between book basis and tax basis accumulated net investment income (loss), accumulated net realized losses, and unrealized appreciation from investments is primarily attributable to the tax deferral of losses on wash sales, investments in partnerships, contingent debt payment instruments, trust preferred securities, and adjustments for accrued dividends payable.
At April 30, 2019, the Funds had capital loss carry forwards for federal income tax purposes available to offset future capital gains, as follows:
| Non-Expiring | Non-Expiring | |||||||||||||||||
| Expiring | Short-Term | Long-Term | Total | CLCF Utilized | ||||||||||||||
| $ | — | $ | 312,114 | $ | 78,502 | $ | 390,616 | $ | — | |||||||||
| 7. | CONTROL OWNERSHIP |
The beneficial ownership, either directly or indirectly, of more than 25% of the voting securities of a fund creates presumption of control of the fund, under Section 2(a)(9) of the 1940 Act. As of April 30, 2019, TD Ameritrade and Charles Schwab & Co., Inc. held approximately 36% and 59% of the voting securities of the Holbrook Income Fund, respectively.
15
| Holbrook Income Fund |
| Notes to Financial Statements (Continued) |
| April 30, 2019 |
| 8. | RECENT ACCOUNTING PRONOUNCEMENTS |
In March 2017, the FASB issued Accounting Standards Update (“ASU”) No. 2017-08, Receivables—Nonrefundable Fees and Other Costs (Subtopic 310-20): Premium Amortization on Purchased Callable Debt Securities. The amendments in the ASU shorten the amortization period for certain callable debt securities, held at a premium, to be amortized to the earliest call date. The ASU does not require an accounting change for securities held at a discount; which continues to be amortized to maturity. The ASU is effective for fiscal years and interim periods within those fiscal years beginning after December 15, 2018. Management is currently evaluating the impact, if any, of applying this provision.
In August 2018, the FASB issued ASU No. 2018-13, which changes certain fair value measurement disclosure requirements. The new ASU, in addition to other modifications and additions, removes the requirement to disclose the amount and reasons for transfers between Level 1 and Level 2 of the fair value hierarchy, and the policy for the timing of transfers between levels. For investment companies, the amendments are effective for financial statements issued for fiscal years beginning after December 15, 2019, and interim periods within those fiscal years. Early adoption is allowed. These amendments have been adopted with these financial statements.
In September 2018, the Securities and Exchange Commission adopted amendments to certain disclosure requirements under Regulation S-X to conform to US GAAP, including: (i) an amendment to require presentation of the total, rather than the components, of distributable earnings on the Statement of Assets and Liabilities; and (ii) an amendment to require presentation of the total, rather than the components, of distributions to shareholders, except for tax return of capital distributions, if any, on the Statement of Changes in Net Assets. These amendments have been adopted with these financial statements.
| 9. | SUBSEQUENT EVENTS |
Subsequent events after the date of the Statement of Assets and Liabilities have been evaluated through the date the financial statements were issued. Management has determined that no events or transactions occurred requiring adjustment or disclosure in the financial statements.
16

GRANT THORNTON LLP | REPORT OF INDEPENDENT REGISTERED PUBLIC ACCOUNTING FIRM
Board of Trustees of the Two Roads Shared Trust
Opinion on the financial statements
We have audited the accompanying statement of assets and liabilities, including the portfolio of investments, of Holbrook Income Fund (a fund in the Two Roads Shared Trust) (the “Fund”) as of April 30, 2019, the related statement of operations for the year then ended, and the statements of changes in net assets for each of the two years in the period ended April 30, 2019, and the financial highlights for each of the two years in the period ended April 30, 2019, and for the period from July 6, 2016 (date of commencement of operations) through April 30, 2017, and the related notes (collectively referred to as the “financial statements”). In our opinion, the financial statements present fairly, in all material respects, the financial position of the Fund as of April 30, 2019, and the results of its operations for the year then ended, the changes in its net assets for each of the two years in the period ended April 30, 2019, and its financial highlights for each of the two years in the period ended April 30, 2019 and for the period from July 6, 2016 (date of commencement of operations) through April 30, 2017, in conformity with accounting principles generally accepted in the United States of America.
Basis for opinion
These financial statements are the responsibility of the Fund’s management. Our responsibility is to express an opinion on the Fund’s financial statements based on our audits. We are a public accounting firm registered with the Public Company Accounting Oversight Board (United States) (“PCAOB”) and are required to be independent with respect to the Fund in accordance with the U.S. federal securities laws and the applicable rules and regulations of the Securities and Exchange Commission and the PCAOB.
We conducted our audits in accordance with the standards of the PCAOB. Those standards require that we plan and perform the audit to obtain reasonable assurance about whether the financial statements are free of material misstatement, whether due to error or fraud. The Fund is not required to have, nor were we engaged to perform, an audit of its internal control over financial reporting. As part of our audits we are required to obtain an understanding of internal control over financial reporting but not for the purpose of expressing an opinion on the effectiveness of the Fund’s internal control over financial reporting. Accordingly, we express no such opinion.
| |
| GT.COM | Grant Thornton LLP is the U.S. member firm of Grant Thornton International Ltd (GTIL). GTIL and each of its member firms are separate legal entities and are not a worldwide partnership. |
17
Our audits included performing procedures to assess the risks of material misstatement of the financial statements, whether due to error or fraud, and performing procedures that respond to those risks. Such procedures included examining, on a test basis, evidence supporting the amounts and disclosures in the financial statements. Our audits also included evaluating the accounting principles used and significant estimates made by management, as well as evaluating the overall presentation of the financial statements. Our procedures included confirmation of securities owned as of April 30, 2019, by correspondence with the custodian and brokers. We believe that our audits provide a reasonable basis for our opinion.
We have served as the Fund’s auditor since 2016.
Philadelphia, Pennsylvania June 27, 2019 |

18
| Holbrook Income Fund |
| SUPPLEMENTAL INFORMATION (Unaudited) |
| April 30, 2019 |
Approval of Advisory Agreement – Holbrook Income Fund
At a meeting held on March 6 and 7, 2019 (the “Meeting”), the Board of Trustees (the “Board”) of Two Roads Shared Trust (the “Trust”), including all of those trustees who are not “interested persons” of the Trust (as such term is defined in the 1940 Act), which independent Trustees constitute all of the Trustees, considered the approval of an investment advisory agreement (the “Advisory Agreement”) between Holbrook Holdings Inc. (“Holbrook” or the “Adviser”) and the Trust, on behalf of the Holbrook Income Fund (the “Fund”), a series of the Trust.
In connection with the Board’s consideration of the Advisory Agreement, the Board received written materials in advance of the Meeting, which included information regarding: (i) the nature, extent, and quality of services to be provided to the Fund by the Adviser; (ii) a description of the Adviser’s investment management personnel; (iii) an overview of the Adviser’s operations and financial condition; (iv) a description of the Adviser’s brokerage practices (including any soft dollar arrangements); (v) a comparison of the Fund’s advisory fee and overall expenses with those of comparable funds; (vi) the level of profitability from the Adviser’s fund-related operations; (vii) the Adviser’s compliance policies and procedures, including policies and procedures for personal securities transactions, business continuity and information security; and (viii) information regarding the performance record of other funds with similar investment strategies.
Throughout the process, including at the meeting, the Board had numerous opportunities to ask questions of and request additional materials from the Adviser. During the Meeting, the Board was advised by, and met in executive session with, the Board’s independent legal counsel, and received a memorandum from such independent counsel regarding its responsibilities under applicable law.
Matters considered by the Board in connection with its approval of the Advisory Agreement included, among others, the following:
Nature, Extent and Quality of Services.The Board reviewed materials provided by Holbrook related to the Advisory Agreement with the Trust regarding the Fund, including the Advisory Agreement; a description of the manner in which investment decisions are made and executed; a review of the financial condition of Holbrook; an overview of the personnel that service the Fund and their background and experience; information regarding Holbrook’s risk management processes and liquidity management; Holbrook’s compliance policies and procedures, including its business continuity plans and cybersecurity policies and a Code of Ethics containing provisions reasonably necessary to prevent Access Persons, as that term is defined in Rule 17j-1 under the 1940 Act, from engaging in conduct prohibited by Rule 17j-1(b); a written risk assessment of Holbrook’s compliance program and the use of an outside compliance consultant; information regarding Holbrook’s compliance and regulatory history; and an independent report prepared by Broadridge analyzing the performance record, fees and expenses of the Fund as compared to other mutual funds with similar investment strategies. The Board also noted that on a regular basis it received and reviewed information from the Trust’s CCO regarding the Fund’s compliance policies and procedures established pursuant to Rule 38a-1 under the
19
| Holbrook Income Fund |
| SUPPLEMENTAL INFORMATION (Unaudited) (Continued) |
| April 30, 2019 |
Investment Company Act of 1940, which included evaluating the regulatory compliance systems of Holbrook and procedures reasonably designed to assure compliance with the federal securities laws.
In reaching its conclusions, the Board considered the experience and qualifications of Holbrook’s management team and Holbrook’s commitment to the operation of Holbrook’s compliance program. The Board also considered Holbrook’s policies and procedures in the areas of business continuity and with respect to information systems security and the Trust’s CCO’s review and evaluation of the same, which found them to be satisfactory. The Board also considered the significant risks assumed by the Adviser in connection with the services provided to the Fund, including entrepreneurial risk in sponsoring new funds and ongoing risks including investment, operational, enterprise, litigation, regulatory and compliance risks with respect to the Fund, and considered that the growth of the Fund since the inception of both the Adviser and the Fund recognized that Holbrook was satisfactorily managing such risks. The Board concluded that Holbrook had sufficient quality and depth of personnel, resources, investment methodologies and compliance policies and procedures to perform its duties under the Advisory Agreement and that the nature, overall quality and extent of the management services provided by Holbrook to the Fund were satisfactory and reliable.
Performance.Among other data, the Board considered a report prepared by Broadridge that included the Fund’s performance for the one-year and since-inception periods ended December 31, 2018, as compared to the Fund’s Morningstar category (Short-Term Bond) and as compared to a group of funds selected by Broadridge that employ similar investment strategies as the Fund (the “Peer Group”). The Board also considered the Fund’s performance as compared to the benchmark index, the Barclays U.S. Government/Credit 1-5 Year Total Return Index presented in the Broadridge report. The Board also reviewed the Fund’s performance as compared to the Barclays U.S. Aggregate Bond Total Return Index, the Fund’s benchmark index. The Board noted that while it found the data provided by Broadridge generally useful, the Board recognized its limitations, including in particular that the results of the performance comparisons may vary depending on the selection of the performance peer group. In evaluating the data contained in the Broadridge report, the Board also took into account the differences between the other funds in the Peer Group and the Fund.
The Board considered, among other data, that the Fund outperformed the median of the Peer Group and its Morningstar category for the one-year and since inception periods ended December 31, 2018, as well as the Fund’s benchmark index and the benchmark index included in the Morningstar report. The Board further considered Holbrook’s performance on both an absolute and risk-adjusted basis, including with respect to performance volatility. The Board concluded that the Fund’s overall performance was satisfactory and that Holbrook was capable of obtaining an acceptable level of investment returns for shareholders.
Fees and Expenses. As to the costs of the services provided by Holbrook, the Board considered a comparison of the Fund’s contractual advisory fee and net expense ratio to those of the funds within the Peer Group and to its Morningstar category. The Board noted that the Fund’s contractual advisory fee was above the median of the Peer Group and its Morningstar category but
20
| Holbrook Income Fund |
| SUPPLEMENTAL INFORMATION (Unaudited) (Continued) |
| April 30, 2019 |
was not the highest. The Board also considered that the net operating expenses of the Fund were above the median of its Peer Group and its Morningstar category but not the highest among the funds within those groups. The Board noted in considering the expenses of the Fund that the Fund’s average net assets were substantially lower than the Peer Group median and the Morningstar category median and considered the impact that the size of the Fund has on the Fund’s total operating expenses relative to the expenses borne by funds within the Peer Group. The Board also considered that Holbrook had agreed to reimburse expenses to limit net annual operating expenses to 1.30% and 1.80% (exclusive of (i) any front-end or contingent deferred loads; (ii) brokerage fees and commissions; (iii) acquired fund fees and expenses; (iv) borrowing costs (such as interest and dividend expense on securities sold short); (v) taxes; and (vi) extraordinary expenses, such as litigation expenses) of the average net assets attributable to Class I and Investor Class shares of the Fund, respectively. The Board concluded that the advisory fee was not unreasonable.
Profitability. The Board considered Holbrook’s profitability and whether these profits are excessive in light of the services provided to the Fund. The Board reviewed a profitability analysis prepared by Holbrook based on current asset levels. The Board concluded that because Holbrook’s relationship with the Fund was not currently profitable, profitability was not excessive.
Economies of Scale. The Board considered whether Holbrook would realize economies of scale with respect to its management of the Fund as it grows and whether fee levels reflected these economies of scale for the benefit of shareholders. The Board considered the profitability analysis provided by Holbrook, and considered that Holbrook had represented that it expected the Fund to achieve economies of scale at certain asset levels, but that at current asset levels, economies of scale was not a consideration. The Board noted that it would revisit whether economies of scale exist in the future once the Fund has achieved sufficient size.
Other Benefits.The Board also considered the character and amount of other direct and incidental benefits to be received by Holbrook from its association with the Fund. The Board noted that Holbrook did not believe that it received any direct, indirect or ancillary material “fall-out” benefits from its relationship with the Fund at this time, although the Board noted the potential for future product launches based on the success of the Fund as well as the use of soft dollars. The Board considered these potential benefits appeared to be not unreasonable.
Conclusion.The Board, having requested and received such information from Holbrook as it believed reasonably necessary to evaluate the terms of the Advisory Agreement, and having been advised by independent counsel that the Board had appropriately considered and weighed all relevant factors, determined that approval of the Advisory Agreement for an additional one-year term was in the best interests of the Fund and its shareholders. In considering the Advisory Agreement, the Board did not identify any one factor as all important and each Trustee may have considered different factors as more important.
21
| Holbrook Income Fund |
| Expense Example (Unaudited) |
| April 30, 2019 |
As a shareholder of the Holbrook Income Fund (the “Fund”), you incur two types of costs: (1) transaction costs, including sales charges (loads) on purchases, contingent deferred sales charges (CDSCs) and redemption fees; and (2) ongoing costs, including management fees, distribution and/or service (12b-1) fees, and other Fund expenses. This example is intended to help you understand your ongoing costs (in dollars) of investing in the Holbrook Income Fund and to compare these costs with the ongoing costs of investing in other mutual funds.
The example is based on an investment of $1,000 invested at the beginning of the period and held for the six month period from November 1, 2018, through April 30, 2019.
Actual Expenses
The “Actual Expenses” line in the table below provides information about actual account values and actual expenses. You may use the information below, together with the amount you invested, to estimate the expenses that you paid over the period. Simply divide your account value by $1,000 (for example, an $8,600 account value divided by $1,000 = 8.6), then multiply the result by the number in the table under the heading entitled “Expenses Paid During Period” to estimate the expenses you paid on your account during this period.
Hypothetical Example for Comparison Purposes
The “Hypothetical” line in the table below provides information about hypothetical account values and hypothetical expenses based on the Fund’s actual expense ratio and an assumed rate of return of 5% per year before expenses, which is not the Fund’s actual return. The hypothetical account values and expenses may not be used to estimate the actual ending account balances or expenses you paid for the period. You may use this information to compare this 5% hypothetical example with the 5% hypothetical examples that appear in the shareholder reports of other funds.
Please note that the expenses shown in the table are meant to highlight your ongoing costs only and do not reflect any transactional costs, such as redemption fees. Therefore, the table is useful in comparing ongoing costs only, and will not help you determine the relative total costs of owning different funds. In addition, if these transactional costs were included, your costs would have been higher.
| Beginning | Annualized | Ending | Expenses | |||||||||||||
| Account | Expense Ratio | Account | Paid During | |||||||||||||
| Value 11/01/2018 | For the period | Value 4/30/2019 | the Period* | |||||||||||||
| Actual | ||||||||||||||||
| Class I | $ | 1,000.00 | 1.30 | % | $ | 1,016.50 | $ | 6.50 | ||||||||
| Investor Class | 1,000.00 | 1.80 | % | 1,013.90 | 8.99 | |||||||||||
| Beginning | Annualized | Ending | Expenses | |||||||||||||
| Account | Expense Ratio | Account | Paid During | |||||||||||||
| Value 11/01/2018 | For the period | Value 4/30/2019 | the Period* | |||||||||||||
| Hypothetical | ||||||||||||||||
| Class I | $ | 1,000.00 | 1.30 | % | $ | 1,018.35 | $ | 6.51 | ||||||||
| Investor Class | 1,000.00 | 1.80 | % | 1,015.87 | 9.00 | |||||||||||
| * | Expenses are equal to the Fund’s annualized expense ratio multiplied by the average account value over the period, multiplied by 181/365. |
22
| Holbrook Income Fund |
| SUPPLEMENTAL INFORMATION (Unaudited)(Continued) |
| April 30, 2019 |
Trustees and Officers. The Trustees and officers of the Trust, together with information as to their principal business occupations during the past five years and other information, are shown below. Unless otherwise noted, the address of each Trustee and Officer is 17645 Wright Street, Suite 200, Omaha, Nebraska 68130.
Independent Trustees *
| Name, Address, Year of Birth | Position(s) Held with Registrant | Term and Length Served | Principal Occupation(s) During Past 5 Years | Number of Portfolios Overseen In The Fund Complex** | Other Directorships Held During Past 5 Years |
| Mark Garbin Year of Birth: 1951 | Trustee | Indefinite, Since 2012 | Managing Principal, Coherent Capital Management LLC (since 2008) | 1 | Northern Lights Fund Trust (since 2013); Northern Lights Variable Trust (for series not affiliated with the Funds since 2013); Forethought Variable Insurance Trust (since 2013); Northern Lights Variable Trust (since 2013); OHA Mortgage Strategies Fund (offshore), Ltd. (2014 - 2017); and Altegris KKR Commitments Master Fund (since 2014); and OFI Carlyle Private Credit Fund (since March 2018) |
| Mark D. Gersten Year of Birth: 1950 | Chairman, Trustee | Indefinite, Since 2012 | Independent Consultant (since 2012); Senior Vice President – Global Fund Administration Mutual Funds & Alternative Funds, AllianceBernstein LP (1985 – 2011). | 1 | Northern Lights Fund Trust (since 2013); Northern Lights Variable Trust (for series not affiliated with the Funds since 2013); Altegris KKR Commitments Master Fund (since 2014); previously, Ramius Archview Credit and Distressed Fund (2015-2017); and Schroder Global Series Trust (2012 to 2017) |
| Neil M. Kaufman Year of Birth: 1960 | Trustee, Audit Committee Chairman | Indefinite, Since 2012 | Managing Member, Kaufman & Associates, LLC (legal services)(Since 2016); Partner, Abrams Fensterman, Fensterman, Eisman, Formato, Ferrara & Wolf, LLP (legal services)(2010-2016) | 1 | Altegris KKR Commitments Master Fund (since 2014) |
| Anita K. Krug Year of Birth: 1969 | Trustee | Indefinite, Since 2012 | Interim Vice Chancellor for Academic Affairs (since 2018) University of Washington Bothell; Interim Dean (2017- 2018), Professor (since 2016), Associate Professor (2014-2016); and Assistant Professor (2010-2014), University of Washington School of Law | 1 | Altegris KKR Commitments Master Fund (since 2014); Centerstone Investors Trust (since 2016) |
| * | Information is as of April 30, 2019. |
| ** | As of April 30, 2019, the Trust was comprised of 20 active portfolios managed by seven unaffiliated investment advisers and two affiliated investment advisers. The term “Fund Complex” applies only to those funds that (i) are advised by a common investment adviser or by an investment adviser that is an affiliated person of the investment adviser of any of the other funds in the Trust or (ii) hold themselves out to investors as related companies for purposes of investment and investor services. The Fund does not hold itself out as related to any other series within the Trust for investment purpose. |
4/30/19 – Two Roadsv1
23
| Holbrook Income Fund |
| SUPPLEMENTAL INFORMATION (Unaudited)(Continued) |
| April 30, 2019 |
Officers of the Trust*
| Name, Address, Year of Birth | Position(s) Held with Registrant | Principal Occupation(s) During Past 5 Years | Number of Portfolios Overseen In The Fund Complex** | Other Directorships Held During Past 5 Years |
| James Colantino 80 Arkay Drive Hauppauge, NY 11788 Year of Birth: 1969 | President Since Feb. 2017 Treasurer (2012 to 2017) | Senior Vice President (2012- present); Vice President (2004 to 2012); Gemini Fund Services, LLC. | N/A | N/A |
| Laura Szalyga 80 Arkay Drive Hauppauge, NY 11788 Year of Birth: 1978 | Treasurer Since Feb. 2017 | Vice President, Gemini Fund Services, LLC (since 2015); Assistant Vice President, Gemini Fund Services, LLC (2011-2014). | N/A | N/A |
| Richard A. Malinowski 80 Arkay Drive Hauppauge, NY 11788 Year of Birth: 1983 | Vice President Since Sep. 2018 Secretary Since 2013 | Senior Vice President (since 2017); Vice President and Counsel (2016-2017) and Assistant Vice President (2012 – 2016), Gemini Fund Services, LLC | N/A | N/A |
| William B. Kimme Year of Birth: 1962 | Chief Compliance Officer Since Inception | Senior Compliance Officer, Northern Lights Compliance Services, LLC (September 2011 - present) | N/A | N/A |
| * | Information is as of April 30, 2019. |
| ** | As of April 30, 2019, the Trust was comprised of 20 active portfolios managed by seven unaffiliated investment advisers and two affiliated investment advisers. The term “Fund Complex” applies only to those funds that (i) are advised by a common investment adviser or by an investment adviser that is an affiliated person of the investment adviser of any of the other funds in the Trust or (ii) hold themselves out to investors as related companies for purposes of investment and investor services. The Fund does not hold itself out as related to any other series within the Trust for investment purpose. |
The Fund’s Statement of Additional Information (“SAI”) includes additional information about the Trustees and is available free of charge, upon request, by calling toll-free at 1-877-345-8646.
4/30/19 – Two Roadsv1
24
PRIVACY NOTICE
| FACTS | WHAT DOES TWO ROADS SHARED TRUST DO WITH YOUR PERSONAL INFORMATION |
| Why? | Financial companies choose how they share your personal information. |
| Federal law gives consumers the right to limit some but not all sharing. | |
| Federal law also requires us to tell you how we collect, share, and protect your personal information. Please read this notice carefully to understand what we do. | |
| What? | THE TYPES OF PERSONAL INFORMATION WE COLLECT AND SHARE DEPENDS ON THE PRODUCT OR SERVICE THAT YOU HAVE WITH US. THIS INFORMATION CAN INCLUDE: |
| ● Social Security number and income | |
| ● Account transactions and transaction history | |
| ● Investment experience and purchase history | |
| When you areno longer our customer, we continue to share your information as described in this notice. | |
| How? | All financial companies need to share customers’ personal information to run their everyday business. In the section below, we list the reasons financial companies can share their customers’ personal information; the reason Two Roads Shared Trust chooses to share and whether you can limit this sharing. |
| Reasons we can share your personal information | Does Two Roads Shared Trust share? | Can you limit this sharing? |
| For our everyday business purposes – | ||
| such as to process your transactions, maintain your account(s), respond to court orders and legal investigations, or report to credit bureaus | YES | NO |
| For our marketing purposes – | NO | We do not share |
| to offer our products and services to you | ||
| For joint marketing with other financial companies | NO | We do not share |
| For our affiliates’ everyday business purposes – | NO | We do not share |
| information about your transactions and experiences | ||
| For our affiliates’ everyday business purposes – | NO | We do not share |
| information about your creditworthiness | ||
| For our affiliates to market to you | NO | We do not share |
| For nonaffiliates to market to you | NO | We do not share |
| Questions? | Call 1-402-895-1600 |
25
What we do
| How does Two Roads Shared Trust protect my personal information? | To protect your personal information from unauthorized access and use, we use security measures that comply with federal law. These measures include computer safeguards and secured files and buildings. |
| Our service providers are held accountable for adhering to strict policies and procedures to prevent any misuse of your nonpublic personal information. | |
| How does Two Roads Shared Trust | We collect your personal information, for example, when you |
| collect my personal information? | |
| ● open an account or give us contact information | |
| ● provide account information or give us your income information | |
| ● make deposits or withdrawals from your account | |
| We also collect your personal information from other companies. | |
| Why can’t I limit all sharing? | Federal law gives you the right to limit only |
| ● sharing for affiliates’ everyday business purposes – information about your creditworthiness | |
| ● affiliates from using your information to market to you | |
| ● sharing for nonaffiliates to market to you | |
| State laws and individual companies may give you additional rights to limit sharing | |
| Definitions | |
| Affiliates | Companies related by common ownership or control. They can be financial and nonfinancial companies. |
| ● Two Roads Shared Trust has no affiliates. | |
| Nonaffiliates | Companies not related by common ownership or control. They can be financial and nonfinancial companies. |
| ● Two Roads Shared Trust does not share with nonaffiliates so they can market to you. | |
| Joint marketing | A formal agreement between nonaffiliates financial companies that together market financial products or services to you. |
| ● Two Roads Shared Trust does not jointly market. |
26
Proxy Voting Policy
Information regarding how the Fund votes proxies relating to portfolio securities for the 12 month period ended June 30th as well as a description of the policies and procedures that the Fund used to determine how to vote proxies is available without charge, upon request, by calling 1-877-345-8646 or by referring to the Securities and Exchange Commission’s (“SEC”) website at http://www.sec.gov.
Portfolio Holdings
The Fund files its complete schedule of portfolio holdings with the SEC for the first and third quarters of each fiscal year on Form N-Q. Form N-Q is available on the SEC’s website athttp://www.sec.gov. The information on Form N-Q is available without charge, upon request, by calling 1-877-345-8646.
This report and the financial statements contained herein are submitted for the general information of shareholders and are not authorized for distribution to prospective investors unless preceded or accompanied by an effective prospectus, which contains information about the Fund’s investment objective, risks, fees and expenses. Investors are reminded to read the prospectus carefully before investing in the Fund.
| Investment Adviser |
| Holbrook Holdings Inc |
| 1722 NW Raleigh St. #416 |
| Portland, OR 97212 |
| Administrator |
| Gemini Fund Services, LLC |
| 80 Arkay Drive, Suite 110 |
| Hauppauge, NY 11788 |
ITEM 2. CODE OF ETHICS.
| (a) | The registrant has, as of the end of the period covered by this report, adopted a code of ethics that applies to the registrant's principal executive officer, principal financial officer, and principal accounting officer or controller, or persons performing similar functions, regardless of whether these individuals are employed by the registrant or a third party. |
| (b) | During the period covered by this report, there were no amendments to any provision of the code of ethics. |
| (c) | During the period covered by this report, there were no waivers or implicit waivers of a provision of the code of ethics. |
ITEM 3. AUDIT COMMITTEE FINANCIAL EXPERT.
| The registrant’s Board of Trustees has determined that it does not have an audit committee financial expert serving on its audit committee. At this time, the registrant believes that the experience provided by each member of the audit committee together offer the registrant adequate oversight for the registrant’s level of financial complexity. |
ITEM 4. PRINCIPAL ACCOUNTANT FEES AND SERVICES.
| (a) | Audit Fees. The aggregate fees billed for each of the last two fiscal years for professional services rendered by the registrant's principal accountant for the audit of the registrant's annual financial statements or services that are normally provided by the accountant in connection with statutory and regulatory filings or engagements for those fiscal years are as follows:
|
| Trust Series | 2019 | 2018 |
| Holbrook Income Fund | 15,000 | 15,700 |
| (b) | Audit-Related Fees. There were no fees billed in each of the last two fiscal years for assurances and related services by the principal accountant that are reasonably related to the performance of the audit of the registrant’s financial statements and are not reported under paragraph (a) of this item. |
| (c) | Tax Fees. The aggregate fees billed in each of the last two fiscal years for professional services rendered by the principal accountant for tax compliance are as follows: |
| Trust Series | 2019 | 2018 |
| Holbrook Income Fund | 2,900 | 2,800 |
| (d) | All Other Fees. The aggregate fees billed in each of the last two fiscal years for products and services provided by the registrant’s principal accountant, other than the services reported in paragraphs (a) through (c) of this item were $0 and $0 for the fiscal years ended April 30, 2018 and 2017, respectively. |
| (e)(1) | The audit committee does not have pre-approval policies and procedures. Instead, the audit committee or audit committee chairman approves on a case-by-case basis each audit or non-audit service before the principal accountant is engaged by the registrant. |
| (e)(2) | There were no services described in each of paragraphs (b) through (d) of this Item that were approved by the audit committee pursuant to paragraph (c)(7)(i)(C) of Rule 2-01 of Regulation S-X. |
| f) | Not applicable. The percentage of hours expended on the principal accountant's engagement to audit the registrant's financial statements for the most recent fiscal year that were attributed to work performed by persons other than the principal accountant's full-time, permanent employees was zero percent (0%). |
| (g) | All non-audit fees billed by the registrant's principal accountant for services rendered to the registrant for the fiscal years ended April 30, 2018 and 2017, respectively, are disclosed in (b)-(d) above. There were no audit or non-audit services performed by the registrant's principal accountant for the registrant's adviser. |
ITEM 5. AUDIT COMMITTEE OF LISTED REGISTRANTS.
Not applicable
ITEM 6. SCHEDULE OF INVESTMENT
Included in annual report to shareholders filed under item 1 of this form.
ITEM 7. DISCLOSURE OF PROXY VOTING POLICIES AND PROCEDURES FOR CLOSED-END MANAGEMENT INVESTMENT COMPANIES.
Not applicable Fund is an open-end management investment company
ITEM 8. PORTFOLIO MANAGERS OF CLOSED-END MANAGEMENT INVESTMENT COMPANIES
Not applicable Fund is an open-end management investment company
ITEM 9. PURCHASES OF EQUITY SECURITIES BY CLOSED-END MANAGEMENT INVESTMENT COMPANY AND AFFILIATED PURCHASERS.
Not applicable Fund is an open-end management investment company
ITEM 10. SUBMISSION OF MATTERS TO A VOTE OF SECURITY HOLDERS.
Not applicable at this time.
ITEM 11. CONTROLS AND PROCEDURES.
| (a) | The registrant's principal executive and principal financial officers, or persons performing similar functions, have concluded that the registrant's disclosure controls and procedures (as defined in Rule 30a-3(c) under the 1940 Act, are effective, as of a date within 90 days of the filing date of this report, based on the evaluation of these controls and procedures required by Rule 30a-3(b) under the 1940 Act and Rule 15d-15(b) under the Securities Exchange Act of 1934, as amended. |
| (b) | There were no changes in the registrant's internal control over financial reporting (as defined in Rule 30a-3(d) under the 1940 Act) that occurred during the period covered by this report that have materially affected, or are reasonably likely to materially affect, the registrant's internal control over financial reporting. |
ITEM 12. DISCLOSURE OF SECURITIES LENDING ACTIVITIES FOR CLOSED-ENDED MANAGEMENT INVESTMENT COMPANIES
Not applicable.
ITEM 13. EXHIBITS
| (1) | Code of Ethics for Principal Executive and Senior Financial Officers is attached hereto. |
| (2) | Certifications pursuant to Section 302 of the Sarbanes-Oxley Act of 2002 are filed herewith. |
| (3) | Certifications pursuant to Section 906 of the Sarbanes-Oxley Act of 2002 are filed herewith. |
SIGNATURES
Pursuant to the requirements of the Securities Exchange Act of 1934 and the Investment Company Act of 1940, the registrant has duly caused this report to be signed on its behalf by the undersigned, thereunto duly authorized.
Two Roads Shared Trust
| By James Colantino | /s/ James Colantino |
| Principal Executive Officer/President | |
| Date: July 1, 2019 | |
Pursuant to the requirements of the Securities Exchange Act of 1934 and the Investment Company Act of 1940, this report has been signed below by the following person on behalf of the registrant and in the capacities and on the date indicated.
| By Laura Szalyga | /s/ Laura Szalyga |
| Principal Financial Officer/Treasurer | |
| Date: July 1, 2019 | |