united states
securities and exchange commission
washington, d.c. 20549
form n-csr
certified shareholder report of registered management
investment companies
Investment Company Act file number 811-22718
Two Roads Shared Trust
(Exact name of registrant as specified in charter)
225 Pictoria Drive, Suite 450, Cincinnati, OH 45246
(Address of principal executive offices) (Zip code)
Rich Malinowski, Gemini Fund Services, LLC.
4221 North 203rd Street, Suite 100, Elkhorn, Nebraska 68022
(Name and address of agent for service)
Registrant's telephone number, including area code: 631-470-2600
Date of fiscal year end: 7/31
Date of reporting period: 7/31/20
ITEM 1. REPORTS TO SHAREHOLDERS.

Hanlon Managed Income Fund
| Class A | HANAX | |
| Class C | HANCX | |
| Class I | HANIX | |
| Class R | HANRX |
Hanlon Tactical Dividend and Momentum Fund
| Class A | HTDAX | |
| Class C | HTDCX | |
| Class I | HTDIX | |
| Class R | HTDRX |
Annual Report
July 31, 2020
www.HanlonFunds.com
1-844-828-3212
Distributed by Northern Lights Distributors, LLC
Member FINRA
This report and the financial statements contained herein are submitted for the general information of shareholders and are not authorized for distribution to prospective investors unless preceded or accompanied by an effective prospectus. Nothing contained herein is to be considered an offer of sale or solicitation of an offer to buy shares of the Funds. Such offering is made only by a prospectus, which contains information about each Fund’s investment objective, risks, fees and expenses. Investors are reminded to read the Funds’ prospectus carefully before investing in the Funds.
Beginning on January 1, 2021, as permitted by regulations adopted by the Securities and Exchange Commission, paper copies of the Funds’ shareholder reports like this one will no longer be sent by mail, unless you specifically request paper copies of the reports. Instead, the reports will be made available on the Funds’ website www.hanlonfunds.com, and you will be notified by mail each time a report is posted and provided with a website link to access the report.
If you already elected to receive shareholder reports electronically, you will not be affected by this change and you need not take any action. You may elect to receive shareholder reports and other communications from the Funds electronically or to continue receiving paper copies of shareholder reports, which are available free of charge, by contacting your financial intermediary (such as a broker-dealer or bank) or, if you are a direct investor, by following the instructions included with paper Fund documents that have been mailed to you.
| Dear Fellow Shareholders, |
 |
| Sean Hanlon, CFP® |
| CEO and Co-Chief Investment Officer |
The Hanlon Managed Income Fund’s (“the Fund”) investment strategy attempts to achieve our core tactical mission of providing current income, capital preservation, and positive risk-adjusted returns; although there is no guarantee that we will meet these objectives. The Fund is designed to adjust to changes in market conditions, shifting to cash when we identify signs of potential market downturns. Shareholders can use the Managed Income Fund to attempt to generate, although there is no guarantee, potentially higher returns than the traditional “40” portion of aggregate bond exposure of the classic “60/40” balanced portfolio.
| Thank you, |
 |
1
| Commentary |
Note: The following commentary pertains to the Fund’s annual reporting period from August 1, 2019 to July 31, 2020.
US fixed income markets were starting to show signs of concern in late January, as Treasury yields fell below 2% as news of the COVID-19 outbreak in China began to raise concerns over slowing global growth. These concerns would soon explode into a global pandemic, forcing global central banks to abandon all thoughts of fiscal tightening and instead unleash an unprecedented influx of stimulus measures. In the US, the Fed’s “hold-steady” policy on interest rates was quickly thrown out the window, with the Central Bank electing to swiftly cut rates by 50 basis points on March 3rd, followed by an emergency 1% cut on March 16th, leaving the target federal funds rate at just 0-25 basis points.
As dramatic as these cuts were, arguably more extreme was the Fed’s foray into corporate debt markets, which many have pointed out is in violation of the Federal Reserve Act of 1913. The Fed was able skirt the illegality of violating its own charter via a loophole in which the Treasury made the purchase on behalf of the central bank, however, the end result remains that the US Federal Reserve is now effectively backstopping US corporations. The Fed was willing to extend this bailout even beyond investment grade companies, allowing a portion of the bond purchases to be allocated to high yield, or “junk” debt.
The market’s reaction to this unprecedented government intervention was predictable. The market turned on a dime, from sheer panic to frenzied buying upon announcement of the program. Arguably, the Fed accomplished its mission of stabilizing corporate debt markets simply by announcing the policy shift, and probably didn’t even need to carry through with the purchases. The Fed did hold true to its word, however, and now holds $3.6 billion in corporate bonds, a small fraction of the $750 billion capacity it authorized.
While many free market proponents will decry the Fed’s intervention into the corporate bond markets as a socialist overreach and a restriction on “creative destruction”, high yield bondholders who were staring down the -22% (using performance of the iShares iBoxx High Yield Bond ETF, HYG) collapse from February 20th to March 23rd were certainly celebrating. HYG saw its best day ever, jumping 6.6% on April 8th. High yield bonds have since recovered nearly all their losses for the year, which is shocking considering the extreme levels of unemployment and mounting corporate defaults.
The COVID-19 pandemic, and the ensuing central bank response, have changed the narrative regarding how far the US central bank will intervene. While the Fed is acting with an admirable goal of limiting the economic impact of what is effectively a natural disaster, its actions do raise questions over whether or not the cure will be worse than the sickness over the long term as the consequences of unlimited money printing play out.
Performance Update
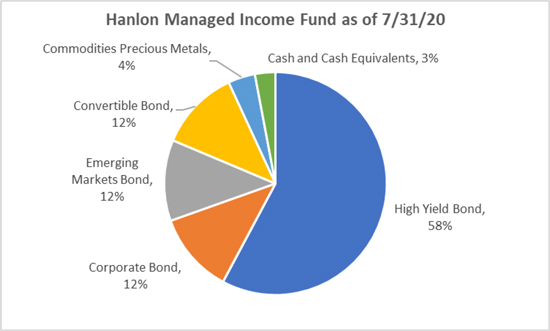
| The Hanlon Managed Income Fund (“the Fund”) invests in a variety of fixed income asset classes, including High Yield and Investment Grade Corporate Bonds, Bank Loans, International Developed Market Bonds, Emerging Market Bonds, Convertible Bonds, Municipal Bonds, REITs, and Preferred Stocks. In addition, the Fund can also invest in equities, primarily utilizing ETFs focused on high-dividend-paying stocks. |
2
| High Yield Bonds represented the largest asset class exposure in the fund with a 48% allocation at the start of the period. The Fund began the second half of the annual period with a 43% allocation to cash. The remaining exposure was allocated among high yield bonds, investment grade corporate bonds, convertible bonds, bank loans, and REITs. High yield bond exposure was increased in mid-February, bringing cash levels down to roughly 9%, however these positions were exited on February 25th in adherence to the Fund’s tactical trading signals. The trade was well-timed, as it allowed the Fund to sidestep the severe selloff in high yield. From the February 20th peak to the March 23rd trough, the iShares iBoxx High Yield ETF (HYG) fell over 22% while the Fund experienced less than half the drawdown, falling just 9.4%. |
As previously mentioned, the rebound in high yield, spurred by the US Federal Reserve’s foray into corporate debt markets, was rapid. Unfortunately, the fund’s tactical signals, which are price-based and quantitative in nature, and cannot predict shifts in central bank policy, continued to call for cautious positioning during the high yield bounce back. The Fund did gradually add back exposure, reducing cash to just 3% by the end of the semiannual period, but most of the market’s gains occurred in the period immediately following the selloff therefore the fund lagged broader fixed income markets from the March 23rd bottom.
For the period from 8/1/2019 – 7/31/2020 the Fund’s Class I shares returned -2.62%. The Fund is benchmarked against 3-month Treasury Bills, which returned 1.30% during the same period. As of July 31st, 2020, the Fund had the following weightings.
The views in this report are those of the Fund’s management. This report contains certain forward-looking statements about factors that may affect the performance of the Fund in the future. These statements are based on the Fund’s management’s predictions and expectations concerning certain future events such as the performance of the economy as a whole and of specific industry sectors. Management believes these forward-looking statements are reasonable, although they are inherently uncertain and difficult to predict.
| 1168 NLD – 9/15/2020 |
3
| Dear Fellow Shareholders, |
|
| Sean Hanlon, CFP® |
| CEO and Co-Chief Investment Officer |
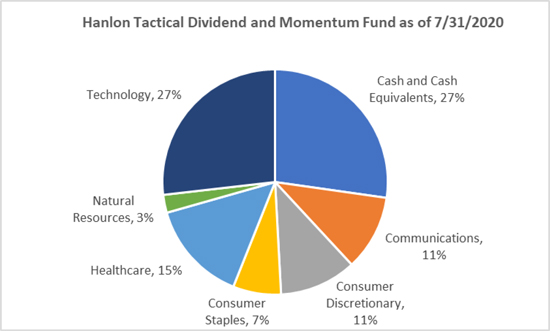
We launched the Hanlon Tactical Dividend and Momentum Fund (“TDM”, “the Fund”) with the goal of protecting our shareholders from large market drawdowns and providing positive, risk-adjusted returns; although there is no guarantee that we will meet these objectives. The Fund invests in the 11 major equity economic sectors, weighted up to their respective S&P 500 market capitalizations. This approach attempts to closely track the broader equity market during times when the market is steadily advancing. When a given sector displays relative weakness, we will attempt to reduce or eliminate exposure, while remaining in the other sectors. In extreme times, we may exit the markets completely and ride out the volatility in cash or short-term fixed income positions.
| Thank you, |
|
4
| Commentary |
Note: The following commentary pertains to the Fund’s annual reporting period from August 1, 2019 to July 31, 2020.
US equity markets experienced extreme volatility during the second half of the annual reporting period (2/1/20-7/31/20) as the COVID-19 pandemic triggered a global shutdown in commerce, transportation, and manufacturing. It is interesting to look back at our last semiannual letter, when the threat of COVID-19 was listed among other potential “black swan” events and reflect on how dramatically the world has changed in 6 short months. While the COVID shutdown was unprecedented, it was met with a staggering amount of support in the form of government stimulus programs and central bank intervention directly into financial markets. The US Federal Reserve authorized nearly $6 trillion to support financial markets, while legislators authorized an additional $3.7 trillion, with more currently being negotiated. The result was an extremely violent plunge followed by a period of frenzied buying, as the narrative has now shifted to risk-on with many investors wagering global central banks and lawmakers will continue to throw unfathomable amounts of money at the pandemic.
There has been much debate over the long-run implications of printing trillions of dollars and effectively socializing financial losses in some cases. On one hand, the pandemic can be considered on par with a natural disaster, and it is easy to justify a social safety net for business as well as individuals impacted through no fault of their own. The counterargument holds that intervening in financial markets prevents “creative destruction”, allowing so-called zombie companies access to credit markets that only prolongs their slow demise. While there have been some head-scratching misallocation of capital - such as a nearly-900% spike in Hertz (HTZ) stock after the company filed for bankruptcy – the market is effectively separating the winners from losers as it looks towards the post-COVID economy. Evidence of this can be found in the outperformance of the Nasdaq relative to the S&P 500 and Dow Jones Industrial Average, spurred by overweight exposure to the Technology sector.
Technology was already the leader during the prior semiannual period (8/1/19-1/31/20), and while the sector (measured by the SPDR Technology Sector ETF XLK) fell alongside broader markets during the initial COVID-19 selloff, it rebounded more dramatically off the March 23rd bottom as investors began to place a premium on companies that can thrive without traditional physical infrastructure. The crowding into technology stocks has pushed the Tech sector up to around 28% of the S&P 500 market capitalization, compared to less than 19% a decade prior.
| After Technology, the Consumer Discretionary Sector posted the best performance during the semiannual period, however much of that can be attributed to a near-25% weighting to Amazon (AMZN) which derives most of its profits from its cloud-computing Amazon Web Services business, and could arguably be considered a Tech company as well. On the other end of the spectrum, the dismal news for Energy companies continued, as the COVID-19 shutdown absolutely decimated demand, sending oil prices briefly negative in a historic selloff. Financial firms also lagged, hit with a double whammy of extremely low interest rates and mounting loan delinquencies and defaults. |
5
| Performance Update |
The Hanlon Tactical Dividend and Momentum Fund (“TDM”, the “Fund”) was invested in all sectors aside from Energy as of February 1st. By March 4th, the Fund had exited several sectors to raise its cash position to roughly 42%. Cash reached 68% on March 13th, and by March 20th the Fund was fully defensive in 100% cash. Due to the severity of the market selloff and the quantitative, signal-driven nature of the Fund, reinvestment of the Cash positions did not occur until May 11th, when roughly 23% of the assets were redeployed into the Healthcare and Technology sectors. The Fund scaled back up in early June to around 64% invested by June 8th. At the end of the semiannual period, the Fund was roughly 73% invested.
The Fund aims to provide lower volatility than the broad S&P 500 Index, particularly in times of severe market stress. From the February 19th peak to the March 23rd trough, the Fund experienced roughly half of the drawdown experienced by the S&P 500 Index, with the Fund down 16.9% compared to a 33.8% decline in the S&P 500. The S&P was able to stage a dramatic recovery, however, thanks to quick action from the Federal Reserve and lawmakers. As a result, the Fund’s Class I shares lost 2.50% during the annual period, lagging the broad S&P 500 Index which was able to quickly recover to gain 11.96% during the same timeframe. As of July 31st, 2020, the Fund had the below weightings:
The views in this report are those of the Fund’s management. This report contains certain forward-looking statements about factors that may affect the performance of the Fund in the future. These statements are based on the Fund’s management’s predictions and expectations concerning certain future events such as the performance of the economy as a whole and of specific industry sectors. Management believes these forward-looking statements are reasonable, although they are inherently uncertain and difficult to predict.
| 1167-NLD-9/15/2020 |
6
| Hanlon Managed Income Fund |
| PORTFOLIO REVIEW (Unaudited) |
| July 31, 2020 |
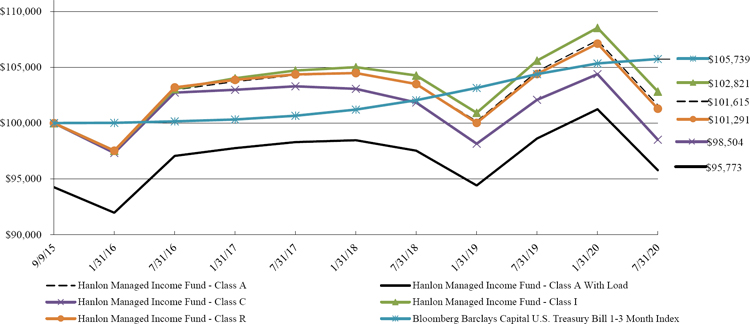
The Fund’s performance figures* for each periods ended July 31, 2020, compared to its benchmark:
| One Year | Since Inception (a) | |
| Hanlon Managed Income Fund - Class A | (2.88)% | 0.33% |
| Hanlon Managed Income Fund - Class A with load | (8.46)% | (0.88)% |
| Hanlon Managed Income Fund - Class C | (3.50)% | (0.31)% |
| Hanlon Managed Income Fund - Class I | (2.62)% | 0.57% |
| Hanlon Managed Income Fund - Class R | (2.97)% | 0.26% |
| Bloomberg Barclays Capital U.S. Treasury Bill 1-3 Month Index (b) | 1.30% | 1.15% |
Comparison of the Change in Value of a $100,000 Investment
| * | The performance data quoted is historical. Past performance is no guarantee of future results. Current performance may be higher or lower than the performance data quoted. The principal value and investment return of an investment will fluctuate so that your shares, when redeemed, may be worth more or less than their original cost. The returns shown do not reflect the deduction of taxes that a shareholder would pay on Fund distributions or on the redemptions of Fund shares. Returns greater than 1 year are annualized. The total annual operating expenses as stated in the fee table of the Fund’s prospectus dated November 28, 2019 are 2.06%, 2.81%, 1.81% and 2.21%, for Class A, Class C, Class I and Class R shares, respectively. Hanlon Investment Management, Inc. (the “Advisor”) has contractually agreed to reduce the Fund’s fees and/or absorb expenses of the Fund until at least November 28, 2020 to ensure that total annual Fund operating expenses (exclusive of any front-end or contingent deferred loads; brokerage fees and commissions; expenses of other investment companies in which the Fund may invest (“acquired fund fees and expenses”); borrowing costs, such as interest and dividend expense on securities sold short; taxes; and extraordinary expenses, such as litigation expenses) of the Fund do not exceed 1.70%, 2.45%, 1.45%, and 1.85% of average daily net assets attributable to Class A, Class C, Class I, and Class R shares, respectively. This agreement may be terminated with respect to the Fund by the Board of Trustees on 60 days’ written notice to the Advisor. These expense reimbursements are subject to possible recoupment from the Fund in future years on a rolling three-year basis (within three years after the fees have been waived or reimbursed) if such recoupment can be achieved without exceeding the foregoing expense limits as well as any expense limitation that was in effect at the time the waiver or reimbursement was made. Class A Shares are subject to a maximum sales charge of 5.75% imposed on purchases. Class C shares are subject to a contingent deferred sales charge of 1.00% on redemptions made within one year of purchase. For investments in Class A shares of $1 million or more, there is a contingent deferred sales charge of 1.00% on redemptions made within one year of purchase. For performance information current to the most recent month-end, please call 1-844-828-3212. |
| (a) | Inception date is September 9, 2015. |
| (b) | The Bloomberg Barclays Capital U.S. Treasury Bill 1-3 Month Index includes all publicly issued zero-coupon U.S. Treasury Bills that have a remaining maturity of less than 3 months and more than 1 month, are rated investment grade, and have $250 million or more of outstanding face value. In addition, the securities must be denominated in U.S. dollars and must be fixed rate and non convertible. Unlike a mutual fund, an index does not reflect any trading costs or management fees. Investors cannot directly invest in an index. |
| Portfolio Composition as of July 31, 2020 | ||||
| Holdings By Investment Type | % of Net Assets | |||
| Exchange Traded Funds - Debt | 93.7 | % | ||
| Collateral For Securities Loaned | 10.9 | % | ||
| Exchange Traded Fund - Commodity | 3.9 | % | ||
| Money Market Fund | 3.6 | % | ||
| Liabilities In Excess of Other Assets | (12.1 | )% | ||
| 100.0 | % | |||
Please refer to the Portfolio of Investments in this annual report for a detailed listing of the Fund’s holdings.
7
| Hanlon Tactical Dividend and Momentum Fund |
| PORTFOLIO REVIEW (Unaudited) |
| July 31, 2020 |
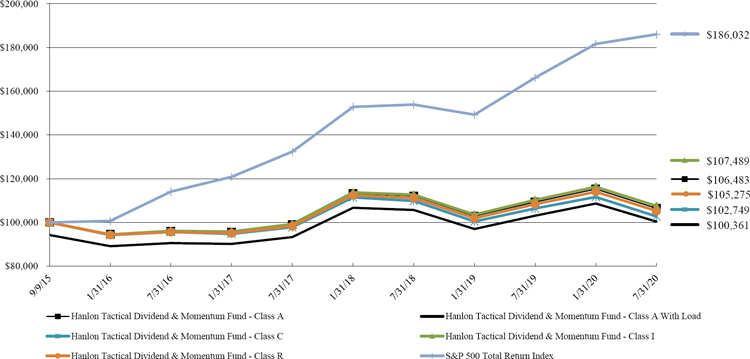
The Fund’s performance figures* for each periods ended July 31, 2020, compared to its benchmark:
| One Year | Since Inception (a) | |
| Hanlon Tactical Dividend and Momentum Fund - Class A | (2.63)% | 1.29% |
| Hanlon Tactical Dividend and Momentum Fund - Class A with load | (8.20)% | 0.07% |
| Hanlon Tactical Dividend and Momentum Fund - Class C | (3.42)% | 0.56% |
| Hanlon Tactical Dividend and Momentum Fund - Class I | (2.50)% | 1.49% |
| Hanlon Tactical Dividend and Momentum Fund - Class R | (2.81)% | 1.06% |
| S&P 500 Total Return Index (b) | 11.96% | 13.53% |
Comparison of the Change in Value of a $100,000 Investment
| * | The performance data quoted is historical. Past performance is no guarantee of future results. Current performance may be higher or lower than the performance data quoted. The principal value and investment return of an investment will fluctuate so that your shares, when redeemed, may be worth more or less than their original cost. The returns shown do not reflect the deduction of taxes that a shareholder would pay on Fund distributions or on the redemptions of Fund shares. Returns greater than 1 year are annualized. The total annual operating expenses as stated in the fee table of the Fund’s prospectus dated November 28, 2019 are 1.78%, 2.53%, 1.53% and 1.93% for Class A, Class C, Class I and Class R shares, respectively. The Advisor has contractually agreed to reduce the Fund’s fees and/or absorb expenses of the Fund until at least November 28, 2020 to ensure that total annual Fund operating expenses (exclusive of any front-end or contingent deferred loads; brokerage fees and commissions; expenses of other investment companies in which the Fund may invest (“acquired fund fees and expenses”); borrowing costs, such as interest and dividend expense on securities sold short; taxes; and extraordinary expenses, such as litigation expenses) of the Fund do not exceed 1.70%, 2.45%, 1.45%, and 1.85% of average daily net assets attributable to Class A, Class C, Class I, and Class R shares, respectively. This agreement may be terminated with respect to the Fund by the Board of Trustees on 60 days’ written notice to the Advisor. These expense reimbursements are subject to possible recoupment from the Fund in future years on a rolling three-year basis (within three years after the fees have been waived or reimbursed) if such recoupment can be achieved without exceeding the foregoing expense limits as well as any expense limitation that was in effect at the time the waiver or reimbursement was made. Class A shares are subject to a maximum sales charge imposed on purchases of 5.75%. Class C shares are subject to a contingent deferred sales charge of 1.00% on redemptions made within one year of purchase. For investments in Class A shares of $1 million or more, there is a contingent deferred sales charge of 1.00% on redemptions made within one year of purchase. For performance information current to the most recent month-end, please call 1-844-828-3212. |
| (a) | Inception date is September 9, 2015. |
| (b) | The S&P 500 Total Return Index is an unmanaged free-float capitalization-weighted index which measures the performance of 500 large-cap common stocks actively traded in the United States. Unlike a mutual fund, an index does not reflect any trading costs or management fees. Investors cannot directly invest in an index. |
| Portfolio Composition as of July 31, 2020 | ||||
| Holdings By Investment Type | % of Net Assets | |||
| Exchange Traded Funds - Equity | 73.2 | % | ||
| Money Market Fund | 27.0 | % | ||
| Liabilities in Excess of Other Assets | (0.2 | )% | ||
| 100.0 | % | |||
Please refer to the Portfolio of Investments in this annual report for a detailed listing of the Fund’s holdings.
8
| Hanlon Managed Income Fund |
| PORTFOLIO OF INVESTMENTS |
| July 31, 2020 |
| Shares | Fair Value | |||||||
| EXCHANGE TRADED FUNDS - 97.6% | ||||||||
| COMMODITY FUND - 3.9% | ||||||||
| 209,325 | iShares Gold Trust * ^ | $ | 3,947,870 | |||||
| TOTAL COMMODITY FUND (Cost - $3,633,195) | ||||||||
| DEBT FUNDS - 93.7% | ||||||||
| 156,039 | iShares 0-5 Year High Yield Corporate Bond ETF | 6,932,813 | ||||||
| 173,783 | iShares iBoxx High Yield Corporate Bond ETF | 14,839,330 | ||||||
| 181,192 | SPDR Bloomberg Barclays Convertible Securities ETF | 11,757,549 | ||||||
| 139,901 | SPDR Bloomberg Barclays High Yield Bond ETF | 14,843,496 | ||||||
| 265,811 | SPDR Bloomberg Barclays Short Term High Yield Bond ETF | 6,924,377 | ||||||
| 489,573 | VanEck Vectors Fallen Angel High Yield Bond ETF ^ | 15,000,517 | ||||||
| 121,615 | Vanguard Intermediate-Term Corporate Bond ETF | 11,775,980 | ||||||
| 104,616 | Vanguard Long-Term Corporate Bond ETF | 11,725,361 | ||||||
| TOTAL DEBT FUNDS (Cost - $90,780,053) | 93,799,423 | |||||||
| TOTAL EXCHANGE TRADED FUNDS (Cost - $94,413,248) | 97,747,293 | |||||||
| SHORT-TERM INVESTMENTS - 14.5% | ||||||||
| COLLATERAL FOR SECURITIES LOANED - 10.9% | ||||||||
| 1,327,330 | Dreyfus Government Cash Management, Investor Class 0.06% + (a) | 1,327,330 | ||||||
| 9,631,170 | Milestone Treasury Obligations Fund, Institutional Class 0.01% + (a)(b) | 9,631,170 | ||||||
| TOTAL COLLATERAL FOR SECURITIES LOANED (Cost - $10,958,500) | 10,958,500 | |||||||
| MONEY MARKET FUND - 3.6% | ||||||||
| 3,589,798 | Morgan Stanley Institutional Liquidity Funds - Treasury Securities Portfolio, Institutional Class, 0.02% + | 3,589,798 | ||||||
| (Cost - $3,589,798) | ||||||||
| TOTAL SHORT-TERM INVESTMENTS (Cost - $14,548,298) | 14,548,298 | |||||||
| TOTAL INVESTMENTS - 112.1% (Cost - $108,961,546) | $ | 112,295,591 | ||||||
| LIABILITIES IN EXCESS OF OTHER ASSETS - (12.1)% | (12,177,606 | ) | ||||||
| NET ASSETS - 100.0% | $ | 100,117,985 | ||||||
ETF - Exchange Traded Fund
SPDR - Standard & Poor’s Depositary Receipt
| * | Non income producing security. |
| ^ | All or a portion of this security is on loan. The market value of loaned securities is $11,018,595. |
| + | Money market fund; interest rate reflects seven-day effective yield on July 31, 2020. |
| (a) | Security was purchased with cash received as collateral for securities on loan at July 31, 2020. Total collateral had a value of $10,958,500 at July 31, 2020. Additional collateral received from the borrower not disclosed in the Portfolio of Investments had a value of $189,078 as of July 31, 2020. |
| (b) | The Milestone Treasury Obligations Fund is managed by CLS Investments, LLC, an affiliate of the Distributor. |
The accompanying notes are an integral part of these financial statements.
9
| Hanlon Tactical Dividend and Momentum Fund |
| PORTFOLIO OF INVESTMENTS |
| July 31, 2020 |
| Shares | Fair Value | |||||||
| EXCHANGE TRADED FUNDS - 73.2% | ||||||||
| EQUITY FUNDS - 73.2% | ||||||||
| 193,006 | Communication Services Select Sector SPDR Fund | $ | 11,219,439 | |||||
| 82,772 | Consumer Discretionary Select Sector SPDR Fund | 11,339,764 | ||||||
| 114,934 | Consumer Staples Select Sector SPDR Fund | 7,206,362 | ||||||
| 140,919 | Health Care Select Sector SPDR Fund ^ | 14,871,182 | ||||||
| 42,993 | Materials Select Sector SPDR Fund ^ | 2,595,058 | ||||||
| 186,352 | Technology Select Sector SPDR Fund | 20,578,851 | ||||||
| 24,563 | Vanguard Information Technology ETF | 7,252,717 | ||||||
| TOTAL EXCHANGE TRADED FUNDS (Cost - $70,273,015) | 75,063,373 | |||||||
| SHORT-TERM INVESTMENTS - 27.0% | ||||||||
| MONEY MARKET FUND - 27.0% | ||||||||
| 27,708,182 | Morgan Stanley Institutional Liquidity Funds - Treasury Securities Portfolio, Institutional Class, 0.02% + | 27,708,182 | ||||||
| TOTAL SHORT-TERM INVESTMENTS (Cost - $27,708,182) | ||||||||
| TOTAL INVESTMENTS - 100.2% (Cost - $97,981,197) | $ | 102,771,555 | ||||||
| LIABILITIES IN EXCESS OF OTHER ASSETS - (0.2)% | (212,792 | ) | ||||||
| NET ASSETS - 100.0% | $ | 102,558,763 | ||||||
ETF - Exchange Traded Fund
SPDR - Standard & Poor’s Depositary Receipt
| ^ | All or a portion of this security is on loan. The market value of loaned securities is $17,164,862. Collateral received from the borrower not disclosed in the Portfolio of Investments had a value of $17,602,878 as of July 31, 2020. |
| + | Money market fund; interest rate reflects seven-day effective yield on July 31, 2020. |
The accompanying notes are an integral part of these financial statements.
10
| Hanlon Funds |
| STATEMENTS OF ASSETS AND LIABILITIES |
| July 31, 2020 |
| Hanlon Managed | Hanlon Tactical | |||||||
| Income Fund | Dividend and Momentum Fund | |||||||
| ASSETS | ||||||||
| Investment securities: | ||||||||
| Investments at cost | $ | 108,961,546 | $ | 97,981,197 | ||||
| Investments at value | $ | 112,295,591 | $ | 102,771,555 | ||||
| Receivable for fund shares sold | 6,690 | 12,295 | ||||||
| Dividends and interest receivable | 2,282 | 962 | ||||||
| Securities lending income receivable | — | 2,372 | ||||||
| Prepaid expenses and other assets | 30,931 | 27,777 | ||||||
| TOTAL ASSETS | 112,335,494 | 102,814,961 | ||||||
| LIABILITIES | ||||||||
| Securities lending collateral | 10,958,500 | — | ||||||
| Payable for investments purchased | 898,209 | — | ||||||
| Payable for Fund shares repurchased | 150,629 | 66,107 | ||||||
| Investment advisory fees payable | 101,897 | 85,888 | ||||||
| Payable to related parties | 35,049 | 31,147 | ||||||
| Distribution (12b-1) fees payable | 5,220 | 8,513 | ||||||
| Accrued expenses and other liabilities | 68,005 | 64,543 | ||||||
| TOTAL LIABILITIES | 12,217,509 | 256,198 | ||||||
| NET ASSETS | $ | 100,117,985 | $ | 102,558,763 | ||||
| COMPOSITION OF NET ASSETS: | ||||||||
| Paid in capital | $ | 128,934,075 | $ | 107,137,198 | ||||
| Accumulated losses | (28,816,090 | ) | (4,578,435 | ) | ||||
| NET ASSETS | $ | 100,117,985 | $ | 102,558,763 | ||||
| NET ASSET VALUE PER SHARE: | ||||||||
| Class A Shares: | ||||||||
| Net Assets | $ | 7,168,990 | $ | 8,669,157 | ||||
| Shares of beneficial interest outstanding ($0 par value, unlimited shares authorized) | 818,897 | 822,848 | ||||||
| Net asset value (Net Assets ÷ Shares Outstanding) and redemption price per share | $ | 8.75 | $ | 10.54 | ||||
| Maximum offering price per share (net asset value plus maximum sales charge of 5.75%) (a) | $ | 9.28 | $ | 11.18 | ||||
| Class C Shares: | ||||||||
| Net Assets | $ | 1,216,237 | $ | 1,086,899 | ||||
| Shares of beneficial interest outstanding ($0 par value, unlimited shares authorized) | 140,475 | 106,893 | ||||||
| Net asset value (Net Assets ÷ Shares Outstanding), offering price and redemption price per share (b) | $ | 8.66 | $ | 10.17 | ||||
| Class I Shares: | ||||||||
| Net Assets | $ | 83,766,093 | $ | 75,871,323 | ||||
| Shares of beneficial interest outstanding ($0 par value, unlimited shares authorized) | 9,612,922 | 7,292,043 | ||||||
| Net asset value (Net Assets ÷ Shares Outstanding), offering price and redemption price per share | $ | 8.71 | $ | 10.40 | ||||
| Class R Shares: | ||||||||
| Net Assets | $ | 7,966,665 | $ | 16,931,384 | ||||
| Shares of beneficial interest outstanding ($0 par value, unlimited shares authorized) | 913,597 | 1,633,133 | ||||||
| Net asset value (Net Assets ÷ Shares Outstanding), offering price and redemption price per share | $ | 8.72 | $ | 10.37 | ||||
| (a) | For investments in Class A shares of $1 million or more, there is a deferred sales charge of 1.00% of the original purchase price on redemptions made within one year of purchase. |
| (b) | Class C shares sold within one year of purchases are subject to a contingent deferred sales charge of 1.00% of the original purchase price. |
The accompanying notes are an integral part of these financial statements.
11
| Hanlon Funds |
| STATEMENTS OF OPERATIONS |
| For the Year Ended July 31, 2020 |
| Hanlon Managed | Hanlon Tactical | |||||||
| Income Fund | Dividend and Momentum Fund | |||||||
| INVESTMENT INCOME | ||||||||
| Dividends | $ | 3,358,335 | $ | 1,359,235 | ||||
| Interest | 384,628 | 373,243 | ||||||
| Securities lending income (net of fees) | 130,125 | 34,887 | ||||||
| TOTAL INVESTMENT INCOME | 3,873,088 | 1,767,365 | ||||||
| EXPENSES | ||||||||
| Investment advisory fees | 1,160,125 | 1,147,712 | ||||||
| Distribution (12b-1) fees: | ||||||||
| Class A | 20,796 | 26,145 | ||||||
| Class C | 14,797 | 13,931 | ||||||
| Class R | 35,725 | 79,521 | ||||||
| Third party administrative service fees | 114,309 | 99,652 | ||||||
| Administration fees | 96,310 | 95,817 | ||||||
| Transfer agent fees | 82,807 | 47,499 | ||||||
| Registration fees | 51,054 | 52,054 | ||||||
| Accounting services fees | 48,105 | 48,481 | ||||||
| Legal fees | 25,009 | 25,507 | ||||||
| Custodian fees | 21,196 | 14,101 | ||||||
| Audit fees | 20,395 | 20,695 | ||||||
| Compliance officer fees | 18,000 | 16,999 | ||||||
| Trustees’ fees and expenses | 16,999 | 16,999 | ||||||
| Insurance expense | 16,492 | 16,041 | ||||||
| Printing and postage expenses | 11,006 | 10,499 | ||||||
| Other expenses | 4,500 | 4,500 | ||||||
| TOTAL EXPENSES | 1,757,625 | 1,736,153 | ||||||
| NET INVESTMENT INCOME | 2,115,463 | 31,212 | ||||||
| REALIZED AND UNREALIZED GAIN (LOSS) ON INVESTMENTS | ||||||||
| Net realized loss from security transactions | (5,478,670 | ) | (4,085,966 | ) | ||||
| Distributions of realized gains from underlying investment companies | 7,668 | — | ||||||
| Net change in unrealized appreciation on investments | 371,268 | 907,155 | ||||||
| NET REALIZED AND UNREALIZED LOSS ON INVESTMENTS | (5,099,734 | ) | (3,178,811 | ) | ||||
| NET DECREASE IN NET ASSETS RESULTING FROM OPERATIONS | $ | (2,984,271 | ) | $ | (3,147,599 | ) | ||
The accompanying notes are an integral part of these financial statements.
12
| Hanlon Managed Income Fund |
| STATEMENTS OF CHANGES IN NET ASSETS |
| For the | For the | |||||||
| Year Ended | Year Ended | |||||||
| July 31, 2020 | July 31, 2019 | |||||||
| FROM OPERATIONS | ||||||||
| Net investment income | $ | 2,115,463 | $ | 5,403,793 | ||||
| Net realized loss from security transactions | (5,478,670 | ) | (7,087,644 | ) | ||||
| Distributions of realized gains from underlying investment companies | 7,668 | — | ||||||
| Net change in unrealized appreciation on investments | 371,268 | 2,570,432 | ||||||
| Net increase (decrease) in net assets resulting from operations | (2,984,271 | ) | 886,581 | |||||
| DISTRIBUTIONS TO SHAREHOLDERS | ||||||||
| From return of capital: | ||||||||
| Class A | (20,125 | ) | (9,898 | ) | ||||
| Class C | (2,468 | ) | (1,710 | ) | ||||
| Class I | (299,673 | ) | (109,577 | ) | ||||
| Class R | (19,521 | ) | (9,898 | ) | ||||
| Distributions paid | ||||||||
| Class A | (160,672 | ) | (387,940 | ) | ||||
| Class C | (22,765 | ) | (66,778 | ) | ||||
| Class I | (1,955,979 | ) | (4,693,521 | ) | ||||
| Class R | (160,314 | ) | (379,455 | ) | ||||
| Net decrease in net assets resulting from distributions to shareholders | (2,641,517 | ) | (5,658,777 | ) | ||||
| FROM SHARES OF BENEFICIAL INTEREST | ||||||||
| Proceeds from shares sold: | ||||||||
| Class A | 630,627 | 2,034,840 | ||||||
| Class C | 202,830 | 155,730 | ||||||
| Class I | 7,642,311 | 9,943,700 | ||||||
| Class R | 1,694,601 | 1,213,566 | ||||||
| Net asset value of shares issued in reinvestment of distributions: | ||||||||
| Class A | 157,310 | 336,757 | ||||||
| Class C | 17,656 | 49,823 | ||||||
| Class I | 128,750 | 242,277 | ||||||
| Class R | 179,835 | 389,353 | ||||||
| Payments for shares redeemed: | ||||||||
| Class A | (3,449,862 | ) | (4,910,936 | ) | ||||
| Class C | (668,786 | ) | (1,454,719 | ) | ||||
| Class I | (31,013,389 | ) | (51,037,839 | ) | ||||
| Class R | (3,621,252 | ) | (3,469,820 | ) | ||||
| Net decrease in net assets resulting from shares of beneficial interest | (28,099,369 | ) | (46,507,268 | ) | ||||
| TOTAL DECREASE IN NET ASSETS | (33,725,157 | ) | (51,279,464 | ) | ||||
| NET ASSETS | ||||||||
| Beginning of Year | 133,843,142 | 185,122,606 | ||||||
| End of Year | $ | 100,117,985 | $ | 133,843,142 | ||||
| SHARE ACTIVITY | ||||||||
| Class A: | ||||||||
| Shares Sold | 70,138 | 223,904 | ||||||
| Shares Reinvested | 17,173 | 37,317 | ||||||
| Shares Redeemed | (379,299 | ) | (537,385 | ) | ||||
| Net decrease in shares of beneficial interest outstanding | (291,988 | ) | (276,164 | ) | ||||
| Class C: | ||||||||
| Shares Sold | 22,432 | 16,884 | ||||||
| Shares Reinvested | 1,938 | 5,587 | ||||||
| Shares Redeemed | (75,409 | ) | (163,005 | ) | ||||
| Net decrease in shares of beneficial interest outstanding | (51,039 | ) | (140,534 | ) | ||||
| Class I: | ||||||||
| Shares Sold | 865,019 | 1,097,375 | ||||||
| Shares Reinvested | 14,149 | 26,939 | ||||||
| Shares Redeemed | (3,495,090 | ) | (5,593,773 | ) | ||||
| Net decrease in shares of beneficial interest outstanding | (2,615,922 | ) | (4,469,459 | ) | ||||
| Class R: | ||||||||
| Shares Sold | 192,451 | 132,435 | ||||||
| Shares Reinvested | 19,695 | 43,346 | ||||||
| Shares Redeemed | (409,452 | ) | (382,428 | ) | ||||
| Net decrease in shares of beneficial interest outstanding | (197,306 | ) | (206,647 | ) | ||||
The accompanying notes are an integral part of these financial statements.
13
| Hanlon Tactical Dividend and Momentum Fund |
| STATEMENTS OF CHANGES IN NET ASSETS |
| For the | For the | |||||||
| Year Ended | Year Ended | |||||||
| July 31, 2020 | July 31, 2019 | |||||||
| FROM OPERATIONS | ||||||||
| Net investment income | $ | 31,212 | $ | 387,326 | ||||
| Net realized gain (loss) from security transactions | (4,085,966 | ) | 10,406,209 | |||||
| Net change in unrealized appreciation (depreciation) on investments | 907,155 | (14,672,482 | ) | |||||
| Net decrease in net assets resulting from operations | (3,147,599 | ) | (3,878,947 | ) | ||||
| DISTRIBUTIONS TO SHAREHOLDERS | ||||||||
| From return of capital: | ||||||||
| Class A | (6,353 | ) | (1,701 | ) | ||||
| Class I | (50,501 | ) | (14,196 | ) | ||||
| Class R | (12,455 | ) | — | |||||
| Distributions paid | ||||||||
| Class A | (41,492 | ) | (2,201 | ) | ||||
| Class I | (562,519 | ) | (330,705 | ) | ||||
| Class R | (48,647 | ) | — | |||||
| Net decrease in net assets resulting from distributions to shareholders | (721,967 | ) | (348,803 | ) | ||||
| FROM SHARES OF BENEFICIAL INTEREST | ||||||||
| Proceeds from shares sold: | ||||||||
| Class A | 1,187,818 | 1,947,498 | ||||||
| Class C | 158,687 | 127,444 | ||||||
| Class I | 5,717,642 | 9,548,550 | ||||||
| Class R | 2,112,604 | 2,688,517 | ||||||
| Net asset value of shares issued in reinvestment of distributions: | ||||||||
| Class A | 46,072 | 3,683 | ||||||
| Class I | 26,606 | 13,568 | ||||||
| Class R | 61,102 | — | ||||||
| Payments for shares redeemed: | ||||||||
| Class A | (4,193,097 | ) | (3,460,974 | ) | ||||
| Class C | (543,130 | ) | (664,012 | ) | ||||
| Class I | (20,127,000 | ) | (23,654,274 | ) | ||||
| Class R | (7,561,265 | ) | (6,069,001 | ) | ||||
| Net decrease in net assets resulting from shares of beneficial interest | (23,113,961 | ) | (19,519,001 | ) | ||||
| TOTAL DECREASE IN NET ASSETS | (26,983,527 | ) | (23,746,751 | ) | ||||
| NET ASSETS | ||||||||
| Beginning of Year | 129,542,290 | 153,289,041 | ||||||
| End of Year | $ | 102,558,763 | $ | 129,542,290 | ||||
| SHARE ACTIVITY | ||||||||
| Class A: | ||||||||
| Shares Sold | 109,155 | 183,665 | ||||||
| Shares Reinvested | 4,056 | 372 | ||||||
| Shares Redeemed | (397,360 | ) | (321,148 | ) | ||||
| Net decrease in shares of beneficial interest outstanding | (284,149 | ) | (137,111 | ) | ||||
| Class C: | ||||||||
| Shares Sold | 14,776 | 12,295 | ||||||
| Shares Redeemed | (53,053 | ) | (63,948 | ) | ||||
| Net decrease in shares of beneficial interest outstanding | (38,277 | ) | (51,653 | ) | ||||
| Class I: | ||||||||
| Shares Sold | 540,022 | 884,200 | ||||||
| Shares Reinvested | 2,376 | 1,389 | ||||||
| Shares Redeemed | (1,906,828 | ) | (2,226,744 | ) | ||||
| Net decrease in shares of beneficial interest outstanding | (1,364,430 | ) | (1,341,155 | ) | ||||
| Class R: | ||||||||
| Shares Sold | 206,300 | 251,456 | ||||||
| Shares Reinvested | 5,460 | — | ||||||
| Shares Redeemed | (727,664 | ) | (573,211 | ) | ||||
| Net decrease in shares of beneficial interest outstanding | (515,904 | ) | (321,755 | ) | ||||
The accompanying notes are an integral part of these financial statements.
14
| Hanlon Managed Income Fund |
| FINANCIAL HIGHLIGHTS |
| Per Share Data and Ratios for a Share of Beneficial Interest Outstanding Throughout Each Period |
| Class A | ||||||||||||||||||||
| Year Ended | Year Ended | Year Ended | Year Ended | Period Ended | ||||||||||||||||
| July 31, | July 31, | July 31, | July 31, | July 31, | ||||||||||||||||
| 2020 | 2019 | 2018 | 2017 | 2016 (1) | ||||||||||||||||
| Net asset value, beginning of period | $ | 9.19 | $ | 9.42 | $ | 9.81 | $ | 10.15 | $ | 10.00 | ||||||||||
| Activity from investment operations: | ||||||||||||||||||||
| Net investment income (2) | 0.15 | 0.31 | 0.32 | 0.35 | 0.22 | |||||||||||||||
| Net realized and unrealized gain (loss) on investments | (0.41 | ) | (0.22 | ) | (0.40 | ) | (0.21 | ) | 0.07 | |||||||||||
| Total from investment operations | (0.26 | ) | 0.09 | (0.08 | ) | 0.14 | 0.29 | |||||||||||||
| Less distributions from: | ||||||||||||||||||||
| Net investment income | (0.16 | ) | (0.31 | ) | (0.31 | ) | (0.36 | ) | (0.14 | ) | ||||||||||
| Net realized gains | — | — | — | (0.12 | ) | — | ||||||||||||||
| Return of capital | (0.02 | ) | (0.01 | ) | (0.00 | ) (3) | (0.00 | ) (3) | — | |||||||||||
| Total distributions | (0.18 | ) | (0.32 | ) | (0.31 | ) | (0.48 | ) | (0.14 | ) | ||||||||||
| Net asset value, end of period | $ | 8.75 | $ | 9.19 | $ | 9.42 | $ | 9.81 | $ | 10.15 | ||||||||||
| Total return (4) | (2.88 | )% | 1.12 | % | (0.79 | )% | 1.28 | % | 2.97 | % (5) | ||||||||||
| Net assets, at end of period (000’s) | $ | 7,169 | $ | 10,204 | $ | 13,072 | $ | 30,566 | $ | 56,249 | ||||||||||
| Ratio of expenses to average net assets (6) | 1.70 | % | 1.68 | % | 1.67 | % | 1.50 | % | 1.40 | % (7) | ||||||||||
| Ratio of net investment income to average net assets (6,8) | 1.70 | % | 3.35 | % | 3.30 | % | 3.47 | % | 2.54 | % (7) | ||||||||||
| Portfolio Turnover Rate | 721 | % | 484 | % | 157 | % | 933 | % | 599 | % (5) | ||||||||||
| (1) | The Hanlon Managed Income Fund commenced operations on September 9, 2015. |
| (2) | Per share amounts calculated using the average shares method, which appropriately presents the per share data for the period. |
| (3) | Represents less than $0.005 per share. |
| (4) | Total returns are historical in nature and exclude the effect of applicable sales charges and assumes reinvestment of dividends. |
| (5) | Not annualized. |
| (6) | The ratios of expenses and net investment income to average net assets do not reflect the Fund’s proportionate share of income and expenses of underlying investment companies in which the Fund invests. |
| (7) | Annualized. |
| (8) | Recognition of net investment income by the Fund is affected by the timing and declaration of dividends by the underlying investment companies in which the Fund invests. |
The accompanying notes are an integral part of these financial statements.
15
| Hanlon Managed Income Fund |
| FINANCIAL HIGHLIGHTS |
| Per Share Data and Ratios for a Share of Beneficial Interest Outstanding Throughout Each Period |
| Class C | ||||||||||||||||||||
| Year Ended | Year Ended | Year Ended | Year Ended | Period Ended | ||||||||||||||||
| July 31, | July 31, | July 31, | July 31, | July 31, | ||||||||||||||||
| 2020 | 2019 | 2018 | 2017 | 2016 (1) | ||||||||||||||||
| Net asset value, beginning of period | $ | 9.12 | $ | 9.36 | $ | 9.74 | $ | 10.09 | $ | 10.00 | ||||||||||
| Activity from investment operations: | ||||||||||||||||||||
| Net investment income (2) | 0.08 | 0.25 | 0.23 | 0.26 | 0.22 | |||||||||||||||
| Net realized and unrealized gain (loss) on investments | (0.39 | ) | (0.24 | ) | (0.37 | ) | (0.20 | ) | �� | 0.04 | ||||||||||
| Total from investment operations | (0.31 | ) | 0.01 | (0.14 | ) | 0.06 | 0.26 | |||||||||||||
| Less distributions from: | ||||||||||||||||||||
| Net investment income | (0.13 | ) | (0.24 | ) | (0.24 | ) | (0.29 | ) | (0.17 | ) | ||||||||||
| Net realized gains | — | — | — | (0.12 | ) | — | ||||||||||||||
| Return of capital | (0.02 | ) | (0.01 | ) | (0.00 | ) (3) | (0.00 | ) (3) | — | |||||||||||
| Total distributions | (0.15 | ) | (0.25 | ) | (0.24 | ) | (0.41 | ) | (0.17 | ) | ||||||||||
| Net asset value, end of period | $ | 8.66 | $ | 9.12 | $ | 9.36 | $ | 9.74 | $ | 10.09 | ||||||||||
| Total return (4) | (3.50 | )% | 0.23 | % | (1.40 | )% | 0.55 | % | 2.73 | % (5) | ||||||||||
| Net assets, at end of period (000’s) | $ | 1,216 | $ | 1,746 | $ | 3,107 | $ | 2,907 | $ | 2,315 | ||||||||||
| Ratio of expenses to average net assets (6) | 2.45 | % | 2.43 | % | 2.42 | % | 2.25 | % | 2.22 | % (7) | ||||||||||
| Ratio of net investment income to average net assets (6,8) | 0.88 | % | 2.79 | % | 2.38 | % | 2.58 | % | 2.52 | % (7) | ||||||||||
| Portfolio Turnover Rate | 721 | % | 484 | % | 157 | % | 933 | % | 599 | % (5) | ||||||||||
| (1) | The Hanlon Managed Income Fund commenced operations on September 9, 2015. |
| (2) | Per share amounts calculated using the average shares method, which appropriately presents the per share data for the period. |
| (3) | Represents less than $0.005 per share. |
| (4) | Total returns are historical in nature and exclude the effect of applicable sales charges and assumes reinvestment of dividends. |
| (5) | Not annualized. |
| (6) | The ratios of expenses and net investment income to average net assets do not reflect the Fund’s proportionate share of income and expenses of underlying investment companies in which the Fund invests. |
| (7) | Annualized. |
| (8) | Recognition of net investment income by the Fund is affected by the timing and declaration of dividends by the underlying investment companies in which the Fund invests. |
The accompanying notes are an integral part of these financial statements.
16
| Hanlon Managed Income Fund |
| FINANCIAL HIGHLIGHTS |
| Per Share Data and Ratios for a Share of Beneficial Interest Outstanding Throughout Each Period |
| Class I | ||||||||||||||||||||
| Year Ended | Year Ended | Year Ended | Year Ended | Period Ended | ||||||||||||||||
| July 31, | July 31, | July 31, | July 31, | July 31, | ||||||||||||||||
| 2020 | 2019 | 2018 | 2017 | 2016 (1) | ||||||||||||||||
| Net asset value, beginning of period | $ | 9.14 | $ | 9.38 | $ | 9.76 | $ | 10.10 | $ | 10.00 | ||||||||||
| Activity from investment operations: | ||||||||||||||||||||
| Net investment income (loss) (2) | 0.17 | 0.33 | 0.34 | 0.37 | (0.05 | ) (3) | ||||||||||||||
| Net realized and unrealized gain (loss) on investments | (0.40 | ) | (0.22 | ) | (0.38 | ) | (0.22 | ) | 0.35 | |||||||||||
| Total from investment operations | (0.23 | ) | 0.11 | (0.04 | ) | 0.15 | 0.30 | |||||||||||||
| Less distributions from: | ||||||||||||||||||||
| Net investment income | (0.17 | ) | (0.34 | ) | (0.34 | ) | (0.37 | ) | (0.20 | ) | ||||||||||
| Net realized gains | — | — | — | (0.12 | ) | — | ||||||||||||||
| Return of capital | (0.03 | ) | (0.01 | ) | (0.00 | ) (4) | (0.00 | ) (4) | — | |||||||||||
| Total distributions | (0.20 | ) | (0.35 | ) | (0.34 | ) | (0.49 | ) | (0.20 | ) | ||||||||||
| Net asset value, end of period | $ | 8.71 | $ | 9.14 | $ | 9.38 | $ | 9.76 | $ | 10.10 | ||||||||||
| Total return (5) | (2.62 | )% | 1.27 | % | (0.43 | )% | 1.61 | % | 3.05 | % (6) | ||||||||||
| Net assets, at end of period (000’s) | $ | 83,766 | $ | 111,722 | $ | 156,565 | $ | 340,624 | $ | 500,760 | ||||||||||
| Ratio of expenses to average net assets (7) | 1.45 | % | 1.43 | % | 1.42 | % | 1.25 | % | 1.36 | % (8) | ||||||||||
| Ratio of net investment income (loss) to average net assets (7,9) | 1.89 | % | 3.64 | % | 3.52 | % | 3.72 | % | (0.48 | )% (3,8) | ||||||||||
| Portfolio Turnover Rate | 721 | % | 484 | % | 157 | % | 933 | % | 599 | % (6) | ||||||||||
| (1) | The Hanlon Managed Income Fund commenced operations on September 9, 2015. |
| (2) | Per share amounts calculated using the average shares method, which appropriately presents the per share data for the period. |
| (3) | The amount of net investment loss on investment per share for the period ended July 31, 2016 does not accord with the amounts in the Statements of Operations due to the timing of purchases and sales of Fund shares in relation to fluctuating market values. |
| (4) | Represents less than $0.005 per share. |
| (5) | Total returns are historical in nature and exclude the effect of applicable sales charges and assumes reinvestment of dividends. |
| (6) | Not annualized. |
| (7) | The ratios of expenses and net investment income to average net assets do not reflect the Fund’s proportionate share of income and expenses of underlying investment companies in which the Fund invests. |
| (8) | Annualized. |
| (9) | Recognition of net investment income by the Fund is affected by the timing and declaration of dividends by the underlying investment companies in which the Fund invests. |
The accompanying notes are an integral part of these financial statements.
17
| Hanlon Managed Income Fund |
| FINANCIAL HIGHLIGHTS |
| Per Share Data and Ratios for a Share of Beneficial Interest Outstanding Throughout Each Period |
| Class R | ||||||||||||||||||||
| Year Ended | Year Ended | Year Ended | Year Ended | Period Ended | ||||||||||||||||
| July 31, | July 31, | July 31, | July 31, | July 31, | ||||||||||||||||
| 2020 | 2019 | 2018 | 2017 | 2016 (1) | ||||||||||||||||
| Net asset value, beginning of period | $ | 9.16 | $ | 9.40 | $ | 9.78 | $ | 10.12 | $ | 10.00 | ||||||||||
| Activity from investment operations: | ||||||||||||||||||||
| Net investment income (2) | 0.13 | 0.29 | 0.29 | 0.33 | 0.25 | |||||||||||||||
| Net realized and unrealized gain (loss) on investments | (0.40 | ) | (0.22 | ) | (0.37 | ) | (0.21 | ) | 0.06 | |||||||||||
| Total from investment operations | (0.27 | ) | 0.07 | (0.08 | ) | 0.12 | 0.31 | |||||||||||||
| Less distributions from: | ||||||||||||||||||||
| Net investment income | (0.15 | ) | (0.30 | ) | (0.30 | ) | (0.34 | ) | (0.19 | ) | ||||||||||
| Net realized gains | — | — | — | (0.12 | ) | — | ||||||||||||||
| Return of capital | (0.02 | ) | (0.01 | ) | (0.00 | ) (3) | (0.00 | ) (3) | — | |||||||||||
| Total distributions | (0.17 | ) | (0.31 | ) | (0.30 | ) | (0.46 | ) | (0.19 | ) | ||||||||||
| Net asset value, end of period | $ | 8.72 | $ | 9.16 | $ | 9.40 | $ | 9.78 | $ | 10.12 | ||||||||||
| Total return (4) | (2.97 | )% | 0.86 | % | (0.82 | )% | 1.13 | % | 3.20 | % (5) | ||||||||||
| Net assets, at end of period (000’s) | $ | 7,967 | $ | 10,171 | $ | 12,379 | $ | 17,829 | $ | 30,376 | ||||||||||
| Ratio of expenses to average net assets (6) | 1.85 | % | 1.83 | % | 1.82 | % | 1.65 | % | 1.67 | % (7) | ||||||||||
| Ratio of net investment income to average net assets (6,8) | 1.44 | % | 3.23 | % | 3.03 | % | 3.36 | % | 2.86 | % (7) | ||||||||||
| Portfolio Turnover Rate | 721 | % | 484 | % | 157 | % | 933 | % | 599 | % (5) | ||||||||||
| (1) | The Hanlon Managed Income Fund commenced operations on September 9, 2015. |
| (2) | Per share amounts calculated using the average shares method, which appropriately presents the per share data for the period. |
| (3) | Represents less than $0.005 per share. |
| (4) | Total returns are historical in nature and exclude the effect of applicable sales charges and assumes reinvestment of dividends. |
| (5) | Not annualized. |
| (6) | The ratios of expenses and net investment income to average net assets do not reflect the Fund’s proportionate share of income and expenses of underlying investment companies in which the Fund invests. |
| (7) | Annualized. |
| (8) | Recognition of net investment income by the Fund is affected by the timing and declaration of dividends by the underlying investment companies in which the Fund invests. |
The accompanying notes are an integral part of these financial statements.
18
| Hanlon Tactical Dividend and Momentum Fund |
| FINANCIAL HIGHLIGHTS |
| Per Share Data and Ratios for a Share of Beneficial Interest Outstanding Throughout Each Period |
| Class A | ||||||||||||||||||||
| Year Ended | Year Ended | Year Ended | Year Ended | Period Ended | ||||||||||||||||
| July 31, | July 31, | July 31, | July 31, | July 31, | ||||||||||||||||
| 2020 | 2019 | 2018 | 2017 | 2016 (1) | ||||||||||||||||
| Net asset value, beginning of period | $ | 10.87 | $ | 11.15 | $ | 9.87 | $ | 9.58 | $ | 10.00 | ||||||||||
| Activity from investment operations: | ||||||||||||||||||||
| Net investment income (loss) (2) | (0.01 | ) (3) | 0.02 | 0.01 | 0.05 | 0.06 | ||||||||||||||
| Net realized and unrealized gain (loss) on investments | (0.27 | ) | (0.30 | ) | 1.30 | 0.24 | (0.45 | ) | ||||||||||||
| Total from investment operations | (0.28 | ) | (0.28 | ) | 1.31 | 0.29 | (0.39 | ) | ||||||||||||
| Less distributions from: | ||||||||||||||||||||
| Net investment income | (0.04 | ) | (0.00 | ) (4) | (0.03 | ) | — | (0.03 | ) | |||||||||||
| Return of capital | (0.01 | ) | (0.00 | ) (4) | (0.00 | ) (4) | — | — | ||||||||||||
| Total distributions | (0.05 | ) | (0.00 | ) (4) | (0.03 | ) | — | (0.03 | ) | |||||||||||
| Net asset value, end of period | $ | 10.54 | $ | 10.87 | $ | 11.15 | $ | 9.87 | $ | 9.58 | ||||||||||
| Total return (5) | (2.63 | )% | (2.48 | )% | 13.28 | % | 3.03 | % | (3.92 | )% (6) | ||||||||||
| Net assets, at end of period (000’s) | $ | 8,669 | $ | 12,038 | $ | 13,867 | $ | 20,812 | $ | 53,517 | ||||||||||
| Ratio of expenses to average net assets (7) | 1.66 | % | 1.64 | % | 1.62 | % | 1.53 | % | 1.40 | % (8) | ||||||||||
| Ratio of net investment income (loss) to average net assets (7,9) | (0.11 | )% (3) | 0.14 | % | 0.13 | % | 0.57 | % | 0.75 | % (8) | ||||||||||
| Portfolio Turnover Rate | 293 | % | 226 | % | 48 | % | 384 | % | 579 | % (6) | ||||||||||
| (1) | The Hanlon Tactical Dividend & Momentum Fund commenced operations on September 9, 2015. |
| (2) | Per share amounts calculated using the average shares method, which appropriately presents the per share data for the period. |
| (3) | The amount of net investment loss on investment per share for the period ended does not accord with the amounts in the Statements of Operations due to the timing of purchases and sales of Fund shares in relation to fluctuating market values. |
| (4) | Represents less than $0.005 per share. |
| (5) | Total returns are historical in nature and exclude the effect of applicable sales charges and assumes reinvestment of dividends. |
| (6) | Not annualized. |
| (7) | The ratios of expenses and net investment income to average net assets do not reflect the Fund’s proportionate share of income and expenses of underlying investment companies in which the Fund invests. |
| (8) | Annualized. |
| (9) | Recognition of net investment income by the Fund is affected by the timing and declaration of dividends by the underlying investment companies in which the Fund invests. |
The accompanying notes are an integral part of these financial statements.
19
| Hanlon Tactical Dividend and Momentum Fund |
| FINANCIAL HIGHLIGHTS |
| Per Share Data and Ratios for a Share of Beneficial Interest Outstanding Throughout Each Period |
| Class C | ||||||||||||||||||||
| Year Ended | Year Ended | Year Ended | Year Ended | Period Ended | ||||||||||||||||
| July 31, | July 31, | July 31, | July 31, | July 31, | ||||||||||||||||
| 2020 | 2019 | 2018 | 2017 | 2016 (1) | ||||||||||||||||
| Net asset value, beginning of period | $ | 10.53 | $ | 10.87 | $ | 9.68 | $ | 9.53 | $ | 10.00 | ||||||||||
| Activity from investment operations: | ||||||||||||||||||||
| Net investment loss (2,3) | (0.09 | ) | (0.07 | ) | (0.06 | ) | (0.03 | ) | (0.00 | ) (4) | ||||||||||
| Net realized and unrealized gain (loss) on investments | (0.27 | ) | (0.27 | ) | 1.25 | 0.24 | (0.44 | ) | ||||||||||||
| Total from investment operations | (0.36 | ) | (0.34 | ) | 1.19 | 0.21 | (0.44 | ) | ||||||||||||
| Less distributions from: | ||||||||||||||||||||
| Net investment income | — | — | — | (0.06 | ) | (0.03 | ) | |||||||||||||
| Total distributions | — | — | — | (0.06 | ) | (0.03 | ) | |||||||||||||
| Net asset value, end of period | $ | 10.17 | $ | 10.53 | $ | 10.87 | $ | 9.68 | $ | 9.53 | ||||||||||
| Total return (5) | (3.42 | )% | (3.13 | )% | 12.29 | % | 2.28 | % | (4.38 | )% (6) | ||||||||||
| Net assets, at end of period (000’s) | $ | 1,087 | $ | 1,529 | $ | 2,140 | $ | 2,997 | $ | 2,778 | ||||||||||
| Ratio of expenses to average net assets (7) | 2.41 | % | 2.39 | % | 2.37 | % | 2.28 | % | 2.23 | % (8) | ||||||||||
| Ratio of net investment loss to average net assets (7,9) | (0.88 | )% (3) | (0.64 | )% | (0.61 | )% | (0.31 | )% | (0.08 | )% (3,8) | ||||||||||
| Portfolio Turnover Rate | 293 | % | 226 | % | 48 | % | 384 | % | 579 | % (6) | ||||||||||
| (1) | The Hanlon Tactical Dividend & Momentum Fund commenced operations on September 9, 2015. |
| (2) | Per share amounts calculated using the average shares method, which appropriately presents the per share data for the period. |
| (3) | The amount of net investment loss on investment per share for the period ended does not accord with the amounts in the Statements of Operations due to the timing of purchases and sales of Fund shares in relation to fluctuating market values. |
| (4) | Represents less than $0.005 per share. |
| (5) | Total returns are historical in nature and exclude the effect of applicable sales charges and assumes reinvestment of dividends. |
| (6) | Not annualized. |
| (7) | The ratios of expenses and net investment income to average net assets do not reflect the Fund’s proportionate share of income and expenses of underlying investment companies in which the Fund invests. |
| (8) | Annualized. |
| (9) | Recognition of net investment income by the Fund is affected by the timing and declaration of dividends by the underlying investment companies in which the Fund invests. |
The accompanying notes are an integral part of these financial statements.
20
| Hanlon Tactical Dividend and Momentum Fund |
| FINANCIAL HIGHLIGHTS |
| Per Share Data and Ratios for a Share of Beneficial Interest Outstanding Throughout Each Period |
| Class I | ||||||||||||||||||||
| Year Ended | Year Ended | Year Ended | Year Ended | Period Ended | ||||||||||||||||
| July 31, | July 31, | July 31, | July 31, | July 31, | ||||||||||||||||
| 2020 | 2019 | 2018 | 2017 | 2016 (1) | ||||||||||||||||
| Net asset value, beginning of period | $ | 10.74 | $ | 11.02 | $ | 9.77 | $ | 9.58 | $ | 10.00 | ||||||||||
| Activity from investment operations: | ||||||||||||||||||||
| Net investment income (loss) (2) | 0.01 | 0.04 | 0.04 | 0.07 | (0.02 | ) (3) | ||||||||||||||
| Net realized and unrealized gain (loss) on investments | (0.27 | ) | (0.28 | ) | 1.28 | 0.24 | (0.37 | ) | ||||||||||||
| Total from investment operations | (0.26 | ) | (0.24 | ) | 1.32 | 0.31 | (0.39 | ) | ||||||||||||
| Less distributions from: | ||||||||||||||||||||
| Net investment income | (0.07 | ) | (0.04 | ) | (0.07 | ) | (0.12 | ) | (0.03 | ) | ||||||||||
| Return of capital | (0.01 | ) | (0.00 | ) (4) | (0.00 | ) (4) | — | — | ||||||||||||
| Total distributions | (0.08 | ) | (0.04 | ) | (0.07 | ) | (0.12 | ) | (0.03 | ) | ||||||||||
| Net asset value, end of period | $ | 10.40 | $ | 10.74 | $ | 11.02 | $ | 9.77 | $ | 9.58 | ||||||||||
| Total return (5) | (2.50 | )% | (2.18 | )% | 13.53 | % | 3.28 | % | (3.88 | )% (6) | ||||||||||
| Net assets, at end of period (000’s) | $ | 75,871 | $ | 92,978 | $ | 110,151 | $ | 137,869 | $ | 289,029 | ||||||||||
| Ratio of expenses to average net assets (7) | 1.41 | % | 1.39 | % | 1.37 | % | 1.28 | % | 1.44 | % (8) | ||||||||||
| Ratio of net investment income (loss) to average net assets (7,9) | 0.13 | % | 0.38 | % | 0.39 | % | 0.81 | % | (0.17 | )% (3,8) | ||||||||||
| Portfolio Turnover Rate | 293 | % | 226 | % | 48 | % | 384 | % | 579 | % (6) | ||||||||||
| (1) | The Hanlon Tactical Dividend & Momentum Fund commenced operations on September 9, 2015. |
| (2) | Per share amounts calculated using the average shares method, which appropriately presents the per share data for the period. |
| (3) | The amount of net investment loss on investment per share for the period ended July 31, 2016 does not accord with the amounts in the Statements of Operations due to the timing of purchases and sales of Fund shares in relation to fluctuating market values. |
| (4) | Represents less than $0.005 per share. |
| (5) | Total returns are historical in nature and exclude the effect of applicable sales charges and assumes reinvestment of dividends. |
| (6) | Not annualized. |
| (7) | The ratios of expenses and net investment income to average net assets do not reflect the Fund’s proportionate share of income and expenses of underlying investment companies in which the Fund invests. |
| (8) | Annualized. |
| (9) | Recognition of net investment income by the Fund is affected by the timing and declaration of dividends by the underlying investment companies in which the Fund invests. |
The accompanying notes are an integral part of these financial statements.
21
| Hanlon Tactical Dividend and Momentum Fund |
| FINANCIAL HIGHLIGHTS |
| Per Share Data and Ratios for a Share of Beneficial Interest Outstanding Throughout Each Period |
| Class R | ||||||||||||||||||||
| Year Ended | Year Ended | Year Ended | Year Ended | Period Ended | ||||||||||||||||
| July 31, | July 31, | July 31, | July 31, | July 31, | ||||||||||||||||
| 2020 | 2019 | 2018 | 2017 | 2016 (1) | ||||||||||||||||
| Net asset value, beginning of period | $ | 10.70 | $ | 10.98 | $ | 9.73 | $ | 9.53 | $ | 10.00 | ||||||||||
| Activity from investment operations: | ||||||||||||||||||||
| Net investment income (loss) (2) | (0.03 | ) (3) | (0.00 | ) (4) | (0.00 | ) (4) | 0.04 | 0.05 | ||||||||||||
| Net realized and unrealized gain (loss) on investments | (0.27 | ) | (0.28 | ) | 1.27 | 0.23 | (0.49 | ) | ||||||||||||
| Total from investment operations | (0.30 | ) | (0.28 | ) | 1.27 | 0.27 | (0.44 | ) | ||||||||||||
| Less distributions from: | ||||||||||||||||||||
| Net investment income | (0.02 | ) | — | (0.02 | ) | (0.07 | ) | (0.03 | ) | |||||||||||
| Return of capital | (0.01 | ) | — | (0.00 | ) (4) | — | — | |||||||||||||
| Total distributions | (0.03 | ) | — | (0.02 | ) | (0.07 | ) | (0.03 | ) | |||||||||||
| Net asset value, end of period | $ | 10.37 | $ | 10.70 | $ | 10.98 | $ | 9.73 | $ | 9.53 | ||||||||||
| Total return (5) | (2.81 | )% | (2.55 | )% | 13.03 | % | 2.85 | % | (4.38 | )% (6) | ||||||||||
| Net assets, at end of period (000’s) | $ | 16,931 | $ | 22,998 | $ | 27,131 | $ | 33,952 | $ | 85,499 | ||||||||||
| Ratio of expenses to average net assets (7) | 1.81 | % | 1.79 | % | 1.77 | % | 1.68 | % | 1.66 | % (8) | ||||||||||
| Ratio of net investment income (loss) to average net assets (7,9) | (0.26 | )% (3) | (0.01 | )% | (0.03 | )% | 0.45 | % | 0.56 | % (8) | ||||||||||
| Portfolio Turnover Rate | 293 | % | 226 | % | 48 | % | 384 | % | 579 | % (6) | ||||||||||
| (1) | The Hanlon Tactical Dividend & Momentum Fund commenced operations on September 9, 2015. |
| (2) | Per share amounts calculated using the average shares method, which appropriately presents the per share data for the period. |
| (3) | The amount of net investment loss on investment per share for the period ended does not accord with the amounts in the Statements of Operations due to the timing of purchases and sales of Fund shares in relation to fluctuating market values. |
| (4) | Represents less than $0.005 per share. |
| (5) | Total returns are historical in nature and exclude the effect of applicable sales charges and assumes reinvestment of dividends. |
| (6) | Not annualized. |
| (7) | The ratios of expenses and net investment income to average net assets do not reflect the Fund’s proportionate share of income and expenses of underlying investment companies in which the Fund invests. |
| (8) | Annualized. |
| (9) | Recognition of net investment income by the Fund is affected by the timing and declaration of dividends by the underlying investment companies in which the Fund invests. |
The accompanying notes are an integral part of these financial statements.
22
| Hanlon Funds |
| NOTES TO FINANCIAL STATEMENTS |
| July 31, 2020 |
| 1. | ORGANIZATION |
The Hanlon Managed Income Fund and the Hanlon Tactical Dividend and Momentum Fund (each a “Fund” and together the “Funds”), are each a series of shares of beneficial interest of the Two Roads Shared Trust (the “Trust”), a statutory trust organized under the laws of the State of Delaware on June 8, 2012, and registered under the Investment Company Act of 1940, as amended (the “1940 Act”), as an open-end management investment company. The Funds commenced operations on September 9, 2015. The investment objective of the Hanlon Managed Income Fund is to provide current income, capital preservation and positive risk-adjusted returns. As of September 9, 2018, the Fund is a diversified fund and must comply with the diversification requirements of Section 5(b)(1) of the 1940 Act. Prior to September 9, 2018, the Fund was non-diversified. The investment objective of the Hanlon Tactical Dividend and Momentum Fund is to provide capital appreciation and current income, and the Fund is diversified.
The Funds each offer Class A, Class C, Class I and Class R shares. Class A shares of each Fund are offered at net asset value plus a maximum sales charge of 5.75%. Class C, Class I and Class R shares of each Fund are offered at net asset value. Investments of more than $1 million in Class A shares of each Fund are subject to a contingent deferred sales charge of 1.00% of the original purchase price on redemptions made within one year of purchase. Class C shares of each Fund are subject to a contingent deferred sales charge of 1.00% of the original purchase price on redemptions made within one year of purchase. Each share class represents an interest in the same assets of the Fund and classes are identical except for differences in their fees and ongoing service and distribution charges. All classes of shares have equal voting privileges except that each class has exclusive voting rights with respect to its service and/or distribution plans. Each Fund’s income, expenses (other than class specific distribution fees) and realized and unrealized gains and losses are allocated proportionately each day based upon the relative net assets of each class.
| 2. | SUMMARY OF SIGNIFICANT ACCOUNTING POLICIES |
The following is a summary of significant accounting policies followed by the Funds in preparation of their financial statements. These policies are in conformity with accounting principles generally accepted in the United States of America (“GAAP”). The preparation of financial statements requires management to make estimates and assumptions that affect the reported amounts of assets and liabilities and disclosure of contingent assets and liabilities at the date of the financial statements and the reported amounts of income and expenses for the period. Actual results could differ from those estimates. Each Fund is an investment company and accordingly follows the investment company accounting and reporting guidance of the Financial Accounting Standards Board (“FASB”) Accounting Standard Codification Topic 946 “Financial Services – Investment Companies”.
Security Valuation – Securities listed on an exchange are valued at the last reported sale price at the close of the regular trading session of the primary exchange on the business day the value is being determined, or in the case of securities listed on NASDAQ at the NASDAQ Official Closing Price (“NOCP”). In the absence of a sale such securities shall be valued at the mean between the last bid and ask prices on the day of valuation. Debt securities, including U.S. government obligation (other than short-term obligations) are valued each day by an independent pricing service approved by the Trust’s Board of Trustees (the “Board”) based on methods which include consideration of: yields or prices of securities of comparable quality, coupon, maturity and type, indications as to values from dealers, and general market conditions or market quotations from a major market maker in the securities. The independent pricing service does not distinguish between smaller-sized bond positions known as “odd lots” and larger institutional -sized bond positions known as “round lots”. The Fund may fair value a particular bond if the adviser does not believe that the round lot value provided by the independent pricing service reflects fair value of the Fund’s holding. Investments valued in currencies other than the U.S. dollar are converted to U.S. dollars using exchange rates obtained from pricing services. Short-term debt obligations having 60 days or less remaining until maturity, at time of purchase, may be valued at amortized cost. Investments in open-end investment companies are valued at net asset value.
The Funds may hold securities, such as private investments, interests in commodity pools, other non-traded securities or temporarily illiquid securities, for which market quotations are not readily available or are determined to be unreliable. These securities will be valued using the “fair value” procedures approved by the Board. The Board has delegated execution of these procedures to a fair value committee composed of one or more representatives from each of the (i) Trust, (ii) administrator, and (iii) advisor. The committee may also enlist third party consultants such as a valuation specialist at a public accounting firm, valuation consultant or financial officer of a security issuer on an as-needed basis to assist in determining a security-specific fair value. The Board has also engaged a third party valuation firm to, as needed, attend valuation meetings held by the Trust, review minutes of such meetings and report to the Board on a quarterly basis. The Board reviews and ratifies the execution of this process and the resultant fair value prices at least quarterly to assure the process produces reliable results.
23
| Hanlon Funds |
| NOTES TO FINANCIAL STATEMENTS (Continued) |
| July 31, 2020 |
Valuation of Underlying Funds – The Funds may invest in portfolios of open-end or closed-end investment companies (the “Underlying Funds”). The Underlying Funds value securities in their portfolios for which market quotations are readily available at their market values (generally the last reported sale price) and all other securities and assets at their fair value to the methods established by the board of directors of the Underlying Funds.
Open-ended funds are valued at their respective net asset values as reported by such investment companies. The shares of many closed-end investment companies, after their initial public offering, frequently trade at a price per share, which is different than the net asset value per share. The difference represents a market premium or market discount of such shares. There can be no assurances that the market discount or market premium on shares of any closed-end investment company purchased by a Fund will not change.
Exchange Traded Funds – The Funds may invest in exchange traded funds (“ETFs”). ETFs are a type of index fund bought and sold on a securities exchange. An ETF trades like common stock and represents a fixed portfolio of securities designed to track the performance and dividend yield of a particular domestic or foreign market index. The Funds may purchase an ETF to gain exposure to a portion of the U.S. or a foreign market. The risks of owning an ETF generally reflect the risks of owning the underlying securities they are designed to track, although the lack of liquidity on an ETF could result in it being more volatile. Additionally, ETFs have fees and expenses that reduce their value.
Fair Valuation Process – The applicable investments are valued collectively via inputs from each group within the fair value committee. For example, fair value determinations are required for the following securities: (i) securities for which market quotations are insufficient or not readily available on a particular business day (including securities for which there is a short and temporary lapse in the provision of a price by the regular pricing source); (ii) securities for which, in the judgment of the advisor, the prices or values available do not represent the fair value of the instrument; factors which may cause the advisor to make such a judgment include, but are not limited to, the following: only a bid price or an asked price is available; the spread between bid and asked prices is substantial; the frequency of sales; the thinness of the market; the size of reported trades; and actions of the securities markets, such as the suspension or limitation of trading; (iii) securities determined to be illiquid; and (iv) securities with respect to which an event that will affect the value thereof has occurred (a “significant event”) since the closing prices were established on the principal exchange on which they are traded, but prior to a Fund’s calculation of its net asset value. Specifically, interests in commodity pools or managed futures pools are valued on a daily basis by reference to the closing market prices of each futures contract or other asset held by a pool, as adjusted for pool expenses. Restricted or illiquid securities, such as private investments or non-traded securities are valued via inputs from the advisor based upon the current bid for the security from two or more independent dealers or other parties reasonably familiar with the facts and circumstances of the security (who should take into consideration all relevant factors as may be appropriate under the circumstances). If the advisor is unable to obtain a current bid from such independent dealers or other independent parties, the fair value committee shall determine the fair value of such security using the following factors: (i) the type of security; (ii) the cost at date of purchase; (iii) the size and nature of the Fund’s holdings; (iv) the discount from market value of unrestricted securities of the same class at the time of purchase and subsequent thereto; (v) information as to any transactions or offers with respect to the security; (vi) the nature and duration of restrictions on disposition of the security and the existence of any registration rights; (vii) how the yield of the security compares to similar securities of companies of similar or equal creditworthiness; (viii) the level of recent trades of similar or comparable securities; (ix) the liquidity characteristics of the security; (x) current market conditions; and (xi) the market value of any securities into which the security is convertible or exchangeable.
The Funds utilize various methods to measure the fair value of all of each Fund’s investments on a recurring basis. GAAP establishes a hierarchy that prioritizes inputs to valuation methods. The three levels of input are:
Level 1 – Unadjusted quoted prices in active markets for identical assets and liabilities that the Funds have the ability to access.
Level 2 – Observable inputs other than quoted prices included in Level 1 that are observable for the asset or liability, either directly or indirectly. These inputs may include quoted prices for the identical instrument on an inactive market, prices for similar instruments, interest rates, prepayment speeds, credit risk, yield curves, default rates and similar data.
Level 3 – Unobservable inputs for the asset or liability, to the extent relevant observable inputs are not available, representing the Funds’ own assumptions about the assumptions a market participant would use in valuing the asset or liability, and would be based on the best information available.
The availability of observable inputs can vary from security to security and is affected by a wide variety of factors, including, for example, the type of security, whether the security is new and not yet established in the marketplace, the liquidity of markets, and other characteristics particular to the security. To the extent that valuation is based on models or inputs that are less observable or unobservable in the market, the determination of fair value requires more judgment. Accordingly, the degree of judgment exercised in determining fair value is greatest for instruments categorized in Level 3.
24
| Hanlon Funds |
| NOTES TO FINANCIAL STATEMENTS (Continued) |
| July 31, 2020 |
The inputs used to measure fair value may fall into different levels of the fair value hierarchy. In such cases, for disclosure purposes, the level in the fair value hierarchy within which the fair value measurement falls in its entirety, is determined based on the lowest level input that is significant to the fair value measurement in its entirety.
The inputs or methodology used for valuing securities are not necessarily an indication of the risk associated with investing in those securities. The following tables summarize the inputs used as of July 31, 2020 for the Funds’ assets and liabilities measured at fair value:
Hanlon Managed Income Fund
| Assets * | Level 1 | Level 2 | Level 3 | Total | ||||||||||||
| Exchange Traded Funds | $ | 97,747,293 | $ | — | $ | — | $ | 97,747,293 | ||||||||
| Short-Term Investments | 14,548,298 | — | — | 14,548,298 | ||||||||||||
| Total | $ | 112,295,591 | $ | — | $ | — | $ | 112,295,591 | ||||||||
Hanlon Tactical Dividend and Momentum Fund
| Assets * | Level 1 | Level 2 | Level 3 | Total | ||||||||||||
| Exchange Traded Funds | $ | 75,063,373 | $ | — | $ | — | $ | 75,063,373 | ||||||||
| Short-Term Investments | 27,708,182 | — | — | 27,708,182 | ||||||||||||
| Total | $ | 102,771,555 | $ | — | $ | — | $ | 102,771,555 | ||||||||
The Funds did not hold any Level 3 securities during the period.
| * | Refer to the Portfolio of Investments for industry classification. |
Security Transactions and Related Income – Security transactions are accounted for on trade date basis. Interest income is recognized on an accrual basis. Discounts are accreted and premiums are amortized on securities purchased over the lives of the respective securities. Dividend income is recorded on the ex-dividend date. Realized gains or losses from sales of securities are determined by comparing the identified cost of the security lot sold with the net sales proceeds.
Dividends and Distributions to Shareholders – Dividends from net investment income are declared and distributed monthly for the Hanlon Managed Income Fund and annually for the Hanlon Tactical Dividend and Momentum Fund. Distributable net realized capital gains are declared and distributed annually. Dividends from net investment income and distributions from net realized gains are recorded on ex dividend date and determined in accordance with federal income tax regulations, which may differ from GAAP. These “book/tax” differences are considered either temporary (i.e., deferred losses, capital loss carry forwards) or permanent in nature. To the extent these differences are permanent in nature, such amounts are reclassified within the composition of net assets based on their federal tax-basis treatment; temporary differences do not require reclassification.
Federal Income Taxes – It is the Funds’ policy to qualify as a regulated investment company by complying with the provisions of the Internal Revenue Code that are applicable to regulated investment companies and to distribute substantially all of its taxable income and net realized gains to shareholders. Therefore, no federal income tax provision is required.
The Funds recognize the tax benefits of uncertain tax positions only where the position is “more likely than not” to be sustained assuming examination by tax authorities. Management has analyzed the Funds’ tax positions and has concluded that no liability for unrecognized tax benefits should be recorded related to uncertain tax positions taken on returns filed for the open tax years ended 2017-2019, or expected to be taken in the Funds’ July 31, 2020 tax return. Each Fund identifies its major tax jurisdictions as U.S. Federal and Ohio, and foreign jurisdictions where a Fund makes significant investments. The Funds are not aware of any tax positions for which it is reasonably possible that the total amounts of unrecognized tax benefits will change materially in the next twelve months.
Expenses – Expenses of the Trust that are directly identifiable to a specific fund are charged to that fund. Expenses, which are not readily identifiable to a specific fund, are allocated in such a manner as deemed equitable, taking into consideration the nature and type of expense and the relative sizes of the funds in the Trust.
Indemnification – The Trust indemnifies its officers and trustees for certain liabilities that may arise from the performance of their duties to the Trust. Additionally, in the normal course of business, the Funds enter into contracts that contain a variety of representations and warranties and which provide general indemnities. The Funds’ maximum exposure under these arrangements is
25
| Hanlon Funds |
| NOTES TO FINANCIAL STATEMENTS (Continued) |
| July 31, 2020 |
unknown, as this would involve future claims that may be made against a Fund that have not yet occurred. However, the Funds expect the risk of loss due to these warranties and indemnities to be remote.
| 3. | PRINCIPAL INVESTMENT RISKS |
The Fund’s investments expose the funds to various risks, certain of which are discussed below. Each Fund’s prospectus and statement of additional information (“SAI”) include a full listing of risks associated with each Fund’s investments. These risks include but are not limited to cash positions risk, cybersecurity risk, emerging markets risk, equity risk, fixed income securities risk, focus risk, foreign (non-U.S.) investment risk, hedging transactions risk, high-yield risk, investment companies and ETFs risk, issuer-specific risk, leveraging risk, LIBOR risk, large capitalization risk, management risk, market events risk, market risk, portfolio turnover risk, real estate securities risk, REIT risk, rules-based strategy risk, sector risk, securities lending risk, short sales risk, technology securities risk and volatility risk.
Equity Risk – Equity securities are susceptible to general market fluctuations and volatile increases and decreases in value as market confidence in and perceptions of their issuers change. Factors that may influence the price of equity securities include developments affecting a specific company or industry, or the changing economic, political or market conditions.
| ● | Dividend-Yielding Companies Risk (Hanlon Tactical Dividend and Momentum Fund). A company that has historically paid regular dividends to shareholders may decrease or eliminate dividend payments in the future, which could result in a decrease in the value of the company’s stock and lower performance of the Fund. |
| ● | Momentum Investing Risk (Hanlon Tactical Dividend and Momentum Fund). An investment in securities with positive momentum entails investing in securities that have had above-average recent returns. These securities may experience greater price volatility than other equity securities, which may negatively impact the investment performance of the Fund. |
Fixed Income Securities Risk – The Hanlon Managed Income Fund is subject to fixed income securities risk. Fixed income securities are subject to interest rate risk, call risk, prepayment and extension risk, credit risk, duration, and liquidity risk. In addition, current market conditions may pose heightened risks for fixed income securities. When the Fund invests directly or indirectly in fixed income securities, the value of an investment in the Fund will fluctuate with changes in interest rates. Typically, a rise in interest rates causes a decline in the value of fixed income securities. In general, the market price of fixed income securities with longer maturities will increase or decrease more in response to changes in interest rates than shorter-term securities. Other risk factors include credit risk (the debtor may default) and prepayment risk (the debtor may pay its obligation early, reducing the amount of interest payments). These risks could affect the value of a particular investment by the Fund, possibly causing the Fund’s share price and total return to be reduced and fluctuate more than other types of investments. Moreover, new regulations applicable to and changing business practices of financial intermediaries that make markets in fixed income securities have resulted in less market making activity for certain fixed income securities, which has reduced the liquidity and may increase the volatility for such fixed income securities. The fixed-income securities market can be susceptible to increases in volatility and decreases in liquidity. Liquidity may decline unpredictably in response to overall economic conditions or credit tightening. For example, a general rise in interest rates may cause investors to move out of fixed income securities on a large scale, which could adversely affect the price and liquidity of fixed income securities. Duration risk arises when holding long duration and long maturity investments, which will magnify certain risks, including interest rate risk and credit risk. Longer-term securities may be more sensitive to interest rate changes. Given the recent, historically low interest rates and the potential for increases in those rates, a heightened risk is posed by rising interest rates to longer-term fixed income securities. Effective duration estimates price changes for relatively small changes in rates. If rates rise significantly, effective duration may tend to understate the drop in a security’s price. If rates drop significantly, effective duration may tend to overstate the rise in a security’s price.
Cash Positions Risk – A Fund may hold a significant position in cash, cash equivalent securities or U.S. treasury investments. When a Fund’s investment in cash, cash equivalent securities or U.S. treasury investments increases, the Fund may not participate in market advances or declines to the same extent that it would if the Fund were more fully invested.
High-Yield Risk – The Hanlon Managed Income Fund is subject to high yield risk. Investment in or exposure to high yield (lower rated or below investment grade) debt instruments (also known as “junk bonds”) may involve greater levels of interest rate, credit, liquidity and valuation risk than or below investment grade for higher rated instruments. High yield debt instruments are considered predominantly speculative with respect to the issuer’s continuing ability to make principal and interest payments and, therefore, such instruments generally involve greater risk of default or price changes than higher rated debt instruments. An economic downturn or
26
| Hanlon Funds |
| NOTES TO FINANCIAL STATEMENTS (Continued) |
| July 31, 2020 |
period of rising interest rates could adversely affect the value of these securities and market for these securities and reduce market liquidity (liquidity risk).
Investment Companies and ETFs Risk – When a Fund invests in other investment companies, including ETFs, it will bear additional expense based upon its pro rata share of the other investment company’s or ETF’s operating expense, including the potential duplication of management fees. The risk of owning an investment company or ETF generally reflects the risks of owning the underlying investments the investment company or ETF holds. A Fund also will incur brokerage costs when it purchases and sells ETFs.
| ● | Inverse, Leveraged and Inverse-Leveraged ETFs Risk (Hanlon Managed Income Fund). Inverse ETFs generally use derivatives that are designed to produce returns that move in the opposite direction of the indexes they track, meaning that that when the value of the index rises, the inverse ETF suffers a loss. Leveraged ETFs attempt to provide a multiple of the performance of an index. An ETF that utilizes leverage may be more volatile than an ETF that does not because leverage tends to exaggerate any effect on the value of the portfolio securities. Inverse-leveraged ETFs seek returns that correspond to a multiple of the inverse of the performance of an index. Because inverse, leveraged or inverse-leveraged ETFs typically seek to obtain their objective on a daily basis, holding such ETFs for longer than a day will produce the result of the ETF’s return for each day compounded over the period, which usually will differ from the actual multiple (or inverse) of the return of the ETF’s index for the period, particularly when the index experiences large ups and downs. During periods of market volatility, inverse ETFs may not perform as expected. |
Securities Lending Risk – A Fund may lend portfolio securities to institutions, such as banks and certain broker-dealers. A Fund may experience a loss or delay in the recovery of its securities if the borrowing institution breaches its agreement with the Fund. In certain market conditions, the portfolio of a Fund’s securities on loan may be significant and may magnify the risk of such a loss or delay. The risks associated with lending portfolio securities, as with other extensions of secured credit, include, but are not limited to, possible delays in receiving additional collateral or in the recovery of the securities loaned, possible loss of rights in the collateral should the borrower fail financially, as well as risk of loss in the value of the collateral or the value of the investments made with the collateral.
Volatility Risk – A Fund or an underlying fund may have investments that appreciate or decrease significantly in value over short periods of time. This may cause a Fund’s or an underlying fund’s net asset value per share to experience significant increases or declines in value over short periods of time.
Market Risk – Overall market risk may affect the value of individual instruments in which the Funds invest. The Funds are subject to the risk that the securities markets will move down, sometimes rapidly and unpredictably, based on overall economic conditions and other factors, which may negatively affect the Funds’ performance. Factors such as domestic and foreign (non-U.S.) economic growth and market conditions, real or perceived adverse economic or political conditions, inflation, changes in interest rate levels, lack of liquidity in the markets, volatility in the securities markets, adverse investor sentiment affect the securities markets and political events affect the securities markets. Securities markets also may experience long periods of decline in value. When the value of the Funds’ investments goes down, your investment in the Fund decreases in value and you could lose money.
Local, state, regional, national or global events such as war, acts of terrorism, the spread of infectious illness or other public health issues, recessions, or other events could have a significant impact on the Fund and its investments and could result in decreases to the Fund’s net asset value. Political, geopolitical, natural and other events, including war, terrorism, trade disputes, government shutdowns, market closures, natural and environmental disasters, epidemics, pandemics and other public health crises and related events and governments’ reactions to such events have led, and in the future may lead, to economic uncertainty, decreased economic activity, increased market volatility and other disruptive effects on U.S. and global economies and markets. Such events may have significant adverse direct or indirect effects on the Fund and its investments. For example, a widespread health crisis such as a global pandemic could cause substantial market volatility, exchange trading suspensions and closures, impact the ability to complete redemptions, and affect Fund performance. A health crisis may exacerbate other pre-existing political, social and economic risks. In addition, the increasing interconnectedness of markets around the world may result in many markets being affected by events or conditions in a single country or region or events affecting a single or small number of issuers.
An outbreak of infectious respiratory illness caused by a novel coronavirus known as COVID-19 was first detected in China in December 2019 and has now been detected globally. On March 11, 2020, the World Health Organization announced that it had made the assessment that COVID-19 can be characterized as a pandemic. COVID-19 has resulted in travel restrictions, closed international
27
| Hanlon Funds |
| NOTES TO FINANCIAL STATEMENTS (Continued) |
| July 31, 2020 |
borders, enhanced health screenings at ports of entry and elsewhere, disruption of and delays in healthcare service preparation and delivery, prolonged quarantines, cancellations, business and school closings, supply chain disruptions, and lower consumer demand, as well as general concern and uncertainty. The impact of COVID-19, and other infectious illness outbreaks that may arise in the future, could adversely affect the economies of many nations or the entire global economy, individual issuers and capital markets in ways that cannot necessarily be foreseen. In addition, the impact of infectious illnesses in emerging market countries may be greater due to generally less established healthcare systems. Public health crises caused by the COVID-19 outbreak may exacerbate other pre-existing political, social and economic risks in certain countries or globally. The duration of the COVID-19 outbreak and its effects cannot be determined with certainty. The value of the Fund and the securities in which the Funds invest may be adversely affected by impacts caused by COVID-19 and other epidemics and pandemics that may arise in the future.
| 4. | INVESTMENT TRANSACTIONS |
The cost of purchases and proceeds from the sale of securities, other than short-term investments, for the year ended July 31, 2020 amounted to $527,439,106 and $546,238,179, respectively, for the Hanlon Managed Income Fund and $219,854,537 and $265,983,166, respectively, for the Hanlon Tactical Dividend and Momentum Fund.
| 5. | INVESTMENT ADVISORY AGREEMENT AND TRANSACTIONS WITH RELATED PARTIES |
Hanlon Investment Management, Inc. serves as the Funds’ Investment Advisor (the “Advisor”). Pursuant to an Investment Advisory Agreement with the Funds, the Advisor, under the oversight of the Board, directs the daily operations of the Funds and supervises the performance of administrative and professional services provided by others. As compensation for its services and the related expenses borne by the Advisor, the Funds pay the Advisor an investment advisory fee, computed and accrued daily and paid monthly, at an annual rate of 1.00% of each Funds’ average daily net assets. For the year ended July 31, 2020 the Advisor earned advisory fees of $1,160,125 and $1,147,712 for the Hanlon Managed Income Fund and the Hanlon Tactical Dividend and Momentum Fund, respectively.
The Advisor has contractually agreed to reduce its fees and/or absorb expenses of the Funds (the “Waiver Agreement”), until at least November 28, 2020, to ensure that total annual operating expenses of each Fund after fee waiver and/or reimbursement (exclusive of any front-end or contingent deferred loads; brokerage fees and commissions; expenses of other investment companies in which a Fund may invest (“acquired fund fees and expenses”); borrowing costs, such as interest and dividend expense on securities sold short; taxes; and extraordinary expenses, such as litigation expenses) will not exceed 1.70%, 2.45%, 1.45% and 1.85% of each Fund’s average daily net assets for Class A, Class C, Class I and Class R shares, respectively. This Waiver Agreement may be terminated with respect to a Fund by the Board of Trustees on 60 days’ written notice to the Advisor. These expense reimbursements are subject to possible recoupment from a Fund in future years on a rolling three-year basis (within three years after the fees have been waived or reimbursed) if such recoupment can be achieved without exceeding the foregoing expense limits as well as any expense limitation that was in effect at the time the waiver or reimbursement was made. No recoupment will be paid to the Advisor in any fiscal quarter unless the Board has determined in advance that such recoupment is in the best interest of a Fund and its shareholders. For the year ended July 31, 2020 the Advisor did not waive fees or reimburse expenses for the Hanlon Managed Income Fund and the Hanlon Tactical Dividend and Momentum Fund.
Distributor – The distributor of the Funds is Northern Lights Distributors, LLC (the “Distributor”). The Board has adopted, on behalf of the Funds, the Trust’s Master Distribution and Shareholder Servicing Plans for Class A, Class C, and Class R shares (the “Plans”), as amended, pursuant to Rule 12b-1 under the 1940 Act, to pay for certain distribution activities and shareholder services. Under the Plans, the Funds may pay 0.25% per year of the average daily net assets of Class A shares, 1.00% of the average daily net assets for Class C shares and 0.40% of the average daily net assets for Class R shares for such distribution and shareholder service activities. For the year ended July 31, 2020, the Hanlon Managed Income Fund incurred distribution fees of $20,796, $14,797 and $35,725 for Class A, Class C and Class R shares, respectively. For the year ended July 31, 2020 the Hanlon Tactical Dividend and Momentum Fund incurred distribution fees of $26,145, $13,931 and $79,521 for Class A, Class C and Class R shares, respectively.
The Distributor acts as the Funds’ principal underwriter in a continuous public offering of the Funds’ shares. During the year ended July 31, 2020, the Distributor received $0 and $2,978 in underwriting commissions for sales of Class A and Class C shares, respectively, of the Hanlon Managed Income Fund, of which $0 and $950 was retained by the principal underwriter for Class A and Class C shares, respectively. During the year ended July 31, 2020, the Distributor received $0 and $2,166 in underwriting commissions for sales of Class A and Class C shares, respectively, of the Hanlon Tactical Dividend and Momentum Fund, of which $0 and $580 for Class A and Class C shares, respectively, was retained by the principal underwriter.
28
| Hanlon Funds |
| NOTES TO FINANCIAL STATEMENTS (Continued) |
| July 31, 2020 |
In addition, certain affiliates of the Distributor provide services to the Funds as follows:
Gemini Fund Services, LLC (“GFS”) – GFS, an affiliate of the Distributor, provides administration, fund accounting, and transfer agent services to the Trust. Pursuant to separate servicing agreements with GFS, each Fund pays GFS customary fees for providing administration, fund accounting and transfer agency services to the Fund. Certain officers of the Trust are also officers of GFS, and are not paid any fees directly by the Funds for serving in such capacities.
Northern Lights Compliance Services, LLC (“NLCS”) – NLCS, an affiliate of GFS and the Distributor, provides a Chief Compliance Officer to the Trust, as well as related compliance services, pursuant to a consulting agreement between NLCS and the Trust. Under the terms of such agreement, NLCS receives customary fees from the Funds.
BluGiant, LLC (“BluGiant”), an affiliate of GFS and the Distributor, provides EDGAR conversion and filing services as well as print management services for the Funds on an ad-hoc basis. For the provision of these services, BluGiant receives customary fees from the Funds.
Effective February 1, 2019, NorthStar Financial Services Group, LLC, the parent company of GFS and its affiliated companies including NLD, NLCS and Blu Giant (collectively, the “Gemini Companies”), sold its interest in the Gemini Companies to a third party private equity firm that contemporaneously acquired Ultimus Fund Solutions, LLC (an independent mutual fund administration firm) and its affiliates (collectively, the “Ultimus Companies”). As a result of these separate transactions, the Gemini Companies and the Ultimus Companies are now indirectly owned through a common parent entity, The Ultimus Group, LLC.
| 6. | AGGREGATE UNREALIZED APPRECIATION AND DEPRECIATION – TAX BASIS |
| Gross | Gross | Net Unrealized | ||||||||||||||
| Tax | Unrealized | Unrealized | Appreciation | |||||||||||||
| Fund | Cost | Appreciation | Depreciation | (Depreciation) | ||||||||||||
| Hanlon Managed Income Fund | $ | 109,634,099 | $ | 3,334,045 | $ | (672,553 | ) | $ | 2,661,492 | |||||||
| Hanlon Tactical Dividend and Momentum Fund | $ | 97,981,197 | $ | 4,790,358 | $ | — | $ | 4,790,358 | ||||||||
| 7. | DISTRIBUTIONS TO SHAREHOLDERS AND TAX COMPONENTS OF CAPITAL |
The tax character of distributions paid for the periods ended July 31, 2020 and July 31, 2019 was as follows:
| For the period ended July 31, 2020: | ||||||||||||||||||||
| Ordinary | Long-Term | Return | Tax-Exempt | |||||||||||||||||
| Portfolio | Income | Capital Gains | of Capital | Income | Total | |||||||||||||||
| Hanlon Managed Income Fund | $ | 2,299,730 | $ | — | $ | 341,787 | $ | — | $ | 2,641,517 | ||||||||||
| Hanlon Tactical Dividend and Momentum Fund | 652,658 | — | 69,309 | — | 721,967 | |||||||||||||||
| For the period ended July 31, 2019: | ||||||||||||||||||||
| Ordinary | Long-Term | Return | ||||||||||||||||||
| Portfolio | Income | Capital Gains | of Capital | Total | ||||||||||||||||
| Hanlon Managed Income Fund | $ | 5,527,694 | $ | — | $ | 131,083 | $ | 5,658,777 | ||||||||||||
| Hanlon Tactical Dividend and Momentum Fund | 332,906 | — | 15,897 | $ | 348,803 | |||||||||||||||
As of July 31, 2020, the components of accumulated earnings/(deficit) on a tax basis were as follows:
| Undistributed | Undistributed | Undistributed | Post October Loss | Capital Loss | Other | Unrealized | Total | |||||||||||||||||||||||||
| Ordinary | Ordinary | Long-Term | and | Carry | Book/Tax | Appreciation/ | Accumulated | |||||||||||||||||||||||||
| Portfolio | Tax-Exempt Income | Income | Capital Gains | Late Year Loss | Forwards | Differences | (Depreciation) | Earnings/(Deficits) | ||||||||||||||||||||||||
| Hanlon Managed Income Fund | $ | — | $ | — | $ | — | $ | (4,392,101 | ) | $ | (27,085,481 | ) | $ | — | $ | 2,661,492 | $ | (28,816,090 | ) | |||||||||||||
| Hanlon Tactical Dividend and Momentum Fund | — | — | — | (5,999,627 | ) | (3,369,166 | ) | — | 4,790,358 | (4,578,435 | ) | |||||||||||||||||||||
The difference between book basis and tax basis unrealized appreciation/(depreciation), accumulated net investment loss and accumulated net realized losses from investments is primarily attributable to the tax deferral of losses on wash sales.
29
| Hanlon Funds |
| NOTES TO FINANCIAL STATEMENTS (Continued) |
| July 31, 2020 |
Late year losses incurred after December 31 within the fiscal year are deemed to arise on the first business day of the following fiscal year for tax purposes. The Hanlon Tactical Dividend and Momentum Fund incurred and elected to defer such late year losses of $621,446.
| Late Year | ||||
| Portfolio | Losses | |||
| Hanlon Managed Income Fund | $ | — | ||
| Hanlon Tactical Dividend and Momentum Fund | 621,446 | |||
Capital losses incurred after October 31 within the fiscal year are deemed to arise on the first business day of the following fiscal year for tax purposes. The following Funds incurred and elected to defer such capital losses as follows:
| Post October | ||||
| Portfolio | Losses | |||
| Hanlon Managed Income Fund | $ | 4,392,101 | ||
| Hanlon Tactical Dividend and Momentum Fund | 5,378,181 | |||
At July 31, 2020, the Funds had capital loss carry forwards for federal income tax purposes available to offset future capital gains and utilized capital loss carryforwards as follows:
| Non-Expiring | ||||||||||||||||||||
| Portfolio | Short-Term | Long-Term | Total | Expiration | CLCF Utilized | |||||||||||||||
| Hanlon Managed Income Fund | $ | 17,219,655 | $ | 9,865,826 | $ | 27,085,481 | $ | — | $ | — | ||||||||||
| Hanlon Tactical Dividend and Momentum Fund | 3,369,166 | — | 3,369,166 | — | 801,482 | |||||||||||||||
Permanent book and tax differences, primarily attributable to tax return updates of return of capital distributions from underlying investment companies resulted in reclassifications for the fiscal year ended July 31, 2020 as follows:
| Paid | ||||||||
| In | Accumulated | |||||||
| Portfolio | Capital | Earnings (Losses) | ||||||
| Hanlon Managed Income Fund | $ | (184,267 | ) | $ | 184,267 | |||
| Hanlon Tactical Dividend and Momentum Fund | — | — | ||||||
| 8. | CONTROL OWNERSHIP |
The beneficial ownership, either directly or indirectly, of more than 25% of the voting securities of a Fund creates a presumption of control of the Fund, under Section 2(a)9 of the 1940 Act. As of July 31, 2020, Pershing LLC held 79.14% and 70.90% of the voting securities of the Hanlon Managed Income Fund and the Hanlon Tactical Dividend and Momentum Fund, respectively, for the benefit of others.
| 9. | SECURITIES LENDING |
Under an agreement with the BNY Mellon Corp. (“BNY Mellon”), the Funds can lend their portfolio securities to brokers, dealers and other financial institutions approved by the Board to earn additional income. Loans are collateralized by cash, in an amount at least equal to the market value of the securities loaned plus accrued interest, which is invested in highly liquid, short-term instruments such as repurchase agreements collateralized by U.S. Government securities and money market funds in accordance with the Funds’ security lending procedures. A portion of the income generated by the investment in the collateral, net of any rebates paid by BNY Mellon to the borrowers is remitted to BNY Mellon as lending agent, and the remainder is paid to the Funds. The Funds continue to receive interest or dividends on the securities loaned. The Funds have the right under the Master Securities Lending Agreement to recover the securities from the borrower on demand; if the borrower fails to deliver the securities on a timely basis, the Funds could experience delays or losses on recovery. Additionally, the Funds are subject to the risk of loss from investments made with the cash received as collateral. The Funds manage credit exposure arising from these lending transactions by, in appropriate circumstances, entering into master netting agreements and collateral agreements with third party borrowers that provide in the event
30
| Hanlon Funds |
| NOTES TO FINANCIAL STATEMENTS (Continued) |
| July 31, 2020 |
of default (such as bankruptcy or a borrower’s failure to pay or perform), the right to net a third party borrower’s rights and obligations under such agreement and liquidate and set off collateral against the net amount owed by the counterparty.
At July 31, 2020, each Fund had loaned securities and received collateral for the loan. The Hanlon Managed Income Fund received cash collateral which was invested in the Dreyfus Government Cash Management and Milestone Treasury Obligations Fund as shown in the Schedules of Investments. The Funds receive compensation relating to the lending of the Funds’ securities.
The market values of loaned securities and collateral and percentage of total investment income the Funds received from the investment of cash collateral retained by the lending agent, BNY Mellon, were as follows:
| Market Value of | Market Value of | Percentage of Total | ||||||||||
| Fund | Loaned Securities | Collateral | Investment Income | |||||||||
| Hanlon Managed Income Fund | $ | 11,018,595 | $ | 11,147,578 | 3.07 | % | ||||||
| Hanlon Tactical Dividend and Momentum Fund | $ | 17,164,862 | $ | 17,602,878 | 1.97 | % | ||||||
| Gross Amounts Not Offset in | ||||||||||||||||
| the Statement of Assets and | ||||||||||||||||
| Liabilities | ||||||||||||||||
| Gross Amounts | ||||||||||||||||
| Recognized in | Financial | Cash | ||||||||||||||
| Statements of Assets | Instruments | Collateral | Net Amount | |||||||||||||
| and Liabilities | Pledged | Pledged | of Assets | |||||||||||||
| Hanlon Managed Income Fund | ||||||||||||||||
| Description of Liability | ||||||||||||||||
| Securities lending collateral | $ | 10,958,500 | $ | — | $ | 10,958,500 | (1) | $ | — | |||||||
| (1) | The amount is limited to the liability balance and accordingly does not include excess collateral pledged. |
The following table sets forth the remaining contractual maturity of the collateral held as of July 31, 2020:
| Remaining Contractual Maturity of the Collateral Held as of July 31, 2020 | ||||||||||||||||||||
| Overnight and | Up to | Greater than | ||||||||||||||||||
| Continuous | 30 Days | 30-90 days | 90 days | Total | ||||||||||||||||
| Hanlon Managed Income Fund | ||||||||||||||||||||
| Dreyfus Government Cash Management | $ | 1,327,330 | $ | — | $ | — | $ | — | $ | 1,327,330 | ||||||||||
| Milestone Treasury Obligations Fund | 9,631,170 | — | — | — | 9,631,170 | |||||||||||||||
| U.S. Government | — | $ | — | $ | — | $ | 189,078 | $ | 189,078 | |||||||||||
| Total securities lending | $ | 10,958,500 | $ | — | $ | — | $ | 189,078 | $ | 11,147,578 | ||||||||||
| Remaining Contractual Maturity of the Collateral Held as of July 31, 2020 | ||||||||||||||||||||
| Overnight and | Up to | Greater than | ||||||||||||||||||
| Continuous | 30 Days | 30-90 days | 90 days | Total | ||||||||||||||||
| Hanlon Tactical Dividend and Momentum Fund | ||||||||||||||||||||
| U.S. Government | $ | — | $ | 776,994 | $ | — | $ | 16,825,884 | $ | 17,602,878 | ||||||||||
| Total securities lending | $ | — | $ | 776,994 | $ | — | $ | 16,825,884 | $ | 17,602,878 | ||||||||||
The fair value of the securities loaned for the Hanlon Managed Income Fund and the Hanlon Tactical Dividend and Momentum Fund totaled $11,018,585 and $17,164,862 at July 31, 2020, respectively. The securities loaned are noted in the Portfolios of Investments. The fair value of the “Collateral for Securities Loaned” on the Portfolio of Investments includes only cash collateral received and reinvested that totaled $10,958,500 and $0 for the Hanlon Managed Income Fund and the Hanlon Tactical Dividend and Momentum Fund at July 31, 2020, respectively. These amounts are offset by a liability recorded as “Securities lending collateral.” At July 31, 2020, the Hanlon Managed Income Fund and Hanlon Tactical Dividend and Momentum Fund had received non-cash collateral of
31
| Hanlon Funds |
| NOTES TO FINANCIAL STATEMENTS (Continued) |
| July 31, 2020 |
$189,078 and $17,602,878, respectively.
| 10. | UNDERLYING INVESTMENT IN OTHER INVESTMENT COMPANIES |
The Hanlon Tactical Dividend and Momentum Fund currently invests a portion of its assets in the Morgan Stanley Institutional Liquidity Funds - Treasury Securities Portfolio (“Morgan Stanley Portfolio”). The Fund may redeem its investment from the Morgan Stanley Portfolio at any time if the Adviser determines that it is in the best interest of the Fund and its shareholders to do so. The performance of the Fund will be directly affected by the performance of the Morgan Stanley Portfolio. The financial statements of the Morgan Stanley Portfolio, including the portfolios of investments, can be found at the Securities and Exchange Commission’s website www.sec.gov and should be read in conjunction with the Fund’s financial statements. As of July 31, 2020, the percentage of the Fund’s net assets invested in the Morgan Stanley Portfolio was 27.0%.
| 11. | SUBSEQUENT EVENTS |
Subsequent events after the date of the Statements of Assets and Liabilities have been evaluated through the date the financial statements were issued. Management has determined that no events or transactions occurred requiring adjustment or disclosure in the financial statements.
32
 | |||
GRANT THORNTON LLP
Two Commerce Square | REPORT OF INDEPENDENT REGISTERED PUBLIC ACCOUNTING FIRM | ||
| D | +1 215 561 4200 | ||
| F | +1 215 561 1066 | ||
| Board of Trustees of the Two Roads Shared Trust and Shareholders of Hanlon Managed Income Fund and Hanlon Tactical Dividend and Momentum Fund | |||
| Opinion on the financial statements | |||
| We have audited the accompanying statements of assets and liabilities, including the portfolios of investments, of Hanlon Managed Income Fund and Hanlon Tactical Dividend and Momentum Fund (two of the funds in the Two Roads Shared Trust) (collectively, the “Funds”) as of July 31, 2020, the related statements of operations for the year then ended, and the statements of changes in net assets for each of the two years in the period ended July 31, 2020, and the financial highlights for each of the four years in the period ended July 31, 2020, and for the period from September 9, 2015 (date of commencement of operations) through July 31, 2016, and the related notes (collectively referred to as the “financial statements”). In our opinion, the financial statements present fairly, in all material respects, the financial position of the Funds as of July 31, 2020, and the results of their operations for the year then ended, the changes in their net assets for each of the two years in the period ended July 31, 2020, and their financial highlights for each of the four years in the period ended July 31, 2020 and for the period from September 9, 2015 (date of commencement of operations) through July 31, 2016, in conformity with accounting principles generally accepted in the United States of America. | |||
| Basis for opinion | |||
| These financial statements are the responsibility of the Funds’ management. Our responsibility is to express an opinion on the Funds’ financial statements based on our audits. We are a public accounting firm registered with the Public Company Accounting Oversight Board (United States) (“PCAOB”) and are required to be independent with respect to the Funds in accordance with the U.S. federal securities laws and the applicable rules and regulations of the Securities and Exchange Commission and the PCAOB. | |||
| We conducted our audits in accordance with the standards of the PCAOB. Those standards require that we plan and perform the audit to obtain reasonable assurance about whether the financial statements are free of material misstatement, whether due to error or fraud. The Funds are not required to have, nor were we engaged to perform, an audit of their internal control over financial reporting. As part of our audits we are required to obtain an understanding of internal control over financial reporting but not for the purpose of expressing an opinion on the effectiveness of the Funds’ internal control over financial reporting. Accordingly, we express no such opinion. | |||
| GT.COM | Grant Thornton LLP is the U.S. member firm of Grant Thornton International Ltd (GTIL). GTIL and each of its member firms are separate legal entities and are not a worldwide partnership. |
33
| Our audits included performing procedures to assess the risks of material misstatement of the financial statements, whether due to error or fraud, and performing procedures that respond to those risks. Such procedures included examining, on a test basis, evidence regarding the amounts and disclosures in the financial statements. Our audits also included evaluating the accounting principles used and significant estimates made by management, as well as evaluating the overall presentation of the financial statements. Our procedures included confirmation of securities owned as of July 31, 2020 by correspondence with the custodians and brokers. We believe that our audits provide a reasonable basis for our opinion. | |
 | |
| We have served as the auditor of one or more investment companies in the Two Roads Shared Trust since 2016. | |
| Philadelphia, Pennsylvania September 29, 2020 |
34
| Hanlon Funds |
| EXPENSE EXAMPLE (Unaudited) |
| July 31, 2020 |
As a shareholder of a Fund, you incur two types of costs: (1) transaction costs, including sales charges (loads) on purchases and deferred sales charges on certain redemptions; (2) ongoing costs, including management fees; distribution and/or service (12b-1) fees; and other Fund expenses. This example is intended to help you understand your ongoing costs (in dollars) of investing in a Fund and to compare these costs with the ongoing costs of investing in other mutual funds.
The example is based on an investment of $1,000 invested at the beginning of the period and held for the entire period from February 1, 2020 through July 31, 2020.
Actual Expenses
The “Actual Expenses” line in the table below provides information about actual account values and actual expenses. You may use the information below; together with the amount you invested, to estimate the expenses that you paid over the period. Simply divide your account value by $1,000 (for example, an $8,600 account value divided by $1,000 = 8.6), then multiply the result by the number in the table under the heading entitled “Expenses Paid During Period” to estimate the expenses you paid on your account during this period.
Hypothetical Example for Comparison Purposes
The “Hypothetical” line in the table below provides information about hypothetical account values and hypothetical expenses based on the Funds’ actual expense ratio and an assumed rate of return of 5% per year before expenses, which is not the Funds’ actual return. The hypothetical account values and expenses may not be used to estimate the actual ending account balances or expenses you paid for the period. You may use this information to compare this 5% hypothetical example with the 5% hypothetical examples that appear in the shareholder reports of other funds.
Please note that the expenses shown in the table are meant to highlight your ongoing costs only and do not reflect any transactional costs, such as sales charges (loads), or redemption fees. Therefore, the table is useful in comparing ongoing costs only, and will not help you determine the relative total costs of owning different funds. In addition, if these transactional costs were included, your costs would have been higher.
| Hypothetical | |||||||||||||
| Actual | (5% return before expenses) | ||||||||||||
| Fund’s | Beginning | Ending | Ending | ||||||||||
| Annualized | Account | Account | Expenses | Account | Expenses | ||||||||
| Expense | Value | Value | Paid During | Value | Paid During | ||||||||
| Ratio | 2/1/20 | 7/31/20 | Period * | 7/31/20 | Period * | ||||||||
| Hanlon Managed Income Fund – Class A | 1.70% | $1,000.00 | $946.00 | $ 8.23 | $1,016.41 | $ 8.52 | |||||||
| Hanlon Managed Income Fund – Class C | 2.45% | $1,000.00 | $943.70 | $ 11.84 | $1,012.68 | $ 12.26 | |||||||
| Hanlon Managed Income Fund – Class I | 1.45% | $1,000.00 | $947.40 | $ 7.02 | $1,017.65 | $ 7.27 | |||||||
| Hanlon Managed Income Fund – Class R | 1.85% | $1,000.00 | $945.60 | $ 8.95 | $1,015.66 | $ 9.27 | |||||||
| Hanlon Tactical Dividend and Momentum Fund – Class A | 1.66% | $1,000.00 | $923.80 | $ 7.89 | $1,016.66 | $ 8.27 | |||||||
| Hanlon Tactical Dividend and Momentum Fund – Class C | 2.41% | $1,000.00 | $920.40 | $ 11.46 | $1,012.93 | $ 12.01 | |||||||
| Hanlon Tactical Dividend and Momentum Fund – Class I | 1.41% | $1,000.00 | $924.40 | $ 6.70 | $1,017.90 | $ 7.02 | |||||||
| Hanlon Tactical Dividend and Momentum Fund – Class R | 1.81% | $1,000.00 | $923.40 | $ 8.61 | $1,015.91 | $ 9.02 | |||||||
| * | Expenses are equal to the Fund’s annualized expense ratio, multiplied by the number of days in the period (182) divided by the number of days in the fiscal year (366). |
35
| Hanlon Funds |
| SUPPLEMENTAL INFORMATION (Unaudited) |
| July 31, 2020 |
LIQUIDITY RISK MANAGEMENT PROGRAM
The Funds have adopted and implemented a written liquidity risk management program as required by Rule 22e-4 (the “Liquidity Rule”) under the 1940 Act. The program is reasonably designed to assess and manage the Funds’ liquidity risk, taking into consideration, among other factors, the Funds’ investment strategy and the liquidity of its portfolio investments during normal and reasonably foreseeable stressed conditions; its short and long-term cash flow projections; and its cash holdings and access to other funding sources.
During the fiscal year ended July 31, 2020, the Trust’s Liquidity Risk Management Program Committee (the “Committee”) reviewed the Funds’ investments and determined that the Funds held adequate levels of cash and highly liquid investments to meet shareholder redemption activities in accordance with applicable requirements. Accordingly, the Committee concluded that (i) the Funds’ liquidity risk management program is reasonably designed to prevent violations of the Liquidity Rule and (ii) the Funds’ liquidity risk management program has been effectively implemented.
36
| Hanlon Funds |
| SUPPLEMENTAL INFORMATION (Unaudited)(Continued) |
| July 31, 2020 |
Approval of Advisory Agreement
Hanlon Investment Management, Inc., for the Hanlon Tactical Dividend and Momentum Fund and the Hanlon Managed Income Fund
At a meeting held on June 25, 29-30, 2020 (the “Meeting”), the Board of Trustees (the “Board”) of Two Roads Shares Trust (the “Trust”), each of whom is not an “interested person” of the Trust (the “Independent Trustees” or the “Trustees”), as such term is defined under Section 2(a)(19) of the Investment Company Act of 1940, as amended (the “1940 Act”), considered the reapproval of the investment advisory agreement (the “Advisory Agreement”) between Hanlon Investments Management, Inc. (“Hanlon” or the “Adviser”) and the Trust, on behalf of the Hanlon Tactical Dividend and Momentum Fund and the Hanlon Managed Income Fund (“the Funds”).
In connection with the Board’s consideration of the Advisory Agreement, the Board received written materials in advance of the Meeting, which included information regarding: (i) the nature, extent, and quality of services to be provided to each Fund by Hanlon; (ii) a description of the Adviser’s investment management personnel; (iii) an overview of the Adviser’s operations and financial condition; (iv) a description of the Adviser’s brokerage practices (including any soft dollar arrangements); (v) a comparison of the Funds’ advisory fees and overall expenses with those of comparable mutual funds; (vi) the anticipated level of profitability from the Adviser’s fund-related operations; (vii) the Adviser’s compliance policies and procedures, including policies and procedures for personal securities transactions, business continuity and information security and (viii) information regarding the performance record of the Funds as compared to other mutual funds with similar investment strategies.
Throughout the process, including at the meeting, the Board had numerous opportunities to ask questions of and request additional materials from Hanlon. During the Meeting, the Board was advised by, and met, in executive session with, the Board’s independent legal counsel, and received a memorandum from such independent counsel regarding their responsibilities under applicable law. The Board also noted that the evaluation process with respect to the Adviser was an ongoing one and that in this regard, the Board took into account discussions with management and information provided to the Board at prior meetings with respect to the services provided by the Adviser.
Matters considered by the Board in connection with its approval of the Advisory Agreement included, among others, the following:
Nature, Extent and Quality of Services. The Board reviewed materials provided by Hanlon related to the Advisory Agreement with the Trust on behalf of the Funds, including: the Advisory Agreement; a description of the manner in which investment decisions are made and executed; a review of the financial condition of Hanlon; an overview of the personnel that perform advisory, compliance, and operational services for the Funds; a quarterly written report containing Hanlon’s performance commentary; Hanlon’s compliance program, including its business continuity policy, information systems security policy, and a Code of Ethics containing provisions reasonably necessary to prevent Access Persons, as that term is defined in Rule 17j-1 under the Investment Company Act of 1940 Act, from engaging in conduct prohibited by Rule 17j-1(b); information regarding risk management processes and liquidity management; an annual review of the operation of Hanlon’s compliance program; information regarding the Adviser’s and its affiliates’ compliance and regulatory history; and an independent report prepared by Broadridge analyzing the performance record, fees and expenses of each Fund as compared to other mutual funds with similar investment strategies.
In reaching its conclusions with respect to the nature and quality of services to be provided by Hanlon under the Advisory Agreement, the Board considered the level and sophistication of Hanlon’s employees’ asset management, risk management, operations and compliance experience. The Board considered that Hanlon continued to employ various investment strategies and that there had been no staffing changes in each Fund’s portfolio management team. The Board noted that it had met with the Funds’ portfolio managers and was satisfied with their expertise and ability to manage the Funds’ portfolios in accordance with their investment objectives and strategy. The Board also noted that on a regular basis it received and reviewed information from the Trust’s Chief Compliance Officer (CCO) regarding the Funds’ compliance policies and procedures established pursuant to Rule 38a-1 under the 1940 Act, which included evaluating the regulatory compliance systems of Hanlon and procedures reasonably
37
| Hanlon Funds |
| SUPPLEMENTAL INFORMATION (Unaudited)(Continued) |
| July 31, 2020 |
designed to ensure compliance with federal securities laws. The Board noted that Hanlon appeared to have adequate capacity to operate both its investment and compliance program, that Hanlon had adopted cybersecurity and business continuity policies and procedures, and that Hanlon’s risk management and associated policies appeared to be operating effectively to identify and monitor risks. The Board also considered the significant risks assumed by Hanlon in connection with the services provided to the Funds, including entrepreneurial risk and ongoing risks including investment, operational, enterprise, litigation, regulatory and compliance risks with respect to the Funds. The Board also considered the financial condition and operations of the Adviser during the COVID-19 pandemic and noted that there had been no material disruption of the Adviser’s services to the Funds and that the Adviser had continued to provide the same level, quality and extent of services to the Funds.
In considering the nature, extent, and quality of the services provided by Hanlon, the Board also took into account its knowledge, acquired through discussions and reports during the preceding year and in past years, of Hanlon’s management and the quality of the performance of Hanlon’s duties. The Board concluded that Hanlon had sufficient quality and depth of personnel, resources, investment methods, and compliance policies and procedures to perform its duties under the Advisory Agreement and that the nature, overall quality and extent of the advisory services provided by Hanlon to the Funds were satisfactory and reliable.
Performance. In considering the Funds’ performance, the Board noted that it reviewed at its regularly scheduled meetings information about the Funds’ performance results. Among other data, the Board considered the performance of the Funds for the one-year, three-year and since inception periods ended March 31, 2020 as compared to each Fund’s respective benchmark indices and against the performance of a group of peer funds (the “Peer Group”) provided by Broadridge, an independent third-party data provider. The Board noted that while it found the data provided by the independent third-party generally useful it recognized its limitations, including in particular that the data may vary depending on the end date selected and that the results of the performance comparisons may vary depending on the selection of the peer group. The Board considered that the Hanlon Managed Income Fund outperformed the median of its Peer Group and the median of its Morningstar category (High Yield Bond) for the one-year period but underperformed its benchmark for the one-year period and underperformed its Peer Group median, category median and benchmark for each of the three-year and since inception periods. Regarding the Hanlon Tactical Dividend and Momentum Fund, the Board considered that the Fund had outperformed its benchmark and Morningstar category (Tactical Allocation) for the one-year period and outperformed its Peer Group median and category median for the three-year period but underperformed its benchmark, the median of its Morningstar category and the median of its Peer Group for the since inception period.
The Board also took into account management’s discussion of each Fund’s performance, including the quarterly written report containing Hanlon’s performance commentary. The Board took note of each Fund’s strong performance over the past year and also took into account each Fund’s risk-adjusted returns, as well as how each Fund has performed compared to its benchmark index. The Board also took into account each Fund’s performance volatility relative to its peers. The Board concluded that each Fund’s overall performance was satisfactory.
Fees and Expenses. Regarding the costs of the services provided by Hanlon with respect to the Funds, the Board considered a comparison of the Funds contractual advisory fee and net expense ratio to those of the funds within the Peer Group and to its Morningstar category. The Board noted that the Hanlon Managed Income Fund’s contractual advisory fee was above the median of the Peer Group and its Morningstar category but was not the highest. The Board also considered that the net operating expenses of the Hanlon Managed Income Fund were above the median of its Peer Group and its Morningstar category but were not the highest. The Board noted that the Hanlon Tactical Dividend and Momentum Fund’s contractual advisory fee was equal to the median of the Peer Group and above the median of its Morningstar category but was not the highest. The Board also considered that the net operating expenses of the Hanlon Tactical Dividend and Momentum Fund were above the median of its Peer Group and its Morningstar category but were not the highest. The Board noted in considering the expenses of the Hanlon Managed Income Fund that its average net assets were lower than the median assets of the funds in its Peer Group and Morningstar category and considered the impact that the size of the Fund has on the Fund’s total operating expenses. The Board also considered that Hanlon had agreed to reimburse expenses to limit net annual operating expenses to 1.45%, 1.70% 1.85% and 2.45% (exclusive of any taxes, interest, brokerage commissions, expenses incurred in connection with any merger or reorganization, indirect expenses, expenses of other investment companies in which the Fund may invest, or extraordinary expenses such as litigation) of the average net assets attributable to Class I, Class A, Class R and Class
38
| Hanlon Funds |
| SUPPLEMENTAL INFORMATION (Unaudited)(Continued) |
| July 31, 2020 |
C shares of the Funds, respectively. The Board took into account Hanlon’s discussion of each Fund’s expenses. The Board also noted that Hanlon managed other accounts or funds that are similarly managed as the Hanlon Managed Income Fund and the Hanlon Managed Income Fund paid lower fees than the comparable accounts.
Based on the factors above, the Board concluded that the advisory fee of each Fund was not unreasonable.
Profitability. The Board considered Hanlon’s profitability and whether these profits were reasonable in light of the services provided to each Fund. The Board reviewed a profitability analysis prepared by Hanlon based on current asset levels of the Funds. The Board noted the direct and indirect costs of operating the Funds in that analysis and concluded that Hanlon’s profitability from its relationship with each Fund was not excessive.
Economies of Scale. The Board considered whether Hanlon would realize economies of scale with respect to its management of the Funds as the Funds grow and whether fee levels reflected these economies of scale for the benefit of shareholders. The Board noted that the advisory fee did not currently have breakpoints with respect to either Fund. The Board considered the profitability analysis provided by Hanlon and considered that Hanlon had represented that it expected the Funds to achieve economies of scale at certain asset levels, but given current asset levels, economies of scale was not a relevant consideration. The Board noted that it would revisit whether economies of scale exist in the future once the Funds had achieved sufficient size.
Other Benefits. The Board also considered the character and amount of any other direct and incidental benefits to be received by Hanlon from its association with the Funds. The Board considered that Hanlon reported that the operation of the Fund benefits Hanlon to the extent that trading within multiple strategies on behalf of its investor clients is able to performed within a pooled investment vehicle that is allocated to its clients, avoiding having to trade individually for numerous Hanlon client accounts. The Board considered that Hanlon may elect to allocate assets from its other client accounts to the Funds and would benefit from increased assets in the Funds as a result, and that Hanlon did not anticipate receiving any other direct, indirect or ancillary material “fall-out” benefits from its relationship with the Funds. The Board concluded that these potential benefits are reasonable.
Conclusion. The Board, having requested and received such information from Hanlon as it believed reasonably necessary to evaluate the terms of the Advisory Agreement, and having been advised by independent counsel that the Board had appropriately considered and weighed all relevant factors, determined that approval of Advisory Agreement for an additional one-year term was in the best interests of the Funds and their respective shareholders. In considering the Advisory Agreement renewal, the Board considered a variety of factors, including those discussed above, and also considered other factors (including conditions and trends prevailing generally in the economy, the securities markets, and the industry). The Board did not identify any one factor as determinative, and each Independent Trustee may have weighed each factor differently. The Board’s conclusions may be based in part on its consideration of the advisory arrangements in prior years and on the Board’s ongoing regular review of the Funds’ performance and operations throughout the year.
39
| Hanlon Funds |
| SUPPLEMENTAL INFORMATION (Unaudited) |
| July 31, 2020 |
Trustees and Officers. The Trustees and officers of the Trust, together with information as to their principal business occupations during the past five years and other information, are shown below. Unless otherwise noted, the address of each Trustee and Officer is 225 Pictoria Drive, Suite 450, Cincinnati, OH 45246.
Independent Trustees *
| Name, Address, Year of Birth | Position(s) Held with Registrant | Term and Length Served | Principal Occupation(s) During Past 5 Years | Number of Portfolios Overseen In The Fund Complex** | Other Directorships Held During Past 5 Years |
| Mark Garbin Year of Birth: 1951 | Trustee | Indefinite, Since 2012 | Managing Principal, Coherent Capital Management LLC (since 2008) | 2 | Northern Lights Fund Trust (since 2013); Northern Lights Variable Trust (since 2013); Forethought Variable Insurance Trust (since 2013); OHA Mortgage Strategies Fund (offshore), Ltd. (2014 -2017); Altegris KKR Commitments Master Fund (since 2014); and Carlyle Tactical Private Credit Fund (since March 2018) |
| Mark D. Gersten Year of Birth: 1950 | Chairman, Trustee | Indefinite, Since 2012 | Independent Consultant (since 2012); Senior Vice President – Global Fund Administration Mutual Funds & Alternative Funds, AllianceBernstein LP (1985 – 2011) | 2 | Northern Lights Fund Trust (since 2013); Northern Lights Variable Trust (since 2013); Altegris KKR Commitments Master Fund (since 2014); previously, Ramius Archview Credit and Distressed Fund (2015-2017); and Schroder Global Series Trust (2012 to 2017) |
| Neil M. Kaufman Year of Birth: 1960 | Trustee, Audit Committee Chairman | Indefinite, Since 2012 | Managing Member, Kaufman & Associates, LLC (legal services)(Since 2016); Partner, Abrams Fensterman, Fensterman, Eisman, Formato, Ferrara & Wolf, LLP (legal services)(2010-2016) | 2 | Altegris KKR Commitments Master Fund (since 2014) |
| Anita K. Krug Year of Birth: 1969 | Trustee | Indefinite, Since 2012 | Dean (since 2019) Chicago Kent Law School; Interim Vice Chancellor for Academic Affairs (2018-2019) University of Washington Bothell; Interim Dean (2017-2018), Professor (2016-2019), Associate Professor (2014-2016); and Assistant Professor (2010-2014), University of Washington School of Law | 2 | Altegris KKR Commitments Master Fund (since 2014); Centerstone Investors Trust (since 2016) |
| * | Information is as of July 31, 2020. |
| ** | As of July 31, 2020, the Trust was comprised of 23 active portfolios managed by seven unaffiliated investment advisers and two affiliated investment advisers. The term “Fund Complex” applies only to those funds that are (i) advised by a common investment adviser or by an investment adviser that is an affiliated person of the investment adviser of any of the other funds of the Trust or (ii) hold themselves out to investors as related companies for purposes of investment and investor services. The Funds do not share the same investment adviser with any other series of the Trust or hold themselves out as related to any other series of the Trust for investment purposes. |
7/31/2020 – Two Roads v1
40
| Hanlon Funds |
| SUPPLEMENTAL INFORMATION (Unaudited)(Continued) |
| July 31, 2020 |
Officers of the Trust*
| Name, Address, Year of Birth | Position(s) Held with Registrant | Principal Occupation(s) During Past 5 Years | Number of Portfolios Overseen In The Fund Complex** | Other Directorships Held During Past 5 Years |
| James Colantino 80 Arkay Drive Hauppauge, NY 11788 Year of Birth: 1969 | President Since Feb. 2017 Treasurer (2012 to 2017) | Senior Vice President (2012-present); Vice President (2004 to 2012); Gemini Fund Services, LLC | N/A | N/A |
| Laura Szalyga 80 Arkay Drive Hauppauge, NY 11788 Year of Birth: 1978 | Treasurer Since Feb. 2017 | Vice President, Gemini Fund Services, LLC (since 2015); Assistant Vice President, Gemini Fund Services, LLC (2011-2014) | N/A | N/A |
| Richard A. Malinowski 80 Arkay Drive Hauppauge, NY 11788 Year of Birth: 1983 | Vice President Since Sep. 2018 Secretary Since 2013 | Senior Vice President and Senior Managing Counsel, Gemini Fund Services, LLC, (since February 2020); Senior Vice President Legal Administration, Gemini Fund Services, LLC (April 2017 to February 2020); Vice President and Counsel (April 2016 – 2017) and AVP and Staff Attorney (September 2012 – March 2016). | N/A | N/A |
| William B. Kimme Year of Birth: 1962 | Chief Compliance Officer Since Inception | Senior Compliance Officer, Northern Lights Compliance Services, LLC (September 2011 -present) | N/A | N/A |
| * | Information is as of July 31, 2020. |
| ** | As of July 31, 2020, the Trust was comprised of 23 active portfolios managed by seven unaffiliated investment advisers and two affiliated investment advisers. The term “Fund Complex” applies only to those funds that are (i) advised by a common investment adviser or by an investment adviser that is an affiliated person of the investment adviser of any of the other funds of the Trust or (ii) hold themselves out to investors as related companies for purposes of investment and investor services. The Funds do not share the same investment adviser with any other series of the Trust or hold themselves out as related to any other series of the Trust for investment purposes. |
The Funds’ Statement of Additional Information (“SAI”) includes additional information about the Trustees and is available free of charge, upon request, by calling toll-free at 1-844-828-3212.
7/31/2020 – Two Roads v1
41
PRIVACY NOTICE
| FACTS | WHAT DOES TWO ROADS SHARED TRUST DO WITH YOUR PERSONAL INFORMATION |
| Why? | Financial companies choose how they share your personal information. |
| Federal law gives consumers the right to limit some but not all sharing. | |
| Federal law also requires us to tell you how we collect, share, and protect your personal information. Please read this notice carefully to understand what we do. | |
| What? | THE TYPES OF PERSONAL INFORMATION WE COLLECT AND SHARE DEPENDS ON THE PRODUCT OR SERVICE THAT YOU HAVE WITH US. THIS INFORMATION CAN INCLUDE: |
| ● Social Security number and income | |
| ● Account transactions and transaction history | |
| ● Investment experience and purchase history | |
| When you are no longer our customer, we continue to share your information as described in this notice. | |
| How? | All financial companies need to share customers’ personal information to run their everyday business. In the section below, we list the reasons financial companies can share their customers’ personal information; the reason Two Roads Shared Trust chooses to share and whether you can limit this sharing. |
| Reasons we can share your personal information | Does Two Roads Shared Trust share? | Can you limit this sharing? |
| For our everyday business purposes – | ||
| such as to process your transactions, maintain your account(s), respond to court orders and legal investigations, or report to credit bureaus | YES | NO |
| For our marketing purposes – | NO | We do not share |
| to offer our products and services to you | ||
| For joint marketing with other financial companies | NO | We do not share |
| For our affiliates’ everyday business purposes – | NO | We do not share |
| information about your transactions and experiences | ||
| For our affiliates’ everyday business purposes – | NO | We do not share |
| information about your creditworthiness | ||
| For our affiliates to market to you | NO | We do not share |
| For nonaffiliates to market to you | NO | We do not share |
| Questions? | Call 1-402-895-1600 |
42
What we do
| How does Two Roads Shared Trust protect my personal information? | To protect your personal information from unauthorized access and use, we use security measures that comply with federal law. These measures include computer safeguards and secured files and buildings. |
| Our service providers are held accountable for adhering to strict policies and procedures to prevent any misuse of your nonpublic personal information. | |
| How does Two Roads Shared Trust | We collect your personal information, for example, when you |
| collect my personal information? | |
| ● open an account or give us contact information | |
| ● provide account information or give us your income information | |
| ● make deposits or withdrawals from your account | |
| We also collect your personal information from other companies. | |
| Why can’t I limit all sharing? | Federal law gives you the right to limit only |
| ● sharing for affiliates’ everyday business purposes – information about your creditworthiness | |
| ● affiliates from using your information to market to you | |
| ● sharing for nonaffiliates to market to you | |
| State laws and individual companies may give you additional rights to limit sharing | |
| Definitions | |
| Affiliates | Companies related by common ownership or control. They can be financial and nonfinancial companies. |
| ● Two Roads Shared Trust has no affiliates. | |
| Nonaffiliates | Companies not related by common ownership or control. They can be financial and nonfinancial companies. |
| ● Two Roads Shared Trust does not share with nonaffiliates so they can market to you. | |
| Joint marketing | A formal agreement between nonaffiliates financial companies that together market financial products or services to you. |
| ● Two Roads Shared Trust does not jointly market. |
43
PROXY VOTING POLICY
Information regarding how the Funds voted proxies relating to portfolio securities for the most recent twelve month period ended June 30 as well as a description of the policies and procedures that the Funds use to determine how to vote proxies is available without charge, upon request, by calling 1-844-828-3212 or by referring to the Securities and Exchange Commission’s (“SEC”) website at http://www.sec.gov.
PORTFOLIO HOLDINGS
Each Fund files its complete schedule of portfolio holdings with the SEC for the first and third quarters of each fiscal year as an exhibit to its reports on Form N-PORT within sixty days after the end of the period. Form N-PORT reports are available on the SEC’s website at http://www.sec.gov. The information on reports and Form N-PORT is available without charge, upon request, by calling 1-844-828-3212.
INVESTMENT ADVISOR
Hanlon Investment Management, Inc.
3393 Bargaintown Road
Egg Harbor Township, NJ 08234
ADMINISTRATOR
Gemini Fund Services, LLC
4221 North 203rd Street, Suite 100
Elkhorn, Nebraska 48022
ITEM 2. CODE OF ETHICS.
| (a) | The registrant has, as of the end of the period covered by this report, adopted a code of ethics that applies to the registrant's principal executive officer, principal financial officer, and principal accounting officer or controller, or persons performing similar functions, regardless of whether these individuals are employed by the registrant or a third party. |
| (b) | During the period covered by this report, there were no amendments to any provision of the code of ethics. |
| (c) | During the period covered by this report, there were no waivers or implicit waivers of a provision of the code of ethics. |
ITEM 3. AUDIT COMMITTEE FINANCIAL EXPERT.
| The Registrant’s board of trustees has determined that Mark Gersten is the audit committee financial expert, as defined in Item 3 of Form N-CSR. Mr. Gersten is independent for purposes of this Item 3. |
ITEM 4. PRINCIPAL ACCOUNTANT FEES AND SERVICES.
| (a) | Audit Fees. The aggregate fees billed for the last two fiscal year for professional services rendered by the registrant's principal accountant for the audit of the registrant's annual financial statements or services that are normally provided by the accountant in connection with statutory and regulatory filings or engagements for those fiscal years are as follows:
|
| Trust Series | 2019 | 2020 | |
| Hanlon Managed Income Fund | 16,500 | 16,500 | |
| Hanlon Tactical Dividend and Momentum Fund | 16,500 | 16,500 |
| (b) | Audit-Related Fees. There were no fees billed in the last fiscal year for assurances and related services by the principal accountant that are reasonably related to the performance of the audit of the registrant’s financial statements and are not reported under paragraph (a) of this item. |
| (c) | Tax Fees. The aggregate fees billed in the last fiscal year for professional services rendered by the principal accountant for tax compliance are as follows: |
| Trust Series | 2019 | 2020 | |
| Hanlon Managed Income Fund | 2,900 | 3,050 | |
| Hanlon Tactical Dividend and Momentum Fund | 2,900 | 3,050 |
| (d) | All Other Fees. The aggregate fees billed in the last fiscal year for products and services provided by the registrant’s principal accountant, other than the services reported in paragraphs (a) through (c) of this item were: |
Fiscal years ended July 31, 2019 $0 Fiscal years ended July 31, 2020 $0 | |
| (e)(1) | The audit committee does not have pre-approval policies and procedures. Instead, the audit committee or audit committee chairman approves on a case-by-case basis each audit or non-audit service before the principal accountant is engaged by the registrant. |
| (e)(2) | There were no services described in each of paragraphs (b) through (d) of this Item that were approved by the audit committee pursuant to paragraph (c)(7)(i)(C) of Rule 2-01 of Regulation S-X. |
| (f) | Not applicable. The percentage of hours expended on the principal accountant's engagement to audit the registrant's financial statements for the most recent fiscal year that were attributed to work performed by persons other than the principal accountant's full-time, permanent employees was zero percent (0%). |
(g)
(h) | All non-audit fees billed by the registrant's principal accountant for services rendered to the registrant for the fiscal years ended July 31, 2020 and 2019 are disclosed in (b)-(d) above. There were no audit or non-audit services performed by the registrant's principal accountant for the registrant's adviser. Not applicable. |
ITEM 5. AUDIT COMMITTEE OF LISTED REGISTRANTS.
Not applicable.
ITEM 6. INVESTMENTS
Included in annual report to shareholders filed under Item 1 of this form.
ITEM 7. DISCLOSURE OF PROXY VOTING POLICIES AND PROCEDURES FOR CLOSED-END MANAGEMENT INVESTMENT COMPANIES.
Not applicable. Each Fund is an open-end management investment company.
ITEM 8. PORTFOLIO MANAGERS OF CLOSED-END MANAGEMENT INVESTMENT COMPANIES
Not applicable. Each Fund is an open-end management investment company.
ITEM 9. PURCHASES OF EQUITY SECURITIES BY CLOSED-END MANAGEMENT INVESTMENT COMPANY AND AFFILIATED PURCHASERS.
Not applicable. Each Fund is an open-end management investment company.
ITEM 10. SUBMISSION OF MATTERS TO A VOTE OF SECURITY HOLDERS.
Not applicable at this time.
ITEM 11. CONTROLS AND PROCEDURES.
| (a) | The registrant's principal executive and principal financial officers, or persons performing similar functions, have concluded that the registrant's disclosure controls and procedures (as defined in Rule 30a-3(c) under the 1940 Act, are effective, as of a date within 90 days of the filing date of this report, based on the evaluation of these controls and procedures required by Rule 30a-3(b) under the 1940 Act and Rule 15d-15(b) under the Securities Exchange Act of 1934, as amended. |
| (b) | There were no changes in the registrant's internal control over financial reporting (as defined in Rule 30a-3(d) under the 1940 Act) that occurred during the period covered by this report that have materially affected, or are reasonably likely to materially affect, the registrant's internal control over financial reporting. |
Item 12. DISCLOSURE OF SECURITIES LENDING ACTIVITES FOR CLOSED-END MANAGEMENT INVESTMENT COMPANIES.
Not applicable. Each Fund is an open-end management investment company.
ITEM 13. EXHIBITS
(a)(1) Code of Ethics for Principal Executive and Senior Financial Officers is attached hereto.
(a)(2) Certifications pursuant to Section 302 of the Sarbanes-Oxley Act of 2002 are filed herewith.
(a)(3) Not applicable for open-end investment companies.
(a)(4) Not applicable.
(b) Certifications pursuant to Section 906 of the Sarbanes-Oxley Act of 2002 are filed herewith.
SIGNATURES
Pursuant to the requirements of the Securities Exchange Act of 1934 and the Investment Company Act of 1940, the registrant has duly caused this report to be signed on its behalf by the undersigned, thereunto duly authorized.
Two Roads Shared Trust
| By James Colantino | /s/ James Colantino |
| Principal Executive Officer/President | |
| Date: 10/5/2020 | |
Pursuant to the requirements of the Securities Exchange Act of 1934 and the Investment Company Act of 1940, this report has been signed below by the following person on behalf of the registrant and in the capacities and on the date indicated.
| By Laura Szalyga | /s/ Laura Szalyga |
| Principal Financial Officer/Treasurer | |
| Date: 10/5/2020 | |