united states
securities and exchange commission
washington, d.c. 20549
form n-csr
certified shareholder report of registered management
investment companies
Investment Company Act file number 811-22718
Two Roads Shared Trust
(Exact name of registrant as specified in charter)
225 Pictoria Drive, Suite 450, Cincinnati, OH 45246
(Address of principal executive offices) (Zip code)
Richard Malinowski, Gemini Fund Services, LLC.
4221 North 203rd Street, Suite 100, Elkhorn, NE 68022
(Name and address of agent for service)
Registrant's telephone number, including area code: 631-470-2619
Date of fiscal year end: 10/31
Date of reporting period: 10/31/20
ITEM 1. REPORTS TO SHAREHOLDERS.
 | |
| Annual Report | |
| October 31, 2020 | |
Conductor Global Equity Value Fund
| Class A | RAALX |
| Class C | RACLX |
| Class I | RAILX |
| Class Y | RAYLX |
Conductor International Equity Value Fund
| Class A | RIALX |
| Class I | RIYLX |
| www.conductorfunds.com | |
| 1-844-GO-RAILX (1-844-467-2459) | |
| This report and the financial statements contained herein are submitted for the general information of shareholders and are not authorized for distribution to prospective investors unless preceded or accompanied by an effective prospectus, which contains information about each Fund’s investment objective, risks, fees and expenses. Investors are reminded to read the prospectus carefully before investing in a Fund. | |
Beginning on January 1, 2021, as permitted by regulations adopted by the Securities and Exchange Commission, paper copies of the Funds’ shareholder reports like this one will no longer be sent by mail, unless you specifically request paper copies of the reports. Instead, the reports will be made available on the Funds’ website www.conductorfunds.com, and you will be notified by mail each time a report is posted and provided with a website link to access the report.
If you already elected to receive shareholder reports electronically, you will not be affected by this change and you need not take any action. You may elect to receive shareholder reports and other communications from the Funds electronically or to continue receiving paper copies of shareholder reports, which are available free of charge, by contacting your financial intermediary (such as a broker-dealer or bank) or, if you are a direct investor, by following the instructions included with paper Fund documents that have been mailed to you.

December 2020
First, let us begin by welcoming you to the seventh yearly update for the Conductor Global Equity Value Fund, (the “Global Fund”) and for the recently launched Conductor International Equity Value Fund (the “International Fund” and together with Global Fund, each a “Fund” and collectively the “Funds”). We always look forward to keeping you updated regularly on the status of the various positions in the portfolios and the global market and economic trends that affect our positioning.
FY 2020 has been defined almost exclusively by the Covid-19 pandemic, which ushered in extraordinary market volatility and whiplash-inducing economic swings around the globe. Throw in one of the most contentious election cycles in American history, and investors were subject to a market backdrop without parallel. Relative performance in many of our target equity market segments once again lagged as the trends pushing against global and value remained on the same pathway observed over the past several years. The uncertainty and fear surrounding Covid and its broader economic impact continued to weigh on international stocks, which underperformed those in the United States, though emerging market stocks, entering the fiscal year near historic low valuations, showed signs of life towards the end of the fiscal year. Global value stocks, which have underperformed for the better part of the last decade, seemed to be affected most by pandemic-induced fear and uncertainty. Weak relative performance trends for value actually accelerated through most of the year as investors sought the “certainty” of large -cap technology haven names despite the, by many measure, historic valuation gulf between value and growth. Steadfast as ever, we still believe that value remains positioned to outperform growth in coming years and that international stocks are positioned to outperform US stocks. Value stocks remain significantly and historically undervalued relative to growth stocks. International stocks, whether emerging or developed market, remain significantly undervalued compared to their US counterparts on a historical basis.
From 11/1/2019 to 10/31/2020, the MSCI World Index was up 4.95%, while the MSCI All Country World Index was up 5.45%. The Global Fund’s Benchmark, the MSCI All Country World Value Index was down -11.50%, while the MSCI All Country World Growth Index was up 23.41%. The MSCI All Country Small and Mid -Cap Index was up 1.04% versus 6.25% for the MSCI All Country Large-Cap Index. The MSCI EAFE, covering ex-US developed countries, was down -6.36%, while the MSCI Emerging Markets Index was up 8.59%. The S&P 500 was up 9.70%. Over the same period, the Conductor Global Equity Value Fund Class Y was down -14.27%.
The International Fund Class I was launched on 12/3/2019. Between 12/3/19 and 10/31/20 the International Fund was down -15.15% versus -2.34% for the MSCI All Country World ex USA index and -14.98% for the MSCI All Country World ex USA Value index.
1
Disclosures:
The referenced indices are shown for general market comparisons and are not meant to represent the Funds. Investors cannot directly invest in an index; unmanaged index returns do not reflect any fees, expenses or sales charges.
The Funds’ maximum sales charge for Class “A” shares is 5.75%. The performance data quoted here represents past performance. Current performance may be lower or higher than the performance data quoted above. Past performance is no guarantee of future results. The investment return and principal value of an investment will fluctuate so that investor’s shares, when redeemed, may be worth more or less than their original cost. The Funds’ investment adviser has contractually agreed to reduce its fees and/or absorb expenses of each Fund, at least until March 1, 2021, to ensure that each of the Fund’s total annual operating expenses (exclusive of any front -end or contingent deferred loads; brokerage fees and commissions; expenses of other investment companies in which the Fund may invest (“acquired fund fees and expenses”); borrowing costs, such as interest and dividend expense on securities sold short; taxes; and extraordinary expenses, such as litigation expenses) will not exceed 2.15%, 2.90%, 1.90%, and 1.25% of average daily net assets attributable to Global Fund Class A, Class C, Class I, and Class Y shares, respectively; and 1.45% and 1.20% of the average daily net assets attributable to International Fund Class A and Class I shares, respectively. These expense reimbursements are subject to possible recoupment from Funds in future years on a rolling three -year basis (within the three years after the fees have been waived or reimbursed) if such recoupment can be achieved without exceeding the foregoing expense limits as well as any expense limitation that was in effect at the time the reimbursement was made. Please review the funds’ prospectus for more information regarding the funds’ fees and expenses. For performance information current to the most recent month-end, please call toll-free 844-467-2459 or by visiting www.conductorfunds.com.
The views in this report are those of the Funds’ management. This report contains certain forward-looking statements about factors that may affect the performance of the funds in the future. These statements are based on the Funds’ management’s predictions and expectations concerning certain future events, such as the performance of the economy on the whole and of specific industry sectors. Management believes these forward-looking statements are reasonable, although they are inherently uncertain and difficult to predict.
2
Global Year in Review:
In essence, one issue alone dominated global market discussion this year: the devastating Covid-19 pandemic. Once news of the pandemic and its spread around the world took hold in mid to late February 2020, investors were subjected to market whipsaws and news-flow whipsaws unprecedented excepting the worst days of the 2008/2009 global financial crisis, or the days surrounding the market crash of 1987. Immediately, talk pivoted towards lockdowns, healthcare treatments, vaccines, hospital capacity, business survivability within highly affected industries, government stimulus, bailouts, central bank accommodation, and political polarization. At its lowest on March 23rd, the MSCI ACWI Index was down over 30% from 2019 calendar year end levels. The rebound rally for this Index from those lows to the end of the 2020 fiscal year exceeded 45%. Amidst it all, volatility measures, such as the VIX index in the US, reached levels observed only during the very worst moments of the global financial crisis.
Of course, the uncertainty in markets captured in the wild swings of index returns and volatility indicators was merely a reflection of the wild swings occurring in global macroeconomic headline indicators. GDP numbers declined at rates never seen before around the globe during CY Q2, only to rebound during the ensuing months at an unprecedented pace (though as of October 31, 2020 global GDP remains below the levels of Q4:2019). Global trade flows collapsed. Certain industries, such as those focused on home delivery and convenience, benefitted mightily, while others, such as those focused on the global hospitality industry, were driven to the point of insolvency.
Governments and central banks around the globe opened the fiscal and monetary spigots in quick order, perhaps saving the global economy from a far worse outcome, though many economists still ponder whether enough firepower has been directed towards the crisis. The United States government approved more than $ 2 trillion, approximately 11% of GDP, in aid towards individuals and businesses. The Federal Reserve provided extraordinary assistance to maintain liquidity in fixed income and money markets. The United Kingdom approved close to $ 100 billion in spending to shore up health services and businesses. Across the European Union, governments approved well over a trillion euros worth of stimulus. The European Central Bank, like its American counterpart, worked diligently to maintain accommodative monetary conditions. Global equity markets took their cues from the extraordinary response and rebounded accordingly. These strong global equity market gains during the back portion of the fiscal year, however, obscure an economic backdrop that remains just as confusing and uncertain as the situation early in the crisis. And, certain dislocations that were present in global equity markets prior to the crisis, such as significantly over-extended valuation metrics in many corners of the world (especially the US) and wide performance differentials between various sub-components such as value and growth stocks, only became more dislocated as the crisis unfolded. Broader macroeconomic and societal dislocations and problem subjects such as widening income stratification, mega-cap tech companies’ roles in the
3
global economy, the urban/rural skills divide in many countries, and the relationship between economic superpowers China and the US have only become more complicated and contentious as Covid continues to upend the economic and political order.
Coming into the 2020 fiscal year, as pointed out in last year’s letter, global macroeconomic trends were already softening, corporate earnings had already plateaued, and valuations in places like the United States were already reaching unsustainable levels. Even with vaccines potentially ready to mitigate the worst of the crisis, US (especially) and international equity markets face headwinds, valuation and otherwise, that we believe will be difficult to shake off even under the most favorable political and societal conditions. Lo and behold, the US finds itself emerging from one of the most contentious and, perhaps, strangest election and post-election periods in its modern history. Across the Atlantic, as of this writing, Brexit negotiations between the UK and the EU remain as twisted as ever. Of course, the new US administration and Congress could find a path towards compromise and kumbaya, and the EU and UK could come up with a long-lasting face and trade -saving deal in the coming days and weeks, but it’s just as easy, we feel, to foresee a period of significant distrust and acrimony in Washington and significant fracturing between the EU and UK, and within the EU itself. These two economic blocs represent a significant portion of global GDP and market-cap. Against that backdrop, we’re inclined to say that volatility will remain a feature of global equity markets going forward. As we’re required to do, we’ll continue to invest our capital in value -oriented names. We believe that now, more than ever, value is in a unique position to provide substantial and superior risk-adjusted returns over the next several years, whether markets continue the current smooth sailing trend or re-enter treacherous waters.
4
Conductor Global: Portfolio Positioning
Below, we provide the sector and geographic exposure breakdowns for the Global Fund portfolio, both at fiscal year-end 2019 and fiscal year-end 2020. Of note, we break out the sector and geographic exposures embedded in any ETF exposure to show the true risk allocations and exposures. We also include the sector and geographic performance data for the MSCI All Country World Index (the “ACWI”) as a frame of reference rather than MSCI World. Like our portfolio, the ACWI has exposure to Emerging markets while the MSCI World does not.
| Sector 10/31/19 | Fund Portfolio % | ACWI % | Differential |
| Cash | 9.07% | 0.45% | 8.62% |
| Consumer Disc. | 14.76% | 10.86% | 3.90% |
| Consumer Staples | 3.69% | 8.37% | -4.68% |
| Energy | 4.24% | 5.25% | -1.01% |
| Financials/RE | 12.72% | 19.94% | -7.22% |
| Health Care | 2.66% | 11.53% | -8.87% |
| Industrials | 10.56% | 10.13% | 0.43% |
| Info Tech | 18.82% | 16.54% | 2.28% |
| Materials | 4.07% | 4.68% | -0.61% |
| Communication Svcs | 8.51% | 8.79% | -0.28% |
| Utilities | 10.90% | 3.46% | 7.44% |
| Sector 10/31/20 | Fund Portfolio % | ACWI % | Differential |
| Cash | 31.24% | 0.33% | 30.91% |
| Consumer Disc. | 18.20% | 13.05% | 5.15% |
| Consumer Staples | 2.39% | 7.81% | -5.42% |
| Energy | 1.04% | 2.74% | -1.70% |
| Financials/RE | 2.80% | 15.40% | -12.60% |
| Health Care | 1.39% | 12.28% | -10.89% |
| Industrials | 8.91% | 9.55% | -0.64% |
| Info Tech | 9.96% | 21.14% | -11.18% |
| Materials | 18.70% | 4.79% | 13.91% |
| Communication Svcs | 1.79% | 9.72% | -7.93% |
| Utilities | 3.57% | 3.18% | 0.39% |
5
| ACWI Sector Performance 10/31/19 to 10/31/20 | Performance % |
| Consumer Disc. | 24.52% |
| Consumer Staples | 0.26% |
| Energy | -41.72% |
| Financials | -17.79% |
| Real Estate | -15.10% |
| Health Care | 10.79% |
| Industrials | -1.82% |
| Info Tech | 33.35% |
| Materials | 7.45% |
| Communication Svcs | 16.50% |
| Utilities | -1.56% |
| Region 10/31/19 | Fund Portfolio % | ACWI % | Differential |
| Africa/Mid East | 4.21% | 1.20% | 3.01% |
| Asia Pacific | 40.54% | 18.57% | 21.97% |
| Central Asia | 0.71% | 0.99% | -0.28% |
| Eastern Europe | 0.37% | 0.73% | -0.36% |
| North America | 20.77% | 56.92% | -36.15% |
| South/Central Am. | 9.13% | 1.17% | 7.96% |
| Western Europe | 15.49% | 20.11% | -4.62% |
| Not Classified | 8.79% | 0.30% | 8.49% |
| Region 10/31/20 | Fund Portfolio % | ACWI % | Differential |
| Africa/Mid East | 0.00% | 1.13% | -1.13% |
| Asia Pacific | 40.25% | 19.50% | 20.75% |
| Central Asia | 0.00% | 1.03% | -1.03% |
| Eastern Europe | 1.11% | 0.50% | 0.61% |
| North America | 18.15% | 59.45% | -41.30% |
| South/Central Am. | 3.57% | 0.81% | 2.76% |
| Western Europe | 5.69% | 17.40% | -11.71% |
| Not Classified | 31.24% | 0.19% | 31.05% |
6
| ACWI Region Performance 10/31/19 to 10/31/20 (USD) | Performance % |
| United States (S&P 500) | 9.70% |
| Europe | -8.71% |
| Japan | -2.61% |
| Asia AC ex-Japan | 16.16% |
| EM Latin America | -32.94% |
Portfolio Positioning and Relative Performance Observations:
As a reminder, the investment process for adding individual equities to the Global Fund is not thematically oriented but focused on quantitative fundamental metrics. The Global Fund screens global equities using a variety of traditional cash flow, income statement, and balance sheet ratios and adds companies exhibiting valuation ratios at levels below the overall levels for the relevant global indices. The typical portfolio company, we believe, also exhibits lower quantitative probabilities for bankruptcy (i.e. better balance sheet health) at time of entry than the median company in global Indices. In an attempt to avoid “value traps” and manage risk, the Global Fund also employs momentum-based technical rules to assist with stock selection. Likewise, technical rules help govern when positions should be removed from the portfolio. Finally, the Global Fund employs a top down model incorporating macroeconomic data, valuation data, and index-level technical data to assess overall market risk. During times of extremely high risk, the Adviser believes, although there are no guarantees, that the Global Fund has the capability of significantly reducing risk exposures. Overall, the shifts in exposures listed above and briefly described below are simply governed by the models we employ, not any qualitative judgment by the portfolio manager as to which sectors or geographies should out or underperform in the future.
SECTOR
| ● | Over the course of FY 2020, the Fund saw the biggest exposure reductions in the Info Tech and Financials sectors, with the biggest increases in Materials and Consumer Discretionary. The Covid stimulus/reflationary trade significantly improved the relative performance opportunities for the beaten-down materials sector, which resulted in increased allocation. A similar dynamic played out with beaten down consumer discretionary names, particularly in the global retail industry. The Global Fund exited a number of the value-oriented tech names during the more volatile days of the Covid crisis. Because the IT sector in general holds the highest valuations of any sector, exposure remained low as the year progressed. We expect this to remain the case. The financial sector remains inexpensive long-term when compared to historical valuation levels, but poor relative strength/performance has kept the Global Fund from significantly increasing the allocation to this point. Nonetheless, because of the inherent value |
7
characteristics of the Financials sector, we expect exposure to increase in the coming quarters. Energy is another value-oriented sector that could see a material increase in allocation in the future.
| ● | In regard to sector attribution relative to the MSCI All Country World Index, the Consumer Discretionary and Information Technology Sectors cost the portfolio 6% and 5% respectively in relative performance. Much of the poor performance in Consumer Discretionary reflected poor performance of many names through the crisis. Improved performance among Consumer Discretionary names later in the fiscal year mitigated some of the relative performance deficit. In the case of the Info Tech sector’s negative contribution, Global Fund under-allocation to large-cap growth technology names during the year significantly curtailed overall performance relative to the benchmark. Underweight positioning in Financials and Energy added approximately 2% points in relative performance. The standout performer during the fiscal year was the Materials sector; the overweight there, combined with solid stock selection, added approximately 3% points in relative performance. The biggest drag of all, however, was the much larger than benchmark cash position, which cost the portfolio approximately 7% in relative performance. |
GEOGRAPHY
| ● | In terms of geographic allocation, since the beginning of FY 2020, the Global Fund has been significantly underweight US and European equities relative to benchmark, and significantly overweight Asia/Pacific equities. Overall, the Global Fund has been overweight international equities generally. As mentioned above, the Global Fund has maintained a substantial cash position throughout the year, mostly at the expense of US exposure. Going forward, we expect to maintain a significant underweight to US equities owing to the fact that US equity indices remain the most overvalued top-level indices globally. We expect Asia/Pacific to remain a core part of the portfolio and anticipate more Europe exposure. |
| ● | Looking at attribution from a geographic perspective, North American/US stocks were the biggest weight on relative performance against global benchmarks, costing the portfolio over six percentage points in relative performance, mostly due to the very strong performance of US equities and the Global Fund’s significant underweight positioning. The Global Fund’s overweight in South/Central American stocks through the year cost the portfolio approximately 2% in relative performance. As mentioned above, excess cash cost the portfolio approximately 7% points in relative performance. |
8
Conductor International: Portfolio Positioning
Below, we provide the sector and geographic exposure breakdowns for the International Fund, both at inception on December 3, 2019 and at fiscal year-end 2020 (10/31/20). Of note, we break out the sector and geographic exposures embedded in any ETF exposure to show the true risk allocations and exposures. We also include the sector and geographic performance data for the MSCI All Country World ex-US Index (the “ACWI ex-US”) as a frame of reference rather than MSCI World ex-US index. Like our portfolio, the ACWI has exposure to Emerging markets while the MSCI World does not.
| Sector 12/03/19 | Fund Portfolio % | ACWI ex-US % | Differential |
| Cash | 0.72% | 0.47% | 0.25% |
| Consumer Disc. | 25.59% | 11.84% | 13.75% |
| Consumer Staples | 3.55% | 9.56% | -6.01% |
| Energy | 1.71% | 6.37% | -4.66% |
| Financials/RE | 6.72% | 24.54% | -17.82% |
| Health Care | 5.34% | 8.85% | -3.51% |
| Industrials | 12.33% | 11.98% | 0.35% |
| Info Tech | 24.04% | 9.16% | 14.88% |
| Materials | 10.62% | 7.25% | 3.37% |
| Communication Svcs | 3.15% | 6.64% | -3.49% |
| Utilities | 6.24% | 3.34% | 2.90% |
| Sector 10/31/20 | Fund Portfolio % | ACWI ex-US % | Differential |
| Cash | 30.04% | 0.43% | 29.61% |
| Consumer Disc. | 10.70% | 14.36% | -3.66% |
| Consumer Staples | 2.32% | 9.48% | -7.16% |
| Energy | 1.95% | 3.99% | -2.04% |
| Financials/RE | 6.49% | 19.73% | -13.24% |
| Health Care | 3.69% | 9.93% | -6.24% |
| Industrials | 11.11% | 11.52% | -0.41% |
| Info Tech | 8.62% | 11.62% | -3.00% |
| Materials | 16.31% | 7.77% | 8.54% |
| Communication Svcs | 4.47% | 7.83% | -3.36% |
| Utilities | 4.29% | 3.34% | 0.95% |
9
| ACWI ex-US Sector Performance 12/03/19 to 10/31/20 | Performance % |
| Consumer Disc. | 13.17% |
| Consumer Staples | -2.97% |
| Energy | -37.52% |
| Financials | -19.31% |
| Health Care | 6.68% |
| Industrials | -4.21% |
| Info Tech | 21.87% |
| Materials | 4.89% |
| Communication Svcs | 14.28% |
| Utilities | 0.16% |
| Region 12/03/19 | Fund Portfolio % | ACWI ex-US % | Differential |
| Africa/Mid East | 3.14% | 2.72% | 0.42% |
| Asia Pacific | 57.92% | 41.96% | 15.96% |
| Central Asia | 0.89% | 2.43% | -1.54% |
| Eastern Europe | 0.51% | 1.53% | -1.02% |
| North America | 2.00% | 7.50% | -5.50% |
| South/Central Am. | 11.86% | 2.42% | 9.44% |
| Western Europe | 23.04% | 41.10% | -18.06% |
| Not Classified | 0.65% | 0.35% | 0.30% |
| Region 10/31/20 | Fund Portfolio % | ACWI ex-US % | Differential |
| Africa/Mid East | 1.02% | 2.73% | -1.71% |
| Asia Pacific | 44.31% | 46.51% | -2.2% |
| Central Asia | 1.04% | 2.48% | -1.44% |
| Eastern Europe | 0.37% | 1.19% | -0.82% |
| North America | 4.58% | 6.92% | -2.34% |
| South/Central Am. | 3.96% | 1.70% | 2.26% |
| Western Europe | 14.72% | 38.09% | -23.37% |
| Not Classified | 30.00% | 0.37% | 29.63% |
| ACWI Region Performance 12/03/19 to 10/31/20 (USD) | Performance % |
| Europe | -8.63% |
| Japan | -4.83% |
| Asia AC ex-Japan | 16.06% |
| EM Latin America | -30.31% |
| EM Africa/Mid East | -16.66% |
10
Portfolio Positioning and Relative Performance Observations:
As a reminder, the investment process for adding individual equities to the International Fund is not thematically oriented but focused on quantitative fundamental metrics. The International Fund screens global equities using a variety of traditional cash flow, income statement, and balance sheet ratios and adds companies exhibiting valuation ratios at levels below the overall levels for the relevant global indices. The typical portfolio company, we believe, also exhibits lower quantitative probabilities for bankruptcy (i.e. better balance sheet health) at time of entry than the median company in global indices. In an attempt to avoid “value traps” and manage risk, the International Fund also employs momentum-based technical rules to assist with stock selection. Likewise, technical rules help govern when positions should be removed from the portfolio. Finally, the International Fund employs a top down model incorporating macroeconomic data, valuation data, and index-level technical data to assess overall market risk. During times of extremely high risk, the Adviser believes the Fund has the capability of significantly reducing risk exposures. Overall, the shifts in exposures listed above and briefly described below are simply governed by the models we employ, not any qualitative judgment by the portfolio manager as to which sectors or geographies should out or underperform in the future.
SECTOR
| ● | Over the course of the period from its inception through October 31, 2020, the International Fund saw the biggest exposure reductions in the Info Tech and Consumer Discretionary sectors, with the biggest increases in Materials and Communication Services. The Covid stimulus/reflationary trade significantly improved the relative performance opportunities for the beaten-down materials sector, which resulted in increased allocation. The reduction in consumer discretionary stocks was a stark contrast with the Global Fund; the primary reason that the International Fund didn’t maintain the same exposures to Consumer Discretionary mainly comes down to the fact that many of the positive trends in those stocks took place in the US. The International Fund exited a number of the value-oriented tech names during the more volatile days of the Covid crisis. Because the IT sector in general holds the highest valuations of any sector, exposure remained low as the fiscal period progressed. We expect this to remain the case. The financial sector remains inexpensive long-term when compared to historical valuation levels, but poor relative strength/performance has kept the International Fund from significantly increasing the allocation to this point. Nonetheless, because of the inherent value characteristics of the Financials sector, we expect exposure to increase in the coming quarters. Energy is another value- oriented sector that could see a material increase in allocation in the future. |
| ● | In regard to sector attribution relative to the MSCI All Country World ex-US Index, the Consumer Discretionary sector cost the portfolio 7% in relative performance, by far the most negative sector in that regard. Like the Global Fund, high cash levels |
11
cost the International Fund performance as markets rallied into the end of the fiscal period. In the case of the International Fund, cash drag cost the portfolio approximately 3.5% of relative performance. Much of the poor performance in Consumer Discretionary reflected poor performance of many names through the crisis. Improved performance among Consumer Discretionary names later in the fiscal year mitigated some of the relative performance deficit. Underweight positioning in Financials added approximately 2.5% points in relative performance. The standout performer, during the fiscal period was the Materials sector; the overweight there, combined with solid stock selection, added approximately 3% points in relative performance.
GEOGRAPHY
| ● | In terms of geographic allocation, since its inception, the International Fund has been significantly underweight European equities relative to benchmark, and generally overweight Asia/Pacific equities. The International Fund maintained a substantial cash position from its inception through October 31, 2020. Going forward, we expect Asia/Pacific equities to remain a core part of the portfolio and anticipate an increase in Europe exposure. |
| ● | Looking at attribution from a geographic perspective, core European equities were the biggest weight on relative performance for the International Fund against the international benchmark, costing the portfolio approximately 3.5 percentage points in relative performance, The International Fund’s overweight in South/Central American stocks through the period cost the portfolio approximately 1.5% in relative performance. Excess cash cost the portfolio approximately 3.5% points in relative performance. Exposure to Eastern Europe and Central Asia very slightly contributed positively to relative performance, the only regions to do so. |
12
Portfolio Characteristics
The portfolios as currently constructed (12/7/20) continue to reflect our value and quality orientations. The gaps between portfolio and benchmark valuation metrics have actually widened over the past year. Weighted average levels for portfolio and benchmark valuation metrics (since portfolio inception) can be found in the following table:
| Valuation Metric | Global Fund Portfolio | ACWI |
| EV/EBITDA, TTM | 7.37x | 15.89x |
| Price to Book | 1.47x | 2.75x |
| Price to Earnings, TTM | 17.62x | 31.53x |
| Price to Cash Flow, TTM | 5.75x | 13.14x |
| Price to Sales | 0.63x | 2.05x |
| Debt to Equity | 50.42% | 151.24% |
| Dividend Yield | 4.05% | 1.87% |
| Valuation Metric | International Fund Portfolio | ACWI ex-US |
| EV/EBITDA, TTM | 9.53x | 13.06x |
| Price to Book | 1.62x | 1.86x |
| Price to Earnings, TTM | 23.49x | 33.58x |
| Price to Cash Flow, TTM | 9.03x | 10.27x |
| Price to Sales | 0.90x | 1.48x |
| Debt to Equity | 84.75% | 166.40% |
| Dividend Yield | 3.27% | 2.31% |
13
Disclosures:
Investing in each of the Funds carries certain risks. Adverse changes in currency exchange rates may erode or reverse any potential gains from each of the Fund’s investments. The risk of investing in emerging market securities, primarily increased foreign investment risk. Investments in foreign securities could subject the Funds to greater risks including currency fluctuation, economic conditions, and different governmental and accounting standards. There is a risk that issuers and counterparties will not make payments on securities and other investments held by the Funds, resulting in losses to the Funds. Investments in lesser-known, small and medium capitalization companies may be more vulnerable than larger, more established organizations. There can be a higher portfolio turnover due to active and frequent trading that may result in higher transactional and brokerage costs. The Adviser from time to time employs various hedging techniques. The success of each of the Fund’s hedging strategy will be subject to the Adviser’s ability to correctly assess the degree of correlation between the performance of the instruments used in the hedging strategy and the performance of the investments in the portfolio being hedged. The risk on a short sale is the risk of loss if the value of a security sold short increases prior to the delivery date, since the Funds must pay more for the security than it received from the purchaser in the short sale. Therefore, the risk of loss may be unlimited.
Investors should carefully consider the investment objectives, risks, charges and expenses of the Funds. This and other information about each Fund is contained in the prospectus and should be read carefully before investing. The prospectus for the funds can be obtained by calling toll free 1- 844-GO-RAILX or www.conductorfunds.com. The Funds are distributed by Northern Lights Distributors, LLC., Member FINRA/SIPC IronHorse Capital Management and Northern Lights Distributors, LLC are not affiliated.
14
Definitions:
ETF: The Funds invest in exchange traded funds (ETFs) and performance is subject to underlying investment weightings which will vary. ETFs are subject to expenses, which will be indirectly paid by the Funds. The cost of investing in a Fund that invests in ETFs will generally be higher than the cost of investing in a Fund that invests directly in individual stocks and bonds.
Asset allocation is an investment strategy that aims to balance risk and reward by apportioning a portfolio’s assets according to an individual’s goals, risk tolerance, and investment horizon. The three main asset classes - equities, fixed-income, and cash and equivalents - have different levels of risk and return, so each will behave differently over time.
MSCI World Index: The MSCI World Index is a free float-adjusted market capitalization weighted index that is designed to measure the equity market performance of developed markets. The MSCI World Index consists of the following 23 developed market country indexes: Australia, Austria, Belgium, Canada, Denmark, Finland, France, Germany, Hong Kong, Ireland, Israel, Italy, Japan, Netherlands, New Zealand, Norway, Portugal, Singapore, Spain, Sweden, Switzerland, the United Kingdom, and the United States.
The MSCI ACWI Index is a free float-adjusted market capitalization weighted index that is designed to measure the equity market performance of developed and emerging markets. The MSCI ACWI consists of 46 country indexes comprising 23 developed and 23 emerging market country indexes. The developed market country indexes included are: Australia, Austria, Belgium, Canada, Denmark, Finland, France, Germany, Hong Kong, Ireland, Israel, Italy, Japan, Netherlands, New Zealand, Norway, Portugal, Singapore, Spain, Sweden, Switzerland, the United Kingdom and the United States. The emerging market country indexes included are: Brazil, Chile, China, Colombia, Czech Republic, Egypt, Greece, Hungary, India, Indonesia, Korea, Malaysia, Mexico, Peru, Philippines, Poland, Qatar, Russia, South Africa, Taiwan, Thailand, Turkey and United Arab Emirates.
S&P 500 Index: The S&P 500 Index is a broad-based unmanaged index of 500 stocks, which is widely recognized as representative of the equity market in general.
MSCI Emerging Markets Index: The MSCI Emerging Markets Index is a free float- adjusted market capitalization index that is designed to measure equity market performance of emerging markets. The MSCI Emerging Markets Index consists of the following 21 emerging market country indexes: Brazil, Chile, China, Colombia, Czech Republic, Egypt, Greece, Hungary, India, Indonesia, Korea, Malaysia, Mexico, Peru, Philippines, Poland, Russia, South Africa, Taiwan, Thailand, and Turkey.
15
MSCI Europe Index: The MSCI Europe Index is a free float-adjusted market capitalization weighted index that is designed to measure the equity market performance of the developed markets in Europe. The MSCI Europe Index consists of the following 15 developed market country indexes: Austria, Belgium, Denmark, Finland, France, Germany, Ireland, Italy, the Netherlands, Norway, Portugal, Spain, Sweden, Switzerland, and the United Kingdom.
MSCI Index Variants
The MSCI Global Standard Indexes include large and mid-cap segments and provide exhaustive coverage of these size segments. The indexes target a coverage range of around 85% of the free float-adjusted market capitalization in each market. The Large Cap Indexes target a coverage range of around 70% of the free float-adjusted market capitalization in each market and the Mid Cap Indexes target a coverage range of around 15% of the free float-adjusted market capitalization in each market.
The MSCI Global Small Cap Indexes provide an exhaustive representation of the small cap size segment. The indexes target companies that are in the Investable Market Index (IMI) but that are not in the Standard Index in each market.
The MSCI Global Value and Growth Indexes cover the full range of MSCI Developed, Emerging and All Country Indexes across large, mid and small cap size segmentations. They are also cover large and mid-cap size segments for the MSCI Frontier Markets Indexes. The indexes are constructed using an approach that provides a precise definition of style using eight historical and forward-looking fundamental data points for every security. Each security is placed into either the Value or Growth Indexes or may be partially allocated to both (with no double counting). The objective of this index design is to divide constituents of an underlying MSCI Equity Index into respective value and growth indexes, each targeting 50% of the free float adjusted market capitalization of the underlying market index.
TOPIX: An index that measures stock prices on the Tokyo Stock Exchange (TSE). This capitalization-weighted index lists all firms that are considered to be under the ‘first section’ on the TSE, which groups all of the large firms on the exchange into one pool. The second section groups all of the remaining smaller firms.
EV/EBITDA: A ratio used to determine the value of a company. The enterprise multiple looks at a firm as a potential acquirer would, because it takes debt into account - an item which other multiples like the P/E ratio do not include.
Price to Book: A ratio used to compare a stock’s market value to its book value. It is calculated by dividing the current closing price of the stock by the latest quarter’s book value per share.
16
P/E trailing 12 month: The sum of a company’s price-to-earnings, calculated by taking the current stock price and dividing it by the trailing earnings per share for the past 12 months. This measure differs from forward P/E, which uses earnings estimates for the next four quarters.
Altman Z-score: The output of a credit-strength test that gauges a publicly traded manufacturing company’s likelihood of bankruptcy. The Altman Z-score, is based on five financial ratios that can be calculated from data found on a company’s annual 10K report. The Altman Z-score is calculated as follows:
Z-Score = 1.2A + 1.4B + 3.3C + 0.6D + 1.0E
Where:
A = Working Capital/Total Assets
B = Retained Earnings/Total Assets
C = Earnings Before Interest & Tax/Total Assets
D = Market Value of Equity/Total Liabilities
E = Sales/Total Assets
A score below 1.8 means the company is probably headed for bankruptcy, while companies with scores above 3.0 are not likely to go bankrupt. The lower/higher the score, the lower/higher the likelihood of bankruptcy.
The views in this report are those of the Funds’ management. This report contains certain forward-looking statements about factors that may affect the performance of the Funds in the future. These statements are based on the Funds’ management’s predictions and expectations concerning certain future events such as the performance of the economy as a whole and of specific industry sectors. Management believes these forward-looking statements are reasonable, although they are inherently uncertain and difficult to predict.
6275-NLD-12/21/2020
17
| Conductor Global Equity Value Fund |
| Portfolio Review (Unaudited) |
| October 31, 2020 |
The Fund’s performance figures* for the periods ended October 31, 2020, compared to its benchmark:
| Annualized | |||||||
| Since | |||||||
| Commencement | |||||||
| of Operations | Since Inception | Since Inception | Since Inception | ||||
| One Year | Three Years | Five Years | 12/27/2013 (a) | 4/15/2014 | 9/17/2015 | 4/19/16 | |
| Class A with Load (b) | (19.92)% | (7.62)% | 1.23% | N/A | 1.64% | N/A | N/A |
| Class A | (15.05)% | (5.77)% | 2.43% | N/A | 2.56% | N/A | N/A |
| Class C | (15.70)% | (6.49)% | 1.67% | N/A | N/A | 2.14% | N/A |
| Class I | (14.82)% | (5.55)% | 2.68% | 2.29% | N/A | N/A | N/A |
| Class Y | (14.27)% | (4.99)% | N/A | N/A | N/A | N/A | 3.42% |
| MSCI All Country World Value Index (c) | (12.21)% | (2.44)% | 2.92% | 2.14% | 2.04% | 3.54% | 3.11% |
| * | The performance data quoted here represents past performance. Current performance may be lower or higher than the performance data quoted above. Investment return and principal value will fluctuate, so that shares, when redeemed, may be worth more or less than their original cost. The returns shown do not reflect the deduction of taxes that a shareholder would pay on Fund distributions or on the redemptions of Fund shares. Past performance is no guarantee of future results. Ironhorse Capital, LLC (the “Advisor”) has contractually agreed to reduce the Fund’s fees and/or absorb expenses of the Fund until at least March 1, 2021 to ensure that total annual Fund operating expenses (exclusive of any front-end or contingent deferred loads; brokerage fees and commissions; expenses of other investment companies in which the Fund may invest (“acquired fund fees and expenses”); borrowing costs, such as interest and dividend expense on securities sold short; taxes; and extraordinary expenses, such as litigation expenses) do not exceed 2.15%, 2.90%, 1.90% and 1.25% of average daily net assets attributable to Class A, Class C, Class I and Class Y shares, respectively. This agreement may be terminated by the Fund’s Board of Trustees on 60 days’ written notice to the Advisor. These fee waivers and expense reimbursements are subject to possible recoupment from the Fund in future years on a rolling three year basis (within the three years of when the amount was waived or reimbursed) if such recoupment can be achieved within the foregoing expense limits as well as any expense limitation that was in effect at the time the waiver or reimbursement was made. Class A Shares are subject to a maximum sales charge of 5.75% imposed on purchases. Per the fee table in the Fund’s February 28, 2020 prospectus, the Fund’s total annual operating expense ratio before expense waivers, if any, is 2.06%, 2.81%, 1.82%, and 1.77% for Class A, Class C, Class I, and Class Y shares, respectively. For performance information current to the most recent month-end, please call toll-free 1-844-GO-RAILX. |
| (a) | The inception date of Class I is December 26, 2013. Class I commenced operations on December 27, 2013. |
| (b) | Class A with load total return is calculated using the maximum sales charge of 5.75% |
| (c) | The MSCI All Country World Value Index captures large and mid-cap securities exhibiting overall value style characteristics across 23 developed markets countries and 24 emerging markets countries. The value investment style characteristics for index construction are defined using three variables: book value to price, 12-month forward earnings to price and dividend yield. Investors cannot invest directly in an index or benchmark. Index returns are gross of any fees, brokerage commissions or other expense of investing. |
Comparison of the Change in Value of a $100,000 Investment ^
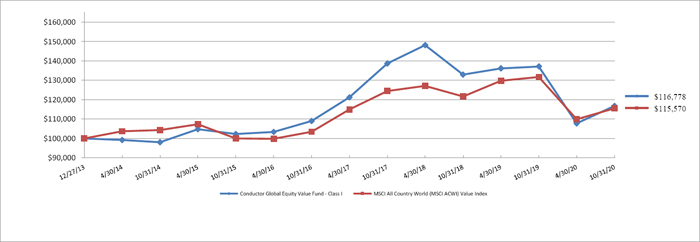
| ^ | Performance shown is for Class I shares. The performance of the Fund’s other classes may be greater or less than the line shown due to differences in loads and fees paid by shareholders in different share classes. |
| Portfolio Composition as of October 31, 2020 | ||||
| Holdings by Industry/Asset Class | % of Net Assets | |||
| Short-Term Investments | 32.6 | % | ||
| Retail - Discretionary | 10.1 | % | ||
| Technology Hardware | 9.4 | % | ||
| Automotive | 6.7 | % | ||
| Chemicals | 6.6 | % | ||
| Steel | 6.1 | % | ||
| Metals & Mining | 4.9 | % | ||
| Technology Services | 3.8 | % | ||
| Gas & Water Utilities | 3.6 | % | ||
| Other** | 17.9 | % | ||
| Other Assets and Liabilities - Net | (1.7 | )% | ||
| 100.0 | % | |||
| ** | Other represents less than 2.0% weightings in the following industries: Asset Management, Commercial Support Services, Containers & Packaging, Electrical Equipment, Entertainment Content, Health Care Facilities & Services, Home Construction, Household Products, Machinery, Oil & Gas Producers, Retail - Consumer Staples, Semiconductors and Specialty Finance. |
Please refer to the Portfolio of Investments in this annual report for a detailed analysis of the Fund’s holdings.
18
| Conductor International Equity Value Fund |
| Portfolio Review (Unaudited) |
| October 31, 2020 |
The Fund’s performance figures* for the period ended October 31, 2020, compared to its benchmark:
| Since | |
| Commencement of | |
| Operations (a) | |
| Class A with Load (b) | (20.03)% |
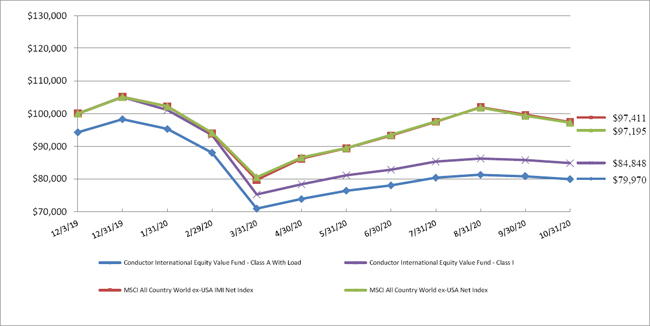
| Class A | (15.15)% |
| Class I | (15.15)% |
| MSCI All Country World ex-USA IMI Net Index (c) | (2.59)% |
| MSCI All Country World ex-USA Net Index (d) | (2.80)% |
| * | The performance data quoted here represents past performance. Current performance may be lower or higher than the performance data quoted above. Investment return and principal value will fluctuate, so that shares, when redeemed, may be worth more or less than their original cost. The returns shown do not reflect the deduction of taxes that a shareholder would pay on Fund distributions or on the redemptions of Fund shares. Past performance is no guarantee of future results. The Advisor has contractually agreed to reduce the Fund’s fees and/or absorb expenses of the Fund until at least March 1, 2021 to ensure that total annual Fund operating expenses after expense waiver and reimbursement (exclusive of any front-end or contingent deferred loads; brokerage fees and commissions; expenses of other investment companies in which the Fund may invest (“acquired fund fees and expenses”); borrowing costs, such as interest and dividend expense on securities sold short; taxes; and extraordinary expenses, such as litigation expenses) do not exceed 1.45% and 1.20% of average daily net assets attributable to Class A and Class I shares, respectively. This agreement may be terminated by the Fund’s Board of Trustees on 60 days’ written notice to the Advisor. These fee waivers and expense reimbursements are subject to possible recoupment from the Fund in future years on a rolling three year basis (within the three years of when the amount was waived or reimbursed) if such recoupment can be achieved within the foregoing expense limits as well as any expense limitation that was in effect at the time the waiver or reimbursement was made. Class A Shares are subject to a maximum sales charge of 5.75% imposed on purchases. Per the fee table in the Fund’s February 28, 2020 prospectus, the Fund’s total annual operating expense ratio before expense waivers, if any, is 2.41% and 2.16% for Class A and Class I shares, respectively. For performance information current to the most recent month-end, please call toll-free 1-844-GO-RAILX. |
| (a) | The inception date of Class A and Class I is December 3, 2019. Class A and Class I commenced operations on December 5, 2019. |
| (b) | Class A with load total return is calculated using the maximum sales charge of 5.75% |
| (c) | The MSCI All Country World ex-USA IMI Net Index captures large, mid and small cap representation across 22 of 23 Developed Markets (DM) countries (excluding the United States) and 26 Emerging Markets (EM) countries. You cannot invest directly in an index. Index returns are gross of any fees, brokerage commissions or other expense of investing. |
| (d) | The MSCI All Country World ex-USA Net Index is a market-capitalization-weighted index maintained by Morgan Stanley Capital International (MSCI). It is designed to provide a broad measure of stock performance throughout the world, with the exception of U.S.-based companies. The MSCI ACWI Ex-U.S. includes both developed and emerging markets. You cannot invest directly in an index. Index returns are gross of any fees, brokerage commissions or other expense of investing. |
Comparison of the Change in Value of a $100,000 Investment
| Portfolio Composition as of October 31, 2020 | ||||
| Holdings by Industry/Asset Class | % of Net Assets | |||
| Short-Term Investment | 27.2 | % | ||
| Equity Funds | 26.9 | % | ||
| Technology Hardware | 8.7 | % | ||
| Chemicals | 5.8 | % | ||
| Metals & Mining | 3.8 | % | ||
| Technology Services | 3.5 | % | ||
| Gas & Water Utilities | 3.3 | % | ||
| Steel | 3.0 | % | ||
| Automotive | 3.0 | % | ||
| Other ** | 12.6 | % | ||
| Other Assets and Liabilities - Net | 2.2 | % | ||
| 100.0 | % | |||
| ** | Other represents less than 2.2% weightings in the following industries: Containers & Packaging, Entertainment Content, Health Care Facilities & Services, Home Construction, Oil & Gas Producers, Retail - Discretionary, Specialty Finance, Transportation & Logistics and Transportation Equipment. |
Please refer to the Portfolio of Investments in this annual report for a detailed analysis of the Fund’s holdings.
19
| Conductor Global Equity Value Fund |
| PORTFOLIO OF INVESTMENTS |
| October 31, 2020 |
| Shares | Value | |||||||
| COMMON STOCKS - 65.2% | ||||||||
| ASSET MANAGEMENT - 1.0% | ||||||||
| 34,690 | Waddell & Reed Financial, Inc. ^ | $ | 532,492 | |||||
| AUTOMOTIVE - 6.7% | ||||||||
| 14,235 | BorgWarner, Inc. | 497,940 | ||||||
| 4,835 | Continental A.G. | 513,724 | ||||||
| 19,730 | Cooper Tire & Rubber Company | 678,515 | ||||||
| 19,200 | FCC Company Ltd. | 368,437 | ||||||
| 15,650 | Linamar Corporation | 511,565 | ||||||
| 19,500 | Stanley Electric Company Ltd. | 555,356 | ||||||
| 18,700 | TS Tech Company Ltd. | 517,593 | ||||||
| 3,643,130 | ||||||||
| CHEMICALS - 6.6% | ||||||||
| 11,780 | Covestro A.G. | 562,213 | ||||||
| 35,500 | Lintec Corporation | 786,958 | ||||||
| 15,100 | LOTTE Fine Chemical Company Ltd. | 648,580 | ||||||
| 14,100 | Nitto Denko Corporation | 990,607 | ||||||
| 49,000 | Zeon Corporation | 596,155 | ||||||
| 3,584,513 | ||||||||
| COMMERCIAL SUPPORT SERVICES - 2.0% | ||||||||
| 32,020 | Kelly Services, Inc. | 556,508 | ||||||
| 10,930 | Randstad N.V. * | 545,369 | ||||||
| 1,101,877 | ||||||||
| CONTAINERS & PACKAGING - 1.0% | ||||||||
| 47,965 | Transcontinental, Inc. ^ | 568,106 | ||||||
| ELECTRICAL EQUIPMENT- 1.0% | ||||||||
| 15,600 | Tokyo Seimitsu Company Ltd. | 526,367 | ||||||
| ENTERTAINMENT CONTENT - 1.8% | ||||||||
| 25,800 | GungHo Online Entertainment, Inc. | 641,056 | ||||||
| 317,000 | IGG, Inc. | 343,149 | ||||||
| 984,205 | ||||||||
| HEALTH CARE FACILITIES & SERVICES - 1.4% | ||||||||
| 30,000 | H.U. Group Holdings, Inc. | 763,269 | ||||||
| HOME CONSTRUCTION - 1.5% | ||||||||
| 66,300 | Haseko Corporation | 794,880 | ||||||
| HOUSEHOLD PRODUCTS - 1.3% | ||||||||
| 14,340 | Nu Skin Enterprises, Inc. | 707,679 | ||||||
The accompanying notes are an integral part of these financial statements.
20
| Conductor Global Equity Value Fund |
| PORTFOLIO OF INVESTMENTS (Continued) |
| October 31, 2020 |
| Shares | Value | |||||||
| MACHINERY - 2.0% | ||||||||
| 21,235 | Doosan Bobcat, Inc. | $ | 542,646 | |||||
| 11,200 | OKUMA Corporation | 543,624 | ||||||
| 1,086,270 | ||||||||
| METALS & MINING - 4.9% | ||||||||
| 175,940 | Fortescue Metals Group Ltd. | 2,152,361 | ||||||
| 32,430 | Warrior Met Coal, Inc. | 486,450 | ||||||
| 2,638,811 | ||||||||
| OIL & GAS PRODUCERS - 1.0% | ||||||||
| 60,800 | ITOCHU ENEX Company Ltd. | 571,965 | ||||||
| RETAIL - CONSUMER STAPLES - 1.1% | ||||||||
| 27,000 | Arcs Company Ltd. | 597,713 | ||||||
| RETAIL - DISCRETIONARY - 9.8% | ||||||||
| 45,850 | Bed Bath & Beyond, Inc. ^ | 907,830 | ||||||
| 26,615 | Buckle, Inc. (The) | 637,695 | ||||||
| 12,155 | Dillard’s, Inc. | 543,693 | ||||||
| 55,300 | EDION Corporation | 544,693 | ||||||
| 14,920 | Foot Locker, Inc. | 550,250 | ||||||
| 769,600 | Matahari Department Store Tbk P.T. * | 51,919 | ||||||
| 57,980 | Qurate Retail, Inc. | 392,525 | ||||||
| 6,500 | Shimamura Company Ltd. | 692,970 | ||||||
| 44,240 | Takkt A.G. * | 470,131 | ||||||
| 24,327 | Urban Outfitters, Inc. * | 543,465 | ||||||
| 5,335,171 | ||||||||
| SEMICONDUCTORS - 1.0% | ||||||||
| 15,100 | Ulvac, Inc. | 553,104 | ||||||
| SPECIALTY FINANCE - 1.8% | ||||||||
| 108,720 | Resurs Holding A.B. | 497,019 | ||||||
| 19,882 | Synchrony Financial | 497,448 | ||||||
| 994,467 | ||||||||
| STEEL - 6.1% | ||||||||
| 18,960 | APERAM S.A. | 508,824 | ||||||
| 57,660 | BlueScope Steel Ltd. | 595,552 | ||||||
| 21,000 | Maruichi Steel Tube Ltd. | 481,773 | ||||||
| 259,400 | Novolipetsk Steel PJSC | 607,328 | ||||||
| 11,675 | Nucor Corporation | 557,597 | ||||||
| 42,200 | Russel Metals, Inc. ^ | 561,590 | ||||||
| 3,312,664 | ||||||||
| TECHNOLOGY HARDWARE - 9.4% | ||||||||
| 315,000 | FLEXium Interconnect, Inc. | 1,286,096 | ||||||
| 40,000 | Inaba Denki Sangyo Company Ltd. | 962,938 | ||||||
| 14,400 | Mabuchi Motor Company Ltd. | 593,694 | ||||||
| 466,000 | Pegatron Corporation | 1,004,243 | ||||||
| 24,000 | Taiyo Holdings Company Ltd. | 1,256,465 | ||||||
| 5,103,436 | ||||||||
The accompanying notes are an integral part of these financial statements.
21
| Conductor Global Equity Value Fund |
| PORTFOLIO OF INVESTMENTS (Continued) |
| October 31, 2020 |
| Shares | Value | |||||||
| TECHNOLOGY SERVICES - 3.8% | ||||||||
| 120,000 | NEC Networks & System Integration Corporation | $ | 2,080,848 | |||||
| TOTAL COMMON STOCKS (Cost - $31,062,414) | 35,480,967 | |||||||
| PREFERRED STOCK - 3.9% | ||||||||
| GAS & WATER UTILITIES - 3.6% | ||||||||
| 63,058 | Cia de Gas de Sao Paulo | 1,956,266 | ||||||
| RETAIL - DISCRETIONARY - 0.3% | ||||||||
| 1,739 | Qurate Retail, Inc. * | 170,109 | ||||||
| 2,126,375 | ||||||||
| TOTAL PREFERRED STOCK - (Cost - $1,116,380) | ||||||||
| SHORT-TERM INVESTMENTS - 32.6% | ||||||||
| INVESTMENT PURCHASED AS SECURITIES LENDING COLLATERAL - 2.5% | ||||||||
| 1,377,465 | Dreyfus Cash Management Fund - Institutional Class, 0.10% + (a) | 1,377,465 | ||||||
| MONEY MARKET FUND - 30.1% | ||||||||
| 16,371,400 | Dreyfus Cash Management Fund - Institutional Class, 0.10% + | 16,389,410 | ||||||
| TOTAL SHORT-TERM INVESTMENTS (Cost - $17,751,693) | 17,766,875 | |||||||
| TOTAL INVESTMENTS - 101.7% (Cost - $49,930,487) | $ | 55,374,217 | ||||||
| OTHER ASSETS AND LIABILITIES - NET - (1.7)% | (941,341 | ) | ||||||
| TOTAL NET ASSETS - 100.0% | $ | 54,432,876 | ||||||
| * | Non-income producing security. |
| ^ | All or a portion of the security is on loan. Total loaned securities had a value of $1,839,359 at October 31, 2020. |
| + | Money market fund; interest rate reflects seven day effective yield on October 31, 2020. |
| (a) | Security was purchased with cash received as collateral for securities on loan as of October 31, 2020. Total collateral had a value of $1,377,465 at October 31, 2020. Additional collateral received from the borrower not disclosed in the Portfolio of Investments had a value of $554,737 as of October 31, 2020. |
| Portfolio Composition as of October 31, 2020 | ||||
| Holdings by Country | % of Market Value | |||
| United States | 47.0 | % | ||
| Japan | 27.8 | % | ||
| Australia | 5.0 | % | ||
| Taiwan | 4.1 | % | ||
| Brazil | 3.3 | % | ||
| Canada | 3.0 | % | ||
| Germany | 2.8 | % | ||
| Korea | 2.2 | % | ||
| Netherlands | 1.0 | % | ||
| Russia | 1.1 | % | ||
| Other** | 2.7 | % | ||
| 100.0 | % | |||
| ** | Other represents less than 1.0% weightings in each of the following countries: Belgium, Hong Kong, Indonesia and Sweden. |
The accompanying notes are an integral part of these financial statements.
22
| Conductor International Equity Value Fund |
| PORTFOLIO OF INVESTMENTS |
| October 31, 2020 |
| Shares | Value | |||||||
| COMMON STOCKS - 40.4% | ||||||||
| AUTOMOTIVE - 3.0% | ||||||||
| 235 | Continental A.G. | $ | 24,973 | |||||
| 618 | Faurecia SE* | 23,442 | ||||||
| 1,400 | FCC Company Ltd. | 26,905 | ||||||
| 75,320 | ||||||||
| CHEMICALS - 5.8% | ||||||||
| 562 | Covestro A.G. | 26,827 | ||||||
| 846 | Johnson Matthey PLC | 23,505 | ||||||
| 700 | LOTTE Fine Chemical Company Ltd. | 30,067 | ||||||
| 600 | Nitto Denko Corporation | 42,216 | ||||||
| 16,800 | Petronas Chemicals Group Bhd | 23,671 | ||||||
| 146,286 | ||||||||
| CONTAINERS & PACKAGING - 1.0% | ||||||||
| 2,235 | Transcontinental, Inc. | 26,451 | ||||||
| ENTERTAINMENT CONTENT - 2.2% | ||||||||
| 5,200 | Gree, Inc. | 27,156 | ||||||
| 1,200 | GungHo Online Entertainment, Inc. | 29,861 | ||||||
| 57,017 | ||||||||
| HEALTH CARE FACILITIES & SERVICES - 1.2% | ||||||||
| 1,200 | H.U. Group Holdings, Inc. | 30,576 | ||||||
| HOME CONSTRUCTION - 1.4% | ||||||||
| 2,900 | Haseko Corporation | 34,820 | ||||||
| METALS & MINING - 3.8% | ||||||||
| 7,887 | Fortescue Metals Group Ltd. | 96,396 | ||||||
| OIL & GAS PRODUCERS - 0.8% | ||||||||
| 18,026 | Viva Energy Group Ltd. | 21,304 | ||||||
| RETAIL - DISCRETIONARY - 2.2% | ||||||||
| 25,700 | Matahari Department Store Tbk P.T. * | 1,734 | ||||||
| 300 | Shimamura Company Ltd. | 32,031 | ||||||
| 2,040 | Takkt A.G. * | 21,682 | ||||||
| 55,447 | ||||||||
| SPECIALTY FINANCE - 0.9% | ||||||||
| 5,130 | Resurs Holding A.B. | 23,445 | ||||||
The accompanying notes are an integral part of these financial statements.
23
| Conductor International Equity Value Fund |
| PORTFOLIO OF INVESTMENTS (Continued) |
| October 31, 2020 |
| Shares | Value | |||||||
| STEEL - 3.0% | ||||||||
| 2,830 | BlueScope Steel Ltd. | $ | 29,203 | |||||
| 1,000 | Maruichi Steel Tube Ltd. | 22,976 | ||||||
| 1,800 | Russel Metals, Inc. | 23,935 | ||||||
| 76,114 | ||||||||
| TECHNOLOGY HARDWARE - 8.7% | ||||||||
| 14,000 | FLEXium Interconnect, Inc. | 57,160 | ||||||
| 1,700 | Inaba Denki Sangyo Company Ltd. | 40,986 | ||||||
| 700 | Mabuchi Motor Company Ltd. | 28,903 | ||||||
| 20,000 | Pegatron Corporation | 43,100 | ||||||
| 1,000 | Taiyo Holdings Company Ltd. | 52,430 | ||||||
| 222,579 | ||||||||
| TECHNOLOGY SERVICES - 3.5% | ||||||||
| 5,100 | NEC Networks & System Integration Corporation | 88,567 | ||||||
| TRASPORTATION & LOGISTICS - 2.1% | ||||||||
| 227 | Hyundai Glovis Co. Ltd. | 33,736 | ||||||
| 1,910 | Westshore Terminals Investment Corp. | 19,181 | ||||||
| 52,917 | ||||||||
| TRASPORTATION EQUIPMENT - 0.8% | ||||||||
| 6,900 | Zhuzhou CRRC Times Electric Co. Ltd. | 21,242 | ||||||
| TOTAL COMMON STOCKS (Cost - $946,729) | 1,028,481 | |||||||
| PREFERRED STOCK - 3.3% | ||||||||
| GAS & WATER UTILITIES - 3.3% | ||||||||
| 2,700 | Cia de Gas de Sao Paulo | |||||||
| TOTAL PREFERRED STOCK - (Cost - $78,464) | 83,355 | |||||||
| EXCHANGE TRADED FUNDS - 26.9% | ||||||||
| EQUITY FUNDS - 26.9% | ||||||||
| 11,096 | Vanguard FTSE Developed Markets ETF | 437,737 | ||||||
| 5,667 | Vanguard FTSE Emerging Markets ETF | 248,271 | ||||||
| TOTAL EXCHANGE TRADED FUNDS - (Cost - $717,081) | 686,008 | |||||||
| SHORT-TERM INVESTMENT - 27.2% | ||||||||
| MONEY MARKET FUND - 27.2% | ||||||||
| 691,361 | Dreyfus Cash Management Fund - Institutional Class, 0.10% + | 692,122 | ||||||
| TOTAL SHORT-TERM INVESTMENTS (Cost - $691,575) | ||||||||
| TOTAL INVESTMENTS - 97.8% (Cost - $2,433,849) | $ | 2,489,966 | ||||||
| OTHER ASSETS AND LIABILITIES - NET - 2.2% | 56,092 | |||||||
| TOTAL NET ASSETS - 100.0% | $ | 2,546,058 | ||||||
| + | Money market fund; interest rate reflects seven day effective yield on October 31, 2020. |
| * | Non-income producing security. |
The accompanying notes are an integral part of these financial statements.
24
| Conductor International Equity Value Fund |
| PORTFOLIO OF INVESTMENTS (Continued) |
| October 31, 2020 |
| Portfolio Composition as of October 31, 2020 | ||||
| Holdings by Country | % of Market Value | |||
| United States | 27.8 | % | ||
| International ETF | 27.6 | % | ||
| Japan | 18.4 | % | ||
| Australia | 5.9 | % | ||
| Taiwan | 4.0 | % | ||
| Brazil | 3.5 | % | ||
| Germany | 3.0 | % | ||
| Canada | 2.8 | % | ||
| Korea | 2.6 | % | ||
| Other** | 4.4 | % | ||
| 100.0 | % | |||
| ** | Other represents less than 1.0% weightings in each of the following countries: France, Hong Kong, Indonesia, United Kingdom and |
The accompanying notes are an integral part of these financial statements.
25
| Conductor Funds |
| Statements of Assets and Liabilities |
| October 31, 2020 |
| Conductor Global Equity | Conductor International | |||||||
| Value Fund | Equity Value Fund | |||||||
| ASSETS | ||||||||
| Securities, at cost | $ | 49,930,487 | $ | 2,433,849 | ||||
| Securities, at fair value | $ | 55,374,217 | $ | 2,489,966 | ||||
| Foreign currency (cost: $13,641 and $0) | 13,111 | — | ||||||
| Receivable for securities sold | 2,265,288 | 22,839 | ||||||
| Dividends and interest receivable | 276,387 | 6,487 | ||||||
| Receivable due from advisor | — | 34,547 | ||||||
| Prepaid expenses and other assets | 39,337 | 12,249 | ||||||
| TOTAL ASSETS | 57,968,340 | 2,566,088 | ||||||
| LIABILITIES | ||||||||
| Collateral on securities loaned (see note 8) | 1,377,465 | — | ||||||
| Payable for investments purchased | 2,027,700 | — | ||||||
| Payable for fund shares redeemed | 40,831 | — | ||||||
| Audit and tax fees payable | 17,687 | 16,893 | ||||||
| Investment advisory fees payable | 47,006 | — | ||||||
| Payable to related parties | 14,209 | 2,162 | ||||||
| Distribution (12b-1) fees payable | 730 | — | ||||||
| Accrued expenses and other liabilities | 9,836 | 975 | ||||||
| TOTAL LIABILITIES | 3,535,464 | 20,030 | ||||||
| NET ASSETS | $ | 54,432,876 | $ | 2,546,058 | ||||
| NET ASSETS CONSIST OF: | ||||||||
| Paid in capital | $ | 62,043,594 | $ | 3,044,323 | ||||
| Accumulated deficit | (7,610,718 | ) | (498,265 | ) | ||||
| NET ASSETS | $ | 54,432,876 | $ | 2,546,058 | ||||
The accompanying notes are an integral part of these financial statements.
26
| Conductor Funds |
| Statements of Assets and Liabilities (Continued) |
| October 31, 2020 |
| Conductor Global Equity | Conductor International | |||||||
| Value Fund | Equity Value Fund | |||||||
| NET ASSET VALUE PER SHARE: | ||||||||
| Class A Shares: | ||||||||
| Net Assets | $ | 971,406 | $ | 8 | ||||
| Shares of beneficial interest outstanding [$0 par value, unlimited shares authorized] | 96,721 | 1 | ||||||
| Net asset value (Net Assets ÷ Shares Outstanding) and redemption price per share (a) | $ | 10.04 | $ | 8.33 | (b) | |||
| Maximum offering price per share (maximum sales charge of 5.75%) | $ | 10.65 | $ | 8.84 | (b) | |||
| Class C Shares: | ||||||||
| Net Assets | $ | 589,757 | ||||||
| Shares of beneficial interest outstanding [$0 par value, unlimited shares authorized] | 59,473 | |||||||
| Net asset value (Net Assets ÷ Shares Outstanding), offering price and redemption price per share (a) | $ | 9.92 | ||||||
| Class I Shares: | ||||||||
| Net Assets | $ | 39,583,780 | $ | 2,546,050 | ||||
| Shares of beneficial interest outstanding [$0 par value, unlimited shares authorized] | 3,921,792 | 305,574 | ||||||
| Net asset value (Net Assets ÷ Shares Outstanding), offering price and redemption price per share (a) | $ | 10.09 | $ | 8.33 | ||||
| Class Y Shares: | ||||||||
| Net Assets | $ | 13,287,933 | ||||||
| Shares of beneficial interest outstanding [$0 par value, unlimited shares authorized] | 1,280,712 | |||||||
| Net asset value (Net Assets ÷ Shares Outstanding), offering price and redemption price per share (a) | $ | 10.38 | ||||||
| (a) | Redemptions made within 30 days of purchase may be assessed a redemption fee of 1.00%. |
| (b) | NAV/offering price may not recalculate due to rounding of shares. |
The accompanying notes are an integral part of these financial statements.
27
| Conductor Funds |
| Statements of Operations |
| For the Year or Period Ended October 31, 2020 |
| Conductor Global Equity | Conductor International | |||||||
| Value Fund | Equity Value Fund (a) | |||||||
| INVESTMENT INCOME | ||||||||
| Dividend Income (Foreign Taxes Withheld: $160,695 and $7,740) | $ | 2,001,453 | $ | 78,254 | ||||
| Interest Income | 53,341 | 2,351 | ||||||
| Securities Lending Income (net of fees) | 25,456 | — | ||||||
| TOTAL INVESTMENT INCOME | 2,080,250 | 80,605 | ||||||
| EXPENSES | ||||||||
| Investment advisory fees | 793,947 | 27,550 | ||||||
| Distribution (12b-1) fees: | ||||||||
| Class A | 3,473 | — | ||||||
| Class C | 8,650 | — | ||||||
| Administrative services fees | 40,365 | 30,237 | ||||||
| Registration fees | 77,392 | 1,326 | ||||||
| Third party administrative services fees | 72,245 | 1,262 | ||||||
| Custodian fees | 10,634 | 6,736 | ||||||
| Transfer agent fees | 70,340 | 10,076 | ||||||
| Audit fees | 46,747 | 17,393 | ||||||
| Accounting services fees | 29,113 | 14,752 | ||||||
| Legal fees | 42,971 | 27,492 | ||||||
| Printing and postage expenses | 22,632 | 2,238 | ||||||
| Compliance officer fees | 38,017 | 5,886 | ||||||
| Trustees fees and expenses | 17,012 | 7,643 | ||||||
| Insurance expense | 19,491 | 207 | ||||||
| Tax expense | 13,232 | — | ||||||
| Other expenses | 13,827 | 1,891 | ||||||
| TOTAL EXPENSES | 1,320,088 | 154,689 | ||||||
| Less: Fees waived/reimbursed by the Advisor | (202,291 | ) | (125,955 | ) | ||||
| NET EXPENSES | 1,117,797 | 28,734 | ||||||
| NET INVESTMENT INCOME | 962,453 | 51,871 | ||||||
| REALIZED AND UNREALIZED GAIN/(LOSS) | ||||||||
| Net realized loss from: | ||||||||
| Investments | (6,743,188 | ) | (547,781 | ) | ||||
| Foreign currency translations | (212,603 | ) | (14,173 | ) | ||||
| Realized loss from investments and foreign currency transactions | (6,955,791 | ) | (561,954 | ) | ||||
| Net change in unrealized appreciation/(depreciation) of: | ||||||||
| Investments | (4,919,434 | ) | 56,117 | |||||
| Foreign currency translations | 3,981 | 29 | ||||||
| Unrealized appreciation/(depreciation) on investments and foreign currency translations | (4,915,453 | ) | 56,146 | |||||
| NET REALIZED AND UNREALIZED LOSS ON INVESTMENTS | (11,871,244 | ) | (505,808 | ) | ||||
| NET DECREASE IN NET ASSETS RESULTING FROM OPERATIONS | $ | (10,908,791 | ) | $ | (453,937 | ) | ||
| (a) | The Conductor International Equity Value Fund commenced investment operations on December 5, 2019. |
The accompanying notes are an integral part of these financial statements.
28
| Conductor Global Equity Value Fund |
| Statements of Changes in Net Assets |
| For the Year Ended | For the Year Ended | |||||||
| October 31, | October 31, | |||||||
| 2020 | 2019 | |||||||
| FROM OPERATIONS | ||||||||
| Net investment income | $ | 962,453 | $ | 1,704,955 | ||||
| Net realized loss from investments and foreign currency translations | (6,955,791 | ) | (6,073,661 | ) | ||||
| Net change in unrealized appreciation/(depreciation) of investments and foreign currency translations | (4,915,453 | ) | 6,649,109 | |||||
| Net increase/(decrease) in net assets resulting from operations | (10,908,791 | ) | 2,280,403 | |||||
| DISTRIBUTIONS TO SHAREHOLDERS | ||||||||
| Total Distributions Paid: | ||||||||
| Class A | (16,310 | ) | (297,412 | ) | ||||
| Class C | (2,817 | ) | (152,054 | ) | ||||
| Class I | (640,074 | ) | (5,408,051 | ) | ||||
| Class Y | (222,123 | ) | (3,719,978 | ) | ||||
| From Return of Capital | (117,449 | ) | — | |||||
| Net decrease in net assets resulting from distributions to shareholders | (998,773 | ) | (9,577,495 | ) | ||||
| FROM SHARES OF BENEFICIAL INTEREST | ||||||||
| Proceeds from shares sold: | ||||||||
| Class A | — | 200,620 | ||||||
| Class C | — | 164,334 | ||||||
| Class I | 364,985 | 657,483 | ||||||
| Class Y | 2,250,854 | 9,889,360 | ||||||
| Net asset value of shares issued in reinvestment of distributions: | ||||||||
| Class A | 17,446 | 276,374 | ||||||
| Class C | 4,242 | 150,021 | ||||||
| Class I | 639,841 | 4,755,569 | ||||||
| Class Y | 245,715 | 3,546,864 | ||||||
| Redemption fee proceeds: | ||||||||
| Class C | 103 | — | ||||||
| Class Y | 64 | — | ||||||
| Payments for shares redeemed: | ||||||||
| Class A | (847,207 | ) | (1,177,857 | ) | ||||
| Class C | (588,431 | ) | (441,850 | ) | ||||
| Class I | (5,447,321 | ) | (1,792,702 | ) | ||||
| Class Y | (13,699,477 | ) | (27,103,774 | ) | ||||
| Net decrease in net assets from shares of beneficial interest | (17,059,186 | ) | (10,875,558 | ) | ||||
| TOTAL DECREASE IN NET ASSETS | (28,966,750 | ) | (18,172,650 | ) | ||||
| NET ASSETS | ||||||||
| Beginning of Year | 83,399,626 | 101,572,276 | ||||||
| End of Year | $ | 54,432,876 | $ | 83,399,626 | ||||
The accompanying notes are an integral part of these financial statements.
29
| Conductor Global Equity Value Fund |
| Statements of Changes in Net Assets (Continued) |
| For the Year Ended | For the Year Ended | |||||||
| October 31, | October 31, | |||||||
| 2020 | 2019 | |||||||
| SHARE ACTIVITY | ||||||||
| Class A: | ||||||||
| Shares Sold | — | 17,137 | ||||||
| Shares Reinvested | 1,735 | 24,379 | ||||||
| Shares Redeemed | (78,890 | ) | (103,344 | ) | ||||
| Net decrease in shares of beneficial interest outstanding | (77,155 | ) | (61,828 | ) | ||||
| Class C: | ||||||||
| Shares Sold | — | 13,799 | ||||||
| Shares Reinvested | 435 | 13,408 | ||||||
| Shares Redeemed | (55,921 | ) | (39,127 | ) | ||||
| Net decrease in shares of beneficial interest outstanding | (55,486 | ) | (11,920 | ) | ||||
| Class I: | ||||||||
| Shares Sold | 29,727 | 55,991 | ||||||
| Shares Reinvested | 63,106 | 415,838 | ||||||
| Shares Redeemed | (490,802 | ) | (153,832 | ) | ||||
| Net increase/(decrease) in shares of beneficial interest outstanding | (397,969 | ) | 317,997 | |||||
| Class Y: | ||||||||
| Shares Sold | 213,723 | 851,414 | ||||||
| Shares Reinvested | 23,317 | 305,523 | ||||||
| Shares Redeemed | (1,213,859 | ) | (2,250,127 | ) | ||||
| Net decrease in shares of beneficial interest outstanding | (976,819 | ) | (1,093,190 | ) | ||||
The accompanying notes are an integral part of these financial statements.
30
| Conductor International Equity Value Fund |
| Statement of Changes in Net Assets |
| For the Period* Ended | ||||
| October 31, | ||||
| 2020 | ||||
| FROM OPERATIONS | ||||
| Net investment income | $ | 51,871 | ||
| Net realized loss from investments and foreign currency translations | (561,954 | ) | ||
| Net change in unrealized appreciation of investments and foreign currency translations | 56,146 | |||
| Net decrease in net assets resulting from operations | (453,937 | ) | ||
| DISTRIBUTIONS TO SHAREHOLDERS | ||||
| Total Distributions Paid: | ||||
| Class A | — | (a) | ||
| Class I | (44,328 | ) | ||
| From Return of Capital | (7,847 | ) | ||
| Net decrease in net assets resulting from distributions to shareholders | (52,175 | ) | ||
| FROM SHARES OF BENEFICIAL INTEREST | ||||
| Proceeds from shares sold: | ||||
| Class A | 10 | |||
| Class I | 2,999,985 | |||
| Net asset value of shares issued in reinvestment of distributions: | ||||
| Class A | — | (a) | ||
| Class I | 52,175 | |||
| Net increase in net assets from shares of beneficial interest | 3,052,170 | |||
| TOTAL INCREASE IN NET ASSETS | 2,546,058 | |||
| NET ASSETS | ||||
| Beginning of Year | — | |||
| End of Year | $ | 2,546,058 | ||
| SHARE ACTIVITY | ||||
| Class A: | ||||
| Shares Sold | 1 | |||
| Shares Reinvested | — | (b) | ||
| Net increase in shares of beneficial interest outstanding | 1 | |||
| Class I: | ||||
| Shares Sold | 299,998 | |||
| Shares Reinvested | 5,576 | |||
| Net increase in shares of beneficial interest outstanding | 305,574 | |||
| * | The Conductor International Equity Value Fund commenced investment operations on December 5, 2019. |
| (a) | Represents less than $1. |
| (b) | Represents less than 1 share. |
The accompanying notes are an integral part of these financial statements.
31
| Conductor Global Equity Value Fund |
| Financial Highlights |
| Per Share Data and Ratios for a Share of Beneficial Interest Outstanding Throughout each Year |
| Class A Shares* | ||||||||||||||||||||
| Year Ended | Year Ended | Year Ended | Year Ended | Year Ended | ||||||||||||||||
| October 31, | October 31, | October 31, | October 31, | October 31, | ||||||||||||||||
| 2020 | 2019 | 2018 | 2017 | 2016 | ||||||||||||||||
| Net asset value, beginning of year | $ | 12.01 | $ | 13.00 | $ | 13.75 | $ | 10.84 | $ | 10.20 | ||||||||||
| Activity from investment operations: | ||||||||||||||||||||
| Net investment income/(loss) (1) | 0.12 | 0.19 | 0.05 | 0.01 | (0.03 | ) | ||||||||||||||
| Net realized and unrealized gain/(loss) on investments | (1.94 | ) | 0.10 | (0.63 | ) | 2.90 | 0.67 | |||||||||||||
| Total from investment operations | (1.82 | ) | 0.29 | (0.58 | ) | 2.91 | 0.64 | |||||||||||||
| Less distributions from: | ||||||||||||||||||||
| Net investment income | (0.13 | ) | (0.18 | ) | (0.15 | ) | — | — | ||||||||||||
| Net return of capital | (0.02 | ) | — | — | — | — | ||||||||||||||
| Net realized gains | — | (1.10 | ) | (0.02 | ) | — | — | |||||||||||||
| Total distributions | (0.15 | ) | (1.28 | ) | (0.17 | ) | — | — | ||||||||||||
| Paid-in-Capital From Redemption Fees | — | — | 0.00 | (6) | — | — | ||||||||||||||
| Net asset value, end of year | $ | 10.04 | $ | 12.01 | $ | 13.00 | $ | 13.75 | $ | 10.84 | ||||||||||
| Total return (2) | (15.05 | )% | 2.94 | % | (4.33 | )% | 26.85 | % | 6.27 | % | ||||||||||
| Net assets, end of year (000’s) | $ | 971 | $ | 2,088 | $ | 3,065 | $ | 3,624 | $ | 1,887 | ||||||||||
| Ratio of gross expenses to average net assets (3)(4) | 2.30 | % (8) | 1.94 | % | 1.81 | % | 1.95 | % | 2.37 | % | ||||||||||
| Ratio of net expenses to average net assets (4) | 2.17 | % (8) | 1.94 | % | 2.11 | % (7) | 2.15 | % (7) | 2.14 | % | ||||||||||
| Ratio of net investment income/(loss) to average net assets (4)(5) | 1.08 | % | 1.59 | % | 0.36 | % | 0.06 | % | (0.33 | )% | ||||||||||
| Portfolio Turnover Rate | 91 | % | 108 | % | 141 | % | 90 | % | 123 | % | ||||||||||
| * | The Conductor Global Equity Value Fund Class A commenced investment operations on April 15, 2014. |
| (1) | Per share amounts calculated using the average shares method, which more appropriately presents the per share data for the period. |
| (2) | Total returns are historical and assume changes in share price and reinvestment of dividends and distributions. Total returns for periods less than one year are not annualized. Total returns shown exclude the effect of the maximum applicable sales charges of 5.75% and, if applicable, wire redemption fees. Had the Advisor not waived its fees, the returns would have been lower. |
| (3) | Represents the ratio of expenses to average net assets absent fee waivers by the Advisor. |
| (4) | The ratios of expenses and net investment income/(loss) to average net assets do not reflect the Fund’s proportionate share of income and expenses of underlying investment companies in which the Fund invests. |
| (5) | Recognition of net investment income/(loss) by the Fund is affected by the timing of the declaration of the dividends by the underlying investment companies in which the Fund invests. |
| (6) | Amount represents less than $0.005. |
| (7) | Represents the ratio of expenses to average net assets inclusive of the Advisor’s recapture of waived/reimbursed fees from prior periods. |
| (8) | Includes tax expense. If these expenses were excluded, the ratio of gross expenses to average net assets would be 2.28% and the ratio of net expenses to average net assets would be 2.15%. |
The accompanying notes are an integral part of these financial statements.
32
| Conductor Global Equity Value Fund |
| Financial Highlights |
| Per Share Data and Ratios for a Share of Beneficial Interest Outstanding Throughout each Year |
| Class C Shares* | ||||||||||||||||||||
| Year Ended | Year Ended | Year Ended | Year Ended | Year Ended | ||||||||||||||||
| October 31, | October 31, | October 31, | October 31, | October 31, | ||||||||||||||||
| 2020 | 2019 | 2018 | 2017 | 2016 | ||||||||||||||||
| Net asset value, beginning of year | $ | 11.84 | $ | 12.82 | $ | 13.55 | $ | 10.76 | $ | 10.20 | ||||||||||
| Activity from investment operations: | ||||||||||||||||||||
| Net investment income/(loss) (1) | 0.04 | 0.10 | (0.06 | ) | (0.09 | ) | (0.11 | ) | ||||||||||||
| Net realized and unrealized gain/(loss) on investments | (1.90 | ) | 0.10 | (0.61 | ) | 2.88 | 0.67 | |||||||||||||
| Total from investment operations | (1.86 | ) | 0.20 | (0.67 | ) | 2.79 | 0.56 | |||||||||||||
| Less distributions from: | ||||||||||||||||||||
| Net investment income | (0.04 | ) | (0.08 | ) | (0.04 | ) | — | — | ||||||||||||
| Net return of capital | (0.02 | ) | — | — | — | — | ||||||||||||||
| Net realized gains | — | (1.10 | ) | (0.02 | ) | — | — | |||||||||||||
| Total distributions | (0.06 | ) | (1.18 | ) | (0.06 | ) | — | — | ||||||||||||
| Paid-in-Capital From Redemption Fees | 0.00 | (7) | — | — | — | — | ||||||||||||||
| Net asset value, end of year | $ | 9.92 | $ | 11.84 | $ | 12.82 | $ | 13.55 | $ | 10.76 | ||||||||||
| Total return (2) | (15.70 | )% | 2.10 | % | (4.99 | )% | 25.93 | % | 5.49 | % | ||||||||||
| Net assets, end of year (000’s) | $ | 590 | $ | 1,361 | $ | 1,626 | $ | 1,333 | $ | 258 | ||||||||||
| Ratio of gross expenses to average net assets (3)(4) | 3.05 | % (8) | 2.69 | % | 2.55 | % | 2.69 | % | 3.11 | % | ||||||||||
| Ratio of net expenses to average net assets (4) | 2.92 | % (8) | 2.69 | % | 2.86 | % (6) | 2.90 | % (6) | 2.88 | % | ||||||||||
| Ratio of net investment income/(loss) to average net assets (4)(5) | 0.40 | % | 0.83 | % | (0.42 | )% | (0.70 | )% | (1.05 | )% | ||||||||||
| Portfolio Turnover Rate | 91 | % | 108 | % | 141 | % | 90 | % | 123 | % | ||||||||||
| * | The Conductor Global Equity Value Fund Class C commenced investment operations on September 17, 2015. |
| (1) | Per share amounts calculated using the average shares method, which more appropriately presents the per share data for the period. |
| (2) | Total returns are historical and assume changes in share price and reinvestment of dividends and distributions. Total returns for periods of less than one year are not annualized. Total returns shown exclude the effect of sales charges and, if applicable, wire redemption fees. Had the Advisor not waived its fees, the returns would have been lower. |
| (3) | Represents the ratio of expenses to average net assets absent fee waivers by the Advisor. |
| (4) | The ratios of expenses and net investment income/(loss) to average net assets do not reflect the Fund’s proportionate share of income and expenses of underlying investment companies in which the Fund invests. |
| (5) | Recognition of net investment income/(loss) by the Fund is affected by the timing of the declaration of the dividends by the underlying investment companies in which the Fund invests. |
| (6) | Represents the ratio of expenses to average net assets inclusive of the Advisor’s recapture of waived/reimbursed fees from prior periods. |
| (7) | Amount represents less than $0.005. |
| (8) | Includes tax expense. If these expenses were excluded, the ratio of gross expenses to average net assets would be 3.03% and the ratio of net expenses to average net assets would be 2.90%. |
The accompanying notes are an integral part of these financial statements.
33
| Conductor Global Equity Value Fund |
| Financial Highlights |
| Per Share Data and Ratios for a Share of Beneficial Interest Outstanding Throughout each Year |
| Class I Shares* | ||||||||||||||||||||
| Year Ended | Year Ended | Year Ended | Year Ended | Year Ended | ||||||||||||||||
| October 31, | October 31, | October 31, | October 31, | October 31, | ||||||||||||||||
| 2020 | 2019 | 2018 | 2017 | 2016 | ||||||||||||||||
| Net asset value, beginning of year | $ | 12.07 | $ | 13.09 | $ | 13.86 | $ | 10.90 | $ | 10.23 | ||||||||||
| Activity from investment operations: | ||||||||||||||||||||
| Net investment income/(loss) (1) | 0.14 | 0.22 | 0.09 | 0.03 | (0.01 | ) | ||||||||||||||
| Net realized and unrealized gain/(loss) on investments | (1.94 | ) | 0.10 | (0.64 | ) | 2.93 | 0.68 | |||||||||||||
| Total from investment operations | (1.80 | ) | 0.32 | (0.55 | ) | 2.96 | 0.67 | |||||||||||||
| Less distributions from: | ||||||||||||||||||||
| Net investment income | (0.16 | ) | (0.24 | ) | (0.20 | ) | — | — | ||||||||||||
| Net return of capital | (0.02 | ) | — | — | — | — | ||||||||||||||
| Net realized gains | — | (1.10 | ) | (0.02 | ) | — | — | |||||||||||||
| Total distributions | (0.18 | ) | (1.34 | ) | (0.22 | ) | — | — | ||||||||||||
| Net asset value, end of year | $ | 10.09 | $ | 12.07 | $ | 13.09 | $ | 13.86 | $ | 10.90 | ||||||||||
| Total return (2) | (14.82 | )% | 3.14 | % | (4.09 | )% | 27.16 | % | 6.55 | % | ||||||||||
| Net assets, end of year (000’s) | $ | 39,584 | $ | 52,142 | $ | 52,383 | $ | 55,185 | $ | 45,923 | ||||||||||
| Ratio of gross expenses to average net assets (3)(4) | 2.07 | % | 1.70 | % | 1.55 | % | 1.71 | % | 2.11 | % | ||||||||||
| Ratio of net expenses to average net assets (4) | 1.92 | % | 1.70 | % | 1.86 | % (6) | 1.90 | % (6) | 1.87 | % | ||||||||||
| Ratio of net investment income/(loss) to average net assets (4)(5) | 1.33 | % | 1.83 | % | 0.62 | % | 0.28 | % | (0.06 | )% | ||||||||||
| Portfolio Turnover Rate | 91 | % | 108 | % | 141 | % | 90 | % | 123 | % | ||||||||||
| * | The Conductor Global Equity Value Fund Class I commenced investment operations on December 27, 2013. |
| (1) | Per share amounts calculated using the average shares method, which more appropriately presents the per share data for the period. |
| (2) | Total returns shown are historical in nature and assume changes in share price, reinvestment of dividends and capital gain distributions, if any. Total returns for periods of less than one year are not annualized. Had the Advisor not waived its fees, the returns would have been lower. |
| (3) | Represents the ratio of expenses to average net assets absent fee waivers by the Advisor. |
| (4) | The ratios of expenses and net investment income/(loss) to average net assets do not reflect the Fund’s proportionate share of income and expenses of underlying investment companies in which the Fund invests. |
| (5) | Recognition of net investment income/(loss) by the Fund is affected by the timing of the declaration of the dividends by the underlying investment companies in which the Fund invests. |
| (6) | Represents the ratio of expenses to average net assets inclusive of the Advisor’s recapture of waived/reimbursed fees from prior periods. |
| (7) | Includes tax expense. If these expenses were excluded, the ratio of gross expenses to average net assets would be 2.05% and the ratio of net expenses to average net assets would be 1.90%. |
The accompanying notes are an integral part of these financial statements.
34
| Conductor Global Equity Value Fund |
| Financial Highlights |
| Per Share Data and Ratios for a Share of Beneficial Interest Outstanding Throughout each Year |
| Class Y Shares | ||||||||||||||||||||
| Year Ended | Year Ended | Year Ended | Year Ended | Period Ended | ||||||||||||||||
| October 31, | October 31, | October 31, | October 31, | October 31, | ||||||||||||||||
| 2020 | 2019 | 2018 | 2017 | 2016 (1) | ||||||||||||||||
| Net asset value, beginning of year | $ | 12.32 | $ | 13.28 | $ | 13.97 | $ | 10.91 | $ | 10.28 | ||||||||||
| Activity from investment operations: | ||||||||||||||||||||
| Net investment income (2) | 0.23 | 0.27 | 0.19 | 0.12 | 0.01 | |||||||||||||||
| Net realized and unrealized gain/(loss) on investments | (1.99 | ) | 0.11 | (0.66 | ) | 2.94 | 0.62 | |||||||||||||
| Total from investment operations | (1.76 | ) | 0.38 | (0.47 | ) | 3.06 | 0.63 | |||||||||||||
| Less distributions from: | ||||||||||||||||||||
| Net investment income | (0.16 | ) | (0.24 | ) | (0.20 | ) | — | — | ||||||||||||
| Net return of capital | (0.02 | ) | — | — | — | — | ||||||||||||||
| Net realized gains | — | (1.10 | ) | (0.02 | ) | — | — | |||||||||||||
| Total distributions | (0.18 | ) | (1.34 | ) | (0.22 | ) | — | — | ||||||||||||
| Paid-in-Capital From Redemption Fees | 0.00 | (9) | — | 0.00 | (9) | — | — | |||||||||||||
| Net asset value, end of year | $ | 10.38 | $ | 12.32 | $ | 13.28 | $ | 13.97 | $ | 10.91 | ||||||||||
| Total return (3) | (14.27 | )% | 3.59 | % | (3.48 | )% | 28.05 | % | 6.13 | % | ||||||||||
| Net assets, end of year (000’s) | $ | 13,288 | $ | 27,808 | $ | 44,498 | $ | 19,242 | $ | 845 | ||||||||||
| Ratio of gross expenses to average net assets (5)(7) | 2.04 | % (10) | 1.65 | % | 1.55 | % | 1.68 | % | 2.04 | % (6) | ||||||||||
| Ratio of net expenses to average net assets (7) | 1.27 | % (10) | 1.25 | % | 1.25 | % | 1.25 | % | 1.39 | % (6) | ||||||||||
| Ratio of net investment income to average net assets (7)(8) | 2.08 | % | 2.23 | % | 1.27 | % | 0.93 | % | 0.24 | % (6) | ||||||||||
| Portfolio Turnover Rate | 91 | % | 108 | % | 141 | % | 90 | % | 123 | % (4) | ||||||||||
| (1) | The Conductor Global Equity Value Fund Class Y commenced investment operations on April 19, 2016. |
| (2) | Per share amounts calculated using the average shares method, which more appropriately presents the per share data for the period. |
| (3) | Total returns shown are historical in nature and assume changes in share price, reinvestment of dividends and capital gain distributions, if any. Total returns for periods of less than one year are not annualized. Had the Advisor not waived its fees, the returns would have been lower. |
| (4) | Not annualized. |
| (5) | Represents the ratio of expenses to average net assets absent fee waivers by the Advisor. |
| (6) | Annualized. |
| (7) | The ratios of expenses and net investment income/(loss) to average net assets do not reflect the Fund’s proportionate share of income and expenses of underlying investment companies in which the Fund invests. |
| (8) | Recognition of net investment income/(loss) by the Fund is affected by the timing of the declaration of the dividends by the underlying investment companies in which the Fund invests. |
| (9) | Amount represents less than $0.005. |
| (10) | Includes tax expense. If these expenses were excluded, the ratio of gross expenses to average net assets would be 2.02% and the ratio of net expenses to average net assets would be 1.25%. |
The accompanying notes are an integral part of these financial statements.
35
| Conductor International Equity Value Fund |
| Financial Highlights |
| Per Share Data and Ratios for a Share of Beneficial Interest Outstanding Throughout the Period |
| Class A Shares | ||||
| Period* Ended | ||||
| October 31, | ||||
| 2020 | ||||
| Net asset value, beginning of period | $ | 10.00 | ||
| Activity from investment operations: | ||||
| Net investment income (1) | 0.17 | |||
| Net realized and unrealized loss on investments | (1.67 | ) | ||
| Total from investment operations | (1.50 | ) | ||
| Less distributions from: | ||||
| Net investment income | (0.14 | ) | ||
| Net return of capital | (0.03 | ) | ||
| Total distributions | (0.17 | ) | ||
| Net asset value, end of period | $ | 8.33 | ||
| Total return (2) | (15.15 | )% | ||
| Net assets, end of period (8) | $ | 8 | ||
| Ratio of gross expenses to average net assets (3)(4)(6) | 6.71 | % | ||
| Ratio of net expenses to average net assets (4)(6) | 1.45 | % | ||
| Ratio of net investment income to average net assets (4)(5)(6) | 1.92 | % | ||
| Portfolio Turnover Rate (7) | 84 | % | ||
| * | The Conductor International Equity Value Fund Class A commenced investment operations on December 5, 2019. |
| (1) | Per share amounts calculated using the average shares method, which more appropriately presents the per share data for the period. |
| (2) | Total returns are historical and assume changes in share price and reinvestment of dividends and distributions. Total returns for periods less than one year are not annualized. Total returns shown exclude the effect of the maximum applicable sales charges of 5.75% and, if applicable, wire redemption fees. Had the Advisor not waived its fees, the returns would have been lower. |
| (3) | Represents the ratio of expenses to average net assets absent fee waivers and reimbursements by the Advisor. |
| (4) | The ratios of expenses and net investment income/(loss) to average net assets do not reflect the Fund’s proportionate share of income and expenses of underlying investment companies in which the Fund invests. |
| (5) | Recognition of net investment income/(loss) by the Fund is affected by the timing of the declaration of the dividends by the underlying investment companies in which the Fund invests. |
| (6) | Annualized. |
| (7) | Not annualized. |
| (8) | Represents actual net assets. |
The accompanying notes are an integral part of these financial statements.
36
| Conductor International Equity Value Fund |
| Financial Highlights |
| Per Share Data and Ratios for a Share of Beneficial Interest Outstanding Throughout the Period |
| Class I Shares | ||||
| Period* Ended | ||||
| October 31, | ||||
| 2020 | ||||
| Net asset value, beginning of period | $ | 10.00 | ||
| Activity from investment operations: | ||||
| Net investment income (1) | 0.17 | |||
| Net realized and unrealized loss on investments | (1.67 | ) | ||
| Total from investment operations | (1.50 | ) | ||
| Less distributions from: | ||||
| Net investment income | (0.14 | ) | ||
| Net return of capital | (0.03 | ) | ||
| Total distributions | (0.17 | ) | ||
| Net asset value, end of period | $ | 8.33 | ||
| Total return (2) | (15.15 | )% | ||
| Net assets, end of period (000’s) | $ | 2,546 | ||
| Ratio of gross expenses to average net assets (3)(4)(6) | 6.46 | % | ||
| Ratio of net expenses to average net assets (4)(6) | 1.20 | % | ||
| Ratio of net investment income to average net assets (4)(5)(6) | 2.17 | % | ||
| Portfolio Turnover Rate (7) | 84 | % | ||
| * | The Conductor International Equity Value Fund Class I commenced investment operations on December 5, 2019. |
| (1) | Per share amounts calculated using the average shares method, which more appropriately presents the per share data for the period. |
| (2) | Total returns shown are historical in nature and assume changes in share price, reinvestment of dividends and capital gain distributions, if any. Total returns for periods of less than one year are not annualized. Had the Advisor not waived its fees, the returns would have been lower. |
| (3) | Represents the ratio of expenses to average net assets absent fee waivers and reimbursements by the Advisor. |
| (4) | The ratios of expenses and net investment income/(loss) to average net assets do not reflect the Fund’s proportionate share of income and expenses of underlying investment companies in which the Fund invests. |
| (5) | Recognition of net investment income/(loss) by the Fund is affected by the timing of the declaration of the dividends by the underlying investment companies in which the Fund invests. |
| (6) | Annualized. |
| (7) | Not annualized. |
The accompanying notes are an integral part of these financial statements.
37
| Conductor Funds |
| NOTES TO FINANCIAL STATEMENTS |
| October 31, 2020 |
| 1. | ORGANIZATION |
The Conductor Global Equity Value Fund (the “Global Fund”) and the Conductor International Equity Value Fund (the “International Fund”), each a “Fund” or collectively the “Funds,” are each a series of shares of beneficial interest of the Two Roads Shared Trust (the “Trust”), a statutory trust organized under the laws of the State of Delaware on June 8, 2012, and are registered under the Investment Company Act of 1940, as amended (the “1940 Act”), as diversified, open-end management investment companies. The Global Fund offers Class A, Class C, Class I, and Class Y shares. The International Fund offers Class A and Class I shares. The Funds inception dates and investment objectives are as follows:
| Fund | Inception Date | Investment Objective | ||
| Global Fund | Class A – April 15, 2014 | To provide long-term risk-adjusted total return. | ||
| Class C – September 17, 2015 | ||||
| Class I – December 26, 2013 | ||||
| Class Y – April 19, 2016 | ||||
| International Fund | December 3, 2019 | To provide long-term risk-adjusted total return. |
Class A shares of each Fund are offered at net asset value (“NAV”) plus a maximum sales charge of 5.75%. Each share class represents an interest in the same assets of a Fund and classes are identical except for differences in their sales charge structures and ongoing service and distribution charges. All classes of shares of each Fund have equal voting privileges with respect to such Fund except that each class has exclusive voting rights with respect to its service and/or distribution plans. Each Fund’s income, expenses (other than class specific distribution fees) and realized and unrealized gains and losses are allocated proportionately each day based upon the relative net assets of such class.
| 2. | SUMMARY OF SIGNIFICANT ACCOUNTING POLICIES |
The following is a summary of significant accounting policies followed by the Funds in preparation of their financial statements. These policies are in conformity with accounting principles generally accepted in the United States of America (“GAAP”). The preparation of the financial statements requires management to make estimates and assumptions that affect the reported amounts of assets and liabilities and disclosure of contingent assets and liabilities at the date of the financial statements and the reported amounts of income and expenses for the period. Actual results could differ from those estimates. The Funds are each an investment company and accordingly follow the investment company accounting and reporting guidance of the Financial Accounting Standards Board (“FASB”) Accounting Standard Codification Topic 946 “Financial Services – Investment Companies” including FASB Accounting Standard Update ASU 2013-08.
Security Valuation – Securities, including exchange traded funds, listed on an exchange are valued at the last reported sale price at the close of the regular trading session of the exchange on the business day the value is being determined, or in the case of securities listed on NASDAQ at the NASDAQ Official Closing Price. In the absence of a sale such securities shall be valued at mean between the last bid and ask prices on the day of valuation. Short-term debt obligations having 60 days or less remaining until maturity, at time of purchase, may be valued at amortized cost. Investments in open-end investment companies are valued at net asset value.
Securities in which the Funds invest may be traded in markets that close before 4:00 p.m. Eastern Time (“ET”). Normally, developments that occur between the close of the foreign markets and 4:00 p.m. ET will not be reflected in a Fund’s NAV. However, a Fund may determine that such developments are so significant that they will materially affect the value of the Fund’s securities, and the Fund may adjust the previous closing prices to reflect what the Board believes to be the fair value of these securities as of 4:00 p.m. ET. The Funds utilize fair value prices as provided by an independent pricing vendor on a daily basis for those securities traded on a foreign exchange.
Valuation of Underlying Funds – The Funds may invest in portfolios of open-end or closed-end investment companies (the “Underlying Funds”). The Underlying Funds value securities in their portfolios for which market quotations are readily available at their market values (generally the last reported sale price) and all other securities and assets at their fair value to the methods established by the board of directors of the Underlying Funds.
38
| Conductor Funds |
| NOTES TO FINANCIAL STATEMENTS (Continued) |
| October 31, 2020 |
Open-end funds are valued at their respective net asset values as reported by such investment companies. The shares of many closed-end investment companies, after their initial public offering, frequently trade at a price per share, which is different than the net asset value per share. The difference represents a market premium or market discount of such shares. There can be no assurances that the market discount or market premium on shares of any closed-end investment company purchased by a Fund will not change.
Exchange Traded Funds – The Funds may invest in exchange traded funds (“ETFs”). ETFs are a type of index fund bought and sold on a securities exchange. An ETF trades like common stock and represents a fixed portfolio of securities designed to track the performance and dividend yield of a particular domestic or foreign market index. The Funds may purchase an ETF to temporarily gain exposure to a portion of the U.S. or a foreign market. The risks of owning an ETF generally reflect the risks of owning the underlying securities they are designed to track, although the lack of liquidity on an ETF could result in it being more volatile. Additionally, ETFs have fees and expenses that reduce their value.
The Funds may hold securities, such as private investments, interests in commodity pools, other non-traded securities or temporarily illiquid securities, for which market quotations are not readily available or are determined to be unreliable. These securities will be valued using the “fair value” procedures approved by the Board. The Board has delegated execution of these procedures to a fair value committee composed of one or more representatives from each of the (i) Trust, (ii) administrator, and (iii) advisor. The committee may also enlist third party consultants such a valuation specialist at a public accounting firm, valuation consultant or financial officer of a security issuer on an as-needed basis to assist in determining a security-specific fair value. The Board has also engaged a third party valuation firm to, as needed, attend valuation meetings held by the Trust, review minutes of such meetings and report to the Board on a quarterly basis. The Board reviews and ratifies the execution of this process and the resultant fair value prices at least quarterly to assure the process produces reliable results.
Fair Valuation Process – The applicable investments are valued collectively via inputs from each group within the fair value committee. For example, fair value determinations are required for the following securities: (i) securities for which market quotations are insufficient or not readily available on a particular business day (including securities for which there is a short and temporary lapse in the provision of a price by the regular pricing source); (ii) securities for which, in the judgment of the advisor, the prices or values available do not represent the fair value of the instrument; factors which may cause the advisor to make such a judgment include, but are not limited to, the following: only a bid price or an asked price is available; the spread between bid and asked prices is substantial; the frequency of sales; the thinness of the market; the size of reported trades; and actions of the securities markets, such as the suspension or limitation of trading; (iii) securities determined to be illiquid; and (iv) securities with respect to which an event that will affect the value thereof has occurred (a “significant event”) since the closing prices were established on the principal exchange on which they are traded, but prior to a Fund’s calculation of its net asset value. Specifically, interests in commodity pools or managed futures pools are valued on a daily basis by reference to the closing market prices of each futures contract or other asset held by a pool, as adjusted for pool expenses. Restricted or illiquid securities, such as private investments or non-traded securities are valued via inputs from the advisor based upon the current bid for the security from two or more independent dealers or other parties reasonably familiar with the facts and circumstances of the security (who should take into consideration all relevant factors as may be appropriate under the circumstances). If the advisor is unable to obtain a current bid from such independent dealers or other independent parties, the fair value committee shall determine the fair value of such security using the following factors: (i) the type of security; (ii) the cost at date of purchase; (iii) the size and nature of the Fund’s holdings; (iv) the discount from market value of unrestricted securities of the same class at the time of purchase and subsequent thereto; (v) information as to any transactions or offers with respect to the security; (vi) the nature and duration of restrictions on disposition of the security and the existence of any registration rights; (vii) how the yield of the security compares to similar securities of companies of similar or equal creditworthiness; (viii) the level of recent trades of similar or comparable securities; (ix) the liquidity characteristics of the security; (x) current market conditions; and (xi) the market value of any securities into which the security is convertible or exchangeable.
39
| Conductor Funds |
| NOTES TO FINANCIAL STATEMENTS (Continued) |
| October 31, 2020 |
The Funds utilize various methods to measure the fair value of all of their investments on a recurring basis. GAAP establishes a hierarchy that prioritizes inputs to valuation methods. The three levels of input are:
Level 1 – Unadjusted quoted prices in active markets for identical assets and liabilities that a Fund has the ability to access.
Level 2 – Observable inputs other than quoted prices included in Level 1 that are observable for the asset or liability, either directly or indirectly. These inputs may include quoted prices for the identical instrument on an inactive market, prices for similar instruments, interest rates, prepayment speeds, credit risk, yield curves, default rates and similar data.
Level 3 – Unobservable inputs for the asset or liability, to the extent relevant observable inputs are not available, representing a Fund’s own assumptions about the assumptions a market participant would use in valuing the asset or liability, and would be based on the best information available.
The availability of observable inputs can vary from security to security and is affected by a wide variety of factors, including, for example, the type of security, whether the security is new and not yet established in the marketplace, the liquidity of markets, and other characteristics particular to the security. To the extent that valuation is based on models or inputs that are less observable or unobservable in the market, the determination of fair value requires more judgment. Accordingly, the degree of judgment exercised in determining fair value is greatest for instruments categorized in Level 3.
The inputs used to measure fair value may fall into different levels of the fair value hierarchy. In such cases, for disclosure purposes, the level in the fair value hierarchy within which the fair value measurement falls in its entirety, is determined based on the lowest level input that is significant to the fair value measurement in its entirety.
The inputs or methodology used for valuing securities are not necessarily an indication of the risk associated with investing in those securities. The following table summarizes the inputs used as of October 31, 2020 for each Fund’s investments measured at fair value:
| Global Fund | ||||||||||||||||
| Assets * | Level 1 | Level 2 | Level 3 | Total | ||||||||||||
| Common Stocks | $ | 10,338,674 | $ | 25,142,293 | $ | — | $ | 35,480,967 | ||||||||
| Preferred Stocks | 2,126,375 | — | — | 2,126,375 | ||||||||||||
| Short-Term Investments | 17,766,875 | — | — | 17,766,875 | ||||||||||||
| Total Investments | $ | 30,231,924 | $ | 25,142,293 | $ | — | $ | 55,374,217 | ||||||||
| International Fund | ||||||||||||||||
| Assets * | Level 1 | Level 2 | Level 3 | Total | ||||||||||||
| Common Stocks | $ | 69,567 | $ | 958,914 | $ | — | $ | 1,028,481 | ||||||||
| Preferred Stocks | 83,355 | — | — | 83,355 | ||||||||||||
| Exchange Traded Funds | 686,008 | — | — | 686,008 | ||||||||||||
| Short-Term Investment | 692,122 | — | — | 692,122 | ||||||||||||
| Total Investments | $ | 1,531,052 | $ | 958,914 | $ | — | $ | 2,489,966 | ||||||||
| * | Please refer to each Fund’s Portfolio of Investments for industry classifications. |
The Funds did not hold any Level 3 securities during the period.
Certain foreign securities are valued utilizing valuation factors provided by an independent pricing service to reflect any significant market movements between the time foreign markets close and the time the Funds value such foreign securities. The utilization of valuation factors may result in the securities being categorized as Level 2.
40
| Conductor Funds |
| NOTES TO FINANCIAL STATEMENTS (Continued) |
| October 31, 2020 |
Security Transactions and Investment Income – Investment security transactions are accounted for on a trade date basis. Cost is determined and gains and losses are based upon the specific identification method for both financial statement and federal income tax purposes. Dividend income is recorded on the ex-dividend date and interest income is recorded on the accrual basis. Purchase discounts and premiums on securities are accreted and amortized over the life of the respective securities.
Foreign Currency Translations – The accounting records of the Funds are maintained in U.S. dollars. Investment securities and other assets and liabilities denominated in a foreign currency, and income receipts and expense payments are translated into U.S. dollars using the prevailing exchange rate at the London market close. Purchases and sales of securities are translated into U.S. dollars at the contractual currency rates established at the approximate time of the trade.
Net realized gains and losses on foreign currency transactions represent net gains and losses from currency realized between the trade and settlement dates on securities transactions and the difference between income accrued versus income received. The effects of changes in foreign currency exchange rates on investments in securities are included with the net realized and unrealized gain or loss on investments.
Federal Income Taxes – It is each Fund’s policy to qualify as a regulated investment company by complying with the provisions of the Internal Revenue Code that are applicable to regulated investment companies and to distribute substantially all of its taxable income and net realized gains to shareholders. Therefore, no federal income tax provision has been recorded.
Each Fund recognizes the tax benefits of uncertain tax positions only where the position is “more likely than not” to be sustained assuming examination by tax authorities. Management has analyzed each Fund’s tax positions and has concluded that no liability for unrecognized tax benefits should be recorded related to uncertain tax positions taken on the Global Fund’s returns filed for open tax years ended October 31, 2017 to October 31, 2019, or expected to be taken in each Fund’s October 31, 2020 year-end tax returns. Each Fund identifies its major tax jurisdictions as U.S. Federal, Ohio and foreign jurisdictions where the Funds make significant investments; however, the Funds are not aware of any tax positions for which it is reasonably expected that the total amounts of unrecognized tax benefits will change materially in the next twelve months.
Each Fund recognizes interest and penalties, if any, related to unrecognized tax benefits as income tax expense in the Statements of Operations. During the period, the Funds did not incur any interest or penalties. Generally, tax authorities can examine tax returns filed since inception.
Distributions to Shareholders – Distributions from investment income are declared and paid quarterly. Distributions from net realized capital gains, if any, are declared and paid at least annually and are recorded on the ex-dividend date. The character of income and gains to be distributed is determined in accordance with income tax regulations, which may differ from GAAP.
Expenses – Expenses of the Trust that are directly identifiable to a specific fund are charged to that fund. Expenses which are not readily identifiable to a specific fund are allocated in such a manner as deemed equitable, taking into consideration the nature and type of expense and the relative sizes of the funds in the Trust.
Indemnification – The Trust indemnifies its officers and trustees for certain liabilities that may arise from the performance of their duties to the Trust. Additionally, in the normal course of business, the Trust enters into contracts that contain a variety of representations and warranties and which provide general indemnities. Each Fund’s maximum exposure under these arrangements is unknown, as this would involve future claims that may be made against a Fund that has not yet occurred. However, the Funds expect the risk of loss due to these warranties and indemnities to be remote.
41
| Conductor Funds |
| NOTES TO FINANCIAL STATEMENTS (Continued) |
| October 31, 2020 |
| 3. | PRINCIPAL INVESTMENT RISKS |
Each Fund’s investments in securities, financial instruments and derivatives expose it to various risks, certain of which are discussed below. Please refer to the Funds’ prospectus and statement of additional information for a more full listing of risks associated with each Fund’s investments which include but are not limited to active trading risk, credit risk, currency risk, cybersecurity risk, derivatives risk, emerging market risk, equity risk, foreign (non-U.S.) investment risk, gap risk, geographic and sector risk, hedging transactions risk, index risk, investment companies and exchange-traded funds risk, issuer-specific risk, large-cap securities risk, management risk, market risk, market events risk, model risk, new fund risk, portfolio turnover risk, securities lending risk, short selling risk, small-cap and mid-cap securities risk, value investing risk, valuation risk, and volatility risk.
Cash Positions Risk – The Funds may hold a significant position in cash, cash equivalent securities or U.S. Treasury investments. When a Fund’s investment in cash, cash equivalent securities or U.S. Treasury investment increases, the Fund may not participate in market advances or declines to the same extent that it would if the Fund were more fully invested.
Emerging Market Risk – Investing in emerging markets involves not only the risks described herein with respect to investing in foreign securities, but also other risks, including exposure to economic structures that are generally less diverse and mature, and to political systems that can be expected to have less stability than those of developed countries. The typically small size of the markets may also result in a lack of liquidity and in price volatility of these securities. Emerging markets are riskier than more developed markets because they tend to develop unevenly and may never fully develop. Investments in emerging markets may be considered speculative. Emerging markets are more likely to experience hyperinflation and currency devaluations, which adversely affect returns to U.S. investors. In addition, many emerging financial markets have far lower trading volumes and less liquidity than developed markets which may result in increased price volatility of emerging market investments.
Equity Risk – Common stocks are susceptible to general stock market fluctuations and to volatile increases and decreases in value as market confidence in and perceptions of their issuers change. Preferred stocks are subject to the risk that the dividend on the stock may be changed or omitted by the issuer, and that participation in the growth of an issuer may be limited.
Foreign (Non-U.S.) Investments Risk – Foreign (non-U.S.) securities present greater investment risks than investing in the securities of U.S. issuers and may experience more rapid and extreme changes in value than the securities of U.S. companies, due to less information about foreign (non-U.S.) companies in the form of reports and ratings than about U.S. issuers; different accounting, auditing and financial reporting requirements; smaller markets; nationalization; expropriation or confiscatory taxation; currency blockage; or political changes or diplomatic developments. Foreign (non-U.S.) securities may also be less liquid and more difficult to value than securities of U.S. issuers.
Geographic and Sector Risk – The risk that if a Fund invests a significant portion of its total assets in certain issuers within the same geographic region or economic sector, an adverse economic, business or political development affecting that region or sector may affect the value of the Fund’s investments more than if the Fund’s investments were not so focused. While the Fund may not concentrate in any one industry, the Fund may invest without limitation in a particular country or sector.
Investment Companies and ETFs Risk – When a Fund invests in other investment companies, including ETFs, it will bear additional expenses based on its pro rata share of the other investment company’s or ETF’s operating expenses, including the potential duplication of management fees. The risk of owning an ETF generally reflects the risks of owning the underlying investments the ETF holds. A Fund also will incur brokerage costs when it purchases and sells ETFs.
Market Risk – Overall market risk may affect the value of individual instruments in which a Fund invests. A Fund is subject to the risk that the securities markets will move down, sometimes rapidly and unpredictably, based on overall economic conditions and other factors, which may negatively affect the Fund’s performance. Factors such as domestic and foreign (non-U.S.) economic growth and market conditions, real or perceived adverse economic or political conditions, inflation, changes
42
| Conductor Funds |
| NOTES TO FINANCIAL STATEMENTS (Continued) |
| October 31, 2020 |
in interest rate levels, lack of liquidity in the markets, volatility in the securities markets, adverse investor sentiment affect the securities markets and political vents affect the securities markets. Securities markets also may experience long periods of decline in value. When the value of a Fund’s investments goes down, your investment in the Fund decreases in value and you could lose money.
Local, state, regional, national or global events such as war, acts of terrorism, the spread of infectious illness or other public health issues, recessions, or other events could have a significant impact on a Fund and its investments and could result in decreases to the Fund’s net asset value. Political, geopolitical, natural and other events, including war, terrorism, trade disputes, government shutdowns, market closures, natural and environmental disasters, epidemics, pandemics and other public health crises and related events and governments’ reactions to such events have led, and in the future may lead, to economic uncertainty, decreased economic activity, increased market volatility and other disruptive effects on U.S. and global economies and markets. Such events may have significant adverse direct or indirect effects on a Fund and its investments. For example, a widespread health crisis such as a global pandemic could cause substantial market volatility, exchange trading suspensions and closures, impact the ability to complete redemptions, and affect Fund performance. A health crisis may exacerbate other pre-existing political, social and economic risks. In addition, the increasing interconnectedness of markets around the world may result in many markets being affected by events or conditions in a single country or region or events affecting a single or small number of issuers.
An outbreak of infectious respiratory illness caused by a novel coronavirus known as COVID-19 was first detected in China in December 2019 and has now been detected globally. On March 11, 2020, the World Health Organization announced that it had made the assessment that COVID-19 can be characterized as a pandemic. COVID-19 has resulted in travel restrictions, closed international borders, enhanced health screenings at ports of entry and elsewhere, disruption of and delays in healthcare service preparation and delivery, prolonged quarantines, cancellations, business and school closings, supply chain disruptions, and lower consumer demand, as well as general concern and uncertainty. The impact of COVID-19, and other infectious illness outbreaks that may arise in the future, could adversely affect the economies of many nations or the entire global economy, individual issuers and capital markets in ways that cannot necessarily be foreseen. In addition, the impact of infectious illnesses in emerging market countries may be greater due to generally less established healthcare systems. Public health crises caused by the COVID-19 outbreak may exacerbate other pre-existing political, social and economic risks in certain countries or globally. The duration of the COVID-19 outbreak and its effects cannot be determined with certainty. The value of a Fund and the securities in which the Fund invests may be adversely affected by impacts caused by COVID-19 and other epidemics and pandemics that may arise in the future.
Securities Lending Risk – A Fund may lend portfolio securities to institutions, such as banks and certain broker-dealers. The risks associated with lending portfolio securities, as with other extensions of secured credit, include, but are not limited to, possible delays in receiving additional collateral or in the recovery of the securities loaned, possible loss of rights in the collateral should the borrower fail financially, as well as risk of loss in the value of the collateral or the value of the investments made with the collateral. In certain market conditions, the portion of a Fund’s securities on loan may be significant and may magnify the risk of such a loss or delay.
| 4. | INVESTMENT TRANSACTIONS |
The cost of purchases and proceeds from the sale of securities, other than short-term securities, for the period ended October 31, 2020, amounted to:
| Global Fund | International Fund | |||||||
| Purchases | $ | 44,363,379 | $ | 3,931,198 | ||||
| Sales | 71,385,553 | 1,641,109 | ||||||
43
| Conductor Funds |
| NOTES TO FINANCIAL STATEMENTS (Continued) |
| October 31, 2020 |
| 5. | INVESTMENT ADVISORY AGREEMENT AND TRANSACTIONS WITH RELATED PARTIES |
Advisory Fees – IronHorse Capital, LLC serves as the Funds’ Investment Advisor (the “Advisor”). Effective October 1, 2016, under the terms of the Advisory Agreement, the Advisor receives monthly fees calculated at an annual rate of 1.25% of the average daily net assets of the Global Fund. Prior to October 1, 2016, the Advisor received monthly fees calculated at an annual rate of 1.50% of the average daily net assets of the Global Fund. Under the terms of the Advisory Agreement, the Advisor receives monthly fees calculated at an annual rate of 1.15% of the average daily net assets of the International Fund. For the periods ended October 31, 2020, the Global Fund and International Fund incurred advisory fees in the amounts of $793,947 and $27,550, respectively.
The Advisor has contractually agreed to waive all or part of its management fees and/or make payments to limit Fund expenses (exclusive of any front-end loads, taxes, leverage interest, brokerage commissions, expenses incurred in connection with any merger or reorganization, dividend expense on securities sold short, acquired fund fees and expenses, or extraordinary expenses such as litigation) so that the total annual operating expenses do not exceed 2.15%, 2.90%, 1.90%, and 1.25% of the average daily net assets of Class A, Class C, Class I, and Class Y, respectively, for the Global Fund, and 1.45% and 1.20% of the average daily net assets of Class A and Class I, respectively, for the International Fund. This agreement is in effect at least until March 1, 2021. Prior to October 1, 2016, the expense limitation for Class Y was 1.50% of the average daily net assets of Class Y of the Global Fund. For the periods ended October 31, 2020, the Advisor waived $202,291 of its fees for the Global Fund, and $125,955 of its fees for the International Fund.
Prior to February 29, 2016, the Advisor agreed to waive all or a portion of its management fees for the Global Fund so that the total annual operating expenses, or extraordinary expenses, did not exceed 2.18%, 2.93% and 1.93% of average daily net assets for Class A, Class C, and Class I, respectively.
These expense reimbursements are subject to possible recoupment from the Funds in future years on a rolling three-year basis (within three years after the fees have been waived or reimbursed) if such recoupment can be achieved without exceeding the foregoing expense limits as well as any expense limitation that was in effect at the time the reimbursement was made.
The following amounts are subject to recapture by the Funds by the following dates:
| Global Fund – Class Y | International Fund | |||||||
| 10/31/2021 | $ | 115,793 | N/A | |||||
| 10/31/2022 | $ | 130,925 | N/A | |||||
| 10/31/2023 | $ | 202,291 | $ | 125,955 | ||||
As of October 31, 2020, $46,265 of waived fees for Class Y of the Global Fund expired unrecouped.
The Board has adopted a Distribution Plan (the “Plan”) pursuant to Rule 12b-1 under the 1940 Act. The Plan provides that a monthly service and/or distribution fee is calculated by each Fund at an annual rate of 0.25% of its average daily net assets for Class A shares and 1.00% of its average daily net assets for Class C shares and is paid to Northern Lights Distributors, LLC (the “Distributor” or “NLD”) to provide compensation for ongoing shareholder servicing and distribution-related activities or services and/or maintenance of each Fund’s shareholder accounts not otherwise required to be provided by the Advisor. For the period ended October 31, 2020, $3,473 and $8,650 of 12b-1 fees were incurred for Class A shares and Class C shares, respectively, of the Global Fund, and $0 of 12b-1 fees were incurred for Class A shares of the International Fund.
The Distributor acts as the Funds’ principal underwriter in a continuous public offering of each Fund’s Class A, Class C, and Class I shares. For the periods ended October 31, 2020, the Distributor did not receive underwriting commissions for the sales of Class A shares or Class C Shares of the Funds.
44
| Conductor Funds |
| NOTES TO FINANCIAL STATEMENTS (Continued) |
| October 31, 2020 |
In addition, certain affiliates of the Distributor provide services to the Funds as follows:
Gemini Fund Services, LLC (“GFS”), an affiliate of the Distributor, provides administration, fund accounting, and transfer agent services to the Trust. Pursuant to separate servicing agreements with GFS, the Funds each pay GFS customary fees for providing administration, fund accounting and transfer agency services to the Funds. Certain officers of the Trust are also officers of GFS, and are not paid any fees directly by the Funds for serving in such capacities.
Northern Lights Compliance Services, LLC (“NLCS”), an affiliate of GFS and the Distributor, provides a Chief Compliance Officer to the Trust, as well as related compliance services, pursuant to a consulting agreement between NLCS and the Trust. Under the terms of such agreement, NLCS receives customary fees from each Fund.
BluGiant, LLC (“BluGiant”), an affiliate of GFS and the Distributor, provides EDGAR conversion and filing services as well as print management services for the Funds on an ad-hoc basis. For the provision of these services, BluGiant receives customary fees from each Fund.
| 6. | AGGREGATE UNREALIZED APPRECIATION AND DEPRECIATION – TAX BASIS |
The identified cost of investments in securities owned by each Fund for federal income tax purposes, and their respective gross unrealized appreciation and depreciation at October 31, 2020, were as follows:
| Global Fund | International Fund | |||||||
| Cost for Federal Tax purposes | $ | 50,042,177 | $ | 2,440,479 | ||||
| Unrealized Appreciation | $ | 6,390,853 | $ | 145,347 | ||||
| Unrealized Depreciation | (1,058,813 | ) | (95,860 | ) | ||||
| Tax Net Unrealized Appreciation | $ | 5,332,040 | $ | 49,487 | ||||
| 7. | TAX COMPONENTS OF CAPITAL |
The tax character of fund distributions paid for the year ended October 31, 2020 and October 31, 2019 was as follows:
| For the period ended October 31, 2020: | ||||||||||||||||||||
| Tax- | ||||||||||||||||||||
| Ordinary | Long-Term | Return | Exempt | |||||||||||||||||
| Portfolio | Income | Capital Gains | of Capital | Income | Total | |||||||||||||||
| Global Fund | $ | 947,085 | $ | — | $ | 117,449 | $ | — | $ | 1,064,534 | ||||||||||
| International Fund | 44,328 | — | 7,847 | — | 52,175 | |||||||||||||||
| For the period ended October 31, 2019: | ||||||||||||||||||||
| Tax- | ||||||||||||||||||||
| Ordinary | Long-Term | Return | Exempt | |||||||||||||||||
| Portfolio | Income | Capital Gains | of Capital | Income | Total | |||||||||||||||
| Global Fund | $ | 1,676,503 | $ | 7,900,992 | $ | — | $ | — | $ | 9,577,495 | ||||||||||
| International Fund | — | — | — | — | — | |||||||||||||||
The difference between ordinary distributions paid from book and ordinary distributions paid from tax relates to allowable foreign tax credits of $65,761 for the year ended October 31, 2020 for the Conductor Global Equity Value Fund which have been passed through to the Fund’s underlying shareholders and are deemed dividends for tax purposes.
45
| Conductor Funds |
| NOTES TO FINANCIAL STATEMENTS (Continued) |
| October 31, 2020 |
As of October 31, 2020, the components of accumulated earnings/(deficit) on a tax basis were as follows:
| Undistributed | ||||||||||||||||
| Ordinary | Undistributed | Undistributed | Post October Loss | |||||||||||||
| Tax-Exempt | Ordinary | Long-Term | and | |||||||||||||
| Portfolio | Income | Income | Capital Gains | Late Year Loss | ||||||||||||
| Global Fund | $ | — | $ | — | $ | — | $ | — | ||||||||
| International Fund | — | — | — | — | ||||||||||||
| Capital Loss | Other | Unrealized | Total | |||||||||||||
| Carry | Book/Tax | Appreciation/ | Accumulated | |||||||||||||
| Portfolio | Forwards | Differences | (Depreciation) | Earnings/(Deficit) | ||||||||||||
| Global Fund | $ | (12,946,849 | ) | $ | — | $ | 5,336,131 | $ | — | |||||||
| International Fund | (547,781 | ) | — | 49,516 | — | |||||||||||
The difference between book basis and tax basis undistributed net investment income, and unrealized appreciation from investments is primarily attributable to the adjustments for passive foreign investment companies. The table above includes unrealized foreign currency gains of $4,091 and $29 for the Conductor Global Equity Value Fund and the Conductor International Value Fund, respectively.
At October 31, 2020, the Funds had capital loss carry forwards for federal income tax purposes available to offset future capital gains as follows:
| Portfolio | Short-Term^ | Long-Term^ | Total | CLCF Utilized | ||||||||||||
| Global Fund | $ | 12,946,849 | $ | — | $ | 12,946,849 | $ | — | ||||||||
| International Fund | 547,781 | — | 547,781 | — | ||||||||||||
| ^ | Non-Expiring. |
Permanent book and tax differences, primarily attributable to the book/tax basis treatment of non-deductible expenses, resulted in reclassifications for the Funds for the fiscal year ended October 31, 2020 as follows:
| Paid In | Accumulated | |||||||
| Portfolio | Capital | Earnings/(Deficit) | ||||||
| Global Fund | $ | (13,232 | ) | $ | 13,232 | |||
| International Fund | — | — | ||||||
46
| Conductor Funds |
| NOTES TO FINANCIAL STATEMENTS (Continued) |
| October 31, 2020 |
| 8. | SECURITIES LENDING |
The Global Fund has entered into a securities lending arrangement with BNY Mellon Corp. (“BNY Mellon”). Under an agreement with BNY Mellon, the Global Fund can lend its portfolio securities to brokers, dealers and other financial institutions approved by the Board of Trustees to earn additional income. Loans are collateralized by cash, in an amount at least equal to the market value of the securities loaned plus accrued interest, which is invested in highly liquid, short-term instruments such as repurchase agreements collateralized by U.S. Government securities and money market funds in accordance with the Global Fund’s security lending procedures. A portion of the income generated by the investment in the collateral, net of any rebates paid by BNY Mellon to the borrowers is remitted to BNY Mellon as lending agent, and the remainder is paid to the Global Fund. The Global Fund continues to receive interest or dividends on the securities loaned. The Global Fund has the right under the Master Securities Lending Agreement to recover the securities from the borrower on demand; if the borrower fails to deliver the securities on a timely basis, the Global Fund could experience delays or losses on recovery. Additionally, the Global Fund is subject to the risk of loss from investments made with the cash received as collateral. The Global Fund manages credit exposure arising from these lending transactions by, in appropriate circumstances, entering into master netting agreements and collateral agreements with third party borrowers that provide in the event of default (such as bankruptcy or a borrower’s failure to pay or perform), the right to net a third party borrower’s rights and obligations under such agreement and liquidate and set off collateral against the net amount owed by the counterparty.
At October 31, 2020, the Global Fund had loaned securities and received cash collateral for the loan. This cash was invested in the Dreyfus Government Cash Management Fund as shown in the Schedule of Investments. The Global Fund receives compensation relating to the lending of the Global Fund’s securities.
The market values of loaned securities and collateral and percentage of total investment income the Global Fund received from the investment of cash collateral retained by the lending agent, BNY Mellon, were as follows:
| Market Value of | Market Value of | Percentage of Total | ||||||||
| Loaned Securities | Collateral | Investment Income | ||||||||
| $ | 1,839,359 | $ | 1,932,202 | 1.22 | % | |||||
| Gross Amounts Not Offset in | ||||||||||||||||
| the Statement of Assets and | ||||||||||||||||
| Liabilities | ||||||||||||||||
| Gross Amounts | ||||||||||||||||
| Recognized in | Financial | |||||||||||||||
| Statements of Assets | Instruments | Cash Collateral | Net Amount of | |||||||||||||
| and Liabilities | Pledged | Pledged | Assets | |||||||||||||
| Description of Liability | ||||||||||||||||
| Securities lending collateral | $ | 1,377,465 | $ | — | $ | 1,377,465 | (1) | $ | — | |||||||
| (1) | The amount is limited to the liability balance and accordingly does not include excess collateral pledged. |
The following table sets forth the remaining contractual maturity of the collateral held as of October 31, 2020:
| Remaining Contractual Maturity of the Collateral Held as of October 31, 2020 | ||||||||||||||||||||
| Overnight and | Up to | Greater than | ||||||||||||||||||
| Continuous | 30 Days | 30-90 days | 90 days | Total | ||||||||||||||||
| Dreyfus Government Cash Management | $ | 1,377,465 | $ | — | $ | — | $ | — | $ | 1,377,465 | ||||||||||
| U.S. Government | — | — | 3,900 | 550,837 | 554,737 | |||||||||||||||
| Total securities lending | $ | 1,377,465 | $ | — | $ | 3,900 | $ | 550,837 | $ | 1,932,202 | ||||||||||
47
| Conductor Funds |
| NOTES TO FINANCIAL STATEMENTS (Continued) |
| October 31, 2020 |
The fair value of the securities loaned for the Global Fund totaled $1,839,359 at October 31, 2020. The securities loaned are noted in the Portfolio of Investments. The fair value of the “Securities lending collateral” on the Portfolio of Investments includes only cash collateral received and reinvested that totaled $1,377,465 for the Global Fund at October 31, 2020. This amount is offset by a liability recorded as “Collateral on Securities Loaned.” At October 31, 2020, the Global Fund received non-cash collateral of $554,737.
| 9. | UNDERLYING INVESTMENT IN OTHER INVESTMENT COMPANIES |
The Funds currently invests a portion of their assets in the Dreyfus Cash Management Fund – Institutional Class (the “Dreyfus Fund”). The Dreyfus Fund is registered under the 1940 Act as open-end management investment company. The Funds may redeem their investment in the Dreyfus Fund at any time if the Adviser determines that it is in the best interest of the Funds and their shareholders to do so. The performance of the Funds will be directly affected by the performance of the Dreyfus Fund. The financial statements of the Dreyfus Fund, including its portfolio of investments, can be found on the Securities and Exchange Commission’s (“SEC”) website, www.sec.gov, and should be read in conjunction with each Fund’s financial statements.
As of October 31, 2020, the percentage of each Fund’s net assets invested in the Dreyfus Fund was as follows:
| Fund Name | Percentage of Fund’s Net Assets invested in the Dreyfus Fund | |
| Global Fund | 30.1% | |
| International Fund | 27.2% |
| 10. | CONTROL OWNERSHIP |
The beneficial ownership, either directly or indirectly, of more than 25% of the voting securities of a fund creates presumption of control of the fund, under Section 2(a)(9) of the 1940 Act. As of October 31, 2020, Charles Schwab & Co., holding shares for the benefit of others in nominee name, held approximately 66% and 100% of the voting securities of the Global Fund and International Fund, respectively.
| 11. | REDEMPTION FEES |
Each Fund may assess a short-term redemption fee of 1.00% of the total redemption amount if a shareholder sells his/her shares after holding them for less than 30 days. The redemption fee is paid directly to the Fund. For the year ended October 31, 2020, the Global Fund assessed redemption fees for Class C and Class Y in the amounts of $103 and $64, respectively. For the period ended October 31, 2020, there were no redemption fees assessed for the International Fund.
| 12. | SUBSEQUENT EVENTS |
Subsequent events after the date of the Statements of Assets and Liabilities have been evaluated through the date the financial statements were issued. Management has determined that no events or transactions occurred requiring adjustment or disclosure in the financial statements.
48

GRANT THORNTON LLP
D +1 215 561 4200 | REPORT OF INDEPENDENT REGISTERED PUBLIC ACCOUNTING FIRM | ||||
Board of Trustees of the Two Roads Shared Trust and Shareholders of
Opinion on the financial statements
We have audited the accompanying statements of assets and liabilities, including the portfolios of investments, of Conductor Global Equity Value Fund and Conductor International Equity Value Fund (two of the funds in the Two Roads Shared Trust) (collectively, the “Funds”) as of October 31, 2020, the related statements of operations, changes in net assets and the financial highlights for each of the periods indicated in the table below, and the related notes (collectively referred to as the “financial statements”). In our opinion, the financial statements present fairly, in all material respects, the financial position of the Funds as of October 31, 2020, and the results of their operations, changes in their net assets and their financial highlights for each of the periods indicated in the table below, in conformity with accounting principles generally accepted in the United States of America. | |||||
| Fund | Statement of Operations | Statement of Changes in Net Assets | Financial Highlights | ||
| Conductor Global Equity Value Fund | For the year ended October 31, 2020 | For each of the two years in the period ended October 31, 2020 | For each of the five years in the period ended October 31, 2020 | ||
| Conductor International Equity Value Fund | For the period December 5, 2019 (commencement of operations) through October 31, 2020 | For the period December 5, 2019 (commencement of operations) through October 31, 2020 | For the period December 5, 2019 (commencement of operations) through October 31, 2020 | ||
Basis for opinion
These financial statements are the responsibility of the Funds’ management. Our responsibility is to express an opinion on the Funds’ financial statements based on our audits. We are a public accounting firm registered with the Public Company Accounting Oversight Board (United States) (“PCAOB”) and are required to be independent with respect to the Funds in accordance with the U.S. federal securities laws and the applicable rules and regulations of the Securities and Exchange Commission and the PCAOB. | |||||
| GT.COM | Grant Thornton LLP is the U.S. member firm of Grant Thornton International Ltd (GTIL). GTIL and each of its member firms are separate legal entities and are not a worldwide partnership. | ||||
49
We conducted our audits in accordance with the standards of the PCAOB. Those standards require that we plan and perform the audit to obtain reasonable assurance about whether the financial statements are free of material misstatement, whether due to error or fraud. The Funds are not required to have, nor were we engaged to perform, an audit of their internal control over financial reporting. As part of our audits we are required to obtain an understanding of internal control over financial reporting but not for the purpose of expressing an opinion on the effectiveness of the Funds’ internal control over financial reporting. Accordingly, we express no such opinion.
Our audits included performing procedures to assess the risks of material misstatement of the financial statements, whether due to error or fraud, and performing procedures that respond to those risks. Such procedures included examining, on a test basis, evidence regarding the amounts and disclosures in the financial statements. Our audits also included evaluating the accounting principles used and significant estimates made by management, as well as evaluating the overall presentation of the financial statements. Our procedures included confirmation of securities owned as of October 31, 2020 by correspondence with the custodian and broker; when replies were not received from brokers, we performed other auditing procedures. We believe that our audits provide a reasonable basis for our opinion.
We have served as the auditor of one or more investment companies in the Two Roads Shared Trust since 2016.
Philadelphia, Pennsylvania December 30, 2020 |
50
| Conductor Funds |
| EXPENSE EXAMPLES (Unaudited) |
| October 31, 2020 |
As a shareholder of a Fund, you incur two types of costs: (1) transaction costs, including sales charges (loads) on purchases of Class A shares; and (2) ongoing costs, including management fees; distribution and/or service (12b-1) fees; and other Fund expenses. This example is intended to help you understand your ongoing costs (in dollars) of investing in the Conductor Global Equity Value Fund and Conductor International Equity Value Fund and to compare these costs with the ongoing costs of investing in other mutual funds. The example is based on an investment of $1,000 invested at the beginning of the period and held for the entire six months ended October 31, 2020.
Actual Expenses
The “Actual” Expenses line in the table below provides information about actual account values and actual expenses. You may use the information below together with the amount you invested, to estimate the expenses that you paid over the period. Simply divide your account value by $1,000 (for example, an $8,600 account value divided by $1,000 = 8.6), then multiply the result by the number in the table under the heading entitled “Expenses Paid During Period” to estimate the expenses you paid on your account during this period.
Hypothetical Example for Comparison Purposes
The “Hypothetical” line in the table below provides information about hypothetical account values and hypothetical expenses based on each Fund’s actual expense ratio and an assumed rate of return of 5% per year before expenses, which is not the Fund’s actual return. The hypothetical account values and expenses may not be used to estimate the actual ending account balances or expenses you paid for the period. You may use this information to compare this 5% hypothetical example with the 5% hypothetical examples that appear in the shareholder reports of other funds.
Please note that the expenses shown in the table are meant to highlight your ongoing costs only and do not reflect any transactional costs, such as sales charges (loads), or redemption fees. Therefore, the table is useful in comparing ongoing costs only, and will not help you determine the relative total costs of owning different funds. In addition, if these transactional costs were included, your costs would have been higher.
| Beginning Account Value | Ending Account Value | Expenses* Paid During | Annualized Expense Ratio | |||||
| Actual | 5/1/2020 | 10/31/2020 | Period 5/1/20 – 10/31/20 | 5/1/20 – 10/31/20 | ||||
| Global Fund | ||||||||
| Class A | $1,000.00 | $1,082.70 | $11.26 | 2.15% | ||||
| Class C | 1,000.00 | 1,078.20 | 15.15 | 2.90% | ||||
| Class I | 1,000.00 | 1,083.70 | 9.95 | 1.90% | ||||
| Class Y | 1,000.00 | 1,086.90 | 6.56 | 1.25% | ||||
| International Fund | ||||||||
| Class A | 1,000.00 | 1,082.50 | 7.59 | 1.45% | ||||
| Class I | 1,000.00 | 1,082.50 | 6.28 | 1.20% | ||||
| Hypothetical | ||||||||
| (5% return before | Beginning Account Value | Ending Account Value | Expenses* Paid During | Annualized Expense Ratio | ||||
| expenses) | 5/1/2020 | 10/31/2020 | Period 5/1/20 – 10/31/20 | 5/1/20 – 10/31/20 | ||||
| Global Fund | ||||||||
| Class A | $1,000.00 | $1,014.33 | $10.89 | 2.15% | ||||
| Class C | 1,000.00 | 1,010.56 | 14.66 | 2.90% | ||||
| Class I | 1,000.00 | 1,015.58 | 9.63 | 1.90% | ||||
| Class Y | 1,000.00 | 1,018.85 | 6.34 | 1.25% | ||||
| International Fund | ||||||||
| Class A | 1,000.00 | 1,017.85 | 7.35 | 1.45% | ||||
| Class I | 1,000.00 | 1,019.10 | 6.02 | 1.20% |
| * | Expenses are equal to each Fund’s annualized expense ratio, multiplied by the number of days in the period (184) divided by the number of days in the fiscal year (366). |
51
| Conductor Global Equity Value Fund |
| SUPPLEMENTAL INFORMATION (Unaudited) |
| October 31, 2020 |
Approval of Advisory Agreement
Conductor Global Equity Value Fund
At a meeting held on September 15 and 16, 2020 (the “Meeting”), the Board of Trustees (the “Board”) of Two Roads Shares Trust (the “Trust”), each of whom is not an “interested person” of the Trust (the “Independent Trustees” or the “Trustees”), as such term is defined under Section 2(a)(19) of the Investment Company Act of 1940, as amended (the “1940 Act”), considered the reapproval of the investment advisory agreement (the “Advisory Agreement”) between IronHorse Capital, LLC (“IronHorse” or the “Adviser”) and the Trust, on behalf of the Conductor Global Equity Value Fund (the “Fund”).
In connection with the Board’s consideration of the Advisory Agreement, the Board received written materials in advance of the Meeting, which included information regarding: (i) the nature, extent, and quality of services to be provided to the Fund by IronHorse; (ii) a description of the Adviser’s investment management personnel; (iii) an overview of the Adviser’s operations and financial condition; (iv) a description of the Adviser’s brokerage practices (including any soft dollar arrangements); (v) a comparison of the Fund’s advisory fees and overall expenses with those of comparable mutual funds; (vi) the anticipated level of profitability from the Adviser’s fund-related operations; (vii) the Adviser’s compliance policies and procedures, including policies and procedures for personal securities transactions, business continuity and information security and (viii) information regarding the performance record of the Fund as compared to other mutual funds with similar investment strategies.
Throughout the process, including at the meeting, the Board had numerous opportunities to ask questions of and request additional materials from IronHorse. During the Meeting, the Board was advised by, and met, in executive session with, the Board’s independent legal counsel, and received a memorandum from such independent counsel regarding their responsibilities under applicable law. The Board also noted that the evaluation process with respect to the Adviser was an ongoing one and that in this regard, the Board took into account discussions with management and information provided to the Board at prior meetings with respect to the services provided by the Adviser.
Matters considered by the Board in connection with its approval of the Advisory Agreement included, among others, the following:
Nature, Extent and Quality of Services. The Board reviewed materials provided by IronHorse related to the services provided pursuant to the Advisory Agreement with the Trust on behalf of the Fund, including: the Advisory Agreement; a description of the manner in which investment decisions are made and executed; a review of the financial condition of IronHorse; an overview of the personnel that perform advisory, compliance, and operational services for the Fund; a quarterly written report containing IronHorse’s performance commentary; IronHorse’s compliance program, including its business continuity policy, information systems security policy, and a Code of Ethics containing provisions reasonably necessary to prevent Access Persons, as that term is defined in Rule 17j-1 under the Investment Company Act of 1940 Act, from engaging in conduct prohibited by Rule 17j-1(b); information regarding risk management processes and liquidity management; an annual review of the operation of IronHorse’s compliance program; information regarding the Adviser’s compliance and regulatory history; and an independent report prepared by Broadridge analyzing the performance record and fees and expenses of the Fund as compared to other mutual funds with similar investment strategies.
In reaching its conclusions with respect to the nature and quality of services to be provided by IronHorse under the Advisory Agreement, the Board considered the level and sophistication of IronHorse’s employees’ asset management, risk management, and operations and compliance experience and that there had been no changes to the ownership structure of IronHorse over the previous year. The Board considered that IronHorse continued to employ a quantitative-based factor model strategy; that there had been no significant changes in IronHorse’s investment strategies or operations; and that IronHorse has employed defensive positioning in an effort to preserve assets during market conditions throughout 2020. The Board noted that it had met with the Fund’s portfolio manager
52
| Conductor Global Equity Value Fund |
| SUPPLEMENTAL INFORMATION (Unaudited)(Continued) |
| October 31, 2020 |
and was satisfied with his expertise and ability to manage the Fund’s portfolio in accordance with its investment objectives and strategy. The Board also noted that on a regular basis it received and reviewed information from the Trust’s Chief Compliance Officer (CCO) regarding the Fund’s compliance policies and procedures established pursuant to Rule 38a-1 under the 1940 Act, which included evaluating the regulatory compliance systems of IronHorse and procedures reasonably designed to ensure compliance with federal securities laws. The Board considered that IronHorse had engaged an outside consulting firm to support certain compliance functions of the Adviser. The Board noted that IronHorse appeared to have adequate capacity to operate both its investment and compliance program, that IronHorse had adopted cybersecurity and business continuity policies and procedures, and that IronHorse’s risk management and associated policies appeared to be operating effectively to identify and monitor risks. The Board also considered the significant risks assumed by IronHorse in connection with the services provided to the Fund, including entrepreneurial risk and ongoing risks including investment, operational, enterprise, litigation, regulatory, and compliance risks with respect to the Fund. The Board also considered the financial condition and operations of the Adviser during the COVID-19 pandemic and noted that there had been no material disruption of the Adviser’s services to the Fund and that the Adviser had continued to provide the same level, quality and extent of services to the Fund.
In considering the nature, extent, and quality of the services provided by IronHorse, the Board also took into account its knowledge, acquired through discussions and reports during the preceding year and in past years, of IronHorse’s management and the quality of the performance of IronHorse’s duties. The Board concluded that IronHorse had sufficient quality and depth of personnel, resources, investment methods, and compliance policies and procedures to perform its duties under the Advisory Agreement and that the nature, overall quality and extent of the advisory services provided by IronHorse to the Fund were satisfactory and reliable.
Performance. In considering the Fund’s performance, the Board noted that it reviewed at its regularly scheduled meetings information about the Fund’s performance results. Among other data, the Board considered the performance of the Fund for the one-year, three-year and since inception periods ended June 30, 2020 as compared to the Fund’s benchmark index (MSCI World Index) and against the performance of a group of peer funds (the “Peer Group”) provided by Broadridge, an independent third-party data provider. The Board noted that while it found the data provided by the independent third-party generally useful it recognized its limitations, including in particular that the data may vary depending on the end date selected and that the results of the performance comparisons may vary depending on the selection of the peer group. The Board considered that the Fund underperformed the median of its Peer Group and the median of its Morningstar category (World Small/Mid Stock) for the each of the one-year, three-year and since inception periods. The Board noted that value stocks in general had underperformed stocks across most markets and capitalization ranges.
The Board took into account management’s discussion of the Fund’s performance, noting that IronHorse has stated that it will maintain a defensive position until it believes the markets have returned to conditions that merit IronHorse opening the Fund to investment exposure in a non-defensive manner. The Board noted that while such action will cause the Fund to underperform when markets experience a sharp recovery, as was the case in the preceding six-month period, IronHorse has articulated a rational basis for its performance and its actions were geared towards the protection of Fund shareholders and risk mitigation. The Board concluded that the Adviser’s overall performance was satisfactory.
Fees and Expenses. Regarding the costs of the services provided by IronHorse with respect to the Fund, the Board considered a comparison of the Fund’s contractual advisory fee and net expense ratio to those of the funds within the Peer Group and to its Morningstar category. The Board noted that the Fund’s advisory fee and total net operating expenses (Class Y Shares) were above the Peer Group median but were not the highest in the category. The Board took into account IronHorse’s discussion of the Fund’s expenses. The Board also considered the Fund’s expense ratio, noting that IronHorse had agreed to limit the Fund’s net annual operating expenses to 2.15%, 2.90%, 1.90%, and 1.25% (exclusive of (i) any front-end or contingent deferred loads; (ii) brokerage fees and commissions; (iii) acquired fund fees and expenses; (iv) borrowing costs (such as interest and dividend expense on securities sold short); (v) taxes; and (vi) extraordinary expenses, such as litigation expenses) of the average net assets of Class A, Class C, Class I, and Class Y shares of the Fund, respectively, and noted that IronHorse had on previous occasions reduced its expense limitation as well.
53
| Conductor Global Equity Value Fund |
| SUPPLEMENTAL INFORMATION (Unaudited)(Continued) |
| October 31, 2020 |
In considering the level of the advisory fee with respect to the Fund, the Board also took into account the cost of other accounts managed by IronHorse that used a similar investment strategy, noting that differences were attributable to the differences in the management of these different kinds of accounts.
Based on the factors above, the Board concluded that the advisory fee of the Fund was not unreasonable.
Profitability. The Board considered IronHorse’s profitability and whether these profits were reasonable in light of the services provided to the Fund. The Board reviewed a profitability analysis prepared by IronHorse based on current asset levels of the Fund. The Board noted the direct and indirect costs of operating the Fund in that analysis and concluded that IronHorse’s profitability from its relationship with the Fund was not excessive.
Economies of Scale. The Board considered whether IronHorse would realize economies of scale with respect to its management of the Fund as the Fund grows and whether fee levels reflected these economies of scale for the benefit of shareholders. The Board noted that the advisory fee did not currently have breakpoints and considered IronHorse’s discussion of the Fund’s advisory fee structure. The Board also considered the profitability analysis included in the Board Materials and noted that while expenses of managing the Fund as a percentage of assets under management were expected to decrease as the Fund’s assets continued to grow, at current asset levels, economies of scale had not yet been reached. The Board noted that it would revisit whether additional economies of scale should be taken into account in the future once the Fund had achieved sufficient scale.
Other Benefits. The Board also considered the character and amount of any other direct and incidental benefits to be received by IronHorse from its association with the Fund. The Board considered that IronHorse did not anticipate receiving any other direct, indirect, or ancillary material “fall-out” benefits from its relationship with the Fund. The Board concluded that these potential benefits are reasonable.
Conclusion. The Board, having requested and received such information from IronHorse as it believed reasonably necessary to evaluate the terms of the Advisory Agreement, and having been advised by independent counsel that the Board had appropriately considered and weighed all relevant factors, determined that approval of Advisory Agreement for an additional one-year term was in the best interests of the Fund and its shareholders.
In considering the Advisory Agreement renewal, the Board considered a variety of factors, including those discussed above, and also considered other factors (including conditions and trends prevailing generally in the economy, the securities markets, and the industry). The Board did not identify any one factor as determinative, and each Independent Trustee may have weighed each factor differently. The Board’s conclusions may be based in part on its consideration of the advisory arrangements in prior years and on the Board’s ongoing regular review of the Fund’s performance and operations throughout the year.
54
| Conductor Funds |
| SUPPLEMENTAL INFORMATION (Unaudited) |
| October 31, 2020 |
Trustees and Officers. The Trustees and officers of the Trust, together with information as to their principal business occupations during the past five years and other information, are shown below. The address of each Trustee and Officer is 225 Pictoria Drive, Suite 450, Cincinnati, OH 45246. All correspondence to the Trustees and Officers should be directed to c/o Gemini Fund Services, LLC, P.O. Box 541150, Omaha, Nebraska 68154.
Independent Trustees *
| Name, Address, Year of Birth | Position(s) Held with Registrant | Term and Length Served | Principal Occupation(s) During Past 5 Years | Number of Portfolios Overseen In The Fund Complex** | Other Directorships Held During Past 5 Years |
| Mark Garbin Year of Birth: 1951 | Trustee | Indefinite, Since 2012 | Managing Principal, Coherent Capital Management LLC (since 2008) | 2 | Northern Lights Fund Trust (since 2013); Northern Lights Variable Trust (since 2013); Forethought Variable Insurance Trust (since 2013); OHA Mortgage Strategies Fund (offshore), Ltd. (2014 - 2017); Altegris KKR Commitments Master Fund (since 2014); and Carlyle Tactical Private Credit Fund (since March 2018) |
| Mark D. Gersten Year of Birth: 1950 | Chairman, Trustee | Indefinite, Since 2012 | Independent Consultant (since 2012); Senior Vice President – Global Fund Administration Mutual Funds & Alternative Funds, AllianceBernstein LP (1985 – 2011) | 2 | Northern Lights Fund Trust (since 2013); Northern Lights Variable Trust (since 2013); Altegris KKR Commitments Master Fund (since 2014); previously, Ramius Archview Credit and Distressed Fund (2015-2017); and Schroder Global Series Trust (2012 to 2017) |
| Neil M. Kaufman Year of Birth: 1960 | Trustee, Audit Committee Chairman | Indefinite, Since 2012 | Managing Member, Kaufman & Associates, LLC (legal services)(Since 2016); Partner, Abrams Fensterman, Fensterman, Eisman, Formato, Ferrara & Wolf, LLP (legal services)(2010-2016) | 2 | Altegris KKR Commitments Master Fund (since 2014) |
| Anita K. Krug Year of Birth: 1969 | Trustee | Indefinite, Since 2012 | Dean (since 2019) Chicago Kent Law School; Interim Vice Chancellor for Academic Affairs (2018-2019) University of Washington Bothell; Interim Dean (2017- 2018), Professor (2016-2019), Associate Professor (2014-2016); and Assistant Professor (2010-2014), University of Washington School of Law | 2 | Altegris KKR Commitments Master Fund (since 2014); Centerstone Investors Trust (since 2016) |
| * | Information is as of October 31, 2020. |
| ** | As of October 31, 2020, the Trust was comprised of 23 active portfolios managed by seven unaffiliated investment advisers and two affiliated investment advisers. The term “Fund Complex” applies only to those funds that (i) advised by a common investment adviser or by an investment adviser that is an affiliated person of the investment adviser of any of the other funds of the Trust or (ii) hold themselves out to investors as related companies for purposes of investment and investor services. The Funds do not share the same investment adviser with any other series of the Trust or hold themselves out as related to any other series of the Trust for investment purposes. |
10/31/2020 – Two Roads v2
55
| Conductor Funds |
| SUPPLEMENTAL INFORMATION (Unaudited)(Continued) |
| October 31, 2020 |
Officers of the Trust*
| Name, Address, Year of Birth | Position(s) Held with Registrant | Principal Occupation(s) During Past 5 Years | Number of Portfolios Overseen In The Fund Complex** | Other Directorships Held During Past 5 Years |
| James Colantino Year of Birth: 1969 | President Since Feb. 2017 Treasurer (2012 to 2017) | Senior Vice President (2012- present); Vice President (2004 to 2012); Gemini Fund Services, LLC | N/A | N/A |
| Laura Szalyga Year of Birth: 1978 | Treasurer Since Feb. 2017 | Vice President, Gemini Fund Services, LLC (since 2015); Assistant Vice President, Gemini Fund Services, LLC (2011-2014) | N/A | N/A |
| Richard A. Malinowski Year of Birth: 1983 | Vice President Since Sep. 2018 Secretary Since 2013 | Senior Vice President and Senior Managing Counsel, Gemini Fund Services, LLC, (since February 2020); Senior Vice President Legal Administration, Gemini Fund Services, LLC (April 2017 to February 2020); Vice President and Counsel (April 2016 – 2017) and AVP and Staff Attorney (September 2012 – March 2016). | N/A | N/A |
| William B. Kimme Year of Birth: 1962 | Chief Compliance Officer Since Inception | Senior Compliance Officer, Northern Lights Compliance Services, LLC (September 2011 -present) | N/A | N/A |
| * | Information is as of October 31, 2020. |
| ** | As of October 31, 2020, the Trust was comprised of 23 active portfolios managed by seven unaffiliated investment advisers and two affiliated investment advisers. The term “Fund Complex” applies only to those funds that (i) advised by a common investment adviser or by an investment adviser that is an affiliated person of the investment adviser of any of the other funds of the Trust or (ii) hold themselves out to investors as related companies for purposes of investment and investor services. The Funds do not share the same investment adviser with any other series of the Trust or hold themselves out as related to any other series of the Trust for investment purposes. |
The Funds’ Statement of Additional Information (“SAI”) includes additional information about the Trustees and is available free of charge, upon request, by calling toll-free at 1-844-467-2459.
10/31/2020 – Two Roads v2
56
| Conductor Funds |
| LIQUIDITY RISK MANAGEMENT PROGRAM (Unaudited) |
| October 31, 2020 |
The Funds have adopted and implemented a written liquidity risk management program as required by Rule 22e-4 (the “Liquidity Rule”) under the Investment Company Act. The program is reasonably designed to assess and manage each Fund’s liquidity risk, taking into consideration, among other factors, the respective Fund’s investment strategy and the liquidity of its portfolio investments during normal and reasonably foreseeable stressed conditions; its short and long-term cash flow projections; and its cash holdings and access to other funding sources.
During the fiscal period ended October 31, 2020, the Trust’s Liquidity Risk Management Program Committee (the “Committee”) reviewed each Fund’s investments and determined that the Funds held adequate levels of cash and highly liquid investments to meet shareholder redemption activities in accordance with applicable requirements. Accordingly, the Committee concluded that (i) the Funds’ liquidity risk management program is reasonably designed to prevent violations of the Liquidity Rule and (ii) the Funds’ liquidity risk management program has been effectively implemented.
57
| PRIVACY NOTICE | |||||||||
| FACTS | WHAT DOES TWO ROADS SHARED TRUST DO WITH YOUR PERSONAL INFORMATION | ||||||||
| Why? | Financial companies choose how they share your personal information. Federal law gives consumers the right to limit some but not all sharing. Federal law also requires us to tell you how we collect, share, and protect your personal information. Please read this notice carefully to understand what we do. | ||||||||
| What? | THE TYPES OF PERSONAL INFORMATION WE COLLECT AND SHARE DEPENDS ON THE PRODUCT OR SERVICE THAT YOU HAVE WITH US. THIS INFORMATION CAN INCLUDE: | ||||||||
| ● Social Security number and income | |||||||||
| ● Account transactions and transaction history | |||||||||
| ● Investment experience and purchase history | |||||||||
| When you are no longer our customer, we continue to share your information as described in this notice. | |||||||||
| How? | All financial companies need to share customers’ personal information to run their everyday business. In the section below, we list the reasons financial companies can share their customers’ personal information; the reason Two Roads Shared Trust chooses to share and whether you can limit this sharing. | ||||||||
| Reasons we can share your personal information | Does Two Roads Shared Trust share? | Can you limit this sharing? |
| For our everyday business purposes – such as to process your transactions, maintain your account(s), respond to court orders and legal investigations, or report to credit bureaus | YES | NO |
| For our marketing purposes – to offer our products and services to you | NO | We do not share |
| For joint marketing with other financial companies | NO | We do not share |
| For our affiliates’ everyday business purposes – information about your transactions and experiences | NO | We do not share |
| For our affiliates’ everyday business purposes – information about your creditworthiness | NO | We do not share |
| For our affiliates to market to you | NO | We do not share |
| For nonaffiliates to market to you | NO | We do not share |
| Questions? | Call 1-402-895-1600 | |
58
What we do
| How does Two Roads Shared Trust protect my personal information? | To protect your personal information from unauthorized access and use, we use security measures that comply with federal law. These measures include computer safeguards and secured files and buildings.
Our service providers are held accountable for adhering to strict policies and procedures to prevent any misuse of your nonpublic personal information. |
| How does Two Roads Shared Trust collect my personal information? | We collect your personal information, for example, when you |
| ● open an account or give us contact information | |
| ● provide account information or give us your income information | |
| ● make deposits or withdrawals from your account | |
| We also collect your personal information from other companies. | |
| Why can’t I limit all sharing? | Federal law gives you the right to limit only |
| ● sharing for affiliates’ everyday business purposes – information about your creditworthiness | |
| ● affiliates from using your information to market to you | |
| ● sharing for nonaffiliates to market to you | |
| State laws and individual companies may give you additional rights to limit sharing | |
| Definitions | |
| Affiliates | Companies related by common ownership or control. They can be financial and nonfinancial companies. |
| ● Two Roads Shared Trust has no affiliates. | |
| Nonaffiliates | Companies not related by common ownership or control. They can be financial and nonfinancial companies. |
| ● Two Roads Shared Trust does not share with nonaffiliates so they can market to you. | |
| Joint marketing | A formal agreement between nonaffiliates financial companies that together market financial products or services to you. |
| ● Two Roads Shared Trust does not jointly market. | |
59
Proxy Voting Policy
Information regarding how the Funds vote proxies relating to portfolio securities for the 12 month period ended June 30th as well as a description of the policies and procedures that the Funds used to determine how to vote proxies is available without charge, upon request, by calling 1-844-GO-RAILX or by referring to the Securities and Exchange Commission’s (“SEC”) website at http://www.sec.gov.
Portfolio Holdings
The Funds files their complete schedule of portfolio holdings with the SEC for the first and third quarters of each fiscal year on Form N-PORT. Form N-PORT is available on the SEC’s website at http://www.sec.gov. The information on Form N-PORT is available without charge, upon request, by calling 1-844-GO-RAILX.
| Investment Advisor |
| IronHorse Capital LLC |
| 3102 West End Avenue, Suite 400 |
| Nashville, TN 37203 |
| Administrator |
| Gemini Fund Services, LLC |
| 4221 North 203rd Street, Suite 100 |
| Elkhorn, NE 68022 |
This report and the financial statements contained herein are submitted for the general information of shareholders and are not authorized for distribution to prospective investors unless preceded or accompanied by an effective prospectus. Nothing contained herein is to be considered an offer of sale or solicitation of an offer to buy shares of the Fund. Such offering is made only by a prospectus, which contains information about each Fund’s investment objective, risks, fees and expenses. Investors are reminded to read the prospectus carefully before investing in a Fund.
ITEM 2. CODE OF ETHICS.
| (a) | The registrant has, as of the end of the period covered by this report, adopted a code of ethics that applies to the registrant's principal executive officer, principal financial officer, and principal accounting officer or controller, or persons performing similar functions, regardless of whether these individuals are employed by the registrant or a third party. |
| (b) | During the period covered by this report, there were no amendments to any provision of the code of ethics. |
| (c) | During the period covered by this report, there were no waivers or implicit waivers of a provision of the code of ethics. |
ITEM 3. AUDIT COMMITTEE FINANCIAL EXPERT.
(a)(1) The Registrant’s board of trustees has determined that Mark Gersten is an audit committee financial expert, as defined in Item 3 of Form N-CSR. Mr. Gersten is independent for purposes of this Item.
(a)(2) Not applicable.
(a)(3) Not applicable.
ITEM 4. PRINCIPAL ACCOUNTANT FEES AND SERVICES.
| (a) | Audit Fees. The aggregate fees billed for each of the last two fiscal years for professional services rendered by the registrant's principal accountant for the audit of the registrant's annual financial statements or services that are normally provided by the accountant in connection with statutory and regulatory filings or engagements for those fiscal years are as follows:
|
2020 $33,000 2019 $16,500 |
| (b) | Audit-Related Fees. There were no fees billed in each of the last two fiscal years for assurances and related services by the principal accountant that are reasonably related to the performance of the audit of the registrant’s financial statements and are not reported under paragraph (a) of this item. |
| (c) | Tax Fees. The aggregate fees billed in each of the last two fiscal years for professional services rendered by the principal accountant for tax compliance are as follows: |
2020 $5,800 2019 $2,900 |
| (d) | All Other Fees. The aggregate fees billed in each of the last two fiscal years for products and services provided by the registrant’s principal accountant, other than the services reported in paragraphs (a) through (c) of this item were $0 and $0 for the fiscal years ended October 31, 2020 and 2019 respectively. |
| (e)(1) | The audit committee does not have pre-approval policies and procedures. Instead, the audit committee or audit committee chairman approves on a case-by-case basis each audit or non-audit service before the principal accountant is engaged by the registrant. |
| (e)(2) | There were no services described in each of paragraphs (b) through (d) of this Item that were approved by the audit committee pursuant to paragraph (c)(7)(i)(C) of Rule 2-01 of Regulation S-X. |
| f) | Not applicable. The percentage of hours expended on the principal accountant's engagement to audit the registrant's financial statements for the most recent fiscal year that were attributed to work performed by persons other than the principal accountant's full-time, permanent employees was zero percent (0%). |
| (g) | All non-audit fees billed by the registrant's principal accountant for services rendered to the registrant for the fiscal years ended October 31, 2020 and 2019 respectively are disclosed in (b)-(d) above. There were no audit or non-audit services performed by the registrant's principal accountant for the registrant's adviser. |
| (h) | The registrant's audit committee has considered whether the provision of non-audit services to the registrant's investment adviser (not including any sub-adviser whose role is primarily portfolio management and is subcontracted with or overseen by another investment adviser), and any entity controlling, controlled by, or under common control with the investment adviser that provides ongoing services to the registrant, that were not pre-approved pursuant to paragraph (c)(7)(ii) of Rule 2-01 of Regulation S-X, is compatible with maintaining the principal accountant's independence. |
ITEM 5. AUDIT COMMITTEE OF LISTED REGISTRANTS.
Not applicable
ITEM 6. SCHEDULE OF INVESTMENT
Included in annual report to shareholders filed under item 1 of this form.
ITEM 7. DISCLOSURE OF PROXY VOTING POLICIES AND PROCEDURES FOR CLOSED-END MANAGEMENT INVESTMENT COMPANIES.
Not applicable Fund is an open-end management investment company
ITEM 8. PORTFOLIO MANAGERS OF CLOSED-END MANAGEMENT INVESTMENT COMPANIES
Not applicable Fund is an open-end management investment company
ITEM 9. PURCHASES OF EQUITY SECURITIES BY CLOSED-END MANAGEMENT INVESTMENT COMPANY AND AFFILIATED PURCHASERS.
Not applicable Fund is an open-end management investment company
ITEM 10. SUBMISSION OF MATTERS TO A VOTE OF SECURITY HOLDERS.
Not applicable at this time.
ITEM 11. CONTROLS AND PROCEDURES.
| (a) | The registrant's principal executive and principal financial officers, or persons performing similar functions, have concluded that the registrant's disclosure controls and procedures (as defined in Rule 30a-3(c) under the 1940 Act, are effective, as of a date within 90 days of the filing date of this report, based on the evaluation of these controls and procedures required by Rule 30a-3(b) under the 1940 Act and Rule 15d-15(b) under the Securities Exchange Act of 1934, as amended. |
| (b) | There were no changes in the registrant's internal control over financial reporting (as defined in Rule 30a-3(d) under the 1940 Act) that occurred during the period covered by this report that have materially affected, or are reasonably likely to materially affect, the registrant's internal control over financial reporting. |
Item 12. Disclosure of Securities Lending Activities for Closed-End Management Investment Companies. Not applicable.
ITEM 13. EXHIBITS
| (1) | Code of Ethics for Principal Executive and Senior Financial Officers is attached hereto. |
| (2) | Certifications pursuant to Section 302 of the Sarbanes-Oxley Act of 2002 are filed herewith. |
| (3) | Certifications pursuant to Section 906 of the Sarbanes-Oxley Act of 2002 are filed herewith. |
SIGNATURES
Pursuant to the requirements of the Securities Exchange Act of 1934 and the Investment Company Act of 1940, the registrant has duly caused this report to be signed on its behalf by the undersigned, thereunto duly authorized.
Two Roads Shared Trust
| By James Colantino | /s/ James Colantino |
| Principal Executive Officer, | |
| Date: 1/7/2021 | |
Pursuant to the requirements of the Securities Exchange Act of 1934 and the Investment Company Act of 1940, this report has been signed below by the following person on behalf of the registrant and in the capacities and on the date indicated.
| By James Colantino | /s/ James Colantino |
| Principal Executive Officer | |
| Date: 1/7/2021 | |
Pursuant to the requirements of the Securities Exchange Act of 1934 and the Investment Company Act of 1940, this report has been signed below by the following person on behalf of the registrant and in the capacities and on the date indicated.
| By Laura Szalyga | /s/ Laura Szalyga |
| Principal Financial Officer | |
| Date: 1/7/2021 | |