united states
securities and exchange commission
washington, d.c. 20549
form n-csr
certified shareholder report of registered management
investment companies
Investment Company Act file number 811-22718
Two Roads Shared Trust
(Exact name of registrant as specified in charter)
225 Pictoria Drive, Suite 450 Cincinnati, OH 45246
(Address of principal executive offices) (Zip code)
Richard Malinowski, Ultimus Fund Solutions, LLC.
4221 North 203rd Street, Suite 100, Elkhorn, NE 68022
(Name and address of agent for service)
Registrant's telephone number, including area code: 631-470-2619
Date of fiscal year end: 10/31
Date of reporting period: 10/31/21
ITEM 1. REPORTS TO SHAREHOLDERS.
Dear Shareholder,
LeaderShares® Activist Leaders® ETF (ACTV)*: +58.60%
| * | From November 1, 2020 through October 31, 2021 |
Source: Bloomberg
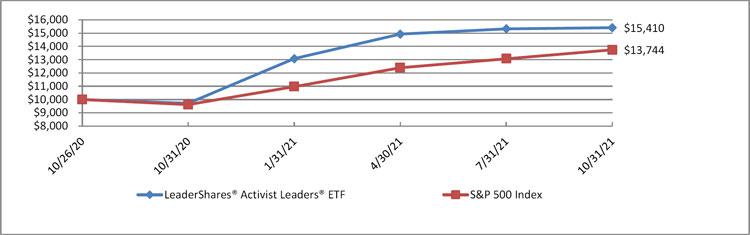
During the LeaderShares® Activist Leaders® ETF’s (the “Fund”) fiscal year the global economy began to stabilize as recovery from the spread of Covid-19 became more widespread. The US economy led the global recovery with US equities achieving multiple new highs.
The Fund posted a return of 58.60% (Source: Ultimus) during the period as compared to 42.91% for the S&P 500. During the period, the Fund was invested in a portfolio of stocks based on its quantitative selection methodology. The Fund is an active fund and does not track an index. The Fund’s concentrated exposure in companies benefitting from shareholder activism and the global economic recovery seemed to drive the outperformance against the S&P 500 Index, which returned 42.91% (Source: Ultimus) for the reporting period. Generally, however, systematic correlation to the overall U.S. equity market was as expected on both down and up trends. The Fund will continue to implement its disciplined quantitative stock selection process.
| ** | Standard and Poor’s 500 Total Return Index is a capitalization-weighted index of 500 stocks. The index is designed to measure performance of the broad domestic economy through changes in the aggregate market value of 500 stocks representing all major industries. Investors cannot invest directly in an index or benchmark. Index returns are gross of any fees, brokerage commissions or other expenses of investing. |
The views in this report are those of the Fund’s management. This report contains certain forward-looking statements about factors that may affect the performance of the Fund in the future. These statements are based on the Fund’s management’s predictions and expectations concerning certain future events such as the performance of the economy as a whole and of specific industry sectors. Management believes these forward-looking statements are reasonable, although they are inherently uncertain and difficult to predict
Dear Shareholder,
LeaderShares® AlphaFactor® Tactical Focused ETF (LSAT)* +46.20%
| * | From November 1, 2020 through October 31, 2021 |
Source: Bloomberg
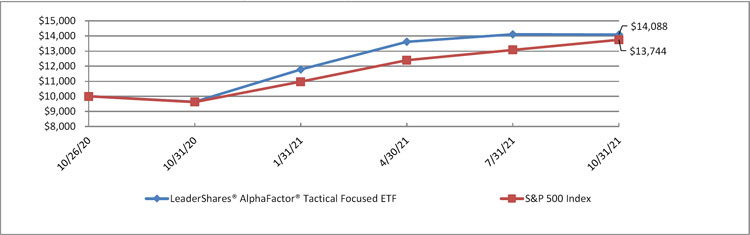
During the LeaderShares® AlphaFactor® Tactical Focused ETF’s (the “Fund”) fiscal year the global economy began to stabilize as recovery from the spread of Covid-19 became more widespread. The US economy led the global recovery with US equities achieving multiple new highs.
The Fund posted a return of 46.20% (Source: Ultimus) during the period as compared to 42.91% for the S&P 500. During the period, the Fund was invested in a portfolio of stocks based on its quantitative selection methodology. The Fund is an active fund and does not track an index. The Fund’s concentrated exposure in companies benefitting from the global economic recovery seemed to drive the outperformance against the S&P 500 Index, which returned 42.91% (Source: Ultimus) for the reporting period. Generally, however, systematic correlation to the overall U.S. equity market was as expected on both down and up trends. The Fund will continue to implement its disciplined quantitative stock selection process.
| ** | Standard and Poor’s 500 Total Return Index is a capitalization-weighted index of 500 stocks. The index is designed to measure performance of the broad domestic economy through changes in the aggregate market value of 500 stocks representing all major industries. Investors cannot invest directly in an index or benchmark. Index returns are gross of any fees, brokerage commissions or other expenses of investing. |
The views in this report are those of the Fund’s management. This report contains certain forward-looking statements about factors that may affect the performance of the Fund in the future. These statements are based on the Fund’s management’s predictions and expectations concerning certain future events such as the performance of the economy as a whole and of specific industry sectors. Management believes these forward-looking statements are reasonable, although they are inherently uncertain and difficult to predict
Dear Shareholder,
LeaderShares® AlphaFactor® US Core Equity ETF (LSAF): +36.84%*
| * | From November 1, 2020 through October 31, 2021. Source: Ultimus Fund Solutions. |
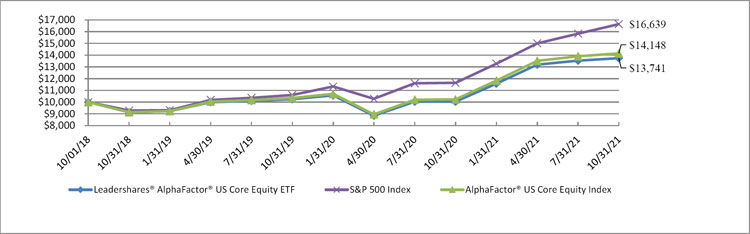
During the LeaderShares® AlphaFactor® US Core Equity ETF’s (the “Fund”) fiscal year the global economy began to stabilize as recovery from the spread of Covid-19 became more widespread. The US economy led the global recovery with US equities achieving multiple new highs.
The Fund posted a return of +36.84% (Source: Ultimus) for the year ended October 31, 2021, as compared to the +38.37% return of its benchmark AlphaFactor® US Core Equity Index (Source: Ultimus). During the period, the Fund was invested in a portfolio of stocks based on its quantitative selection methodology. The Fund’s under-exposure to quantitative factors such as growth and size, both categories which continued to lead the recovery post Q1 2020 market correction and had a large attribution within the S&P 500 Index, drove some of the Fund’s equity underperformance against the S&P 500 Index, which returned 42.91% (Source: Ultimus) for the reporting period. Generally, however, systematic correlation to the overall U.S. equity market was as expected on both down and up trends. The Fund will continue to implement its disciplined quantitative stock selection process.
Capital markets are infinitely complex. Every day, new information becomes available that changes the risk and return dynamic of any investment. In our view, capital markets are only a tool to capture opportunities in favorable risk -return dynamic, wherever they exist to work towards an investor’s long-term goal or objective. We do not attempt to forecast or suggest what may lie ahead. Instead, we utilize a quantitative approach, aiming to minimize the subjectivity of investing.
| ** | Standard and Poor’s 500 Total Return Index is a capitalization-weighted index of 500 stocks. The index is designed to measure performance of the broad domestic economy through changes in the aggregate market value of 500 stocks representing all major industries. Investors cannot invest directly in an index or benchmark. Index returns are gross of any fees, brokerage commissions or other expenses of investing. |
| *** | The AlphaFactor® US Core Equity Index utilizes a quantitative rules-based investment methodology that applies a multi-factor ranking process focused on the largest 1,000 U.S. common stocks based on market capitalization. The methodology selects stocks based on a number of characteristics that include, net share count reduction, cash flow growth, dividend yield, volatility, and debt/asset ratios. |
The views in this report are those of the Fund’s management. This report contains certain forward-looking statements about factors that may affect the performance of the Fund in the future. These statements are based on the Fund’s management’s predictions and expectations concerning certain future events such as the performance of the economy as a whole and of specific industry sectors. Management believes these forward-looking statements are reasonable, although they are inherently uncertain and difficult to predict.
Dear Shareholder,
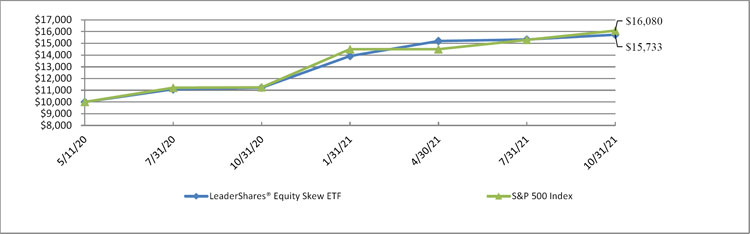
LeaderShares® Equity Skew ETF (SQEW): 40.17%*
| * | From November 1, 2020 through October 31, 2021. Source: Ultimus. |
During the LeaderShares® Equity Skew ETF’s (the “Fund”) fiscal year the global economy began to stabilize as recovery from the spread of Covid-19 became more widespread. The US economy led the global recovery with US equities achieving multiple new highs.
The Fund posted a return of 40.17% (Source: Ultimus) during the period as compared to 41.20% for the S&P 500. During the period, the Fund was invested in a portfolio of stocks based on its quantitative selection methodology. The Fund is an active fund and does not track an index, however the Fund’s under-exposure to factors such as growth and size, both categories which led the recovery post market bottom in early 2020, seemed to drive a slight equity underperformance against the S&P 500 Index, which returned 42.91% (Source: Ultimus) for the reporting period. Generally, however, systematic correlation to the overall U.S. equity market was as expected on both down and up trends. The Fund will continue to implement its disciplined quantitative stock selection process.
Capital markets are infinitely complex. Every day, new information becomes available that changes the risk and return dynamic of any investment. In our view, capital markets are only a tool to capture opportunities in favorable risk -return dynamic, wherever they exist to work towards an investor’s long-term goal or objective. We do not attempt to forecast or suggest what may lie ahead. Instead, we utilize a quantitative approach, aiming to minimize the subjectivity of investing.
| ** | Standard and Poor’s 500 Total Return Index is a capitalization-weighted index of 500 stocks. The index is designed to measure performance of the broad domestic economy through changes in the aggregate market value of 500 stocks representing all major industries. Investors cannot invest directly in an index or benchmark. Index returns are gross of any fees, brokerage commissions or other expenses of investing. |
The views in this report are those of the Fund’s management. This report contains certain forward-looking statements about factors that may affect the performance of the Fund in the future. These statements are based on the Fund’s management’s predictions and expectations concerning certain future events such as the performance of the economy as a whole and of specific industry sectors. Management believes these forward-looking statements are reasonable, although they are inherently uncertain and difficult to predict.
Dear Shareholder,
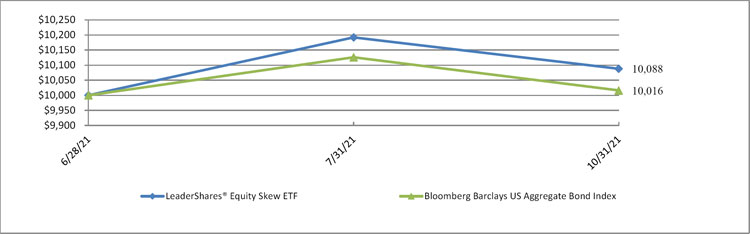
LeaderShares® Dynamic Yield ETF (DYLD)*: +0.88%
| * | From June, 28 2021 through October 31, 2021 |
Source: Bloomberg
The LeaderShares® Dynamic Yield ETF (the “Fund”) is a new fund launched at the end of June 2021. From inception through the end of the Fund’s fiscal year, it returned +0.88% versus 0.16% return of its benchmark the Bloomberg US Aggregate Bond Index.
During this short period, the Fund benefitted from active management of a portfolio of high yield corporate bonds as well as US treasuries.
| ** | The Bloomberg Barclays U.S. Aggregate Bond Index is a broadbased benchmark that measures the investment grade, U.S. dollar-denominated, fixed-rate taxable bond market. This includes Treasuries, government-related and corporate securities, mortgage-backed securities, asset-backed securities and collateralized mortgage-backed securities. |
The views in this report are those of the Fund’s management. This report contains certain forward-looking statements about factors that may affect the performance of the Fund in the future. These statements are based on the Fund’s management’s predictions and expectations concerning certain future events such as the performance of the economy as a whole and of specific industry sectors. Management believes these forward-looking statements are reasonable, although they are inherently uncertain and difficult to predict
5034-NLD-1/7/2022
LeaderShares® Activist Leaders® ETF
PORTFOLIO REVIEW
October 31, 2021 (Unaudited)
The Fund’s performance figures* for the period ended October 31, 2021, compared to its benchmark:
| One Year | Since Inception(a) | |
| LeaderShares® Activist Leaders® ETF - NAV | 58.60% | 53.20% |
| LeaderShares® Activist Leaders® ETF - Market Price | 58.58% | 53.24% |
| S&P 500 Index (b) | 42.91% | 36.85% |
| * | The performance data quoted here represents past performance. Current performance may be lower or higher than the performance data quoted above. Past performance is no guarantee of future results. The investment return and principal value of an investment will fluctuate so that investor’s shares, when redeemed, may be worth more or less than their original cost. The returns shown do not reflect the deduction of taxes that a shareholder would pay on Fund distributions or on the redemption of Fund shares. The Fund’s per share net asset value or “NAV” is the value of one share of the Fund as calculated in accordance with the standard formula for valuing shares. The NAV return is based on the NAV of the Fund and the market return is based on the market price per share of the Fund. The price used to calculate market return (“Market Price”) is determined by using the midpoint between the highest bid and the lowest offer on the primary stock exchange on which shares of the Fund are listed for trading, as of the time that the Fund’s NAV is calculated. Since shares of the Fund did not trade in the secondary market until after the Fund’s inception, for the period from inception (10/26/2020) to the first day of secondary market trading shares of the Fund, the NAV of the Fund is used as a proxy for the Market Price to calculate market returns. Market and NAV returns assume that dividends and capital gain distributions have been reinvested in the Fund at Market Price and NAV, respectively. The Fund’s total annual operating expenses are 0.75% per the March 1, 2021 prospectus. Please see the Financial Highlights for a more recent expense ratio. For performance information current to the most recent month-end, please call toll-free 1-480-757-4277. |
| (a) | As of the close of business on the day of commencement of trading October 26, 2020 |
| (b) | The S&P 500 Index is a market-capitalization-weighted index of the 500 largest U.S. publicly traded companies. The S&P 500 Index is a float-weighted index, meaning company market capitalizations are adjusted by the number of shares available for public trading. Investors cannot invest directly in an index or benchmark. Index returns are gross of any fees, brokerage commissions or other expenses of investing. |
Comparison of the Change in Value of a $10,000 Investment
| PORTFOLIO ANALYSIS | ||||
| October 31, 2021 | ||||
| Percent of | ||||
| Top 10 Industries | Net Assets | |||
| Technology Services | 12.1 | % | ||
| Oil & Gas Producers | 9.1 | % | ||
| Biotech & Pharma | 9.0 | % | ||
| Software | 9.0 | % | ||
| Health Care Facilities & Services | 6.1 | % | ||
| Asset Management | 6.1 | % | ||
| Leisure Facilities & Services | 6.0 | % | ||
| Chemicals | 6.0 | % | ||
| Food | 6.0 | % | ||
| Technology Hardware | 6.0 | % | ||
| Other/Cash and Equivalents | 24.6 | % | ||
| Total | 100.0 | % | ||
Please refer to the Schedule of Investments for a detailed listing of the Fund’s holdings.
LeaderShares® AlphaFactor® Tactical Focused ETF
PORTFOLIO REVIEW
October 31, 2021 (Unaudited)
The Fund’s performance figures* for the period ended October 31, 2021, compared to its benchmark:
| One Year | Since Inception(a) | |
| LeaderShares® AlphaFactor® Tactical Focused ETF - NAV | 46.20% | 40.23% |
| LeaderShares® AlphaFactor® Tactical Focused ETF - Market Price | 46.22% | 40.30% |
| S&P 500 Index (b) | 42.91% | 36.85% |
| * | The performance data quoted here represents past performance. Current performance may be lower or higher than the performance data quoted above. Past performance is no guarantee of future results. The investment return and principal value of an investment will fluctuate so that investor’s shares, when redeemed, may be worth more or less than their original cost. The returns shown do not reflect the deduction of taxes that a shareholder would pay on Fund distributions or on the redemption of Fund shares. The Fund’s per share net asset value or “NAV” is the value of one share of the Fund as calculated in accordance with the standard formula for valuing shares. The NAV return is based on the NAV of the Fund and the market return is based on the market price per share of the Fund. The price used to calculate market return (“Market Price”) is determined by using the midpoint between the highest bid and the lowest offer on the primary stock exchange on which shares of the Fund are listed for trading, as of the time that the Fund’s NAV is calculated. Since shares of the Fund did not trade in the secondary market until after the Fund’s inception, for the period from inception (10/26/2020) to the first day of secondary market trading shares of the Fund, the NAV of the Fund is used as a proxy for the Market Price to calculate market returns. Market and NAV returns assume that dividends and capital gain distributions have been reinvested in the Fund at Market Price and NAV, respectively. The Fund’s total annual operating expenses are 0.99% per the March 1, 2021 prospectus. Please see the Financial Highlights for a more recent expense ratio. For performance information current to the most recent month-end, please call toll-free 1-480-757-4277. |
| (a) | As of the close of business on the day of commencement of trading October 26, 2020 |
| (b) | The S&P 500 Index is a market-capitalization-weighted index of the 500 largest U.S. publicly traded companies. The S&P 500 Index is a float-weighted index, meaning company market capitalizations are adjusted by the number of shares available for public trading. Investors cannot invest directly in an index or benchmark. Index returns are gross of any fees, brokerage commissions or other expenses of investing. |
Comparison of the Change in Value of a $10,000 Investment
| PORTFOLIO ANALYSIS October 31, 2021 | ||||
| Percent of | ||||
| Top 10 Industries | Net Assets | |||
| Inurance | 16.4 | % | ||
| Retail - Consumer Staples | 9.7 | % | ||
| Technology Hardware | 9.7 | % | ||
| Institutional Financial Services | 7.1 | % | ||
| Commercial Support Services | 6.5 | % | ||
| Office REIT | 6.4 | % | ||
| Cable & Satellite | 5.8 | % | ||
| Apparel & Textile Products | 3.7 | % | ||
| Asset Management | 3.7 | % | ||
| Automotive | 3.5 | % | ||
| Other/Cash and Equivalents | 27.5 | % | ||
| Total | 100.0 | % | ||
Please refer to the Schedule of Investments for a detailed listing of the Fund’s holdings.
Leadershares® AlphaFactor® US Core Equity ETF
PORTFOLIO REVIEW
October 31, 2021 (Unaudited)
The Fund’s performance figures* for the period ended October 31, 2021, compared to its benchmarks:
| One Year | Three Year | Since Inception(a) | |
| LeaderShares® AlphaFactor® US Core Equity ETF - NAV | 36.84% | 14.54% | 10.85% |
| LeaderShares® AlphaFactor® US Core Equity ETF - Market Price | 37.09% | 14.61% | 10.91% |
| S&P 500 Index (b) | 42.91% | 21.48% | 17.96% |
| AlphaFactor® US Core Equity Index (c) | 38.37% | 15.72% | 11.96% |
| * | The performance data quoted here represents past performance. Current performance may be lower or higher than the performance data quoted above. Past performance is no guarantee of future results. The investment return and principal value of an investment will fluctuate so that investor’s shares, when redeemed, may be worth more or less than their original cost. The returns shown do not reflect the deduction of taxes that a shareholder would pay on Fund distributions or on the redemption of Fund shares. The Fund’s per share net asset value or “NAV” is the value of one share of the Fund as calculated in accordance with the standard formula for valuing shares. The NAV return is based on the NAV of the Fund and the market return is based on the market price per share of the Fund. The price used to calculate market return (“Market Price”) is determined by using the midpoint between the highest bid and the lowest offer on the primary stock exchange on which shares of the Fund are listed for trading, as of the time that the Fund’s NAV is calculated. Since shares of the Fund did not trade in the secondary market until after the Fund’s inception, for the period from inception (10/1/2018) to the first day of secondary market trading shares of the Fund, the NAV of the Fund is used as a proxy for the Market Price to calculate market returns. Market and NAV returns assume that dividends and capital gain distributions have been reinvested in the Fund at Market Price and NAV, respectively. The Fund’s total annual operating expenses are 0.75% per the March 1, 2021 prospectus. Please see the Financial Highlights for a more recent expense ratio. For performance information current to the most recent month-end, please call toll-free 1-480-757-4277. |
| (a) | As of the close of business on the day of commencement of trading October 1, 2018 |
| (b) | The S&P 500 Index is a market-capitalization-weighted index of the 500 largest U.S. publicly traded companies. The S&P 500 Index is a float-weighted index, meaning company market capitalizations are adjusted by the number of shares available for public trading. Investors cannot invest directly in an index or benchmark. Index returns are gross of any fees, brokerage commissions or other expenses of investing. |
| (c) | The AlphaFactor® US Core Equity Index, the Fund advisor’s proprietary index, utilizes a quantitative rules-based investment methodology that applies a multi-factor ranking process and is focused on the largest 1,000 U.S. common stocks based on market capitalization. Companies within this group of the top 1,000 market capitalizations may be considered large or mid-cap companies. Investors cannot invest directly in an index or benchmark. Index returns are gross of any fees, brokerage commissions or other expenses of investing. |
Comparison of the Change in Value of a $10,000 Investment
| PORTFOLIO ANALYSIS October 31, 2021 | ||||
| Percent of | ||||
| Top 10 Industries | Net Assets | |||
| Retail - Discretionary | 10.8 | % | ||
| Insurance | 9.8 | % | ||
| Banking | 6.0 | % | ||
| Health Care Facilities & Services | 5.7 | % | ||
| Specialty Finance | 4.5 | % | ||
| Instutional Financial Services | 4.2 | % | ||
| Technology Hardware | 4.0 | % | ||
| Chemicals | 3.9 | % | ||
| Semiconductors | 3.9 | % | ||
| Medical Equipment & Devices | 3.8 | % | ||
| Other/Cash and Equivalents | 43.4 | % | ||
| Total | 100.0 | % | ||
Please refer to the Schedule of Investments for a detailed listing of the Fund’s holdings.
LeaderShares® Equity Skew ETF
PORTFOLIO REVIEW
October 31, 2021 (Unaudited)
The Fund’s performance figures* for the period ended October 31, 2021, compared to its benchmarks:
| One Year | Since Inception(a) | |
| LeaderShares® Equity Skew ETF - NAV | 40.17% | 35.99% |
| LeaderShares® Equity Skew ETF - Market Price | 41.63% | 36.19% |
| S&P 500 Index (b) | 42.91% | 38.02% |
| * | The performance data quoted here represents past performance. Current performance may be lower or higher than the performance data quoted above. Past performance is no guarantee of future results. The investment return and principal value of an investment will fluctuate so that investor’s shares, when redeemed, may be worth more or less than their original cost. The returns shown do not reflect the deduction of taxes that a shareholder would pay on Fund distributions or on the redemption of Fund shares. The Fund’s per share net asset value or “NAV” is the value of one share of the Fund as calculated in accordance with the standard formula for valuing shares. The NAV return is based on the NAV of the Fund and the market return is based on the market price per share of the Fund. The price used to calculate market return (“Market Price”) is determined by using the midpoint between the highest bid and the lowest offer on the primary stock exchange on which shares of the Fund are listed for trading, as of the time that the Fund’s NAV is calculated. Since shares of the Fund did not trade in the secondary market until after the Fund’s inception, for the period from inception (5/11/2020) to the first day of secondary market trading shares of the Fund, the NAV of the Fund is used as a proxy for the Market Price to calculate market returns. Market and NAV returns assume that dividends and capital gain distributions have been reinvested in the Fund at Market Price and NAV, respectively. The Fund’s total annual operating expenses are 0.75% per the March 1, 2021 prospectus. Please see the Financial Highlights for a more recent expense ratio. For performance information current to the most recent month-end, please call toll-free 1-480-757-4277. |
| (a) | As of the close of business on the day of commencement of trading May 11, 2020 |
| (b) | The S&P 500 Index is a market-capitalization-weighted index of the 500 largest U.S. publicly traded companies. The S&P 500 Index is a float-weighted index, meaning company market capitalizations are adjusted by the number of shares available for public trading. Investors cannot invest directly in an index or benchmark. Index returns are gross of any fees, brokerage commissions or other expenses of investing. |
Comparison of the Change in Value of a $10,000 Investment
| PORTFOLIO ANALYSIS October 31, 2021 | ||||
| Percent of | ||||
| Top 10 Industries | Net Assets | |||
| Exchange Traded Funds | 71.1 | % | ||
| Banking | 3.2 | % | ||
| Biotech & Pharma | 2.2 | % | ||
| Insurance | 1.8 | % | ||
| Oil & Gas Producers | 1.7 | % | ||
| Health Care Facilities & Services | 1.4 | % | ||
| Medical Equipment & Devices | 1.1 | % | ||
| Electric Utilities | 1.1 | % | ||
| Institutional Financial Services | 1.1 | % | ||
| Semiconductors | 1.1 | % | ||
| Other/Cash and Equivalents | 14.2 | % | ||
| Total | 100.0 | % | ||
Please refer to the Schedule of Investments for a detailed listing of the Fund’s holdings.
LeaderShares® Dynamic Yield ETF
PORTFOLIO REVIEW
October 31, 2021 (Unaudited)
The Fund’s performance figures* for the period ended October 31, 2021, compared to its benchmarks:
| Since Inception(a) | |
| LeaderShares® Dynamic Yield ETF - NAV | 0.88% |
| LeaderShares® Dynamic Yield ETF - Market Price | 1.08% |
| Bloomberg Barclays US Aggregate Bond Index | 0.16% |
| * | The performance data quoted here represents past performance. Current performance may be lower or higher than the performance data quoted above. Past performance is no guarantee of future results. The investment return and principal value of an investment will fluctuate so that investor’s shares, when redeemed, may be worth more or less than their original cost. The returns shown do not reflect the deduction of taxes that a shareholder would pay on Fund distributions or on the redemption of Fund shares. The Fund’s per share net asset value or “NAV” is the value of one share of the Fund as calculated in accordance with the standard formula for valuing shares. The NAV return is based on the NAV of the Fund and the market return is based on the market price per share of the Fund. The price used to calculate market return (“Market Price”) is determined by using the midpoint between the highest bid and the lowest offer on the primary stock exchange on which shares of the Fund are listed for trading, as of the time that the Fund’s NAV is calculated. Since shares of the Fund did not trade in the secondary market until after the Fund’s inception, for the period from inception (6/28/2021) to the first day of secondary market trading shares of the Fund, the NAV of the Fund is used as a proxy for the Market Price to calculate market returns. Market and NAV returns assume that dividends and capital gain distributions have been reinvested in the Fund at Market Price and NAV, respectively. The Fund’s total annual operating expenses are 0.75% per the June 22, 2022 prospectus. Please see the Financial Highlights for a more recent expense ratio. For performance information current to the most recent month-end, please call toll-free 1-480-757-4277. |
| (a) | As of the close of business on the day of commencement of trading June 28, 2021. |
| (b) | The Bloomberg Barclays U.S. Aggregate Bond Index is a broadbased benchmark that measures the investment grade, U.S. dollar-denominated, fixed-rate taxable bond market. This includes Treasuries, government-related and corporate securities, mortgagebacked securities, asset-backed securities and collateralised mortgage-backed securities. |
Comparison of the Change in Value of a $10,000 Investment
| PORTFOLIO ANALYSIS October 31, 2021 | ||||
| Percent of | ||||
| Top 10 Industries | Net Assets | |||
| U.S. Government & Agencies | 28.4 | % | ||
| Telecommunications | 10.3 | % | ||
| Banking | 7.7 | % | ||
| Health Care Facilities & Services | 6.1 | % | ||
| Oil & Gas Producers | 6.0 | % | ||
| Biotech & Pharma | 4.1 | % | ||
| Cable Satellite | 4.0 | % | ||
| Food | 3.8 | % | ||
| Transportation & Logistics | 3.0 | % | ||
| Aerospace & Defense | 2.7 | % | ||
| Other/Cash and Equivalents | 23.9 | % | ||
| Total | 100.0 | % | ||
Please refer to the Schedule of Investments for a detailed listing of the Fund’s holdings.
| LEADERSHARES® ACTIVIST LEADERS ETF |
| SCHEDULE OF INVESTMENTS |
| October 31, 2021 |
| Shares | Fair Value | |||||||
| COMMON STOCKS — 99.3% | ||||||||
| ASSET MANAGEMENT - 6.1% | ||||||||
| 90,282 | Invesco Ltd. | $ | 2,294,066 | |||||
| 50,351 | Janus Henderson Group PLC | 2,341,321 | ||||||
| 4,635,387 | ||||||||
| BIOTECH & PHARMA - 9.0% | ||||||||
| 83,082 | Bausch Health Companies, Inc.(a) | 2,332,942 | ||||||
| 132,306 | Innoviva, Inc.(a) | 2,308,740 | ||||||
| 182,533 | Ironwood Pharmaceuticals, Inc.(a) | 2,330,946 | ||||||
| 6,972,628 | ||||||||
| CHEMICALS - 6.0% | ||||||||
| 102,884 | GCP Applied Technologies, Inc.(a) | 2,326,207 | ||||||
| 70,681 | Huntsman Corporation | 2,302,787 | ||||||
| 4,628,994 | ||||||||
| ENGINEERING & CONSTRUCTION - 3.0% | ||||||||
| 33,743 | AECOM(a) | 2,307,009 | ||||||
| FOOD - 6.0% | ||||||||
| 51,568 | Hain Celestial Group, Inc.(a) | 2,313,856 | ||||||
| 64,033 | TreeHouse Foods, Inc.(a) | 2,314,153 | ||||||
| 4,628,009 | ||||||||
| HEALTH CARE FACILITIES & SERVICES -6.1% | ||||||||
| 24,475 | Magellan Health, Inc.(a) | 2,320,964 | ||||||
| 86,637 | Mednax, Inc.(a) | 2,359,126 | ||||||
| 4,680,090 | ||||||||
| HOME & OFFICE PRODUCTS - 3.0% | ||||||||
| 100,204 | Newell Brands, Inc. | 2,293,670 | ||||||
| INSURANCE - 2.9% | ||||||||
| 51,170 | eHealth, Inc.(a) | 2,269,390 | ||||||
| LEISURE FACILITIES & SERVICES - 6.0% | ||||||||
| 18,757 | Papa John’s International, Inc. | 2,327,368 | ||||||
| 41,012 | Restaurant Brands International, Inc. | 2,322,920 | ||||||
| 4,650,288 | ||||||||
The accompanying notes are an integral part of these financial statements.
| LEADERSHARES® ACTIVIST LEADERS ETF |
| SCHEDULE OF INVESTMENTS (Continued) |
| October 31, 2021 |
| Shares | Fair Value | |||||||
| COMMON STOCKS — 99.3% (Continued) | ||||||||
| MACHINERY -3.0% | ||||||||
| 98,012 | Welbilt, Inc.(a) | $ | 2,318,964 | |||||
| OIL & GAS PRODUCERS - 9.1% | ||||||||
| 22,352 | Cheniere Energy, Inc. | 2,311,197 | ||||||
| 121,752 | Delek US Holdings, Inc.(a) | 2,368,076 | ||||||
| 69,209 | Occidental Petroleum Corporation | 2,320,578 | ||||||
| 6,999,851 | ||||||||
| REAL ESTATE OWNERS & DEVELOPERS - 3.0% | ||||||||
| 26,326 | Howard Hughes Corporation(a) | 2,293,784 | ||||||
| SOFTWARE - 9.0% | ||||||||
| 74,991 | ACI Worldwide, Inc.(a) | 2,300,724 | ||||||
| 37,478 | CommVault Systems, Inc.(a) | 2,304,897 | ||||||
| 78,549 | Evolent Health, Inc., Class A(a) | 2,299,129 | ||||||
| 6,904,750 | ||||||||
| SPECIALTY FINANCE - 3.0% | ||||||||
| 126,217 | SLM Corporation | 2,316,082 | ||||||
| TECHNOLOGY HARDWARE - 6.0% | ||||||||
| 25,931 | Seagate Technology Holdings PLC | 2,309,674 | ||||||
| 129,280 | Xerox Holdings Corporation | 2,301,184 | ||||||
| 4,610,858 | ||||||||
| TECHNOLOGY SERVICES - 12.1% | ||||||||
| 344,170 | Conduent, Inc.(a) | 2,323,148 | ||||||
| 54,747 | Green Dot Corporation, Class A(a) | 2,319,083 | ||||||
| 24,633 | Insight Enterprises, Inc.(a) | 2,332,745 | ||||||
| 114,497 | Nielsen Holdings PLC | 2,318,564 | ||||||
| 9,293,540 | ||||||||
| TRANSPORTATION EQUIPMENT - 3.0% | ||||||||
| 81,914 | Trinity Industries, Inc. | 2,297,688 | ||||||
| WHOLESALE - DISCRETIONARY - 3.0% | ||||||||
| 41,811 | LKQ Corporation(a) | 2,302,950 | ||||||
The accompanying notes are an integral part of these financial statements.
| LEADERSHARES® ACTIVIST LEADERS ETF |
| SCHEDULE OF INVESTMENTS (Continued) |
| October 31, 2021 |
| Shares | Fair Value | |||||||
| TOTAL COMMON STOCKS (Cost $71,526,986) | $ | 76,403,932 | ||||||
| TOTAL INVESTMENTS - 99.3% (Cost $71,526,986) | $ | 76,403,932 | ||||||
| OTHER ASSETS IN EXCESS OF LIABILITIES - 0.7% | 557,215 | |||||||
| NET ASSETS - 100.0% | $ | 76,961,147 | ||||||
| LTD | - Limited Company |
| PLC | - Public Limited Company |
| (a) | Non-income producing security. |
| Diversification of Assets | ||||
| Country | % of Net Assets | |||
| United States | 81.4 | % | ||
| Canada | 6.0 | % | ||
| Jersey | 3.0 | % | ||
| United Kingdom | 3.0 | % | ||
| Ireland | 3.0 | % | ||
| Bermuda | 2.9 | % | ||
| Other Assets in excess of liabilities | 0.7 | % | ||
| Grand Total | 100.0 | % | ||
The accompanying notes are an integral part of these financial statements.
| LEADERSHARES® ALPHAFACTOR® TACTICAL FOCUSED ETF |
| SCHEDULE OF INVESTMENTS |
| October 31, 2021 |
| Shares | Fair Value | |||||||
| COMMON STOCKS — 98.9% | ||||||||
| AEROSPACE & DEFENSE - 3.4% | ||||||||
| 18,646 | L3Harris Technologies, Inc. | $ | 4,298,649 | |||||
| APPAREL & TEXTILE PRODUCTS - 3.7% | ||||||||
| 28,542 | NIKE, Inc., Class B | 4,774,791 | ||||||
| ASSET MANAGEMENT - 3.7% | ||||||||
| 15,541 | Ameriprise Financial, Inc. | 4,695,402 | ||||||
| AUTOMOTIVE - 3.5% | ||||||||
| 125,085 | Gentex Corporation | 4,426,758 | ||||||
| BIOTECH & PHARMA - 3.1% | ||||||||
| 19,335 | Amgen, Inc. | 4,001,765 | ||||||
| CABLE & SATELLITE - 5.8% | ||||||||
| 198,322 | Altice USA, Inc., Class A(a) | 3,232,649 | ||||||
| 676,562 | Sirius XM Holdings, Inc. | 4,120,262 | ||||||
| 7,352,911 | ||||||||
| COMMERCIAL SUPPORT SERVICES - 6.5% | ||||||||
| 164,817 | H&R Block, Inc. | 3,802,328 | ||||||
| 40,781 | Robert Half International, Inc. | 4,611,107 | ||||||
| 8,413,435 | ||||||||
| ELECTRICAL EQUIPMENT - 3.5% | ||||||||
| 24,987 | Keysight Technologies, Inc.(a) | 4,498,160 | ||||||
| HOUSEHOLD PRODUCTS - 3.2% | ||||||||
| 102,106 | Nu Skin Enterprises, Inc., Class A | 4,099,556 | ||||||
| INSTITUTIONAL FINANCIAL SERVICES - 7.1% | ||||||||
| 110,667 | Jefferies Financial Group, Inc. | 4,758,682 | ||||||
| 69,279 | SEI Investments Company | 4,367,348 | ||||||
| 9,126,030 | ||||||||
| INSURANCE - 16.4% | ||||||||
| 79,190 | Aflac, Inc. | 4,250,127 | ||||||
The accompanying notes are an integral part of these financial statements.
| LEADERSHARES® ALPHAFACTOR® TACTICAL FOCUSED ETF |
| SCHEDULE OF INVESTMENTS (Continued) |
| October 31, 2021 |
| Shares | Fair Value | |||||||
| COMMON STOCKS — 98.9% (Continued) | ||||||||
| INSURANCE -16.4% (Continued) | ||||||||
| 32,331 | Allstate Corporation | $ | 3,998,375 | |||||
| 32,809 | American Financial Group, Inc. | 4,463,337 | ||||||
| 15,070 | Berkshire Hathaway, Inc., Class B(a) | 4,325,241 | ||||||
| 31,680 | Hanover Insurance Group, Inc. | 3,991,680 | ||||||
| 21,028,760 | ||||||||
| INTERNET MEDIA & SERVICES - 3.5% | ||||||||
| 20,221 | VeriSign, Inc.(a) | 4,502,610 | ||||||
| MORTGAGE FINANCE - 3.2% | ||||||||
| 261,467 | AGNC Investment Corporation | 4,162,555 | ||||||
| OFFICE REIT - 6.4% | ||||||||
| 305,595 | Brandywine Realty Trust | 4,049,134 | ||||||
| 57,926 | SL Green Realty Corporation | 4,058,874 | ||||||
| 8,108,008 | ||||||||
| RETAIL - CONSUMER STAPLES - 9.7% | ||||||||
| 131,677 | Albertsons Companies, Inc. | 4,075,403 | ||||||
| 19,450 | Dollar General Corporation | 4,308,564 | ||||||
| 102,103 | Kroger Company | 4,086,162 | ||||||
| 12,470,129 | ||||||||
| SEMICONDUCTORS - 3.0% | ||||||||
| 77,536 | Intel Corporation | 3,799,264 | ||||||
| SOFTWARE - 3.5% | ||||||||
| 47,306 | Oracle Corporation | 4,538,538 | ||||||
| TECHNOLOGY HARDWARE - 9.7% | ||||||||
| 36,611 | Arrow Electronics, Inc.(a) | 4,237,723 | ||||||
| 150,909 | HP, Inc. | 4,577,070 | ||||||
| 202,821 | Xerox Holdings Corporation | 3,610,214 | ||||||
| 12,425,007 | ||||||||
The accompanying notes are an integral part of these financial statements.
| LEADERSHARES® ALPHAFACTOR® TACTICAL FOCUSED ETF |
| SCHEDULE OF INVESTMENTS (Continued) |
| October 31, 2021 |
| Shares | Fair Value | |||||||
| TOTAL COMMON STOCKS (Cost $117,735,829) | $ | 126,722,328 | ||||||
| TOTAL INVESTMENTS - 98.9% (Cost $117,735,829) | $ | 126,722,328 | ||||||
| OTHER ASSETS IN EXCESS OF LIABILITIES - 1.1% | 1,421,692 | |||||||
| NET ASSETS - 100.0% | $ | 128,144,020 | ||||||
| REIT | - Real Estate Investment Trust |
| (a) | Non-income producing security. |
The accompanying notes are an integral part of these financial statements.
| LEADERSHARES® ALPHAFACTOR® US CORE EQUITY ETF |
| SCHEDULE OF INVESTMENTS |
| October 31, 2021 |
| Shares | Fair Value | |||||||
| COMMON STOCKS — 98.5% | ||||||||
| AEROSPACE & DEFENSE - 1.9% | ||||||||
| 36,776 | Howmet Aerospace, Inc. | $ | 1,091,879 | |||||
| 16,434 | Textron, Inc. | 1,213,651 | ||||||
| 2,305,530 | ||||||||
| APPAREL & TEXTILE PRODUCTS - 1.0% | ||||||||
| 3,201 | Deckers Outdoor Corporation(a) | 1,265,387 | ||||||
| ASSET MANAGEMENT - 1.1% | ||||||||
| 4,355 | Ameriprise Financial, Inc. | 1,315,776 | ||||||
| BANKING - 6.0% | ||||||||
| 27,238 | Bank of America Corporation | 1,301,432 | ||||||
| 14,237 | Comerica, Inc. | 1,211,426 | ||||||
| 7,079 | JPMorgan Chase & Company | 1,202,651 | ||||||
| 53,115 | KeyCorporation | 1,235,986 | ||||||
| 14,922 | Popular, Inc. | 1,215,248 | ||||||
| 19,408 | US Bancorp | 1,171,661 | ||||||
| 7,338,404 | ||||||||
| CABLE & SATELLITE - 1.8% | ||||||||
| 1,589 | Charter Communications, Inc., Class A(a) | 1,072,400 | ||||||
| 6,690 | Liberty Broadband Corporation -Series C (a) | 1,086,791 | ||||||
| 2,159,191 | ||||||||
| CHEMICALS - 3.9% | ||||||||
| 7,622 | Celanese Corporation | 1,231,029 | ||||||
| 27,368 | Corteva, Inc. | 1,180,929 | ||||||
| 53,035 | Element Solutions, Inc. | 1,204,425 | ||||||
| 4,115 | Sherwin-Williams Company | 1,302,850 | ||||||
| 4,919,233 | ||||||||
| COMMERCIAL SUPPORT SERVICES - 2.8% | ||||||||
| 46,173 | H&R Block, Inc. | 1,065,211 | ||||||
| 10,694 | ManpowerGroup, Inc. | 1,033,575 | ||||||
| 11,412 | Robert Half International, Inc. | 1,290,355 | ||||||
| 3,389,141 | ||||||||
| CONSTRUCTION MATERIALS - 2.1% | ||||||||
| 5,831 | Carlisle Companies, Inc. | 1,299,846 | ||||||
The accompanying notes are an integral part of these financial statements.
| LEADERSHARES® ALPHAFACTOR® US CORE EQUITY ETF |
| SCHEDULE OF INVESTMENTS (Continued) |
| October 31, 2021 |
| Shares | Fair Value | |||||||
| COMMON STOCKS — 98.5% (Continued) | ||||||||
| CONSTRUCTION MATERIALS - 2.1% (Continued) | ||||||||
| 13,365 | Owens Corning | $ | 1,248,425 | |||||
| 2,548,271 | ||||||||
| CONSUMER SERVICES - 1.1% | ||||||||
| 19,094 | Service Corp International | 1,307,748 | ||||||
| CONTAINERS & PACKAGING - 2.0% | ||||||||
| 11,404 | Crown Holdings, Inc. | 1,185,902 | ||||||
| 20,979 | Sealed Air Corporation | 1,244,474 | ||||||
| 2,430,376 | ||||||||
| E-COMMERCE DISCRETIONARY - 1.0% | ||||||||
| 16,524 | eBay, Inc. | 1,267,721 | ||||||
| ELECTRICAL EQUIPMENT - 2.1% | ||||||||
| 6,637 | Acuity Brands, Inc. | 1,363,439 | ||||||
| 7,009 | Keysight Technologies, Inc.(a) | 1,261,760 | ||||||
| 2,625,199 | ||||||||
| ENGINEERING & CONSTRUCTION - 1.0% | ||||||||
| 18,210 | AECOM(a) | 1,245,018 | ||||||
| FORESTRY, PAPER & WOOD PRODUCTS - 0.9% | ||||||||
| 18,617 | Louisiana-Pacific Corporation | 1,097,100 | ||||||
| HEALTH CARE FACILITIES & SERVICES - 5.7% | ||||||||
| 9,876 | DaVita, Inc.(a) | 1,019,598 | ||||||
| 4,727 | HCA Healthcare, Inc. | 1,183,924 | ||||||
| 4,068 | Laboratory Corp of America Holdings(a) | 1,167,597 | ||||||
| 5,755 | McKesson Corporation | 1,196,349 | ||||||
| 4,229 | Molina Healthcare, Inc.(a) | 1,250,601 | ||||||
| 7,916 | Quest Diagnostics, Inc. | 1,161,910 | ||||||
| 6,979,979 | ||||||||
| HOME & OFFICE PRODUCTS - 0.9% | ||||||||
| 24,581 | Tempur Sealy International, Inc. | 1,093,117 | ||||||
The accompanying notes are an integral part of these financial statements.
| LEADERSHARES® ALPHAFACTOR® US CORE EQUITY ETF |
| SCHEDULE OF INVESTMENTS (Continued) |
| October 31, 2021 |
| Shares | Fair Value | |||||||
| COMMON STOCKS — 98.5% (Continued) | ||||||||
| HOME CONSTRUCTION - 1.9% | ||||||||
| 6,481 | Mohawk Industries, Inc.(a) | $ | 1,148,498 | |||||
| 20,698 | Toll Brothers, Inc. | 1,245,399 | ||||||
| 2,393,897 | ||||||||
| INSTITUTIONAL FINANCIAL SERVICES - 4.2% | ||||||||
| 22,172 | Bank of New York Mellon Corporation (The) | 1,312,582 | ||||||
| 8,619 | Evercore, Inc., Class A | 1,308,709 | ||||||
| 3,060 | Goldman Sachs Group, Inc. | 1,264,851 | ||||||
| 13,596 | State Street Corporation | 1,339,886 | ||||||
| 5,226,028 | ||||||||
| INSURANCE - 9.8% | ||||||||
| 22,197 | Aflac, Inc. | 1,191,313 | ||||||
| 9,060 | Allstate Corporation (The) | 1,120,450 | ||||||
| 9,188 | American Financial Group, Inc. | 1,249,936 | ||||||
| 4,218 | Berkshire Hathaway, Inc., Class B(a) | 1,210,608 | ||||||
| 38,807 | Equitable Holdings, Inc. | 1,300,034 | ||||||
| 16,421 | Hartford Financial Services Group, Inc. (The) | 1,197,584 | ||||||
| 16,757 | Lincoln National Corporation | 1,209,018 | ||||||
| 21,425 | Loews Corporation | 1,201,300 | ||||||
| 18,741 | MetLife, Inc. | 1,176,935 | ||||||
| 11,029 | Prudential Financial, Inc. | 1,213,741 | ||||||
| 12,070,919 | ||||||||
| INTERNET MEDIA & SERVICES - 1.9% | ||||||||
| 431 | Alphabet, Inc., Class A(a) | 1,276,156 | ||||||
| 3,401 | Meta Platforms, Inc., Class A(a) | 1,100,462 | ||||||
| 2,376,618 | ||||||||
| LEISURE FACILITIES & SERVICES - 1.0% | ||||||||
| 2,425 | Domino’s Pizza, Inc. | 1,185,752 | ||||||
| MACHINERY - 0.9% | ||||||||
| 11,793 | Toro Company | 1,125,878 | ||||||
| MEDICAL EQUIPMENT & DEVICES - 3.8% | ||||||||
| 7,706 | Hill-Rom Holdings, Inc. | 1,193,659 | ||||||
| 15,606 | Hologic, Inc.(a) | 1,144,076 | ||||||
The accompanying notes are an integral part of these financial statements.
| LEADERSHARES® ALPHAFACTOR® US CORE EQUITY ETF |
| SCHEDULE OF INVESTMENTS (Continued) |
| October 31, 2021 |
| Shares | Fair Value | |||||||
| COMMON STOCKS — 98.5% (Continued) | ||||||||
| MEDICAL EQUIPMENT & DEVICES - 3.8% (Continued) | ||||||||
| 828 | Mettler-Toledo International, Inc.(a) | $ | 1,226,169 | |||||
| 3,196 | Waters Corporation(a) | 1,174,690 | ||||||
| 4,738,594 | ||||||||
| PUBLISHING & BROADCASTING - 0.9% | ||||||||
| 7,560 | Nexstar Media Group, Inc., Class A | 1,133,471 | ||||||
| RESIDENTIAL REIT - 1.0% | ||||||||
| 30,155 | American Homes 4 Rent, Class A | 1,224,293 | ||||||
| RETAIL - CONSUMER STAPLES - 3.0% | ||||||||
| 5,448 | Dollar General Corporation | 1,206,841 | ||||||
| 28,566 | Kroger Company | 1,143,211 | ||||||
| 5,045 | Target Corporation | 1,309,783 | ||||||
| 3,659,835 | ||||||||
| RETAIL - DISCRETIONARY - 10.8% | ||||||||
| 5,496 | Advance Auto Parts, Inc. | 1,239,458 | ||||||
| 9,396 | AutoNation, Inc.(a) | 1,138,044 | ||||||
| 676 | AutoZone, Inc.(a) | 1,206,552 | ||||||
| 18,115 | Bath & Body Works, Inc. | 1,251,565 | ||||||
| 9,482 | Dick’s Sporting Goods, Inc. | 1,177,759 | ||||||
| 24,283 | Kohl’s Corporation | 1,178,454 | ||||||
| 5,685 | Lowe’s Companies, Inc. | 1,329,266 | ||||||
| 1,884 | O’Reilly Automotive, Inc.(a) | 1,172,451 | ||||||
| 5,675 | Tractor Supply Company | 1,232,440 | ||||||
| 3,174 | Ulta Beauty, Inc.(a) | 1,166,001 | ||||||
| 6,446 | Williams-Sonoma, Inc. | 1,197,216 | ||||||
| 13,289,206 | ||||||||
| SEMICONDUCTORS - 3.9% | ||||||||
| 8,966 | Applied Materials, Inc. | 1,225,204 | ||||||
| 14,045 | Cirrus Logic, Inc.(a) | 1,134,976 | ||||||
| 3,432 | KLA Corporation | 1,279,312 | ||||||
| 6,851 | Qorvo, Inc.(a) | 1,152,544 | ||||||
| 4,792,036 | ||||||||
The accompanying notes are an integral part of these financial statements.
| LEADERSHARES® ALPHAFACTOR® US CORE EQUITY ETF |
| SCHEDULE OF INVESTMENTS (Continued) |
| October 31, 2021 |
| Shares | Fair Value | |||||||
| COMMON STOCKS — 98.5% (Continued) | ||||||||
| SOFTWARE - 2.0% | ||||||||
| 39,665 | Dropbox, Inc., Class A(a) | $ | 1,209,386 | |||||
| 13,231 | Oracle Corporation | 1,269,382 | ||||||
| 2,478,768 | ||||||||
| SPECIALTY FINANCE - 4.5% | ||||||||
| 22,526 | Ally Financial, Inc. | 1,075,391 | ||||||
| 7,087 | Capital One Financial Corporation | 1,070,350 | ||||||
| 9,356 | Discover Financial Services | 1,060,222 | ||||||
| 66,559 | SLM Corporation | 1,221,357 | ||||||
| 23,504 | Synchrony Financial | 1,091,761 | ||||||
| 5,519,081 | ||||||||
| STEEL - 2.1% | ||||||||
| 11,651 | Nucor Corporation | 1,300,835 | ||||||
| 19,568 | Steel Dynamics, Inc. | 1,293,053 | ||||||
| 2,593,888 | ||||||||
| TECHNOLOGY HARDWARE - 4.0% | ||||||||
| 8,157 | Apple, Inc. | 1,221,919 | ||||||
| 10,258 | Arrow Electronics, Inc.(a) | 1,187,364 | ||||||
| 42,397 | HP, Inc. | 1,285,901 | ||||||
| 19,768 | Jabil, Inc. | 1,185,289 | ||||||
| 4,880,473 | ||||||||
| TECHNOLOGY SERVICES - 2.1% | ||||||||
| 3,816 | Gartner, Inc.(a) | 1,266,569 | ||||||
| 3,250 | Moody’s Corporation | 1,313,487 | ||||||
| 2,580,056 | ||||||||
| TRANSPORTATION & LOGISTICS - 3.4% | ||||||||
| 38,838 | CSX Corporation | 1,404,770 | ||||||
| 4,799 | Norfolk Southern Corporation | 1,406,347 | ||||||
| 3,996 | Old Dominion Freight Line, Inc. | 1,364,035 | ||||||
| 4,175,152 | ||||||||
| TRANSPORTATION EQUIPMENT - 1.0% | ||||||||
| 5,093 | Cummins, Inc. | 1,221,505 | ||||||
The accompanying notes are an integral part of these financial statements.
| LEADERSHARES® ALPHAFACTOR® US CORE EQUITY ETF |
| SCHEDULE OF INVESTMENTS (Continued) |
| October 31, 2021 |
| Shares | Fair Value | |||||||
| COMMON STOCKS — 98.5% (Continued) | ||||||||
| WHOLESALE - DISCRETIONARY - 1.0% | ||||||||
| 22,935 | LKQ Corporation(a) | $ | 1,263,260 | |||||
| TOTAL COMMON STOCKS (Cost $115,361,492) | 121,215,901 | |||||||
| TOTAL INVESTMENTS - 98.5% (Cost $115,361,492) | $ | 121,215,901 | ||||||
| OTHER ASSETS IN EXCESS OF LIABILITIES - 1.5% | 1,877,187 | |||||||
| NET ASSETS - 100.0% | $ | 123,093,088 | ||||||
| REIT | - Real Estate Investment Trust |
| (a) | Non-income producing security. |
The accompanying notes are an integral part of these financial statements.
| LEADERSHARES® EQUITY SKEW ETF |
| SCHEDULE OF INVESTMENTS |
| October 31, 2021 |
| Shares | Fair Value | |||||||
| COMMON STOCKS — 28.0% | ||||||||
| AEROSPACE & DEFENSE - 0.8% | ||||||||
| 1,242 | Boeing Company(a) | $ | 257,131 | |||||
| 514 | General Dynamics Corporation | 104,214 | ||||||
| 297 | Lockheed Martin Corporation | 98,699 | ||||||
| 327 | Northrop Grumman Corporation | 116,811 | ||||||
| 3,445 | Raytheon Technologies Corporation | 306,122 | ||||||
| 882,977 | ||||||||
| APPAREL & TEXTILE PRODUCTS - 0.2% | ||||||||
| 1,067 | NIKE, Inc., Class B | 178,498 | ||||||
| ASSET MANAGEMENT - 0.4% | ||||||||
| 260 | Ameriprise Financial, Inc. | 78,554 | ||||||
| 93 | BlackRock, Inc. | 87,742 | ||||||
| 3,504 | Charles Schwab Corporation | 287,433 | ||||||
| 453,729 | ||||||||
| AUTOMOTIVE - 0.3% | ||||||||
| 8,616 | Ford Motor Company(a) | 147,161 | ||||||
| 3,249 | General Motors Company(a) | 176,843 | ||||||
| 324,004 | ||||||||
| BANKING - 3.2% | ||||||||
| 16,584 | Bank of America Corporation | 792,384 | ||||||
| 4,636 | Citigroup, Inc. | 320,626 | ||||||
| 6,738 | JPMorgan Chase & Company | 1,144,719 | ||||||
| 948 | PNC Financial Services Group, Inc. | 200,056 | ||||||
| 2,958 | Truist Financial Corporation | 187,744 | ||||||
| 3,052 | US Bancorp | 184,249 | ||||||
| 9,570 | Wells Fargo & Company | 489,601 | ||||||
| 3,319,379 | ||||||||
| BEVERAGES - 0.7% | ||||||||
| 5,851 | Coca-Cola Company | 329,822 | ||||||
| 383 | Constellation Brands, Inc., Class A | 83,038 | ||||||
| 1,854 | PepsiCo, Inc. | 299,606 | ||||||
| 712,466 | ||||||||
| BIOTECH & PHARMA - 2.2% | ||||||||
| 1,024 | AbbVie, Inc. | 117,422 | ||||||
The accompanying notes are an integral part of these financial statements.
| LEADERSHARES® EQUITY SKEW ETF |
| SCHEDULE OF INVESTMENTS (Continued) |
| October 31, 2021 |
| Shares | Fair Value | |||||||
| COMMON STOCKS — 28.0% (Continued) | ||||||||
| BIOTECH & PHARMA - 2.2% (Continued) | ||||||||
| 637 | Amgen, Inc. | $ | 131,840 | |||||
| 2,433 | Bristol-Myers Squibb Company | 142,087 | ||||||
| 697 | Eli Lilly & Company | 177,568 | ||||||
| 2,867 | Gilead Sciences, Inc. | 186,011 | ||||||
| 3,622 | Johnson & Johnson | 589,951 | ||||||
| 2,914 | Merck & Company, Inc. | 256,578 | ||||||
| 369 | Moderna, Inc.(a) | 127,382 | ||||||
| 12,861 | Pfizer, Inc. | 562,540 | ||||||
| 2,291,379 | ||||||||
| CABLE & SATELLITE - 0.3% | ||||||||
| 5,834 | Comcast Corporation, Class A | 300,043 | ||||||
| CHEMICALS - 0.4% | ||||||||
| 270 | Air Products and Chemicals, Inc. | 80,949 | ||||||
| 1,677 | Corteva, Inc. | 72,363 | ||||||
| 1,179 | DuPont de Nemours, Inc. | 82,058 | ||||||
| 317 | Ecolab, Inc. | 70,444 | ||||||
| 559 | International Flavors & Fragrances, Inc. | 82,425 | ||||||
| 546 | PPG Industries, Inc. | 87,670 | ||||||
| 475,909 | ||||||||
| COMMERCIAL SUPPORT SERVICES - 0.1% | ||||||||
| 545 | Waste Management, Inc. | 87,325 | ||||||
| DATA CENTER REIT - 0.2% | ||||||||
| 663 | Digital Realty Trust, Inc. | 104,628 | ||||||
| 83 | Equinix, Inc. | 69,477 | ||||||
| 174,105 | ||||||||
| DIVERSIFIED INDUSTRIALS - 1.0% | ||||||||
| 1,337 | 3M Company | 238,895 | ||||||
| 827 | Emerson Electric Company | 80,227 | ||||||
| 2,485 | General Electric Company | 260,603 | ||||||
| 1,610 | Honeywell International, Inc. | 351,979 | ||||||
| 375 | Illinois Tool Works, Inc. | 85,451 | ||||||
| 1,017,155 | ||||||||
The accompanying notes are an integral part of these financial statements.
| LEADERSHARES® EQUITY SKEW ETF |
| SCHEDULE OF INVESTMENTS (Continued) |
| October 31, 2021 |
| Shares | Fair Value | |||||||
| COMMON STOCKS — 28.0% (Continued) | ||||||||
| ELECTRIC UTILITIES - 1.1% | ||||||||
| 1,140 | American Electric Power Company, Inc. | $ | 96,569 | |||||
| 1,852 | Dominion Energy, Inc. | 140,622 | ||||||
| 1,747 | Duke Energy Corporation | 178,211 | ||||||
| 2,258 | Exelon Corporation | 120,103 | ||||||
| 2,593 | NextEra Energy, Inc. | 221,261 | ||||||
| 1,129 | Public Service Enterprise Group, Inc. | 72,030 | ||||||
| 725 | Sempra Energy | 92,532 | ||||||
| 2,428 | Southern Company | 151,313 | ||||||
| 1,240 | Xcel Energy, Inc. | 80,092 | ||||||
| 1,152,733 | ||||||||
| ENTERTAINMENT CONTENT - 0.7% | ||||||||
| 4,248 | Walt Disney Company(a) | 718,209 | ||||||
| FOOD - 0.3% | ||||||||
| 1,385 | General Mills, Inc. | 85,593 | ||||||
| 3,265 | Mondelez International, Inc., Class A | 198,316 | ||||||
| 283,909 | ||||||||
| HEALTH CARE FACILITIES & SERVICES - 1.4% | ||||||||
| 554 | Anthem, Inc. | 241,062 | ||||||
| 1,326 | Centene Corporation(a) | 94,464 | ||||||
| 772 | Cigna Corporation | 164,907 | ||||||
| 2,953 | CVS Health Corporation | 263,644 | ||||||
| 582 | HCA Healthcare, Inc. | 145,768 | ||||||
| 353 | McKesson Corporation | 73,382 | ||||||
| 1,060 | UnitedHealth Group, Inc. | 488,098 | ||||||
| 1,471,325 | ||||||||
| HEALTH CARE REIT - 0.1% | ||||||||
| 944 | Welltower, Inc. | 75,898 | ||||||
| HOUSEHOLD PRODUCTS - 0.5% | ||||||||
| 927 | Colgate-Palmolive Company | 70,628 | ||||||
| 244 | Estee Lauder Companies, Inc., Class A | 79,137 | ||||||
| 2,916 | Procter & Gamble Company | 416,958 | ||||||
| 566,723 | ||||||||
The accompanying notes are an integral part of these financial statements.
| LEADERSHARES® EQUITY SKEW ETF |
| SCHEDULE OF INVESTMENTS (Continued) |
| October 31, 2021 |
| Shares | Fair Value | |||||||
| COMMON STOCKS — 28.0% (Continued) | ||||||||
| INDUSTRIAL REIT - 0.2% | ||||||||
| 1,692 | Prologis, Inc. | $ | 245,272 | |||||
| INFRASTRUCTURE REIT - 0.2% | ||||||||
| 528 | American Tower Corporation | 148,880 | ||||||
| 405 | Crown Castle International Corporation | 73,022 | ||||||
| 221,902 | ||||||||
| INSTITUTIONAL FINANCIAL SERVICES - 1.1% | ||||||||
| 1,767 | Bank of New York Mellon Corporation | 104,606 | ||||||
| 824 | CME Group, Inc. | 181,733 | ||||||
| 781 | Goldman Sachs Group, Inc. | 322,826 | ||||||
| 604 | Intercontinental Exchange, Inc. | 83,630 | ||||||
| 3,476 | Morgan Stanley | 357,264 | ||||||
| 775 | State Street Corporation | 76,376 | ||||||
| 1,126,435 | ||||||||
| INSURANCE - 1.8% | ||||||||
| 1,404 | Aflac, Inc. | 75,353 | ||||||
| 682 | Allstate Corporation | 84,343 | ||||||
| 1,915 | American International Group, Inc. | 113,157 | ||||||
| 4,243 | Berkshire Hathaway, Inc., Class B(a) | 1,217,783 | ||||||
| 610 | Marsh & McLennan Companies, Inc. | 101,748 | ||||||
| 1,632 | MetLife, Inc. | 102,490 | ||||||
| 859 | Prudential Financial, Inc. | 94,533 | ||||||
| 581 | Travelers Companies, Inc. | 93,471 | ||||||
| 1,882,878 | ||||||||
| INTERNET MEDIA & SERVICES - 0.1% | ||||||||
| 56 | Booking Holdings, Inc.(a) | 135,564 | ||||||
| LEISURE FACILITIES & SERVICES - 0.5% | ||||||||
| 633 | Marriott International, Inc., Class A(a) | 101,293 | ||||||
| 1,035 | McDonald’s Corporation | 254,144 | ||||||
| 1,156 | Starbucks Corporation | 122,617 | ||||||
| 478,054 | ||||||||
| MACHINERY - 0.2% | ||||||||
| 662 | Caterpillar, Inc. | 135,055 | ||||||
The accompanying notes are an integral part of these financial statements.
| LEADERSHARES® EQUITY SKEW ETF |
| SCHEDULE OF INVESTMENTS (Continued) |
| October 31, 2021 |
| Shares | Fair Value | |||||||
| COMMON STOCKS — 28.0% (Continued) | ||||||||
| MACHINERY - 0.2% (Continued) | ||||||||
| 380 | Stanley Black & Decker, Inc. | $ | 68,297 | |||||
| 203,352 | ||||||||
| MEDICAL EQUIPMENT & DEVICES - 1.1% | ||||||||
| 1,719 | Abbott Laboratories | 221,562 | ||||||
| 1,135 | Baxter International, Inc. | 89,620 | ||||||
| 659 | Becton Dickinson and Company | 157,890 | ||||||
| 3,279 | Boston Scientific Corporation(a) | 141,423 | ||||||
| 484 | Danaher Corporation | 150,897 | ||||||
| 631 | Edwards Lifesciences Corporation(a) | 75,606 | ||||||
| 171 | Illumina, Inc.(a) | 70,975 | ||||||
| 237 | Intuitive Surgical, Inc.(a) | 85,588 | ||||||
| 399 | Stryker Corporation | 106,162 | ||||||
| 482 | Zimmer Biomet Holdings, Inc. | 68,984 | ||||||
| 1,168,707 | ||||||||
| OIL & GAS PRODUCERS - 1.7% | ||||||||
| 4,313 | Chevron Corporation | 493,795 | ||||||
| 2,883 | ConocoPhillips | 214,755 | ||||||
| 1,279 | EOG Resources, Inc. | 118,256 | ||||||
| 9,331 | Exxon Mobil Corporation | 601,570 | ||||||
| 4,328 | Kinder Morgan, Inc. | 72,494 | ||||||
| 1,440 | Marathon Petroleum Corporation | 94,939 | ||||||
| 962 | Phillips 66 | 71,938 | ||||||
| 495 | Pioneer Natural Resources Company | 92,555 | ||||||
| 2,674 | Williams Companies, Inc. (The) | 75,113 | ||||||
| 1,835,415 | ||||||||
| REAL ESTATE SERVICES - 0.1% | ||||||||
| 747 | CBRE Group, Inc., Class A(a) | 77,748 | ||||||
| RESIDENTIAL REIT - 0.1% | ||||||||
| 315 | AvalonBay Communities, Inc. | 74,554 | ||||||
| RETAIL - CONSUMER STAPLES - 0.8% | ||||||||
| 487 | Costco Wholesale Corporation | 239,380 | ||||||
| 396 | Target Corporation | 102,810 | ||||||
The accompanying notes are an integral part of these financial statements.
| LEADERSHARES® EQUITY SKEW ETF |
| SCHEDULE OF INVESTMENTS (Continued) |
| October 31, 2021 |
| Shares | Fair Value | |||||||
| COMMON STOCKS — 28.0% (Continued) | ||||||||
| RETAIL - CONSUMER STAPLES - 0.8% (Continued) | ||||||||
| 1,654 | Walgreens Boots Alliance, Inc. | $ | 77,771 | |||||
| 3,317 | Walmart, Inc. | 495,626 | ||||||
| 915,587 | ||||||||
| RETAIL - DISCRETIONARY - 0.5% | ||||||||
| 689 | Home Depot, Inc. | 256,129 | ||||||
| 472 | Lowe’s Companies, Inc. | 110,363 | ||||||
| 855 | Ross Stores, Inc. | 96,786 | ||||||
| 2,912 | TJX Companies, Inc. | 190,707 | ||||||
| 653,985 | ||||||||
| RETAIL REIT - 0.1% | ||||||||
| 755 | Simon Property Group, Inc. | 110,668 | ||||||
| SEMICONDUCTORS - 1.1% | ||||||||
| 732 | Analog Devices, Inc. | 126,995 | ||||||
| 303 | Broadcom, Inc. | 161,096 | ||||||
| 9,327 | Intel Corporation | 457,023 | ||||||
| 2,631 | Micron Technology, Inc. | 181,802 | ||||||
| 1,023 | Texas Instruments, Inc. | 191,792 | ||||||
| 1,118,708 | ||||||||
| SOFTWARE - 0.2% | ||||||||
| 1,717 | Oracle Corporation | 164,729 | ||||||
| SPECIALTY FINANCE - 0.5% | ||||||||
| 1,512 | American Express Company | 262,755 | ||||||
| 1,029 | Capital One Financial Corporation | 155,410 | ||||||
| 711 | Discover Financial Services | 80,571 | ||||||
| 498,736 | ||||||||
| STEEL - 0.1% | ||||||||
| 675 | Nucor Corporation | 75,364 | ||||||
| TECHNOLOGY HARDWARE - 0.6% | ||||||||
| 9,928 | Cisco Systems, Inc. | 555,670 | ||||||
| 2,760 | HP, Inc. | 83,711 | ||||||
| 639,381 | ||||||||
The accompanying notes are an integral part of these financial statements.
| LEADERSHARES® EQUITY SKEW ETF |
| SCHEDULE OF INVESTMENTS (Continued) |
| October 31, 2021 |
| Shares | Fair Value | |||||||
| COMMON STOCKS — 28.0% (Continued) | ||||||||
| TECHNOLOGY SERVICES - 1.0% | ||||||||
| 504 | Automatic Data Processing, Inc. | $ | 113,143 | |||||
| 1,396 | Fidelity National Information Services, Inc. | 154,593 | ||||||
| 672 | Global Payments, Inc. | 96,089 | ||||||
| 1,994 | International Business Machines Corporation | 249,449 | ||||||
| 643 | Mastercard, Inc., Class A | 215,739 | ||||||
| 1,574 | Visa, Inc., Class A | 333,327 | ||||||
| 1,162,340 | ||||||||
| TELECOMMUNICATIONS - 0.9% | ||||||||
| 16,212 | AT&T, Inc. | 409,515 | ||||||
| 9,436 | Verizon Communications, Inc. | 500,013 | ||||||
| 909,528 | ||||||||
| TOBACCO & CANNABIS - 0.5% | ||||||||
| 4,405 | Altria Group, Inc. | 194,305 | ||||||
| 3,760 | Philip Morris International, Inc. | 355,470 | ||||||
| 549,775 | ||||||||
| TRANSPORTATION & LOGISTICS - 0.5% | ||||||||
| 2,525 | CSX Corporation | 91,329 | ||||||
| 307 | Norfolk Southern Corporation | 89,966 | ||||||
| 1,374 | Southwest Airlines Company(a) | 64,963 | ||||||
| 786 | Union Pacific Corporation | 189,741 | ||||||
| 501 | United Parcel Service, Inc., Class B | 106,948 | ||||||
| 542,947 | ||||||||
| WHOLESALE -CONSUMER STAPLES - 0.2% | ||||||||
| 1,250 | Archer-Daniels-Midland Company | 80,300 | ||||||
| 1,180 | Sysco Corporation | 90,742 | ||||||
| 171,042 | ||||||||
| TOTAL COMMON STOCKS (Cost $27,229,042) | 29,448,437 | |||||||
| Shares | Fair Value | |||||||
| EXCHANGE-TRADED FUNDS — 71.1% | ||||||||
| EQUITY - 71.1% | ||||||||
| 239,168 | SPDR Portfolio Emerging Markets ETF | 10,312,924 | ||||||
| 15,754 | SPDR Portfolio S&P 500 Growth ETF | 1,100,259 | ||||||
The accompanying notes are an integral part of these financial statements.
| LEADERSHARES® EQUITY SKEW ETF |
| SCHEDULE OF INVESTMENTS (Continued) |
| October 31, 2021 |
| Shares | Fair Value | |||||||
| EXCHANGE-TRADED FUNDS — 71.1% (Continued) | ||||||||
| EQUITY - 71.1% (Continued) | ||||||||
| 404,368 | SPDR S&P 600 Small Cap Growth ETF | $ | 36,700,440 | |||||
| 319,823 | SPDR S&P 600 Small CapValue ETF | 26,964,277 | ||||||
| 75,077,900 | ||||||||
| TOTAL EXCHANGE-TRADED FUNDS (Cost $71,847,935) | 75,077,900 | |||||||
| TOTAL INVESTMENTS - 99.1% (Cost $99,076,977) | $ | 104,526,337 | ||||||
| OTHER ASSETS IN EXCESS OF LIABILITIES - 0.9% | 951,868 | |||||||
| NET ASSETS - 100.0% | $ | 105,478,205 | ||||||
| ETF | - Exchange-Traded Fund |
| REIT | - Real Estate Investment Trust |
| SPDR | - Standard & Poor’s Depositary Receipt |
| (a) | Non-income producing security. |
The accompanying notes are an integral part of these financial statements.
| LEADERSHARES® DYNAMIC YIELD ETF |
| SCHEDULE OF INVESTMENTS |
| October 31, 2021 |
| Principal | Coupon Rate | |||||||||||||
| Amount ($) | Spread | (%) | Maturity | Fair Value | ||||||||||
| CORPORATE BONDS — 69.1% | ||||||||||||||
| AEROSPACE & DEFENSE — 2.7% | ||||||||||||||
| 156,000 | Boeing Company (The) | 4.8750 | 05/01/25 | $ | 172,414 | |||||||||
| 196,000 | Boeing Company (The) | 2.1960 | 02/04/26 | 196,565 | ||||||||||
| 156,000 | Boeing Company (The) | 5.1500 | 05/01/30 | 182,173 | ||||||||||
| 104,000 | Boeing Company (The) | 5.7050 | 05/01/40 | 133,733 | ||||||||||
| 104,000 | Boeing Company (The) | 5.8050 | 05/01/50 | 142,684 | ||||||||||
| 104,000 | Boeing Company (The) | 5.9300 | 05/01/60 | 146,404 | ||||||||||
| 305,000 | Bombardier, Inc.(a) | 7.8750 | 04/15/27 | 317,481 | ||||||||||
| 22,000 | Howmet Aerospace, Inc. | 6.8750 | 05/01/25 | 25,520 | ||||||||||
| 156,000 | Raytheon Technologies Corporation | 4.1250 | 11/16/28 | 176,954 | ||||||||||
| 104,000 | Raytheon Technologies Corporation | 4.5000 | 06/01/42 | 128,057 | ||||||||||
| 305,000 | TransDigm, Inc. | 5.5000 | 11/15/27 | 312,625 | ||||||||||
| 1,934,610 | ||||||||||||||
| AUTOMOTIVE — 2.0% | ||||||||||||||
| 208,000 | Ford Motor Company | 9.0000 | 04/22/25 | 250,380 | ||||||||||
| 208,000 | Ford Motor Company | 9.6250 | 04/22/30 | 299,911 | ||||||||||
| 208,000 | Ford Motor Company | 7.4500 | 07/16/31 | 275,600 | ||||||||||
| 305,000 | Ford Motor Company | 4.7500 | 01/15/43 | 333,176 | ||||||||||
| 260,000 | Ford Motor Company | 5.2910 | 12/08/46 | 299,339 | ||||||||||
| 1,458,406 | ||||||||||||||
| BANKING — 7.7% | ||||||||||||||
| 196,000 | Bank of America Corporation | 3.3000 | 01/11/23 | 202,609 | ||||||||||
| 196,000 | Bank of America Corporation(b) | US0003M + 0.790% | 3.0040 | 12/20/23 | 201,206 | |||||||||
| 196,000 | Bank of America Corporation(b) | SOFRRATE + 0.960% | 1.7340 | 07/22/27 | 194,832 | |||||||||
| 196,000 | Bank of America Corporation(b) | US0003M + 1.040% | 3.4190 | 12/20/28 | 209,737 | |||||||||
| 156,000 | Bank of America Corporation(b) | US0003M + 1.310% | 4.2710 | 07/23/29 | 175,621 | |||||||||
| 156,000 | Bank of America Corporation(b) | ICE LIBOR USD 3 Month + 1.210% | 3.9740 | 02/07/30 | 173,554 | |||||||||
| 196,000 | Bank of America Corporation(b) | US0003M + 0.990% | 2.4960 | 02/13/31 | 196,803 | |||||||||
| 196,000 | Bank of America Corporation(b) | SOFRRATE + 1.320% | 2.6870 | 04/22/32 | 198,722 | |||||||||
| 196,000 | Bank of America Corporation(b) | SOFRRATE + 1.930% | 2.6760 | 06/19/41 | 189,155 | |||||||||
| 196,000 | Bank of America Corporation(b) | SOFRRATE + 1.580% | 3.3110 | 04/22/42 | 207,714 | |||||||||
| 156,000 | Bank of America Corporation B(b) | US0003M + 3.150% | 4.0830 | 03/20/51 | 188,483 | |||||||||
The accompanying notes are an integral part of these financial statements.
| LEADERSHARES® DYNAMIC YIELD ETF |
| SCHEDULE OF INVESTMENTS (Continued) |
| October 31, 2021 |
| Principal | Coupon Rate | |||||||||||||
| Amount ($) | Spread | (%) | Maturity | Fair Value | ||||||||||
| CORPORATE BONDS — 69.1% (Continued) | ||||||||||||||
| BANKING — 7.7% (Continued) | ||||||||||||||
| 196,000 | Citigroup, Inc.(b) | SOFRRATE + 2.842% | 3.1060 | 04/08/26 | $ | 206,534 | ||||||||
| 156,000 | Citigroup, Inc. | 4.4500 | 09/29/27 | 175,067 | ||||||||||
| 156,000 | Citigroup, Inc.(b) | SOFRRATE + 3.914% | 4.4120 | 03/31/31 | 178,988 | |||||||||
| 196,000 | Citigroup, Inc.(b) | SOFRRATE + 2.107% | 2.5720 | 06/03/31 | 197,863 | |||||||||
| 196,000 | JPMorgan Chase & Company(b) | SOFRRATE + 1.850% | 2.0830 | 04/22/26 | 200,008 | |||||||||
| 196,000 | JPMorgan Chase & Company(b) | SOFRRATE + 0.885% | 1.5780 | 04/22/27 | 194,224 | |||||||||
| 196,000 | JPMorgan Chase & Company(b) | SOFRRATE + 1.510% | 2.7390 | 10/15/30 | 201,110 | |||||||||
| 156,000 | JPMorgan Chase & Company(b) | SOFRRATE + 3.790% | 4.4930 | 03/24/31 | 181,127 | |||||||||
| 196,000 | JPMorgan Chase & Company(b) | SOFRRATE + 1.250% | 2.5800 | 04/22/32 | 197,937 | |||||||||
| 104,000 | JPMorgan Chase & Company | 6.4000 | 05/15/38 | 150,956 | ||||||||||
| 156,000 | JPMorgan Chase & Company(b) | US0003M + 1.380% | 3.9640 | 11/15/48 | 184,012 | |||||||||
| 156,000 | JPMorgan Chase & Company(b) | SOFRRATE + 1.580% | 3.3280 | 04/22/52 | 168,514 | |||||||||
| 196,000 | Wells Fargo & Company | 3.0000 | 04/22/26 | 207,567 | ||||||||||
| 196,000 | Wells Fargo & Company | 3.0000 | 10/23/26 | 207,144 | ||||||||||
| 196,000 | Wells Fargo & Company(b) | SOFRRATE + 2.100% | 2.3930 | 06/02/28 | 199,325 | |||||||||
| 196,000 | Wells Fargo & Company(b) | US0003M + 1.170% | 2.8790 | 10/30/30 | 203,321 | |||||||||
| 196,000 | Wells Fargo & Company(b) | SOFRRATE + 2.530% | 3.0680 | 04/30/41 | 201,192 | |||||||||
| 104,000 | Wells Fargo & Company(b) | US0003M + 4.240% | 5.0130 | 04/04/51 | 143,703 | |||||||||
| 5,537,028 | ||||||||||||||
| BEVERAGES — 1.0% | ||||||||||||||
| 156,000 | Anheuser-Busch Companies, LLC / Anheuser-Busch | 3.6500 | 02/01/26 | 169,671 | ||||||||||
| 104,000 | Anheuser-Busch Companies, LLC / Anheuser-Busch | 4.7000 | 02/01/36 | 126,007 | ||||||||||
| 104,000 | Anheuser-Busch Companies, LLC / Anheuser-Busch | 4.9000 | 02/01/46 | 132,373 | ||||||||||
| 104,000 | Anheuser-Busch InBev Worldwide, Inc. | 4.7500 | 01/23/29 | 122,224 | ||||||||||
| 104,000 | Anheuser-Busch InBev Worldwide, Inc. | 5.5500 | 01/23/49 | 145,924 | ||||||||||
| 696,199 | ||||||||||||||
| BIOTECH & PHARMA — 4.1% | ||||||||||||||
| 196,000 | AbbVie, Inc. | 2.6000 | 11/21/24 | 204,174 | ||||||||||
| 196,000 | AbbVie, Inc. | 3.6000 | 05/14/25 | 210,245 | ||||||||||
The accompanying notes are an integral part of these financial statements.
| LEADERSHARES® DYNAMIC YIELD ETF |
| SCHEDULE OF INVESTMENTS (Continued) |
| October 31, 2021 |
| Principal | Coupon Rate | |||||||||||||
| Amount ($) | Spread | (%) | Maturity | Fair Value | ||||||||||
| CORPORATE BONDS — 69.1% (Continued) | ||||||||||||||
| BIOTECH & PHARMA — 4.1% (Continued) | ||||||||||||||
| 196,000 | AbbVie, Inc. | 2.9500 | 11/21/26 | $ | 207,357 | |||||||||
| 196,000 | AbbVie, Inc. | 3.2000 | 11/21/29 | 209,682 | ||||||||||
| 156,000 | AbbVie, Inc. | 4.0500 | 11/21/39 | 179,349 | ||||||||||
| 104,000 | AbbVie, Inc. | 4.2500 | 11/21/49 | 125,102 | ||||||||||
| 104,000 | Amgen, Inc. | 4.6630 | 06/15/51 | 134,190 | ||||||||||
| 104,000 | AstraZeneca PLC | 6.4500 | 09/15/37 | 154,806 | ||||||||||
| 305,000 | Bausch Health Companies, Inc.(a) | 6.2500 | 02/15/29 | 295,937 | ||||||||||
| 156,000 | Bristol-Myers Squibb Company | 3.4000 | 07/26/29 | 171,719 | ||||||||||
| 104,000 | Bristol-Myers Squibb Company | 4.2500 | 10/26/49 | 130,792 | ||||||||||
| 305,000 | Endo Luxembourg Finance Company I Sarl / Endo US,(a) | 6.1250 | 04/01/29 | 300,449 | ||||||||||
| 104,000 | GlaxoSmithKline Capital, Inc. | 6.3750 | 05/15/38 | 153,936 | ||||||||||
| 305,000 | Par Pharmaceutical, Inc.(a) | 7.5000 | 04/01/27 | 308,161 | ||||||||||
| 104,000 | Pfizer, Inc. | 7.2000 | 03/15/39 | 168,027 | ||||||||||
| 2,953,926 | ||||||||||||||
| CABLE & SATELLITE — 4.0% | ||||||||||||||
| 305,000 | CCO Holdings, LLC / CCO Holdings Capital(a) | 5.3750 | 06/01/29 | 327,874 | ||||||||||
| 305,000 | CCO Holdings, LLC / CCO Holdings Capital(a) | 4.7500 | 03/01/30 | 315,294 | ||||||||||
| 305,000 | CCO Holdings, LLC / CCO Holdings Capital(a) | 4.5000 | 08/15/30 | 310,719 | ||||||||||
| 305,000 | CCO Holdings, LLC / CCO Holdings Capital(a) | 4.2500 | 02/01/31 | 304,048 | ||||||||||
| 156,000 | Charter Communications Operating, LLC / Charter | 4.9080 | 07/23/25 | 173,555 | ||||||||||
| 104,000 | Charter Communications Operating, LLC / Charter | 6.4840 | 10/23/45 | 143,554 | ||||||||||
| 156,000 | Comcast Corporation | 4.1500 | 10/15/28 | 178,186 | ||||||||||
| 8,000 | Comcast Corporation | 4.6000 | 10/15/38 | 9,791 | ||||||||||
| 12,000 | Comcast Corporation | 4.7000 | 10/15/48 | 15,545 | ||||||||||
| 118,000 | Comcast Corporation(a) | 2.8870 | 11/01/51 | 114,858 | ||||||||||
| 124,000 | Comcast Corporation(a) | 2.9370 | 11/01/56 | 119,627 | ||||||||||
| 300,000 | DISH DBS Corporation | 5.8750 | 11/15/24 | 319,875 | ||||||||||
| 208,000 | DISH DBS Corporation | 7.7500 | 07/01/26 | 231,400 | ||||||||||
| 305,000 | Sirius XM Radio, Inc.(a) | 4.1250 | 07/01/30 | 303,452 | ||||||||||
| 2,867,778 | ||||||||||||||
| COMMERCIAL SUPPORT SERVICES — 0.4% | ||||||||||||||
| 300,000 | Prime Security Services Borrower, LLC / Prime(a) | 5.7500 | 04/15/26 | 321,270 | ||||||||||
| DIVERSIFIED INDUSTRIALS — 0.6% | ||||||||||||||
The accompanying notes are an integral part of these financial statements.
| LEADERSHARES® DYNAMIC YIELD ETF |
| SCHEDULE OF INVESTMENTS (Continued) |
| October 31, 2021 |
| Principal | Coupon Rate | |||||||||||||
| Amount ($) | Spread | (%) | Maturity | Fair Value | ||||||||||
| CORPORATE BONDS — 69.1% (Continued) | ||||||||||||||
| DIVERSIFIED INDUSTRIALS — 0.6% (Continued) | ||||||||||||||
| 104,000 | General Electric Company | 6.7500 | 03/15/32 | $ | 143,207 | |||||||||
| 104,000 | General Electric Company | 5.8750 | 01/14/38 | 143,721 | ||||||||||
| 104,000 | General Electric Company | 4.3500 | 05/01/50 | 132,445 | ||||||||||
| 419,373 | ||||||||||||||
| E-COMMERCE DISCRETIONARY — 0.4% | ||||||||||||||
| 156,000 | Amazon.com, Inc. | 3.1500 | 08/22/27 | 169,102 | ||||||||||
| 104,000 | Amazon.com, Inc. | 4.0500 | 08/22/47 | 127,780 | ||||||||||
| 296,882 | ||||||||||||||
| ELECTRIC UTILITIES — 0.8% | ||||||||||||||
| 260,000 | FirstEnergy Corporation | 3.9000 | 07/15/27 | 282,269 | ||||||||||
| 208,000 | FirstEnergy Corporation | 7.3750 | 11/15/31 | 283,881 | ||||||||||
| 566,150 | ||||||||||||||
| FOOD — 3.8% | ||||||||||||||
| 300,000 | Kraft Heinz Foods Company | 3.0000 | 06/01/26 | 313,965 | ||||||||||
| 300,000 | Kraft Heinz Foods Company | 3.8750 | 05/15/27 | 325,534 | ||||||||||
| 208,000 | Kraft Heinz Foods Company | 4.2500 | 03/01/31 | 235,185 | ||||||||||
| 156,000 | Kraft Heinz Foods Company(a) | 7.1250 | 08/01/39 | 236,695 | ||||||||||
| 208,000 | Kraft Heinz Foods Company | 5.0000 | 06/04/42 | 257,503 | ||||||||||
| 208,000 | Kraft Heinz Foods Company | 5.2000 | 07/15/45 | 264,693 | ||||||||||
| 208,000 | Kraft Heinz Foods Company | 4.3750 | 06/01/46 | 241,886 | ||||||||||
| 208,000 | Kraft Heinz Foods Company | 4.8750 | 10/01/49 | 257,595 | ||||||||||
| 305,000 | Post Holdings, Inc.(a) | 4.6250 | 04/15/30 | 306,907 | ||||||||||
| 305,000 | Post Holdings, Inc.(a) | 4.5000 | 09/15/31 | 300,098 | ||||||||||
| 2,740,061 | ||||||||||||||
| HEALTH CARE FACILITIES & SERVICES — 6.1% | ||||||||||||||
| 300,000 | Centene Corporation | 4.6250 | 12/15/29 | 324,001 | ||||||||||
| 305,000 | Centene Corporation | 3.3750 | 02/15/30 | 313,023 | ||||||||||
| 305,000 | Centene Corporation | 3.0000 | 10/15/30 | 310,395 | ||||||||||
| 305,000 | Centene Corporation | 2.5000 | 03/01/31 | 297,762 | ||||||||||
| 305,000 | CHS/Community Health Systems, Inc.(a) | 6.8750 | 04/15/29 | 314,257 | ||||||||||
| 104,000 | CIGNA CORP 4.90% 12/15/2048 | 4.9000 | 12/15/48 | 134,665 | ||||||||||
| 156,000 | Cigna Corporation | 4.3750 | 10/15/28 | 178,993 | ||||||||||
| 104,000 | CVS Health Corp 5.050000 03/25/2048 | 5.0500 | 03/25/48 | 136,844 | ||||||||||
| 72,000 | CVS Health Corporation | 4.3000 | 03/25/28 | 81,582 | ||||||||||
The accompanying notes are an integral part of these financial statements.
| LEADERSHARES® DYNAMIC YIELD ETF |
| SCHEDULE OF INVESTMENTS (Continued) |
| October 31, 2021 |
| Principal | Coupon Rate | |||||||||||||
| Amount ($) | Spread | (%) | Maturity | Fair Value | ||||||||||
| CORPORATE BONDS — 69.1% (Continued) | ||||||||||||||
| HEALTH CARE FACILITIES & SERVICES — 6.1% (Continued) | ||||||||||||||
| 104,000 | CVS Health Corporation | 4.7800 | 03/25/38 | $ | 127,199 | |||||||||
| 104,000 | CVS Health Corporation | 5.1250 | 07/20/45 | 136,881 | ||||||||||
| 305,000 | DaVita, Inc.(a) | 4.6250 | 06/01/30 | 306,894 | ||||||||||
| 305,000 | DaVita, Inc.(a) | 3.7500 | 02/15/31 | 289,369 | ||||||||||
| 208,000 | HCA, Inc. | 5.3750 | 02/01/25 | 231,660 | ||||||||||
| 208,000 | HCA, Inc. | 5.8750 | 02/15/26 | 237,120 | ||||||||||
| 208,000 | HCA, Inc. | 5.6250 | 09/01/28 | 244,032 | ||||||||||
| 300,000 | HCA, Inc. | 3.5000 | 09/01/30 | 315,848 | ||||||||||
| 305,000 | Tenet Healthcare Corporation(a) | 6.1250 | 10/01/28 | 320,616 | ||||||||||
| 4,301,141 | ||||||||||||||
| HOME & OFFICE PRODUCTS — 0.3% | ||||||||||||||
| 208,000 | Newell Brands, Inc. | 4.2000 | 04/01/26 | 228,049 | ||||||||||
| INSTITUTIONAL FINANCIAL SERVICES — 2.3% | ||||||||||||||
| 196,000 | Goldman Sachs Group, Inc. (The) | 3.5000 | 04/01/25 | 209,279 | ||||||||||
| 156,000 | Goldman Sachs Group, Inc. (The)(b) | US0003M + 1.301% | 4.2230 | 05/01/29 | 174,860 | |||||||||
| 196,000 | Goldman Sachs Group, Inc. (The)(b) | SOFRRATE + 1.281% | 2.6150 | 04/22/32 | 197,061 | |||||||||
| 104,000 | Goldman Sachs Group, Inc. (The) | 6.7500 | 10/01/37 | 148,119 | ||||||||||
| 104,000 | Goldman Sachs Group, Inc. (The) | 6.2500 | 02/01/41 | 152,596 | ||||||||||
| 156,000 | Morgan Stanley | 3.8750 | 01/27/26 | 170,383 | ||||||||||
| 196,000 | Morgan Stanley(b) | SOFRRATE + 0.879% | 1.5930 | 05/04/27 | 194,260 | |||||||||
| 156,000 | Morgan Stanley(b) | US0003M + 1.628% | 4.4310 | 01/23/30 | 178,785 | |||||||||
| 196,000 | Morgan Stanley Series GMTN(b) | SOFRRATE + 1.143% | 2.6990 | 01/22/31 | 200,572 | |||||||||
| 1,625,915 | ||||||||||||||
| INTERNET MEDIA & SERVICES — 0.7% | ||||||||||||||
| 208,000 | Netflix, Inc. | 4.8750 | 04/15/28 | 238,550 | ||||||||||
| 208,000 | Netflix, Inc. | 5.8750 | 11/15/28 | 253,494 | ||||||||||
| 492,044 | ||||||||||||||
| LEISURE FACILITIES & SERVICES — 2.7% | ||||||||||||||
| 305,000 | Carnival Corporation(a) | 7.6250 | 03/01/26 | 321,726 | ||||||||||
| 305,000 | Carnival Corporation(a) | 5.7500 | 03/01/27 | 310,810 | ||||||||||
| 305,000 | Hilton Domestic Operating Company, Inc.(a) | 3.6250 | 02/15/32 | 297,955 | ||||||||||
The accompanying notes are an integral part of these financial statements.
| LEADERSHARES® DYNAMIC YIELD ETF |
| SCHEDULE OF INVESTMENTS (Continued) |
| October 31, 2021 |
| Principal | Coupon Rate | |||||||||||||||||||
| Amount ($) | Spread | (%) | Maturity | Fair Value | ||||||||||||||||
| CORPORATE BONDS — 69.1% (Continued) | ||||||||||||||||||||
| LEISURE FACILITIES & SERVICES — 2.7% (Continued) | ||||||||||||||||||||
| 305,000 | NCL Corporation Ltd.(a) | 5.8750 | 03/15/26 | $ | 306,144 | |||||||||||||||
| 305,000 | New Red Finance, Inc.(a) | 4.0000 | 10/15/30 | 295,847 | ||||||||||||||||
| 305,000 | Royal Caribbean Cruises Ltd.(a) | 5.5000 | 04/01/28 | 310,719 | ||||||||||||||||
| 1,843,201 | ||||||||||||||||||||
| MEDICAL EQUIPMENT & DEVICES — 0.2% | ||||||||||||||||||||
| 104,000 | Abbott Laboratories | 4.9000 | 11/30/46 | 144,745 | ||||||||||||||||
| METALS & MINING — 1.2% | ||||||||||||||||||||
| 305,000 | FMG Resources August 2006 Pty Ltd.(a) | 4.3750 | 04/01/31 | 309,194 | ||||||||||||||||
| 208,000 | Freeport-McMoRan, Inc. | 5.4500 | 03/15/43 | 261,924 | ||||||||||||||||
| 305,000 | Novelis Corporation(a) | 4.7500 | 01/30/30 | 317,581 | ||||||||||||||||
| 888,699 | ||||||||||||||||||||
| OIL & GAS PRODUCERS — 6.0% | ||||||||||||||||||||
| 260,000 | Apache Corporation | 5.1000 | 09/01/40 | 291,711 | ||||||||||||||||
| 305,000 | Cheniere Energy Partners, L.P.(a) | 4.0000 | 03/01/31 | 317,586 | ||||||||||||||||
| 305,000 | Comstock Resources, Inc.(a) | 6.7500 | 03/01/29 | 328,256 | ||||||||||||||||
| 104,000 | ConocoPhillips | 6.5000 | 02/01/39 | 153,567 | ||||||||||||||||
| 208,000 | Continental Resources Inc/OK(a) | 5.7500 | 01/15/31 | 249,340 | ||||||||||||||||
| 305,000 | EQT Corporation | 3.9000 | 10/01/27 | 325,816 | ||||||||||||||||
| 305,000 | New Fortress Energy, Inc.(a) | 6.5000 | 09/30/26 | 296,893 | ||||||||||||||||
| 305,000 | NGL Energy Operating, LLC / NGL Energy Finance(a) | 7.5000 | 02/01/26 | 309,728 | ||||||||||||||||
| 145,000 | Occidental Petroleum Corporation | 2.9000 | 08/15/24 | 147,893 | ||||||||||||||||
| 305,000 | Occidental Petroleum Corporation | 3.5000 | 08/15/29 | 309,956 | ||||||||||||||||
| 208,000 | Occidental Petroleum Corporation | 8.8750 | 07/15/30 | 282,100 | ||||||||||||||||
| 208,000 | Occidental Petroleum Corporation | 6.6250 | 09/01/30 | 254,779 | ||||||||||||||||
| 208,000 | Occidental Petroleum Corporation | 6.1250 | 01/01/31 | 249,340 | ||||||||||||||||
| 208,000 | Occidental Petroleum Corporation | 6.4500 | 09/15/36 | 264,982 | ||||||||||||||||
| 104,000 | Shell International Finance BV | 6.3750 | 12/15/38 | 153,988 | ||||||||||||||||
| 104,000 | Shell International Finance BV | 4.3750 | 05/11/45 | 130,540 | ||||||||||||||||
| 208,000 | Western Midstream Operating, L.P. | 5.3000 | 02/01/30 | 228,280 | ||||||||||||||||
| 4,294,755 | ||||||||||||||||||||
| REAL ESTATE INVESTMENT TRUSTS — 1.7% | ||||||||||||||||||||
| 305,000 | Iron Mountain, Inc.(a) | 5.2500 | 07/15/30 | 318,879 | ||||||||||||||||
| 305,000 | MPT Operating Partnership, L.P. / MPT Finance | 3.5000 | 03/15/31 | 307,730 | ||||||||||||||||
The accompanying notes are an integral part of these financial statements.
| LEADERSHARES® DYNAMIC YIELD ETF |
| SCHEDULE OF INVESTMENTS (Continued) |
| October 31, 2021 |
| Principal | Coupon Rate | |||||||||||||
| Amount ($) | Spread | (%) | Maturity | Fair Value | ||||||||||
| CORPORATE BONDS — 69.1% (Continued) | ||||||||||||||
| REAL ESTATE INVESTMENT TRUSTS — 1.7% (Continued) | ||||||||||||||
| 305,000 | SBA Communications Corporation | 3.8750 | 02/15/27 | $ | 314,922 | |||||||||
| 305,000 | SBA Communications Corporation(a) | 3.1250 | 02/01/29 | 293,181 | ||||||||||
| 1,234,712 | ||||||||||||||
| RETAIL - CONSUMER STAPLES — 0.4% | ||||||||||||||
| 305,000 | Albertsons Companies Inc / Safeway Inc / New(a) | 3.5000 | 03/15/29 | 301,015 | ||||||||||
| RETAIL - DISCRETIONARY — 0.6% | ||||||||||||||
| 104,000 | Home Depot, Inc. (The) | 5.8750 | 12/16/36 | 146,770 | ||||||||||
| 305,000 | Magic MergerCo, Inc.(a) | 7.8750 | 05/01/29 | 308,504 | ||||||||||
| 455,274 | ||||||||||||||
| SEMICONDUCTORS — 0.4% | ||||||||||||||
| 156,000 | Broadcom, Inc.(a) | 3.1370 | 11/15/35 | 153,896 | ||||||||||
| 156,000 | Broadcom, Inc.(a) | 3.1870 | 11/15/36 | 153,732 | ||||||||||
| 307,628 | ||||||||||||||
| SOFTWARE — 2.2% | ||||||||||||||
| 196,000 | Microsoft Corporation | 2.4000 | 08/08/26 | 205,775 | ||||||||||
| 156,000 | Microsoft Corporation | 3.3000 | 02/06/27 | 170,476 | ||||||||||
| 196,000 | Microsoft Corporation | 2.5250 | 06/01/50 | 193,159 | ||||||||||
| 196,000 | Microsoft Corporation | 2.9210 | 03/17/52 | 207,750 | ||||||||||
| 196,000 | Microsoft Corporation | 2.6750 | 06/01/60 | 195,113 | ||||||||||
| 196,000 | Oracle Corporation | 2.5000 | 04/01/25 | 203,337 | ||||||||||
| 196,000 | Oracle Corporation | 3.6000 | 04/01/50 | 200,176 | ||||||||||
| 196,000 | Oracle Corporation | 3.8500 | 04/01/60 | 204,769 | ||||||||||
| 1,580,555 | ||||||||||||||
| SPECIALTY FINANCE — 0.7% | ||||||||||||||
| 208,000 | OneMain Finance Corporation | 6.8750 | 03/15/25 | 232,440 | ||||||||||
| 208,000 | OneMain Finance Corporation | 7.1250 | 03/15/26 | 236,340 | ||||||||||
| 468,780 | ||||||||||||||
| TECHNOLOGY HARDWARE — 2.0% | ||||||||||||||
| 196,000 | Apple, Inc. | 2.4000 | 05/03/23 | 201,598 | ||||||||||
| 196,000 | Apple, Inc. | 3.2500 | 02/23/26 | 211,487 | ||||||||||
| 156,000 | Apple, Inc. | 3.8500 | 05/04/43 | 184,400 | ||||||||||
| 104,000 | Apple, Inc. | 4.6500 | 02/23/46 | 137,478 | ||||||||||
| 104,000 | Dell International, LLC / EMC Corporation | 6.0200 | 06/15/26 | 122,605 | ||||||||||
The accompanying notes are an integral part of these financial statements.
| LEADERSHARES® DYNAMIC YIELD ETF |
| SCHEDULE OF INVESTMENTS (Continued) |
| October 31, 2021 |
| Principal | Coupon Rate | |||||||||||||
| Amount ($) | Spread | (%) | Maturity | Fair Value | ||||||||||
| CORPORATE BONDS — 69.1% (Continued) | ||||||||||||||
| TECHNOLOGY HARDWARE — 2.0% (Continued) | ||||||||||||||
| 305,000 | Imola Merger Corporation(a) | 4.7500 | 05/15/29 | $ | 313,753 | |||||||||
| 208,000 | Western Digital Corporation | 4.7500 | 02/15/26 | 228,280 | ||||||||||
| 1,399,601 | ||||||||||||||
| TECHNOLOGY SERVICES — 0.5% | ||||||||||||||
| 196,000 | Visa, Inc. | 3.1500 | 12/14/25 | 210,724 | ||||||||||
| 104,000 | Visa, Inc. | 4.3000 | 12/14/45 | 133,286 | ||||||||||
| 344,010 | ||||||||||||||
| TELECOMMUNICATIONS — 10.3% | ||||||||||||||
| 156,000 | AT&T, Inc. | 4.3500 | 03/01/29 | 177,285 | ||||||||||
| 156,000 | AT&T, Inc. | 4.3000 | 02/15/30 | 177,337 | ||||||||||
| 144,000 | AT&T, Inc. | 2.5500 | 12/01/33 | 140,068 | ||||||||||
| 144,000 | AT&T, Inc. | 3.5000 | 09/15/53 | 146,020 | ||||||||||
| 144,000 | AT&T, Inc. | 3.5500 | 09/15/55 | 146,165 | ||||||||||
| 184,000 | AT&T, Inc. | 3.8000 | 12/01/57 | 193,655 | ||||||||||
| 144,000 | AT&T, Inc. | 3.6500 | 09/15/59 | 146,352 | ||||||||||
| 104,000 | British Telecommunications PLC | 9.6250 | 12/15/30 | 156,221 | ||||||||||
| 104,000 | Deutsche Telekom International Finance BV | 8.7500 | 06/15/30 | 152,126 | ||||||||||
| 253,000 | Embarq Corporation | 7.9950 | 06/01/36 | 280,018 | ||||||||||
| 305,000 | Frontier Communications Corporation(a) | 5.0000 | 05/01/28 | 310,338 | ||||||||||
| 104,000 | Orange S.A. | 9.0000 | 03/01/31 | 159,632 | ||||||||||
| 208,000 | Sprint Capital Corporation | 6.8750 | 11/15/28 | 263,617 | ||||||||||
| 156,000 | Sprint Capital Corporation | 8.7500 | 03/15/32 | 233,688 | ||||||||||
| 208,000 | Sprint Corporation | 7.8750 | 09/15/23 | 230,880 | ||||||||||
| 208,000 | Sprint Corporation | 7.1250 | 06/15/24 | 235,300 | ||||||||||
| 208,000 | Sprint Corporation | 7.6250 | 02/15/25 | 242,060 | ||||||||||
| 208,000 | Sprint Corporation | 7.6250 | 03/01/26 | 249,600 | ||||||||||
| 208,000 | Telecom Italia Capital S.A. | 7.2000 | 07/18/36 | 253,460 | ||||||||||
| 208,000 | Telecom Italia Capital S.A. | 7.7210 | 06/04/38 | 265,488 | ||||||||||
| 305,000 | T-Mobile USA, Inc. | 3.5000 | 04/15/31 | 316,088 | ||||||||||
| 156,000 | Verizon Communications, Inc. | 4.1250 | 03/16/27 | 174,443 | ||||||||||
| 156,000 | Verizon Communications, Inc. | 4.3290 | 09/21/28 | 178,230 | ||||||||||
| 156,000 | Verizon Communications, Inc. | 4.0160 | 12/03/29 | 175,014 | ||||||||||
| 196,000 | Verizon Communications, Inc. | 2.5500 | 03/21/31 | 197,781 | ||||||||||
| 104,000 | Verizon Communications, Inc. | 4.5000 | 08/10/33 | 122,953 | ||||||||||
The accompanying notes are an integral part of these financial statements.
| LEADERSHARES® DYNAMIC YIELD ETF |
| SCHEDULE OF INVESTMENTS (Continued) |
| October 31, 2021 |
| Principal | Coupon Rate | |||||||||||||
| Amount ($) | Spread | (%) | Maturity | Fair Value | ||||||||||
| CORPORATE BONDS — 69.1% (Continued) | ||||||||||||||
| TELECOMMUNICATIONS — 10.3% (Continued) | ||||||||||||||
| 196,000 | Verizon Communications, Inc. | 3.4000 | 03/22/41 | $ | 205,553 | |||||||||
| 104,000 | Verizon Communications, Inc. | 4.8620 | 08/21/46 | 136,605 | ||||||||||
| 104,000 | Verizon Communications, Inc. | 4.5220 | 09/15/48 | 131,958 | ||||||||||
| 156,000 | Verizon Communications, Inc. | 3.5500 | 03/22/51 | 168,190 | ||||||||||
| 156,000 | Verizon Communications, Inc. | 3.7000 | 03/22/61 | 169,172 | ||||||||||
| 156,000 | Vodafone Group PLC | 4.3750 | 05/30/28 | 177,994 | ||||||||||
| 104,000 | Vodafone Group PLC | 5.2500 | 05/30/48 | 137,080 | ||||||||||
| 208,000 | Vodafone Group PLC(b) | USD SWAP SEMI 30/360 5YR + 4.873% | 7.0000 | 04/04/79 | 251,764 | |||||||||
| 305,000 | Windstream Escrow, LLC / Windstream Escrow Finance(a) | 7.7500 | 08/15/28 | 322,990 | ||||||||||
| 305,000 | Zayo Group Holdings, Inc. B(a) | 4.0000 | 03/01/27 | 296,613 | ||||||||||
| 7,321,738 | ||||||||||||||
| TOBACCO & CANNABIS — 0.3% | ||||||||||||||
| 196,000 | BAT Capital Corporation | 3.5570 | 08/15/27 | 208,082 | ||||||||||
| TRANSPORTATION & LOGISTICS — 3.0% | ||||||||||||||
| 208,000 | American Airlines, Inc.(a) | 11.7500 | 07/15/25 | 257,920 | ||||||||||
| 305,000 | American Airlines, Inc./AAdvantage Loyalty IP Ltd.(a) | 5.5000 | 04/20/26 | 320,243 | ||||||||||
| 305,000 | American Airlines, Inc./AAdvantage Loyalty IP Ltd.(a) | 5.7500 | 04/20/29 | 328,637 | ||||||||||
| 208,000 | Delta Air Lines, Inc. | 7.3750 | 01/15/26 | 244,731 | ||||||||||
| 305,000 | Hawaiian Brand Intellectual Property Ltd. /(a) | 5.7500 | 01/20/26 | 320,250 | ||||||||||
| 305,000 | United Airlines, Inc.(a) | 4.3750 | 04/15/26 | 315,895 | ||||||||||
| 305,000 | United Airlines, Inc.(a) | 4.6250 | 04/15/29 | 314,830 | ||||||||||
| 2,102,506 | ||||||||||||||
| TOTAL CORPORATE BONDS (Cost $49,702,744) | 49,334,133 | |||||||||||||
| Principal | Coupon Rate | |||||||||||||
| Amount ($) | (%) | Maturity | Fair Value | |||||||||||
| U.S. GOVERNMENT & AGENCIES — 28.4% | ||||||||||||||
| U.S. TREASURY BILLS — 28.4% | ||||||||||||||
| 5,270,000 | United States Treasury Note | 1.6250 | 05/15/31 | 5,310,760 | ||||||||||
| 7,980,000 | United States Treasury Note | 2.2500 | 05/15/41 | 8,316,657 | ||||||||||
| 6,099,000 | United States Treasury Note | 2.3750 | 05/15/51 | 6,695,558 | ||||||||||
The accompanying notes are an integral part of these financial statements.
| LEADERSHARES® DYNAMIC YIELD ETF |
| SCHEDULE OF INVESTMENTS (Continued) |
| October 31, 2021 |
| Principal | Coupon Rate | |||||||||||||
| Amount ($) | (%) | Maturity | Fair Value | |||||||||||
| U.S. GOVERNMENT & AGENCIES — 28.4% (Continued) | ||||||||||||||
| U.S. TREASURY BILLS — 28.4% (Continued) | ||||||||||||||
| $ | 20,322,975 | |||||||||||||
| TOTAL U.S. GOVERNMENT & AGENCIES (Cost $20,301,658) | 20,322,975 | |||||||||||||
| TOTAL INVESTMENTS - 97.5% (Cost $70,004,402) | $ | 69,657,108 | ||||||||||||
| OTHER ASSETS IN EXCESS OF LIABILITIES - 2.5% | 1,804,021 | |||||||||||||
| NET ASSETS - 100.0% | $ | 71,461,129 | ||||||||||||
| BV | - Besloten Vennootschap |
| ETF | - Exchange-Traded Fund |
| LLC | - Limited Liability Company |
| LP | - Limited Partnership |
| LTD | - Limited Company |
| PLC | - Public Limited Company |
| REIT | - Real Estate Investment Trust |
| S/A | - Société Anonyme |
| ICE LIBOR USD 3 Month | ICE LIBOR USD 3 Month |
| SOFRRATE | United States SOFR Secured Overnight Financing Rate |
| US0003M | ICE LIBOR USD 3 Month |
| USD SWAP SEMI 30/360 5YR | USD SWAP SEMI 30/360 5YR |
| (a) | Security exempt from registration under Rule 144A or Section 4(2) of the Securities Act of 1933. The security may be resold in transactions exempt from registration, normally to qualified institutional buyers. As of October 31, 2021 the total market value of 144A securities is 14,016,461 or 19.6% of net assets. |
| (b) | Variable rate security; the rate shown represents the rate on October 31, 2021. |
The accompanying notes are an integral part of these financial statements.
| LeaderShares® ETF’s |
| STATEMENTS OF ASSETS AND LIABILITIES |
| October 31, 2021 |
| LeaderShares® | LeaderShares® | |||||||||||||||||||
| LeaderShares® | AlphaFactor® | AlphaFactor® | LeaderShares® | LeaderShares® | ||||||||||||||||
| Activist Leaders® ETF | Tactical Focused ETF | US Core Equity ETF | Equity Skew ETF | Dynamic Yield ETF | ||||||||||||||||
| ASSETS | ||||||||||||||||||||
| Investment securities: | ||||||||||||||||||||
| Investments, at cost | $ | 71,526,986 | $ | 117,735,829 | $ | 115,361,492 | $ | 99,076,977 | $ | 70,004,402 | ||||||||||
| Investments, at fair value | $ | 76,403,932 | $ | 126,722,328 | $ | 121,215,901 | $ | 104,526,337 | $ | 69,657,108 | ||||||||||
| Cash | 2,650,656 | 1,415,020 | 1,886,511 | 971,388 | 1,116,019 | |||||||||||||||
| Receivable for investments sold | 1,268,675 | — | — | — | 9,314 | |||||||||||||||
| Dividends and interest receivable | 26,902 | 107,093 | 54,587 | 42,151 | 720,934 | |||||||||||||||
| Receivable for capital stock sold | 156,447 | — | — | — | 75,629 | |||||||||||||||
| TOTAL ASSETS | 80,506,612 | 128,244,441 | 123,156,999 | 105,539,876 | 71,579,004 | |||||||||||||||
| LIABILITIES | ||||||||||||||||||||
| Payable for investments purchased | 3,153,058 | — | — | — | 75,629 | |||||||||||||||
| Payable for capital shares redeemed | 349,108 | — | — | — | — | |||||||||||||||
| Investment advisory fees payable | 43,299 | 100,421 | 63,911 | 61,671 | 42,246 | |||||||||||||||
| TOTAL LIABILITIES | 3,545,465 | 100,421 | 63,911 | 61,671 | 117,875 | |||||||||||||||
| NET ASSETS | $ | 76,961,147 | $ | 128,144,020 | $ | 123,093,088 | $ | 105,478,205 | $ | 71,461,129 | ||||||||||
| Net Assets Consist Of: | ||||||||||||||||||||
| Paid in capital | $ | 66,771,279 | $ | 115,040,390 | $ | 118,085,231 | $ | 91,677,173 | $ | 71,745,503 | ||||||||||
| Accumulated gains (deficit) | 10,189,868 | 13,103,630 | 5,007,857 | 13,801,032 | (284,374 | ) | ||||||||||||||
| NET ASSETS | $ | 76,961,147 | $ | 128,144,020 | $ | 123,093,088 | $ | 105,478,205 | $ | 71,461,129 | ||||||||||
| Net Asset Value Per Share: | ||||||||||||||||||||
| Net Assets | $ | 76,961,147 | $ | 128,144,020 | $ | 123,093,088 | $ | 105,478,205 | $ | 71,461,129 | ||||||||||
| Shares of beneficial interest outstanding ($0 par value, unlimited shares authorized) | 2,000,000 | 3,650,000 | 3,650,000 | 2,825,000 | 2,850,000 | |||||||||||||||
| Net asset value (Net Assets ÷ Shares Outstanding) | $ | 38.48 | $ | 35.11 | $ | 33.72 | $ | 37.34 | $ | 25.07 | ||||||||||
The accompanying notes are an integral part of these financial statements.
| LeaderShares® ETF’s |
| STATEMENTS OF OPERATIONS |
| For the Year or Period Ended October 31, 2021 |
| LeaderShares® | LeaderShares® | |||||||||||||||||||
| LeaderShares® | AlphaFactor® | AlphaFactor® | LeaderShares® | LeaderShares® | ||||||||||||||||
| Activist Leaders® ETF | Tactical Focused ETF | US Core Equity ETF | Equity Skew ETF | Dynamic Yield ETF * | ||||||||||||||||
| INVESTMENT INCOME | ||||||||||||||||||||
| Dividends (Less: Foreign Withholding Expense of $7,813 for Activist Leaders ETF) | $ | 461,926 | $ | 2,491,841 | $ | 1,049,505 | $ | 1,235,746 | $ | — | ||||||||||
| Interest | — | — | — | — | 575,812 | |||||||||||||||
| TOTAL INVESTMENT INCOME | 461,926 | 2,491,841 | 1,049,505 | 1,235,746 | 575,812 | |||||||||||||||
| EXPENSES | ||||||||||||||||||||
| Investment advisory fees | 448,583 | 977,442 | 714,425 | 597,411 | 151,005 | |||||||||||||||
| TOTAL EXPENSES | 448,583 | 977,442 | 714,425 | 597,411 | 151,005 | |||||||||||||||
| NET INVESTMENT INCOME | 13,343 | 1,514,399 | 335,080 | 638,335 | 424,807 | |||||||||||||||
| REALIZED AND UNREALIZED GAIN (LOSS) ON INVESTMENTS | ||||||||||||||||||||
| Net realized gain (loss) on: | ||||||||||||||||||||
| Investments | 5,349,722 | 2,829,623 | 9,442,544 | 8,377,422 | 24,978 | |||||||||||||||
| In-kind redemptions | 13,403,776 | 16,666,091 | 13,262,681 | 10,990,596 | — | |||||||||||||||
| Options | — | — | — | (330,770 | ) | — | ||||||||||||||
| Realized gain on investments | 18,753,498 | 19,495,714 | 22,705,225 | 19,037,248 | 24,978 | |||||||||||||||
| Unrealized appreciation (depreciation) on: | ||||||||||||||||||||
| Investments | 4,959,880 | 9,255,410 | 3,346,892 | 2,836,584 | (347,294 | ) | ||||||||||||||
| NET REALIZED AND UNREALIZED GAIN (LOSS) ON INVESTMENTS | 23,713,378 | 28,751,124 | 26,052,117 | 21,873,832 | (322,316 | ) | ||||||||||||||
| NET INCREASE IN NET ASSETS RESULTING FROM OPERATIONS | $ | 23,726,721 | $ | 30,265,523 | $ | 26,387,197 | $ | 22,512,167 | $ | 102,491 | ||||||||||
| * | Fund commenced operation on June 28, 2021. |
The accompanying notes are an integral part of these financial statements.
| LeaderShares® Activist Leaders® ETF |
| STATEMENT OF CHANGES IN NET ASSETS |
| For the Year | For the Period | |||||||
| Ended | Ended | |||||||
| October 31, 2021 | October 31, 2020 * | |||||||
| FROM OPERATIONS | ||||||||
| Net investment gain (loss) | $ | 13,343 | $ | (1,173 | ) | |||
| Net realized gain on investments | 5,349,722 | 5,217 | ||||||
| Net realized gain on in-kind redemptions | 13,403,776 | — | ||||||
| Unrealized appreciation (depreciation) on investments | 4,959,880 | (82,934 | ) | |||||
| Net increase (decrease) in net assets resulting from operations | 23,726,721 | (78,890 | ) | |||||
| DISTRIBUTIONS TO SHAREHOLDERS | ||||||||
| Total distributions paid | (55,755 | ) | — | |||||
| Net decrease in net assets resulting from distributions to shareholders | (55,755 | ) | — | |||||
| FROM SHARES OF BENEFICIAL INTEREST | ||||||||
| Proceeds from shares sold | 61,902,239 | 42,592,171 | ||||||
| Cost of shares redeemed | (51,125,339 | ) | — | |||||
| Net increase in net assets resulting from shares of beneficial interest | 10,776,900 | 42,592,171 | ||||||
| TOTAL INCREASE IN NET ASSETS | 34,447,866 | 42,513,281 | ||||||
| NET ASSETS | ||||||||
| Beginning of Year/Period | 42,513,281 | — | ||||||
| End of Year/Period | $ | 76,961,147 | $ | 42,513,281 | ||||
| SHARE ACTIVITY | ||||||||
| Shares sold | 1,825,000 | 1,750,000 | ||||||
| Shares redeemed | (1,575,000 | ) | — | |||||
| Net increase in shares of beneficial interest outstanding | 250,000 | 1,750,000 | ||||||
| * | Fund commenced operation on October 26, 2020. |
The accompanying notes are an integral part of these financial statements.
| LeaderShares® AlphaFactor® Tactical Focused ETF |
| STATEMENT OF CHANGES IN NET ASSETS |
| For the Year | For the Period | |||||||
| Ended | Ended | |||||||
| October 31, 2021 | October 31, 2020 * | |||||||
| FROM OPERATIONS | ||||||||
| Net investment income | $ | 1,514,399 | $ | 21,472 | ||||
| Net realized gain on investments | 2,829,623 | — | ||||||
| Net realized gain on in-kind redemptions | 16,666,091 | — | ||||||
| Unrealized appreciation (depreciation) on investments | 9,255,410 | (268,911 | ) | |||||
| Net increase (decrease) in net assets resulting from operations | 30,265,523 | (247,439 | ) | |||||
| DISTRIBUTIONS TO SHAREHOLDERS | ||||||||
| Total distributions paid | (248,363 | ) | — | |||||
| Net decrease in net assets resulting from distributions to shareholders | (248,363 | ) | — | |||||
| FROM SHARES OF BENEFICIAL INTEREST | ||||||||
| Proceeds from shares sold | 137,674,873 | 47,818,400 | ||||||
| Cost of shares redeemed | (87,118,974 | ) | — | |||||
| Net increase in net assets resulting from shares of beneficial interest | 50,555,899 | 47,818,400 | ||||||
| TOTAL INCREASE IN NET ASSETS | 80,573,059 | 47,570,961 | ||||||
| NET ASSETS | ||||||||
| Beginning of Year/Period | 47,570,961 | — | ||||||
| End of Year/Period | $ | 128,144,020 | $ | 47,570,961 | ||||
| SHARE ACTIVITY | ||||||||
| Shares sold | 4,575,000 | 1,975,000 | ||||||
| Shares redeemed | (2,900,000 | ) | — | |||||
| Net increase in shares of beneficial interest outstanding | 1,675,000 | 1,975,000 | ||||||
| * | Fund commenced operation on October 26, 2020. |
The accompanying notes are an integral part of these financial statements.
| LeaderShares® AlphaFactor® US Core Equity ETF |
| STATEMENT OF CHANGES IN NET ASSETS |
| For the Year | For the Year | |||||||
| Ended | Ended | |||||||
| October 31, 2021 | October 31, 2020 | |||||||
| FROM OPERATIONS | ||||||||
| Net investment income | $ | 335,080 | $ | 529,556 | ||||
| Net realized gain (loss) on investments | 9,442,544 | (8,205,280 | ) | |||||
| Net realized gain on in-kind redemptions | 13,262,681 | 8,929,306 | ||||||
| Unrealized appreciation (depreciation) on investments | 3,346,892 | (57,884 | ) | |||||
| Net increase in net assets resulting from operations | 26,387,197 | 1,195,698 | ||||||
| DISTRIBUTIONS TO SHAREHOLDERS | ||||||||
| Total distributions paid | (296,928 | ) | (546,464 | ) | ||||
| Return of capital | — | (6,256 | ) | |||||
| Net decrease in net assets resulting from distributions to shareholders | (296,928 | ) | (552,720 | ) | ||||
| FROM SHARES OF BENEFICIAL INTEREST | ||||||||
| Proceeds from shares sold | 159,184,764 | 77,972,584 | ||||||
| Cost of shares redeemed | (135,722,428 | ) | (79,486,783 | ) | ||||
| Net increase (decrease) in net assets resulting from shares of beneficial interest | 23,462,336 | (1,514,199 | ) | |||||
| TOTAL INCREASE (DECREASE) IN NET ASSETS | 49,552,605 | (871,221 | ) | |||||
| NET ASSETS | ||||||||
| Beginning of Year | 73,540,483 | 74,411,704 | ||||||
| End of Year | $ | 123,093,088 | $ | 73,540,483 | ||||
| SHARE ACTIVITY | ||||||||
| Shares sold | 5,100,000 | 3,275,000 | ||||||
| Shares redeemed | (4,425,000 | ) | (3,225,000 | ) | ||||
| Net increase in shares of beneficial interest outstanding | 675,000 | 50,000 | ||||||
The accompanying notes are an integral part of these financial statements.
| LeaderShares® Equity Skew ETF |
| STATEMENT OF CHANGES IN NET ASSETS |
| For the Year | For the Period | |||||||
| Ended | Ended | |||||||
| October 31, 2021 | October 31, 2020 * | |||||||
| FROM OPERATIONS | ||||||||
| Net investment income | $ | 638,335 | $ | 192,348 | ||||
| Net realized gain on investments | 8,046,652 | 2,870,382 | ||||||
| Net realized gain on in-kind redemptions | 10,990,596 | 2,533,901 | ||||||
| Unrealized appreciation on investments | 2,836,584 | 2,612,776 | ||||||
| Net increase in net assets resulting from operations | 22,512,167 | 8,209,407 | ||||||
| DISTRIBUTIONS TO SHAREHOLDERS | ||||||||
| Total distributions paid | (3,395,723 | ) | — | |||||
| Net decrease in net assets resulting from distributions to shareholders | (3,395,723 | ) | — | |||||
| FROM SHARES OF BENEFICIAL INTEREST | ||||||||
| Proceeds from shares sold | 98,072,672 | 86,342,315 | ||||||
| Cost of shares redeemed | (65,730,531 | ) | (40,532,102 | ) | ||||
| Net increase in net assets resulting from shares of beneficial interest | 32,342,141 | 45,810,213 | ||||||
| TOTAL INCREASE IN NET ASSETS | 51,458,585 | 54,019,620 | ||||||
| NET ASSETS | ||||||||
| Beginning of Year/Period | 54,019,620 | — | ||||||
| End of Year/Period | $ | 105,478,205 | $ | 54,019,620 | ||||
| SHARE ACTIVITY | ||||||||
| Shares sold | 2,775,000 | 3,425,000 | ||||||
| Shares redeemed | (1,875,000 | ) | (1,500,000 | ) | ||||
| Net increase in shares of beneficial interest outstanding | 900,000 | 1,925,000 | ||||||
| * | Fund commenced operation on May 11, 2020. |
The accompanying notes are an integral part of these financial statements.
| LeaderShares® Dynamic Yield ETF |
| STATEMENT OF CHANGES IN NET ASSETS |
| For the Period * | ||||
| Ended | ||||
| October 31, 2021 | ||||
| FROM OPERATIONS | ||||
| Net investment income | $ | 424,807 | ||
| Net realized gain on investments | 24,978 | |||
| Unrealized depreciation on investments | (347,294 | ) | ||
| Net increase in net assets resulting from operations | 102,491 | |||
| DISTRIBUTIONS TO SHAREHOLDERS | ||||
| Total distributions paid | (386,865 | ) | ||
| Net decrease in net assets resulting from distributions to shareholders | (386,865 | ) | ||
| FROM SHARES OF BENEFICIAL INTEREST | ||||
| Proceeds from shares sold | 71,745,503 | |||
| Net increase in net assets resulting from shares of beneficial interest | 71,745,503 | |||
| TOTAL INCREASE IN NET ASSETS | 71,461,129 | |||
| NET ASSETS | ||||
| Beginning of Period | — | |||
| End of Period | $ | 71,461,129 | ||
| SHARE ACTIVITY | ||||
| Shares sold | 2,850,000 | |||
| Net increase in shares of beneficial interest outstanding | 2,850,000 | |||
| * | Fund commenced operation on June 28, 2021. |
The accompanying notes are an integral part of these financial statements.
| LeaderShares® Activist Leaders® ETF |
| FINANCIAL HIGHLIGHTS |
Per Share Data and Ratios for a Share of Beneficial Interest Outstanding Throughout The Year/Period Presented
| For the Year | For the Period | |||||||
| Ended | Ended | |||||||
| October 31, 2021 | October 31, 2020 * | |||||||
| Net asset value, beginning of year/period | $ | 24.29 | $ | 25.00 | ||||
| Activity from investment operations: | ||||||||
| Net investment gain (loss) (1) | 0.01 | (0.00 | ) ** | |||||
| Net realized and unrealized gain (loss) on investments | 14.21 | (0.71 | ) | |||||
| Total from investment operations | 14.22 | (0.71 | ) | |||||
| Less distributions from: | ||||||||
| Net investment income | (0.03 | ) | — | |||||
| Total distributions | (0.03 | ) | — | |||||
| Net asset value, end of year/period | $ | 38.48 | $ | 24.29 | ||||
| Market price, end of year/period | $ | 38.49 | $ | 24.30 | ||||
| Total return (2) | 58.60 | % | (2.84 | )% (4) | ||||
| Net assets, at end of year/period (000s) | $ | 76,961 | $ | 42,513 | ||||
| Ratio of expenses to average net assets | 0.75 | % | 0.75 | % (3) | ||||
| Ratio of net investment income/(loss) to average net assets | 0.02 | % | (0.75 | )% (3) | ||||
| Portfolio Turnover Rate (5) | 49 | % | 3 | % (4) | ||||
| * | Fund commenced operation on October 26, 2020. |
| ** | Represents less than $0.01 per share. |
| (1) | Per share amounts calculated using the average shares method, which more appropriately presents the per share data for each period. |
| (2) | Total return is calculated assuming a purchase of shares at net asset value on the first day and a sale at net asset value on the last day of the period. Distributions are assumed, for the purpose of this calculation, to be reinvested at the ex-dividend date net asset value per share on their respective payment dates. |
| (3) | Annualized |
| (4) | Not annualized |
| (5) | Portfolio turnover rate excludes portfolio securities received or delivered as a result of processing capital share transactions in Creation Units. (Note 7) |
The accompanying notes are an integral part of these financial statements.
| LeaderShares® AlphaFactor® Tactical Focused ETF |
| FINANCIAL HIGHLIGHTS |
Per Share Data and Ratios for a Share of Beneficial Interest Outstanding Throughout The Year/Period Presented
| For the Year | For the Period | |||||||
| Ended | Ended | |||||||
| October 31, 2021 | October 31, 2020 * | |||||||
| Net asset value, beginning of year/period | $ | 24.09 | $ | 25.00 | ||||
| Activity from investment operations: | ||||||||
| Net investment gain (1) | 0.51 | 0.03 | ||||||
| Net realized and unrealized gain (loss) on investments | 10.60 | (0.94 | ) | |||||
| Total from investment operations | 11.11 | (0.91 | ) | |||||
| Less distributions from: | ||||||||
| Net investment income | (0.09 | ) | — | |||||
| Total distributions | (0.09 | ) | — | |||||
| Net asset value, end of year/period | $ | 35.11 | $ | 24.09 | ||||
| Market price, end of year/period | $ | 35.13 | $ | 24.10 | ||||
| Total return (2) | 46.20 | % | (3.64 | )% (4) | ||||
| Net assets, at end of year/period (000s) | $ | 128,144 | $ | 47,571 | ||||
| Ratio of expenses to average net assets | 0.99 | % | 0.99 | % (3) | ||||
| Ratio of net investment income to average net assets | 1.53 | % | 16.95 | % (3) | ||||
| Portfolio Turnover Rate (5) | 78 | % | 0 | % (4) | ||||
| * | Fund commenced operation on October 26, 2020. |
| (1) | Per share amounts calculated using the average shares method, which more appropriately presents the per share data for each period. |
| (2) | Total return is calculated assuming a purchase of shares at net asset value on the first day and a sale at net asset value on the last day of the period. Distributions are assumed, for the purpose of this calculation, to be reinvested at the ex-dividend date net asset value per share on their respective payment dates. |
| (3) | Annualized |
| (4) | Not annualized |
| (5) | Portfolio turnover rate excludes portfolio securities received or delivered as a result of processing capital share transactions in Creation Units. (Note 7) |
The accompanying notes are an integral part of these financial statements.
| LeaderShares® AlphaFactor® US Core Equity ETF |
| FINANCIAL HIGHLIGHTS |
Per Share Data and Ratios for a Share of Beneficial Interest Outstanding Throughout The Year/Period Presented
| For the Year | For the Year | For the Year | For the Period | |||||||||||||
| Ended | Ended | Ended | Ended | |||||||||||||
| October 31, 2021 | October 31, 2020 | October 31, 2019 | October 31, 2018* | |||||||||||||
| Net asset value, beginning of year/period | $ | 24.72 | $ | 25.44 | $ | 22.85 | $ | 25.00 | ||||||||
| Activity from investment operations: | ||||||||||||||||
| Net investment gain (loss) (1) | 0.11 | 0.17 | 0.18 | (0.00 | ) ** | |||||||||||
| Net realized and unrealized gain (loss) on investments | 8.99 | (0.71 | ) | 2.58 | (2.15 | ) | ||||||||||
| Total from investment operations | 9.10 | (0.54 | ) | 2.76 | (2.15 | ) | ||||||||||
| Less distributions from: | ||||||||||||||||
| Net investment income | (0.10 | ) | (0.18 | ) | (0.17 | ) | — | |||||||||
| Return of capital | — | (0.00 | ) ** | — | — | |||||||||||
| Total distributions | (0.10 | ) | (0.18 | ) | (0.17 | ) | — | |||||||||
| Net asset value, end of year/period | $ | 33.72 | $ | 24.72 | $ | 25.44 | $ | 22.85 | ||||||||
| Market price, end of year/period | $ | 33.78 | $ | 24.72 | $ | 25.45 | $ | 22.86 | ||||||||
| Total return (2) | 36.84 | % | (2.09 | )% | 12.16 | % | (8.60 | )% (4) | ||||||||
| Net assets, at end of year/period (000s) | $ | 123,093 | $ | 73,540 | $ | 74,412 | $ | 50,849 | ||||||||
| Ratio of expenses to average net assets | 0.75 | % | 0.75 | % | 0.75 | % | 0.75 | % (3) | ||||||||
| Ratio of net investment income/(loss) to average net assets | 0.35 | % | 0.70 | % | 0.77 | % | (0.01 | )% (3) | ||||||||
| Portfolio Turnover Rate (5) | 177 | % | 181 | % | 193 | % | 0 | % (4) | ||||||||
| * | Fund commenced operation on October 1, 2018. |
| ** | Represents less than $0.01 per share. |
| (1) | Per share amounts calculated using the average shares method, which more appropriately presents the per share data for each year/period. |
| (2) | Total return is calculated assuming a purchase of shares at net asset value on the first day and a sale at net asset value on the last day of the period. Distributions are assumed, for the purpose of this calculation, to be reinvested at the ex-dividend date net asset value per share on their respective payment dates. |
| (3) | Annualized |
| (4) | Not annualized |
| (5) | Portfolio turnover rate excludes portfolio securities received or delivered as a result of processing capital share transactions in Creation Units. (Note 7) |
The accompanying notes are an integral part of these financial statements.
| LeaderShares® Equity Skew ETF |
| FINANCIAL HIGHLIGHTS |
Per Share Data and Ratios for a Share of Beneficial Interest Outstanding Throughout The Year/Period Presented
| For the Year | For the Period | |||||||
| Ended | Ended | |||||||
| October 31, 2021 | October 31, 2020 * | |||||||
| Net asset value, beginning of year/period | $ | 28.06 | $ | 25.00 | ||||
| Activity from investment operations: | ||||||||
| Net investment gain (1) | 0.28 | 0.09 | ||||||
| Net realized and unrealized gain on investments | 10.67 | 2.97 | ||||||
| Total from investment operations | 10.95 | 3.06 | ||||||
| Less distributions from: | ||||||||
| Net investment income | (0.26 | ) | — | |||||
| Net realized gains | (1.41 | ) | — | |||||
| Total distributions | (1.67 | ) | — | |||||
| Net asset value, end of year/period | $ | 37.34 | $ | 28.06 | ||||
| Market price, end of year/period | $ | 37.41 | $ | 27.83 | ||||
| Total return (2) | 40.17 | % | 12.24 | % (4) | ||||
| Net assets, at end of year/period (000s) | $ | 105,478 | $ | 54,020 | ||||
| Ratio of expenses to average net assets | 0.75 | % | 0.75 | % (3) | ||||
| Ratio of net investment income to average net assets | 0.80 | % | 0.71 | % (3) | ||||
| Portfolio Turnover Rate (5) | 58 | % | 57 | % (4) | ||||
| * | Fund commenced operation on May 11, 2020. |
| (1) | Per share amounts calculated using the average shares method, which more appropriately presents the per share data for each period. |
| (2) | Total return is calculated assuming a purchase of shares at net asset value on the first day and a sale at net asset value on the last day of the period. Distributions are assumed, for the purpose of this calculation, to be reinvested at the ex-dividend date net asset value per share on their respective payment dates. |
| (3) | Annualized |
| (4) | Not annualized |
| (5) | Portfolio turnover rate excludes portfolio securities received or delivered as a result of processing capital share transactions in Creation Units. (Note 7) |
The accompanying notes are an integral part of these financial statements.
| LeaderShares® Dynamic Yield ETF |
| FINANCIAL HIGHLIGHTS |
Per Share Data and Ratios for a Share of Beneficial Interest Outstanding Throughout The Period Presented
| For the Period | ||||
| Ended | ||||
| October 31, 2021 * | ||||
| Net asset value, beginning of period | $ | 25.00 | ||
| Activity from investment operations: | ||||
| Net investment gain (1) | 0.18 | |||
| Net realized and unrealized gain on investments | 0.04 | |||
| Total from investment operations | 0.22 | |||
| Less distributions from: | ||||
| Net investment income | (0.15 | ) | ||
| Total distributions | (0.15 | ) | ||
| Net asset value, end of period | $ | 25.07 | ||
| Market price, end of period | $ | 25.12 | ||
| Total return (2) | 0.88 | % (4) | ||
| Net assets, at end of period (000s) | $ | 71,461 | ||
| Ratio of expenses to average net assets | 0.75 | % (3) | ||
| Ratio of net investment income to average net assets | 2.11 | % (3) | ||
| Portfolio Turnover Rate (5) | 6 | % (4) | ||
| * | Fund commenced operation on June 28, 2021. |
| (1) | Per share amounts calculated using the average shares method, which more appropriately presents the per share data for each period. |
| (2) | Total return is calculated assuming a purchase of shares at net asset value on the first day and a sale at net asset value on the last day of the period. Distributions are assumed, for the purpose of this calculation, to be reinvested at the ex-dividend date net asset value per share on their respective payment dates. |
| (3) | Annualized |
| (4) | Not annualized |
| (5) | Portfolio turnover rate excludes portfolio securities received or delivered as a result of processing capital share transactions in Creation Units. (Note 7) |
The accompanying notes are an integral part of these financial statements.
| LeaderShares® ETF’s |
| NOTES TO FINANCIAL STATEMENTS |
| October 31, 2021 |
| 1. | ORGANIZATION |
The LeaderShares® Activist Leaders® ETF, LeaderShares® AlphaFactor® Tactical Focused ETF, LeaderShares® AlphaFactor® US Core Equity ETF, LeaderShares® Equity Skew ETF, and LeaderShares® Dynamic Yield ETF (each, a “Fund” and collectively the “Funds”) are each a series of shares of beneficial interest of the Two Roads Shared Trust (the “Trust”), a statutory trust organized under the laws of the State of Delaware on June 8, 2012, and registered under the Investment Company Act of 1940, as amended (the "1940 Act"), as diversified, open-end management investment companies. The LeaderShares® Activist Leaders® ETF, LeaderShares® AlphaFactor® Tactical Focused ETF and LeaderShares® Equity Skew ETF seek to generate long-term capital growth. The LeaderShares® AlphaFactor® US Core Equity ETF seeks to provide investment results that correspond generally, before fees and expenses, to the performance of the AlphaFactor® US Core Equity Index. The LeaderShares® Dynamic Yield ETF seeks current income. The LeaderShares® AlphaFactor® US Core Equity ETF commenced operations on October 1, 2018. The LeaderShares® Equity Skew ETF commenced operations May 11, 2020. The LeaderShares® Activist Leaders® ETF and LeaderShares®AlphaFactor® Tactical Focused ETF commenced operations on October 26, 2020. The LeaderShares® Dynamic Yield ETF commenced operations on June 28, 2021.
| 2. | SIGNIFICANT ACCOUNTING POLICIES |
The following is a summary of significant accounting policies followed by the Funds in preparation of their financial statements. These policies are in conformity with accounting principles generally accepted in the United States of America (“GAAP”). The preparation of financial statements requires management to make estimates and assumptions that affect the reported amounts of assets and liabilities and disclosure of contingent assets and liabilities at the date of the financial statements and the reported amounts of income and expenses for the period. Actual results could differ from those estimates. The Funds are investment companies and accordingly follow the investment company accounting and reporting guidance of the Accounting Standards Board (“FASB”) Accounting Standards Codification Topic 946 “Financial Services – Investment Companies” including FASB Accounting Standards Update ASU 2013-08.
Securities valuation – Securities listed on an exchange are valued at the last reported sale price at the close of the regular trading session of the exchange on the business day the value is being determined, or in the case of securities listed on NASDAQ at the NASDAQ Official Closing Price. In the absence of a sale, such securities shall be valued at the mean between the current bid and ask prices on the day of valuation. Options contracts listed on a securities exchange or board of trade (not including Index Options contracts) for which market quotations are readily available shall be valued at the last quoted sales price or, in the absence of a sale, at the mean between the current bid and ask prices on the valuation date. Index Options listed on a securities exchange or board of trade for which market quotations are readily available shall be valued at the mean between the current bid and ask prices on the valuation date. The Funds may fair value a particular bond if the adviser does not believe that the round lot value provided by the independent pricing service reflects fair value of the Funds’ holding. Short-term debt obligations having 60 days or less remaining until maturity, at time of purchase may be valued at amortized cost (which approximates fair value). Investments in open-end investment companies are valued at net asset value.
| LeaderShares® ETF’s |
| NOTES TO FINANCIAL STATEMENTS (Continued) |
| October 31, 2021 |
Valuation of Underlying Funds - The Funds may invest in portfolios of open-end or closed-end investment companies (the "Underlying Funds"). The Underlying Funds value securities in their portfolios for which market quotations are readily available at their market values (generally the last reported sale price) and all other securities and assets at their fair value to the methods established by the board of directors of the Underlying Funds.
Open-end funds are valued at their respective net asset values as reported by such investment companies. The shares of many closed-end investment companies, after their initial public offering, frequently trade at a price per share, which is different than the net asset value per share. The difference represents a market premium or market discount of such shares. There can be no assurances that the market discount or premium on shares of any closed-end investment company purchased by the Funds will not change.
The Funds may hold securities, such as private investments, interests in commodity pools, other non-traded securities or temporarily illiquid securities, for which market quotations are not readily available or are determined to be unreliable. These securities will be valued using the “fair value” procedures approved by the Board. The Board has delegated execution of these procedures to a fair value committee composed of one or more representatives from each of the (i) Trust, (ii) administrator, and (iii) advisor. The committee may also enlist third party consultants such as a valuation specialist at a public accounting firm, valuation consultant or financial officer of a security issuer on an as-needed basis to assist in determining a security-specific fair value. The Board has also engaged a third party valuation firm to, as needed, attend valuation meetings held by the Trust, review minutes of such meetings and report to the Board on a quarterly basis. The Board reviews and considers the determinations reached by the Fair Value Committee in ratifying the Fair Value Committee’s application of the fair valuation methodologies employed.
Fair Valuation Process –The applicable investments are valued collectively via inputs from each group within the fair value committee. For example, fair value determinations are required for the following securities: (i) securities for which market quotations are insufficient or not readily available on a particular business day (including securities for which there is a short and temporary lapse in the provision of a price by the regular pricing source); (ii) securities for which, in the judgment of the advisor, the prices or values available do not represent the fair value of the instrument; factors which may cause the advisor to make such a judgment include, but are not limited to, the following: only a bid price or an ask price is available; the spread between bid and ask prices is substantial; the frequency of sales; the thinness of the market; the size of reported trades; and actions of the securities markets, such as the suspension or limitation of trading; (iii) securities determined to be illiquid; and (iv) securities with respect to which an event that will affect the value thereof has occurred (a “significant event”) since the closing prices were established on the principal exchange on which they are traded, but prior to a Fund’s calculation of its net asset value. Specifically, interests in commodity pools or managed futures pools are valued on a daily basis by reference to the closing market prices of each futures contract or other asset held by a pool, as adjusted for pool expenses. Restricted or illiquid securities, such as private investments or non-traded securities are valued via inputs from the advisor based upon the current bid for the security from two or more independent dealers or other parties reasonably familiar with the facts and circumstances of the security (who should take into consideration all relevant factors as may be
| LeaderShares® ETF’s |
| NOTES TO FINANCIAL STATEMENTS (Continued) |
| October 31, 2021 |
appropriate under the circumstances). If the advisor is unable to obtain a current bid from such independent dealers or other independent parties, the fair value committee shall determine the fair value of such security using the following factors: (i) the type of security; (ii) the cost at date of purchase; (iii) the size and nature of the Fund's holdings; (iv) the discount from market value of unrestricted securities of the same class at the time of purchase and subsequent thereto; (v) information as to any transactions or offers with respect to the security; (vi) the nature and duration of restrictions on disposition of the security and the existence of any registration rights; (vii) how the yield of the security compares to similar securities of companies of similar or equal creditworthiness; (viii) the level of recent trades of similar or comparable securities; (ix) the liquidity characteristics of the security; (x) current market conditions; and (xi) the market value of any securities into which the security is convertible or exchangeable.
The Funds utilize various methods to measure the fair value of all of their investments on a recurring basis. GAAP establishes a hierarchy that prioritizes inputs to valuation methods. The three levels of input are:
Level 1 – Unadjusted quoted prices in active markets for identical assets and liabilities that the Fund has the ability to access.
Level 2 – Observable inputs other than quoted prices included in Level 1 that are observable for the asset or liability, either directly or indirectly. These inputs may include quoted prices for the identical instrument on an inactive market, prices for similar instruments, interest rates, prepayment speeds, credit risk, yield curves, default rates and similar data.
Level 3 – Unobservable inputs for the asset or liability, to the extent relevant observable inputs are not available, representing the Fund’s own assumptions about the assumptions a market participant would use in valuing the asset or liability, and would be based on the best information available.
The availability of observable inputs can vary from security to security and is affected by a wide variety of factors, including, for example, the type of security, whether the security is new and not yet established in the marketplace, the liquidity of markets, and other characteristics particular to the security. To the extent that valuation is based on models or inputs that are less observable or unobservable in the market, the determination of fair value requires more judgment. Accordingly, the degree of judgment exercised in determining fair value is greatest for instruments categorized in Level 3.
The inputs used to measure fair value may fall into different levels of the fair value hierarchy. In such cases, for disclosure purposes, the level in the fair value hierarchy within which the fair value measurement falls in its entirety, is determined based on the lowest level input that is significant to the fair value measurement in its entirety.
| LeaderShares® ETF’s |
| NOTES TO FINANCIAL STATEMENTS (Continued) |
| October 31, 2021 |
The inputs or methodology used for valuing securities are not necessarily an indication of the risk associated with investing in those securities. The following tables summarize the inputs used as of October 31, 2021 for the Funds’ investments measured at fair value:
| LeaderShares® Activist Leaders® ETF | ||||
| Assets * | Level 1 | Level 2 | Level 3 | Total |
| Common Stock | $ 76,403,932 | $ - | $ - | $ 76,403,932 |
| Total | $ 76,403,932 | $ - | $ - | $ 76,403,932 |
| LeaderShares® AlphaFactor® Tactical Focused ETF | ||||
| Assets * | Level 1 | Level 2 | Level 3 | Total |
| Common Stock | $ 126,722,328 | $ - | $ - | $ 126,722,328 |
| Total | $ 126,722,328 | $ - | $ - | $ 126,722,328 |
| LeaderShares® AlphaFactor® US Core Equity ETF | ||||
| Assets * | Level 1 | Level 2 | Level 3 | Total |
| Common Stock | $ 121,215,901 | $ - | $ - | $ 121,215,901 |
| Total | $ 121,215,901 | $ - | $ - | $ 121,215,901 |
| LeaderShares® Equity Skew ETF | ||||
| Assets * | Level 1 | Level 2 | Level 3 | Total |
| Common Stock | $ 29,448,437 | $ - | $ - | $ 29,448,437 |
| Exchange Traded Funds | 75,077,900 | - | - | 75,077,900 |
| Total | $ 104,526,337 | - | $ - | $ 104,526,337 |
| LeaderShares® Dynamic Yield ETF | ||||
| Assets * | Level 1 | Level 2 | Level 3 | Total |
| Corporate Bonds | $ 49,334,133 | $ - | $ - | $ 49,334,133 |
| U.S. Government & Agencies | - | 20,322,975 | - | 20,322,975 |
| Total | $ 49,334,133 | - | $ - | $ 69,657,108 |
The Funds did not hold any Level 3 securities during the period.
* See Schedule of Investments for industry classification.
Impact of Derivatives on the Statement of Operations – The following is a summary of the location of derivative investments on the Statements of Operations for the period ended October 31, 2021:
Derivative Investment Type Location of Gain/Loss on Derivative
Option Contracts Net Realized Gain (Loss): Option Contracts
| LeaderShares® ETF’s |
| NOTES TO FINANCIAL STATEMENTS (Continued) |
| October 31, 2021 |
The following is a summary of the realized loss and changes in unrealized depreciation on derivative investments recognized in the Statements of Operations categorized by primary risk exposure for the period ended October 31, 2021:
| LeaderShares® Equity Skew ETF | ||
| Realized loss on derivatives recognized in the Statement of Operations | ||
| Derivative Investment Type | Equity Risk | Total for the Period Ended October 31, 2021 |
| Option Contracts | $ 330,770 | $ (330,770) |
Security Transactions and Related Income – Security transactions are accounted for on the trade date. Interest income is recognized on an accrual basis. Discounts are accreted and premiums are amortized on securities purchased over the lives of the respective securities. Dividend income is recorded on the ex-dividend date. Realized gains or losses from sales of securities are determined by comparing the identified cost of the security lot sold with the net sales proceeds. Withholding taxes on foreign dividends have been provided for in accordance with the Funds’ understanding of the applicable country’s tax rules and rates.
Dividends and Distributions to Shareholders – For the LeaderShares® AlphaFactor® US Core Equity ETF Fund, dividends from net investment income, if any, are declared and paid quarterly. For the LeaderShares® Activist Leader® ETF, LeaderShares® AlphaFactor® Tactical Focused ETF, and the LeaderShares® US Equity Skew ETF, dividends from net investment income, if any, are declared and paid annually. For the LeaderShares® Dynamic Yield ETF, dividends from net investment income, if any, are declared and paid monthly. Distributable net realized capital gains, if any, are declared and distributed annually. Dividends from net investment income and distributions from net realized gains are determined in accordance with federal income tax regulations, which may differ from GAAP. These “book/tax” differences are considered either temporary (e.g., deferred losses) or permanent in nature. To the extent these differences are permanent in nature, such amounts are reclassified within the composition of net assets based on their federal tax-basis treatment; temporary differences do not require reclassification. Quarterly distributions in excess of ordinary taxable income are treated as returns of capital. Dividends and distributions to shareholders are recorded on the ex-dividend date.
Option Transactions – The Funds are subject to equity price risk in the normal course of pursuing its investment objective and may purchase or sell options to help hedge against risk. When a Fund writes put and call options, an amount equal to the premium received is included in the statement of assets and liability as a liability. The amount of the liability is subsequently marked-to-market to reflect the current market value of the option. If an option expires on its stipulated expiration date or if a Fund enters into a closing purchase transaction, a gain or loss is realized. If a written call option is exercised, a gain or loss is realized for the sale of the underlying security and the proceeds from the sale are increased by the premium originally received. As writer of an option, the Funds have no control over whether the option will be exercised and, as a result, retain the market risk of an unfavorable change in the price of the security underlying the written option.
Put options are purchased to hedge against a decline in the value of securities held in the Funds’ portfolio. If such a decline occurs, the put options will permit the Funds to sell the securities underlying such options at the exercise price, or to close out the options at a profit. The premium paid for a put or call
| LeaderShares® ETF’s |
| NOTES TO FINANCIAL STATEMENTS (Continued) |
| October 31, 2021 |
option plus any transaction costs will reduce the benefit, if any, realized by the Funds upon exercise of the option, and, unless the price of the underlying security rises or declines sufficiently, the option may expire worthless to the Funds. In addition, in the event that the price of the security in connection with which an option was purchased moves in a direction favorable to the Funds, the benefits realized by the Funds as a result of such favorable movement will be reduced by the amount of the premium paid for the option and related transaction costs. Written and purchased options are non-income producing securities. With purchased options, there is minimal counterparty risk to the Funds since these options are exchange traded and the exchange’s clearinghouse, as counterparty to all exchange traded options, guarantees against a possible default.
Federal Income Taxes – It is the Funds’ policy to qualify as a regulated investment company by complying with the provisions of the Internal Revenue Code that are applicable to regulated investment companies and to distribute substantially all of its taxable income and net realized gains to shareholders. Therefore, no federal income tax provision has been recorded.
Management has analyzed the Funds’ tax positions and has concluded that no liability for unrecognized tax benefits should be recorded related to uncertain tax positions taken on returns filed for open tax years or expected to be taken in the Funds’ October 31, 2021 year-end tax returns. The Funds identify their major tax jurisdictions as U.S. Federal, Ohio and foreign jurisdictions where the Funds make significant investments; however the Funds are not aware of any tax positions for which it is reasonably expected that the total amounts of unrecognized tax benefits will change materially in the next twelve months.
The Funds recognize interest and penalties, if any, related to unrecognized tax benefits as income tax expense in the Statement of Operations. During the period, the Funds did not incur any interest or penalties.
Indemnification – The Trust indemnifies its officers and Trustees for certain liabilities that may arise from the performance of their duties to the Trust. Additionally, in the normal course of business, the Funds enter into contracts that contain a variety of representations and warranties and which provide general indemnities. The Funds’ maximum exposure under these arrangements is unknown, as this would involve future claims that may be made against the Funds that have not yet occurred. However, the risk of loss due to these warranties and indemnities appears to be remote.
| LeaderShares® ETF’s |
| NOTES TO FINANCIAL STATEMENTS (Continued) |
| October 31, 2021 |
| 3. | INVESTMENT TRANSACTIONS |
For the year ended October 31, 2021, cost of purchases and proceeds from sales of portfolio securities (excluding in-kind transactions and short-term investments), as well as cost of purchases and proceeds from sales of portfolio securities for in-kind transactions amounted to:
| Purchases | Sales | Purchases In-Kind | Sales In-Kind | ||||
| LeaderShares® Activist Leaders® ETF | $ 28,827,728 | $ 27,404,503 | $ 61,597,713 | $ 51,800,676 | |||
| LeaderShares® AlphaFactor® Tactical Focused ETF | 78,902,135 | 77,536,886 | 135,971,446 | 85,808,844 | |||
| LeaderShares® AlphaFactor® US Core Equity ETF | 182,810,610 | 182,729,406 | 156,169,694 | 134,426,548 | |||
| LeaderShares® Equity Skew ETF | 47,371,392 | 49,406,279 | 97,591,777 | # | 65,088,506 | ||
| LeaderShares® Dynamic Yield ETF | 1,097,245 | 2,681,321 | 71,745,909 | - |
| 4. | INVESTMENT ADVISORY AGREEMENT AND TRANSACTIONS WITH RELATED PARTIES |
Redwood Investment Management, LLC serves as the Funds’ Investment Advisor (the “Advisor”). Pursuant to investment advisory agreements with the Funds, the Advisor, under the oversight of the Board, directs the daily operations of the Funds and supervises the performance of administrative and professional services provided by others. As compensation for its services and the related expenses borne by the Advisor, the LeaderShares® Activist Leaders® ETF Fund, LeaderShares® AlphaFactor® Tactical Focused ETF Fund, LeaderShares® AlphaFactor® US Core Equity ETF Fund, LeaderShares® Equity Skew ETF Fund, and LeaderShares® Dynamic Yield ETF Fund pay the Advisor a unitary management fee, computed and accrued daily and paid monthly, at an annual rate of 0.75%, 0.99%, 0.75%, 0.75% and 0.75% respectively of each Funds’ average daily net assets. For the year (except as indicated) ended October 31, 2021 the funds incurred the following advisory fees:
| Investment Advisory Fees | ||
| LeaderShares® Activist Leaders ETF | $ 448,583 | |
| LeaderShares® AlphaFactor® Tactical Focused ETF | 977,442 | |
| LeaderShares® AlphaFactor® US Core Equity ETF | 714,425 | |
| LeaderShares® Equity Skew ETF | 597,411 | |
| LeaderShares® Dynamic Yield ETF* | 151,005 |
* Advisory fees shown for the period from inception to October 31, 2021
The Advisor’s unitary management fee is designed to pay the Funds’ expenses and to compensate the Advisor for providing services for the Funds. Out of the unitary management fee, the Advisor pays substantially all expenses of the Funds, including the costs of transfer agency, custody, fund administration, legal, audit and other services and Independent Trustees’ fees, but not payments under the Funds’ 12b-1 plan, brokerage fees and commissions, taxes, borrowing costs (such as dividend expense on securities sold short and interest), fees and expenses of other investment companies in which the Funds may invest, and extraordinary or non-recurring expenses (including litigation to which the Trust or the Funds may be a party and indemnification of the Trustees and officers with respect thereto). The Advisor, and not the Funds’ shareholders, would benefit from any reduction in fees paid for third-party services, including reductions based on increases in net assets.
| LeaderShares® ETF’s |
| NOTES TO FINANCIAL STATEMENTS (Continued) |
| October 31, 2021 |
The Funds have adopted a distribution and service plan (“Plan”) pursuant to Rule 12b-1 under the 1940 Act. Under the Plan, the Funds are authorized to pay distribution fees to the distributor and other firms that provide distribution and shareholder services (“Service Providers”). If a Service Provider provides these services, the Funds may pay fees at an annual rate not to exceed 0.25% of average daily net assets, pursuant to Rule 12b-1 under the 1940 Act. No distribution or service fees are currently paid by the Funds, and there are no current plans to impose these fees. In the event Rule 12b-1 fees were charged, over time they would increase the cost of an investment in the Funds. Northern Lights Distributors, LLC, the Funds’ distributor, its affiliates, and the Funds’ Advisor or its affiliates may, at their own expense and out of their own legitimate profits, provide additional cash payments to financial intermediaries who sell shares of the Funds, including affiliates of the Advisor.
Ultimus Fund Solutions, LLC (“UFS”) – UFS, an affiliate of the Distributor, provides administration and fund accounting services to the Funds. Pursuant to a separate servicing agreement with UFS, the advisor on behalf of the Funds pay UFS customary fees for providing administration and fund accounting services to the Fund. Certain officers of the Trust are also officers of UFS, and are not paid any fees directly by the Funds for serving in such capacities.
Northern Lights Compliance Services, LLC (“NLCS”) - NLCS, an affiliate of UFS and the Distributor, provides a Chief Compliance Officer to the Trust, as well as related compliance services, pursuant to a consulting agreement between NLCS and the Funds. Under the terms of such agreement, NLCS receives customary fees from the Trust. The Chief Compliance Officer of the Trust is also an officer of NLCS, and is not paid any fees directly by the Funds for serving in such capacity.
Blu Giant, LLC (“Blu Giant”) – Blu Giant, an affiliate of UFS and the Distributor, provides EDGAR conversion and filing services as well as print management services for the Funds on an ad-hoc basis. For the provision of these services, Blu Giant receives customary fees from the advisor on behalf of the Funds.
| 5. | AGGREGATE UNREALIZED APPRECIATION AND DEPRECIATION – TAX BASIS |
The identified cost of investments in securities owned by the Funds for federal income tax purposes and its respective gross unrealized appreciation and depreciation at October 31, 2021, was as follows:
| Portfolio | Cost for Federal Tax purposes | Unrealized Appreciation | Unrealized Depreciation | Tax Net Unrealized App/Dep | ||||
| LeaderShares® Activist Leaders® ETF | $71,822,387 | $ 7,217,747 | $ (2,636,202) | $ 4,581,545 | ||||
| LeaderShares® AlphaFactor® Tactical Focused ETF | 117,736,431 | 14,565,473 | (5,579,576) | 8,985,897 | ||||
| LeaderShares® AlphaFactor® US Core Equity ETF | 115,363,594 | 7,572,770 | (1,720,463) | 5,852,307 | ||||
| LeaderShares® Equity Skew ETF | 99,072,476 | 5,928,835 | (474,974) | 5,453,861 | ||||
| LeaderShares® Dynamic Yield ETF | 70,010,304 | 275,761 | (628,957) | (353,196) |
| LeaderShares® ETF’s |
| NOTES TO FINANCIAL STATEMENTS (Continued) |
| October 31, 2021 |
| 6. | DISTRIBUTIONS TO SHAREHOLDERS AND TAX COMPONENTS OF CAPITAL |
The tax character of fund distributions paid for the year ended October 31, 2021, and October 31, 2020 was as follows:
| For the period ended October 31, 2021: | ||||||||||
| Ordinary | Long-Term | Return | Tax Exempt | |||||||
| Portfolio | Income | Capital Gains | of Capital | Income | Total | |||||
| LeaderShares® Activist Leaders ETF | $ 55,755 | $ - | $ - | $ - | $ 55,755 | |||||
| LeaderShares® AlphaFactor Tactical Focused ETF | 248,363 | - | - | - | 248,363 | |||||
| LeaderShares® AlphaFactor® US Core Equity ETF | 296,928 | - | - | - | 296,928 | |||||
| LeaderShares® Equity Skew ETF | 3,395,546 | 177 | - | - | 3,395,723 | |||||
| LeaderShares® Dynamic Yield ETF | 386,865 | - | - | - | 386,865 | |||||
| For the period ended October 31, 2020: | ||||||||||
| Ordinary | Long-Term | Return | Tax Exempt | |||||||
| Portfolio | Income | Capital Gains | of Capital | Income | Total | |||||
| LeaderShares® Activist Leaders ETF | $ - | $ - | $ - | $ - | $ - | |||||
| LeaderShares® AlphaFactor Tactical Focused ETF | - | - | - | - | - | |||||
| LeaderShares® AlphaFactor® US Core Equity ETF | 546,464 | - | 6,256 | - | 552,720 | |||||
| LeaderShares® Equity Skew ETF | - | - | - | - | - | |||||
| LeaderShares® Dynamic Yield ETF | - | - | - | - | - | |||||
As of October 31, 2021, the components of accumulated earnings/(deficit) on a tax basis were as follows:
| Undistributed | Undistributed | Post October Loss | Capital Loss | Other | Unrealized | Total | ||||||||
| Ordinary | Long-Term | and | Carry | Book/Tax | Appreciation/ | Accumulated | ||||||||
| Portfolio | Income | Capital Gains | Late Year Loss | Forwards | Differences | (Depreciation) | Earnings/(Deficits) | |||||||
| LeaderShares® Activist Leaders® ETF | $ 5,597,048 | $ 11,275 | $ - | $ - | $ - | $ 4,581,545 | $ 10,189,868 | |||||||
| LeaderShares® AlphaFactor® Tactical Focused ETF | 3,777,220 | 340,513 | - | - | - | 8,985,897 | 13,103,630 | |||||||
| LeaderShares® AlphaFactor® US Core Equity ETF | 29,053 | - | - | (873,503) | - | 5,852,307 | 5,007,857 | |||||||
| LeaderShares® Equity Skew ETF | 7,126,711 | 1,220,460 | - | - | - | 5,453,861 | 13,801,032 | |||||||
| LeaderShares® Dynamic Yield ETF | 68,822 | - | - | - | - | (353,196) | (284,374) |
Late year losses incurred after December 31 within the fiscal year are deemed to arise on the first business day of the following fiscal year for tax purposes. The LeaderShares® Activist Leaders ETF incurred and elected to defer such capital losses of $33,460.
At October 31, 2021, the LeaderShares® AlphaFactor® US Core Equity ETF and LeaderShares Equity Skew ETF had capital loss carry forwards for federal income tax purposes available to offset future capital gains, as follows:
| Non-Expiring | ||||||
| Portfolio | Short-Term | Long-Term | Total | |||
| LeaderShares AlphaFactor® US Core Equity ETF | 873,503 | - | 873,503 | |||
| LeaderShares Equity Skew ETF | 59,130 | - | 59,130 | |||
| LeaderShares® ETF’s |
| NOTES TO FINANCIAL STATEMENTS (Continued) |
| October 31, 2021 |
| Paid in | Accumulated | |||
| Portfolio | Capital | Earnings (Losses) | ||
| LeaderShares®Activist Leaders ETF | $ 13,402,208 | $ (13,402,208) | ||
| LeaderShares® AlphaFactor® Tactical Focused ETF | 16,666,091 | (16,666,091) | ||
| LeaderShares® AlphaFactor® US Core Equity ETF | 13,258,270 | (13,258,270) | ||
| LeaderShares® Equity Skew ETF | 10,990,739 | (10,990,739) | ||
| LeaderShares® Dynamic Yield ETF | - | - |
| 7. | CAPITAL SHARE TRANSACTIONS |
Shares are not individually redeemable and may be redeemed by the Funds at NAV only in large blocks known as “Creation Units.” Shares are created and redeemed by the Funds only in Creation Unit size aggregations of 25,000 shares. Only Authorized Participants are permitted to purchase or redeem Creation Units from the Funds. An Authorized Participant is either (i) a broker-dealer or other participant in the clearing process through the Continuous Net Settlement System of the National Securities Clearing Corporation or (ii) a Depository Trust Company participant and, in each case, must have executed a Participant Agreement with the distributor. Such transactions are generally permitted on an in-kind basis, with a balancing cash component to equate the transaction to the NAV per share of the Funds on the transaction date. Cash may be substituted equivalent to the value of certain securities generally when they are not available in sufficient quantity for delivery, not eligible for trading by the Authorized Participant or as a result of other market circumstances. In addition, the Funds may impose transaction fees on purchases and redemptions of Funds shares to cover the custodial and other costs incurred by the Funds in effecting trades. A fixed fee payable to the custodian is imposed on each creation and redemption transaction regardless of the number of Creation Units involved in the transaction (“Fixed Fee”). Purchases and redemptions of Creation Units for cash or involving cash-in-lieu are required to pay an additional variable charge to compensate the Funds and its ongoing shareholders for brokerage and market impact expenses relating to Creation Unit transactions (“Variable Charge,” and together with the Fixed Fee, the “Transaction Fees”). Transactions in capital shares for the Funds are disclosed in the Statements of Changes in Net Assets.
Investors who use the services of a broker, or other such intermediary may be charged a fee for such services. The Transaction Fees for the Fund are listed in the table below:
| Fee for In-Kind and | Minimum Additional Variable | Maximum Additional Variable |
| Cash Purchases | Charge for Cash Purchases* | Charge for Cash Purchases* |
| $600 | 0.20% | 2.00% |
* As a percentage of the amount invested.
| LeaderShares® ETF’s |
| NOTES TO FINANCIAL STATEMENTS (Continued) |
| October 31, 2021 |
8. PRINCIPAL INVESTMENT RISKS
The Funds’ investments in securities, financial instruments and derivatives expose it to various risks, certain of which are discussed below. Each Fund’s prospectus and statement of additional information include a more full listing of risks associated with each Fund’s investments. The Risks associated with a Funds' investments include, but are not limited to:
LeaderShares® Activist Leaders ETF: activist risk, active trading risk, authorized participant concentration risk, cybersecurity risk, derivatives risk, equity risk, ETF structure risks, fluctuation of net asset value risk, gap risk, information technology sector risk, management risk, market capitalization risk, market risk, market events risk, new fund risk, quantitative investing risk, rules-based strategy risk, sector risk, swap risk, and volatility risk.
LeaderShares® AlphaFactor® Tactical Focused ETF: active trading risk, authorized participant concentration risk, cash positions risk, cybersecurity risk, derivatives risk, equity risk, ETF structure risks, fluctuation of net asset value risk, focus risk, gap risk, investment companies and ETFs Risk, management risk, market capitalization risk, market risk, market events risk, money market instrument risk, new fund risks, quantitative investing risk, rules-based strategy risk, sector risk, swap risk, tactical overlay strategy risk, U.S. Government securities risk, and volatility risk.
LeaderShares® AlphaFactor® US Core Equity ETF: active trading risk, authorized participant concentration risk, calculation methodology risk, concentration risk, consumer discretionary sector risk, derivatives risk, ETF structure risks, equity risk, financial sector risk, fluctuation of net asset value risk, gap risk, index tracking error risk, industrial sectors risk, information technology sector risk, management risk, market capitalization risk, market risk, market events risk, new fund risk, passive investment risk, portfolio turnover risk, retail sector risk, rules-based strategy risk, and volatility risk.
LeaderShares® Equity Skew ETF: active trading risk, authorized participant concentration risk, cybersecurity risk, equity risk, emerging markets risk, ETF structure risks, fluctuation of net asset value risk, gap risk, geographic and sector risk, management risk, investment companies and ETFs Risk, foreign (Non-US) investments risk, market capitalization risk, market risk, market events risk, new fund risks, and quantitative investing risk.
LeaderShares® Dynamic Yield ETF: market risk, fixed income securities risk, active trading risk, asset allocation risk, authorized participant concentration risk, bank loan risk, cash positions risk, common stock risk, convertible securities risk, counterparty credit risk, credit risk, credit spread risk, currency risk, cybersecurity risk, derivatives risk, emerging markets risk, ETF structure risk, fluctuation of net asset value risk, foreign (Non-US) investments risk, future contract risk, gap risk, high yield risk, index risk, investment companies and ETFs risk, issuer-specific risk, leveraging risk, LIBOR risk, liquidity risk, market events risk, model risk, mortgage-backed and asset-backed securities risk, new fund risk, odd lot pricing risk, portfolio turnover risk, prepayment and extension risk, regulatory risk, sector risk, swap risk, US government securities risk, valuation risk, variable or floating rate securities risk, and volatility risk.
| LeaderShares® ETF’s |
| NOTES TO FINANCIAL STATEMENTS (Continued) |
| October 31, 2021 |
ETF Structure Risks. Each Fund is structured as an ETF and as a result is subject to special risks. Shares are not individually redeemable and may be redeemed by the Fund at NAV only in large blocks known as “Creation Units.”
| Trading in shares on the Exchange may be halted due to market conditions or for reasons that, in the view of the Exchange, make trading in shares inadvisable, such as extraordinary market volatility. There can be no assurance that shares will continue to meet the listing requirements of the Exchange. An active trading market for the Fund’s shares may not be developed or maintained. If the Fund’s shares are traded outside a collateralized settlement system, the number of financial institutions that can act as authorized participants that can post collateral on an agency basis is limited, which may limit the market for the Fund’s shares. |
| The market prices of shares will fluctuate in response to changes in NAV and supply and demand for shares and will include a “bid-ask spread” charged by the exchange specialists, market makers or other participants that trade the particular security. There may be times when the market price and the NAV vary significantly. |
Equity Risk. Equity securities are susceptible to general market fluctuations and volatile increases and decreases in value as market confidence in and perceptions of their issuers change. Factors that may influence the price of equity securities include developments affecting a specific company or industry, or the changing economic, political or market conditions.
Fluctuation of Net Asset Value Risk. The NAV of the Fund’s shares will generally fluctuate with changes in the market value of the Fund’s holdings. The market prices of the shares will generally fluctuate in accordance with changes in NAV as well as the relative supply of and demand for the shares on the Exchange. The Advisor cannot predict whether the shares will trade below, at or above their NAV. Price differences may be due, in large part, to the fact that supply and demand forces at work in the secondary trading market for the shares will be closely related to, but not identical to, the same forces influencing the prices of the Fund’s holdings trading individually or in the aggregate at any point in time. Unlike conventional ETFs, Activist Leaders ETF, Tactical Focused ETF, Equity SKEW ETF, and Dynamic Yield are not index funds. The Funds are actively managed and do not seek to replicate the performance of a specified Index. Actively managed ETFs have a limited trading history and, therefore, there can be no assurance as to whether and/or the extent to which the shares will trade at premiums or discounts to NAV.
Index Tracking Error Risk. As with all index funds, the performance of the Fund and the Index may differ from each other for a variety of reasons. For example, the Fund incurs operating expenses and portfolio transaction costs not incurred by the Index. In addition, the Fund may not be fully invested in the securities of the Index at all times, may deviate from the relative weightings of Index or may hold securities not included in the Index. Tracking error risk may be heightened during times or market volatility or other unusual market conditions.
Market Risk. Overall market risk may affect the value of individual instruments in which the Fund invests. The Fund is subject to the risk that the securities markets will move down, sometimes rapidly and unpredictably, based on overall economic conditions and other factors, which may negatively affect
| LeaderShares® ETF’s |
| NOTES TO FINANCIAL STATEMENTS (Continued) |
| October 31, 2021 |
the Fund’s performance. Factors such as domestic and foreign (non-U.S.) economic growth and market conditions, real or perceived adverse economic or political conditions, inflation, changes in interest rate levels, lack of liquidity in the bond or other markets, volatility in the securities markets, adverse investor sentiment affect the securities markets and political events affect the securities markets. Securities markets also may experience long periods of decline in value. When the value of the Fund’s investments goes down, your investment in the Fund decreases in value and you could lose money.
Local, state, regional, national or global events such as war, acts of terrorism, the spread of infectious illness or other public health issues, recessions, or other events could have a significant impact on the Fund and its investments and could result in decreases to the Fund’s net asset value. Political, geopolitical, natural and other events, including war, terrorism, trade disputes, government shutdowns, market closures, natural and environmental disasters, epidemics, pandemics and other public health crises and related events and governments’ reactions to such events have led, and in the future may lead, to economic uncertainty, decreased economic activity, increased market volatility and other disruptive effects on U.S. and global economies and markets. Such events may have significant adverse direct or indirect effects on the Fund and its investments. For example, a widespread health crisis such as a global pandemic could cause substantial market volatility, exchange trading suspensions and closures, impact the ability to complete redemptions, and affect Fund performance. A health crisis may exacerbate other pre-existing political, social and economic risks. In addition, the increasing interconnectedness of markets around the world may result in many markets being affected by events or conditions in a single country or region or events affecting a single or small number of issuers.
COVID-19 has resulted in travel restrictions, closed international borders, enhanced health screenings at ports of entry and elsewhere, disruption of and delays in healthcare service preparation and delivery, prolonged quarantines, cancellations, business and school closings, supply chain disruptions, and lower consumer demand, as well as general concern and uncertainty. The impact of COVID-19, and other infectious illness outbreaks that may arise in the future, could adversely affect the economies of many nations or the entire global economy, individual issuers and capital markets in ways that cannot necessarily be foreseen.
| 9. | UNDERLYING INVESTMENT IN OTHER INVESTMENT COMPANIES |
The Funds invest in other ETFs. Each ETF is subject to specific risks depending on the nature of the ETF. These risks could include liquidity risk, sector risk, foreign and related currency risk and high yield risk. Investors in the Funds will indirectly bear fees and expenses charged by the underlying investment companies in which the Funds invest in addition to the Funds’ direct fees and expenses.
The performance on the LeaderShares® Equity Skew ETF will be directly affected by the performance of the SPDR S&P 600 Small Cap Growth ETF and SPDR S&P 600 Small Cap Value ETF. The annual report for these securities, along with the report of the independent registered public accounting firms are included in those securities N-CSR’s available at “www.sec.gov”. As of October 31, 2021, the percentage of the LeaderShares® Equity Skew ETF’s net assets invested in SPDR S&P 600 Small Cap Growth ETF and SPDR S&P 600 Small Cap Value ETF were 34.8% and 25.6%, respectively.
| LeaderShares® ETF’s |
| NOTES TO FINANCIAL STATEMENTS (Continued) |
| October 31, 2021 |
10. NEW ACCOUNTING PRONOUNCEMENTS
In March 2020, FASB issued ASU 2020-04, Reference Rate Reform (Topic 848): Facilitation of the Effects of Reference Rate Reform on Financial Reporting (‘‘ASU 2020-04’’). The amendments in ASU 2020-04 provide optional temporary financial reporting relief from the effect of certain types of contract modifications due to the planned discontinuation of LIBOR and other interbank-offered based reference rates as of the end of 2021. ASU 2020-04 is effective for certain reference rate-related contract modifications that occur during the period March 12, 2020 through December 31, 2022. Management is currently evaluating the impact, if any of applying this ASU.
In October 2020, the Securities and Exchange Commission (“SEC”) adopted new regulations governing the use of derivative by registered investment companies (“Rule 18f-4”). Rule 18f-4 will impose limits on the amount of derivatives a Fund can enter into, eliminate the asset segregation framework currently used by funds to comply with Section 18 of the 1940 Act, and require funds whose use of derivatives is greater than a limited specified amount to establish and maintain a comprehensive derivatives risk management program and appoint a derivatives risk manager. Funds will be required to comply with Rule 18f-4 by August 19,2022. It is not currently clear what impact, if any, Rule 18f-4 will have on the availability, liquidity or performance of derivatives. Management is currently evaluating the potential impact of Rule 18f-4 on the Funds. When fully implemented, Rule 18f-4 may require changes in how a Fund uses derivatives, adversely affect the Fund’s performance and increase costs related to the Funds’ use of derivatives.
11. SUBSEQUENT EVENTS
Subsequent events after the date of the Statements of Assets and Liabilities have been evaluated through the date the financial statements were issued. Management has determined that no events or transactions occurred requiring adjustment or disclosure in the financial statements.

grant thornton llp Two Commerce Square 2001 Market Street, Suite 700 Philadelphia, PA 19103
D +1 215 561 4200 F +1 215 561 1066
|
| REPORT OF INDEPENDENT REGISTERED PUBLIC ACCOUNTING FIRM |
Board of Trustees of the Two Roads Shared Trust and Shareholders of
LeaderShares® Activist Leaders® ETF
LeaderShares® AlphaFactor® Tactical Focused ETF
LeaderShares® AlphaFactor® US Core Equity ETF
LeaderShares® Equity Skew ETF
LeaderShares® Dynamic Yield ETF
Opinion on the financial statements
We have audited the accompanying statements of assets and liabilities, including the schedules of investments, of LeaderShares® Activist Leaders® ETF, LeaderShares® AlphaFactor® Tactical Focused ETF, LeaderShares® AlphaFactor® US Core Equity ETF, LeaderShares® Equity Skew ETF and LeaderShares® Dynamic Yield ETF (five of the funds in the Two Roads Shared Trust) (collectively the “Funds”) as of October 31, 2021, the related statements of operations, changes in net assets and the financial highlights for each of the periods indicated in the table below, and the related notes (collectively referred to as the “financial statements”). In our opinion, the financial statements present fairly, in all material respects, the financial position of the Funds as of October 31, 2021, and the results of their operations, changes in their net assets, and their financial highlights for each of the periods indicated in the table below, in conformity with accounting principles generally accepted in the United States of America.
GT.COM Grant Thornton LLP is the U.S. member firm of Grant Thornton International Ltd (GTIL). GTIL and each of its member firms are separate legal entities and are not a worldwide partnership.
| Fund | Statement of Operations | Statement of Changes in Net Assets | Financial Highlights |
| LeaderShares® Activist Leaders® ETF | For the year ended October 31, 2021 | For the year ended October 31, 2021 and for the period October 26, 2020 (commencement of operations) through October 31, 2020 | For the year ended October 31, 2021 and for the period October 26, 2020 (commencement of operations) through October 31, 2020 |
| LeaderShares® AlphaFactor® Tactical Focused ETF | For the year ended October 31, 2021 | For the year ended October 31, 2021 and for the period October 26, 2020 (commencement of operations) through October 31, 2020 | For the year ended October 31, 2021 and for the period October 26, 2020 (commencement of operations) through October 31, 2020 |
LeaderShares® AlphaFactor® US Core Equity ETF
| For the year ended October 31, 2021 | For each of the two years in the period ended October 31, 2021 | For each of the three years in the period ended October 31, 2021 and for the period October 1, 2018 (commencement of operations) through October 31, 2018 |
LeaderShares® Equity Skew ETF
| For the year ended October 31, 2021 | For the year ended October 31, 2021 and for the period May 11, 2020 (commencement of operations) through October 31, 2021 | For the year ended October 31, 2021 and for the period May 11, 2020 (commencement of operations) through October 31, 2021 |
LeaderShares® Dynamic Yield ETF
| For the period June 28, 2021 (commencement of operations) through October 31, 2021 | For the period June 28, 2021 (commencement of operations) through October 31, 2021 | For the period June 28, 2021 (commencement of operations) through October 31, 2021 |
Basis for opinion
These financial statements are the responsibility of the Funds’ management. Our responsibility is to express an opinion on the Funds’ financial statements based on our audits. We are a public accounting firm registered with the Public Company Accounting Oversight Board (United States) (“PCAOB”) and are required to be independent with respect to the Funds in accordance with the U.S. federal securities laws and the applicable rules and regulations of the Securities and Exchange Commission and the PCAOB.
We conducted our audits in accordance with the standards of the PCAOB. Those standards require that we plan and perform the audit to obtain reasonable assurance about whether the financial statements are free of material misstatement, whether due to error or fraud. The Funds are not required to have, nor were we engaged to perform, an audit of their internal control over financial reporting. As part of our audits we are required to obtain an understanding of internal control over financial reporting but not for the purpose of expressing an opinion on the effectiveness of the Funds’ internal control over financial reporting. Accordingly, we express no such opinion.
Our audits included performing procedures to assess the risks of material misstatement of the financial statements, whether due to error or fraud, and performing procedures that respond to those risks. Such procedures included examining, on a test basis, evidence regarding the amounts and disclosures in the financial statements. Our procedures included confirmation of securities owned as of October 31, 2021, by correspondence with the custodian and brokers; when replies were not received from brokers, we performed other auditing procedures. Our audits also included evaluating the accounting principles used and significant estimates made by management, as well as evaluating the overall presentation of the financial statements and financial highlights. We believe that our audits provide a reasonable basis for our opinion.
We have served as the auditor of one or more investment companies in the Two Roads Shared Trust since 2016.
/s/ Grant Thornton LLP
Philadelphia, Pennsylvania
January 10, 2022
| LeaderShares® ETF’s |
| EXPENSE EXAMPLES (Unaudited) |
| October 31, 2021 |
As a shareholder of the Funds, you incur two types of costs: (1) transaction costs, including brokerage commissions on purchases and sales of Fund shares; (2) ongoing costs, including a unitary management fee and other Fund expenses. This example is intended to help you understand your ongoing costs (in dollars) of investing in the Fund and to compare these costs with the ongoing costs of investing in other mutual funds.
The example for LeaderShares® Activist Leaders® ETF, LeaderShares® AlphaFactor® Tactical Focused ETF, LeaderShares® AlphaFactor® US Core Equity ETF, and LeaderShares® Equity Skew ETF is based on an investment of $1,000 invested at the beginning of the period and held for the entire period from May 1, 2021 through October 31, 2021. The Dynamic Yield ETF Fund commenced operation on June 28, 2021. Therefore, this funds example is based on an investment of $1,000 invested at inception and held for the remainder of the period from June 28, 2021 through October 31, 2021.
Actual Expenses
The “Actual” expenses line in the table below provides information about actual account values and actual expenses. You may use the information below, together with the amount you invested, to estimate the expenses that you paid over the period. Simply divide your account value by $1,000 (for example, an $8,600 account value divided by $1,000 = 8.6), then multiply the result by the number in the table under the heading entitled “Expenses Paid During Period” to estimate the expenses you paid on your account during this period.
Hypothetical Example for Comparison Purposes
The “Hypothetical” line in the table below provides information about hypothetical account values and hypothetical expenses based on the Fund’s actual expense ratio and an assumed rate of return of 5% per year before expenses, which is not the Fund’s actual return. The hypothetical account values and expenses may not be used to estimate the actual ending account balances or expenses you paid for the period. You may use this information to compare this 5% hypothetical example with the 5% hypothetical examples that appear in the shareholder reports of other funds.
Please note that the expenses shown in the table are meant to highlight your ongoing costs only and do not reflect any transactional costs, such as brokerage commissions paid on purchases and sales of Fund shares. Therefore, the table is useful in comparing ongoing costs only, and will not help you determine the relative total costs of owning different funds. In addition, if these transactional costs were included, your costs would have been higher.
| Hypothetical | ||||||||||||||
| Actual* | (5% return before expenses) | |||||||||||||
| Fund’s | Beginning | Ending | Ending | |||||||||||
| Annualized | Account | Account | Expenses | Account | Expenses | |||||||||
| Expense | Value | Value | Paid During | Value | Paid During | |||||||||
| Ratio | 5/1/21 | 10/31/21 | Period | 10/31/21 | Period | |||||||||
| LeaderShares® Activist Leaders® ETF | 0.75% | $1,000.00 | $1,013.76 | $2.64 | $1,022.58 | $2.65 | ||||||||
| LeaderShares® AlphaFactor® Tactical Focused ETF | 0.99% | $1,000.00 | $1,015.22 | $2.49 | $1,022.74 | $2.50 | ||||||||
| LeaderShares® AlphaFactor® US Core Equity ETF | 0.75% | $1,000.00 | $1,017.19 | $3.81 | $1,021.42 | $3.82 | ||||||||
| LeaderShares® Equity Skew ETF | 0.75% | $1,000.00 | $1,013.96 | $3.81 | $1,021.42 | $3.82 | ||||||||
| * | Expenses are equal to the average account value over the period, multiplied by the Funds’ annualized expense ratio, multiplied by the number of days in the period (184) divided by the number of days in the fiscal year (365). |
| Hypothetical | ||||||||||||||
| Actual* | (5% return before expenses) | |||||||||||||
| Fund’s | Beginning | Ending | Ending | |||||||||||
| Annualized | Account | Account | Expenses | Account | Expenses | |||||||||
| Expense | Value | Value | Paid During | Value | Paid During | |||||||||
| Ratio | 6/28/21 | 10/31/21 | Period | 10/31/21 | Period | |||||||||
| LeaderShares® Dynamic Yield ETF | 0.75% | $1,000.00 | $1,000.45 | $2.57 | $1,014.55 | $2.59 | ||||||||
| * | Expenses are equal to the average account value over the period, multiplied by the Funds’ annualized expense ratio, multiplied by the number of days in the period (125) divided by the number of days in the fiscal year (365). |
| LeaderShares® ETF’s |
| SUPPLEMENTAL INFORMATION (Unaudited) (Continued) |
| October 31, 2021 |
Approval of Advisory Agreement
LeaderShares Dynamic Yield ETF
At a meeting held on June 15, 2021 (the “Meeting”), the Board of Trustees (the “Board”) of Two Roads Shared Trust (the “Trust”), each of whom is not an “interested person” of the Trust (the “Independent Trustees” or the “Trustees”), as such term is defined under Section 2(a)(19) of the Investment Company Act of 1940, as amended (the “1940 Act”), considered the approval of an investment advisory agreement (the “Advisory Agreement”) between Redwood Investment Management LLC (“Redwood” or the “Adviser”) and the Trust, on behalf of the LeaderShares Dynamic Yield ETF (“DYLD” or the “Fund”).
In connection with the Board’s consideration of the Advisory Agreement, the Board received written materials in advance of the Meeting, which included information regarding: (i) the nature, extent, and quality of services to be provided to the Fund by Redwood; (ii) a description of the Adviser’s investment management personnel; (iii) an overview of the Adviser’s operations and financial condition; (iv) a description of the Adviser’s brokerage practices (including any soft dollar arrangements); (v) a comparison of the Fund’s proposed advisory fees and overall expenses with those of comparable funds; (vi) the anticipated level of profitability from the Adviser’s fund-related operations; (vii) the Adviser’s compliance policies and procedures, including policies and procedures for personal securities transactions, business continuity and information security and (viii) information regarding the performance record of other funds with similar investment strategies to those of the Fund.
Throughout the process, including at the meeting, the Board had numerous opportunities to ask questions of and request additional materials from Redwood. During the Meeting, the Board was advised by, and met in executive session with, the Board’s independent legal counsel, and received a memorandum from such independent counsel regarding their responsibilities under applicable law. The Board also noted that the evaluation process with respect to the Adviser was an ongoing one and that in this regard, the Board took into account discussions with management and information provided to the Board at prior meetings with respect to the services provided by the Adviser.
Matters considered by the Board in connection with its approval of the Advisory Agreement included, among others, the following:
Nature, Extent and Quality of Services. The Board reviewed materials provided by Redwood related to the Advisory Agreement with the Trust with respect to DYLD, including: the Advisory Agreement; a description of the manner in which investment decisions are made and executed; an overview of the personnel that perform services for DYLD and their background and experience; a summary of the financial condition of Redwood; an overview of Redwood’s compliance program, including its business continuity and cybersecurity policies, a Code of Ethics containing provisions reasonably necessary to prevent Access Persons, as that term is defined in Rule 17j-1 under the 1940 Act, from engaging in conduct prohibited by Rule 17j-1(b); information
| LeaderShares® ETF’s |
| SUPPLEMENTAL INFORMATION (Unaudited) (Continued) |
| October 31, 2021 |
regarding risk management processes and liquidity management; an annual review of the operation of Redwood’s compliance program; information regarding Redwood’s compliance and regulatory history; and independent reports prepared by Broadridge, an independent third party data provider, analyzing the proposed fees and expenses of DYLD as compared to other ETFs with similar investment strategies.
In reaching its conclusions with respect to the nature and quality of services to be provided by Redwood under the Advisory Agreement, the Board considered its regular review of Redwood’s asset management, risk management, operations, and compliance experience in connection with Redwood’s existing suite of funds. The Board noted that the Trust’s CCO has reviewed Redwood’s compliance policies and procedures and had discussed the operation of Redwood’s compliance program, including recent additions Redwood had made to improving its operations, and that his conclusions regarding Redwood’s compliance program continue to find that Redwood’s compliance program is reasonably designed to ensure compliance with federal securities laws.
With respect to DYLD, the Board considered that the Fund’s proposed investment strategy and the efficiencies Redwood would gain from managing a fund with this particular investment strategy. The Board considered Redwood’s operational track record with its other funds, including its experience with actively managed ETFs and with funds that use derivatives to execute their strategies, and determined that Redwood had the requisite experience and sophistication to manage DYLD’s investment strategy. In considering the nature, extent, and quality of the services provided by Redwood, the Board also took into account its knowledge, acquired through multiple discussions and reports during the preceding year and in past years, of Redwood’s management and the quality of the performance of Redwood’s duties.
The Board concluded that Redwood had sufficient quality and depth of personnel, resources, investment methodologies and compliance policies and procedures to perform its duties under the Advisory Agreement with respect to DYLD and that the nature, overall quality and extent of the management services provided by Redwood has been satisfactory.
Performance. The Board considered the Adviser’s discussion of its experience with respect to the proposed strategy of the Fund and that the Adviser did not currently run a comparable fund but had experience with a similar strategy within certain of its model portfolios. The Board noted that although no comparable returns had been provided for consideration with respect to DYLD, based on Redwood’s experience and expertise, Redwood could be expected to operate the Fund’s investment strategy. The Board concluded that Redwood’s overall historical performance was satisfactory, and that Redwood was expected to obtain acceptable level of investment returns for shareholders of DYLD.
Fees and Expenses. Regarding the costs of the services provided by Redwood with respect to DYLD, the Board considered a comparison of DYLD’s unitary fee and net operating expense ratio to those of the funds in its Peer Group. The Board noted that Redwood charged a unitary fee of 0.75% (exclusive of brokerage fees and commissions, taxes, borrowing costs such as dividend expense on securities sold short and interest, fees and expenses of other investment companies in which DYLD might invest, extraordinary or non-recurring expenses, and DYLD’s allocated pro-
| LeaderShares® ETF’s |
| SUPPLEMENTAL INFORMATION (Unaudited) (Continued) |
| October 31, 2021 |
rata portion of fees and expenses of the Independent Trustees and their legal counsel). The Board noted that DYLD’s unitary fee and estimated total operating expenses were above the median of its Peer Group but were not the highest in its Peer Group. The Board took into account Redwood’s discussion of DYLD’s estimated expenses and specifically Redwood’s review of certain comparable funds in the Peer Group that they believed did not provide an applicable strategy comparison to DYLD because they were primarily high yield bond funds and not actively managed and/or tactical fixed income funds, and that if those funds were excluded, DYLD’s unitary fee would be lower than the mean and median of the fees and expenses of the remaining Peer Group. The Board concluded that the advisory fee of DYLD is consistent with Redwood’s fees for its other tactical strategy ETFs and is not unreasonable.
Profitability. The Board considered Redwood’s anticipated profitability and whether these expected profits are reasonable in light of the services to be provided to DYLD. The Board reviewed a profitability analysis prepared by Redwood based on projected asset levels of DYLD and considered the anticipated net profits of Redwood after its expenses were deducted from the unitary fee. The Board noted the direct and indirect costs of operating DYLD in that analysis and concluded that Redwood’s estimated profitability from its relationship with the Fund was not excessive.
Economies of Scale. The Board considered whether Redwood would realize economies of scale with respect to its management of DYLD as it grew and whether fee levels reflected these economies. The Board noted that DYLD’s current advisory fee does not include breakpoints. The Board also noted the unitary fee structure of the Fund. The Board concluded that, at current and projected asset levels for the initial term of the Advisory Agreement with respect to DYLD, economies of scale were not a consideration at this time but that the Board would consider whether economies of scale exist in the future.
Other Benefits . The Board also considered the character and amount of other direct and incidental benefits to be received by Redwood from its association with DYLD. The Board considered that Redwood expected to use DYLD as one of the components of model portfolios it builds for its clients and that DYLD would reduce trading and custodial costs for its clients using its models. The Board noted that Redwood did not anticipate receiving any other direct, indirect or ancillary material “fall-out” benefits from its relationship with DYLD.
Conclusion. The Board, having requested and received such information from Redwood as it believed reasonably necessary to evaluate the terms of the Advisory Agreement with respect to DYLD, and having been advised by independent counsel that the Board had appropriately considered and weighed all relevant factors, determined that approval of the Advisory Agreement for an initial two-year term was in the best interests of DYLD and its future shareholders.
In considering the Advisory Agreement’s approval, the Board considered a variety of factors, including those discussed above, and also considered other factors (including conditions and trends prevailing generally in the economy, the securities markets, and the industry) . The Board did not identify any one factor as determinative, and each Independent Trustee may have weighed each factor differently. The Board’s conclusions may be based in part on its consideration of the advisory arrangements in prior years and on the Board’s ongoing regular review of fund performance and operations throughout the year.
| LeaderShares® ETF’s |
| SUPPLEMENTAL INFORMATION (Unaudited)(Continued) |
| October 31, 2021 |
Trustees and Officers. The Trustees and officers of the Trust, together with information as to their principal business occupations during the past five years and other information, are shown below. Unless otherwise noted, the address of each Trustee and Officer is 225 Pictoria Drive, Suite 450, Cincinnati, OH 45246.
Independent Trustees *
| Name, Address, Year of Birth | Position(s) Held with Registrant | Term and Length Served | Principal Occupation(s) During Past 5 Years | Number of Portfolios Overseen In The Fund Complex** | Other Directorships Held During Past 5 Years |
| Mark Garbin Year of Birth: 1951 | Trustee | Indefinite, Since 2012 | Managing Principal, Coherent Capital Management LLC (since 2008) | 10 | Northern Lights Fund Trust (since 2013); Northern Lights Variable Trust (since 2013); Forethought Variable Insurance Trust (since 2013); OHA Mortgage Strategies Fund (offshore), Ltd. (2014 - 2017); iCapital KKR Private Markets Fund (since 2014); and Carlyle Tactical Private Credit Fund (since March 2018) |
| Mark D. Gersten Year of Birth: 1950 | Chairman, Trustee | Indefinite, Since 2012 | Independent Consultant (since 2012); Senior Vice President – Global Fund Administration Mutual Funds & Alternative Funds, AllianceBernstein LP (1985 – 2011) | 10 | Northern Lights Fund Trust (since 2013); Northern Lights Variable Trust (since 2013); iCapital KKR Private Markets Fund (since 2014); previously, Ramius Archview Credit and Distressed Fund (2015-2017); and Schroder Global Series Trust (2012 to 2017) |
| Neil M. Kaufman Year of Birth: 1960 | Trustee, Audit Committee Chairman | Indefinite, Since 2012 | Managing Member, Kaufman, McGowan PLLC (legal services) (Since 2016); Partner, Abrams Fensterman, Fensterman, Eisman, Formato, Ferrara & Wolf, LLP (legal services) (2010-2016) | 10 | iCapital KKR Private Markets Fund (since 2014) |
| Anita K. Krug Year of Birth: 1969 | Trustee | Indefinite, Since 2012 | Dean and Professor (since 2019) Illinois Institute of Technology; Interim Vice Chancellor for Academic Affairs (2018-2019) University of Washington Bothell; Interim Dean (2017-2018), Professor (2016-2019), Associate Professor (2014-2016); and Assistant Professor (2010-2014), University of Washington School of Law | 10 | iCapital KKRPrivate Markets Fund (since 2014); Centerstone Investors Trust (2016-2021) |
| * | Information is as of October 31, 2021. |
| ** | As of October 31, 2021, the Trust was comprised of 24 active portfolios managed by seven unaffiliated investment advisers and two affiliated investment advisers. The term “Fund Complex” applies only to those funds that (i) are advised by a common investment adviser or by an investment adviser that is an affiliated person of the investment adviser of any of the other funds in the Trust or (ii) hold themselves out to investors as related companies for purposes of investment and investor services. [The Funds do not hold themselves out as related to any other series within the Trust, except for the Redwood Managed Volatility Fund, Redwood Managed Municipal Income Fund, Redwood AlphaFactor Tactical International Fund, and Redwood Systematic Macro Trend (“SMarT”) Fund, which are also advised by the Fund’s Adviser.] |
10/31/2021 – Two Roads v2
| LeaderShares® ETF’s |
| SUPPLEMENTAL INFORMATION (Unaudited)(Continued) |
| October 31, 2021 |
Officers of the Trust*
| Name, Address, Year of Birth | Position(s) Held with Registrant | Principal Occupation(s) During Past 5 Years | Number of Portfolios Overseen In The Fund Complex** | Other Directorships Held During Past 5 Years |
| James Colantino 80 Arkay Drive Hauppauge, NY 11788 Year of Birth: 1969 | President Since Feb. 2017 Treasurer (2012 to 2017) | Senior Vice President (2012-present); Vice President (2004 to 2012); Ultimus Fund Solutions LLC | N/A | N/A |
| Laura Szalyga 80 Arkay Drive Hauppauge, NY 11788 Year of Birth: 1978 | Treasurer Since Feb. 2017 | Vice President, Ultimus Fund Solutions LLC (since 2015); Assistant Vice President, Ultimus Fund Solutions LLC (2011-2014) | N/A | N/A |
| Richard A. Malinowski 80 Arkay Drive Hauppauge, NY 11788 Year of Birth: 1983 | Vice President Since Sep. 2018 Secretary Since 2013 | Senior Vice President and Senior Managing Counsel, Ultimus Fund Solutions LLC, (since February 2020); Senior Vice President Legal Administration, Ultimus Fund Solutions LLC (April 2017 to February 2020); Vice President and Counsel (April 2016 – 2017) and AVP and Staff Attorney (September 2012 –March 2016). | N/A | N/A |
| William B. Kimme Year of Birth: 1962 | Chief Compliance Officer Since Inception | Senior Compliance Officer, Northern Lights Compliance Services, LLC (September 2011 - present) | N/A | N/A |
| * | Information is as of October 31, 2021. |
| ** | As of October 31, 2021, the Trust was comprised of 24 active portfolios managed by seven unaffiliated investment advisers and two affiliated investment advisers. The term “Fund Complex” applies only to those funds that (i) are advised by a common investment adviser or by an investment adviser that is an affiliated person of the investment adviser of any of the other funds in the Trust or (ii) hold themselves out to investors as related companies for purposes of investment and investor services. [The Funds do not hold themselves out as related to any other series within the Trust, except for the Redwood Managed Volatility Fund, Redwood Managed Municipal Income Fund, Redwood AlphaFactor Tactical International Fund, and Redwood Systematic Macro Trend (“SMarT”) Fund, which are also advised by the Fund’s Adviser.] |
The Fund’s Statement of Additional Information (“SAI”) includes additional information about the Trustees and is available free of charge, upon request, by calling toll-free at 1-855-733-3863.
10/31/2021 – Two Roads v2
PRIVACY NOTICE
| FACTS | WHAT DOES TWO ROADS SHARED TRUST DO WITH YOUR PERSONAL INFORMATION |
| Why? | Financial companies choose how they share your personal information. |
| Federal law gives consumers the right to limit some but not all sharing. | |
| Federal law also requires us to tell you how we collect, share, and protect your personal information. Please read this notice carefully to understand what we do. | |
| What? | THE TYPES OF PERSONAL INFORMATION WE COLLECT AND SHARE DEPENDS ON THE PRODUCT OR SERVICE THAT YOU HAVE WITH US. THIS INFORMATION CAN INCLUDE: |
| ● Social Security number and income | |
| ● Account transactions and transaction history | |
| ● Investment experience and purchase history | |
| When you are no longer our customer, we continue to share your information as described in this notice. | |
| How? | All financial companies need to share customers’ personal information to run their everyday business. In the section below, we list the reasons financial companies can share their customers’ personal information; the reason Two Roads Shared Trust chooses to share and whether you can limit this sharing. |
| Reasons we can share your personal information | Does Two Roads Shared Trust share? | Can you limit this sharing? |
| For our everyday business purposes – | ||
| such as to process your transactions, maintain your account(s), respond to court orders and legal investigations, or report to credit bureaus | YES | NO |
| For our marketing purposes – | NO | We do not share |
| to offer our products and services to you | ||
| For joint marketing with other financial companies | NO | We do not share |
| For our affiliates’ everyday business purposes – | NO | We do not share |
| information about your transactions and experiences | ||
| For our affiliates’ everyday business purposes – | NO | We do not share |
| information about your creditworthiness | ||
| For our affiliates to market to you | NO | We do not share |
| For nonaffiliates to market to you | NO | We do not share |
| Questions? | Call 1-402-895-1600 |
What we do
| How does Two Roads Shared Trust protect my personal information? | To protect your personal information from unauthorized access and use, we use security measures that comply with federal law. These measures include computer safeguards and secured files and buildings. |
| Our service providers are held accountable for adhering to strict policies and procedures to prevent any misuse of your nonpublic personal information. | |
| How does Two Roads Shared Trust | We collect your personal information, for example, when you |
| collect my personal information? | |
| ● open an account or give us contact information | |
| ● provide account information or give us your income information | |
| ● make deposits or withdrawals from your account | |
| We also collect your personal information from other companies. | |
| Why can’t I limit all sharing? | Federal law gives you the right to limit only |
| ● sharing for affiliates’ everyday business purposes – information about your creditworthiness | |
| ● affiliates from using your information to market to you | |
| ● sharing for nonaffiliates to market to you | |
| State laws and individual companies may give you additional rights to limit sharing | |
| Definitions | |
| Affiliates | Companies related by common ownership or control. They can be financial and nonfinancial companies. |
| ● Two Roads Shared Trust has no affiliates. | |
| Nonaffiliates | Companies not related by common ownership or control. They can be financial and nonfinancial companies. |
| ● Two Roads Shared Trust does not share with nonaffiliates so they can market to you. | |
| Joint marketing | A formal agreement between nonaffiliates financial companies that together market financial products or services to you. |
| �� | ● Two Roads Shared Trust does not jointly market. |
Proxy Voting Policy
Information regarding how the Funds vote proxies relating to portfolio securities for the 12 month period ended June 30th as well as a description of the policies and procedures that the Funds used to determine how to vote proxies is available without charge, upon request, by calling 1-480-757-4277 or by referring to the Securities and Exchange Commission’s (“SEC”) website at http://www.sec.gov.
Portfolio Holdings
Each Fund files its complete schedule of portfolio holdings with the SEC for the first and third quarters of each fiscal year on Form N-PORT. Form N-PORT is available on the SEC’s website at http://www.sec.gov. The information on Form N-PORT is available without charge, upon request, by calling 1-480-757-4277.
| Investment Advisor |
| Redwood Investment Management, LLC |
| 4110 N Scottsdale Rd, Suite 125 |
| Scottsdale, AZ 85251 |
| Administrator |
| Ultimus Fund Solutions, LLC |
| 4221 North 203rd Street, Suite 100 |
| Elkhorn, NE 68022-3474 |
| LEADERSHARES-AR21 |
ITEM 2. CODE OF ETHICS.
| (a) | The registrant has, as of the end of the period covered by this report, adopted a code of ethics that applies to the registrant's principal executive officer, principal financial officer, and principal accounting officer or controller, or persons performing similar functions, regardless of whether these individuals are employed by the registrant or a third party. |
| (b) | During the period covered by this report, there were no amendments to any provision of the code of ethics. |
| (c) | During the period covered by this report, there were no waivers or implicit waivers of a provision of the code of ethics. |
ITEM 3. AUDIT COMMITTEE FINANCIAL EXPERT.
| The registrant’s Board of Trustees has determined that Mark Gersten is an audit committee financial expert, as defined in Item 3 of Form N-CSR. Mr Gersten is independent for purposes of this Item 3. |
ITEM 4. PRINCIPAL ACCOUNTANT FEES AND SERVICES.
| (a) | Audit Fees. The aggregate fees billed for each of the last two fiscal years for professional services rendered by the registrant's principal accountant for the audit of the registrant's annual financial statements or services that are normally provided by the accountant in connection with statutory and regulatory filings or engagements for those fiscal years are as follows:
|
| Trust Series | 2021 | 2020 | |
| LeaderShares AlphaFactor US Core Equity ETF | $16,250 | $15,500 | |
| LeaderShares Activist Leaders ETF | $16,500 | $10,500 | |
| LeaderShares AlphaFactor Tactical Focused ETF | $16,500 | $10,500 | |
| LeaderShares Equity Skew ETF | $16,500 | $15,500 | |
| LeaderShares Dynamic Yield ETF | $16,250 | N/A |
| (b) | Audit-Related Fees. There were no fees billed in each of the last two fiscal years for assurances and related services by the principal accountant that are reasonably related to the performance of the audit of the registrant’s financial statements and are not reported under paragraph (a) of this item. |
| (c) | Tax Fees. The aggregate fees billed in each of the last two fiscal years for professional services rendered by the principal accountant for tax compliance are as follows: |
| Trust Series | 2021 | 2020 | ||
| LeaderShares AlphaFactor US Core Equity ETF | $3,200 | $3,050 | ||
| LeaderShares Activist Leaders ETF | $3,200 | $3,050 | ||
| LeaderShares AlphaFactor Tactical Focused ETF | $3,200 | $3,050 | ||
| LeaderShares Equity Skew ETF | $3,200 | $3,050 |
LeaderShares Dynamic Yield ETF $3,200 N/A
| (d) | All Other Fees. The aggregate fees billed in each of the last two fiscal years for products and services provided by the registrant’s principal accountant, other than the services reported in paragraphs (a) through (c) of this item were $0 for the fiscal year ended October 31, 2021. |
| (e)(1) | The audit committee does not have pre-approval policies and procedures. Instead, the audit committee or audit committee chairman approves on a case-by-case basis each audit or non-audit service before the principal accountant is engaged by the registrant. |
| (e)(2) | There were no services described in each of paragraphs (b) through (d) of this Item that were approved by the audit committee pursuant to paragraph (c)(7)(i)(C) of Rule 2-01 of Regulation S-X. |
| f) | Not applicable. The percentage of hours expended on the principal accountant's engagement to audit the registrant's financial statements for the most recent fiscal year that were attributed to work performed by persons other than the principal accountant's full-time, permanent employees was zero percent (0%). |
| (g) | All non-audit fees billed by the registrant's principal accountant for services rendered to the registrant for the fiscal year ended October 31, 2021 are disclosed in (b)-(d) above. There were no audit or non-audit services performed by the registrant's principal accountant for the registrant's adviser. |
| (h) | Not applicable. |
ITEM 5. AUDIT COMMITTEE OF LISTED REGISTRANTS.
Not applicable
ITEM 6. SCHEDULE OF INVESTMENT
Included in annual report to shareholders filed under item 1 of this form.
ITEM 7. DISCLOSURE OF PROXY VOTING POLICIES AND PROCEDURES FOR CLOSED-END MANAGEMENT INVESTMENT COMPANIES.
Not applicable Fund is an open-end management investment company
ITEM 8. PORTFOLIO MANAGERS OF CLOSED-END MANAGEMENT INVESTMENT COMPANIES
Not applicable Fund is an open-end management investment company
ITEM 9. PURCHASES OF EQUITY SECURITIES BY CLOSED-END MANAGEMENT INVESTMENT COMPANY AND AFFILIATED PURCHASERS.
Not applicable Fund is an open-end management investment company
ITEM 10. SUBMISSION OF MATTERS TO A VOTE OF SECURITY HOLDERS.
Not applicable at this time.
ITEM 11. CONTROLS AND PROCEDURES.
| (a) | The registrant's principal executive and principal financial officers, or persons performing similar functions, have concluded that the registrant's disclosure controls and procedures (as defined in Rule 30a-3(c) under the 1940 Act), are effective, as of a date within 90 days of the filing date of this report, based on the evaluation of these controls and procedures required by Rule 30a-3(b) under the 1940 Act and Rule 15d-15(b) under the Securities Exchange Act of 1934, as amended. |
| (b) | There were no changes in the registrant's internal control over financial reporting (as defined in Rule 30a-3(d) under the 1940 Act) that occurred during the period covered by this report that have materially affected, or are reasonably likely to materially affect, the registrant's internal control over financial reporting. |
ITEM 12. DISCLOSURE OF SECURITIES LENDING ACTIVITIES FOR CLOSED-END MANAGEMENT INVESTMENT COMPANIES.
Not applicable Fund is an open-end management investment company
ITEM 13. EXHIBITS
| (1) | Code of Ethics for Principal Executive and Senior Financial Officers is attached hereto. |
| (2) | Certifications pursuant to Section 302 of the Sarbanes-Oxley Act of 2002 are filed herewith. |
| (3) | Certifications pursuant to Section 906 of the Sarbanes-Oxley Act of 2002 are filed herewith. |
SIGNATURES
Pursuant to the requirements of the Securities Exchange Act of 1934 and the Investment Company Act of 1940, the registrant has duly caused this report to be signed on its behalf by the undersigned, thereunto duly authorized.
Two Roads Shared Trust
| By James Colantino | /s/James Colantino |
| President/Principal Executive Officer, | |
| Date: January 10, 2022 | |
Pursuant to the requirements of the Securities Exchange Act of 1934 and the Investment Company Act of 1940, this report has been signed below by the following person on behalf of the registrant and in the capacities and on the date indicated.
| By James Colantino | /s/James Colantino |
| President/Principal Executive Officer | |
| Date: January 10, 2022 | |
Pursuant to the requirements of the Securities Exchange Act of 1934 and the Investment Company Act of 1940, this report has been signed below by the following person on behalf of the registrant and in the capacities and on the date indicated.
| By Laura Szalyga | /s/ Laura Szalyga |
| Treasurer/Principal Financial Officer | |
| Date: January 10, 2022 | |