united states
securities and exchange commission
washington, d.c. 20549
form n-csr
certified shareholder report of registered management
investment companies
Investment Company Act file number 811-22718
Two Roads Shared Trust
(Exact name of registrant as specified in charter)
225 Pictoria Drive, Suite 450, Cincinnati, Ohio 68130
(Address of principal executive offices) (Zip code)
The Corporation Trust Company
1209 Orange Street, Wilmington, DE 19801
(Name and address of agent for service)
Registrant's telephone number, including area code: 631-490-4300
Date of fiscal year end: 10/31
Date of reporting period: 10/31/21
ITEM 1. REPORTS TO SHAREHOLDERS.
Affinity World Leaders Equity ETF
WLDR
October 31, 2021
Annual Report
Advised by:
Regents Park Funds, LLC
4041 MacArthur Blvd., Suite 155
Newport Beach, CA 92660
RegentsParkFunds.com
1-866-866-4848
Distributed by Northern Lights Distributors, LLC
Member FINRA

| LETTER TO SHAREHOLDERS OF THE AFFINITY WORLD LEADERS (WLDR ETF) |
| November 2021 |
Dear Shareholders:
The Affinity World Leaders Equity ETF (ticker: WLDR) returned 44.42% over the 12-month period ended October 31, 2021. This period marked the recovery from the pandemic as equity markets rallied from the lows reached in 2020.
Fiscal and monetary stimulus as well as improving economies caused the equity markets to rally from the lows reached in March of 2020. Positive vaccine news in November of 2020 combined with continued fiscal stimulus and solid revenue and earnings reports contributed to rising stock markets into 2021.
In the WLDR ETF, most countries in which the fund invested were significantly positive for the fiscal year. France, Netherlands, and Canada represented the countries with the best performing stocks. U.S. equities also performed very well with a return of 48% for the period. Stocks within Singapore, Spain and Norway underperformed the broader market. Regarding sectors, energy stocks yielded the best return for the period. Global demand for oil, driven primarily by economies reopening, pushed oil prices past $80 dollars per barrel. The financial sector also performed well with interest rates rising off their lows set in the Summer of last year. The technology sector was the third best performing group during this period. Underperforming sectors included transportation, utilities, and consumer non-durables.
Value stocks outperformed growth stocks during the period as investors rewarded cyclically sensitive sectors. Coming out of the pandemic, investors began to focus on beaten down companies with the anticipation that these firms would produce the greatest rebound in earnings, particularly those that had suffered the most due to economic lockdowns. As a result, higher quality companies, as defined by greater earnings stability, lagged the market.
More recently, investor attention has been focused on inflation and Federal Reserve tapering. Inflation has reached multi-year highs as a result of supply chain bottlenecks and higher energy prices. The Federal Reserve insists that price increases are transitory, and they will moderate bond purchases in the middle of next year. Meanwhile, the U.S. economy continues to improve.
On behalf of the entire staff at Affinity, we greatly appreciate our shareholders and thank you for your support. We look forward to communicating with you again soon.
Gregory R. Lai, CFA
CEO & Founder
The views in this report are those of the Fund’s management. This report contains certain forward-looking statements about factors that may affect the performance of the Fund in the future. These statements are based on the Fund’s management’s predictions and expectations concerning certain future events such as the performance of the economy as a whole and of specific industry sectors. Management believes these forward-looking statements are reasonable, although they are inherently uncertain and difficult to predict.
4041MacArthur Blvd, Suite 150 | Newport Beach CA 92660 | Tel 949 660-6373 | Fax 949 251-5666
www.affinityinvestment.com
1719-NLD-11162021
1
| Affinity World Leaders Equity ETF |
| PORTFOLIO REVIEW (Unaudited) |
| October 31, 2021 |
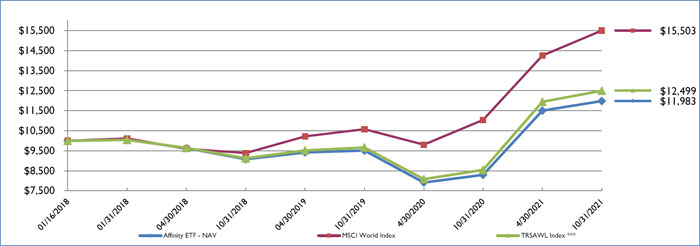
Average Annual Total Return through October 31, 2021*, as compared to its benchmark:
| 1 Year | 3 Year | Since Inception **** | |
| Return | Return | through October 31, 2021 | |
| Affinity World Leaders Equity ETF - NAV | 44.42% | 9.69% | 4.89% |
| Affinity World Leaders Equity ETF - Market Price | 43.33% | 9.45% | 4.88% |
| MSCI World Index ** | 40.42% | 18.20% | 12.27% |
| Thomson Reuters StarMine Affinity World Leaders Total Return Index *** | 46.28% | 11.06% | 6.06% |
| * | The performance data quoted here represents past performance. Current performance may be lower or higher than the performance data quoted above. Investment return and principal value will fluctuate, so that shares, when redeemed, may be worth more or less than their original cost. The returns shown do not reflect the deduction of taxes that a shareholder would pay on Fund distributions or on the redemptions of Fund shares. Past performance is no guarantee of future results. Performance figures for periods less than 1 year are not annualized. The Fund’s adviser has contractually agreed to reduce the Fund’s fees and/or absorb expenses of the Fund until at least February 28, 2022 to ensure that total annual Fund operating expenses after fee waiver and reimbursement (exclusive of any taxes, interest, brokerage commissions, expenses incurred in connection with any merger or reorganization, indirect expenses, expenses of other investment companies in which the Fund may invest, or extraordinary expenses such as litigation) will not exceed 0.67% of average daily net assets. This agreement may be terminated by the Fund’s Board of Trustees on 60 days’ written notice to the adviser. These fee waivers and expense reimbursements are subject to possible recoupment from the Fund in future years on a rolling three year basis (within the three years after the fees have been waived or reimbursed) if such recoupment can be achieved within the foregoing expense limits as well as any expense limitation in effect at the time the waiver or reimbursement was made. Without waiver or reimbursement the gross expenses and fees of the Fund are 2.90% per the most recent prospectus dated March 1, 2021. The expense limits in effect prior to their expiration on February 28, 2021 was 0.47%. The Fund’s adviser and Affinity Investment Advisors, LLC (“Affinity” or the “Sub-Adviser”) have agreed that Affinity will reimburse all Fund expenses directly. For performance information current to the most recent month-end, please call toll-free 1-866-866-4848. |
The Fund’s per share net asset value or “NAV” is the value of one share of the Fund as calculated in accordance with the standard formula for valuing exchange traded fund shares. The NAV return is based on the NAV of the Fund and the market return is based on the market price per share of the Fund. The price used to calculate market return (“Market Price”) is determined by using the midpoint between the highest bid and the lowest offer on the primary stock exchange on which shares of the Fund are listed for trading, as of the time that the Fund’s NAV is calculated. Market and NAV returns assume that dividends and capital gain distributions have been reinvested in the Fund at Market Price and NAV, respectively.
| ** | The MSCI World Index is a broad global equity index that represents large and mid-cap equity performance across 23 developed markets countries. It covers approximately 85% of the free float-adjusted market capitalization in each country and MSCI World Index does not offer exposure to emerging markets. The Fund’s portfolio holdings may differ significantly from the securities held in the Index, and unlike a mutual fund, an unmanaged index assumes no transaction costs, taxes, management fees or other expenses. Investors may not invest directly in an index. |
| *** | The Thomson Reuters StarMine Affinity World Leaders Total Return Index (“TRSAWL Index”) consists of equity securities issued and traded in the US as well as international countries. The TRSAWL Index consists of approximately 150 to 250 stocks of companies located in the U.S. and in at least three countries outside of the U.S., and may invest in up to 20 countries. The TRSAWL Index will be significantly invested in the securities of international companies in addition to securities of U.S. companies. The Fund’s portfolio holdings may differ significantly from the securities held in the TRSAWL Index, and unlike a mutual fund, an unmanaged index assumes no transaction costs, taxes, management fees or other expenses. Investors may not invest directly in an index. |
| **** | As of the close of business on the day of commencement of trading January 16, 2018. |
Comparison of the Change in Value of a $10,000 Investment
2
| Affinity World Leaders Equity ETF |
| PORTFOLIO REVIEW (Unaudited) (Continued) |
| October 31, 2021 |
Portfolio Composition as of October 31, 2021:
| Geographic Region | Percentage of Net Assets | Sector Classification | Percentage of Net Assets | |||||||
| United States | 65.1 | % | Technology Hardware | 10.4 | % | |||||
| Japan | 7.4 | % | Technology Services | 8.9 | % | |||||
| United Kingdom | 4.7 | % | Biotech & Pharma | 6.6 | % | |||||
| Netherlands | 3.9 | % | Health Care Facilities & Services | 6.0 | % | |||||
| France | 3.8 | % | Specialty Finance | 5.1 | % | |||||
| Ireland | 3.5 | % | Advertising & Marketing | 4.4 | % | |||||
| Germany | 3.2 | % | Insurance | 4.1 | % | |||||
| Canada | 1.2 | % | Oil & Gas Producers | 3.6 | % | |||||
| Switzerland | 1.2 | % | Retail - Consumer Staples | 3.6 | % | |||||
| Bermuda | 0.9 | % | Banking | 3.3 | % | |||||
| Other Assets in Excess of Liabilities | 5.1 | % | Other Assets in Excess of Liabilities | 44.0 | % | |||||
| 100.0 | % | 100.0 | % | |||||||
Please refer to the Schedule of Investments in this annual report for a detailed analysis of the Fund’s holdings.
3
| AFFINITY WORLD LEADERS EQUITY ETF |
| SCHEDULE OF INVESTMENTS |
| October 31, 2021 |
| Shares | Fair Value | |||||||
| COMMON STOCKS — 99.5% | ||||||||
| Australia - 0.7% | ||||||||
| 4,855 | Sonic Healthcare Ltd. | $ | 145,973 | |||||
| 44,587 | South32 Ltd. | 119,557 | ||||||
| 265,530 | ||||||||
| Belgium - 0.3% | ||||||||
| 932 | Solvay S.A. | 110,876 | ||||||
| Bermuda - 0.9% | ||||||||
| 2,211 | Athene Holding Ltd., Class A(a) | 192,379 | ||||||
| 1,591 | Bunge Ltd. | 147,390 | ||||||
| 339,769 | ||||||||
| Canada - 1.2% | ||||||||
| 28 | CAE, Inc.(a) | 848 | ||||||
| 1,901 | Canadian Apartment Properties REIT | 92,677 | ||||||
| 2,102 | Canadian Imperial Bank of Commerce | 254,655 | ||||||
| 432 | Canadian Tire Corp Ltd. | 61,262 | ||||||
| 1,006 | Restaurant Brands International, Inc. | 56,868 | ||||||
| 466,310 | ||||||||
| Cayman Islands - 0.3% | ||||||||
| 15,270 | CK Asset Holdings Ltd. | 94,320 | ||||||
| Denmark - 0.3% | ||||||||
| 39 | AP Moller - Maersk A/S - Series B | 112,814 | ||||||
| Finland - 0.8% | ||||||||
| 3,176 | Fortum OYJ | 94,458 | ||||||
| 38,176 | Nokia OYJ(a) | 219,571 | ||||||
| 314,029 | ||||||||
| France - 3.8% | ||||||||
| 5,774 | AXA S.A. | 168,118 | ||||||
| 1,507 | Bouygues S.A. | 61,039 | ||||||
| 6,950 | Carrefour S.A. | 125,911 | ||||||
| 2,722 | Cie de Saint-Gobain | 187,616 | ||||||
| 14,695 | Credit Agricole S.A. | 221,756 | ||||||
| 7,908 | Engie S.A. | 112,527 | ||||||
See accompanying notes which are an integral part of these financial statements.
4
| AFFINITY WORLD LEADERS EQUITY ETF |
| SCHEDULE OF INVESTMENTS (Continued) |
| October 31, 2021 |
| Shares | Fair Value | |||||||
| COMMON STOCKS — 99.5% (Continued) | ||||||||
| France - 3.8% (Continued) | ||||||||
| 3,209 | Sanofi | $ | 320,968 | |||||
| 6,938 | Societe Generale S.A. | 231,516 | ||||||
| 1,429,451 | ||||||||
| Germany - 3.2% | ||||||||
| 1,966 | BASF S.E. | 141,697 | ||||||
| 4,986 | Bayer A.G. | 280,828 | ||||||
| 1,923 | Bayerische Motoren Werke A.G. | 194,143 | ||||||
| 1,737 | Covestro A.G. | 111,362 | ||||||
| 2,312 | Daimler A.G. | 229,403 | ||||||
| 2,145 | Deutsche Post A.G. | 132,853 | ||||||
| 9,022 | E.ON S.E. | 114,493 | ||||||
| 1,204,779 | ||||||||
| Ireland - 3.5% | ||||||||
| 1,688 | Accenture plc, Class A | 605,638 | ||||||
| 7,842 | Seagate Technology Holdings plc | 698,487 | ||||||
| 1,304,125 | ||||||||
| Japan - 7.4% | ||||||||
| 9,044 | Canon, Inc. | 202,890 | ||||||
| 6,204 | Dai-ichi Life Holdings, Inc. | 130,663 | ||||||
| 3,172 | Dentsu Group, Inc. | 116,003 | ||||||
| 2,040 | FUJIFILM Holdings Corporation | 157,457 | ||||||
| 898 | Fujitsu Ltd. | 154,556 | ||||||
| 22,420 | Inpex Corporation | 187,186 | ||||||
| 2,602 | ITOCHU Corporation | 73,981 | ||||||
| 7,408 | Japan Tobacco, Inc. | 145,236 | ||||||
| 7,168 | Kubota Corporation | 152,287 | ||||||
| 7,748 | Marubeni Corporation | 65,314 | ||||||
| 2,584 | Mitsubishi Corporation | 81,854 | ||||||
| 44,632 | Mitsubishi UFJ Financial Group, Inc. | 243,661 | ||||||
| 3,458 | Mitsui & Company Ltd. | 78,607 | ||||||
| 3,988 | MS&AD Insurance Group Holdings, Inc. | 128,917 | ||||||
| 7,116 | Nippon Steel Corporation | 124,752 | ||||||
| 1,416 | Nippon Yusen KK | 101,582 | ||||||
| 7,056 | NTT Data Corporation | 141,275 | ||||||
See accompanying notes which are an integral part of these financial statements.
5
| AFFINITY WORLD LEADERS EQUITY ETF |
| SCHEDULE OF INVESTMENTS (Continued) |
| October 31, 2021 |
| Shares | Fair Value | |||||||
| COMMON STOCKS — 99.5% (Continued) | ||||||||
| Japan - 7.4% (Continued) | ||||||||
| 4,588 | Sumitomo Corporation | $ | 65,063 | |||||
| 26,076 | Toray Industries, Inc. | 162,116 | ||||||
| 1,520 | Toyota Tsusho Corporation | 65,719 | ||||||
| 6,456 | Yamaha Motor Company Ltd. | 179,200 | ||||||
| 2,758,319 | ||||||||
| Luxembourg - 0.4% | ||||||||
| 4,031 | ArcelorMittal S.A. | 136,798 | ||||||
| Netherlands - 3.9% | ||||||||
| 26 | Adyen N.V.(a) | 78,546 | ||||||
| 3,025 | AerCap Holdings N.V.(a) | 178,596 | ||||||
| 8,741 | CNH Industrial N.V. | 151,025 | ||||||
| 17,078 | ING Groep N.V. | 259,297 | ||||||
| 4,308 | Koninklijke Ahold Delhaize N.V. | 140,240 | ||||||
| 66,078 | Koninklijke KPN N.V. | 197,672 | ||||||
| 1,202 | LyondellBasell Industries N.V., Class A | 111,570 | ||||||
| 2,509 | NN Group N.V. | 134,492 | ||||||
| 8,467 | Stellantis N.V. | 168,906 | ||||||
| 1,476 | Stellantis N.V. | 29,465 | ||||||
| 1,449,809 | ||||||||
| Norway - 0.3% | ||||||||
| 13,248 | Norsk Hydro ASA | 96,909 | ||||||
| Singapore - 0.4% | ||||||||
| 41,462 | Wilmar International Ltd. | 132,826 | ||||||
| Spain - 0.5% | ||||||||
| 13,744 | Repsol S.A. | 175,848 | ||||||
| Sweden - 0.6% | ||||||||
| 489 | Evolution A.B. | 79,096 | ||||||
| 5,774 | SKF A.B., B Shares | 133,787 | ||||||
| 212,883 | ||||||||
See accompanying notes which are an integral part of these financial statements.
6
| AFFINITY WORLD LEADERS EQUITY ETF |
| SCHEDULE OF INVESTMENTS (Continued) |
| October 31, 2021 |
| Shares | Fair Value | |||||||
| COMMON STOCKS — 99.5% (Continued) | ||||||||
| Switzerland - 1.2% | ||||||||
| 5,144 | ABB Ltd. | $ | 170,519 | |||||
| 15,416 | UBS Group A.G. | 280,820 | ||||||
| 451,339 | ||||||||
| United Kingdom - 4.7% | ||||||||
| 12,839 | 3i Group plc | 240,051 | ||||||
| 2,979 | AstraZeneca plc | 371,351 | ||||||
| 18,967 | BAE Systems plc | 143,463 | ||||||
| 4,818 | British American Tobacco plc | 168,178 | ||||||
| 106,365 | BT Group PLC(a) | 202,516 | ||||||
| 6,768 | Imperial Brands plc | 143,055 | ||||||
| 14,300 | Kingfisher plc | 65,666 | ||||||
| 626 | Next plc | 68,355 | ||||||
| 9,556 | Royal Dutch Shell plc, B SHARES | 220,716 | ||||||
| 37,274 | Tesco plc | 137,901 | ||||||
| 1,761,252 | ||||||||
| United States - 65.1% | ||||||||
| 1,528 | AGCO Corporation | 186,737 | ||||||
| 8,544 | AGNC Investment Corporation | 136,020 | ||||||
| 1,880 | Alcoa Corporation | 86,386 | ||||||
| 7,096 | Ally Financial, Inc. | 338,763 | ||||||
| 3,523 | Altria Group, Inc. | 155,400 | ||||||
| 1,959 | AmerisourceBergen Corporation | 239,037 | ||||||
| 726 | Anthem, Inc. | 315,904 | ||||||
| 5,282 | Arrow Electronics, Inc.(a) | 611,391 | ||||||
| 14,847 | AT&T, Inc. | 375,035 | ||||||
| 2,085 | Berkshire Hathaway, Inc., Class B(a) | 598,416 | ||||||
| 5,436 | Best Buy Company, Inc. | 664,497 | ||||||
| 2,516 | Capital One Financial Corporation | 379,991 | ||||||
| 2,395 | CDW Corporation/DE | 447,027 | ||||||
| 728 | Celanese Corporation | 117,579 | ||||||
| 5,621 | Cognizant Technology Solutions Corporation, Class A | 438,944 | ||||||
| 3,493 | CVS Health Corporation | 311,855 | ||||||
| 883 | Darden Restaurants, Inc. | 127,276 | ||||||
| 1,719 | Darling Ingredients, Inc.(a) | 145,290 | ||||||
See accompanying notes which are an integral part of these financial statements.
7
| AFFINITY WORLD LEADERS EQUITY ETF |
| SCHEDULE OF INVESTMENTS (Continued) |
| October 31, 2021 |
| Shares | Fair Value | |||||||
| COMMON STOCKS — 99.5% (Continued) | ||||||||
| United States - 65.1% (Continued) | ||||||||
| 6,042 | Dell Technologies, Inc., Class C(a) | $ | 664,560 | |||||
| 4,577 | Devon Energy Corporation | 183,446 | ||||||
| 1,622 | Diamondback Energy, Inc. | 173,862 | ||||||
| 3,130 | Discover Financial Services | 354,692 | ||||||
| 18,207 | DISH Network Corporation, Class A(a) | 747,761 | ||||||
| 2,239 | Dow, Inc. | 125,317 | ||||||
| 12,032 | DXC Technology Company(a) | 391,882 | ||||||
| 3,119 | Electronic Arts, Inc. | 437,440 | ||||||
| 2,447 | Emerson Electric Company | 237,383 | ||||||
| 2,146 | EOG Resources, Inc. | 198,419 | ||||||
| 719 | EPAM Systems, Inc.(a) | 484,060 | ||||||
| 3,235 | Exelon Corporation | 172,070 | ||||||
| 1,481 | Expeditors International of Washington, Inc. | 182,548 | ||||||
| 3,414 | Fidelity National Financial, Inc. | 163,565 | ||||||
| 1,324 | Fidelity National Information Services, Inc. | 146,620 | ||||||
| 1,088 | General Dynamics Corporation | 220,592 | ||||||
| 5,039 | Gilead Sciences, Inc. | 326,930 | ||||||
| 1,075 | HCA Healthcare, Inc. | 269,244 | ||||||
| 22,752 | HP, Inc. | 690,068 | ||||||
| 3,427 | International Business Machines Corporation | 428,718 | ||||||
| 21,698 | Interpublic Group of Companies, Inc. | 793,496 | ||||||
| 3,282 | Iron Mountain, Inc. | 149,790 | ||||||
| 9,616 | Jefferies Financial Group, Inc. | 413,488 | ||||||
| 556 | Jones Lang LaSalle, Inc.(a) | 143,576 | ||||||
| 4,964 | Kroger Company (The) | 198,659 | ||||||
| 861 | Laboratory Corp of America Holdings(a) | 247,124 | ||||||
| 1,179 | Lamar Advertising Company, Class A | 133,463 | ||||||
| 2,520 | Lennar Corporation, Class A | 251,824 | ||||||
| 2,281 | Lincoln National Corporation | 164,574 | ||||||
| 4,421 | LKQ Corporation(a) | 243,509 | ||||||
| 2,950 | Marathon Petroleum Corporation | 194,493 | ||||||
| 994 | McDonald’s Corporation | 244,077 | ||||||
| 994 | McKesson Corporation | 206,633 | ||||||
| 819 | Molina Healthcare, Inc.(a) | 242,195 | ||||||
See accompanying notes which are an integral part of these financial statements.
8
| AFFINITY WORLD LEADERS EQUITY ETF |
| SCHEDULE OF INVESTMENTS (Continued) |
| October 31, 2021 |
| Shares | Fair Value | |||||||
| COMMON STOCKS — 99.5% (Continued) | ||||||||
| United States - 65.1% (Continued) | ||||||||
| 16,204 | NortonLifeLock, Inc. | $ | 412,392 | |||||
| 3,277 | NRG Energy, Inc. | 130,720 | ||||||
| 1,041 | Nucor Corporation | 116,228 | ||||||
| 10,806 | Omnicom Group, Inc. | 735,672 | ||||||
| 5,350 | Oracle Corporation | 513,279 | ||||||
| 2,547 | Owens Corning | 237,915 | ||||||
| 10,615 | Pfizer, Inc. | 464,300 | ||||||
| 2,292 | Philip Morris International, Inc. | 216,686 | ||||||
| 5,203 | PPL Corporation | 149,846 | ||||||
| 1,642 | Quest Diagnostics, Inc. | 241,013 | ||||||
| 593 | Regeneron Pharmaceuticals, Inc.(a) | 379,484 | ||||||
| 1,669 | Robert Half International, Inc. | 188,714 | ||||||
| 1,203 | Simon Property Group, Inc. | 176,336 | ||||||
| 913 | Snap-on, Inc. | 185,549 | ||||||
| 7,672 | Synchrony Financial | 356,364 | ||||||
| 2,486 | Sysco Corporation | 191,173 | ||||||
| 15,368 | Tapestry, Inc. | 599,045 | ||||||
| 2,779 | Target Corporation | 721,484 | ||||||
| 5,894 | TD SYNNEX Corporation | 618,870 | ||||||
| 1,764 | Tyson Foods, Inc., Class A | 141,067 | ||||||
| 3,049 | UGI Corporation | 132,357 | ||||||
| 1,338 | United Parcel Service, Inc., Class B | 285,623 | ||||||
| 556 | United Rentals, Inc.(a) | 210,785 | ||||||
| 1,542 | United Therapeutics Corporation(a) | 294,152 | ||||||
| 704 | Watsco, Inc. | 203,864 | ||||||
| 1,178 | Whirlpool Corporation | 248,358 | ||||||
| 1,182 | Yum! Brands, Inc. | 147,679 | ||||||
| 24,200,581 | ||||||||
| TOTAL COMMON STOCKS (Cost $34,894,794) | 37,018,567 | |||||||
| TOTAL INVESTMENTS - 99.5% (Cost $34,894,794) | $ | 37,018,567 | ||||||
| OTHER ASSETS IN EXCESS OF LIABILITIES- 0.5% | 181,907 | |||||||
| NET ASSETS - 100.0% | $ | 37,200,474 | ||||||
| A.S. | - Anonim Sirketi |
| Ltd. | - Limited Company |
| N.V. | - Naamioze Vennootschap |
| OYJ | - Julkinen osakeyhtiö |
| PLC | - Public Limited Company |
| REIT | - Real Estate Investment Trust |
| S.A. | - Société Anonyme |
| (a) | Non-income producing security. |
See accompanying notes which are an integral part of these financial statements.
9
| AFFINITY WORLD LEADERS EQUITY ETF |
| OCTOBER 31, 2021 |
| Diversification of Assets | ||||
| Country | % of Net Assets | |||
| United States | 65.1 | % | ||
| Japan | 7.4 | % | ||
| United Kingdom | 4.7 | % | ||
| Netherlands | 3.9 | % | ||
| France | 3.8 | % | ||
| Ireland | 3.5 | % | ||
| Germany | 3.2 | % | ||
| Canada | 1.3 | % | ||
| Switzerland | 1.2 | % | ||
| Bermuda | 0.9 | % | ||
| Finland | 0.8 | % | ||
| Australia | 0.7 | % | ||
| Sweden | 0.6 | % | ||
| Spain | 0.5 | % | ||
| Luxembourg | 0.4 | % | ||
| Singapore | 0.4 | % | ||
| Denmark | 0.3 | % | ||
| Belgium | 0.3 | % | ||
| Norway | 0.3 | % | ||
| Cayman Islands | 0.3 | % | ||
| Total | 99.5 | % | ||
| Other Assets Less Liabilities - Net | 0.5 | % | ||
| Grand Total | 100.0 | % | ||
See accompanying notes which are an integral part of these financial statements.
10
| Affinity World Leaders Equity ETF |
| STATEMENT OF ASSETS AND LIABILITIES |
| October 31, 2021 |
| ASSETS | ||||
| Investment securities: | ||||
| At cost | $ | 34,894,794 | ||
| At fair value | $ | 37,018,567 | ||
| Cash | 125,199 | |||
| Foreign cash, (cost $1,381) | 1,363 | |||
| Dividends receivable | 68,003 | |||
| Receivable due from Adviser, net (a) | 30,740 | |||
| Prepaid expenses and other assets | 7,194 | |||
| TOTAL ASSETS | 37,251,066 | |||
| LIABILITIES | ||||
| Custody fees | 24,423 | |||
| Audit fees | 12,301 | |||
| Payable to related parties | 6,875 | |||
| Accrued expenses and other liabilities | 6,993 | |||
| TOTAL LIABILITIES | 50,592 | |||
| NET ASSETS | $ | 37,200,474 | ||
| Net Assets Consist Of: | ||||
| Paid in capital ($0 par value, unlimited shares authorized) | $ | 32,947,306 | ||
| Accumulated earnings | 4,253,168 | |||
| NET ASSETS | $ | 37,200,474 | ||
| Net Asset Value Per Share: | ||||
| Shares: | ||||
| Net assets | $ | 37,200,474 | ||
| Shares of beneficial interest outstanding (b) | 1,350,000 | |||
| Net asset value (Net Assets ÷ Shares Outstanding), offering price and redemption price per share | $ | 27.56 | ||
| (a) | See footnote 4. |
| (b) | Unlimited number of shares of beneficial interest authorized, no par value. |
See accompanying notes to financial statements.
11
Affinity World Leaders Equity ETF
STATEMENT OF OPERATIONS
For the Year Ended October 31, 2021
| INVESTMENT INCOME | ||||
| Dividends (net of $23,593 in foreign dividend tax withheld) | $ | 510,751 | ||
| TOTAL INVESTMENT INCOME | 510,751 | |||
| EXPENSES | ||||
| Investment advisory fees | 97,157 | |||
| Administrative services fees | 68,554 | |||
| Custodian fees | 51,878 | |||
| Legal fees | 28,264 | |||
| Audit fees | 18,750 | |||
| Transfer agent fees | 13,954 | |||
| Compliance officer fees | 13,639 | |||
| Printing and postage expenses | 12,593 | |||
| Trustees’ fees and expenses | 10,624 | |||
| Insurance expense | 3,135 | |||
| Other expenses | 10,280 | |||
| TOTAL EXPENSES | 328,828 | |||
| Less: Fees waived and expenses reimbursed by the Adviser | (201,860 | ) | ||
| NET EXPENSES | 126,968 | |||
| NET INVESTMENT INCOME | 383,783 | |||
| REALIZED AND UNREALIZED GAIN FROM INVESTMENTS | ||||
| Net realized gain from investments and foreign currency transactions | 3,046,164 | |||
| Net realized gain from redemptions in-kind | 550,451 | |||
| Net change in unrealized appreciation on investments and foreign currency translations | 2,790,453 | |||
| NET REALIZED AND UNREALIZED GAIN FROM INVESTMENTS | 6,387,068 | |||
| NET INCREASE IN NET ASSETS RESULTING FROM OPERATIONS | $ | 6,770,851 | ||
See accompanying notes to financial statements.
12
Affinity World Leaders Equity ETF
STATEMENTS OF CHANGES IN NET ASSETS
| For the | For the | |||||||
| Year Ended | Year Ended | |||||||
| October 31, 2021 | October 31, 2020 | |||||||
| FROM OPERATIONS | ||||||||
| Net investment income | $ | 383,783 | $ | 223,886 | ||||
| Net realized gain/(loss) from investments and foreign currency transactions | 3,046,164 | (394,347 | ) | |||||
| Net realized gain from redemptions in-kind | 550,451 | — | ||||||
| Net change in unrealized appreciation/(depreciation) on investments and foreign currency | 2,790,453 | (749,846 | ) | |||||
| Net increase/(decrease) in net assets resulting from operations | 6,770,851 | (920,307 | ) | |||||
| DISTRIBUTIONS TO SHAREHOLDERS | ||||||||
| Total distributions paid | (403,440 | ) | (202,830 | ) | ||||
| Net decrease in net assets from distributions to shareholders | (403,440 | ) | (202,830 | ) | ||||
| FROM SHARES OF BENEFICIAL INTEREST | ||||||||
| Proceeds from shares sold | 17,742,243 | 10,984,844 | ||||||
| Payments for shares redeemed | (2,489,803 | ) | — | |||||
| Net increase/(decrease) in net assets from shares of beneficial interest | 15,252,440 | 10,984,844 | ||||||
| TOTAL INCREASE IN NET ASSETS | 21,619,851 | 9,861,707 | ||||||
| NET ASSETS | ||||||||
| Beginning of Year | 15,580,623 | 5,718,916 | ||||||
| End of Year | $ | 37,200,474 | $ | 15,580,623 | ||||
| SHARE ACTIVITY | ||||||||
| Shares Sold | 650,000 | 550,000 | ||||||
| Shares Redeemed | (100,000 | ) | — | |||||
| Net increase/(decrease) from share activity | 550,000 | 550,000 | ||||||
See accompanying notes to financial statements.
13
Affinity World Leaders Equity ETF
FINANCIAL HIGHLIGHTS
Per Share Data and Ratios for a Share of Beneficial Interest Outstanding Throughout each of the Periods Presented
| For the | For the | For the | For the | |||||||||||||
| Year Ended | Year Ended | Year Ended | Period Ended | |||||||||||||
| October 31, 2021 | October 31, 2020 | October 31, 2019 | October 31, 2018 (a) | |||||||||||||
| Net asset value, beginning of period | $ | 19.48 | $ | 22.88 | $ | 22.38 | $ | 25.00 | ||||||||
| Activity from investment operations: | ||||||||||||||||
| Net investment income (b) | 0.48 | 0.52 | 0.58 | 0.47 | ||||||||||||
| Net realized and unrealized gain (loss) on investments (c) | 8.13 | (3.39 | ) | 0.44 | (2.74 | ) | ||||||||||
| Total gain (loss) from investment operations | 8.61 | (2.87 | ) | 1.02 | (2.27 | ) | ||||||||||
| Less distributions from: | ||||||||||||||||
| Net investment income | (0.53 | ) | (0.53 | ) | (0.52 | ) | (0.35 | ) | ||||||||
| Total distributions | (0.53 | ) | (0.53 | ) | (0.52 | ) | (0.35 | ) | ||||||||
| Net asset value, end of period | $ | 27.56 | $ | 19.48 | $ | 22.88 | $ | 22.38 | ||||||||
| Market price, end of period | $ | 27.55 | $ | 19.62 | $ | 22.81 | $ | 22.52 | ||||||||
| Total return (d)(e) | 44.42 | % | (12.75 | )% | 4.73 | % (n) | (9.92 | )% (k)(l) | ||||||||
| Market price total return | 43.33 | % | (11.86 | )% | 3.78 | % | (10.43 | )% (k) | ||||||||
| Net assets, end of period (000s) | $ | 37,200 | $ | 15,581 | $ | 5,719 | $ | 5,595 | ||||||||
| Ratio of gross expenses to average net assets (f)(g) | 1.59 | % | 2.90 | % | 4.29 | % | 4.66 | % (m) | ||||||||
| Ratio of net expenses to average net assets (g)(h) | 0.61 | % | 0.47 | % | 0.47 | % | 0.47 | % (m) | ||||||||
| Ratio of net investment income to average net assets (g)(i) | 1.85 | % | 2.52 | % | 2.65 | % | 2.47 | % (m) | ||||||||
| Portfolio Turnover Rate (j) | 105 | % | 134 | % | 116 | % | 135 | % (k) | ||||||||
| (a) | The Affinity World Leaders Equity ETF commenced operations on January 16, 2018. |
| (b) | Per share amounts calculated using the average shares method, which more appropriately presents the per share data for the period. |
| (c) | Net realized and unrealized gain (loss) on investments per share are balancing amounts necessary to reconcile the change in net asset value per share for the period, and may not reconcile with aggregate gains (losses) in the Statement of Operations due to the share transactions for the period. |
| (d) | Total return is calculated assuming a purchase of shares at net asset value on the first day and a sale at net asset value on the last day of the period. Distributions are assumed, for the purpose of this calculation, to be reinvested at the ex-dividend date net asset value per share on their respective payment dates. Had the Adviser not waived or reimbursed a portion of the Fund’s expenses, total returns would have been lower. |
| (e) | Includes adjustments in accordance with accounting principles generally accepted in the United States and, consequently, the net asset value for financial reporting purposes and the returns based upon those net asset values may differ from the net asset values and returns for shareholder transactions. |
| (f) | Represents the ratio of expenses to average net assets absent fee waivers and/or expense reimbursements by the Adviser. |
| (g) | Does not include the expenses of other investments companies in which the Fund Invests. |
| (h) | Represents the ratio of expenses to average net assets inclusive of fee waivers and/or expense reimbursements by the Adviser. |
| (i) | Recognition of net investment income (loss) by the Fund is affected by the timing of the declaration of dividends by the underlying investment companies in which the Fund invests. |
| (j) | Portfolio turnover rate excludes securities received or delivered from in-kind transactions. |
| (k) | Not annualized. |
| (l) | Represents total return based on net asset values per share from commencement of investment operations on January 16, 2018 through October 31, 2018. Total return based on net asset value per share, as of the close of business on the day of commencement of trading on the BATS on January 16, 2018 through October 31, 2018 was (9.92)%. |
| (m) | Annualized. |
| (n) | During the year ended October 31, 2019, 0.17% of the fund’s total return consists of a voluntary reimbursement by the adviser for a realized investment loss. Excluding this item, total return would have been 4.56%. |
See accompanying notes to financial statements.
14
Affinity World Leaders Equity ETF
NOTES TO FINANCIAL STATEMENTS
October 31, 2021
| (1) | ORGANIZATION |
The Affinity World Leaders Equity ETF (the “Fund”) is a series of shares of beneficial interest of the Two Roads Shared Trust (the “Trust”), a statutory trust organized under the laws of the State of Delaware on June 8, 2012, and is registered under the Investment Company Act of 1940, as amended (the “1940 Act”), as a diversified, open-end management investment company. The Fund commenced operations on January 16, 2018. The Fund’s investment objective is to seek to provide investment results that correspond generally, before fees and expenses, to the performance of the Thomson Reuters StarMine Affinity World Leaders Total Return Index (the “TRSAWL Index” or the “Index”).
| (2) | SIGNIFICANT ACCOUNTING POLICIES |
The following is a summary of significant accounting policies followed by the Fund in preparation of its financial statements. These policies are in conformity with accounting principles generally accepted in the United States of America (“GAAP”). The preparation of financial statements requires management to make estimates and assumptions that affect the reported amounts of assets and liabilities and disclosure of contingent assets and liabilities at the date of the financial statements and the reported amounts of income and expenses for the period. Actual results could differ from those estimates. The Fund is an investment company and accordingly follows the investment company accounting and reporting guidance of the Financial Accounting Standards Board (“FASB”) Accounting Standards Codification Topic 946 “Financial Services – Investment Companies”.
Security Valuation – Securities listed on an exchange are valued at the last reported sale price at the close of the regular trading session of the exchange on the business day the value is being determined, or in the case of securities listed on NASDAQ at the NASDAQ Official Closing Price. In the absence of a sale such securities shall be valued at the mean between the current bid and ask prices on the day of valuation. Short-term debt obligations having 60 days or less remaining until maturity, at time of purchase may be valued at amortized cost. Investments in open-end investment companies are valued at net asset value.
The Fund may hold securities, such as private investments, interests in commodity pools, other non-traded securities or temporarily illiquid securities, for which market quotations are not readily available or are determined to be unreliable. These securities will be valued using the “fair value” procedures approved by the Board of Trustees (the “Board”). The Board has delegated execution of these procedures to a fair value committee composed of one or more representatives from each of the (i) Trust, (ii) administrator, and (iii) Adviser. The committee may also enlist third party consultants such as a valuation specialist at a public accounting firm, valuation consultant, or financial officer of a security issuer on an as-needed basis to assist in determining a security-specific fair value. The Board has also engaged a third party valuation firm to, as needed, attend valuation meetings held by the Trust, review minutes of such meetings and report to the Board on a quarterly basis. The Board reviews and considers the determinations reached by the fair value committee in ratifying the fair value committee’s application of the fair valuation methodologies employed.
Fair Valuation Process – The applicable investments are valued collectively via inputs from each group within the fair value committee. For example, fair value determinations are required for the following securities: (i) securities for which market quotations are insufficient or not readily available on a particular business day (including securities for which there is a short and temporary lapse in the provision of a price by the regular pricing source); (ii) securities for which, in the judgment of the adviser, the prices or values available do not represent the fair value of the instrument; factors which may cause the adviser to make such a judgment include, but are not limited to, the following: only a bid price or an asked price is available; the spread between bid and asked prices is substantial; the frequency of sales; the thinness of the market; the size of reported trades; and actions of the securities markets, such as the suspension or limitation of trading; (iii) securities determined to be illiquid; and (iv) securities with respect to which an event that will affect the value thereof has occurred (a “significant event”) since the closing prices were established on the principal exchange on which they are traded, but prior to a Fund’s calculation of its net asset value. Specifically, interests in commodity pools or managed futures pools are valued on a daily basis by
15
Affinity World Leaders Equity ETF
NOTES TO FINANCIAL STATEMENTS (Continued)
October 31, 2021
reference to the closing market prices of each futures contract or other asset held by a pool, as adjusted for pool expenses. Restricted or illiquid securities, such as private investments or non-traded securities are valued via inputs from the adviser based upon the current bid for the security from two or more independent dealers or other parties reasonably familiar with the facts and circumstances of the security (who should take into consideration all relevant factors as may be appropriate under the circumstances). If the adviser is unable to obtain a current bid from such independent dealers or other independent parties, the fair value team shall determine the fair value of such security using the following factors: (i) the type of security; (ii) the cost at date of purchase; (iii) the size and nature of the Fund’s holdings; (iv) the discount from market value of unrestricted securities of the same class at the time of purchase and subsequent thereto; (v) information as to any transactions or offers with respect to the security; (vi) the nature and duration of restrictions on disposition of the security and the existence of any registration rights; (vii) how the yield of the security compares to similar securities of companies of similar or equal creditworthiness; (viii) the level of recent trades of similar or comparable securities; (ix) the liquidity characteristics of the security; (x) current market conditions; and (xi) the market value of any securities into which the security is convertible or exchangeable.
Valuation of Underlying Funds – The Fund may invest in portfolios of open-end or closed- end investment companies (the “Underlying Funds”). Investment companies are valued at their respective net asset values as reported by such investment companies. Open-end investment companies value securities in their portfolios for which market quotations are readily available at their market values (generally the last reported sale price) and all other securities and assets at their fair value to the methods established by the board of directors of the open-end funds. The shares of many closed-end investment companies and exchange traded funds (“ETFs”), after their initial public offering, frequently trade at a price per share, which is different than the net asset value per share. The difference represents a market premium or market discount of such shares. There can be no assurances that the market discount or market premium on shares of any closed-end investment company or ETF purchased by the Fund will not change.
Exchange Traded Funds – The Fund may invest in ETFs. ETFs are a type of fund bought and sold on a securities exchange. An ETF trades like common stock and represents a fixed portfolio of securities. The risks of owning an ETF generally reflect the risks of owning the underlying securities in which it invests, although the lack of liquidity on an ETF could result in it being more volatile. Additionally, ETFs have fees and expenses that reduce their value.
Real Estate Investment Trusts – Real Estate Stock invests primarily in Real Estate Investment Trusts (REITs). Distributions from REITs may be characterized as dividends, capital gains, and/or return of capital.
The Fund utilizes various methods to measure the fair value of all of its investments on a recurring basis. GAAP establishes a hierarchy that prioritizes inputs to valuation methods. The three levels of input are:
Level 1 – Unadjusted quoted prices in active markets for identical assets and liabilities that the Fund has the ability to access.
Level 2 – Observable inputs other than quoted prices included in Level 1 that are observable for the asset or liability, either directly or indirectly. These inputs may include quoted prices for the identical instrument on an inactive market, prices for similar instruments, interest rates, prepayment speeds, credit risk, yield curves, default rates and similar data.
Level 3 – Unobservable inputs for the asset or liability, to the extent relevant observable inputs are not available, representing the Fund’s own assumptions about the assumptions a market participant would use in valuing the asset or liability, and would be based on the best information available.
The availability of observable inputs can vary from security to security and is affected by a wide variety of factors, including, for example, the type of security, whether the security is new and not yet established in the marketplace, the liquidity of markets, and other characteristics particular to the security. To the extent that valuation is based
16
Affinity World Leaders Equity ETF
NOTES TO FINANCIAL STATEMENTS (Continued)
October 31, 2021
on models or inputs that are less observable or unobservable in the market, the determination of fair value requires more judgment. Accordingly, the degree of judgment exercised in determining fair value is greatest for instruments categorized in Level 3.
The inputs used to measure fair value may fall into different levels of the fair value hierarchy. In such cases, for disclosure purposes, the level in the fair value hierarchy within which the fair value measurement falls in its entirety, is determined based on the lowest level input that is significant to the fair value measurement in its entirety.
The inputs or methodology used for valuing securities are not necessarily an indication of the risk associated with investing in those securities. The following tables summarize the inputs used as of October 31, 2021 for the Fund’s assets and liabilities measured at fair value:
| Assets * | Level 1 | Level 2 | Level 3 | Total | ||||||||||||
| Common Stocks | $ | 37,018,567 | $ | — | $ | — | $ | 37,018,567 | ||||||||
| Total | $ | 37,018,567 | $ | — | $ | — | $ | 37,018,567 | ||||||||
The Fund did not hold any Level 2 or 3 securities during the year.
| * | Refer to the Schedule of Investments for portfolio composition. |
Foreign Currency Translations
The books and records of the Fund are maintained in US dollars. The market values of securities which are not traded in US currency are recorded in the financial statements after translation to US dollars based on the applicable exchange rates at the end of the period. The costs of such securities are translated at exchange rates prevailing when acquired. Related interest, dividends and withholding taxes are accrued at the rates of exchange prevailing on the respective dates of such transactions.
Net realized gains and losses on foreign currency transactions represent net gains and losses from currency realized between the trade and settlement dates on securities transactions and the difference between income accrued versus income received. The effect of changes in foreign currency exchange rates on investments in securities are included with the net realized and unrealized gain or loss on investment securities.
Security Transactions and Related Income
Security transactions are accounted for on trade date basis. Interest income is recognized on an accrual basis. Discounts are accreted and premiums are amortized on securities purchased over the lives of the respective securities. Dividend income is recorded on the ex -dividend date. Realized gains or losses from sales of securities are determined by comparing the identified cost of the security lot sold with the net sales proceeds.
Dividends and Distributions to Shareholders
Ordinarily, dividends from net investment income, if any, are declared and paid quarterly by the Fund. The Fund distributes its net realized capital gains, if any, to shareholders annually. Dividends from net investment income and distributions from net realized gains are recorded on ex-dividend date and determined in accordance with federal income tax regulations, which may differ from GAAP. These “book/tax” differences are considered either temporary (i.e., deferred losses, capital loss carry forwards) or permanent in nature. To the extent these differences are permanent in nature, such amounts are reclassified within the composition of net assets based on their federal tax-basis treatment; temporary differences do not require reclassification.
17
Affinity World Leaders Equity ETF
NOTES TO FINANCIAL STATEMENTS (Continued)
October 31, 2021
Federal Income Taxes
The Fund intends to continue to comply with the requirements of the Internal Revenue Code applicable to regulated investment companies and to distribute all of its taxable income to its shareholders. Therefore, no provision for federal income tax is required. The Fund recognizes the tax benefits of uncertain tax positions only where the position is “more likely than not” to be sustained assuming examination by tax authorities. Management has analyzed the Fund’s tax positions and has concluded that no liability for unrecognized tax benefits should be recorded related to uncertain tax positions taken on returns filed for open tax years ended October 31, 2018 through October 31, 2020 or expected to be taken in the Fund’s October 31, 2021 year- end tax return. The Fund identified its major tax jurisdictions as U.S. Federal, Ohio, and foreign jurisdictions where the Fund makes significant investments. The Fund is not aware of any tax positions for which it is reasonably possible that the total amounts of unrecognized tax benefits will change materially in the next twelve months.
Expenses
Expenses of the Trust that are directly identifiable to a specific fund are charged to that fund. Expenses, which are not readily identifiable to a specific fund, are allocated in such a manner as deemed equitable, taking into consideration the nature and type of expense and the relative sizes of the funds in the Trust.
Indemnification
The Trust indemnifies its officers and trustees for certain liabilities that may arise from the performance of their duties to the Fund. Additionally, in the normal course of business, the Fund enters into contracts that contain a variety of representations and warranties which provide general indemnities. The Fund’s maximum exposure under these arrangements is unknown, as this would involve future claims that may be made against the Fund that have not yet occurred. However, the Fund expects the risk of loss due to these warranties and indemnities to be remote.
Distributions from REITs
Distributions from REITs are initially recorded as dividend income and, to the extent such represent a return of capital or capital gain for tax purposes, are reclassified when such information becomes available.
| (3) | INVESTMENT TRANSACTIONS |
For the year ended October 31, 2021, cost of purchases and proceeds from sales of portfolio securities (excluding in-kind transactions and short-term investments), amounted to $21,837,434 and $21,595,765 respectively, for the Fund. For the year ended October 31, 2021, cost of purchases and proceeds from sales for in-kind transactions, amounted to $17,553,402 and $2,490,954 respectively, for the Fund.
| (4) | INVESTMENT ADVISORY AGREEMENT AND TRANSACTIONS WITH RELATED PARTIES |
Regents Park Funds, LLC serves as the Fund’s investment adviser (the “Adviser”). Pursuant to an Investment Advisory Agreement with the Fund, the Adviser, under the oversight of the Board, directs the daily operations of the Fund and supervises the performance of administrative and professional services provided by others. As compensation for its services, the Fund pays to the Adviser a monthly investment management fees at an annual rate of 0.47% of its average daily net assets. For the year ended October 31, 2021, the Adviser earned $97,157 in investment management fees. Pursuant to the Expense Limitation Agreement (discussed below), as of October 31, 2021, the amount due to the Fund from the Adviser totaled $30,740, which has since been paid.
18
Affinity World Leaders Equity ETF
NOTES TO FINANCIAL STATEMENTS (Continued)
October 31, 2021
The Adviser has engaged Affinity Investment Advisors, LLC to serve as investment sub-adviser (“Sub -Adviser” or “Affinity”) to the Fund. The Sub-Adviser, with respect to the portion of the Fund’s assets allocated to the Sub-Adviser, is responsible for selecting investments and assuring that investments are made in accordance with the Fund’s investment objective, policies and restrictions.
The Adviser, pursuant to an Expense Limitation Agreement (the “Agreement”) has contractually agreed to reduce the Fund’s fees and/or absorb expenses of the Fund until at least February 28, 2022 to ensure that total annual Fund operating expenses after fee waiver and reimbursement (exclusive of any taxes, interest, brokerage commissions, expenses incurred in connection with any merger or reorganization, indirect expenses, expenses of other investment companies in which the Fund may invest, or extraordinary expenses such as litigation) will not exceed 0.67% of average daily net assets. The expense limits in effect prior to their expiration on February 28, 2021 was 0.47%. This Agreement may be terminated by the Board of Trustees on 60 days’ written notice to the Adviser. These fee waivers and expense reimbursements are subject to possible recoupment from the Fund in future years on a rolling three-year basis (within the three years after the fees have been waived or reimbursed) if such recoupment can be achieved within the foregoing expense limits as well as any expense limitation that was in effect at the time the waiver or reimbursement was made. The Adviser and the Sub-Adviser have agreed that Affinity will reimburse all Fund expenses directly.
For the year ended October 31, 2021, the Adviser waived fees and reimbursed expenses of the Fund in the amount of $201,860. The Adviser can recoup waived and reimbursed expenses of $192,500 until October 31, 2022, $215,568 until October 31, 2023 and $201,860 until October 31, 2024, pursuant to the Agreement. For the year ended October 31, 2021, the Adviser did not recoup any fees that had been reimbursed in previous years.
The Trust, with respect to the Fund, has adopted a distribution and service plan (“Plan”) pursuant to Rule 12b-1 under the 1940 Act. Under the Plan, the Fund is authorized to pay distribution fees to Northern Lights Distributors (“NLD” or “the distributor”) and other firms that provide distribution and shareholder services (“Service Providers”). If a Service Provider provides these services, the Fund may pay fees at an annual rate not to exceed 0.25% of average daily net assets, pursuant to Rule 12b-1 under the 1940 Act.
No distribution or service fees are currently paid by the Fund and there are no current plans to impose these fees. In the event Rule 12b-1 fees were charged, over time they would increase the cost of an investment in the Fund.
In addition, certain affiliates of the Distributor provide services to the Fund as follows:
Ultimus Fund Solutions, LLC (“UFS”) – UFS, an affiliate of the Distributor, provides administration and fund accounting services to the Fund. Pursuant to a separate servicing agreement with UFS, the Fund pays UFS customary fees for providing administration and fund accounting services to the Fund. Certain officers of the Trust are also officers of UFS and are not paid any fees directly by the Fund for serving in such capacities.
Northern Lights Compliance Services, LLC (“NLCS”) – NLCS, an affiliate of UFS and the Distributor, provides a Chief Compliance Officer to the Fund, as well as related compliance services, pursuant to a consulting agreement between NLCS and the Fund. Under the terms of such agreement, NLCS receives customary fees from the Fund. An officer of the Fund is also an officer of NLCS and is not paid any fees directly by the Fund for serving in such capacity.
Blu Giant, LLC (“Blu Giant”), Blu Giant, an affiliate of UFS and the Distributor, provides EDGAR conversion and filing services as well as print management services for the Fund on an ad-hoc basis. For the provision of these services, Blu Giant receives customary fees from the Fund.
19
Affinity World Leaders Equity ETF
NOTES TO FINANCIAL STATEMENTS (Continued)
October 31, 2021
| (5) | CAPITAL SHARE TRANSACTIONS |
Shares are not individually redeemable and may be redeemed by the Fund at NAV only in large blocks known as “Creation Units.” Shares are created and redeemed by the Fund only in Creation Unit size aggregations of 50,000 shares. Only Authorized Participants or transactions done through an Authorized Participant are permitted to purchase or redeem Creation Units from the Fund. An Authorized Participant is either (i) a broker-dealer or other participant in the clearing process through the Continuous Net Settlement System of the National Securities Clearing Corporation or (ii) a DTC participant and, in each case, must have executed a Participant Agreement with the Distributor. Such transactions are generally permitted on an in-kind basis, with a balancing cash component to equate the transaction to the NAV per share of the Fund on the transaction date. Cash may be substituted equivalent to the value of certain securities generally when they are not available in sufficient quantity for delivery, not eligible for trading by the Authorized Participant or as a result of other market circumstances. In addition, the Fund may impose transaction fees on purchases and redemptions of Fund shares to cover the custodial and other costs incurred by the Funds in effecting trades. A fixed fee payable to the Custodian may be imposed on each creation and redemption transaction regardless of the number of Creation Units involved in the transaction (“Fixed Fee”) . Purchases and redemptions of Creation Units for cash or involving cash-in-lieu are required to pay an additional variable charge to compensate the Fund and its ongoing shareholders for brokerage and market impact expenses relating to Creation Unit transactions (“Variable Charge,” and together with the Fixed Fee, the “Transaction Fees”). Transactions in capital shares for the Fund are disclosed in the Statements of Changes in Net Assets.
The Transaction Fees for the Fund are listed in the table below:
| Minimum Additional | Maximum Additional | |
| Fee for In-Kind and | Variable Charge for | Variable Charge for |
| Cash Purchases | Cash Purchases* | Cash Purchases* |
| $1,800 | 0.20% | 2.00% |
| * | As a percentage of the amount invested. |
| (6) | PRINCIPAL INVESTMENT RISKS |
The Fund’s investments in securities, financial instruments and derivatives expose it to various risks, certain of which are discussed below. Please refer to the Fund’s prospectus and statement of additional information for a more full listing of risks associated with the Fund’s investments which include, but are not limited to authorized participant concentration risk, calculation methodology risk, currency risk, cybersecurity risk, equity risk, ETF structure risk, fluctuation of NAV risk, foreign (non – U.S.) investments risk, gap risk, geographic and sector risk, index risk, index tracking error risk, industry concentration risk, management risk, market capitalization risk, market risk, portfolio turnover risk and volatility risk.
Equity Risk: Equity securities are susceptible to general market fluctuations and volatile increases and decreases in value as market confidence in and perceptions of their issues change. Factors that may influence the price of equity securities include developments affecting a specific company or industry, or changing economic, political or market conditions.
Index Risk: Unlike many investment companies, the Sub-Adviser does not utilize an investing strategy that seeks returns in excess of the TRSAWL Index. Therefore, the Sub-Adviser would not necessarily sell a security unless that security is removed from the TRSAWL Index, even if that security generally is underperforming. The Index Provider relies on third party data it believes to be reliable in constructing the TRSAWL Index, but it does not guarantee the accuracy or availability of any such third party data, and there is also no guarantee with respect to the accuracy, availability or timeliness of the production of the TRSAWL Index. In addition, the performance of the Fund and the TRSAWL Index may differ from each other for a variety of reasons. For example, the Fund incurs operating expenses and portfolio transaction costs not incurred by the TRSAWL Index. Also, the Fund may not be
20
Affinity World Leaders Equity ETF
NOTES TO FINANCIAL STATEMENTS (Continued)
October 31, 2021
fully invested in the securities of the TRSAWL Index at all times, may deviate from the relative weightings of the TRSAWL Index, or may hold securities not included in the TRSAWL Index. These risks may be heightened during times of market volatility or other unusual market conditions.
Foreign (Non-U.S.) Investment Risk: Foreign (non-U.S.) securities present greater investment risks than investing in the securities of U.S. issuers and may experience more rapid and extreme changes in value than the securities of U.S. companies, due to less information about foreign (non -U.S.) companies in the form of reports and ratings than about U.S. issuers; different accounting, auditing and financial reporting requirements; smaller markets; nationalization; expropriation or confiscatory taxation; currency blockage; or political changes or diplomatic developments. Foreign (non-U.S.) securities may also be less liquid and more difficult to value than securities of U.S. issuers.
ETF Structure Risks: The Fund is structured as an ETF and as a result is subject to special risks. Shares are not individually redeemable and may be redeemed by the Fund at NAV only in large blocks known as “Creation Units.” Trading in shares on the Cboe BZX Exchange, Inc. (the “Exchange”) may be halted due to market conditions or for reasons that, in the view of the Exchange, make trading in shares inadvisable, such as extraordinary market volatility. There can be no assurance that shares will continue to meet the listing requirements of the Exchange. An active trading market for the Fund’s shares may not be developed or maintained. If the Fund’s shares are traded outside a collateralized settlement system, the number of financial institutions that can act as authorized participants that can post collateral on an agency basis is limited, which may limit the market for the Fund’s shares. The market prices of shares will fluctuate in response to changes in NAV and supply and demand for shares and will include a “bid-ask spread” charged by the exchange specialists, market makers or other participants that trade the particular security. There may be times when the market price and the NAV vary significantly.
Fluctuation of Net Asset Value Risk: The NAV of the Fund’s shares will generally fluctuate with changes in the market value of the Fund’s holdings. The market prices of the Shares will generally fluctuate in accordance with changes in NAV as well as the relative supply of and demand for the shares on the Exchange. The Fund’s Sub- Adviser cannot predict whether the shares will trade below, at or above their NAV. Price differences may be due, in large part, to the fact that supply and demand forces at work in the secondary trading market for the Shares will be closely related to, but not identical to, the same forces influencing the prices of the Fund’s holdings trading individually or in the aggregate at any point in time.
Market Risk: Overall market risk may affect the value of individual instruments in which the Fund invests. The Fund is subject to the risk that the securities markets will move down, sometimes rapidly and unpredictably, based on overall economic conditions and other factors, which may negatively affect the Fund’s performance. Factors such as domestic and foreign (non-U.S.) economic growth and market conditions, real or perceived adverse economic or political conditions, inflation, changes in interest rate levels, lack of liquidity in the bond and other markets, volatility in the securities markets, adverse investor sentiment affect the securities markets and political events affect the securities markets. Securities markets also may experience long periods of decline in value. When the value of the Fund��s investments goes down, your investment in the Fund decreases in value and you could lose money.
Local, state, regional, national or global events such as war, acts of terrorism, the spread of infectious illness or other public health issues, recessions, or other events could have a significant impact on the Fund and its investments and could result in decreases to the Fund’s net asset value. Political, geopolitical, natural and other events, including war, terrorism, trade disputes, government shutdowns, market closures, natural and environmental disasters, epidemics, pandemics and other public health crises and related events and governments’ reactions to such events have led, and in the future may lead, to economic uncertainty, decreased economic activity, increased market volatility and other disruptive effects on U.S. and global economies and markets. Such events may have significant adverse direct or indirect effects on the Fund and its investments. For example, a widespread health crisis such as a global pandemic could cause substantial market volatility, exchange trading suspensions and closures, impact the ability to complete redemptions, and affect Fund performance. A health crisis
21
Affinity World Leaders Equity ETF
NOTES TO FINANCIAL STATEMENTS (Continued)
October 31, 2021
may exacerbate other pre-existing political, social and economic risks. In addition, the increasing interconnections of markets around the world may result in many markets being affected by events or conditions in a single country or region or events affecting a single or small number of issuers.
COVID-19 has resulted in travel restrictions, closed international borders, enhanced health screenings at ports of entry and elsewhere, disruption of and delays in healthcare service preparation and delivery, prolonged quarantines, cancellations, business and school closings, supply chain disruptions, and lower consumer demand, as well as general concern and uncertainty. The impact of COVID-19, and other infectious illness outbreaks that may arise in the future, could adversely affect the economies of many nations or the entire global economy, individual issuers and capital markets in ways that cannot necessarily be foreseen.
| (7) | DISTRIBUTIONS TO SHAREHOLDERS AND TAX COMPONENTS OF CAPITAL |
The Statement of Assets and Liabilities represents cost for financial reporting purposes. Aggregate cost for federal tax purposes is $34,953,452 and differs from market value by net unrealized appreciation (depreciation) that consisted of:
| Gross unrealized appreciation | $ | 2,640,535 | ||
| Gross unrealized depreciation | (575,420 | ) | ||
| Net unrealized appreciation | $ | 2,065,115 |
The tax character of fund distributions paid for the years ended October 31, 2021 and October 31, 2020:
| Fiscal Year Ended | Fiscal Year Ended | |||||||
| October 31, 2021 | October 31, 2020 | |||||||
| Ordinary Income | $ | 403,440 | $ | 202,830 | ||||
| Long-Term Capital Gain | — | — | ||||||
| Return of Capital | — | — | ||||||
| $ | 403,440 | $ | 202,830 | |||||
As of October 31, 2021, the components of accumulated earnings on a tax basis were as follows:
| Undistributed | Undistributed | Post October Loss | Capital Loss | Other | Unrealized | Total | ||||||||||||||||||||
| Ordinary | Long-Term | and | Carry | Book/Tax | Appreciation/ | Accumulated | ||||||||||||||||||||
| Income | Gains | Late Year Loss | Forwards | Differences | (Depreciation)* | Earnings/(Losses) | ||||||||||||||||||||
| $ | 2,188,602 | $ | — | $ | — | $ | — | $ | — | $ | 2,064,527 | $ | 4,253,129 | |||||||||||||
The difference between book basis and tax basis undistributed net investment income, accumulated net realized gains and unrealized appreciation from investments is primarily attributable to tax adjustments for passive foreign investment companies.
| * | The unrealized appreciation in the table above includes unrealized foreign currency losses of $588. |
At October 31, 2021, the Fund utilized prior year capital loss carryforwards to offset current year capital gains in the amount of $951,160.
22
Affinity World Leaders Equity ETF
NOTES TO FINANCIAL STATEMENTS (Continued)
October 31, 2021
Permanent book and tax differences, primarily attributable to the book/tax basis treatment of adjustments related to transfers in kind, resulted in reclassification for the year ended October 31, 2021 as follows:
| Paid In | Accumulated | |||||
| Capital | Earnings (Losses) | |||||
| $ | 549,054 | $ | (549,054 | ) | ||
| (9) | SUBSEQUENT EVENTS |
Subsequent events after the Statement of Assets and Liabilities date have been evaluated through the date the financial statements were issued. Management has determined that no events or transactions occurred requiring adjustment or disclosure in the financial statements.
23
Report of Independent Registered Public Accounting Firm
To the Board of Trustees of Two Roads Shared Trust
and the Shareholders of Affinity World Leaders Equity ETF
Opinion on the Financial Statements
We have audited the accompanying statement of assets and liabilities of Affinity World Leaders Equity ETF (the Fund), a series of Two Roads Shared Trust, including the schedule of investments, as of October 31, 2021, the related statement of operations for the year then ended, the statements of changes in net assets for each of the two years in the period then ended, and the related notes to the financial statements (collectively, the financial statements), and the financial highlights for each of the three years in the period then ended and for the period from January 16, 2018 (commencement of operations) through October 31, 2018. In our opinion, the financial statements and financial highlights present fairly, in all material respects, the financial position of the Fund as of October 31, 2021, the results of its operations for the year then ended, the changes in net assets for each of the two years in the period then ended, and the financial highlights for each of the three years in the period then ended and for the period from January 16, 2018 (commencement of operations) through October 31, 2018, in conformity with accounting principles generally accepted in the United States of America.
Basis for Opinion
These financial statements are the responsibility of the Fund’s management. Our responsibility is to express an opinion on the Fund’s financial statements and financial highlights based on our audit. We are a public accounting firm registered with the Public Company Accounting Oversight Board (United States) (PCAOB) and are required to be independent with respect to the Fund in accordance with U.S. federal securities laws and the applicable rules and regulations of the Securities and Exchange Commission and the PCAOB.
We conducted our audit in accordance with the standards of the PCAOB. Those standards require that we plan and perform the audit to obtain reasonable assurance about whether the financial statements are free of material misstatement, whether due to error or fraud. The Fund is not required to have, nor were we engaged to perform, an audit of its internal control over financial reporting. As part of our audit, we are required to obtain an understanding of internal control over financial reporting but not for the purpose of expressing an opinion on the effectiveness of the Fund’s internal control over financial reporting. Accordingly, we express no such opinion.
Our audit included performing procedures to assess the risks of material misstatement of the financial statements, whether due to error or fraud, and performing procedures that respond to those risks. Such procedures included examining, on a test basis, evidence regarding the amounts and disclosures in the financial statements. Our procedures included confirmation of investments owned as of October 31, 2021, by correspondence with the custodian. Our audit also included evaluating the accounting principles used and significant estimates made by management, as well as evaluating the overall presentation of the financial statements. We believe that our audit provides a reasonable basis for our opinion.
/s/ RSM US LLP
We have served as the auditor of one or more Regents Park Funds, LLC’s investment companies since 2013.
Denver, Colorado
December 28, 2021
24
| Affinity World Leaders ETF |
| EXPENSE EXAMPLES (Unaudited) |
| October 31, 2021 |
As a shareholder of the Fund, you incur two types of costs: (1) transaction costs for purchasing and selling shares; and (2) ongoing costs, including management fees and other fund expenses. This example is intended to help you understand your ongoing costs (in dollars) of investing in the Fund and to compare these costs with the ongoing costs of investing in other mutual funds.
The Example is based on an investment of $1,000 invested at the beginning of the six-month period and held for the entire six-month period from May 1, 2021 to October 31, 2021 (the ’‘period’’).
Actual Expenses
The first line of the table below provides information about actual account values and actual expenses. You may use the information in this line, together with the amount you invested, to estimate the expenses that you paid over the period. Simply divide your account value by $1,000 (for example, an $8,600 account value divided by $1,000 = 8.6), then multiply the result by the number in the first line under the heading entitled ’‘Expenses Paid During the Period’’ to estimate the expenses you paid on your account during this period.
Hypothetical Example for Comparison Purposes
The second line of the table below provides information about hypothetical account values and hypothetical expenses based on the Fund’s actual expense ratio and an assumed rate of return of 5% per year before expenses, which is not the Fund’s actual return. The hypothetical account values and expenses may not be used to estimate the actual ending account balance or expenses you paid for the period. You may use this information to compare the ongoing costs of investing in the Fund and other funds. To do so, compare this 5% hypothetical example with the 5% hypothetical examples that appear in the shareholder reports of the other funds. Please note that the expenses shown in the table are meant to highlight your ongoing costs only and do not reflect any transactional costs, such as brokerage commissions on purchases or sales of Fund shares. Therefore, the second line of the table is useful in comparing ongoing costs only and will not help you determine the relative total costs of owning different funds. In addition, if these transactional costs were included, your costs would have been higher.
| Beginning | Ending | Expenses Paid | Expense Ratio | |
| Account Value | Account Value | During Period | During the Period | |
| Actual | 5/1/21 | 10/31/21 | 5/1/21-10/31/21* | 5/1/21-10/31/21 |
| $1,000.00 | $1,041.70 | $3.15 | 0.61% | |
| Hypothetical | Beginning | Ending | Expenses Paid | Expense Ratio |
| Account Value | Account Value | During Period | During the Period | |
| (5% return before expenses) | 5/1/21 | 10/31/21 | 5/1/21-10/31/21* | 5/1/21-10/31/21 |
| $1,000.00 | $1,022.12 | $3.12 | 0.61% |
| * | Expenses are equal to the average account value over the period, multiplied by the Fund’s annualized expense ratio, multiplied by the number of days in the period (184) divided by the number of days in the fiscal year (365). |
25
| Affinity World Leaders ETF |
| ADDITIONAL INFORMATION (Unaudited) |
| October 31, 2021 |
LIQUIDITY RISK MANAGEMENT PROGRAM
The Fund has adopted and implemented a written liquidity risk management program as required by Rule 22e-4 (the “Liquidity Rule”) under the 1940 Act. The program is reasonably designed to assess and manage the Fund’s liquidity risk, taking into consideration, among other factors, the Fund’s investment strategy and the liquidity of its portfolio investments during normal and reasonably foreseeable stressed conditions; its short and long-term cash flow projections; and its cash holdings and access to other funding sources.
During the year ended October 31, 2021, the Trust’s Liquidity Risk Management Program Committee (the “Committee”) reviewed the Fund’s investments and determined that the Fund held adequate levels of cash and highly liquid investments to meet shareholder redemption activities in accordance with applicable requirements. Accordingly, the Committee concluded that (i) the Fund’s liquidity risk management program is reasonably designed to prevent violations of the Liquidity Rule and (ii) the Fund’s liquidity risk management program has been effectively implemented.
26
| Affinity World Leaders ETF |
| SUPPLEMENTAL INFORMATION (Unaudited) |
| October 31, 2021 |
Trustees and Officers. The Trustees and officers of the Trust, together with information as to their principal business occupations during the past five years and other information, are shown below. Unless otherwise noted, the address of each Trustee and Officer is 225 Pictoria Drive, Suite 450, Cincinnati, OH 45246.
Independent Trustees *
| Name, Address, Year of Birth | Position(s) Held with Registrant | Term and Length Served | Principal Occupation(s) During Past 5 Years | Number of Portfolios Overseen In The Fund Complex** | Other Directorships Held During Past 5 Years |
| Mark Garbin Year of Birth: 1951 | Trustee | Indefinite, Since 2012 | Managing Principal, Coherent Capital Management LLC (since 2008) | 7 | Northern Lights Fund Trust (since 2013); Northern Lights Variable Trust (since 2013); Forethought Variable Insurance Trust (since 2013); OHA Mortgage Strategies Fund (offshore), Ltd. (2014 - 2017); iCapital KKR Private Markets Fund (since 2014); and Carlyle Tactical Private Credit Fund (since March 2018) |
| Mark D. Gersten Year of Birth: 1950 | Chairman, Trustee | Indefinite, Since 2012 | Independent Consultant (since 2012); Senior Vice President – Global Fund Administration Mutual Funds & Alternative Funds, AllianceBernstein LP (1985 – 2011) | 7 | Northern Lights Fund Trust (since 2013); Northern Lights Variable Trust (since 2013); iCapital KKR Private Markets Fund (since 2014); previously, Ramius Archview Credit and Distressed Fund (2015-2017); and Schroder Global Series Trust (2012 to 2017) |
| Neil M. Kaufman Year of Birth: 1960 | Trustee, Audit Committee Chairman | Indefinite, Since 2012 | Managing Member, Kaufman, McGowan PLLC (legal services)(Since 2016); Partner, Abrams Fensterman, Fensterman, Eisman, Formato, Ferrara & Wolf, LLP (legal services)(2010-2016) | 7 | iCapital KKR Private Markets Fund (since 2014) |
| Anita K. Krug Year of Birth: 1969 | Trustee | Indefinite, Since 2012 | Dean and Professor (since 2019) Illinois Institute of Technology; Interim Vice Chancellor for Academic Affairs (2018-2019) University of Washington Bothell; Interim Dean (2017-2018), Professor (2016-2019), Associate Professor (2014-2016); and Assistant Professor (2010-2014), University of Washington School of Law | 7 | iCapital KKR Private Markets Fund (since 2014); Centerstone Investors Trust (2016-2021) |
| * | Information is as of October 31, 2021. |
| ** | As of October 31, 2021, the Trust was comprised of 24 active portfolios managed by seven unaffiliated investment advisers and two affiliated investment advisers. The term “Fund Complex” applies only to those funds that (i) are advised by a common investment adviser or by an investment adviser that is an affiliated person of the investment adviser of any of the other funds in the Trust or (ii) hold themselves out to investors as related companies for purposes of investment and investor services. The Fund does not hold itself out as related to any other series within the Trust except for Anfield Dynamic Fixed Income ETF, Anfield Diversified Alternatives ETF, Anfield Universal Fixed Income ETF, Anfield U.S. Equity Sector Rotation ETF and APEX Healthcare ETF, each of which are advised by the Fund’s Adviser and sub-advised by Anfield, and Anfield Universal Fixed Income Fund, which is advised by Anfield. |
10/31/2021 – Two Roads v2
27
| Affinity World Leaders ETF |
| SUPPLEMENTAL INFORMATION (Unaudited) (Continued) |
| October 31, 2021 |
Officers of the Trust*
| Name, Address, Year of Birth | Position(s) Held with Registrant | Principal Occupation(s) During Past 5 Years | Number of Portfolios Overseen In The Fund Complex** | Other Directorships Held During Past 5 Years |
| James Colantino 80 Arkay Drive Hauppauge, NY 11788 Year of Birth: 1969 | President Since Feb. 2017 Treasurer (2012 to 2017) | Senior Vice President (2012-present); Vice President (2004 to 2012); Ultimus Fund Solutions LLC | N/A | N/A |
| Laura Szalyga 80 Arkay Drive Hauppauge, NY 11788 Year of Birth: 1978 | Treasurer Since Feb. 2017 | Vice President, Ultimus Fund Solutions LLC (since 2015); Assistant Vice President, Ultimus Fund Solutions LLC (2011-2014) | N/A | N/A |
| Richard A. Malinowski 80 Arkay Drive Hauppauge, NY 11788 Year of Birth: 1983 | Vice President Since Sep. 2018 Secretary Since 2013 | Senior Vice President and Senior Managing Counsel, Ultimus Fund Solutions LLC, (since February 2020); Senior Vice President Legal Administration, Ultimus Fund Solutions LLC (April 2017 to February 2020); Vice President and Counsel (April 2016 – 2017) and AVP and Staff Attorney (September 2012 –March 2016). | N/A | N/A |
| William B. Kimme Year of Birth: 1962 | Chief Compliance Officer Since Inception | Senior Compliance Officer, Northern Lights Compliance Services, LLC (September 2011 - present) | N/A | N/A |
| * | Information is as of October 31, 2021. |
| ** | As of October 31, 2021, the Trust was comprised of 24 active portfolios managed by seven unaffiliated investment advisers and two affiliated investment advisers. The term “Fund Complex” applies only to those funds that (i) are advised by a common investment adviser or by an investment adviser that is an affiliated person of the investment adviser of any of the other funds in the Trust or (ii) hold themselves out to investors as related companies for purposes of investment and investor services. The Fund does not hold itself out as related to any other series within the Trust except for Anfield Dynamic Fixed Income ETF, Anfield Diversified Alternatives ETF, Anfield Universal Fixed Income ETF, Anfield U.S. Equity Sector Rotation ETF and APEX Healthcare ETF, each of which are advised by the Fund’s Adviser and sub-advised by Anfield, and Anfield Universal Fixed Income Fund, which is advised by Anfield. |
The Fund’s Statement of Additional Information (“SAI”) includes additional information about the Trustees and is available free of charge, upon request, by calling toll-free at 1-866-866-4848.
10/31/2021 – Two Roads v2
28
PRIVACY NOTICE
| FACTS | WHAT DOES TWO ROADS SHARED TRUST DO WITH YOUR PERSONAL INFORMATION |
| Why? | Financial companies choose how they share your personal information. |
| Federal law gives consumers the right to limit some but not all sharing. | |
| Federal law also requires us to tell you how we collect, share, and protect your personal information. Please read this notice carefully to understand what we do. | |
| What? | THE TYPES OF PERSONAL INFORMATION WE COLLECT AND SHARE DEPENDS ON THE PRODUCT OR SERVICE THAT YOU HAVE WITH US. THIS INFORMATION CAN INCLUDE: |
| ● Social Security number and income | |
| ● Account transactions and transaction history | |
| ● Investment experience and purchase history | |
| When you are no longer our customer, we continue to share your information as described in this notice. | |
| How? | All financial companies need to share customers’ personal information to run their everyday business. In the section below, we list the reasons financial companies can share their customers’ personal information; the reason Two Roads Shared Trust chooses to share and whether you can limit this sharing. |
| Reasons we can share your personal information | Does Two Roads Shared Trust share? | Can you limit this sharing? |
| For our everyday business purposes – | ||
| such as to process your transactions, maintain your account(s), respond to court orders and legal investigations, or report to credit bureaus | YES | NO |
| For our marketing purposes – | NO | We do not share |
| to offer our products and services to you | ||
| For joint marketing with other financial companies | NO | We do not share |
| For our affiliates’ everyday business purposes – | NO | We do not share |
| information about your transactions and experiences | ||
| For our affiliates’ everyday business purposes – | NO | We do not share |
| information about your creditworthiness | ||
| For our affiliates to market to you | NO | We do not share |
| For nonaffiliates to market to you | NO | We do not share |
| Questions? | Call 1-631-490-4300 |
29
What we do
| How does Two Roads Shared Trust protect my personal information? | To protect your personal information from unauthorized access and use, we use security measures that comply with federal law. These measures include computer safeguards and secured files and buildings. |
| Our service providers are held accountable for adhering to strict policies and procedures to prevent any misuse of your nonpublic personal information. | |
| How does Two Roads Shared Trust | We collect your personal information, for example, when you |
| collect my personal information? | |
| ● open an account or give us contact information | |
| ● provide account information or give us your income information | |
| ● make deposits or withdrawals from your account | |
| We also collect your personal information from other companies. | |
| Why can’t I limit all sharing? | Federal law gives you the right to limit only |
| ● sharing for affiliates’ everyday business purposes – information about your creditworthiness | |
| ● affiliates from using your information to market to you | |
| ● sharing for nonaffiliates to market to you | |
| State laws and individual companies may give you additional rights to limit sharing | |
| Definitions | |
| Affiliates | Companies related by common ownership or control. They can be financial and nonfinancial companies. |
| ● Two Roads Shared Trust has no affiliates. | |
| Nonaffiliates | Companies not related by common ownership or control. They can be financial and nonfinancial companies. |
| ● Two Roads Shared Trust does not share with nonaffiliates so they can market to you. | |
| Joint marketing | A formal agreement between nonaffiliates financial companies that together market financial products or services to you. |
| ● Two Roads Shared Trust does not jointly market. |
30
Proxy Voting Policy
Information regarding how the Fund votes proxies relating to portfolio securities for the twelve month period ended June 30th as well as a description of the policies and procedures that the Fund used to determine how to vote proxies is available without charge, upon request, by calling 1-866-866-4848 or by referring to the Securities and Exchange Commission’s (“SEC”) website at http://www.sec.gov.
Portfolio Holdings
Funds file a complete schedule of portfolio holdings with the Securities and Exchange Commission (the “SEC”) for the first and third quarters of each fiscal year as an exhibit to its reports on Form N-PORT, within sixty days after the end of the period. Form N-PORT reports are available at the SEC’s website at www.sec.gov. The information on Form N-PORT is available without charge, upon request, by calling 1-866-866-4848.
| Adviser |
| Regents Park Funds, LLC |
| 4041 MacArthur Blvd., Suite 155 |
| Newport Beach, CA 92660 |
| Administrator |
| Ultimus Fund Solutions, LLC |
| 225 Pictoria Drive, Suite 450 |
| Cincinnati, OH 45245 |
This report and the financial statements contained herein are submitted for the general information of shareholders and are not authorized for distribution to prospective investors unless preceded or accompanied by an effective prospectus. Nothing contained herein is to be considered an offer of sale or solicitation of an offer to buy shares of the Fund. Such an offering is made only by a prospectus, which contains information about the Fund’s investment objective, risks, fees and expenses. Investors are reminded to read the prospectus carefully before investing in the Fund.
AFAR-21
(b) Not applicable
ITEM 2. CODE OF ETHICS.
| (a) | The registrant has, as of the end of the period covered by this report, adopted a code of ethics that applies to the registrant's principal executive officer, principal financial officer, and principal accounting officer or controller, or persons performing similar functions, regardless of whether these individuals are employed by the registrant or a third party. |
| (b) | During the period covered by this report, there were no amendments to any provision of the code of ethics. |
| (c) | During the period covered by this report, there were no waivers or implicit waivers of a provision of the code of ethics. |
| (d) | During the period covered by this report, there were no waivers or implicit waivers of a provision of the code of ethics. |
ITEM 3. AUDIT COMMITTEE FINANCIAL EXPERT.
| The Registrant’s board of trustees has determined that Mark Gersten is an audit committee financial expert, as defined in Item 3 of Form N-CSR. Mr. Gersten is independent for purposes of this Item 3. |
ITEM 4. PRINCIPAL ACCOUNTANT FEES AND SERVICES.
| (a) | Audit Fees |
| Trust Series | 2021 | 2020 | |
| Affinity World Leaders Equity ETF | $16,000 | $15,500 |
| (b) | Audit-Related Fees – None |
| (c) | Tax Fees. The aggregate fees billed in each of the last two fiscal years for professional services rendered by the principal accountant for tax compliance are as follows: |
| Trust Series | 2021 | 2020 | |
| Affinity World Leaders Equity ETF | $3,500 | $3,250 |
| (d) | All Other Fees – None |
| (e)(1) | The audit committee does not have pre-approval policies and procedures. Instead, the audit committee or audit committee chairman approves on a case-by-case basis each audit or non-audit service before the principal accountant is engaged by the registrant. |
| (e)(2) | There were no services described in each of paragraphs (b) through (d) of this Item that were approved by the audit committee pursuant to paragraph (c)(7)(i)(C) of Rule 2-01 of Regulation S-X. |
| f) | Not applicable. The percentage of hours expended on the principal accountant's engagement to audit the registrant's financial statements for the most recent fiscal year that were attributed to work performed by persons other than the principal accountant's full-time, permanent employees was zero percent (0%). |
| (g) | All non-audit fees billed by the registrant's principal accountant for services rendered to the registrant for the fiscal year ended October 31, 2020 and 2021 are disclosed in (b)-(d) above. There were no audit or non-audit services performed by the registrant's principal accountant for the registrant's adviser. |
(h) Not applicable.
ITEM 5. AUDIT COMMITTEE OF LISTED REGISTRANTS.
The registrant is an issuer as defined in Rule 10A-3 under the Securities Exchange Act of 1934, as amended (the “Exchange Act”) and has a separately-designated standing audit committee established in accordance with Section 3(a)(58)A of the Exchange Act. The registrant’s audit committee members are Mark Garbin, Mark Gersten, Neil M. Kaufman and Anita K. Krug.
ITEM 6. SCHEDULE OF INVESTMENT
Included in annual report to shareholders filed under item 1 of this form.
ITEM 7. DISCLOSURE OF PROXY VOTING POLICIES AND PROCEDURES FOR CLOSED-END MANAGEMENT INVESTMENT COMPANIES.
Not applicable Fund is an open-end management investment company
ITEM 8. PORTFOLIO MANAGERS OF CLOSED-END MANAGEMENT INVESTMENT COMPANIES
Not applicable Fund is an open-end management investment company
ITEM 9. PURCHASES OF EQUITY SECURITIES BY CLOSED-END MANAGEMENT INVESTMENT COMPANY AND AFFILIATED PURCHASERS.
Not applicable Fund is an open-end management investment company
ITEM 10. SUBMISSION OF MATTERS TO A VOTE OF SECURITY HOLDERS.
Not applicable at this time.
ITEM 11. CONTROLS AND PROCEDURES.
| (a) | The registrant's principal executive and principal financial officers, or persons performing similar functions, have concluded that the registrant's disclosure controls and procedures (as defined in Rule 30a-3(c) under the 1940 Act), are effective, as of a date within 90 days of the filing date of this report, based on the evaluation of these controls and procedures required by Rule 30a-3(b) under the 1940 Act and Rule 15d-15(b) under the Securities Exchange Act of 1934, as amended. |
| (b) | There were no changes in the registrant's internal control over financial reporting (as defined in Rule 30a-3(d) under the 1940 Act) that occurred during the period covered by this report that have materially affected, or are reasonably likely to materially affect, the registrant's internal control over financial reporting. |
ITEM 12. Disclosure of Securities Lending Activities for Closed-End Management Investment Companies.
Not applicable Fund is an open-end management investment company
ITEM 13. EXHIBITS
| (a) | (1) | Code of Ethics for Principal Executive and Senior Financial Officers is attached hereto. |
| (a) | (2) | Certifications pursuant to Section 302 of the Sarbanes-Oxley Act of 2002 are filed herewith. |
| (b) | Certifications pursuant to Section 906 of the Sarbanes-Oxley Act of 2002 are filed herewith. |
SIGNATURES
Pursuant to the requirements of the Securities Exchange Act of 1934 and the Investment Company Act of 1940, the registrant has duly caused this report to be signed on its behalf by the undersigned, thereunto duly authorized.
Two Roads Shared Trust
| By James Colantino | /s/ James Colantino |
| Principal Executive Officer/President, | |
| Date: January 6, 2022 | |
Pursuant to the requirements of the Securities Exchange Act of 1934 and the Investment Company Act of 1940, this report has been signed below by the following person on behalf of the registrant and in the capacities and on the date indicated.
| By Laura Szalyga | /s/ Laura Szalyga |
| Principal Financial Officer/Treasurer | |
| Date: January 6, 2022 | |