united states
securities and exchange commission
washington, d.c. 20549
form n-csr
certified shareholder report of registered management
investment companies
Investment Company Act file number 811-22718
Two Roads Shared Trust
(Exact name of registrant as specified in charter)
225 Pictoria Drive, Suite 450 Cincinnati, OH 45246
(Address of principal executive offices) (Zip code)
The Corporation Trust Company
1209 Orange Street, Wilmington, DE 19801
(Name and address of agent for service)
Registrant's telephone number, including area code: 631-490-4300
Date of fiscal year end: 10/31
Date of reporting period: 10/31/21
ITEM 1. REPORTS TO SHAREHOLDERS.
Dear Shareholder,
Redwood Managed Volatility Fund (RWDIX): +3.43%*
| * | Class I – From November 1, 2020 through October 31, 2021 Source: Ultimus Fund Solutions. |
During the Redwood Managed Volatility Fund’s (the “Fund”) fiscal year, risk markets and the economy benefitted from recovery from the global spread of Covid-19 . The Federal Reserve maintained highly accommodative monetary policy of low interest rates and asset purchases which supported corporate credits including high yield bonds.
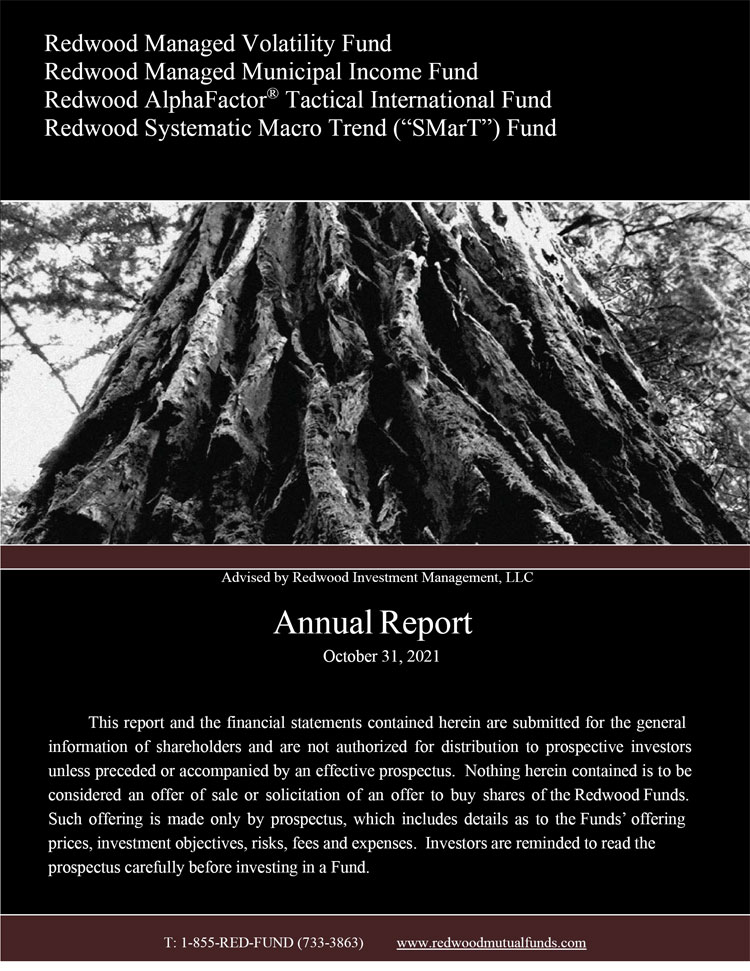
The Fund returned +3.43% (Source: Ultimus). The Fund’s performance during the period was mainly driven by yield received from corporate bonds and credit spreads modestly tightening. The Fund derived most of its total return from derivative products, such as total-return swaps and CDX, tied to U.S. corporate high -yield bond exposure. The Fund outperformed in comparison to its benchmark, the BoFA Merrill Lynch 3-5 Year Treasury Index which returned -1.52% (Source: Ultimus) as treasuries experienced a modest sell off in response to stronger economic data.
Capital markets are infinitely complex. Every day, new information becomes available that changes the risk and return dynamic of any investment. In our view, capital markets are only a tool to capture opportunities in favorable risk -return dynamic, wherever they exist to work towards an investor’s long-term goal or objective. We do not attempt to forecast or suggest what may lie ahead. Instead, we utilize a disciplined, quantitative approach, aiming to minimize the subjectivity of investing.
| ** | Bank of America Merrill Lynch 3-5 Year Treasury Index is an unmanaged index which includes U.S. Treasury securities with maturities of 3 to 4.99 years. The index is produced by Bank of America Merrill Lynch, Pierce, Fenner & Smith, Inc. Investors can not invest directly in an index or benchmark. Index returns are gross of any fees, brokerage commissions or other expenses of investing. |
| *** | The BofA Merrill Lynch 3-5 Year Treasury Index tracks the performance of the direct sovereign debt of the U.S. government having a maturity of at least three years and less than five years. Investors cannot invest directly in an index or benchmark. Index returns are gross of any fees, brokerage commissions or other expenses of investing. |
999998.05572/124250038v.1
Dear Shareholder,
Redwood Managed Municipal Income Fund (RWMIX): +8.30%*
| * | Class I – From November 1, 2020 through October 31, 2021. Source: Ultimus Fund Solutions. |
During the Redwood Managed Volatility Fund’s (the “Fund”) fiscal year risk markets and the economy benefitted from recovery from the global spread of Covid -19. The Federal Reserve maintained highly accommodative monetary policy of low interest rates and asset purchases which supported the broader bond market.
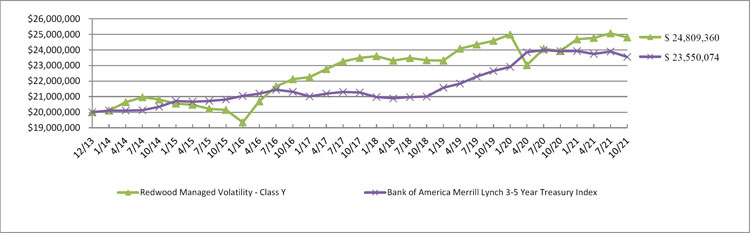
The Fund returned +8.30% (Source: Ultimus). The Fund’s performance during the period was mainly driven by two factors. First, due to low absolute interest rates, investors sought premium yields such as available in high yield municipal bonds. Second, a fear of increasing income tax rates spurred incremental demand for federal tax free income bonds. The Fund outperformed in comparison to its benchmark, the Bloomberg Barclays U.S. Municipal Bond Index which returned 2.64% (Source: Ultimus) as investment - grade municipal bonds underperformed their high-yield municipal bond counterparts as investors sought premium yields.
Capital markets are infinitely complex. Every day, new information becomes available that changes the risk and return dynamic of any investment. In our view, capital markets are only a tool to capture opportunities in favorable risk -return dynamic, wherever they exist to work towards an investor’s long-term goal or objective. We do not attempt to forecast or suggest what may lie ahead. Instead, we utilize a quantitative approach, aiming to minimize the subjectivity of investing.
| ** | The Bloomberg Barclays U.S. Municipal Bond Index covers the U.S. dollar denominated long-term tax exempt bond market. The index has four main sectors: state and local general obligation bonds, revenue bonds. Investors cannot invest directly in an index or benchmark. Index returns are gross of any fees, brokerage commissions or other expenses of investing. |
| *** | Bloomberg Barclays U.S. Municipal Bond Index covers the USD-denominated long -term tax exempt bond market. The index has four main sectors: state and local general obligation bonds, revenue bonds, insured bonds, and pre-refunded bonds. Investors cannot invest directly in an index or benchmark. Index returns are gross of any fees, brokerage commissions or other expenses of investing. |
999998.05572/124250038v.1
Dear Shareholder,
Redwood AlphaFactor® Tactical International Fund (RWIIX): 25.54%*
| * | Class I – From November 1, 2020 through October 31, 2021. Source: Bloomberg. |
During the Redwood AlphaFactor® Tactical International Fund’s (the “Fund”) fiscal year, the global economy began to stabilize as recovery from the spread of Covid-19 became more widespread. International equities, represented by the MSCI All Country World ex-US Index** (MSCI ACWI ex-US), recovered from their steep decline experienced in early 2020.
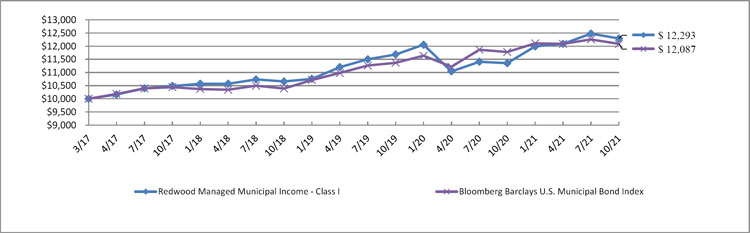
The Fund posted gains of 25.54% (Source: Ultimus). During the entire period, the Fund was invested in a portfolio of international stock exposure, and international equity derivatives. While risk-on during the entire period, the Fund derived most of its total return from derivative products, namely equity swaps reflecting international long equity exposure. The fund underperformed its benchmark, the Redwood AlphaFactor® Tactical International Index (RWTINT), which returned 32.74% (Source: Bloomberg) during the same period. The Fund will continue to implement its disciplined quantitative stock selection and risk management process.
Capital markets are infinitely complex. Every day, new information becomes available that changes the risk and return dynamic of any investment. In our view, capital markets are only a tool to capture opportunities in favorable risk -return dynamic, wherever they exist to work towards an investor’s long-term goal or objective. We do not attempt to forecast or suggest what may lie ahead. Instead, we utilize a quantitative approach, aiming to minimize the subjectivity of investing.
| ** | The Redwood AlphaFactor® Tactical International Index, the Fund advisor’s proprietary index, utilizes a quantitative, factor-based, investment methodology focused on large and middle capitalization stocks of both developed and emerging markets outside of the U.S. typically of companies with market capitalizations of greater than $2 billion. Investors cannot invest directly in an index or benchmark. Index returns are gross of any fees, brokerage commissions or other expenses of investing. |
| *** | The Redwood AlphaFactor® Tactical International Index seeks to identify critical turning points in the markets for international equities. The index utilizes a quantitively driven process that seeks to be risk-on when international equities are trending upwards, and risk-off when international equities are trending downwards. Investors cannot invest directly in an index or benchmark. Index returns are gross of any fees, brokerage commissions or other expenses of investing. |
999998.05572/124250038v.1
Dear Shareholder,
Redwood Systematic Macro Trend (“SMarT”) Fund (RWSIX): 36.79%*
| * | Class I – From November 1, 2020 through October 31, 2021. Source: Ultimus Fund Solutions. |
During the Redwood Systematic Macro Trend (“SMarT”) Fund’s (the “Fund”) fiscal year, the global economy began to stabilize as recovery from the spread of Covid-19 became more widespread. The US economy led the global recovery with US equities achieving multiple new highs.
The Fund posted gains of 36.79% (Source: Ultimus), and outperformed its benchmark, 40% S&P 500/60% Bloomberg Barclays Aggregate Index which returned 15.36% (Source: Ultimus). During the entire period, the Fund was invested in a combination of exposures including U.S. equity, convertible bond, preferred stock, high yield corporate bond, and international stock. The Fund was able to outperform its benchmark given the Fund’s higher equity exposure (through stock positions and its convertible bonds) which rallied strongly versus investment grade fixed income which experienced flat to negative performance. The Fund will continue to implement its disciplined quantitative security selection and risk management process.
Capital markets are infinitely complex. Every day, new information becomes available that changes the risk and return dynamic of any investment. In our view, capital markets are only a tool to capture opportunities in favorable risk -return dynamic, wherever they exist to work towards an investor’s long-term goal or objective. We do not attempt to forecast or suggest what may lie ahead. Instead, we utilize a quantitative approach, aiming to minimize the subjectivity of investing.
| ** | The Composite Index represents a blend of 40% S&P 500 Total Return Index and 60% Bloomberg Barclays Global Aggregate Bond Index. The Composite Index has comparable return characteristics as the Fund and shows how the Fund’s performance directly compares to a blend of the returns of broad-based indices widely recognized in the industry. Investors cannot invest directly in an index or benchmark. Index returns are gross of any fees, brokerage commissions or other expenses of investing. |
Standard and Poor’s 500 Total Return Index is a capitalization-weighted index of 500 stocks. The index is designed to measure performance of the broad domestic economy through changes in the aggregate market value of 500 stocks representing all major industries. Investors cannot invest directly in an index or benchmark. Index returns are gross of any fees, brokerage commissions or other expenses of investing.
The Bloomberg Barclays Aggregate Bond Index is a measure of global investment grade debt from twenty-four local currency markets. This multi-currency benchmark includes treasury, government-related, corporate, and securitized fixed-rate bonds from both developed and emerging market issuers. Investors cannot invest directly in an index or benchmark. Index returns are gross of any fees, brokerage commissions or other expenses of investing.
| *** | The 40% S&P 500 / 60% Bloomberg Barclays Aggregate Bond Index is a blended index which is composed of 40% Standard and Poor’s 500 Total Return Index (a capitalization-weighted index of 500 stocks. The index is designed to measure performance of the broad domestic economy through changes in the aggregate market value of 500 stocks representing all major industries) and 60% of the Bloomberg Barclays Aggregate Bond Index (an index that consists of investment grade U.S. Government bonds, investment grade corporate bonds, mortgage pass-through securities, and asset-backed securities. It is often considered representative of the U.S. investment-grade fixed rate bond market). Investors cannot invest directly in an index or benchmark. Index returns are gross of any fees, brokerage commissions or other expenses of investing. |
999998.05572/124250038v.1
The views in this report are those of the Fund’s management. This report contains certain forward-looking statements about factors that may affect the performance of the Fund in the future. These statements are based on the Fund’s management’s predictions and expectations concerning certain future events such as the performance of the economy as a whole and of specific industry sectors. Management believes these forward-looking statements are reasonable, although they are inherently uncertain and difficult to predict.
5035-NLD-1/7/2022
999998.05572/124250038v.1
| Redwood Managed Volatility Fund |
| PORTFOLIO REVIEW |
| October 31, 2021 (Unaudited) |
The Fund’s performance figures* for the period ended October 31, 2021, compared to its benchmark:
| Annualized Three | Annualized Since | |||
| One Year | Years | Annualized Five Years | Inception(a) | |
| Class I | 3.43% | 1.91% | 2.24% | 2.66% |
| Class N | 3.12% | 1.66% | 1.97% | 2.41% |
| Class Y | 3.54% | 2.05% | 2.32% | 2.78% |
| Bank of America Merrill Lynch 3-5 Yr Treasury Index (b) | (1.52)% | 3.89% | 2.02% | 2.10% |
| * | The performance data quoted here represents past performance. Current performance may be lower or higher than the performance data quoted above. Past performance is no guarantee of future results. The investment return and principal value of an investment will fluctuate so that investor’s shares, when redeemed, may be worth more or less than their original cost. The returns shown do not reflect the deduction of taxes that a shareholder would pay on Fund distributions or on the redemption of Fund shares. The Fund’s total annual operating expenses after expense waiver are 1.55% for Class I shares, 1.78% for Class N shares, and 1.43% for Class Y shares per the March 1, 2021 prospectus. The Fund’s advisor has contractually agreed to reduce the Fund’s fees and/or absorb expenses of the Fund until at least March 1, 2022 to ensure that total annual Fund operating expenses after expense waiver and reimbursement (exclusive of any front-end or contingent deferred loads; brokerage fees and commissions; acquired fund fees and expenses; borrowing costs, such as interest and dividend expenses on securities sold short; taxes; and extraordinary expenses, such as litigation expenses) will not exceed 1.67%, 1.92% and 1.43% of average daily net assets attributable to Class I, Class N and Class Y shares, respectively. This agreement may be terminated by the Fund’s Board of Trustees on 60 days’ written notice to the advisor. These fee waivers and expense reimbursements are subject to possible recoupment from the Fund in future years on a rolling three year basis (within the three years of when the amount was waived or reimbursed) if such recoupment can be achieved within the foregoing expense limits as well as any expense limitation that was in effect at the time the waiver or reimbursement was made. For performance information current to the most recent month-end, please call toll-free 1-855-733-3863. |
| (a) | Redwood Managed Volatility Fund commenced operations on December 19, 2013. |
| (b) | Bank of America Merrill Lynch 3-5 Year Treasury Index is an unmanaged index which includes U.S. Treasury securities with maturities of 3 to 4.99 years. The index is produced by Bank of America Merrill Lynch, Pierce, Fenner & Smith, Inc. Investors can not invest directly in an index or benchmark. Index returns are gross of any fees, brokerage commissions or other expenses of investing. |
Comparison of the Change in Value of a $20,000,000 Investment ^
| ^ | Performance shown is for Class Y shares. The performance of the Fund’s other classes may be greater or less than the line shown due to differences in loads and fees paid by shareholders in different share classes. |
| PORTFOLIO COMPOSITION October 31, 2021 | ||
| % of Net Assets | ||
| Short-Term Investment | 51.5% | |
| U.S. Government and Agencies | 9.6% | |
| Corporate Bonds | 3.3% | |
| Convertible Bond | 0.0%* | |
| Other Assets in Excess of Liabilities | 35.6% | |
| Total | 100.0% | |
| * | Less than 0.1% |
Please refer to the Schedule of Investments for a detailed listing of the Fund’s holdings.
| Redwood Managed Municipal Income Fund |
| PORTFOLIO REVIEW |
| October 31, 2021 (Unaudited) |
The Fund’s performance figures* for the period ended October 31, 2021, compared to its benchmark:
| Annualized Three | |||
| One Year | Years | Since Inception(a) | |
| Class I | 8.30% | 4.87% | 4.54% |
| Class N | 7.47% | 4.25% | 4.06% |
| Bloomberg Barclays U.S. Municipal Bond Index (b) | 2.64% | 5.17% | 4.16% |
| * | The performance data quoted here represents past performance. Current performance may be lower or higher than the performance data quoted above. Past performance is no guarantee of future results. The investment return and principal value of an investment will fluctuate so that investor’s shares, when redeemed, may be worth more or less than their original cost. The returns shown do not reflect the deduction of taxes that a shareholder would pay on Fund distributions or on the redemption of Fund shares. The Fund’s total annual operating expenses after expense waivers are 1.54% for Class I shares and 1.79% for Class N shares per the March 1, 2021 prospectus. The Fund’s advisor has contractually agreed to reduce the Fund’s fees and/or absorb expenses of the Fund until at least March 1, 2022 to ensure that total annual Fund operating expenses after expense waiver and reimbursement (exclusive of any front-end or contingent deferred loads; brokerage fees and commissions; acquired fund fees and expenses; borrowing costs, such as interest and dividend expenses on securities sold short; taxes; and extraordinary expenses, such as litigation expenses) will not exceed 1.25% and 1.00% of average daily net assets attributable to Class I and Class N shares, respectively. This agreement may be terminated by the Fund’s Board of Trustees on 60 days’ written notice to the advisor. These fee waivers and expense reimbursements are subject to possible recoupment from the Fund in future years on a rolling three year basis (within the three years of when the amount was waived or reimbursed) if such recoupment can be achieved within the foregoing expense limits as well as any expense limitation that was in effect at the time the waiver or reimbursement was made. For performance information current to the most recent month-end, please call toll-free 1-855-733-3863. |
| (a) | Redwood Managed Municipal Income Fund commenced operations on March 9, 2017. |
| (b) | The Bloomberg Barclays U.S. Municipal Bond Index covers the U.S. dollar denominated long-term tax exempt bond market. The index has four main sectors: state and local general obligation bonds, revenue bonds. Investors cannot invest directly in an index or benchmark. Index returns are gross of any fees, brokerage commissions or other expenses of investing. |
Comparison of the Change in Value of a $10,000 Investment^
| ^ | Performance shown is for Class I shares. The performance of the Fund’s other classes may be greater or less than the line shown due to differences in loads and fees paid by shareholders in different share classes. |
| PORTFOLIO COMPOSITION October 31, 2021 | ||
| % of Net Assets | ||
| Short-Term Investments | 94.7% | |
| Open End Funds | 5.4% | |
| Liabilities in Excess of Other Assets | (0.1)% | |
| Total | 100.0% | |
Please refer to the Schedule of Investments for a detailed listing of the Fund’s holdings.
| Redwood AlphaFactor® Tactical International Fund |
| PORTFOLIO REVIEW |
| October 31, 2021 (Unaudited) |
The Fund’s performance figures* for the period ended October 31, 2021 compared to its benchmarks:
| Annualized Three | |||
| One Year | Years | Since Inception(a) | |
| Class I | 25.54% | 8.52% | 5.91% |
| Class N | 22.46% | 7.87% | 5.33% |
| Redwood AlphaFactor® Tactical International Index (b) | 32.74% | 42.91% | 45.96% |
| MSCI AC World Index ex-US Net (c) | 29.66% | 12.00% | 6.40% |
| * | The performance data quoted here represents past performance. Current performance may be lower or higher than the performance data quoted above. Past performance is no guarantee of future results. The investment return and principal value of an investment will fluctuate so that investor’s shares, when redeemed, may be worth more or less than their original cost. The returns shown do not reflect the deduction of taxes that a shareholder would pay on Fund distributions or on the redemption of Fund shares. The Fund’s total annual operating expenses after expense waivers are 1.20% for Class I shares and 1.45% for Class N shares per the March 1, 2021 prospectus. The Fund’s adviser has contractually agreed to reduce the Fund’s fees and/or absorb expenses of the Fund until at least March 1, 2022 to ensure that total annual Fund operating expenses after expense waiver and reimbursement (exclusive of any front-end or contingent deferred loads; brokerage fees and commissions; acquired fund fees and expenses; borrowing costs, such as interest and dividend expenses on securities sold short; taxes; and extraordinary expenses, such as litigation expenses) will not exceed 1.20% and 1.45% of average daily net assets attributable to Class I and Class N shares, respectively. This agreement may be terminated by the Fund’s Board of Trustees on 60 days’ written notice to the adviser. These fee waivers and expense reimbursements are subject to possible recoupment from the Fund in future years on a rolling three year basis (within the three years of when the amount was waived or reimbursed) if such recoupment can be achieved within the foregoing expense limits as well as any expense limitation that was in effect at the time the waiver or reimbursement was made. For performance information current to the most recent month-end, please call toll-free 1-855-733-3863. |
| (a) | Redwood AlphaFactor® Tactical International Fund commenced operations on November 2, 2017. |
| (b) | The Redwood AlphaFactor® Tactical International Index, the Fund advisor’s proprietary index, utilizes a quantitative, factor-based, investment methodology focused on large and middle capitalization stocks of both developed and emerging markets outside of the U.S. typically of companies with market capitalizations of greater than $2 billion. Investors cannot invest directly in an index or benchmark. Index returns are gross of any fees, brokerage commissions or other expenses of investing. |
| (c) | The Morgan Stanley Capital International All Country World Index Ex-U.S. (MSCI ACWI Ex-U.S.) is a market-capitalization-weighted index maintained by Morgan Stanley Capital International (MSCI). It is designed to provide a broad measure of stock performance throughout the world, with the exception of U.S.-based companies. The MSCI All Country World Index Ex-U.S. includes both developed and emerging markets. Investors cannot invest directly in an index or benchmark. Index returns are gross of any fees, brokerage commissions or other expenses of investing. |
Comparison of the Change in Value of a $10,000 Investment ^
| ^ | Performance shown is for Class I shares. The performance of the Fund’s other classes may be greater or less than the line shown due to differences in loads and fees paid by shareholders in different share classes. |
| PORTFOLIO COMPOSITION October 31, 2021 | ||
| % of Net Assets | ||
| Common Stock | 56.6% | |
| Short-Term Investments | 51.7% | |
| U.S. Government & Agencies | 11.0% | |
| Other Assets in Excess of Liabilities | (19.3)% | |
| Total | 100.0% | |
Please refer to the Schedule of Investments for a detailed listing of the Fund’s holdings.
| Redwood Systematic Macro Trend (“SMarT”) Fund |
| PORTFOLIO REVIEW |
| October 31, 2021 (Unaudited) |
The Fund’s performance figures* for the period ended October 31, 2021, compared to its benchmarks:
| Annualized Three | |||
| One Year | Years | Since Inception(a) | |
| Class I | 36.79% | 15.89% | 11.36% |
| Class N | 36.55% | 15.66% | 11.12% |
| MS Category Avg-Tactical Allocation Index (b) | 24.97% | 33.93% | 31.24% |
| Composite Index (c) | 15.36% | 12.19% | 9.46% |
| S&P 500 Total Return Index (d) | 42.91% | 21.48% | 17.75% |
| Bloomberg Barclays Aggregate Bond Index (e) | (0.48)% | 5.63% | 3.62% |
| * | The performance data quoted here represents past performance. Current performance may be lower or higher than the performance data quoted above. Past performance is no guarantee of future results. The investment return and principal value of an investment will fluctuate so that investor’s shares, when redeemed, may be worth more or less than their original cost. The returns shown do not reflect the deduction of taxes that a shareholder would pay on Fund distributions or on the redemption of Fund shares. The Fund’s total annual operating expenses after expense waivers are 1.32% for Class I shares and 1.57% for Class N shares per the March 1, 2021 prospectus. The Fund’s adviser has contractually agreed to reduce the Fund’s fees and/or absorb expenses of the Fund until at least March 1, 2022 to ensure that total annual Fund operating expenses after expense waiver and reimbursement (exclusive of any front-end or contingent deferred loads; brokerage fees and commissions; acquired fund fees and expenses; borrowing costs, such as interest and dividend expenses on securities sold short; taxes; and extraordinary expenses, such as litigation expenses) will not exceed 1.30% and 1.55% of average daily net assets attributable to Class I and Class N shares, respectively. This agreement may be terminated by the Fund’s Board of Trustees on 60 days’ written notice to the adviser. These fee waivers and expense reimbursements are subject to possible recoupment from the Fund in future years on a rolling three year basis (within the three years of when the amount was waived or reimbursed) if such recoupment can be achieved within the foregoing expense limits as well as any expense limitation that was in effect at the time the waiver or reimbursement was made. For performance information current to the most recent month-end, please call toll-free 1-855-733-3863. |
| (a) | Redwood Systematic Macro Trend (“SMarT”) Fund commenced operations on November 2, 2017. |
| (b) | The MS Category Avg-Tactical Allocation Index, Tactical asset allocation strategy is the process by which the asset of a fund is changed on a short-term basis to take advantage of perceived differences in relative values of the various asset classes. The MS Category Avg–Tactical Allocation Index is the average of all funds categorized as Tactical Allocation by Morningstar. Investors cannot invest directly in an index or benchmark. Index returns are gross of any fees, brokerage commissions or other expenses of investing. |
| (c) | The Composite Index represents a blend of 40% S&P 500 Total Return Index and 60% Bloomberg Barclays Global Aggregate Bond Index. The Composite Index has comparable return characteristics as the Fund and shows how the Fund’s performance directly compares to a blend of the returns of broad-based indices widely recognized in the industry. Investors cannot invest directly in an index or benchmark. Index returns are gross of any fees, brokerage commissions or other expenses of investing. |
| (d) | Standard and Poor’s 500 Total Return Index is a capitalization-weighted index of 500 stocks. The index is designed to measure performance of the broad domestic economy through changes in the aggregate market value of 500 stocks representing all major industries. Investors cannot invest directly in an index or benchmark. Index returns are gross of any fees, brokerage commissions or other expenses of investing. |
| (e) | The Bloomberg Barclays Aggregate Bond Index is a measure of global investment grade debt from twenty-four local currency markets. This multi-currency benchmark includes treasury, government-related, corporate, and securitized fixed-rate bonds from both developed and emerging market issuers. Investors cannot invest directly in an index or benchmark. Index returns are gross of any fees, brokerage commissions or other expenses of investing. |
Comparison of the Change in Value of a $10,000 Investment^
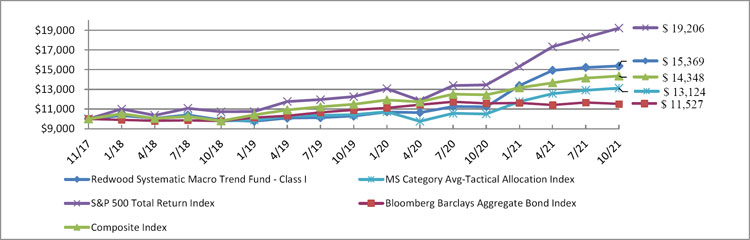
| ^ | Performance shown is for Class I shares. The performance of the Fund’s other classes may be greater or less than the line shown due to differences in loads and fees paid by shareholders in different share classes. |
| PORTFOLIO COMPOSITION October 31, 2021 | ||
| % of Net Assets | ||
| Common Stock | 47.2% | |
| Short-Term Investments | 25.4% | |
| U.S. Government & Agencies | 13.5% | |
| Exchange-Traded Funds | 12.0% | |
| Open End Funds | 0.1% | |
| Other/Cash and Other Assets Less Liabilities | 1.8% | |
| Total | 100.0% | |
Please refer to the Schedule of Investments for a detailed listing of the Fund’s holdings.
| REDWOOD MANAGED VOLATILITY FUND |
| SCHEDULE OF INVESTMENTS |
| October 31, 2021 |
| Principal | Coupon Rate | |||||||||||||
| Amount ($) | (%) | Maturity | Fair Value | |||||||||||
| CONVERTIBLE BONDS — 0.0% (a) | ||||||||||||||
| STEEL — 0.0%(a) | ||||||||||||||
| 17,000 | Cleveland-Cliffs, Inc. | 1.5000 | 01/15/25 | $ | 52,982 | |||||||||
| TOTAL CONVERTIBLE BONDS (Cost $41,834) | 52,982 | |||||||||||||
| CORPORATE BONDS — 3.3% | ||||||||||||||
| AEROSPACE & DEFENSE — 0.0%(a) | ||||||||||||||
| 115,000 | TransDigm, Inc. | 6.3750 | 06/15/26 | 119,025 | ||||||||||
| AUTOMOTIVE — 0.2% | ||||||||||||||
| 115,000 | American Axle & Manufacturing, Inc. | 6.2500 | 03/15/26 | 118,306 | ||||||||||
| 111,000 | Ford Motor Company | 4.3460 | 12/08/26 | 118,811 | ||||||||||
| 115,000 | Goodyear Tire & Rubber Company (The) | 5.0000 | 05/31/26 | 117,875 | ||||||||||
| 354,992 | ||||||||||||||
| BANKING — 0.0% (a) | ||||||||||||||
| 113,000 | CIT Group, Inc. | 5.0000 | 08/15/22 | 116,673 | ||||||||||
| BIOTECH & PHARMA — 0.1% | ||||||||||||||
| 112,000 | Bausch Health Companies, Inc.(b) | 7.0000 | 01/15/28 | 113,610 | ||||||||||
| 118,000 | Teva Pharmaceutical Finance Company BV Series 2 | 3.6500 | 11/10/21 | 118,066 | ||||||||||
| 231,676 | ||||||||||||||
| CABLE & SATELLITE — 0.2% | ||||||||||||||
| 113,000 | CCO Holdings, LLC / CCO Holdings Capital(b) | 5.0000 | 02/01/28 | 117,661 | ||||||||||
| 110,000 | DISH DBS Corporation | 7.3750 | 07/01/28 | 115,775 | ||||||||||
| 110,000 | Sirius XM Radio, Inc.(b) | 5.5000 | 07/01/29 | 118,801 | ||||||||||
| 352,237 | ||||||||||||||
| CHEMICALS — 0.1% | ||||||||||||||
| 111,000 | Avient Corporation | 5.2500 | 03/15/23 | 116,411 | ||||||||||
| 39,000 | Olin Corporation | 5.5000 | 08/15/22 | 40,239 | ||||||||||
| 156,650 | ||||||||||||||
| COMMERCIAL SUPPORT SERVICES — 0.0% (a) | ||||||||||||||
| 37,000 | RR Donnelley & Sons Company | 8.2500 | 07/01/27 | 43,336 | ||||||||||
The accompanying notes are an integral part of these financial statements
| REDWOOD MANAGED VOLATILITY FUND |
| SCHEDULE OF INVESTMENTS (Continued) |
| October 31, 2021 |
| Principal | Coupon Rate | |||||||||||||
| Amount ($) | (%) | Maturity | Fair Value | |||||||||||
| CORPORATE BONDS — 3.3% (Continued) | ||||||||||||||
| CONTAINERS & PACKAGING — 0.2% | ||||||||||||||
| 112,000 | Ball Corporation | 4.0000 | 11/15/23 | $ | 117,600 | |||||||||
| 105,000 | Pactiv, LLC B | 7.9500 | 12/15/25 | 117,206 | ||||||||||
| 93,000 | Sealed Air Corporation(b) | 6.8750 | 07/15/33 | 119,405 | ||||||||||
| 354,211 | ||||||||||||||
| ELECTRIC UTILITIES — 0.2% | ||||||||||||||
| 117,000 | Calpine Corporation(b) | 5.1250 | 03/15/28 | 116,561 | ||||||||||
| 87,000 | FirstEnergy Corporation | 7.3750 | 11/15/31 | 118,738 | ||||||||||
| 116,000 | PG&E Corporation | 5.0000 | 07/01/28 | 120,786 | ||||||||||
| 171,000 | Talen Energy Supply, LLC | 6.5000 | 06/01/25 | 104,030 | ||||||||||
| 115,000 | Vistra Operations Company, LLC(b) | 5.5000 | 09/01/26 | 118,559 | ||||||||||
| 578,674 | ||||||||||||||
| ELECTRICAL EQUIPMENT — 0.0%(a) | ||||||||||||||
| 106,000 | WESCO Distribution, Inc.(b) | 7.2500 | 06/15/28 | 117,041 | ||||||||||
| ENTERTAINMENT CONTENT — 0.1% | ||||||||||||||
| 180,000 | Diamond Sports Group, LLC / Diamond Sports Finance(b) | 5.3750 | 08/15/26 | 102,061 | ||||||||||
| 104,000 | Liberty Interactive, LLC | 8.5000 | 07/15/29 | 116,170 | ||||||||||
| 117,000 | Univision Communications, Inc.(b) | 5.1250 | 02/15/25 | 118,901 | ||||||||||
| 337,132 | ||||||||||||||
| FOOD — 0.1% | ||||||||||||||
| 115,000 | Lamb Weston Holdings, Inc.(b) | 4.6250 | 11/01/24 | 117,950 | ||||||||||
| 113,000 | Post Holdings, Inc.(b) | 5.7500 | 03/01/27 | 117,379 | ||||||||||
| 235,329 | ||||||||||||||
| FORESTRY, PAPER & WOOD PRODUCTS — 0.0%(a) | ||||||||||||||
| 118,000 | Louisiana-Pacific Corporation(b) | 3.6250 | 03/15/29 | 118,861 | ||||||||||
| HEALTH CARE FACILITIES & SERVICES — 0.1% | ||||||||||||||
| 115,000 | DaVita, Inc.(b) | 4.6250 | 06/01/30 | 115,714 | ||||||||||
| 103,000 | HCA, Inc. | 5.8750 | 02/15/26 | 117,420 | ||||||||||
| 104,000 | Tenet Healthcare Corporation | 6.8750 | 11/15/31 | 119,210 | ||||||||||
| 352,344 | ||||||||||||||
| HOME & OFFICE PRODUCTS — 0.0% (a) | ||||||||||||||
| 112,000 | Newell Brands, Inc. | 4.3500 | 04/01/23 | 116,747 | ||||||||||
The accompanying notes are an integral part of these financial statements
| REDWOOD MANAGED VOLATILITY FUND |
| SCHEDULE OF INVESTMENTS (Continued) |
| October 31, 2021 |
| Principal | Coupon Rate | |||||||||||||
| Amount ($) | (%) | Maturity | Fair Value | |||||||||||
| CORPORATE BONDS — 3.3% (Continued) | ||||||||||||||
| HOME CONSTRUCTION — 0.1% | ||||||||||||||
| 40,000 | Beazer Homes USA, Inc. B | 6.7500 | 03/15/25 | $ | 41,350 | |||||||||
| 113,000 | Toll Brothers Finance Corporation B | 4.3750 | 04/15/23 | 116,673 | ||||||||||
| 158,023 | ||||||||||||||
| HOUSEHOLD PRODUCTS — 0.0% (a) | ||||||||||||||
| 111,000 | Avon Products, Inc. | 7.0000 | 03/15/23 | 117,105 | ||||||||||
| INSURANCE — 0.1% | ||||||||||||||
| 119,000 | Genworth Holdings, Inc. | 4.8000 | 02/15/24 | 121,815 | ||||||||||
| 42,000 | MBIA, Inc. | 6.6250 | 10/01/28 | 43,234 | ||||||||||
| 111,000 | Radian Group, Inc. | 4.5000 | 10/01/24 | 117,799 | ||||||||||
| 282,848 | ||||||||||||||
| INTERNET MEDIA & SERVICES — 0.0%(a) | ||||||||||||||
| 101,000 | Netflix, Inc.(b) | 4.8750 | 06/15/30 | 118,822 | ||||||||||
| LEISURE FACILITIES & SERVICES — 0.2% | ||||||||||||||
| 39,000 | Carnival Corporation | 6.6500 | 01/15/28 | 40,999 | ||||||||||
| 107,000 | MGM Resorts International | 5.7500 | 06/15/25 | 115,694 | ||||||||||
| 115,000 | Royal Caribbean Cruises Ltd. | 5.2500 | 11/15/22 | 118,018 | ||||||||||
| 109,000 | Yum! Brands, Inc.(b) | 7.7500 | 04/01/25 | 116,052 | ||||||||||
| 390,763 | ||||||||||||||
| METALS & MINING — 0.0%(a) | ||||||||||||||
| 117,000 | Freeport-McMoRan, Inc. | 3.5500 | 03/01/22 | 117,360 | ||||||||||
| OIL & GAS PRODUCERS — 0.3% | ||||||||||||||
| 116,000 | Antero Resources Corporation | 5.0000 | 03/01/25 | 118,465 | ||||||||||
| 110,000 | Apache Corporation | 4.8750 | 11/15/27 | 119,490 | ||||||||||
| 39,000 | Cheniere Energy, Inc.(b) | 4.6250 | 10/15/28 | 40,948 | ||||||||||
| 73,000 | Cheniere Energy, Inc. | 4.6250 | 10/15/28 | 76,646 | ||||||||||
| 115,000 | EQM Midstream Partners, L.P. | 4.0000 | 08/01/24 | 119,456 | ||||||||||
| 108,000 | Murphy Oil Corporation | 7.0500 | 05/01/29 | 122,191 | ||||||||||
| 115,000 | New Fortress Energy, Inc.(b) | 6.7500 | 09/15/25 | 112,162 | ||||||||||
| 108,000 | Occidental Petroleum Corporation | 5.5500 | 03/15/26 | 119,340 | ||||||||||
| 87,000 | Ovintiv, Inc. | 8.1250 | 09/15/30 | 119,504 | ||||||||||
| 948,202 | ||||||||||||||
The accompanying notes are an integral part of these financial statements
| REDWOOD MANAGED VOLATILITY FUND |
| SCHEDULE OF INVESTMENTS (Continued) |
| October 31, 2021 |
| Principal | Coupon Rate | |||||||||||||
| Amount ($) | (%) | Maturity | Fair Value | |||||||||||
| CORPORATE BONDS — 3.3% (Continued) | ||||||||||||||
| OIL & GAS SERVICES & EQUIPMENT — 0.1% | ||||||||||||||
| 134,000 | Nabors Industries, Inc. | 5.7500 | 02/01/25 | $ | 127,549 | |||||||||
| 147,000 | Transocean, Inc.(b) | 8.0000 | 02/01/27 | 112,473 | ||||||||||
| 240,022 | ||||||||||||||
| REAL ESTATE INVESTMENT TRUSTS — 0.2% | ||||||||||||||
| 114,000 | Iron Mountain, Inc.(b) | 4.8750 | 09/15/27 | 117,777 | ||||||||||
| 116,000 | iStar, Inc. | 4.2500 | 08/01/25 | 119,044 | ||||||||||
| 115,000 | Uniti Group, L.P. / Uniti Fiber Holdings Inc / CSL(b) | 7.1250 | 12/15/24 | 117,875 | ||||||||||
| 354,696 | ||||||||||||||
| REAL ESTATE SERVICES — 0.0%(a) | ||||||||||||||
| 113,000 | Realogy Group, LLC / Realogy Co-Issuer Corporation(b) | 4.8750 | 06/01/23 | 116,673 | ||||||||||
| RETAIL - CONSUMER STAPLES — 0.1% | ||||||||||||||
| 95,000 | New Albertsons, L.P. | 8.0000 | 05/01/31 | 116,901 | ||||||||||
| 125,000 | Rite Aid Corporation B | 7.7000 | 02/15/27 | 112,709 | ||||||||||
| 35,000 | Safeway, Inc. | 7.2500 | 02/01/31 | 42,307 | ||||||||||
| 271,917 | ||||||||||||||
| RETAIL - DISCRETIONARY — 0.1% | ||||||||||||||
| 116,000 | Macy’s Retail Holdings, LLC | 3.6250 | 06/01/24 | 120,025 | ||||||||||
| 117,000 | Staples, Inc.(b) | 10.7500 | 04/15/27 | 111,924 | ||||||||||
| 231,949 | ||||||||||||||
| SEMICONDUCTORS — 0.0%(a) | ||||||||||||||
| 110,000 | Amkor Technology, Inc.(b) | 6.6250 | 09/15/27 | 117,123 | ||||||||||
| SPECIALTY FINANCE — 0.1% | ||||||||||||||
| 112,000 | Navient Corporation | 5.5000 | 01/25/23 | 117,242 | ||||||||||
| 111,000 | OneMain Finance Corporation | 5.6250 | 03/15/23 | 116,880 | ||||||||||
| 234,122 | ||||||||||||||
| STEEL — 0.0%(a) | ||||||||||||||
| 112,000 | United States Steel Corporation | 6.6500 | 06/01/37 | 118,901 | ||||||||||
| TECHNOLOGY HARDWARE — 0.1% | ||||||||||||||
| 93,000 | Dell, Inc. | 7.1000 | 04/15/28 | 119,997 | ||||||||||
| 40,000 | Pitney Bowes, Inc. | 4.6250 | 03/15/24 | 42,196 | ||||||||||
The accompanying notes are an integral part of these financial statements
| REDWOOD MANAGED VOLATILITY FUND |
| SCHEDULE OF INVESTMENTS (Continued) |
| October 31, 2021 |
| Principal | Coupon Rate | |||||||||||||
| Amount ($) | (%) | Maturity | Fair Value | |||||||||||
| CORPORATE BONDS — 3.3% (Continued) | ||||||||||||||
| TECHNOLOGY HARDWARE — 0.1% (Continued) | ||||||||||||||
| 114,000 | Xerox Corporation | 3.8000 | 05/15/24 | $ | 118,560 | |||||||||
| 280,753 | ||||||||||||||
| TECHNOLOGY SERVICES — 0.1% | ||||||||||||||
| 100,000 | Sabre GLBL, Inc.(b) | 9.2500 | 04/15/25 | 115,566 | ||||||||||
| 107,000 | Unisys Corporation(b) | 6.8750 | 11/01/27 | 116,764 | ||||||||||
| 232,330 | ||||||||||||||
| TELECOMMUNICATIONS — 0.3% | ||||||||||||||
| 106,000 | CenturyLink, Inc. | 7.5000 | 04/01/24 | 116,468 | ||||||||||
| 115,000 | Frontier Communications Corporation(b) | 5.0000 | 05/01/28 | 117,013 | ||||||||||
| 96,000 | Sprint Corporation | 7.6250 | 03/01/26 | 115,200 | ||||||||||
| 116,000 | T-Mobile USA, Inc. | 4.0000 | 04/15/22 | 117,595 | ||||||||||
| 466,276 | ||||||||||||||
| TRANSPORTATION & LOGISTICS — 0.2% | ||||||||||||||
| 118,000 | American Airlines Group, Inc.(b) | 5.0000 | 06/01/22 | 118,443 | ||||||||||
| 117,000 | Delta Air Lines, Inc. | 3.6250 | 03/15/22 | 117,896 | ||||||||||
| 115,000 | United Airlines Holdings, Inc. | 5.0000 | 02/01/24 | 119,599 | ||||||||||
| 355,938 | ||||||||||||||
| TOTAL CORPORATE BONDS (Cost $8,797,378) | 8,738,751 | |||||||||||||
| U.S. GOVERNMENT & AGENCIES — 9.6% | ||||||||||||||
| U.S. TREASURY BILLS — 2.6% | ||||||||||||||
| 2,999,000 | United States Treasury Note | 0.8750 | 11/15/30 | 2,835,871 | ||||||||||
| 4,084,000 | United States Treasury Note | 1.6250 | 05/15/31 | 4,115,587 | ||||||||||
| 6,951,458 | ||||||||||||||
| U.S. TREASURY NOTES — 7.0% | ||||||||||||||
| 3,446,000 | United States Treasury Note | 3.1250 | 11/15/28 | 3,835,290 | ||||||||||
| 2,872,000 | United States Treasury Note | 2.6250 | 02/15/29 | 3,104,733 | ||||||||||
| 2,870,000 | United States Treasury Note | 2.3750 | 05/15/29 | 3,056,046 | ||||||||||
| 2,297,000 | United States Treasury Note | 1.5000 | 02/15/30 | 2,301,083 | ||||||||||
| 6,956,000 | United States Treasury Note | 0.6250 | 08/15/30 | 6,451,553 | ||||||||||
| 18,748,705 | ||||||||||||||
| TOTAL U.S. GOVERNMENT & AGENCIES (Cost $26,388,897) | 25,700,163 | |||||||||||||
The accompanying notes are an integral part of these financial statements
| REDWOOD MANAGED VOLATILITY FUND |
| SCHEDULE OF INVESTMENTS (Continued) |
| October 31, 2021 |
| Shares | Fair Value | |||||||
| SHORT-TERM INVESTMENTS — 51.5% | ||||||||
| MONEY MARKET FUNDS - 51.5% | ||||||||
| 137,588,718 | First American Government Obligations Fund, Class X, 0.03% (Cost $137,588,718)(c) | $ | 137,588,718 | |||||
| TOTAL INVESTMENTS - 64.4% (Cost $172,816,82 7) | $ | 172,080,614 | ||||||
| OTHER ASSETS IN EXCESS OF LIABILITIES - 35.6% | 95,216,139 | |||||||
| NET ASSETS - 100.0% | $ | 267,378,703 | ||||||
| LLC | - Limited Liability Company |
| LP | - Limited Partnership |
| LTD | - Limited Company |
| REIT | - Real Estate Investment Trust |
| (a) | Percentage rounds to less than 0.1%. |
| (b) | Security exempt from registration under Rule 144A or Section 4(2) of the Securities Act of 1933. The security may be resold in transactions exempt from registration, normally to qualified institutional buyers. As of October 31, 2021 the total market value of 144A securities is 3,062,119 or 1.1% of net assets. |
| (c) | Rate disclosed is the seven day effective yield as of October 31, 2021. |
The accompanying notes are an integral part of these financial statements
| Redwood Managed Volatility Fund |
| SCHEDULE OF INVESTMENTS (Continued) |
| October 31, 2021 |
CREDIT DEFAULT SWAP
| Notional | Upfront Premiums | Pay/Receive | Unrealized | ||||||||||||||||||||||
| Amount | Paid (Received) | Reference Entity (I) | Counterparty | Expiration Date | Fixed Rate | Fixed Rate | Value | Gain (Loss) | |||||||||||||||||
| $ | 92,000,000 | $ | (8,280,363 | ) | To Sell Protection - CDX HY | BNP | 12/20/2026 | Receive | 5.00% | $ | (8,676,019 | ) | $ | (395,656 | ) | ||||||||||
| CDSI S37 5Y PRC, pays | |||||||||||||||||||||||||
| Quarterly | |||||||||||||||||||||||||
| $ | (8,676,019 | ) | $ | (395,656 | ) | ||||||||||||||||||||
| (1) | If the Fund is a seller of protection and a credit event occurs, as defined under the terms of that particular swap agreement, the Fund will either (i) pay the buyer of protection an amount equal to the notional amount of the swap and take delivery of the referenced obligation or underlying securities comprising the referenced index or (ii) pay a net settlement amount in the form of cash or securities equal to the notional amount of the swap less the recovery value of the referenced obligation or underlying securities comprising of the referenced index. The swap itself does not have a credit rating, however the underlying holdings of the swap are comprised of non-investment grade entities, with ratings of B and BB. |
TOTAL RETURN SWAPS **
| Unrealized | ||||||||||||||||||
| Number of | Appreciation | |||||||||||||||||
| Security | Shares | Notional Value | Interest Rate Payable | Termination Date | Counterparty | (Depreciation) | ||||||||||||
| BlackRock High Yield Bond Portfolio - Institutional Shares | 9,231,479 | $ | 72,836,372 | 3-Mth USD_LIBOR + 185 bps | 4/13/2023 | Barclays | $ | (182,274 | ) | |||||||||
| BlackRock High Yield Bond Fund - Institutional Class | 12,340,900 | 97,369,699 | 3-Mth USD_LIBOR + 300 bps | 12/31/2022 | Goldman Sachs | (537,476 | ) | |||||||||||
| Mainstay MacKay High Yield Corporate Bond Fund - Institutional Class | 13,497,526 | 76,530,975 | 3-Mth USD_LIBOR + 185 bps | 4/13/2023 | Barclays | (640,483 | ) | |||||||||||
| Nuveen High Yield Municipal | 273,075 | 5,000,000 | 3-Mth USD_LIBOR + 150 bps | 9/29/2024 | Barclays | 10,466 | ||||||||||||
| Vanguard High Yield - Institutional Class | 6,400,543 | 38,275,245 | 3-Mth USD_LIBOR + 185 bps | 6/5/2023 | Barclays | (177,970 | ) | |||||||||||
| Total | $ | (1,527,737 | ) | |||||||||||||||
| ** | The swaps provide exposure to the total returns on the securities that are calculated on a daily basis. Under the terms of the swaps, the Advisor has the ability to periodically adjust the notional level of the swaps. In addition, the Fund will receive the total return on the securities, including dividends and provide a fee to the counterparty. The swaps are reset monthly. |
The accompanying notes are an integral part of these financial statements.
| REDWOOD MANAGED MUNICIPAL INCOME FUND |
| SCHEDULE OF INVESTMENTS |
| October 31, 2021 |
| Shares | Fair Value | |||||||
| OPEN END FUNDS — 5.4% | ||||||||
| FIXED INCOME - 5.4% | ||||||||
| 101,221 | American Century High-Yield Municipal Fund, Class I | $ | 1,040,549 | |||||
| 100,207 | BlackRock High Yield Municipal Fund, Institutional Class | 1,057,182 | ||||||
| 110,614 | Northern High Yield Municipal Fund | 998,843 | ||||||
| 109,648 | Nuveen High Yield Municipal Bond Fund, Class I | 2,007,645 | ||||||
| 108,635 | PIMCO High Yield Municipal Bond Fund, Institutional Class | 1,066,805 | ||||||
| 152,627 | Pioneer High Income Municipal Fund, Class Y | 1,120,281 | ||||||
| 71,353 | Western Asset Municipal High Income Fund, Class I | 1,021,060 | ||||||
| 8,312,365 | ||||||||
| TOTAL OPEN END FUNDS (Cost $8, 203,483) | 8,312,365 | |||||||
| SHORT-TERM INVESTMENTS — 94.7% | ||||||||
| MONEY MARKET FUNDS - 94.7% | ||||||||
| 102,080,066 | BlackRock Liquidity Funds MuniCash, Institutional Class, 0.01%(a) | 102,090,276 | ||||||
| 11,674,595 | First American Government Obligations Fund, Class X, 0.03%(a) | 11,674,595 | ||||||
| 7,647,150 | JPMorgan Municipal Money Market Fund, Agency Class, 0.01%(a) | 7,647,150 | ||||||
| 24,284,175 | JPMorgan Tax Free Money Market Fund, Agency Class, 0.01%(a) | 24,284,175 | ||||||
| TOTAL MONEY MARKET FUNDS (Cost $145,696,348) | 145,696,196 | |||||||
| TOTAL SHORT-TERM INVESTMENTS (Cost $145,696,348) | 145,696,196 | |||||||
| TOTAL INVESTMENTS - 100.1% (Cost $153, 899,831) | $ | 154,008,561 | ||||||
| LIABILITIES IN EXCESS OF OTHER ASSETS - (0.1)% | (109,402 | ) | ||||||
| NET ASSETS - 100.0% | $ | 153,899,159 | ||||||
| (a) | Rate disclosed is the seven day effective yield as of October 31, 2021. |
The accompanying notes are an integral part of these financial statements
| REDWOOD ALPHAFACTOR® TACTICAL INTERNATIONAL FUND |
| SCHEDULE OF INVESTMENTS |
| October 31, 2021 |
| Shares | Fair Value | |||||||
| COMMON STOCKS — 56.6% | ||||||||
| Brazil - 7.6% | ||||||||
| 799,385 | Cia Energetica de Minas Gerais | $ | 1,826,517 | |||||
| 436,446 | Cia Siderurgica Nacional S.A. | 1,773,812 | ||||||
| 400,898 | CPFL Energia S.A. | 1,869,009 | ||||||
| 362,489 | Petroleo Brasileiro S.A. | 1,785,115 | ||||||
| 218,088 | Suzano S.A.(a) | 1,900,774 | ||||||
| 233,563 | Telefonica Brasil S.A. | 1,885,658 | ||||||
| 934,255 | TIM S.A. | 1,852,931 | ||||||
| 143,093 | Vale S.A. | 1,822,614 | ||||||
| 14,716,430 | ||||||||
| Canada - 8.9% | ||||||||
| 21,102 | CGI, Inc.(a) | 1,882,165 | ||||||
| 42,199 | Dollarama, Inc. | 1,904,410 | ||||||
| 62,863 | Empire Company Ltd., Class A | 1,876,432 | ||||||
| 17,621 | George Weston Ltd. | 1,900,916 | ||||||
| 25,168 | Loblaw Companies Ltd. | 1,889,910 | ||||||
| 233,734 | Lundin Mining Corporation | 2,030,830 | ||||||
| 37,819 | Metro, Inc. | 1,899,874 | ||||||
| 74,380 | Quebecor, Inc., Class B | 1,892,578 | ||||||
| 23,848 | West Fraser Timber Company Ltd.(a) | 1,906,416 | ||||||
| 17,183,531 | ||||||||
| Cayman Islands - 1.1% | ||||||||
| 164,716 | Vipshop Holdings Ltd. - ADR (a) | 1,838,230 | ||||||
| China - 2.0% | ||||||||
| 5,373,408 | Bank of China Ltd., H Shares(b) | 1,899,573 | ||||||
| 1,276,067 | COSCO SHIPPING Holdings Company Ltd.(a) | 1,981,590 | ||||||
| 3,881,163 | ||||||||
| Denmark - 0.3% | ||||||||
| 44,375 | AP Moller -Maersk A/S - ADR | 643,438 | ||||||
| Indonesia - 0.3% | ||||||||
| 24,071 | Telekomunikasi Indonesia Persero Tbk P.T. - ADR | 632,827 | ||||||
The accompanying notes are an integral part of these financial statements
| REDWOOD ALPHAFACTOR® TACTICAL INTERNATIONAL FUND |
| SCHEDULE OF INVESTMENTS (Continued) |
| October 31, 2021 |
| Shares | Fair Value | |||||||
| COMMON STOCKS — 56.6% (Continued) | ||||||||
| Israel -1.0% | ||||||||
| 15,761 | Check Point Software Technologies Ltd.(a) | $ | 1,885,016 | |||||
| Japan - 14.7% | ||||||||
| 49,941 | Aisin Seiki Company Ltd. | 1,824,199 | ||||||
| 110,682 | Astellas Pharma, Inc. | 1,860,797 | ||||||
| 63,756 | Capcom Company Ltd. | 1,710,970 | ||||||
| 15,868 | Daito Trust Construction Company Ltd. | 1,964,974 | ||||||
| 52,560 | Dentsu Group, Inc. | 1,922,168 | ||||||
| 67,154 | ITOCHU Corporation | 1,909,347 | ||||||
| 59,943 | KDDI Corporation | 1,854,671 | ||||||
| 83,965 | Mitsui & Company Ltd. | 1,908,680 | ||||||
| 35,976 | NEC Corporation | 1,836,267 | ||||||
| 67,217 | Nippon Telegraph & Telephone Corporation | 1,879,306 | ||||||
| 371,676 | Nissan Motor Company Ltd.(a) | 1,882,093 | ||||||
| 145,165 | Panasonic Corporation | 1,772,789 | ||||||
| 200,276 | Ricoh Company Ltd. | 1,942,603 | ||||||
| 130,684 | Sumitomo Dainippon Pharma Company Ltd. | 1,841,782 | ||||||
| 68,087 | Takeda Pharmaceutical Company Ltd. | 1,912,585 | ||||||
| 28,023,231 | ||||||||
| Korea (Republic Of) - 4.9% | ||||||||
| 25,835 | Kia Motors Corporation | 1,881,442 | ||||||
| 21,783 | Korea Shipbuilding & Offshore Engineering Company(a) | 1,920,028 | ||||||
| 112,500 | LG Display Company Ltd.(a) | 1,896,581 | ||||||
| 7,381 | POSCO | 1,869,647 | ||||||
| 21,890 | S-Oil Corporation(b) | 1,920,093 | ||||||
| 9,487,791 | ||||||||
| Mexico - 0.3% | ||||||||
| 35,283 | America Movil S.A.B. de C.V., Class L - ADR | 627,333 | ||||||
| Norway - 0.6% | ||||||||
| 24,284 | Equinor ASA - ADR | 617,542 | ||||||
| 38,878 | Telenor ASA - ADR | 618,160 | ||||||
| 1,235,702 | ||||||||
The accompanying notes are an integral part of these financial statements
| REDWOOD ALPHAFACTOR® TACTICAL INTERNATIONAL FUND |
| SCHEDULE OF INVESTMENTS (Continued) |
| October 31, 2021 |
| Shares | Fair Value | |||||||||||||
| COMMON STOCKS — 56.6% (Continued) | ||||||||||||||
| Singapore - 1.0% | ||||||||||||||
| 264,603 | Singapore Exchange Ltd. | $ | 1,899,412 | |||||||||||
| Sweden - 4.8% | ||||||||||||||
| 53,319 | Boliden A.B. | 1,880,459 | ||||||||||||
| 84,369 | Electrolux A.B. | 1,914,598 | ||||||||||||
| 97,062 | Hennes & Mauritz A.B., Class B | 1,819,750 | ||||||||||||
| 47,537 | Lundin Energy A.B. | 1,877,458 | ||||||||||||
| 109,964 | Securitas A.B., B | 1,818,116 | ||||||||||||
| 9,310,381 | ||||||||||||||
| Taiwan Province Of China - 8.1% | ||||||||||||||
| 2,758,621 | AU Optronics Corporation | 1,904,653 | ||||||||||||
| 566,819 | Evergreen Marine Corp Taiwan Ltd. | 2,028,102 | ||||||||||||
| 3,250,929 | Innolux Corporation | 1,952,300 | ||||||||||||
| 128,690 | Novatek Microelectronics Corporation | 1,922,818 | ||||||||||||
| 105,655 | Realtek Semiconductor Corporation | 1,895,890 | ||||||||||||
| 883,404 | United Microelectronics Corporation | 1,842,510 | ||||||||||||
| 344,153 | Wan Hai Lines Ltd. | 1,980,131 | ||||||||||||
| 583,086 | Yang Ming Marine Transport Corporation(a) | 2,023,403 | ||||||||||||
| 15,549,807 | ||||||||||||||
| Thailand - 1.0% | ||||||||||||||
| 333,076 | Advanced Info Service PCL | 1,897,125 | ||||||||||||
| TOTAL COMMON STOCKS (Cost $109,925,953) | 108,811,416 | |||||||||||||
| Principal | Coupon Rate | |||||||||||||
| Amount ($) | (%) | Maturity | Fair Value | |||||||||||
| U.S. GOVERNMENT & AGENCIES — 11.0% | ||||||||||||||
| United States — 11.0% | ||||||||||||||
| 10,000,000 USD | United States Treasury Note | 1.3750 | 02/15/23 | 10,143,164 | ||||||||||
| 11,000,000 USD | United States Treasury Note | 1.5000 | 02/15/30 | 11,019,551 | ||||||||||
| 21,162,715 | ||||||||||||||
| TOTAL U.S. GOVERNMENT & AGENCIES (Cost $21,451,157) | 21,162,715 | |||||||||||||
The accompanying notes are an integral part of these financial statements
| REDWOOD ALPHAFACTOR® TACTICAL INTERNATIONAL FUND |
| SCHEDULE OF INVESTMENTS (Continued) |
| October 31, 2021 |
| Shares | Fair Value | |||||||
| SHORT-TERM INVESTMENTS — 51.7% | ||||||||
| MONEY MARKET FUNDS - 51.7% | ||||||||
| 93,232,506 | First American Government Obligations Fund, Class X, 0.03%(b) | $ | 93,232,506 | |||||
| 6,318,374 | Morgan Stanley Institutional Liquidity Funds - Prime Portfolio, Institutional Class, 0.06%(b) | 6,319,637 | ||||||
| TOTAL MONEY MARKET FUNDS (Cost $99,552,143) | 99,552,143 | |||||||
| TOTAL SHORT-TERM INVESTMENTS (Cost $99,552,143) | 99,552,143 | |||||||
| TOTAL INVESTMENTS - 119.3% (Cost $230,929,253) | $ | 229,526,274 | ||||||
| LIABILITIES IN EXCESS OF OTHER ASSETS - (19.3)% | (37,078,202 | ) | ||||||
| NET ASSETS - 100.0% | $ | 192,448,072 | ||||||
| A.B. | - Aktiebolag |
| ADR | - American Depositary Receipt |
| A/S | - Anonim Sirketi |
| LTD | - Limited Company |
| PLC | - Public Limited Company |
| PT | - Perseroan Terbatas |
| S/A | - Société Anonyme |
| (a) | Non-income producing security. |
| (b) | Rate disclosed is the seven day effective yield as of October 31, 2021. |
The accompanying notes are an integral part of these financial statements
| REDWOOD SYSTEMATIC MACRO TREND (“SMarT”) FUND |
| SCHEDULE OF INVESTMENTS (Continued) |
| October 31, 2021 |
| Principal | Coupon Rate | |||||||||||||
| Amount ($) | (%) | Maturity | Fair Value | |||||||||||
| U.S. GOVERNMENT & AGENCIES — 13.5% (Continued) | ||||||||||||||
| U.S. TREASURY NOTES — 11.2% | ||||||||||||||
| 1,954,000 | United States Treasury Note | 3.1250 | 11/15/28 | $ | 2,174,741 | |||||||||
| 1,628,000 | United States Treasury Note | 2.6250 | 02/15/29 | 1,759,925 | ||||||||||
| 1,630,000 | United States Treasury Note | 2.3750 | 05/15/29 | 1,735,663 | ||||||||||
| 10,003,000 | United States Treasury Note | 1.5000 | 02/15/30 | 10,020,779 | ||||||||||
| 3,944,000 | United States Treasury Note | 0.6250 | 08/15/30 | 3,657,983 | ||||||||||
| 19,349,091 | ||||||||||||||
| TOTAL U.S. GOVERNMENT & AGENCIES (Cost $24,072,486) | 23,291,479 | |||||||||||||
| Shares | Fair Value | |||||||||||||
| SHORT-TERM INVESTMENTS — 25.4% | ||||||||||||||
| MONEY MARKET FUNDS - 25.4% | ||||||||||||||
| 41,253,931 | First American Government Obligations Fund, Class X, 0.03%(c) | 41,253,932 | ||||||||||||
| 2,531,585 | Goldman Sachs Financial Square Government Fund, 0.03%(c) | 2,531,585 | ||||||||||||
| TOTAL MONEY MARKET FUNDS (Cost $43,785,517) | 43,785,517 | |||||||||||||
| TOTAL SHORT-TERM INVESTMENTS (Cost $43,785,517) | 43,785,517 | |||||||||||||
| TOTAL INVESTMENTS - 98.2% (Cost $152,078,921) | $ | 169,095,975 | ||||||||||||
| OTHER ASSETS IN EXCESS OF LIABILITIES - 1.8% | 3,160,096 | |||||||||||||
| NET ASSETS - 100.0% | $ | 172,256,071 | ||||||||||||
| ETF | - Exchange-Traded Fund |
| NV | - Naamioze Vennootschap |
| PLC | - Public Limited Company |
| REIT | - Real Estate Investment Trust |
| (a) | Non-income producing security. |
| (b) | Percentage rounds to less than 0.1%. |
| (c) | Rate disclosed is the seven day effective yield as of October 31, 2021. |
The accompanying notes are an integral part of these financial statements
| REDWOOD SYSTEMATIC MACRO TREND (“SMarT”) FUND |
| SCHEDULE OF INVESTMENTS |
| October 31, 2021 |
| Shares | Fair Value | |||||||
| COMMON STOCKS — 47.2% | ||||||||
| ADVERTISING & MARKETING - 1.3% | ||||||||
| 32,422 | Interpublic Group of Companies, Inc. | $ | 1,185,673 | |||||
| 16,367 | Omnicom Group, Inc. | 1,114,265 | ||||||
| 2,299,938 | ||||||||
| AEROSPACE & DEFENSE - 1.3% | ||||||||
| 3,306 | Lockheed Martin Corporation | 1,098,650 | ||||||
| 13,982 | Raytheon Technologies Corporation | 1,242,440 | ||||||
| 2,341,090 | ||||||||
| APPAREL & TEXTILE PRODUCTS - 0.6% | ||||||||
| 64,068 | Hanesbrands, Inc. | 1,091,719 | ||||||
| BANKING - 1.4% | ||||||||
| 7,666 | Bank of America Corporation | 366,281 | ||||||
| 5,060 | JPMorgan Chase & Company | 859,643 | ||||||
| 72,726 | People’s United Financial, Inc. | 1,246,524 | ||||||
| 2,472,448 | ||||||||
| BIOTECH & PHARMA - 3.1% | ||||||||
| 9,864 | AbbVie, Inc. | 1,131,105 | ||||||
| 16,506 | Gilead Sciences, Inc. | 1,070,909 | ||||||
| 3,184 | Johnson & Johnson | 518,610 | ||||||
| 15,580 | Merck & Company, Inc. | 1,371,819 | ||||||
| 1,577 | Organon & Company | 57,955 | ||||||
| 25,734 | Pfizer, Inc. | 1,125,605 | ||||||
| 5,276,003 | ||||||||
| CHEMICALS - 1.3% | ||||||||
| 18,892 | Dow, Inc. | 1,057,385 | ||||||
| 11,766 | LyondellBasell Industries N.V., Class A | 1,092,120 | ||||||
| 2,149,505 | ||||||||
| CONTAINERS & PACKAGING - 1.2% | ||||||||
| 92,724 | Amcor plc | 1,119,179 | ||||||
| 19,817 | International Paper Company | 984,310 | ||||||
| 2,103,489 | ||||||||
| DIVERSIFIED INDUSTRIALS - 0.6% | ||||||||
| 6,116 | 3M Company | 1,092,807 | ||||||
The accompanying notes are an integral part of these financial statements
| REDWOOD SYSTEMATIC MACRO TREND (“SMarT”) FUND |
| SCHEDULE OF INVESTMENTS (Continued) |
| October 31, 2021 |
| Shares | Fair Value | |||||||
| COMMON STOCKS — 47.2% (Continued) | ||||||||
| E-COMMERCE DISCRETIONARY - 1.3% | ||||||||
| 656 | Amazon.com, Inc.(a) | $ | 2,212,314 | |||||
| ELECTRIC UTILITIES - 3.4% | ||||||||
| 15,703 | Consolidated Edison, Inc. | 1,184,006 | ||||||
| 20,651 | Edison International | 1,299,568 | ||||||
| 30,674 | FirstEnergy Corporation | 1,181,869 | ||||||
| 15,478 | Pinnacle West Capital Corporation | 998,176 | ||||||
| 40,599 | PPL Corporation | 1,169,251 | ||||||
| 5,832,870 | ||||||||
| ENTERTAINMENT CONTENT - 0.2% | ||||||||
| 1,919 | Walt Disney Company (The)(a) | 324,445 | ||||||
| FOOD - 1.5% | ||||||||
| 18,996 | Kellogg Company | 1,164,455 | ||||||
| 33,088 | Kraft Heinz Company (The) | 1,187,528 | ||||||
| 2,351,983 | ||||||||
| FORESTRY, PAPER & WOOD PRODUCTS - 0.0%(b) | ||||||||
| 1,802 | Sylvamo Corporation(a) | 50,732 | ||||||
| HEALTH CARE FACILITIES & SERVICES - 0.6% | ||||||||
| 22,787 | Cardinal Health, Inc. | 1,089,446 | ||||||
| HOME & OFFICE PRODUCTS - 1.2% | ||||||||
| 24,526 | Leggett & Platt, Inc. | 1,149,043 | ||||||
| 47,105 | Newell Brands, Inc. | 1,078,233 | ||||||
| 2,227,276 | ||||||||
| HOUSEHOLD PRODUCTS - 0.3% | ||||||||
| 3,991 | Procter & Gamble Company (The) | 570,673 | ||||||
| INDUSTRIAL SUPPORT SERVICES - 0.7% | ||||||||
| 21,276 | Fastenal Company | 1,214,434 | ||||||
| INSURANCE - 1.4% | ||||||||
| 11,183 | Prudential Financial, Inc. | 1,230,689 | ||||||
The accompanying notes are an integral part of these financial statements
| REDWOOD SYSTEMATIC MACRO TREND (“SMarT”) FUND |
| SCHEDULE OF INVESTMENTS (Continued) |
| October 31, 2021 |
| Shares | Fair Value | |||||||
| COMMON STOCKS — 47.2% (Continued) | ||||||||
| INSURANCE - 1.4% (Continued) | ||||||||
| 44,427 | Unum Group | $ | 1,131,556 | |||||
| 2,362,245 | ||||||||
| INTERNET MEDIA & SERVICES - 1.9% | ||||||||
| 447 | Alphabet, Inc., Class A(a) | 1,323,531 | ||||||
| 3,479 | Meta Platforms, Inc., Class A(a) | 1,125,700 | ||||||
| 1,094 | Netflix, Inc.(a) | 755,199 | ||||||
| 3,204,430 | ||||||||
| LEISURE PRODUCTS - 0.7% | ||||||||
| 12,143 | Hasbro, Inc. | 1,162,814 | ||||||
| MEDICAL EQUIPMENT & DEVICES - 0.4% | ||||||||
| 1,084 | Thermo Fisher Scientific, Inc. | 686,248 | ||||||
| METALS & MINING - 0.6% | ||||||||
| 20,673 | Newmont Corporation | 1,116,342 | ||||||
| MULTI ASSET CLASS REIT - 0.7% | ||||||||
| 28,340 | Vornado Realty Trust | 1,208,134 | ||||||
| OIL & GAS PRODUCERS - 4.0% | ||||||||
| 21,680 | Exxon Mobil Corporation | 1,397,710 | ||||||
| 73,443 | Kinder Morgan, Inc. | 1,230,170 | ||||||
| 22,588 | ONEOK, Inc. | 1,437,048 | ||||||
| 18,112 | Valero Energy Corporation | 1,400,601 | ||||||
| 48,317 | Williams Companies, Inc. (The) | 1,357,225 | ||||||
| 6,822,754 | ||||||||
| RETAIL -CONSUMER STAPLES - 0.6% | ||||||||
| 23,802 | Walgreens Boots Alliance, Inc. | 1,119,170 | ||||||
| RETAIL -DISCRETIONARY - 1.2% | ||||||||
| 9,708 | Genuine Parts Company | 1,272,816 | ||||||
| 1,955 | Home Depot, Inc. (The) | 726,752 | ||||||
| 1,999,568 | ||||||||
The accompanying notes are an integral part of these financial statements
| REDWOOD SYSTEMATIC MACRO TREND (“SMarT”) FUND |
| SCHEDULE OF INVESTMENTS (Continued) |
| October 31, 2021 |
| Shares | Fair Value | |||||||
| COMMON STOCKS — 47.2% (Continued) | ||||||||
| SEMICONDUCTORS - 1.5% | ||||||||
| 2,399 | Broadcom, Inc. | $ | 1,275,476 | |||||
| 4,020 | NVIDIA Corporation | 1,027,793 | ||||||
| 2,140 | QUALCOMM, Inc. | 284,706 | ||||||
| 2,587,975 | ||||||||
| SOFTWARE - 2.8% | ||||||||
| 590 | Adobe, Inc.(a) | 383,712 | ||||||
| 11,300 | Microsoft Corporation | 3,747,306 | ||||||
| 2,165 | salesforce.com, Inc.(a) | 648,829 | ||||||
| 4,779,847 | ||||||||
| SPECIALTY REITS - 0.7% | ||||||||
| 25,058 | Iron Mountain, Inc. | 1,143,647 | ||||||
| TECHNOLOGY HARDWARE - 3.5% | ||||||||
| 23,468 | Apple, Inc. | 3,515,507 | ||||||
| 77,126 | Hewlett Packard Enterprise Company | 1,129,896 | ||||||
| 13,618 | Seagate Technology Holdings plc | 1,212,956 | ||||||
| 5,858,359 | ||||||||
| TECHNOLOGY SERVICES - 2.7% | ||||||||
| 8,498 | International Business Machines Corporation | 1,063,100 | ||||||
| 3,010 | Mastercard, Inc., Class A | 1,009,915 | ||||||
| 1,924 | PayPal Holdings, Inc.(a) | 447,503 | ||||||
| 5,247 | Visa, Inc., Class A | 1,111,157 | ||||||
| 55,248 | Western Union Company (The) | 1,006,619 | ||||||
| 4,638,294 | ||||||||
| TELECOMMUNICATIONS - 2.0% | ||||||||
| 43,559 | AT&T, Inc. | 1,100,300 | ||||||
| 98,105 | Lumen Technologies, Inc. | 1,163,526 | ||||||
| 21,667 | Verizon Communications, Inc. | 1,148,135 | ||||||
| 3,411,961 | ||||||||
| TOBACCO & CANNABIS - 1.2% | ||||||||
| 23,804 | Altria Group, Inc. | 1,049,994 | ||||||
| 11,544 | Philip Morris International, Inc. | 1,091,370 | ||||||
| 2,141,364 | ||||||||
The accompanying notes are an integral part of these financial statements
| REDWOOD SYSTEMATIC MACRO TREND (“SMarT”) FUND |
| SCHEDULE OF INVESTMENTS (Continued) |
| October 31, 2021 |
| Shares | Fair Value | |||||||||||||
| COMMON STOCKS — 47.2% (Continued) | ||||||||||||||
| TRANSPORTATION & LOGISTICS - 0.5% | ||||||||||||||
| 33,818 | Air Transport Services Group, Inc.(a) | $ | 841,730 | |||||||||||
| TRANSPORTATION EQUIPMENT - 0.8% | ||||||||||||||
| 14,585 | PACCAR, Inc. | 1,307,108 | ||||||||||||
| TOTAL COMMON STOCKS (Cost $71,459,176) | 81,093,162 | |||||||||||||
| EXCHANGE-TRADED FUNDS — 12.0% | ||||||||||||||
| EQUITY - 12.0% | ||||||||||||||
| 49,618 | iShares Core S&P Small-Cap ETF | 5,609,810 | ||||||||||||
| 113,170 | Schwab International Small-Cap Equity ETF | 4,860,652 | ||||||||||||
| 35,050 | Vanguard FTSE All World ex-US Small-Cap ETF | 4,836,199 | ||||||||||||
| 23,616 | Vanguard Small-Cap ETF | 5,419,636 | ||||||||||||
| 20,726,297 | ||||||||||||||
| TOTAL EXCHANGE-TRADED FUNDS (Cost $12,561,742) | 20,726,297 | |||||||||||||
| OPEN END FUNDS — 0.1% | ||||||||||||||
| FIXED INCOME - 0.1% | ||||||||||||||
| 9,606 | Nuveen California High Yield Municipal Bond Fund | 99,520 | ||||||||||||
| 5,461 | Nuveen High Yield Municipal Bond Fund, Class I | 100,000 | ||||||||||||
| 199,520 | ||||||||||||||
| TOTAL OPEN END FUNDS (Cost $200,000) | 199,520 | |||||||||||||
| Principal | Coupon Rate | |||||||||||||
| Amount ($) | (%) | Maturity | Fair Value | |||||||||||
| U.S. GOVERNMENT & AGENCIES — 13.5% | ||||||||||||||
| U.S. TREASURY BILLS — 2.3% | ||||||||||||||
| 1,701,000 | United States Treasury Note | 0.8750 | 11/15/30 | 1,608,475 | ||||||||||
| 2,316,000 | United States Treasury Note | 1.6250 | 05/15/31 | 2,333,913 | ||||||||||
| 3,942,388 | ||||||||||||||
The accompanying notes are an integral part of these financial statements
| Redwood AlphaFactor® Tactical International Fund |
| SCHEDULE OF INVESTMENTS (Continued) |
| October 31, 2021 |
TOTAL RETURN SWAPS *
| Appreciation | ||||||||||||||||||
| Security | Number of Shares | Notional Value | Interest Rate Payable | Termination Date | Counterparty | (Depreciation) | ||||||||||||
| AECC Aviation Power Co. Ltd. | 217,700 | $ | 2,022,172 | 1-Mth LIBOR +0.85% | 10/29/2022 | Barclays | $ | (9,587 | ) | |||||||||
| America Movil SAB de CV | 1,404,372 | 1,254,567 | 3-Mth LIBOR +0.50% | 10/29/2022 | Barclays | (114 | ) | |||||||||||
| Avic Eectromechinical Systems | 852,671 | 2,033,535 | 1-Mth LIBOR +0.85% | 10/29/2022 | Barclays | (8,220 | ) | |||||||||||
| AVIC Industry-Finance Holdings | 3,240,500 | 1,972,168 | 1-Mth LIBOR +0.85% | 10/29/2022 | Barclays | (2,336 | ) | |||||||||||
| A.P. Moller - Maersk A/S | 467 | 8,232,404 | 1-Mth LIBOR +0.40% | 6/30/2022 | Societe Generale | (601 | ) | |||||||||||
| Astra International Tbk Pt | 4,490,333 | 1,785,506 | 1-Mth LIBOR +1.10% | 6/30/2022 | Societe Generale | 126,880 | ||||||||||||
| Baoshan Iron & Steel Co. Ltd. | 1,718,800 | 1,925,400 | 1-Mth LIBOR +0.85% | 10/29/2022 | Barclays | (10,340 | ) | |||||||||||
| Bim Birlesik Magazalar A.S. | 151,818 | 1,091,001 | 1-Mth LIBOR +0.65% | 1/31/2022 | Goldman Sachs | (110,322 | ) | |||||||||||
| Changjiang Securities Co. Ltd. | 1,706,700 | 1,937,105 | 1-Mth LIBOR +0.85% | 6/30/2022 | Barclays | (6,189 | ) | |||||||||||
| China United Network Communications | 3,000,400 | 1,922,056 | 1-Mth LIBOR +0.85% | 10/29/2022 | Barclays | (9,092 | ) | |||||||||||
| Continental Ag | 16,218 | 1,647,275 | 1-Mth EURIBOR +0.35% | 6/30/2022 | Societe Generale | (953 | ) | |||||||||||
| Covestro Ag | 29,341 | 1,626,304 | 1-Mth EURIBOR +0.35% | 6/30/2022 | Societe Generale | (941 | ) | |||||||||||
| Daimler Ag | 19,605 | 1,681,773 | 1-Mth EURIBOR +0.35% | 6/30/2022 | Societe Generale | (973 | ) | |||||||||||
| Equinor Asa | 48,739 | 10,423,170 | 1-Mth NIBOR +0.35% | 6/30/2022 | Societe Generale | (616 | ) | |||||||||||
| Foxconn Industrial Internet Co. | 1,088,713 | 1,938,345 | 1-Mth LIBOR +0.85% | 10/29/2022 | Barclays | (7,369 | ) | |||||||||||
| Grupo Bimbo, S.A.B. De C.V. | 669,952 | 1,987,567 | 3-Mth LIBOR +0.50% | 1/13/2022 | Barclays | (181 | ) | |||||||||||
| Grupo Mexico SAB de CV | 420,163 | 1,847,470 | 3-Mth LIBOR +0.50% | 10/29/2022 | Barclays | (168 | ) | |||||||||||
| GN Store Nord A/S | 28,678 | 11,223,030 | 1-Mth LIBOR + 0.40% | 6/30/2022 | Societe Generale | (3,776 | ) | |||||||||||
| Hellenic Telecommunications Organization S.A. | 105,136 | 1,619,089 | 1-Mth EURIBOR +0.90% | 1/13/2022 | Barclays | (12,160 | ) | |||||||||||
| Industrial Securities Co. Ltd. | 1,328,000 | 1,898,509 | 1-Mth LIBOR +0.85% | 10/29/2022 | Barclays | (3,827 | ) | |||||||||||
| Inner Mongolio Junzeng Energy | 2,387,400 | 1,918,276 | 1-Mth LIBOR +0.85% | 10/29/2022 | Barclays | (4,416 | ) | |||||||||||
| InPost SA | 127,632 | 1,589,753 | 1-Mth EURIBOR +0.40% | 10/29/2022 | Barclays | (17,689 | ) | |||||||||||
| Inspur Electronic Information | 393,248 | 1,916,455 | 1-Mth LIBOR +0.85% | 10/29/2022 | Barclays | (6,535 | ) | |||||||||||
| Jeronimo Martins Sgp | 83,037 | 1,625,167 | 1-Mth EURIBOR +0.40% | 6/30/2022 | Societe Generale | 2,729 | ||||||||||||
| KBC Group NV | 20,390 | 1,642,618 | 1-Mth EURIBOR +0.40% | 1/13/2022 | Barclays | — | ||||||||||||
| Kering SA | 2,521 | 1,634,112 | 1-Mth ERIBOR +0.35% | 10/29/2022 | Barclays | — | ||||||||||||
| Koninklijke Ahold Delhaize N.V. | 57,631 | 1,621,160 | 1-Mth EURIBOR +0.40% | 1/13/2022 | Barclays | — | ||||||||||||
| MSCI ACWI U | 160,000 | 8,865,600 | 1-Mth LIBOR + 0.30% | 6/1/2022 | Barclays | (95,476 | ) | |||||||||||
| MSCI ACWI U | 170,000 | 9,419,700 | 1-Mth LIBOR + 0.30% | 6/1/2022 | Goldman Sachs | 279,613 | ||||||||||||
| Novartis Ag | 22,677 | 1,716,145 | 1-Mth LIBOR +0.40% | 6/30/2022 | Societe Generale | (939 | ) | |||||||||||
| Oriba Advance Ahold SAB de CV | 723,141 | 1,883,376 | 3-Mth LIBOR +0.50% | 10/29/2022 | Barclays | 247 | ||||||||||||
| Shaanxi Coal Industry Co. Ltd. | 969,800 | 1,904,105 | 1-Mth LIBOR +0.85% | 10/29/2022 | Barclays | (8,242 | ) | |||||||||||
| Shanxi Taigang Stainless Steel | 1,620,200 | 1,957,040 | 1-Mth LIBOR +0.85% | 10/29/2022 | Barclays | (7,523 | ) | |||||||||||
| Telefonica SA | 431,000 | 1,622,500 | 1-Mth EURIBOR +0.35% | 10/29/2022 | Barclays | — | ||||||||||||
| Telenor Asa | 77,625 | 10,356,469 | 1-Mth NIBOR +0.35% | 6/30/2022 | Societe Generale | (612 | ) | |||||||||||
| Telkom Indonesia Persero Tbk P | 4,789,688 | 1,257,325 | 1-Mth LIBOR +1.10% | 6/30/2022 | Societe Generale | 23,246 | ||||||||||||
| Top Glove Corp Bhd | 3,045,100 | 1,999,717 | 1-Mth LIBOR +0.85% | 10/29/2022 | Barclays | 445 | ||||||||||||
| United Tractors TBK | 1,171,391 | 2,073,082 | 1-Mth EURIBOR +1.10% | 6/30/2022 | Societe Generale | (114,839 | ) | |||||||||||
| Voestalpine Ag | 50,483 | 1,657,862 | 1-Mth EURIBOR +0.40% | 10/29/2022 | Barclays | — | ||||||||||||
| Wolters Kluwer N.V. | 17,802 | 1,613,573 | 1-Mth EURIBOR +0.40% | 1/13/2022 | Barclays | — | ||||||||||||
| Wartsila Oyj Abp | 136,027 | 1,631,644 | 1-Mth EURIBOR +0.40% | 10/29/2022 | Barclays | — | ||||||||||||
| Yara International Asa | 36,834 | 16,244,545 | 1-Mth NIBOR +0.35% | 6/30/2022 | Societe Generale | (960 | ) | |||||||||||
| Total | $ | (11,836 | ) | |||||||||||||||
| * | The swaps provide exposure to the total returns on the securities that are calculated on a daily basis. Under the terms of the swaps, the Advisor has the ability to periodically adjust the notional level of the swaps. In addition, the Fund will receive the total return on the securities, including dividends and provide a fee to the counterparty. The swaps do not reset; payments only occur at termination. |
The accompanying notes are an integral part of these financial statements.
| Redwood Systematic Macro Trend (“SMarT”) Fund |
| SCHEDULE OF INVESTMENTS (Continued) |
| October 31, 2021 |
Total Return Swaps *
| Unrealized | ||||||||||||||||
| Appreciation | ||||||||||||||||
| Security | Number of Shares | Notional Value | Interest Rate Payable | Termination Date | Counterparty | (Depreciation) | ||||||||||
| iShares IBOXX High Yield Corporate Bond | 143,884 | $ | 12,588,411 | 1-Mth LIBOR + 30 bps | 4/11/2022 | Barclays | $ | (42,650 | ) | |||||||
| iShares Preferred & Income - Institutional Class | 235,249 | 9,130,014 | 1-Mth LIBOR + 40 bps | 4/11/2022 | Barclays | 163,298 | ||||||||||
| SPDR BBG BARC Convertible - Institutional Class | 219,762 | 18,756,687 | 1-Mth LIBOR + 40 bps | 4/11/2022 | Barclays | 590,844 | ||||||||||
| Total | $ | 711,492 | ||||||||||||||
| * | The swaps provide exposure to the total returns on the securities that are calculated on a daily basis. Under the terms of the swaps, the Advisor has the ability to periodically adjust the notional level of the swaps. In addition, the Fund will receive the total return on the securities, including dividends and provide a fee to the counterparty. The swaps are reset monthly. |
The accompanying notes are an integral part of these financial statements.
| Redwood Funds |
| STATEMENTS OF ASSETS AND LIABILITIES |
| October 31, 2021 |
| Redwood Managed | Redwood Managed | Redwood AlphaFactor® | Redwood Systematic | |||||||||||||
| Volatility Fund | Municipal Income Fund | Tactical International Fund | Macro Trend “SMarT” Fund | |||||||||||||
| Assets: | ||||||||||||||||
| Investment Securities: | ||||||||||||||||
| Investments, at Cost | $ | 172,816,827 | $ | 153,899,831 | $ | 230,929,253 | $ | 152,078,921 | ||||||||
| Investments, at Fair Value | 172,080,614 | 154,008,561 | 229,526,274 | 169,095,975 | ||||||||||||
| Cash | 91,230,462 | * | 300 | 8,455,768 | * | 2,064,085 | ||||||||||
| Receivable for securities sold | — | — | 46,147,832 | 6,636,811 | ||||||||||||
| Unrealized Appreciation on Swap Contracts | 10,466 | — | 433,160 | 754,142 | ||||||||||||
| Deposit at Broker for open Swap Contracts | 5,303,274 | — | — | 22,500 | ||||||||||||
| Receivable for Fund Shares Sold | 336,722 | 226,885 | 381,305 | 362,590 | ||||||||||||
| Dividends and Interest Receivable | 1,153,922 | 36,708 | 2,855,967 | 272,627 | ||||||||||||
| Prepaid Expenses and Other Assets | 22,107 | 17,586 | 19,158 | 18,672 | ||||||||||||
| Total Assets | 270,137,567 | 154,290,040 | 287,819,464 | 179,227,402 | ||||||||||||
| Liabilities: | ||||||||||||||||
| Payable for Investments Purchased | — | 21,912 | 92,446,392 | 6,683,585 | ||||||||||||
| Distribution (12b-1) Fees Payable | 364 | — | — | — | ||||||||||||
| Swap Interest Payable | — | — | 2,150,441 | — | ||||||||||||
| Unrealized Depreciation on Swap Contracts | 1,933,859 | — | 444,996 | 42,650 | ||||||||||||
| Investment Advisory Fees Payable | 286,016 | 98,590 | 148,647 | 133,489 | ||||||||||||
| Payable for Fund Shares Redeemed | 392,057 | 168,505 | 27,020 | 18,613 | ||||||||||||
| Payable to Related Parties | 49,395 | 33,715 | 29,482 | 24,085 | ||||||||||||
| Accrued Expenses and Other Liabilities | 97,173 | 68,159 | 84,414 | 68,909 | ||||||||||||
| Total Liabilities | 2,758,864 | 390,881 | 95,331,392 | 6,971,331 | ||||||||||||
| Net Assets | $ | 267,378,703 | $ | 153,899,159 | $ | 192,488,072 | $ | 172,256,071 | ||||||||
| Class I Net Assets | $ | 90,596,938 | $ | 153,899,141 | $ | 192,488,054 | $ | 172,256,050 | ||||||||
| Shares of Beneficial Interest Outstanding (no par value; unlimited shares authorized) | 6,348,367 | 9,389,147 | 11,200,911 | 8,574,950 | ||||||||||||
| Net Asset Value (Net Assets/Shares Outstanding), Offering and Redemption Price Per Share | $ | 14.27 | $ | 16.39 | $ | 17.19 | $ | 20.09 | ||||||||
| Class N Net Assets | $ | 1,657,497 | $ | 18 | $ | 18 | $ | 21 | ||||||||
| Shares of Beneficial Interest Outstanding (no par value; unlimited shares authorized) | 114,653 | 1 | 1 | 1 | ||||||||||||
| Net Asset Value (Net Assets/Shares Outstanding), Offering and Redemption Price Per Share | $ | 14.46 | $ | 17.05 | ** | $ | 17.18 | ** | $ | 20.33 | ** | |||||
| Class Y Net Assets | $ | 175,124,268 | ||||||||||||||
| Shares of Beneficial Interest Outstanding (no par value; unlimited shares authorized) | 12,142,556 | |||||||||||||||
| Net Asset Value (Net Assets/Shares Outstanding), Offering and Redemption Price Per Share | $ | 14.42 | ||||||||||||||
| Net Assets Consist Of: | ||||||||||||||||
| Paid-in-Capital | $ | 302,414,182 | $ | 146,286,884 | $ | 172,877,281 | $ | 142,013,466 | ||||||||
| Accumulated Earnings (Deficits) | (35,035,479 | ) | 7,612,275 | 19,610,791 | 30,242,605 | |||||||||||
| Net Assets | $ | 267,378,703 | $ | 153,899,159 | $ | 192,488,072 | $ | 172,256,071 | ||||||||
| * | All or portion of the cash is held in a segregated US Bank account. |
| ** | NAV does not recalculate due to rounding of shares of beneficial interest outstanding. |
The accompanying notes are an integral part of these financial statements.
| Redwood Funds |
| STATEMENTS OF OPERATIONS |
| For The Year Ended October 31, 2021 |
| Redwood Managed | Redwood Managed | Redwood AlphaFactor® | Redwood Systematic | |||||||||||||
| Volatility Fund | Municipal Income Fund | Tactical International Fund | Macro Trend “SMarT” Fund | |||||||||||||
| Investment Income: | ||||||||||||||||
| Dividend Income (Less: Foreign Withholding Tax $0, $0, $189,035, $2,281) | $ | — | $ | 4,408,499 | $ | 1,615,669 | $ | 2,729,767 | ||||||||
| Interest Income | 786,201 | 1,075 | 299,449 | 120,767 | ||||||||||||
| Total Investment Income | 786,201 | 4,409,574 | 1,915,118 | 2,850,534 | ||||||||||||
| Expenses: | ||||||||||||||||
| Investment Advisory Fees | 3,346,427 | 1,023,930 | 1,456,495 | 1,275,841 | ||||||||||||
| Distribution (12b-1) Fees | 6,116 | — | 5 | — | ||||||||||||
| Third Party Administrative Servicing Fees | 289,327 | 170,650 | 206,597 | 160,203 | ||||||||||||
| Administrative Fees | 187,745 | 102,979 | 122,853 | 90,982 | ||||||||||||
| Transfer Agent Fees | 73,330 | 72,398 | 18,339 | 15,755 | ||||||||||||
| Registration Fees | 72,423 | 45,605 | 40,017 | 41,908 | ||||||||||||
| Fund Accounting Fees | 48,988 | 31,715 | 32,602 | 30,312 | ||||||||||||
| Insurance Expense | 32,233 | 16,511 | 13,584 | 9,506 | ||||||||||||
| Custody Fees | 28,687 | 18,480 | 40,867 | 14,749 | ||||||||||||
| Printing Expense | 23,823 | 16,823 | 10,000 | 8,905 | ||||||||||||
| Legal fees | 23,189 | 33,796 | 22,514 | 22,894 | ||||||||||||
| Audit Fees | 14,681 | 12,449 | 17,611 | 14,721 | ||||||||||||
| Trustees’ Fees | 11,135 | 10,932 | 10,910 | 10,372 | ||||||||||||
| Chief Compliance Officer Fees | 8,789 | 8,956 | 9,024 | 7,561 | ||||||||||||
| Miscellaneous Expenses | 4,528 | 4,982 | 5,434 | 4,701 | ||||||||||||
| Total Expenses | 4,171,421 | 1,570,206 | 2,006,852 | 1,708,410 | ||||||||||||
| Fees Reimbursed by the Advisor | (247,949 | ) | (106,128 | ) | (62,459 | ) | (41,530 | ) | ||||||||
| Net Expenses | 3,923,472 | 1,464,078 | 1,944,393 | 1,666,880 | ||||||||||||
| Net Investment Income (Loss) | (3,137,271 | ) | 2,945,496 | (29,275 | ) | 1,183,654 | ||||||||||
| Net Realized and Unrealized Gain (Loss) on Investments: | ||||||||||||||||
| Net Realized Gain/(Loss) from Security Transactions: | ||||||||||||||||
| Investments | 3,570 | 1,827,596 | 1,972,345 | 10,442,808 | ||||||||||||
| Distributions from underlying investment companies | — | 10,342,790 | — | — | ||||||||||||
| Swap Contracts | 15,376,533 | — | 29,686,054 | 5,751,214 | ||||||||||||
| Options Contracts | — | — | (781,198 | ) | (462,974 | ) | ||||||||||
| Net Change in Unrealized Appreciation (Depreciation) on: | ||||||||||||||||
| Investments and Foreign Exchange Transactions | (736,213 | ) | (3,278,757 | ) | (1,808,118 | ) | 15,747,360 | |||||||||
| Swap Contracts | (1,733,340 | ) | — | 2,720,694 | 680,284 | |||||||||||
| Option Contracts | — | — | 32,606 | — | ||||||||||||
| Net Realized and Unrealized Gain on Investments | 12,910,550 | 8,891,629 | 31,822,383 | 32,158,692 | ||||||||||||
| Net Increase in Net Assets Resulting From Operations | $ | 9,773,279 | $ | 11,837,125 | $ | 31,793,108 | $ | 33,342,346 | ||||||||
The accompanying notes are an integral part of these financial statements.
| Redwood Managed Volatility Fund |
| STATEMENTS OF CHANGES IN NET ASSETS |
| For the | For the | |||||||
| Year Ended | Year Ended | |||||||
| October 31, 2021 | October 31, 2020 | |||||||
| Operations: | ||||||||
| Net Investment Loss | $ | (3,137,271 | ) | $ | (3,435,054 | ) | ||
| Net Realized Gain (Loss) | 15,380,103 | (5,238,949 | ) | |||||
| Net Change in Unrealized Depreciation | (2,469,553 | ) | (2,512,169 | ) | ||||
| Net Increase (Decrease) in Net Assets Resulting From Operations | 9,773,279 | (11,186,172 | ) | |||||
| Distributions to Shareholders: | ||||||||
| Total Distributions Paid: | ||||||||
| Class I | (3,320,285 | ) | (809,848 | ) | ||||
| Class N | (181,968 | ) | (55,949 | ) | ||||
| Class Y | (10,806,316 | ) | (3,325,082 | ) | ||||
| Net Decrease in Net Assets Resulting From Distributions to Shareholders | (14,308,569 | ) | (4,190,879 | ) | ||||
| Capital Transactions: | ||||||||
| Class I Shares: | ||||||||
| Proceeds from Shares Issued | 60,344,710 | 86,094,102 | ||||||
| Distributions Reinvested | 3,268,826 | 759,615 | ||||||
| Cost of Shares Redeemed | (34,851,908 | ) | (83,381,633 | ) | ||||
| Total From Capital Transactions: Class I | 28,761,628 | 3,472,084 | ||||||
| Class N Shares: | ||||||||
| Proceeds from Shares Issued | 14,910 | 838,436 | ||||||
| Distributions Reinvested | 173,913 | 53,068 | ||||||
| Cost of Shares Redeemed | (2,273,081 | ) | (2,679,404 | ) | ||||
| Total From Capital Transactions: Class N | (2,084,258 | ) | (1,787,900 | ) | ||||
| Class Y Shares: | ||||||||
| Proceeds from Shares Issued | 46,960,805 | 122,407,723 | ||||||
| Distributions Reinvested | 10,429,664 | 3,147,376 | ||||||
| Cost of Shares Redeemed | (95,116,381 | ) | (174,065,168 | ) | ||||
| Total From Capital Transactions: Class Y | (37,725,912 | ) | (48,510,069 | ) | ||||
| Total Decrease in Net Assets | (15,583,832 | ) | (62,202,936 | ) | ||||
| Nets Assets: | ||||||||
| Beginning of Year | 282,962,535 | 345,165,471 | ||||||
| End of Year | $ | 267,378,703 | $ | 282,962,535 | ||||
| SHARE ACTIVITY | ||||||||
| Class I: | ||||||||
| Shares Sold | 4,208,325 | 5,714,956 | ||||||
| Shares Reinvested | 229,568 | 50,463 | ||||||
| Shares Redeemed | (2,420,335 | ) | (5,689,828 | ) | ||||
| Net increase in shares of beneficial interest outstanding | 2,017,558 | 75,591 | ||||||
| Class N: | ||||||||
| Shares Sold | 1,031 | 55,465 | ||||||
| Shares Reinvested | 12,060 | 3,426 | ||||||
| Shares Redeemed | (156,741 | ) | (180,426 | ) | ||||
| Net decrease in shares of beneficial interest outstanding | (143,650 | ) | (121,535 | ) | ||||
| Class Y: | ||||||||
| Shares Sold | 3,234,370 | 8,273,182 | ||||||
| Shares Reinvested | 725,445 | 206,566 | ||||||
| Shares Redeemed | (6,543,418 | ) | (11,785,784 | ) | ||||
| Net decrease in shares of beneficial interest outstanding | (2,583,603 | ) | (3,306,036 | ) | ||||
The accompanying notes are an integral part of these financial statements.
| Redwood Managed Municipal Income Fund |
| STATEMENTS OF CHANGES IN NET ASSETS |
| For the | For the | |||||||
| Year Ended | Year Ended | |||||||
| October 31, 2021 | October 31, 2020 | |||||||
| Operations: | ||||||||
| Net Investment Income | $ | 2,945,496 | $ | 3,866,276 | ||||
| Net Realized Gain (Loss) | 12,170,386 | (2,619,725 | ) | |||||
| Net Change in Unrealized Depreciation | (3,278,757 | ) | (6,663,955 | ) | ||||
| Net Increase (Decrease) in Net Assets Resulting From Operations | 11,837,125 | (5,417,404 | ) | |||||
| Distributions to Shareholders: | ||||||||
| Total Distributions Paid: | ||||||||
| Class I | (3,110,074 | ) | (3,812,903 | ) | ||||
| Class N | (1 | ) | (580 | ) | ||||
| Net Decrease in Net Assets Resulting From Distributions to Shareholders | (3,110,075 | ) | (3,813,483 | ) | ||||
| Capital Transactions: | ||||||||
| Class I Shares: | ||||||||
| Proceeds from Shares Issued | 66,279,433 | 71,764,048 | ||||||
| Distributions Reinvested | 3,032,420 | 3,664,802 | ||||||
| Cost of Shares Redeemed | (76,662,211 | ) | (94,021,089 | ) | ||||
| Total From Capital Transactions: Class I | (7,350,358 | ) | (18,592,239 | ) | ||||
| Class N Shares: | ||||||||
| Proceeds from Shares Issued | 17 | 52,307 | ||||||
| Distributions Reinvested | 1 | 580 | ||||||
| Cost of Shares Redeemed | (202 | ) | (137,420 | ) | ||||
| Total From Capital Transactions: Class N | (184 | ) | (84,533 | ) | ||||
| Total Increase (Decrease) in Net Assets | 1,376,508 | (27,907,659 | ) | |||||
| Nets Assets: | ||||||||
| Beginning of Year | 152,522,651 | 180,430,310 | ||||||
| End of Year | $ | 153,899,159 | $ | 152,522,651 | ||||
| SHARE ACTIVITY | ||||||||
| Class I: | ||||||||
| Shares Sold | 4,060,257 | 4,535,519 | ||||||
| Shares Reinvested | 186,949 | 229,369 | ||||||
| Shares Redeemed | (4,721,443 | ) | (5,983,384 | ) | ||||
| Net decrease in shares of beneficial interest outstanding | (474,237 | ) | (1,218,496 | ) | ||||
| Class N: | ||||||||
| Shares Sold | 1 | 3,025 | ||||||
| Shares Reinvested | — | 34 | ||||||
| Shares Redeemed | (12 | ) | (8,286 | ) | ||||
| Net decrease in shares of beneficial interest outstanding | (11 | ) | (5,227 | ) | ||||
The accompanying notes are an integral part of these financial statements.
| Redwood AlphaFactor® Tactical International Fund |
| STATEMENT OF CHANGES IN NET ASSETS |
| For the | For the | |||||||
| Year Ended | Year Ended | |||||||
| October 31, 2021 | October 31, 2020 | |||||||
| Operations: | ||||||||
| Net Investment Loss | $ | (29,275 | ) | $ | (597,789 | ) | ||
| Net Realized Gain | 30,877,201 | 6,715,243 | ||||||
| Net Change in Unrealized Appreciation (Depreciation) | 945,182 | (2,817,152 | ) | |||||
| Net Increase in Net Assets Resulting From Operations | 31,793,108 | 3,300,302 | ||||||
| Distributions to Shareholders: | ||||||||
| Total Distributions Paid: | ||||||||
| Class I | (8,145,494 | ) | (1,210,462 | ) | ||||
| Class N | (523 | ) | (306 | ) | ||||
| (8,146,017 | ) | (1,210,768 | ) | |||||
| Net Decrease in Net Assets Resulting From Distributions to Shareholders | (8,146,017 | ) | (1,210,768 | ) | ||||
| Capital Transactions: | ||||||||
| Class I Shares: | ||||||||
| Proceeds from Shares Issued | 83,400,860 | 53,273,453 | ||||||
| Distributions Reinvested | 8,126,867 | 1,208,506 | ||||||
| Cost of Shares Redeemed | (50,284,545 | ) | (37,794,333 | ) | ||||
| Total From Capital Transactions: Class I | 41,243,182 | 16,687,626 | ||||||
| Class N Shares: | ||||||||
| Proceeds from Shares Issued | 17 | 10,210 | ||||||
| Distributions Reinvested | 523 | 306 | ||||||
| Cost of Shares Redeemed | (10,262 | ) | (35,638 | ) | ||||
| Total From Capital Transactions: Class N | (9,722 | ) | (25,122 | ) | ||||
| Total Increase in Net Assets | 64,880,551 | 18,752,038 | ||||||
| Nets Assets: | ||||||||
| Beginning of Year | 127,607,521 | 108,855,483 | ||||||
| End of Year | $ | 192,488,072 | $ | 127,607,521 | ||||
| SHARE ACTIVITY | ||||||||
| Class I: | ||||||||
| Shares Sold | 4,886,697 | 3,773,979 | ||||||
| Shares Reinvested | 501,659 | 84,993 | ||||||
| Shares Redeemed | (2,992,624 | ) | (2,614,248 | ) | ||||
| Net increase in shares of beneficial interest outstanding | 2,395,732 | 1,244,724 | ||||||
| Class N: | ||||||||
| Shares Sold | 1 | 675 | ||||||
| Shares Reinvested | 32 | 21 | ||||||
| Shares Redeemed | (612 | ) | (2,320 | ) | ||||
| Net decrease in shares of beneficial interest outstanding | (579 | ) | (1,624 | ) | ||||
The accompanying notes are an integral part of these financial statements.
| Redwood Systematic Macro Trend (“SMarT”) Fund |
| STATEMENT OF CHANGES IN NET ASSETS |
| For the | For the | |||||||
| Year Ended | Year Ended | |||||||
| October 31, 2021 | October 31, 2020 | |||||||
| Operations: | ||||||||
| Net Investment Income | $ | 1,183,654 | $ | 641,373 | ||||
| Net Realized Gain | 15,731,048 | 6,387,412 | ||||||
| Net Change in Unrealized Appreciation | 16,427,644 | 225,640 | ||||||
| Net Increase in Net Assets Resulting From Operations | 33,342,346 | 7,254,425 | ||||||
| Distributions to Shareholders: | ||||||||
| Total Distributions Paid: | ||||||||
| Class I | (7,470,875 | ) | (1,509,851 | ) | ||||
| Class N | (14 | ) | (1,267 | ) | ||||
| Net Decrease in Net Assets Resulting From Distributions to Shareholders | (7,470,889 | ) | (1,511,118 | ) | ||||
| Capital Transactions: | ||||||||
| Class I Shares: | ||||||||
| Proceeds from Shares Issued | 81,113,557 | 26,123,605 | ||||||
| Distributions Reinvested | 7,445,670 | 1,501,448 | ||||||
| Cost of Shares Redeemed | (30,563,279 | ) | (22,851,482 | ) | ||||
| Total From Capital Transactions: Class I | 57,995,948 | 4,773,571 | ||||||
| Class N Shares: | ||||||||
| Proceeds from Shares Issued | 10,018 | 1,003 | ||||||
| Distributions Reinvested | 14 | 1,267 | ||||||
| Cost of Shares Redeemed | (10,606 | ) | (82,867 | ) | ||||
| Total From Capital Transactions: Class N | (574 | ) | (80,597 | ) | ||||
| Total Increase in Net Assets | 83,866,831 | 10,436,281 | ||||||
| Nets Assets: | ||||||||
| Beginning of Year | 88,389,240 | 77,952,959 | ||||||
| End of Year | $ | 172,256,071 | $ | 88,389,240 | ||||
| SHARE ACTIVITY | ||||||||
| Class I: | ||||||||
| Shares Sold | 4,183,928 | 1,704,057 | ||||||
| Shares Reinvested | 433,438 | 97,786 | ||||||
| Shares Redeemed | (1,633,796 | ) | (1,494,202 | ) | ||||
| Net increase in shares of beneficial interest outstanding | 2,983,570 | 307,641 | ||||||
| Class N: | ||||||||
| Shares Sold | 529 | 66 | ||||||
| Shares Reinvested | 1 | 82 | ||||||
| Shares Redeemed | (540 | ) | (5,363 | ) | ||||
| Net decrease in shares of beneficial interest outstanding | (10 | ) | (5,215 | ) | ||||
The accompanying notes are an integral part of these financial statements.
| Redwood Managed Volatility Fund |
| FINANCIAL HIGHLIGHTS |
| Per Share Data and Ratios for a Share of Beneficial Interest Outstanding Throughout Each Year Presented |
| Class I | ||||||||||||||||||||
| For the | For the | For the | For the | For the | ||||||||||||||||
| Year Ended | Year Ended | Year Ended | Year Ended | Year Ended | ||||||||||||||||
| October 31, 2021 | October 31, 2020 | October 31, 2019 | October 31, 2018 | October 31, 2017 | ||||||||||||||||
| Net Asset Value, Beginning of Year | $ | 14.55 | $ | 15.14 | $ | 14.86 | $ | 15.95 | $ | 15.66 | ||||||||||
| Activity from Investment Operations: | ||||||||||||||||||||
| Net Investment Income (Loss) (a) | (0.18 | ) | (0.15 | ) | (0.01 | ) | 0.45 | 0.43 | ||||||||||||
| Net Realized and Unrealized Gain (Loss) on Investments | 0.68 | �� | (0.25 | ) | 0.78 | (0.55 | ) | 0.51 | ||||||||||||
| Total From Operations | 0.50 | (0.40 | ) | 0.77 | (0.10 | ) | 0.94 | |||||||||||||
| Less Distributions: | ||||||||||||||||||||
| From Net Investment Income | (0.78 | ) | (0.19 | ) | (0.49 | ) | (0.99 | ) | (0.65 | ) | ||||||||||
| Total Distributions | (0.78 | ) | (0.19 | ) | (0.49 | ) | (0.99 | ) | (0.65 | ) | ||||||||||
| Paid-in-Capital from Redemption Fees | — | — | — | 0.00 | (d) | 0.00 | (d) | |||||||||||||
| Net Asset Value, End of Year | $ | 14.27 | $ | 14.55 | $ | 15.14 | $ | 14.86 | $ | 15.95 | ||||||||||
| Total Return (b) | 3.43 | % | (2.70 | )% | 5.10 | % | (0.65 | )% | 6.24 | % | ||||||||||
| Net Assets, End of Year (000’s) | $ | 90,597 | $ | 63,012 | $ | 64,403 | $ | 52,093 | $ | 75,575 | ||||||||||
| Ratio of Expenses to Average Net Assets (c) | 1.55 | % | 1.55 | % | 1.58 | % | 1.50 | % | 1.43 | % | ||||||||||
| Ratio of net expenses and net of waivers to average net assets | 1.55 | % | 1.55 | % | 1.58 | % (c) | 1.50 | % | 2.72 | % | ||||||||||
| Ratio of Net Investment Income (Loss) to Average Net Assets (c)(e) | (1.23 | )% | (1.05 | )% | (0.05 | )% | 2.94 | % | 2.72 | % | ||||||||||
| Portfolio Turnover Rate | 11 | % | 11066 | % | 2 | % | 217 | % | 110 | % | ||||||||||
| Class N | ||||||||||||||||||||
| For the | For the | For the | For the | For the | ||||||||||||||||
| Year Ended | Year Ended | Year Ended | Year Ended | Year Ended | ||||||||||||||||
| October 31, 2021 | October 31, 2020 | October 31, 2019 | October 31, 2018 | October 31, 2017 | ||||||||||||||||
| Net Asset Value, Beginning of Year | $ | 14.74 | $ | 15.33 | $ | 14.84 | $ | 15.94 | $ | 15.65 | ||||||||||
| Activity from Investment Operations: | ||||||||||||||||||||
| Net Investment Income (Loss) (a) | (0.22 | ) | (0.19 | ) | (0.04 | ) | 0.40 | 0.38 | ||||||||||||
| Net Realized and Unrealized Gain (Loss) on Investments | 0.69 | (0.25 | ) | 0.76 | (0.54 | ) | 0.52 | |||||||||||||
| Total From Operations | 0.47 | (0.44 | ) | 0.72 | (0.14 | ) | 0.90 | |||||||||||||
| Less Distributions: | ||||||||||||||||||||
| From Net Investment Income | (0.75 | ) | (0.15 | ) | (0.23 | ) | (0.96 | ) | (0.61 | ) | ||||||||||
| Total Distributions | (0.75 | ) | (0.15 | ) | (0.23 | ) | (0.96 | ) | (0.61 | ) | ||||||||||
| Paid-in-Capital from Redemption Fees | — | — | — | 0.00 | (d) | 0.00 | (d) | |||||||||||||
| Net Asset Value, End of Year | $ | 14.46 | $ | 14.74 | $ | 15.33 | $ | 14.84 | $ | 15.94 | ||||||||||
| Total Return (b) | 3.12 | % | (2.97 | )% | 4.93 | % | (0.97 | )% | 5.99 | % | ||||||||||
| Ratios/Supplemental Data | ||||||||||||||||||||
| Net Assets, End of Year (000s) | $ | 1,657 | $ | 3,807 | $ | 5,821 | $ | 13,364 | $ | 24,473 | ||||||||||
| Ratio of Expenses to Average Net Assets (c) | 1.82 | % | 1.78 | % | 1.84 | % | 1.74 | % | 1.68 | % | ||||||||||
| Ratio of net expenses and net of waivers to average net assets | 1.82 | % | 1.78 | % | 1.84 | % (c) | 1.74 | % | 1.77 | % | ||||||||||
| Ratio of Net Investment Income (Loss) to Average Net Assets (c)(e) | (1.55 | )% | (1.28 | )% | (0.23 | )% | 2.61 | % | 2.42 | % | ||||||||||
| Portfolio Turnover Rate | 11 | % | 11066 | % | 2 | % | 217 | % | 110 | % | ||||||||||
| * | Class I and Class N commenced operations on December 19, 2013. |
| (a) | Per share amounts are calculated using the average shares method, which more appropriately presents the per share data for the period. |
| (b) | Total returns are historical in nature and assume changes in share price, reinvestment of dividends and capital gains distributions, if any. Total returns for periods less than one year are not annualized. |
| (c) | Does not include expenses of other investment companies in which the Fund invests. |
| (d) | Amount is less than $0.005 per share. |
| (e) | Recognition of net investment income by the Fund is affected by the timing of declaration of dividends by underlying investment companies in which the Fund invests. |
The accompanying notes are an integral part of these financial statements.
| Redwood Managed Volatility Fund |
| FINANCIAL HIGHLIGHTS |
| Per Share Data and Ratios for a Share of Beneficial Interest Outstanding Throughout Each Year Presented |
| Class Y | ||||||||||||||||||||
| For the | For the | For the | For the | For the | ||||||||||||||||
| Year Ended | Year Ended | Year Ended | Year Ended | Year Ended | ||||||||||||||||
| October 31, 2021 | October 31, 2020 | October 31, 2019 | October 31, 2018 | October 31, 2017 | ||||||||||||||||
| Net Asset Value, Beginning of Year | $ | 14.68 | $ | 15.25 | $ | 14.95 | $ | 16.03 | $ | 15.74 | ||||||||||
| Activity from Investment Operations: | ||||||||||||||||||||
| Net Investment Income (Loss) (a) | (0.17 | ) | (0.14 | ) | 0.02 | 0.46 | 0.43 | |||||||||||||
| Net Realized and Unrealized Gain (Loss) on Investments | 0.69 | (0.24 | ) | 0.77 | (0.55 | ) | 0.51 | |||||||||||||
| Total From Operations | 0.52 | (0.38 | ) | 0.79 | (0.09 | ) | 0.94 | |||||||||||||
| Less Distributions: | ||||||||||||||||||||
| From Net Investment Income | (0.78 | ) | (0.19 | ) | (0.49 | ) | (0.99 | ) | (0.65 | ) | ||||||||||
| Total Distributions | (0.78 | ) | (0.19 | ) | (0.49 | ) | (0.99 | ) | (0.65 | ) | ||||||||||
| Paid-in-Capital from Redemption Fees | — | — | — | 0.00 | (f) | 0.00 | (f) | |||||||||||||
| Net Asset Value, End of Year | $ | 14.42 | $ | 14.68 | $ | 15.25 | $ | 14.95 | $ | 16.03 | ||||||||||
| Total Return (b) | 3.54 | % | (2.68 | )% | 5.34 | % | (0.64 | )% | 6.20 | % | ||||||||||
| Net Assets, End of Year (000’s) | $ | 175,124 | $ | 216,144 | $ | 274,941 | $ | 284,993 | $ | 350,196 | ||||||||||
| Ratio of gross expenses to average net assets (c) | 1.56 | % | 1.55 | % (d) | 1.58 | % (d) | 1.46 | % (d) | 1.43 | % | ||||||||||
| Ratio of net expenses to average net assets (c) | 1.43 | % | 1.43 | % | 1.43 | % | 1.48 | % (e) | 1.50 | % | ||||||||||
| Ratio of Net Investment Income (Loss) to Average Net Assets (c)(g) | (1.14 | )% | (0.95 | )% | 0.12 | % | 3.01 | % | 2.72 | % | ||||||||||
| Portfolio Turnover Rate | 11 | % | 11066 | % | 2 | % | 217 | % | 110 | % | ||||||||||
| * | Class Y commenced operations on December 19, 2013. |
| (a) | Per share amounts are calculated using the average shares method, which more appropriately presents the per share data for the period. |
| (b) | Total returns are historical in nature and assume changes in share price, reinvestment of dividends and capital gains distributions, if any. Had the Advisor not absorbed a portion of Fund expenses, total returns would In periods where the Advisor recaptures a portion of the Funds expenses total returns would have been higher. Total returns for periods less than one year are not annualized. |
| (c) | Does not include expenses of other investment companies in which the Fund invests. |
| (d) | Represents the ratio of expenses to average net assets absent fee waivers and/or expense reimbursements by the Advisor. |
| (e) | Represents the ratio of expenses to average net assets inclusive of the Advisor’s recapture of waived/expense reimbursed fees from prior periods. |
| (f) | Amount is less than $0.005 per share. |
| (g) | Recognition of net investment income by the Fund is affected by the timing of declaration of dividends by underlying investment companies in which the Fund invests. |
The accompanying notes are an integral part of these financial statements.
| Redwood Managed Municipal Income Fund |
| FINANCIAL HIGHLIGHTS |
| Per Share Data and Ratios for a Share of Beneficial Interest Outstanding Throughout The Periods Presented |
| Class I | ||||||||||||||||||||
| For the | For the | For the | For the | For the | ||||||||||||||||
| Year Ended | Year Ended | Year Ended | Year Ended | Period Ended | ||||||||||||||||
| October 31, 2021 | October 31, 2020 | October 31, 2019 | October 31, 2018 | October 31, 2017* | ||||||||||||||||
| Net Asset Value, Beginning of Period | $ | 15.46 | $ | 16.27 | $ | 15.31 | $ | 15.46 | $ | 15.00 | ||||||||||
| Activity from Investment Operations: | ||||||||||||||||||||
| Net Investment Income (a) | 0.34 | 0.36 | 0.50 | 0.42 | 0.37 | |||||||||||||||
| Net Realized and Unrealized Gain (Loss) on Investments | 0.94 | (0.82 | ) | 0.95 | (0.18 | ) | 0.37 | |||||||||||||
| Total From Operations | 1.28 | (0.46 | ) | 1.45 | 0.24 | 0.74 | ||||||||||||||
| Less Distributions: | ||||||||||||||||||||
| From Net Investment Income | (0.35 | ) | (0.35 | ) | (0.49 | ) | (0.39 | ) | (0.28 | ) | ||||||||||
| Total Distributions | (0.35 | ) | (0.35 | ) | (0.49 | ) | (0.39 | ) | (0.28 | ) | ||||||||||
| Net Asset Value, End of Period | $ | 16.39 | $ | 15.46 | $ | 16.27 | $ | 15.31 | $ | 15.46 | ||||||||||
| Total Return (b) | 8.30 | % | (2.85 | )% | 9.62 | % | 1.64 | % | 4.93 | % (h) | ||||||||||
| Net Assets, End of Period (000’s) | $ | 153,899 | $ | 152,522 | $ | 180,342 | $ | 170,030 | $ | 46,625 | ||||||||||
| Ratio of Gross Expenses to Average Net Assets including interest expense (e) | 1.07 | % (g) | 1.09 | % (g) | 1.09 | % (g) | 1.04 | % | 1.44 | % (c,g) | ||||||||||
| Ratio of Net Expenses to Average Net Assets including interest expense (e) | 1.00 | % | 1.00 | % | 1.00 | % | 1.04 | % | 1.23 | % (c) | ||||||||||
| Ratio of Gross Expenses to Average Net Assets excluding interest expense (e) | 1.07 | % (g) | 1.09 | % (g) | 1.09 | % (g) | 0.96 | % | 1.22 | % (c,g) | ||||||||||
| Ratio of Net Expenses to Average Net Assets excluding interest expense (e) | 1.00 | % | 1.00 | % | 1.00 | % | 0.96 | % | 1.00 | % (c) | ||||||||||
| Ratio of Net Investment Income to Average Net Assets (e,f) | 2.11 | % | 2.26 | % | 3.13 | % | 2.73 | % | 3.77 | % (c) | ||||||||||
| Portfolio Turnover Rate | 8 | % | 250 | % | 7 | % | 280 | % | 24 | % (d) | ||||||||||
| * | Fund commenced operations on March 9, 2017 |
| (a) | Per share amounts are calculated using the average shares method, which more appropriately presents the per share data for the period. |
| (b) | Total returns are historical in nature and assume changes in share price, reinvestment of dividends and capital gains distributions, if any. Total returns for periods less than one year are not annualized. |
| (c) | Annualized. |
| (d) | Not annualized. |
| (e) | Does not include expenses of other investment companies in which the Fund invests. |
| (f) | Recognition of net investment income by the Fund is affected by the timing of declaration of dividends by underlying investment companies in which the Fund invests. |
| (g) | Represents the ratio of expenses to average net assets absent fee waivers and/or expense reimbursements by the Advisor. |
| (i) | Includes adjustments in accordance with accounting principles generally accepted in the United States and, consequently, the net asset value for financial reporting purposes and the returns based upon those net asset values may differ from the net asset values and returns for shareholder transactions. |
The accompanying notes are an integral part of these financial statements.
| Redwood Managed Municipal Income Fund |
| FINANCIAL HIGHLIGHTS |
| Per Share Data and Ratios for a Share of Beneficial Interest Outstanding Throughout The Periods Presented |
| Class N | ||||||||||||||||||||
| For the | For the | For the | For the | For the | ||||||||||||||||
| Year Ended | Year Ended | Year Ended | Year Ended | Period Ended | ||||||||||||||||
| October 31, 2021 | October 31, 2020 | October 31, 2019 | October 31, 2018 | October 31, 2017* | ||||||||||||||||
| Net Asset Value, Beginning of Period | $ | 16.17 | $ | 16.90 | $ | 15.61 | $ | 15.72 | $ | 15.00 | ||||||||||
| Activity from Investment Operations: | ||||||||||||||||||||
| Net Investment Income (a) | 0.13 | 0.46 | 0.45 | 0.33 | — | |||||||||||||||
| Net Realized and Unrealized Gain (Loss) on Investments | 1.07 | (1.06 | ) | 1.00 | (0.12 | ) | 0.72 | |||||||||||||
| Total From Operations | 1.20 | (0.60 | ) | 1.45 | 0.21 | 0.72 | ||||||||||||||
| Less Distributions: | ||||||||||||||||||||
| From Net Investment Income | (0.32 | ) | (0.13 | ) | (0.16 | ) | (0.32 | ) | — | |||||||||||
| Total Distributions | (0.32 | ) | (0.13 | ) | (0.16 | ) | (0.32 | ) | — | |||||||||||
| Net Asset Value, End of Period | $ | 17.05 | $ | 16.17 | $ | 16.90 | $ | 15.61 | $ | 15.72 | ||||||||||
| Total Return (b) | 7.47 | % | (3.60 | )% | 9.35 | % | 1.31 | % | 4.80 | % (i) | ||||||||||
| Net Assets, End of Period (000’s) | $ | 18 | (h) | $ | 194 | (h) | $ | 89 | $ | 162 | $ | 16 | (h) | |||||||
| Ratio of Gross Expenses to Average Net Assets including interest expense (e) | 1.32 | % (g) | 1.34 | % (g) | 1.34 | % (g) | 1.25 | % | 1.69 | % (c,g) | ||||||||||
| Ratio of Net Expenses to Average Net Assets including interest expense (e) | 1.25 | % | 1.25 | % | 1.25 | % | 1.25 | % | 1.48 | % (c) | ||||||||||
| Ratio of Gross Expenses to Average Net Assets excluding interest expense (e) | 1.32 | % (g) | 1.34 | % (g) | 1.34 | % (g) | 1.22 | % | 1.47 | % (c,g) | ||||||||||
| Ratio of Net Expenses to Average Net Assets excluding interest expense (e) | 1.25 | % | 1.25 | % | 1.25 | % | 1.22 | % | 1.25 | % (c) | ||||||||||
| Ratio of Net Investment Income to Average Net Assets (e,f) | 0.05 | % | 2.72 | % | 2.78 | % | 2.08 | % | 0.00 | % (c) | ||||||||||
| Portfolio Turnover Rate | 8 | % | 250 | % | 7 | % | 280 | % | 24 | % (d) | ||||||||||
| * | Fund commenced operations on March 9, 2017 |
| (a) | Per share amounts are calculated using the average shares method, which more appropriately presents the per share data for the period. |
| (b) | Total returns are historical in nature and assume changes in share price, reinvestment of dividends and capital gains distributions, if any. Total returns for periods less than one year are not annualized. |
| (c) | Annualized. |
| (d) | Not annualized. |
| (e) | Does not include expenses of other investment companies in which the Fund invests. |
| (f) | Recognition of net investment income by the Fund is affected by the timing of declaration of dividends by underlying investment companies in which the Fund invests. |
| (g) | Represents the ratio of expenses to average net assets absent fee waivers and/or expense reimbursements by the Advisor. |
| (h) | Amount is actual; not presented in thousands. |
| (i) | Includes adjustments in accordance with accounting principles generally accepted in the United States and, consequently, the net asset value for financial reporting purposes and the returns based upon those net asset values may differ from the net asset values and returns for shareholder transactions. |
The accompanying notes are an integral part of these financial statements.
| Redwood AlphaFactor® Tactical International Fund |
| FINANCIAL HIGHLIGHTS |
| Per Share Data and Ratios for a Share of Beneficial Interest Outstanding Throughout The Periods Presented |
| Class I | Class N | |||||||||||||||||||||||||||||||
| For the | For the | For the | For the Period | For the | For the | For the | For the Period | |||||||||||||||||||||||||
| Year Ended | Year Ended, | Year Ended, | November 2, 2017 | Year Ended | Year Ended, | Year Ended, | November 2, 2017 | |||||||||||||||||||||||||
| October 31, 2021 | October 31, 2020 | October 31, 2019 | Through October 31, 2018* | October 31, 2021 | October 31, 2020 | October 31, 2019 | Through October 31, 2018* | |||||||||||||||||||||||||
| Net Asset Value, Beginning of Period | $ | 14.49 | $ | 14.39 | $ | 14.67 | $ | 15.00 | $ | 14.66 | $ | 14.57 | $ | 14.66 | $ | 15.00 | ||||||||||||||||
| Activity from Investment Operations: | ||||||||||||||||||||||||||||||||
| Net Investment Income (Loss) (a) | (0.04 | ) | (0.07 | ) | 0.18 | 0.08 | (0.21 | ) | (0.09 | ) | 0.17 | 0.06 | ||||||||||||||||||||
| Net Realized and Unrealized Gain (Loss) on Investments | 3.68 | 0.30 | (0.17 | ) | (0.32 | ) | 3.63 | 0.29 | (0.19 | ) | (0.33 | ) | ||||||||||||||||||||
| Total From Operations | 3.64 | 0.23 | 0.01 | (0.24 | ) | 3.42 | 0.20 | (0.02 | ) | (0.27 | ) | |||||||||||||||||||||
| Less Distributions: | ||||||||||||||||||||||||||||||||
| From Paid in Capital | — | — | (0.02 | ) | (0.09 | ) | — | — | (0.02 | ) | (0.07 | ) | ||||||||||||||||||||
| From Net Investment Income | (0.94 | ) | (0.13 | ) | (0.27 | ) | (0.00 | ) (h) | (0.90 | ) | (0.11 | ) | (0.05 | ) | (0.00 | ) (h) | ||||||||||||||||
| Total Distributions | (0.94 | ) | (0.13 | ) | (0.29 | ) | (0.09 | ) | (0.90 | ) | (0.11 | ) | (0.07 | ) | (0.07 | ) | ||||||||||||||||
| Net Asset Value, End of Period | $ | 17.19 | $ | 14.49 | $ | 14.39 | $ | 14.67 | $ | 17.18 | $ | 14.66 | $ | 14.57 | $ | 14.66 | ||||||||||||||||
| Total Return (b) | 25.54 | % | 1.63 | % | 0.04 | % | (1.58 | )% | 22.46 | % | 1.36 | % | (0.16 | )% | (1.79 | )% | ||||||||||||||||
| Net Assets, End of Period (000’s) | $ | 192,488 | $ | 127,599 | $ | 108,823 | $ | 81,628 | $ | 18 | (i) | $ | 9 | $ | 32 | $ | 153 | |||||||||||||||
| Ratio of Gross Expenses to Average Net Assets (e,f) | 1.24 | % | 1.29 | % | 1.26 | % | 1.23 | % (c) | 1.49 | % | 1.54 | % | 1.51 | % | 1.51 | % (c) | ||||||||||||||||
| Ratio of Net Expenses to Average Net Assets (e) | 1.20 | % | 1.20 | % | 1.20 | % | 1.20 | % (c) | 1.45 | % | 1.45 | % | 1.45 | % | 1.45 | % (c) | ||||||||||||||||
| Ratio of Net Investment Income (Loss) to Average Net Assets (e,g) | (0.24 | )% | (0.47 | )% | 1.19 | % | 0.55 | % (c) | (0.71 | )% | (0.60 | )% | 1.17 | % | 0.38 | % (c) | ||||||||||||||||
| Portfolio Turnover Rate | 63 | % | 230 | % | 344 | % | 682 | % (d) | 63 | % | 230 | % | 344 | % | 682 | % (d) | ||||||||||||||||
| * | Fund commenced operations on November 2, 2017 |
| (a) | Per share amounts are calculated using the average shares method, which more appropriately presents the per share data for the period. |
| (b) | Total returns are historical in nature and assume changes in share price, reinvestment of dividends and capital gains distributions, if any. Total returns for periods less than one year are not annualized. |
| (c) | Annualized. |
| (d) | Not annualized. |
| (e) | Does not include expenses of other investment companies in which the Fund invests. |
| (f) | Represents the ratio of expenses to average net assets absent fee waivers and/or expense reimbursements by the Advisor. |
| (g) | Recognition of net investment income by the Fund is affected by the timing of declaration of dividends by underlying investment companies in which the Fund invests. |
| (h) | Amount represents less than $0.005. |
| (i) | Amount is actual; not presented in thousands. |
The accompanying notes are an integral part of these financial statements.
| Redwood Systematic Macro Trend (“SMarT”) Fund |
| FINANCIAL HIGHLIGHTS |
| Per Share Data and Ratios for a Share of Beneficial Interest Outstanding Throughout The Periods Presented |
| Class I | Class N | |||||||||||||||||||||||||||||||
| For the | For the | For the | For the Period | For the | For the | For the | For the Period | |||||||||||||||||||||||||
| Year Ended | Year Ended | Year Ended | November 2, 2017 | Year Ended | Year Ended | Year Ended | November 2, 2017 | |||||||||||||||||||||||||
| October 31, 2021 | October 31, 2020 | October 31, 2019 | Through October 31, 2018* | October 31, 2021 | October 31, 2020 | October 31, 2019 | Through October 31, 2018* | |||||||||||||||||||||||||
| Net Asset Value, Beginning of Period | $ | 15.81 | $ | 14.74 | $ | 14.48 | $ | 15.00 | $ | 16.00 | $ | 14.90 | $ | 14.47 | $ | 15.00 | ||||||||||||||||
| Activity from Investment Operations: | ||||||||||||||||||||||||||||||||
| Net Investment Income (a) | 0.18 | 0.12 | 0.22 | 0.35 | 0.09 | 0.32 | 0.20 | 0.28 | ||||||||||||||||||||||||
| Net Realized and Unrealized Gain (Loss) on Investments | 5.41 | 1.23 | 0.37 | (0.53 | ) | 5.54 | 1.02 | 0.36 | (0.50 | ) | ||||||||||||||||||||||
| Total From Operations | 5.59 | 1.35 | 0.59 | (0.18 | ) | 5.63 | 1.34 | 0.56 | (0.22 | ) | ||||||||||||||||||||||
| Less Distributions: | ||||||||||||||||||||||||||||||||
| From Net Realized Gains | — | — | (0.00 | ) (h) | — | — | — | (0.00 | ) (h) | — | ||||||||||||||||||||||
| From Net Investment Income | (1.31 | ) | (0.28 | ) | (0.33 | ) | (0.34 | ) | (1.30 | ) | (0.24 | ) | (0.13 | ) | (0.31 | ) | ||||||||||||||||
| Total Distributions | (1.31 | ) | (0.28 | ) | (0.33 | ) | (0.34 | ) | (1.30 | ) | �� | (0.24 | ) | (0.13 | ) | (0.31 | ) | |||||||||||||||
| Net Asset Value, End of Period | $ | 20.09 | $ | 15.81 | $ | 14.74 | $ | 14.48 | $ | 20.33 | $ | 16.00 | $ | 14.90 | $ | 14.47 | ||||||||||||||||
| Total Return (b) | 36.79 | % | 9.25 | % | 4.16 | % | (1.27 | )% | 36.55 | % | 9.06 | % | 3.90 | % | (1.52 | )% | ||||||||||||||||
| Net Assets, End of Period | $ | 172,256,050 | $ | 88,389,063 | $ | 77,875,080 | $ | 55,693,857 | $ | 21 | $ | 177 | $ | 77,879 | $ | 136,939 | ||||||||||||||||
| Ratio of Gross Expenses to Average Net Assets (e,f) | 1.34 | % | 1.45 | % | 1.40 | % | 1.41 | % (c) | 1.59 | % | 1.70 | % | 1.65 | % | 1.67 | % (c) | ||||||||||||||||
| Ratio of Net Expenses to Average Net Assets (e) | 1.30 | % | 1.30 | % | 1.30 | % | 1.30 | % (c) | 1.55 | % | 1.55 | % | 1.55 | % | 1.55 | % (c) | ||||||||||||||||
| Ratio of Net Investment Income to Average Net Assets (e,g) | 0.93 | % | 0.77 | % | 1.52 | % | 2.30 | % (c) | 0.97 | % | 2.07 | % | 1.42 | % | 1.85 | % (c) | ||||||||||||||||
| Portfolio Turnover Rate | 160 | % | 628 | % | 256 | % | 20 | % (d) | 160 | % | 628 | % | 256 | % | 20 | % (d) | ||||||||||||||||
| * | Fund commenced operations on November 2, 2017 |
| (a) | Per share amounts are calculated using the average shares method, which more appropriately presents the per share data for the period. |
| (b) | Total returns are historical in nature and assume changes in share price, reinvestment of dividends and capital gains distributions, if any. Total returns for periods less than one year are not annualized. |
| (c) | Annualized. |
| (d) | Not annualized. |
| (e) | Does not include expenses of other investment companies in which the Fund invests. |
| (f) | Represents the ratio of expenses to average net assets absent fee waivers and/or expense reimbursements by the Advisor. |
| (g) | Recognition of net investment income by the Fund is affected by the timing of declaration of dividends by underlying investment companies in which the Fund invests. |
| (h) | Amount represents less than $0.005. |
The accompanying notes are an integral part of these financial statements.
| Redwood Funds |
| NOTES TO FINANCIAL STATEMENTS |
| October 31, 2021 |
| 1. | ORGANIZATION |
Redwood Managed Volatility Fund (the “Managed Volatility Fund”), Redwood Managed Municipal Income Fund (the “Municipal Income Fund”), Redwood AlphaFactor® Tactical International Fund (the “Tactical International Fund”), Redwood Systematic Macro Trend (“SMarT”) Fund (the “SMarT Fund”), each a “Fund” and collectively, the “Funds” are each a series of shares of beneficial interest of the Two Roads Shared Trust (the “Trust”), a statutory trust organized under the laws of the State of Delaware on June 8, 2012, and registered under the Investment Company Act of 1940, as amended (the “1940 Act”), as diversified, open-end management investment companies. The Managed Volatility Fund commenced investment operations on December 19, 2013. The Municipal Income Fund commenced operations on March 9, 2017. The Tactical International Fund, and SMarT Fund commenced operations on November 2, 2017. The Managed Volatility Fund’s investment objective is to seek a combination of total return and prudent management of portfolio downside volatility and downside loss. The Municipal Income Fund seeks to generate tax-efficient income, while focusing on managing downside risk. The Tactical International Fund seeks to generate long- term total return with capital preservation as a secondary objective. The SMarT Fund seeks to generate capital appreciation while focusing on managing downside risk.
The Managed Volatility Fund offers Class I, Class N and Class Y shares. The Municipal Income Fund, Tactical International Fund, and SMarT Fund each offer Class I and Class N shares. All classes are sold at NAV. Each share class of a Fund represents an interest in the same assets of that Fund and classes are identical except for differences in their fees and ongoing service and distribution charges. All classes of shares have equal voting privileges except that each class has exclusive voting rights with respect to its service and/or distribution plans. Each Fund’s income, expenses (other than class specific distribution fees) and realized and unrealized gains and losses are allocated proportionately each day based upon the relative net assets of each class of the Fund.
| 2. | SUMMARY OF SIGNIFICANT ACCOUNTING POLICIES |
The following is a summary of significant accounting policies followed by the Funds in preparation of its financial statements. These policies are in conformity with accounting principles generally accepted in the United States of America (“GAAP”). The preparation of financial statements requires management to make estimates and assumptions that affect the reported amounts of assets and liabilities and disclosure of contingent assets and liabilities at the date of the financial statements and the reported amounts of income and expenses for the period. Actual results could differ from those estimates. The Funds are investment companies and accordingly follow the investment company accounting and reporting guidance of the Financial Accounting Standards Board (“FASB”) Accounting Standard Codification Topic 946 “Financial Services – Investment Companies”.
Security Valuation – Securities listed on an exchange are valued at the last reported sale price at the close of the regular trading session of the exchange on the business day the value is being determined, or in the case of securities listed on NASDAQ at the NASDAQ Official Closing Price. In the absence of a sale such securities shall be valued at the mean between the last bid and ask prices on the day of valuation. Options contracts listed on a securities exchange or board of trade (not including Index Options contracts) for which market quotations are readily available shall be valued at the last quoted sales price or, in the absence of a sale, at the mean between the current bid and ask prices on the valuation date. Index Options listed on a securities exchange or board of trade for which market quotations are readily available shall be valued at the mean between the current bid and ask prices on the valuation date. Total return swaps on exchange-listed securities shall be valued at the last quoted sales price or, in the absence of a sale, at the mean between the current bid and ask prices on the day of valuation on each underlying exchange-listed security. Exchange listed swaps shall be valued at the last quoted sales price or, in the absence of a sale, at the mean between the current bid and ask prices on the day of valuation. The independent pricing service does not distinguish between smaller-sized bond positions known as “odd lots” and larger institutional-sized bond positions known as “round lots”. Each Fund may fair value a particular bond if the adviser does not believe that the round lot value provided by the independent pricing service reflects fair value of the Fund’s holding. Short-term debt obligations, excluding U.S. Treasury Bills, having 60 days or less remaining until maturity, at time of purchase, may be valued at amortized cost.
Valuation of Underlying Funds – The Funds may invest in portfolios of open-end or closed-end investment companies (the “Underlying Funds”). The Underlying Funds value securities in their portfolios for which market quotations are readily available at their market values (generally the last reported sale price) and all other securities and assets at their fair value to the methods established by the board of directors of the Underlying Funds.
| Redwood Funds |
| NOTES TO FINANCIAL STATEMENTS (Continued) |
| October 31, 2021 |
Open -end funds are valued at their respective net asset values as reported by such investment companies. The shares of many closed- end investment companies, after their initial public offering, frequently trade at a price per share, which is different than the net asset value per share. The difference represents a market premium or market discount of such shares. There can be no assurances that the market discount or premium on shares of any closed-end investment company purchased by the Funds will not change.
The Funds may hold securities, such as private investments, interests in commodity pools, other non-traded securities or temporarily illiquid securities, for which market quotations are not readily available or are determined to be unreliable. These securities will be valued using the “fair value” procedures approved by the Board. The Board has delegated execution of these procedures to a fair value committee composed of one or more representatives from each of the (i) Trust, (ii) administrator, and (iii) advisor. The committee may also enlist third party consultants such as a valuation specialist at a public accounting firm, valuation consultant or financial officer of a security issuer on an as-needed basis to assist in determining a security- specific fair value. The Board has also engaged a third party valuation firm to, as needed, attend valuation meetings held by the Trust, review minutes of such meetings and report to the Board on a quarterly basis. The Board reviews and considers the determinations reached by the fair value committee in ratifying the fair value committee’s application of the fair valuation methodologies employed.
Fair Valuation Process – The applicable investments are valued collectively via inputs from each group within the fair value committee. For example, fair value determinations are required for the following securities: (i) securities for which market quotations are insufficient or not readily available on a particular business day (including securities for which there is a short and temporary lapse in the provision of a price by the regular pricing source); (ii) securities for which, in the judgment of the advisor, the prices or values available do not represent the fair value of the instrument; factors which may cause the advisor to make such a judgment include, but are not limited to, the following: only a bid price or an ask price is available; the spread between bid and ask prices is substantial; the frequency of sales; the thinness of the market; the size of reported trades; and actions of the securities markets, such as the suspension or limitation of trading; (iii) securities determined to be illiquid; and (iv) securities with respect to which an event that will affect the value thereof has occurred (a “significant event”) since the closing prices were established on the principal exchange on which they are traded, but prior to a Fund’s calculation of its net asset value. Specifically, interests in commodity pools or managed futures pools are valued on a daily basis by reference to the closing market prices of each futures contract or other asset held by a pool, as adjusted for pool expenses. Restricted or illiquid securities, such as private investments or non-traded securities are valued via inputs from the advisor based upon the current bid for the security from two or more independent dealers or other parties reasonably familiar with the facts and circumstances of the security (who should take into consideration all relevant factors as may be appropriate under the circumstances). If the advisor is unable to obtain a current bid from such independent dealers or other independent parties, the fair value committee shall determine the fair value of such security using the following factors: (i) the type of security; (ii) the cost at date of purchase; (iii) the size and nature of the Fund’s holdings; (iv) the discount from market value of unrestricted securities of the same class at the time of purchase and subsequent thereto; (v) information as to any transactions or offers with respect to the security; (vi) the nature and duration of restrictions on disposition of the security and the existence of any registration rights; (vii) how the yield of the security compares to similar securities of companies of similar or equal creditworthiness; (viii) the level of recent trades of similar or comparable securities; (ix) the liquidity characteristics of the security; (x) current market conditions; and (xi) the market value of any securities into which the security is convertible or exchangeable.
The Funds utilize various methods to measure the fair value of all of its investments on a recurring basis. GAAP establishes a hierarchy that prioritizes inputs to valuation methods. The three levels of input are:
Level 1 – Unadjusted quoted prices in active markets for identical assets and liabilities that the Funds have the ability to access.
Level 2 – Observable inputs other than quoted prices included in Level 1 that are observable for the asset or liability, either directly or indirectly. These inputs may include quoted prices for the identical instrument on an inactive market, prices for similar instruments, interest rates, prepayment speeds, credit risk, yield curves, default rates and similar data.
Level 3 – Unobservable inputs for the asset or liability, to the extent relevant observable inputs are not available, representing the Funds own assumptions about the assumptions a market participant would use in valuing the asset or liability, and would be based on the best information available.
| Redwood Funds |
| NOTES TO FINANCIAL STATEMENTS (Continued) |
| October 31, 2021 |
The availability of observable inputs can vary from security to security and is affected by a wide variety of factors, including, for example, the type of security, whether the security is new and not yet established in the marketplace, the liquidity of markets, and other characteristics particular to the security. To the extent that valuation is based on models or inputs that are less observable or unobservable in the market, the determination of fair value requires more judgment. Accordingly, the degree of judgment exercised in determining fair value is greatest for instruments categorized in Level 3.
The inputs used to measure fair value may fall into different levels of the fair value hierarchy. In such cases, for disclosure purposes, the level in the fair value hierarchy within which the fair value measurement falls in its entirety, is determined based on the lowest level input that is significant to the fair value measurement in its entirety.
The inputs or methodology used for valuing securities are not necessarily an indication of the risk associated with investing in those securities. The following tables summarize the inputs used as of October 31, 2021 for the Funds’ assets and liabilities measured at fair value:
| Redwood Managed Volatility Fund | ||||||||||||||||
| Assets | Level 1 | Level 2 | Level 3 | Total | ||||||||||||
| Short-Term Investments | $ | 137,588,718 | $ | — | $ | — | $ | 137,588,718 | ||||||||
| U.S. Government and Agencies | — | 25,700,163 | — | 25,700,163 | ||||||||||||
| Corporate Bonds | — | 8,738,751 | — | 8,738,751 | ||||||||||||
| Convertible Bond | — | 52,982 | — | 52,982 | ||||||||||||
| Swaps * | — | 10,466 | — | 10,466 | ||||||||||||
| Total | $ | 137,588,718 | $ | 34,502,362 | $ | — | $ | 172,091,080 | ||||||||
| Liabilities | Level 1 | Level 2 | Level 3 | Total | ||||||||||||
| Swaps * | $ | — | $ | 1,933,859 | $ | — | $ | 1,933,859 | ||||||||
| Redwood Managed Municipal Income Fund | ||||||||||||||||
| Assets | Level 1 | Level 2 | Level 3 | Total | ||||||||||||
| Short-Term Investments | $ | 145,696,196 | $ | — | $ | — | $ | 145,696,196 | ||||||||
| Open End Funds | 8,312,365 | — | — | 8,312,365 | ||||||||||||
| Total | $ | 154,008,561 | $ | — | $ | — | $ | 154,008,561 | ||||||||
| Redwood AlphaFactor® Tactical International Fund | ||||||||||||||||
| Assets | Level 1 | Level 2 | Level 3 | Total | ||||||||||||
| Common Stock | $ | 108,811,416 | $ | — | $ | — | $ | 108,811,416 | ||||||||
| Short-Term Investments | 99,552,143 | — | — | 99,552,143 | ||||||||||||
| U.S. Government and Obligations | — | 21,162,715 | — | 21,162,715 | ||||||||||||
| Swaps* | — | 433,160 | — | 433,160 | ||||||||||||
| Total | $ | 208,363,559 | $ | 21,595,875 | $ | — | $ | 229,959,434 | ||||||||
| Liabilities | ||||||||||||||||
| Swaps * | $ | — | $ | 444,996 | $ | — | $ | 444,996 | ||||||||
| Total | $ | — | $ | 444,996 | $ | — | $ | 444,996 | ||||||||
| Redwood Funds |
| NOTES TO FINANCIAL STATEMENTS (Continued) |
| October 31, 2021 |
| Redwood Systematic Macro Trend (“SMarT”) Fund | ||||||||||||||||
| Assets | Level 1 | Level 2 | Level 3 | Total | ||||||||||||
| Common Stock | $ | 81,093,162 | $ | — | $ | — | $ | 81,093,162 | ||||||||
| Short-Term Investments | 43,785,517 | — | — | 43,785,517 | ||||||||||||
| U.S. Government and Agencies | — | 23,291,479 | — | 23,291,479 | ||||||||||||
| Exchange-Traded Funds | 20,726,297 | — | — | 20,726,297 | ||||||||||||
| Open End Funds | — | 199,520 | — | 199,520 | ||||||||||||
| Swaps * | — | 754,142 | — | 754,142 | ||||||||||||
| Total | $ | 145,604,976 | $ | 24,245,141 | $ | — | $ | 169,850,117 | ||||||||
| Liabilities | ||||||||||||||||
| Swaps * | $ | — | $ | 42,650 | $ | — | $ | 42,650 | ||||||||
| Total | $ | — | $ | 42,650 | $ | — | $ | 42,650 | ||||||||
The Funds did not hold any Level 3 securities during the period.
| * | Net unrealized gain (loss) of swap contracts is reported in the above table. |
Swap Agreements – The Funds are subject to equity price risk and/or interest rate risk in the normal course of pursuing their respective investment objectives. The Funds may enter into various swap transactions for investment purposes or to manage interest rate, equity, foreign exchange (currency) or credit risk. These would be two-party contracts entered into primarily to exchange the returns (or differentials in rates of returns) earned or realized on particular pre-determined investments or instruments. The average month end notional value of the total return swaps that the Managed Volatility Fund, Tactical International Fund and SMarT Fund invested in during the year ended October 31, 2021 was $298,443,259, $216,466,655 and $39,287,819, respectively.
Credit Default Swaps – Credit default swaps (“CDS”) are typically two -party (bilateral) financial contracts that transfer credit exposure between the two parties. One party to a CDS (referred to as the credit protection “buyer”) receives credit protection or sheds credit risk, whereas the other party to a CDS (referred to as the credit protection “seller”) is selling credit protection or taking on credit risk. The seller typically receives pre-determined periodic payments from the other party. These payments are in consideration for agreeing to make compensating specific payments to the buyer should a negative credit event occur, such as (1) bankruptcy or (2) failure to pay interest or principal on a reference debt instrument, with respect to a specified issuer or one of the reference issuers in a CDS portfolio. In general, CDS may be used by the Funds to obtain credit risk exposure similar to that of a direct investment in high yield bonds. Credit default swaps involve risks because they are difficult to value, are highly susceptible to liquidity and credit risk, and generally pay a return to the party that has paid the premium only in the event of an actual default by the issuer of the underlying obligation (as opposed to a credit downgrade or other indication of financial difficulty). The Fund bears the loss of the amount expected to be received under a swap agreement in the event of the default or bankruptcy of a swap counterparty. The maximum risk of loss for sell protection on a credit default swap is the notional value of the total underlying amount of the swap.
The amounts to be exchanged or “swapped” between parties are calculated with respect to the notional amount. Changes in the value of swap agreements are recognized as unrealized gains or losses in the Statements of Operations by “marking to market” on a daily basis to reflect the value of the swap agreement at the end of each trading day. Payments received or paid at the beginning of the agreement are reflected as such on the Statements of Assets and Liabilities and may be referred to as upfront payments. A liquidation payment received or made at the termination of the swap agreement is recorded as a realized gain or loss on the Statements of Operations. The maximum pay-outs for these contracts are limited to the notional amount of each swap. CDS may involve greater risks than if the Funds had invested in the referenced obligation directly and are subject to general market risk, liquidity risk, counterparty risk and credit risk. The average month end notional value of the credit default swaps that the Managed Volatility Fund invested in during the year ended October 31, 2021 was $71,615,385.
| Redwood Funds |
| NOTES TO FINANCIAL STATEMENTS (Continued) |
| October 31, 2021 |
Impact of Derivatives on the Statement of Assets and Liabilities and Statement of Operations – The following is a summary of the location of derivative investments in the Statement of Assets and Liabilities as of October 31, 2021:
| Derivative Investment Type | Location on the Statement of Assets and Liabilities |
| Credit Default Swap Contracts | Unrealized Depreciation on Swap Contracts |
| Total Return Swap Contracts | Unrealized Appreciation (Depreciation) on Swap Contracts |
The following table sets forth the fair value of derivative contracts by primary risk exposure as of October 31, 2021:
| Managed Volatility Fund | ||||||||
| Derivatives Investment Value | ||||||||
| Interest Rate | ||||||||
| Derivative Investment Type | Risk | Equity Risk | ||||||
| Credit Default Swap Contracts | $ | (395,656 | ) | $ | — | |||
| Total Return Swap Contracts | — | (1,527,737 | ) | |||||
| Total | $ | (395,656 | ) | $ | (1,527,737 | ) | ||
| Tactical International Fund | ||||
| Derivatives Investment Value | ||||
| Derivative Investment Type | Equity Risk | |||
| Total Return Swap Contracts | $ | (11,836 | ) | |
| Total | $ | (11,836 | ) | |
| SMarT Fund | ||||
| Derivatives Investment Value | ||||
| Derivative Investment Type | Equity Risk | |||
| Total Return Swap Contracts | $ | 711,492 | ||
| Total | $ | 711,492 | ||
The following is a summary of the location of derivative investments on the Statements of Operations for the year ended October 31, 2021:
| Derivative Investment Type | Location of Gain/Loss on Derivative |
| Swap Contracts | Net Realized Gain/(Loss) from Security Transactions: Swap Contracts |
| Net Change in Unrealized Depreciation on Swap Contracts | |
| Option Contracts | Net Realized Gain/(Loss) from Security Transactions: Option Contracts |
| Net Change in Unrealized Appreciation on: Options Contracts |
| Redwood Funds |
| NOTES TO FINANCIAL STATEMENTS (Continued) |
| October 31, 2021 |
The following is a summary of the realized gain (loss) and changes in unrealized appreciation (depreciation) on derivative investments recognized in the Statements of Operations categorized by primary risk exposure for the year ended October 31, 2021:
| Managed Volatility Fund | ||||||||||||
| Realized gain/(loss) on derivatives recognized in the Statement of Operations | ||||||||||||
| Total for the | ||||||||||||
| Year Ended October 31, | ||||||||||||
| Derivative Investment Type | Interest Rate Risk | Equity Risk | 2021 | |||||||||
| Credit Default Swap Contracts | $ | (3,046,089 | ) | $ | — | $ | (3,046,089 | ) | ||||
| Total Return Swap Contracts | — | 18,422,622 | 18,422,622 | |||||||||
| Changes in unrealized appreciation/(depreciation) on derivatives recognized in the Statement of Operations | ||||||||||||
| Total for the | ||||||||||||
| Year Ended October 31, | ||||||||||||
| Derivative Investment Type | Interest Rate Risk | Equity Risk | 2021 | |||||||||
| Credit Default Swap Contracts | $ | (415,239 | ) | $ | — | $ | (415,239 | ) | ||||
| Total Return Swap Contracts | — | (1,318,101 | ) | (1,318,101 | ) | |||||||
| Tactical International Fund | ||||||||
| Realized gain/(loss) on derivatives recognized in the Statement of Operations | ||||||||
| Total for the | ||||||||
| Year Ended October 31, | ||||||||
| Derivative Investment Type | Equity Risk | 2021 | ||||||
| Total Return Swap Contracts | $ | 29,685,651 | $ | 29,685,651 | ||||
| Changes in unrealized appreciation/(depreciation) on derivatives recognized in the Statement of Operations | ||||||||
| Total for the | ||||||||
| Year Ended October 31, | ||||||||
| Derivative Investment Type | Equity Risk | 2021 | ||||||
| Total Return Swap Contracts | $ | 2,720,694 | $ | 2,720,694 | ||||
| Option Contracts | 32,606 | 32,606 | ||||||
| SMarT Fund | ||||||||
| Realized gain/(loss) on derivatives recognized in the Statement of Operations | ||||||||
| Total for the | ||||||||
| Year Ended October 31, | ||||||||
| Derivative Investment Type | Equity Risk | 2021 | ||||||
| Total Return Swap Contracts | $ | 5,751,214 | $ | 5,751,214 | ||||
| Option Contracts | (462,974 | ) | (462,974 | ) | ||||
| Changes in unrealized appreciation/(depreciation) on derivatives recognized in the Statement of Operations | ||||||||
| Total for the | ||||||||
| Year Ended October 31, | ||||||||
| Derivative Investment Type | Equity Risk | 2021 | ||||||
| Total Return Swap Contracts | $ | 680,284 | $ | 680,284 | ||||
The notional value of the derivative instruments outstanding as of October 31, 2021 as disclosed in the Portfolio of Investments and the amounts realized and changes in unrealized gains and losses on derivative instruments during the period as disclosed above and within the Statements of Operations serve as indicators of the volume of derivative activity for each Fund.
| Redwood Funds |
| NOTES TO FINANCIAL STATEMENTS (Continued) |
| October 31, 2021 |
Offsetting of Financial Assets and Derivative Assets – The following tables presents the Funds’ asset and liability derivatives available for offset under a master netting arrangement net of collateral pledged as of October 31, 2021.
| Managed Volatility Fund | ||||||||||||||||||||||||
| Gross Amounts Not Offset in the Statement | ||||||||||||||||||||||||
| Assets | of Assets & Liabilities | |||||||||||||||||||||||
| Net Amounts of Assets | ||||||||||||||||||||||||
| Gross Amounts Offset in | Presented in the | |||||||||||||||||||||||
| Gross Amounts of | the Statement of Assets & | Statement of Assets & | Financial | Cash Collateral | ||||||||||||||||||||
| Description | Recognized Assets | Liabilities | Liabilities | Instruments | Pledged | Net Amount | ||||||||||||||||||
| Swap Contracts | $ | 10,466 | $ | — | $ | 10,466 | $ | (10,466 | ) | $ | — | (1) | $ | — | ||||||||||
| Total | $ | 10,466 | $ | — | $ | 10,466 | $ | (10,466 | ) | $ | — | $ | — | |||||||||||
| Gross Amounts Not Offset in the Statement | ||||||||||||||||||||||||
| Liabilities | of Assets & Liabilities | |||||||||||||||||||||||
| Net Amounts of Liabilities | ||||||||||||||||||||||||
| Gross Amounts Offset in | Presented in the | |||||||||||||||||||||||
| Gross Amounts of | the Statement of Assets & | Statement of Assets & | Financial | Cash Collateral | ||||||||||||||||||||
| Description | Recognized Liabilities | Liabilities | Liabilities | Instruments | Pledged | Net Amount | ||||||||||||||||||
| Swap Contracts | $ | (1,933,859 | ) | $ | — | $ | (1,933,859 | ) | $ | 10,466 | $ | 1,923,393 | (1) | $ | — | |||||||||
| Total | $ | (1,933,859 | ) | $ | — | $ | (1,933,859 | ) | $ | 10,466 | $ | 1,923,393 | $ | — | ||||||||||
| Tactical International Fund | ||||||||||||||||||||||||
| Gross Amounts Not Offset in the Statement | ||||||||||||||||||||||||
| Assets | of Assets & Liabilities | |||||||||||||||||||||||
| Net Amounts of Assets | ||||||||||||||||||||||||
| Gross Amounts Offset in | Presented in the | |||||||||||||||||||||||
| Gross Amounts of | the Statement of Assets & | Statement of Assets & | Financial | Cash Collateral | ||||||||||||||||||||
| Description | Recognized Assets | Liabilities | Liabilities | Instruments | Pledged | Net Amount | ||||||||||||||||||
| Swap Contracts | $ | 433,160 | $ | — | $ | 433,160 | $ | (433,160 | ) | $ | — | $ | — | |||||||||||
| Total | $ | 433,160 | $ | — | $ | 433,160 | $ | (433,160 | ) | $ | — | $ | — | |||||||||||
| Gross Amounts Not Offset in the Statement | ||||||||||||||||||||||||
| Liabilities | of Assets & Liabilities | |||||||||||||||||||||||
| Net Amounts of Liabilities | ||||||||||||||||||||||||
| Gross Amounts Offset in | Presented in the | |||||||||||||||||||||||
| Gross Amounts of | the Statement of Assets & | Statement of Assets & | Financial | Cash Collateral | ||||||||||||||||||||
| Description | Recognized Liabilities | Liabilities | Liabilities | Instruments | Pledged | Net Amount | ||||||||||||||||||
| Swap Contracts | $ | (444,996 | ) | $ | — | $ | (444,996 | ) | $ | 433,160 | $ | 11,836 | (1) | $ | — | |||||||||
| Total | $ | (444,996 | ) | $ | — | $ | (444,996 | ) | $ | 433,160 | $ | 11,836 | $ | — | ||||||||||
| SMarT Fund | ||||||||||||||||||||||||
| Gross Amounts Not Offset in the Statement | ||||||||||||||||||||||||
| Assets | of Assets & Liabilities | |||||||||||||||||||||||
| Net Amounts of Assets | ||||||||||||||||||||||||
| Gross Amounts Offset in | Presented in the | |||||||||||||||||||||||
| Gross Amounts of | the Statement of Assets & | Statement of Assets & | Financial | Cash Collateral | ||||||||||||||||||||
| Description | Recognized Assets | Liabilities | Liabilities | Instruments | Pledged | Net Amount | ||||||||||||||||||
| Swap Contracts | $ | 754,142 | $ | — | $ | 754,142 | $ | (42,650 | ) | $ | — | (1) | $ | 711,492 | ||||||||||
| Total | $ | 754,142 | $ | — | $ | 754,142 | $ | (42,650 | ) | $ | — | $ | 711,492 | |||||||||||
| Gross Amounts Not Offset in the Statement | ||||||||||||||||||||||||
| Liabilities | of Assets & Liabilities | |||||||||||||||||||||||
| Net Amounts of Liabilities | ||||||||||||||||||||||||
| Gross Amounts Offset in | Presented in the | |||||||||||||||||||||||
| Gross Amounts of | the Statement of Assets & | Statement of Assets & | Financial | Cash Collateral | ||||||||||||||||||||
| Description | Recognized Liabilities | Liabilities | Liabilities | Instruments | Pledged | Net Amount | ||||||||||||||||||
| Swap Contracts | $ | (42,650 | ) | $ | — | $ | (42,650 | ) | $ | 42,650 | $ | — | $ | — | ||||||||||
| Total | $ | (42,650 | ) | $ | — | $ | (42,650 | ) | $ | 42,650 | $ | — | $ | — | ||||||||||
| (1) | The amount is limited to the derivative liability balance and accordingly, does not include excess collateral pledged. |
| Redwood Funds |
| NOTES TO FINANCIAL STATEMENTS (Continued) |
| October 31, 2021 |
As a result of the decreases in market value of the Fund’s assets pledged at derivative counterparties, the Fund has been required to post additional collateral relating to its margin requirements. The Fund has posted all required collateral; however, the Fund’s ability to meet future margin calls may be impacted by continued unfavorable market conditions.
Option Transactions – The Funds are subject to equity price risk in the normal course of pursuing its investment objective and may purchase or sell options to help hedge against risk. When a Fund writes put and call options, an amount equal to the premium received is included in the statement of assets and liability as a liability. The amount of the liability is subsequently marked-to-market to reflect the current market value of the option. If an option expires on its stipulated expiration date or if a Fund enters into a closing purchase transaction, a gain or loss is realized. If a written call option is exercised, a gain or loss is realized for the sale of the underlying security and the proceeds from the sale are increased by the premium originally received. As writer of an option, the Funds have no control over whether the option will be exercised and, as a result, retain the market risk of an unfavorable change in the price of the security underlying the written option.
Put options are purchased to hedge against a decline in the value of securities held in the Funds’ portfolio. If such a decline occurs, the put options will permit the Funds to sell the securities underlying such options at the exercise price, or to close out the options at a profit. The premium paid for a put or call option plus any transaction costs will reduce the benefit, if any, realized by the Funds upon exercise of the option, and, unless the price of the underlying security rises or declines sufficiently, the option may expire worthless to the Funds. In addition, in the event that the price of the security in connection with which an option was purchased moves in a direction favorable to the Funds, the benefits realized by the Funds as a result of such favorable movement will be reduced by the amount of the premium paid for the option and related transaction costs. Written and purchased options are non-income producing securities. With purchased options, there is minimal counterparty risk to the Funds since these options are exchange traded and the exchange’s clearinghouse, as counterparty to all exchange traded options, guarantees against a possible default.
Security Transactions and Related Income – Security transactions are accounted for on trade date basis. Interest income is recognized on an accrual basis. Discounts are accreted and premiums are amortized on securities purchased over the lives of the respective securities. Dividend income is recorded on the ex-dividend date. Realized gains or losses from sales of securities are determined by comparing the identified cost of the security lot sold with the net sales proceeds.
Dividends and Distributions to Shareholders – Dividends from net investment income are declared and distributed quarterly for the Managed Volatility Fund, and monthly for the Municipal Income Fund, Tactical International Fund and SMarT Fund. Distributable net realized capital gains are declared and distributed annually. Dividends from net investment income and distributions from net realized gains are recorded on ex dividend date and determined in accordance with federal income tax regulations, which may differ from GAAP. These “book/tax” differences are considered either temporary (i.e., deferred losses, capital loss carry forwards) or permanent in nature. To the extent these differences are permanent in nature, such amounts are reclassified within the composition of net assets based on their federal tax-basis treatment; temporary differences do not require reclassification.
Federal Income Taxes – It is each Fund’s policy to qualify as a regulated investment company by complying with the provisions of the Internal Revenue Code that are applicable to regulated investment companies and to distribute substantially all of their taxable income and net realized gains to shareholders. Therefore, no federal income tax provision has been recorded.
The Funds recognize the tax benefits of uncertain tax positions only where the position is “more likely than not” to be sustained assuming examination by tax authorities. Management has analyzed the Funds’ tax positions, and has concluded that no liability for unrecognized tax benefits should be recorded related to uncertain tax positions taken on returns filed for the open tax years ended October 31, 2018 to October 31, 2020 for the Managed Volatility Fund and Municipal Income Fund, and the open tax year ended October 31, 2019 to October 31, 2020 for the Tactical International Fund and SMarT Fund or positions expected to be taken in the Funds’ October 31, 2021 year-end tax returns. The Funds identify their major tax jurisdictions as U.S. Federal, Ohio and foreign jurisdictions where the Funds make significant investments; however, the Funds are not aware of any tax positions for which it is reasonably expected that the total amounts of unrecognized tax benefits will change materially in the next twelve months. The Funds recognize interest and penalties, if any, related to unrecognized tax
| Redwood Funds |
| NOTES TO FINANCIAL STATEMENTS (Continued) |
| October 31, 2021 |
benefits as income tax expense in the Statement of Operations. During the period, the Funds did not incur any interest or penalties.
Expenses – Expenses of the Trust that are directly identifiable to a specific fund are charged to that fund. Expenses, which are not readily identifiable to a specific fund, are allocated in such a manner as deemed equitable, taking into consideration the nature and type of expense and the relative sizes of the funds in the Trust.
Indemnification – The Trust indemnifies its officers and trustees for certain liabilities that may arise from the performance of their duties to the Trust. Additionally, in the normal course of business, the Funds enter into contracts that contain a variety of representations and warranties and which provide general indemnities. The Funds’ maximum exposure under these arrangements is unknown, as this would involve future claims that may be made against the Funds that have not yet occurred. However, the Funds expect the risk of loss due to these warranties and indemnities to be remote.
3. INVESTMENT TRANSACTIONS AND ASSOCIATED RISKS
The cost of purchases and proceeds from the sale of securities, other than short-term investments, for the year ended October 31, 2021 amounted to the following:
| Fund | Purchases | Sales | ||||||
| Managed Volatility Fund | $ | 35,797,751 | $ | 1,037,332 | ||||
| Municipal Income Fund | 9,949,867 | 162,072,491 | ||||||
| Tactical International Fund | 153,310,952 | 45,720,189 | ||||||
| SMarT Fund | 182,292,191 | 160,468,579 | ||||||
The Funds’ investments in securities, financial instruments and derivatives expose them to various risks, certain of which are discussed below. Each Fund’s prospectus and statement of additional information (“SAI”) include a more full listing of risks associated with each Fund’s investments. These risks include, but are not limited to:
Managed Volatility Fund: active trading risk, asset allocation risk, bank loan risk, borrowing risk, cash positions risk, counterparty risk, credit default swaps risk, credit risk, cybersecurity risk, derivatives risk, fixed income risk, gap risk, high-yield fixed income securities (“junk bonds”) risk, LIBOR risk, leveraging risk, liquidity risk, managed volatility strategy risk, management risk, market events risk, market risk, model risk, money market instrument risk, portfolio turnover risk, rules-based strategy risk, swap risk, swaptions risk, total return swaps risk, U.S. government securities risk, valuation risk and volatility risk.
Municipal Income Fund: active trading risk, asset allocation risk, borrowing risk, cash positions risk, counterparty risk, credit risk, cybersecurity risk, derivatives risk, fixed income securities risk, gap risk, high yield risk, investment companies and ETFs risk, LIBOR risk, leveraging risk, liquidity risk, management risk, market events risk, market risk, model risk, money market instrument risk, municipal bond risk, portfolio turnover risk, rules-based strategy risk, swap risk, taxability risk, underlying funds risk, U.S. government securities risk and volatility risk.
Tactical International Fund: active trading risk, American depositary receipts risk, cash positions risk, cybersecurity risk, derivatives risk, emerging markets risk, equity risk, foreign (non-U.S.) investment risk, gap risk, geographic and sector risk, index tracking error risk, investment companies and ETFs risk, liquidity risk, management risk, market capitalization risk, market events risk, market risk, money market instrument risk, passive investment risk, portfolio turnover risk, quantitative investing risk, rules based strategy risk, U.S. government securities risk, valuation risk and volatility risk.
SMarT Fund: bank loan risk, borrowing risk, cash positions risk, counterparty risk, credit risk, currency risk, cybersecurity risk, derivatives risk, emerging markets risk, equity risk, fixed income securities risk, foreign (non- U.S.) investment risk, gap risk, high yield risk, investment companies and ETFs risk, leveraging risk, LIBOR risk, liquidity risk, management risk, market capitalization risk, market events risk, market risk, money market instrument risk, portfolio turnover risk, preferred
| Redwood Funds |
| NOTES TO FINANCIAL STATEMENTS (Continued) |
| October 31, 2021 |
securities risk, quantitative investing risk, real estate investment trusts risk, swap risk, U.S. government securities risk, underlying funds risk, valuation risk, and volatility risk.
Cash Positions Risk – The Funds may hold a significant position in cash and/or cash equivalent securities. When the Funds’ investment in cash or cash equivalent securities increases, the Funds may not participate in market advances or declines to the same extent that it would if the Funds were more fully invested. With respect to the Municipal Income Fund, the Fund or an underlying fund in which it invests may sell securities that lose their tax-exempt statuses at inopportune times, which may cause tax consequences or a decrease in the Fund’s value.
Derivatives Risk – The Funds may invest in derivative instruments. The derivative instruments held by the Funds may be more volatile than other instruments and may be subject to unanticipated market movements, which are potentially unlimited. The risks associated with investments in derivatives also include leverage, liquidity, interest rate, market, credit and management risks, mispricing or improper valuations. Certain derivatives require a Fund to make margin payments, a form of security deposit intended to protect against nonperformance of the derivative contract. A Fund may have to post additional margin if the value of the derivative position changes in a manner adverse to the Fund. Changes in the market value of a derivative may not correlate perfectly with the underlying asset, rate or index, and a Fund could lose more than the principal amount invested. In addition, if a derivative is being used for hedging purposes there can be no assurance given that each derivative position will achieve a perfect correlation with the security or currency against which it is being hedged, or that a particular derivative position will be available when sought by the portfolio manager.
Equity Risk – Tactical International Fund, and SMarT Fund are subject to equity risk. Equity securities are susceptible to general market fluctuations volatile increases and decreases in value as market confidence in and perceptions of their issuers change. Factors that may influence the price of equity securities include developments affecting a specific company or industry, or changing economic, political or market conditions.
Fixed Income Risk – The Managed Volatility Fund, Municipal Income Fund and SMarT Fund are subject to fixed income securities risk. When a Fund invests in fixed income securities or derivatives, the value of your investment in the Fund will fluctuate with changes in interest rates. Typically a rise in interest rates causes a decline in the value of fixed income securities or derivatives owned by a Fund. In general, the market price of fixed income securities with longer maturities will increase or decrease more in response to changes in interest rates than shorter-term securities. Risks associated with rising interest rates are heightened given that interest rates in the U.S. currently remain near historic lows. Other risk factors include credit risk (the debtor may default) and prepayment risk (the debtor may pay its obligation early, reducing the amount of interest payments). These risks could affect the value of a particular investment by a Fund, possibly causing the Fund’s share price and total return to be reduced and fluctuate more than other types of investments. The fixed-income securities market can be susceptible to increases in volatility and decreases in liquidity. Liquidity may decline unpredictably in response to overall economic conditions or credit tightening. For example, a general rise in interest rates may cause investors to move out of fixed income securities on a large scale, which could adversely affect the price and liquidity of fixed income securities and could also result in increased redemptions for a Fund.
Index Tracking Error Risk – The International Fund is subject to index tracking error risk. As with all index funds, the performance of a Fund and its Index may differ from each other for a variety of reasons. For example, the Fund incurs operating expenses and portfolio transaction costs not incurred by the Index. In addition, the Fund may not be fully invested in securities of the Index at all times, may deviate from the relative weightings of the Index, or may hold securities not included in the Index. Tracking error risk may be heightened during times of market volatility or other unusual market conditions.
Investment Companies and ETFs Risk – When a Fund invests in other investment companies, including ETFs, it will bear additional expenses based on its pro rata share of the other investment company’s or ETF’s operating expenses, including the potential duplication of management fees. The risk of owning an investment company or ETF generally reflects the risk of owning the underlying investments held by the investment company or ETF. A Fund will also incur brokerage costs when it purchases and sells ETFs.
Market Risk – Overall market risk may affect the value of individual instruments in which a Fund invests. A Fund is subject to the risk that the securities markets will move down, sometimes rapidly and unpredictably, based on overall economic
| Redwood Funds |
| NOTES TO FINANCIAL STATEMENTS (Continued) |
| October 31, 2021 |
conditions and other factors, which may negatively affect the Fund’s performance. Factors such as domestic and foreign (non - U.S.) economic growth and market conditions, real or perceived adverse economic or political conditions, inflation, changes in interest rate levels, lack of liquidity in the bond or other markets, volatility in the securities markets, adverse investor sentiment affect the securities markets and political events affect the securities markets. Securities markets also may experience long periods of decline in value. When the value of a Fund’s investments goes down, your investment in the Fund decreases in value and you could lose money.
Local, state, regional, national or global events such as war, acts of terrorism, the spread of infectious illness or other public health issues, recessions, or other events could have a significant impact on a Fund and its investments and could result in decreases to the Fund’s net asset value. Political, geopolitical, natural and other events, including war, terrorism, trade disputes, government shutdowns, market closures, natural and environmental disasters, epidemics, pandemics and other public health crises and related events and governments’ reactions to such events have led, and in the future may lead, to economic uncertainty, decreased economic activity, increased market volatility and other disruptive effects on U.S. and global economies and markets. Such events may have significant adverse direct or indirect effects on a Fund and its investments. For example, a widespread health crisis such as a global pandemic could cause substantial market volatility, exchange trading suspensions and closures, impact the ability to complete redemptions, and affect Fund performance. A health crisis may exacerbate other pre-existing political, social and economic risks. In addition, the increasing interconnectedness of markets around the world may result in many markets being affected by events or conditions in a single country or region or events affecting a single or small number of issuers.
COVID-19 has resulted in travel restrictions, closed international borders, enhanced health screenings at ports of entry and elsewhere, disruption of and delays in healthcare service preparation and delivery, prolonged quarantines, cancellations, business and school closings, supply chain disruptions, and lower consumer demand, as well as general concern and uncertainty. The impact of COVID-19, and other infectious illness outbreaks that may arise in the future, could adversely affect the economies of many nations or the entire global economy, individual issuers and capital markets in ways that cannot necessarily be foreseen.
Municipal Bond Risk – The underlying funds in which the Municipal Income Fund may invest may be affected significantly by the economic, regulatory or political developments affecting the ability of issuers of debt securities whose interest is, in the opinion of bond counsel for the issuer at the time of issuance, exempt from federal income tax to pay interest or repay principal. For example, COVID- 19 has significantly stressed the financial resources of many municipal issuers, which may impair a municipal issuer’s ability to meet its financial obligations when due and could adversely impact the value of its bonds, which could negatively impact the performance of the Fund.
Swap Risk – The Managed Volatility Fund, Municipal Income, SMarT Fund, and Tactical International Fund are each subject to swap risk. Swap agreements are subject to the risk that the counterparty to the swap will default on its obligation to pay the Fund and the risk that the Fund will not be able to meet its obligations to pay the counterparty to the swap. In addition, there is the risk that a swap may be terminated by a Fund or the counterparty in accordance with its terms. If a swap were to terminate, a Fund may be unable to implement its investment strategies and the Fund may not be able to seek to achieve its investment objective. See Note 2 to the Financial Statements for further discussion of swaps and credit default swaps.
Credit Default Swaps Risk – A credit default swap enables an investor to buy or sell protection against a credit event with respect to an issuer. Credit default swaps involve risks because they are difficult to value, are highly susceptible to liquidity and credit risk, and generally pay a return to the party that has paid the premium only in the event of an actual default by the issuer of the underlying obligation (as opposed to a credit downgrade or other indication of financial difficulty). A Fund bears the loss of the amount expected to be received under a swap agreement in the event of the default or bankruptcy of a swap agreement counterparty.
Taxability Risk – There is no guarantee that all of the Municipal Income Fund’s income will remain exempt from federal or state or local income taxes. The Fund or an underlying fund in which it invests may sell securities that lose their tax-exempt statuses at inopportune times, which may cause tax consequences or a decrease in the Fund’s value. In order to pay tax-exempt interest, tax- exempt securities must meet certain legal requirements. Failure to meet such requirements may cause the interest received and distributed by the Fund to shareholders to be taxable. If the Fund fails to meet the requirements
| Redwood Funds |
| NOTES TO FINANCIAL STATEMENTS (Continued) |
| October 31, 2021 |
necessary to pay out exempt-interest dividends to its shareholders, the income distributions resulting from all of its investments, including its municipal securities, may be subject to federal income tax when received by shareholders.
Total Return Swaps Risk – A total return swap is a contract in which one party agrees to make periodic payments to another party based on the change in market value of the assets underlying the contract, which may include a specified security, basket of securities, or securities indices during the specified period, in return for periodic payments based on a fixed or variable interest rate or the total return from other underlying assets. Total return swap agreements may be used to obtain exposure to a security or market without owning or taking physical custody of such security or investing directly in such market. Total return swap agreements may effectively add leverage to the Fund’s portfolio because, in addition to its total net assets, the Fund would be subject to investment exposure on the notional amount of the swap. The primary risks associated with total returns swaps are credit risks (if the counterparty fails to meet its obligations) and market risk (if there is no liquid market for the agreement or unfavorable changes occur to the underlying asset).
Volatility Risk – The Fund may have investments that appreciate or decrease significantly in value over short periods of time. This may cause the Fund’s net asset value per share to experience significant increases or declines in value over short periods of time.
| 4. | INVESTMENT ADVISORY AGREEMENT AND TRANSACTIONS WITH RELATED PARTIES |
Advisory Fees – Redwood Investment Management, LLC serves as the Funds’ Investment Advisor (the “Advisor”) . Pursuant to investment advisory agreements with the Funds, the Advisor, under the oversight of the Board, directs the daily operations of the Funds and supervises the performance of administrative and professional services provided by others. As compensation for its services and the related expenses borne by the Advisor, the Funds pay the Advisor an investment advisory fee, computed and accrued daily and paid monthly, at an annual rate of average daily net assets as follows:
| Fund | Management Fee | |
| Managed Volatility Fund | 1.25% | |
| Municipal Income Fund | 0.70% | |
| Tactical International Fund | 0.90% | |
| SMarT Fund | 1.00% |
The Advisor has contractually agreed to reduce its fees and/or absorb expenses of the Funds, until at least March 1, 2022 to ensure that Total Annual Fund Operating Expenses after fee waiver and/or reimbursement (exclusive of any front-end or contingent deferred loads; brokerage fees and commissions; acquired fund fees and expenses; borrowing costs, such as interest and dividend expenses on securities sold short; taxes; and extraordinary expenses, such as litigation expenses) will not exceed the expense limitations of the Funds’ average daily net assets for each Fund’s share classes, as listed in the table below, subject to possible recoupment from the Funds in future years on a rolling three year basis (within the three years of when the amount was waived or reimbursed) if such recoupment can be achieved within the foregoing expense limits as well as any expense limit that was in effect at the time the waiver or reimbursement was made. The expense limitations are as follows:
| Fund | Expense Limitation | |||||||||||
| Class I | Class N | Class Y | ||||||||||
| Managed Volatility Fund | 1.67 | % | 1.92 | % | 1.43 | % | ||||||
| Municipal Income Fund | 1.00 | % | 1.25 | % | ||||||||
| Tactical International Fund | 1.20 | % | 1.45 | % | ||||||||
| SMarT Fund | 1.30 | % | 1.55 | % | ||||||||
| Redwood Funds |
| NOTES TO FINANCIAL STATEMENTS (Continued) |
| October 31, 2021 |
During the year ended October 31, 2021, the Advisor reimbursed $247,949, $106,128, $62,459, and $41,530 to the Managed Volatility Fund, Municipal Income Fund, Tactical International Fund, and SMarT Fund respectively. No expenses were recaptured during the year ended October 31, 2021. Cumulative expenses subject to recapture will expire on October 31 of the following years:
| Managed | Municipal Income | Tactical | ||||||||||||||
| Year | Volatility Fund | Fund | International Fund | SMarT Fund | ||||||||||||
| 2022 | 409,145 | 148,961 | 55,962 | 62,061 | ||||||||||||
| 2023 | 299,527 | 158,926 | 112,009 | 123,172 | ||||||||||||
| 2024 | 247,949 | 106,128 | 62,459 | 41,530 | ||||||||||||
| Total | $ | 956,621 | $ | 414,015 | $ | 230,430 | $ | 226,763 | ||||||||
The Board has adopted the Trust’s Master Distribution and Shareholder Servicing Plan (the “Plan”) pursuant to Rule 12b-1 under the 1940 Act with respect to Class N shares of each of the Funds. The Plan provides that a monthly service and/or distribution fee is calculated by the Funds at an annual rate of 0.25% of its average daily net assets for Class N and is paid to Northern Lights Distributors, LLC (the “Distributor”) to provide compensation for ongoing shareholder servicing and distribution- related activities or services and/or maintenance of the Funds’ shareholder accounts not otherwise required to be provided by the Advisor. During the year ended October 31, 2021, Class N paid $ 6,116, $0, $5, and $0 in distribution fees for the Managed Volatility Fund, Municipal Income Fund, Tactical International Fund, and SMarT Fund respectively.
The Distributor acts as each Fund’s principal underwriter in a continuous public offering of each Fund’s share classes. For the year ended October 31, 2021 there were no underwriting commissions paid.
In addition, certain affiliates of the Distributor provide services to the Funds as follows:
Ultimus Fund Solutions, LLC (“UFS”) – UFS, an affiliate of the Distributor, provides administration, fund accounting, and transfer agent services to the Trust. Pursuant to separate servicing agreements with UFS, the Funds pay UFS customary fees for providing administration, fund accounting and transfer agency services to the Funds. Certain officers of the Trust are also officers of UFS, and are not paid any fees directly by the Funds for serving in such capacities.
Northern Lights Compliance Services, LLC (“NLCS”) – NLCS, an affiliate of UFS and the Distributor, provides a Chief Compliance Officer to the Trust, as well as related compliance services, pursuant to a consulting agreement between NLCS and the Trust. Under the terms of such agreement, NLCS receives customary fees from the Funds.
Blu Giant, LLC (“Blu Giant”), an affiliate of UFS and the Distributor, provides EDGAR conversion and filing services as well as print management services for the Funds on an ad-hoc basis. For the provision of these services, BluGiant receives customary fees from the Funds.
| Redwood Funds |
| NOTES TO FINANCIAL STATEMENTS (Continued) |
| October 31, 2021 |
| 5. | AGGREGATE UNREALIZED APPRECIATION AND DEPRECIATION – TAX BASIS |
The identified cost of investments in securities owned by the Funds for federal income tax purposes, and their respective gross unrealized appreciation and depreciation at October 31, 2021, were as follows:
| Tax Net | ||||||||||||||||
| Cost for Federal | Unrealized | Unrealized | Unrealized | |||||||||||||
| Portfolio | Tax Purposes | Appreciation | Depreciation | App/Dep | ||||||||||||
| Redwood Managed Volatility Fund | $ | 172,816,827 | $ | 50,788 | $ | (787,001 | ) | $ | (736,213 | ) | ||||||
| Redwood Managed Municipal Income Fund | 153,899,831 | 126,749 | (18,019 | ) | 108,730 | |||||||||||
| Redwood AlphaFactor International Fund | 230,929,253 | 983,597 | (2,386,576 | ) | (1,402,979 | ) | ||||||||||
| Redwood Systematic Macro Trends Fund | 152,117,351 | 19,538,940 | (2,560,316 | ) | 16,978,624 | |||||||||||
| 6. | DISTRIBUTION TO SHAREHOLDERS & TAX COMPONENTS OF CAPITAL |
The tax character of distributions paid during the following years was as follows:
| For the period ended October 31, 2021: | ||||||||||||||||||||
| Ordinary | Long-Term | Return | Tax Exempt | |||||||||||||||||
| Portfolio | Income | Capital Gains | of Capital | Income | Total | |||||||||||||||
| Redwood Managed Volatility Fund | $ | 14,308,569 | $ | — | $ | — | $ | — | $ | 14,308,569 | ||||||||||
| Redwood Managed Municipal Income Fund | 359,576 | 96,649 | — | 2,653,850 | 3,110,075 | |||||||||||||||
| Redwood AlphaFactor International Fund | 8,146,017 | — | — | — | 8,146,017 | |||||||||||||||
| Redwood Systematic Macro Trends Fund | 7,470,889 | — | — | — | 7,470,889 | |||||||||||||||
| For the period ended October 31, 2020: | ||||||||||||||||||||
| Ordinary | Long-Term | Return | Tax-Exempt | |||||||||||||||||
| Portfolio | Income | Capital Gains | of Capital | Income | Total | |||||||||||||||
| Redwood Managed Volatility Fund | $ | 4,190,879 | $ | — | $ | — | $ | — | $ | 4,190,879 | ||||||||||
| Redwood Managed Municipal Income Fund | 3,813,483 | — | — | — | 3,813,483 | |||||||||||||||
| Redwood AlphaFactor International Fund | 1,210,768 | — | — | — | 1,210,768 | |||||||||||||||
| Redwood Systematic Macro Trends Fund | 1,511,118 | — | — | — | 1,511,118 | |||||||||||||||
As of October 31, 2021, the components of accumulated earnings/(deficit) on a tax basis were as follows:
| Undistributed | Undistributed | Post October Loss | Capital Loss | Other | Unrealized | Total | ||||||||||||||||||||||
| Ordinary | Long-Term | and | Carry | Book/Tax | Appreciation/ | Accumulated | ||||||||||||||||||||||
| Portfolio | Income | Capital Gains | Late Year Loss | Forwards | Differences | (Depreciation) | Earnings/(Deficits) | |||||||||||||||||||||
| Redwood Managed Volatility Fund | $ | 16,764,030 | $ | — | $ | — | $ | (51,063,296 | ) | $ | — | $ | (736,213 | ) | $ | (35,035,479 | ) | |||||||||||
| Redwood Managed Municipal Income Fund | — | 7,503,545 | — | — | — | 108,730 | 7,612,275 | |||||||||||||||||||||
| Redwood AlphaFactor International Fund | 26,175,231 | — | — | (5,161,461 | ) | — | (1,402,979 | ) | 19,610,791 | |||||||||||||||||||
| Redwood Systematic Macro Trends Fund | 12,914,544 | 351,275 | — | — | (1,838 | ) | 16,978,624 | 30,242,605 | ||||||||||||||||||||
The difference between book basis and tax basis accumulated net investment income (loss), accumulated net realized gains (losses), and unrealized appreciation (depreciation) from investments is primarily attributable to the mark to market treatment of swaps, tax deferral of losses on wash sales and straddles, tax adjustments for real estate investment trusts and
| Redwood Funds |
| NOTES TO FINANCIAL STATEMENTS (Continued) |
| October 31, 2021 |
C-Corporation return of capital distributions. In addition, the unrealized appreciation (depreciation) in the table above includes unrealized foreign currency gains (losses) of $(57,240) for the Redwood AlphaFactor International Fund.
At October 31, 2021, the Fund had capital loss carry forwards for federal income tax purposes available to offset future capital gains as follows:
| Non-Expiring | ||||||||||||||||
| Portfolio | Short-Term | Long-Term | Total | CLCF Utilized | ||||||||||||
| Redwood Managed Volatility Fund | $ | 38,265,565 | $ | 12,797,731 | $ | 51,063,296 | $ | — | ||||||||
| Redwood Managed Municipal Income Fund | — | — | — | 4,570,192 | ||||||||||||
| Redwood AlphaFactor International Fund | 5,161,461 | — | 5,161,461 | 7,393,167 | ||||||||||||
| Redwood Systematic Macro Trends Fund | — | — | — | 3,920,272 | ||||||||||||
| 7. | BENEFICIAL OWNERSHIP |
The beneficial ownership, either directly or indirectly, of more than 25% of the voting securities of a Fund creates presumption of control of the Fund, under Section 2(a)(9) of the 1940 Act. As of October 31, 2021 the companies that held more than 25% of the voting securities of the Funds, and may be deemed to control the respective Fund, are as follows:
| Tactical | ||||||||
| Managed Volatility | Municipal | International | ||||||
| Owner | Fund | Income Fund | Fund | SMarT Fund | ||||
| TD Ameritrade (1) | 51.3% | 54.8% | 64.8% | 63.3% |
| (1) | These owners are comprised of multiple investors and accounts. |
| 8. | UNDERLYING INVESTMENT IN OTHER INVESTMENT COMPANIES |
Each underlying fund, including each exchange -traded fund (“ETF”), is subject to specific risks, depending on the nature of the underlying fund. These risks could include liquidity risk, sector risk, foreign and related currency risk, as well as risks associated with real estate investments and commodities. Investors in the Fund will indirectly bear fees and expenses charged by the underlying investment companies in which the Fund invests in addition to the Fund’s direct fees and expenses.
The performance of the Redwood Managed Volatility Fund will be directly affected by the performance of the First American Government Obligations Fund, Class X. The annual report for this security, along with the report of the independent registered public accounting firms are included in those securities N-CSR’s are available at “www.sec.gov”. As of October 31, 2021, the percentage of the Redwood Managed Volatility Fund’s net assets invested in First American Government Obligations Fund, Class X was 51.5%.
The performance of the Redwood Managed Municipal Income Fund will be directly affected by the performance of the BlackRock Liquidity Funds MuniCash, Institutional Class. The annual report for this security, along with the report of the independent registered public accounting firms are included in those securities N-CSR’s are available at “www.sec.gov”. As of October 31, 2021, the percentage of the Redwood Managed Municipal Income Fund’s net assets invested in BlackRock Liquidity Funds MuniCash, Institutional Class was 66.3%.
The performance of the Redwood Alphafactor® Tactical International Fund will be directly affected by the performance of the First American Government Obligations Fund, Class X. The annual report for this security, along with the report of the independent registered public accounting firms are included in those securities N-CSR’s are available at “www.sec.gov”. As of October 31, 2021, the percentage of the Redwood Alphafactor® Tactical International Fund’s net assets invested in First American Government Obligations Fund, Class X was 48.4%.
| Redwood Funds |
| NOTES TO FINANCIAL STATEMENTS (Continued) |
| October 31, 2021 |
| 9. | NEW ACCOUNTING PRONOUNCEMENTS |
In March 2020, FASB issued ASU 2020 -04, Reference Rate Reform (Topic 848): Facilitation of the Effects of Reference Rate Reform on Financial Reporting (’‘ASU 2020-04’’). The amendments in ASU 2020-04 provide optional temporary financial reporting relief from the effect of certain types of contract modifications due to the planned discontinuation of LIBOR and other interbank- offered based reference rates as of the end of 2021. ASU 2020-04 is effective for certain reference rate-related contract modifications that occur during the period March 12, 2020 through December 31, 2022. Management is currently evaluating the impact, if any of applying this ASU.
In October 2020, the Securities and Exchange Commission (“SEC”) adopted new regulations governing the use of derivative by registered investment companies (“Rule 18f-4”). Rule 18f-4 will impose limits on the amount of derivatives a Fund can enter into, eliminate the asset segregation framework currently used by funds to comply with Section 18 of the 1940 Act, and require funds whose use of derivatives is greater than a limited specified amount to establish and maintain a comprehensive derivatives risk management program and appoint a derivatives risk manager. Funds will be required to comply with Rule 18f-4 by August 19,2022. It is not currently clear what impact, if any, Rule 18f-4 will have on the availability, liquidity or performance of derivatives. Management is currently evaluating the potential impact of Rule 18f-4 on the Funds. When fully implemented, Rule 18f-4 may require changes in how a Fund uses derivatives, adversely affect the Fund’s performance and increase costs related to the Funds’ use of derivatives.
| 10. | SUBSEQUENT EVENTS |
Subsequent events after the date of the Statements of Assets and Liabilities have been evaluated through the date the financial statements were issued. Management has determined that no events or transactions occurred requiring adjustment or disclosure in the financial statements.
 | ||
GRANT THORNTON LLP Two Commerce Square 2001 Market Street, Suite 700 Philadelphia, PA 19103
D +1 215 561 4200 F +1 215 561 1066 | REPORT OF INDEPENDENT REGISTERED PUBLIC ACCOUNTING FIRM | |
| Board of Trustees of the Two Roads Shared Trust and Shareholders of Redwood Managed Volatility Fund | ||
| Redwood Managed Municipal Income Fund | ||
| Redwood AlphaFactor® Tactical International Fund | ||
| Redwood Systematic Macro Trend (“SMarT”) Fund | ||
| Opinion on the financial statements | ||
| We have audited the accompanying statements of assets and liabilities, including the schedules of investments, of Redwood Managed Volatility Fund, Redwood Managed Municipal Income Fund, Redwood AlphaFactor® Tactical International Fund, and Redwood Systematic Macro Trend (“SMarT”) Fund (four of the funds in the Two Roads Shared Trust) (collectively, the “Funds”) as of October 31, 2021, the related statements of operations, changes in net assets and the financial highlights for each of the periods indicated in the table below, and the related notes (collectively referred to as the “financial statements”). In our opinion, the financial statements present fairly, in all material respects, the financial position of the Funds as of October 31, 2021, and the results of their operations, changes in their net assets, and their financial highlights for each of the periods indicated in the table below, in conformity with accounting principles generally accepted in the United States of America. |
| Fund | Statement of Operations | Statements of Changes in Net Assets | Financial Highlights |
| Redwood Managed Volatility Fund | For the year ended October 31, 2021 | For each of the two years in the period ended October 31, 2021 | For each of the five years in the period ended October 31, 2021 |
| Redwood Managed Municipal Income Fund | For the year ended October 31, 2021 | For each of the two years in the period ended October 31, 2021 | For each of the four years in the period ended October 31, 2021 and for the period March 9, 2017 (commencement of operations) through October 31, 2017 |
| Redwood AlphaFactor® Tactical International Fund | For the year ended October 31, 2021 | For each of the two years in the period ended October 31, 2021 | For each of the three years in the period ended October 31, 2021 and for the period November 2, 2017 (commencement of operations) through October 31, 2018 |
| Redwood Systematic Macro Trend (“SMarT”) Fund | For the year ended October 31, 2021 | For each of the two years in the period ended October 31, 2021 | For each of the three years in the period ended October 31, 2021 and for period November 2, 2017 (commencement of operations) through October 31, 2018 |
| GT.COM | Grant Thornton LLP is the U.S. member firm of Grant Thornton International Ltd (GTIL). GTIL and each of its member firms are separate legal entities and are not a worldwide partnership. |
| |
| Basis for opinion | |
| These financial statements are the responsibility of the Funds’ management. Our responsibility is to express an opinion on the Funds’ financial statements based on our audits. We are a public accounting firm registered with the Public Company Accounting Oversight Board (United States) (“PCAOB”) and are required to be independent with respect to the Funds in accordance with the U.S. federal securities laws and the applicable rules and regulations of the Securities and Exchange Commission and the PCAOB. | |
| We conducted our audits in accordance with the standards of the PCAOB. Those standards require that we plan and perform the audit to obtain reasonable assurance about whether the financial statements are free of material misstatement, whether due to error or fraud. The Funds are not required to have, nor were we engaged to perform, an audit of their internal control over financial reporting. As part of our audits we are required to obtain an understanding of internal control over financial reporting but not for the purpose of expressing an opinion on the effectiveness of the Funds’ internal control over financial reporting. Accordingly, we express no such opinion. | |
| Our audits included performing procedures to assess the risks of material misstatement of the financial statements, whether due to error or fraud, and performing procedures that respond to those risks. Such procedures included examining, on a test basis, evidence regarding the amounts and disclosures in the financial statements. Our procedures included confirmation of securities owned as of October 31, 2021, by correspondence with the custodian and brokers; when replies were not received from brokers, we performed other auditing procedures. Our audits also included evaluating the accounting principles used and significant estimates made by management, as well as evaluating the overall presentation of the financial statements and financial highlights. We believe that our audits provide a reasonable basis for our opinion. | |
 | |
| We have served as the auditor of one or more investment companies in the Two Roads Shared Trust since 2016. | |
| Philadelphia, Pennsylvania | |
| December 30, 2021 |
| Redwood Funds |
| EXPENSE EXAMPLES (Unaudited) |
| October 31, 2021 |
As a shareholder of the Funds you incur two types of costs: (1) transaction costs (such as front-end loads and redemption fees) and (2) ongoing costs, including advisory fees, distribution and/or service (12b-1 fees) fees and other Fund expenses. This example is intended to help you understand your ongoing costs (in dollars) of investing in the Funds and to compare these costs with the ongoing costs of investing in other mutual funds. Please note, the expenses shown in the tables are meant to highlight ongoing costs only and do not reflect any transactional costs.
This example is based on an investment of $1,000 invested for the period of time beginning May 1, 2021 and held through October 31, 2021.
Actual Expenses: The “Actual Expenses” column in the table below provides information about actual account values and actual expenses. You may use the information below, together with the amount you invested, to estimate the expenses that you paid over the period. Simply divide your account value by $1,000 (for example, an $8,600 account value divided by $1,000 = 8.6), then multiply the result by the number in the table under the heading entitled “Expenses Paid During Period” to estimate the expenses you paid on your account during this period.
Hypothetical Examples for Comparison Purposes: The “Hypothetical” column in the table below provides information about hypothetical account values and hypothetical expenses based on the Funds’ actual expense ratio and an assumed rate of return of 5% per year before expenses, which is not the Funds’ actual return. The hypothetical account values and expenses may not be used to estimate the actual ending account balances or expenses you paid for the period. You may use this information to compare this 5% hypothetical example with the 5% hypothetical examples that appear in the shareholder reports of other funds.
Please note that the expenses shown in the table are meant to highlight your ongoing costs only and do not reflect any transactional costs such as front-end sales charges (loads). Therefore, the table is useful in comparing ongoing costs only, and will not help you determine the relative total costs of owning different funds. In addition, if these transactional costs were included, your costs would have been higher.
| Hypothetical | ||||||||||||||
| Actual | (5% return before expenses) | |||||||||||||
| Fund’s | Beginning | Ending | Expenses | Ending | Expenses | |||||||||
| Annualized | Account Value | Account Value | Paid During | Account Value | Paid During | |||||||||
| Class I | Expense Ratio | 5/1/21 | 10/31/2021 | Period* | 10/31/2021 | Period* | ||||||||
| Redwood Managed Volatility Fund | 1.52% | $1,000.00 | $1,001.00 | $7.67 | $1,017.54 | $7.73 | ||||||||
| Redwood Managed Municipal Income Fund | 1.00% | $1,000.00 | $1,017.10 | $5.08 | $1,020.16 | $5.09 | ||||||||
| Redwood AlphaFactor® Tactical International Fund | 1.20% | $1,000.00 | $1,011.20 | $6.08 | $1,019.16 | $6.11 | ||||||||
| Redwood Systematic Macro Trend “SMarT” Fund | 1.30% | $1,000.00 | $1,029.70 | $6.65 | $1,018.65 | $6.61 | ||||||||
| Class N | ||||||||||||||
| Redwood Managed Volatility Fund | 1.78% | $1,000.00 | $999.30 | $8.97 | $1,016.23 | $9.05 | ||||||||
| Redwood Managed Municipal Income Fund | 1.25% | $1,000.00 | $1,016.40 | $6.35 | $1,018.90 | $6.36 | ||||||||
| Redwood AlphaFactor® Tactical International Fund | 1.45% | $1,000.00 | $1,011.20 | $7.35 | $1,017.90 | $7.38 | ||||||||
| Redwood Systematic Macro Trend “SMarT” Fund | 1.55% | $1,000.00 | $1,029.40 | $7.93 | $1,017.39 | $7.88 | ||||||||
| Class Y | ||||||||||||||
| Redwood Managed Volatility Fund | 1.43% | $1,000.00 | $1,001.60 | $7.21 | $1,018.00 | $7.27 | ||||||||
| * | Expenses are equal to the average account value over the period, multiplied by the Funds’ annualized expense ratio, multiplied by the number of days in the period ended October 31, 2021 (184) divided by the number of days in the fiscal year (365). |
| Redwood Funds |
| SUPPLEMENTAL INFORMATION (Unaudited)(Continued) |
| October 31, 2021 |
Trustees and Officers. The Trustees and officers of the Trust, together with information as to their principal business occupations during the past five years and other information, are shown below. Unless otherwise noted, the address of each Trustee and Officer is 225 Pictoria Drive, Suite 450, Cincinnati, OH 45246.
Independent Trustees *
| Name, Address, Year of Birth | Position(s) Held with Registrant | Term and Length Served | Principal Occupation(s) During Past 5 Years | Number of Portfolios Overseen In The Fund Complex** | Other Directorships Held During Past 5 Years |
| Mark Garbin Year of Birth: 1951 | Trustee | Indefinite, Since 2012 | Managing Principal, Coherent Capital Management LLC (since 2008) | 10 | Northern Lights Fund Trust (since 2013); Northern Lights Variable Trust (since 2013); Forethought Variable Insurance Trust (since 2013); OHA Mortgage Strategies Fund (offshore), Ltd. (2014 - 2017); iCapital KKR Private Markets Fund (since 2014); and Carlyle Tactical Private Credit Fund (since March 2018) |
| Mark D. Gersten Year of Birth: 1950 | Chairman, Trustee | Indefinite, Since 2012 | Independent Consultant (since 2012); Senior Vice President – Global Fund Administration Mutual Funds & Alternative Funds, AllianceBernstein LP (1985 – 2011) | 10 | Northern Lights Fund Trust (since 2013); Northern Lights Variable Trust (since 2013); iCapital KKR Private Markets Fund (since 2014); previously, Ramius Archview Credit and Distressed Fund (2015-2017); and Schroder Global Series Trust (2012 to 2017) |
| Neil M. Kaufman Year of Birth: 1960 | Trustee, Audit Committee Chairman | Indefinite, Since 2012 | Managing Member, Kaufman, McGowan PLLC (legal services)(Since 2016); Partner, Abrams Fensterman, Fensterman, Eisman, Formato, Ferrara & Wolf, LLP (legal services)(2010-2016) | 10 | iCapital KKR Private Markets Fund (since 2014) |
| Anita K. Krug Year of Birth: 1969 | Trustee | Indefinite, Since 2012 | Dean and Professor (since 2019) Illinois Institute of Technology; Interim Vice Chancellor for Academic Affairs (2018-2019) University of Washington Bothell; Interim Dean (2017-2018), Professor (2016-2019), Associate Professor (2014-2016); and Assistant Professor (2010-2014), University of Washington School of Law | 10 | iCapital KKRPrivate Markets Fund (since 2014); Centerstone Investors Trust (2016-2021) |
| * | Information is as of October 31, 2021. |
| ** | As of October 31, 2021, the Trust was comprised of 24 active portfolios managed by seven unaffiliated investment advisers and two affiliated investment advisers. The term “Fund Complex” applies only to those funds that (i) are advised by a common investment adviser or by an investment adviser that is an affiliated person of the investment adviser of any of the other funds in the Trust or (ii) hold themselves out to investors as related companies for purposes of investment and investor services. [The Funds do not hold themselves out as related to any other series within the Trust, except for the Redwood Managed Volatility Fund, Redwood Managed Municipal Income Fund, Redwood AlphaFactor Tactical International Fund, and Redwood Systematic Macro Trend (“SMarT”) Fund, which are also advised by the Fund’s Adviser.] |
10/31/2021 – Two Roads v2
Redwood Funds
SUPPLEMENTAL INFORMATION (Unaudited)(Continued)
October 31, 2021
Officers of the Trust*
| Name, Address, Year of Birth | Position(s) Held with Registrant | Principal Occupation(s) During Past 5 Years | Number of Portfolios Overseen In The Fund Complex** | Other Directorships Held During Past 5 Years |
| James Colantino 80 Arkay Drive Hauppauge, NY 11788 Year of Birth: 1969 | President Since Feb. 2017 Treasurer (2012 to 2017) | Senior Vice President (2012-present); Vice President (2004 to 2012); Ultimus Fund Solutions LLC | N/A | N/A |
| Laura Szalyga 80 Arkay Drive Hauppauge, NY 11788 Year of Birth: 1978 | Treasurer Since Feb. 2017 | Vice President, Ultimus Fund Solutions LLC (since 2015); Assistant Vice President, Ultimus Fund Solutions LLC (2011-2014) | N/A | N/A |
| Richard A. Malinowski 80 Arkay Drive Hauppauge, NY 11788 Year of Birth: 1983 | Vice President Since Sep. 2018 Secretary Since 2013 | Senior Vice President and Senior Managing Counsel, Ultimus Fund Solutions LLC, (since February 2020); Senior Vice President Legal Administration, Ultimus Fund Solutions LLC (April 2017 to February 2020); Vice President and Counsel (April 2016 – 2017) and AVP and Staff Attorney (September 2012 –March 2016). | N/A | N/A |
| William B. Kimme Year of Birth: 1962 | Chief Compliance Officer Since Inception | Senior Compliance Officer, Northern Lights Compliance Services, LLC (September 2011 - present) | N/A | N/A |
| * | Information is as of October 31, 2021. |
| ** | As of October 31, 2021, the Trust was comprised of 24 active portfolios managed by seven unaffiliated investment advisers and two affiliated investment advisers. The term “Fund Complex” applies only to those funds that (i) are advised by a common investment adviser or by an investment adviser that is an affiliated person of the investment adviser of any of the other funds in the Trust or (ii) hold themselves out to investors as related companies for purposes of investment and investor services. [The Funds do not hold themselves out as related to any other series within the Trust, except for the Redwood Managed Volatility Fund, Redwood Managed Municipal Income Fund, Redwood AlphaFactor Tactical International Fund, and Redwood Systematic Macro Trend (“SMarT”) Fund, which are also advised by the Fund’s Adviser.] |
The Fund’s Statement of Additional Information (“SAI”) includes additional information about the Trustees and is available free of charge, upon request, by calling toll-free at 1-855-733-3863.
10/31/2021 – Two Roads v2
| Redwood Funds |
| SUPPLEMENTAL INFORMATION (Unaudited) |
| October 31, 2021 |
LIQUIDITY RISK MANAGEMENT PROGRAM
The Funds have adopted and implemented a written liquidity risk management program as required by Rule 22e-4 (the “Liquidity Rule”) under the 1940 Act. The program is reasonably designed to assess and manage the Funds’ liquidity risk, taking into consideration, among other factors, the Funds’ investment strategy and the liquidity of their portfolio investments during normal and reasonably foreseeable stressed conditions; their short and long-term cash flow projections; and their cash holdings and access to other funding sources.
During the fiscal period ended October 31, 2021, the Trust’s Liquidity Risk Management Program Committee (the “Committee”) reviewed the Funds’ investments and determined that the Funds held adequate levels of cash and highly liquid investments to meet shareholder redemption activities in accordance with applicable requirements. Accordingly, the Committee concluded that (i) the Funds’ liquidity risk management program is reasonably designed to prevent violations of the Liquidity Rule and (ii) the Funds’ liquidity risk management program has been effectively implemented.
| PRIVACY NOTICE | |||||||||
| FACTS | WHAT DOES TWO ROADS SHARED TRUST DO WITH YOUR PERSONAL INFORMATION | ||||||||
| Why? | Financial companies choose how they share your personal information. Federal law gives consumers the right to limit some but not all sharing. Federal law also requires us to tell you how we collect, share, and protect your personal information. Please read this notice carefully to understand what we do. | ||||||||
| What? | THE TYPES OF PERSONAL INFORMATION WE COLLECT AND SHARE DEPENDS ON THE PRODUCT OR SERVICE THAT YOU HAVE WITH US. THIS INFORMATION CAN INCLUDE: | ||||||||
| ● Social Security number and income | |||||||||
| ● Account transactions and transaction history | |||||||||
| ● Investment experience and purchase history | |||||||||
| When you are no longer our customer, we continue to share your information as described in this notice. | |||||||||
| How? | All financial companies need to share customers’ personal information to run their everyday business. In the section below, we list the reasons financial companies can share their customers’ personal information; the reason Two Roads Shared Trust chooses to share and whether you can limit this sharing. | ||||||||
| Reasons we can share your personal information | Does Two Roads Shared Trust share? | Can you limit this sharing? |
| For our everyday business purposes – such as to process your transactions, maintain your account(s), respond to court orders and legal investigations, or report to credit bureaus | YES | NO |
| For our marketing purposes – to offer our products and services to you | NO | We do not share |
| For joint marketing with other financial companies | NO | We do not share |
| For our affiliates’ everyday business purposes – information about your transactions and experiences | NO | We do not share |
| For our affiliates’ everyday business purposes – information about your creditworthiness | NO | We do not share |
| For our affiliates to market to you | NO | We do not share |
| For nonaffiliates to market to you | NO | We do not share |
| Questions? | Call 1-402-895-1600 | |
What we do
| How does Two Roads Shared Trust protect my personal information? | To protect your personal information from unauthorized access and use, we use security measures that comply with federal law. These measures include computer safeguards and secured files and buildings.
Our service providers are held accountable for adhering to strict policies and procedures to prevent any misuse of your nonpublic personal information. |
| How does Two Roads Shared Trust collect my personal information? | We collect your personal information, for example, when you |
| ● open an account or give us contact information | |
| ● provide account information or give us your income information | |
| ● make deposits or withdrawals from your account | |
| We also collect your personal information from other companies. | |
| Why can’t I limit all sharing? | Federal law gives you the right to limit only |
| ● sharing for affiliates’ everyday business purposes – information about your creditworthiness | |
| ● affiliates from using your information to market to you | |
| ● sharing for nonaffiliates to market to you | |
| State laws and individual companies may give you additional rights to limit sharing | |
| Definitions | |
| Affiliates | Companies related by common ownership or control. They can be financial and nonfinancial companies. |
| ● Two Roads Shared Trust has no affiliates. | |
| Nonaffiliates | Companies not related by common ownership or control. They can be financial and nonfinancial companies. |
| ● Two Roads Shared Trust does not share with nonaffiliates so they can market to you. | |
| Joint marketing | A formal agreement between nonaffiliates financial companies that together market financial products or services to you. |
| ● Two Roads Shared Trust does not jointly market. | |
Proxy Voting Policy
Information regarding how the Funds vote proxies relating to portfolio securities for the 12 month period ended June 30th as well as a description of the policies and procedures that the Funds used to determine how to vote proxies is available without charge, upon request, by calling 1-855-852-8998 or by referring to the Securities and Exchange Commission’s (“SEC”) website at http://www.sec.gov.
Portfolio Holdings
Each Fund files its complete schedule of portfolio holdings with the SEC for the first and third quarters of each fiscal year on Form N-PORT. Form N-PORT reports are available on the SEC’s website at http://www.sec.gov. The information on Form N-PORT is available without charge, upon request, by calling 1-855-733-3863.
| Investment Advisor |
| Redwood Investment Management, LLC |
| 4110 N Scottsdale Rd, Suite 125 |
| Scottsdale, AZ 85251 |
| Administrator |
| Ultimus Fund Solutions, LLC |
| 225 Pictoria Drive, Suite 450 |
| Cincinnati, OH 45246 |
| REDWOOD-AR21 |
ITEM 2. CODE OF ETHICS.
| (a) | The registrant has, as of the end of the period covered by this report, adopted a code of ethics that applies to the registrant's principal executive officer, principal financial officer, and principal accounting officer or controller, or persons performing similar functions, regardless of whether these individuals are employed by the registrant or a third party. |
| (b) | During the period covered by this report, there were no amendments to any provision of the code of ethics. |
| (c) | During the period covered by this report, there were no waivers or implicit waivers of a provision of the code of ethics. |
ITEM 3. AUDIT COMMITTEE FINANCIAL EXPERT.
| The registrant’s Board of Trustees has determined that Mark Gersten is an audit committee financial expert, as defined in Item 3 of Form N-CSR. Mr Gersten is independent for purposes of this Item 3. |
ITEM 4. PRINCIPAL ACCOUNTANT FEES AND SERVICES.
| (a) | Audit Fees. The aggregate fees billed for each of the last two fiscal years for professional services rendered by the registrant's principal accountant for the audit of the registrant's annual financial statements or services that are normally provided by the accountant in connection with statutory and regulatory filings or engagements for those fiscal years are as follows:
|
| Trust Series | 2021 | 2020 |
| Redwood Managed Volatility Fund | $17,250 | $17,000 |
| Redwood Managed Municipal Income Fund | $17,250 | $15,750 |
| Redwood AlphaFactor® Tactical International Fund | $17,250 | $16,750 |
| Redwood Systematic Macro Trend Fund | $17,250 | $16,750 |
| (b) | Audit-Related Fees. There were no fees billed in each of the last two fiscal years for assurances and related services by the principal accountant that are reasonably related to the performance of the audit of the registrant’s financial statements and are not reported under paragraph (a) of this item. |
| (c) | Tax Fees. The aggregate fees billed in each of the last two fiscal years for professional services rendered by the principal accountant for tax compliance are as follows: |
| Trust Series | 2021 | 2020 |
| Redwood Managed Volatility Fund | $3,200 | $3,050 |
| Redwood Managed Municipal Income Fund | $3,200 | $3,050 |
| Redwood AlphaFactor® Tactical International Fund | $3,200 | $3,050 |
| Redwood Systematic Macro Trend Fund | $3,200 | $3,050 |
| (d) | All Other Fees. The aggregate fees billed in each of the last two fiscal years for products and services provided by the registrant’s principal accountant, other than the services reported in paragraphs (a) through (c) of this item were $0 for the fiscal year ended October 31, 2020. |
| (e)(1) | The audit committee does not have pre-approval policies and procedures. Instead, the audit committee or audit committee chairman approves on a case-by-case basis each audit or non-audit service before the principal accountant is engaged by the registrant. |
| (e)(2) | There were no services described in each of paragraphs (b) through (d) of this Item that were approved by the audit committee pursuant to paragraph (c)(7)(i)(C) of Rule 2-01 of Regulation S-X. |
| f) | Not applicable. The percentage of hours expended on the principal accountant's engagement to audit the registrant's financial statements for the most recent fiscal year that were attributed to work performed by persons other than the principal accountant's full-time, permanent employees was zero percent (0%). |
| (g) | All non-audit fees billed by the registrant's principal accountant for services rendered to the registrant for the fiscal year ended October 31, 2020 are disclosed in (b)-(d) above. There were no audit or non-audit services performed by the registrant's principal accountant for the registrant's adviser. |
| (h) | Not applicable.
|
ITEM 5. AUDIT COMMITTEE OF LISTED REGISTRANTS.
Not applicable
ITEM 6. SCHEDULE OF INVESTMENT
Included in annual report to shareholders filed under item 1 of this form.
ITEM 7. DISCLOSURE OF PROXY VOTING POLICIES AND PROCEDURES FOR CLOSED-END MANAGEMENT INVESTMENT COMPANIES.
Not applicable Fund is an open-end management investment company
ITEM 8. PORTFOLIO MANAGERS OF CLOSED-END MANAGEMENT INVESTMENT COMPANIES
Not applicable Fund is an open-end management investment company
ITEM 9. PURCHASES OF EQUITY SECURITIES BY CLOSED-END MANAGEMENT INVESTMENT COMPANY AND AFFILIATED PURCHASERS.
Not applicable Fund is an open-end management investment company
ITEM 10. SUBMISSION OF MATTERS TO A VOTE OF SECURITY HOLDERS.
Not applicable at this time.
ITEM 11. CONTROLS AND PROCEDURES.
| (a) | The registrant's principal executive and principal financial officers, or persons performing similar functions, have concluded that the registrant's disclosure controls and procedures (as defined in Rule 30a-3(c) under the 1940 Act), are effective, as of a date within 90 days of the filing date of this report, based on the evaluation of these controls and procedures required by Rule 30a-3(b) under the 1940 Act and Rule 15d-15(b) under the Securities Exchange Act of 1934, as amended. |
| (b) | There were no changes in the registrant's internal control over financial reporting (as defined in Rule 30a-3(d) under the 1940 Act) that occurred during the period covered by this report that have materially affected, or are reasonably likely to materially affect, the registrant's internal control over financial reporting. |
ITEM 12. DISCLOSURE OF SECURITIES LENDING ACTIVITIES FOR CLOSED-END MANAGEMENT INVESTMENT COMPANIES.
Not applicable Fund is an open-end management investment company
ITEM 13. EXHIBITS
| (1) | Code of Ethics for Principal Executive and Senior Financial Officers is attached hereto. |
| (2) | Certifications pursuant to Section 302 of the Sarbanes-Oxley Act of 2002 are filed herewith. |
| (3) | Certifications pursuant to Section 906 of the Sarbanes-Oxley Act of 2002 are filed herewith. |
SIGNATURES
Pursuant to the requirements of the Securities Exchange Act of 1934 and the Investment Company Act of 1940, the registrant has duly caused this report to be signed on its behalf by the undersigned, thereunto duly authorized.
Two Roads Shared Trust
| By James Colantino | /s/James Colantino |
| President/Principal Executive Officer, | |
| Date: January 6, 2022 | |
Pursuant to the requirements of the Securities Exchange Act of 1934 and the Investment Company Act of 1940, this report has been signed below by the following person on behalf of the registrant and in the capacities and on the date indicated.
| By James Colantino | /s/James Colantino |
| President/Principal Executive Officer | |
| Date: January 6, 2022 | |
Pursuant to the requirements of the Securities Exchange Act of 1934 and the Investment Company Act of 1940, this report has been signed below by the following person on behalf of the registrant and in the capacities and on the date indicated.
| By Laura Szalyga | /s/ Laura Szalyga |
| Treasurer/Principal Financial Officer | |
| Date: January 6, 2022 | |