united states
securities and exchange commission
washington, d.c. 20549
form n-csr
certified shareholder report of registered management
investment companies
Investment Company Act file number 811-22718
Two Roads Shared Trust
(Exact name of registrant as specified in charter)
225 Pictoria Drive, Suite 450, Cincinnati, OH 45246
(Address of principal executive offices) (Zip code)
Richard Malinowski, Gemini Fund Services, LLC.
4221 North 203rd Street, Suite 100, Elkhorn, NE 68022
(Name and address of agent for service)
Registrant's telephone number, including area code: 631-470-2619
Date of fiscal year end: 10/31
Date of reporting period: 10/31/21
ITEM 1. REPORTS TO SHAREHOLDERS.
 |
| Annual Report |
| October 31, 2021 |
| Recurrent MLP & Infrastructure Fund |
| Class I Shares (RMLPX) |
| 1-833-RECURRENT |
| (1-833-732-8773) |
| www.recurrentadvisors.com |
| Distributed by Northern Lights Distributors, LLC |
| Member FINRA |
This report and the financial statements contained herein are submitted for the general information of shareholders and are not authorized for distribution to prospective investors unless preceded or accompanied by an effective prospectus, which contains information about the Fund’s investment objective, risks, fees and expenses. Investors are reminded to read the prospectus carefully before investing in the Fund.

1
 | Recurrent MLP & Infrastructure Fund (RMLPX) Fiscal 2021 Annual Report (10/31/21) |
Recurrent MLP & Infrastructure Fund – FY 2021 at a glance
Before we discuss the performance of the Recurrent MLP & Infrastructure Fund (“RMLPX” or the “Fund”), we want to thank all of our clients – current and prospective – for their trust and support. Thanks to your support, RMLPX has grown from $90mm to $221mm since the last fiscal year.
In the fiscal year ended October 31, 2021, RMLPX enjoyed the benefits of a broad recovery in cyclical and commodity-oriented assets, which began in earnest in early November 2020 in conjunction with successful clinical trials of multiple COVID vaccines. A year later, we have seen what we believe is the beginning of a long-awaited recovery in the sectors where we invest, including energy and infrastructure assets.
On one hand, the successful development of vaccines, and their rapid dissemination throughout the world in 2021, has supported a robust economic recovery that has translated into stronger demand for energy and higher commodity prices. Despite progress made in 2021, there is still a ways to go until the world returns to its pre-COVID economic activity. Many offices remain closed, and different strains of COVID, such as the Delta variant which became the dominant global strain in summer 2021, have caused periodic economic slowdowns throughout the year, although each new flare-up has been notably less severe from an economic perspective than the initial outbreak in the first calendar quarter of 2020.
Perhaps equally impactful as the ongoing macroeconomic recovery has been the company-level improvements we have witnessed across the sectors where we invest. While many other cyclical and travel-oriented sectors of the economy relied on emergency government funding during the COVID outbreak, the energy sector had been hardened by years of falling commodity prices even before the appearance of COVID. During COVID, the relative credit quality of energy companies actually improved, as multi-year programs of cost cutting and debt reduction continued, and the industry’s slate of growth investments, already whittled down since 2015, was reduced dramatically. Encouragingly, in the later months of FY 2021, we saw a broad increase in dividend payouts and stock buybacks across our investment universe, with many management teams guiding to higher payouts again in FY 2022.
As a result, as we put FY 2021 in the rearview mirror, we believe, although we cannot guarantee, that energy infrastructure and midstream companies are poised to generate greater levels of free cash flow (FCF) than they have in at least 20 years. As we look forward into FY 2022, we expect to see continued announcements of higher dividend payouts and increased buybacks, which we believe will support equity valuations and benefit the companies we hold in RMLPX.
During FY 2021 (from November 1, 2020 through October 31, 2021), RMLPX generated a +91.87% total return, outperforming the +85.70% return of the Alerian MLP Index (AMZ) by +6.17%. From the Fund’s November 2, 2017 inception date through October 31, 2021, RMLPX has returned +8.70% (+2.11% on an annualized basis), exceeding the AMZ’s +1.02% total return by +7.68%, and exceeding the AMZ’s +0.25% annualized return by +1.86%.
The performance data quoted here represents past performance. For performance data current to the most recent month end, please call (833)-RECURRENT. Current performance may be lower or higher than the performance data quoted above. Past performance is no guarantee of future results. The investment return and principal value of an investment in the Fund will fluctuate so that investors’ shares, when redeemed, may be worth more or less than their original cost. Per the fee table in the Fund’s March 1, 2021 prospectus, total Annual Operating Expenses are 1.38% for RMLPX; although the Adviser has agreed to cap total fund expenses for the fund (excluding certain expenses) at 1.25% through at least March 1, 2022.
2
| Recurrent MLP & Infrastructure Fund (RMLPX) Fiscal 2021 Annual Report (10/31/21) |
Recurrent MLP & Infrastructure Fund – Market Outlook
After FY 2020 overlapped with the worst 12-month performance period in midstream history, FY 2021 ended October 31, 2021 offered a welcome respite, with an inflationary macroeconomic backdrop (part 1 below) combining with improved company-level financials (part 2 below) to deliver strong absolute and relative performance for RMLPX and the midstream sector as a whole.
Looking forward, there is significant reason to believe that much of the supportive backdrop will continue into FY 2022, while company-level financial strength continues to improve. We walk through major economic and industry-level themes below.
Part 1: midstream has been a sector that has historically benefitted from higher inflation
The economic shock of COVID in 2020 gave way to dramatically lower levels of capital investment across the economy, effectively reducing inventories and industrial productive capacity across the world. As the economy roared back to life in 2021, the underinvestment of the previous year gave rise to levels of inflation not seen since the 1980s (as measured by the US Producer Price Index, or PPI).
Exhibit 1: Inflation metrics have been elevated during 2021, driven primarily by commodity prices
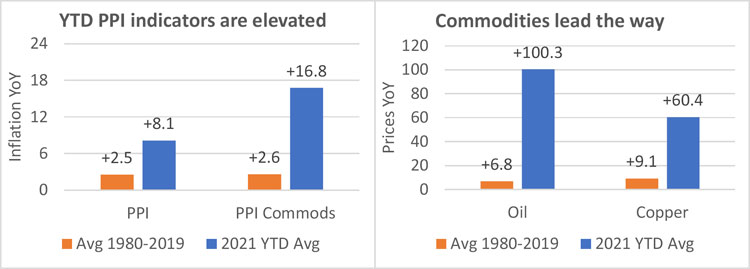
Notes: PPI reflects US Producer Price Index (PPI); PPI Commods reflects the PPI Commodity Index (PCI). Oil price reflects WTI; Copper reflects LME Copper pricing. Data retrieved as of 10/31/21.
Source: Bloomberg, Company public filings, Recurrent Investment Advisors.
While inflation has had negative impacts on the cost structures of many non-energy businesses, energy companies (including midstream MLPs) have generally benefitted, as commodity price inflation generally increases energy company revenues and cash flows, while energy company cost structures remain depressed by the multi-year downturn that culminated in the COVID shock of 2020.
3
| Recurrent MLP & Infrastructure Fund (RMLPX) Fiscal 2021 Annual Report (10/31/21) |
Exhibit 2: Correlation of asset class returns vs. inflation, as measured by the US producer price index (PPI)
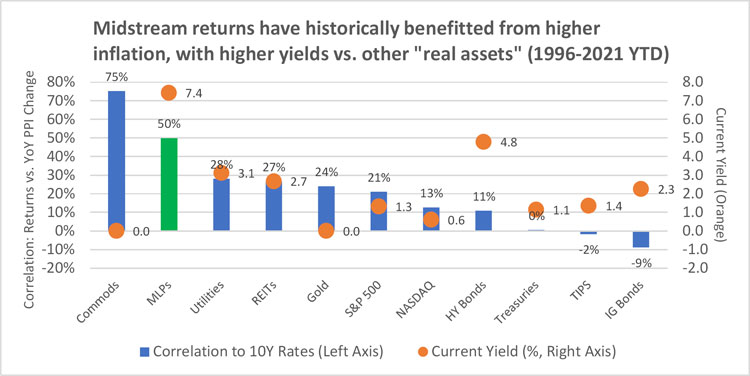
Notes: MLPs reflect Alerian MLP Index (AMZ); Commodities reflect Bloomberg Commodity Index; Utilities reflect S&P 500 Utilities; REITs reflect Dow Jones REIT Index; High Yield, Treasuries, TIPS, Inv Grade bonds reflect corresponding Bloomberg Barclays Aggregate Total Return Bond Indices. Data retrieved as of 10/31/21.
Source: Bloomberg, Company public filings, Recurrent Investment Advisors.
Interestingly, the energy industry is both a beneficiary of increased inflation, and a cause of higher inflation. Since 2020, reduced drilling levels in the US have meaningfully curtailed oil and gas production. Exhibit 3 shows how oil price inflation has been driven in part by depressed capital investment.
Exhibit 3: oil price inflation has been spurred by insufficient investment in new production
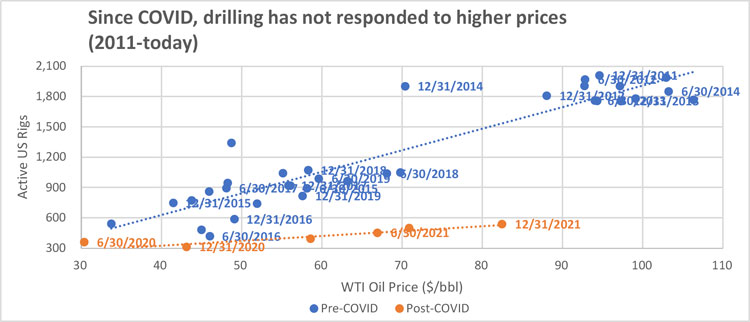
Source: Recurrent research, Bloomberg estimates and company guidance, public filings.
Notes: See “notes” under Exhibit 1.
4
| Recurrent MLP & Infrastructure Fund (RMLPX) Fiscal 2021 Annual Report (10/31/21) |
Prior to COVID, US rig counts ranged from 400 to 2,000 as oil prices ranged from roughly $35 to $110 per barrel. Post-COVID, rig count has not exceeded 600, despite oil exceeding $80 per barrel on October 31, 2021. We believe that oil prices should remain fundamentally supported as long as US production remains depressed by low levels of investment, given that US shale production drove an outsized (and arguably excessive) portion of global supply growth in the decade prior to COVID.
Part 2: industry-level financial discipline supports the positive outlook for midstream
While the macroeconomic and commodity backdrop supports the midstream sector’s “top line” (revenue and cash flow), cost discipline and restrained reinvestment also bolsters the “bottom line” (profit and free cash flow) outlook for the midstream sector.
This improved “bottom line” outlook has been predicated on improved credit quality, a theme we’ve discussed in our previous 3 annual reports. As shown in Exhibit 4, US midstream credit spreads (average midstream bond yields vs. the BBB average) have shown significant tightening while other cyclical sectors have seen increased relative borrowing costs.
Exhibit 4: US midstream credit spreads have tightened vs. BBB (investment grade), reflecting improved balance sheets

Source: Recurrent research, Bloomberg data. Data as of 10/31/21.
Changes reflect average 5-10 year maturities across each sector, compared to the yield of the Bloomberg/Barclays US Credit Corporate 5-10 year Index, measured on 12/31/19 and again on 10/31/21.
While midstream financial health has demonstrably improved – as evidenced by declining borrowing costs in the bond markets – the equity markets have been slow to discount these improvements. While FY 2021 midstream equity total returns were strong, a comparison of equity yields and bond yields offer an indication of how much equity valuations have lagged during 2021’s recovery.
As seen in Exhibit 5, equities currently offer nearly 400 bps of additional yield compared to bonds issued by the same companies. In other words, despite equities’ potential for growth and greater alignment with management, bonds offer roughly 3.0% in yield, with no potential for income growth over time, while equity yields offer roughly 7.4% as of October 31, 2021.
5
| Recurrent MLP & Infrastructure Fund (RMLPX) Fiscal 2021 Annual Report (10/31/21) |
Exhibit 5: while credit markets see limited risk in midstream, equities do not yet reflect this improvement
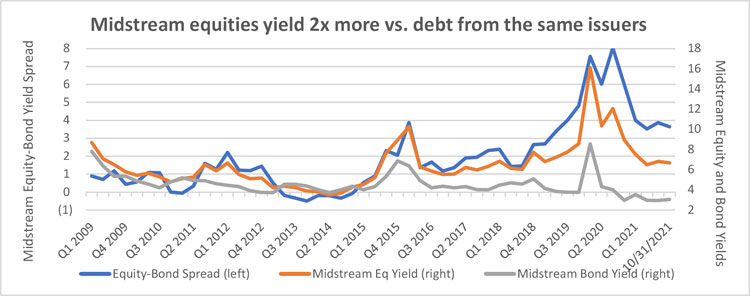
Source: Recurrent research, Bloomberg data; includes bond and equity yields of current and past AMZ members, 2014-today.
With financial discipline having successfully driven a significant improvement in midstream balance sheets, we believe we can declare the “debt reduction” phase of the midstream recovery largely complete. With bondholders apparently satisfied, midstream companies can focus on rewarding shareholders, who have experienced meaningful underperformance vs. S&P 500 and NASDAQ over the past 3-year, 5-year, and 10-year periods. As shown in Exhibit 6, we believe midstream companies are well-positioned to deliver significant cash back to shareholders in 2022, as low reinvestment rates and robust cash flows deliver significant FCF.
Exhibit 6: midstream free cash flow generation is accelerating as growth projects roll off
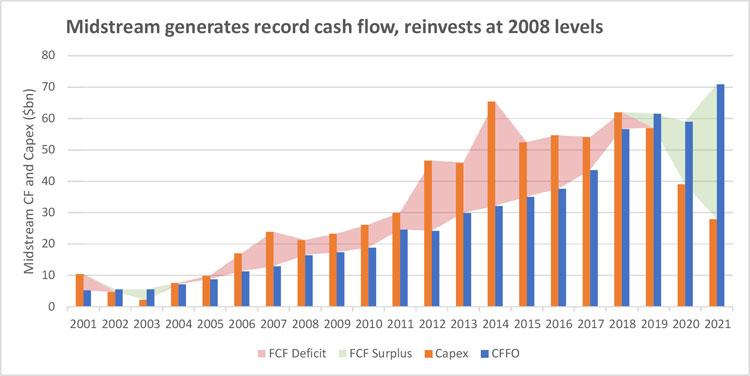
Source: Recurrent research, Bloomberg data, public filings. Includes financial data for current and past members of the Alerian MLP Index (AMZ), 2014-today.
6
| Recurrent MLP & Infrastructure Fund (RMLPX) Fiscal 2021 Annual Report (10/31/21) |
In conclusion, we believe 2021 was a beginning, not an end, for midstream
In late 2020, our letter focused on the potential free cash flow inflection that we believed was possible in 2021. When we wrote that letter, we had just experienced a uniquely challenging twelve-month period for midstream and the energy industry as a whole. Today, we write our letter after a powerful twelve-month rally that recouped the losses of FY 2020. But we believe, although we cannot guarantee, that this is the beginning, not the end, of the midstream recovery. Sure enough, the potential free cash flow we highlighted a year ago has begun to materialize – not only in the form of a significant equity rally, but also in the form of falling borrowing costs, and now the emergence of cash return programs, designed by midstream managements to reward long-suffering shareholders (and themselves) after a painful few years. In our investment universe, we’ve seen over 50% of our coverage companies announce future buyback plans, and 30% of our coverage companies initiated buybacks during FY 2021. This compares to a year ago, when less than 5% of our universe had enacted a buyback plan. In FY 2022, we have every expectation that these percentages will increase again, paving the way for greater cash returns – regular dividends, special dividends, share buybacks – to reward shareholders and indirectly, investors in RMLPX.
Best regards,
Brad Olsen and Mark Laskin
Co-Founders and Portfolio Managers
Recurrent Investment Advisors (Advisor of the Recurrent MLP & Infrastructure Fund)
The views in this report are those of the Fund’s management. This report contains certain forward-looking statements about factors that may affect the performance of the Fund in the future. These statements are based on the Fund’s management’s predictions and expectations concerning certain future events such as the performance of the economy as a whole and of specific industry sectors. Management believes these forward-looking statements are reasonable, although they are inherently uncertain and difficult to predict.
7
| Recurrent MLP & Infrastructure Fund (RMLPX) Fiscal 2021 Annual Report (10/31/21) |
Recurrent MLP & Infrastructure Fund (RMLPX)
FY 2021 Portfolio Commentary
During FY 2021 (from November 1, 2020 through October 31, 2021), RMLPX generated a +91.87% total return, outperforming the +85.70% return of the Alerian MLP Index (AMZ) by +6.17%, and erasing the losses of FY 2020.
During FY 2021, companies with high leverage to post-COVID reopening and the broad economic recovery stood out as top performers. Our focus on companies with variable revenues (benefitting from higher commodity prices and higher volumes) and low fixed costs benefitted the portfolio, as did our focus on companies with low reinvestment requirements (as higher levels of reinvestment can leave companies exposed to the negative impacts of cost inflation).
| Recurrent MLP & Infrastructure Historical Performance Detail | ||||
| As of 10/31/21 | ||||
| YTD | 1-Year | 3-Year | Since incept. | |
| Recurrent MLP (RMLPX) | +48.01% | +91.87% | +3.91% | +2.11% |
| Alerian MLP Index (AMZ) | +46.34% | +85.70% | -0.00% | +0.25% |
| RMLPX vs. AMZ | +1.67% | +6.17% | +3.92% | +1.86% |
RMLPX Top 10 Holdings
| Recurrent MLP & Infrastructure - as of October 31, 2021 | ||||
| Rank | Ticker | Company | Subsector | % of Port |
| 1 | CVE | Cenovus Energy Inc. | Integrated Oil | 9.1% |
| 2 | PBA | Pembina Pipeline Corporation | Unregulated Oil/NGL | 6.5% |
| 3 | ET | Energy Transfer L.P. | Gas Infra | 6.3% |
| 4 | MPC | Marathon Petroleum Corporation | Unregulated Oil/NGL | 5.5% |
| 5 | WES | Western Midstream Partners L.P. | Gathering and Processing | 5.5% |
| 6 | VNOM | Viper Energy Partners L.P. | Royalty/Other | 5.4% |
| 7 | EPD | Enterprise Products Partners L.P. | Unregulated Oil/NGL | 5.2% |
| 8 | TRGP | Targa Resources Corporation | Gathering and Processing | 5.0% |
| 9 | PAGP | Plains GP Holdings L.P. | Unregulated Oil/NGL | 4.9% |
| 10 | VLO | Valero Energy Corporation | Unregulated Oil/NGL | 4.9% |
| Top 10 RMLPX Holdings as a % of Portfolio: | 58.2% | |||
Portfolio holdings are subject to change at any time and should not be considered investment advice.
Major Contributors and Detractors to RMLPX Performance
| RMLPX Top 5 Absolute Performance Contributors and Detractors in FY 2021 | |||||
| Company | Ticker | Contribution (bps) | Company | Ticker | Contribution (bps) |
| Cenovus Energy Inc | CVE | +1175 | Aemetis Inc. | AMTX | -17 |
| Viper Energy Partners | VNOM | +695 | Renewable Energy Grp | REGI | +12 |
| Marathon Petroleum | MPC | +642 | TC Energy Corp | TRP | +134 |
| Energy Transfer LP | ET | +603 | Kinder Morgan Inc | KMI | +361 |
| Targa Resources Corp | TRGP | +594 | Enterprise Products | EPD | +369 |
8
| Recurrent MLP & Infrastructure Fund (RMLPX) Fiscal 2021 Annual Report (10/31/21) |
Top 5 Contributors to Performance
Cenovus Energy (CVE)
RMLPX holdings are primarily comprised of pipeline companies, and our process focuses on high capital efficiency (low reinvestment requirements) and higher return assets, trading at a discount to book asset value. Our process occasionally draws us to pipeline-adjacent names which share some of these attractive traits. With COVID dramatically reducing US drilling activity, we found ourselves looking for a potential “hedge” in the event of sustainably lower volumes across US shale plays, and we found CVE. As a low-cost, capital-efficient Canadian integrated oil producer, CVE shares many of the earnings attributes as a commodity-levered midstream company, with one key difference: CVE’s margins have been historically reduced by high rail shipping costs out of Canada. In 2020, we identified CVE as a potential winner in the event of lower production volumes out of US shale plays. In 2021, lower production volumes in the US opened up low-cost pipeline capacity, which allowed CVE to ship its oil to US markets at a much lower cost, by and large avoiding high-cost railroads entirely during 2021. The result was expanded per-unit margins for CVE, and accordingly, CVE was a significant outperformer in FY 2021. We expect CVE to meaningfully increase its dividend and expand its buyback program in the next 12 months.
Viper Energy Partners (VNOM)
VNOM holds a portfolio of Permian royalty interests, which garner a fixed percentage of revenues from the underlying acreage positions, with no obligation to contribute to future capital expenditures to drill those acreage positions. While VNOM fell sharply in early 2020 due to the impact of COVID, VNOM’s cheap valuation and FCF generation provided for a sizeable buyback and dividend increases throughout 2021. With 2020-era hedges rolling off in late 2021, revenues should rise in FY 2022 in a variety of oil price environments, while drilling activity in VNOM operating areas remains robust.
Marathon Petroleum (MPC)
While most refiners suffered mightily in 2020 and recovered slowly in 2021, MPC was benefitted by two key idiosyncratic factors: a world-scale midstream operation, which delivered more than 50% of MPC earnings throughout 2020 and 2021, as well as a unique catalyst – the sale of MPC’s Speedway gas station business brought in over $16bn of cash proceeds to MPC, meaningfully deleveraging the balance sheet and setting up an industry-leading $10bn buyback program. With the buyback authorization still largely unspent and MPC’s current market cap sitting below $40bn, we believe MPC is well-positioned to outperform in 2022.
Energy Transfer (ET)
Energy Transfer was one of the “poster children” of the excessive debt loads that drove many midstream companies to meaningfully underperform the broad markets over the last year, and ET’s hesitation in cutting its dividend during 2020 meant that debt was reduced at a slower pace than many midstream peers. However, in calendar 2021, things improved markedly, as ET benefitted with a $4bn cash windfall resulting from exceptional reliability during the February 2021 winter storms in Texas. This windfall accelerated debt reduction and supported ET after a sluggish 2020. We expect ET will expand its cash returns to shareholders in 2021 as leverage thresholds are achieved and major projects completed.
9
| Recurrent MLP & Infrastructure Fund (RMLPX) Fiscal 2021 Annual Report (10/31/21) |
Targa Resources Corp (TRGP)
Targa was one of the first companies to take radical action during 2020 to address lingering balance sheet issues after years of heavy investments and excessive dividend payouts. TRGP cut its dividend and growth spending budgets dramatically in 2020, effectively de-risking its balance sheet with accelerated debt paydown and a small common stock buyback in 2021. In October, TRGP announced a significant reinstatement of its dividend, and additional cash returns are likely to follow in FY 2022.
Top 5 Detractors to Performance
Aemetis (AMTX)
The smallest holding in our portfolio, AMTX stood out as the only holding during 2021 with a negative total return (albeit only -0.17%) during our holding period. AMTX is a producer of ethanol in California. Plans to reduce the carbon intensity of ethanol production and expand into sustainable jet fuel have brought significant low-cost government funding to AMTX, and earnings should grow meaningfully throughout the next several years. However, given higher near-term earnings growth in other parts of our portfolio, we exited AMTX with a small loss and reinvested in our traditional midstream portfolio.
Renewable Energy Group (REGI)
In light of reduced motor fuel demand in 2020 and 2021 owing to the impact of COVID, the cost of government blending credits (Renewable Identification Numbers, or RINS) rose dramatically during 2021, benefitting the operations of renewable fuel blenders such as REGI. While a small non-core position, REGI saw significant volatility throughout 2021 as concerns about the status of the US governments Blender Tax Credit (BTC) and Renewable Volume Obligation (RVO) caused volatility in the RINS market and even more volatility in stocks such as REGI and DAR. REGI remains well-positioned to grow earnings in 2023 and beyond with the expansion of its flagship Geismar, Louisiana plant, but ultimately we see higher upside elsewhere.
TC Energy (TRP)
Canada’s largest transporter of gas is a well-run, well-capitalized company which outperformed strongly in 2020. Accordingly, its limited exposure to higher commodity prices, and management’s long-standing policy of seeking new growth opportunities and eschewing buybacks and higher dividends was generally received poorly during FY 2021, as investors sought out stocks with more leverage to the ongoing economic recovery. Furthermore, we see TRP’s post-Keystone identity, with more focus on renewables and low carbon investments, as less attractive than high-return investments in low-growth oil and gas pipelines.
Enterprise Products (EPD)
In a recurring theme for midstream companies, EPD enjoyed strong earnings throughout 2020 despite the pandemic and steady growth in 2021. In another recurring theme, investors generally shied away from EPD as EPD management stood by a longstanding focus on finding new growth projects in EPD’s core business, while shying away from special dividends and stock repurchases. This policy was generally shunned by investors in FY 2021. While EPD remains a well-run, operationally sound company, we see EPD as having fewer near-term catalysts than peers, as management is focused on reinvestment and debt reduction, at a time when other peers are aggressively buying back stock.
10
| Recurrent MLP & Infrastructure Fund (RMLPX) Fiscal 2021 Annual Report (10/31/21) |
Kinder Morgan (KMI)
Despite a surge of winter storm-related earnings in February 2021, KMI enjoyed a more modest rally than other midstream peers, as limited upside exposure to higher commodity prices and a slower volumetric recovery in KMI’s California operations kept the stock from performing more strongly. Notably, at a time when investors are highly focused on buybacks and special dividends, KMI reinvested its winter storm windfall in a step-out acquisition of a gas storage facility in New York and Pennsylvania, dampening investor excitement around potential extraordinary cash returns via special dividends and buybacks.
Investments cannot be made in an index. Unmanaged index returns do not reflect any fees, expenses or sales charges. Past performance is no guarantee of future results and the index performance shown is not indicative of the performance of the Fund.
Alerian MLP Index –is a composite of the 50 most prominent energy master limited partnerships calculated by Alerian using a float-adjusted market capitalization methodology.
S&P 500 Index is an unmanaged composite of 500 large capitalization companies. This index is widely used by professional investors as a performance benchmark for large-cap stocks.
S&P North American Natural Resources Index – seeks investment results that correspond generally to the price and yield performance, before fees and expenses, of U.S.-traded natural resource-related companies, including oil and gas production, transportation, refining, materials, and mining.
EBITDA – Earnings before interest, taxes, depreciation and amortization. EBITDA is a non-GAAP metric, typically used as a measure of a company’s operating cash flow, excluding changes in working capital.
EV/IC vs. ROIC – Enterprise Value / Invested Capital vs. Return on Invested Capital. Compares a company’s market value (EV) vs. the book value of its capital (IC).
Investors should carefully consider the investment objectives, risks, charges and expenses of the Fund. This and other important information about the Fund is contained in the prospectus, which can be obtained by calling 832-241-5900. The prospectus should be read carefully before investing. The Fund is distributed by Northern Lights Distributors, LLC, member FINRA/SIPC. Recurrent Investment Advisors is not affiliated with Northern Lights Distributors, LLC.
Important Risk Disclosure (RMLPX)
Mutual Funds involve risk including the potential loss of principal. Higher turnover and frequent trading my result is higher costs. Cash available for distribution by MLP’s may vary and could be affected by the entity’s operations, including capital expenditures, operating, acquisition, construction, exploration and borrowing costs, reducing the amount of cash and MLP has available for distribution. The Fund may focus on one or more industries, sectors or geographic regions of the economy and the value of an investment may fluctuate more widely than if it were diversified. Tax risks associated with the Fund include fund structure risk, MLP tax risk, and tax estimation/NAV risk. Cyber-attacks or failures affecting the Fund or service providers may adversely impact the Fund or its shareholders.
The Fund invests primarily in the energy sector and infrastructure industry and is susceptible to adverse economic, environmental, and regulatory concerns. Additional risks include acquisition, catastrophic event, commodity price, depletion, natural resource, supply/demand and weather risk. The purchase of IPO shares may involve high transaction cost, market and liquidity risks. The investment strategies employed by the Advisor may not result in an increase in value or performance. Overall equity market risk may affect the value of individual instruments in which the Fund invests. Holders of MLP’s have limited control and voting rights, additionally, there are certain tax risks and conflicts of interest between holders of MLP’s and the general partner. The Fund is newly -formed and may not grow to or maintain economically viable size, not be successful implementing its investment strategy, which could result in the Fund being liquidated. (7435-NLD-12012021)
11
| Recurrent MLP & Infrastructure Fund |
| PORTFOLIO REVIEW (Unaudited) |
| October 31, 2021 |
The Fund’s performance figures* for the periods ended October 31, 2021, compared to its benchmarks:
| Annualized | |||
| One Year | Three Year | Since Inception (a) | |
| Recurrent MLP & Infrastructure Fund - Class I | 91.87% | 3.90% | 2.11% |
| Alerian MLP Index (Total Return)** | 85.70% | (0.01)% | 0.25% |
| (a) | Inception date is November 2, 2017. |
| * | The performance data quoted is historical. Past performance is no guarantee of future results. Current performance may be higher or lower than the performance data quoted. The principal value and investment return of an investment will fluctuate so that your shares, when redeemed, may be worth more or less than their original cost. Total returns for periods of less than one year are not annualized. Total returns would have been lower absent the advisor fee waiver. The returns shown do not reflect the deduction of taxes that a shareholder would pay on Fund distributions or on the redemptions of Fund shares. The Advisor has contractually agreed to waive fees and/or reimburse expenses to the Fund until at least March 1, 2022 to ensure that the Fund’s total annual operating expenses after expense waiver and reimbursement (excluding any front-end or contingent deferred loads; brokerage fees and commissions; acquired fund fees and expenses; borrowing costs such as interest and dividend expenses on securities sold short, taxes; and extraordinary expenses, such as litigation expenses) will not exceed 1.25% of average daily net assets attributable to Class I shares. This agreement may be terminated by the Fund’s Board of Trustees on 60 days’ written notice to the Advisor. The Fund’s total annual fund operating expense ratio, gross of fee waivers or expense reimbursements is 1.38% for Class I shares per the fee table in the Fund’s March 1, 2021 Prospectus. These fee waivers and expense reimbursements are subject to possible recoupment from the Fund in future years on a rolling three year basis (within three years after the fees have been waived or reimbursed) if such recoupment can be achieved within the foregoing expense limits as well as any expense limitation that was in effect at the time the waiver or reimbursement was made. For performance information current to the most recent month-end, please call 1-833-732-8773. |
| ** | The Alerian MLP Index (Total Return) is a composite of the 50 most prominent energy master limited partnerships calculated by Standard & Poor’s using a float-adjusted market capitalization methodology. This index provides a comprehensive benchmark for investors to track the performance of the energy MLP sector. Investors cannot invest directly in an index or benchmark. Index returns are gross of any fees, brokerage commissions or other expenses of investing. |
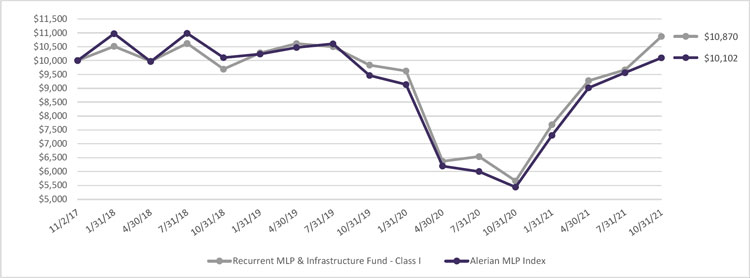
Comparison of Change in Value of a $10,000 Investment
Since Inception November 2, 2017 through October 31, 2021
| Holdings by type of investment | % of Net Assets | |||
| Common Stocks | 74.9 | % | ||
| Master Limited Partnerships | 23.0 | % | ||
| Short-Term Investment | 1.6 | % | ||
| Other Assets Less Liabilities | 0.5 | % | ||
| 100.0 | % | |||
Please refer to the Portfolio of Investments that follows in this annual report for a detail of the Fund’s holdings.
12
| RECURRENT MLP & INFRASTRUCTURE FUND |
| SCHEDULE OF INVESTMENTS |
| October 31, 2021 |
| Shares | Fair Value | |||||||
| COMMON STOCKS 74.9% | ||||||||
| FOOD - 1.2% | ||||||||
| 30,895 | Darling Ingredients, Inc.(a) | $ | 2,611,245 | |||||
| OIL & GAS PRODUCERS - 73.1% | ||||||||
| 293,698 | AltaGas Ltd. | 6,070,383 | ||||||
| 1,668,325 | Cenovus Energy, Inc. | 19,986,534 | ||||||
| 56,111 | Cheniere Energy, Inc. | 5,801,877 | ||||||
| 147,734 | Enbridge, Inc. | 6,184,145 | ||||||
| 406,998 | Equitrans Midstream Corporation | 4,196,149 | ||||||
| 240,560 | Keyera Corporation | 6,155,914 | ||||||
| 559,799 | Kinder Morgan, Inc. | 9,376,633 | ||||||
| 183,694 | Marathon Petroleum Corporation | 12,110,945 | ||||||
| 432,335 | Pembina Pipeline Corporation | 14,305,965 | ||||||
| 126,705 | Phillips 66 | 9,475,000 | ||||||
| 982,922 | Plains GP Holdings, L.P., Class A | 10,713,850 | ||||||
| 400,808 | Suncor Energy, Inc. | 10,541,250 | ||||||
| 200,386 | Targa Resources Corporation | 10,955,103 | ||||||
| 82,639 | TC Energy Corporation | 4,470,770 | ||||||
| 138,450 | Valero Energy Corporation | 10,706,339 | ||||||
| 541,671 | Viper Energy Partners, L.P. | 11,943,846 | ||||||
| 324,932 | Williams Companies, Inc. (The) | 9,127,340 | ||||||
| 162,122,043 | ||||||||
| RENEWABLE ENERGY - 0.6% | ||||||||
| 19,864 | Renewable Energy Group, Inc.(a) | 1,271,296 | ||||||
| TOTAL COMMON STOCKS (Cost $113,856,198) | 166,004,584 | |||||||
| MASTER LIMITED PARTNERSHIPS 23.0% | ||||||||
| METALS & MINING - 1.3% | ||||||||
| 239,000 | Alliance Resource Partners, L.P. | 2,834,540 | ||||||
| OIL & GAS PRODUCERS - 21.7% | ||||||||
| 1,472,099 | Energy Transfer, L.P. | 13,999,661 | ||||||
The accompanying notes are an integral part of these financial statements.
13
| RECURRENT MLP & INFRASTRUCTURE FUND |
| SCHEDULE OF INVESTMENTS (Continued) |
| October 31, 2021 |
| Shares | Fair Value | |||||||
| MASTER LIMITED PARTNERSHIPS 23.0% (Continued) | ||||||||
| OIL & GAS PRODUCERS - 21.7% (Continued) | ||||||||
| 506,345 | Enterprise Products Partners, L.P. | $ | 11,483,905 | |||||
| 160,959 | Magellan Midstream Partners, L.P. | 7,886,991 | ||||||
| 66,527 | Sunoco, L.P. | 2,693,678 | ||||||
| 569,030 | Western Midstream Partners, L.P. | 12,091,888 | ||||||
| 48,156,123 | ||||||||
| TOTAL MASTER LIMITED PARTNERSHIPS (Cost $44,166,234) | 50,990,663 | |||||||
| SHORT-TERM INVESTMENT 1.6% | ||||||||
| MONEY MARKET FUND - 1.6% | ||||||||
| 3,666,743 | First American Government Obligations Fund, Class X, 0.03% (Cost $3,666,743)(b) | 3,666,743 | ||||||
| TOTAL INVESTMENTS - 99.5% (Cost $161,689,175) | $ | 220,661,990 | ||||||
| OTHER ASSETS IN EXCESS OF LIABILITIES - 0.5% | 997,269 | |||||||
| NET ASSETS - 100.0% | $ | 221,659,259 | ||||||
| LP | - Limited Partnership |
| LTD | - Limited Company |
| (a) | Non-income producing security. |
| (b) | Rate disclosed is the seven day effective yield as of October 31, 2021. |
The accompanying notes are an integral part of these financial statements.
14
| Recurrent MLP & Infrastructure Fund |
| STATEMENT OF ASSETS AND LIABILITIES |
| October 31, 2021 |
| ASSETS | ||||
| Investment securities: | ||||
| At cost | $ | 161,689,175 | ||
| At fair value | $ | 220,661,990 | ||
| Receivable for Fund shares sold | 212,811 | |||
| Interest and dividends receivable | 999,459 | |||
| Prepaid expenses & other assets | 42,866 | |||
| TOTAL ASSETS | 221,917,126 | |||
| LIABILITIES | ||||
| Advisory fees payable | 175,871 | |||
| Payable for Fund shares redeemed | 21,472 | |||
| Payable to related parties | 16,394 | |||
| Audit and tax fees | 27,000 | |||
| Accrued expenses and other liabilities | 17,130 | |||
| TOTAL LIABILITIES | 257,867 | |||
| NET ASSETS | $ | 221,659,259 | ||
| Net Assets Consist Of: | ||||
| Paid in capital ($0 par value, unlimited shares authorized) | $ | 175,155,046 | ||
| Accumulated earnings | 46,504,213 | |||
| NET ASSETS | $ | 221,659,259 | ||
| Net Asset Value Per Share: | ||||
| Class I Shares: | ||||
| Net Assets | $ | 221,659,259 | ||
| Shares of beneficial interest outstanding ($0 par value, unlimited shares authorized) | 14,260,322 | |||
| Net asset value (Net Assets ÷ Shares Outstanding), offering price and redemption price per share | $ | 15.54 | ||
The accompanying notes are an integral part of these financial statements.
15
| Recurrent MLP & Infrastructure Fund |
| STATEMENT OF OPERATIONS |
| For the Year Ended October 31, 2021 |
| INVESTMENT INCOME | ||||
| Dividends (Foreign taxes withheld: $326,769) | $ | 5,955,575 | ||
| Interest | 585 | |||
| TOTAL INVESTMENT INCOME | 5,956,160 | |||
| EXPENSES | ||||
| Investment advisory fees | 1,391,183 | |||
| Administrative services fees | 141,774 | |||
| Audit and tax fees | 40,291 | |||
| Legal fees | 26,684 | |||
| Transfer agent fees | 74,438 | |||
| Chief compliance officer fees | 27,091 | |||
| Trustees fees and expenses | 11,391 | |||
| Registration fees | 56,894 | |||
| Printing and postage expenses | 23,986 | |||
| Custodian fees | 19,966 | |||
| Third party administrative services fees | 92,999 | |||
| Insurance fees | 11,331 | |||
| Other expenses | 13,944 | |||
| TOTAL EXPENSES | 1,931,972 | |||
| Plus: Recapture of fees previously waived by the Advisor | 7,212 | |||
| NET EXPENSES | 1,939,184 | |||
| NET INVESTMENT INCOME | 4,016,976 | |||
| REALIZED AND UNREALIZED GAIN/(LOSS) ON INVESTMENTS | ||||
| Net realized gain/(loss) on: | ||||
| Investments | (144,671 | ) | ||
| Foreign currency translations | 18,359 | |||
| Total realized loss | (126,312 | ) | ||
| Net change in unrealized appreciation on: | ||||
| Investments | 83,669,183 | |||
| Foreign currency translations | 6,929 | |||
| Total change in unrealized appreciation | 83,676,112 | |||
| NET REALIZED AND UNREALIZED GAIN ON INVESTMENTS | 83,549,800 | |||
| NET INCREASE IN NET ASSETS RESULTING FROM OPERATIONS | $ | 87,566,776 | ||
The accompanying notes are an integral part of these financial statements.
16
| Recurrent MLP & Infrastructure Fund |
| STATEMENTS OF CHANGES IN NET ASSETS |
| Year Ended | Year Ended | |||||||
| October 31, | October 31, | |||||||
| 2021 | 2020 | |||||||
| FROM OPERATIONS | ||||||||
| Net investment income | $ | 4,016,976 | $ | 3,082,794 | ||||
| Net realized loss on investments | (126,312 | ) | (16,883,928 | ) | ||||
| Net change in unrealized appreciation/(depreciation) on investments | 83,676,112 | (23,450,898 | ) | |||||
| Net increase/(decrease) in net assets resulting from operations | 87,566,776 | (37,252,032 | ) | |||||
| DISTRIBUTIONS TO SHAREHOLDERS | ||||||||
| Total distributions paid | (2,046,059 | ) | (539,680 | ) | ||||
| Return of capital | (12,696,192 | ) | (8,215,713 | ) | ||||
| Net decrease in net assets from distributions to shareholders | (14,742,251 | ) | (8,755,393 | ) | ||||
| FROM SHARES OF BENEFICIAL INTEREST | ||||||||
| Proceeds from shares sold: | 103,531,014 | 116,000,279 | ||||||
| Net asset value of shares issued in reinvestment of distributions: | 11,075,644 | 6,003,971 | ||||||
| Payments for shares redeemed: | (55,568,586 | ) | (40,965,062 | ) | ||||
| Net increase in net assets from shares of beneficial interest | 59,038,072 | 81,039,188 | ||||||
| TOTAL INCREASE IN NET ASSETS | 131,862,597 | 35,031,763 | ||||||
| NET ASSETS | ||||||||
| Beginning of year | 89,796,662 | 54,764,899 | ||||||
| End of year | $ | 221,659,259 | $ | 89,796,662 | ||||
| SHARE ACTIVITY | ||||||||
| Shares sold | 7,709,304 | 10,074,063 | ||||||
| Shares reinvested | 829,114 | 562,103 | ||||||
| Shares redeemed | (4,348,686 | ) | (3,753,915 | ) | ||||
| Net increase in shares of beneficial interest outstanding | 4,189,732 | 6,882,251 | ||||||
The accompanying notes are an integral part of these financial statements.
17
| Recurrent MLP & Infrastructure Fund |
| FINANCIAL HIGHLIGHTS |
Per Share Data and Ratios for a Share of Beneficial Interest Outstanding Throughout Each Period
| Class I (1) | ||||||||||||||||
| For the Year Ended | For the Year Ended | For the Year Ended | For the Period Ended | |||||||||||||
| October 31, | October 31, | October 31, | October 31, | |||||||||||||
| 2021 | 2020 | 2019 | 2018 | |||||||||||||
| Net asset value, beginning of period | $ | 8.92 | $ | 17.18 | $ | 18.14 | $ | 20.00 | ||||||||
| Activity from investment operations: | ||||||||||||||||
| Net investment income (2) | 0.35 | 0.46 | 0.58 | 0.97 | ||||||||||||
| Net realized and unrealized gain/(loss) on investments (3) | 7.57 | (7.53 | ) | (0.24 | ) | (1.53 | ) | |||||||||
| Total from investment operations | 7.92 | (7.07 | ) | 0.34 | (0.56 | ) | ||||||||||
| Less distributions from: | ||||||||||||||||
| Net investment income | (0.18 | ) | (0.07 | ) | (0.25 | ) | — | |||||||||
| Return of capital | (1.12 | ) | (1.12 | ) | (1.05 | ) | (1.30 | ) | ||||||||
| Total distributions | (1.30 | ) | (1.19 | ) | (1.30 | ) | (1.30 | ) | ||||||||
| Net asset value, end of period | $ | 15.54 | $ | 8.92 | $ | 17.18 | $ | 18.14 | ||||||||
| Total return (4) | 91.87 | % | (42.41 | )% | 1.53 | % | (3.10 | )% | ||||||||
| Net assets, at end of period (000’s) | $ | 221,659 | $ | 89,797 | $ | 54,765 | $ | 8,591 | ||||||||
| Ratio of gross expenses to average net assets (5) | 1.25 | % | 1.38 | % (8) | 1.75 | % | 7.39 | % (9) | ||||||||
| Ratio of net expenses to average net assets (5) | 1.25 | % (6) | 1.26 | % (7,8) | 1.25 | % (7) | 1.25 | % (7,9) | ||||||||
| Ratio of net investment income to average net assets | 2.59 | % | 3.89 | % | 3.13 | % | 4.85 | % (9) | ||||||||
| Portfolio Turnover Rate | 22 | % | 32 | % | 52 | % | 116 | % (10) | ||||||||
| (1) | The Recurrent MLP & Infrastructure Fund commenced operations on November 2, 2017. |
| (2) | Per share amounts calculated using the average shares method, which more appropriately presents the per share data for the period. |
| (3) | Net realized and unrealized gain/(loss) on investments per share are balancing amounts necessary to reconcile the change in net asset value per share for the period, and may not reconcile with aggregate gains/(losses) in the statement of operations due to the share transactions for the period. |
| (4) | Total returns are historical and assume changes in share price and reinvestment of dividends and distributions. Total returns for periods of less than one year are not annualized. Total returns would be lower absent fee waivers. |
| (5) | Does not include the expenses of other investment companies in which the Fund invests, if any. |
| (6) | Represents the ratio of expenses to average net assets inclusive of the Advisor’s recapture of waived/reimbursed fees from prior periods. |
| (7) | Represents the ratio of expenses to average net assets net of fee waivers and/or expense reimbursements by the Advisor. |
| (8) | Includes tax expenses. If these expenses were excluded, the ratio of gross expenses to average net assets would be 1.37% and the ratio of net expenses to average net assets would be 1.25%. |
| (9) | Annualized. |
| (10) | Not annualized. |
The accompanying notes are an integral part of these financial statements.
18
| Recurrent MLP & Infrastructure Fund |
| NOTES TO FINANCIAL STATEMENTS |
| October 31, 2021 |
| 1. | ORGANIZATION |
Recurrent MLP & Infrastructure Fund (the “Fund”), is a series of shares of beneficial interest of the Two Roads Shared Trust (the “Trust”), a statutory trust organized under the laws of the State of Delaware on June 8, 2012, and is registered under the Investment Company Act of 1940, as amended (the “1940 Act”), as a non-diversified, open-end management investment company. The Fund offers Class I shares. The Fund commenced investment operations for Class I shares on November 2, 2017. The Fund’s investment objective is to seek total return including substantial current income from a portfolio of master limited partnerships (“MLPs”) and energy infrastructure investments.
| 2. | SIGNIFICANT ACCOUNTING POLICIES |
The following is a summary of significant accounting policies followed by the Fund in preparation of its financial statements. These policies are in conformity with U.S. generally accepted accounting principles in the United States of America (“U.S. GAAP”). The preparation of the financial statements requires management to make estimates and assumptions that affect the reported amounts of assets and liabilities and disclosure of contingent assets and liabilities at the date of the financial statements and the reported amounts of income and expenses for the period. Actual results could differ from those estimates. The Fund is a registered investment company and accordingly follows the investment company accounting and reporting guidance of the Financial Accounting Standards Board (“FASB”) Accounting Standard Codification Topic 946 “Financial Services – Investment Companies”.
Securities Valuation – Securities listed on an exchange are valued at the last reported sale price at the close of the regular trading session of the exchange on the business day the value is being determined, or in the case of securities listed on NASDAQ at the NASDAQ Official Closing Price. In the absence of a sale, such securities shall be valued at the mean between the current bid and ask prices on the primary exchange on the day of valuation. Short-term debt obligations having 60 days or less remaining until maturity, at the time of purchase, may be valued at amortized cost which approximates fair value.
Valuation of Underlying Funds – The Fund may invest in portfolios of open-end or closed-end investment companies (the “Underlying Funds”). The Underlying Funds value securities in their portfolios for which market quotations are readily available at their market values (generally the last reported sale price) and all other securities and assets at their fair value according to the methods established by the board of directors of the Underlying Funds.
Open-end investment companies are valued at their respective net asset values as reported by such investment companies. The shares of many closed-end investment companies, after their initial public offering, frequently trade at a price per share, which is different than the net asset value per share. The difference represents a market premium or market discount of such shares. There can be no assurances that the market discount or market premium on shares of any closed-end investment company purchased by the Fund will not change.
Master Limited Partnerships (“MLPs”) – An MLP is an entity receiving partnership taxation treatment under the Internal Revenue Code of 1986, as amended (the “Code”) the partnership interests or “units” of which are traded on securities exchanges like shares of corporate stock. To qualify as an MLP for U.S. federal income tax purposes, an entity must receive at least 90% of its income from qualifying sources such as interest, dividends, income and gain from mineral or natural resources activities, income and gain from the transportation or storage of certain fuels, and, in certain circumstances, income and gain from commodities or futures, forwards and options with respect to commodities. For this purpose, mineral or natural resources activities include exploration, development, production, mining, refining, marketing and transportation (including pipelines) of oil and gas, minerals, geothermal energy, fertilizer, timber or industrial source carbon dioxide.
A typical MLP consists of a general partner and limited partners; however, some entities receiving partnership taxation treatment under the Code are established as limited liability companies (“LLCs”). The general partner of an MLP manages the partnership, has an ownership stake in the partnership and in some cases the general partners are eligible to receive an incentive distribution. The limited partners provide capital to the partnership, receive common units of the partnership, have a limited role in the operation and management of the partnership and are entitled to receive cash distributions with respect to their units. Currently, most MLPs operate in the energy, natural resources and real estate sectors. Due to their partnership structure, MLPs generally do not pay income taxes. Thus, unlike investors in corporate securities, direct MLP investors are generally not subject to double taxation (i.e., corporate level tax and tax on corporate dividends).
19
| Recurrent MLP & Infrastructure Fund |
| NOTES TO FINANCIAL STATEMENTS (Continued) |
| October 31, 2021 |
The Fund may hold securities, such as private investments, interests in commodity pools, other non-traded securities or temporarily illiquid securities, for which market quotations are not readily available or are determined to be unreliable. These securities will be valued using the “fair value” procedures approved by the Board. The Board has delegated execution of these procedures to a fair value committee composed of one or more representatives from each of the (i) Trust, (ii) administrator, and (iii) advisor. The committee may also enlist third party consultants such a valuation specialist at a public accounting firm, valuation consultant or financial officer of a security issuer on an as-needed basis to assist in determining a security-specific fair value. The Board has also engaged a third party valuation firm to, as needed, attend valuation meetings held by the Trust, review minutes of such meetings and report to the Board on a quarterly basis. The Board reviews and considers the determinations reached by the fair value committee in ratifying the fair value committee’s application of the fair valuation methodologies employed.
Fair Valuation Process – The applicable investments are valued collectively via inputs from each group within the fair value committee. For example, fair value determinations are required for the following securities: (i) securities for which market quotations are insufficient or not readily available on a particular business day (including securities for which there is a short and temporary lapse in the provision of a price by the regular pricing source); (ii) securities for which, in the judgment of the advisor, the prices or values available do not represent the fair value of the instrument; factors which may cause the advisor to make such a judgment include, but are not limited to, the following: only a bid price or an asked price is available; the spread between bid and asked prices is substantial; the frequency of sales; the thinness of the market; the size of reported trades; and actions of the securities markets, such as the suspension or limitation of trading; (iii) securities determined to be illiquid; and (iv) securities with respect to which an event that will affect the value thereof has occurred (a “significant event”) since the closing prices were established on the principal exchange on which they are traded, but prior to a Fund’s calculation of its net asset value. Specifically, interests in commodity pools or managed futures pools are valued on a daily basis by reference to the closing market prices of each futures contract or other asset held by a pool, as adjusted for pool expenses. Restricted or illiquid securities, such as private investments or non-traded securities are valued via inputs from the advisor based upon the current bid for the security from two or more independent dealers or other parties reasonably familiar with the facts and circumstances of the security (who should take into consideration all relevant factors as may be appropriate under the circumstances). If the advisor is unable to obtain a current bid from such independent dealers or other independent parties, the fair value committee shall determine the fair value of such security using the following factors: (i) the type of security; (ii) the cost at date of purchase; (iii) the size and nature of the Fund’s holdings; (iv) the discount from market value of unrestricted securities of the same class at the time of purchase and subsequent thereto; (v) information as to any transactions or offers with respect to the security; (vi) the nature and duration of restrictions on disposition of the security and the existence of any registration rights; (vii) how the yield of the security compares to similar securities of companies of similar or equal creditworthiness; (viii) the level of recent trades of similar or comparable securities; (ix) the liquidity characteristics of the security; (x) current market conditions; and (xi) the market value of any securities into which the security is convertible or exchangeable.
The Fund utilizes various methods to measure the fair value of all of its investments on a recurring basis. U.S. GAAP establishes a hierarchy that prioritizes inputs to valuation methods. The three levels of input are:
Level 1 – Unadjusted quoted prices in active markets for identical assets and liabilities that a Fund has the ability to access.
Level 2 – Observable inputs other than quoted prices included in Level 1 that are observable for the asset or liability, either directly or indirectly. These inputs may include quoted prices for the identical instrument in an inactive market, prices for similar instruments, interest rates, prepayment speeds, credit risk, yield curves, default rates and similar data.
Level 3 – Unobservable inputs for the asset or liability, to the extent relevant observable inputs are not available; representing a Fund’s own assumptions about the assumptions a market participant would use in valuing the asset or liability, and would be based on the best information available.
20
| Recurrent MLP & Infrastructure Fund |
| NOTES TO FINANCIAL STATEMENTS (Continued) |
| October 31, 2021 |
The availability of observable inputs can vary from security to security and is affected by a wide variety of factors, including, for example, the type of security, whether the security is new and not yet established in the marketplace, the liquidity of markets, and other characteristics particular to the security. To the extent that valuation is based on models or inputs that are less observable or unobservable in the market, the determination of fair value requires more judgment. Accordingly, the degree of judgment exercised in determining fair value is greatest for instruments categorized in Level 3.
The inputs used to measure fair value may fall into different levels of the fair value hierarchy. In such cases, for disclosure purposes, the level in the fair value hierarchy within which the fair value measurement falls in its entirety, is determined based on the lowest level input that is significant to the fair value measurement in its entirety.
The inputs or methodology used for valuing securities are not necessarily an indication of the risk associated with investing in those securities. The following tables summarize the inputs used as of October 31, 2021 for the Fund’s assets and liabilities measured at fair value:
| Assets * | Level 1 | Level 2 | Level 3 | Total | ||||||||||||
| Common Stocks | $ | 166,004,584 | $ | — | $ | — | $ | 166,004,584 | ||||||||
| Master Limited Partnerships | 50,990,663 | — | — | 50,990,663 | ||||||||||||
| Short-Term Investment | 3,666,743 | — | — | 3,666,743 | ||||||||||||
| Total Investments | $ | 220,661,990 | $ | — | $ | — | $ | 220,661,990 | ||||||||
| * | Refer to the Portfolio of Investments for classification. |
The Fund did not hold any Level 3 securities during the year ended October 31, 2021.
Security Transactions and Investment Income – Security transactions are accounted for on trade date basis. Interest income is recognized on an accrual basis. Discounts are accreted and premiums are amortized on securities purchased over the lives of the respective securities. Dividend income is recorded on the ex-dividend date. Realized gains or losses from sales of securities are determined by comparing the identified cost of the security lot sold with the net sales proceeds.
Foreign Currency Translations – The accounting records of the Fund are maintained in U.S. dollars. Investment securities and other assets and liabilities denominated in a foreign currency, and income receipts and expense payments are translated into U.S. dollars using the prevailing exchange rate at the London market close. Purchases and sales of securities are translated into U.S. dollars at the contractual currency rates established at the approximate time of the trade.
Net realized gains and losses on foreign currency transactions represent net gains and losses from currency realized between the trade and settlement dates on securities transactions and the difference between income accrued versus income received. The effects of changes in foreign currency exchange rates on investments in securities are included with the net realized and unrealized gain or loss on investments.
Dividends and Distributions to Shareholders – Dividends from net investment income are declared and distributed quarterly for the Fund. Dividends from net realized capital gains are distributed annually. Dividends from net investment income and distributions from net realized gains are recorded on ex-dividend date and determined in accordance with federal income tax regulations, which may differ from U.S. GAAP. These “book/tax” differences are considered either temporary (i.e., deferred losses, capital loss carry forwards) or permanent in nature. To the extent these differences are permanent in nature, such amounts are reclassified within the composition of net assets based on their federal tax-basis treatment. Temporary differences do not require reclassification.
Federal Income Taxes – It is the Fund’s policy to qualify as a regulated investment company by complying with the provisions of the Internal Revenue Code that are applicable to regulated investment companies and to distribute substantially all of their taxable income and net realized gains to shareholders. Therefore, no federal income tax provision has been recorded.
The Fund recognizes the tax benefits of uncertain tax positions only where the position is “more likely than not” to be sustained assuming examination by tax authorities. Management has analyzed the Fund’s tax positions and has concluded that no liability for unrecognized tax benefits should be recorded related to uncertain tax positions taken on returns filed for open tax years ended October 31, 2018-October 31, 2020, or expected to be taken in the Fund’s October 31, 2021 year-end
21
| Recurrent MLP & Infrastructure Fund |
| NOTES TO FINANCIAL STATEMENTS (Continued) |
| October 31, 2021 |
tax returns. The Fund identifies its major tax jurisdictions as U.S. Federal, Ohio, and foreign jurisdictions where the Fund makes significant investments. The Fund is not aware of any tax positions for which it is reasonably possible that the total amounts of unrecognized tax benefits will change materially in the next twelve months.
Expenses – Expenses of the Trust that are directly identifiable to a specific fund are charged to that fund. Expenses, which are not readily identifiable to a specific fund, are allocated in such a manner as deemed equitable, taking into consideration the nature and type of expense and the relative sizes of the funds in the Trust.
Indemnification – The Trust indemnifies its officers and Trustees for certain liabilities that may arise from the performance of their duties to the Trust. Additionally, in the normal course of business, the Fund enter into contracts that contain a variety of representations and warranties and which provide general indemnities. The Fund’s maximum exposure under these arrangements is unknown, as this would involve future claims that may be made against the Fund that have not yet occurred. However, the risk of loss due to these warranties and indemnities appears to be remote.
| 3. | INVESTMENT TRANSACTIONS AND ASSOCIATED RISKS |
For the year ended October 31, 2021, the aggregate purchases and sales of investments (excluding short-term investments) was $80,764,390 and $33,414,375, respectively.
Please refer to the Fund’s prospectus and statement of additional information (“SAI”) for a more full listing of risks associated with the Fund’s investments. The risks below and other risks are also discussed more fully in the Fund’s prospectus and SAI which include but are not limited to active trading risk, cash flow risk, concentration risk, cybersecurity risk, energy sector focus risk, energy infrastructure industry focus risks (including acquisition risk, catastrophic event risk, commodity price risk, depletion risk, environmental and regulatory risk, interest rate risk, natural resources risk, supply and demand risk, and weather risk), equity risk, gap risk, geographic and sector risk, IPO risk, liquidity risk, leveraging risk, management risk, market capitalization risk, market events risk, market risk, master limited partnership risk, MLP tax risk, non-diversification risk, portfolio turnover risk, RIC qualification risk, and volatility risk.
Concentration Risk – Because the Fund may focus on one or more industries or sectors of the economy, its performance depends in large part on the performance of those sectors or industries. As a result, the value of an investment may fluctuate more widely than it would in a fund that is diversified across industries and sectors.
Energy Sector Focus Risk – The Fund focuses its investments in the energy sector which is comprised of energy, industrial, consumer, infrastructure and logistics companies, and will therefore be susceptible to adverse economic, environmental, business, regulatory or other occurrences affecting that sector such as that experienced with the novel coronavirus (“COVID-19”) pandemic. The energy sector has historically experienced substantial price volatility. At times, the performance of these investments may lag the performance of other sectors or the market as a whole. Companies operating in the energy sector are subject to specific risks, including, among others, fluctuations in commodity prices; reduced consumer demand for commodities such as oil, natural gas or petroleum products; reduced availability of natural gas or other commodities for transporting, processing, storing or delivering; slowdowns in new construction; extreme weather or other natural disasters; and threats of attack by terrorists on energy assets. Additionally, energy sector companies are subject to substantial government regulation and changes in the regulatory environment for energy companies may adversely impact their profitability. Over time, depletion of natural gas reserves and other energy reserves may also affect the profitability of energy companies.
Energy Infrastructure Industry Focus Risk – A substantial percentage of the Fund invests primarily in the energy infrastructure industry. As a result, the Fund will therefore be susceptible to adverse economic, environmental or regulatory occurrences affecting the energy infrastructure industry. Risks associated with investments in MLPs and other companies operating in the energy infrastructure industry include but are not limited to the following:
| ○ | Acquisition Risk – Energy infrastructure companies owned by the Fund may depend on their ability to make acquisitions that increase adjusted operating surplus per unit in order to increase distributions to unit holders. |
| ○ | Catastrophic Event Risk – MLPs and other companies operating in the energy infrastructure industry are subject to many dangers inherent in the production, exploration, management, transportation, processing and distribution of |
22
| Recurrent MLP & Infrastructure Fund |
| NOTES TO FINANCIAL STATEMENTS (Continued) |
| October 31, 2021 |
natural gas, natural gas liquids, crude oil, refined petroleum and petroleum products and other hydrocarbons. Any occurrence of a catastrophic event, such as a terrorist attack, could bring about a limitation, suspension or discontinuation of the operations of MLPs and other companies operating in the energy infrastructure industry.
| ○ | Commodity Price Risk – MLPs and other companies operating in the energy infrastructure industry may be affected by fluctuations in the prices of energy commodities. Fluctuations in energy infrastructure commodity prices would directly impact companies that own such energy infrastructure commodities and could indirectly impact companies that engage in transportation, storage, processing, distribution or marketing of such energy infrastructure commodities. |
| ○ | Depletion Risk – Energy infrastructure companies engaged in the exploration, development, management, gathering or production of energy commodities face the risk that commodity reserves are depleted over time. Such companies seek to increase their reserves through expansion of their current businesses, acquisitions, further development of their existing sources of energy infrastructure commodities or exploration of new sources of energy infrastructure commodities or by entering into long-term contracts for additional reserves; however, there are risks associated with each of these potential strategies. |
| ○ | Environmental and Regulatory Risk – Companies operating in the energy infrastructure industry are subject to significant regulation of their operations by federal, state and local governmental agencies. Additionally, voluntary initiatives and mandatory controls have been adopted or are being studied and evaluated, both in the United States and worldwide, to address current potentially hazardous environmental issues, including hydraulic fracturing and related waste disposal and geological concerns, as well as those that may develop in the future. The U.S. regulatory landscape has been impacted by the change in administration. The Fund cannot predict whether federal financial regulatory agencies will take any action to adopt new regulations or provide guidance that will adversely impact the energy infrastructure industry. In addition, the new administration has recently announced several initiatives aimed at addressing climate change. It is unclear how these initiatives could impact the Fund’s investments. |
| ○ | Interest Rate Risk – Rising interest rates could increase the cost of capital thereby increasing operating costs and reducing the ability of MLPs and other companies operating in the energy industry to carry out acquisitions or expansions in a cost-effective manner. Rising interest rates may also impact the price of energy infrastructure securities as the yields on alternative investments increase. |
| ○ | Natural Resources Risk – The Fund’s investments in natural resources issuers (including MLPs) is susceptible to adverse economic, environmental, business, regulatory or other occurrences affecting that sector. The natural resources sector has historically experienced substantial price volatility. At times, the performance of these investments may lag the performance of other sectors or the market as a whole. Companies operating in the natural resources sector are subject to specific risks, including, among others, fluctuations in commodity prices; reduced consumer demand for commodities such as oil, natural gas or petroleum products; reduced availability of natural gas or other commodities for transporting, processing, storing or delivering; slowdowns in new construction; domestic and global competition, extreme weather or other natural disasters; and threats of attack by terrorists on energy assets. Additionally, natural resource sector companies are subject to substantial government regulation, including environmental regulation and liability for environmental damage, and changes in the regulatory environment for energy companies may adversely impact their profitability. Over time, depletion of natural gas reserves and other natural resources reserves may also affect the profitability of natural resources companies. |
| ○ | Supply and Demand Risk – Companies in the energy infrastructure industry may be impacted by the levels of supply and demand for energy infrastructure commodities. The demand for oil and other energy commodities was adversely impacted by the market disruption and slowdown in economic activity resulting from the COVID-19 pandemic. Future pandemics could lead to reduced production and price volatility. |
| ○ | Weather Risk – Weather plays a role in the seasonality of some energy infrastructure companies’ cash flows, and extreme weather conditions could adversely affect performance and cash flows of those companies. |
Equity Risk – Common stocks are susceptible to general stock market fluctuations and to volatile increases and decreases in value as market confidence in and perceptions of their issuers change. Factors that may influence the price of equity
23
| Recurrent MLP & Infrastructure Fund |
| NOTES TO FINANCIAL STATEMENTS (Continued) |
| October 31, 2021 |
securities include developments affecting a specific company or industry, or changing economic, political or market conditions. Preferred stocks are subject to the risk that the dividend on the stock may be changed or omitted by the issuer, and that participation in the growth of an issuer may be limited.
Market Risk – Overall market risk may affect the value of individual instruments in which the Fund invests. The Fund is subject to the risk that the securities markets will move down, sometimes rapidly and unpredictably, based on overall economic conditions and other factors, which may negatively affect the Fund’s performance. Factors such as domestic and foreign (non-U.S.) economic growth and market conditions, real or perceived adverse economic or political conditions, inflation, changes in interest rate levels, lack of liquidity in the bond or other markets, volatility in the markets, adverse investor sentiment, and political events affect the securities markets. Securities markets also may experience long periods of decline in value. When the value of the Fund’s investments goes down, your investment in the Fund decreases in value and you could lose money.
Local, state, regional, national or global events such as war, acts of terrorism, the spread of infectious illness or other public health issues, recessions, or other events could have a significant impact on the Fund and its investments and could result in decreases to the Fund’s net asset value. Political, geopolitical, natural and other events, including war, terrorism, trade disputes, government shutdowns, market closures, natural and environmental disasters, epidemics, pandemics and other public health crises and related events and governments’ reactions to such events have led, and in the future may lead, to economic uncertainty, decreased economic activity, increased market volatility and other disruptive effects on U.S. and global economies and markets. Such events may have significant adverse direct or indirect effects on the Fund and its investments. For example, a widespread health crisis such as a global pandemic could cause substantial market volatility, exchange trading suspensions and closures, impact the ability to complete redemptions, and affect Fund performance. A health crisis may exacerbate other pre-existing political, social and economic risks. In addition, the increasing interconnectedness of markets around the world may result in many markets being affected by events or conditions in a single country or region or events affecting a single or small number of issuers.
COVID-19 has resulted in travel restrictions, closed international borders, enhanced health screenings at ports of entry and elsewhere, disruption of and delays in healthcare service preparation and delivery, prolonged quarantines, cancellations, business and school closings, supply chain disruptions, and lower consumer demand, as well as general concern and uncertainty. The impact of COVID-19, and other infectious illness outbreaks that may arise in the future, could adversely affect the economies of many nations or the entire global economy, individual issuers and capital markets in ways that cannot necessarily be foreseen.
Master Limited Partnership Risk – An investment in MLP units involves certain risks which differ from an investment in the securities of a corporation. Holders of MLP units have limited control and voting rights on matters affecting the partnership. In addition, there are certain tax risks associated with an investment in MLP units and conflicts of interest exist between common unit holders of MLPs and the general partner, including those arising from incentive distribution payments. The MLP market may be adversely impacted by negative investor perceptions, such as reaction to reduced distributions. Risks of MLPs include the following: a decrease in the production of natural gas, natural gas liquids, crude oil, coal or other energy commodities or a decrease in the volume of such commodities available for transportation, mining, processing, storage or distribution may adversely impact the financial performance of MLPs or MLP-related securities. In addition, investing in MLPs involves certain risks related to investing in the underlying assets of the MLPs. The amount of cash that any MLP has available to pay its unit holders in the form of distributions/dividends depends on the amount of cash flow generated from such company’s operations. Cash flow from operations will vary from quarter to quarter and is largely dependent on factors affecting the MLP’s operations and factors affecting the energy, natural resources or real estate sectors in general. MLPs were adversely impacted by the reduced demand for oil and other energy commodities as a result of the slowdown in economic activity resulting from the spread of the COVID-19 pandemic, which triggered an unprecedented sell-off of energy pipeline and midstream companies in 2020. Recently, global oil prices have experienced significant volatility, including a period where an oil-price futures contract fell into negative territory for the first time in history. Reduced production and continued oil price volatility may adversely impact the value of the Fund’s investments in MLPs and energy infrastructure companies.
24
| Recurrent MLP & Infrastructure Fund |
| NOTES TO FINANCIAL STATEMENTS (Continued) |
| October 31, 2021 |
MLP Tax Risk – Historically, MLPs have been able to offset a significant portion of their taxable income with tax deductions, including depreciation and amortization expense deductions. A change in current tax law, or a change in the business of a given MLP, could result in an MLP being treated as a corporation or other form of taxable entity for U.S. federal income tax purposes, which would result in the MLP being required to pay U.S. federal income tax, excise tax or other form of tax on its taxable income. The classification of an MLP as a corporation or other form of taxable entity for U.S. federal income tax purposes could have the effect of reducing the amount of cash available for distribution by the MLP and could cause any such distributions received by the Fund to be taxed as dividend income, return of capital, or capital gain. Thus, if any of the MLPs owned by the Fund were treated as corporations or other forms of taxable entity for U.S. federal income tax purposes, the after-tax return to the Fund with respect to its investment in such MLPs could be materially reduced which could cause a material decrease in the net asset value per share (“NAV”) of the Fund’s shares.
| 4. | INVESTMENT ADVISORY AGREEMENT AND TRANSACTION WITH RELATED PARTIES |
Recurrent Investment Advisors, LLC serves as the Fund’s investment advisor. Pursuant to an advisory agreement with the Trust on behalf of the Fund, the Advisor, under the oversight of the Board, directs the daily operations of the Fund and supervises the performance of administrative and professional services provided by others. As compensation for its services and the related expenses borne by the Advisor, the Fund pays the Advisor a fee computed and accrued daily paid monthly, based on the Fund’s average daily net assets and is computed at the annual rate of 0.90%. Pursuant to the advisory agreement, the Fund incurred $1,391,183 in advisory fees for the year ended October 31, 2021. As of October 31, 2021, the amount due to Advisor from the Fund was $175,871.
The Advisor has contractually agreed to reduce the Fund’s fees and/or to absorb expenses of the Fund until at least until March 1, 2022 to ensure that total annual Fund operating expenses (exclusive of any front-end or contingent deferred loads; brokerage fees and commissions; acquired fund fees and expenses; borrowing costs, such as interest and dividend expenses on securities sold short; taxes; and extraordinary expenses, such as litigation expenses) do not exceed 1.25% of the average daily net assets attributable to the Fund. This agreement may be terminated by the Board on 60 days’ written notice to the Advisor. These expense reimbursements are subject to possible recoupment from the Fund in future years on a rolling three-year basis (within three years after the fees have been waived or reimbursed) if such recoupment can be achieved within the foregoing expense limits as well as any expense limitation that was in effect at the time the waiver or reimbursement was made. Fee waiver and reimbursement arrangements can decrease the Fund’s expenses and increase its performance. For the year ended October 31, 2021, the Advisor recouped $7,212 of previously waived fees.
The Fund’s ability to recoup the cumulative expenses previously waived or reimbursed subject to the aforementioned conditions will expire as presented in the table below:
| 10/31/2022 | $ | 156,362 | ||
| 10/31/2023 | $ | 96,867 |
As of October 31, 2021, $220,286 of waived fees expired unrecouped.
The distributor of the Fund is Northern Lights Distributors, LLC (the “Distributor”), an affiliate of Ultimus Fund Solutions, LLC. The Trust, on behalf of the Fund, has adopted the Trust’s Distribution and Shareholder Servicing Plan pursuant to Rule 12b-1 under the Investment Company Act of 1940 (the “Plan”), as amended, to pay for certain distribution activities and shareholder services. During the year ended October 31, 2021, the Fund did not pay distribution related charges pursuant to the Plan.
In addition, certain affiliates of the Distributor provide services to the Fund as follows:
Ultimus Fund Solutions, LLC (“UFS”)
UFS, an affiliate of the Distributor, provides administration, fund accounting, and transfer agent services to the Trust. Pursuant to separate servicing agreements with UFS, the Fund pays UFS customary fees for providing administration, fund accounting and transfer agency services to the Fund. Certain officers of the Trust are also officers of UFS and are not paid any fees directly by the Fund for serving in such capacities.
25
| Recurrent MLP & Infrastructure Fund |
| NOTES TO FINANCIAL STATEMENTS (Continued) |
| October 31, 2021 |
Northern Lights Compliance Services, LLC (“NLCS”), an affiliate of UFS and the Distributor, provides a Chief Compliance Officer to the Trust, as well as related compliance services, pursuant to a consulting agreement between NLCS and the Trust. Under the terms of such agreement, NLCS receives customary fees from the Fund.
Blu Giant, LLC (“Blu Giant”), an affiliate of UFS and the Distributor, provides EDGAR conversion and filing services as well as print management services for the Fund on an ad-hoc basis. For the provision of these services, Blu Giant receives customary fees from the Fund.
| 5. | AGGREGATE UNREALIZED APPRECIATION AND DEPRECIATION – TAX BASIS |
The identified cost of investments in securities owned by the Fund for federal income tax purposes, and its respective gross unrealized appreciation and depreciation at October 31, 2021, were as follows:
| Gross | Gross | Net Unrealized | ||||||||||||
| Tax | Unrealized | Unrealized | Appreciation/ | |||||||||||
| Cost | Appreciation | Depreciation | (Depreciation) | |||||||||||
| $ | 164,406,268 | $ | 62,414,445 | $ | (6,158,723 | ) | $ | 56,255,722 | ||||||
| 6. | DISTRIBUTIONS TO SHAREHOLDERS AND TAX COMPONENTS OF CAPITAL |
The tax character of fund distributions paid for the years ended October 31, 2021 and October 31, 2020 was as follows:
| Fiscal Year Ended | Fiscal Year Ended | |||||||
| October 31, 2021 | October 31, 2020 | |||||||
| Ordinary Income | $ | 2,046,059 | $ | 539,680 | ||||
| Return of Capital | 12,696,192 | 8,215,713 | ||||||
| $ | 14,742,251 | $ | 8,755,393 | |||||
As of October 31, 2021, the components of accumulated earnings/(deficit) on a tax basis were as follows:
| Undistributed | Undistributed | Post October Loss | Capital Loss | Other | Unrealized | Total | ||||||||||||||||||||
| Ordinary | Long-Term | and | Carry | Book/Tax | Appreciation/ | Accumulated | ||||||||||||||||||||
| Income | Gains | Late Year Loss | Forwards | Differences | (Depreciation) | Earnings/(Deficits) | ||||||||||||||||||||
| $ | — | $ | — | $ | — | $ | (9,758,146 | ) | $ | — | $ | 56,262,359 | $ | 46,504,213 | ||||||||||||
The difference between book basis and tax basis unrealized appreciation, accumulated net realized losses and undistributed net investment income/loss is primarily attributable to tax adjustments for partnerships and the tax deferral of losses on wash sales. The unrealized appreciation in the table above includes unrealized foreign currency gains of $6,637.
At October 31, 2021, the Fund had capital loss carry forwards (“CLFC”) for federal income tax purposes available to offset future capital gains (including prior year losses of 127,544 incurred as a C-Corp and carried forward to the Fund) and capital loss carry forwards utilized, as follows:
| Non-Expiring | Non-Expiring | CLCF | ||||||||||||
| Short-Term | Long-Term | Total | Utilized | |||||||||||
| $ | 5,421,298 | $ | 4,336,848 | $ | 9,758,146 | $ | 1,926,840 | |||||||
26
| Recurrent MLP & Infrastructure Fund |
| NOTES TO FINANCIAL STATEMENTS (Continued) |
| October 31, 2021 |
Permanent book and tax differences, primarily attributable to adjustments to the Fund’s prior year federal tax return, resulted in reclassifications for the Fund for the fiscal year ended October 31, 2021 as follows:
| Paid In | Accumulated | |||||
| Capital | Earnings/(Losses) | |||||
| $ | (56,159 | ) | $ | 56,159 | ||
| 7. | CONTROL OWNERSHIP |
The beneficial ownership, either directly or indirectly, of more than 25% of the voting securities of the Fund creates presumption of control of the Fund, under Section 2(a) 9 of the 1940 Act. As of October 31, 2021, Charles Schwab & Company, Inc. held approximately 35% of the voting securities of the Fund.
| 8. | SUBSEQUENT EVENTS |
Subsequent events after the date of the Statements of Assets and Liabilities have been evaluated through the date the financial statements were issued. Management has determined that no events or transactions occurred requiring adjustment or disclosure in the financial statements.
27
Report of Independent Registered Public Accounting Firm
To the Board of Trustees of Two Roads Shared Trust
and the Shareholders of Recurrent MLP & Infrastructure Fund
Opinion on the Financial Statements
We have audited the accompanying statement of assets and liabilities of Recurrent MLP & Infrastructure Fund (the Fund), including the schedule of investments, as of October 31, 2021, the related statement of operations for the year then ended, the statements of changes in net assets for each of the two years in the period then ended, and the related notes to the financial statements (collectively, the financial statements), and the financial highlights for each of the three years in the period then ended and for the period from November 2, 2017 (commencement of operations) through October 31, 2018. In our opinion, the financial statements and financial highlights present fairly, in all material respects, the financial position of the Fund as of October 31, 2021, the results of its operations for the year then ended, the changes in net assets for each of the two years in the period then ended, and the financial highlights for each of the three years in the period then ended and for the period from November 2, 2017 (commencement of operations) through October 31, 2018, in conformity with accounting principles generally accepted in the United States of America.
Basis for Opinion
These financial statements are the responsibility of the Fund’s management. Our responsibility is to express an opinion on the Fund’s financial statements and financial highlights based on our audit. We are a public accounting firm registered with the Public Company Accounting Oversight Board (United States) (PCAOB) and are required to be independent with respect to the Fund in accordance with U.S. federal securities laws and the applicable rules and regulations of the Securities and Exchange Commission and the PCAOB.
We conducted our audit in accordance with the standards of the PCAOB. Those standards require that we plan and perform the audit to obtain reasonable assurance about whether the financial statements are free of material misstatement, whether due to error or fraud. The Fund is not required to have, nor were we engaged to perform, an audit of its internal control over financial reporting. As part of our audit, we are required to obtain an understanding of internal control over financial reporting but not for the purpose of expressing an opinion on the effectiveness of the Fund’s internal control over financial reporting. Accordingly, we express no such opinion.
Our audit included performing procedures to assess the risks of material misstatement of the financial statements, whether due to error or fraud, and performing procedures that respond to those risks. Such procedures included examining, on a test basis, evidence regarding the amounts and disclosures in the financial statements. Our procedures included confirmation of investments owned as of October 31, 2021, by correspondence with the custodian. Our audit also included evaluating the accounting principles used and significant estimates made by management, as well as evaluating the overall presentation of the financial statements. We believe that our audit provides a reasonable basis for our opinion.
/s/ RSM US LLP
We have served as the auditor of one or more Recurrent Investment Advisors, LLC advised investment companies since 2017.
Denver, Colorado
December 28, 2021
28
| Recurrent MLP & Infrastructure Fund |
| EXPENSE EXAMPLES (Unaudited) |
| October 31, 2021 |
As a shareholder of the Fund, you incur two types of costs: (1) transaction costs; (2) ongoing costs, including management fees; and other Fund expenses. This example is intended to help you understand your ongoing costs (in dollars) of investing in the Fund and compare these costs with the ongoing costs of investing in other mutual funds.
The example is based on an investment of $1,000 invested at the beginning of the period* and held for the entire period from May 1, 2021 through October 31, 2021.
Actual Expenses
The “Actual Expenses” line in the table below provides information about actual account values and actual expenses. You may use the information below, together with the amount you invested, to estimate the expenses that you paid over the period. Simply divide your account value by $1,000 (for example, an $8,600 account value divided by $1,000 = 8.6), then multiply the result by the number in the table under the heading entitled “Expenses Paid During Period” to estimate the expenses you paid on your account during this period.
Hypothetical Example for Comparison Purposes
The “Hypothetical” line in the table below provides information about hypothetical account values and hypothetical expenses based on the Fund’s actual expense ratio and an assumed rate of return of 5% per year before expenses, which is not the Fund’s actual return. The hypothetical account values and expenses may not be used to estimate the actual ending account balances or expenses you paid for the period. You may use this information to compare this 5% hypothetical example with the 5% hypothetical examples that appear in the shareholder reports of other funds.
Please note that the expenses shown in the table are meant to highlight your ongoing costs only and do not reflect any transactional costs, such as sales loads, or redemption fees. Therefore, the table is useful in comparing ongoing costs only, and will not help you determine the relative total costs of owning different funds. In addition, if these transactional costs were included, your costs would have been higher.
| Hypothetical (5% return before | ||||||||||||
| Actual | expenses) | |||||||||||
| Fund’s | Beginning | |||||||||||
| Annualized | Account | Ending | Expenses Paid | Ending | Expenses Paid | |||||||
| Expense Ratio | Value | Account Value | During Period | Account Value | During Period | |||||||
| Class I: | ||||||||||||
| Recurrent MLP & Infrastructure Fund* | 1.25% | $1,000.00 | $1,172.10 | $6.84 | $1,018.90 | $6.36 | ||||||
| * | Expense information is equal to the average account value over the period, multiplied by the Fund’s annualized expense ratio, multiplied by the number of days in the period (184) divided by the number of days in the fiscal year (365). |
29
| Recurrent MLP & Infrastructure Fund |
| SUPPLEMENTAL INFORMATION (Unaudited) |
| October 31, 2021 |
Approval of Advisory Agreement
Recurrent MLP & Infrastructure Fund
At a meeting held on June 28-29, 2021 (the “Meeting”), the Board of Trustees (the “Board”) of Two Roads Shared Trust (the “Trust”), each of whom is not an “interested person” of the Trust (the “Independent Trustees” or the “Trustees”), as such term is defined under Section 2(a)(19) of the Investment Company Act of 1940, as amended (the “1940 Act”), considered the reapproval of the investment advisory agreement (the “Advisory Agreement”) between Recurrent Investment Advisors, LLC (“Recurrent” or the “Adviser”) and the Trust, on behalf of the Recurrent MLP& Infrastructure Fund (“Recurrent MLP Fund” or the “Fund”).
In connection with the Board’s consideration of the Advisory Agreement, the Board received written materials in advance of the Meeting, which included information regarding: (i) the nature, extent, and quality of services to be provided to the Recurrent MLP Fund by Recurrent; (ii) a description of the Adviser’s investment management personnel; (iii) an overview of the Adviser’s operations and financial condition; (iv) a description of the Adviser’s brokerage practices (including any soft dollar arrangements); (v) a comparison of the Recurrent MLP Fund’s advisory fees and overall expenses with those of comparable mutual funds; (vi) the anticipated level of profitability from the Adviser’s fund-related operations; (vii) the Adviser’s compliance policies and procedures, including policies and procedures for personal securities transactions, business continuity and information security and (viii) information regarding the performance record of the Recurrent MLP Fund as compared to other mutual funds with similar investment strategies.
Throughout the process, including at the meeting, the Board had numerous opportunities to ask questions of and request additional materials from Recurrent. During the Meeting, the Board was advised by, and met, in executive session with, the Board’s independent legal counsel, and received a memorandum from such independent counsel regarding their responsibilities under applicable law. The Board also noted that the evaluation process with respect to the Adviser was an ongoing one and that in this regard, the Board took into account discussions with management and information provided to the Board at prior meetings with respect to the services provided by the Adviser.
Matters considered by the Board in connection with its approval of the Advisory Agreement included, among others, the following:
Nature, Extent and Quality of Services. The Board reviewed materials provided by Recurrent related to the Advisory Agreement with the Trust on behalf of the Fund, including: the Advisory Agreement; a description of the manner in which investment decisions are made and executed; a review of the financial condition of Recurrent; an overview of the personnel that perform advisory, compliance, and operational services for the Fund; a quarterly written report containing Recurrent’s performance commentary; Recurrent’s compliance program, including its business continuity policy and information systems security policy, and a Code of Ethics containing provisions reasonably necessary to prevent Access Persons, as that term is defined in Rule 17j-1 under the Investment Company Act of 1940 Act, from engaging in conduct prohibited by Rule 17j-1(b); information regarding risk management processes and liquidity management; an annual review of the operation of Recurrent’s compliance program; information regarding the Adviser’s and its affiliates’ compliance and regulatory history; and an independent report prepared by Broadridge analyzing the performance record, fees and expenses of the Fund as compared to other mutual funds with similar investment strategies.
In reaching its conclusions with respect to the nature and quality of services to be provided by Recurrent under the Advisory Agreement, the Board considered the overall experience of Recurrent’s employees’ asset management, risk management, operations and compliance experience, particularly their long-term focus on the energy sector over the courses of their careers. The Board considered that Recurrent has incrementally added to staff with an additional partner focused on the distribution of the Fund, and that there had been no staffing changes in the Fund’s portfolio management team. The Board noted that it had met with the Fund’s portfolio managers and continued
30
| Recurrent MLP & Infrastructure Fund |
| SUPPLEMENTAL INFORMATION (Unaudited)(Continued) |
| October 31, 2021 |
to be satisfied with their expertise and ability to manage the Fund’s portfolio in accordance with its investment objectives and strategy.
The Board also noted that it receives and has reviewed information from the Trust’s CCO that indicated that there have been no significant compliance violations or of the Trust’s code of ethics and that Recurrent appears to utilize third party systems for trading and compliance functions, and noted the Trust’s CCO finding that Recurrent’s policies and procedures are reasonably designed to ensure compliance with federal securities laws. The Board also noted no significant disruption to the Adviser’s ability to service the Fund due to the COVID-19 pandemic.
In considering the nature, extent, and quality of the services provided by Recurrent, the Board also took into account its knowledge, acquired through discussions and reports during the preceding year and in past years, of Recurrent’s management and the quality of the performance of Recurrent’s duties. The Board concluded that Recurrent had sufficient quality and depth of personnel, resources, investment methods, and compliance policies and procedures to perform its duties under the Advisory Agreement and that the nature, overall quality and extent of the advisory services provided by Recurrent to the Fund were satisfactory and reliable.
Performance. In considering the Fund’s performance, the Board noted that it reviewed at its regularly scheduled meetings information about the Fund’s performance results. Among other data, the Board considered the performance of the Fund for the three-year, one-year and since inception periods ended March 31, 2021 as compared to the Fund’s benchmark index and against the performance of a group of peer funds (the “Peer Group”) provided by Broadridge, an independent third-party data provider. The Board noted that while it found the data provided by the independent third-party generally useful it recognized its limitations, including in particular that the data may vary depending on the end date selected and that the results of the fee comparisons may vary depending on the selection and asset size of the peer group. The Board considered that the Fund exceeded its Peer Group and Morningstar category medians and underperformed its benchmark for the one-year period, and was in the range of each of its Peer Group and Morningstar category medians and outperformed its benchmark for the three-year period. The Board also noted the Fund’s performance from year-to-year.
The Board also took into account Recurrent’s discussion of the Fund’s performance, including the quarterly written report containing Recurrent’s performance commentary. The Board noted the relative performance volatility inherent in the Fund’s strategy and also noted the Fund’s improved relative performance over the more recent period. The Board concluded that the Fund’s performance was being monitored and that overall performance was consistent with the investment strategy as described in the prospectus.
Fees and Expenses. Regarding the costs of the services provided by Recurrent with respect to the Fund, the Board considered a comparison of the Fund’s contractual advisory fee and net expense ratio to those of the funds within the Peer Group and to its Morningstar category. The Board noted that the Fund’s contractual advisory fee was below the median of the Peer Group and its Morningstar category. The Board also considered that the net operating expenses of the Fund were approximately the same as the median of its Peer Group and its Morningstar category. The Board noted in considering the expenses of the Fund that the Fund’s average net assets were substantially lower than the median assets of the funds in its Peer Group and Morningstar category, notwithstanding that the Fund’s current assets had increased over the year. The Board also considered that Recurrent had agreed to reimburse expenses to limit net annual operating expenses to 1.25% (exclusive of any taxes, interest, brokerage commissions, expenses incurred in connection with any merger or reorganization, indirect expenses, expenses of other investment companies in which the Fund may invest, or extraordinary expenses such as litigation) of the average net assets attributable to Class I shares of the Fund. The Board also noted that Recurrent managed other accounts that are similar to the Fund’s investment strategy, and the Fund’s contractual advisory fee was in line with those other accounts.
31
| Recurrent MLP & Infrastructure Fund |
| SUPPLEMENTAL INFORMATION (Unaudited)(Continued) |
| October 31, 2021 |
Based on the factors above, the Board concluded that the advisory fee of the Fund was not unreasonable.
Profitability. The Board considered Recurrent’s profitability and whether these profits were reasonable in light of the services provided to the Fund. The Board reviewed a profitability analysis prepared by Recurrent based on current asset levels of the Fund. The Board noted the direct and indirect costs of operating the Fund in that analysis and concluded that Recurrent’s profitability from its relationship with the Fund was not excessive.
Economies of Scale. The Board considered whether Recurrent would realize economies of scale with respect to its management of the Fund as the Fund grows and whether fee levels reflected these economies of scale for the benefit of shareholders. The Board noted that the advisory fee did not currently have breakpoints. The Board considered the profitability analysis provided by Recurrent and considered that Recurrent had represented that it expected the Fund to achieve economies of scale at certain asset levels, but that at current asset levels, economies of scale continued to not be a current consideration. The Board noted that it would revisit whether economies of scale exist in the future once the Fund has achieved sufficient size.
Other Benefits. The Board also considered the character and amount of any other direct and incidental benefits to be received by Recurrent from its association with the Fund. The Board considered that Recurrent did not anticipate receiving any direct, indirect or ancillary material “fall-out” benefits from its relationship with the Fund, although the Board noted the potential for future product launches based on the success of the Fund as well as the use of soft dollars that Recurrent would utilize for research services. The Board concluded that these potential benefits are reasonable.
Conclusion. The Board, having requested and received such information from Recurrent as it believed reasonably necessary to evaluate the terms of the Advisory Agreement, and having been advised by independent counsel that the Board had appropriately considered and weighed all relevant factors, determined that approval of Advisory Agreement for an additional one-year term was in the best interests of the Fund and its shareholders.
In considering the Advisory Agreement renewal, the Board considered a variety of factors, including those discussed above, and also considered other factors (including conditions and trends prevailing generally in the economy, the securities markets, and the industry). The Board did not identify any one factor as determinative, and each Independent Trustee may have weighed each factor differently. The Board’s conclusions may be based in part on its consideration of the advisory arrangements in prior years and on the Board’s ongoing regular review of fund performance and operations throughout the year.
32
| Recurrent MLP & Infrastructure Fund |
| SUPPLEMENTAL INFORMATION (Unaudited) |
| October 31, 2021 |
Trustees and Officers. The Trustees and officers of the Trust, together with information as to their principal business occupations during the past five years and other information, are shown below. Unless otherwise noted, the address of each Trustee and Officer is 225 Pictoria Drive, Suite 450, Cincinnati, OH 45246.
Independent Trustees *
| Name, Address, Year of Birth | Position(s) Held with Registrant | Term and Length Served | Principal Occupation(s) During Past 5 Years | Number of Portfolios Overseen In The Fund Complex** | Other Directorships Held During Past 5 Years |
| Mark Garbin Year of Birth: 1951 | Trustee | Indefinite, Since 2012 | Managing Principal, Coherent Capital Management LLC (since 2008) | 1 | Northern Lights Fund Trust (since 2013); Northern Lights Variable Trust (since 2013); Forethought Variable Insurance Trust (since 2013); OHA Mortgage Strategies Fund (offshore), Ltd. (2014 - 2017); iCapital KKR Private Markets Fund (since 2014); and Carlyle Tactical Private Credit Fund (since March 2018) |
| Mark D. Gersten Year of Birth: 1950 | Chairman, Trustee | Indefinite, Since 2012 | Independent Consultant (since 2012); Senior Vice President – Global Fund Administration Mutual Funds & Alternative Funds, AllianceBernstein LP (1985 – 2011) | 1 | Northern Lights Fund Trust (since 2013); Northern Lights Variable Trust (since 2013); iCapital KKR Private Markets Fund (since 2014); previously, Ramius Archview Credit and Distressed Fund (2015-2017); and Schroder Global Series Trust (2012 to 2017) |
| Neil M. Kaufman Year of Birth: 1960 | Trustee, Audit Committee Chairman | Indefinite, Since 2012 | Managing Member, Kaufman, McGowan PLLC (legal services)(Since 2016); Partner, Abrams Fensterman, Fensterman, Eisman, Formato, Ferrara & Wolf, LLP (legal services)(2010-2016) | 1 | iCapital KKR Private Markets Fund (since 2014) |
| Anita K. Krug Year of Birth: 1969 | Trustee | Indefinite, Since 2012 | Dean and Professor (since 2019) Illinois Institute of Technology; Interim Vice Chancellor for Academic Affairs (2018-2019) University of Washington Bothell; Interim Dean (2017- 2018), Professor (2016-2019), Associate Professor (2014-2016); and Assistant Professor (2010-2014), University of Washington School of Law | 1 | iCapital KKR Private Markets Fund (since 2014); Centerstone Investors Trust (2016-2021) |
| * | Information is as of October 31, 2021. |
| ** | As of October 31, 2021, the Trust was comprised of 24 active portfolios managed by seven unaffiliated investment advisers and two affiliated investment advisers. The term “Fund Complex” applies only to those funds that (i) are advised by a common investment adviser or by an investment adviser that is an affiliated person of the investment adviser of any of the other funds in the Trust or (ii) hold themselves out to investors as related companies for purposes of investment and investor services. The Fund does not share the same investment adviser with any other series of the Trust or hold itself out as related to any other series of the Trust for investment purposes. |
10/31/2021 – Two Roads v2
33
| Recurrent MLP & Infrastructure Fund |
| SUPPLEMENTAL INFORMATION (Unaudited)(Continued) |
| October 31, 2021 |
Officers of the Trust*
| Name, Address, Year of Birth | Position(s) Held with Registrant | Principal Occupation(s) During Past 5 Years | Number of Portfolios Overseen In The Fund Complex** | Other Directorships Held During Past 5 Years |
| James Colantino 80 Arkay Drive Hauppauge, NY 11788 Year of Birth: 1969 | President Since Feb. 2017 Treasurer (2012 to 2017) | Senior Vice President (2012- present); Vice President (2004 to 2012); Ultimus Fund Solutions LLC | N/A | N/A |
| Laura Szalyga 80 Arkay Drive Hauppauge, NY 11788 Year of Birth: 1978 | Treasurer Since Feb. 2017 | Vice President, Ultimus Fund Solutions LLC (since 2015); Assistant Vice President, Ultimus Fund Solutions LLC (2011-2014) | N/A | N/A |
| Richard A. Malinowski 80 Arkay Drive Hauppauge, NY 11788 Year of Birth: 1983 | Vice President Since Sep. 2018 Secretary Since 2013 | Senior Vice President and Senior Managing Counsel, Ultimus Fund Solutions LLC, (since February 2020); Senior Vice President Legal Administration, Ultimus Fund Solutions LLC (April 2017 to February 2020); Vice President and Counsel (April 2016 – 2017) and AVP and Staff Attorney (September 2012 – March 2016). | N/A | N/A |
| William B. Kimme Year of Birth: 1962 | Chief Compliance Officer Since Inception | Senior Compliance Officer, Northern Lights Compliance Services, LLC (September 2011 -present) | N/A | N/A |
| * | Information is as of October 31, 2021. |
| ** | As of October 31, 2021, the Trust was comprised of 24 active portfolios managed by seven unaffiliated investment advisers and two affiliated investment advisers. The term “Fund Complex” applies only to those funds that (i) are advised by a common investment adviser or by an investment adviser that is an affiliated person of the investment adviser of any of the other funds in the Trust or (ii) hold themselves out to investors as related companies for purposes of investment and investor services. The Fund does not share the same investment adviser with any other series of the Trust or hold itself out as related to any other series of the Trust for investment purposes. |
The Fund’s Statement of Additional Information (“SAI”) includes additional information about the Trustees and is available free of charge, upon request, by calling toll-free at 1-833-732-8773.
10/31/2021 – Two Roads v2
34
| Recurrent MLP & Infrastructure Fund |
| LIQUIDITY RISK MANAGEMENT PROGRAM (Unaudited) |
| October 31, 2021 |
The Fund has adopted and implemented a written liquidity risk management program as required by Rule 22e-4 (the “Liquidity Rule”) under the 1940 Act. The program is reasonably designed to assess and manage the Fund’s liquidity risk, taking into consideration, among other factors, the Fund’s investment strategy and the liquidity of its portfolio investments during normal and reasonably foreseeable stressed conditions; its short and long-term cash flow projections; and its cash holdings and access to other funding sources.
During the fiscal year ended October 31, 2021, the Trust’s Liquidity Risk Management Program Committee (the “Committee”) reviewed the Fund’s investments and determined that the Fund held adequate levels of cash and highly liquid investments to meet shareholder redemption activities in accordance with applicable requirements. Accordingly, the Committee concluded that (i) the Fund’s liquidity risk management program is reasonably designed to prevent violations of the Liquidity Rule and (ii) the Fund’s liquidity risk management program has been effectively implemented.
35
| PRIVACY NOTICE | |||||||||
| FACTS | WHAT DOES TWO ROADS SHARED TRUST DO WITH YOUR PERSONAL INFORMATION | ||||||||
| Why? | Financial companies choose how they share your personal information. Federal law gives consumers the right to limit some but not all sharing. Federal law also requires us to tell you how we collect, share, and protect your personal information. Please read this notice carefully to understand what we do. | ||||||||
| What? | THE TYPES OF PERSONAL INFORMATION WE COLLECT AND SHARE DEPENDS ON THE PRODUCT OR SERVICE THAT YOU HAVE WITH US. THIS INFORMATION CAN INCLUDE: | ||||||||
| ● Social Security number and income | |||||||||
| ● Account transactions and transaction history | |||||||||
| ● Investment experience and purchase history | |||||||||
| When you are no longer our customer, we continue to share your information as described in this notice. | |||||||||
| How? | All financial companies need to share customers’ personal information to run their everyday business. In the section below, we list the reasons financial companies can share their customers’ personal information; the reason Two Roads Shared Trust chooses to share and whether you can limit this sharing. | ||||||||
| Reasons we can share your personal information | Does Two Roads Shared Trust share? | Can you limit this sharing? |
| For our everyday business purposes – such as to process your transactions, maintain your account(s), respond to court orders and legal investigations, or report to credit bureaus | YES | NO |
| For our marketing purposes – to offer our products and services to you | NO | We do not share |
| For joint marketing with other financial companies | NO | We do not share |
| For our affiliates’ everyday business purposes – information about your transactions and experiences | NO | We do not share |
| For our affiliates’ everyday business purposes – information about your creditworthiness | NO | We do not share |
| For our affiliates to market to you | NO | We do not share |
| For nonaffiliates to market to you | NO | We do not share |
| Questions? | Call 1-402-895-1600 | |
36
What we do
| How does Two Roads Shared Trust protect my personal information? | To protect your personal information from unauthorized access and use, we use security measures that comply with federal law. These measures include computer safeguards and secured files and buildings.
Our service providers are held accountable for adhering to strict policies and procedures to prevent any misuse of your nonpublic personal information. |
| How does Two Roads Shared Trust collect my personal information? | We collect your personal information, for example, when you |
| ● open an account or give us contact information | |
| ● provide account information or give us your income information | |
| ● make deposits or withdrawals from your account | |
| We also collect your personal information from other companies. | |
| Why can’t I limit all sharing? | Federal law gives you the right to limit only |
| ● sharing for affiliates’ everyday business purposes – information about your creditworthiness | |
| ● affiliates from using your information to market to you | |
| ● sharing for nonaffiliates to market to you | |
| State laws and individual companies may give you additional rights to limit sharing | |
| Definitions | |
| Affiliates | Companies related by common ownership or control. They can be financial and nonfinancial companies. |
| ● Two Roads Shared Trust has no affiliates. | |
| Nonaffiliates | Companies not related by common ownership or control. They can be financial and nonfinancial companies. |
| ● Two Roads Shared Trust does not share with nonaffiliates so they can market to you. | |
| Joint marketing | A formal agreement between nonaffiliates financial companies that together market financial products or services to you. |
| ● Two Roads Shared Trust does not jointly market. | |
37
PROXY VOTING POLICY
Information regarding how the Fund voted proxies relating to portfolio securities for the most recent twelve month period ended June 30 as well as a description of the policies and procedures that the Fund uses to determine how to vote proxies is available without charge, upon request, by calling 1-833-RECURRENT (1-833-732-8773) or by referring to the Securities and Exchange Commission’s (“SEC”) website at http://www.sec.gov.
PORTFOLIO HOLDINGS
The Fund files its complete schedule of portfolio holdings with the SEC for the first and third quarters of each fiscal year as an exhibit to its report on Form N-PORT. Form N-PORT is available on the SEC’s website at http://www.sec.gov. The information on Form N-PORT is available without charge, upon request, by calling 1-833-RECURRENT (1-833-732-8773).
INVESTMENT ADVISOR
Recurrent Investment Advisors, LLC
3801 Kirby Drive, Suite 654
Houston, TX 77098
ADMINISTRATOR
Ultimus Fund Solutions, LLC
4221 North 203rd Street, Suite 100
Elkhorn, NE 68022
This report and the financial statements contained herein are submitted for the general information of shareholders and are not authorized for distribution to prospective investors unless preceded or accompanied by an effective prospectus. Nothing contained herein is to be considered an offer of sale or solicitation of an offer to buy shares of the Fund. Such offering is made only by a prospectus, which contains information about the Fund’s investment objective, risks, fees and expenses. Investors are reminded to read the prospectus carefully before investing in the Fund.
Recurrent-AR-21
(a) Include a copy of the report transmitted to stockholders pursuant to Rule 30e-1 under the Act (17 CFR 270.30e-1).
(b) Include a copy of each notice transmitted to stockholders in reliance on Rule 30e-3 under the Act (17 CFR 270.30e-3) that contains disclosures specified by paragraph (c)(3) of that rule.
ITEM 2. CODE OF ETHICS.
| (a) | The registrant has, as of the end of the period covered by this report, adopted a code of ethics that applies to the registrant's principal executive officer, principal financial officer, and principal accounting officer or controller, or persons performing similar functions, regardless of whether these individuals are employed by the registrant or a third party. |
| (b) | During the period covered by this report, there were no amendments to any provision of the code of ethics. |
| (c) | During the period covered by this report, there were no waivers or implicit waivers of a provision of the code of ethics. |
ITEM 3. AUDIT COMMITTEE FINANCIAL EXPERT.
(a)(1) The Registrant’s board of trustees has determined that Mark Gersten is an audit committee financial expert, as defined in Item 3 of Form N-CSR. Mr. Gersten is independent for purposes of this Item. (a)(2) Not applicable. (a)(3) Not applicable.
|
ITEM 4. PRINCIPAL ACCOUNTANT FEES AND SERVICES.
| (a) | Audit Fees. The aggregate fees billed for each of the last two fiscal years for professional services rendered by the registrant's principal accountant for the audit of the registrant's annual financial statements or services that are normally provided by the accountant in connection with statutory and regulatory filings or engagements for those fiscal years are as follows:
2021: $18,250 2020: $17,500 |
| (b) | Audit-Related Fees. There were no fees billed in each of the last two fiscal years for assurances and related services by the principal accountant that are reasonably related to the performance of the audit of the registrant’s financial statements and are not reported under paragraph (a) of this item. |
| (c) | Tax Fees. The aggregate fees billed in each of the last two fiscal years for professional services rendered by the principal accountant for tax compliance are as follows:
2021: $9,750 2020: $9,500 |
| (d) | All Other Fees. The aggregate fees billed in each of the last two fiscal years for products and services provided by the registrant’s principal accountant, other than the services reported in paragraphs (a) through (c) of this item were $0 and $0 for the fiscal years ended October 31, 2021 and 2020, respectively. |
| (e)(1) | The audit committee does not have pre-approval policies and procedures. Instead, the audit committee or audit committee chairman approves on a case-by-case basis each audit or non-audit service before the principal accountant is engaged by the registrant. |
| (e)(2) | There were no services described in each of paragraphs (b) through (d) of this Item that were approved by the audit committee pursuant to paragraph (c)(7)(i)(C) of Rule 2-01 of Regulation S-X. |
| (f) | Not applicable. The percentage of hours expended on the principal accountant's engagement to audit the registrant's financial statements for the most recent fiscal year that were attributed to work performed by persons other than the principal accountant's full-time, permanent employees was zero percent (0%). |
| (g) | All non-audit fees billed by the registrant's principal accountant for services rendered to the registrant for the fiscal years ended October 31, 2021 and 2020 respectively are disclosed in (b)-(d) above. There were no audit or non-audit services performed by the registrant's principal accountant for the registrant's adviser. |
| (h) | Not applicable. |
ITEM 5. AUDIT COMMITTEE OF LISTED REGISTRANTS.
Not applicable
ITEM 6. SCHEDULE OF INVESTMENT
Included in annual report to shareholders filed under item 1 of this form.
ITEM 7. DISCLOSURE OF PROXY VOTING POLICIES AND PROCEDURES FOR CLOSED-END MANAGEMENT INVESTMENT COMPANIES.
Not applicable Fund is an open-end management investment company
ITEM 8. PORTFOLIO MANAGERS OF CLOSED-END MANAGEMENT INVESTMENT COMPANIES
Not applicable Fund is an open-end management investment company
ITEM 9. PURCHASES OF EQUITY SECURITIES BY CLOSED-END MANAGEMENT INVESTMENT COMPANIES AND AFFILIATED PURCHASERS.
Not applicable Fund is an open-end management investment company
ITEM 10. SUBMISSION OF MATTERS TO A VOTE OF SECURITY HOLDERS.
Not applicable at this time.
ITEM 11. CONTROLS AND PROCEDURES.
| (a) | The registrant's principal executive and principal financial officers, or persons performing similar functions, have concluded that the registrant's disclosure controls and procedures (as defined in Rule 30a-3(c) under the 1940 Act, are effective, as of a date within 90 days of the filing date of this report, based on the evaluation of these controls and procedures required by Rule 30a-3(b) under the 1940 Act and Rule 15d-15(b) under the Securities Exchange Act of 1934, as amended. |
| (b) | There were no changes in the registrant's internal control over financial reporting (as defined in Rule 30a-3(d) under the 1940 Act) that occurred during the period covered by this report that have materially affected, or are reasonably likely to materially affect, the registrant's internal control over financial reporting. |
Item 12. Disclosure of Securities Lending Activities for Closed-End Management Investment Companies.
Not applicable.
ITEM 13. EXHIBITS
| (a)(1) | Code of Ethics for Principal Executive and Senior Financial Officers is attached hereto. |
| (a)(2) | Certifications pursuant to Section 302 of the Sarbanes-Oxley Act of 2002 are filed herewith. |
| (b) | Certifications pursuant to Section 906 of the Sarbanes-Oxley Act of 2002 are filed herewith. |
SIGNATURES
Pursuant to the requirements of the Securities Exchange Act of 1934 and the Investment Company Act of 1940, the registrant has duly caused this report to be signed on its behalf by the undersigned, thereunto duly authorized.
Two Roads Shared Trust
| By James Colantino | /s/ James Colantino |
| Principal Executive Officer, | |
| Date: 1/6/2022 | |
Pursuant to the requirements of the Securities Exchange Act of 1934 and the Investment Company Act of 1940, this report has been signed below by the following person on behalf of the registrant and in the capacities and on the date indicated.
| By James Colantino | /s/ James Colantino |
| Principal Executive Officer | |
| Date: 1/6/2022 | |
Pursuant to the requirements of the Securities Exchange Act of 1934 and the Investment Company Act of 1940, this report has been signed below by the following person on behalf of the registrant and in the capacities and on the date indicated.
| By Laura Szalyga | /s/ Laura Szalyga |
| Principal Financial Officer | |
| Date: 1/6/2022 | |