united states
securities and exchange commission
washington, d.c. 20549
form n-csr
certified shareholder report of registered management
investment companies
Investment Company Act file number 811-22718
Two Roads Shared Trust
(Exact name of registrant as specified in charter)
225 Pictoria Drive, Suite 450 Cincinnati, OH 45246
(Address of principal executive offices) (Zip code)
The Corporation Trust Company
1209 Orange Street
Wilmington, DE 19801
(Name and address of agent for service)
Registrant's telephone number, including area code: 631-470-2619
Date of fiscal year end: 12/31
Date of reporting period: 12/31/23
ITEM 1. REPORTS TO SHAREHOLDERS.
Dear Shareholder,
Redwood Managed Volatility Portfolio: 4.36%
Class I - From January 1, 2023 through December 31, 2023
Source: Ultimus Fund Solutions.
During the Redwood Managed Volatility Portfolio’s (the “Fund”) fiscal year, risk markets staged a recovery as the U.S. Federal Reserve was believed to be nearing the end of it ’s aggressive rate hiking policy to curb decade high levels of inflation. However, unlike the rally seen in stocks, many fixed income asset classes had been range bound up until the last quarter of the fiscal year.
The Fund returned 4.36%* for the one-year period ended December 31, 2023 (Source: Ultimus) . Utilizing our quantitative risk-managed process, the Fund had several tactical shifts to and from defensive posturing that resulted in the Fund being exposed to risk assets for only a portion of the period. The Fund derived most of its total return from U.S. corporate high-yield bond fund exposure. The Fund performed inline in comparison to its benchmark, the ICE BofA 3-5 Year Treasury Index** which returned 4.37% (Source: Ultimus). During the remainder of the period, the Fund was also able to participate in the intermittent recoveries given the tactical nature of the strategy.
Capital markets are infinitely complex. Every day, new information becomes available that changes the risk and return dynamic of any investment. In our view, capital markets are only a tool to capture opportunities in favorable risk -return dynamic, wherever they exist to work towards an investor’s long-term goal or objective. We do not attempt to forecast or suggest what may lie ahead. Instead, we utilize a disciplined, quantitative approach, aiming to minimize the subjectivity of investing.
| * | The returns are based upon unadjusted net asset values and may differ from the returns shown in the financial statements, which include adjustments in accordance with accounting principles generally accepted in the United States. |
| ** | ICE Bank of America 3-5 Year Treasury Index is an unmanaged index which includes U.S. Treasury securities with maturities of 3 to 4.99 years. The index is produced by Bank of America MerrillLynch, Pierce, Fenner & Smith, Inc. Investors cannot invest directly in an index or benchmark. Index returns are gross of any fees, brokerage commissions or other expenses of investing. |
The views in this report are those of the Fund’s management. This report contains certain forward-looking statements about factors that may affect the performance of the Fund in the future. These statements are based on the Fund’s management’s predictions and expectations concerning certain future events such as the performance of the economy as the whole and of specific industry sectors. Management believes that these forward-looking statements are reasonable, although they are inherently uncertain and difficult to predict.
3070-NLD-01/23/2024
1
Redwood Managed Volatility Portfolio
PORTFOLIO REVIEW (Unaudited)
December 31, 2023
The Portfolio’s performance figures* for the periods ended December 31, 2023 compared to its benchmark:
| (Annualized) | (Annualized) | ||||
| (Annualized) | (Annualized) | Since Inception | Since Inception | ||
| One Year | Three Year | Five Year | Class N | Class I | |
| Class N (a,d) | 3.83% | (0.50)% | 3.38% | 2.75% | N/A |
| Class I (b,d) | 4.36% | 0.00% | 3.89% | N/A | 3.45% |
| ICE BoFA 3-5 Year Treasury Index (c) | 4.37% | (1.94)% | (1.94)% | 1.08% | 0.99% |
| * | The performance data quoted here represents past performance. Current performance may be lower or higher than the performance data quoted above. Past performance is no guarantee of future results. The investment return and principal value of an investment will fluctuate so that investor’s shares, when redeemed, may be worth more or less than their original cost. The returns shown do not reflect the deduction of taxes that a shareholder would pay on Portfolio distributions or on the redemption of Portfolio shares, as well as other charges and expenses of the insurance contract or separate account. The Portfolio’s total annual operating expenses, before expense waivers, are 3.30% and 2.80% for Class N shares and Class I shares, respectively, per the May 1, 2023 prospectus. Redwood Invesment Management, LLC (the “Adviser”) has contractually agreed to reduce the Portfolio’s fees and/or to make payments to limit Portfolio expenses until at least May 1, 2024, so that the total annual operating expenses after fee waiver and reimbursement (exclusive of any front-end or contingent deferred loads, brokerage fees and commissions, acquired fund fees and expenses, borrowing costs (such as interest and dividend expense on securities sold short), taxes, and extraordinary expenses such as litigation expenses) of the Portfolio do not exceed 1.99% and 1.49% for Class N and Class I shares, respectively. This agreement may be terminated by the Portfolio’s Board of Trustees on 60 days’ written notice to the Adviser. These fee waivers and/or expense reimbursements are subject to possible recoupment from the Portfolio in future years on a rolling three year basis (within the three years after the fees have been waived and/or reimbursed) if such recoupment can be achieved without exceeding the foregoing expense limits as well as any expense limitation in effect at the time the waiver or reimbursement was made. For performance information current to the most recent month-end, please call toll-free 1-855-733-3863. |
| (a) | Redwood Managed Volatility Portfolio Class N commenced operations on October 20, 2014. |
| (b) | Redwood Managed Volatility Portfolio Class I commenced operations on January 15, 2015. |
| (c) | ICE BoFA 3-5 Year Treasury Index is an unmanaged index which includes U.S. Treasury securities with maturities of 3 to 4.99 years. The index is produced by Bank of America Merrill Lynch, Pierce, Fenner & Smith, Inc. Investors can not invest directly in an index or benchmark. Index returns are gross of any fees, brokerage commissions or other expenses of investing. |
| (d) | The returns are based upon unadjusted net asset values and may differ from the returns shown in the financial statements, which include adjustments in accordance with accounting principles generally accepted in the United States. |
Comparison of the Change in Value of a $10,000 Investment
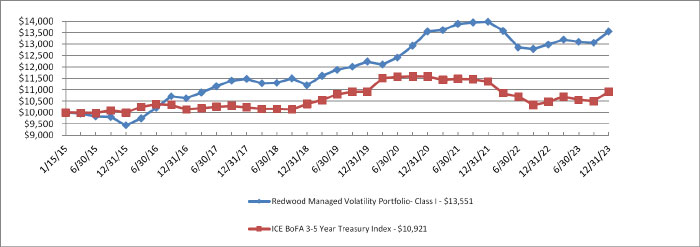
| * | Performance shown is for Class I shares. The performance of the Fund’s other class may be greater or less than the line shown due to differences in loads and fees paid by shareholders in different share classes. |
PORTFOLIO ANALYSIS (Unaudited) December 31, 2023 | ||||
| Percent of | ||||
| Net Assets | ||||
| Open End Funds - Fixed Income | 99.4 | % | ||
| Short-Term Investments | 0.0 | % | ||
| Other Assets in Excess of Liabilities | 0.6 | % | ||
| Total | 100.0 | % | ||
Please refer to the Schedule of Investments for a detailed listing of the Portfolio’s holdings.
2
| REDWOOD MANAGED VOLATILITY PORTFOLIO |
| SCHEDULE OF INVESTMENTS |
| December 31, 2023 |
| Shares | Fair Value | |||||||
| OPEN END FUNDS — 99.4% | ||||||||
| FIXED INCOME – 99.4% | ||||||||
| 142,916 | American High-Income Trust, Class F-3 | $ | 1,357,700 | |||||
| 193,383 | BlackRock High Yield Bond Portfolio, Institutional Class | 1,363,336 | ||||||
| 152,741 | Federated Hermes Institutional High Yield Bond Fund, Institutional Class | 1,350,230 | ||||||
| 1,346 | Janus Henderson High-Yield Fund, Class I | 9,748 | ||||||
| 214,696 | Lord Abbett High Yield Fund, Class I | 1,363,317 | ||||||
| 1,033 | MainStay MacKay High Yield Corporate Bond Fund, Class I | 5,331 | ||||||
| 1,170 | PIMCO High Yield Fund, Institutional Class | 9,352 | ||||||
| 163,471 | Principal High Income Fund, Institutional Class | 1,345,364 | ||||||
| 955 | Putnam High Yield Fund, Class Y | 5,412 | ||||||
| 250,657 | Vanguard High-Yield Corporate Fund, Admiral Shares | 1,358,561 | ||||||
| TOTAL OPEN END FUNDS (Cost$7, 809,161) | 8,168,351 | |||||||
| SHORT-TERM INVESTMENTS — 0.0% | ||||||||
| MONEY MARKET FUND - 0.0% | ||||||||
| 324 | Vanguard Cash Reserves Federal Money Market Fund, Admiral Shares, 5.32%(a) (Cost$324) | 324 | ||||||
| TOTAL INVESTMENTS – 99.4% (Cost $7,809,485) | $ | 8,168,675 | ||||||
| OTHER ASSETS IN EXCESS OF LIABILITIES- 0.6% | 46,500 | |||||||
| NET ASSETS - 100.0% | $ | 8,215,175 | ||||||
| (a) | Rate disclosed is the seven day effective yield as of December 31, 2023. |
The accompanying notes are an integral part of these financial statements.
3
| Redwood Managed Volatility Portfolio |
| STATEMENT OF ASSETS AND LIABILITIES |
| December 31, 2023 |
| ASSETS | ||||
| Investment securities: | ||||
| At cost | $ | 7,809,485 | ||
| At fair value | $ | 8,168,675 | ||
| Cash | 85,794 | |||
| Dividends and interest receivable | 258 | |||
| Due from Adviser | 5,183 | |||
| Prepaid expenses | 7,326 | |||
| TOTAL ASSETS | 8,267,236 | |||
| LIABILITIES | ||||
| Distribution (12b-1) fees payable - Class N | 710 | |||
| Payable for Portfolio shares redeemed | 3,037 | |||
| Payable to related parties | 13,203 | |||
| Accrued expenses and other liabilities | 35,111 | |||
| TOTAL LIABILITIES | 52,061 | |||
| NET ASSETS | $ | 8,215,175 | ||
| Class N Shares: | ||||
| Net Assets | $ | 1,699,546 | ||
| Shares of beneficial interest outstanding ($0 par value, unlimited shares authorized) | 181,309 | |||
| Net Asset Value (Net Assets÷Shares Outstanding), Offering and Redemption Price Per Share | $ | 9.37 | ||
| Class I Shares: | ||||
| Net Assets | $ | 6,515,629 | ||
| Shares of beneficial interest outstanding ($0 par value, unlimited shares authorized) | 694,913 | |||
| Net Asset Value (Net Assets÷Shares Outstanding), Offering and Redemption Price Per Share | $ | 9.38 | (a) | |
| Net Assets Consist of: | ||||
| Paid-in-Capital | $ | 8,406,648 | ||
| Accumulated Deficit | (191,473 | ) | ||
| Net Assets | $ | 8,215,175 | ||
| (a) | The NAV and Offering Price shown above differ from the traded NAV on December 31, 2023 due to financial statement rounding and/or financial statement adjustments. |
The accompanying notes are an integral part of these financial statements.
4
| Redwood Managed Volatility Portfolio |
| STATEMENT OF OPERATIONS |
| For the Year Ended December 31, 2023 |
| INVESTMENT INCOME | ||||
| Dividends | $ | 423,166 | ||
| Interest | 107,042 | |||
| TOTAL INVESTMENT INCOME | 530,208 | |||
| EXPENSES | ||||
| Investment advisory fees | 113,934 | |||
| Distribution (12b-1) fees - Class N | 9,031 | |||
| Legal fees | 29,849 | |||
| Audit fees | 25,660 | |||
| Accounting services fees | 23,590 | |||
| Administrative services fees | 19,156 | |||
| Third party administrative service fees | 17,919 | |||
| Trustees’ fees and expenses | 17,237 | |||
| Printing and postage expenses | 11,581 | |||
| Transfer agent fees | 10,207 | |||
| Compliance officer fees | 8,583 | |||
| Custodian fees | 8,072 | |||
| Insurance fees | 6,063 | |||
| Custody overdraft fees | 1,942 | |||
| Miscellaneous fees | 2,431 | |||
| TOTAL EXPENSES | 305,255 | |||
| Less: Fees waived/reimbursed by the Adviser | (158,544 | ) | ||
| NET EXPENSES | 146,711 | |||
| NET INVESTMENT INCOME | 383,497 | |||
| REALIZED AND UNREALIZED GAIN (LOSS) ON INVESTMENTS | ||||
| Net realized loss on investments | (328,331 | ) | ||
| Net change in unrealized appreciation (depreciation) on investments | 306,864 | |||
| NET REALIZED AND UNREALIZED LOSS ON INVESTMENTS | (21,467 | ) | ||
| NET INCREASE IN NET ASSETS RESULTING FROM OPERATIONS | $ | 362,030 | ||
The accompanying notes are an integral part of these financial statements.
5
| Redwood Managed Volatility Portfolio |
| STATEMENTS OF CHANGES IN NET ASSETS |
| For the | For the | |||||||
| Year Ended | Year Ended | |||||||
| December 31, 2023 | December 31, 2022 | |||||||
| FROM OPERATIONS | ||||||||
| Net investment income | $ | 383,497 | $ | 94,833 | ||||
| Net realized gain (loss) on investments | (328,331 | ) | 331,344 | |||||
| Net change in unrealized appreciation (depreciation) of investments | 306,864 | (1,405,719 | ) | |||||
| Net increase (decrease) in net assets resulting from operations | 362,030 | (979,542 | ) | |||||
| DISTRIBUTIONS TO SHAREHOLDERS | ||||||||
| Class N | (10,126 | ) | (90,101 | ) | ||||
| Class I | (84,678 | ) | (370,726 | ) | ||||
| Net decrease in net assets from distributions to shareholders | (94,804 | ) | (460,827 | ) | ||||
| FROM SHARES OF BENEFICIAL INTEREST | ||||||||
| Class N: | ||||||||
| Proceeds from shares sold | 69,894 | 52,442 | ||||||
| Net asset value of shares issued in reinvestment of distributions | 10,126 | 90,101 | ||||||
| Cost of shares redeemed | (534,826 | ) | (884,724 | ) | ||||
| Net decrease in net assets from shares of beneficial interest | (454,806 | ) | (742,181 | ) | ||||
| Class I: | ||||||||
| Proceeds from shares sold | 1,687,741 | 2,188,937 | ||||||
| Net asset value of shares issued in reinvestment of distributions | 84,677 | 370,726 | ||||||
| Cost of shares redeemed | (3,217,932 | ) | (7,442,839 | ) | ||||
| Net decrease in net assets from shares of beneficial interest | (1,445,514 | ) | (4,883,176 | ) | ||||
| TOTAL DECREASE IN NET ASSETS | (1,633,094 | ) | (7,065,726 | ) | ||||
| NET ASSETS | ||||||||
| Beginning of Year | 9,848,269 | 16,913,995 | ||||||
| End of Year | $ | 8,215,175 | $ | 9,848,269 | ||||
| SHARE ACTIVITY | ||||||||
| Class N: | ||||||||
| Shares Sold | 7,601 | 5,506 | ||||||
| Shares Reinvested | 1,112 | 9,815 | ||||||
| Shares Redeemed | (57,932 | ) | (90,217 | ) | ||||
| Net decrease in shares of beneficial interest outstanding | (49,219 | ) | (74,896 | ) | ||||
| Class I: | ||||||||
| Shares Sold | 181,300 | 224,080 | ||||||
| Shares Reinvested | 9,295 | 40,296 | ||||||
| Shares Redeemed | (347,832 | ) | (753,403 | ) | ||||
| Net decrease in shares of beneficial interest outstanding | (157,237 | ) | (489,027 | ) | ||||
The accompanying notes are an integral part of these financial statements.
6
| Redwood Managed Volatility Portfolio - Class N |
| FINANCIAL HIGHLIGHTS |
| Per share data and ratios for a share of beneficial interest outstanding throughout each year presented. |
| For the | For the | For the | For the | For the | ||||||||||||||||
| Year Ended | Year Ended | Year Ended | Year Ended | Year Ended | ||||||||||||||||
| December 31, 2023 | December 31, 2022 | December 31, 2021 | December 31, 2020 | December 31, 2019 | ||||||||||||||||
| Net Asset Value, Beginning of Year | $ | 9.08 | $ | 10.25 | $ | 10.22 | $ | 9.65 | $ | 8.98 | ||||||||||
| Increase (Decrease) From Operations: | ||||||||||||||||||||
| Net investment income (a) | 0.35 | 0.06 | 0.17 | 0.28 | 0.30 | |||||||||||||||
| Net gain (loss) from investments (both realized and unrealized) | (0.00 | ) (f) | (0.83 | ) | 0.10 | 0.68 | 0.49 | |||||||||||||
| Total from operations | 0.35 | (0.77 | ) | 0.27 | 0.96 | 0.79 | ||||||||||||||
| Less Distributions: | ||||||||||||||||||||
| From net investment income | (0.06 | ) | (0.40 | ) | (0.24 | ) | (0.39 | ) | (0.12 | ) | ||||||||||
| Total Distributions | (0.06 | ) | (0.40 | ) | (0.24 | ) | (0.39 | ) | (0.12 | ) | ||||||||||
| Net Asset Value, End of Year | $ | 9.37 | $ | 9.08 | $ | 10.25 | $ | 10.22 | $ | 9.65 | ||||||||||
| Total Return (b) | 3.83 | % | (7.60 | )% | 2.67 | % | 10.15 | % | 8.83 | % | ||||||||||
| Ratios/Supplemental Data | ||||||||||||||||||||
| Net assets, end of year (in 000’s) | $ | 1,700 | $ | 2,093 | $ | 3,129 | $ | 3,633 | $ | 5,731 | ||||||||||
| Ratio of gross expenses to average net assets (c,d) | 3.75 | % | 3.04 | % | 2.67 | % | 2.80 | % | 2.74 | % | ||||||||||
| Ratio of net expenses to average net assets (c,d) | 2.01 | % | 1.99 | % | 1.99 | % | 1.99 | % | 1.99 | % | ||||||||||
| Ratio of net investment income to average net assets (c,e) | 3.81 | % | 0.61 | % | 1.64 | % | 2.75 | % | 3.19 | % | ||||||||||
| Portfolio turnover rate | 448 | % | 678 | % | 9 | % | 189 | % | 35 | % | ||||||||||
| (a) | Per share amounts are calculated using the average shares method, which more appropriately presents the per share data for the year. |
| (b) | Total returns are historical in nature and assume changes in share price, reinvestment of dividends and capital gains distributions, if any. Had the Adviser not absorbed a portion of Portfolio expenses, total returns would have been lower. Total returns do not reflect the fees and expenses of any separate account that may use the Portfolio as its underlying investment medium or any variable contract or variable life insurance policy that may be funded in such account. If these fees and expenses were included, the total returns figures for all periods shown would be reduced. |
| (c) | Does not include expenses of other investment companies in which the Portfolio invests. |
| (d) | Represents the ratio of expenses to average net assets absent fee waivers and/or expense reimbursements by the Adviser. Interest expense is not included in the waiver. Excluding interest expense, the following ratios for the year ended December 31, 2023 are as follows: |
| Gross expenses | Net expenses | |
| 3.73% | 1.99% | |
| (e) | Recognition of net investment income by the Portfolio is affected by the timing of declaration of dividends by underlying investment companies in which the Portfolio invests. |
| (f) | Represents less than $(0.01) per share. |
The accompanying notes are an integral part of these financial statements.
7
| Redwood Managed Volatility Portfolio - Class I |
| FINANCIAL HIGHLIGHTS |
| Per share data and ratios for a share of beneficial interest outstanding throughout each year presented. |
| For the | For the | For the | For the | For the | ||||||||||||||||
| Year Ended | Year Ended | Year Ended | Year Ended | Year Ended | ||||||||||||||||
| December 31, 2023 | December 31, 2022 | December 31, 2021 | December 31, 2020 | December 31, 2019 | ||||||||||||||||
| Net Asset Value, Beginning of Year | $ | 9.10 | $ | 10.28 | $ | 10.25 | $ | 9.68 | $ | 9.03 | ||||||||||
| Increase (Decrease) From Operations: | ||||||||||||||||||||
| Net investment income (a) | 0.40 | 0.08 | 0.30 | 0.33 | 0.34 | |||||||||||||||
| Net gain (loss) from investments (both realized and unrealized) | (0.00 | ) (f) | (0.81 | ) | 0.02 | 0.68 | 0.50 | |||||||||||||
| Total from operations | 0.40 | (0.73 | ) | 0.32 | 1.01 | 0.84 | ||||||||||||||
| Less Distributions: | ||||||||||||||||||||
| From net investment income | (0.12 | ) | (0.45 | ) | (0.29 | ) | (0.44 | ) | (0.19 | ) | ||||||||||
| Total Distributions | (0.12 | ) | (0.45 | ) | (0.29 | ) | (0.44 | ) | (0.19 | ) | ||||||||||
| Net Asset Value, End of Year | $ | 9.38 | $ | 9.10 | $ | 10.28 | $ | 10.25 | $ | 9.68 | ||||||||||
| Total Return (b) | 4.47 | % | (7.15 | )% | 3.18 | % | 10.68 | % | 9.34 | % | ||||||||||
| Ratios/Supplemental Data | ||||||||||||||||||||
| Net assets, end of year (in 000’s) | $ | 6,516 | $ | 7,756 | $ | 13,785 | $ | 12,418 | $ | 13,962 | ||||||||||
| Ratio of gross expenses to average net assets (c,d) | 3.25 | % | 2.54 | % | 2.17 | % | 2.30 | % | 2.24 | % | ||||||||||
| Ratio of net expenses to average net assets (c,d) | 1.51 | % | 1.49 | % | 1.49 | % | 1.49 | % | 1.49 | % | ||||||||||
| Ratio of net investment income to average net assets (c,e) | 4.31 | % | 0.84 | % | 2.86 | % | 3.24 | % | 3.61 | % | ||||||||||
| Portfolio turnover rate | 448 | % | 678 | % | 9 | % | 189 | % | 35 | % | ||||||||||
| (a) | Per share amounts are calculated using the average shares method, which more appropriately presents the per share data for the year. |
| (b) | Total return represents aggregate total return based on Net Asset Value. Total returns are historical in nature and assume changes in share price, reinvestment of dividends and capital gains distributions, if any. Had the Adviser not absorbed a portion of Portfolio expenses, total returns would have been lower. Total returns do not reflect the fees and expenses of any separate account that may use the Portfolio as its underlying investment medium or any variable contract or variable life insurance policy that may be funded in such account. If these fees and expenses were included, the total returns figures for all periods shown would be reduced. |
| (c) | Does not include expenses of other investment companies in which the Portfolio invests. |
| (d) | Represents the ratio of expenses to average net assets absent fee waivers and/or expense reimbursements by the Adviser. Interest expense is not included in the waiver. Excluding interest expense, the following ratios for the year ended December 31, 2023 are as follows: |
| Gross expenses | Net expenses | |
| 3.23% | 1.49% | |
| (e) | Recognition of net investment income by the Portfolio is affected by the timing of declaration of dividends by underlying investment companies in which the Portfolio invests. |
| (f) | Represents less than $(0.01) per share. |
The accompanying notes are an integral part of these financial statements.
8
| Redwood Managed Volatility Portfolio |
| NOTES TO FINANCIAL STATEMENTS |
| December 31, 2023 |
| 1. | ORGANIZATION |
Redwood Managed Volatility Portfolio (the “Portfolio”) is a series of shares of beneficial interest of the Two Roads Shared Trust (the “Trust”), a statutory trust organized under the laws of the State of Delaware on June 8, 2012, and is registered under the Investment Company Act of 1940, as amended (the “1940 Act”), as a diversified, open-end management investment company. The Portfolio commenced investment operations on October 20, 2014. The investment objective is to seek a combination of total return and prudent management of portfolio downside volatility and downside loss. The Portfolio is a “fund of funds”, in that the Portfolio will generally invest in other investment companies.
The Portfolio offers Class N and Class I shares. Class N shares commenced operations October 20, 2014 and Class I Shares commenced operations January 15, 2015. All classes are sold at net asset value (“NAV”) . Each share class represents an interest in the same assets of the Portfolio and classes are identical except for differences in their ongoing service and distribution charges. All classes of shares have equal voting privileges except that each class has exclusive voting rights with respect to its service and/or distribution plans. The Portfolio’s income, expenses (other than class specific distribution fees) and realized and unrealized gains and losses are allocated proportionately each day based upon the relative net assets of each class.
| 2. | SUMMARY OF SIGNIFICANT ACCOUNTING POLICIES |
The following is a summary of significant accounting policies followed by the Portfolio in preparation of its financial statements. These policies are in conformity with accounting principles generally accepted in the United States of America (“GAAP”). The preparation of financial statements requires management to make estimates and assumptions that affect the reported amounts of assets and liabilities and disclosure of contingent assets and liabilities at the date of the financial statements and the reported amounts of increases and decreases in net assets resulting from operations during the reporting period. Actual results could differ from those estimates. The Portfolio is an investment company and accordingly follows the investment company accounting and reporting guidance of the Financial Accounting Standards Board (“FASB”) Accounting Standards Codification Topic 946 “Financial Services – Investment Companies” including FASB Accounting Standards Update ASU 2013-08.
Security Valuation – Securities listed on an exchange are valued at the last quoted sale price at the close of the regular trading session of the exchange on the business day the value is being determined, or in the case of securities listed on NASDAQ at the NASDAQ Official Closing Price. In the absence of a sale such securities shall be valued at the mean between the current bid and ask prices on the day of valuation. Debt securities not traded on an exchange may be valued at prices supplied by a pricing agent(s) based on broker or dealer supplied valuations or matrix pricing, a method of valuing securities by reference to the value of other securities with similar characteristics, such as rating, interest rate and maturity. Options contracts listed on a securities exchange or board of trade (not including Index Options contracts) for which market quotations are readily available shall be valued at the last quoted sales price or, in the absence of a sale, at the mean between the current bid and ask prices on the valuation date. Index Options listed on a securities exchange or board of trade for which market quotations are readily available shall be valued at the mean between the current bid and ask prices on the valuation date. Total return swaps on exchange-listed securities shall be valued at the last quoted sales price or, in the absence of a sale, at the mean between the current bid and ask prices on the day of valuation on each underlying exchange-listed security. Exchange listed swaps shall be valued at the last quoted sales price or, in the absence of a sale, at the mean between the current bid and ask prices on the day of valuation. The independent pricing service does not distinguish between smaller-sized bond positions known as “odd lots” and larger institutional-sized bond positions known as “round lots”. The Portfolio may fair value a particular bond if the Adviser does not believe that the round lot value provided by the independent pricing service reflects fair value of the Portfolio’s holding. Short-term debt obligations, excluding U.S. Treasury Bills, having 60 days or less remaining until maturity, at time of purchase, may be valued at amortized cost.
Valuation of Underlying Funds – The Portfolio may invest in funds of open-end or closed-end investment companies (the “Underlying Funds”). The Underlying Funds value securities in their portfolios for which market quotations are readily
9
| Redwood Managed Volatility Portfolio |
| NOTES TO FINANCIAL STATEMENTS (Continued) |
| December 31, 2023 |
available at their market values (generally the last reported sale price) and all other securities and assets at their fair value to the methods established by the boards of directors of the Underlying Funds.
Open-end funds and certain non-exchange traded closed-end funds are valued at their respective net asset values as reported by such investment companies. The shares of many exchange traded funds (such as closed-end funds and ETFs), after their initial public offering, frequently trade at a price per share, which is different than the net asset value per share. The difference represents a market premium or market discount of such shares. There can be no assurances that the market discount or premium on shares of any exchange traded fund purchased by the Portfolio will not change.
The Portfolio may hold securities for which market quotations are not readily available or are determined to be unreliable. These securities are valued using the “fair value” procedures approved by the Board of Trustees of the Trust (the “Board”). The Board has appointed the Adviser as its valuation designee (the “Valuation Designee”) for all fair value determinations and responsibilities other than overseeing pricing service providers used by the Trust. This designation is subject to Board oversight and certain reporting and other requirements designed to facilitate the Board’s ability effectively to oversee the designee’s fair value determinations. The Valuation Designee may also enlist third party consultants such as a valuation specialist at a public accounting firm, valuation consultant or financial officer of a security issuer on an as-needed basis to assist the Valuation Designee in determining a security-specific fair value. The Board is responsible for reviewing and approving fair value methodologies utilized by the Valuation Designee, approval of which shall be based upon whether the Valuation Designee followed the valuation procedures approved by the Board.
Fair Valuation Process – The applicable investments are valued by the Valuation Designee pursuant to valuation procedures approved by the Board. For example, fair value determinations are required for the following securities: (i) securities for which market quotations are insufficient or not readily available on a particular business day (including securities for which there is a short and temporary lapse in the provision of a price by the regular pricing source); (ii) securities for which, in the judgment of the Valuation Designee, the prices or values available do not represent the fair value of the instrument; factors which may cause the Valuation Designee to make such a judgment include, but are not limited to, the following: only a bid price or an asked price is available; the spread between bid and asked prices is substantial; the frequency of sales; the thinness of the market; the size of reported trades; and actions of the securities markets, such as the suspension or limitation of trading; (iii) securities determined to be illiquid; and (iv) securities with respect to which an event that affects the value thereof has occurred (a “significant event”) since the closing prices were established on the principal exchange on which they are traded, but prior to the Portfolio’s calculation of its net asset value. Specifically, interests in commodity pools or managed futures pools are valued on a daily basis by reference to the closing market prices of each futures contract or other asset held by a pool, as adjusted for pool expenses. Restricted or illiquid securities, such as private investments or non -traded securities are valued based upon the current bid for the security from two or more independent dealers or other parties reasonably familiar with the facts and circumstances of the security (who should take into consideration all relevant factors as may be appropriate under the circumstances). If a current bid from such independent dealers or other independent parties is unavailable, the Valuation Designee shall determine the fair value of such security using the following factors: (i) the type of security; (ii) the cost at date of purchase; (iii) the size and nature of the Portfolio’s holdings; (iv) the discount from market value of unrestricted securities of the same class at the time of purchase and subsequent thereto; (v) information as to any transactions or offers with respect to the security; (vi) the nature and duration of restrictions on disposition of the security and the existence of any registration rights; (vii) how the yield of the security compares to similar securities of companies of similar or equal creditworthiness; (viii) the level of recent trades of similar or comparable securities; (ix) the liquidity characteristics of the security; (x) current market conditions; and (xi) the market value of any securities into which the security is convertible or exchangeable.
The Portfolio utilizes various methods to measure the fair value of all of its investments on a recurring basis. GAAP establishes a hierarchy that prioritizes inputs to valuation methods. The three levels of input are:
Level 1 – Unadjusted quoted prices in active markets for identical assets and liabilities that the Portfolio has the ability to access.
10
| Redwood Managed Volatility Portfolio |
| NOTES TO FINANCIAL STATEMENTS (Continued) |
| December 31, 2023 |
Level 2 – Observable inputs other than quoted prices included in Level 1 that are observable for the asset or liability, either directly or indirectly. These inputs may include quoted prices for the identical instrument on an inactive market, prices for similar instruments, interest rates, prepayment speeds, credit risk, yield curves, default rates and similar data.
Level 3 – Unobservable inputs for the asset or liability, to the extent relevant observable inputs are not available, representing the Portfolio’s own assumptions about the assumptions a market participant would use in valuing the asset or liability, and would be based on the best information available.
The availability of observable inputs can vary from security to security and is affected by a wide variety of factors, including, for example, the type of security, whether the security is new and not yet established in the marketplace, the liquidity of markets, and other characteristics particular to the security. To the extent that valuation is based on models or inputs that are less observable or unobservable in the market, the determination of fair value requires more judgment. Accordingly, the degree of judgment exercised in determining fair value is greatest for instruments categorized in Level 3.
The inputs used to measure fair value may fall into different levels of the fair value hierarchy. In such cases, for disclosure purposes, the level in the fair value hierarchy within which the fair value measurement falls in its entirety, is determined based on the lowest level input that is significant to the fair value measurement in its entirety.
The inputs or methodology used for valuing securities are not necessarily an indication of the risk associated with investing in those securities. The following table summarizes the inputs used as of December 31, 2023 for the Portfolio’s investments measured at fair value:
| Assets | Level 1 | Level 2 | Level 3 | Total | ||||||||||||
| Open End Funds | $ | 8,168,351 | $ | — | $ | — | $ | 8,168,351 | ||||||||
| Short-Term Investments | 324 | — | — | 324 | ||||||||||||
| Total Assets | $ | 8,168,675 | $ | — | $ | — | $ | 8,168,675 | ||||||||
The Portfolio did not hold any Level 3 securities during the period.
Security Transactions and Related Income – Security transactions are accounted for on trade date basis. Interest income is recognized on an accrual basis. Discounts are accreted and premiums are amortized on securities purchased over the lives of the respective securities. Dividend income is recorded on the ex-dividend date. Realized gains or losses from sales of securities are determined by comparing the identified cost of the security lot sold with the net sales proceeds.
Dividends and Distributions to Shareholders – Dividends from net investment income are declared and distributed at least annually. Distributable net realized capital gains are declared and distributed annually. Dividends from net investment income and distributions from net realized gains are recorded on ex-dividend date and determined in accordance with federal income tax regulations, which may differ from GAAP. These “book/tax” differences are considered either temporary (i.e., deferred losses, capital loss carry forwards) or permanent in nature. To the extent these differences are permanent in nature, such amounts are reclassified within the composition of net assets based on their federal tax-basis treatment; temporary differences do not require reclassification.
Cash – The Portfolio considers its investment in a Federal Deposit Insurance Corporation (“FDIC”) insured interest bearing savings account to be cash. The Portfolio maintains cash balances, which, at times, may exceed federally insured limits. The Portfolio maintains these balances with a high quality financial institution.
Federal Income Taxes – It is the Portfolio’s policy to qualify as a regulated investment company by complying with the provisions of the Internal Revenue Code that are applicable to regulated investment companies and to distribute substantially all of its taxable income and net realized gains to shareholders. Therefore, no federal income tax provision has been recorded.
The Portfolio recognizes the tax benefits of uncertain tax positions only where the position is “more likely than not” to be sustained assuming examination by tax authorities. Management has analyzed the Portfolio’s tax positions, and has
11
| Redwood Managed Volatility Portfolio |
| NOTES TO FINANCIAL STATEMENTS (Continued) |
| December 31, 2023 |
concluded that no liability for unrecognized tax benefits should be recorded related to uncertain tax positions taken on returns filed for the open tax years (2020-2022) or expected to be taken in the Portfolio’s 2023 tax return. The Portfolio identifies its major tax jurisdictions as U.S. Federal, Ohio and foreign jurisdictions where the Portfolio makes significant investments; however the Portfolio is not aware of any tax positions for which it is reasonably expected that the total amounts of unrecognized tax benefits will change materially in the next twelve months. The Portfolio recognizes interest and penalties, if any, related to unrecognized tax benefits as income tax expense in the Statement of Operations. During the period, the Portfolio did not incur any interest or penalties.
Expenses – Expenses of the Trust that are directly identifiable to a specific portfolio are charged to that portfolio. Expenses, which are not readily identifiable to a specific portfolio, are allocated in such a manner as deemed equitable, taking into consideration the nature and type of expense and the relative sizes of the portfolios in the Trust.
Indemnification – The Trust indemnifies its officers and trustees for certain liabilities that may arise from the performance of their duties to the Trust. Additionally, in the normal course of business, the Portfolio enters into contracts that contain a variety of representations and warranties and which provide general indemnities. The Portfolio’s maximum exposure under these arrangements is unknown, as this would involve future claims that may be made against the Portfolio that have not yet occurred. However, the risk of loss due to these warranties and indemnities appears to be remote.
| 3. | INVESTMENT TRANSACTIONS AND ASSOCIATED RISKS |
The cost of purchases and proceeds from the sale of securities, other than short-term investments, for the year ended December 31, 2023, amounted to $27,636,665 and $29,214,856, respectively.
The Portfolio’s investments expose it to various risks certain of which are discussed below. Please refer to the Portfolio’s prospectus and statement of additional information for further information regarding the risks associated with the Portfolio’s investments which include but are not limited to active trading risk, asset allocation risk, bank loan risk, borrowing risk, cash positions risk, credit risk, credit default swaps risk, cybersecurity risk, derivatives risk, fixed income risk, gap risk, high-yield fixed income securities risk, investment companies and ETFs risk, leveraging risk, LIBOR risk, liquidity risk, managed volatility strategy risk, management risk, market risk, market events risk, model risk, money market instrument risk, portfolio turnover risk, rules-based strategy risk, underlying fund risk, U.S. Government securities risk and valuation risk.
Asset Allocation Risk – Asset allocation risk is the risk that the selection by a manager of a fund in which the Portfolio invests and the allocation of the Portfolio’s assets among the various asset classes and market segments will cause the Portfolio to underperform other funds with similar investment objectives. The Portfolio’s investment in any one fund or asset class may exceed 25% of the Portfolio’s total assets, which may cause it to be subject to greater risk than a more diversified fund.
Cash Positions Risk – The Portfolio may hold a significant position in cash and/or cash equivalent securities. When the Portfolio’s investment in cash or cash equivalent securities increases, the Portfolio may not participate in market advances or declines to the same extent that it would if the Portfolio were more fully invested.
High-Yield Fixed Income Securities Risk – Investment in or exposure to high yield (lower rated) debt instruments (also known as “junk bonds”) may involve greater levels of interest rate, credit, liquidity and valuation risk than for higher rated instruments. Such high yield securities are generally considered speculative because they present a greater risk of loss, including default, than higher quality fixed income securities. An economic downturn or period of rising interest rates could adversely affect the liquidity and value of these securities. If the issuer of a security is in default with respect to interest or principal payments, the underlying investment company or ETF could lose its entire investment. Furthermore, the transaction costs associated with the purchase and sale of high yield debt instruments may vary greatly depending on a number of factors and may adversely affect the Portfolio’s performance.
12
| Redwood Managed Volatility Portfolio |
| NOTES TO FINANCIAL STATEMENTS (Continued) |
| December 31, 2023 |
Investment Companies and ETFs Risk – When the Portfolio invests in other investment companies, including ETF’s, it will bear additional expenses based on its pro rata share of the other investment company’s operating expenses, including the management fees. The risk of owning an investment company generally reflects the risks of owning the underlying investments investment company. The Portfolio will be indirectly exposed to the risks of the portfolio assets held by the other investment company. The Portfolio may also incur brokerage costs when it purchases and sells shares of investment companies. An exchange-traded closed end fund’s or an ETF’s shares could trade at a significant premium or discount to its net asset value (NAV).
LIBOR Risk – The U.S. Federal Reserve, based on the recommendations of the New York Federal Reserve’s Alternative Reference Rate Committee (comprised of major derivative market participants and their regulators) has begun publishing a Secured Overnight Financing Rate (SOFR), a broad measure of secured overnight U.S. Treasury repo rates as the preferred alternative rate to LIBOR. Actions by regulators have resulted in the establishment of alternative reference rates to LIBOR in most major currencies. Markets are developing in response to these new rates, but questions around liquidity in these rates and how to appropriately adjust these rates to eliminate any economic value transfer at the time of transition remain a significant concern. Including the risk that any pricing or adjustments to the Portfolio’s investments resulting from a substitute or alternate reference rate may adversely affect the Portfolio’s performance and/or NAV. The utilization of an alternative reference rate, or the transition process to an alternative reference rate, may adversely affect the Portfolio’s performance. It remains uncertain how such changes would be implemented and the effects such changes would have on the Portfolio, including any negative effects on the Portfolio’s liquidity and valuation of the Portfolio’s investments, issuers of instruments in which the Portfolio invests and financial markets generally.
Managed Volatility Strategy Risk – Securities purchased by the Portfolio may exhibit higher price volatility than anticipated and the Portfolio may not be less volatile than the market as a whole. In addition, there is no guarantee that the Adviser’s managed volatility strategy will consistently minimize market impact or limit the Portfolio’s downside risk as intended. Further, the Portfolio’s managed volatility strategy may expose the Portfolio to losses (some of which may be sudden) that it would not have otherwise been exposed to if the Portfolio’s investment program consisted only of holding securities directly. Finally, while the Adviser’s managed volatility strategy may limit the Portfolio’s downside risk over time, the Portfolio also may experience lesser gains in a rising market. The Portfolio is not required to engage in trades that manage volatility and may not choose to do so. The Portfolio may have investments that appreciate or decrease significantly in value over short periods of time. This may cause the Portfolio’s net asset value per share to experience significant increases or declines in value over short periods of time.
Market Risk – Overall market risk may affect the value of individual instruments in which the Portfolio invests. The Portfolio is subject to the risk that the securities markets will move down, sometimes rapidly and unpredictably, based on overall economic conditions and other factors, which may negatively affect the Portfolio’s performance. Factors such as domestic and foreign (non-U.S.) economic growth and market conditions, real or perceived adverse economic or political conditions, inflation, military conflict, acts of terrorism, social unrest, natural disasters, recessions, changes in interest rate levels, supply chain disruptions, sanctions, the spread of infectious illness or other public health threats, lack of liquidity in the bond and other markets, volatility in the securities markets, adverse investor sentiment and political events affect the securities markets. U.S. and foreign stock markets have experienced periods of substantial price volatility in the past and may do so again in the future. Securities markets also may experience long periods of decline in value. A change in financial condition or other event affecting a single issuer or market may adversely impact securities markets as a whole. Rates of inflation have recently risen. The value of assets or income from an investment may be worth less in the future as inflation decreases the value of money. As inflation increases, the real value of the Portfolio’s assets can decline as can the value of the Portfolio’s distributions. When the value of the Portfolio’s investments goes down, your investment in the Portfolio decreases in value and you could lose money.
Local, state, regional, national or global events such as war, acts of terrorism, the spread of infectious illness or other public health issues, recessions, or other events could have a significant impact on the Portfolio and its investments and could result in decreases to the Portfolio’s net asset value. Political, geopolitical, natural and other events, including war, terrorism, trade disputes, government shutdowns, market closures, natural and environmental disasters, epidemics, pandemics and other public health crises and related events and governments’ reactions to such events have led, and in the
13
| Redwood Managed Volatility Portfolio |
| NOTES TO FINANCIAL STATEMENTS (Continued) |
| December 31, 2023 |
future may lead, to economic uncertainty, decreased economic activity, increased market volatility and other disruptive effects on U.S. and global economies and markets. Such events may have significant adverse direct or indirect effects on the Portfolio and its investments. For example, a widespread health crisis such as a global pandemic could cause substantial market volatility, exchange trading suspensions and closures, impact the ability to complete redemptions, and affect Portfolio performance. A health crisis may exacerbate other pre-existing political, social and economic risks. In addition, the increasing interconnectedness of markets around the world may result in many markets being affected by events or conditions in a single country or region or events affecting a single or small number of issuers.
The impact of COVID-19, and other infectious illness outbreaks that may arise in the future, could adversely affect the economies of many nations or the entire global economy, individual issuers and capital markets in ways that cannot necessarily be foreseen.
Underlying Fund Risk – The risk that the Portfolio’s investment performance and its ability to achieve its investment objective are directly related to the performance of the underlying funds in which it invests. There can be no assurance that the Portfolio’s investments in underlying funds will achieve their respective investment objectives. The Portfolio is subject to the risks of the underlying funds in direct proportion to the allocation of its assets among the underlying funds.
| 4. | INVESTMENT ADVISORY AGREEMENT AND TRANSACTIONS WITH RELATED PARTIES |
Advisory Fees – Redwood Investment Management, LLC serves as the Portfolio’s Investment Adviser (the “Adviser”). Pursuant to an Investment Advisory Agreement with the Portfolio, the Adviser, under the oversight of the Board, directs the daily operations of the Portfolio and supervises the performance of administrative and professional services provided by others. As compensation for its services and the related expenses borne by the Adviser, the Portfolio pays the Adviser an investment advisory fee, computed and accrued daily and paid monthly, at an annual rate of 1.25% of the Portfolio’s average daily net assets. For the year ended December 31, 2023, the Adviser earned management fees of $113,934.
The Adviser has contractually agreed to reduce its fees and/or absorb expenses of the Portfolio (the “Waiver Agreement”), until at least May 1, 2024, to ensure that total annual portfolio operating expenses after fee waiver and/or reimbursement (exclusive of any front-end or contingent deferred loads, brokerage fees and commissions, acquired fund fees and expenses, borrowing costs (such as interest and dividend expense on securities sold short), taxes, and extraordinary expenses such as litigation expenses) will not exceed 1.99% and 1.49% of the Portfolio’s average daily net assets for Class N and Class I shares, respectively. This agreement may be terminated by the Portfolio’s Board on 60 days’ written notice to the Adviser. These fee waivers and expense reimbursements are subject to possible recoupment from the Portfolio in future years on a rolling three year basis (within the three years after the fees have been waived or reimbursed) if such recoupment can be achieved without exceeding the foregoing expense limits as well as any expense limitation in effect at the time the waiver was made or the expense reimbursed.
If the Adviser waives any fee or reimburses any expense pursuant to the Waiver Agreement, and the Portfolio’s operating expenses are subsequently less than 1.99% or 1.49% of average daily net assets attributable to Class N shares or Class I shares, respectively, the Adviser shall be entitled to recoup from the Portfolio such waived fees or reimbursed expenses, provided that such recoupment does not cause the Portfolio’s expenses to exceed 1.99% and 1.49% of average daily net assets for Class N and Class I shares, respectively (or, if lower, the expense limits in place at the time of recoupment). If Portfolio operating expenses attributable to Class N or Class I shares subsequently exceed 1.99% or 1.49%, respectively, per annum of the average daily net assets, the recoupments shall be suspended. During the year ended December 31, 2023, the Adviser waived fees and reimbursed expenses in the amount of $158,544 to the Portfolio. Pursuant to the Waiver Agreement, cumulative expenses subject to recapture as of December 31, 2023 are $414,460 and the amounts will expire as follows: December 31, 2024 - $123,314 and December 31, 2025 - $132,602, December 31, 2026 - $158,544.
The Board has adopted the Trust’s Master Distribution and Shareholder Servicing Plan (the “Plan”) pursuant to Rule 12b-1 under the 1940 Act. The Plan provides that a monthly service and/or distribution fee is calculated by the Portfolio at an annual rate of 0.50% of its average daily net assets for Class N shares and is paid to Northern Lights Distributors, LLC (the “Distributor” or “NLD”) to provide compensation for ongoing shareholder servicing and distribution-related activities or
14
| Redwood Managed Volatility Portfolio |
| NOTES TO FINANCIAL STATEMENTS (Continued) |
| December 31, 2023 |
services and/or maintenance of the Portfolio’s shareholder accounts not otherwise required to be provided by the Adviser. During the year ended December 31, 2023, Class N paid $9,031 in distribution fees.
The Distributor acts as the Portfolio’s principal underwriter in a continuous public offering of the Portfolio’s Class N and Class I shares. No underwriting commissions were paid during the year ended December 31, 2023.
In addition, certain affiliates of the Distributor provide services to the Portfolio as follows:
Ultimus Fund Solutions, LLC (“UFS”) – UFS, an affiliate of the Distributor, provides administration, fund accounting, and transfer agent services to the Trust. Pursuant to separate servicing agreements with UFS, the Portfolio pays UFS customary fees for providing administration, fund accounting, and transfer agency services to the Portfolio. Certain officers of the Trust are also officers of UFS, and are not paid any fees directly by the Portfolio for serving in such capacities.
Northern Lights Compliance Services, LLC (“NLCS”) – NLCS, an affiliate of UFS and the Distributor, provides a Chief Compliance Officer to the Trust, as well as related compliance services, pursuant to a consulting agreement between NLCS and the Trust. Under the terms of such agreement, NLCS receives customary fees from the Portfolio.
Blu Giant, LLC (“Blu Giant”) – Blu Giant, an affiliate of UFS and the Distributor, provides EDGAR conversion and filing services as well as print management services for the Portfolio on an ad-hoc basis. For the provision of these services, Blu Giant receives customary fees from the Portfolio.
| 5. | AGGREGATE UNREALIZED APPRECIATION AND DEPRECIATION – TAX BASIS |
The identified cost of investments in securities owned by the Portfolio for federal tax purposes and its respective gross unrealized appreciation and depreciation at December 31, 2023, was as follows:
| Cost for Federal Tax purposes | $ | 8,009,308 | ||
| Unrealized Appreciation | 359,190 | |||
| Unrealized Depreciation | (199,823 | ) | ||
| Tax Net Unrealized Appreciation | $ | 159,367 |
| 6. | DISTRIBUTION TO SHAREHOLDERS & TAX COMPONENTS OF CAPITAL |
The tax character of fund distributions paid for the year ended December 31, 2023 and December 31, 2022 was as follows:
| Fiscal Year Ended | Fiscal Year Ended | |||||||
| December 31, 2023 | December 31, 2022 | |||||||
| Ordinary Income | $ | 94,804 | $ | 460,827 | ||||
| $ | 94,804 | $ | 460,827 | |||||
As of December 31, 2023, the components of accumulated earnings/(deficit) on a tax basis were as follows:
| Undistributed | Capital Loss | Unrealized | Total | |||||||||||
| Ordinary | Carry | Appreciation/ | Accumulated | |||||||||||
| Income | Forwards | (Depreciation) | Earnings/(Deficits) | |||||||||||
| $ | 383,457 | $ | (734,297 | ) | $ | 159,367 | $ | (191,473 | ) | |||||
15
| Redwood Managed Volatility Portfolio |
| NOTES TO FINANCIAL STATEMENTS (Continued) |
| December 31, 2023 |
The difference between book basis and tax basis undistributed net investment income/(loss), accumulated net realized gain/(loss), and unrealized appreciation/(depreciation) from investments is primarily attributable to the tax deferral of losses on wash sales.
At December 31, 2023, the Portfolio had capital loss carry forwards for federal income tax purposes available to offset future capital gains and utilized capital loss carryforwards as follows:
| Short-Term | Total | CLCF Utilized | ||||||||
| $ | 734,297 | $ | 734,297 | $ | — | |||||
| 7. | CONTROL OWNERSHIP |
The beneficial ownership, either directly or indirectly, of more than 25% of the voting securities of a Portfolio creates presumption of control of the Portfolio, under Section 2(a)9 of the 1940 Act. As of December 31, 2023, Jefferson National Life Insurance Co. held approximately 99.2% of voting securities of the Portfolio.
| 8. | REGULATORY UPDATE |
On January 24, 2023, the SEC adopted rule and form amendments to require mutual funds and ETFs to transmit concise and visually engaging streamlined annual and semiannual reports to shareholders that highlight key information. Other information, including financial statements, will no longer appear in a streamlined shareholder report but must be available online, delivered free of charge upon request, and filed on a semiannual basis on Form N-CSR. The rule and form amendments have a compliance date of July 24, 2024. At this time, management is evaluating the impact of these amendments on the shareholder reports for the Portfolio.
| 9. | SUBSEQUENT EVENTS |
Subsequent events after the date of the Statement of Assets and Liabilities have been evaluated through the date the financial statements were issued. Management has determined that no events or transactions occurred requiring adjustment or disclosure in the financial statements.
16

REPORT OF INDEPENDENT REGISTERED PUBLIC ACCOUNTING FIRM
To the Shareholders of Redwood Managed Volatility Portfolio and
Board of Trustees of Two Roads Shared Trust
Opinion on the Financial Statements
We have audited the accompanying statement of assets and liabilities, including the schedule of investments, of Redwood Managed Volatility Portfolio (the “Fund”) a series of Two Roads Shared Trust, as of December 31, 2023, the related statement of operations for the year then ended, the statements of changes in net assets, the related notes, and the financial highlights for each of the years in the two-year period then ended (collectively referred to as the “financial statements”). In our opinion, the financial statements present fairly, in all material respects, the financial position of the Fund as of December 31, 2023, the results of its operations for the year then ended, the changes in net assets, and the financial highlights for each of the years in the two-year period then ended, in conformity with accounting principles generally accepted in the United States of America.
The Fund’s financial highlights for the year ended December 31, 2021, and prior, were audited by other auditors whose report dated February 24, 2022, expressed an unqualified opinion on those financial highlights.
Basis for Opinion
These financial statements are the responsibility of the Fund’s management. Our responsibility is to express an opinion on the Fund’s financial statements based on our audits. We are a public accounting firm registered with the Public Company Accounting Oversight Board (United States) (“PCAOB”) and are required to be independent with respect to the Fund in accordance with the U.S. federal securities laws and the applicable rules and regulations of the Securities and Exchange Commission and the PCAOB.
We conducted our audits in accordance with the standards of the PCAOB. Those standards require that we plan and perform the audits to obtain reasonable assurance about whether the financial statements are free of material misstatement whether due to error or fraud.
Our audits included performing procedures to assess the risks of material misstatement of the financial statements, whether due to error or fraud, and performing procedures that respond to those risks. Such procedures included examining, on a test basis, evidence regarding the amounts and disclosures in the financial statements. Our procedures included confirmation of securities owned as of December 31, 2023, by correspondence with the custodian. Our audits also included evaluating the accounting principles used and significant estimates made by management, as well as evaluating the overall presentation of the financial statements. We believe that our audits provide a reasonable basis for our opinion.
We have served as the Fund’s auditor since 2022.

COHEN & COMPANY, LTD.
Philadelphia, Pennsylvania
February 28, 2024
COHEN & COMPANY, LTD.
800.229.1099 | 866.818.4538 fax | cohencpa.com
Registered with the Public Company Accounting Oversight Board
17
| Redwood Managed Volatility Portfolio |
| EXPENSE EXAMPLES (Unaudited) |
| December 31, 2023 |
As a shareholder of Redwood Managed Volatility Portfolio, you incur two types of costs: (1) transaction costs and (2) ongoing costs, including management fees; distribution and/or service (12b-1) fees; and other Portfolio expenses. This example is intended to help you understand your ongoing costs (in dollars) of investing in the Redwood Managed Volatility Portfolio and to compare these costs with the ongoing costs of investing in other mutual funds.
The example is based on an investment of $1,000 invested at the beginning of the period and held for the entire period from July 1, 2023 through December 31, 2023.
Actual Expenses
The “Actual” line in the table below provides information about actual account values and actual expenses. You may use the information below together with the amount you invested, to estimate the expenses that you paid over the period. Simply divide your account value by $ 1,000 (for example, an $8,600 account value divided by $1,000 = 8.6), then multiply the result by the number in the table under the heading entitled “Expenses Paid During Period” to estimate the expenses you paid on your account during this period.
Hypothetical Example for Comparison Purposes
The “Hypothetical” line in the table below provides information about hypothetical account values and hypothetical expenses based on the Redwood Managed Volatility Portfolio’s actual expense ratio and an assumed rate of return of 5% per year before expenses, which is not the Portfolio’s actual return. The hypothetical account values and expenses may not be used to estimate the actual ending account balances or expenses you paid for the period. You may use this information to compare this 5% hypothetical example with the 5% hypothetical examples that appear in the shareholder reports of other funds.
Please note that the expenses shown in the table are meant to highlight your ongoing costs only and do not reflect any transactional costs, such as sales charges (loads), or redemption fees, as well as other charges and expenses of the insurance contract, or separate account. Therefore, the table is useful in comparing ongoing costs only, and will not help you determine the relative total costs of owning different funds. In addition, if these transactional costs were included, your costs would have been higher.
| Beginning | Ending | Expenses Paid | Expense Ratio | |||||
| Account Value | Account Value | During Period | During Period | |||||
| Actual * | 7/1/23 | 12/31/23 | 7/1/23-12/31/23 | 7/1/23-12/31/23 | ||||
| Class I | $1,000.00 | $1,034.50 | $7.74 | 1.51% | ||||
| Class N | 1,000.00 | 1,032.60 | 10.30 | 2.01% | ||||
| Beginning | Ending | Expenses Paid | Expense Ratio | |||||
| Hypothetical | Account Value | Account Value | During Period* | During Period | ||||
| (5% return before expenses) | 7/1/23 | 12/31/23 | 7/1/23-12/31/23 | 7/1/23-12/31/23 | ||||
| Class I | $1,000.00 | $1,017.59 | $7.68 | 1.51% | ||||
| Class N | 1,000.00 | 1,015.07 | 10.21 | 2.01% |
| * | Expenses are equal to the average account value over the period, multiplied by the Portfolio’s annualized expense ratio, multiplied by the number of days in the period (184) divided by the number of days in the fiscal year (365). |
18
Approval of Advisory Agreement
Redwood Managed Volatility Portfolio
At a meeting held on December 19–20, 2023 (the “Meeting”), the Board of Trustees (the “Board”) of Two Roads Shared Trust (the “Trust”), each of whom is not an “interested person” of the Trust (the “Independent Trustees” or the “Trustees”), as such term is defined under Section 2(a)(19) of the Investment Company Act of 1940, as amended (the “1940 Act”), considered the renewal of the investment advisory agreement (the “Advisory Agreement”) between Redwood Investment Management, LLC (“Redwood” or the “Adviser”) and the Trust, on behalf of the Redwood Managed Volatility Portfolio (the “Redwood MV Portfolio”).
In connection with the Board’s consideration of the Advisory Agreement, the Board received written materials in advance of the Meeting, which included information regarding: (i) the nature, extent, and quality of services provided to the Redwood MV Portfolio by Redwood; (ii) a description of the Adviser’s investment management personnel; (iii) an overview of the Adviser’s operations and financial condition; (iv) a description of the Adviser’s brokerage practices (including any soft dollar arrangements); (v) a comparison of the Redwood MV Portfolio’s advisory fees and overall expenses with those of comparable mutual funds; (vi) the level of profitability from the Adviser’s fund-related operations; (vii) the Adviser’s compliance policies and procedures, including policies and procedures for personal securities transactions, business continuity and information security and (viii) information regarding the performance record of the Redwood MV Portfolio as compared to other mutual funds with similar investment strategies.
Throughout the process, including at the Meeting, the Board had numerous opportunities to ask questions of and request additional materials and information from Redwood. The Board was advised by, and met, in executive session with, the Board’s independent legal counsel, and received a memorandum from such independent counsel regarding its responsibilities under applicable law. The Board also noted that the evaluation process with respect to the Adviser is an ongoing one and that in this regard, the Board took into account discussions with management and information provided to the Board at and between prior meetings with respect to the services provided by the Adviser. The Board noted that the information received and considered by the Board in connection with the Meeting and throughout the year was both written and oral.
Matters considered by the Board in connection with its approval of the Advisory Agreement with respect to the Redwood MV Portfolio included, among others, the following:
Nature, Extent and Quality of Services. The Board reviewed materials provided by Redwood related to the Advisory Agreement with respect to the Redwood MV Portfolio, including the Advisory Agreement, a description of the manner in which investment decisions are made and executed; an overview of the personnel that perform advisory, compliance and operational services for the Redwood MV Portfolio and their background and experience; a summary of the financial condition of Redwood; a quarterly written report containing Redwood’s performance commentary; Redwood’s compliance policies and procedures, including its business continuity plan and cybersecurity policies, and a code of ethics containing provisions reasonably necessary to prevent Access Persons, as that term is defined in Rule 17j-1 under the 1940 Act, from engaging in conduct prohibited by Rule 17j-1(b); information regarding risk management processes and liquidity management; an annual review of the operation of Redwood’s compliance program; information regarding Redwood’s compliance and regulatory history; and an independent report prepared by Broadridge, an independent third party data provider, analyzing the performance record, fees and expenses of the Redwood MV Portfolio as compared to those of a peer group of other mutual funds with similar investment strategies as selected by Broadridge (the “Peer Group”).
In considering the nature, extent and quality of services to be provided by Redwood under the
19
Advisory Agreement, the Board considered Redwood’s asset management, risk management, operations, and compliance experience. The Board considered that Redwood had summarized the investment strategies used for the Redwood MV Portfolio and that in advising the Redwood MV Portfolio, Redwood employed quantitative and tactical investment elements which require a significant level of sophistication and labor to execute. The Board noted that in addition to the reports on the information with respect to portfolio management functions from Redwood, on a regular basis the Board receives and reviews information from the Trust’s Chief Compliance Officer (the “CCO”) regarding Redwood’s compliance policies and procedures established pursuant to Rule 38a-1 under the 1940 Act, including evaluations of the regulatory compliance systems of Redwood and any disciplinary history. The Board also considered Redwood’s policies and procedures relating to business continuity and cybersecurity, including the Trust’s CCO review and evaluation of these policies and procedures, and that the CCO found them to be satisfactory. The Board also considered the operation of Redwood’s compliance program and any compliance matters over the past year, The Board took into account representations made by Redwood at the Meeting, including with respect to actions being proposed to be taken by the Adviser in the near future including certain changes and enhancements to Redwood’s compliance program.
The Board also considered the financial condition and operations of the Adviser during the COVID-19 pandemic and noted that there had been no material disruption of the Adviser’s services to the Redwood MV Portfolio and that the Adviser had continued to provide the same level, nature, extent and quality of services to the Redwood MV Portfolio. The Board also considered the significant risks assumed by the Adviser in connection with the services provided to the Redwood MV Portfolio, including entrepreneurial risk and ongoing risks including investment, operational, enterprise, litigation, regulatory and compliance risks with respect to the Redwood MV Portfolio.
In considering the nature, extent, and quality of the services provided by Redwood, the Board also took into account its knowledge, acquired through discussions and reports during the preceding year and in past years, of Redwood’s management and the quality of the performance of Redwood’s duties.
After discussion and taking into account the report and evaluation provided by the Trust’s CCO, the Board concluded that Redwood had sufficient personnel, resources, investment methodologies and compliance policies and procedures to perform its duties under the Advisory Agreement with respect to the Redwood MV Portfolio and that the overall nature, quality and extent of the portfolio management services provided by Redwood to the Redwood MV Portfolio was satisfactory.
Performance. In considering the Redwood MV Portfolio’s performance, the Board noted that it reviews at its regularly scheduled quarterly meetings information about the Redwood MV Portfolio’s performance results. Among other data, the Board considered the Redwood MV Portfolio’s performance as compared to the Peer Group’s performance. The Board noted that while it found the data provided by the independent third-party generally useful it recognized its limitations, including in particular that the data may vary depending on the end date selected and that the results of the performance comparisons may vary depending on the selection of the peer group.
With respect to the Redwood MV Portfolio, the Board considered, among other performance data, the Redwood MV Portfolio’s performance for the one-year, three-year, five-year, and since inception periods ended September 30, 2023 as compared to the performance of the Redwood MV Portfolio’s Peer Group, its Morningstar category, and its benchmark index. The Board considered that the Redwood MV Portfolio had outperformed the median of its Peer Group and benchmark index for the one-year period and had outperformed the median of its Peer Group, Morningstar category, and benchmark index for each of the three-year, five-year and since inception periods. The Board also considered that the Redwood MV Portfolio had underperformed as compared to the median of its Morningstar category for the one-year period. The Board noted that the Redwood MV Portfolio appeared to have been meeting the overall objectives of the Redwood MV Portfolio as regards its strategy.
20
The Board also took into account the Adviser’s discussion of the Redwood MV Portfolio’s performance, as well as the quarterly written report containing Redwood’s performance commentary. The Board noted the Redwood MV Portfolio’s risk adjusted returns and how the Redwood MV Portfolio was managed, including whether the Redwood MV Portfolio was managed according to an index or actively managed by Redwood and the factors contributing to any difference in performance with any other funds managed by Redwood with a similar strategy. The Board concluded that the overall performance of the Redwood MV Portfolio was satisfactory.
Fees and Expenses. As to the costs of the services provided by Redwood, among other expense data, the Board considered a comparison prepared by Broadridge of the Redwood MV Portfolio’s contractual advisory fee and operating expenses compared to the Redwood MV Portfolio’s Peer Group and Morningstar category. The Board noted that while it found the data provided by the independent third -party generally useful it recognized its limitations, including in particular that the funds in the Peer Group had a wide range of asset levels and varying expense record dates, and were both retail mutual funds and variable annuity funds.
The Board noted, among other data, that the advisory fee was above the median of both the Redwood MV Portfolio’s Peer Group and Morningstar category. The Board also recognized that the Redwood MV Portfolio’s net total expenses were above the median of both its Peer Group and Morningstar category, but within the range of other funds in the Peer Group and Morningstar category. The Board also considered Redwood’s commentary with respect to differences in the Redwood MV Portfolio from other funds in the Peer Group.
The Board took into account Redwood’s discussion of the Redwood MV Portfolio’s expenses. The Board considered that Redwood had agreed to reimburse expenses to limit net annual operating expenses (exclusive of (i) any front-end or contingent deferred loads; (ii) brokerage fees and commissions; (iii) acquired fund fees and expenses; (iv) borrowing costs (such as interest and dividend expense on securities sold short); (v) taxes; and (vi) extraordinary expenses, such as litigation expenses) to 1.49% and 1.99% of the average net assets of Class I and Class N shares, respectively, of the Redwood MV Portfolio.
In considering the level of the advisory fee paid with respect to the Redwood MV Portfolio, the Board took into account the cost of other accounts managed by Redwood that used a similar strategy, if any, noting that any variance in the advisory fees was attributable to the differences in the management of these other funds and private accounts.
Based on the factors above, the Board concluded that the advisory fee of the Redwood MV Portfolio was not unreasonable.
Profitability. The Board considered Redwood’s profitability and whether these profits were reasonable in light of the services provided to the Redwood MV Portfolio. The Board reviewed a profitability analysis prepared by Redwood on the Redwood MV Portfolio’s asset levels and considered the total profits of Redwood from its relationship with the Redwood MV Portfolio and other funds adviser by Redwood in the aggregate. The Board also considered that Redwood had agreed to reimburse expenses to limit net annual operating expenses. The Board concluded that Redwood’s profitability, if any, from its relationship with the Redwood MV Portfolio, after taking into account a reasonable allocation of costs, was not excessive.
Economies of Scale. The Board considered whether Redwood would realize economies of scale with respect to its management of the Redwood MV Portfolio as the Redwood MV Portfolio grew and whether fee levels reflected these economies. The Board noted that the Redwood MV Portfolio’s current advisory fee does not include breakpoints, and took into account Redwood’s discussion of the Redwood MV Portfolio’s fee structure, including the current size of the Redwood MV Portfolio as well as the level
21
of expenses incurred with respect to the Redwood MV Portfolio. The Board considered the profitability analysis provided by the Adviser and noted that while expenses of managing the Redwood MV Portfolio as a percentage of assets under management were expected to decrease as the Redwood MV Portfolio’s assets continued to grow, at current asset levels, economies of scale have not yet been reached. The Board noted that it would revisit whether economies of scale exist in the future once the Redwood MV Portfolio had achieved sufficient scale.
Other Benefits. The Board also considered the character and amount of other direct and incidental benefits to be received by Redwood from its relationship with the Redwood MV Portfolio. The Board considered that Redwood did not believe it receives any direct, indirect or ancillary material “fall-out” benefits from its relationship with the Redwood MV Portfolio. The Board concluded that any benefits are reasonable.
Conclusion. The Board, having requested and received such information from Redwood as it believed reasonably necessary to evaluate the terms of the Advisory Agreement with respect to the Fund, and having been advised by independent counsel that the Board had appropriately considered and weighed all relevant factors, determined that approval of the Advisory Agreement with respect to the Redwood MV Portfolio for an additional one-year term was in the best interests of the Redwood MV Portfolio and its shareholders.
In considering the renewal of the Advisory Agreement with respect to the Fund, the Board considered a variety of factors, including those discussed above, and also considered other factors (including conditions and trends prevailing generally in the economy, the securities markets, and the industry). The Board did not identify any one factor as determinative, and each Independent Trustee may have weighed each factor differently. The Board’s conclusions may be based in part on its consideration of the advisory arrangements in prior years and on the Board’s ongoing regular review of the Redwood MV Portfolio’s performance and operations throughout the year.
22
| Redwood Managed Volatility Portfolio |
| SUPPLEMENTAL INFORMATION (Unaudited) |
| December 31, 2023 |
LIQUIDITY RISK MANAGEMENT PROGRAM
The Portfolio has adopted and implemented a written liquidity risk management program as required by Rule 22e-4 (the “Liquidity Rule”) under the Investment Company Act. The program is reasonably designed to assess and manage the Portfolio’s liquidity risk, taking into consideration, among other factors, the Portfolio’s investment strategy and the liquidity of its portfolio investments during normal and reasonably foreseeable stressed conditions; its short and long-term cash flow projections; and its cash holdings and access to other funding sources.
During the fiscal period ended December 31, 2023 the Trust’s Liquidity Risk Management Program Committee (the “Committee”) reviewed the Portfolio’s investments and determined that the Portfolio held adequate levels of cash and highly liquid investments to meet shareholder redemption activities in accordance with applicable requirements. Accordingly, the Committee concluded that (i) the Portfolio’s liquidity risk management program is reasonably designed to prevent violations of the Liquidity Rule and (ii) the Portfolio’s liquidity risk management program has been effectively implemented.
23
| Redwood Managed Volatility Portfolio |
| SUPPLEMENTAL INFORMATION (Unaudited) (Continued) |
| December 31, 2023 |
Trustees and Officers. The Trustees and officers of the Trust, together with information as to their principal business occupations during the past five years and other information, are shown below. Unless otherwise noted, the address of each Trustee and Officer is 225 Pictoria Drive, Suite 450, Cincinnati, OH 45246.
Independent Trustees *
| Name, Address, Year of Birth | Position(s) Held with Registrant | Term and Length Served | Principal Occupation(s) During Past 5 Years | Number of Portfolios Overseen In The Fund Complex** | Other Directorships Held During Past 5 Years |
| Mark Garbin Year of Birth: 1951 | Trustee | Indefinite, Since 2012 | Managing Principal, Coherent Capital Management LLC (since 2008), Independent Director, OCHEE LP (2021- present) | 10 | Northern Lights Fund Trust (since 2013); Northern Lights Variable Trust (since 2013); Forethought Variable Insurance Trust (since 2013); iDirect Private Markets Fund (since 2014); Carlyle Tactical Private Credit Fund (since March 2018); OHA CLO Enhanced Equity II Genpar LLP (since 2021) and Carlyle Credit Income Fund (since September 2023) |
| Mark D. Gersten Year of Birth: 1950 | Chairman, Trustee | Indefinite, Since 2012 | Independent Consultant (since 2012); Senior Vice President – Global Fund Administration Mutual Funds & Alternative Funds, AllianceBernstein LP (1985 – 2011) | 10 | Northern Lights Fund Trust (since 2013); Northern Lights Variable Trust (since 2013); iDirect Private Markets Fund (since 2014); previously, Ramius Archview Credit and Distressed Fund (2015-2017); and Schroder Global Series Trust (2012 to 2017) |
| Neil M. Kaufman Year of Birth: 1960 | Trustee, Audit Committee Chairman | Indefinite, Since 2012 | Managing Member, Kaufman McGowan PLLC (legal services)(Since 2016) | 10 | iDirect Private Markets Fund (since 2014) |
| Anita K. Krug Year of Birth: 1969 | Trustee | Indefinite, Since 2012 | Dean and Professor (since 2019) of Chicago-Kent College of Law, Illinois Institute of Technology; Interim Vice Chancellor for Academic Affairs (2018-2019) University of Washington Bothell; Interim Dean (2017- 2018), Professor (2016-2019), Associate Professor (2014-2016); and Assistant Professor (2010-2014), University of Washington School of Law | 10 | iDirect Private Markets Fund (since 2014); Centerstone Investors Trust (2016-2021) |
| * | Information as of December 31, 2023. |
| ** | As of December 31, 2023, the Trust was comprised of 30 active portfolios managed by nine unaffiliated investment advisers and two affiliated investment advisers. The term “Fund Complex” applies only to those funds that (i) are advised by a common investment adviser or by an investment adviser that is an affiliated person of the investment adviser of any of the other funds in the Trust or (ii) hold themselves out to investors as related companies for purposes of investment and investor services. The Portfolio does not hold itself out as related to any other series of the Trust except for the Redwood Managed Volatility Fund, Redwood Managed Municipal Income Fund, Redwood AlphaFactor Tactical International Fund, Redwood Systematic Macro Trend (“SMarT”) Fund, LeaderShares® AlphaFactor® US Core Equity ETF, LeaderShares® Activist Leaders® ETF, LeaderShares® AlphaFactor® Tactical Focused ETF, LeaderShares® Equity Skew ETF and the LeaderShares Dynamic Yield ETF which are advised by the Portfolio’s Adviser. |
12/31/23 – Two Roads v1
24
| Redwood Managed Volatility Portfolio |
| SUPPLEMENTAL INFORMATION (Unaudited) (Continued) |
| December 31, 2023 |
Officers of the Trust*
| Name, Address, Year of Birth | Position(s) Held with Registrant | Principal Occupation(s) During Past 5 Years | Number of Portfolios Overseen In The Fund Complex** | Other Directorships Held During Past 5 Years |
| James Colantino Year of Birth: 1969 | President Since Feb. 2017 Treasurer (2012 to 2017) | Senior Vice President (2012- present); Vice President (2004 to 2012); Ultimus Fund Solutions LLC | N/A | N/A |
| Laura Szalyga Year of Birth: 1978 | Treasurer Since Feb. 2017 | Vice President, Ultimus Fund Solutions LLC (since 2015); Assistant Vice President, Ultimus Fund Solutions LLC (2011-2014) | N/A | N/A |
| Timothy Burdick Year of Birth: 1986 | Vice President Since Aug. 2022 Secretary Since Aug. 2022 | Vice President and Managing Counsel, Ultimus Fund Solutions, LLC (2022 – present); Assistant Vice President and Counsel, Ultimus Fund Solutions, LLC (2019 – 2022); Senior Program Compliance Manager, CJ Affiliate (2016 – 2019). | N/A | N/A |
| William B. Kimme Year of Birth: 1962 | Chief Compliance Officer Since Inception | Senior Compliance Officer, Northern Lights Compliance Services, LLC (September 2011 - present) | N/A | N/A |
| * | Information is as of December 31, 2023. |
| ** | As of December 31, 2023, the Trust was comprised of 30 active portfolios managed by nine unaffiliated investment advisers and two affiliated investment advisers. The term “Fund Complex” applies only to those funds that (i) are advised by a common investment adviser or by an investment adviser that is an affiliated person of the investment adviser of any of the other funds in the Trust or (ii) hold themselves out to investors as related companies for purposes of investment and investor services. The Portfolio does not hold itself out as related to any other series of the Trust except for the Redwood Managed Volatility Fund, Redwood Managed Municipal Income Fund, Redwood AlphaFactor Tactical International Fund, Redwood Systematic Macro Trend (“SMarT”) Fund, LeaderShares® AlphaFactor® US Core Equity ETF, LeaderShares® Activist Leaders® ETF, LeaderShares® AlphaFactor® Tactical Focused ETF, LeaderShares® Equity Skew ETF and the LeaderShares Dynamic Yield ETF which are advised by the Portfolio’s Adviser. |
The Portfolio’s Statement of Additional Information (“SAI”) includes additional information about the Trustees and is available free of charge, upon request, by calling toll-free at 1-855-733-3863.
12/31/23 – Two Roads v1
25
PRIVACY NOTICE
| FACTS | WHAT DOES TWO ROADS SHARED TRUST DO WITH YOUR PERSONAL INFORMATION |
| Why? | Financial companies choose how they share your personal information. Federal law gives consumers the right to limit some but not all sharing. Federal law also requires us to tell you how we collect, share, and protect your personal information. Please read this notice carefully to understand what we do. |
| What? | THE TYPES OF PERSONAL INFORMATION WE COLLECT AND SHARE DEPENDS ON THE PRODUCT OR SERVICE THAT YOU HAVE WITH US. THIS INFORMATION CAN INCLUDE:
● Social Security number and income
● Account transactions and transaction history
● Investment experience and purchase history
When you are no longer our customer, we continue to share your information as described in this notice. |
| How? | All financial companies need to share customers’ personal information to run their everyday business. In the section below, we list the reasons financial companies can share their customers’ personal information; the reason Two Roads Shared Trust chooses to share and whether you can limit this sharing. |
| Reasons we can share your personal information | Does Two Roads Shared Trust share? | Can you limit this sharing? |
| For our everyday business purposes – such as to process your transactions, maintain your account(s), respond to court orders and legal investigations, or report to credit bureaus | YES | NO |
| For our marketing purposes – to offer our products and services to you | NO | We do not share |
| For joint marketing with other financial companies | NO | We do not share |
| For our affiliates’ everyday business purposes – information about your transactions and experiences | NO | We do not share |
| For our affiliates’ everyday business purposes – information about your creditworthiness | NO | We do not share |
| For our affiliates to market to you | NO | We do not share |
| For nonaffiliates to market to you | NO | We do not share |
| Questions? | Call 1-631-490-4300 | |
26
What we do
| How does Two Roads Shared Trust protect my personal information? | To protect your personal information from unauthorized access and use, we use security measures that comply with federal law. These measures include computer safeguards and secured files and buildings.
Our service providers are held accountable for adhering to strict policies and procedures to prevent any misuse of your nonpublic personal information. |
| How does Two Roads Shared Trust collect my personal information? | We collect your personal information, for example, when you
● open an account or give us contact information
● provide account information or give us your income information
● make deposits or withdrawals from your account
We also collect your personal information from other companies. |
| Why can’t I limit all sharing? | Federal law gives you the right to limit only
● sharing for affiliates’ everyday business purposes – information about your creditworthiness
● affiliates from using your information to market to you
● sharing for nonaffiliates to market to you
State laws and individual companies may give you additional rights to limit sharing |
Definitions
| Affiliates | Companies related by common ownership or control. They can be financial and nonfinancial companies.
● Two Roads Shared Trust has no affiliates. |
| Nonaffiliates | Companies not related by common ownership or control. They can be financial and nonfinancial companies.
● Two Roads Shared Trust does not share with nonaffiliates so they can market to you. |
| Joint marketing | A formal agreement between nonaffiliates financial companies that together market financial products or services to you.
● Two Roads Shared Trust does not jointly market. |
27
Proxy Voting Policy
Information regarding how the Portfolio votes proxies relating to portfolio securities for the 12 month period ended June 30 as well as a description of the policies and procedures that the Portfolio used to determine how to vote proxies is available without charge, upon request, by calling 1-855-733-3863 or by referring to the Securities and Exchange Commission’s (“SEC”) website at http://www.sec.gov.
Portfolio Holdings
The Portfolio files its complete schedule of portfolio holdings with the Securities and Exchange Commission (the “SEC”) for the first and third quarters of each fiscal year as an exhibit to its reports on Form N-PORT, within sixty days after the end of the period. Form N-PORT reports are available at the SEC’s website at www.sec.gov.
Investment Adviser
Redwood Investment Management, LLC
4110 N. Scottsdale Rd, Suite 125
Scottsdale, AZ 85251
Administrator
Ultimus Fund Solutions, LLC
225 Pictoria Drive, Suite 450
Cincinnati, OH 45246
REDWOODVIT-AR23
ITEM 2. CODE OF ETHICS.
| (a) | The registrant has, as of the end of the period covered by this report, adopted a code of ethics that applies to the registrant's principal executive officer, principal financial officer, and principal accounting officer or controller, or persons performing similar functions, regardless of whether these individuals are employed by the registrant or a third party. |
| (b) | Not applicable. |
| (c) | During the period covered by this report, there were no amendments to any provision of the code of ethics. |
| (d) | During the period covered by this report, there were no waivers or implicit waivers of a provision of the code of ethics. |
| (e) | Not applicable. |
| (f) | A copy of the code of ethics is attached as an exhibit. |
ITEM 3. AUDIT COMMITTEE FINANCIAL EXPERT.
| (a)(1) | The registrant’s board of trustees has determined that Mark Gersten and Neil M. Kaufman are audit committee financial experts, as defined in Item 3 of Form N-CSR. |
| (a)(2) | Mr. Gersten and Mr. Kaufman are independent for purposes of this Item. |
| (a)(3) | Not applicable. |
ITEM 4. PRINCIPAL ACCOUNTANT FEES AND SERVICES.
| (a) | Audit Fees. The aggregate fees billed for each of the last two fiscal years for professional services rendered by the registrant's principal accountant for the audit of the registrant's annual financial statements or services that are normally provided by the accountant in connection with statutory and regulatory filings or engagements for those fiscal years are as follows:
|
| Trust Series | 2022 2023 | |
| Redwood Managed Volatility Portfolio | $15,000 $15,000 |
| (b) | Audit-Related Fees. There were no fees billed in each of the last two fiscal years for assurances and related services by the principal accountant that are reasonably related to the performance of the audit of the registrant’s financial statements and are not reported under paragraph (a) of this item. |
| (c) | Tax Fees. The aggregate fees billed in each of the last two fiscal years for professional services rendered by the principal accountant for tax compliance, tax advice, and tax planning are as follows: |
| Trust Series | 2022 2023 | |
| Redwood Managed Volatility Portfolio | $3,200 $3,200 |
| (d) | All Other Fees. There were no fees billed in each of the last two fiscal years for products and services provided by the registrant’s principal accountant, other than the services reported in paragraphs (a) through (c) of this Item. |
| (e)(1) | The audit committee does not have pre-approval policies and procedures. Instead, the audit committee or audit committee chairman approves on a case-by-case basis each audit or non-audit service before the principal accountant is engaged by the registrant. |
| (e)(2) | There were no services described in each of paragraphs (b) through (d) of this Item that were approved by the audit committee pursuant to paragraph (c)(7)(i)(C) of Rule 2-01 of Regulation S-X. |
| (f) | Not applicable. The percentage of hours expended on the principal accountant's engagement to audit the registrant's financial statements for the most recent fiscal year that were attributed to work performed by persons other than the principal accountant's full-time, permanent employees was zero percent (0%). |
| (g) | All non-audit fees billed by the registrant's principal accountant for services rendered to the registrant for each of the last two fiscal years are disclosed in (b)-(d) above. There were no audit or non-audit services performed by the registrant's principal accountant for the registrant's adviser. |
| (h) | Not applicable |
| (i) | Not applicable |
| (j) | Not applicable |
ITEM 5. AUDIT COMMITTEE OF LISTED REGISTRANTS.
Not applicable
ITEM 6. INVESTMENTS
Included in annual report to shareholders filed under Item 1 of this form.
ITEM 7. DISCLOSURE OF PROXY VOTING POLICIES AND PROCEDURES FOR CLOSED-END MANAGEMENT INVESTMENT COMPANIES.
Not applicable to open-end management investment companies.
ITEM 8. PORTFOLIO MANAGERS OF CLOSED-END MANAGEMENT INVESTMENT COMPANIES
Not applicable to open-end management investment companies.
ITEM 9. PURCHASES OF EQUITY SECURITIES BY CLOSED-END MANAGEMENT INVESTMENT COMPANY AND AFFILIATED PURCHASERS.
Not applicable to open-end management investment companies.
ITEM 10. SUBMISSION OF MATTERS TO A VOTE OF SECURITY HOLDERS.
Not applicable.
ITEM 11. CONTROLS AND PROCEDURES.
(a) Based on an evaluation of the registrant's disclosure controls and procedures (as defined in Rule 30a-3(c) under the 1940 Act), as of a date within 90 days of the filing date of this Form N-CSR, the principal executive officer and principal financial officer of the registrant have concluded that the disclosure controls and procedures of the registrant are reasonably designed to ensure that the information required in filings on Form N-CSR is recorded, processed, summarized, and reported by the filing date, including that information required to be disclosed is accumulated and communicated to the registrant’s management, including the registrant’s principal executive officer and principal financial officer, as appropriate to allow timely decisions regarding required disclosure.
(b) There were no changes in the registrant’s internal control over financial reporting (as defined in Rule 30a-3(d) under the 1940 Act) that occurred during the period covered by this report that have materially affected, or are reasonably likely to materially affect, the registrant’s internal control over financial reporting.
ITEM 12. DISCLOSURE OF SECURITIES LENDING ACTIVITES FOR CLOSED-END MANAGEMENT INVESTMENT COMPANIES.
Not applicable to open-end management investment companies.
ITEM 13. EXHIBITS
(a)(1) Code of Ethics for Principal Executive and Senior Financial Officers is attached hereto.
SIGNATURES
Pursuant to the requirements of the Securities Exchange Act of 1934 and the Investment Company Act of 1940, the registrant has duly caused this report to be signed on its behalf by the undersigned, thereunto duly authorized.
Two Roads Shared Trust
| By James Colantino | /s/ James Colantino |
| President/Principal Executive Officer | |
| Date: March 5, 2024 | |
Pursuant to the requirements of the Securities Exchange Act of 1934 and the Investment Company Act of 1940, this report has been signed below by the following person on behalf of the registrant and in the capacities and on the date indicated.
| By Laura Szalyga | /s/ Laura Szalyga |
| Treasurer/Principal Financial Officer | |
| Date: March 5, 2024 | |