united states
securities and exchange commission
washington, d.c. 20549
form n-csr
certified shareholder report of registered management
investment companies
Investment Company Act file number 811-22718
Two Roads Shared Trust
(Exact name of registrant as specified in charter)
225 Pictoria Drive, Suite 450, Cincinnati, Ohio 45246
(Address of principal executive offices) (Zip code)
The Corporation Trust Company
1209 Orange Street, Wilmington, DE 19801
(Name and address of agent for service)
Registrant's telephone number, including area code: 631-490-4300
Date of fiscal year end: 1/31
Date of reporting period: 1/31/24
Item 1. Reports to Stockholders.
| |
| |
| |
| |
| |
 |
| |
| |
| Regents Park Hedged Market Strategy ETF |
| |
| |
| |
| |
| |
| |
| |
| |
| |
| |
| |
| |
| |
| |
| |
| January 31, 2024 |
| |
| Annual Report |
| |
| |
| |
| |
| |
| |
| |
| |
| |
| |
| Advised by: |
| Anfield Capital Management, LLC |
| 4041 MacArthur Blvd. |
| Suite 155 |
| Newport Beach, CA 92660 |
| www.AnfieldFunds.com |
| |
| Distributed by Northern Lights Distributors, LLC |
| Member FINRA |

February 2024
Annual Letter to Shareholders of the Regents Park Hedged Market Strategy ETF (RPHS)
General Update
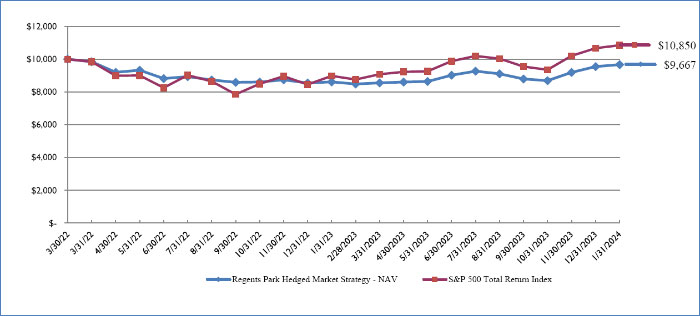
The annual period for the Regents Park Hedged Market Strategy ETF (‘RPHS’, the ‘Fund’) that ended January 31st, 2024, was the first full annual period for the Fund since launching at the end of Q1 2022. Performance during the period was largely positive for both the Fund and its primary benchmark, the S&P 500 TR Index (“SPXTR”). For the annual period ended January 31st, 2024, the Fund gained 12.16% on a total return basis, net of fees, while the SPXTR gained 20.82%, although past performance does not guarantee future results. While we are unsatisfied with the Fund’s overall lag as compared to the SPXTR, we acknowledge this is a unique challenge relating to the variable risk-return profile employed by the Fund. We are pleased that the Fund’s volatility, as measured by the standard deviation, remained low relative to its peers, and was ~65% that of the SPXTR for 2024. Asset levels in the Fund declined primarily due to client redemptions beyond the investment manager’s control. We will continue to manage the Fund in accordance with its stated investment strategy and objectives. This period, we are pleased that we believe we delivered on the Fund’s intention of providing lower risk equity market exposure as measured by volatility, and we will continue to manage the Fund with that goal in mind.
Portfolio Update and Current Positioning
As of the annual period close, the Fund’s collateral portfolio is made up of US Treasury securities (~71%) and USD corporate fixed income securities (~29%). This collateral portfolio is intended to partially offset the cost of hedging the Fund’s portfolio (as more fully described below) during the annual period. RPHS is managed to a proprietary model which dictates the funds overall participation ratio to the SPXTR. Overall, the portfolio management team has been pleased with the model’s direction and signals. The team continues to derive value from the model and has begun to adhere to its outputs on a more active basis as internal confidence in the system has grown over the life of the Fund.
Principal Investment Strategy
The Fund’s investment objective is to seek to provide capital appreciation through exposure to the U.S. Large Cap equity market while hedging overall market risk. There is no guarantee that the Fund will achieve its investment objective. The actively managed Fund seeks to achieve said objective by three primary means. First, positive large cap market exposure (delta) via either long futures or long options positions, or both. Second, a hedge is created either by reducing long exposure (delta) directly, or by directly hedging the portfolio via long puts or short calls, or both. Third, because the market exposure is created via derivatives (currently the two main derivatives utilized are futures and options contracts), the portfolio management team invests excess cash into a short duration (0.50-1.00 years), investment grade quality fixed income portfolio. This fixed income portfolio generates income that helps pay for the costs of carry and options premiums.
On behalf of the entire staff at Regents Park Funds, we thank you for your continued support.

David Young, CFA
CEO & Founder
The views in this report are those of the Fund’s management. This report contains certain forward-looking statements about factors that may affect the performance of the Fund in the future. These statements are based on the Fund’s management’s predictions and expectations concerning certain future events such as the performance of the economy as a whole and of specific industry sectors. Management believes these forward-looking statements are reasonable, although they are inherently uncertain and difficult to predict.
7192-NLD 02/26/2024
Regents Park Hedged Market Strategy ETF
PORTFOLIO REVIEW (Unaudited)
January 31, 2024
Average Annual Total Return through January 31, 2024*, as compared to its benchmark:
| | One | Inception through*** |
| | Year | January 31, 2024 |
| Regents Park Hedged Market Strategy ETF - NAV | 12.16% | -1.82% |
| Regents Park Hedged Market Strategy ETF - Market Price | 11.97% | -2.10% |
| S&P 500 Total Return Index ** | 20.82% | 4.53% |
| * | The performance data quoted here represents past performance. Current performance may be lower or higher than the performance data quoted above. Investment return and principal value will fluctuate, so that shares, when redeemed, may be worth more or less than their original cost. The returns shown do not reflect the deduction of taxes that a shareholder would pay on Fund distributions or on the redemptions of Fund shares. Past performance is no guarantee of future results. Performance figures for periods less than 1 year are not annualized. |
The Fund’s per share net asset value or “NAV” is the value of one share of the Fund as calculated in accordance with the standard formula for valuing exchange-traded fund shares. The NAV return is based on the NAV of the Fund and the market return is based on the market price per share of the Fund. The price used to calculate market return (“Market Price”) is determined by using the market price or bid/ask as of close of market on the primary stock exchange on which shares of the Fund are listed for trading, as of the time that the Fund’s NAV is calculated. Market price returns are calculated using the closing price and account for distributions from the Fund. Market Price and NAV returns assume that dividends and capital gain distributions have been reinvested in the Fund at Market Price and NAV, respectively. Regents Park Funds, LLC (the “Adviser”) provides investment advisory service, and is responsible for all of the expenses and liabilities of the Fund, inclusive of fees and expenses of other investment companies in which the Fund may invest, except for any brokerage fees and commissions, taxes, borrowing costs (such as dividend expense on securities sold short and interest), and such extraordinary or non-recurring expenses as may arise, including litigation to which the Fund may be a party and indemnification of the Board of Trustees and officers with respect thereto in return for a “unitary fee.” Expenses not expressly assumed by the Adviser under the Advisory Agreement are paid by the Fund. The Advisory Agreement may be terminated with respect to the Fund without penalty on 60 days’ written notice by a vote of a majority of the Trustees, the Adviser, or by holders of a majority of the Fund’s outstanding shares (with respect to the Fund). The Advisory Agreement shall terminate automatically in the event of its assignment. The Fund’s total annual operating expenses are at 0.75%, per the most recent prospectus. These expenses were calculated with estimated other expenses and acquired fund fees and expenses.
| ** | The S&P 500 Total Return Index is a large-cap, market-weighted, U.S. equities index that tracks the price (excluding dividends) of the leading companies that reflect the industries of the U.S. economy and is often considered a proxy for the stock market in general. |
| *** | As of the close of business on the day of commencement of trading on March 30, 2022. |
Comparison of the Change in Value of a $10,000 Investment
Portfolio Composition as of January 31, 2024:
| Compositions | | Percentage of Net Assets | |
| Corporate Bonds: | | | | |
| Banking | | | 7.4 | % |
| Electric Utilities | | | 2.5 | % |
| Real Estate Investment Trusts | | | 2.2 | % |
| Oil and Gas Producers | | | 1.7 | % |
| Gas & Water Utilities | | | 1.7 | % |
| Heath Care Facilities & Services | | | 1.6 | % |
| Aerospace & Defense | | | 1.3 | % |
| Medical Equipment & Devices | | | 1.0 | % |
| Technology Services | | | 1.0 | % |
| Other | | | 4.7 | % |
| U.S Government & Agencies | | | | |
| U.S Treasury Bills | | | 60.4 | % |
| Index Options Purchased | | | 0.9 | % |
| Other Assets in Excess of Liabilities | | | 13.6 | % |
| | | | 100.0 | % |
Please refer to the Schedule of Investments in this Annual Report for a detailed analysis of the Fund’s holdings.
| REGENTS PARK HEDGED MARKET STRATEGY ETF |
| SCHEDULE OF INVESTMENTS |
| January 31, 2024 |
| Principal | | | | | Coupon Rate | | | | | |
| Amount ($) | | | | | (%) | | Maturity | | Fair Value | |
| | | | | CORPORATE BONDS — 25.1% | | | | | | | | |
| | | | | AEROSPACE & DEFENSE — 1.3% | | | | | | | | |
| | 796,000 | | | L3 Technologies, Inc. | | 3.9500 | | 05/28/24 | | $ | 792,109 | |
| | | | | | | | | | | | | |
| | | | | ASSET MANAGEMENT — 0.8% | | | | | | | | |
| | 500,000 | | | Charles Schwab Corporation (The) | | 3.5500 | | 02/01/24 | | | 500,000 | |
| | | | | | | | | | | | | |
| | | | | AUTOMOTIVE — 0.8% | | | | | | | | |
| | 500,000 | | | Daimler Finance North America, LLC(a) | | 3.6500 | | 02/22/24 | | | 499,413 | |
| | | | | | | | | | | | | |
| | | | | BANKING — 7.4% | | | | | | | | |
| | 500,000 | | | Bank of Montreal | | 3.3000 | | 02/05/24 | | | 499,907 | |
| | 250,000 | | | BNP Paribas S.A.(a) | | 4.3750 | | 09/28/25 | | | 246,180 | |
| | 700,000 | | | BPCE S.A.(a) | | 4.5000 | | 03/15/25 | | | 689,167 | |
| | 500,000 | | | Canadian Imperial Bank of Commerce | | 3.8500 | | 02/16/24 | | | 499,137 | |
| | 1,168,000 | | | Credit Agricole S.A.(a) | | 4.3750 | | 03/17/25 | | | 1,152,298 | |
| | 950,000 | | | Societe Generale S.A.(a) | | 4.2500 | | 04/14/25 | | | 933,377 | |
| | 420,000 | | | Toronto-Dominion Bank (The) | | 2.6500 | | 06/12/24 | | | 415,898 | |
| | | | | | | | | | | | 4,435,964 | |
| | | | | ELECTRIC UTILITIES — 2.5% | | | | | | | | |
| | 350,000 | | | Electricite de France S.A.(a) | | 3.6250 | | 10/13/25 | | | 343,271 | |
| | 700,000 | | | Enel Finance International N.V.(a) | | 2.6500 | | 09/10/24 | | | 687,434 | |
| | 500,000 | | | Pennsylvania Electric Company(a) | | 4.1500 | | 04/15/25 | | | 491,097 | |
| | | | | | | | | | | | 1,521,802 | |
| | | | | FOOD — 0.7% | | | | | | | | |
| | 150,000 | | | Cargill, Inc.(a) | | 0.4000 | | 02/02/24 | | | 150,000 | |
| | 250,000 | | | Mondelez International, Inc. B | | 2.1250 | | 03/17/24 | | | 248,865 | |
| | | | | | | | | | | | 398,865 | |
| | | | | GAS & WATER UTILITIES — 1.7% | | | | | | | | |
| | 1,000,000 | | | Korea Gas Corporation(a) | | 3.8750 | | 02/12/24 | | | 999,554 | |
| | | | | | | | | | | | | |
| | | | | HEALTH CARE FACILITIES & SERVICES — 1.6% | | | | | | | | |
| | 434,000 | | | Cigna Corporation | | 0.6130 | | 03/15/24 | | | 431,492 | |
| | 500,000 | | | Laboratory Corp of America Holdings | | 3.2500 | | 09/01/24 | | | 493,322 | |
| | | | | | | | | | | | 924,814 | |
See accompanying notes to financial statements.
| REGENTS PARK HEDGED MARKET STRATEGY ETF |
| SCHEDULE OF INVESTMENTS (Continued) |
| January 31, 2024 |
| Principal | | | | | Coupon Rate | | | | | |
| Amount ($) | | | | | (%) | | Maturity | | Fair Value | |
| | | | | CORPORATE BONDS — 25.1% (Continued) | | | | | | | | |
| | | | | INSTITUTIONAL FINANCIAL SERVICES — 0.8% | | | | | | | | |
| | 500,000 | | | Bank of New York Mellon Corporation (The) | | 3.6500 | | 02/04/24 | | $ | 499,934 | |
| | | | | | | | | | | | | |
| | | | | INSURANCE — 0.8% | | | | | | | | |
| | 500,000 | | | American International Group, Inc. | | 4.1250 | | 02/15/24 | | | 499,702 | |
| | | | | | | | | | | | | |
| | | | | MEDICAL EQUIPMENT & DEVICES — 1.0% | | | | | | | | |
| | 600,000 | | | Becton Dickinson and Company | | 3.7340 | | 12/15/24 | | | 593,158 | |
| | | | | | | | | | | | | |
| | | | | OIL & GAS PRODUCERS — 1.7% | | | | | | | | |
| | 1,000,000 | | | Phillips 66 | | 0.9000 | | 02/15/24 | | | 998,171 | |
| | | | | | | | | | | | | |
| | | | | REAL ESTATE INVESTMENT TRUSTS — 2.2% | | | | | | | | |
| | 750,000 | | | Crown Castle International Corporation | | 3.2000 | | 09/01/24 | | | 739,608 | |
| | 375,000 | | | Office Properties Income Trust | | 4.2500 | | 05/15/24 | | | 369,005 | |
| | 200,000 | | | VICI Properties, L.P. / VICI Note Company, Inc.(a) | | 5.6250 | | 05/01/24 | | | 199,893 | |
| | | | | | | | | | | | 1,308,506 | |
| | | | | TECHNOLOGY SERVICES — 1.0% | | | | | | | | |
| | 600,000 | | | International Business Machines Corporation | | 3.6250 | | 02/12/24 | | | 599,666 | |
| | | | | | | | | | | | | |
| | | | | TELECOMMUNICATIONS — 0.8% | | | | | | | | |
| | 500,000 | | | T-Mobile USA, Inc. | | 3.5000 | | 04/15/25 | | | 490,470 | |
| | | | | | | | | | | | | |
| | | | | TOTAL CORPORATE BONDS (Cost $15,170,980) | | | | | | | 15,062,128 | |
| | | | | | | | | | | | | |
| Principal | | | | | Coupon Rate | | | | | | |
| Amount ($) | | | | | (%) | | Maturity | | Fair Value | |
| | | | | U.S. GOVERNMENT & AGENCIES — 60.4% | | | | | | | | |
| | | | | U.S. TREASURY BILLS — 60.4% | | | | | | | | |
| | 35,100,000 | | | United States Treasury Bill(b) | | — | | 03/28/24 | | | 34,813,332 | |
| | 1,000,000 | | | United States Treasury Note | | 2.2500 | | 03/31/24 | | | 994,938 | |
| | 500,000 | | | United States Treasury Note | | 2.5000 | | 04/30/24 | | | 496,529 | |
| | | | | | | | | | | | 36,304,799 | |
| | | | | TOTAL U.S. GOVERNMENT & AGENCIES (Cost $36,311,495) | | | | | | | 36,304,799 | |
See accompanying notes to financial statements.
| REGENTS PARK HEDGED MARKET STRATEGY ETF |
| SCHEDULE OF INVESTMENTS (Continued) |
| January 31, 2024 |
| Contracts(c) | | | | | Broker/Counterparty | | Expiration Date | | Exercise
Price | | | Notional Value | | | Fair Value | |
| | | | | INDEX OPTIONS PURCHASED - 0.9% | | | | | | | | | | | | | | | | |
| | | | | CALL OPTIONS PURCHASED - 0.6% | | | | | | | | | | | | | | | | |
| | 15 | | | S&P 500 INDEX | | IB | | 03/15/2024 | | $ | 4,800 | | | $ | 7,200,000 | | | $ | 186,075 | |
| | 10 | | | S&P 500 INDEX | | IB | | 04/19/2024 | | | 4,900 | | | | 4,900,000 | | | | 105,550 | |
| | 10 | | | S&P 500 INDEX | | IB | | 05/17/2024 | | | 5,000 | | | | 5,000,000 | | | | 83,700 | |
| | | | | TOTAL CALL OPTIONS PURCHASED (Cost - $279,547) | | | | | 375,325 | |
| | | | | | | | | | | | | | | | | | | | | |
| | | | | PUT OPTIONS PURCHASED - 0.3% | | | | | | | | | | | | | | | | |
| | 10 | | | S&P 500 INDEX | | IB | | 04/19/2024 | | $ | 4,700 | | | $ | 4,700,000 | | | $ | 54,250 | |
| | 10 | | | S&P 500 INDEX | | IB | | 05/17/2024 | | | 4,800 | | | | 4,800,000 | | | | 94,200 | |
| | | | | TOTAL PUT OPTIONS PURCHASED (Cost - $156,128) | | | | | 148,450 | |
| | | | | | | | | | | | | | | | | | | | | |
| | | | | TOTAL INDEX OPTIONS PURCHASED (Cost - $435,675) | | | | | 523,775 | |
| | | | | | | | | | | | | | | | | | | | | |
| | | | | TOTAL INVESTMENTS - 86.4% (Cost $51,918,150) | | | | $ | 51,890,702 | |
| | | | | OTHER ASSETS IN EXCESS OF LIABILITIES - 13.6% | | | | | 8,176,244 | |
| | | | | NET ASSETS - 100.0% | | | | $ | 60,066,946 | |
| OPEN FUTURES CONTRACTS | |
| Number of | | | | | | | Notional | | | Value and Unrealized | |
| Contracts | | | Open Long Futures Contracts | | Expiration | | Amount(d) | | | Appreciation | |
| | 185 | | | CME E-Mini Standard & Poor’s 500 Index Future | | 03/15/2024 | | $ | 45,052,125 | | | $ | 1,621,813 | |
| | | | | TOTAL FUTURES CONTRACTS | | | | | | | | | | |
| IB | - Interactive Broker |
| | |
| LLC | - Limited Liability Company |
| | |
| L.P | - Limited Partnership |
| | |
| N.V. | - Naamioze Vennootschap |
| | |
| S&P | - Standard & Poor’s |
| | |
| S.A. | - Société Anonyme |
| (a) | Security exempt from registration under Rule 144A or Section 4(2) of the Securities Act of 1933. The security may be resold in transactions exempt from registration, normally to qualified institutional buyers. As of January 31, 2024 the total market value of 144A securities is $6,391,684 or 10.6% of net assets. |
| (c) | Each option contract allows the holder of the option to purchase or sell 100 shares of the underlying security. |
| (d) | The amounts shown are the underlying reference notional amounts to stock exchange indices and equities upon which the fair value of the futures contracts held by the Fund are based. Notional values do not represent the current fair value of, and are not necessarily indicative of the future cash flows of the Fund’s futures contracts. Further, the underlying price changes in relation to the variables specified by the notional values affects the fair value of these derivative financial instruments. The notional values as set forth within this schedule do not purport to represent economic value at risk to the Fund. |
See accompanying notes to financial statements.
| Regents Park Hedged Market Strategy ETF |
| STATEMENT OF ASSETS AND LIABILITIES |
| January 31, 2024 |
| ASSETS | | | | |
| Investment securities: | | | | |
| At cost | | $ | 51,918,150 | |
| At fair value | | $ | 51,890,702 | |
| Cash | | | 2,616,675 | |
| Deposits at broker for futures contracts | | | 3,751,546 | |
| Unrealized appreciation on futures contracts | | | 1,621,813 | |
| Interest receivable | | | 202,702 | |
| TOTAL ASSETS | | | 60,083,438 | |
| | | | | |
| LIABILITIES | | | | |
| Investment advisory fees payable | | | 16,492 | |
| TOTAL LIABILITIES | | | 16,492 | |
| NET ASSETS | | $ | 60,066,946 | |
| | | | | |
| Net Assets Consist Of: | | | | |
| Paid in capital | | $ | 67,602,219 | |
| Accumulated loss | | | (7,535,273 | ) |
| NET ASSETS | | $ | 60,066,946 | |
| | | | | |
| Net Asset Value Per Share: | | | | |
| Shares: | | | | |
| Net assets | | $ | 60,066,946 | |
| Shares of beneficial interest outstanding (a) | | | 6,625,000 | |
| | | | | |
| Net asset value (Net Assets ÷ Shares Outstanding), offering price and redemption price per share | | $ | 9.07 | |
| (a) | Unlimited number of shares of beneficial interest authorized, no par value. |
See accompanying notes to financial statements.
| Regents Park Hedged Market Strategy ETF |
| STATEMENT OF OPERATIONS |
| For the Year Ended January 31, 2024 |
| INVESTMENT INCOME | | | | |
| Interest | | $ | 3,836,489 | |
| TOTAL INVESTMENT INCOME | | | 3,836,489 | |
| | | | | |
| EXPENSES | | | | |
| Investment advisory fees | | | 769,565 | |
| Interest expense | | | 43,299 | |
| TOTAL EXPENSES | | | 812,864 | |
| | | | | |
| NET INVESTMENT INCOME | | | 3,023,625 | |
| | | | | |
| REALIZED AND UNREALIZED GAIN ON INVESTMENTS | | | | |
| Net realized gain from investments and options purchased | | | 51,929 | |
| Net realized gain from futures contracts | | | 4,459,674 | |
| Net change in unrealized appreciation on investments and options purchased | | | 944,957 | |
| Net change in unrealized appreciation on futures contracts | | | 1,223,813 | |
| NET REALIZED AND UNREALIZED GAIN ON INVESTMENTS | | | 6,680,373 | |
| | | | | |
| NET INCREASE IN NET ASSETS RESULTING FROM OPERATIONS | | $ | 9,703,998 | |
See accompanying notes to financial statements.
| Regents Park Hedged Market Strategy ETF |
| STATEMENTS OF CHANGES IN NET ASSETS |
| | | For the | | | For the | |
| | | Year Ended | | | Period Ended | |
| | | January 31, 2024 | | | January 31, 2023 * | |
| FROM OPERATIONS | | | | | | | | |
| Net investment income | | $ | 3,023,625 | | | $ | 2,056,708 | |
| Net realized gain (loss) from investments and options purchased | | | 51,929 | | | | (2,621,462 | ) |
| Net realized gain (loss) from future contracts | | | 4,459,674 | | | | (11,058,377 | ) |
| Net change in unrealized appreciation (depreciation) on investments and options purchased | | | 944,957 | | | | (972,405 | ) |
| Net change in unrealized appreciation on future contracts | | | 1,223,813 | | | | 398,000 | |
| Net increase (decrease) in net assets resulting from operations | | | 9,703,998 | | | | (12,197,536 | ) |
| | | | | | | | | |
| DISTRIBUTIONS TO SHAREHOLDERS | | | | | | | | |
| Total distributions paid | | | (3,198,250 | ) | | | (1,843,485 | ) |
| Net decrease in net assets from distributions to shareholders | | | (3,198,250 | ) | | | (1,843,485 | ) |
| | | | | | | | | |
| FROM SHARES OF BENEFICIAL INTEREST | | | | | | | | |
| Proceeds from shares sold | | | 13,600,190 | | | | 192,654,653 | |
| Payments for shares redeemed | | | (96,389,143 | ) | | | (42,513,481 | ) |
| Net increase (decrease) in net assets from shares of beneficial interest | | | (82,788,953 | ) | | | 150,141,172 | |
| | | | | | | | | |
| TOTAL INCREASE (DECREASE) IN NET ASSETS | | | (76,283,205 | ) | | | 136,100,151 | |
| | | | | | | | | |
| NET ASSETS | | | | | | | | |
| Beginning of Year/Period | | | 136,350,151 | | | | 250,000 | (a) |
| End of Year/Period | | $ | 60,066,946 | | | $ | 136,350,151 | |
| | | | | | | | | |
| SHARE ACTIVITY | | | | | | | | |
| Shares Sold | | | 1,575,000 | | | | 20,950,000 | |
| Shares Redeemed | | | (10,975,000 | ) | | | (4,925,000 | ) |
| Net increase (decrease) in shares from beneficial interest outstanding | | | (9,400,000 | ) | | | 16,025,000 | |
| * | The Regents Park Hedged Market Strategy ETF commenced operations on March 30, 2022. |
| (a) | Beginning capital of $250,000 was contributed by fund management of Regents Park Funds, LLC, investment adviser to the Fund, in exchange for 25,000 shares of the Fund in connection with the seeding of the Regents Park Hedged Market Strategy ETF, a series of the Trust. |
See accompanying notes to financial statements.
| Regents Park Hedged Market Strategy ETF |
| FINANCIAL HIGHLIGHTS |
Per Share Data and Ratios for a Share of Beneficial Interest Outstanding Throughout the Year/Period Presented
| | | For the | | | For the | |
| | | Year Ended | | | Period Ended | |
| | | January 31, 2024 | | | January 31, 2023 (a) | |
| Net asset value, beginning of year/period | | $ | 8.51 | | | $ | 10.00 | |
| Activity from investment operations: | | | | | | | | |
| Net investment income (b) | | | 0.26 | | | | 0.14 | |
| Net realized and unrealized gain (loss) on investments | | | 0.77 | | | | (1.52 | ) |
| Total from investment operations | | | 1.03 | | | | (1.38 | ) |
| Less distributions from: | | | | | | | | |
| Net investment income | | | (0.47 | ) | | | (0.11 | ) |
| Total distributions | | | (0.47 | ) | | | (0.11 | ) |
| Net asset value, end of year/period | | $ | 9.07 | | | $ | 8.51 | |
| Market price, end of year/period | | $ | 9.02 | | | $ | 8.48 | |
| Total return (c) | | | 12.16 | % | | | (13.81 | )% (g)(i) |
| Market price total return | | | 11.97 | % | | | (14.11 | )% (g) |
| Net assets, end of year/period (000s) | | $ | 60,067 | | | $ | 136,350 | |
| Ratio of net expenses to average net assets | | | 0.79 | % (f) | | | 0.75 | % (h) |
| Ratio of net investment income to average net assets (d) | | | 2.95 | % (f) | | | 1.85 | % (h) |
| Portfolio Turnover Rate (e) | | | 0 | % | | | 412 | % (g) |
| (a) | The Regents Park Hedged Market Strategy ETF commenced operations on March 30, 2022. |
| (b) | Per share amounts calculated using the average shares method, which more appropriately presents the per share data for the year/period. |
| (c) | Total return is calculated assuming a purchase of shares at net asset value on the first day and a sale at net asset value on the last day of the year/period. Distributions are assumed, for the purpose of this calculation, to be reinvested at the ex-dividend date net asset value per share on their respective payment dates. Total return would have been lower or higher absent the fee waiver/expense reimbursement or recapture, respectively. |
| (d) | Recognition of net investment income by the Fund is affected by the timing of the declaration of dividends by the underlying investment companies in which the Fund invests. |
| (e) | Portfolio turnover rate excludes securities received or delivered from in-kind transactions. |
| (f) | Excluding interest expense, the following Ratios would have been: |
| | | January 31, 2024 | |
| Net expenses to average net assets | | | 0.75 | % |
| Net investment income to average net assets | | | 2.99 | % |
| (i) | Represents total return based on net asset values per share from commencement of investment operations on March 30, 2022 through January 31, 2023. |
See accompanying notes to financial statements.
| Regents Park Hedged Market Strategy ETF |
| NOTES TO FINANCIAL STATEMENTS |
| January 31, 2024 |
The Regents Park Hedged Market Strategy ETF (the “Fund”), is a series of shares of beneficial interest of the Two Roads Shared Trust (the “Trust”), a statutory trust organized under the laws of the State of Delaware on June 8, 2012, and is registered under the Investment Company Act of 1940, as amended (the “1940 Act”), as a diversified, open-end management investment company. The Fund commenced operations on March 30, 2022. The Fund is an actively managed exchange-traded fund (“ETF”). The investment objective of the Fund is to seek to provide capital appreciation through exposure to the U.S. Large Cap equity market while hedging overall market risk. There is no guarantee that the Fund will achieve its investment objective.
| (2) | SIGNIFICANT ACCOUNTING POLICIES |
The following is a summary of significant accounting policies followed by the Fund in the preparation of its financial statements. These policies are in conformity with accounting principles generally accepted in the United States of America (’‘GAAP”), and require management to make estimates and assumptions that affect the reported amounts of assets and liabilities and disclosure of contingent assets and liabilities at the date of the financial statements and the reported amounts of increases and decreases in net assets from operations during the reporting period. Actual results could differ from those estimates. The Fund is an investment company and accordingly follows the investment company accounting and reporting guidance of the Financial Accounting Standards Board (“FASB”) Accounting Standard Codification Topic 946 “Financial Services – Investment Companies”.
Security Valuation – Securities listed on an exchange are valued at the last reported sale price at the close of the regular trading session of the exchange on the business day the value is being determined, or in the case of securities listed on NASDAQ at the NASDAQ Official Closing Price. In the absence of a sale such securities shall be valued at the mean between the current bid and ask prices on the day of valuation. Securities that are not traded or dealt in any securities exchange (whether domestic or foreign) and for which over-the-counter market quotations are readily available generally shall be valued at the last sale price or, in the absence of a sale, at the mean between the current bid and ask price on such over-the-counter market. Debt securities not traded on an exchange may be valued at prices supplied by a pricing agent(s) based on broker or dealer supplied valuations or matrix pricing, a method of valuing securities by reference to the value of other securities with similar characteristics, such as rating, interest rate and maturity. Futures contracts listed for trading on a securities exchange or board of trade (whether domestic or foreign) for which market quotations are readily available shall be valued at the final settled price for the respective futures or futures options or, if no settled price is available, at the last sale price as of the close of business prior to the valuation time. Exchange traded options are valued at the last sale price or in the absence of a sale, at the mean between the current bid and ask prices. Investments in open-end investment-companies are valued at net asset value. The independent pricing-service does not distinguish between smaller sized bond positions known as “odd lots” and larger institutional sized bond positions known as “round lots”. The Fund may fair value a particular bond if the adviser does not believe that the round lot value provided by the independent pricing service reflects fair value of the Fund’s holding. Short-term debt obligations having 60 days or less remaining until maturity, at time of purchase, may be valued at amortized cost.
The Fund may hold securities, such as private investments, interests in commodity pools, other non-traded securities or temporarily illiquid securities, for which market quotations are not readily available or are determined to be unreliable. These securities are valued using the “fair value” procedures approved by the Trustees of the Trust (the “Board”). The Board has appointed the Adviser as its valuation designee (the “Valuation Designee”) for all fair value determinations and responsibilities, other than overseeing pricing service providers used by the Trust. This designation is subject to Board oversight and certain reporting and other requirements designed to facilitate the Board’s ability effectively to oversee the designee’s fair value determinations. The Board may also enlist third party consultants such a valuation specialist at a public accounting firm, valuation consultant or financial officer of a security issuer on an as-needed basis to assist the Valuation Designee in determining a security-specific fair value. The Board is responsible for reviewing and approving fair value methodologies utilized by the Valuation Designee,
| Regents Park Hedged Market Strategy ETF |
| NOTES TO FINANCIAL STATEMENTS (Continued) |
| January 31, 2024 |
approval of which shall be based upon whether the Valuation Designee followed the valuation procedures established by the Board.
Valuation of Underlying Funds – The Fund may invest in portfolios of open-end or closed-end investment companies (the “Underlying Funds”). Investment companies are valued at their respective net asset values as reported by such investment companies. Open-end investment companies value securities in their portfolios for which market quotations are readily available at their market values (generally the last reported sale price) and all other securities and assets at their fair value to the methods established by the board of directors of the open-end funds. The shares of many closed-end investment companies and ETFs, after their initial public offering, frequently trade at a price per share, which is different than the net asset value per share. The difference represents a market premium or market discount of such shares. There can be no assurances that the market discount or market premium on shares of any closed-end investment company or ETF purchased by the Fund will not change.
Fair Valuation Process – The applicable investments are valued by the Valuation Designee pursuant to valuation procedures approved by the Board. For example, fair value determinations are required for the following securities: (i) securities for which market quotations are insufficient or not readily available on a particular business day (including securities for which there is a short and temporary lapse in the provision of a price by the regular pricing source); (ii) securities for which, in the judgment of the Valuation Designee, the prices or values available do not represent the fair value of the instrument; factors which may cause the Valuation Designee to make such a judgment include, but are not limited to, the following: only a bid price or an ask price is available; the spread between bid and ask prices is substantial; the frequency of sales; the thinness of the market; the size of reported trades; and actions of the securities markets, such as the suspension or limitation of trading; (iii) securities determined to be illiquid; and (iv) securities with respect to which an event that affects the value thereof has occurred (a “significant event”) since the closing prices were established on the principal exchange on which they are traded, but prior to a Fund’s calculation of its net asset value. Specifically, interests in commodity pools or managed futures pools are valued on a daily basis by reference to the closing market prices of each futures contract or other asset held by a pool, as adjusted for pool expenses. Restricted or illiquid securities, such as private investments or non-traded securities are valued based upon the current bid for the security from two or more independent dealers or other parties reasonably familiar with the facts and circumstances of the security (who should take into consideration all relevant factors as may be appropriate under the circumstances). If a current bid from such independent dealers or other independent parties is unavailable, the Valuation Designee shall determine the fair value of such security using the following factors: (i) the type of security; (ii) the cost at date of purchase; (iii) the size and nature of the Fund’s holdings; (iv) the discount from market value of unrestricted securities of the same class at the time of purchase and subsequent thereto; (v) information as to any transactions or offers with respect to the security; (vi) the nature and duration of restrictions on disposition of the security and the existence of any registration rights; (vii) how the yield of the security compares to similar securities of companies of similar or equal creditworthiness; (viii) the level of recent trades of similar or comparable securities; (ix) the liquidity characteristics of the security; (x) current market conditions; and (xi) the market value of any securities into which the security is convertible or exchangeable.
Exchange-Traded Funds – The Fund may invest in ETFs, which are a type of fund bought and sold on a securities exchange. An ETF trades like common stock and represents a fixed portfolio of securities. The risks of owning an ETF generally reflect the risks of owning the underlying securities in which it invests, although the lack of liquidity on an ETF could result in it being more volatile. Additionally, ETFs have fees and expenses that reduce their value.
Exchange Traded Notes – The Fund may invest in exchange traded notes (“ETNs”). ETNs are a type of debt security that is linked to the performance of underlying securities. The risks of owning ETNs generally reflect the risks of owning the underlying securities they are designed to track. In addition, ETNs are subject to credit risk generally to the same extent as debt securities.
| Regents Park Hedged Market Strategy ETF |
| NOTES TO FINANCIAL STATEMENTS (Continued) |
| January 31, 2024 |
Futures Contracts – The Fund may purchase or sell futures contracts to gain exposure to, or hedge against, changes in the value of the S&P 500 Index (or other U.S. Large Cap equity market indices). Initial margin deposits required upon entering into futures contracts are satisfied by the segregation of specific securities or cash as collateral for the account of the broker (the Fund’s agent in acquiring the futures position). During the period the futures contracts are open, changes in the value of the contracts are recognized as unrealized gains or losses by “marking to market” on a daily basis to reflect the market value of the contracts at the end of each day’s trading. Variation margin payments are received or made depending upon whether unrealized gains or losses are incurred. When the contracts are closed, the Fund recognizes a realized gain or loss equal to the difference between the proceeds from, or cost of, the closing transaction and the Fund’s basis in the contract. If the Fund was unable to liquidate a futures contract and/or enter into an offsetting closing transaction, the Fund would continue to be subject to market risk with respect to the value of the contracts and continue to be required to maintain the margin deposits on the futures contracts. The Fund segregates liquid securities having a value at least equal to the amount of the current obligation under any open futures contract. Risks may exceed amounts recognized in the statement of assets and liabilities. With futures, there is minimal counterparty credit risk to the Fund since futures are exchange traded and the exchange’s clearinghouse, as counterparty to all exchange traded futures, guarantees the futures against default.
Option Transactions – The Fund is subject to equity risk in the normal course of pursuing its investment objective and may purchase or sell options to help hedge against risk. When the Fund writes a call option, an amount equal to the premium received is included in the statement of assets and liabilities as a liability. The amount of the liability is subsequently marked-to-market to reflect the current market value of the option. If an option expires on its stipulated expiration date or if the Fund enters into a closing purchase transaction, a gain or loss is realized. If a written call option is exercised, a gain or loss is realized for the sale of the underlying security and the proceeds from the sale are increased by the premium originally received. As writer of an option, the Fund has no control over whether the option will be exercised and, as a result, retains the market risk of an unfavorable change in the price of the security underlying the written option.
The Fund may purchase put and call options. Put options are purchased to hedge against a decline in the value of securities held in the Fund’s portfolio. If such a decline occurs, the put options will permit the Fund to sell the securities underlying such options at the exercise price, or to close out the options at a profit. The premium paid for a put or call option plus any transaction costs will reduce the benefit, if any, realized by the Fund upon exercise of the option, and, unless the price of the underlying security rises or declines sufficiently, the option may expire worthless to the Fund. In addition, in the event that the price of the security in connection with which an option was purchased moves in a direction favorable to the Fund, the benefits realized by the Fund as a result of such favorable movement will be reduced by the amount of the premium paid for the option and related transaction costs. Written and purchased options are non-income producing securities. With purchased options, there is minimal counterparty risk to the Fund since these options are exchange traded and the exchange’s clearinghouse, as counterparty to all exchange traded options, guarantees against a possible default.
The Fund utilizes various methods to measure the fair value of all of its investments on a recurring basis. GAAP establishes a hierarchy that prioritizes inputs to valuation methods. The three levels of input are:
Level 1 – Unadjusted quoted prices in active markets for identical assets and liabilities that the Fund has the ability to access.
Level 2 – Observable inputs other than quoted prices included in Level 1 that are observable for the asset or liability, either directly or indirectly. These inputs may include quoted prices for the identical instrument on an inactive market, prices for similar instruments, interest rates, prepayment speeds, credit risk, yield curves, default rates and similar data.
| Regents Park Hedged Market Strategy ETF |
| NOTES TO FINANCIAL STATEMENTS (Continued) |
| January 31, 2024 |
Level 3 – Unobservable inputs for the asset or liability, to the extent relevant observable inputs are not available, representing the Fund’s own assumptions about the assumptions a market participant would use in valuing the asset or liability, and would be based on the best information available.
The availability of observable inputs can vary from security to security and is affected by a wide variety of factors, including, for example, the type of security, whether the security is new and not yet established in the marketplace, the liquidity of markets, and other characteristics particular to the security. To the extent that valuation is based on models or inputs that are less observable or unobservable in the market, the determination of fair value requires more judgment. Accordingly, the degree of judgment exercised in determining fair value is greatest for instruments categorized in Level 3.
The inputs used to measure fair value may fall into different levels of the fair value hierarchy. In such cases, for disclosure purposes, the level in the fair value hierarchy within which the fair value measurement falls in its entirety, is determined based on the lowest level input that is significant to the fair value measurement in its entirety.
The inputs or methodology used for valuing securities are not necessarily an indication of the risk associated with investing in those securities. The following tables summarize the inputs used as of January 31, 2024 for the Fund’s assets and liabilities measured at fair value:
| Assets* | | Level 1 | | | Level 2 | | | Level 3 | | | Total | |
| Corporate Bonds | | $ | — | | | $ | 15,062,128 | | | $ | — | | | $ | 15,062,128 | |
| U.S Government & Agencies | | | — | | | | 36,304,799 | | | | — | | | | 36,304,799 | |
| Futures Contracts** | | | 1,621,813 | | | | — | | | | — | | | | 1,621,813 | |
| Index Options Purchased | | | 523,775 | | | | — | | | | — | | | | 523,775 | |
| Total | | $ | 2,145,588 | | | $ | 51,366,927 | | | $ | — | | | $ | 53,512,515 | |
The Fund did not hold any Level 3 securities during the year.
| * | Refer to the Schedule of Investments for portfolio composition. |
| ** | Represents the net unrealized appreciation (depreciation) of futures contracts. |
Impact of Derivatives on the Statement of Operations
The derivative instruments outstanding as of January 31, 2024 as disclosed in the Schedule of Investments and the amounts of realized and changes in unrealized gains and losses on derivative instruments during the year as disclosed in the Statement of Operations serve as indicators of the volume of derivative activity for the Fund.
The following is a summary of the location of derivative investments on the Fund’s Statement of Assets and Liabilities as of January 31, 2024:
| | | Asset Derivatives | |
| Contract Type/Primary Risk | | | | | |
| Exposure | | Balance Sheet Location | | Fair Value | |
| Futures Contracts - Equity Risk | | Unrealized appreciation on futures contracts | | $ | 1,621,813 | |
| Options Purchased - Equity Risk | | Investment securities; At fair value | | | 523,775 | |
| | | | | $ | 2,145,588 | |
| Regents Park Hedged Market Strategy ETF |
| NOTES TO FINANCIAL STATEMENTS (Continued) |
| January 31, 2024 |
The following is a summary of the location of derivative investments on the Fund’s Statement of Operations as of January 31, 2024:
| Derivative Investment Type | Location of Gain (Loss) on Derivatives |
| Futures Contracts | Net realized gain from futures contracts/Net change in unrealized appreciation on futures contracts |
| Options Purchased | Net realized gain from investments and options purchased/Net change in unrealized appreciation on investments and options purchased |
The following is a summary of the Fund’s realized gain and unrealized appreciation on derivative investments recognized in the Statement of Operations categorized by primary risk exposure for the year ended January 31, 2024:
| Realized gain on derivatives recognized in the Statement of Operations |
| | | | | | Total for the | |
| Derivative Investment Type | | Equity Risk | | | Year Ended January 31, 2024 | |
| Futures Contracts | | $ | 4,459,674 | | | $ | 4,459,674 | |
| Options Purchased | | | 31,788 | | | | 31,788 | |
| | | | | | | | | |
Net change in unrealized appreciation on derivatives recognized in the
Statement of Operations |
| | | | | | Total for the | |
| Derivative Investment Type | | Equity Risk | | | Year Ended January 31, 2024 | |
| Futures Contracts | | $ | 1,223,813 | | | $ | 1,223,813 | |
| Options Purchased | | | 33,667 | | | | 33,667 | |
Security Transactions and Related Income
Security transactions are accounted for on trade date basis. Interest income is recognized on an accrual basis. Discounts are accreted and premiums are amortized on securities purchased over the lives of the respective securities. Dividend income is recorded on the ex-dividend date. Realized gains or losses from sales of securities are determined by comparing the identified cost of the security lot sold with the net sales proceeds.
Dividends and Distributions to Shareholders
Ordinarily, dividends from net investment income, if any, are declared and paid annually by the Fund. The Fund distributes its net realized capital gains, if any, to shareholders annually. Dividends from net investment income and distributions from net realized gains are recorded on ex-dividend date and determined in accordance with federal income tax regulations, which may differ from GAAP. These “book/tax” differences are considered either temporary (i.e., deferred losses, capital loss carry forwards) or permanent in nature. To the extent these differences are permanent in nature, such amounts are reclassified within the composition of net assets based on their federal tax-basis treatment; temporary differences do not require reclassification.
| Regents Park Hedged Market Strategy ETF |
| NOTES TO FINANCIAL STATEMENTS (Continued) |
| January 31, 2024 |
Federal Income Taxes
The Fund intends to continue to comply with the requirements of the Internal Revenue Code applicable to regulated investment companies and to distribute all of its taxable income to its shareholders. Therefore, no provision for federal income tax is required. The Fund recognizes the tax benefits of uncertain tax positions only where the position is “more likely than not” to be sustained assuming examination by tax authorities. Management has analyzed the Fund’s tax positions and has concluded that no liability for unrecognized tax benefits should be recorded related to uncertain tax positions taken on returns filed for the open tax year ended 2023 or expected to be taken in the Fund’s January 31, 2024, year-end tax returns. The Fund identified its major tax jurisdictions as U.S. Federal, Ohio, and foreign jurisdictions where the Fund makes significant investments. The Fund is not aware of any tax positions for which it is reasonably possible that the total amounts of unrecognized tax benefits will change materially in the next twelve months.
Expenses
Expenses of the Trust that are directly identifiable to a specific fund are charged to that fund. Expenses, which are not readily identifiable to a specific fund, are allocated in such a manner as deemed equitable (as determined by the Board), taking into consideration the nature and type of expense and the relative sizes of the funds in the Trust.
Indemnification
The Trust indemnifies its officers and trustees for certain liabilities that may arise from the performance of their duties to the Fund and Trust. Additionally, in the normal course of business, the Fund enters into contracts that contain a variety of representations and warranties which provide general indemnities. The Fund’s maximum exposure under these arrangements is unknown, as this would involve future claims that may be made against the Fund that have not yet occurred. However, the Fund expects the risk of loss due to these warranties and indemnities to be remote.
| (3) | INVESTMENT TRANSACTIONS |
For the year ended January 31, 2024, cost of purchases and proceeds from sales of portfolio securities (excluding in-kind transactions and short-term investments) for the Fund amounted to $0 and $64,257,570, respectively. For the year ended January 31, 2024, cost of purchases and proceeds from sales of portfolio securities for in-kind transactions, amounted to $0 and $0, respectively.
| (4) | INVESTMENT ADVISORY AGREEMENT AND TRANSACTIONS WITH RELATED PARTIES |
Regents Park Funds, LLC serves as the Fund’s investment adviser (the “Adviser”). Pursuant to an Investment Advisory Agreement with the Fund, the Adviser, subject to the authority of the Board, is responsible for managing the day to day operations of the Fund, including: selecting the overall investment strategies; monitoring and evaluating Sub-Adviser (as defined below) performance; and providing related administrative services and facilities.
Anfield Group, LLC (“Anfield Group”), which is wholly owned by the David Young and Sandra G. Glain Family Trust, wholly owns the Adviser. As compensation for its services, the Fund pays to the Adviser a unitary management fee (computed daily and paid monthly) at an annual rate of 0.75% of its average daily net assets. The Adviser’s unitary management fee is designed to pay the Fund’s expenses and to compensate the Adviser for providing services for the Fund. Out of the unitary management fee, the Adviser pays substantially all expenses of the Fund, inclusive of fees and expenses of other investment companies in which the Fund may invest. The Fund, not the Adviser, pays the following expenses: all brokerage fees and commissions, taxes, borrowing costs (such as dividend expense on securities sold short and interest), and such extraordinary or nonrecurring expenses as may arise, including litigation to which the Fund may be a party and indemnification of the Board of
| Regents Park Hedged Market Strategy ETF |
| NOTES TO FINANCIAL STATEMENTS (Continued) |
| January 31, 2024 |
Trustees and officers with respect thereto. For the year that ended January 31, 2024, the Fund incurred advisory fees of $769,565.
Anfield Capital Management, LLC (“Anfield” or the “Sub-Adviser”) serves as sub-adviser to the Fund. Anfield Group owns a majority interest in Anfield. The Sub-Adviser is an affiliate of the Adviser. The Sub-Adviser is responsible for selecting investments and assuring that investments are made in accordance with the Fund’s investment objective, policies and restrictions. The Adviser compensates the Sub-Adviser for its services from the management fees received from the Fund, which are computed and accrued daily and paid monthly and do not impact the financial statements of the Fund. The Sub-Adviser has agreed to waive some or all of the sub-advisory fee payable to it from the Adviser to reimburse the Adviser in connection with the Adviser’s payment of the operating expenses of the Fund.
The Trust, with respect to the Fund, has adopted a distribution and service plan (“Plan”) pursuant to Rule 12b-1 under the 1940 Act. Under the Plan, the Fund is authorized to pay distribution fees to Northern Lights Distributors, LLC (the “Distributor” or “NLD”) and other firms that provide distribution and shareholder services (“Service Providers”). If a Service Provider provides these services, the Fund may pay fees at an annual rate not to exceed 0.25% of average daily net assets, pursuant to Rule 12b-1 under the 1940 Act.
No distribution or service fees are currently paid by the Fund and there are no current plans to impose these fees.
In the event Rule 12b-1 fees were charged, over time they would increase the cost of an investment in the Fund.
In addition, certain affiliates of the Distributor provide services to the Fund as follows:
Ultimus Fund Solutions, LLC (“Ultimus”) – Ultimus, an affiliate of the Distributor, provides administration and fund accounting services to the Fund. Pursuant to a separate servicing agreement with Ultimus, the Adviser pays Ultimus customary fees for providing administration and fund accounting services to the Fund. Certain officers of the Trust are also officers of Ultimus and are not paid any fees directly by the Adviser for serving in such capacities.
BluGiant, LLC (“BluGiant”), BluGiant, an affiliate of UFS and the Distributor, provides EDGAR conversion and filing services as well as print management services for the Fund on an ad-hoc basis. For the provision of these services, BluGiant receives customary fees from the Fund.
Northern Lights Compliance Services, LLC (“NLCS”) , an affiliate of UFS and the Distributor, provides a Chief Compliance Officer to the Trust, as well as related compliance services, pursuant to a consulting agreement between NLCS and the Trust. Under the terms of such agreement, NLCS receives customary fees from the Fund.
| (5) | DISTRIBUTIONS TO SHAREHOLDERS AND TAX COMPONENTS OF CAPITAL |
The Statement of Assets and Liabilities represents cost for financial reporting purposes. Aggregate cost for federal tax purposes is $51,918,268 for the Fund, and differs from market value by net unrealized appreciation (depreciation) which consisted of:
| Gross unrealized appreciation: | | $ | 556 | |
| Gross unrealized depreciation: | | | (116,222 | ) |
| Net unrealized depreciation: | | $ | (115,666 | ) |
| Regents Park Hedged Market Strategy ETF |
| NOTES TO FINANCIAL STATEMENTS (Continued) |
| January 31, 2024 |
The tax character of fund distributions paid for the period ended January 31, 2024 and January 31, 2023, was as follows:
| | | Fiscal Year Ended | | | Fiscal Year Ended | |
| | | January 31, 2024 | | | January 31, 2023 | |
| Ordinary Income | | $ | 3,198,250 | | | $ | 1,843,485 | |
| Long-Term Capital Gain | | | — | | | | — | |
| Return of Capital | | | — | | | | — | |
| | | $ | 3,198,250 | | | $ | 1,843,485 | |
As of January 31, 2024, the components of accumulated earnings/(deficit) on a tax basis were as follows:
| Undistributed | | | Undistributed | | | Post October Loss | | | Capital Loss | | | Other | | | Unrealized | | | Total | |
| Ordinary | | | Long-Term | | | and | | | Carry | | | Book/Tax | | | Appreciation/ | | | Distributable Earnings | |
| Income | | | Gains | | | Late Year Loss | | | Forwards | | | Differences | | | (Depreciation) | | | (Accumulated Deficits) | |
| $ | 38,598 | | | $ | — | | | $ | — | | | $ | (7,458,205 | ) | | $ | — | | | $ | (115,666 | ) | | $ | (7,535,273 | ) |
The difference between book basis and tax basis undistributed net investment income/(loss), accumulated net realized gain/(loss), and unrealized appreciation/(depreciation) from investments is primarily attributable to the tax deferral of losses on wash sales and adjustments for the mark-to-market on open Section 1256 futures and options contracts.
At January 31, 2024, the Fund had capital loss carry forwards for federal income tax purposes available to offset future capital gains, along with capital loss carryforwards utilized as follows:
| Short-Term | | | Long-Term | | | Total | | | CLCF Utilized | |
| $ | 3,130,423 | | | $ | 4,327,782 | | | $ | 7,458,205 | | | $ | 2,539,891 | |
| (6) | CAPITAL SHARE TRANSACTIONS |
Shares are not individually redeemable and may be redeemed by the Fund at NAV only in large blocks known as “Creation Units.” Shares are created and redeemed by the Fund only in Creation Unit size aggregations of 25,000 shares. Only Authorized Participants or transactions done through an Authorized Participant are permitted to purchase or redeem Creation Units from the Fund. An Authorized Participant is either (i) a broker-dealer or other participant in the clearing process through the Continuous Net Settlement System of the National Securities Clearing Corporation or (ii) a DTC participant and, in each case, must have executed a Participant Agreement with the Distributor. Such transactions are principally in exchange for a deposit of a specified cash payment, plus a transaction fee, but may also be permitted on an in-kind basis, with a balancing cash component to equate the transaction to the NAV per share of the Fund on the transaction date. In addition, the Fund may impose transaction fees on purchases and redemptions of Fund shares to cover the custodial and other costs incurred by the Funds in effecting trades. A fixed fee payable to the Custodian may be imposed on each creation and redemption transaction regardless of the number of Creation Units involved in the transaction (“Fixed Fee”). Purchases and redemptions of Creation Units for cash or involving cash-in-lieu are required to pay an additional variable charge to compensate the Fund and its ongoing shareholders for brokerage and market impact expenses
| Regents Park Hedged Market Strategy ETF |
| NOTES TO FINANCIAL STATEMENTS (Continued) |
| January 31, 2024 |
relating to Creation Unit transactions (“Variable Charge,” and together with the Fixed Fee, the “Transaction Fees”). Transactions in capital shares for the Fund are disclosed in the Statements of Changes in Net Assets.
The Transaction Fees for the Fund are listed in the table below:
| | Maximum Additional Variable Charge for |
| Fee for In-Kind and Cash Purchases | Cash Purchases* |
| $250 | 2.00% |
| * | The maximum Transaction Fee may be up to 2.00% of the amount invested. |
| (7) | PRINCIPAL INVESTMENT RISKS |
The Fund’s investments in securities, financial instruments and derivatives expose it to various risks, certain of which are discussed below. Please refer to the Fund’s prospectus and statement of additional information for further information regarding the risks associated with the Fund’s investments which include, but are not limited to: absence of an active market risk, calculation methodology risk, cash redemption risk, cash transactions risk, collateralized loan obligations risk, counterparty risk, cybersecurity risk, dependence on key personnel risk, derivatives risk, equity risk, ETF structure risks, failure to qualify as a regulated investment company risk, FLEX options risk, FLEX options valuation risk, fixed income securities risk, fluctuation of net asset value risk, gap risk, hedging transactions risk, index risk, investment companies and ETFs risk, leveraging risk, management risk, market capitalization risk, market risk, market events risk, new fund risk, operational risk, options risk, portfolio turnover risk, trading issues risk, underlying fund risk, U.S. government securities risk and volatility risk.
Derivatives Risk – The derivative instruments in which the Fund may invest may be more volatile than other instruments. and may be subject to unanticipated market movements, which are potentially unlimited. The risks associated with investments in derivatives also include leverage, liquidity, interest rate, market, counterparty, credit and management risks, mispricing or improper valuation. Derivative instruments may be more volatile than other instruments and may be subject to unanticipated market movements, which are potentially unlimited. Certain derivatives require the Fund to pledge cash or liquid securities as margin or collateral , a form of security deposit intended to protect against nonperformance of the derivative contract. The Fund may have to post additional margin or collateral if the value of the derivative position changes in a manner adverse to the Fund. Changes in the market value of a derivative may not correlate perfectly with the underlying asset, rate or index, and the Fund could lose more than the principal amount invested. In addition, if a derivative is being used for hedging purposes there can be no assurance given that each derivative position will achieve a perfect correlation with the security or currency against which it is being hedged, or that a particular derivative position will be available when sought by the portfolio manager.
Equity Risk – Equity securities are susceptible to general market fluctuations, volatile increases and decreases in value as market confidence in and perceptions of their issuers change and unexpected trading activity among retail investors. Factors that may influence the price of equity securities include developments affecting a specific company or industry, or changing economic, political or market conditions.
Flex Options Risk – Trading FLEX Options involves risks different from, or possibly greater than, the risks associated with investing directly in securities. The Fund may experience substantial downside from specific FLEX Option positions and certain FLEX Option positions may expire worthless. The FLEX Options are listed on an exchange; however, no one can guarantee that a liquid secondary trading market will exist for the FLEX Options. In the event that trading in the FLEX Options is limited or absent, the value of the Fund’s FLEX Options may decrease. In a less liquid market for the FLEX Options, liquidating the FLEX Options may require the payment of a premium (for written FLEX Options) or acceptance of a discounted price (for purchased FLEX Options) and may take longer to complete. A less liquid trading market may adversely impact the value of the FLEX Options and Fund shares and result in the Fund being unable to achieve its investment objective. A less liquid trading market may adversely
| Regents Park Hedged Market Strategy ETF |
| NOTES TO FINANCIAL STATEMENTS (Continued) |
| January 31, 2024 |
impact the value of the FLEX Options and the value of your investment. Transactions in FLEX Options are required to be centrally cleared. In a transaction involving FLEX Options, the Fund’s counterparty is the OCC, rather than a bank or broker. Although clearing members guarantee performance of their clients’ obligations to the OCC, there is a risk that the assets of the Fund might not be fully protected in the event of a clearing member’s bankruptcy, as the Fund would be limited to recovering only a pro rata share of all available funds segregated on behalf of the clearing member’s customers for the relevant account class. Additionally, the OCC may be unable or unwilling to perform its obligations under the FLEX Options contracts.
FLEX Options Valuation Risk – The FLEX Options held by the Fund will be exercisable at the strike price only on their expiration date. Prior to the expiration date, the value of the FLEX Options will be determined based upon market quotations or using other recognized pricing methods. The value of the FLEX Options does not increase or decrease at the same rate as the S&P 500 Index (although they generally move in the same direction) or its underlying securities and FLEX Option prices may be highly volatile and may fluctuate substantially during a short period of time. The value of the FLEX Options prior to the expiration date may vary because of factors other than the value of the S&P 500 Index, such as interest rate changes, changing supply and demand, decreased liquidity of the FLEX Options, a change in the actual and perceived volatility of the stock market and the S&P 500 Index and the remaining time to expiration. During periods of reduced market liquidity or in the absence of readily available market quotations for the holdings of the Fund, the ability of the Fund to value the FLEX Options becomes more difficult and there is a risk of mispricing or improper valuation of the FLEX Options which could impact the value paid for shares of the Fund.
Hedging Transactions Risk – The Sub-Adviser from time to time employs various hedging techniques. The success of the Fund’s hedging strategy will be subject to the Sub-Adviser’s ability to correctly assess the degree of correlation between the performance of the instruments used in the hedging strategy and the performance of the investments in the portfolio being hedged. Because the characteristics of many securities change as markets change or time passes, the success of the Fund’s hedging strategy will also be subject to the Sub-Adviser’s ability to continually recalculate, readjust, and execute hedges in an efficient and timely manner. For a variety of reasons, the Sub-Adviser may not seek to establish a perfect correlation between such hedging instruments and the portfolio holdings being hedged. Such imperfect correlation may prevent the Fund from achieving the intended hedge or expose the Fund to risk of loss. In addition, it is not possible to hedge fully or perfectly against any risk, and hedging entails its own costs.
Index Risk – The Fund’s investments are subject to the risks associated with changes to the S&P 500 Index. The Fund will be negatively affected by general declines in the securities and asset classes represented in the S&P 500 Index. Market disruptions and regulatory restrictions could have an adverse effect on the Fund’s ability to adjust its exposure to the S&P 500 Index. S&P Dow Jones Indices LLC (the “Index Provider”) relies on third party data it believes to be reliable in constructing the S&P 500 Index, but it does not guarantee the accuracy or availability of any such third party data, and there is also no guarantee with respect to the accuracy, availability or timeliness of the production of the S&P 500 Index. Because the Fund structures its investments in order to hedge the Fund’s portfolio against declines in the S&P 500 Index, the performance of the Fund and the S&P 500 Index will differ from each other. In addition, the Fund incurs operating expenses and portfolio transaction costs not incurred by the S&P 500 Index. These risks may be heightened during times of market volatility or other unusual market conditions.
Options Risk – The use of options involves investment strategies and risks different from those associated with ordinary portfolio securities transactions and depends on the ability of the Fund’s portfolio managers to forecast market movements correctly. The prices of options are volatile and are influenced by, among other things, actual and anticipated changes in the value of the underlying instrument, or in interest or currency exchange rates, including the anticipated volatility, which in turn are affected by fiscal and monetary policies and by national and international political and economic events. The effective use of options also depends on the Fund’s ability to terminate option positions at times deemed desirable to do so. There is no assurance that the Fund will be able to
| Regents Park Hedged Market Strategy ETF |
| NOTES TO FINANCIAL STATEMENTS (Continued) |
| January 31, 2024 |
effect closing transactions at any particular time or at an acceptable price. In addition, there may at times be an imperfect correlation between the movement in values of options and their underlying securities and there may at times not be a liquid secondary market for certain options.
Fixed Income Securities Risk – Fixed income securities are subject to interest rate risk, call risk, prepayment and extension risk, credit risk, duration, and liquidity risk. In addition, current market conditions may pose heightened risks for fixed income securities. When the Fund invests in fixed income securities or derivatives, the value of your investment in the Fund will fluctuate with changes in interest rates. Typically, a rise in interest rates causes a decline in the value of fixed income securities or derivatives owned by the Fund. Moreover, new regulations applicable to and changing business practices of financial intermediaries that make markets in fixed income securities have resulted in less market making activity for certain fixed income securities, which has reduced the liquidity and may increase the volatility for such fixed income securities. The fixed-income securities market can be susceptible to increases in volatility and decreases in liquidity. Liquidity may decline unpredictably in response to overall economic conditions or credit tightening. Longer-term securities may be more sensitive to interest rate changes.
Counterparty Risk – The stability and liquidity of many derivative transactions depends in large part on the creditworthiness of the parties to the transactions. If a counterparty to such a transaction defaults, exercising contractual rights may involve delays or costs for the Fund. Furthermore, there is a risk that a counterparty could become the subject of insolvency proceedings, and that the recovery of securities and other assets from such counterparty will be delayed or be of a value less than the value of the securities or assets originally entrusted to such counterparty. In a transaction involving cleared derivatives, the Fund’s counterparty is a clearing house, rather than a bank or broker. Since the Fund is not a member of clearing houses and only members of a clearing house (“clearing members”) can participate directly in the clearing house, the Fund will hold cleared derivatives through accounts at clearing members. In contrast to bilateral derivatives transactions, following a period of advance notice to the Fund, clearing members generally can require termination of existing cleared derivatives transactions at any time and increases in margin above the margin that it required at the beginning of a transaction. Clearing houses also have broad rights to increase margin requirements for existing transactions and to terminate transactions. Any such increase or termination could interfere with the ability of the Fund to pursue its investment strategy. Also, the Fund is subject to execution risk if it enters into a derivatives transaction that is required to be cleared (or that the Adviser expects to be cleared), and no clearing member is willing or able to clear the transaction on the Fund’s behalf. If the Fund is not able to enter into a particular derivatives transaction, the Fund’s investment performance and risk profile could be adversely affected as a result. The OCC acts as guarantor and central counterparty with respect to the FLEX Options. As a result, the ability of the Fund to meet its objective depends on the OCC being able to meet its obligations. In the unlikely event that the OCC becomes insolvent or is otherwise unable to meet its settlement obligations, the Fund could suffer significant losses.
Absence of an Active Market Risk – The Fund faces numerous market trading risks, including the potential lack of an active market for Fund shares due to a limited number of market markers or authorized participants. The Fund may rely on a small number of third-party market makers to provide a market for the purchase and sale of shares and market makers are under no obligation to make a market in the Fund’s shares. Additionally, only a limited number of institutions act as authorized participants for the Fund and only an authorized participant may engage in creation or redemption transactions directly with the Fund and are not obligated to submit purchase or redemption orders for Creation Units. Decisions by market makers or authorized participants to reduce their role or step away from these activities in times of market stress could inhibit the effectiveness of the arbitrage process in maintaining the relationship between the underlying values of the Fund’s portfolio securities and the Fund’s market price.
Investment Companies and ETFs Risks – When the Fund invests in other investment companies, (including open-end mutual funds or ETFs) (“underlying Funds”), it will bear additional expenses based on its pro rata share of the other investment company’s operating expenses, including management fees of the unaffiliated funds in addition to those paid by the Fund. The risk of owning an investment company generally reflects the risks of owning the
| Regents Park Hedged Market Strategy ETF |
| NOTES TO FINANCIAL STATEMENTS (Continued) |
| January 31, 2024 |
underlying investments held by the investment company. The Fund may also incur brokerage costs when it purchases and sells shares of investment companies. An ETF’s shares could trade at a significant premium or discount to its net asset value (NAV). The Fund may invest in in inverse ETFs, which may result in increased volatility and will magnify the Fund’s losses or gains. During periods of market volatility, inverse ETFs may not perform as expected.
ETF Structure Risks – The Fund is structured as an ETF and as a result is subject to special risks. Shares are not individually redeemable and may be redeemed by the Fund at NAV only in large blocks known as “Creation Units.” Trading in shares on the CBOE BZX Exchange, Inc. (the “Exchange”) may be halted due to market conditions or for reasons that, in the view of the Exchange, make trading in Shares inadvisable, such as extraordinary market volatility. There can be no assurance that Shares will continue to meet the listing requirements of the Exchange. An active trading market for the Fund’s shares may not be developed or maintained. If the Fund’s shares are traded outside a collateralized settlement system, the number of financial institutions that can act as authorized participants that can post collateral on an agency basis is limited, which may limit the market for the Fund’s shares. The market prices of Shares will fluctuate in response to changes in NAV and supply and demand for Shares and will include a “bid-ask spread” charged by the exchange specialists, market makers or other participants that trade the particular security. There may be times when the market price and the NAV vary significantly particularly during times of market stress, with the result that investors may pay significantly more or significantly less for Fund shares than the Fund’s NAV, which is reflected in the bid and ask price for Fund shares or in the closing price. If a shareholder purchases shares at a time when the market price is at a premium to the NAV or sells shares at a time when the market price is at a discount to NAV, the shareholder may sustain losses if the shares are sold at a price that is less than the price paid by the shareholder for the shares. When all or a portion of an ETFs underlying securities trade in a market that is closed when the market for the Fund’s shares is open, there may be changes from the last quote of the closed market and the quote from the Fund’s domestic trading day, which could lead to differences between the market value of the Fund’s shares and the Fund’s NAV. In stressed market conditions, the market for the Fund’s shares may become less liquid in response to the deteriorating liquidity of the Fund’s portfolio. This adverse effect on the liquidity of the Fund’s shares may, in turn, lead to differences between the market value of the Fund’s shares and the Fund’s NAV.
Market Risk – Overall market risk may affect the value of individual instruments in which the Fund invests. The Fund is subject to the risk that the securities markets will move down, sometimes rapidly and unpredictably, based on overall economic conditions and other factors, which may negatively affect the Fund’s performance. Factors such as domestic and foreign (non-U.S.) economic growth and market conditions, real or perceived adverse economic or political conditions, military conflict, acts of terrorism, social unrest, natural disasters, recessions, inflation, changes in interest rate levels, supply chain disruptions, sanctions, the spread of infectious illness or other public health threats, lack of liquidity in the bond or other markets, volatility in the equities or other securities markets, adverse investor sentiment affect the securities markets and political events affect the securities markets. U.S. and foreign stock markets have experienced periods of substantial price volatility in the past and may do so again in the future. Securities markets also may experience long periods of decline in value. A change in financial condition or other event affecting a single issuer or market may adversely impact securities markets as a whole. Rates of inflation have recently risen. The value of assets or income from an investment may be worth less in the future as inflation decreases the value of money. As inflation increases, the real value of the Fund’s assets can decline as can the value of the Fund’s distributions. When the value of the Fund’s investments goes down, your investment in the Fund decreases in value and you could lose money.
Local, state, regional, national or global events such as war, acts of terrorism, the spread of infectious illness or other public health issues, recessions, or other events could have a significant impact on the Fund and its investments and could result in decreases to the Fund’s net asset value. Political, geopolitical, natural and other events, including war, terrorism, trade disputes, government shutdowns, market closures, natural and environmental disasters, epidemics, pandemics and other public health crises and related events and governments’ reactions to such events have led, and in the future may lead, to economic uncertainty, decreased economic activity, increased market volatility and other disruptive effects on U.S. and global economies and markets. Such
| Regents Park Hedged Market Strategy ETF |
| NOTES TO FINANCIAL STATEMENTS (Continued) |
| January 31, 2024 |
events may have significant adverse direct or indirect effects on the Fund and its investments. For example, a widespread health crisis such as a global pandemic could cause substantial market volatility, exchange trading suspensions and closures, impact the ability to complete redemptions, and affect Fund performance. A health crisis may exacerbate other pre-existing political, social and economic risks. In addition, the increasing interconnectedness of markets around the world may result in many markets being affected by events or conditions in a single country or region or events affecting a single or small number of issuers.
U.S. Government Securities Risk – Treasury obligations may differ in their interest rates, maturities, times of issuance and other characteristics. Obligations of U.S. Government agencies and authorities are supported by varying degrees of credit but generally are not backed by the full faith and credit of the U.S. Government. No assurance can be given that the U.S. Government will provide financial support to its agencies and authorities if it is not obligated by law to do so. In addition, the value of U.S. Government securities may be affected by changes in the credit rating of the U.S. Government.
| (8) | RECENT REGULATORY UPDATES |
On January 24, 2023, the SEC adopted rule and form amendments to require mutual funds and ETFs to transmit concise and visually engaging streamlined annual and semiannual reports to shareholders that highlight key information. Other information, including financial statements, will not appear in a streamlined shareholder report but must be available online, delivered free of charge upon request, and filed on a semiannual basis on Form N-CSR. The rule and form amendments have a compliance date of July 24, 2024. At this time, management is evaluating the impact of these amendments on the shareholder reports for the Fund.
Subsequent events after the Statement of Assets and Liabilities date have been evaluated through the date the financial statements were issued. Management has determined that no events or transactions occurred requiring adjustment or disclosure in the financial statements.
REPORT OF INDEPENDENT REGISTERED PUBLIC ACCOUNTING FIRM
To the Board of Trustees of Two Roads Shared Trust and the Shareholders of Regents Park Hedged Market Strategy ETF:
Opinion on the Financial Statements and Financial Highlights
We have audited the accompanying statement of assets and liabilities, including the schedule of investments, of Regents Park Hedged Market Strategy ETF (the “Fund”), one of the funds constituting the Two Roads Shared Trust, as of January 31, 2024, the related statement of operations for the year then ended, and the statement of changes in net assets and financial highlights for the year then ended and for the period from March 30, 2022 (commencement of operations) through January 31, 2023, and the related notes. In our opinion, the financial statements and financial highlights present fairly, in all material respects, the financial position of the Fund as of January 31, 2024, and the results of its operations for the year then ended, the changes in its net assets and the financial highlights for the year then ended and for the period from March 30, 2022 (commencement of operations) through January 31, 2023 in conformity with accounting principles generally accepted in the United States of America.
Basis for Opinion
These financial statements and financial highlights are the responsibility of the Fund’s management. Our responsibility is to express an opinion on the Fund’s financial statements and financial highlights based on our audit. We are a public accounting firm registered with the Public Company Accounting Oversight Board (United States) (PCAOB) and are required to be independent with respect to the Fund in accordance with the U.S. federal securities laws and the applicable rules and regulations of the Securities and Exchange Commission and the PCAOB.
We conducted our audit in accordance with the standards of the PCAOB. Those standards require that we plan and perform the audit to obtain reasonable assurance about whether the financial statements and financial highlights are free of material misstatement, whether due to error or fraud. The Fund is not required to have, nor were we engaged to perform, an audit of its internal control over financial reporting. As part of our audit we are required to obtain an understanding of internal control over financial reporting but not for the purpose of expressing an opinion on the effectiveness of the Fund’s internal control over financial reporting. Accordingly, we express no such opinion.
Our audit included performing procedures to assess the risks of material misstatement of the financial statements and financial highlights, whether due to error or fraud, and performing procedures that respond to those risks. Such procedures included examining, on a test basis, evidence regarding the amounts and disclosures in the financial statements and financial highlights. Our audit also included evaluating the accounting principles used and significant estimates made by management, as well as evaluating the overall presentation of the financial statements and financial highlights. Our procedures included confirmation of securities owned as of January 31, 2024, by correspondence with the custodian and brokers. We believe that our audit provides a reasonable basis for our opinion.
Deloitte & Touche LLP
Costa Mesa, California
March 27, 2024
We have served as the auditor of one or more Regents Park Funds, LLC investment companies since 2022.
| Regents Park Hedged Market Strategy ETF |
| EXPENSE EXAMPLES (Unaudited) |
| January 31, 2024 |
As a shareholder of the Fund, you incur two types of costs: (1) transaction costs for purchasing and selling shares, including brokerage commissions on purchases and sales of Fund shares (which are not reflected in the example below) and (2) ongoing costs, including management fees and other fund expenses. This example is intended to help you understand your ongoing costs (in dollars) of investing in the Fund and to compare these costs with the ongoing costs of investing in other mutual funds.
The Example is based on an investment of $1,000 invested at the beginning of the period and held for the entire period from August 1, 2023, to January 31, 2024 (the ’‘period’’).
Actual Expenses
The first line of the table below provides information about actual account values and actual expenses. You may use the information in this line, together with the amount you invested, to estimate the expenses that you paid over the period. Simply divide your account value by $1,000 (for example, an $8,600 account value divided by $1,000 = 8.6), then multiply the result by the number in the first line under the heading entitled ’‘Expenses Paid During the Period’’ to estimate the expenses you paid on your account during this period.
Hypothetical Example for Comparison Purposes
The second line of the table below provides information about hypothetical account values and hypothetical expenses based on the Fund’s actual expense ratio and an assumed rate of return of 5% per year before expenses, which is not the Fund’s actual return. The hypothetical account values and expenses may not be used to estimate the actual ending account balance or expenses you paid for the period. You may use this information to compare the ongoing costs of investing in the Fund and other funds. To do so, compare this 5% hypothetical example with the 5% hypothetical examples that appear in the shareholder reports of the other funds. Please note that the expenses shown in the table are meant to highlight your ongoing costs only and do not reflect any transactional costs, such as brokerage commissions on purchases or sales of Fund shares. Therefore, the second line of the table is useful in comparing ongoing costs only and will not help you determine the relative total costs of owning different funds. In addition, if these transactional costs were included, your costs would have been higher.
| | Beginning | Ending | Expenses Paid | Expense Ratio During |
| | Account Value | Account Value | During Period | the Period |
| Actual | 8/1/23 | 1/31/24 | 8/1/23–1/31/24* | 8/1/23 – 1/31/24 |
| | $1,000.00 | $1,043.20 | $4.09 | 0.79% |
| | | | | |
| | Beginning | Ending | Expenses Paid | Expense Ratio During |
| Hypothetical | Account Value | Account Value | During Period | the Period |
| (5% return before expenses) | 8/1/23 | 1/31/24 | 8/1/23 – 1/31/24* | 8/1/23 – 1/31/24 |
| | $1,000.00 | $1,021.20 | $4.04 | 0.79% |
| * | Expenses are equal to the average account value over the period, multiplied by the annualized expense ratio, multiplied by the number of days in the period (184) divided by the number in the fiscal year (365). |
| Regents Park Hedged Market Strategy ETF |
| SUPPLEMENTAL INFORMATION (Unaudited) |
| January 31, 2024 |
Trustees and Officers. The Trustees and officers of the Trust, together with information as to their principal business occupations during the past five years and other information, are shown below. Unless otherwise noted, the address of each Trustee and Officer is 225 Pictoria Drive, Suite 450, Cincinnati, OH 45246.
Independent Trustees *
Name, Address,
Year of Birth | Position(s)
Held with
Registrant | Term and
Length
Served | Principal Occupation(s)
During Past 5 Years | Number of
Portfolios
Overseen In
The Fund
Complex** | Other Directorships
Held During Past 5
Years |
Mark Garbin
Year of Birth: 1951 | Trustee | Indefinite, Since 2012 | Managing Principal, Coherent Capital Management LLC (since 2008), Independent Director, OCHEE LP (2021-present) | 11 | Northern Lights Fund Trust (since 2013); Northern Lights Variable Trust (since 2013); Forethought Variable Insurance Trust (since 2013); iDirect Private Markets Fund (since 2014); Carlyle Tactical Private Credit Fund (since March 2018); OHA CLO Enhanced Equity II Genpar LLP (since 2021) and Carlyle Credit Income Fund (since September 2023) |
Mark D. Gersten
Year of Birth: 1950 | Chairman, Trustee | Indefinite, Since 2012 | Independent Consultant (since 2012); Senior Vice President – Global Fund Administration Mutual Funds & Alternative Funds, AllianceBernstein LP (1985 – 2011) | 11 | Northern Lights Fund Trust (since 2013); Northern Lights Variable Trust (since 2013); iDirect Private Markets Fund (since 2014); previously, Ramius Archview Credit and Distressed Fund (2015-2017); and Schroder Global Series Trust (2012 to 2017) |
Neil M. Kaufman
Year of Birth: 1960 | Trustee, Audit Committee Chairman | Indefinite, Since 2012 | Managing Member, Kaufman McGowan PLLC (legal services)(Since 2016) | 11 | iDirectPrivate Markets Fund (since 2014) |
Anita K. Krug
Year of Birth: 1969 | Trustee | Indefinite, Since 2012 | Dean and Professor (since 2019) of Chicago-Kent College of Law, Illinois Institute of Technology; Interim Vice Chancellor for Academic Affairs (2018-2019) University of Washington Bothell; Interim Dean (2017-2018), Professor (2016-2019), Associate Professor (2014-2016); and Assistant Professor (2010-2014), University of Washington School of Law | 11 | iDirect Private Markets Fund (since 2014); Centerstone Investors Trust (2016-2021) |
| * | Information as of January 31, 2024. |
| ** | As of January 31, 2024, the Trust was comprised of 30 active portfolios managed by nine unaffiliated investment advisers and two affiliated investment advisers. The term “Fund Complex” applies only to those funds that (i) are advised by a common investment adviser or by an investment adviser that is an affiliated person of the investment adviser of any of the other funds in the Trust or (ii) hold themselves out to investors as related companies for purposes of investment and investor services. The Fund does not share the same investment adviser with any other series of the Trust or hold itself out as related to any other series of the Trust for investment purposes except for Anfield Diversified Alternatives ETF, Anfield Dynamic Fixed Income ETF, Anfield U.S. Equity Sector ETF, and Anfield Universal Fixed Income ETF, each of which are advised by Regents and sub-advised by the Fund’s Sub-Adviser; Anfield Universal Fixed Income Fund, which is advised by the Fund’s Sub-Adviser; Affinity World Leaders Equity ETF, Foundations Dynamic Core ETF, Foundations Dynamic Growth ETF, Foundations Dynamic Income ETF, and Foundations Dynamic Value ETF which is advised by Regents. |
1/31/24 – Two Roads v1
| Regents Park Hedged Market Strategy ETF |
| SUPPLEMENTAL INFORMATION (Unaudited)(Continued) |
| January 31, 2024 |
Officers of the Trust*
Name, Address,
Year of Birth | Position(s)
Held with
Registrant | Principal Occupation(s) During
Past 5 Years | Number of
Portfolios
Overseen In
The Fund
Complex** | Other Directorships
Held During Past 5
Years |
James Colantino
Year of Birth: 1969 | President Since Feb. 2017 Treasurer (2012 to 2017) | Senior Vice President (2012-present); Vice President (2004 to 2012); Ultimus Fund Solutions LLC | N/A | N/A |
Laura Szalyga
Year of Birth: 1978 | Treasurer Since Feb. 2017 | Vice President, Ultimus Fund Solutions LLC (since 2015); Assistant Vice President, Ultimus Fund Solutions LLC (2011-2014) | N/A | N/A |
Timothy Burdick
Year of Birth: 1986 | Vice President Since Aug. 2022 Secretary Since Aug. 2022 | Vice President and Managing Counsel, Ultimus Fund Solutions, LLC (2022 – present); Assistant Vice President and Counsel, Ultimus Fund Solutions, LLC (2019 – 2022); Senior Program Compliance Manager, CJ Affiliate (2016 –2019). | N/A | N/A |
William B. Kimme
Year of Birth: 1962 | Chief Compliance Officer Since Inception | Senior Compliance Officer, Northern Lights Compliance Services, LLC (September 2011 - present) | N/A | N/A |
| * | Information is as of January 31, 2024. |
| ** | As of January 31, 2024, the Trust was comprised of 30 active portfolios managed by nine unaffiliated investment advisers and two affiliated investment advisers. The term “Fund Complex” applies only to those funds that (i) are advised by a common investment adviser or by an investment adviser that is an affiliated person of the investment adviser of any of the other funds in the Trust or (ii) hold themselves out to investors as related companies for purposes of investment and investor services. The Fund does not share the same investment adviser with any other series of the Trust or hold itself out as related to any other series of the Trust for investment purposes except for Anfield Diversified Alternatives ETF, Anfield Dynamic Fixed Income ETF, Anfield U.S. Equity Sector ETF, and Anfield Universal Fixed Income ETF, each of which are advised by Regents and sub-advised by the Fund’s Sub-Adviser; Anfield Universal Fixed Income Fund, which is advised by the Fund’s Sub-Adviser; Affinity World Leaders Equity ETF, Foundations Dynamic Core ETF, Foundations Dynamic Growth ETF, Foundations Dynamic Income ETF, and Foundations Dynamic Value ETF which is advised by Regents. |
The Fund’s Statement of Additional Information (“SAI”) includes additional information about the Trustees and is available free of charge, upon request, by calling toll-free at 1-866-866-4848.
1/31/24 – Two Roads v1
PRIVACY NOTICE
| FACTS | WHAT DOES TWO ROADS SHARED TRUST DO WITH YOUR PERSONAL INFORMATION |
| | |
| Why? | Financial companies choose how they share your personal information. |
| | |
| | Federal law gives consumers the right to limit some but not all sharing. |
| | Federal law also requires us to tell you how we collect, share, and protect your personal information.
Please read this notice carefully to understand what we do. |
| | |
| What? | THE TYPES OF PERSONAL INFORMATION WE COLLECT AND SHARE DEPENDS ON THE PRODUCT OR SERVICE THAT YOU HAVE WITH US. THIS INFORMATION CAN INCLUDE: |
| | |
| | ● Social Security number and income |
| | |
| | ● Account transactions and transaction history |
| | |
| | ● Investment experience and purchase history |
| | |
| | When you are no longer our customer, we continue to share your information as described in this notice. |
| | |
| How? | All financial companies need to share customers’ personal information to run their everyday business. In the section below, we list the reasons financial companies can share their customers’ personal information; the reason Two Roads Shared Trust chooses to share and whether you can limit this sharing. |
| Reasons we can share your personal information | Does Two Roads
Shared Trust share? | Can you limit
this sharing? |
| For our everyday business purposes – | | |
| such as to process your transactions, maintain your account(s), respond to court orders and legal investigations, or report to credit bureaus | YES | NO |
| For our marketing purposes – | NO | We do not share |
| to offer our products and services to you | | |
| For joint marketing with other financial companies | NO | We do not share |
| For our affiliates’ everyday business purposes – | NO | We do not share |
| information about your transactions and experiences | | |
| For our affiliates’ everyday business purposes – | NO | We do not share |
| information about your creditworthiness | | |
| For our affiliates to market to you | NO | We do not share |
| For nonaffiliates to market to you | NO | We do not share |
| Questions? | Call 1-631-490-4300 |
What we do
How does Two Roads Shared Trust
protect my personal information? | To protect your personal information from unauthorized access and use, we use security measures that comply with federal law.
These measures include computer safeguards and secured files and buildings. |
| | |
| | Our service providers are held accountable for adhering to strict policies and procedures to prevent any misuse of your nonpublic personal information. |
| How does Two Roads Shared Trust | We collect your personal information, for example, when you |
| collect my personal information? | |
| | ● open an account or give us contact information |
| | |
| | ● provide account information or give us your income information |
| | |
| | ● make deposits or withdrawals from your account |
| | |
| | We also collect your personal information from other companies. |
| Why can’t I limit all sharing? | Federal law gives you the right to limit only |
| | |
| | ● sharing for affiliates’ everyday business purposes – information about your creditworthiness |
| | |
| | ● affiliates from using your information to market to you |
| | |
| | ● sharing for nonaffiliates to market to you |
| | |
| | State laws and individual companies may give you additional rights to limit sharing |
| | |
| Definitions | |
| Affiliates | Companies related by common ownership or control. They can be financial and nonfinancial companies. |
| | |
| | ● Two Roads Shared Trust has no affiliates. |
| Nonaffiliates | Companies not related by common ownership or control. They can be financial and nonfinancial companies. |
| | |
| | ● Two Roads Shared Trust does not share with nonaffiliates so they can market to you. |
| Joint marketing | A formal agreement between nonaffiliates financial companies that together market financial products or services to you. |
| | |
| | ● Two Roads Shared Trust does not jointly market. |
Proxy Voting Policy
Information regarding how the Fund votes proxies relating to portfolio securities for the twelve month period ended June 30th as well as a description of the policies and procedures that the Fund used to determine how to vote proxies is available without charge, upon request, by calling 1-866-866-4848 or by referring to the Securities and Exchange Commission’s (“SEC”) website at http://www.sec.gov.
Portfolio Holdings
The Fund files a complete schedule of portfolio holdings with the Securities and Exchange Commission (the “SEC”) for the first and third quarters of each fiscal year as an exhibit to its reports on Form N-PORT, within sixty days after the end of the period. Form N-PORT reports are available at the SEC’s website at http://www.sec.gov. The information on Form N-PORT is available without charge, upon request, by calling 1-866-866-4848.
Adviser
Regents Park Funds, LLC
4041 MacArthur Blvd., Suite 155
Newport Beach, CA 92660
Administrator
Ultimus Fund Solutions, LLC
225 Pictoria Drive, Suite 450
Cincinnati, OH 45246
This report and the financial statements contained herein are submitted for the general information of shareholders and are not authorized for distribution to prospective investors unless preceded or accompanied by an effective prospectus. Nothing contained herein is to be considered an offer of sale or solicitation of an offer to buy shares of the Fund. Such an offering is made only by a prospectus, which contains information about the Fund’s investment objective, risks, fees and expenses. Investors are reminded to read the prospectus carefully before investing in the Fund.
RGTPK-AR24
(b) Not applicable
Item 2. Code of Ethics.
(a) The registrant has, as of the end of the period covered by this report, adopted a code of ethics that applies to the registrant's principal executive officer, principal financial officer, and principal accounting officer or controller, or persons performing similar functions, regardless of whether these individuals are employed by the registrant or a third party.
(c) During the period covered by this report, there were no amendments to any provision of the code of ethics.
(d) During the period covered by this report, there were no waivers or implicit waivers of a provision of the code of ethics.
(f) A copy of the code of ethics is attached as an exhibit.
Item 3. Audit Committee Financial Expert.
| | (a)(1) The registrant’s board of trustees has determined that Mark Gersten and Neil M. Kaufman are audit committee financial experts, as defined in Item 3 of Form N-CSR. (a)(2) Mr. Gersten and Mr. Kaufman are independent for purposes of this Item. (a)(3) Not applicable. |
Item 4. Principal Accountant Fees and Services.
Trust Series
Regents Park Hedged Market Strategy ETF
(a) Audit Fees. The aggregate fees billed for each of the last two fiscal years for professional services rendered by the registrant's principal accountant for the audit of the registrant's annual financial statements or services that are normally provided by the accountant in connection with statutory and regulatory filings or engagements for those fiscal years are as follows:
Trust Series
Regents Park Hedged Market Strategy ETF 2024 2023
$17,850 $17,000
(c) Tax Fees. The aggregate fees billed in each of the last two fiscal years for professional services rendered by the principal accountant for tax compliance, tax advice and tax planning are as follows:
Trust Series 2024 2023
Regents Park Hedged Market Strategy ETF $4,310 $4,100
Preparation of Federal & State income tax returns, assistance with calculation of required income, capital gain and excise distributions and preparation of Federal excise tax returns.
(d) All Other Fees – All Other Fees – The aggregate fees billed in each of the last two fiscal years for products and services provided by the registrant’s principal accountant, other than the services reported in paragraphs (a) through (c) of this item were $0 for the fiscal year ended January 31, 2024.
(e)(1) The audit committee does not have pre-approval policies and procedures. Instead, the audit committee or audit committee chairman approves on a case-by-case basis each audit or non-audit service before the principal accountant is engaged by the registrant.
(e)(2) There were no services described in each of paragraphs (b) through (d) of this Item that were approved by the audit committee pursuant to paragraph (c)(7)(i)(C) of Rule 2-01 of Regulation S-X.
f) Not applicable. The percentage of hours expended on the principal accountant's engagement to audit the registrant's financial statements for the most recent fiscal year that were attributed to work performed by persons other than the principal accountant's full-time, permanent employees was zero percent (0%).
(g) All non-audit fees billed by the registrant's principal accountant for services rendered to the registrant for the last two fiscal years ended January 31, 2024 and January 31, 2023 respectively are disclosed in (b)-(d) above. There were no audit or non-audit services performed by the registrant's principal accountant for the registrant's investment adviser.
(h) Not applicable.
(i) Not applicable
(j) Not applicable
Item 5. Audit Committee of Listed Registrants.
The registrant is an issuer as defined in Rule 10A-3 under the Securities Exchange Act of 1934, as amended (the “Exchange Act”) and has a separately-designated standing audit committee established in accordance with Section 3(a)(58)A of the Exchange Act. The registrant’s audit committee members are Mark Garbin, Mark Gersten, Neil M. Kaufman and Anita K. Krug.
Item 6. Investments. Schedule of investments in securities of unaffiliated issuers is included as part of the report to shareholders filed under Item 1 of the Form.
Item 7. Disclosure of Proxy Voting Policies and Procedures for Closed-End Management Investment Companies. Not applicable to open-end management investment companies.
Item 8. Portfolio Managers of Closed-End Management Investment Companies. Not applicable to open-end management investment companies.
Item 9. Purchases of Equity Securities by Closed-End Management Investment Companies and Affiliated Purchasers. Not applicable to open-end management investment companies.
Item 10. Submission of Matters to a Vote of Security Holders. None
Item 11. Controls and Procedures.
(a) The registrant's principal executive and principal financial officers, or persons performing similar functions, have concluded that the registrant's disclosure controls and procedures (as defined in Rule 30a-3(c) under the 1940 Act), are effective, as of a date within 90 days of filing date of this report, based on the evaluation of these controls and procedures required by Rule 30a-3(b) under the 1940 Act and Rules 13a-15(b) or Rule 15d-15(b) under the Securities Exchange Act of 1934, as amended.
(b) There were no changes in the Registrant’s internal control over financial reporting (as defined in Rule 30a-3(d) under the 1940 Act) that occurred during the period covered by this report that have materially affected, or are reasonably likely to materially affect, the registrant’s internal control over financial reporting.
Item 12. Disclosure of Securities Lending Activities for Closed-End Management Investment Companies. Not applicable to open-end investment companies.
Item 13. Exhibits.
(a)(1) Code of Ethics for Principal Executive and Senior Financial Officers is attached hereto.
(a)(2) Certifications required by Section 302 of the Sarbanes-Oxley Act of 2002 (and Item 13(a)(2) of Form N-CSR) are filed herewith.
(a)(3) Not applicable.
(a)(4) Not applicable
(b) Certifications required by Section 906 of the Sarbanes-Oxley Act of 2002 (and Item 13(b) of Form N-CSR) are filed herewith.
SIGNATURES
Pursuant to the requirements of the Securities Exchange Act of 1934 and the Investment Company Act of 1940, the registrant has duly caused this report to be signed on its behalf by the undersigned, thereunto duly authorized.
(Registrant) Two Roads Shared Trust
By (Signature and Title)
/s/ James Colantino
James Colantino, Principal Executive Officer/President
Date 4/1/2024
Pursuant to the requirements of the Securities Exchange Act of 1934 and the Investment Company Act of 1940, this report has been signed below by the following persons on behalf of the registrant and in the capacities and on the dates indicated.
By (Signature and Title)
/s/ James Colantino
James Colantino, Principal Executive Officer/President
Date 4/1/2024
By (Signature and Title)
/s/ Laura Szalyga
Laura Szalyga, Principal Financial Officer/Treasurer
Date 4/1/2024