UNITED STATES
SECURITIES AND EXCHANGE COMMISSION
Washington, D.C. 20549
FORM N-CSR
CERTIFIED SHAREHOLDER REPORT OF REGISTERED
MANAGEMENT INVESTMENT COMPANIES
Investment Company Act file number 811-22725
Priority Income Fund, Inc.
(Exact name of registrant as specified in charter)
10 East 40th Street, 42nd Floor
New York, NY 10016
(Address of principal executive offices)
M. Grier Eliasek
Chief Executive Officer
Priority Income Fund, Inc.
10 East 40th Street, 42nd Floor
New York, NY 10016
(Name and address of agent for service)
Registrant’s telephone number, including area code: (212) 448-0702
Date of fiscal year end: June 30
Date of reporting period: December 31, 2022
Item 1. Reports to Stockholders.
The semi-annual report to stockholders pursuant to Rule 30e-1 under the Investment Company Act of 1940, as amended, for the six months ended December 31, 2022 is filed herewith.
Semi-Annual Report
December 31, 2022
priorityincomefund.com
Priority Income Fund, Inc. (the “Company”) is an externally managed, non-diversified, closed-end investment management company registered under the Investment Company Act of 1940, as amended. The Company has elected to be treated for tax purposes as a regulated investment company under Subchapter M of the Internal Revenue Code of 1986, as amended.
INVESTMENT OBJECTIVE
The Company’s investment objective is to generate current income and, as a secondary objective, long-term capital appreciation. We expect to seek to achieve our investment objective by investing, under normal circumstances, at least 80% of our total assets in senior secured loans made to companies whose debt is rated below investment grade or, in limited circumstances, unrated, which we collectively refer to as “Senior Secured Loans,” with an emphasis on current income. Our investments may take the form of the purchase of Senior Secured Loans (either in the primary or secondary markets) or through investments in the equity and junior debt tranches of collateralized loan obligation (“CLO”) vehicles that in turn own pools of Senior Secured Loans. The Company intends to invest in both the primary and secondary markets.
TABLE OF CONTENTS
| | | | | |
| Page |
| |
| |
| |
| |
| Index to Financial Statements | |
| |
| |
| |
| |
| |
| |
| |
| |
| |
| |
| |
2023 SEMI-ANNUAL REPORT
PRIORITY INCOME FUND, INC. 4
Letter to Stockholders
Dear Stockholders,
We are pleased to present this semi-annual report of Priority Income Fund, Inc. (“we,” “us,” “our,” the “Company”, the “Fund” or “Priority”) for the six months ended December 31, 2022. Priority has provided its stockholders cash distributions each month for over eight years, and Priority recently increased its quarterly bonus distributions to stockholders for the ninth time since August 2020.
Priority paid to our stockholders a dividend yield for the period ended December 31, 2022 of 11.1%, based on the “Class R Shares” offering price of $12.13 at December 31, 2022, 11.8% based on the “Class RIA Shares” offering price of $11.40 at December 31, 2022 and 11.9% based on the “Class I Shares” offering price of $11.31 at December 31, 2022.
Priority Update
In this semi-annual report, we refer to “Senior Secured Loans” collectively as senior secured loans made primarily to U.S. companies whose debt is rated below investment grade or, in some circumstances, unrated.
Federal Reserve rate hikes in response to inflation pressures helped to drive a dynamic calendar year 2022. In a rising rate environment, one would expect floating rate assets to retain significant value in comparison with fixed rate assets, with such expectation proving out. While few risk assets demonstrated complete safe haven qualities in 2022, interest rate sensitive investments such as the S&P 500 and HYG, a high yield bond ETF, returned -18.1% and -11.0% respectively, while the Morningstar LSTA US Leveraged Loan TR Index of senior secured floating rate loans significantly outperformed, declining only 0.6% in 2022 by comparison.
Priority benefited from loan asset outperformance given that floating rate loans comprise the bulk of the underlying assets in Priority’s CLO positions. The Fund’s shareholder distributions more than offset declines in NAV between December 31, 2021 and December 31, 2022 to end the calendar year with a positive total return of 0.95% based on starting net asset value per share and assuming reinvestment of all shareholder distributions.
We believe Priority outperformed multiple broader markets, including the S&P 500, in 2022 due to a combination of the aforementioned loan asset outperformance as well as certain proactive strategies, including:
–An increased focus on CLO equity positions characterized by lower spread portfolios and more years remaining until the end of their reinvestment period.
–Opportunistic buying of CLO debt tranches rated at inception as ‘BB’ investments by rating agencies including S&P, Moody’s, and Fitch, with a weighted average discount from par of over 13% and an underwritten internal rate of return of 13.9% to maturity.
–Prudent risk management with a reduction in Fund level leverage during the year.
Market volatility in 2022 allowed Priority to achieve equity like returns in CLO debt tranches, increasing the Fund’s resistance to defaults while also creating an opportunity to build NAV given our purchases of these debt investments were made at levels significantly below par. We anticipate continuing to grow our CLO debt book should the discounted opportunity persist.
We actively invested throughout the calendar year:
–Since the end of our June 2022 fiscal year, Priority invested in 6 CLO equity investments totaling $18.9 million in cost basis and 18 CLO debt investments totaling $44.3 million in cost basis.
–For full calendar year 2022, Priority invested in (i) 28 CLO equity investments totaling $146.1 million in cost basis and (ii) 19 CLO debt investments totaling $44.3 million in cost basis.
Furthermore, despite challenging capital market conditions in calendar year 2022, Priority closed on two financing transactions:
2023 SEMI-ANNUAL REPORT
PRIORITY INCOME FUND, INC. 5
–In February 2022, we issued our Series L (NYSE: PRIF PRL) preferred, resulting in gross proceeds of $27.5 million and representing our twelfth issuance of preferred stock, each issuance with a difference maturity date, over the prior four years. We utilized the net proceeds from the offering of PRIF PRL to acquire investments in accordance with our investment objective and strategies and for general working capital purposes.
–In September 2022, we closed on a $40 million senior secured revolving credit facility with a new lender, refinancing our previously existing $35 million facility. The Fund has an accordion feature to increase the facility size to $75 million if mutually agreed by the Fund and facility provider. In addition to increasing the Fund’s access to financing, the facility enhances the fund’s financial flexibility with a longer maturity and a lower drawn and undrawn interest rate.
We increased Fund liquidity through our new revolving credit facility, increased cash balances, and reduced leverage to position Priority to capitalize on opportunities during a potentially volatile calendar year 2023.
CLO Market Commentary
The Russia/Ukraine war, inflationary pressures, and the corresponding Fed response introduced volatility which began in Q1 and persisted throughout 2022. Despite such volatility, market CLO issuance in 2022 remained robust with $129.3 billion issued1, even though such issuance was below the record level of $187.1 billion1 in 2021. CLOs represented 69%1 of the buyer base in the institutional Senior Secured Loan market for full year 2022, highlighting the importance of the CLO market.
Secondary CLO trading exhibited volatility during 2022, with CLO BB debt trading in a 16-point range, from a high index price of 97.56 on January 21, 2022 to a trough index price of 81.59 on October 13, 20222, even though such assets pay floating rate interest that increased dramatically throughout the year. Other parts of CLO capital structures exhibited heightened price and spread volatility as well2.
We believe the widening of CLO liabilities contributed to a decline in CLO refinance and reset activity in 2022 after a fast paced 2021. A CLO refinancing is an occurrence where all or part of the CLO liabilities are refinanced at a lower spread without a change in CLO maturity. A CLO reset is an occurrence where all of the CLO liabilities are refinanced and the CLO reinvestment period is extended typically by two to five years.
We expect in 2023 CLO primary activity will likely be stressed by continued volatility but remain robust by historical standards. CLO research analysts are projecting 2023 CLO issuance to decline modestly from 2022 levels:
–Barclays: $117 billion3
–Bank of America Merrill Lynch: $90 billion4
–Citigroup: $120 billion5
–JP Morgan: $120 billion6
–Morgan Stanley: $100 billion7
–Nomura: $90 billion8
Looking ahead to 2023, we expect the macroeconomic picture to remain uncertain, with defaults likely increasing from historically low levels. While that may put some pressure on the loan and CLO markets, we also anticipate such factors to present enhanced opportunities for Priority to invest at discounted prices.
In addition, we believe that long-term fundamentals for the investments held by Priority remain attractive: (1) Priority continued to increase its number of investments with 203 investments as of December 31, 2022 (the highest count achieved to date), (2) Priority’s portfolio trailing twelve month (“TTM”) default rate as of December 31, 2022 stood at 0.76%, and (3) we believe CLO managers are able to capitalize on loan price volatility to increase portfolio spreads and buy loans at discounted prices.
Dividend Policy
To qualify for U.S federal income tax treatment as a regulated investment company, the Company is required to pay out distributions as determined in accordance with federal income tax regulations. In certain periods, we expect the income distributable pursuant to these regulations, which we refer to as distributable income, to be higher or lower than our reportable accounting income. In addition to net investment income, our dividend policy considers in part our estimate of our distributable income, which includes (1) interest income from our underlying collateralized loan obligation (“CLO”) debt and equity investments, (2) recognition of certain mark-to-market gains or losses to the extent that the fair market value of our CLO investments is determined to deviate from its adjusted tax basis, and (3) acceleration of unamortized fees and expenses
2023 SEMI-ANNUAL REPORT
PRIORITY INCOME FUND, INC. 6
following the refinancing or reset of a CLO’s liabilities. As a result, distributable income may differ from accounting income, as expressed by net investment income. Our distributions may exceed our earnings, and portions of the distributions that we make may therefore be a return of the money that you originally invested and represent a return of capital to you for tax purposes.
M. Grier Eliasek
Chairman and Chief Executive Officer
The Senior Secured Loans in which we invest are made primarily to U.S. companies whose debt is rated below investment grade or, in some circumstances, unrated. These investments, which are often referred to as “junk” or “high yield,” have predominantly speculative characteristics with respect to the issuer’s capacity to pay interest and repay principal. They may also be difficult to value and illiquid.
This letter may contain certain forward-looking statements within the meaning of the Private Securities Litigation Reform Act of 1995, including statements regarding the future performance of Priority Income Fund, Inc. Words such as “believes,” “expects,” and “future” or similar expressions are intended to identify forward-looking statements. Any such statements, other than statements of historical fact, are highly likely to be affected by the global impact of the spread of COVID-19 or unknowable future events and conditions, including elements of the future that are or are not under the control of Priority Income Fund, Inc., and that Priority Income Fund, Inc. may or may not have considered. Accordingly, such statements cannot be guarantees or assurances of any aspect of future performance and involve a number of risks and uncertainties, including the impact of COVID-19 and related changes in base interest rates and significant market volatility on our business, our industry, and the global economy. Actual developments and results may vary materially from any forward-looking statements. Such statements speak only as of the time when made. Priority Income Fund, Inc. undertakes no obligation to publicly update or revise any forward-looking statements, whether as a result of new information, future events or otherwise. Any performance information quoted above represents past performance. We caution investors that the past performance described above is not indicative of and does not guarantee future returns. The investment return and principal value of an investment will fluctuate so that an investor's shares, when sold, may be worth more or less than their original cost. Current performance information may be different than the performance data presented above. Index and asset class performance quoted above does not reflect the fees, expenses or taxes that a stockholder may incur. The results described above may not be representative of our portfolio.
1 Morningstar / Pitchbook / LCD
2 Palmer Square BB Price Index
3 Barclays – Global CLOs, Light at the end of 1H
4 BofA Global Research – 2023 Year Ahead Outlook - CLO
5 Citigroup – Global CLO Market 2023 Outlook - CLO
6 J.P. Morgan – CLO 2023 Outlook
7 Morgan Stanley – 2023 Global Securitized Product Outlook
8 Nomura – 2023 CLO Outlook
2023 SEMI-ANNUAL REPORT
PRIORITY INCOME FUND, INC. 7
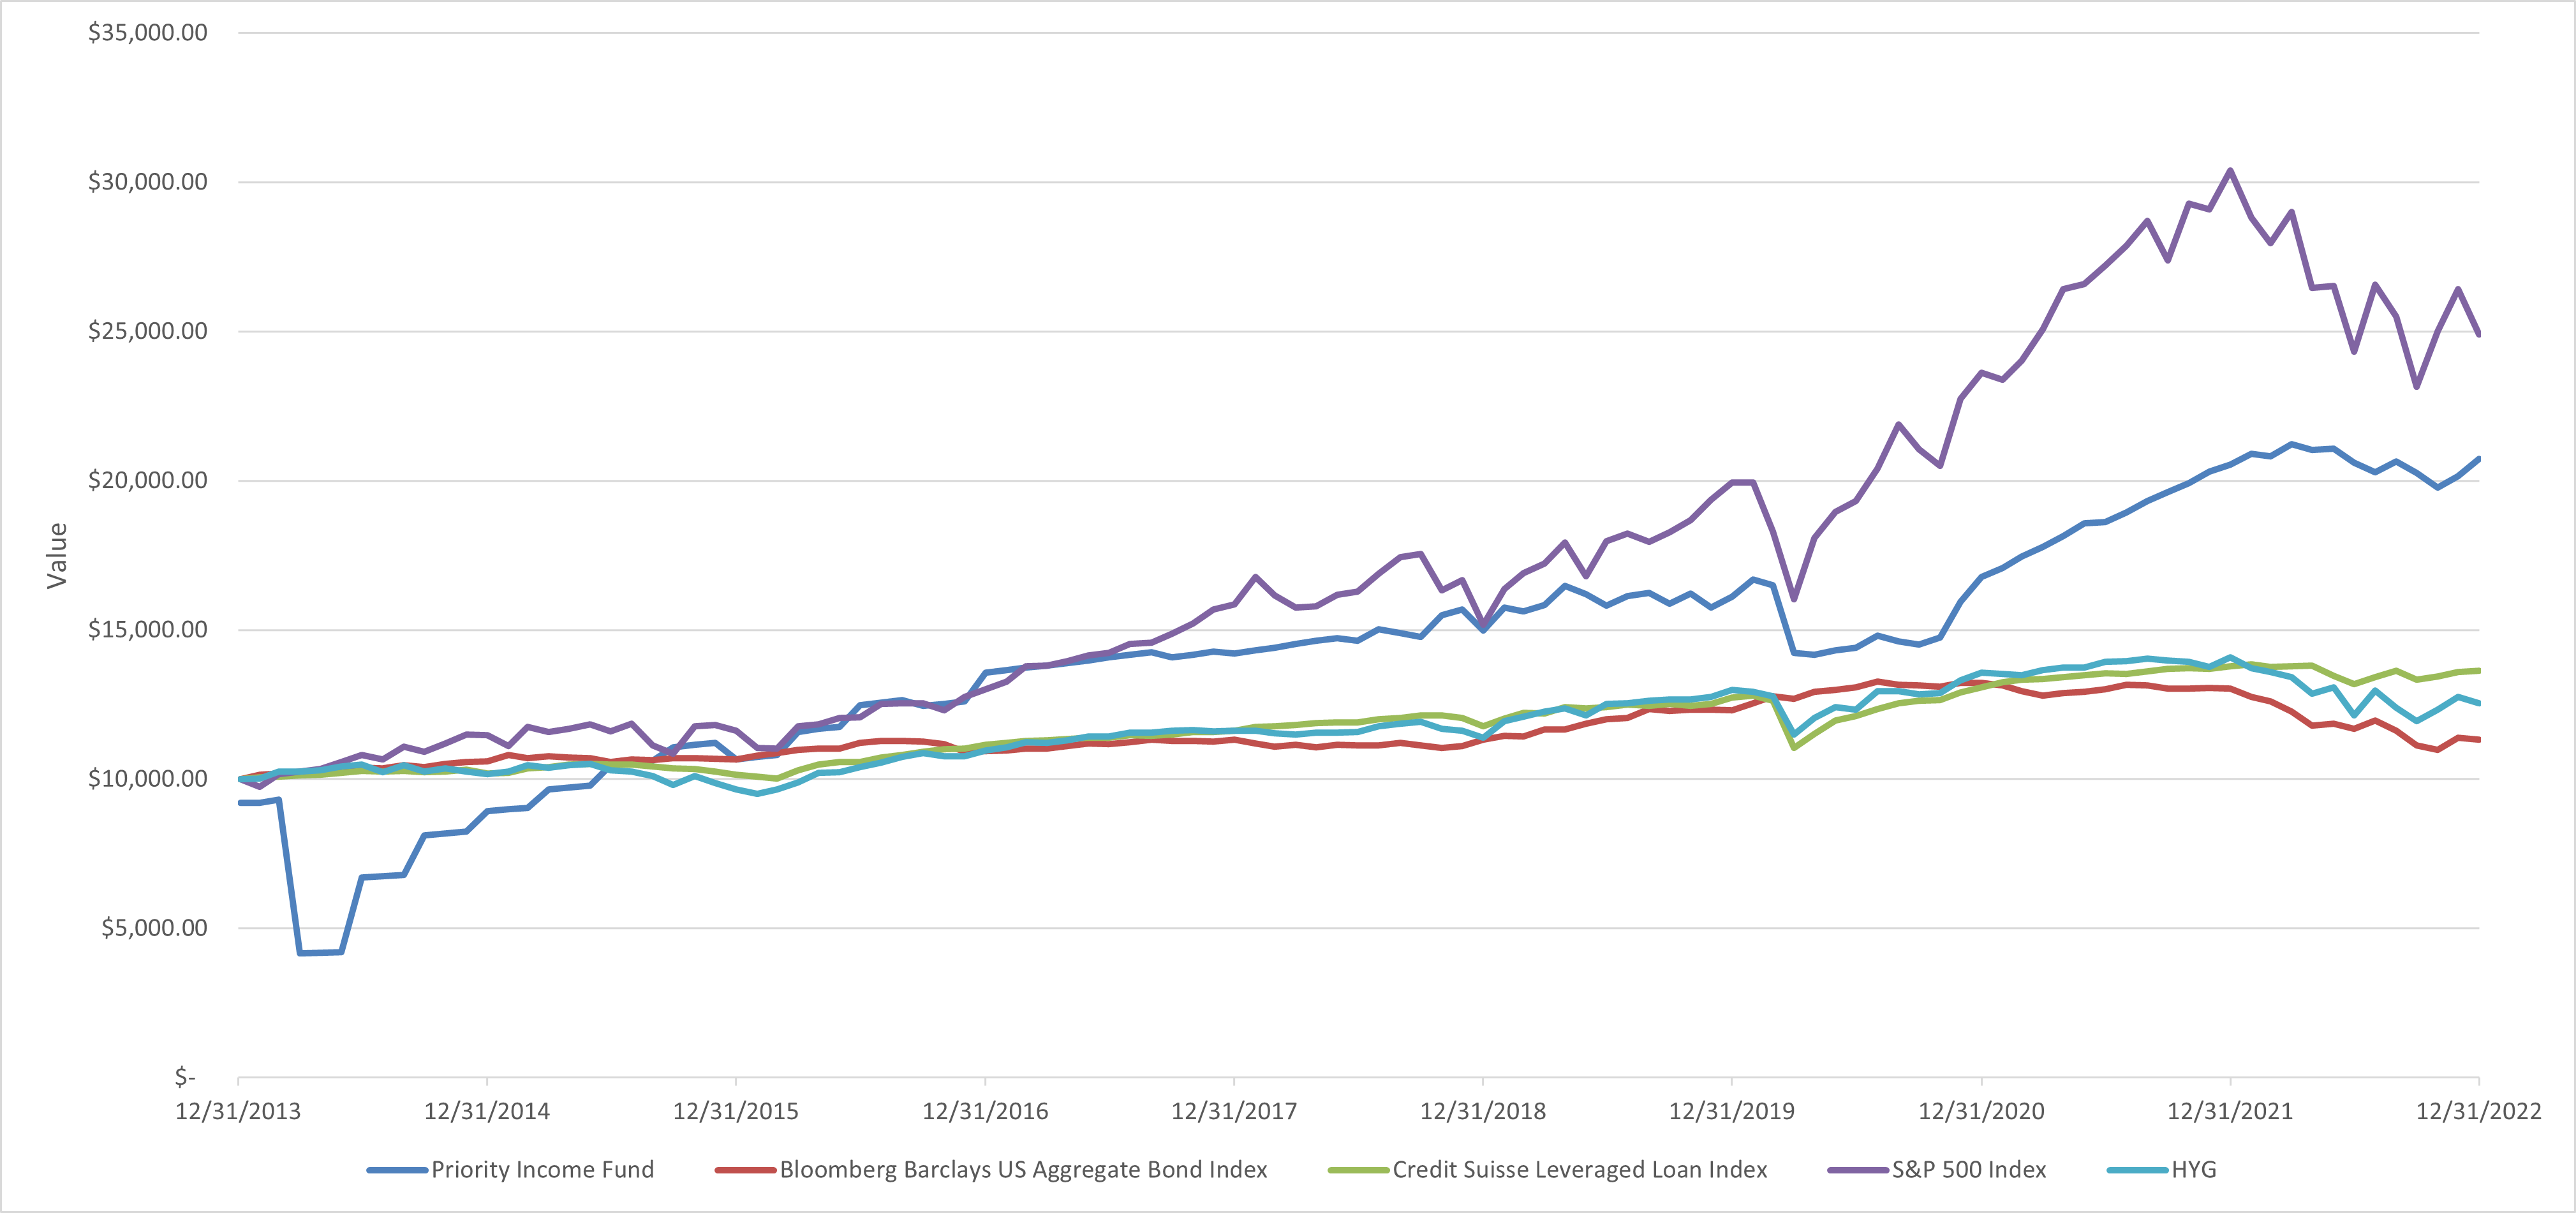
Comparison of change in value of a $10,000 investment in Priority Income Fund with a hypothetical investment of $10,000 in the Bloomberg Barclays US Aggregate Bond Index, Credit Suisse Leveraged Loan Index, and S&P 500® Index.
Past performance is not predictive of future performance. Current and future results may be lower or higher than those shown. The results shown are before taxes on fund distributions and sale of fund shares.
The above graph compares a hypothetical $10,000 investment made in Priority Income Fund on 1/6/14 (inception date) to a hypothetical investment of $10,000 made in the Bloomberg Barclays US Aggregate Bond Index, Credit Suisse Leverage Loan Index, and S&P 500® Index on that date. All dividends and capital gain distributions are reinvested.
The fund’s performance shown in the line graph above takes into account the maximum initial sales charge on Class R shares. The Bloomberg Barclays US Aggregate Bond Index is a broad-based flagship benchmark that measures the investment grade, US dollar-denominated, fixed-rate taxable bond market. The index includes Treasuries, government-related and corporate securities, MBS (agency fixed-rate pass-throughs), ABS and CMBS (agency and non-agency). The Credit Suisse Leveraged Loan Index tracks the investable market of the U.S. dollar denominated leveraged loan market. It consists of issues rated “5B” or lower, meaning that the highest rated issues included in this index are Moody’s/S&P ratings of Baa1/BB+ or Ba1/BBB+. All loans are funded term loans with a tenor of at least one year and are made by issuers domiciled in developed countries. The S&P 500® Index is widely regarded as the best single gauge of large-cap U.S. equities. The Index includes 500 leading companies and captures approximately 80% coverage of available market capitalization. Investors cannot invest directly in any index. These factors can contribute to the indices potentially outperforming the Fund. Further information relating to fund performance is contained in the Financial Highlights section of the Fund’s prospectus and elsewhere in this report.
2023 SEMI-ANNUAL REPORT
PRIORITY INCOME FUND, INC. 8
| | | | | | | | | | | | | | | | | | | | | | | | | | | | | |
| Average Annual Total Returns as of December 31, 2022 | |
| | Inception Date | | 1 Year | | 5 Year | | From Inception | |
| Priority Income Fund, Inc. | | | | | | | | | |
| with maximum sales charge | | 1/3/2014 | | (6.16) | % | | 4.63 | % | | 8.44 | % | |
without sales charge(1) | | 1/3/2014 | | 0.63 | % | | 6.39 | % | | 9.45 | % | |
| | | | | | | | | |
| Bloomberg Barclays US Aggregate Bond Index | | 1/3/2014 | | (13.02) | % | | 0.02 | % | | 1.40 | % | * |
| Credit Suisse Leveraged Loan Index | | 1/3/2014 | | (1.06) | % | | 3.24 | % | | 3.52 | % | * |
| S&P 500 Index | | 1/3/2014 | | (18.10) | % | | 9.43 | % | | 10.67 | % | * |
| | | | | | | | | |
*Index date is based on the inception date of the fund.
(1)Calculated based off of the net offing price.
The performance data quoted represents past performance, which is no guarantee of future results. Share price and investment return fluctuate and an investor’s shares may be worth more or less than original cost upon sale or repurchase. Current performance may be lower or higher than the performance quoted. Go to www.priorityincomefund.com for the Fund’s most recent return information. The fund’s performance shown in the graphs and table does not reflect the deduction of taxes that a shareholder would pay on fund distributions or the redemption of fund shares. In addition to the performance of Class R shares shown with and without a maximum sales charge, the fund’s performance shown in the table takes into account all other applicable fees and expenses.
2023 SEMI-ANNUAL REPORT
PRIORITY INCOME FUND, INC. 9
| | | | | | | | | | | | | | | | | | | | | | | | | | |
| Portfolio Composition - At a Glance |
| | | | | | | | |
| Top Ten Holdings | | | | | | | | |
| As of December 31, 2022 | | | | | | | | |
| | | | | | | | |
| Portfolio Investment | | Investment | | Legal Maturity | | Fair Value | | % of Net Assets |
| Cedar Funding IV CLO, Ltd. | | Subordinated Notes | | 7/23/2030 | | $ | 19,430,882 | | | 3.4 | % |
| Voya CLO 2022-1, Ltd. | | Subordinated Notes | | 4/20/2035 | | $ | 14,883,194 | | | 2.6 | % |
| CIFC Funding 2017-IV, Ltd. | | Subordinated Notes | | 10/24/2030 | | $ | 14,781,551 | | | 2.6 | % |
| Voya CLO 2018-1, Ltd. | | Subordinated Notes | | 4/18/2031 | | $ | 14,265,793 | | | 2.5 | % |
| Neuberger Berman CLO XVI-S, Ltd. | | Subordinated Notes | | 4/17/2034 | | $ | 13,694,206 | | | 2.4 | % |
| Madison Park Funding XIV, Ltd. | | Subordinated Notes | | 10/22/2030 | | $ | 13,515,907 | | | 2.4 | % |
| Columbia Cent CLO 29 Limited | | Subordinated Notes | | 10/20/2034 | | $ | 13,375,426 | | | 2.3 | % |
| Cedar Funding XI CLO, Ltd. | | Subordinated Notes | | 6/1/2032 | | $ | 13,199,285 | | | 2.3 | % |
| Voya CLO 2019-1, Ltd. | | Subordinated Notes | | 4/15/2031 | | $ | 12,857,995 | | | 2.2 | % |
| Sound Point CLO XVII, Ltd. | | Subordinated Notes | | 10/20/2030 | | $ | 11,972,684 | | | 2.1 | % |
Portfolio Composition
| | | | | |
| Number of Loans Underlying the Company’s CLO Investments | 2,014 | |
| Dollar Amount of Loans Underlying the Company’s CLO Investments | $87.9 billion |
| Percentage of Collateral Underlying the Company’s CLO Investments that are in Default | 0.52 | % |
| Last Twelve Months Default Rate of Collateral Underlying the Company’s CLO Investments | 0.76 | % |
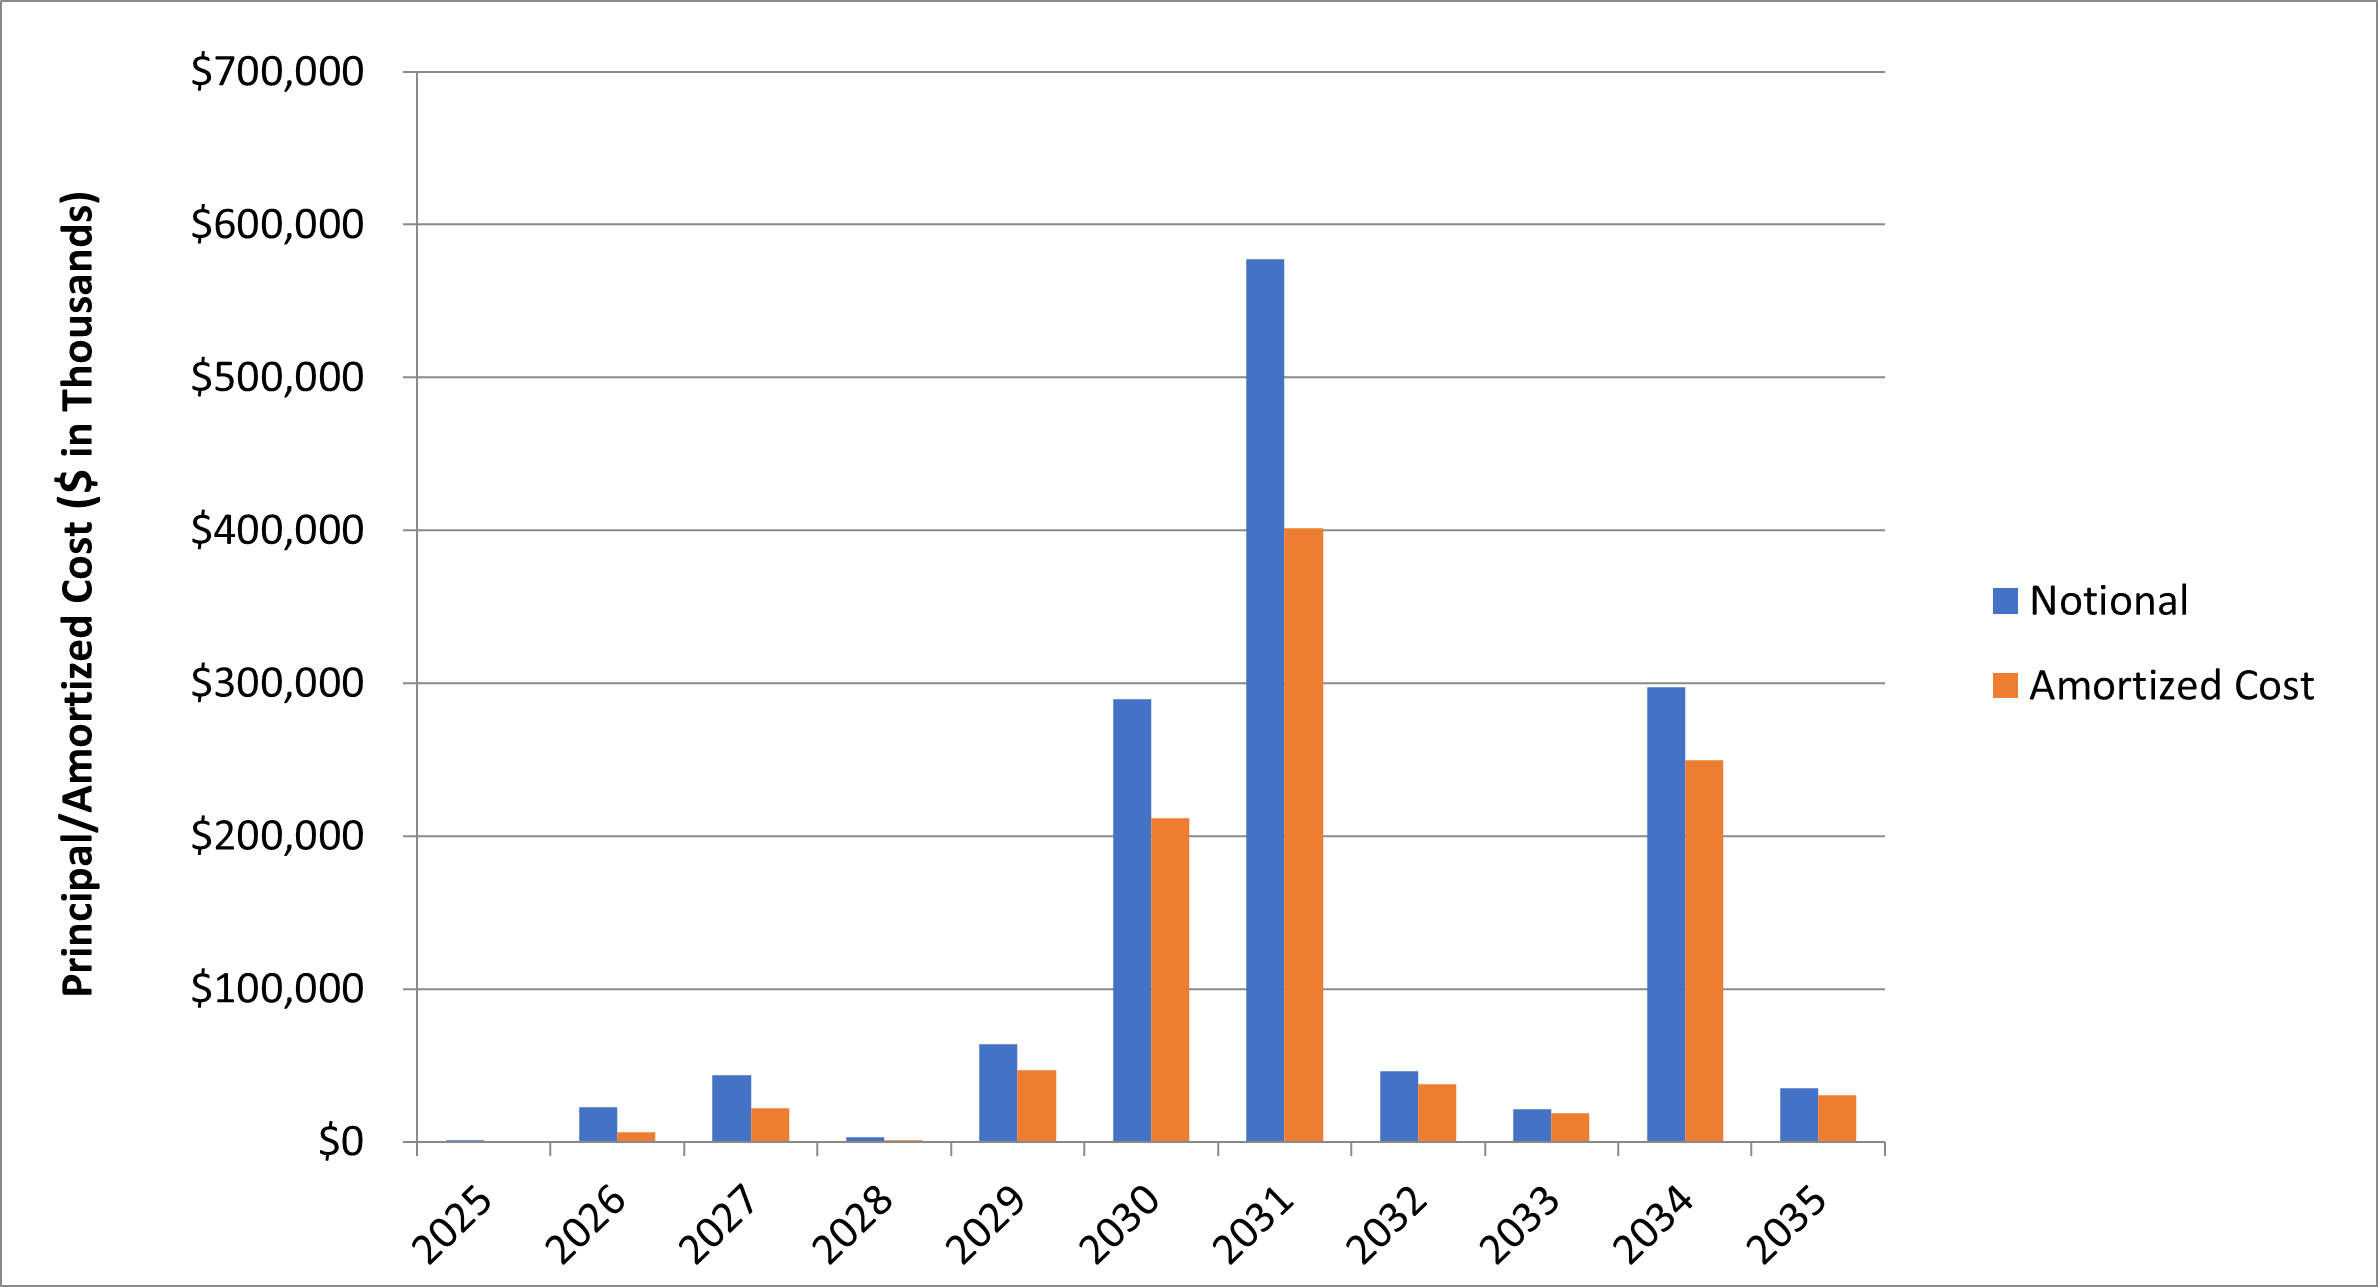
Legal Maturity of Portfolio Securities
2023 SEMI-ANNUAL REPORT
PRIORITY INCOME FUND, INC. 10
Collateral Summary
| | | | | |
| Number of loans underlying the Company’s CLO investments | 2,014 |
| Largest exposure to any individual borrower | 0.90 | % |
| Average individual borrower exposure | 0.06 | % |
| Aggregate exposure to 10 largest borrowers | 5.79 | % |
| Aggregate exposure to senior secured loans | 100 | % |
| Weighted average stated spread | 3.50 | % |
| Weighted average LIBOR floor | 0.70 | % |
| Weighted average percentage of floating rate loans with LIBOR floors | 57.38 | % |
| Weighted average credit rating of underlying collateral based on average Moody’s rating | B1/B2 |
| Weighted average maturity of underlying collateral | 4.3 years |
| U.S. dollar currency exposure | 100 | % |
| | | | | | | | | | | | | | | | | | | | | | | | | | |
Underlying Secured Loan Rating Distribution (Moody’s / S&P)(1) |
| Quarter-End | Aaa/AAA | Aa/AA | A/A | Baa/BBB | Ba/BB | B/B | Caa/CCC and Lower | Unrated |
| December 31, 2022 | 0.00% / 0.00% | 0.00% / 0.00% | 0.07% / 0.01% | 1.92% / 1.25% | 24.95% / 21.39% | 66.69% / 69.84% | 5.07% / 5.17% | 0.51% / 1.56% |
(1)Excludes structured product assets and newly issued transactions for which collateral data is not yet available. |
|
| Cash is included within the denominator of the above calculations, but is not rated by Moody’s/S&P. |
2023 SEMI-ANNUAL REPORT
PRIORITY INCOME FUND, INC. 11
| | | | | | | | | | | | | | | | | | | | |
| Statement of Assets and Liabilities |
| As of December 31, 2022 |
| | | | | | |
| Assets | |
| Investments, at fair value (amortized cost $1,031,257,369) | $ | 877,370,288 | |
| Cash | 16,170,837 | |
| Restricted cash | 282,114 | |
| Interest receivable | 3,548,001 | |
| Receivable for capital shares sold | 2,977,178 | |
| Deferred common stock offering costs (Note 5) | 609,863 | |
| Deferred financing costs on Revolving Credit Facility (Note 11) | 381,076 | |
| Due from affiliate (Note 5) | 293,757 | |
| Prepaid expenses | 152,785 | |
| | | | Total assets | 901,785,899 | |
| | | | | | |
| Liabilities | |
| Mandatorily redeemable Term Preferred Stock; ($0.01 par value; 50,000,000 shares authorized; 1,094,065 Series D Term Preferred Stock outstanding with net offering costs of $427,127 and unamortized discount of $616,612; 1,233,428 Series F Term Preferred Stock outstanding with net offering costs of $118,562 and unamortized discount of $647,848; 1,472,000 Series G Term Preferred Stock outstanding with net offering costs of $204,548 and unamortized discount of $814,501; 1,196,000 Series H Term Preferred Stock outstanding with net offering costs of $221,602 and unamortized discount of $695,419; 1,600,000 Series I Term Preferred Stock outstanding with net offering costs of $204,141 and unamortized discount of $1,029,691; 1,580,000 Series J Term Preferred Stock outstanding with net offering costs of $230,083 and unamortized discount of $1,048,873; 1,100,000 Series L Term Preferred Stock outstanding with net offering costs of $279,352 and unamortized discount of $781,241) (Note 7) | 224,567,725 | |
| Notes payable (less unamortized discount and debt issuance costs of $1,118,523) (Note 12) | 28,881,477 | |
| Revolving Credit Facility (Note 11) | 11,800,000 | |
| Due to Adviser (Note 5) | 11,779,700 | |
| Dividends payable | 8,710,666 | |
| Accrued expenses | 1,246,566 | |
| Due to Administrator (Note 5) | 1,143,823 | |
| Due to affiliate (Note 5) | 348,198 | |
| Interest payable | 17,313 | |
| | | | Total liabilities | 288,495,468 | |
| Cumulative Preferred Stock, par value $0.01 per share (50,000,000 shares authorized; 1,600,000 Series K Cumulative Preferred Stock outstanding as of December 31, 2022) (Note 7) | 38,434,574 | |
| Commitments and contingencies (Note 10) | |
| Net Assets Applicable to Common Shares | $ | 574,855,857 | |
| |
| Components of net assets: | |
| Common stock, $0.01 par value; 150,000,000 shares authorized; 50,490,629 shares issued and | |
| outstanding (Note 4) | $ | 504,906 | |
| Paid-in capital in excess of par (Note 4) | 581,867,766 | |
| Total distributable earnings (Note 8) | (7,516,815) | |
| Net Assets Applicable to Common Shares | $ | 574,855,857 | |
| | | | | | |
| Net asset value per Common Share | $ | 11.39 | |
| See accompanying notes to financial statements. |
2023 SEMI-ANNUAL REPORT
PRIORITY INCOME FUND, INC. 12
| | | | | | | | | | | | | | | | | | | | |
| Statement of Operations |
| For the six months ended December 31, 2022 |
| |
| Investment income | |
| Interest income from investments | $ | 93,902,190 | |
| | | | Total investment income | 93,902,190 | |
| Expenses | |
| Incentive fee (Note 5) | 13,798,309 | |
| Base management fee (Note 5) | 8,898,017 | |
| Total investment advisory fees | 22,696,326 | |
| |
| Preferred dividend expense | 7,913,634 | |
| Interest expense and credit facility expense | 1,642,541 | |
| Administrator costs (Note 5) | 1,628,837 | |
| Transfer agent fees and expenses | 955,312 | |
| Adviser shared service expense (Note 5) | 717,362 | |
| Valuation services | 700,172 | |
| Amortization of common stock offering costs (Note 5) | 476,719 | |
| Report and notice to shareholders | 357,276 | |
| Audit and tax expense | 341,200 | |
| Insurance expense | 135,207 | |
| Director fees | 112,500 | |
| General and administrative | 103,153 | |
| Legal expense | 5,435 | |
| Total expenses | 37,785,674 | |
| Net investment income | 56,116,516 | |
| Net realized and net change in unrealized gain (loss) on investments | |
| Net realized gain on investments | 173,067 | |
| Net change in unrealized gain (loss) on investments | (52,228,033) | |
| Net realized and net change in unrealized gain (loss) on investments | (52,054,966) | |
| Net realized loss on extinguishment of debt | (324,184) | |
| Net increase in net assets resulting from operations | 3,737,366 | |
| Dividends declared on Cumulative Preferred Stock | (1,400,000) | |
| Net Increase in Net Assets Resulting from Operations applicable to Common Stockholders | $ | 2,337,366 | |
| | | | | | |
| See accompanying notes to financial statements. |
2023 SEMI-ANNUAL REPORT
PRIORITY INCOME FUND, INC. 13
| | | | | | | | | | | | | | | | | | | | | | | | | | |
| Statements of Changes in Net Assets and Temporary Equity |
| | | | | | | | |
| | | | | | Six Months Ended | | |
| | | | | | December 31, 2022 | Year Ended | |
| | | | | | (unaudited) | June 30, 2022 | |
| Net increase (decrease) in net assets resulting from operations applicable to Common Stockholders: | | | |
| Net investment income | $ | 56,116,516 | | $ | 73,406,226 | | |
| Net realized gain (loss) on investments | 173,067 | | (8,358,797) | | |
| Net change in gain (loss) appreciation on investments | (52,228,033) | | (14,484,658) | | |
| Net realized loss on repurchase of preferred stock | (324,184) | | (1,668,530) | | |
| | | | Net increase in net assets resulting from operations | 3,737,366 | | 48,894,241 | | |
| Distributions to common stockholders: | | | |
| Dividends from earnings (Notes 6 and 8) | (33,114,402) | | (53,587,685) | | |
| Return of capital (Notes 6 and 8) | — | | — | | |
| | | | Total distributions to common stockholders | (33,114,402) | | (53,587,685) | | |
| Distributions to Series K Cumulative Preferred stockholders: | | | |
| Dividends from earnings (Notes 6 and 8) | (1,400,000) | | (2,061,104) | | |
| | | | Total distributions to Series K Cumulative Preferred stockholders | (1,400,000) | | (2,061,104) | | |
| Capital transactions: | | | |
| Gross proceeds from shares sold (Note 4) | 89,283,071 | | 103,968,590 | | |
| Commissions and fees on shares sold (Note 5) | (4,151,909) | | (6,229,141) | | |
| Repurchase of common shares (Note 4) | (18,494,627) | | (30,291,138) | | |
| Reinvestment of distributions (Note 4) | 9,166,823 | | 20,851,185 | | |
| | | | Net increase in net assets from capital transactions | 75,803,358 | | 88,299,496 | | |
| | | | Total increase in net assets | 45,026,322 | | 81,544,948 | | |
| Net assets: | | | |
| Beginning of period | 529,829,535 | | 448,284,587 | | |
| End of period | $ | 574,855,857 | | $ | 529,829,535 | | |
| | | | | | | | | | | | | | | | | | | | | | | |
| | | | | | Six Months Ended | |
| | | | | | December 31, 2022 | Year Ended |
| | | | | | (unaudited) | June 30, 2022 |
| Preferred Stock Classified as Temporary Equity: | | |
| Proceeds from the issuance of Cumulative Preferred Stock (Note 7) | $ | — | | $ | 38,750,000 | |
| Cumulative Preferred Stock issuance costs, paid and deferred | — | | (315,426) | |
| Net increase in Temporary Equity from Cumulative Preferred Stock transactions | — | | 38,434,574 | |
| Temporary Equity: | | |
| Beginning of period | 38,434,574 | | — | |
| End of period | $ | 38,434,574 | | $ | 38,434,574 | |
| | | | | | | |
| See accompanying notes to financial statements. |
2023 SEMI-ANNUAL REPORT
PRIORITY INCOME FUND, INC. 14
| | | | | | | | | | | | | | | | | | | | |
| Statement of Cash Flows |
| For the six months ended December 31, 2022 |
| |
| Cash flows used in operating activities: | |
| Net increase in net assets resulting from operations | $ | 3,737,366 | |
| Adjustments to reconcile net increase in net assets resulting from operations to net cash used in operating activities: |
| Amortization of common stock offering costs (Note 5) | 476,719 | |
| Accretion of purchase discount, net | (24,329,672) | |
| Amortization of term preferred stock deferred offering costs | 131,479 | |
| Amortization of term preferred stock discount | 469,858 | |
| Amortization of notes payable debt issuance costs | 6,390 | |
| Amortization of notes payable discount | 22,250 | |
| Amortization of deferred financing costs on Revolving Credit Facility (Note 11) | 67,076 | |
| Purchases of investments | (63,238,889) | |
| Repayments from investments | 3,930,524 | |
| Payment-in-kind interest | 406,277 | |
| Net realized gain on investments | (173,067) | |
| Net change in unrealized (gain) loss on investments | 52,228,033 | |
| Net realized loss on repurchase of preferred stock | 324,184 | |
| (Increase) Decrease in operating assets: | |
| Deferred common stock offering costs (Note 5) | (597,041) | |
| Interest receivable | (1,474,949) | |
| Due from affiliate (Note 5) | (131,009) | |
| Prepaid expenses | 102,493 | |
| Increase (Decrease) in operating liabilities: | |
| Due to adviser (Note 5) | 2,189,833 | |
| Accrued expenses | (122,126) | |
| Due to Administrator (Note 5) | 452,845 | |
| Due to affiliate (Note 5) | 14,514 | |
| Preferred dividend payable | (4,873) | |
| Interest payable | (183,655) | |
| Director fees payable | (75,000) | |
| Net cash used in operating activities | (25,770,440) | |
| Cash flows provided by financing activities: | |
| Gross proceeds from shares sold (Note 4) | 86,167,079 | |
| Commissions and fees on shares sold (Note 5) | (4,038,790) | |
| Distributions paid to common stockholders | (15,240,261) | |
| Repurchase of common shares (Note 4) | (18,448,176) | |
| Distributions paid to Cumulative Preferred Stockholders | (1,400,000) | |
| Borrowings under Revolving Credit Facility (Note 11) | 41,800,000 | |
| Repayments of Revolving Credit Facility (Note 11) | (54,800,000) | |
| Deferred financing costs on Revolving Credit Facility (Note 11) | (411,711) | |
| Notes payable debt issuance costs, paid and deferred | (3,750) | |
| Net cash provided by financing activities | 33,624,391 | |
| Net increase in cash and restricted cash | 7,853,951 | |
| Cash and restricted cash at beginning of period | 8,599,000 | |
| Cash and restricted cash at end of period | $ | 16,452,951 | |
| |
| Non-cash financing activity: | |
| Value of shares issued through reinvestment of distributions | $ | 9,166,823 | |
| Supplemental disclosure: | |
| Cash paid for interest | $ | 1,762,595 | |
| Cash paid for Term Preferred Stock and Cumulative Preferred Stock | $ | 8,717,170 | |
| | | | | | |
| Beginning of the period | |
| Cash | $ | 8,599,000 | |
| Restricted cash | — | |
| Cash and restricted cash at beginning of period | $ | 8,599,000 | |
| | | | | | |
| End of the period | |
| Cash | $ | 16,170,837 | |
| Restricted cash | 282,114 | |
2023 SEMI-ANNUAL REPORT
PRIORITY INCOME FUND, INC. 15
| | | | | | | | | | | | | | | | | | | | |
| Cash and restricted cash at end of period | $ | 16,452,951 | |
| See accompanying notes to financial statements. |
2023 SEMI-ANNUAL REPORT
PRIORITY INCOME FUND, INC. 16
| | | | | | | | | | | | | | | | | | | | | | | | | | | | | | | | | | | | | | | | | | | | |
| Schedule of Investments |
| As of December 31, 2022 |
| | | | | | | | | | | | | | | | | | | | | | | | | | | | | | | | | | | | | | | | | | | | | | | | | | |
Portfolio Investments(1)(5)(9) | | Investment | | Estimated Yield(2)/Interest Rate | | Legal Maturity | | Acquisition date | | Principal Amount | | Amortized Cost | | Fair Value(3)
Level 3 | | % of Net Assets |
| Collateralized Loan Obligation - Equity Class (Cayman Islands) |
Adams Mill CLO Ltd.(6)(7) | | Subordinated Notes | | — | % | | 7/15/2026 | | 7/3/2014 | | $ | 500,000 | | | $ | — | | | $ | — | | | — | % |
| AIMCO CLO 11, Ltd. | | Subordinated Notes | | 24.86 | % | | 10/17/2034 | | 4/4/2022 | | 5,000,000 | | | 5,157,108 | | | 4,929,696 | | | 0.9 | % |
| Apidos CLO XVIII-R | | Subordinated Notes | | 19.17 | % | | 10/22/2030 | | 9/26/2018 | | 410,000 | | | 517,038 | | | 380,097 | | | 0.1 | % |
| Apidos CLO XX | | Subordinated Notes | | 34.97 | % | | 7/16/2031 | | 3/4/2020 | | 12,500,000 | | | 7,310,917 | | | 7,279,032 | | | 1.3 | % |
Apidos CLO XXI(6)(7) | | Subordinated Notes | | — | % | | 7/19/2027 | | 5/13/2015 | | 5,000,000 | | | 1,613,720 | | | — | | | — | % |
| Apidos CLO XXII | | Subordinated Notes | | 27.26 | % | | 4/21/2031 | | 9/17/2015 | | 9,894,611 | | | 6,768,537 | | | 7,032,537 | | | 1.2 | % |
| Apidos CLO XXIV | | Subordinated Notes | | 33.62 | % | | 10/21/2030 | | 5/17/2019 | | 12,214,397 | | | 7,154,229 | | | 7,398,225 | | | 1.3 | % |
| Apidos CLO XXVI | | Subordinated Notes | | 19.03 | % | | 7/18/2029 | | 7/25/2019 | | 6,000,000 | | | 4,576,544 | | | 4,340,464 | | | 0.8 | % |
| Babson CLO Ltd. 2015-I | | Subordinated Notes | | 12.88 | % | | 1/20/2031 | | 4/1/2015 | | 3,400,000 | | | 2,051,651 | | | 1,477,783 | | | 0.3 | % |
Barings CLO Ltd. 2018-III(6) | | Subordinated Notes | | — | % | | 7/20/2029 | | 10/10/2014 | | 397,600 | | | 165,897 | | | 101,743 | | | 0.0 | % |
BlueMountain CLO 2012-2 Ltd.(6)(7) | | Subordinated Notes | | — | % | | 11/20/2028 | | 1/7/2015 | | 3,000,000 | | | 734,041 | | | — | | | — | % |
BlueMountain CLO 2013-2 Ltd.(6) | | Subordinated Notes | | — | % | | 10/22/2030 | | 10/1/2015 | | 1,900,000 | | | 1,351,687 | | | 859,735 | | | 0.1 | % |
| BlueMountain CLO XXVI Ltd. | | Subordinated Notes | | 24.26 | % | | 10/20/2034 | | 11/18/2021 | | 8,906,000 | | | 7,854,601 | | | 6,902,318 | | | 1.2 | % |
| BlueMountain CLO XXVIII Ltd. | | Subordinated Notes | | 25.35 | % | | 4/17/2034 | | 4/1/2022 | | 3,300,000 | | | 2,947,305 | | | 2,742,170 | | | 0.5 | % |
| BlueMountain CLO XXIX Ltd. | | Subordinated Notes | | 25.27 | % | | 7/25/2034 | | 12/15/2021 | | 6,000,000 | | | 5,702,969 | | | 5,130,963 | | | 0.9 | % |
| BlueMountain CLO XXXI Ltd. | | Subordinated Notes | | 26.78 | % | | 4/19/2034 | | 4/28/2022 | | 5,000,000 | | | 4,230,130 | | | 3,783,099 | | | 0.7 | % |
| BlueMountain CLO XXXII Ltd. | | Subordinated Notes | | 26.75 | % | | 10/16/2034 | | 2/18/2022 | | 12,000,000 | | | 10,080,993 | | | 9,006,081 | | | 1.6 | % |
| BlueMountain CLO XXXIV Ltd. | | Subordinated Notes | | 26.22 | % | | 4/20/2035 | | 3/23/2022 | | 5,700,000 | | | 5,611,833 | | | 5,104,470 | | | 0.9 | % |
| BlueMountain Fuji US CLO II Ltd. | | Subordinated Notes | | 11.69 | % | | 10/21/2030 | | 8/22/2017 | | 2,500,000 | | | 2,139,028 | | | 1,763,835 | | | 0.3 | % |
| California Street CLO IX, Ltd. | | Preference Shares | | 28.62 | % | | 7/16/2032 | | 12/13/2019 | | 4,670,000 | | | 2,407,380 | | | 2,325,452 | | | 0.4 | % |
| Carlyle Global Market Strategies CLO 2013-1, Ltd. | | Subordinated Notes | | 6.27 | % | | 8/14/2030 | | 6/23/2016 | | 17,550,000 | | | 11,014,240 | | | 8,193,823 | | | 1.4 | % |
| Carlyle Global Market Strategies CLO 2013-4, Ltd. | | Income Notes | | 13.99 | % | | 1/15/2031 | | 12/22/2016 | | 11,839,488 | | | 6,920,266 | | | 5,287,397 | | | 0.9 | % |
| Carlyle Global Market Strategies CLO 2014-1, Ltd. | | Income Notes | | 21.95 | % | | 4/17/2031 | | 2/25/2016 | | 12,870,000 | | | 8,104,531 | | | 7,692,486 | | | 1.3 | % |
| Carlyle Global Market Strategies CLO 2014-3-R, Ltd. | | Subordinated Notes | | 12.25 | % | | 7/28/2031 | | 5/23/2018 | | 15,000,000 | | | 12,649,845 | | | 9,952,010 | | | 1.7 | % |
| Carlyle Global Market Strategies CLO 2016-1, Ltd. | | Subordinated Notes | | 13.37 | % | | 4/20/2034 | | 3/16/2016 | | 6,844,556 | | | 6,159,212 | | | 5,124,219 | | | 0.9 | % |
| Carlyle Global Market Strategies CLO 2016-3, Ltd. | | Subordinated Notes | | 14.99 | % | | 7/20/2034 | | 8/8/2016 | | 3,245,614 | | | 2,835,858 | | | 2,614,568 | | | 0.5 | % |
| Carlyle Global Market Strategies CLO 2017-2, Ltd. | | Subordinated Notes | | 35.20 | % | | 7/21/2031 | | 1/4/2022 | | 4,450,000 | | | 2,546,652 | | | 2,301,412 | | | 0.4 | % |
| Carlyle Global Market Strategies CLO 2017-4, Ltd. | | Income Notes | | 31.83 | % | | 1/15/2030 | | 10/14/2021 | | 9,107,000 | | | 5,398,664 | | | 4,795,014 | | | 0.8 | % |
| Carlyle Global Market Strategies CLO 2017-5, Ltd. | | Subordinated Notes | | 12.19 | % | | 1/22/2030 | | 12/18/2017 | | 10,000,000 | | | 8,725,396 | | | 7,097,570 | | | 1.2 | % |
| Cedar Funding II CLO, Ltd. | | Subordinated Notes | | 18.33 | % | | 4/20/2034 | | 9/27/2017 | | 2,500,000 | | | 2,171,647 | | | 1,807,331 | | | 0.3 | % |
| Cedar Funding IV CLO, Ltd. | | Subordinated Notes | | 17.12 | % | | 7/23/2034 | | 6/19/2017 | | 26,698,229 | | | 21,959,638 | | | 19,430,881 | | | 3.5 | % |
| Cedar Funding V CLO, Ltd. | | Subordinated Notes | | 29.71 | % | | 7/17/2031 | | 10/15/2018 | | 7,358,000 | | | 7,561,708 | | | 7,207,454 | | | 1.3 | % |
2023 SEMI-ANNUAL REPORT
PRIORITY INCOME FUND, INC. 17
| | | | | | | | | | | | | | | | | | | | | | | | | | | | | | | | | | | | | | | | | | | | | | | | | | |
Portfolio Investments(1)(5)(9) | | Investment | | Estimated Yield(2)/Interest Rate | | Legal Maturity | | Acquisition date | | Principal Amount | | Amortized Cost | | Fair Value(3)
Level 3 | | % of Net Assets |
| Collateralized Loan Obligation - Equity Class (Cayman Islands) |
| Cedar Funding VI CLO, Ltd. | | Subordinated Notes | | 19.20 | % | | 4/20/2034 | | 8/7/2017 | | $ | 6,722,117 | | | $ | 6,628,306 | | | $ | 5,318,796 | | | 0.9 | % |
| Cedar Funding X CLO, Ltd. | | Subordinated Notes | | 27.57 | % | | 10/20/2032 | | 1/12/2022 | | 10,775,000 | | | 9,524,020 | | | 8,750,730 | | | 1.5 | % |
| Cedar Funding XI CLO, Ltd. | | Subordinated Notes | | 28.44 | % | | 6/1/2032 | | 7/12/2021 | | 17,500,000 | | | 14,060,072 | | | 13,199,285 | | | 2.3 | % |
| Cedar Funding XII, Ltd. | | Subordinated Notes | | 23.67 | % | | 10/25/2034 | | 3/28/2022 | | 3,300,000 | | | 2,886,908 | | | 2,650,699 | | | 0.5 | % |
| Cedar Funding XIV, Ltd. | | Subordinated Notes | | 27.96 | % | | 7/15/2033 | | 4/7/2022 | | 10,000,000 | | | 7,958,385 | | | 7,339,707 | | | 1.3 | % |
| Cedar Funding XV, Ltd. | | Subordinated Notes | | 26.41 | % | | 4/20/2035 | | 7/25/2022 | | 5,000,000 | | | 3,789,333 | | | 3,598,172 | | | 0.6 | % |
Cent CLO 21 Limited(6) | | Subordinated Notes | | — | % | | 7/26/2030 | | 5/15/2014 | | 510,555 | | | 332,632 | | | 224,314 | | | 0.0 | % |
| CIFC Falcon 2019, Ltd. | | Subordinated Notes | | 22.24 | % | | 1/20/2033 | | 5/14/2021 | | 8,500,000 | | | 8,064,876 | | | 7,548,209 | | | 1.3 | % |
| CIFC Funding 2013-I, Ltd. | | Subordinated Notes | | 15.30 | % | | 7/16/2030 | | 6/1/2018 | | 3,000,000 | | | 1,820,912 | | | 1,565,107 | | | 0.3 | % |
| CIFC Funding 2013-II, Ltd. | | Income Notes | | 11.94 | % | | 10/18/2030 | | 2/6/2014 | | 305,000 | | | 170,093 | | | 121,302 | | | 0.0 | % |
| CIFC Funding 2013-III-R, Ltd. | | Subordinated Notes | | 31.68 | % | | 4/24/2031 | | 1/19/2021 | | 4,900,000 | | | 2,230,438 | | | 2,329,521 | | | 0.4 | % |
| CIFC Funding 2013-IV, Ltd. | | Subordinated Notes | | 20.35 | % | | 4/28/2031 | | 3/15/2019 | | 8,000,000 | | | 5,166,849 | | | 4,931,826 | | | 0.9 | % |
| CIFC Funding 2014, Ltd. | | Income Notes | | 16.17 | % | | 1/21/2031 | | 2/6/2014 | | 2,758,900 | | | 1,657,164 | | | 1,334,510 | | | 0.2 | % |
| CIFC Funding 2014-III, Ltd. | | Income Notes | | 19.46 | % | | 10/22/2031 | | 11/14/2016 | | 11,700,000 | | | 7,196,742 | | | 5,579,134 | | | 1.0 | % |
| CIFC Funding 2014-IV-R, Ltd. | | Income Notes | | 18.55 | % | | 1/17/2035 | | 8/5/2014 | | 4,833,031 | | | 3,093,752 | | | 2,570,445 | | | 0.4 | % |
| CIFC Funding 2015-I, Ltd. | | Subordinated Notes | | 18.01 | % | | 1/22/2031 | | 11/24/2015 | | 7,500,000 | | | 5,088,629 | | | 4,239,878 | | | 0.7 | % |
CIFC Funding 2015-III, Ltd.(6) | | Subordinated Notes | | — | % | | 4/19/2029 | | 5/29/2018 | | 10,000,000 | | | 5,142,612 | | | 3,783,529 | | | 0.7 | % |
| CIFC Funding 2015-IV, Ltd. | | Subordinated Notes | | 19.75 | % | | 4/20/2034 | | 4/27/2016 | | 22,930,000 | | | 13,289,428 | | | 11,009,198 | | | 1.9 | % |
| CIFC Funding 2016-I, Ltd. | | Subordinated Notes | | 27.94 | % | | 10/21/2031 | | 12/9/2016 | | 6,500,000 | | | 4,670,574 | | | 5,485,813 | | | 1.0 | % |
CIFC Funding 2017-I, Ltd.(6) | | Subordinated Notes | | — | % | | 4/20/2029 | | 2/3/2017 | | 8,000,000 | | | 6,206,120 | | | 4,820,630 | | | 0.8 | % |
| CIFC Funding 2017-IV, Ltd. | | Subordinated Notes | | 16.52 | % | | 10/24/2030 | | 8/14/2017 | | 18,000,000 | | | 17,329,388 | | | 14,781,550 | | | 2.7 | % |
| CIFC Funding 2018-II, Ltd. | | Subordinated Notes | | 43.13 | % | | 4/20/2031 | | 8/11/2022 | | 10,000,000 | | | 5,880,519 | | | 5,231,118 | | | 0.9 | % |
| CIFC Funding 2018-IV, Ltd. | | Subordinated Notes | | 31.03 | % | | 10/17/2031 | | 6/19/2020 | | 6,000,000 | | | 4,655,052 | | | 4,730,156 | | | 0.8 | % |
| CIFC Funding 2020-II, Ltd. | | Income Notes | | 30.05 | % | | 10/20/2034 | | 7/20/2020 | | 2,000,000 | | | 1,674,669 | | | 1,821,132 | | | 0.3 | % |
| CIFC Funding 2020-III, Ltd. | | Subordinated Notes | | 25.91 | % | | 10/20/2034 | | 9/11/2020 | | 7,350,000 | | | 6,896,377 | | | 7,035,879 | | | 1.2 | % |
| Columbia Cent CLO 29 Limited | | Subordinated Notes | | 27.18 | % | | 10/20/2034 | | 7/10/2020 | | 16,000,000 | | | 12,373,515 | | | 13,375,425 | | | 2.3 | % |
| Columbia Cent CLO 31 Limited | | Subordinated Notes | | 24.00 | % | | 4/20/2034 | | 2/1/2021 | | 12,100,000 | | | 10,520,167 | | | 9,847,934 | | | 1.7 | % |
| Dryden 86 CLO, Ltd. | | Subordinated Notes | | 27.95 | % | | 7/17/2034 | | 3/10/2022 | | 10,250,000 | | | 7,801,140 | | | 7,075,925 | | | 1.2 | % |
| Dryden 87 CLO, Ltd. | | Subordinated Notes | | 28.08 | % | | 5/22/2034 | | 3/10/2022 | | 4,000,000 | | | 3,594,740 | | | 3,238,199 | | | 0.6 | % |
| Dryden 95 CLO, Ltd. | | Subordinated Notes | | 27.28 | % | | 8/21/2034 | | 4/27/2022 | | 10,500,000 | | | 8,941,488 | | | 8,396,511 | | | 1.5 | % |
| Galaxy XIX CLO, Ltd. | | Subordinated Notes | | 10.85 | % | | 7/24/2030 | | 12/5/2016 | | 2,750,000 | | | 1,935,756 | | | 1,371,232 | | | 0.2 | % |
| Galaxy XX CLO, Ltd. | | Subordinated Notes | | 26.14 | % | | 4/21/2031 | | 5/28/2021 | | 2,000,000 | | | 1,628,629 | | | 1,508,991 | | | 0.3 | % |
| Galaxy XXI CLO, Ltd. | | Subordinated Notes | | 32.67 | % | | 4/21/2031 | | 5/28/2021 | | 4,775,000 | | | 3,054,326 | | | 2,808,504 | | | 0.5 | % |
| Galaxy XXVII CLO, Ltd. | | Subordinated Notes | | 39.15 | % | | 5/16/2031 | | 7/23/2021 | | 2,212,500 | | | 996,800 | | | 1,126,748 | | | 0.2 | % |
| Galaxy XXVIII CLO, Ltd. | | Subordinated Notes | | 34.68 | % | | 7/15/2031 | | 5/30/2014 | | 5,295,000 | | | 2,517,301 | | | 2,391,547 | | | 0.4 | % |
2023 SEMI-ANNUAL REPORT
PRIORITY INCOME FUND, INC. 18
| | | | | | | | | | | | | | | | | | | | | | | | | | | | | | | | | | | | | | | | | | | | | | | | | | |
Portfolio Investments(1)(5)(9) | | Investment | | Estimated Yield(2)/Interest Rate | | Legal Maturity | | Acquisition date | | Principal Amount | | Amortized Cost | | Fair Value(3)
Level 3 | | % of Net Assets |
| Collateralized Loan Obligation - Equity Class (Cayman Islands) |
| GoldenTree Loan Opportunities IX, Ltd. | | Subordinated Notes | | 2.81 | % | | 10/29/2029 | | 7/19/2017 | | $ | 3,250,000 | | | $ | 2,195,144 | | | $ | 1,888,689 | | | 0.3 | % |
Halcyon Loan Advisors Funding 2014-2 Ltd.(6) | | Subordinated Notes | | — | % | | 4/28/2025 | | 4/14/2014 | | 400,000 | | | 210,313 | | | — | | | — | % |
Halcyon Loan Advisors Funding 2014-3 Ltd.(6) | | Subordinated Notes | | — | % | | 10/22/2025 | | 9/12/2014 | | 500,000 | | | 298,545 | | | — | | | — | % |
Halcyon Loan Advisors Funding 2015-1 Ltd.(6) | | Subordinated Notes | | — | % | | 4/20/2027 | | 3/16/2015 | | 3,000,000 | | | 1,849,511 | | | — | | | — | % |
Halcyon Loan Advisors Funding 2015-2 Ltd.(6) | | Subordinated Notes | | — | % | | 7/26/2027 | | 6/3/2015 | | 3,000,000 | | | 1,927,789 | | | — | | | — | % |
Halcyon Loan Advisors Funding 2015-3 Ltd.(6) | | Subordinated Notes | | — | % | | 10/18/2027 | | 7/27/2015 | | 7,000,000 | | | 5,329,399 | | | 31,187 | | | 0.0 | % |
| HarbourView CLO VII-R, Ltd. | | Subordinated Notes | | 5.63 | % | | 7/18/2031 | | 6/5/2015 | | 275,000 | | | 193,471 | | | 100,434 | | | 0.0 | % |
| Jefferson Mill CLO Ltd. | | Subordinated Notes | | 10.54 | % | | 10/20/2031 | | 6/30/2015 | | 6,049,689 | | | 4,624,107 | | | 3,316,620 | | | 0.6 | % |
LCM XV Limited Partnership(6) | | Income Notes | | — | % | | 7/19/2030 | | 1/28/2014 | | 250,000 | | | 150,967 | | | 108,434 | | | 0.0 | % |
| LCM XVI Limited Partnership | | Income Notes | | 11.10 | % | | 10/15/2031 | | 5/12/2014 | | 6,814,685 | | | 4,428,008 | | | 3,165,893 | | | 0.6 | % |
| LCM XVII Limited Partnership | | Income Notes | | 12.96 | % | | 10/15/2031 | | 9/17/2014 | | 1,000,000 | | | 693,393 | | | 514,788 | | | 0.1 | % |
| LCM XVIII Limited Partnership | | Income Notes | | 40.86 | % | | 7/20/2031 | | 10/29/2021 | | 12,195,000 | | | 5,108,652 | | | 4,171,724 | | | 0.7 | % |
| LCM XXVIII Limited Partnership | | Subordinated Notes | | 33.29 | % | | 10/21/2030 | | 10/29/2021 | | 2,000,000 | | | 1,256,262 | | | 1,064,207 | | | 0.2 | % |
| LCM XXXII Limited Partnership | | Income Notes | | 25.78 | % | | 7/20/2034 | | 3/2/2022 | | 10,390,000 | | | 8,593,463 | | | 7,493,331 | | | 1.3 | % |
| LCM XXXIV Limited Partnership | | Subordinated Notes | | 32.03 | % | | 10/20/2034 | | 8/4/2022 | | 2,395,000 | | | 1,720,500 | | | 1,577,711 | | | 0.3 | % |
Madison Park Funding XIII, Ltd.(6) | | Subordinated Notes | | — | % | | 4/19/2030 | | 2/3/2014 | | 13,000,000 | | | 7,352,815 | | | 6,332,059 | | | 1.1 | % |
| Madison Park Funding XIV, Ltd. | | Subordinated Notes | | 25.38 | % | | 10/22/2030 | | 7/3/2014 | | 23,750,000 | | | 16,382,483 | | | 13,515,906 | | | 2.4 | % |
| Madison Park Funding XL, Ltd. | | Subordinated Notes | | 41.90 | % | | 5/28/2030 | | 10/8/2020 | | 7,000,000 | | | 3,452,991 | | | 3,230,942 | | | 0.6 | % |
Mountain View CLO 2014-1 Ltd.(6) | | Income Notes | | — | % | | 10/15/2026 | | 8/29/2014 | | 1,000,000 | | | 497,106 | | | — | | | — | % |
| Mountain View CLO IX Ltd. | | Subordinated Notes | | 17.78 | % | | 7/15/2031 | | 5/13/2015 | | 8,815,500 | | | 4,517,073 | | | 4,050,216 | | | 0.7 | % |
| Neuberger Berman CLO XVI-S, Ltd. | | Subordinated Notes | | 28.08 | % | | 4/17/2034 | | 2/9/2022 | | 16,000,000 | | | 15,517,891 | | | 13,694,205 | | | 2.5 | % |
| Neuberger Berman CLO XXI, Ltd. | | Subordinated Notes | | 27.68 | % | | 4/20/2034 | | 2/16/2022 | | 8,501,407 | | | 7,111,750 | | | 6,046,602 | | | 1.1 | % |
Octagon Investment Partners XIV, Ltd.(6) | | Income Notes | | — | % | | 7/16/2029 | | 12/1/2017 | | 6,150,000 | | | 3,121,174 | | | 2,345,252 | | | 0.4 | % |
| Octagon Investment Partners XV, Ltd. | | Income Notes | | 20.61 | % | | 7/19/2030 | | 5/23/2019 | | 8,937,544 | | | 4,933,928 | | | 4,882,711 | | | 0.8 | % |
| Octagon Investment Partners XVII, Ltd. | | Subordinated Notes | | 16.08 | % | | 1/27/2031 | | 6/28/2018 | | 16,153,000 | | | 8,004,333 | | | 6,401,898 | | | 1.1 | % |
| Octagon Investment Partners 18-R, Ltd. | | Subordinated Notes | | 15.13 | % | | 4/16/2031 | | 7/30/2015 | | 4,568,944 | | | 2,168,337 | | | 1,707,204 | | | 0.3 | % |
| Octagon Investment Partners 20-R, Ltd. | | Subordinated Notes | | 18.30 | % | | 5/12/2031 | | 4/25/2019 | | 3,500,000 | | | 2,983,309 | | | 2,277,363 | | | 0.4 | % |
| Octagon Investment Partners XXI, Ltd. | | Subordinated Notes | | 20.18 | % | | 2/14/2031 | | 1/6/2016 | | 13,822,188 | | | 8,509,105 | | | 6,487,615 | | | 1.1 | % |
| Octagon Investment Partners XXII, Ltd. | | Subordinated Notes | | 12.66 | % | | 1/22/2030 | | 11/12/2014 | | 6,625,000 | | | 4,813,881 | | | 3,519,011 | | | 0.6 | % |
| Octagon Investment Partners 27, Ltd. | | Subordinated Notes | | 19.48 | % | | 7/15/2030 | | 10/31/2018 | | 5,000,000 | | | 3,360,102 | | | 2,682,769 | | | 0.5 | % |
| Octagon Investment Partners 30, Ltd. | | Subordinated Notes | | 6.90 | % | | 3/18/2030 | | 11/16/2017 | | 9,525,000 | | | 7,641,105 | | | 6,503,984 | | | 1.1 | % |
| Octagon Investment Partners 31, Ltd. | | Subordinated Notes | | 11.14 | % | | 7/19/2030 | | 12/20/2019 | | 3,067,500 | | | 1,927,384 | | | 1,781,205 | | | 0.3 | % |
| Octagon Investment Partners 33, Ltd. | | Subordinated Notes | | 14.10 | % | | 1/20/2031 | | 7/9/2018 | | 2,850,000 | | | 2,341,419 | | | 1,912,837 | | | 0.3 | % |
| Octagon Investment Partners 36, Ltd. | | Subordinated Notes | | 24.19 | % | | 4/15/2031 | | 12/20/2019 | | 10,400,960 | | | 8,051,090 | | | 7,005,487 | | | 1.2 | % |
2023 SEMI-ANNUAL REPORT
PRIORITY INCOME FUND, INC. 19
| | | | | | | | | | | | | | | | | | | | | | | | | | | | | | | | | | | | | | | | | | | | | | | | | | |
Portfolio Investments(1)(5)(9) | | Investment | | Estimated Yield(2)/Interest Rate | | Legal Maturity | | Acquisition date | | Principal Amount | | Amortized Cost | | Fair Value(3)
Level 3 | | % of Net Assets |
| Collateralized Loan Obligation - Equity Class (Cayman Islands) |
| Octagon Investment Partners 37, Ltd. | | Subordinated Notes | | 24.66 | % | | 7/25/2030 | | 3/17/2021 | | $ | 14,500,000 | | | $ | 11,231,307 | | | $ | 10,675,045 | | | 1.9 | % |
| Octagon Investment Partners 39, Ltd. | | Subordinated Notes | | 23.60 | % | | 10/21/2030 | | 1/9/2020 | | 10,250,000 | | | 8,176,298 | | | 7,716,611 | | | 1.3 | % |
| Octagon Loan Funding, Ltd. | | Subordinated Notes | | 20.63 | % | | 11/18/2031 | | 8/25/2014 | | 5,014,526 | | | 3,041,292 | | | 2,571,325 | | | 0.4 | % |
| OZLM VI, Ltd. | | Subordinated Notes | | 5.68 | % | | 4/17/2031 | | 10/31/2016 | | 15,688,991 | | | 10,775,452 | | | 6,897,060 | | | 1.2 | % |
OZLM VII, Ltd.(6) | | Subordinated Notes | | — | % | | 7/17/2029 | | 11/3/2015 | | 2,654,467 | | | 1,386,766 | | | 422,572 | | | 0.1 | % |
OZLM VIII, Ltd.(6) | | Subordinated Notes | | — | % | | 10/17/2029 | | 8/7/2014 | | 950,000 | | | 554,166 | | | 279,118 | | | 0.0 | % |
| OZLM IX, Ltd. | | Subordinated Notes | | 10.79 | % | | 10/20/2031 | | 2/22/2017 | | 15,000,000 | | | 11,029,883 | | | 7,667,053 | | | 1.3 | % |
OZLM XII, Ltd.(6) | | Subordinated Notes | | — | % | | 4/30/2027 | | 1/17/2017 | | 12,122,952 | | | 7,169,134 | | | 62,506 | | | 0.0 | % |
| OZLM XXII, Ltd. | | Subordinated Notes | | 9.49 | % | | 1/17/2031 | | 5/11/2017 | | 27,343,000 | | | 14,482,334 | | | 10,846,950 | | | 1.9 | % |
| Redding Ridge 3 CLO, Ltd. | | Preference Shares | | 23.13 | % | | 1/15/2030 | | 3/26/2021 | | 12,293,000 | | | 6,916,515 | | | 6,319,241 | | | 1.1 | % |
| Redding Ridge 4 CLO, Ltd. | | Subordinated Notes | | 22.02 | % | | 4/15/2030 | | 1/29/2021 | | 14,000,000 | | | 12,840,458 | | | 11,714,801 | | | 2.0 | % |
| Redding Ridge 5 CLO, Ltd. | | Subordinated Notes | | 24.36 | % | | 10/15/2031 | | 5/27/2021 | | 5,500,000 | | | 5,138,058 | | | 4,838,961 | | | 0.8 | % |
| Rockford Tower CLO 2021-3, Ltd. | | Subordinated Notes | | 23.02 | % | | 10/20/2034 | | 2/11/2022 | | 8,000,000 | | | 7,014,109 | | | 6,913,661 | | | 1.2 | % |
| Romark WM-R Ltd. | | Subordinated Notes | | 11.77 | % | | 4/21/2031 | | 4/11/2014 | | 490,713 | | | 354,112 | | | 254,409 | | | 0.0 | % |
| Sound Point CLO II, Ltd. | | Subordinated Notes | | 4.73 | % | | 1/26/2031 | | 5/16/2019 | | 21,053,778 | | | 10,398,368 | | | 7,539,577 | | | 1.3 | % |
| Sound Point CLO VII-R, Ltd. | | Subordinated Notes | | 15.78 | % | | 10/23/2031 | | 7/31/2019 | | 9,002,745 | | | 3,522,920 | | | 2,517,080 | | | 0.4 | % |
| Sound Point CLO XVII, Ltd. | | Subordinated Notes | | 5.00 | % | | 10/20/2030 | | 7/11/2018 | | 20,000,000 | | | 14,782,587 | | | 11,972,684 | | | 2.1 | % |
| Sound Point CLO XVIII, Ltd. | | Subordinated Notes | | 15.22 | % | | 1/20/2031 | | 10/29/2018 | | 15,563,500 | | | 11,156,743 | | | 9,870,658 | | | 1.7 | % |
| Sound Point CLO XIX, Ltd. | | Subordinated Notes | | 26.27 | % | | 4/15/2031 | | 9/23/2021 | | 7,500,000 | | | 4,285,670 | | | 3,906,022 | | | 0.7 | % |
| Sound Point CLO XX, Ltd. | | Subordinated Notes | | 24.03 | % | | 7/28/2031 | | 11/5/2021 | | 8,000,000 | | | 5,190,477 | | | 4,464,734 | | | 0.8 | % |
| Sound Point CLO XXIII, Ltd. | | Subordinated Notes | | 19.45 | % | | 7/17/2034 | | 8/27/2021 | | 5,915,000 | | | 4,478,280 | | | 4,195,406 | | | 0.7 | % |
Symphony CLO XIV, Ltd.(6) | | Subordinated Notes | | — | % | | 7/14/2026 | | 5/6/2014 | | 750,000 | | | 379,097 | | | 156,311 | | | 0.0 | % |
| Symphony CLO XVI, Ltd. | | Subordinated Notes | | 13.17 | % | | 10/15/2031 | | 7/1/2015 | | 5,000,000 | | | 4,066,521 | | | 3,089,145 | | | 0.5 | % |
| Symphony CLO XIX, Ltd. | | Subordinated Notes | | 23.62 | % | | 4/16/2031 | | 5/6/2021 | | 2,000,000 | | | 1,353,441 | | | 1,298,275 | | | 0.2 | % |
| TCI-Symphony CLO 2017-1, Ltd. | | Income Notes | | 26.73 | % | | 7/15/2030 | | 9/15/2020 | | 3,000,000 | | | 1,885,279 | | | 1,876,082 | | | 0.3 | % |
| TCW CLO 2021-2, Ltd. | | Subordinated Notes | | 29.39 | % | | 7/25/2034 | | 8/17/2022 | | 5,000,000 | | | 3,682,202 | | | 3,480,552 | | | 0.6 | % |
THL Credit Wind River 2013-1 CLO, Ltd.(6) | | Subordinated Notes | | — | % | | 7/19/2030 | | 11/1/2017 | | 10,395,000 | | | 6,774,022 | | | 4,155,134 | | | 0.7 | % |
| THL Credit Wind River 2013-2 CLO, Ltd. | | Income Notes | | 7.74 | % | | 10/18/2030 | | 12/27/2017 | | 3,250,000 | | | 1,954,385 | | | 1,477,714 | | | 0.3 | % |
| THL Credit Wind River 2014-1 CLO, Ltd. | | Subordinated Notes | | 15.24 | % | | 7/18/2031 | | 7/11/2018 | | 11,800,000 | | | 6,904,601 | | | 5,512,300 | | | 1.0 | % |
| THL Credit Wind River 2014-2 CLO, Ltd. | | Income Notes | | 34.84 | % | | 1/15/2031 | | 1/22/2021 | | 7,550,000 | | | 2,657,879 | | | 2,517,521 | | | 0.4 | % |
| THL Credit Wind River 2017-4 CLO, Ltd. | | Subordinated Notes | | 28.41 | % | | 11/20/2030 | | 6/25/2020 | | 3,765,400 | | | 2,814,428 | | | 2,636,806 | | | 0.5 | % |
| THL Credit Wind River 2018-2 CLO, Ltd. | | Subordinated Notes | | 20.25 | % | | 7/15/2030 | | 3/11/2019 | | 8,884,000 | | | 7,824,332 | | | 6,621,258 | | | 1.2 | % |
| THL Credit Wind River 2018-3 CLO, Ltd. | | Subordinated Notes | | 22.89 | % | | 1/20/2031 | | 6/28/2019 | | 13,000,000 | | | 12,037,109 | | | 10,861,341 | | | 1.9 | % |
Venture XVIII CLO, Ltd.(6) | | Subordinated Notes | | — | % | | 10/15/2029 | | 7/16/2018 | | 4,750,000 | | | 2,772,058 | | | 1,705,226 | | | 0.3 | % |
2023 SEMI-ANNUAL REPORT
PRIORITY INCOME FUND, INC. 20
| | | | | | | | | | | | | | | | | | | | | | | | | | | | | | | | | | | | | | | | | | | | | | | | | | |
Portfolio Investments(1)(5)(9) | | Investment | | Estimated Yield(2)/Interest Rate | | Legal Maturity | | Acquisition date | | Principal Amount | | Amortized Cost | | Fair Value(3)
Level 3 | | % of Net Assets |
| Collateralized Loan Obligation - Equity Class (Cayman Islands) |
| Venture 28A CLO, Ltd. | | Subordinated Notes | | 20.01 | % | | 10/20/2034 | | 7/16/2018 | | $ | 17,715,000 | | | $ | 13,465,476 | | | $ | 11,772,044 | | | 2.0 | % |
| Venture XXX CLO, Ltd. | | Subordinated Notes | | 16.70 | % | | 1/15/2031 | | 7/16/2018 | | 5,100,000 | | | 4,128,188 | | | 3,702,001 | | | 0.6 | % |
| Venture XXXII CLO, Ltd. | | Subordinated Notes | | 20.82 | % | | 7/18/2031 | | 10/9/2018 | | 7,929,328 | | | 7,216,055 | | | 5,921,248 | | | 1.0 | % |
| Venture XXXIV CLO, Ltd. | | Subordinated Notes | | 24.63 | % | | 10/15/2031 | | 7/30/2019 | | 13,903,000 | | | 11,179,329 | | | 10,518,595 | | | 1.8 | % |
| Venture 41 CLO, Ltd. | | Subordinated Notes | | 26.75 | % | | 1/20/2034 | | 1/26/2021 | | 8,249,375 | | | 7,548,647 | | | 6,811,183 | | | 1.2 | % |
| Venture 42 CLO, Ltd. | | Subordinated Notes | | 25.49 | % | | 4/17/2034 | | 11/5/2021 | | 15,000,000 | | | 13,320,771 | | | 11,742,187 | | | 2.0 | % |
| Venture 43 CLO, Ltd. | | Subordinated Notes | | 25.26 | % | | 4/17/2034 | | 9/1/2021 | | 12,000,000 | | | 9,883,377 | | | 9,395,183 | | | 1.6 | % |
| Voya IM CLO 2013-1, Ltd. | | Income Notes | | 3.13 | % | | 10/15/2030 | | 6/9/2016 | | 4,174,688 | | | 2,601,519 | | | 1,967,845 | | | 0.3 | % |
| Voya IM CLO 2013-3, Ltd. | | Subordinated Notes | | 4.19 | % | | 10/18/2031 | | 2/13/2015 | | 4,000,000 | | | 1,875,378 | | | 1,223,795 | | | 0.2 | % |
| Voya IM CLO 2014-1, Ltd. | | Subordinated Notes | | 2.91 | % | | 4/18/2031 | | 2/5/2014 | | 314,774 | | | 191,367 | | | 124,396 | | | 0.0 | % |
Voya CLO 2014-3, Ltd.(6)(7) | | Subordinated Notes | | — | % | | 7/24/2026 | | 4/10/2015 | | 7,000,000 | | | 2,853,170 | | | 121,592 | | | 0.0 | % |
| Voya CLO 2014-4, Ltd. | | Subordinated Notes | | 8.40 | % | | 7/14/2031 | | 11/10/2014 | | 1,000,000 | | | 655,510 | | | 431,588 | | | 0.1 | % |
Voya CLO 2015-2, Ltd.(6)(7) | | Subordinated Notes | | — | % | | 7/23/2027 | | 6/24/2015 | | 13,712,000 | | | 3,274,452 | | | 194,406 | | | 0.0 | % |
| Voya CLO 2016-1, Ltd. | | Subordinated Notes | | 13.34 | % | | 1/21/2031 | | 1/22/2016 | | 7,750,000 | | | 6,183,513 | | | 5,396,926 | | | 0.9 | % |
| Voya CLO 2016-3, Ltd. | | Subordinated Notes | | 13.10 | % | | 10/20/2031 | | 9/30/2016 | | 10,225,000 | | | 7,995,286 | | | 6,695,494 | | | 1.2 | % |
| Voya CLO 2017-3, Ltd. | | Subordinated Notes | | 14.72 | % | | 4/20/2034 | | 6/15/2017 | | 5,750,000 | | | 6,530,434 | | | 5,079,755 | | | 0.9 | % |
| Voya CLO 2017-4, Ltd. | | Subordinated Notes | | 28.32 | % | | 10/15/2030 | | 3/25/2021 | | 2,500,000 | | | 1,608,476 | | | 1,478,914 | | | 0.3 | % |
| Voya CLO 2018-1, Ltd. | | Subordinated Notes | | 18.66 | % | | 4/18/2031 | | 2/23/2018 | | 20,000,000 | | | 16,416,403 | | | 14,265,792 | | | 2.6 | % |
| Voya CLO 2018-2, Ltd. | | Subordinated Notes | | 30.91 | % | | 7/15/2031 | | 4/27/2021 | | 6,778,666 | | | 4,404,847 | | | 4,185,810 | | | 0.7 | % |
| Voya CLO 2018-4, Ltd. | | Subordinated Notes | | 33.47 | % | | 1/15/2032 | | 8/9/2021 | | 3,192,000 | | | 2,356,214 | | | 2,201,283 | | | 0.4 | % |
| Voya CLO 2019-1, Ltd. | | Subordinated Notes | | 24.82 | % | | 4/15/2031 | | 1/27/2020 | | 15,500,000 | | | 14,499,447 | | | 12,857,995 | | | 2.2 | % |
| Voya CLO 2020-1, Ltd. | | Subordinated Notes | | 25.38 | % | | 7/17/2034 | | 3/3/2022 | | 6,500,000 | | | 5,680,183 | | | 5,026,151 | | | 0.9 | % |
| Voya CLO 2022-1, Ltd. | | Subordinated Notes | | 25.93 | % | | 4/20/2035 | | 3/18/2022 | | 17,600,000 | | | 16,215,849 | | | 14,883,193 | | | 2.7 | % |
West CLO 2014-1 Ltd.(6)(7) | | Subordinated Notes | | — | % | | 7/17/2026 | | 6/24/2014 | | 13,375,000 | | | 2,586,143 | | | — | | | — | % |
| Total Collateralized Loan Obligation - Equity Class | | $ | 896,168,094 | | | $ | 754,044,320 | | | 131.2 | % |
| | | | | | | | | | | | | | | | |
Collateralized Loan Obligation - Debt Class (Cayman Islands)(4) |
| AGL CLO 21, Ltd. | | Class E Notes | | 11.65% (SOFR + 8.62%) | | 7/27/2035 | | 7/27/2022 | | $ | 1,000,000 | | | $ | 953,052 | | | $ | 980,219 | | | 0.2 | % |
| BlueMountain Fuji US CLO III Ltd. | | Class E Notes | | 9.28% (LIBOR + 5.20%) | | 1/15/2030 | | 9/9/2022 | | 2,000,000 | | | 1,668,501 | | | 1,688,585 | | | 0.3 | % |
| Cent CLO 21 Limited | | Class D-R2 Notes | | 10.66% (LIBOR + 6.30%) | | 7/26/2030 | | 7/29/2022 | | 7,000,000 | | | 5,783,240 | | | 6,239,244 | | | 1.1 | % |
| CIFC Funding 2013-III-R, Ltd. | | Class D Notes | | 10.22% (LIBOR + 5.90%) | | 4/24/2031 | | 9/9/2022 | | 1,675,000 | | | 1,428,707 | | | 1,469,885 | | | 0.3 | % |
| CIFC Funding 2014-III, Ltd. | | Class E-R2 Notes | | 10.42% (LIBOR + 6.10%) | | 10/22/2031 | | 9/16/2022 | | 1,125,000 | | | 955,737 | | | 1,072,747 | | | 0.2 | % |
| CIFC Funding 2015-I, Ltd. | | Class E-RR Notes | | 10.32% (LIBOR + 6.00%) | | 1/22/2031 | | 9/9/2022 | | 2,562,500 | | | 2,186,093 | | | 2,459,682 | | | 0.4 | % |
2023 SEMI-ANNUAL REPORT
PRIORITY INCOME FUND, INC. 21
| | | | | | | | | | | | | | | | | | | | | | | | | | | | | | | | | | | | | | | | | | | | | | | | | | |
Portfolio Investments(1)(5)(9) | | Investment | | Estimated Yield(2)/Interest Rate | | Legal Maturity | | Acquisition date | | Principal Amount | | Amortized Cost | | Fair Value(3)
Level 3 | | % of Net Assets |
Collateralized Loan Obligation - Debt Class (Cayman Islands)(4) |
| LCM XXIII Ltd. | | Class D Notes | | 11.29% (LIBOR + 7.05%) | | 10/19/2029 | | 8/19/2022 | | $ | 6,000,000 | | | $ | 5,150,864 | | | $ | 5,161,090 | | | 0.9 | % |
| Madison Park Funding XXIV, Ltd. | | Class E-R Notes | | 11.42% (SOFR + 7.46%) | | 10/19/2029 | | 8/19/2022 | | 5,000,000 | | | 4,700,783 | | | 4,872,912 | | | 0.8 | % |
| Madison Park Funding XL, Ltd. | | Class E-R Notes | | 11.19% (LIBOR + 6.45%) | | 5/28/2030 | | 9/9/2022 | | 3,460,000 | | | 3,055,514 | | | 3,282,062 | | | 0.6 | % |
| Neuberger Berman CLO XV, Ltd. | | Class E-R Notes | | 10.83% (LIBOR + 6.75%) | | 10/15/2029 | | 9/14/2022 | | 1,375,000 | | | 1,253,151 | | | 1,290,311 | | | 0.2 | % |
| Newark BSL CLO 2, Ltd. | | Class D Notes | | 10.66% (LIBOR + 6.30%) | | 7/25/2030 | | 7/27/2022 | | 3,000,000 | | | 2,681,792 | | | 2,797,849 | | | 0.5 | % |
| Sound Point CLO XIV, Ltd. | | Class E Notes | | 10.97% (LIBOR + 6.65%) | | 1/23/2029 | | 7/27/2022 | | 1,000,000 | | | 912,686 | | | 934,494 | | | 0.2 | % |
| Sound Point CLO XXV, Ltd. | | Class E-R Notes | | 11.31% (SOFR + 7.25%) | | 4/25/2033 | | 9/9/2022 | | 3,000,000 | | | 2,582,744 | | | 2,570,544 | | | 0.4 | % |
| Voya CLO 2017-1, Ltd. | | Class D Notes | | 10.18% (LIBOR + 6.10%) | | 4/17/2030 | | 9/9/2022 | | 2,500,000 | | | 2,078,667 | | | 2,123,491 | | | 0.4 | % |
| Apidos CLO XXIV | | Class E-R Notes | | 12.10% (LIBOR + 7.86%) | | 10/21/2030 | | 3/10/2020 | | 2,000,000 | | | 1,584,849 | | | 1,527,818 | | | 0.3 | % |
| BlueMountain CLO 2015-3 Ltd. | | Class E-R Notes | | 12.32% (LIBOR + 8.08%) | | 4/21/2031 | | 8/5/2022 | | 2,500,000 | | | 1,785,487 | | | 1,710,768 | | | 0.3 | % |
| California Street CLO IX, Ltd. | | Class F-R2 Notes | | 12.60% (LIBOR + 8.52%) | | 7/16/2032 | | 9/2/2020 | | 2,000,000 | | | 1,639,002 | | | 1,653,038 | | | 0.3 | % |
| Carlyle Global Market Strategies 2014-2-R, Ltd. | | Class E Notes | | 12.61% (LIBOR + 8.00%) | | 5/15/2031 | | 3/6/2019 | | 7,500,000 | | | 7,036,230 | | | 4,818,180 | | | 0.8 | % |
| Carlyle CLO 17, Ltd. | | Class E-R Notes | | 12.76% (LIBOR + 8.35%) | | 4/30/2031 | | 3/5/2019 | | 3,000,000 | | | 2,863,843 | | | 2,641,285 | | | 0.5 | % |
| Cent CLO 21 Limited | | Class E-R2 Notes | | 13.01% (LIBOR + 8.65%) | | 7/26/2030 | | 7/12/2018 | | 109,122 | | | 106,402 | | | 92,094 | | | 0.0 | % |
| CIFC Funding 2013-III-R, Ltd. | | Class E Notes | | 12.10% (LIBOR + 7.78%) | | 4/24/2031 | | 10/2/2020 | | 3,000,000 | | | 2,370,348 | | | 2,220,328 | | | 0.4 | % |
| CIFC Funding 2014-III, Ltd. | | Class F-R2 Notes | | 12.57% (LIBOR + 8.25%) | | 10/22/2031 | | 11/5/2021 | | 1,500,000 | | | 1,400,064 | | | 1,216,666 | | | 0.2 | % |
| CIFC Funding 2014-IV-R, Ltd. | | Class E-R Notes | | 13.26% (LIBOR + 9.18%) | | 1/17/2035 | | 12/20/2021 | | 778,684 | | | 756,201 | | | 721,477 | | | 0.1 | % |
| CIFC Funding 2014-V, Ltd. | | Class F-R2 Notes | | 12.58% (LIBOR + 8.50%) | | 10/17/2031 | | 9/17/2018 | | 750,000 | | | 746,862 | | | 644,969 | | | 0.1 | % |
| CIFC Funding 2015-I, Ltd. | | Class F-RR Notes | | 12.17% (LIBOR + 7.85%) | | 1/22/2031 | | 10/31/2019 | | 5,000,000 | | | 4,236,853 | | | 4,073,656 | | | 0.7 | % |
| CIFC Funding 2016-I, Ltd. | | Class F-R Notes | | 14.43% (LIBOR + 10.15%) | | 10/21/2031 | | 9/16/2019 | | 3,750,000 | | | 3,677,281 | | | 3,457,143 | | | 0.6 | % |
| Galaxy XXI CLO, Ltd. | | Class F-R Notes | | 11.49% (LIBOR + 7.25%) | | 4/21/2031 | | 3/8/2019 | | 6,000,000 | | | 5,201,038 | | | 5,092,835 | | | 0.9 | % |
| Galaxy XXII CLO, Ltd. | | Class F-RR Notes | | 12.88% (LIBOR + 8.80%) | | 4/17/2034 | | 8/8/2022 | | 1,500,000 | | | 1,209,089 | | | 1,243,852 | | | 0.2 | % |
| Galaxy XXVII CLO, Ltd. | | Class F Junior Notes | | 12.70% (LIBOR + 8.06%) | | 5/16/2031 | | 3/5/2019 | | 1,500,000 | | | 1,390,044 | | | 1,148,836 | | | 0.2 | % |
2023 SEMI-ANNUAL REPORT
PRIORITY INCOME FUND, INC. 22
| | | | | | | | | | | | | | | | | | | | | | | | | | | | | | | | | | | | | | | | | | | | | | | | | | |
Portfolio Investments(1)(5)(9) | | Investment | | Estimated Yield(2)/Interest Rate | | Legal Maturity | | Acquisition date | | Principal Amount | | Amortized Cost | | Fair Value(3)
Level 3 | | % of Net Assets |
Collateralized Loan Obligation - Debt Class (Cayman Islands)(4) |
| Galaxy XXVIII CLO, Ltd. | | Class F Junior Notes | | 12.56% (LIBOR + 8.48%) | | 7/15/2031 | | 6/29/2018 | | $ | 41,713 | | | $ | 40,207 | | | $ | 36,126 | | | 0.0 | % |
HarbourView CLO VII-R, Ltd.(8) | | Class F Notes | | 12.46% (LIBOR + 8.27%) | | 7/18/2031 | | 10/29/2018 | | 6,899,634 | | | 6,861,730 | | | 4,343,003 | | | 0.8 | % |
| Madison Park Funding XIII, Ltd. | | Class F-R Notes | | 12.18% (LIBOR + 7.95%) | | 4/19/2030 | | 10/25/2019 | | 2,000,000 | | | 1,781,560 | | | 1,595,053 | | | 0.3 | % |
| Madison Park Funding XIV, Ltd. | | Class F-R Notes | | 12.09% (LIBOR + 7.77%) | | 10/22/2030 | | 3/13/2020 | | 4,500,000 | | | 3,330,526 | | | 3,623,487 | | | 0.6 | % |
| Mountain View CLO IX Ltd. | | Class E Notes | | 12.10% (LIBOR + 8.02%) | | 7/15/2031 | | 10/29/2018 | | 3,625,000 | | | 3,582,867 | | | 2,543,368 | | | 0.4 | % |
| Octagon Investment Partners XVII, Ltd. | | Class F-R2 Notes | | 11.56% (LIBOR + 7.20%) | | 1/27/2031 | | 10/15/2019 | | 5,362,500 | | | 4,438,936 | | | 3,982,391 | | | 0.7 | % |
| Octagon Investment Partners 18-R, Ltd. | | Class E Notes | | 12.33% (LIBOR + 8.25%) | | 4/16/2031 | | 10/15/2019 | | 6,080,742 | | | 5,177,996 | | | 5,356,813 | | | 0.9 | % |
| Octagon Investment Partners XXII, Ltd. | | Class F-RR Notes | | 12.07% (LIBOR + 7.75%) | | 1/22/2030 | | 11/25/2019 | | 5,500,000 | | | 4,546,062 | | | 4,308,198 | | | 0.7 | % |
| OZLM VIII, Ltd. | | Class E-RR Notes | | 12.25% (LIBOR + 8.17%) | | 10/17/2029 | | 11/6/2018 | | 8,400,000 | | | 8,345,710 | | | 6,624,328 | | | 1.1 | % |
| Sound Point CLO IV-R, Ltd. | | Class F Notes | | 12.29% (LIBOR + 8.10%) | | 4/18/2031 | | 3/18/2019 | | 3,500,000 | | | 3,305,980 | | | 2,273,831 | | | 0.4 | % |
| THL Credit Wind River 2014-2 CLO, Ltd. | | Class F-R Notes | | 11.95% (LIBOR + 7.87%) | | 1/15/2031 | | 8/16/2022 | | 3,000,000 | | | 2,186,121 | | | 2,131,108 | | | 0.4 | % |
| Venture XIX CLO, Ltd. | | Class F-RR Notes | | 12.58% (LIBOR + 8.50%) | | 1/15/2032 | | 11/16/2018 | | 7,900,000 | | | 7,859,774 | | | 6,482,949 | | | 1.1 | % |
| Venture XXXIII CLO, Ltd. | | Class F Notes | | 12.08% (LIBOR + 8.00%) | | 7/15/2031 | | 12/3/2019 | | 2,500,000 | | | 1,998,777 | | | 1,852,807 | | | 0.3 | % |
| Voya IM CLO 2012-4, Ltd. | | Class E-R-R Notes | | 14.93% (LIBOR + 10.85%) | | 10/15/2030 | | 10/11/2019 | | 3,320,000 | | | 3,224,032 | | | 2,750,946 | | | 0.5 | % |
| Voya IM CLO 2014-1, Ltd. | | Class E-R2 Notes | | 12.54% (LIBOR + 8.35%) | | 4/18/2031 | | 4/11/2019 | | 8,787,500 | | | 7,013,873 | | | 6,215,500 | | | 1.1 | % |
| Total Collateralized Loan Obligation - Debt Class | | $ | 135,089,275 | | | $ | 123,325,968 | | | 21.4 | % |
| | | | | | | | | | | | | | | | |
| Total Portfolio Investments | | | | | | | | $ | 1,031,257,369 | | | $ | 877,370,288 | | | 152.6 | % |
| Assets, other than investments, less liabilities and Cumulative Preferred stock | | | | | | | | | | (302,514,431) | | | (52.6) | % |
| Net Assets applicable to Common Shares | | | | | | | | | | $ | 574,855,857 | | | 100.0 | % |
| | | | | | | | | | | | | | | | |
(1) The Company does not "control" and is not an "affiliate" of any of the portfolio investments, each term as defined in the Investment Company Act of 1940, as amended (the "1940 Act"). In general, under the 1940 Act, the Company would be presumed to "control" a portfolio company if the Company owned 25% or more of its voting securities and would be an "affiliate" of a portfolio company if the Company owned 5% or more of its voting securities. |
(2) The CLO subordinated notes, income notes and preferred shares are considered equity positions in the CLOs. The CLO equity investments are entitled to recurring distributions which are generally equal to the excess cash flow generated from the underlying investments after payment of the contractual payments to senior debt holders and CLO expenses. The current estimated yield, calculated using amortized cost, is based on the current projections of this excess cash flow taking into account assumptions which have been made regarding expected prepayments, losses and future reinvestment rates. These assumptions are periodically reviewed and adjusted. Ultimately, the actual yield may be higher or lower than the estimated yield if actual results differ from those used for the assumptions. |
(3) Fair value is determined by or under the direction of the Company’s Board of Directors. For intra-quarter end periods, the Company’s Board of Directors has designated the Advisor to fair value the Company’s investments. As of December 31, 2022, all of the Company’s investments were classified as Level 3. ASC 820 classifies such unobservable inputs used to measure fair value as Level 3 within the valuation hierarchy. See Notes 2 and 3 within the accompanying notes to financial statements for further discussion. |
(4) The interest rate on these investments is subject to the base rate of 3-Month LIBOR or 3-Month Term SOFR, as specified, which was 4.76729% and 4.58745% at December 31, 2022, respectively. The current base rates for each investment may be different from the reference rates on December 31, 2022. |
2023 SEMI-ANNUAL REPORT
PRIORITY INCOME FUND, INC. 23
| | | | | | | | | | | | | | | | | | | | | | | | | | | | | | | | | | | | | | | | | | | | | | | | | | |
(5) The securities in which the Company has invested were acquired in transactions that were exempt from registration under the Securities Act of 1933, as amended (the “Securities Act”). These securities may be resold only in transactions that are exempt from registration under the Securities Act. |
(6) The effective yield has been estimated to be 0% as expected future cash flows are anticipated to not be sufficient to repay the investment at cost. If the expected investment proceeds increase, there is a potential for future investment income from the investment. Distributions, once received, will be recognized as return of capital, and when called, any remaining unamortized investment costs will be written off if the actual distributions are less than the amortized investment cost. To the extent that the cost basis of the senior secured notes is fully recovered, any future distributions will be recorded as realized gains. |
(7) Security was called for redemption and the liquidation of the underlying loan portfolio is ongoing. |
(8) This investment has contractual payment-in-kind (“PIK”) interest. PIK interest computed at the contractual rate is accrued into income and reflected as receivable up to the capitalization date. |
(9) All investments are pledged as collateral for the Credit Facility (see Note 11). |
|
| See accompanying notes to financial statements. |
2023 SEMI-ANNUAL REPORT
PRIORITY INCOME FUND, INC. 24
Notes to Financial Statements (unaudited)
December 31, 2022
Note 1. Principal Business and Organization
Priority Income Fund, Inc., (the “Company,” “us,” “our,” or “we”) was incorporated under the general corporation laws of the State of Maryland on July 19, 2012 as an externally managed, nondiversified, closed-end management investment company under the Investment Company Act of 1940, as amended (the “1940 Act”), and commenced operations on May 9, 2013. In addition, the Company has elected to be treated for tax purposes as a regulated investment company (“RIC”) under Subchapter M of the Internal Revenue Code of 1986, as amended (the “Code”). The Company’s investment objective is to generate current income, and as a secondary objective, long-term capital appreciation. We seek to achieve our investment objective by investing, under normal circumstances, in senior secured loans made to companies whose debt is rated below investment grade or, in limited circumstances, unrated (“Senior Secured Loans”) with an emphasis on current income. Our investments may take the form of the purchase of Senior Secured Loans (either in the primary or secondary markets) or through investments in the equity and junior debt tranches of collateralized loan obligation (“CLO”) vehicles that in turn own pools of Senior Secured Loans. The Company intends to invest in both the primary and secondary markets.
The Company is managed by Priority Senior Secured Income Management, LLC (the “Adviser”), which is registered as an investment adviser under the Investment Advisers Act of 1940, as amended. The Adviser is 50% owned by Prospect Capital Management, L.P. (“PCM”) and 50% by Stratera Holdings, LLC (“Stratera Holdings”).
The Company is offering up to 100,000,000 shares of its common stock, on a best efforts basis. The Company commenced the offering on May 9, 2013, at an initial offering price of $15.00 per share, for an initial offering period of 36 months from the date of the commencement of the offering. On January 6, 2014, the Company satisfied its minimum offering requirement by raising over $2.5 million from selling shares to persons not affiliated with the Company or the Adviser (the “Minimum Offering Requirement”), and as a result, broke escrow and commenced making investments.
On February 9, 2016 the Company’s Board of Directors the (the “Board”) approved an 18-month extension to the offering period for the sale of the Company’s common shares through November 9, 2017. Subsequently, on May 30, 2017, the Board approved a continuation of the offering for an additional two years, extending the offering period for the sale of shares through November 2, 2019. On November 25, 2019, the Board approved an additional 18-month continuous public offering period through July 23, 2021. On April 30, 2021, due to the widespread impact of COVID-19 on the economy and financial markets, the Board approved a continuation of the offering through December 31, 2022. On November 3, 2022, the Board approved an extension of the offering until the date upon which 150,000,000 common shares have been sold in the course of our offerings, unless terminated or further extended or increased by the Board of Directors, in its sole discretion.
On December 21, 2018 the Board approved a definitive agreement (the “Merger Agreement”) pursuant to which the Company agreed, subject to the satisfaction of certain closing conditions, to acquire Stira Alcentra Global Credit Fund, a Delaware statutory trust (“Stira Alcentra”), in a common stock transaction (the “Stira Alcentra Acquisition”). The transaction was treated as an asset acquisition in accordance with ASC 805, Business Combinations. The transaction was completed on May 10, 2019.
Note 2. Summary of Significant Accounting Policies
The following is a summary of significant accounting policies followed by the Company in the preparation of its financial statements.
Basis of Presentation
The accompanying financial statements have been prepared in accordance with United States generally accepted accounting principles (“GAAP”) pursuant to the requirements for reporting on Form N-CSR, ASC 946, Financial Services - Investment Companies (“ASC 946”), and Articles 6, 10 and 12 of Regulation S-X.
Reclassifications
Certain reclassifications have been made in the presentation of prior consolidated financial statements and accompanying notes to conform to the presentation as of and for the six months ended December 31, 2022.
Use of Estimates
The preparation of financial statements in conformity with GAAP requires management to make estimates and assumptions that affect the reported amounts of assets and liabilities and disclosure of contingent assets and liabilities at the date of the financial statements and the reported amounts of income, expenses and gains (losses) during the reporting period. Actual results could differ from those estimates and those differences could be material.
2023 SEMI-ANNUAL REPORT
PRIORITY INCOME FUND, INC. 25
Cash and Restricted Cash
Cash held at financial institutions, has exceeded the Federal Deposit Insurance Corporation (“FDIC”) insured limit. The Company has not incurred any losses on these accounts, and the credit risk exposure is mitigated by the financial strength of the banking institutions where the amounts are held. The Company has restrictions on the uses of the cash held based on the terms of the Facility (as defined in Note 11). Cash and restricted cash are carried at cost, which approximates fair value.
Investment Risks
Our investments are subject to a variety of risks. Those risks include the following:
Market Risk
Market risk represents the potential loss that can be caused by a change in the fair value of the financial instrument.
Credit Risk
Credit risk represents the risk that we would incur if the counterparties failed to perform pursuant to the terms of their agreements with us.
Credit Spread Risk
Credit spread risk represents the risk that with higher interest rates comes a higher risk of defaults.
Liquidity Risk
Liquidity risk represents the possibility that we may not be able to rapidly adjust the size of our investment positions in times of high volatility and financial stress at a reasonable price.
Interest Rate Risk
Interest rate risk represents a change in interest rates, which could result in an adverse change in the fair value of an interest-bearing financial instrument.
Prepayment Risk
Many of our debt investments allow for prepayment of principal without penalty. Downward changes in interest rates may cause prepayments to occur at a faster than expected rate, thereby effectively shortening the maturity of the security and making us less likely to fully earn all of the expected income of that security and reinvesting in a lower yielding instrument.
Downgrade Risk
Downgrade risk results when rating agencies lower their rating on a bond which are usually accompanied by bond price declines.
Default Risk
Default risk is the risk that a borrower will be unable to make the required payments on their debt obligation.
Structured Credit Related Risk
CLO investments may be riskier and less transparent to us than direct investments in underlying companies. CLOs typically will have no significant assets other than their underlying senior secured loans. Therefore, payments on CLO investments are and will be payable solely from the cash flows from such senior secured loans.
Market Disruption and Geopolitical Risk
Geopolitical and other events, such as war (including Russia's military invasion of Ukraine), terrorist attacks, public health crises and natural or environmental disasters, may disrupt securities markets and adversely affect global economies and markets. Those events, as well as other changes in non-U.S. and U.S. economic and political conditions, could adversely affect the value of the Company’s investments.
Economic Recessions Risk
Economic recessions or downturns could impair our portfolio investments and adversely affect our operating results.
Investments Transactions
Investments are recognized when we assume an obligation to acquire a financial instrument and assume the risks for gains or losses related to that instrument. Investments are derecognized when we assume an obligation to sell a financial instrument and forego the risks for gains or losses related to that instrument. Specifically, we record all security transactions at fair value on a
2023 SEMI-ANNUAL REPORT
PRIORITY INCOME FUND, INC. 26
trade date basis and changes in fair value are recognized in unrealized gain (loss) on investments on the Statement of Operations. Realized gains or losses on investments are calculated by using the specific identification method.
Investment Valuation
The Company follows guidance under Financial Accounting Standards Board Accounting Standards Codification Topic 820, Fair Value Measurements ("ASC 820"), which classifies the inputs used to measure fair values into the following hierarchy:
Level 1. Unadjusted quoted prices in active markets for identical assets or liabilities that the Company has the ability to access at the measurement date.
Level 2. Quoted prices for similar assets or liabilities in active markets, or quoted prices for identical or similar assets or liabilities on an inactive market, or other observable inputs other than quoted prices.
Level 3. Unobservable inputs for the asset or liability.
In all cases, the level in the fair value hierarchy within which the fair value measurement in its entirety falls is determined based on the lowest level input that is significant to the fair value measurement in its entirety. The assessment of the significance of a particular input to the fair value measurement in its entirety requires judgment and considers factors specific to each investment.
Investments for which market quotations are readily available are valued at such market quotations and are classified in Level 1 of the fair value hierarchy.
U.S. government securities for which market quotations are available are valued at a price provided by an independent pricing agent or primary dealer. The pricing agent or primary dealer provides these prices usually after evaluating inputs including yield curves, credit rating, yield spreads, default rates, cash flows, broker quotes and reported trades. U.S. government securities are categorized in Level 2 of the fair value hierarchy.
With respect to investments for which market quotations are not readily available, or when such market quotations are deemed not to represent fair value, the Board has approved a multi-step valuation process for each quarter, as described below, and such investments are classified in Level 3 of the fair value hierarchy:
1.Each portfolio investment is reviewed by investment professionals of the Adviser with the independent valuation firm engaged by the Board.
2.The independent valuation firm prepares independent valuations based on its own independent assessments and issue its report.
3.The Audit Committee of the Board (the “Audit Committee”) reviews and discusses with the independent valuation firm the valuation report, and then makes a recommendation to the Board of the value for each investment.
4.The Board discusses valuations and determines the fair value of such investments in the Company’s portfolio in good faith based on the input of the Adviser, the respective independent valuation firm and the Audit Committee.
For intra-quarter periods and pursuant to Rule 2a-5, the Board has designated the Adviser as the valuation designee (the “Valuation Designee”) for the purpose of performing fair value determinations for investments for which market quotations are not readily available, or when such market quotations are deemed not to represent fair value. The Board has approved a multi-step valuation process for such intra-quarter investment valuations, as described below, and such investments are classified in Level 3 of the fair value hierarchy:
1.Each portfolio investment is reviewed by investment professionals of the Adviser with the independent valuation firm engaged by the Board.
2.The independent valuation firm prepares independent valuations based on its own independent assessments and issue its report.
3.The Adviser, as the Company’s Valuation Designee, reviews and approves the independent valuation firm’s valuation report.
Our investments in CLOs are classified as Level 3 fair value measured securities under ASC 820 and are valued using a discounted multi-path cash flow model. The CLO structures are analyzed to identify the risk exposures and to determine an appropriate call date (i.e., expected maturity). These risk factors are sensitized in the multi-path cash flow model using Monte Carlo simulations, which is a simulation used to model the probability of different outcomes, to generate probability-weighted (i.e., multi-path) cash flows from the underlying assets and liabilities. These cash flows are discounted using appropriate market
2023 SEMI-ANNUAL REPORT
PRIORITY INCOME FUND, INC. 27
discount rates, and relevant data in the CLO market as well as certain benchmark credit indices are considered, to determine the value of each CLO investment. In addition, we generate a single-path cash flow utilizing our best estimate of expected cash receipts, and assess the reasonableness of the implied discount rate that would be effective for the value derived from the multi-path cash flows. We are not responsible for and have no influence over the asset management of the portfolios underlying the CLO investments we hold, as those portfolios are managed by non-affiliated third-party CLO collateral managers. The main risk factors are default risk, prepayment risk, interest rate risk, downgrade risk, and credit spread risk.
The types of factors that are taken into account in fair value determination include, as relevant, market changes in expected returns for similar investments, performance improvement or deterioration, the nature and realizable value of any collateral, the issuer’s ability to make payments and its earnings and cash flows, the markets in which the issuer does business, comparisons to traded securities, and other relevant factors. The SEC adopted Rule 2a-5 under the 1940 Act which established a consistent, principles-based framework for boards of directors to use in creating their own specific processes in order to determine fair values in good faith. Rule 2a-5's adoption did not have a significant impact on the Company’s financial statements and disclosures as our Board of Directors has chosen to continue to determine fair value in good faith for quarter end valuations. The Board of Directors has designated the Adviser as Valuation Designee for intra-quarter investment valuations.
Revenue Recognition
Interest Income - Equity Class
Interest income from investments in the “equity” positions of CLOs (typically income notes, subordinated notes or preferred shares) is recorded based on an estimation of an effective yield to expected maturity utilizing assumed future cash flows. The Company monitors the expected cash inflows from CLO equity investments, including the expected residual payments, and the estimated effective yield is updated periodically.
Interest Income - Debt Class
Interest income is recorded on an accrual basis using the contractual rate applicable to each debt investment and includes the accretion of discounts and amortization of premiums. Discounts from and premiums to par value on securities purchased are accreted/amortized into interest income over the life of the respective security using the effective interest method. The amortized cost of investments represents the original cost adjusted for the accretion of discounts and amortization of premiums, if any. Generally, if the Company does not expect the borrower to be able to service its debt and other obligations, the Company will, on a discretionary basis, place the debt instrument on non-accrual status and will generally cease recognizing interest income on that loan for financial reporting purposes until all principal and interest have been brought current through payment or due to restructuring such that the interest income is deemed to be collectible. Unpaid accrued interest is generally reversed when a loan is placed on non-accrual status. Interest payments received on non-accrual loans are either applied to the cost basis or interest income, depending upon the Fund’s judgment of the collectibility of the loan receivable. The Company generally restores non-accrual loans to accrual status when past due principal and interest is paid and, in the Fund’s judgment, the payments are likely to remain current. As of December 31, 2022, the Company had no non-accrual investments in its portfolio.
Paid-In-Kind Interest
The Company has certain investments in its portfolio that contain a payment-in-kind (“PIK”) interest provision, which represents contractual interest or dividends that are added to the principal balance and recorded as income. For the six months ended December 31, 2022, there was no PIK interest. For the six months ended December 31, 2022, $406,277 of previous PIK interest was repaid which reduced the principal balance. The Company stops accruing PIK interest when it is determined that PIK interest is no longer collectible. To maintain RIC tax treatment, and to avoid corporate tax, substantially all of this income must be paid out to the stockholders in the form of distributions, even though the Company has not yet collected the cash.
Preferred Stock
The Company carries its mandatorily redeemable Term Preferred Stock (as defined in “Note 7. Preferred Stock”) at accreted cost on the Statement of Assets and Liabilities, and not fair value. Refer to “Note 7. Preferred Stock” for further details. In accordance with ASC 480-10-25, the Company's Term Preferred Stock has been classified as a liability on the Statement of Assets and Liabilities. Dividends on its Term Preferred Stock (which are treated as interest payments for financial reporting purposes) are accrued monthly and paid quarterly. Unpaid dividends relating to the Term Preferred Stock are included in preferred dividend payable on the Statement of Assets and Liabilities and preferred dividend expense on the Statement of Operations. Deferred offering costs and deferred issuance costs are amortized and are included in Preferred dividend expense on the Statement of Operations over the term of the respective shares.
In accordance with ASC 480-10-S99-3A, the Company’s Cumulative Preferred Stock (as defined in “Note 7. Preferred Stock”) has been classified in temporary equity on the Statement of Assets and Liabilities due to the possibility of a change of control triggering event that could lead to redemption outside of the Company’s control. The Cumulative Preferred Stock is recorded
2023 SEMI-ANNUAL REPORT
PRIORITY INCOME FUND, INC. 28
net of offering costs and issuance costs. Unpaid dividends relating to the Cumulative Preferred Stock are included in cumulative preferred stock on the Statement of Assets and Liabilities. Dividends declared on the Cumulative Preferred Stock are included in dividends declared on Cumulative Preferred Stock on the Statement of Operations. Dividends on Cumulative Preferred Stock are accrued monthly and paid quarterly. The Cumulative Preferred Stock is not adjusted to its redemption amount as it is not probable it will be redeemed as it has not reached its optional redemption date.
Asset Coverage Requirement
As a registered closed-end investment company, the Company is required to comply with the asset coverage requirements of the 1940 Act. Under the 1940 Act, the Company may not issue additional preferred stock if immediately after such issuance the Company will not have an asset coverage of at least 200% (defined as the ratio of the Company’s gross assets (less all liabilities and indebtedness not represented by senior securities) to its outstanding senior securities representing indebtedness, plus the aggregate involuntary liquidation preference of the Company’s outstanding preferred stock). If the value of our assets declines, we may be unable to satisfy this test. If that happens, we may be required to sell a portion of our investments and, depending on the nature of our leverage, repay a portion of our indebtedness or redeem outstanding shares of preferred stock, in each case at a time when doing so may be disadvantageous. Also, any amounts that we use to service our indebtedness or preferred dividends would not be available for distributions to our preferred stockholders. Further, the Company may be restricted from making distributions to holders of the Company’s common stock if the Company does not have asset coverage of at least 200%. As a result of issuing senior securities, we would also be exposed to typical risks associated with leverage, including an increased risk of loss.
With respect to senior securities representing indebtedness, such as the senior unsecured notes or any bank borrowings (other than temporary borrowings as defined under the 1940 Act), the Company is required to have asset coverage of at least 300%, immediately after such issuance or borrowing, and calculated as the ratio of the Company’s gross assets, less all liabilities and indebtedness not represented by senior securities, over the aggregate amount of the Company’s outstanding senior securities representing indebtedness.
Common Stock Offering Costs
Common stock offering costs are capitalized to deferred common stock offering costs on the Statement of Assets and Liabilities and amortized to expense over the 12 month period following such capitalization on a straight line basis.
Common stock offering expenses consist of costs for the registration, certain marketing and distribution of the Company’s common shares. These expenses include, but are not limited to, expenses for legal, accounting, printing and certain marketing, and include salaries and direct expenses of the Adviser’s employees, employees of its affiliates and others for providing these services.
Due to Adviser
Amounts due to our Adviser consist of base management fees, incentive fees, routine non-compensation overhead, and operating expenses and offering expenses paid on behalf of the Company. All balances due to the Adviser are settled quarterly.
Deferred Issuance Costs on Mandatorily Redeemable Term Preferred Stock
Deferred issuance costs on Term Preferred Stock consist of fees and expenses incurred in connection with the closing of preferred stock offerings, and are capitalized at the time of payment. These costs are amortized using the effective yield method over the term of the respective preferred stock series. This amortization expense is included in interest expense in the Fund’s financial statements. Upon early termination of preferred stock, the remaining balance of unamortized fees related to such debt is accelerated into realized loss on redemption of term preferred stock on the Fund’s Statement of Operations.
Financing Costs
The Company records origination expenses related to the Facility (as defined in Note 11) as deferred financing costs. These expenses are deferred and amortized as part of interest expense using the effective interest method over the stated life of the obligation for the Facility. Debt issuance costs and origination discounts related to the 2035 Notes (as defined in Note 12) are presented net against the outstanding principal of the respective instrument and amortized as part of interest expense using the effective interest method over the stated life of the respective instrument. In the event that we modify or extinguish our debt before maturity, we follow the guidance in ASC 470-50, Modification and Extinguishments (“ASC 470-50”). For extinguishments of the Facility or the 2035 Notes, any unamortized deferred costs are expensed.
Dividends and Distributions
Dividends and distributions to common stockholders, which are determined in accordance with U.S. federal income tax regulations, are recorded on the record date. The amount to be paid out as a dividend or distribution is approved by the Board. Net realized capital gains, if any, are generally distributed or deemed distributed at least annually.
2023 SEMI-ANNUAL REPORT
PRIORITY INCOME FUND, INC. 29
Income Taxes
The Company has elected to be treated as a RIC for U.S. federal income tax purposes and intends to comply with the requirement of the Code applicable to RICs. In order to continue to qualify for RIC tax treatment among other things, the Company is required to timely distribute at least 90% of its investment company taxable income (the “Annual Distribution Requirement”) and intends to distribute all of the Company’s investment company taxable income and net capital gain to common stockholders; therefore, the Company has made no provision for income taxes. The character of income and gains that the Company will distribute is determined in accordance with income tax regulations that may differ from U.S. GAAP. Book and tax basis differences relating to stockholder dividends and distributions and other permanent book and tax differences are reclassified to paid-in capital.
As of December 31, 2022, the cost basis of investments for tax purposes was $912,347,714 resulting in an estimated net realized depreciation of $(34,977,426). The gross unrealized appreciation and depreciation as of December 31, 2022 were $52,983,875 and $(87,961,301), respectively.
If the Company does not distribute (or is not deemed to have distributed) at least (1) 98% of its calendar year ordinary income; (2) 98.2% of its capital gains for the one-year period ending October 31 in that calendar year; and (3) any ordinary net income and capital gains net income recognized in preceding years, but were not distributed during such years, and on which the Company paid no corporate-level U.S. federal income tax, the Company will generally be required to pay a nondeductible U.S. federal excise tax equal to 4% of such excess amounts. To the extent that the Company determines that its estimated current calendar year taxable income will be in excess of estimated current calendar year dividend distributions from such taxable income, the Company accrues excise taxes, if any, on estimated excess taxable income. As of and for the calendar year ended December 31, 2022, we determined that the Company met the distribution requirements and therefore was not required to pay excise tax.
If the Company fails to satisfy the Annual Distribution Requirement or otherwise fails to qualify as a RIC in any taxable year, the Company would be subject to tax on all of its taxable income at regular corporate rates. The Company would not be able to deduct distributions to common stockholders, nor would the Company be required to make distributions. Distributions would generally be taxable to the Company’s individual and other non-corporate taxable common stockholders as ordinary dividend income eligible for the reduced maximum rate applicable to qualified dividend income to the extent of the Company’s current and accumulated earnings and profits, provided certain holding period and other requirements are met. Subject to certain limitations under the Code, corporate distributions would be eligible for the dividends-received deduction. To qualify again to be taxed as a RIC in a subsequent year, the Company would be required to distribute to its common stockholders the Company’s accumulated earnings and profits attributable to non-RIC years reduced by an interest charge of 50% of such earnings and profits payable by us as an additional tax. In addition, if the Company failed to qualify as a RIC for a period greater than two taxable years, then, in order to qualify as a RIC in a subsequent year, the Company would be required to elect to recognize and pay tax on any net built-in gain (the excess of aggregate gain, including items of income, over aggregate loss that would have been realized if the Company had been liquidated) or, alternatively, be subject to taxation on such built-in gain recognized for a period of five years.
The Company follows ASC 740, Income Taxes (“ASC 740”). ASC 740 provides guidance for how uncertain tax positions should be recognized, measured, presented, and disclosed in the financial statements. ASC 740 requires the evaluation of tax positions taken or expected to be taken in the course of preparing the Company’s tax returns to determine whether the tax positions are “more-likely-than-not” of being sustained by the applicable tax authority. Tax positions not deemed to meet the more-likely-than not threshold are recorded as a tax benefit or expense in the current year. As of December 31, 2022 and for the six months then ended, the Company did not have a liability for any unrecognized tax benefits. Management has analyzed the Company’s positions taken and expected to be taken on its income tax returns for all open tax years and for the year ended June 30, 2022, and has concluded that as of December 31, 2022, no provision for uncertain tax position is required in the Company’s financial statements. Our determinations regarding ASC 740 may be subject to review and adjustment at a later date based upon factors including, but not limited to, an on-going analysis of tax laws, regulations and interpretations thereof. All federal and state income tax returns for each tax year in the three-year period ended June 30, 2022 remain subject to examination by the Internal Revenue Service and state departments of revenue.
Recent Accounting Pronouncements
In March 2020, the FASB issued ASU 2020-04, Reference Rate Reform. The amendments in ASU 2020-04 provide optional expedients and exceptions for applying GAAP to contracts, hedging relationships, and other transactions affected by reference rate reform if certain criteria are met. The standard is effective as of March 12, 2020 through December 31, 2024, as updated by ASU 2022-06, Reference Rate Reform (Topic 848): Deferral of the Sunset Date of Topic 848 in December 2022. Management is currently evaluating the impact of the optional guidance on the Company's financial statements and disclosures. The
2023 SEMI-ANNUAL REPORT
PRIORITY INCOME FUND, INC. 30
Company did not utilize the optional expedients and exceptions provided by ASU 2020-04 during the six months ended December 31, 2022.
In December 2020, the SEC adopted Rule 2a-5, which went into effect on September 8, 2022. The rule established a consistent, principles-based framework for boards of directors to use in creating their own specific processes in order to determine fair values in good faith. Rule 2a-5's adoption did not have a significant impact on the Company’s financial statements and disclosures as our Board of Directors has chosen to continue to determine fair value in good faith for quarter end valuations. The Board of Directors has designated the Adviser as Valuation Designee for intra-quarter investment valuations.
Note 3. Portfolio Investments
Purchases of investment securities (excluding short-term securities) for the six months ended December 31, 2022 were $63,238,889. During the six months ended December 31, 2022, the Company recognized realized gains of $9,171 from an investment which has been called. The Company received $163,896 from liquidating payments on investments that were written-off for tax purposes, which resulted in realized gains.
The following table shows the fair value of our investments disaggregated into the three levels of the ASC 820 valuation hierarchy as of December 31, 2022:
| | | | | | | | | | | | | | | | | | | | | | | |
| Level 1 | | Level 2 | | Level 3 | | Total |
| Assets | | | | | | | |
| Collateralized Loan Obligations - Equity Class | $ | — | | | $ | — | | | $ | 754,044,326 | | | $ | 754,044,326 | |
| Collateralized Loan Obligations - Debt Class | — | | | — | | | 123,325,962 | | | 123,325,962 | |
| $ | — | | | $ | — | | | $ | 877,370,288 | | | $ | 877,370,288 | |
The following table shows the aggregate changes in fair value of our Level 3 investments during the six months ended December 31, 2022:
| | | | | | | | | | | |
| Collateralized Loan Obligation - Equity Class | Collateralized Loan Obligation - Debt Class | Total |
| Fair value at June 30, 2022 | $ | 766,507,176 | | $ | 79,686,318 | | $ | 846,193,494 | |
| Net realized gain on investments | 173,067 | | — | | 173,067 | |
| Net change in unrealized gain (loss) on investments | (50,676,844) | | (1,551,189) | | (52,228,033) | |
| Purchases of investments | 18,923,844 | | 44,315,045 | | 63,238,889 | |
| Payment-in-kind interest | — | | (406,277) | | (406,277) | |
| Repayments from investments | (3,930,524) | | — | | (3,930,524) | |
| Proceeds from sales of investments | — | | — | | — | |
| Accretion of purchase discount, net | 23,047,601 | | 1,282,071 | | 24,329,672 | |
Transfers into Level 3(1) | — | | — | | — | |
Transfers out of Level 3(1) | — | | — | | — | |
| Fair value at December 31, 2022 | $ | 754,044,320 | | $ | 123,325,968 | | $ | 877,370,288 | |
| | | |
| Net increase in unrealized loss attributable to Level 3 investments still held at the end of the period | $ | (50,676,844) | | $ | (1,551,189) | | $ | (52,228,033) | |
| | | |
(1) Transfers are assumed to have occurred at the beginning of the quarter during which the asset was transferred. There were no transfers in or out of Level 3 during the six months ended December 31, 2022. |
The following table provides quantitative information about significant unobservable inputs used in the fair value measurement of Level 3 investments as of December 31, 2022:
2023 SEMI-ANNUAL REPORT
PRIORITY INCOME FUND, INC. 31
| | | | | | | | | | | | | | | | | | | | | | | | | | | | | | | | |
| | | | | | Unobservable Input |
| Asset Category | | Fair Value | | Primary Valuation Technique | | Input | | Range(1)(2) | | Weighted Average(1)(2) |
| Collateral Loan Obligations - Equity Class | | $ | 754,044,320 | | | Discounted Cash Flow | | Discount Rate | | 1.42% - 54.32% | | 27.96% |
| Collateral Loan Obligations - Debt Class | | 123,325,968 | | | Discounted Cash Flow | | Discount Rate | | 11.25% - 23.15% | | 16.76% |
| Total Level 3 Investments | | $ | 877,370,288 | | | | | | | | | |
(1) Excludes investments that have been called for redemption.
(2) Represents the implied discount rate based on our internally generated single-path cash flows that are derived from the fair value estimated by the corresponding multi-path cash flow model utilized by the independent valuation firm.
In determining the range of values for our investments in CLOs, the independent valuation firm uses a discounted multi-path cash flow model. The valuations were accomplished through the analysis of the CLO deal structures to identify the risk exposures from the modeling point of view as well as to determine an appropriate call date (i.e., expected maturity). These risk factors are sensitized in the multi-path cash flow model using Monte Carlo simulations to generate probability-weighted (i.e., multi-path) cash flows for the underlying assets and liabilities. These cash flows are discounted using appropriate market discount rates, and relevant data in the CLO market and certain benchmark credit indices are considered, to determine the value of each CLO investment. In addition, we generate a single-path cash flow utilizing our best estimate of expected cash receipts, and assess the reasonableness of the implied discount rate that would be effective for the value derived from the corresponding multi-path cash flow model.
The significant unobservable input used to value the CLOs is the discount rate applied to the estimated future cash flows expected to be received from the underlying investment, which includes both future principal and interest payments. Included in the consideration and selection of the discount rate are the following factors: risk of default, comparable investments, and call provisions. An increase or decrease in the discount rate applied to projected cash flows, where all other inputs remain constant, would result in a decrease or increase, respectively, in the fair value measurement.
The Company is not responsible for and has no influence over the management of the portfolios underlying the CLO investments the Company holds as those portfolios are managed by non-affiliated third party CLO collateral managers. CLO investments may be riskier and less transparent to the Company than direct investments in underlying companies. CLOs typically will have no significant assets other than their underlying senior secured loans. Therefore, payments on CLO investments are and will be payable solely from the cash flows from such senior secured loans.
The Company’s portfolio primarily consists of residual interests investments in CLOs, which involve a number of significant risks. CLOs are typically highly levered (10 - 14 times), and therefore the residual interest tranches that the Company invests in are subject to a higher degree of risk of total loss. In particular, investors in CLO residual interests indirectly bear risks of the underlying loan investments held by such CLOs. The Company generally has the right to receive payments only from the CLOs, and generally do not have direct rights against the underlying borrowers or the entity that sponsored the CLO. While the CLOs the Company targets generally enable the investor to acquire interests in a pool of senior loans without the expenses associated with directly holding the same investments, the Company’s prices of indices and securities underlying CLOs will rise or fall. These prices (and, therefore, the values of the CLOs) will be influenced by the same types of political and economic events that affect issuers of securities and capital markets generally. The failure by a CLO investment in which the Company invests to satisfy financial covenants, including with respect to adequate collateralization and/or interest coverage tests, could lead to reductions in its payments to the Company. In the event that a CLO fails certain tests, holders of debt senior to the Company may be entitled to additional payments that would, in turn, reduce the payments the Company would otherwise be entitled to receive. Separately, the Company may incur expenses to the extent necessary to seek recovery upon default or to negotiate new terms with a defaulting CLO or any other investment the Company may make. If any of these occur, it could materially and adversely affect the Company’s operating results and cash flows.
The interests the Company has acquired in CLOs are generally thinly traded or have only a limited trading market. CLOs are typically privately offered and sold, even in the secondary market. As a result, investments in CLOs may be characterized as illiquid securities. In addition to the general risks associated with investing in debt securities, CLO residual interests carry additional risks, including, but not limited to: (i) the possibility that distributions from collateral securities will not be adequate to make interest or other payments; (ii) the quality of the collateral may decline in value or default; (iii) the fact that the Company’s investments in CLO tranches will likely be subordinate to other senior classes of note tranches thereof; and (iv) the complex structure of the security may not be fully understood at the time of investment and may produce disputes with the CLO
2023 SEMI-ANNUAL REPORT
PRIORITY INCOME FUND, INC. 32
investment or unexpected investment results. The Company’s net asset value may also decline over time if the Company’s principal recovery with respect to CLO residual interests is less than the price that the Company paid for those investments. The Company’s CLO investments and/or the underlying senior secured loans may prepay more quickly than expected, which could have an adverse impact on its value.
An increase in interest rates would materially increase the CLO’s financing costs. Since most of the collateral positions within the CLOs have interest rate floors, there may not be corresponding increases in investment income (if interest rates increases but stays below the interest rate floor of such investments) resulting in materially smaller distribution payments to the residual interest investors.
The United Kingdom’s Financial Conduct Authority announced a phase out of the LIBOR in 2017. Although many LIBOR rates ceased to be published or no longer are representative of the underlying market they seek to measure after December 31, 2021, a selection of widely used U.S. dollar LIBOR rates will continue to be published through June 2023 in order to assist with the transition. Further, on March 15, 2022, the Consolidated Appropriations Act of 2022, which includes the Adjustable Interest Rate (LIBOR) Act, was signed into law in the United States. This legislation establishes a uniform benchmark replacement process for financial contracts that mature after June 30, 2023 that do not contain clearly defined or practicable fallback provisions. The FRS, in conjunction with the ARRC, a steering committee comprised of large U.S. financial institutions, has begun publishing SOFR, which is their preferred alternative rate for U.S. dollar LIBOR, and which is a new index calculated by short-term repurchase agreements, backed by Treasury securities. Proposals for alternative reference rates for other currencies have also been announced or have already begun publication. Markets are in the process of developing in response to these new rates. Although financial regulators and industry working groups have suggested alternative reference rates, such as the European Interbank Offer Rate, the Sterling Overnight Interbank Average Rate and SOFR, there has been no global consensus as to an alternative rate and the process for amending existing contracts or instruments to transition away from LIBOR remains incomplete. Given the inherent differences between LIBOR and SOFR, or any other alternative benchmark rate that may be established, there remains uncertainty regarding the future utilization of LIBOR and the nature of any replacement rate. In many cases, the nominated replacements, as well as other potential replacements, are not complete or ready to implement and require margin adjustments. There is currently no final consensus as to which benchmark rate(s) (along with any adjustment and/or permutation thereof) will replace all or any LIBOR tenors (i.e., the maturity period) after the discontinuation thereof and there can be no assurance that any such replacement benchmark rate(s) will attain market acceptance. Uncertainty as to the nature of alternative reference rates and as to potential changes or other reforms to LIBOR, or any changes announced with respect to such reforms, may result in a sudden or prolonged increase or decrease in the reported LIBOR rates and the value of LIBOR-based loans and securities, including those of other issuers we currently own or may own in the future. It remains uncertain how such changes would be implemented and the effects such changes would have on us, issuers of instruments in which we invest and financial markets generally.
If the Company owns more than 10% of the shares in a foreign corporation that is treated as a CFC (including residual interest tranche investments in a CLO investment treated as a CFC), for which the Company is treated as receiving a deemed distribution (taxable as ordinary income) each year from such foreign corporation in an amount equal to its pro rata share of the corporation’s income for the tax year (including both ordinary earnings and capital gains), the Company is required to include such deemed distributions from a CFC in its income and the Company is required to distribute such income to maintain its RIC tax treatment regardless of whether or not the CFC makes an actual distribution during such year.
The Company owns shares in PFICs (including residual interest tranche investments in CLOs that are PFICs), therefore the Company may be subject to federal income tax on a portion of any “excess distribution” or gain from the disposition of such shares even if such income is distributed as a taxable dividend to its common stockholders. Certain elections may be available to mitigate or eliminate such tax on excess distributions, but such elections (if available) will generally require the Company to recognize its share of the PFICs income for each year regardless of whether the Company receives any distributions from such PFICs. The Company must nonetheless distribute at least 90% of such income to maintain its tax treatment as a RIC.
If the Company is required to include amounts in income prior to receiving distributions representing such income, the Company may have to sell some of its investments at times and/or at prices management would not consider advantageous, raise additional debt or equity capital or forgo new investment opportunities for this purpose. If the Company is not able to obtain cash from other sources, it may fail to qualify for RIC tax treatment and thus become subject to corporate-level income tax.
The Company’s portfolio is concentrated in CLO vehicles, which is subject to a risk of loss if that sector experiences a market downturn. The Company is subject to credit risk in the normal course of pursuing its investment objectives. The Company’s maximum risk of loss from credit risk for its portfolio investments is the inability of the CLO collateral managers to return up to the cost value due to defaults occurring in the underlying loans of the CLOs.
2023 SEMI-ANNUAL REPORT
PRIORITY INCOME FUND, INC. 33
Investments in CLO residual interests generally offer less liquidity than other investment grade or high-yield corporate debt, and may be subject to certain transfer restrictions. The Company’s ability to sell certain investments quickly in response to changes in economic and other conditions and to receive a fair price when selling such investments may be limited, which could prevent the Company from making sales to mitigate losses on such investments. In addition, CLOs are subject to the possibility of liquidation upon an event of default of certain minimum required coverage ratios, which could result in full loss of value to the CLO residual interests and junior debt investors.
The fair value of the Company’s investments may be significantly affected by changes in interest rates. The Company’s investments in senior secured loans through CLOs are sensitive to interest rate levels and volatility. In the event of a significant rising interest rate environment and/or economic downturn, loan defaults may increase and result in credit losses which may adversely affect the Company’s cash flow, fair value of its investments and operating results. In the event of a declining interest rate environment, a faster than anticipated rate of prepayments is likely to result in a lower than anticipated yield.
Due to the inherent uncertainty of determining the fair value of investments that do not have a readily available market value, the fair value of the Company’s investments may fluctuate from period to period. Additionally, the fair value of the Company’s investments may differ significantly from the values that would have been used had a ready market existed for such investments and may differ materially from the values that we may ultimately realize. Further, such investments are generally subject to legal and other restrictions on resale or otherwise are less liquid than publicly traded securities. If the Company was required to liquidate a portfolio investment in a forced or liquidation sale, the Company could realize significantly less than the value at which the Company has recorded it.
In addition, changes in the market environment and other events that may occur over the life of the investments may cause the gains or losses ultimately realized on these investments to be different than the unrealized gains or losses reflected in the currently assigned valuations.
Note 4. Capital
The Company offers its shares of common stock with varying up-front sales loads and has elected to designate each level of sales load as a “class” solely as a means of identifying those differing sales loads and the different channels through which shares are sold. Shares available to the general public are charged selling commissions and dealer manager fees and are referred to as “Class R Shares”. Shares available to accounts managed by registered investment advisers are charged dealer manager fees but no selling commissions and are referred to as “Class RIA Shares”. Shares available for purchase through (1) fee-based programs, also known as wrap accounts, of investment dealers, (2) participating broker-dealers that have alternative fee arrangements with their clients, (3) certain registered investment advisors or (4) bank trust departments or any other organization or person authorized to act in a fiduciary capacity for its clients or customers are charged no selling commissions or dealer manager fees and are referred to as “Class I Shares.” Although the Company uses “Class” designations to indicate its differing sales load structures, the Company does not operate as a multi-class fund.
The Company’s authorized stock consists of 200,000,000 shares of stock, par value $0.01 per share, 50,000,000 of which are classified as Term Preferred Stock, par value $0.01 per share, or “Preferred Stock” and 150,000,000 of which are classified as common stock. All shares of common stock have identical voting and distributions rights, and bear their own pro rata portion of the Company’s expenses and have the same net asset value.
Transactions in shares of common stock were as follows during the six months ended December 31, 2022 and the year ended June 30, 2022:
2023 SEMI-ANNUAL REPORT
PRIORITY INCOME FUND, INC. 34
| | | | | | | | | | | | | | |
| | Total |
| | Shares | | Amount |
| Six Months Ended December 31, 2022: | | | | |
| Gross shares sold | | 7,235,349 | | | $ | 89,283,071 | |
| Shares issued from reinvestment of distributions | | 820,907 | | | 9,166,823 | |
| Repurchase of common shares | | (1,562,331) | | | (18,494,627) | |
| Net increase from capital transactions | | 6,493,925 | | | $ | 79,955,267 | |
| | | | |
| Year Ended June 30, 2022: | | | | |
| Gross shares sold | | 7,752,485 | | | $ | 103,968,590 | |
| Shares issued from reinvestment of distributions | | 1,743,574 | | | 20,851,185 | |
| Repurchase of common shares | | (2,401,281) | | | (30,291,138) | |
| Net increase from capital transactions | | 7,094,778 | | | $ | 94,528,637 | |
At December 31, 2022, the Company had 50,490,629 shares of common stock issued and outstanding.
At June 30, 2022, the Company had 43,996,704 shares of common stock issued and outstanding.
Share Repurchase Program
The Company conducts quarterly tender offers pursuant to its share repurchase program. The Company’s Board considers the following factors, among others, in making its determination regarding whether to cause us to offer to repurchase shares and under what terms:
•the effect of such repurchases on our qualification as a RIC (including the consequences of any necessary asset sales);
•the liquidity of the Company’s assets (including fees and costs associated with disposing of assets);
•the Company’s investment plans and working capital requirements;
•the relative economies of scale with respect to the Company’s size;
•the Company’s history in repurchasing shares or portions thereof; and
•the condition of the securities markets.
The Company limits the number of shares to be repurchased in any calendar year to up to 2.5% of the number of shares outstanding at the close of business on the last day of the prior fiscal year. At the discretion of the Company’s Board, the Company may use cash on hand, and cash from the sale of investments as of the end of the applicable period to repurchase shares. The Company will offer to repurchase such shares at a price equal to the net asset value per share of our common stock specified in the tender offer. The Company’s Board may suspend or terminate the share repurchase program at any time. The first such tender offer commenced in May 2015.
The following table sets forth the number of common shares that were repurchased by the Company in each tender offer:
2023 SEMI-ANNUAL REPORT
PRIORITY INCOME FUND, INC. 35
| | | | | | | | | | | | | | | | | | | | | | | | | | | | | | | | |
| Quarterly Offer Date | | Repurchase Date | | Shares Repurchased | | Percentage of Shares Tendered That Were Repurchased | | Repurchase Price Per Share | | Aggregate Consideration for Repurchased Shares |
| For the Six Months Ended December 31, 2022 |
| June 30, 2022 | | July 29, 2022 | | 848,423 | | | 100.00 | % | | $ | 12.08 | | | $ | 10,249,069 | |
| September 30, 2022 | | November 4, 2022 | | 713,908 | | | 100.00 | % | | 11.55 | | | 8,245,558 | |
| Total for the six months ended December 31, 2022 | | 1,562,331 | | | | | | | $ | 18,494,627 | |
| | | | | | | | | | |
| For the Year Ended June 30, 2022 |
| June 30, 2021 | | July 28, 2021 | | 375,861 | | | 35.91 | % | | $ | 12.17 | | | $ | 4,574,227 | |
| September 30, 2021 | | October 27, 2021 | | 377,210 | | | 36.90 | % | | 12.46 | | | 4,700,039 | |
| December 31, 2021 | | January 28, 2022 | | 384,510 | | | 36.17 | % | | 12.69 | | | 4,879,428 | |
| March 31, 2022 | | April 24, 2022 | | 1,263,700 | | | 70.44 | % | | 12.77 | | | 16,137,444 | |
| Total for the year ended June 30, 2022 | | 2,401,281 | | | | | | | $ | 30,291,138 | |
On December 23, 2022, the Company made an offer to purchase up 1,099,918 shares of its issued and outstanding common stock, par value $0.01 per share, which amount represents 2.5% of the number of shares outstanding at the close of business on the last day of the prior fiscal year ended June 30, 2022. The offer began on December 30, 2022 and expired at 4:00 p.m., Eastern Time, on February 2, 2023, and a total of 1,194,710 shares were validly tendered and not withdrawn pursuant to the offer as of such date, an amount that exceeded the maximum number of shares the Company offered to purchase pursuant to the offer. In accordance with Rule 13e-4(f), the Company determined to accept for purchase an additional 0.2% of its outstanding shares. In accordance with the terms of the offer and Rule 13e-4(f), the Company purchased all 1,194,710 Shares validly tendered and not withdrawn, at a price equal to $11.26 per Share, for an aggregate purchase price of approximately $13,452,436. The purchase price per Share was equal to the net asset value per Share as of January 31, 2023. All Shares tendered by each shareholder who participated in the tender offer were repurchased by the Company.
From time to time, the Company may repurchase a portion of its common and preferred stock and is notifying you of such intention as required by applicable securities law.
Note 5. Transactions with Affiliates
Investment Advisory Agreement
On May 9, 2013, the Company entered into an initial investment advisory agreement with the Adviser (the "Prior Advisory Agreement"). On May 30, 2019, the Company held a special meeting of stockholders at which stockholders voted to approve a new investment advisory agreement with the Adviser that is identical in all respects except for the date of effectiveness and the term to the Prior Investment Advisory Agreement, which had terminated as a result of a technical “change in control” and “assignment” as such terms are defined under the 1940 Act. The Adviser manages the day-to-day investment operations of, and provides investment advisory services to, the Company. For providing these services, the Adviser is paid a base management fee and an incentive fee. The base management fee, payable quarterly in arrears, is calculated at an annual rate of 2.0% based on the average of the total assets as of the end of the two most recently completed calendar quarters. The Company also pays routine non-compensation overhead expenses of the Adviser in an amount up to 0.0625% per quarter (0.25% annualized) of the Company’s average total assets. The incentive fee is calculated and payable quarterly in arrears based on the Company’s pre-incentive fee net investment income for the immediately preceding quarter. For this purpose, pre-incentive fee net investment income means interest income, dividend income and any other income (including any other fees, such as commitment, origination, structuring, diligence and consulting fees or other fees received) accrued during the calendar quarter, minus operating expenses for the quarter (including the base management fee, expenses reimbursed under the Investment Advisory Agreement, the administration agreement and the investor services agreement, any interest expense and dividends paid on any issued and outstanding preferred shares, but excluding the organization and offering expenses and incentive fee). Pre-incentive fee net investment income includes, in the case of investments with a deferred interest feature (such as original issue discount, debt instruments with payment-in-kind interest and zero coupon securities), accrued income that we have not yet received in cash. Pre-incentive fee net investment income does not include any realized capital gains, realized capital losses or unrealized capital appreciation or depreciation. Pre-incentive fee net investment income, expressed as a rate of return on the value of the Company’s net assets at the end of the immediately preceding calendar quarter, is compared to the preferred return rate of 1.5% per quarter (6.0% annualized). The Company pays the Adviser an incentive fee with respect to its pre-incentive fee net investment income in each calendar quarter as follows: (1) no incentive fee in any calendar quarter in which the pre-incentive
2023 SEMI-ANNUAL REPORT
PRIORITY INCOME FUND, INC. 36
fee net investment income does not exceed the preferred return rate; (2) 100% of the pre-incentive fee net investment income, if any, that exceeds the preferred return rate but is less than 1.875% in any calendar quarter (7.5% annualized); and (3) 20.0% of the pre-incentive fee net investment income, if any, that exceeds 1.875% in any calendar quarter. These calculations are appropriately pro-rated for any period of less than three months.
For the six months ended December 31, 2022, expenses incurred by the Company and the payable amount remaining at December 31, 2022 in connection with the Investment Advisory Agreement were as follows:
| | | | | | | | | | | | | | |
| Description | | Expense | | Payable |
Base management fee(1) | | $ | 8,898,017 | | | $ | 4,494,071 | |
Incentive fee(1) | | 13,798,309 | | | 7,181,885 | |
Routine non-compensation overhead expenses(2) | | 60,595 | | | 15,000 | |
| | | | |
(1) The payable amount is presented as part of the Due to Adviser line item on the Statement of Assets and Liabilities. |
| | |
(2) The payable amount is presented as part of the Due to Adviser line item on the Statement of Assets and Liabilities and the expense amount is presented as Adviser shared service expense on the Statement of Operations. |
Administration Agreement
On May 9, 2013, the Company entered into an administration agreement (the “Administration Agreement”) with Prospect Administration LLC (the “Administrator”), an affiliate of the Adviser. The Administrator performs, oversees and arranges for the performance of administrative services necessary for the operation of the Company. These services include, but are not limited to, accounting, finance, legal services and offerings of the Company’s debt, common stock and other securities. For providing these services, facilities and personnel, the Company reimburses the Administrator for the Company’s actual and allocable portion of expenses and overhead incurred by the Administrator in performing its obligations under the Administration Agreement, including rent and the Company’s allocable portion of the costs of its Chief Financial Officer and Chief Compliance Officer and her staff. During the six months ended December 31, 2022, $1,628,837 in administrator costs were incurred by the Company, $1,143,823 of which is included on the Statement of Assets and Liabilities as a payable under the Due to administrator line item.
Commissions and fees on shares of common stock sold
On December 5, 2019, we announced that Preferred Capital Securities, LLC (“PCS” or “Dealer Manager”), a broker dealer and wholesale distributor, would become the dealer manager for an 18-month follow-on common stock offering upon the effectiveness of our common share registration statement. On February 17, 2023, we filed a definitive prospectus with the SEC pursuant to which, through our Dealer Manager, we are offering up to 50,748,029 shares of our common stock until the date upon which 150,000,000 shares of our common stock have been sold in the course of our offerings, unless terminated or further extended or increased by the Board of Directors, in its sole discretion. PCS charges selling commissions of 6.0% and dealer manager fees of 0.75%, payable upon a purchase of “Class R” shares.
During the six months ended December 31, 2022, the total sales load incurred through the offering of our common stock was $4,151,909, which includes $3,621,595 of selling commissions and $530,314 of dealer manager fees. These fees are charged against additional paid-in capital on the Statements of Changes in Net Assets and Temporary Equity.
Common Stock Offering Costs
The Adviser, on behalf of the Company, paid or incurred common stock offering costs totaling $597,041 for the six months ended December 31, 2022. As of December 31, 2022, $609,863 remains as a deferred asset on the Statement of Assets and Liabilities, while $476,719 has been amortized to expense on the Statement of Operations during the six months ended December 31, 2022 .
Common stock offering expenses consist of costs for the registration, certain marketing activities and distribution of the Company’s common shares. These expenses include, but are not limited to, expenses for legal, accounting, printing and certain marketing activities, and include salaries and direct expenses of the Adviser’s employees, employees of its affiliates and others for providing these services.
At December 31, 2022, the total due to the Adviser for organization and common stock offering costs and operating expenses paid on behalf of the Company was $88,849, which is included within the Due to Adviser line item on the Statement of Assets and Liabilities, and is broken out as follows:
2023 SEMI-ANNUAL REPORT
PRIORITY INCOME FUND, INC. 37
| | | | | | | | | | | | | | | | | | | | |
| Fiscal Year | | Organization and Offering Costs (O&O) | | Operating Expenses (OpEx) paid on behalf of the Company | | Total Due to Adviser for O&O and OpEx paid on behalf of the Company |
| June 30, 2013 | | $ | 1,893,108 | | | $ | — | | | $ | 1,893,108 | |
| June 30, 2014 | | 984,744 | | | 558,394 | | | 1,543,138 | |
| June 30, 2015 | | 591,821 | | | 1,418,046 | | | 2,009,867 | |
| June 30, 2016 | | 442,107 | | | 1,148,321 | | | 1,590,428 | |
| June 30, 2017 | | 456,146 | | | 730,938 | | | 1,187,084 | |
| June 30, 2018 | | 419,077 | | | 24,239 | | | 443,316 | |
| June 30, 2019 | | 107,639 | | | 25,333 | | | 132,972 | |
| June 30, 2020 | | 867,504 | | | — | | | 867,504 | |
| June 30, 2021 | | 359,068 | | | — | | | 359,068 | |
| June 30, 2022 | | 898,724 | | | — | | | 898,724 | |
| June 30, 2023 | | 597,041 | | | — | | | 597,041 | |
| Total reimbursements made | | (7,528,130) | | | (3,905,271) | | | (11,433,401) | |
| Balance payable | | $ | 88,849 | | | $ | — | | | $ | 88,849 | |
Upon achieving the Minimum Offering Requirement, the Adviser was entitled to receive up to 5.0% of the gross proceeds from the offering as reimbursement for organization and common stock offering costs that it has funded, until all of the organization and common stock offering costs incurred and/or paid by the Adviser have been recovered. On January 8, 2014, the Adviser agreed to reduce such reimbursement and accept a maximum of 2% of the gross proceeds of the offering of the Company’s securities until all of the organization and common stock offering costs incurred and/or paid by the Adviser have been recovered.
Co-Investments
On January 13, 2020, (amended on August 2, 2022), the parent company of the Adviser received an exemptive order from the SEC (the “Order”), which superseded a prior co-investment exemptive order granted on February 10, 2014, granting the parent company the ability to negotiate terms other than price and quantity of co-investment transactions with other funds managed by the Adviser or certain affiliates, including Prospect Capital Corporation (“PSEC”), Prospect Floating Rate and Alternative Income Fund, Inc. (“PFLOAT”) and NGL Subsidiary Ltd. (“NGL”), where co-investing would otherwise be prohibited under the 1940 Act, subject to the conditions included therein.
Under the terms of the relief permitting us to co-invest with other funds managed by our Investment Adviser or its affiliates, a “required majority” (as defined in Section 57(o) of the 1940 Act) of the Company’s independent directors must make certain conclusions in connection with a co-investment transaction, including that (1) the terms of the proposed transaction, including the consideration to be paid, are reasonable and fair to the Company and its stockholders and do not involve overreaching of the Company or its stockholders on the part of any person concerned and (2) the transaction is consistent with the interests of the Company’s stockholders and is consistent with the Company’s investment objective and strategies. In certain situations where co-investment with one or more funds managed by the Adviser or its affiliates is not covered by the Order, such as when there is an opportunity to invest in different securities of the same issuer, the personnel of the Adviser or its affiliates will need to decide which fund will proceed with the investment. Such personnel will make these determinations based on policies and procedures, which are designed to reasonably ensure that investment opportunities are allocated fairly and equitably among affiliated funds over time and in a manner that is consistent with applicable laws, rules and regulations. Moreover, except in certain circumstances, when relying on the Order, the Company will be unable to invest in any issuer in which one or more funds managed or owned by the Adviser or its affiliates has previously invested.
Allocation of Expenses
For CLO investments held by each of the Company, PSEC, PFLOAT and NGL, the cost of valuation services with regard to such investments is initially borne by the Company, which then allocates to PSEC, PFLOAT and NGL their proportional share of such expense based on the number of positions held by each entity. During the six months ended December 31, 2022, the Company incurred $185,541 in expenses related to valuation services that are attributable to PSEC, PFLOAT and NGL. As of December 31, 2022, $274,858 is still owed to the Company from PSEC, PFLOAT and NGL. Additionally, during the six months ended December 31, 2022, the Company incurred $18,899 in expense related to marketing and insurance that are attributable to PSEC, of which $18,899 is still owed to the Company. The amounts owed to the Company are typically settled on a quarterly basis.
2023 SEMI-ANNUAL REPORT
PRIORITY INCOME FUND, INC. 38
Officers and Directors
Certain officers and directors of the Company are also officers and directors of the Adviser and its affiliates. For the six months ended December 31, 2022, $112,500 was paid to the independent directors of the Company, which is included as Directors fees on the Statement of Operations, of which $0 is still payable at December 31, 2022. The officers do not receive any direct compensation from the Company.
Services Agreement
PCM has engaged Preferred Shareholder Services, LLC, an affiliate of the Dealer Manager, to provide certain non-offering issuer support services pursuant to a services agreement. PCM is responsible for any payments due under such agreement. Starting on January 1, 2022, Prospect Capital Management allocated the costs under such services agreement to the Company quarterly, at an up to 0.25% per annum rate of the Company’s average monthly net assets. For the six months ended December 31, 2022, $698,484 of reimbursement was incurred, which is included in Adviser shared service expense on the Statement of Operations, of which $348,198 is still payable at December 31, 2022 .
Note 6. Dividends and Distributions
Dividends from net investment income and capital gain distributions are determined in accordance with U.S. federal income tax regulations, which differ from GAAP.
The following tables reflect the distributions per common share that the Company declared and paid or are payable to its common stockholders during the six months ended December 31, 2022. Common stockholders of record as of each respective record date were or will be entitled to receive the distribution.
| | | | | | | | | | | | | | | | | | | | |
| Record Date | | Payment Date | | Total Amount per Share(a) | | Amount Distributed |
| July 1, 8, 15, 22 and 29, 2022 | | August 1, 2022 | | 0.10070 | | | $ | 4,540,567 | |
| August 5, 12, 19 and 26, 2022 | | August 29, 2022 | | 0.08056 | | | 3,727,220 | |
September 2, 9, 16, 23 and 30, 2022(b) | | October 3, 2022 | | 0.17258 | | | 8,257,742 | |
| October 7, 14, 21 and 28, 2022 | | October 31, 2022 | | 0.08056 | | | 3,929,224 | |
| November 4, 11, 18 and 25, 2022 | | November 28, 2022 | | 0.08056 | | | 3,948,891 | |
December 2, 9, 16, 23 and 30, 2022(b) | | January 3, 2023 | | 0.17320 | | | 8,710,758 | |
| Total declared and distributed for the six months ended December 31, 2022 | | $ | 33,114,402 | |
| |
(a)Total amount per share represents the total distribution rate for the record dates indicated. | |
(b)Includes bonus distributions. | |
Dividends and distributions to common stockholders are recorded on the record date. The table above includes distributions with record dates during the six months ended December 31, 2022 and does not include distributions previously declared to common stockholders of record on any future dates, as those amounts are not yet determinable. The following distributions were previously declared and have record dates subsequent to December 31, 2022 for the common shares:
| | | | | | | | | | | | | | |
| Record Date | | Payment Date | | Total Amount per Share(a) |
| January 6, 13, 20 and 27, 2023 | | January 30, 2023 | | $ | 0.08056 | |
| February 3, 10, 17 and 24, 2023 | | February 27, 2023 | | $ | 0.08056 | |
| | | | |
(a)Total amount per share represents the total distribution rate for the record dates indicated. |
The Company may fund its distributions to common stockholders from any sources of funds available, including offering proceeds, borrowings, net investment income from operations, capital gains proceeds from the sale of assets, and non-capital gains proceeds from the sale of assets. Any capital returned to common stockholders through distributions will be distributed after payment of fees and expenses.
The Company has adopted a distribution reinvestment plan pursuant to which common stockholders will automatically have the full amount of distributions reinvested in additional shares. Common stockholders may "opt out" of the distribution
2023 SEMI-ANNUAL REPORT
PRIORITY INCOME FUND, INC. 39
reinvestment plan and instead receive their distributions in cash. Reinvested distributions will purchase shares at a price equal to 95% of the price that shares are sold in the offering at the closing immediately following the distribution payment date. There will be no selling commissions, dealer manager fees or other sales charges for shares issued under the distribution reinvestment plan. During any period when we are not making a “best-efforts” offering of our shares, the number of shares to be issued to a common stockholder in connection with a distribution reinvestment shall be determined by dividing the total dollar amount of the distribution payable to the common stockholder by the net asset value per common share of the Company, as determined pursuant to procedures adopted by our Board.
The Company issued 820,907 and 1,743,574 shares of its common stock in connection with the distribution reinvestment plan for the six months ended December 31, 2022 and year ended June 30, 2022, respectively.
Note 7. Preferred Stock
The Company has authorized 50,000,000 shares of Preferred Stock, at a par value of $0.01 per share, and had 10,875,493 shares issued and outstanding at December 31, 2022.
The Company completed underwritten public offerings of its outstanding mandatorily redeemable Term Preferred Stock: 7.00% Series D Term Preferred Stock Due 2029 (the “Series D Term Preferred Stock”), 6.625% Series F Term Preferred Stock Due 2027 (the “Series F Term Preferred Stock”), 6.25% Series G Term Preferred Stock Due 2026 (the “Series G Term Preferred Stock”), 6.00% Series H Term Preferred Stock Due 2026 (the “Series H Term Preferred Stock”), 6.125% Series I Term Preferred Stock Due 2028 (the “Series I Term Preferred Stock”), 6.000% Series J Term Preferred Stock Due 2028 (the “Series J Term Preferred Stock”) and 6.375% Series L Term Preferred Stock Due 2029 (the “Series L Term Preferred Stock” and, together with the other term preferred stock, the “Term Preferred Stock”). The Company is required to redeem all of the outstanding Term Preferred Stock on their respective term redemption dates, at a redemption price equal to $25 per share plus an amount equal to accumulated but unpaid dividends, if any, to the date of the redemption. The Company cannot effect any amendment, alteration, or repeal of the Company’s obligation to redeem all of the Term Preferred Stock without the prior unanimous vote or consent of the holders of such Term Preferred Stock.
The Company completed underwritten public offerings of its 7.000% Series K Cumulative Preferred Stock (the “Series K Cumulative Preferred Stock” or “Cumulative Preferred Stock”). The Company is not required to redeem its outstanding Cumulative Preferred Stock.
At any time on or after the applicable optional redemption date, at the Company’s sole option, the Company may redeem the Term Preferred Stock or Cumulative Preferred Stock at a redemption price per share equal to the sum of the $25 liquidation preference per share plus an amount equal to accumulated but unpaid dividends, if any, on such Term Preferred Stock or Cumulative Preferred Stock. The Company, with the authorization by the Board, may repurchase any of the Term Preferred Stock or Cumulative Preferred Stock from time to time in the open market after the applicable optional redemption date and effectively extinguish the preferred stock. Further, from time to time (including before the optional redemption date), the Company may repurchase a portion of its preferred stock and is notifying you of such intention as required by applicable securities law.
If the dividends on the preferred stock remain unpaid in an amount equal to two full years’ dividends, the holders of the preferred dividends as a class have the right to elect a majority of the Board of Directors. In general, the holders of the preferred stock and the common shares have equal voting rights of one vote per share, except that the holders of the preferred stock, as a separate class, have the right to elect at least two members of the Board of Directors. The Company is required to maintain certain asset coverage with respect to the preferred stock as defined in the Company’s By-Laws and the 1940 Act.
All Term Preferred Stock and Cumulative Preferred Stock ranks (with respect to the payment of dividends and rights upon liquidation, dissolution or winding up) (a) senior to our common stock, (b) on parity with each other series of our preferred stock, and (c) junior to our existing and future secured and unsecured indebtedness.
The following table summarizes the Company’s Term Preferred Stock and Cumulative Preferred Stock activity for the six months ended December 31, 2022:
2023 SEMI-ANNUAL REPORT
PRIORITY INCOME FUND, INC. 40
| | | | | | | | | | | | | | | | | | | | | | | | | | | | | |
| Series D Term Preferred Stock Due 2029 | Series F Term Preferred Stock Due 2027 | Series G Term Preferred Stock Due 2026 | Series H Term Preferred Stock Due 2026 | Series I Term Preferred Stock Due 2028 | Series J Term Preferred Stock Due 2028 | Series L Term Preferred Stock Due 2029 | Series K Cumulative Preferred Stock | Total Preferred Stock |
| Shares outstanding at June 30, 2022 | 1,094,065 | | 1,233,428 | | 1,472,000 | | 1,196,000 | | 1,600,000 | | 1,580,000 | | 1,100,000 | | 1,600,000 | | 10,875,493 | |
| Shares issued | — | | — | | — | | — | | — | | — | | — | | — | | — | |
| Shares redeemed | — | | — | | — | | — | | — | | — | | — | | — | | — | |
| Shares outstanding at December 31, 2022 | 1,094,065 | | 1,233,428 | | 1,472,000 | | 1,196,000 | | 1,600,000 | | 1,580,000 | | 1,100,000 | | 1,600,000 | | 10,875,493 | |
| | | | | | | | | |
| | | | | | | | | | | | | | | | | | | | | | | | | | | | | |
| Series D Term Preferred Stock Due 2029 | Series F Term Preferred Stock Due 2027 | Series G Term Preferred Stock Due 2026 | Series H Term Preferred Stock Due 2026 | Series I Term Preferred Stock Due 2028 | Series J Term Preferred Stock Due 2028 | Series L Term Preferred Stock Due 2029 | Series K Cumulative Preferred Stock | Total Preferred Stock |
| Principal outstanding at June 30, 2022 | $ | 27,351,625 | | $ | 30,835,700 | | $ | 36,800,000 | | $ | 29,900,000 | | $ | 40,000,000 | | $ | 39,500,000 | | $ | 27,500,000 | | $ | 40,000,000 | | $ | 271,887,325 | |
| Shares issued | — | | — | | — | | — | | — | | — | | — | | — | | — | |
| Shares redeemed | — | | — | | — | | — | | — | | — | | — | | — | | — | |
| Shares outstanding at December 31, 2022 | $ | 27,351,625 | | $ | 30,835,700 | | $ | 36,800,000 | | $ | 29,900,000 | | $ | 40,000,000 | | $ | 39,500,000 | | $ | 27,500,000 | | $ | 40,000,000 | | $ | 271,887,325 | |
| | | | | | | | | |
The following table summarizes the Company’s Term Preferred Stock balances as of December 31, 2022:
| | | | | | | | | | | | | | | | | | | | | | | | | | |
| Series D Term Preferred Stock Due 2029 | Series F Term Preferred Stock Due 2027 | Series G Term Preferred Stock Due 2026 | Series H Term Preferred Stock Due 2026 | Series I Term Preferred Stock Due 2028 | Series J Term Preferred Stock Due 2028 | Series L Term Preferred Stock Due 2029 | Total Term Preferred Stock |
| Principal value | $ | 27,351,625 | | $ | 30,835,700 | | $ | 36,800,000 | | $ | 29,900,000 | | $ | 40,000,000 | | $ | 39,500,000 | | $ | 27,500,000 | | $ | 231,887,325 | |
| Unamortized deferred offering costs | (427,127) | | (118,562) | | (204,548) | | (221,602) | | (204,141) | | (230,083) | | (279,352) | | (1,685,415) | |
| Unamortized discount | (616,612) | | (647,848) | | (814,501) | | (695,419) | | (1,029,691) | | (1,048,873) | | (781,241) | | (5,634,185) | |
| Carrying value | $ | 26,307,886 | | $ | 30,069,290 | | $ | 35,780,951 | | $ | 28,982,979 | | $ | 38,766,168 | | $ | 38,221,044 | | $ | 26,439,407 | | $ | 224,567,725 | |
| | | | | | | | |
Fair value(1) | $ | 23,817,795 | | $ | 28,048,153 | | $ | 33,826,560 | | $ | 26,467,480 | | $ | 34,096,000 | | $ | 33,180,000 | | $ | 24,167,000 | | $ | 203,602,988 | |
Fair value per share(1) | $ | 21.77 | | $ | 22.74 | | $ | 22.98 | | $ | 22.13 | | $ | 21.31 | | $ | 21.00 | | $ | 21.97 | | |
(1)Represents the December 31, 2022 closing market price per share of each respective series of Term Preferred Stock on the New York Stock Exchange (“NYSE”) and is categorized as Level 2 under ASC 820 as of December 31, 2022 because of the low trading volume of the shares. |
The following table summarizes the Company’s Cumulative Preferred Stock balances as of December 31, 2022:
| | | | | |
| Series K Cumulative Preferred Stock |
| Principal value | $ | 40,000,000 | |
| Unamortized deferred offering costs | (315,426) | |
| Unamortized discount | (1,250,000) | |
| Carrying value | $ | 38,434,574 | |
| |
Fair value(1) | $ | 35,040,000 | |
Fair value per share(1) | $ | 21.90 | |
(1)Represents the December 31, 2022 closing market price per share of the series of Cumulative Preferred Stock on the New York Stock Exchange (“NYSE”) and is categorized as Level 2 under ASC 820 as of December 31, 2022 because of the low trading value of the shares. |
2023 SEMI-ANNUAL REPORT
PRIORITY INCOME FUND, INC. 41
The following sets forth the terms of the Company’s Term Preferred Stock and Cumulative Preferred Stock offerings:
| | | | | | | | | | | | | | | | | | | | | | | | | | |
| Series D Term Preferred Stock Due 2029 | Series F Term Preferred Stock Due 2027 | Series G Term Preferred Stock Due 2026 | Series H Term Preferred Stock Due 2026 | Series I Term Preferred Stock Due 2028 | Series J Term Preferred Stock Due 2028 | Series L Term Preferred Stock Due 2029 | Series K Cumulative Preferred Stock |
| Initial offering price | $ | 25.00 | | $ | 25.00 | | $ | 25.00 | | $ | 25.00 | | $ | 25.00 | | $ | 25.00 | | $ | 25.00 | | $ | 25.00 | |
| Term redemption date | June 30, 2029 | June 30, 2027 | June 30, 2026 | December 31, 2026 | June 30, 2028 | December 31, 2028 | March 31, 2029 | N/A |
| Term redemption price per share | $ | 25.00 | | $ | 25.00 | | $ | 25.00 | | $ | 25.00 | | $ | 25.00 | | $ | 25.00 | | $ | 25.00 | | $ | 25.00 | |
| Optional redemption date | March 31, 2022 | February 25, 2023 | March 19, 2023 | May 6, 2023 | June 17, 2024 | August 10, 2024 | February 28, 2025 | September 30, 2026 |
| Fixed dividend rate | 7.00 | % | 6.625 | % | 6.250 | % | 6.000 | % | 6.125 | % | 6.000 | % | 6.375 | % | 7.00 | % |
| Annualized per share payment | $ | 1.75000 | | $ | 1.65624 | | $ | 1.56252 | | $ | 1.50000 | | $ | 1.53124 | | $ | 1.50000 | | $ | 1.59375 | | $ | 1.75000 | |
| | | | | | | | |
Dividends payable on the Company’s Term Preferred Stock were $0 at December 31, 2022.
Deferred issuance costs represent underwriting fees and other direct costs incurred that are related to the Company’s Term Preferred Stock. As of December 31, 2022, the Company had a deferred debt issuance cost balance of $1,685,415 related to the issuance of the Term Preferred Stock. Aggregate net discount on the Term Preferred Stock at the time of issuance totaled $7,300,671. As of December 31, 2022 the Company had an unamortized discount balance of $5,634,185. These amounts are amortized and are included in Preferred dividend expense on the Statement of Operations over the term of the respective shares.
Deferred issuance costs represent underwriting fees and other direct costs incurred that are related to the Company’s Cumulative Preferred Stock. As of December 31, 2022, the Company had a deferred debt issuance cost balance of $315,426 related to the issuance of the Cumulative Preferred Stock. As of December 31, 2022 the Company had an unamortized discount balance of $1,250,000.
The following table summarizes the components of preferred dividend expense, effective dividend rates and cash paid on the Term Preferred Stock for the six months ended December 31, 2022:
| | | | | | | | | | | | | | | | | | | | | | | | | | |
| Series D Term Preferred Stock Due 2029 | Series F Term Preferred Stock Due 2027 | Series G Term Preferred Stock Due 2026 | Series H Term Preferred Stock Due 2026 | Series I Term Preferred Stock Due 2028 | Series J Term Preferred Stock Due 2028 | Series L Term Preferred Stock Due 2029 | Total Term Preferred Stock |
Fixed dividend expense(1) | $ | 957,307 | | $ | 1,021,426 | | $ | 1,150,015 | | $ | 897,000 | | $ | 1,224,992 | | $ | 1,185,000 | | $ | 876,557 | | $ | 7,312,297 | |
| Amortization of deferred offering costs | 23,612 | | 10,939 | | 25,279 | | 23,592 | | 15,147 | | 15,357 | | 17,553 | | $ | 131,479 | |
| Amortization of discount | 37,411 | | 60,249 | | 101,403 | | 74,876 | | 76,405 | | 70,453 | | 49,061 | | $ | 469,858 | |
| Total preferred dividend expense | $ | 1,018,330 | | $ | 1,092,614 | | $ | 1,276,697 | | $ | 995,468 | | $ | 1,316,544 | | $ | 1,270,810 | | $ | 943,171 | | $ | 7,913,634 | |
Effective dividend rate(2) | 7.752 | % | 7.277 | % | 7.151 | % | 6.883 | % | 6.802 | % | 6.659 | % | 7.145 | % | 7.059 | % |
| Cash paid for dividend | $ | 957,307 | | $ | 1,021,426 | | $ | 1,150,015 | | $ | 897,000 | | $ | 1,224,992 | | $ | 1,185,000 | | $ | 881,430 | | $ | 7,317,170 | |
(1)Fixed dividend expense is composed of distributions declared and paid of $7,312,297 for the six months ended December 31, 2022. |
(2)Represents the effective rate for each respective series of Term Preferred Stock as of December 31, 2022. |
2023 SEMI-ANNUAL REPORT
PRIORITY INCOME FUND, INC. 42
The following table summarizes the components of preferred dividend expense, effective dividend rates and cash paid on the Cumulative Preferred Stock for the six months ended December 31, 2022:
| | | | | |
| Series K Cumulative Preferred Stock Due 2025 |
Fixed dividend expense(1) | $ | 1,400,000 | |
| Amortization of deferred offering costs | — | |
| Amortization of discount | — | |
| Total preferred dividend expense | $ | 1,400,000 | |
Effective dividend rate(2) | 7.000 | % |
| Cash paid for dividend | $ | 1,400,000 | |
(1) Fixed dividend expense is composed of distributions declared and paid of $1,400,000 for the six months ended December 31, 2022. |
(2)Represents the effective rate for the series of Cumulative Preferred Stock as of December 31, 2022. |
Note 8. Income Taxes
The information presented in this footnote is based on our most recent tax year ended June 30, 2022.
For income tax purposes, distributions made to shareholders are reported as ordinary income, capital gains, non-taxable return of capital, or a combination thereof. The expected tax character of distributions declared and paid to common shareholders during the year ended June 30, 2022 was as follows:
| | | | | |
| Year ended June 30, 2022 |
| Ordinary income | $ | 53,587,685 | |
| Return of capital | — | |
| Capital gain | — | |
| Total dividends declared and paid to common shareholders | $ | 53,587,685 | |
However, the final determination of the tax character of dividends between ordinary income, capital gains and return of capital will not be made until we file our tax return for the tax year ended June 30, 2022. The expected tax character of distributions declared and paid to preferred stock shareholders during the years ended June 30, 2022 was as follows:
| | | | | |
| Year ended June 30, 2022 |
| Ordinary income | $ | 16,334,719 | |
| Return of capital | — | |
| Capital gain | — | |
| Total dividends declared and paid to preferred shareholders | $ | 16,334,719 | |
However, the final determination of the tax character of dividends between ordinary income, capital gains and return of capital will not be made until we file our tax return for the tax year ending June 30, 2022.
The estimated tax character of dividends paid to the Company's common stock shareholders during the six months ended December 31, 2022 is expected to be as follows:
| | | | | |
| Six months ended December 31, 2022 |
| Ordinary income | $ | 33,114,402 | |
| Return of capital | — | |
| Capital gain | — | |
| Total dividends declared and paid to preferred shareholders | $ | 33,114,402 | |
However, the final determination of the tax character of dividends between ordinary income, capital gains and return of capital
will not be made until we file our tax return for the tax year ending June 30, 2023.
2023 SEMI-ANNUAL REPORT
PRIORITY INCOME FUND, INC. 43
The estimated tax character of dividends paid to the Company's preferred stock shareholders during the six months ended December 31, 2022 is expected to be as follows:
| | | | | |
| Six months ended December 31, 2022 |
| Ordinary income | $ | 8,712,297 | |
| Return of capital | — | |
| Capital gain | — | |
| Total dividends declared and paid to preferred shareholders | $ | 8,712,297 | |
Under IRC Section 163(j), a RIC is permitted to designate distributions attributable to net business interest income as section 163(j) interest dividends. For the six months ended June 30, 2022, 3.49% of our taxable ordinary dividends qualified as section 163(j) interest dividends. For the six months ended December 31, 2022, 8.12% of our taxable ordinary dividends qualified as section 163(j) interest dividends. These percentages are based on the best estimates available at the time of this filing. The final percentages will be determined with the filing of Form 1099-DIV.
However, the final determination of the tax character of dividends between ordinary income, capital gains and return of capital
will not be made until we file our tax return for the tax year ending June 30, 2023.
As of June 30, 2022, the estimated components of distributable earnings on a tax basis were as follows:
| | | | | |
| Overdistributed Ordinary Income | $ | (10,486,838) | |
| Temporary Differences | $ | 39,326,693 | |
| Net Unrealized Gain on Investments | $ | (9,578,714) | |
| Capital Loss Carryforward | $ | (10,274,526) | |
In general, we may make certain adjustments to the classification of net assets as a result of permanent book-to-tax differences, which may include differences in the book and tax basis of certain assets and liabilities, amortization of offering costs and nondeductible federal excise taxes, among other items. For the year ended June 30, 2022, we increased total distributable earnings by $1,714,488, decreased paid-in capital in excess of par by $3,383,018, and increased accumulated realized gain by $1,668,530.
Capital losses in excess of capital gains earned in a tax year may generally be carried forward and used to offset capital gains, subject to certain limitations. For the tax year ended June 30, 2022, we had capital loss carryforwards of approximately $10,274,526 available for use in later tax years. The unused balance each year will be carried forward and utilized as gains are realized, subject to limitations. While our ability to utilize losses in the future depends upon a variety of factors that cannot be known in advance, some of the Company’s capital loss carryforwards may become permanently unavailable due to limitations by the Code.
Note 9. Concentration of Credit Risks
Cash held at financial institutions, at times, may exceed the amount insured by the FDIC. The Company has not incurred any losses on these accounts, and the credit risk exposure is mitigated by the financial strength of the banking institutions where the amounts are held. For the six months ended December 31, 2022, our cash deposits have exceeded the FDIC insured limit. The Company’s portfolio may be concentrated in a limited number of investments in CLO vehicles, which is subject to a risk of loss if that sector experiences a market downturn. The Company is subject to credit risk in the normal course of pursuing its investment objectives. The Company’s maximum risk of loss from credit risk for its portfolio investments is the inability of the CLO collateral managers to return up to the cost value due to loan defaults occurring in the underlying collateral within the CLOs.
Note 10. Commitments and Contingencies
The Company is not currently subject to any material legal proceedings and, to the Company’s knowledge, no material legal proceedings are threatened against the Company. From time to time, the Company may be a party to certain legal proceedings in the ordinary course of business, including proceedings relating to the enforcement of the Company’s rights under contracts with its portfolio companies. While the outcome of any legal proceedings cannot be predicted with certainty, the Company does not expect that any such proceedings will have a material adverse effect upon its financial condition or results of operations.
2023 SEMI-ANNUAL REPORT
PRIORITY INCOME FUND, INC. 44
Note 11. Revolving Credit Facility
On December 16, 2019, we entered into a secured revolving credit facility (the “ 2019 Facility”). The aggregate commitment of the 2019 Facility was $35 million and was collateralized by all of our investments. The 2019 Facility bore interest at the current Prime Rate subject to a 3% floor plus 0.75%. Additionally, the lenders charged a fee on the unused portion of the credit facility equal to either 50 basis points if more than 60% of the credit facility was drawn, or 100 basis points if an amount more than 35% and less than or equal to 60% of the credit facility was drawn, or 150 basis points if an amount less than or equal to 35% of the credit facility is drawn. On September 7, 2022, we paid down the 2019 Facility.
In connection with the origination of the 2019 Facility, we incurred $855,260 of fees, all of which were being amortized over the term of the facility on an effective yield basis. From July 1, 2022 through September 7, 2022, we recorded $207,731 of interest costs and amortization costs on the 2019 Facility as interest expense. On September 7, 2022, we recognized a realized loss on the extinguishment of debt of $324,184 of the remaining fees.
On September 6, 2022, we entered into a secured revolving credit facility (the “Facility”). The aggregate commitment of the Facility is $40 million and is collateralized by our CLO investments. The Facility matures on March 6, 2027 and generally bears interest at the current 1 month SOFR Rate plus 3.25% subject to a SOFR floor of 0.25%. Additionally, the lender charges a fee on the unused portion of the credit facility equal to 0.375% per annum on the difference between the commitment amount and the average daily funded amount of the Facility.
As part of the Facility, we are required to maintain an interest reserve account that will contain the greater of $250,000 or the product of the weighted average daily advances outstanding during the immediately prior calendar month, multiplied by the interest rate and 90/360. Such amounts are classified as Restricted cash on our Statement of Assets and Liabilities. As of December 31, 2022, we held $282,114 in the interest reserve account.
The agreement governing our Facility requires us to comply with certain financial and operational covenants. These covenants include restrictions on the level of indebtedness that we are permitted to incur in relation to the value of our assets and a minimum total net asset level that we are required to maintain. As of December 31, 2022, we were in compliance with these covenants. As of December 31, 2022, we had $11,800,000 outstanding on our Facility. As of December 31, 2022, the investments used as collateral for the Facility had an aggregate fair value of $877,370,288, which represents 100% of our total investments. As of December 31, 2022, the fair value of the Facility was $11,800,000, the balance outstanding, and is categorized as Level 2 under ASC 820. The fair value of the Facility is equal to that of the carrying value since the Facility bears a floating rate and re-prices to market frequently.
In connection with the origination of the Facility, we incurred $409,211 of fees, all of which are being amortized over the term of the facility on an effective yield basis. As of December 31, 2022, $381,076 remains to be amortized and is reflected as Deferred financing costs on the Statements of Assets and Liabilities.
During the six months ended December 31, 2022, we recorded $431,171 of interest costs and amortization of financing costs on the Facility as interest expense.
For the six months ended December 31, 2022, the average stated interest rate (i.e., rate in effect plus the spread) was 4.72%. For the six months ended December 31, 2022, average outstanding borrowings for the Facility were $12,718,082.
Note 12. Notes Payable
On January 27, 2020, we issued $15,000,000 principal amount of senior unsecured notes that mature on March 31, 2035 (the “2035 Notes”). On March 2, 2022, we completed a further issuance of $15,000,000 of the 2035 Notes in a private placement to the same institutional investor. As of December 31, 2022, $30,000,000 in aggregate principal amount of the 2035 Notes remained outstanding. The 2035 Notes bear interest at a rate of 6.50% per year, payable quarterly on March 31, June 30, September 30, and December 31 of each year. Total proceeds from the issuance of the 2035 Notes, net of underwriting discounts and issuance costs, were $28,789,951. As of December 31, 2022, the fair value of the 2035 Notes is $29,132,076, estimated by discounting remaining payments using applicable current market rates, and is categorized as Level 2 under ASC 820 as of December 31, 2022. As of December 31, 2022, $250,599 of debt issuance costs and $867,924 of underwriting discounts that remains to be amortized and are included as a reduction within Notes payable on the Statement of Assets and Liabilities.
During the six months ended December 31, 2022, we recorded $1,003,641 of interest costs and amortization of financing costs on the 2035 Notes as interest expense on the Statement of Operations.
2023 SEMI-ANNUAL REPORT
PRIORITY INCOME FUND, INC. 45
For the six months ended December 31, 2022, the average stated interest rate was 6.50%. For the six months ended December 31, 2022, average outstanding borrowings for the 2035 Notes were $28,867,611.
Note 13. Financial Highlights
The following is a schedule of financial highlights for each of the past five years ended June 30 and for the six months ended December 31, 2022. Although the Company has designated its differing up-front sale loads as different “share classes”, the Company does not operate as a multi-class fund and each share of the Company has the same net asset value, as well as identical voting and distributions rights, and bears its own pro rata portion of the Company’s expenses.
2023 SEMI-ANNUAL REPORT
PRIORITY INCOME FUND, INC. 46
| | | | | | | | | | | | | | | | | | | | | | | | | | | | | | | | | | | | | | | | | | | | | | | |
| | | | | Six Months Ended | Year Ended | | Year Ended | | Year Ended | | Year Ended | | Year Ended | |
| | | | | December 31, 2022 | June 30, 2022 | | June 30, 2021 | | June 30, 2020 | | June 30, 2019 | | June 30, 2018 | |
| Per share data: | | | | | | | | | | | |
| Net asset value, beginning of year/period | $ | 12.04 | | $ | 12.15 | | | $ | 10.57 | | | $ | 13.02 | | | $ | 13.47 | | | $ | 14.43 | | |
Net investment income(a)(g) | 1.18 | | 1.83 | | | 1.84 | | | 1.48 | | | 1.61 | | | 1.60 | | |
Net realized and net change in unrealized gain (loss) on investments(a) | (1.09) | | (0.57) | | | 1.07 | | | (2.63) | | | (0.71) | | | (1.19) | | |
Net realized gain/(loss) on extinguishment of debt(a) | (0.01) | | — | | | — | | | — | | | — | | | — | | |
Net realized gain/(loss) on repurchase of preferred stock(a) | | | | | — | | (0.04) | | | (0.05) | | | 0.04 | | | — | | | — | | |
| Net increase (decrease) in net assets resulting from operations | 0.08 | | 1.22 | | | 2.86 | | | (1.11) | | | 0.90 | | | 0.41 | | |
| Dividends declared on Cumulative Preferred Stock | (0.03) | | (0.05) | | | — | | | — | | | — | | | — | | |
| Net increase (decrease) in net assets resulting from operations applicable to common stockholders | 0.05 | | 1.17 | | | 2.86 | | | (1.11) | | | 0.90 | | | 0.41 | | |
Distributions to common stockholders(f) | | | | | | | | | | | |
Dividends from net investment income(a) | (0.69) | | (1.33) | | | (0.59) | | | (0.69) | | | (1.00) | | | (0.83) | | |
Capital gain(a) | | — | | | — | | | — | | | (0.01) | | | (0.03) | | |
Return of capital(a) | | — | | | (0.67) | | | (0.72) | | | (0.47) | | | (0.64) | | |
Total distributions(b) | (0.69) | | (1.33) | | | (1.26) | | | (1.41) | | | (1.48) | | | (1.50) | | |
Other(c) | (0.01) | | 0.05 | | | (0.02) | | | 0.07 | | | 0.13 | | | 0.13 | | |
| Net asset value, end of year/period | $ | 11.39 | | $ | 12.04 | | | $ | 12.15 | | | $ | 10.57 | | | $ | 13.02 | | | $ | 13.47 | | |
| | | | | | | | | | | |
Total return, based on NAV(d) | 0.58 | % | 10.71 | % | | 29.13 | % | | (8.83) | % | | 8.06 | % | | 3.94 | % | |
| Supplemental Data: | | | | | | | | | | | |
| Net assets, end of year/period | $574,855,857 | $529,829,535 | | $448,284,587 | | $347,800,248 | | $399,704,924 | | $332,681,912 | |
| Ratio to average net assets: | | | | | | | | | | | |
Total expenses excluding expense support (reimbursements)/repayments(g)(h) | 13.75 | % | 12.02 | % | | 12.94 | % | | 11.32 | % | | 8.46 | % | | 6.41 | % | |
Expenses after expense support (reimbursements)/repayments, net(e)(g)(h) | 13.75 | % | 12.02 | % | | 12.94 | % | | 11.32 | % | | 8.46 | % | | 6.25 | % | |
Net investment income(g)(h) | 20.42 | % | 14.63 | % | | 16.23 | % | | 12.20 | % | | 11.90 | % | | 11.46 | % | |
| | | | | | | | | | | |
| Portfolio turnover | 1.58 | % | 1.74 | % | | 3.74 | % | | 1.66 | % | | 1.44 | % | | 1.10 | % | |
| | | | | | | | | | | | | | | |
(a) Calculated based on weighted average shares outstanding during the year or period. |
(b) The per share data for distributions is the actual amount of distributions paid or payable per share of common stock outstanding during the year or period. Distributions per share are rounded to the nearest $0.01. |
(c) The amount shown represents the balancing figure derived from the other figures in the schedule, and is primarily attributable to the accretive effects from the sales of the Company’s shares and the effects of share repurchases during the year or period. |
(d) Total return is based upon the change in net asset value per share between the opening and ending net asset values per share during the year and assumes that dividends are reinvested in accordance with the Company’s dividend reinvestment plan. The computation does not reflect the sales load for any shares. Total return based on market value is not presented since the Company’s common shares are not publicly traded. For periods less than one year, total return is not annualized. |
(e) For the year ended June 30, 2018, there were expense support repayments (reimbursements), net of ($675,148). There were no expense support repayments (reimbursements) for the years ended June 30, 2022, 2021, 2020 and 2019 or for the six months ended December 31, 2022. |
(f) The amounts reflected for the year ended June 30, 2019 have been updated based on tax information received subsequent to the filing of the annual report on Form N-CSR. |
(g) Net investment income per share data and ratios reflect income earned and expenses incurred on assets attributable to preferred shares (as described in Note 7. Preferred Shares). The expense ratios also reflect expenses incurred on assets attributable to preferred shares. The ratio of preferred dividend expense to average net assets applicable to the common shares for the years ended June 30, 2022, 2021, 2020, 2019 and 2018 are 2.99%, 3.54%, 2.94%, 1.34% and 0.00%, respectively. |
(h)Annualized for the six months ended December 31, 2022. |
2023 SEMI-ANNUAL REPORT
PRIORITY INCOME FUND, INC. 47
Information about our senior securities is shown in the following tables as of December 31, 2022 and June 30, 2022, 2021, 2020, 2019 and 2018.
| | | | | | | | | | | | | | |
Senior Securities as of December 31, 2022(a) |
| Senior Securities | Aggregate Amount Outstanding | Asset Coverage per Unit | Involuntary Liquidating Price per Preferred share | Average market value per unit(b) |
| The Facility | $ | 11,800,000 | | $ | 74,654 | | $ | — | | $ | — | |
| 2035 Notes | $ | 30,000,000 | | $ | 21,074 | | $ | — | | $ | — | |
| | | | |
| | | | |
| Series D Term Preferred Stock Due 2029 | $ | 27,351,625 | | $ | 70 | | $ | 25.00 | | $ | 23.73 | |
| Series F Term Preferred Stock Due 2027 | $ | 30,835,700 | | $ | 70 | | $ | 25.00 | | $ | 23.72 | |
| Series G Term Preferred Stock Due 2026 | $ | 36,800,000 | | $ | 70 | | $ | 25.00 | | $ | 23.58 | |
| Series H Term Preferred Stock Due 2026 | $ | 29,900,000 | | $ | 70 | | $ | 25.00 | | $ | 23.74 | |
| Series I Term Preferred Stock Due 2028 | $ | 40,000,000 | | $ | 70 | | $ | 25.00 | | $ | 22.76 | |
| Series J Term Preferred Stock Due 2028 | $ | 39,500,000 | | $ | 70 | | $ | 25.00 | | $ | 22.22 | |
| Series L Term Preferred Stock Due 2029 | $ | 27,500,000 | | $ | 70 | | $ | 25.00 | | $ | 22.67 | |
| Series K Cumulative Preferred Stock | $ | 40,000,000 | | $ | 70 | | $ | 25.00 | | $ | 22.28 | |
| | | | |
| (a)The asset coverage ratio for a class of senior securities representing indebtedness is calculated as our total assets, less all liabilities and indebtedness not represented by senior securities, divided by secured securities representing indebtedness. This asset coverage ratio is multiplied by $1,000 to determine the Asset Coverage Per Unit for the Facility and the 2035 Notes. The asset coverage ratio for a class of senior securities representing stock is calculated as our total assets, less all liabilities and indebtedness not represented by senior securities, divided by senior securities representing indebtedness plus the aggregate of the involuntary liquidation preference of senior securities which is a stock. With respect to the Preferred Stock, the asset coverage per unit figure is expressed in terms of dollar amounts per share of outstanding Preferred Stock (based on a per share liquidation preference of $25). |
(b)Represents the average daily closing market price per share of each respective series of Preferred Stock for the respective periods listed on NYSE from June 30, 2022 to December 31, 2022. |
2023 SEMI-ANNUAL REPORT
PRIORITY INCOME FUND, INC. 48
| | | | | | | | | | | | | | |
Senior Securities as of June 30, 2022(a) |
| Senior Securities | Aggregate Amount Outstanding | Asset Coverage per Unit | Involuntary Liquidating Price per Preferred share | Average market value per unit(b) |
| The Facility | $ | 24,800,000 | | $ | 34,205 | | $ | — | | $ | — | |
| 2035 Notes | $ | 30,000,000 | | $ | 15,479 | | $ | — | | $ | — | |
| | | | |
| | | | |
| Series D Term Preferred Stock Due 2029 | $ | 27,351,625 | | $ | 65 | | $ | 25.00 | | $ | 25.37 | |
| Series F Term Preferred Stock Due 2027 | $ | 30,835,700 | | $ | 65 | | $ | 25.00 | | $ | 25.33 | |
| Series G Term Preferred Stock Due 2026 | $ | 36,800,000 | | $ | 65 | | $ | 25.00 | | $ | 25.26 | |
| Series H Term Preferred Stock Due 2026 | $ | 29,900,000 | | $ | 65 | | $ | 25.00 | | $ | 25.07 | |
| Series I Term Preferred Stock Due 2028 | $ | 40,000,000 | | $ | 65 | | $ | 25.00 | | $ | 24.99 | |
| Series J Term Preferred Stock Due 2028 | $ | 39,500,000 | | $ | 65 | | $ | 25.00 | | $ | 24.75 | |
| Series L Term Preferred Stock Due 2029 | $ | 27,500,000 | | $ | 65 | | $ | 25.00 | | $ | 24.37 | |
| Series K Cumulative Preferred Stock | $ | 40,000,000 | | $ | 65 | | $ | 25.00 | | $ | 24.22 | |
| | | | |
| (a)The asset coverage ratio for a class of senior securities representing indebtedness is calculated as our total assets, less all liabilities and indebtedness not represented by senior securities, divided by secured securities representing indebtedness. This asset coverage ratio is multiplied by $1,000 to determine the Asset Coverage Per Unit for the Facility and the 2035 Notes. The asset coverage ratio for a class of senior securities representing stock is calculated as our total assets, less all liabilities and indebtedness not represented by senior securities, divided by senior securities representing indebtedness plus the aggregate of the involuntary liquidation preference of senior securities which is a stock. With respect to the Preferred Stock, the asset coverage per unit figure is expressed in terms of dollar amounts per share of outstanding Preferred Stock (based on a per share liquidation preference of $25). |
(b)Represents the average daily closing market price per share of each respective series of Preferred Stock for the respective periods listed on NYSE from June 30, 2021 to June 30, 2022. For series that were not outstanding at June 30, 2022, the average starts from the first day of trading of that particular series. |
| | | | | | | | | | | | | | |
Senior Securities as of June 30, 2021(a) |
| Senior Securities | Aggregate Amount Outstanding | Asset Coverage per Unit | Involuntary Liquidating Price per Preferred share | Average market value per unit(b) |
| The Facility | $ | 16,200,000 | | $ | 43,216 | | $ | — | | $ | — | |
| 2035 Notes | $ | 15,000,000 | | $ | 22,439 | | $ | — | | $ | — | |
| Series A Term Preferred Stock Due 2025 | $ | 36,706,625 | | $ | 68 | | $ | 25.00 | | $ | 24.21 | |
| | | | |
| | | | |
| Series D Term Preferred Stock Due 2029 | $ | 27,351,625 | | $ | 68 | | $ | 25.00 | | $ | 25.06 | |
| Series E Term Preferred Stock Due 2024 | $ | 25,541,850 | | $ | 68 | | $ | 25.00 | | $ | 24.19 | |
| Series F Term Preferred Stock Due 2027 | $ | 30,835,700 | | $ | 68 | | $ | 25.00 | | $ | 24.51 | |
| Series G Term Preferred Stock Due 2026 | $ | 36,800,000 | | $ | 68 | | $ | 25.00 | | $ | 25.32 | |
| Series H Term Preferred Stock Due 2026 | $ | 29,900,000 | | $ | 68 | | $ | 25.00 | | $ | 25.16 | |
| Series I Term Preferred Stock Due 2028 | $ | 40,000,000 | | $ | 68 | | $ | 25.00 | | $ | 25.15 | |
| | | | |
| (a)The asset coverage ratio for a class of senior securities representing indebtedness is calculated as our total assets, less all liabilities and indebtedness not represented by senior securities, divided by secured securities representing indebtedness. This asset coverage ratio is multiplied by $1,000 to determine the Asset Coverage Per Unit for the Facility and the 2035 Notes. The asset coverage ratio for a class of senior securities representing stock is calculated as our total assets, less all liabilities and indebtedness not represented by senior securities, divided by senior securities representing indebtedness plus the aggregate of the involuntary liquidation preference of senior securities which is a stock. With respect to the Term Preferred Stock, the asset coverage per unit figure is expressed in terms of dollar amounts per share of outstanding Preferred Stock (based on a per share liquidation preference of $25). |
(b)Represents the average daily closing market price per share of each respective series of Term Preferred Stock for the respective periods listed on NYSE from June 30, 2020 to June 30, 2021. For series that were not outstanding at June 30, 2020, the average starts from the first day of trading of that particular series. |
2023 SEMI-ANNUAL REPORT
PRIORITY INCOME FUND, INC. 49
| | | | | | | | | | | | | | |
Senior Securities as of June 30, 2020(a) |
| Senior Securities | Aggregate Amount Outstanding | Asset Coverage per Unit | Involuntary Liquidating Price per Preferred share | Average market value per unit(b) |
| The Facility | $ | — | | $ | — | | $ | — | | $ | — | |
| 2035 Notes | $ | 15,000,000 | | $ | 36,030 | | $ | — | | $ | — | |
| Series A Term Preferred Stock Due 2025 | $ | 37,035,875 | | $ | 68 | | $ | 25.00 | | $ | 24.31 | |
| Series B Term Preferred Stock Due 2023 | $ | 24,622,950 | | $ | 68 | | $ | 25.00 | | $ | 24.42 | |
| Series C Term Preferred Stock Due 2024 | $ | 38,927,475 | | $ | 68 | | $ | 25.00 | | $ | 24.69 | |
| Series D Term Preferred Stock Due 2029 | $ | 27,400,175 | | $ | 68 | | $ | 25.00 | | $ | 24.87 | |
| Series E Term Preferred Stock Due 2024 | $ | 25,982,900 | | $ | 68 | | $ | 25.00 | | $ | 23.79 | |
| Series F Term Preferred Stock Due 2027 | $ | 30,883,700 | | $ | 68 | | $ | 25.00 | | $ | 22.74 | |
| | | | |
| (a)The asset coverage ratio for a class of senior securities representing indebtedness is calculated as our total assets, less all liabilities and indebtedness not represented by senior securities, divided by secured securities representing indebtedness. This asset coverage ratio is multiplied by $1,000 to determine the Asset Coverage Per Unit for the Facility and the 2035 Notes. The asset coverage ratio for a class of senior securities representing stock is calculated as our total assets, less all liabilities and indebtedness not represented by senior securities, divided by senior securities representing indebtedness plus the aggregate of the involuntary liquidation preference of senior securities which is a stock. With respect to the Term Preferred Stock, the asset coverage per unit figure is expressed in terms of dollar amounts per share of outstanding Preferred Stock (based on a per share liquidation preference of $25). |
(b)Represents the average daily closing market price per share of each respective series of Term Preferred Stock for the respective periods listed on NYSE from June 30, 2019 to June 30, 2020. For series that were not outstanding at June 30, 2019, the average starts from the first day of trading of that particular series. |
| | | | | | | | | | | | | | |
Mandatorily Redeemable Preferred Shares as of June 30, 2019(a) |
| Term Preferred Stock | Aggregate Amount Outstanding | Asset Coverage per Preferred Share | Involuntary Liquidating Price per Preferred share | Average market value per unit(b) |
| Series A Term Preferred Stock Due 2025 | $ | 37,504,575 | | $ | 349 | | $ | 25.00 | | $ | 24.79 | |
| Series B Term Preferred Stock Due 2023 | $ | 25,000,000 | | $ | 524 | | $ | 25.00 | | $ | 24.72 | |
| Series C Term Preferred Stock Due 2024 | $ | 40,250,000 | | $ | 325 | | $ | 25.00 | | $ | 25.02 | |
| Series D Term Preferred Stock Due 2029 | $ | 26,131,675 | | $ | 501 | | $ | 25.00 | | $ | 25.24 | |
| Total Term Preferred Stock | $ | 128,886,250 | | $ | 102 | | | |
| | | | |
(a)For financial reporting purposes, preferred shares are considered to be debt. The Asset Coverage amounts per $25 of Preferred shares (the dollar amount per share) reflects the amount of the Company’s total assets (less all liabilities not represented by borrowings and preferred shares) per $25 Preferred Share of the combined amount of borrowings and outstanding preferred shares and the Asset Coverage amounts per financial reporting purposes. |
(b)Represents the average daily closing market price per share of each respective series of Term Preferred Stock for the respective periods listed on NYSE from June 30, 2018 to June 30, 2019. |
2023 SEMI-ANNUAL REPORT
PRIORITY INCOME FUND, INC. 50
| | | | | | | | | | | | | | | | | |
Mandatorily Redeemable Preferred Shares at the End of the Year(a) |
| Year | Aggregate Amount Outstanding | Asset Coverage per Preferred Share | Involuntary Liquidating Price per Preferred share | Average market value per unit(b) |
| 2018 | $ | 34,000,000 | | $ | 268.64 | | $ | 25.00 | | $ | 24.22 | |
| | | | | |
(a)For financial reporting purposes, preferred shares are considered to be debt. The Asset Coverage amounts per $25 of Preferred shares (the dollar amount per share) reflects the amount of Fund total assets (less all liabilities not represented by borrowings and preferred shares) per $25 Preferred Share of the combined amount of borrowings and outstanding preferred shares and the Asset Coverage amounts per financial reporting purposes. |
(b)The average market value is the settlement price as of June 29, 2018. There were no settled preferred shares outstanding prior to June 29, 2018. |
Note 14. Subsequent Events
During the period from January 1, 2023 through March 1, 2023, we did not purchase any investments.
During the period from January 1, 2023 through March 1, 2023, we sold 1 CLO debt investment totaling $1.0 million.
During the period from January 1, 2023 through March 1, 2023, we raised $17.3 million of capital, net of offering proceeds, through the issuance of 1,519,619 shares.
On January 12, 2023, in accordance with our share pricing policy, our Board determined that an increase in our common stock public offering prices was warranted following an increase in our estimated net asset value per share. In order to more accurately reflect our net asset value per share, we increased our common stock public offering price to $12.28 per share designated as “Class R,” $11.54 per share designated as “Class RIA,” and $11.45 per share designated as “Class I” from $12.13 per share designated as “Class R,” $11.40 per share designated as “Class RIA,” and $11.31 per share designated as “Class I.” The change in the public offering price was effective as of our January 13, 2023 weekly closing and first applied to subscriptions received from January 6, 2023 through January 12, 2023.
On January 19, 2023, in accordance with our share pricing policy, our Board determined that an increase in our common stock public offering prices was warranted following an increase in our estimated net asset value per share. In order to more accurately reflect our net asset value per share, we increased our common stock public offering price to $12.35 per share designated as “Class R,” $11.61 per share designated as “Class RIA,” and $11.52 per share designated as “Class I” from $12.28 per share designated as “Class R,” $11.54 per share designated as “Class RIA,” and $11.45 per share designated as “Class I.” The change in the public offering price was effective as of our January 20, 2023 weekly closing and first applied to subscriptions received from January 13, 2023 through January 19, 2023.
On February 2, 2023, in accordance with our share pricing policy, our Board determined that a decrease in our common stock public offering prices was warranted following a decrease in our estimated net asset value per share. In order to more accurately reflect our net asset value per share, we decreased our common stock public offering price to $12.14 per share designated as “Class R,” $11.41 per share designated as “Class RIA,” and $11.32 per share designated as “Class I” from $12.35 per share designated as “Class R,” $11.61 per share designated as “Class RIA,” and $11.52 per share designated as “Class I.” The change in the public offering price was effective as of our February 3, 2023 weekly closing and first applied to subscriptions received from January 27, 2023 through February 2, 2023.
On February 23, 2023, in accordance with our share pricing policy, our Board determined that an increase in our common stock public offering prices was warranted following an increase in our estimated net asset value per share. In order to more accurately reflect our net asset value per share, we increased our common stock public offering price to $12.22 per share designated as “Class R,” $11.49 per share designated as “Class RIA,” and $11.40 per share designated as “Class I” from $12.14 per share designated as “Class R,” $11.41 per share designated as “Class RIA,” and $11.32 per share designated as “Class I.” The change in the public offering price is effective as of our February 24, 2023 weekly closing and first applied to subscriptions received from February 17, 2023 through February 23, 2023.
On January 16, 2023, we drew $8,200,000 on the Facility. As of March 1, 2023, there was a $20,000,000 outstanding Facility balance.
2023 SEMI-ANNUAL REPORT
PRIORITY INCOME FUND, INC. 51
On February 28, 2023, our Board authorized and we declared a series of distributions for our Series D Term Preferred Stock Due 2029, Series F Term Preferred Stock Due 2027, Series G Term Preferred Stock Due 2026, Series H Term Preferred Stock Due 2026, Series I Term Preferred Stock Due 2028, Series J Term Preferred Stock Due 2028, Series K Cumulative Preferred Stock and Series L Term Preferred Stock Due 2029 payable on March 31, 2023, as reflected in the following table. Preferred stockholders of each respective Series on the record date, the close of business on March 15 2023, will receive the respective distributions on the payment date, March 31, 2023.
| | | | | | | | | | | | | | | | | | | | | | | | | | |
| Series D Term Preferred Stock due 2029 | Series F Term Preferred Stock due 2027 | Series G Term Preferred Stock due 2026 | Series H Term Preferred Stock due 2026 | Series I Term Preferred Stock due 2028 | Series J Term Preferred Stock due 2028 | Series K Cumulative Preferred Stock | Series L Term Preferred Stock due 2029 |
| Total amount per share | $ | 0.43750 | | $ | 0.41406 | | $ | 0.39063 | | $ | 0.37500 | | $ | 0.38281 | | $ | 0.37500 | | $ | 0.43750 | | $ | 0.39844 | |
| | | | | | | | |
| | | | | | | | |
| | | | | | | | |
2023 SEMI-ANNUAL REPORT
PRIORITY INCOME FUND, INC. 52
DISTRIBUTION REINVESTMENT PLAN
Subject to our Board of Directors’ discretion and applicable legal restrictions, we intend to authorize and declare ordinary cash distributions on a quarterly basis and pay such distributions on a monthly basis. We have adopted a distribution reinvestment plan pursuant to which shareholders will automatically have the full amount of their distributions reinvested in additional shares. Participants in our distribution reinvestment plan are free to revoke or reinstate participation in the distribution reinvestment plan within a reasonable time as specified in the plan. If you elect not to participate in the plan you will automatically receive any distributions we declare in cash. For example, if our Board of Directors authorizes, and we declare, a cash distribution, then if you have “opted out” of our distribution reinvestment plan you will receive your distributions in cash rather than having them reinvested in additional shares. During this offering, we generally intend to coordinate distribution payment dates so that the same price that is used for the closing date immediately following such distribution payment date will be used to calculate the purchase price for purchasers under the distribution reinvestment plan. In such case, your reinvested distributions will purchase shares at a price equal to 95% of the price that shares are sold in the offering at the closing immediately following the distribution payment date. Shares issued pursuant to our distribution reinvestment plan will have the same voting rights as our shares offered pursuant to our continuous offering.
If you wish to participate in the distribution reinvestment plan, no action will be required on your part to do so. If you are a registered stockholder, you may opt out of the distribution reinvestment plan and elect receive your entire distribution in cash by notifying DST Systems, Inc., the reinvestment agent, and our transfer agent and registrar, in writing so that such notice is received by the reinvestment agent no later than the record date for distributions to stockholders. For plan participants, the reinvestment agent will set up an account for shares you acquire through the plan and will hold such shares in non-certificated form. If your shares are held by a broker or other financial intermediary, you may “opt out” of our distribution reinvestment plan by notifying your broker or other financial intermediary of your election.
Our distribution reinvestment plan was amended and restated effective April 25, 2022 (the “Amendment Date”). If you held shares of the Company prior to the Amendment Date, your status as a participant or non-participant in the plan will not change on the Amendment Date and will remain unchanged unless you elect to change your participation as specified in the plan, or you purchase new shares of the Company and select a different participation status for those shares. Importantly, all shares held by a shareholder in one account must have the same status with respect to participation in the plan. That means that, if you purchase new shares of the Company after the Amendment Date and do not specifically elect to receive cash distributions, you will become a participant in the plan with respect to all of our shares that you hold, no matter when they were purchased or what your prior election was.
Distributions on fractional shares will be credited to each participant's account. In the event of termination of a participant's account under the Plan, the plan administrator will adjust for any such undivided fractional interest in cash at the current offering price of the Company's shares in effect at the time of termination.
We intend to use newly issued shares to implement the plan and determine the number of shares we will issue to you as follows:
To the extent the Company’s shares are not listed on a national stock exchange or quoted on an over-the-counter market or a national market system (collectively, an “Exchange”):
•during any period when we are making a “best-efforts” public offering of our shares, the number of shares to be issued to you shall be determined by dividing the total dollar amount of the distribution payable to you by a price equal to 95% of the price that the shares are sold in the offering at the closing immediately following the distribution payment date; and
•during any period when we are not making a “best-efforts” offering of our shares, the number of shares to be issued to you shall be determined by dividing the total dollar amount of the distribution payable to you by a price equal to the net asset value as determined by our Board of Directors.
To the extent our shares are listed on an Exchange, the number of shares to be issued to you shall be determined by dividing the total dollar amount of the distribution payable to you by the market price per share of our shares at the close of regular trading on such Exchange on the valuation date fixed by the Board of Directors for such distribution.
There will be no selling commissions, dealer manager fees or other sales charges associated with participation in the distribution reinvestment plan. We will pay the reinvestment agent’s fees under the plan.
If you receive your ordinary cash distributions in the form of shares, you generally are subject to the same federal, state and local tax consequences as you would be had you elected to receive your distributions in cash. Your basis for determining gain
2023 SEMI-ANNUAL REPORT
PRIORITY INCOME FUND, INC. 53
or loss upon the sale of shares received in a distribution from us will be equal to the total dollar amount of the distribution payable in cash. Any shares received in a distribution will have a holding period for tax purposes commencing on the day following the day on which the shares are credited to your account.
2023 SEMI-ANNUAL REPORT
PRIORITY INCOME FUND, INC. 54
ADDITIONAL INFORMATION
Portfolio Information
The Company prepares Form N-PORT, which contains a schedule of its portfolio holdings, on a monthly basis and makes its N-PORT filings with the Securities and Exchange Commission on a quarterly basis within 60 days after the end of the quarter. The Company’s N-PORT filings for the third month of each quarter are available on the Commission’s website at http://www.sec.gov and on our website at www.priorityincomefund.com (which is not intended to be an active hyperlink).
Proxy Information
A description of the policies and procedures that the Company uses to determine how to vote proxies relating to portfolio securities is available (i) without charge, upon request, by calling collect (212) 448-0702; and (ii) on the SEC’s website at http://www.sec.gov. Information regarding how the Company voted proxies relating to portfolio securities during the twelve-month period ended June 30th is available on the SEC’s website at http://www.sec.gov.
Tax Information
For tax purposes, distributions to common stockholders during the six months ended December 31, 2022 were approximately $33,114,402 for distributions from net investment income, $0 from return of capital and $0 from capital gain. Distributions to preferred shareholders during the six months ended December 31, 2022 were $8,712,297 for distributions from net investment income and $0 from return of capital.
Privacy Policy
We are committed to protecting your privacy. This privacy notice, which is required by federal law, explains our privacy policies and our affiliated companies. This notice supersedes any other privacy notice you may have received from us.
We will safeguard, according to strict standards of security and confidentiality, all information we receive about you. The only information we collect from you is your name, date of birth, address, citizenship status (and country of origin, if applicable), number of shares you hold and your social security number. This information is used only so that we can register your shares, send you periodic reports and other information about us, and send you proxy statements or other information required by law.
We do not share this information with any non-affiliated third-party except as described below:
•Authorized personnel of our Adviser. It is our policy that only authorized personnel of our Adviser who need to know your personal information will have access to it.
•Service providers. We may disclose your personal information to companies that provide services on our behalf, such as record keeping, processing your trades and mailing you information. These companies are required to protect your information and use it solely for the purpose for which they received it.
•Courts and government officials. If required by law, we may disclose your personal information in accordance with a court order or at the request of government regulators. Only that information required by law, subpoena or court order will be disclosed.
2023 SEMI-ANNUAL REPORT
PRIORITY INCOME FUND, INC. 55
Item 1. Reports to Stockholders (cont.).
(b) Not applicable.
Item 2. Code of Ethics.
The information required by this item is not required in a semi-annual report on Form N-CSRS.
Item 3. Audit Committee Financial Expert.
The information required by this item is not required in a semi-annual report on Form N-CSRS.
Item 4. Principal Accountant Fees and Services.
The information required by this item is not required in a semi-annual report on Form N-CSRS.
Item 5. Audit Committee of Listed Registrant.
The information required by this item is not required in a semi-annual report on Form N-CSRS.
Item 6. Investments.
(a) Please see the schedule of investments contained in the report to stockholders included under Item 1 of this Form N-CSR.
(b) Not applicable.
Item 7. Disclosure of Proxy Voting Policies and Procedures for Closed-End Management Investment Companies.
The information required by this item is not required in a semi-annual report on Form N-CSRS.
Item 8. Portfolio Managers of Closed-End Investment Companies.
(a) The information required by this item is not required in a semi-annual report on Form N-CSRS.
(b) There has been no change, as of the date of the filing of this semi-annual report on Form N-CSRS, to any of the portfolio
managers identified in response to paragraph (a)(1) of this item in the Registrant's most recent annual report on Form N-CSR.
Item 9. Purchases of Equity Securities by Closed-End Management Investment Company and Affiliated Purchasers.
None during the period covered by this Form N-CSRS filing pursuant to a plan or program.
Item 10. Submission of Matters to a Vote of Security Holders.
Not applicable.
Item 11. Controls and Procedures.
(a)Based on an evaluation of the Disclosure Controls and Procedures (as defined in Rule 30a-3(c) under the Investment Company Act of 1940, the “Disclosure Controls”) as of a date within 90 days prior to the filing date (the “Filing Date”) of this report on Form N-CSR (the “Report”), the Chief Executive Officer (its principal executive officer) and Chief Financial Officer (its principal financial officer) have concluded that due to the material weakness in the Company’s internal control over financial reporting described below and in our annual report on Form N-CSR, that the Disclosure Controls are not reasonably designed to ensure that information required to be disclosed by the Registrant in the Report is recorded, processed, summarized and reported by the Filing Date, including ensuring that information required to be disclosed in the Report is accumulated and communicated to the Registrant’s management, including the Registrant’s principal executive officer and principal financial officer, as appropriate to allow timely decisions regarding required disclosure. Management recognizes that any controls and procedures, no matter how well designed and operated, can provide only reasonable assurance of achieving their objectives.
Remediation Efforts Relating to Previously-Reported Material Weakness in Internal Control Over Financial Reporting.
As of June 30, 2022, management concluded that a material weakness existed relating to the operation of the management review control over the valuation of collateralized loan obligations (“CLOs”), including management’s review procedures over the completeness and accuracy of the underlying data used in performing those review procedures. The material weakness did not result in a misstatement of previously issued financial statements.
We have begun the process of, and we are focused on, enhancing effective internal controls measures to improve our internal control over financial reporting and remediate the material weakness. Our internal control remediation efforts include the following:
•Enhancing existing controls that address the completeness and accuracy of underlying data used in the performance of management review controls over the valuation of CLOs;
•Enhancing policies and procedures to retain adequate documentary evidence for certain management review controls over the valuation of CLOs, including precision of review and evidence of review procedures performed to demonstrate effective operation of such controls;
These matters did not require a fourth quarter 2022 adjustment or materially impact any of our financial statements for any prior annual or interim periods.
We believe our planned actions to enhance our processes and controls will address the material weaknesses, but these actions are subject to ongoing management evaluation, and we will need a period of execution to demonstrate remediation. We are committed to the continuous improvement of our internal control over financial reporting and will continue to diligently review our internal control over financial reporting.
(b)Other than the enhancements to controls noted above, there was no change in the Registrant’s internal control over financial reporting (as defined in Rule 30a-3(d) under the 1940 Act) over the period covered by this report that has materially affected, or is reasonably likely to materially affect, the Registrant’s internal control over financial reporting.
Item 12. Disclosure of Securities Lending Activities for Closed-End Management Investment Companies.
Not applicable.
Item 13. Exhibits.
(a)(1) Not applicable.
(a)(3) Not applicable.
(a)(4) Not applicable.
SIGNATURES
Pursuant to the requirements of the Securities Exchange Act of 1934 and the Investment Company Act of 1940, the Registrant has duly caused this report to be signed on its behalf by the undersigned, thereunto duly authorized.
PRIORITY INCOME FUND, INC.
By: /s/ M. Grier Eliasek
M. Grier Eliasek
Chief Executive Officer and President
Date: March 1, 2023
Pursuant to the requirements of the Securities Exchange Act of 1934 and the Investment Company of 1940, this report has been signed below by the following persons on behalf of the Registrant and in the capacities and on the dates indicated.
By: /s/ M. Grier Eliasek
M. Grier Eliasek
Chief Executive Officer and President
Date: March 1, 2023
By: /s/ Kristin Van Dask
Kristin Van Dask
Chief Financial Officer, Chief Compliance Officer
Treasurer and Secretary
Date: March 1, 2023