UNITED STATES
SECURITIES AND EXCHANGE COMMISSION
Washington, D.C. 20549
FORM N-CSRS
CERTIFIED SHAREHOLDER REPORT OF REGISTERED
MANAGEMENT INVESTMENT COMPANIES
Investment Company Act file number 811-22725
Priority Income Fund, Inc.
(Exact name of registrant as specified in charter)
10 East 40th Street, 42nd Floor
New York, NY 10016
(Address of principal executive offices)
M. Grier Eliasek
Chief Executive Officer
Priority Income Fund, Inc.
10 East 40th Street, 42nd Floor
New York, NY 10016
(Name and address of agent for service)
Registrant’s telephone number, including area code: (212) 448-0702
Date of fiscal year end: June 30
Date of reporting period: December 31, 2020
Item 1. Report to Stockholders.
The semi-annual report to stockholders for the six months ended December 31, 2020 is filed herewith pursuant to Rule 30e-1 under the Investment Company Act of 1940, as amended.
Semi-Annual Report
December 31, 2020
priorityincomefund.com
Priority Income Fund, Inc. (the “Company”) is an externally managed, non-diversified, closed-end investment management company registered under the Investment Company Act of 1940, as amended. The Company has elected to be treated for tax purposes as a regulated investment company under Subchapter M of the Internal Revenue Code of 1986, as amended.
INVESTMENT OBJECTIVE
The Company’s investment objective is to generate current income and, as a secondary objective, long-term capital appreciation. We expect to seek to achieve our investment objective by investing, under normal circumstances, at least 80% of our total assets in senior secured loans made to companies whose debt is rated below investment grade or, in limited circumstances, unrated, which we collectively refer to as “Senior Secured Loans,” with an emphasis on current income. Our investments may take the form of the purchase of Senior Secured Loans (either in the primary or secondary markets) or through investments in the equity and junior debt tranches of collateralized loan obligation (“CLO”) vehicles that in turn own pools of Senior Secured Loans. The Company intends to invest in both the primary and secondary markets.
TABLE OF CONTENTS
| | | | | |
| Page |
| |
| |
| |
| Index to Financial Statements | |
| 11 |
| 12 |
| 13 |
| 14 |
| 15 |
| 20 |
| |
| 42 |
| 43 |
| 45 |
2021 SEMI-ANNUAL REPORT
PRIORITY INCOME FUND, INC. 4
Letter to Stockholders
Dear Stockholders,
We are pleased to present this semi-annual report of Priority Income Fund, Inc. (“we,” “us,” “our,” the “Company” or “Priority”) for the six months ended December 31, 2020. Priority has provided its stockholders recurring cash distributions each month for the past 28 quarters, and Priority recently increased its quarterly bonus distributions to stockholders for the second time since August 2020.
Priority paid to our stockholders a dividend yield for the period ended December 31, 2020 of 9.97%, based on the “Class R Shares” offering price of $12.54 at December 31, 2020 and 10.69% based on the “Class I Shares” offering price of $11.69 at December 31, 2020.
In addition to the aforementioned bonus distribution increases, NAV per share also increased by 9.74% over the six months ended December 31, 2020, from $10.57 to $11.60.
Dividend Policy
To qualify for U.S federal income tax treatment as a regulated investment company, the Company is required to pay out distributions as determined in accordance with federal income tax regulations. In certain periods, we expect the income distributable pursuant to these regulations, which we refer to as distributable income, to be higher or lower than our reportable accounting income. In addition to net investment income, our dividend policy considers in part our estimate of our distributable income, which includes (1) interest income from our underlying collateralized loan obligation (“CLO”) debt and equity investments, (2) recognition of certain mark-to-market gains or losses to the extent that the fair market value of our CLO investments is determined to deviate from its adjusted tax basis, and (3) acceleration of unamortized fees and expenses following the refinancing or reset of a CLO’s liabilities. As a result, distributable income may differ from accounting income, as expressed by net investment income.
Our distributions may exceed our earnings, and portions of the distributions that we make may therefore be a return of the money that you originally invested and represent a return of capital to you for tax purposes.
Priority Update
In this semi-annual report, we refer to “Senior Secured Loans” collectively as senior secured loans made primarily to U.S. companies whose debt is rated below investment grade or, in some circumstances, unrated. These investments, which are often referred to as “junk” or “high yield,” have predominantly speculative characteristics with respect to the issuer’s capacity to pay interest and repay principal. They may also be difficult to value and illiquid.
The first six calendar months of 2020 represented an unprecedented period of economic uncertainty and volatility due to the impact of the global spread of COVID-19. However, the U.S. economy and the Senior Secured Loan market both rebounded strongly in the second half of the year:
–The U.S. unemployment rate peaked at 14.7% in April 2020 and has continued to improve since, decreasing to 6.7% in December 2020.(1)
–U.S. gross domestic product (“GDP”) declined 32.9% in the second quarter of 2020, the largest decline on record, then rebounded at a 33.4% annualized rate in the third quarter of 2020. U.S. GDP grew at a 4% annualized rate in the fourth quarter of 2020.(2)
–The S&P / LSTA Leveraged Loan Index (“S&P / LSTA Index”) troughed at 76.23 on March 23, 2020, the lowest level since the 2008 and 2009 financial crisis, before rebounding to 89.88 as of June 30, 2020.(3)
–The S&P / LSTA Index continued to rally through the second half of 2020, reaching 93.18 as of September 30, 2020 and 96.19 as of December 31, 2020.
–By December 31, 2020, the S&P / LSTA Index had retraced 97% of the price decline experienced between December 31, 2019 and March 23, 2020.(3)
–While the rating agencies downgraded borrowers of Senior Secured Loans at an unprecedented pace in the first half of 2020, downgrading 437 or 31.8% of the companies in the S&P / LSTA Index, rating agencies began upgrading borrowers in the second half of the year.(4) According to Bank of America, 26% of issuers rated CCC post COVID-19 have either refinanced or have been upgraded thus far. (5)
–Defaults in the senior secured loan market have also begun to decrease. The market default rate decreased from 4.17% at September 30, 2020 to 3.83% at December 20, 2020 (with such market default rate remaining above the historical
2021 SEMI-ANNUAL REPORT
PRIORITY INCOME FUND, INC. 5
average of 2.88% since 2003).(6) Priority has continued to significantly outperform the overall market with a 2.19% default rate as of December 31, 2020.
–We have been able to achieve this outperformance by (i) working with best-in-class fixed income managers, (ii) leveraging Prospect Capital Management's own 30+ year track record in investing in credit markets, and (iii) continuing to be underweight in both the retail and oil & gas cyclical industries. At December 31, 2020, Priority’s exposure to the oil & gas industry was limited to 2.45% and exposure to the retail industry was limited to 2.77%.
We believe Priority was well positioned to withstand the market volatility experienced in 2020 due to the defensive nature of our investment strategy:
–The CLO debt and CLO equity we invest in are composed of diversified pools of Senior Secured Loans (and nearly entirely 1st lien instead of 2nd lien). These Senior Secured Loans (especially 1st lien such loans) have two very important structural protections:
–First, Senior Secured Loans typically have liquidation payment priority ahead of subordinated loans, high yield bonds, preferred stock, and common stock. As a result, a significant amount of capital below the Senior Secured Loans needs to be eroded before impacting the Senior Secured loans.
–Second, Senior Secured Loans have a lien on all assets.
–These two factors are the reason why the historical recovery rate for Senior Secured Loans in default has been 80%, while the recovery rate for bonds (which are largely unsecured) has been 48%.(7) These numbers date back to 1987, through multiple credit cycles, including the early 2000s and the 2008 and 2009 recession.
–Priority also benefits from the diversification of its portfolio.
–As of December 31, 2020, Priority held 139 total CLO investments, including 112 CLO equity investments and 27 CLO debt investments.
–We have diversity across over 2,400 different Senior Secured Loans to over 1,000 companies, representing underlying collateral of $63.6 billion of Senior Secured Loans.
–Our largest exposure to an underlying Senior Secured Loan or borrower is less than 1.00% of our portfolio.
–As a result, a default or loss from one specific company is unlikely to materially impact the performance of the Company.
–While we were well positioned defensively going into the COVID-19 pandemic, we were also able to take advantage of volatility in 2020 by making investments that offered the potential for attractive risk-adjusted returns at discounted prices.
–Since our last annual report period ending of June 30, 2020, Priority invested in 9 CLO equity investments totaling $27.3 million in cost basis and 2 CLO debt investments totaling $3.7 million in cost basis.
–For full calendar year 2020, Priority invested in (i) 18 CLO equity investments totaling $91.0 million in par value and $60.7 million in cost basis and (ii) 4 CLO debt investments totaling $11.5 million in par value and $8.1 million in cost basis. We also sold one CLO debt and one CLO equity investment and realized internal rates of return of 107% and 12%, respectively.
–In order to manage our working capital needs, Priority Income Fund also maintains a $25 million senior secured revolving credit facility. In December 2020 we successfully extended the maturity of this credit facility to June 16, 2023.
CLO Market Commentary
Due to the market volatility arising from the global impact of the spread of COVID-19, issuance in the U.S. CLO market declined in the first six calendar months of 2020. U.S. CLO issuance in the first six calendar months was $35.0 billion, a 45.6% decline from the $64.3 billion of issuance in the same time period in 2019.(8) By the end of 2020, new issue U.S. CLO supply totaled $92.8 billion, down only 22% from 2019.(9) CLOs represented 71.9% of the buyer base in the institutional Senior Secured Loan market in 2020, highlighting the importance of the CLO market.(10)
CLO research analysts are projecting CLO issuance to increase in 2021:
–Barclays: $90 - $100 billion(11)
–Bank of America Merrill Lynch: $110 billion(12)
–BNP Paribas: $110 billion(13)
–Citigroup: $100 billion(14)
–JP Morgan: $90 billion(15)
–Morgan Stanley: $105 billion(16)
–Nomura: $105 billion(17)
We believe the following factors indicate that the long-term fundamentals for the investments held by Priority remain attractive: (1) Priority continues to be underweight in the oil & gas and retail industries, (2) Priority’s portfolio trailing twelve month (“TTM”) default rate as of December 31, 2020 stood at 2.19% (significantly less than the market TTM default rate of 3.83%), (3) rating agencies have begun to upgrade CCC rated Senior Secured Loan issuers, and (4) loan prices continue to rally through the second half of 2020, benefiting Priority’s existing CLO investments.
M. Grier Eliasek
Chairman and Chief Executive Officer
2021 SEMI-ANNUAL REPORT
PRIORITY INCOME FUND, INC. 6
This letter may contain certain forward-looking statements within the meaning of the Private Securities Litigation Reform Act of 1995, including statements regarding the future performance of Priority Income Fund, Inc. Words such as “believes,” “expects,” and “future” or similar expressions are intended to identify forward-looking statements. Any such statements, other than statements of historical fact, are highly likely to be affected by the global impact of the spread of COVID-19 or unknowable future events and conditions, including elements of the future that are or are not under the control of Priority Income Fund, Inc., and that Priority Income Fund, Inc. may or may not have considered. Accordingly, such statements cannot be guarantees or assurances of any aspect of future performance and involve a number of risks and uncertainties, including the impact of COVID-19 and related changes in base interest rates and significant market volatility on our business, our industry, and the global economy. Actual developments and results may vary materially from any forward-looking statements. Such statements speak only as of the time when made. Priority Income Fund, Inc. undertakes no obligation to publicly update or revise any forward-looking statements, whether as a result of new information, future events or otherwise. Any performance information quoted above represents past performance. We caution investors that the past performance described above is not indicative of and does not guarantee future returns. The investment return and principal value of an investment will fluctuate so that an investor's shares, when sold, may be worth more or less than their original cost. Current performance information may be different than the performance data presented above. Index and asset class performance quoted above does not reflect the fees, expenses or taxes that a stockholder may incur. The results described above may not be representative of our portfolio.
__________________________
1.U.S. Bureau of Labor Statistics
2.Bloomberg - U.S. GDP: Economy Growth Moderates to 4% in Final Quarter of 2020, January 28, 2021
3.S&P Capital IQ - S&P-LSTA Leveraged Loan Index
4.Derived from LevFin Insights, June 29, 2020
5.BofA Global Research - CLO Weekly: Keep your BB's close, your CCC's closer, February 16, 2021
6.S&P Capital IQ - US leveraged loan default rate ends 2020 at 3.83%; peak seen at less than 6%, January 5, 2021
7.Moody’s Investor Service - Annual Default Study, January 30, 2020
8.Wells Fargo - The CLO Monthly Market overview - July 2, 2020
9.Barclays Credit Research – 2020 wrap-up: Actually not too bad, January 1, 2021
10.S&P Capital IQ - Quarterly Leveraged Lending Review 4Q 2020
11.Barclays - 2021 US CLO Outlook, December 18, 2020
12.BofA Global Research - 2021 Year Ahead Outlook (CLO), November 24, 2020
13.CreditFlux CLO 2021 Outlook, December 18, 2020
14.Citigroup - 2021 US CLO Outlook, January 13, 2021
15.J.P. Morgan - US Fixed Income Markets 2021 Outlook, December 18, 2020
16.Morgan Stanley - 2021 Global Securitized Products Outlook, November 18, 2020
17.Nomura - 2021 CLO Outlook, November 20, 2020
2021 SEMI-ANNUAL REPORT
PRIORITY INCOME FUND, INC. 7
| | | | | | | | | | | | | | | | | | | | | | | | | | |
| Portfolio Composition - At a Glance |
| | | | | | | | |
| Top Ten Holdings | | | | | | | | |
| As of December 31, 2020 | | | | | | | | |
| | | | | | | | |
| Portfolio Investment | | Investment | | Legal Maturity | | Fair Value | | % of Net Assets |
| Cedar Funding IV CLO, Ltd. | | Subordinated Notes | | 7/23/2030 | | $ | 16,715,121 | | | 4.2 | % |
| Sound Point CLO XVII, Ltd. | | Subordinated Notes | | 10/20/2030 | | 15,688,802 | | | 3.9 | % |
| CIFC Funding 2017-IV, Ltd. | | Subordinated Notes | | 10/24/2030 | | 15,091,672 | | | 3.8 | % |
| OZLM XXII, Ltd. | | Subordinated Notes | | 1/17/2031 | | 14,450,190 | | | 3.6 | % |
| Voya CLO 2019-1, Ltd. | | Subordinated Notes | | 4/15/2031 | | 14,062,311 | | | 3.5 | % |
| Carlyle Global Market Strategies CLO 2014-3-R, Ltd. | | Subordinated Notes | | 7/28/2031 | | 11,270,214 | | | 2.8 | % |
| THL Credit Wind River 2018-3 CLO, Ltd. | | Subordinated Notes | | 1/20/2031 | | 10,752,040 | | | 2.7 | % |
| Sound Point CLO II, Ltd. | | Subordinated Notes | | 1/27/2031 | | 9,560,409 | | | 2.4 | % |
| Madison Park Funding XIII, Ltd. | | Subordinated Notes | | 4/19/2030 | | 9,384,661 | | | 2.3 | % |
| Sound Point CLO XVIII, Ltd. | | Subordinated Notes | | 1/20/2031 | | 9,208,067 | | | 2.3 | % |
Portfolio Composition
| | | | | |
| Number of Loans Underlying the Company’s CLO Investments | 2,430 | |
| Dollar Amount of Loans Underlying the Company’s CLO Investments | $63.6 billion |
| Percentage of Collateral Underlying the Company’s CLO Investments that are in Default | 0.94 | % |
| Last Twelve Months Default Rate of Collateral Underlying the Company’s CLO Investments | 2.19 | % |
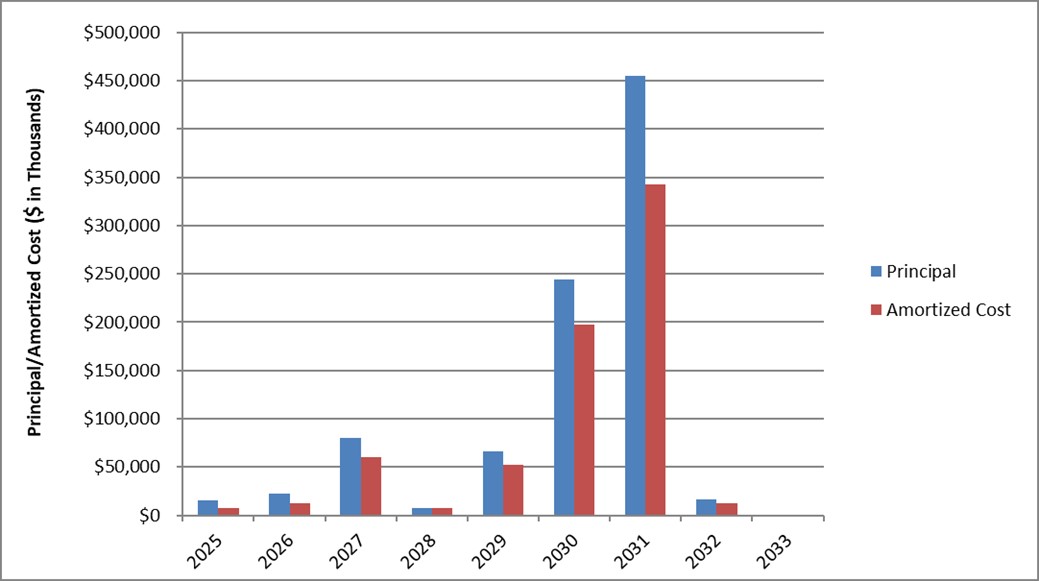
Legal Maturity of Portfolio Securities
2021 SEMI-ANNUAL REPORT
PRIORITY INCOME FUND, INC. 8
Collateral Summary
| | | | | |
| Number of loans underlying the Company’s CLO investments | 2,430 |
| Largest exposure to any individual borrower | 0.80 | % |
| Average individual borrower exposure | 0.07 | % |
| Aggregate exposure to 10 largest borrowers | 6.31 | % |
| Aggregate exposure to senior secured loans | 98.77 | % |
| Weighted average stated spread | 3.45 | % |
| Weighted average LIBOR floor | 0.93 | % |
| Weighted average percentage of floating rate loans with LIBOR floors | 40.0 | % |
| Weighted average credit rating of underlying collateral based on average Moody’s rating | B2/B3 |
| Weighted average maturity of underlying collateral | 4.5 years |
| U.S. dollar currency exposure | 100 | % |
| | | | | | | | | | | | | | | | | | | | | | | | | | |
Underlying Secured Loan Rating Distribution (Moody’s / S&P)(1) |
| Quarter-End | Aaa/AAA | Aa/AA | A/A | Baa/BBB | Ba/BB | B/B | Caa/CCC and Lower | Unrated |
| December 31, 2020 | 0.00% / 0.00% | 0.00% / 0.00% | 0.00% / 0.00% | 2.94% / 1.61% | 24.30% / 21.24% | 63.79% / 66.29% | 8.84% / 9.53% | 0.84% / 2.04% |
(1)Excludes structured product assets and newly issued transactions for which collateral data is not yet available. |
|
| Cash is included within the denominator of the above calculations, but is not rated by Moody’s/S&P. |
2021 SEMI-ANNUAL REPORT
PRIORITY INCOME FUND, INC. 9
| | | | | | | | | | | | | | | | | | | | |
Statement of Assets and Liabilities (unaudited) |
| As of December 31, 2020 |
| | | | | | |
| Assets | |
| Investments, at fair value (amortized cost $695,989,942) | $ | 597,764,233 | |
| Cash | 5,928,368 | |
| Interest receivable | 1,888,893 | |
| Deferred financing costs on Revolving Credit Facility (Note 11) | 388,173 | |
| Deferred common stock offering costs (Note 5) | 240,788 | |
| Prepaid expenses | 158,731 | |
| Due from affiliate (Note 5) | 157,580 | |
| Receivable for capital shares sold | 518 | |
| | | | Total assets | 606,527,284 | |
| Liabilities | |
Mandatorily redeemable preferred stock; ($0.01 par value; 40,000,000 shares authorized; 1,481,435 Series A Term Preferred Stock outstanding with net offering costs of $299,355 and unamortized discount of $821,203; 984,918 Series B Term Preferred Stock outstanding with net offering costs of $230,927 and unamortized discount of $474,845; 1,557,099 Series C Term Preferred Stock outstanding with net offering costs of $235,081 and unamortized discount of $839,864; 1,096,007 Series D Term Preferred Stock outstanding with net offering costs of $354,165 and unamortized discount of $757,916; 1,039,316 Series E Term Preferred Stock outstanding with net offering costs of $239,978 and unamortized discount of $620,268; 1,235,348 Series F Term Preferred Stock outstanding with net offering costs of $159,916 and unamortized discount of $877,238 (Note 7) | 178,942,319 | |
| Notes payable (less unamortized discount and debt issuance costs of $170,482) (Note 12) | 14,360,768 | |
| Due to adviser (Note 5) | 7,347,801 | |
| Revolving Credit Facility (Note 11) | 2,000,000 | |
| Accrued expenses | 937,013 | |
| Due to administrator (Note 5) | 478,033 | |
| Interest payable | 77,861 | |
| | | | Total liabilities | 204,143,795 | |
| Commitments and contingencies (Note 10) | — | |
| Net assets | $ | 402,383,489 | |
| |
| Components of net assets: | |
| Common stock, $0.01 par value; 160,000,000 shares authorized; 34,688,484 shares issued and | |
| outstanding (Note 4) | $ | 346,885 | |
| Paid-in capital in excess of par (Note 4) | 421,954,815 | |
| Total distributable earnings | (19,918,211) | |
| Net assets | $ | 402,383,489 | |
| | | | | | |
| Net asset value per share | $ | 11.60 | |
|
| See accompanying notes to financial statements. |
2021 SEMI-ANNUAL REPORT
PRIORITY INCOME FUND, INC. 10
| | | | | | | | | | | | | | | | | | | | |
Statement of Operations (unaudited) |
| For the six months ended December 31, 2020 |
| |
| Investment income | |
| Interest income from investments | $ | 54,624,472 | |
| | | | Total investment income | 54,624,472 | |
| Expenses | |
| Incentive fee (Note 5) | 7,624,183 | |
| Base management fee (Note 5) | 5,657,077 | |
| Total investment advisory fees | 13,281,260 | |
| |
| Preferred dividend expense | 6,595,251 | |
| Administrator costs (Note 5) | 1,051,300 | |
| Interest expense and credit facility expense | 835,671 | |
| Transfer agent fees and expenses | 633,713 | |
| Valuation services | 533,917 | |
| General and administrative | 451,309 | |
| Amortization of common stock offering costs (Note 5) | 384,268 | |
| Audit and tax expense | 253,425 | |
| Report and notice to shareholders | 223,946 | |
| Insurance expense | 127,733 | |
| Director fees | 75,000 | |
| Legal expense | 53,416 | |
| Adviser shared service expense (Note 5) | 11,798 | |
| Total expenses | 24,512,007 | |
| Expense Support Repayment (Note 5) | — | |
| Net expenses | 24,512,007 | |
| Net investment income | 30,112,465 | |
| Net realized loss and net change in unrealized appreciation (depreciation) on investments | |
| Net realized loss on investments | (1,331,583) | |
| Net change in unrealized appreciation (depreciation) on investments | 27,403,125 | |
| Net realized loss and net change in unrealized appreciation (depreciation) on investments | 26,071,542 | |
| Net increase in net assets resulting from operations | $ | 56,184,007 | |
|
| See accompanying notes to financial statements. |
2021 SEMI-ANNUAL REPORT
PRIORITY INCOME FUND, INC. 11
| | | | | | | | | | | | | | | | | | | | | | | | | | |
| Statements of Changes in Net Assets |
| | | | | | | | |
| | | | | | Six Months Ended | Year Ended | |
| | | | | | December 31, 2020 | June 30, 2020 | |
| | | | | | (unaudited) | | |
| Net increase (decrease) in net assets resulting from operations: | | | |
| Net investment income | $ | 30,112,465 | | $ | 47,181,624 | | |
| Net realized loss on investments | (1,331,583) | | (61,501) | | |
| Net change in unrealized appreciation (depreciation) on investments | 27,403,125 | | (83,798,570) | | |
| Net realized gain on repurchase of preferred stock | — | | 1,299,945 | | |
| | | | Net increase (decrease) in net assets resulting from operations | 56,184,007 | | (35,378,502) | | |
| Distributions to common stockholders: | | | |
| Dividends from earnings (Notes 6 and 8) | (20,598,582) | | (22,014,211) | | |
| Return of capital (Notes 6 and 8) | — | | (23,043,995) | | |
| | | | Total distributions to common stockholders | (20,598,582) | | (45,058,206) | | |
| Capital transactions: | | | |
| Gross proceeds from shares sold (Note 4) | 20,811,889 | | 28,785,035 | | |
| Commissions and fees on shares sold (Note 5) | (1,293,541) | | (2,117,549) | | |
| Repurchase of common shares (Note 4) | (8,926,990) | | (19,399,941) | | |
| Reinvestment of distributions (Note 4) | 8,406,458 | | 21,264,488 | | |
| | | | Net increase in net assets from capital transactions | 18,997,816 | | 28,532,033 | | |
| | | | Total increase (decrease) in net assets | 54,583,241 | | (51,904,675) | | |
| Net assets: | | | |
| Beginning of period/year | 347,800,248 | | 399,704,923 | | |
| End of period/year | $ | 402,383,489 | | $ | 347,800,248 | | |
| | | | | | | | |
| See accompanying notes to financial statements. |
2021 SEMI-ANNUAL REPORT
PRIORITY INCOME FUND, INC. 12
| | | | | | | | | | | | | | | | | | | | |
Statement of Cash Flows (unaudited) |
| For the six months ended December 31, 2020 |
| |
| Cash flows used in operating activities: | |
| Net increase in net assets resulting from operations | $ | 56,184,007 | |
| Adjustments to reconcile net increase in net assets resulting from operations to net cash used in operating activities: |
| Amortization of common stock offering costs (Note 5) | 384,268 | |
| Accretion of purchase discount, net | (11,616,397) | |
| Amortization of preferred stock deferred offering costs | 141,641 | |
| Amortization of preferred stock discount | 403,910 | |
| Amortization of notes payable debt issuance costs | 3,809 | |
| Amortization of notes payable discount | 9,196 | |
| Amortization of deferred financing costs on Revolving Credit Facility (Note 11) | 121,667 | |
| Purchases of investments | (30,981,164) | |
| Proceeds from sales of investments | 1,160,000 | |
| Repayments from investments | 1,434,773 | |
| Payment-in-kind interest | (658,005) | |
| Net realized loss on investments | 1,331,583 | |
| Net change in unrealized appreciation (depreciation) on investments | (27,403,125) | |
| (Increase) Decrease in operating assets: | |
| Deferred common stock offering costs (Note 5) | (174,310) | |
| Deferred financing costs on Revolving Credit Facility (Note 11) | (160,448) | |
| Interest receivable | 85,019 | |
| Due from affiliate (Note 5) | 5,778 | |
| Prepaid expenses | 85,666 | |
| Increase (Decrease) in operating liabilities: | |
| Due to Adviser (Note 5) | 1,851,814 | |
| Accrued expenses | (630,336) | |
| Due to Administrator (Note 5) | 141,262 | |
| Preferred dividend payable | (5,683) | |
| Interest payable | 13,278 | |
| Net cash used in operating activities | (8,271,797) | |
| Cash flows provided by financing activities: | |
| Gross proceeds from shares sold (Note 4) | 20,660,344 | |
| Commissions and fees on shares sold (Note 5) | (1,283,311) | |
| Distributions paid to common stockholders | (12,191,053) | |
| Repurchase of common shares (Note 4) | (8,926,358) | |
| Preferred stock issuance costs, paid and deferred | 90,706 | |
| Borrowings under Revolving Credit Facility (Note 11) | 34,000,000 | |
| Repayments of Revolving Credit Facility (Note 11) | (32,000,000) | |
| Net cash provided by financing activities | 350,328 | |
| Net decrease in cash | (7,921,469) | |
| Cash, beginning of period | 13,849,837 | |
| Cash, end of period | $ | 5,928,368 | |
| |
| Non-cash financing activity: | |
| Value of shares issued through reinvestment of distributions | $ | 8,406,458 | |
| Supplemental disclosure: | |
| Cash paid for interest | $ | 687,722 | |
| See accompanying notes to financial statements. |
2021 SEMI-ANNUAL REPORT
PRIORITY INCOME FUND, INC. 13
| | | | | | | | | | | | | | | | | | | | | | | | | | | | | | | | | | | | | | | | | | | | |
Schedule of Investments (unaudited) |
| As of December 31, 2020 |
| | | | | | | | | | | | | | | | | | | | | | | | | | | | | | | | | | | | | | | | | | | | | | | | | | |
Portfolio Investments(1)(5) | | Investment | | Estimated Yield(2)/Interest Rate | | Legal Maturity | | Acquisition date | | Principal Amount | | Amortized Cost | | Fair Value(3)
Level 3 | | % of Net Assets |
| Collateralized Loan Obligation - Equity Class (Cayman Islands) |
Adams Mill CLO Ltd.(6) | | Subordinated Notes | | — | % | | 7/15/2026 | | 7/3/2014 | | $ | 500,000 | | | $ | 261,667 | | | $ | 12,707 | | | 0.0 | % |
| Apidos CLO XVIII-R | | Subordinated Notes | | 19.23 | % | | 10/22/2030 | | 9/26/2018 | | 410,000 | | | 530,784 | | | 422,217 | | | 0.1 | % |
| Apidos CLO XX | | Subordinated Notes | | 33.17 | % | | 7/16/2031 | | 3/4/2020 | | 5,500,000 | | | 3,115,442 | | | 3,532,623 | | | 0.9 | % |
| Apidos CLO XXI | | Subordinated Notes | | 13.44 | % | | 7/19/2027 | | 5/13/2015 | | 5,000,000 | | | 3,986,045 | | | 3,123,959 | | | 0.8 | % |
| Apidos CLO XXII | | Subordinated Notes | | 29.46 | % | | 4/21/2031 | | 9/17/2015 | | 9,894,611 | | | 6,320,753 | | | 7,186,418 | | | 1.8 | % |
| Apidos CLO XXIV | | Subordinated Notes | | 23.75 | % | | 10/21/2030 | | 5/17/2019 | | 6,750,000 | | | 4,308,928 | | | 4,156,768 | | | 1.0 | % |
| Apidos CLO XXVI | | Subordinated Notes | | 23.23 | % | | 7/18/2029 | | 7/25/2019 | | 6,000,000 | | | 4,398,941 | | | 4,680,085 | | | 1.2 | % |
| Babson CLO Ltd. 2015-I | | Subordinated Notes | | 16.81 | % | | 1/20/2031 | | 4/1/2015 | | 3,400,000 | | | 2,438,987 | | | 1,627,313 | | | 0.4 | % |
| Barings CLO Ltd. 2018-III | | Subordinated Notes | | 11.01 | % | | 7/20/2029 | | 10/10/2014 | | 397,600 | | | 226,013 | | | 156,032 | | | 0.0 | % |
| BlueMountain CLO 2012-2 Ltd. | | Subordinated Notes | | 12.15 | % | | 11/20/2028 | | 1/7/2015 | | 3,000,000 | | | 2,475,211 | | | 1,637,134 | | | 0.4 | % |
| BlueMountain CLO 2013-2 Ltd. | | Subordinated Notes | | 9.10 | % | | 10/22/2030 | | 10/1/2015 | | 1,900,000 | | | 1,549,484 | | | 968,320 | | | 0.2 | % |
| BlueMountain Fuji US CLO II Ltd. | | Subordinated Notes | | 15.36 | % | | 10/21/2030 | | 8/22/2017 | | 2,500,000 | | | 2,304,778 | | | 1,989,833 | | | 0.5 | % |
| California Street CLO IX, Ltd. | | Preference Shares | | 28.35 | % | | 7/16/2032 | | 12/13/2019 | | 4,670,000 | | | 1,857,553 | | | 2,228,626 | | | 0.6 | % |
California Street CLO XII, Ltd.(6) | | Subordinated Notes | | — | % | | 10/15/2025 | | 9/14/2015 | | 14,500,000 | | | 7,252,719 | | | 2,238,942 | | | 0.6 | % |
| Carlyle Global Market Strategies CLO 2013-1, Ltd. | | Subordinated Notes | | 16.10 | % | | 8/14/2030 | | 6/23/2016 | | 17,550,000 | | | 13,046,784 | | | 8,669,487 | | | 2.2 | % |
| Carlyle Global Market Strategies CLO 2013-4, Ltd. | | Income Notes | | 16.92 | % | | 1/15/2031 | | 12/22/2016 | | 11,839,488 | | | 7,676,880 | | | 6,179,899 | | | 1.5 | % |
| Carlyle Global Market Strategies CLO 2014-1, Ltd. | | Income Notes | | 27.43 | % | | 4/17/2031 | | 2/25/2016 | | 12,870,000 | | | 8,254,579 | | | 8,732,947 | | | 2.2 | % |
| Carlyle Global Market Strategies CLO 2014-3-R, Ltd. | | Subordinated Notes | | 16.09 | % | | 7/28/2031 | | 5/23/2018 | | 15,000,000 | | | 13,865,180 | | | 11,270,214 | | | 2.8 | % |
| Carlyle Global Market Strategies CLO 2016-1, Ltd. | | Subordinated Notes | | 16.41 | % | | 4/20/2027 | | 3/16/2016 | | 6,500,000 | | | 6,417,107 | | | 5,417,536 | | | 1.3 | % |
| Carlyle Global Market Strategies CLO 2016-3, Ltd. | | Subordinated Notes | | 18.23 | % | | 10/19/2029 | | 8/8/2016 | | 3,245,614 | | | 3,109,177 | | | 2,763,602 | | | 0.7 | % |
| Carlyle Global Market Strategies CLO 2017-5, Ltd. | | Subordinated Notes | | 15.35 | % | | 1/22/2030 | | 12/18/2017 | | 10,000,000 | | | 9,763,041 | | | 8,158,342 | | | 2.0 | % |
| Cedar Funding II CLO, Ltd. | | Subordinated Notes | | 18.28 | % | | 6/10/2030 | | 9/27/2017 | | 2,500,000 | | | 1,895,258 | | | 1,698,677 | | | 0.4 | % |
| Cedar Funding IV CLO, Ltd. | | Subordinated Notes | | 18.96 | % | | 7/23/2030 | | 6/19/2017 | | 21,114,286 | | | 18,111,785 | | | 16,715,121 | | | 4.2 | % |
| Cedar Funding V CLO, Ltd. | | Subordinated Notes | | 19.29 | % | | 7/17/2031 | | 10/15/2018 | | 2,358,000 | | | 2,678,438 | | | 2,281,544 | | | 0.6 | % |
| Cedar Funding VI CLO, Ltd. | | Subordinated Notes | | 17.59 | % | | 10/20/2028 | | 8/7/2017 | | 4,892,500 | | | 4,900,688 | | | 4,631,568 | | | 1.2 | % |
| Cent CLO 21 Limited | | Subordinated Notes | | 11.42 | % | | 7/26/2030 | | 5/15/2014 | | 510,555 | | | 409,158 | | | 288,924 | | | 0.1 | % |
| CIFC Funding 2013-I, Ltd. | | Subordinated Notes | | 24.92 | % | | 7/16/2030 | | 6/1/2018 | | 3,000,000 | | | 1,807,539 | | | 1,734,641 | | | 0.4 | % |
| CIFC Funding 2013-II, Ltd. | | Income Notes | | 12.36 | % | | 10/18/2030 | | 2/6/2014 | | 305,000 | | | 195,574 | | | 147,023 | | | 0.0 | % |
| CIFC Funding 2013-IV, Ltd. | | Subordinated Notes | | 21.75 | % | | 4/28/2031 | | 3/15/2019 | | 8,000,000 | | | 5,307,131 | | | 5,348,871 | | | 1.3 | % |
| CIFC Funding 2014, Ltd. | | Income Notes | | 16.03 | % | | 1/17/2031 | | 2/6/2014 | | 2,758,900 | | | 1,858,358 | | | 1,500,542 | | | 0.4 | % |
2021 SEMI-ANNUAL REPORT
PRIORITY INCOME FUND, INC. 14
| | | | | | | | | | | | | | | | | | | | | | | | | | | | | | | | | | | | | | | | | | | | | | | | | | |
Portfolio Investments(1)(5) | | Investment | | Estimated Yield(2)/Interest Rate | | Legal Maturity | | Acquisition date | | Principal Amount | | Amortized Cost | | Fair Value(3) Level 3 | | % of Net Assets |
| Collateralized Loan Obligation - Equity Class (Cayman Islands) |
| CIFC Funding 2014-III, Ltd. | | Income Notes | | 19.21 | % | | 10/22/2031 | | 11/14/2016 | | $ | 11,700,000 | | | $ | 7,304,549 | | | $ | 6,257,765 | | | 1.6 | % |
| CIFC Funding 2014-IV-R, Ltd. | | Income Notes | | 17.96 | % | | 10/17/2030 | | 8/5/2014 | | 4,286,000 | | | 2,852,967 | | | 2,137,551 | | | 0.5 | % |
| CIFC Funding 2015-I, Ltd. | | Subordinated Notes | | 20.55 | % | | 1/22/2031 | | 11/24/2015 | | 7,500,000 | | | 5,564,835 | | | 4,778,169 | | | 1.2 | % |
| CIFC Funding 2015-III, Ltd. | | Subordinated Notes | | 18.79 | % | | 4/19/2029 | | 5/29/2018 | | 10,000,000 | | | 7,173,682 | | | 5,988,049 | | | 1.5 | % |
| CIFC Funding 2015-IV, Ltd. | | Subordinated Notes | | 15.10 | % | | 10/20/2027 | | 4/27/2016 | | 9,100,000 | | | 7,107,636 | | | 5,401,988 | | | 1.3 | % |
| CIFC Funding 2016-I, Ltd. | | Subordinated Notes | | 23.56 | % | | 10/21/2031 | | 12/9/2016 | | 6,500,000 | | | 3,963,050 | | | 5,522,896 | | | 1.4 | % |
| CIFC Funding 2017-I, Ltd. | | Subordinated Notes | | 15.02 | % | | 4/20/2029 | | 2/3/2017 | | 8,000,000 | | | 7,302,286 | | | 5,656,463 | | | 1.4 | % |
| CIFC Funding 2017-IV, Ltd. | | Subordinated Notes | | 17.61 | % | | 10/24/2030 | | 8/14/2017 | | 18,000,000 | | | 17,550,510 | | | 15,091,671 | | | 3.8 | % |
| CIFC Funding 2018-IV, Ltd. | | Subordinated Notes | | 31.95 | % | | 10/17/2031 | | 6/19/2020 | | 6,000,000 | | | 4,186,252 | | | 4,533,308 | | | 1.1 | % |
| CIFC Funding 2020-II, Ltd. | | Income Notes | | 25.64 | % | | 8/24/2032 | | 7/20/2020 | | 2,000,000 | | | 1,903,623 | | | 1,923,991 | | | 0.5 | % |
| CIFC Funding 2020-III, Ltd. | | Subordinated Notes | | 22.67 | % | | 10/20/2031 | | 9/11/2020 | | 6,000,000 | | | 5,634,425 | | | 6,051,611 | | | 1.5 | % |
| Columbia Cent CLO 29 Limited | | Subordinated Notes | | 28.70 | % | | 7/21/2031 | | 7/10/2020 | | 9,000,000 | | | 7,908,052 | | | 7,905,572 | | | 2.0 | % |
| Galaxy XIX CLO, Ltd. | | Subordinated Notes | | 19.53 | % | | 7/24/2030 | | 12/5/2016 | | 2,750,000 | | | 1,937,878 | | | 1,280,970 | | | 0.3 | % |
| Galaxy XXVIII CLO, Ltd. | | Subordinated Notes | | 12.64 | % | | 7/15/2031 | | 5/30/2014 | | 250,000 | | | 183,879 | | | 106,400 | | | 0.0 | % |
| GoldenTree Loan Opportunities IX, Ltd. | | Subordinated Notes | | 19.81 | % | | 10/29/2029 | | 7/19/2017 | | 3,250,000 | | | 2,556,017 | | | 1,908,385 | | | 0.5 | % |
Halcyon Loan Advisors Funding 2014-2 Ltd.(6) | | Subordinated Notes | | — | % | | 4/28/2025 | | 4/14/2014 | | 400,000 | | | 210,313 | | | — | | | — | % |
Halcyon Loan Advisors Funding 2014-3 Ltd.(6) | | Subordinated Notes | | — | % | | 10/22/2025 | | 9/12/2014 | | 500,000 | | | 298,545 | | | — | | | — | % |
Halcyon Loan Advisors Funding 2015-1 Ltd.(6) | | Subordinated Notes | | — | % | | 4/20/2027 | | 3/16/2015 | | 3,000,000 | | | 1,849,511 | | | — | | | — | % |
Halcyon Loan Advisors Funding 2015-2 Ltd.(6) | | Subordinated Notes | | — | % | | 7/26/2027 | | 6/3/2015 | | 3,000,000 | | | 1,927,789 | | | 628 | | | 0.0 | % |
Halcyon Loan Advisors Funding 2015-3 Ltd.(6) | | Subordinated Notes | | — | % | | 10/18/2027 | | 7/27/2015 | | 7,000,000 | | | 5,342,317 | | | 1,956,575 | | | 0.5 | % |
| HarbourView CLO VII-R, Ltd. | | Subordinated Notes | | 3.03 | % | | 7/18/2031 | | 6/5/2015 | | 275,000 | | | 188,878 | | | 73,112 | | | 0.0 | % |
| Jefferson Mill CLO Ltd. | | Subordinated Notes | | 11.80 | % | | 10/20/2031 | | 6/30/2015 | | 6,049,689 | | | 5,189,502 | | | 3,328,707 | | | 0.8 | % |
| LCM XV Limited Partnership | | Income Notes | | 6.64 | % | | 7/19/2030 | | 1/28/2014 | | 250,000 | | | 178,840 | | | 110,462 | | | 0.0 | % |
| LCM XVI Limited Partnership | | Income Notes | | 10.67 | % | | 10/15/2031 | | 5/12/2014 | | 6,814,685 | | | 4,643,406 | | | 3,284,599 | | | 0.8 | % |
| LCM XVII Limited Partnership | | Income Notes | | 13.36 | % | | 10/15/2031 | | 9/17/2014 | | 1,000,000 | | | 731,462 | | | 592,147 | | | 0.1 | % |
| Madison Park Funding XIII, Ltd. | | Subordinated Notes | | 29.34 | % | | 4/19/2030 | | 2/3/2014 | | 13,000,000 | | | 9,277,763 | | | 9,384,661 | | | 2.3 | % |
| Madison Park Funding XIV, Ltd. | | Subordinated Notes | | 18.89 | % | | 10/22/2030 | | 7/3/2014 | | 14,000,000 | | | 10,898,543 | | | 9,010,794 | | | 2.2 | % |
| Madison Park Funding XL, Ltd. | | Subordinated Notes | | 42.16 | % | | 2/28/2047 | | 10/8/2020 | | 7,000,000 | | | 2,878,038 | | | 3,307,928 | | | 0.8 | % |
Mountain View CLO 2014-1 Ltd.(6) | | Income Notes | | — | % | | 10/15/2026 | | 8/29/2014 | | 1,000,000 | | | 497,106 | | | — | | | — | % |
| Mountain View CLO IX Ltd. | | Subordinated Notes | | 18.77 | % | | 7/15/2031 | | 5/13/2015 | | 8,815,500 | | | 5,307,161 | | | 4,951,521 | | | 1.2 | % |
| Octagon Investment Partners XIV, Ltd. | | Income Notes | | 20.12 | % | | 7/16/2029 | | 12/1/2017 | | 6,150,000 | | | 3,999,908 | | | 3,165,889 | | | 0.8 | % |
| Octagon Investment Partners XV, Ltd. | | Income Notes | | 23.57 | % | | 7/19/2030 | | 5/23/2019 | | 5,644,737 | | | 3,313,566 | | | 3,392,710 | | | 0.8 | % |
| Octagon Investment Partners XVII, Ltd. | | Subordinated Notes | | 22.76 | % | | 1/27/2031 | | 6/28/2018 | | 16,153,000 | | | 9,055,340 | | | 7,788,489 | | | 1.9 | % |
| Octagon Investment Partners 18-R, Ltd. | | Subordinated Notes | | 18.56 | % | | 4/16/2031 | | 7/30/2015 | | 4,568,944 | | | 2,573,244 | | | 1,826,088 | | | 0.5 | % |
2021 SEMI-ANNUAL REPORT
PRIORITY INCOME FUND, INC. 15
| | | | | | | | | | | | | | | | | | | | | | | | | | | | | | | | | | | | | | | | | | | | | | | | | | |
Portfolio Investments(1)(5) | | Investment | | Estimated Yield(2)/Interest Rate | | Legal Maturity | | Acquisition date | | Principal Amount | | Amortized Cost | | Fair Value(3) Level 3 | | % of Net Assets |
| Collateralized Loan Obligation - Equity Class (Cayman Islands) |
| Octagon Investment Partners 20-R, Ltd. | | Subordinated Notes | | 19.03 | % | | 5/12/2031 | | 4/25/2019 | | $ | 3,500,000 | | | $ | 2,848,587 | | | $ | 2,355,399 | | | 0.6 | % |
| Octagon Investment Partners XXI, Ltd. | | Subordinated Notes | | 18.07 | % | | 2/14/2031 | | 1/6/2016 | | 13,822,188 | | | 8,329,515 | | | 6,347,671 | | | 1.6 | % |
| Octagon Investment Partners XXII, Ltd. | | Subordinated Notes | | 18.71 | % | | 1/22/2030 | | 11/12/2014 | | 6,625,000 | | | 5,275,811 | | | 4,095,698 | | | 1.0 | % |
| Octagon Investment Partners XXIII, Ltd. | | Subordinated Notes | | 17.06 | % | | 7/15/2027 | | 2/1/2016 | | 12,000,000 | | | 8,712,750 | | | 7,972,587 | | | 2.0 | % |
| Octagon Investment Partners 27, Ltd. | | Subordinated Notes | | 20.84 | % | | 7/15/2030 | | 10/31/2018 | | 5,000,000 | | | 3,679,675 | | | 2,962,232 | | | 0.7 | % |
| Octagon Investment Partners 30, Ltd. | | Subordinated Notes | | 16.02 | % | | 3/18/2030 | | 11/16/2017 | | 9,525,000 | | | 8,798,701 | | | 7,426,525 | | | 1.8 | % |
| Octagon Investment Partners 31, Ltd. | | Subordinated Notes | | 36.00 | % | | 7/19/2030 | | 12/20/2019 | | 3,067,500 | | | 1,943,753 | | | 1,969,187 | | | 0.5 | % |
| Octagon Investment Partners 33, Ltd. | | Subordinated Notes | | 20.49 | % | | 1/20/2031 | | 7/9/2018 | | 2,850,000 | | | 2,538,040 | | | 2,346,588 | | | 0.6 | % |
| Octagon Investment Partners 36, Ltd. | | Subordinated Notes | | 29.39 | % | | 4/15/2031 | | 12/20/2019 | | 10,400,960 | | | 8,687,922 | | | 7,868,860 | | | 2.0 | % |
| Octagon Investment Partners 39, Ltd. | | Subordinated Notes | | 28.59 | % | | 10/21/2030 | | 1/9/2020 | | 10,250,000 | | | 7,991,058 | | | 8,133,552 | | | 2.0 | % |
| Octagon Loan Funding, Ltd. | | Subordinated Notes | | 21.09 | % | | 11/18/2031 | | 8/25/2014 | | 5,014,526 | | | 3,088,402 | | | 2,788,705 | | | 0.7 | % |
| OZLM VI, Ltd. | | Subordinated Notes | | 12.28 | % | | 4/17/2031 | | 10/31/2016 | | 15,688,991 | | | 12,211,006 | | | 9,048,491 | | | 2.2 | % |
| OZLM VII, Ltd. | | Subordinated Notes | | 7.66 | % | | 7/17/2029 | | 11/3/2015 | | 2,654,467 | | | 1,577,615 | | | 1,059,138 | | | 0.3 | % |
| OZLM VIII, Ltd. | | Subordinated Notes | | 8.31 | % | | 10/17/2029 | | 8/7/2014 | | 950,000 | | | 615,386 | | | 325,179 | | | 0.1 | % |
| OZLM IX, Ltd. | | Subordinated Notes | | 12.88 | % | | 10/20/2031 | | 2/22/2017 | | 15,000,000 | | | 11,966,296 | | | 8,944,245 | | | 2.2 | % |
| OZLM XII, Ltd. | | Subordinated Notes | | 1.44 | % | | 4/30/2027 | | 1/17/2017 | | 12,122,952 | | | 8,032,173 | | | 5,579,749 | | | 1.4 | % |
| OZLM XXII, Ltd. | | Subordinated Notes | | 18.29 | % | | 1/17/2031 | | 5/11/2017 | | 27,343,000 | | | 17,489,978 | | | 14,450,190 | | | 3.6 | % |
| Romark WM-R Ltd. | | Subordinated Notes | | 11.95 | % | | 4/21/2031 | | 4/11/2014 | | 490,713 | | | 419,714 | | | 271,447 | | | 0.1 | % |
| Sound Point CLO II, Ltd. | | Subordinated Notes | | 18.53 | % | | 1/27/2031 | | 5/16/2019 | | 21,053,778 | | | 12,178,720 | | | 9,560,409 | | | 2.4 | % |
| Sound Point CLO VII-R, Ltd. | | Subordinated Notes | | 23.05 | % | | 10/23/2031 | | 7/31/2019 | | 9,002,745 | | | 3,642,612 | | | 3,107,466 | | | 0.8 | % |
| Sound Point CLO XVII, Ltd. | | Subordinated Notes | | 19.27 | % | | 10/20/2030 | | 7/11/2018 | | 20,000,000 | | | 16,964,375 | | | 15,688,802 | | | 3.9 | % |
| Sound Point CLO XVIII, Ltd. | | Subordinated Notes | | 22.74 | % | | 1/20/2031 | | 10/29/2018 | | 11,050,000 | | | 8,838,026 | | | 9,208,067 | | | 2.3 | % |
Symphony CLO XIV, Ltd.(6) | | Subordinated Notes | | — | % | | 7/14/2026 | | 5/6/2014 | | 750,000 | | | 429,184 | | | 180,176 | | | 0.0 | % |
| Symphony CLO XVI, Ltd. | | Subordinated Notes | | 14.76 | % | | 10/15/2031 | | 7/1/2015 | | 5,000,000 | | | 4,238,378 | | | 3,120,683 | | | 0.8 | % |
| TCI-Symphony CLO 2017-1, Ltd. | | Income Notes | | 41.55 | % | | 7/15/2030 | | 9/15/2020 | | 3,000,000 | | | 1,445,361 | | | 1,643,068 | | | 0.4 | % |
| THL Credit Wind River 2013-1 CLO, Ltd. | | Subordinated Notes | | 16.37 | % | | 7/19/2030 | | 11/1/2017 | | 10,395,000 | | | 8,328,632 | | | 5,435,067 | | | 1.4 | % |
| THL Credit Wind River 2013-2 CLO, Ltd. | | Income Notes | | 16.29 | % | | 10/18/2030 | | 12/27/2017 | | 3,250,000 | | | 2,147,449 | | | 1,511,801 | | | 0.4 | % |
| THL Credit Wind River 2014-1 CLO, Ltd. | | Subordinated Notes | | 20.77 | % | | 7/18/2031 | | 7/11/2018 | | 11,800,000 | | | 8,110,116 | | | 7,077,307 | | | 1.8 | % |
| THL Credit Wind River 2017-4 CLO, Ltd. | | Subordinated Notes | | 36.46 | % | | 11/20/2030 | | 6/25/2020 | | 3,765,400 | | | 2,540,705 | | | 2,734,701 | | | 0.7 | % |
| THL Credit Wind River 2018-2 CLO, Ltd. | | Subordinated Notes | | 21.22 | % | | 7/15/2030 | | 3/11/2019 | | 8,884,000 | | | 7,978,045 | | | 7,297,990 | | | 1.8 | % |
| THL Credit Wind River 2018-3 CLO, Ltd. | | Subordinated Notes | | 23.64 | % | | 1/20/2031 | | 6/28/2019 | | 13,000,000 | | | 11,893,243 | | | 10,752,040 | | | 2.7 | % |
| Venture XVIII CLO, Ltd. | | Subordinated Notes | | 13.54 | % | | 10/15/2029 | | 7/16/2018 | | 4,750,000 | | | 3,295,160 | | | 2,560,840 | | | 0.6 | % |
| Venture 28A CLO, Ltd. | | Subordinated Notes | | 15.83 | % | | 10/19/2029 | | 7/16/2018 | | 12,000,000 | | | 9,996,828 | | | 8,698,899 | | | 2.2 | % |
| Venture XXX CLO, Ltd. | | Subordinated Notes | | 19.41 | % | | 1/15/2031 | | 7/16/2018 | | 5,100,000 | | | 4,451,330 | | | 4,080,253 | | | 1.0 | % |
2021 SEMI-ANNUAL REPORT
PRIORITY INCOME FUND, INC. 16
| | | | | | | | | | | | | | | | | | | | | | | | | | | | | | | | | | | | | | | | | | | | | | | | | | |
Portfolio Investments(1)(5) | | Investment | | Estimated Yield(2)/Interest Rate | | Legal Maturity | | Acquisition date | | Principal Amount | | Amortized Cost | | Fair Value(3) Level 3 | | % of Net Assets |
| Collateralized Loan Obligation - Equity Class (Cayman Islands) |
| Venture XXXII CLO, Ltd. | | Subordinated Notes | | 20.65 | % | | 7/18/2031 | | 10/9/2018 | | $ | 7,929,328 | | | $ | 7,525,780 | | | $ | 7,071,269 | | | 1.8 | % |
| Venture XXXIV CLO, Ltd. | | Subordinated Notes | | 22.11 | % | | 10/15/2031 | | 7/30/2019 | | 5,250,000 | | | 4,508,859 | | | 4,336,099 | | | 1.1 | % |
| Voya IM CLO 2013-1, Ltd. | | Income Notes | | 12.58 | % | | 10/15/2030 | | 6/9/2016 | | 4,174,688 | | | 2,981,911 | | | 2,162,765 | | | 0.5 | % |
| Voya IM CLO 2013-3, Ltd. | | Subordinated Notes | | 4.60 | % | | 10/17/2031 | | 2/13/2015 | | 4,000,000 | | | 2,256,304 | | | 1,339,383 | | | 0.3 | % |
| Voya IM CLO 2014-1, Ltd. | | Subordinated Notes | | 8.77 | % | | 4/18/2031 | | 2/5/2014 | | 314,774 | | | 242,160 | | | 139,743 | | | 0.0 | % |
Voya CLO 2014-3, Ltd.(6) | | Subordinated Notes | | — | % | | 7/24/2026 | | 4/10/2015 | | 7,000,000 | | | 3,296,267 | | | 668,049 | | | 0.2 | % |
| Voya CLO 2014-4, Ltd. | | Subordinated Notes | | 9.20 | % | | 7/14/2031 | | 11/10/2014 | | 1,000,000 | | | 757,609 | | | 499,455 | | | 0.1 | % |
| Voya CLO 2015-2, Ltd. | | Subordinated Notes | | 17.87 | % | | 7/23/2027 | | 6/24/2015 | | 13,712,000 | | | 8,704,295 | | | 8,241,855 | | | 2.0 | % |
| Voya CLO 2016-1, Ltd. | | Subordinated Notes | | 16.98 | % | | 1/21/2031 | | 1/22/2016 | | 7,750,000 | | | 6,846,945 | | | 6,069,446 | | | 1.5 | % |
| Voya CLO 2016-3, Ltd. | | Subordinated Notes | | 14.71 | % | | 10/20/2031 | | 9/30/2016 | | 10,225,000 | | | 8,504,787 | | | 7,124,432 | | | 1.8 | % |
| Voya CLO 2017-3, Ltd. | | Subordinated Notes | | 12.52 | % | | 7/19/2030 | | 6/15/2017 | | 5,750,000 | | | 6,384,832 | | | 5,310,679 | | | 1.3 | % |
| Voya CLO 2018-1, Ltd. | | Subordinated Notes | | 16.20 | % | | 4/18/2031 | | 2/23/2018 | | 10,000,000 | | | 9,643,230 | | | 8,281,622 | | | 2.1 | % |
| Voya CLO 2019-1, Ltd. | | Subordinated Notes | | 26.88 | % | | 4/15/2031 | | 1/27/2020 | | 15,500,000 | | | 14,556,579 | | | 14,062,311 | | | 3.5 | % |
West CLO 2014-1 Ltd.(6) | | Subordinated Notes | | — | % | | 7/17/2026 | | 6/24/2014 | | 13,375,000 | | | 7,931,763 | | | 4,378,688 | | | 1.0 | % |
| Total Collateralized Loan Obligation - Equity Class | | $ | 596,640,722 | | | $ | 502,507,822 | | | 124.9 | % |
| | | | | | | | | | | | | | | | |
Collateralized Loan Obligation - Debt Class (Cayman Islands)(4) |
| Apidos CLO XXIV | | Class E-R Notes | | 8.07% (LIBOR + 7.86%) | | 10/21/2030 | | 3/10/2020 | | $ | 2,000,000 | | | $ | 1,463,428 | | | $ | 1,564,426 | | | 0.4 | % |
| California Street CLO IX, Ltd. | | Class F-R2 Notes | | 8.75% (LIBOR + 8.52%) | | 7/16/2032 | | 9/2/2020 | | 2,000,000 | | | 1,532,660 | | | 1,648,445 | | | 0.4 | % |
| Carlyle Global Market Strategies 2014-2-R, Ltd. | | Class E Notes | | 8.22% (LIBOR + 8.00%) | | 5/15/2031 | | 3/6/2019 | | 7,500,000 | | | 6,753,399 | | | 5,609,044 | | | 1.4 | % |
| Carlyle CLO 17, Ltd. | | Class E-R Notes | | 8.56% (LIBOR + 8.35%) | | 4/30/2031 | | 3/5/2019 | | 3,000,000 | | | 2,759,260 | | | 2,796,255 | | | 0.7 | % |
| Cent CLO 21 Limited | | Class E-R2 Notes | | 8.87% (LIBOR + 8.65%) | | 7/26/2030 | | 7/12/2018 | | 109,122 | | | 102,999 | | | 91,527 | | | 0.0 | % |
| CIFC Funding 2013-III-R, Ltd. | | Class E Notes | | 7.99% (LIBOR + 7.78%) | | 4/24/2031 | | 10/2/2020 | | 3,000,000 | | | 2,180,379 | | | 2,421,768 | | | 0.6 | % |
| CIFC Funding 2014-IV-R, Ltd. | | Class E Notes | | 8.22% (LIBOR + 8.00%) | | 10/17/2030 | | 11/12/2019 | | 9,000,000 | | | 7,330,867 | | | 7,672,620 | | | 1.9 | % |
| CIFC Funding 2014-V, Ltd. | | Class F-R2 Notes | | 8.72% (LIBOR + 8.50%) | | 10/17/2031 | | 9/17/2018 | | 750,000 | | | 726,297 | | | 644,812 | | | 0.2 | % |
| CIFC Funding 2015-I, Ltd. | | Class F-RR Notes | | 8.07% (LIBOR + 7.85%) | | 1/22/2031 | | 10/31/2019 | | 5,000,000 | | | 3,953,524 | | | 4,499,071 | | | 1.1 | % |
| CIFC Funding 2015-IV, Ltd. | | Class E-R Notes | | 8.87% (LIBOR + 8.65%) | | 10/20/2027 | | 12/14/2018 | | 9,000,000 | | | 8,626,684 | | | 7,870,147 | | | 2.0 | % |
| CIFC Funding 2016-I, Ltd. | | Class F-R Notes | | 10.36% (LIBOR + 10.15%) | | 10/21/2031 | | 9/16/2019 | | 3,750,000 | | | 3,569,380 | | | 3,390,914 | | | 0.8 | % |
| Galaxy XXI CLO, Ltd. | | Class F-R Notes | | 7.47% (LIBOR + 7.25%) | | 4/21/2031 | | 3/8/2019 | | 6,000,000 | | | 4,879,462 | | | 5,404,424 | | | 1.3 | % |
2021 SEMI-ANNUAL REPORT
PRIORITY INCOME FUND, INC. 17
| | | | | | | | | | | | | | | | | | | | | | | | | | | | | | | | | | | | | | | | | | | | | | | | | | |
Portfolio Investments(1)(5) | | Investment | | Estimated Yield(2)/Interest Rate | | Legal Maturity | | Acquisition date | | Principal Amount | | Amortized Cost | | Fair Value(3) Level 3 | | % of Net Assets |
Collateralized Loan Obligation - Debt Class (Cayman Islands)(4) |
| Galaxy XXVII CLO, Ltd. | | Class F Junior Notes | | 8.28% (LIBOR + 8.06%) | | 5/16/2031 | | 3/5/2019 | | $ | 1,500,000 | | | $ | 1,329,769 | | | $ | 1,282,820 | | | 0.3 | % |
| Galaxy XXVIII CLO, Ltd. | | Class F Junior Notes | | 8.72% (LIBOR + 8.48%) | | 7/15/2031 | | 6/29/2018 | | 41,713 | | | 38,765 | | | 35,884 | | | 0.0 | % |
| HarbourView CLO VII-R, Ltd. | | Class F Notes | | 8.49% (LIBOR + 8.27%) | | 7/18/2031 | | 10/29/2018 | | 6,433,556 | | | 6,200,014 | | | 4,326,226 | | | 1.1 | % |
| Madison Park Funding XIII, Ltd. | | Class F-R Notes | | 8.17% (LIBOR + 7.95%) | | 4/19/2030 | | 10/25/2019 | | 2,000,000 | | | 1,659,901 | | | 1,722,521 | | | 0.4 | % |
| Madison Park Funding XIV, Ltd. | | Class F-R Notes | | 7.99% (LIBOR + 7.77%) | | 10/22/2030 | | 3/13/2020 | | 4,500,000 | | | 3,030,510 | | | 3,223,010 | | | 0.8 | % |
| Mountain View CLO IX Ltd. | | Class E Notes | | 8.26% (LIBOR + 8.02%) | | 7/15/2031 | | 10/29/2018 | | 3,625,000 | | | 3,474,831 | | | 2,715,182 | | | 0.7 | % |
| Octagon Investment Partners XVII, Ltd. | | Class F-R2 Notes | | 7.41% (LIBOR + 7.20%) | | 1/27/2031 | | 10/15/2019 | | 5,362,500 | | | 4,116,576 | | | 4,396,830 | | | 1.1 | % |
| Octagon Investment Partners 18-R, Ltd. | | Class E Notes | | 8.48% (LIBOR + 8.25%) | | 4/16/2031 | | 10/15/2019 | | 6,000,000 | | | 4,776,571 | | | 5,253,192 | | | 1.3 | % |
| Octagon Investment Partners XXII, Ltd. | | Class F-RR Notes | | 7.97% (LIBOR + 7.75%) | | 1/22/2030 | | 11/25/2019 | | 5,500,000 | | | 4,218,673 | | | 4,737,925 | | | 1.2 | % |
| OZLM VIII, Ltd. | | Class E-RR Notes | | 8.39% (LIBOR + 8.17%) | | 10/17/2029 | | 11/6/2018 | | 8,400,000 | | | 8,107,415 | | | 7,141,205 | | | 1.8 | % |
| Sound Point CLO IV-R, Ltd. | | Class F Notes | | 8.32% (LIBOR + 8.10%) | | 4/18/2031 | | 3/18/2019 | | 3,500,000 | | | 3,175,945 | | | 2,614,910 | | | 0.6 | % |
| Venture XIX CLO, Ltd. | | Class F-RR Notes | | 8.74% (LIBOR + 8.50%) | | 1/15/2032 | | 11/16/2018 | | 7,900,000 | | | 7,637,162 | | | 6,756,414 | | | 1.7 | % |
| Venture XXXIII CLO, Ltd. | | Class F Notes | | 8.24% (LIBOR + 8.00%) | | 7/15/2031 | | 12/3/2019 | | 2,500,000 | | | 1,846,576 | | | 2,038,798 | | | 0.5 | % |
| Voya IM CLO 2012-4, Ltd. | | Class E-R-R Notes | | 11.09% (LIBOR + 10.85%) | | 10/15/2030 | | 10/11/2019 | | 3,320,000 | | | 3,122,101 | | | 3,000,959 | | | 0.7 | % |
| Voya IM CLO 2014-1, Ltd. | | Class E-R2 Notes | | 8.57% (LIBOR + 8.35%) | | 4/18/2031 | | 4/11/2019 | | 3,000,000 | | | 2,736,072 | | | 2,397,082 | | | 0.7 | % |
| Total Collateralized Loan Obligation - Debt Class | | $ | 99,349,220 | | | $ | 95,256,411 | | | 23.7 | % |
| | | | | | | | | | | | | | | | |
| Total Portfolio Investments | | | | | | | | $ | 695,989,942 | | | $ | 597,764,233 | | | 148.6 | % |
| Other liabilities in excess of assets | | | | | | | | | | (195,380,744) | | | (48.6) | % |
| Net Assets | | | | | | | | | | $ | 402,383,489 | | | 100.0 | % |
| | | | | | | | | | | | | | | | |
(1) The Company does not "control" and is not an "affiliate" of any of the portfolio investments, each term as defined in the Investment Company Act of 1940, as amended (the "1940 Act"). In general, under the 1940 Act, the Company would be presumed to "control" a portfolio company if the Company owned 25% or more of its voting securities and would be an "affiliate" of a portfolio company if the Company owned 5% or more of its voting securities. |
(2) The CLO subordinated notes/securities/fee notes, income notes and preferred shares are considered equity positions in the CLOs. The CLO equity investments are entitled to recurring distributions which are generally equal to the excess cash flow generated from the underlying investments after payment of the contractual payments to senior debt holders and CLO expenses. The current estimated yield, calculated using amortized cost, is based on the current projections of this excess cash flow taking into account assumptions which have been made regarding expected prepayments, losses and future reinvestment rates. These assumptions are periodically reviewed and adjusted. Ultimately, the actual yield may be higher or lower than the estimated yield if actual results differ from those used for the assumptions. |
(3) Fair value is determined by or under the direction of the Company’s Board of Directors. As of December 31, 2020, all of the Company’s investments were classified as Level 3. ASC 820 classifies such unobservable inputs used to measure fair value as Level 3 within the valuation hierarchy. See Notes 2 and 3 within the accompanying notes to financial statements for further discussion. |
(4) The interest rate on these investments is subject to the base rate of 3-Month LIBOR, which was 0.238% at December 31, 2020. The current base rate for each investment may be different from the reference rate on December 31, 2020. |
(5) Restricted securities for which quotations are not readily available are valued at fair value, as determined by the Board of Directors. Unless otherwise noted, all of the Company's investments are deemed to be restricted securities. |
(6) The effective yield has been estimated to be 0% as expected future cash flows are anticipated to not be sufficient to repay the investment at cost. If the expected investment proceeds increase, there is a potential for future investment income from the investment. Distributions, once received, will be recognized as return of capital, and when called, any remaining unamortized investment costs will be written off if the actual distributions are less than the amortized investment cost. To the extent that the cost basis of the senior secured notes is fully recovered, any future distributions will be recorded as realized gains. |
|
| See accompanying notes to financial statements. |
2021 SEMI-ANNUAL REPORT
PRIORITY INCOME FUND, INC. 18
Notes to Financial Statements (unaudited)
December 31, 2020
Note 1. Principal Business and Organization
Priority Income Fund, Inc., (the “Company,” “us,” “our,” or “we”) was incorporated under the general corporation laws of the State of Maryland on July 19, 2012 as an externally managed, nondiversified, closed-end management investment company under the Investment Company Act of 1940, as amended (the “1940 Act”), and commenced operations on May 9, 2013. In addition, the Company has elected to be treated for tax purposes as a regulated investment company (“RIC”) under Subchapter M of the Internal Revenue Code of 1986, as amended (the “Code”). The Company’s investment objective is to generate current income, and as a secondary objective, long-term capital appreciation. We seek to achieve our investment objective by investing, under normal circumstances, in senior secured loans made to companies whose debt is rated below investment grade or, in limited circumstances, unrated (“Senior Secured Loans”) with an emphasis on current income. Our investments may take the form of the purchase of Senior Secured Loans (either in the primary or secondary markets) or through investments in the equity and junior debt tranches of collateralized loan obligation (“CLO”) vehicles that in turn own pools of Senior Secured Loans. The Company intends to invest in both the primary and secondary markets.
IIk,m
The Company is managed by Priority Senior Secured Income Management, LLC (the “Adviser”), which is registered as an investment adviser under the Investment Advisers Act of 1940, as amended. The Adviser is 50% owned by Prospect Capital Management, L.P. (“PCM”) and 50% by Stratera Holdings, LLC (“Stratera Holdings”).
The Company is offering up to 100,000,000 shares of its common stock, on a best efforts basis. The Company commenced the offering on May 9, 2013, at an initial offering price of $15.00 per share, for an initial offering period of 36 months from the date of the commencement of the offering. On January 6, 2014, the Company satisfied its minimum offering requirement by raising over $2.5 million from selling shares to persons not affiliated with the Company or the Adviser (the “Minimum Offering Requirement”), and as a result, broke escrow and commenced making investments.
On February 9, 2016 the Company’s Board of Directors the (the “Board”) approved an 18-month extension to the offering period for the sale of the Company’s common shares through November 9, 2017. Subsequently, on May 30, 2017, the Board approved a continuation of this offering for an additional two years, extending the offering period for the sale of shares through November 2, 2019. On November 25, 2019, the Board approved an additional 18-month continuous public offering period until the earlier of (i) July 23, 2021, or (ii) the date upon which 150,000,000 common shares have been sold in the course of the offering of the Company's common shares, unless further extended by our Board.
IIIIIIIIIIIIII
On December 21, 2018 the Board approved a definitive agreement (the “Merger Agreement”) pursuant to which the Company agreed, subject to the satisfaction of certain closing conditions, to acquire Stira Alcentra Global Credit Fund, a Delaware statutory trust (“Stira Alcentra”), in a common stock transaction (the “Stira Alcentra Acquisition”). In connection with the Merger, the Company also entered into a consulting agreement (the “Consulting Agreement”), with Stira Capital Markets Group, LLC (“SCMG”), the dealer-manager of Stira Alcentra. The transaction was treated as an asset acquisition in accordance with ASC 805, Business Combinations. The transaction was completed on May 10, 2019.
Note 2. Summary of Significant Accounting Policies
The following is a summary of significant accounting policies followed by the Company in the preparation of its financial statements.
Basis of Presentation
The accompanying financial statements have been prepared in accordance with United States generally accepted accounting principles (“GAAP”) pursuant to the requirements for reporting on Form N-CSR, ASC 946, Financial Services - Investment Companies (“ASC 946”), and Articles 6, 10 and 12 of Regulation S-X.
Use of Estimates
The preparation of financial statements in conformity with GAAP requires management to make estimates and assumptions that affect the reported amounts of assets and liabilities and disclosure of contingent assets and liabilities at the date of the financial statements and the reported amounts of income, expenses and gains (losses) during the reporting period. Actual results could differ from those estimates and those differences could be material.
Reclassifications
Certain reclassifications have been made in the presentation of prior financial statements and accompanying notes to conform to the presentation as of and for the period ended December 31, 2020.
2021 SEMI-ANNUAL REPORT
PRIORITY INCOME FUND, INC. 19
Cash
Cash held at financial institutions, at times, may exceed the Federal Deposit Insurance Corporation (“FDIC”) insured limit.
Investment Risks
Our investments are subject to a variety of risks. Those risks include the following:
Market Risk
Market risk represents the potential loss that can be caused by a change in the fair value of the financial instrument.
Credit Risk
Credit risk represents the risk that we would incur if the counterparties failed to perform pursuant to the terms of their agreements with us.
Credit Spread Risk
Credit spreads risk represents the risk that with higher interest rates comes a higher risk of defaults.
Liquidity Risk
Liquidity risk represents the possibility that we may not be able to rapidly adjust the size of our investment positions in times of high volatility and financial stress at a reasonable price.
Interest Rate Risk
Interest rate risk represents a change in interest rates, which could result in an adverse change in the fair value of an interest-bearing financial instrument.
Prepayment Risk
Many of our debt investments allow for prepayment of principal without penalty. Downward changes in interest rates may cause prepayments to occur at a faster than expected rate, thereby effectively shortening the maturity of the security and making us less likely to fully earn all of the expected income of that security and reinvesting in a lower yielding instrument.
Downgrade Risk
Downgrade risk results when rating agencies lower their rating on a bond which are usually accompanied by bond price declines.
Default Risk
Default risk is the risk that a borrower will be unable to make the required payments on their debt obligation..
Structured Credit Related Risk
CLO investments may be riskier and less transparent to us than direct investments in underlying companies. CLOs typically will have no significant assets other than their underlying senior secured loans. Therefore, payments on CLO investments are and will be payable solely from the cash flows from such senior secured loans.
Impact of the novel coronavirus (“Wuhan Virus”) pandemic
In December 2019, a novel strain of coronavirus (the "Wuhan Virus") surfaced in Wuhan, China, and the World Health Organization declared a global pandemic, while United States declared a national emergency and for the first time in its history, every state in the United States was under a federal disaster declaration. The U.S. capital markets are continuing to experience a volatility and disruption in connection with the Wuhan Virus pandemic.
The Wuhan Virus has resulted in numerous deaths, travel restrictions, closed international borders, enhanced health screenings at ports of entry and elsewhere, disruption of and delays in healthcare service preparation and delivery, prolonged quarantines and the imposition of both local and more widespread “work from home” measures, cancellations, supply chain disruptions, and lower consumer demand, as well as general concern and uncertainty. The ongoing spread of the Wuhan Virus has had, and is expected to continue to have, a material adverse impact on local economies in the affected jurisdictions and also on the global economy.
The global impact of the outbreak continues to evolve, and many countries have reacted by instituting quarantines, prohibitions on travel and the closure of offices, businesses, schools, retail stores and other public venues. Businesses have also implemented similar precautionary measures. Such measures, as well as the general uncertainty surrounding the dangers and
2021 SEMI-ANNUAL REPORT
PRIORITY INCOME FUND, INC. 20
impact of the Wuhan Virus, have created significant disruption in supply chains and economic activity. While several countries, as well as certain states in the United States, have begun to lift public health restrictions with the view to reopening their economies, recurring outbreaks have led to the re-introduction of such restrictions in certain states in the United States and globally and could continue to lead to the re-introduction of such restrictions elsewhere.
Although the Federal Food and Drug Administration has authorized vaccines for emergency use starting in December 2020, it remains unclear how quickly the vaccines will be distributed nationwide and globally, when “herd immunity” will be achieved in the United States and globally, and when the restrictions that were imposed to slow the spread of the virus will be lifted entirely. The delay in distributing the vaccines could lead people to continue to self-isolate and not participate in the economy at pre-pandemic levels for a prolonged period of time.
Even after the Wuhan Virus pandemic subsides, the U.S. economy and most other major global economies may continue to experience a recession, and we anticipate our business and operations could be materially adversely affected by a prolonged recession in the United States and other major markets. Additionally, as of late December 2020, travelers from the United States are not allowed to visit Canada, Australia or the majority of countries in Europe, Asia, Africa and South America. These continued travel restrictions may prolong the global economic downturn.
Many states, including those in which the Company and the underlying borrowers of the Company’s CLO investments operate, issued orders requiring the closure of non-essential businesses and/or requiring residents to stay at home. The Wuhan Virus pandemic and preventative measures taken to contain or mitigate its spread have caused, and are continuing to cause, business shutdowns, cancellations of events and travel, significant reductions in demand for certain goods and services, reductions in business activity and financial transactions, supply chain interruptions and overall economic and financial market instability both globally and in the United States. Such effects will likely continue for the duration of the pandemic, which is uncertain, and for some period thereafter.
The Wuhan Virus pandemic (including the preventative measures taken in response thereto) has to date (i) created significant business disruption issues for certain of the underlying borrowers of the Company’s CLO investments, and (ii) materially and adversely impacted the value and performance of certain of the Company’s CLO investments. The Wuhan Virus pandemic is having a particularly adverse impact on industries in which certain of the underlying borrowers of the Company’s CLO investments operate, including energy, hospitality, travel, retail and restaurants. Certain of the underlying borrowers of the Company’s CLO investments in other industries have also been significantly impacted. The Wuhan Virus pandemic is continuing as of the filing date of this semi-annual report, and its extended duration may have further adverse impacts on the Company’s CLO investments after December 31, 2020, including for the reasons described herein. Although on March 27, 2020, the U.S. government enacted the Coronavirus Aid, Relief, and Economic Security Act (the “CARES Act”), which contains provisions intended to mitigate the adverse economic effects of the Wuhan Virus pandemic, and although the U.S. government under the new presidential administration continues to consider additional similar or supplemental legislation, it is uncertain whether, or how much, the underlying borrowers of the Company’s CLO investments will be able to benefit from the CARES Act or any other subsequent legislation intended to provide financial relief or assistance. As a result of this disruption and the pressures on their liquidity, certain of the underlying borrowers of the Company’s CLO investments have been, or may continue to be, incentivized to draw on most, if not all, of the unfunded portion of any revolving or delayed draw term loans made by the CLO collateral managers, subject to availability under the terms of such loans.
As a management investment company, we are required to carry our investments at fair value as determined in good faith by our board of directors. Depending on market conditions, we could incur substantial losses in future periods, which could have a material adverse impact on our business, financial condition, and results of operations.
Although it is difficult to predict the extent of the impact of the Wuhan Virus outbreak on the underlying CLO vehicles we invest in, the failure by a CLO vehicle to satisfy certain financial covenants, including with respect to adequate collateralization and/or interest coverage tests, could lead to a reduction in its payments to us. In the event the CLO vehicle fails certain tests, holders of debt senior to us may be entitled to additional payments that would, in turn, reduce the payments we would otherwise be entitled to receive. Separately, we may incur expenses to the extent necessary to seek recovery upon default or to negotiate new terms with a defaulting CLO vehicle or any other investment we may make. If any of these occur, it could materially and adversely affect our operating results and cash flows.
The Wuhan Virus pandemic has adversely impacted the fair value of our investments as of December 31, 2020, and the values assigned as of this date may differ materially from the values that we may ultimately realize with respect to our investments. The impact of the Wuhan Virus pandemic may not yet be fully reflected in the valuation of our investments as our valuations, and particularly valuations of private investments and private companies, are inherently uncertain, may fluctuate over short periods of time and are often based on estimates, comparisons and qualitative evaluations of private information that is often from a time period earlier, generally two to three months, than the quarter for which we are reporting. Additionally, we may not
2021 SEMI-ANNUAL REPORT
PRIORITY INCOME FUND, INC. 21
have yet received information or certifications from our portfolio companies that indicate any or the full extent of declining performance or non-compliance with debt covenants, as applicable, as a result of the Wuhan Virus pandemic. As a result, our valuations at December 31, 2020 may not show the complete or continuing impact of the Wuhan Virus pandemic and the resulting measures taken in response thereto. In addition, write downs in the value of our investments have reduced, and any additional write downs may further reduce, our net asset value (and, as a result, our asset coverage calculation). Accordingly, we may continue to incur additional net unrealized losses or may incur realized losses after December 31, 2020, which could have a material adverse effect on our business, financial condition and results of operations.
Investment Valuation
The Company follows guidance under Financial Accounting Standards Board Accounting Standards Codification Topic 820, Fair Value Measurements and Disclosures ("ASC 820"), which classifies the inputs used to measure fair values into the following hierarchy:
Level 1. Unadjusted quoted prices in active markets for identical assets or liabilities that the Company has the ability to access at the measurement date.
Level 2. Quoted prices for similar assets or liabilities in active markets, or quoted prices for identical or similar assets or liabilities on an inactive market, or other observable inputs other than quoted prices.
Level 3. Unobservable inputs for the asset or liability.
In all cases, the level in the fair value hierarchy within which the fair value measurement in its entirety falls is determined based on the lowest level input that is significant to the fair value measurement in its entirety. The assessment of the significance of a particular input to the fair value measurement in its entirety requires judgment and considers factors specific to each investment.
Investments for which market quotations are readily available are valued at such market quotations and are classified in Level 1 of the fair value hierarchy.
U.S. government securities for which market quotations are available are valued at a price provided by an independent pricing agent or primary dealer. The pricing agent or primary dealer provides these prices usually after evaluating inputs including yield curves, credit rating, yield spreads, default rates, cash flows, broker quotes and reported trades. U.S. government securities are categorized in Level 2 of the fair value hierarchy.
With respect to investments for which market quotations are not readily available, or when such market quotations are deemed not to represent fair value, the Board has approved a multi-step valuation process for each quarter, as described below, and such investments are classified in Level 3 of the fair value hierarchy:
1.Each portfolio investment is reviewed by investment professionals of the Adviser with the independent valuation firm engaged by the Board.
2.The independent valuation firm prepares independent valuations based on its own independent assessments and issue its report.
3.The Audit Committee of the Board (the “Audit Committee”) reviews and discusses with the independent valuation firm the valuation report, and then makes a recommendation to the Board of the value for each investment.
4.The Board discusses valuations and determines the fair value of such investments in the Company’s portfolio in good faith based on the input of the Adviser, the respective independent valuation firm and the Audit Committee.
The Company's investments in CLOs are classified as Level 3 fair value measured securities under ASC 820 and are valued using both a discounted single-path cash flow model and a discounted multi-path cash flow model. The CLO structures are analyzed to identify the risk exposures and to determine an appropriate call date (i.e., expected maturity). These risk factors are sensitized in the multi-path cash flow model using Monte Carlo simulations, which is a simulation used to model the probability of different outcomes, to generate probability-weighted (i.e., multi-path) cash flows from the underlying assets and liabilities. These cash flows, after payments to debt tranches senior to our equity positions, are discounted using appropriate market discount rates, and relevant data in the CLO market as well as certain benchmark credit indices are considered, to determine the value of each CLO investment. In addition, we generate a single-path cash flow utilizing our best estimate of expected cash receipts, and assess the reasonableness of the implied discount rate that would be effective for the value derived from the multi-path cash flows. We are not responsible for and have no influence over the asset management of the portfolios underlying the CLO investments we hold, as those portfolios are managed by non-affiliated third party CLO collateral managers. The main risk factors are default risk, prepayment risk, interest rate risk, downgrade risk, and credit spread risk.
2021 SEMI-ANNUAL REPORT
PRIORITY INCOME FUND, INC. 22
The types of factors that are taken into account in fair value determination include, as relevant, market changes in expected returns for similar investments, performance improvement or deterioration, the nature and realizable value of any collateral, the issuer’s ability to make payments and its earnings and cash flows, the markets in which the issuer does business, comparisons to traded securities, and other relevant factors.
Valuation of Other Financial Assets and Financial Liabilities. ASC 825, Financial Instruments, specifically ASC 825-10-25, permits an entity to choose, at specified election dates, to measure eligible items at fair value (the "Fair Value Option"). We have not elected the Fair Value Option to report selected financial assets and financial liabilities. See Notes 12 and 13 for the disclosures of the fair value of our outstanding debt and the market observable inputs used in determining fair value.
Securities Transactions
Securities transactions are recorded on trade date. Realized gains or losses on investments are calculated by using the specific identification method.
Revenue Recognition
Interest Income - Equity
Interest income from investments in the “equity” positions of CLOs (typically income notes, subordinated notes or preferred shares) is recorded based on an estimation of an effective yield to expected maturity utilizing assumed future cash flows. The Company monitors the expected cash inflows from CLO equity investments, including the expected residual payments, and the estimated effective yield is updated periodically. Interest income from investments in the “debt” positions of CLOs, adjusted for amortization of premium and accretion of discount, is recorded on an accrual basis.
Interest Income - Debt Investments
Interest income is recorded on an accrual basis using the contractual rate applicable to each debt investment and includes the accretion of discounts and amortization of premiums. Discounts from and premiums to par value on securities purchased are accreted/amortized into interest income over the life of the respective security using the effective interest method. The amortized cost of investments represents the original cost adjusted for the accretion of discounts and amortization of premiums, if any. Generally, if the Company does not expect the borrower to be able to service its debt and other obligations, the Company will, on a discretionary basis, place the debt instrument on non-accrual status and will generally cease recognizing interest income on that loan for financial reporting purposes until all principal and interest have been brought current through payment or due to restructuring such that the interest income is deemed to be collectible. The Company generally restores non-accrual loans to accrual status when past due principal and interest is paid and, in the Fund’s judgment, the payments are likely to remain current. As of December 31, 2020, the Company had no non-accrual investments in its portfolio.
Paid-In-Kind Interest
The Company has certain investments in its portfolio that contain a payment-in-kind (“PIK”) interest provision, which represents contractual interest or dividends that are added to the principal balance and recorded as income. For the six months ended December 31, 2020, PIK interest included in interest income totaled $658,005. The Company stops accruing PIK interest when it is determined that PIK interest is no longer collectible. To maintain RIC tax treatment, and to avoid corporate tax, substantially all of this income must be paid out to the stockholders in the form of distributions, even though the Company has not yet collected the cash.
Preferred Stock
The Company carries its mandatorily redeemable preferred stock at accreted cost on the Statement of Assets and Liabilities, and not fair value. Refer to “Note 7. Mandatorily Redeemable Preferred Stock” for further details. In accordance with ASC 480-10-25, the Company's mandatorily redeemable preferred stock has been classified as a liability on the Statement of Assets and Liabilities. Dividend payments relating to the mandatorily redeemable preferred stock are included in preferred dividend payable on the Statement of Assets and Liabilities and preferred dividend expense on the Statement of Operations.
Asset Coverage Requirement
As a registered closed-end investment company, the Company is required to comply with the asset coverage requirements of the 1940 Act. Under the 1940 Act, the Company may not issue additional preferred stock if immediately after such issuance the Company will not have an asset coverage of at least 200% (defined as the ratio of the Company’s gross assets (less all liabilities and indebtedness not represented by senior securities) to its outstanding senior securities representing indebtedness, plus the aggregate involuntary liquidation preference of the Company’s outstanding preferred stock). If the value of our assets declines, we may be unable to satisfy this test. If that happens, we may be required to sell a portion of our investments and, depending on the nature of our leverage, repay a portion of our indebtedness or redeem outstanding shares of preferred stock, in each case at a
2021 SEMI-ANNUAL REPORT
PRIORITY INCOME FUND, INC. 23
time when doing so may be disadvantageous. Also, any amounts that we use to service our indebtedness or preferred dividends would not be available for distributions to our preferred stockholders. Further, the Company may be restricted from making distributions to holders of the Company’s common stock if the Company does not have asset coverage of at least 200%. As a result of issuing senior securities, we would also be exposed to typical risks associated with leverage, including an increased risk of loss.
With respect to senior securities representing indebtedness, such as the senior unsecured notes or any bank borrowings (other than temporary borrowings as defined under the 1940 Act), the Company is required to have asset coverage of at least 300%, immediately after such issuance or borrowing, and calculated as the ratio of the Company’s gross assets, less all liabilities and indebtedness not represented by senior securities, over the aggregate amount of the Company’s outstanding senior securities representing indebtedness.
Common Stock Offering Costs
Common stock offering costs are capitalized to Deferred common stock offering costs on the Statement of Assets and Liabilities and amortized to expense over the 12 month period following such capitalization on a straight line basis.
Common stock offering expenses consist of costs for the registration, certain marketing and distribution of the Company’s common shares. These expenses include, but are not limited to, expenses for legal, accounting, printing and certain marketing, and include salaries and direct expenses of the Adviser’s employees, employees of its affiliates and others for providing these services.
Due to Adviser
Amounts due to our Adviser consist of expense support repayments, base management fees, incentive fees, routine non-compensation overhead, and operating expenses and offering expenses paid on behalf of the Company. All balances due to the Adviser are settled quarterly.
Deferred Issuance Costs on Mandatorily Redeemable Preferred Stock
Preferred issuance costs on mandatorily redeemable preferred stock consist of fees and expenses incurred in connection with the closing of preferred stock offerings, and are capitalized at the time of payment. These costs are amortized using the straight line method over the term of the respective preferred stock series. This amortization expense is included in interest expense in the Fund’s financial statements. Upon early termination of preferred stock, the remaining balance of unamortized fees related to such debt is accelerated into realized loss on redemption of mandatorily redeemable preferred stock on the Fund’s Statement of Operations. Deferred issuance costs are presented on the Statement of Assets and Liabilities as a direct deduction from the related series of mandatorily redeemable preferred stock.
Dividends and Distributions
Dividends and distributions to common stockholders, which are determined in accordance with U.S. federal income tax regulations, are recorded on the record date. The amount to be paid out as a dividend or distribution is approved by the Board. Net realized capital gains, if any, are generally distributed or deemed distributed at least annually.
Income Taxes
The Company has elected to be treated as a RIC for U.S. federal income tax purposes and intends to comply with the requirement of the Code applicable to RICs. In order to continue to qualify for RIC tax treatment among other things, the Company is required to timely distribute at least 90% of its investment company taxable income (the “Annual Distribution Requirement”) and intends to distribute all of the Company’s investment company taxable income and net capital gain to common stockholders; therefore, the Company has made no provision for income taxes. The character of income and gains that the Company will distribute is determined in accordance with income tax regulations that may differ from U.S. GAAP. Book and tax basis differences relating to stockholder dividends and distributions and other permanent book and tax differences are reclassified to paid-in capital.
As of December 31, 2020, the cost basis of investments for tax purposes was $568,430,124 resulting in estimated gross unrealized appreciation and depreciation of $65,967,070 and $(36,632,961), respectively.
If the Company does not distribute (or is not deemed to have distributed) at least (1) 98% of its calendar year ordinary income; (2) 98.2% of its capital gains for the one-year period ending October 31 in that calendar year; and (3) any ordinary net income and capital gains net income recognized in preceding years, but were not distributed during such years, and on which the Company paid no corporate-level U.S. federal income tax, the Company will generally be required to pay a nondeductible U.S. federal excise tax equal to 4% of such excess amounts. To the extent that the Company determines that its estimated current calendar year taxable income will be in excess of estimated current calendar year dividend distributions from such taxable
2021 SEMI-ANNUAL REPORT
PRIORITY INCOME FUND, INC. 24
income, the Company accrues excise taxes, if any, on estimated excess taxable income. As of and for the calendar year ended December 31, 2020, we determined that the Company met the distribution requirements and therefore was not required to pay excise tax. Additionally, as of December 31, 2020, we do not expect to have any excise tax due for 2020 calendar year. Thus, we have not accrued any excise tax for this period.
If the Company fails to satisfy the Annual Distribution Requirement or otherwise fails to qualify as a RIC in any taxable year, the Company would be subject to tax on all of its taxable income at regular corporate rates. The Company would not be able to deduct distributions to common stockholders, nor would the Company be required to make distributions. Distributions would generally be taxable to the Company’s individual and other non-corporate taxable common stockholders as ordinary dividend income eligible for the reduced maximum rate applicable to qualified dividend income to the extent of the Company’s current and accumulated earnings and profits, provided certain holding period and other requirements are met. Subject to certain limitations under the Code, corporate distributions would be eligible for the dividends-received deduction. To qualify again to be taxed as a RIC in a subsequent year, the Company would be required to distribute to its common stockholders the Company’s accumulated earnings and profits attributable to non-RIC years reduced by an interest charge of 50% of such earnings and profits payable by us as an additional tax. In addition, if the Company failed to qualify as a RIC for a period greater than two taxable years, then, in order to qualify as a RIC in a subsequent year, the Company would be required to elect to recognize and pay tax on any net built-in gain (the excess of aggregate gain, including items of income, over aggregate loss that would have been realized if the Company had been liquidated) or, alternatively, be subject to taxation on such built-in gain recognized for a period of five years.
The Company follows ASC 740, Income Taxes (“ASC 740”). ASC 740 provides guidance for how uncertain tax positions should be recognized, measured, presented, and disclosed in the financial statements. ASC 740 requires the evaluation of tax positions taken or expected to be taken in the course of preparing the Company’s tax returns to determine whether the tax positions are “more-likely-than-not” of being sustained by the applicable tax authority. Tax positions not deemed to meet the more-likely-than not threshold are recorded as a tax benefit or expense in the current year. As of December 31, 2020 and for the six months then ended, the Company did not have a liability for any unrecognized tax benefits. Management has analyzed the Company’s positions taken and expected to be taken on its income tax returns for all open tax years and for the year ended June 30, 2021, and has concluded that as of December 31, 2020, no provision for uncertain tax position is required in the Company’s financial statements. Our determinations regarding ASC 740 may be subject to review and adjustment at a later date based upon factors including, but not limited to, an on-going analysis of tax laws, regulations and interpretations thereof. All federal and state income tax returns for each tax year in the three-year period ended June 30, 2020 remain subject to examination by the Internal Revenue Service and state departments of revenue.
Recent Accounting Pronouncements
In June 2016, the FASB issued ASU 2016-13, Financial Instruments-Credit Losses (Topic 326): Measurement of Credit Losses on Financial Instruments (“ASU 2016-13”), which amends the financial instruments impairment guidance so that an entity is required to measure expected credit losses for financial assets based on historical experience, current conditions and reasonable and supportable forecasts. As such, an entity will use forward-looking information to estimate credit losses. ASU 2016-13 also amends the guidance in FASB ASC Subtopic No. 325-40, Investments-Other, Beneficial Interests in Securitized Financial Assets, related to the subsequent measurement of accretable yield recognized as interest income over the life of a beneficial interest in securitized financial assets under the effective yield method. ASU 2016-13 is effective for financial statements issued for fiscal years beginning after December 15, 2019, including interim periods within those fiscal years. Early adoption is permitted as of the fiscal years beginning after December 15, 2018, including interim periods within those fiscal years. The effectiveness of the amended guidance in ASU 2016-13 did not have a material effect on our financial statements and disclosures.
In August 2018, the FASB issued ASU No. 2018-13, Fair Value Measurement (Topic 820): Disclosure Framework—Changes to the Disclosure Requirements for Fair Value Measurement. The standard will modify the disclosure requirements for fair value measurements by removing, modifying, or adding certain disclosures. ASU No. 2018-13 is effective for annual reporting periods beginning after December 15, 2019, including interim periods within that reporting period. Early adoption is permitted upon issuance of this ASU. The effectiveness of the amended guidance in ASU 2018-13 did not have a material effect on our financial statements and disclosures.
In March 2020, the FASB issued ASU 2020-04, Reference Rate Reform. The amendments in ASU 2020-04 provide optional expedients and exceptions for applying GAAP to contracts, hedging relationships, and other transactions affected by reference rate reform if certain criteria are met. The standard is effective as of March 12, 2020 through December 31, 2022. Management is currently evaluating the impact of the optional guidance on the Company's financial statements and disclosures. The
2021 SEMI-ANNUAL REPORT
PRIORITY INCOME FUND, INC. 25
Company did not utilize the optional expedients and exceptions provided by ASU 2020-04 during the six months ended December 31, 2020.
Legislative or Other Actions Relating to Taxes.
The rules dealing with U.S. federal income taxation are constantly under review by persons involved in the legislative process and by the IRS and the U.S. Treasury Department. New legislation and any U.S. Treasury regulations, administrative interpretations or court decisions interpreting such legislation could significantly and negatively affect our ability to qualify for tax treatment as a RIC or the U.S. federal income tax consequences to us and our investors of such qualification, or could have other adverse consequences. We will continue to monitor and account for any tax legislative, regulatory or administrative developments and proposals and their potential effect on us, our business and the business of our portfolio companies.
Note 3. Portfolio Investments
Purchases of investment securities (excluding short-term securities) for the six months ended December 31, 2020 were $30,981,164. During the six months ended December 31, 2020, the Company sold one investment, resulting in a realized loss of $1,333,937. The Company received $2,354 from a liquidating payment on an investment that was written-off for tax purposes, which resulted in a realized gain.
The following table shows the fair value of our investments disaggregated into the three levels of the ASC 820 valuation hierarchy as of December 31, 2020:
| | | | | | | | | | | | | | | | | | | | | | | |
| Level 1 | | Level 2 | | Level 3 | | Total |
| Assets | | | | | | | |
| Collateralized Loan Obligations - Equity Class | $ | — | | | $ | — | | | $ | 502,507,822 | | | $ | 502,507,822 | |
| Collateralized Loan Obligations - Debt Class | — | | | — | | | 95,256,411 | | | 95,256,411 | |
| $ | — | | | $ | — | | | $ | 597,764,233 | | | $ | 597,764,233 | |
The following table shows the aggregate changes in fair value of our Level 3 investments during the six months ended December 31, 2020:
| | | | | | | | | | | |
| Collateralized Loan Obligation - Equity Class | Collateralized Loan Obligation - Debt Class | Total |
| Fair value at June 30, 2020 | $ | 440,146,595 | | $ | 90,885,303 | | $ | 531,031,898 | |
| Net realized gain (loss) on investments | (1,331,583) | | — | | (1,331,583) | |
| Net change in unrealized appreciation (depreciation) on investments | 27,322,077 | | 81,048 | | 27,403,125 | |
| Purchases of investments | 27,297,414 | | 3,683,750 | | 30,981,164 | |
| Payment-in-kind interest | — | | 658,005 | | 658,005 | |
| Repayments from investments | (670,861) | | (763,912) | | (1,434,773) | |
| Proceeds from sales of investments | (1,160,000) | | — | | (1,160,000) | |
| Amortization of purchase discount, net | 10,904,180 | | 712,217 | | 11,616,397 | |
Transfers into Level 3(1) | — | | — | | — | |
Transfers out of Level 3(1) | — | | — | | — | |
| Fair value at December 31, 2020 | $ | 502,507,822 | | $ | 95,256,411 | | $ | 597,764,233 | |
| | | |
| Net increase in unrealized loss attributable to Level 3 investments still held at the end of the period | $ | 26,149,701 | | $ | 81,048 | | $ | 26,230,749 | |
| | | |
(1) Transfers are assumed to have occurred at the beginning of the quarter during which the asset was transferred. There were no transfers in or out of Level 3 during the six months ended December 31, 2020. |
2021 SEMI-ANNUAL REPORT
PRIORITY INCOME FUND, INC. 26
The following table provides quantitative information about significant unobservable inputs used in the fair value measurement of Level 3 investments as of December 31, 2020:
| | | | | | | | | | | | | | | | | | | | | | | | | | | | | | | | |
| | | | | | Unobservable Input |
| Asset Category | | Fair Value | | Primary Valuation Technique | | Input | | Range(1)(2) | | Weighted Average(1)(2) |
| Collateral Loan Obligations - Equity Class | | $ | 502,507,822 | | | Discounted Cash Flow | | Discount Rate | | 0.10% - 36.29% | | 25.34% |
| Collateral Loan Obligations - Debt Class | | 95,256,411 | | | Discounted Cash Flow | | Discount Rate | | 9.58% - 15.53% | | 11.95% |
| Total Level 3 Investments | | $ | 597,764,233 | | | | | | | | | |
(1) Excludes investments that have been called for redemption.
(2) Represents the implied discount rate based on our internally generated single-path cash flows that are derived from the fair value estimated by the corresponding multi-path cash flow model utilized by the independent valuation firm.
In determining the range of values for our investments in CLOs, the independent valuation firm uses a discounted multi-path cash flow model. The valuations were accomplished through the analysis of the CLO deal structures to identify the risk exposures from the modeling point of view as well as to determine an appropriate call date (i.e., expected maturity). These risk factors are sensitized in the multi-path cash flow model using Monte Carlo simulations to generate probability-weighted (i.e., multi-path) cash flows for the underlying assets and liabilities. These cash flows are discounted using appropriate market discount rates, and relevant data in the CLO market and certain benchmark credit indices are considered, to determine the value of each CLO investment. In addition, we generate a single-path cash flow utilizing our best estimate of expected cash receipts, and assess the reasonableness of the implied discount rate that would be effective for the value derived from the corresponding multi-path cash flow model.
The significant unobservable input used to value the CLOs is the discount rate applied to the estimated future cash flows expected to be received from the underlying investment, which includes both future principal and interest payments. Included in the consideration and selection of the discount rate are the following factors: risk of default, comparable investments, and call provisions. An increase or decrease in the discount rate applied to projected cash flows, where all other inputs remain constant, would result in a decrease or increase, respectively, in the fair value measurement.
The Company is not responsible for and has no influence over the management of the portfolios underlying the CLO investments the Company holds as those portfolios are managed by non-affiliated third party CLO collateral managers. CLO investments may be riskier and less transparent to the Company than direct investments in underlying companies. CLOs typically will have no significant assets other than their underlying senior secured loans. Therefore, payments on CLO investments are and will be payable solely from the cash flows from such senior secured loans.
The Company’s portfolio primarily consists of residual interests investments in CLOs, which involve a number of significant risks. CLOs are typically highly levered (10 - 14 times), and therefore the residual interest tranches that the Company invests in are subject to a higher degree of risk of total loss. In particular, investors in CLO residual interests indirectly bear risks of the underlying loan investments held by such CLOs. The Company generally has the right to receive payments only from the CLOs, and generally do not have direct rights against the underlying borrowers or the entity that sponsored the CLO. While the CLOs the Company targets generally enable the investor to acquire interests in a pool of senior loans without the expenses associated with directly holding the same investments, the Company’s prices of indices and securities underlying CLOs will rise or fall. These prices (and, therefore, the values of the CLOs) will be influenced by the same types of political and economic events that affect issuers of securities and capital markets generally. The failure by a CLO investment in which the Company invests to satisfy financial covenants, including with respect to adequate collateralization and/or interest coverage tests, could lead to reductions in its payments to the Company. In the event that a CLO fails certain tests, holders of debt senior to the Company may be entitled to additional payments that would, in turn, reduce the payments the Company would otherwise be entitled to receive. Separately, the Company may incur expenses to the extent necessary to seek recovery upon default or to negotiate new terms with a defaulting CLO or any other investment the Company may make. If any of these occur, it could materially and adversely affect the Company’s operating results and cash flows.
The interests the Company has acquired in CLOs are generally thinly traded or have only a limited trading market. CLOs are typically privately offered and sold, even in the secondary market. As a result, investments in CLOs may be characterized as illiquid securities. In addition to the general risks associated with investing in debt securities, CLO residual interests carry additional risks, including, but not limited to: (i) the possibility that distributions from collateral securities will not be adequate
2021 SEMI-ANNUAL REPORT
PRIORITY INCOME FUND, INC. 27
to make interest or other payments; (ii) the quality of the collateral may decline in value or default; (iii) the fact that the Company’s investments in CLO tranches will likely be subordinate to other senior classes of note tranches thereof; and (iv) the complex structure of the security may not be fully understood at the time of investment and may produce disputes with the CLO investment or unexpected investment results. The Company’s net asset value may also decline over time if the Company’s principal recovery with respect to CLO residual interests is less than the price that the Company paid for those investments. The Company’s CLO investments and/or the underlying senior secured loans may prepay more quickly than expected, which could have an adverse impact on its value.
An increase in LIBOR would materially increase the CLO’s financing costs. Since most of the collateral positions within the CLOs have LIBOR floors, there may not be corresponding increases in investment income (if LIBOR increases but stays below the LIBOR floor rate of such investments) resulting in materially smaller distribution payments to the residual interest investors.
On July 27, 2017, the Financial Conduct Authority (“FCA”) announced that it will no longer persuade or compel banks to submit rates for the calculation of the LIBOR rates after 2021 (the “FCA Announcement”). Furthermore, in the United States, efforts to identify a set of alternative U.S. dollar reference interest rates include proposals by the Alternative Reference Rates Committee of the Federal Reserve Board and the Federal Reserve Bank of New York. On August 24, 2017, the Federal Reserve Board requested public comment on a proposal by the Federal Reserve Bank of New York, in cooperation with the Office of Financial Research, to produce three new reference rates intended to serve as alternatives to LIBOR. These alternative rates are based on overnight repurchase agreement transactions secured by U.S. Treasury Securities. On December 12, 2017, following consideration of public comments, the Federal Reserve Board concluded that the public would benefit if the Federal Reserve Bank of New York published the three proposed reference rates as alternatives to LIBOR (the “Federal Reserve Board Notice”). In April 2018, the Federal Reserve System, in conjunction with the Alternative Reference Rate Committee, announced the replacement of LIBOR with a new index, calculated by short term repurchase agreements collateralized by U.S. Treasury securities, called the Secured Overnight Financing Rate, or the “SOFR.” The Federal Reserve Bank of New York began publishing SOFR in April 2018. Whether or not SOFR attains market traction as a LIBOR replacement remains a question and the future of LIBOR at this time is uncertain, including whether the Wuhan Virus will have further effect on LIBOR transition plans. On July 12, 2019, the Staff from the SEC’s Division of Corporate Finance, Division of Investment Management, Division of Trading and Markets, and Office of the Chief Accountant recently issued a statement about the potentially significant effects on financial markets and market participants when LIBOR is discontinued in 2021 and no longer available as a reference benchmark rate. The Staff encouraged all market participants to identify contracts that reference LIBOR and begin transitions to alternative rates. In addition, on March 25, 2020, the U.K. Financial Conduct Authority reaffirmed the central assumption that firms cannot rely on LIBOR being published after the end of 2021. However, the outbreak of the Wuhan Virus may adversely impact the timing of many firms’ transition planning, and we continue to assess the potential impact of the outbreak on our transition plans. Although SOFR appears to be the preferred replacement rate for U.S. dollar LIBOR, at this time, it is not possible to predict the effect of any such changes, any establishment of alternative reference rates, whether the Wuhan Virus outbreak will have further effect on LIBOR transition timelines or plans, or other reforms to LIBOR that may be enacted in the United States, United Kingdom or elsewhere.
On November 30, 2020, Intercontinental Exchange, Inc. (ICE) announced that the ICE Benchmark Administration Limited (IBA), a wholly-owned subsidiary of ICE and the administrator of LIBOR, will consider extending the LIBOR transition deadline to June 30, 2023. The announcement was supported by the FCA and the U.S. Federal Reserve. Despite the announcement, regulators continue to emphasize the importance of LIBOR transition planning.
At this time, it is not possible to predict the effect of the FCA Announcement, the Federal Reserve Board Notice, or other regulatory changes or announcements, any establishment of alternative reference rates or any other reforms to LIBOR that may be enacted in the United Kingdom, the United States or elsewhere. As such, the potential effect of any such event on our net investment income cannot yet be determined. The CLOs in which the Company is invested generally contemplate a scenario where LIBOR is no longer available by requiring the CLO administrator to calculate a replacement rate primarily through dealer polling on the applicable measurement date. However, there is uncertainty regarding the effectiveness of the dealer polling processes, including the willingness of banks to provide such quotations, which could adversely impact our net investment income. Recently, the CLOs we are invested in have included, or have been amended to include, language permitting the CLO investment manager to implement a market replacement rate (like SOFR) upon the occurrence of certain material disruption events. However, we cannot ensure that all CLOs in which we are invested will have such provisions, nor can we ensure the CLO investment managers will undertake the suggested amendments when able. In addition, the effect of a phase out of LIBOR on U.S. senior secured loans, the underlying assets of the CLOs in which we invest, is currently unclear. To the extent that any replacement rate utilized for senior secured loans differs from that utilized for a CLO that holds those
2021 SEMI-ANNUAL REPORT
PRIORITY INCOME FUND, INC. 28
loans, the CLO would experience an interest rate mismatch between its assets and liabilities which could have an adverse impact on the Company’s net investment income and portfolio returns.
If the Company owns more than 10% of the shares in a foreign corporation that is treated as a CFC (including residual interest tranche investments in a CLO investment treated as a CFC), for which the Company is treated as receiving a deemed distribution (taxable as ordinary income) each year from such foreign corporation in an amount equal to its pro rata share of the corporation’s income for the tax year (including both ordinary earnings and capital gains), the Company is required to include such deemed distributions from a CFC in its income and the Company is required to distribute such income to maintain its RIC tax treatment regardless of whether or not the CFC makes an actual distribution during such year.
The Company owns shares in PFICs (including residual interest tranche investments in CLOs that are PFICs), therefore the Company may be subject to federal income tax on a portion of any “excess distribution” or gain from the disposition of such shares even if such income is distributed as a taxable dividend to its common stockholders. Certain elections may be available to mitigate or eliminate such tax on excess distributions, but such elections (if available) will generally require the Company to recognize its share of the PFICs income for each year regardless of whether the Company receives any distributions from such PFICs. The Company must nonetheless distribute such income to maintain its tax treatment as a RIC.
If the Company is required to include amounts in income prior to receiving distributions representing such income, the Company may have to sell some of its investments at times and/or at prices management would not consider advantageous, raise additional debt or equity capital or forgo new investment opportunities for this purpose. If the Company is not able to obtain cash from other sources, it may fail to qualify for RIC tax treatment and thus become subject to corporate-level income tax.
The Company’s portfolio is concentrated in CLO vehicles, which is subject to a risk of loss if that sector experiences a market downturn. The Company is subject to credit risk in the normal course of pursuing its investment objectives. The Company’s maximum risk of loss from credit risk for its portfolio investments is the inability of the CLO collateral managers to return up to the cost value due to defaults occurring in the underlying loans of the CLOs.
Investments in CLO residual interests generally offer less liquidity than other investment grade or high-yield corporate debt, and may be subject to certain transfer restrictions. The Company’s ability to sell certain investments quickly in response to changes in economic and other conditions and to receive a fair price when selling such investments may be limited, which could prevent the Company from making sales to mitigate losses on such investments. In addition, CLOs are subject to the possibility of liquidation upon an event of default of certain minimum required coverage ratios, which could result in full loss of value to the CLO residual interests and junior debt investors.
The fair value of the Company’s investments may be significantly affected by changes in interest rates. The Company’s investments in senior secured loans through CLOs are sensitive to interest rate levels and volatility. In the event of a significant rising interest rate environment and/or economic downturn, loan defaults may increase and result in credit losses which may adversely affect the Company’s cash flow, fair value of its investments and operating results. In the event of a declining interest rate environment, a faster than anticipated rate of prepayments is likely to result in a lower than anticipated yield.
Due to the inherent uncertainty of determining the fair value of investments that do not have a readily available market value, the fair value of the Company’s investments may fluctuate from period to period. Additionally, the fair value of the Company’s investments may differ significantly from the values that would have been used had a ready market existed for such investments and may differ materially from the values that we may ultimately realize. Further, such investments are generally subject to legal and other restrictions on resale or otherwise are less liquid than publicly traded securities. If the Company was required to liquidate a portfolio investment in a forced or liquidation sale, the Company could realize significantly less than the value at which the Company has recorded it.
In addition, changes in the market environment and other events that may occur over the life of the investments may cause the gains or losses ultimately realized on these investments to be different than the unrealized gains or losses reflected in the currently assigned valuations.
Note 4. Capital
The Company offers its shares of common stock with varying up-front sales loads and has elected to designate each level of sales load as a “class” solely as a means of identifying those differing sales loads and the different channels through which shares are sold. Shares available to the general public are charged selling commissions and dealer manager fees and are referred to as “Class R Shares”. Shares available to accounts managed by registered investment advisers are charged dealer manager
2021 SEMI-ANNUAL REPORT
PRIORITY INCOME FUND, INC. 29
fees but no selling commissions and are referred to as “Class RIA Shares”. Shares available for purchase through (1) fee-based programs, also known as wrap accounts, of investment dealers, (2) participating broker-dealers that have alternative fee arrangements with their clients, (3) certain registered investment advisors or (4) bank trust departments or any other organization or person authorized to act in a fiduciary capacity for its clients or customers are charged no selling commissions or dealer manager fees and are referred to as “Class I Shares.” Although the Company uses “Class” designations to indicate its differing sales load structures, the Company does not operate as a multi-class fund.
The Company’s authorized stock consists of 200,000,000 shares of stock, par value $0.01 per share, 40,000,000 of which are classified as Term Preferred Stock, par value $0.01 per share, or “Term Preferred Stock”, and 160,000,000 of which are classified as common stock. All shares of common stock have identical voting and distributions rights, and bear their own pro rata portion of the Company’s expenses and have the same net asset value.
Transactions in shares of common stock were as follows during the six months ended December 31, 2020 and the year ended June 30, 2020:
| | | | | | | | | | | | | | |
| | Total |
| | Shares | | Amount |
| Six Months Ended December 31, 2020: | | | | |
| Gross shares sold | | 1,820,083 | | | $ | 20,811,889 | |
| Shares issued from reinvestment of distributions | | 826,385 | | | 8,406,458 | |
| Repurchase of common shares | | (851,605) | | | (8,926,990) | |
| Net increase from capital transactions | | 1,794,863 | | | $ | 20,291,357 | |
| | | | |
| Year Ended June 30, 2020: | | | | |
| Gross shares sold | | 2,059,226 | | | $ | 28,785,035 | |
| Shares issued from reinvestment of distributions | | 1,738,580 | | | 21,264,488 | |
| Repurchase of common shares | | (1,595,207) | | | (19,399,941) | |
| Net increase from capital transactions | | 2,202,599 | | | $ | 30,649,582 | |
At December 31, 2020, the Company had 34,688,484 shares of common stock issued and outstanding.
At June 30, 2020, the Company had 32,893,621 shares of common stock issued and outstanding.
Share Repurchase Program
The Company conducts quarterly tender offers pursuant to its share repurchase program. The Company’s Board considers the following factors, among others, in making its determination regarding whether to cause us to offer to repurchase shares and under what terms:
•the effect of such repurchases on our qualification as a RIC (including the consequences of any necessary asset sales);
•the liquidity of the Company’s assets (including fees and costs associated with disposing of assets);
•the Company’s investment plans and working capital requirements;
•the relative economies of scale with respect to the Company’s size;
•the Company’s history in repurchasing shares or portions thereof; and
•the condition of the securities markets.
The Company limits the number of shares to be repurchased in any calendar year to 20% of the weighted average number of shares outstanding in the prior calendar year, or 5% in each quarter, though the actual number of shares that the Company offers to repurchase may be less in light of the limitations noted below. At the discretion of the Company’s Board, the Company may use cash on hand, and cash from the sale of investments as of the end of the applicable period to repurchase shares. In addition to the limit above, the Company further limits the shares it offers to repurchase to the number of shares it can repurchase with the cash that it retains as a result of issuing shares through the Company’s distribution reinvestment plan to those shareholders who have elected to receive their distributions in the form of additional shares rather than in cash. The Company will offer to repurchase such shares at a price equal to the net asset value per share of our common stock specified in the tender offer. The Company’s Board may suspend or terminate the share repurchase program at any time. The first such tender offer commenced in May 2015.
2021 SEMI-ANNUAL REPORT
PRIORITY INCOME FUND, INC. 30
The following table sets forth the number of common shares that were repurchased by the Company in each tender offer:
| | | | | | | | | | | | | | | | | | | | | | | | | | | | | | | | |
| Quarterly Offer Date | | Repurchase Date | | Shares Repurchased | | Percentage of Shares Tendered That Were Repurchased | | Repurchase Price Per Share | | Aggregate Consideration for Repurchased Shares |
| For the Six Months Ended December 31, 2020 |
| June 30, 2020 | | July 7, 2020 | | 470,321 | | | 62.22 | % | | $ | 10.59 | | | $ | 4,980,700 | |
| September 30, 2020 | | October 28, 2020 | | 381,284 | | | 31.07 | % | | 10.35 | | | 3,946,290 | |
| Total for the six months ended December 31, 2020 | | 851,605 | | | | | | | $ | 8,926,990 | |
| | | | | | | | | | |
| For the Year Ended June 30, 2020 |
| June 30, 2019 | | July 30, 2019 | | 341,354 | | | 39.93 | % | | $ | 13.03 | | | $ | 4,447,835 | |
| September 30, 2019 | | October 25, 2019 | | 370,981 | | | 33.90 | % | | 12.76 | | | 4,733,715 | |
| December 31, 2019 | | January 27, 2020 | | 404,532 | | | 42.90 | % | | 12.55 | | | 5,076,868 | |
| March 31, 2020 | | April 28, 2020 | | 478,340 | | | 57.43 | % | | 10.75 | | | 5,141,523 | |
| Total for the year ended June 30, 2020 | | 1,595,207 | | | | | | | $ | 19,399,941 | |
On December 10, 2020, the Company made an offer to purchase up to $4,098,648 in aggregate amount of the Company’s issued and outstanding common shares. The offer began on December 17, 2020 and expired at 12:00 a.m., Eastern Time, on January 20, 2021, and a total of 985,597 shares were validly tendered and not withdrawn pursuant to the offer as of such date. In accordance with the terms of the offer, the Company purchased 352,720 shares of which 3,067 Shares were first purchased from beneficial holders of less than 100 shares and the remainder were purchased on a pro rata basis from the requests for repurchase received by the Company that were validly tendered and not withdrawn at a price equal to $11.62 per share for an aggregate purchase price of approximately $4,098,604. The purchase price per share was equal to the net asset value per Share as of January 15, 2021.
From time to time, the Company may repurchase a portion of its common and preferred stock and is notifying you of such intention as required by applicable securities law.
Note 5. Transactions with Affiliates
Investment Advisory Agreement
On May 9, 2013, the Company entered into an investment advisory agreement (the “Investment Advisory Agreement”) with the Adviser. The Adviser manages the day-to-day investment operations of, and provides investment advisory services to, the Company. For providing these services, the Adviser is paid a base management fee and an incentive fee. The base management fee, payable quarterly in arrears, is calculated at an annual rate of 2.0% based on the average of the total assets as of the end of the two most recently completed calendar quarters. The Company also pays routine non-compensation overhead expenses of the Adviser in an amount up to 0.0625% per quarter (0.25% annualized) of the Company’s average total assets. The incentive fee is calculated and payable quarterly in arrears based on the Company’s pre-incentive fee net investment income for the immediately preceding quarter. For this purpose, pre-incentive fee net investment income means interest income, dividend income and any other income (including any other fees, such as commitment, origination, structuring, diligence and consulting fees or other fees received) accrued during the calendar quarter, minus operating expenses for the quarter (including the base management fee, expenses reimbursed under the Investment Advisory Agreement, the administration agreement and the investor services agreement, any interest expense and dividends paid on any issued and outstanding preferred shares, but excluding the organization and offering expenses and incentive fee). Pre-incentive fee net investment income includes, in the case of investments with a deferred interest feature (such as original issue discount, debt instruments with payment-in-kind interest and zero coupon securities), accrued income that we have not yet received in cash. Pre-incentive fee net investment income does not include any realized capital gains, realized capital losses or unrealized capital appreciation or depreciation. Pre-incentive fee net investment income, expressed as a rate of return on the value of the Company’s net assets at the end of the immediately preceding calendar quarter, is compared to the preferred return rate of 1.5% per quarter (6.0% annualized). The Company pays the Adviser an incentive fee with respect to its pre-incentive fee net investment income in each calendar quarter as follows: (1) no incentive fee in any calendar quarter in which the pre-incentive fee net investment income does not exceed the preferred return rate; (2) 100% of the pre-incentive fee net investment income, if any, that exceeds the preferred return rate but is less than 1.875% in any calendar quarter (7.5% annualized); and (3) 20.0% of the pre-incentive fee net investment
2021 SEMI-ANNUAL REPORT
PRIORITY INCOME FUND, INC. 31
income, if any, that exceeds 1.875% in any calendar quarter. These calculations are appropriately pro-rated for any period of less than three months.
For the six months ended December 31, 2020, expenses incurred by the Company and the payable amount remaining at December 31, 2020 in connection with the Investment Advisory Agreement were as follows:
| | | | | | | | | | | | | | |
| Description | | Expense | | Payable |
Base management fee(1) | | $ | 5,657,077 | | | $ | 2,897,769 | |
Incentive fee(1) | | 7,624,183 | | | 4,356,610 | |
Routine non-compensation overhead expenses(2) | | 11,798 | | | 6,000 | |
| | | | |
(1) The payable amount is presented as part of the Due to adviser line item on the Statement of Assets and Liabilities. |
| | |
(2) The payable amount is presented as part of the Due to adviser line item on the Statement of Assets and Liabilities and as part of Adviser shared service expense on the Statement of Operations. |
Expense Support and Conditional Reimbursement Agreement
We entered into an expense support and conditional reimbursement agreement (the “Expense Support Agreement”) with our Adviser, whereby our Adviser agreed to reimburse us for operating expenses in an amount equal to the difference between distributions to our common stockholders for which a record date had occurred in each quarter less the sum of our net investment income, the net realized capital gains/losses and dividends and other distributions paid to us from our portfolio investments during such period (“Expense Support Reimbursement”). To the extent that there were no dividends or other distributions to our common stockholders for which a record date occurred in any given quarter, then the Expense Support Reimbursement for such quarter was equal to such amount necessary in order for Available Operating Funds (as defined below) for the quarter to equal zero. Any payments required to be made by our Adviser under the Expense Support Agreement for any quarter was paid by our Adviser to us in any combination of cash or other immediately available funds, and/or was offset against amounts otherwise due from us to our Adviser, no later than the earlier of (i) the date on which we closed our books for such quarter and (ii) sixty days after the end of such quarter, or at such later date as determined by us (the “Reimbursement Date”). We have a conditional obligation to reimburse our Adviser for any amounts funded by our Adviser under the Expense Support Agreement. Following any calendar quarter in which Available Operating Funds in such calendar quarter exceed the cumulative distributions to common stockholders for which a record date has occurred in such calendar quarter (“Excess Operating Funds”) on a date mutually agreed upon by our Adviser and us (each such date, a “Repayment Date”), we shall pay such Excess Operating Funds (“Expense Support Repayment”), or a portion thereof, to the extent that we have cash available for such payment, to our Adviser until such time as all Expense Support Reimbursements made by our Adviser to us have been reimbursed; provided that (i) the operating expense ratio as of such Repayment Date is equal to or less than the operating expense ratio as of the Reimbursement Date attributable to such specified Expense Support Reimbursement; (ii) the annualized distribution rate, which includes all regular cash distributions paid and excludes special distributions or the effect of any stock dividends paid, as of such Repayment Date is equal to or greater than the annualized distribution rate as of the Reimbursement Date attributable to such specified Expense Support Reimbursement; and (iii) such specified Reimbursement Date is not earlier than three years prior to the Repayment Date.
On March 29, 2016, we amended and restated the Expense Support Agreement to revise the definition of Available Operating Funds. Available Operating Funds is now defined as the sum of (i) our net investment income (minus any reimbursement payments payable to our Adviser), (ii) our net realized capital gains/losses and (iii) dividends and other distributions paid to us on account of our portfolio investments. However, for Expense Support Reimbursements made under the prior version of the Expense Support Agreement, we calculated Available Operating Funds for the purpose of determining whether we were obligated to make repayments to our Adviser as the sum of (i) our net investment income, (ii) the net realized capital gains/losses, (iii) the changes in unrealized losses, and (iv) dividends and other distributions paid to us from our portfolio investments. The calculation of changes in unrealized losses shall only reflect further reduction in value of individual investments from the largest previously recorded unrealized loss for such individual investment. Realized losses only included the amount in excess of the largest previously recorded unrealized loss for the same investment.
On May 24, 2018, the Board voted in favor of terminating the Third Amended and Restated Expense Support and Conditional Reimbursement Agreement, dated as of March 30, 2016 (the "ESA"), between the Company and the Adviser, and the ESA was terminated effective as of July 1, 2018. The Company will continue to be obligated to repay any Expense Support Reimbursements made by the Adviser to the Company that have not yet been repaid.
2021 SEMI-ANNUAL REPORT
PRIORITY INCOME FUND, INC. 32
The purpose of the Expense Support Agreement was to minimize such distributions from us being characterized as returns of capital for GAAP purposes and to reduce operating expenses until we raised sufficient capital to be able to absorb such expenses. However, such distributions may still have been characterized as a return of capital for U.S. federal income tax purposes.
The following table provides information regarding liabilities incurred by the Adviser pursuant to the Expense Support Agreement:
| | | | | | | | | | | | | | | | | | | | |
| Period Ended | Expense Support Payments Due from Adviser | Expense Support Payments Reimbursed to Adviser | Unreimbursed Support Payments | Operating Expense Ratio(1) | Annualized Distribution Rate(2) | Eligible to be Repaid Through |
| March 31, 2018 | 1,206,778 | | (675,148) | | 531,630 | | 0.34 | % | 7.43 | % | March 31, 2021 |
| June 30, 2018 | — | | — | | — | | 0.29 | % | 7.43 | % | N/A |
| September 30, 2018 | — | | — | | — | | 0.31 | % | 8.00 | % | N/A |
| December 31, 2018 | — | | — | | — | | 0.42 | % | 7.79 | % | N/A |
| March 31, 2019 | — | | — | | — | | 0.44 | % | 8.00 | % | N/A |
| June 30, 2019 | — | | — | | — | | 0.47 | % | 8.00 | % | N/A |
| September 30, 2019 | — | | — | | — | | 0.58 | % | 8.00 | % | N/A |
| December 31, 2019 | — | | — | | — | | 0.54 | % | 8.00 | % | N/A |
| March 31, 2020 | — | | — | | — | | 0.49 | % | 8.93 | % | N/A |
| June 30, 2020 | — | | — | | — | | 0.47 | % | 9.21 | % | N/A |
| September 30, 2020 | — | | — | | — | | 0.51 | % | 9.24 | % | N/A |
| December 31, 2020 | — | | — | | — | | 0.44 | % | 8.72 | % | N/A |
| Total | $ | 1,206,778 | | $ | (675,148) | | $ | 531,630 | | | | |
| | | | | | |
(1)Operating expense ratio is as of the date the Expense Support Reimbursement obligation was incurred by the Adviser and includes all expenses borne by the Company, except for organizational and offering expenses, base management fees, incentive fees and any interest expense attributable to indebtedness incurred by the Company. |
(2)Annualized distribution rate equals the annualized rate of distributions to common stockholders based on the amount of the regular distributions paid immediately prior to the date the Expense Support Reimbursement obligation was incurred by the Adviser. Annualized distribution rate does not include bonus dividends paid to common stockholders. |
There were no Expense Support Repayment obligations payable to the Adviser as of the six months ended December 31, 2020.
Administration Agreement
On May 9, 2013, the Company entered into an administration agreement (the “Administration Agreement”) with Prospect Administration LLC (the “Administrator”), an affiliate of the Adviser. The Administrator performs, oversees and arranges for the performance of administrative services necessary for the operation of the Company. These services include, but are not limited to, accounting, finance, legal services and offerings of the Company’s debt, common stock and other securities. For providing these services, facilities and personnel, the Company reimburses the Administrator for the Company’s actual and allocable portion of expenses and overhead incurred by the Administrator in performing its obligations under the Administration Agreement, including rent and the Company’s allocable portion of the costs of its Chief Financial Officer and Chief Compliance Officer and her staff. During the six months ended December 31, 2020, $1,051,300 in administrator costs were incurred by the Company, $478,033 of which is included on the Statement of Assets and Liabilities as a payable under the Due to administrator line item.
Commissions and fees on shares of common stock sold
During the period from July 1, 2019 to November 2, 2019, Provasi Securities, LP (the “ Former Dealer Manager”), an indirect wholly-owned subsidiary of Stratera Holdings, acted as dealer manager for the offering and managed a group of participating broker-dealers, including other unaffiliated broker-dealers who enter into participating broker-dealer agreements with the Dealer Manager. The Company had agreed to pay the Former Dealer Manager selling commissions in the amount of 6.0% of the selling price of each share of common stock designated as “Class R” for which a sale was completed from the shares offered in the offering. As compensation for acting as the Former Dealer Manager, the Company had agreed to pay the Former Dealer Manager a dealer manager fee in the amount of 2.0% of the selling price of each share of common stock designated as “Class R” or “Class RIA” for which a sale was completed. The Dealer Manager was expected to re-allow the full amount of selling
2021 SEMI-ANNUAL REPORT
PRIORITY INCOME FUND, INC. 33
commissions to participating broker-dealers and was permitted to re-allow up to 1.15% of the dealer manager fee to participating broker-dealers for reimbursement of marketing expenses.
On December 5, 2019, we announced that Preferred Capital Securities, LLC (“PCS” or “Dealer Manager”), a broker dealer and wholesale distributor, would become the dealer manager for an 18-month follow-on common stock offering upon the effectiveness of our common share registration statement. On February 6, 2020, we filed a definitive prospectus with the SEC pursuant to which, through our Dealer Manager, we are offering up to 71,620,877 shares of our common stock for a period of up to eighteen months, unless otherwise extended. PCS replaced Provasi Securities, LP as the Fund's Dealer Manager for its continuous offering of common stock. PCS charges selling commissions of 6.0% and dealer manager fees of 0.75%, payable upon a purchase of “Class R” shares.
During the six months ended December 31, 2020, the total sales load incurred through the offering of our common stock was $1,293,541, which includes $1,138,841 of selling commissions and $154,700 of dealer manager fees. These fees are charged against additional paid-in capital on the Statements of Changes in Net Assets.
Common Stock Offering Costs
The Adviser, on behalf of the Company, paid or incurred common stock offering costs totaling $174,310 for the six months ended December 31, 2020. As of December 31, 2020, $240,788 remains as a deferred asset on the Statement of Assets and Liabilities, while $384,268 has been amortized to expense on the Statement of Operations during the six months ended December 31, 2020 .
Common stock offering expenses consist of costs for the registration, certain marketing activities and distribution of the Company’s common shares. These expenses include, but are not limited to, expenses for legal, accounting, printing and certain marketing activities, and include salaries and direct expenses of the Adviser’s employees, employees of its affiliates and others for providing these services.
At December 31, 2020, the total due to the Adviser for organization and common stock offering costs and operating expenses paid on behalf of the Company was $87,422, which is included within the Due to adviser line item on the Statement of Assets and Liabilities, and is broken out as follows:
| | | | | | | | | | | | | | | | | | | | |
| Fiscal Year | | Organization and Offering Costs (O&O) | | Operating Expenses (OpEx) paid on behalf of the Company | | Total Due to Adviser for O&O and OpEx paid on behalf of the Company |
| June 30, 2013 | | $ | 1,893,108 | | | $ | — | | | $ | 1,893,108 | |
| June 30, 2014 | | 984,744 | | | 558,394 | | | 1,543,138 | |
| June 30, 2015 | | 591,821 | | | 1,418,046 | | | 2,009,867 | |
| June 30, 2016 | | 442,107 | | | 1,148,321 | | | 1,590,428 | |
| June 30, 2017 | | 456,146 | | | 730,938 | | | 1,187,084 | |
| June 30, 2018 | | 419,077 | | | 24,239 | | | 443,316 | |
| June 30, 2019 | | 107,639 | | | 25,333 | | | 132,972 | |
| June 30, 2020 | | 867,504 | | | — | | | 867,504 | |
| December 31, 2020 | | 174,310 | | | — | | | 174,310 | |
| Total reimbursements made | | (5,849,034) | | | (3,905,271) | | | (9,754,305) | |
| | $ | 87,422 | | | $ | — | | | $ | 87,422 | |
Upon achieving the Minimum Offering Requirement, the Adviser was entitled to receive up to 5.0% of the gross proceeds from the offering as reimbursement for organization and common stock offering costs that it has funded, until all of the organization and common stock offering costs incurred and/or paid by the Adviser have been recovered. On January 8, 2014, the Adviser agreed to reduce such reimbursement and accept a maximum of 2% of the gross proceeds of the offering of the Company’s securities until all of the organization and common stock offering costs incurred and/or paid by the Adviser have been recovered.
Co-Investments
On January 13, 2020, the parent company of the Adviser received an exemptive order from the SEC (the “Order”), which superseded a prior co-investment exemptive order granted on February 10, 2014, granting the parent company the ability to negotiate terms other than price and quantity of co-investment transactions with other funds managed by the Adviser or certain affiliates, including Prospect Capital Corporation (“PSEC”), Prospect Flexible Income Fund, Inc. (“FLEX”) and NGL
2021 SEMI-ANNUAL REPORT
PRIORITY INCOME FUND, INC. 34
Subsidiary Ltd. (“NGL”), where co-investing would otherwise be prohibited under the 1940 Act, subject to the conditions included therein.
Under the terms of the order, a “required majority” (as defined in Section 57(o) of the 1940 Act) of the Company’s independent directors must make certain conclusions in connection with a co-investment transaction, including that (1) the terms of the proposed transaction, including the consideration to be paid, are reasonable and fair to the Company and its stockholders and do not involve overreaching of the Company or its stockholders on the part of any person concerned and (2) the transaction is consistent with the interests of the Company’s stockholders and is consistent with the Company’s investment objective and strategies. In certain situations where co-investment with one or more funds managed or owned by the Adviser or its affiliates is not covered by the Order, such as when there is an opportunity to invest in different securities of the same issuer, the personnel of the Adviser or its affiliates will need to decide which fund will proceed with the investment. Such personnel will make these determinations based on policies and procedures, which are designed to reasonably ensure that investment opportunities are allocated fairly and equitably among affiliated funds over time and in a manner that is consistent with applicable laws, rules and regulations. Moreover, except in certain circumstances, when relying on the Order, the Company will be unable to invest in any issuer in which one or more funds managed or owned by the Adviser or its affiliates has previously invested.
Allocation of Expenses
For CLO investments held by each of the Company, PSEC, FLEX and NGL, the cost of valuation services with regard to such investments is initially borne by the Company, which then allocates to PSEC, FLEX and NGL their proportional share of such expense based on the number of positions held by each entity. During the six months ended December 31, 2020, the Company incurred $163,224 in expenses related to valuation services that are attributable to PSEC and FLEX, of which $157,580 is still owed to the Company.
Officers and Directors
Certain officers and directors of the Company are also officers and directors of the Adviser and its affiliates. For the six months ended December 31, 2020, $75,000 was paid to the independent directors of the Company, which is included as Directors fees on the Statement of Operations. The officers do not receive any direct compensation from the Company.
Note 6. Dividends and Distributions
Dividends from net investment income and capital gain distributions are determined in accordance with U.S. federal income tax regulations, which differ from GAAP.
The following tables reflect the distributions per common share that the Company declared and paid or are payable to its common stockholders during the six months ended December 31, 2020. Common stockholders of record as of each respective record date were or will be entitled to receive the distribution.
| | | | | | | | | | | | | | | | | | | | |
| Record Date | | Payment Date | | Total Amount per Share(a) | | Amount Distributed |
| July 3, 10, 17, 24 and 31, 2020 | | August 3, 2020 | | 0.10070 | | | $ | 3,340,268 | |
| August 7, 14, 21 and 28, 2020 | | August 31, 2020 | | 0.08056 | | | 2,672,598 | |
September 9, 11, 18 and 25, 2020(b) | | September 28, 2020 | | 0.11806 | | | 3,957,973 | |
| October 2, 9, 16, 23 and 30, 2020 | | November 2, 2020 | | 0.10070 | | | 3,406,842 | |
| November 6, 13, 20 and 27, 2020 | | November 30, 2020 | | 0.08056 | | | 2,728,924 | |
December 4, 11, 18 and 28, 2020(b) | | December 28, 2020 | | 0.13056 | | | 4,491,977 | |
| Total declared and distributed for the six months ended December 31, 2020 | | $ | 20,598,582 | |
| |
(a)Total amount per share represents the total distribution rate for the record dates indicated. | |
(b)Includes bonus distributions. | |
2021 SEMI-ANNUAL REPORT
PRIORITY INCOME FUND, INC. 35
Dividends and distributions to common stockholders are recorded on the record date. The table above includes distributions with record dates during the six months ended December 31, 2020 and does not include distributions previously declared to common stockholders of record on any future dates, as those amounts are not yet determinable. The following distributions were previously declared and have record dates subsequent to December 31, 2020 for the common shares:
| | | | | | | | | | | | | | |
| Record Date | | Payment Date | | Total Amount per Share(a) |
| January 4, 8, 15, 22 and 29, 2021 | | February 1, 2021 | | $ | 0.10070 | |
| February 5, 12, 19 and 26, 2021 | | March 1, 2021 | | $ | 0.08056 | |
| | | | |
(a)Total amount per share represents the total distribution rate for the record dates indicated. |
The Company may fund its distributions to common stockholders from any sources of funds available, including offering proceeds, borrowings, net investment income from operations, capital gains proceeds from the sale of assets, and non-capital gains proceeds from the sale of assets. Any capital returned to common stockholders through distributions will be distributed after payment of fees and expenses.
Following commencement of the Company’s continuous public offering, substantial portions of the Company’s dividends to common stockholders have been funded through Expense Support Reimbursements that are subject to repayment by the Company. The purpose of this arrangement was to ensure that no portion of the Company’s dividends to common stockholders was paid from offering proceeds. Any such dividends funded through Expense Support Reimbursements were not based on the Company’s investment performance. The repayment of these Expense Support Reimbursements owed to the Adviser will reduce the future distributions to which common stockholders would otherwise be entitled. As of December 31, 2020, there were no Expense Support Repayment obligations payable to the Adviser, and the ESA was terminated in July 2018. Accordingly, the Company does not expect that there will be any further dividends funded through such reimbursements. Nevertheless, there can be no assurance that the Company will achieve the performance necessary to sustain its distributions or that the Company will be able to pay distributions at a specific rate or at all.
The Company has adopted an “opt in” distribution reinvestment plan pursuant to which common stockholders may elect to have the full amount of distributions reinvested in additional shares. Common stockholders will receive distributions in cash unless specifically “opting in” to the distribution reinvestment plan to have cash distributions reinvested in additional shares of the Company. Reinvested distributions will purchase shares at a price equal to 95% of the price that shares are sold in the offering at the closing immediately following the distribution payment date. There will be no selling commissions, dealer manager fees or other sales charges for shares issued under the distribution reinvestment plan. During any period when we are not making a “best-efforts” offering of our shares, the number of shares to be issued to a common stockholder in connection with a distribution reinvestment shall be determined by dividing the total dollar amount of the distribution payable to the common stockholder by the net asset value per common share of the Company, as determined pursuant to procedures adopted by our Board.
The Company issued 826,385 and 1,738,580 shares of its common stock in connection with the distribution reinvestment plan for the six months ended December 31, 2020 and year ended June 30, 2020, respectively.
Note 7. Mandatorily Redeemable Preferred Stock
The Company has authorized 40,000,000 shares of mandatorily redeemable preferred stock, at a par value of $0.01 per share, and had 7,394,123 shares issued and outstanding at December 31, 2020.
The Company completed underwritten public offerings of its 6.375% Series A Term Preferred Stock Due 2025 (the “Series A Term Preferred Stock”), 6.25% Series B Term Preferred Stock Due 2023 (the “Series B Term Preferred Stock”), 6.625% Series C Term Preferred Stock Due 2024 (the “Series C Term Preferred Stock”), 7.00% Series D Term Preferred Stock Due 2029 (the “Series D Term Preferred Stock”), 6.375% Series E Term Preferred Stock Due 2024 (the “Series E Term Preferred Stock”) and 6.625% Series F Term Preferred Stock Due 2027 (the “Series F Term Preferred Stock”, and, together with the other term preferred stock, the “Term Preferred Stock”). The Company is required to redeem all of the outstanding Term Preferred Stock on their respective term redemption dates, at a redemption price equal to $25 per share plus an amount equal to accumulated but unpaid dividends, if any, to the date of the redemption. The Company cannot effect any amendment, alteration, or repeal of the Company’s obligation to redeem all of the Term Preferred Stock without the prior unanimous vote or consent of the holders of such Term Preferred Stock. At any time on or after the applicable optional redemption date, at the Company’s sole option, the Company may redeem the Term Preferred Stock at a redemption price per share equal to the sum of the $25 liquidation
2021 SEMI-ANNUAL REPORT
PRIORITY INCOME FUND, INC. 36
preference per share plus an amount equal to accumulated but unpaid dividends, if any, on such Term Preferred Stock. The Company, with the authorization by the Board, may repurchase any of the Term Preferred Stock from time to time in the open market after the applicable optional redemption date and effectively extinguish the preferred stock. Further, from time to time (including before the optional redemption date), the Company may repurchase a portion of its preferred stock and is notifying you of such intention as required by applicable securities law.
The following table summarizes the Company’s Term Preferred Stock activity for the six months ended December 31, 2020:
| | | | | | | | | | | | | | | | | | | | | | | |
| Series A Term Preferred Stock Due 2025 | Series B Term Preferred Stock Due 2023 | Series C Term Preferred Stock Due 2024 | Series D Term Preferred Stock Due 2029 | Series E Term Preferred Stock Due 2024 | Series F Term Preferred Stock Due 2027 | Total Term Preferred Stock |
| Shares outstanding at June 30, 2020 | 1,481,435 | | 984,918 | | 1,557,099 | | 1,096,007 | | 1,039,316 | | 1,235,348 | | 7,394,123 | |
| Shares issued | — | | — | | — | | — | | — | | — | | — | |
| Shares repurchased | — | | — | | — | | — | | — | | — | | — | |
| Shares outstanding at December 31, 2020 | 1,481,435 | | 984,918 | | 1,557,099 | | 1,096,007 | | 1,039,316 | | 1,235,348 | | 7,394,123 | |
The following table summarizes the Company’s Term Preferred Stock balances as of December 31, 2020:
| | | | | | | | | | | | | | | | | | | | | | | |
| Series A Term Preferred Stock Due 2025 | Series B Term Preferred Stock Due 2023 | Series C Term Preferred Stock Due 2024 | Series D Term Preferred Stock Due 2029 | Series E Term Preferred Stock Due 2024 | Series F Term Preferred Stock Due 2027 | Total Term Preferred Stock |
| Principal value | $ | 37,035,875 | | $ | 24,622,950 | | $ | 38,927,475 | | $ | 27,400,175 | | $ | 25,982,900 | | $ | 30,883,700 | | $ | 184,853,075 | |
| Unamortized deferred offering costs | (299,355) | | (230,927) | | (235,081) | | (354,165) | | (239,978) | | (159,916) | | (1,519,422) | |
| Unamortized discount | (821,203) | | (474,845) | | (839,864) | | (757,916) | | (620,268) | | (877,238) | | (4,391,334) | |
| Carrying value | $ | 35,915,317 | | $ | 23,917,178 | | $ | 37,852,530 | | $ | 26,288,094 | | $ | 25,122,654 | | $ | 29,846,546 | | $ | 178,942,319 | |
| | | | | | | |
Fair value(1)(2) | $ | 34,339,663 | | $ | 23,756,222 | | $ | 38,180,067 | | $ | 26,556,250 | | $ | 24,361,567 | | $ | 29,191,273 | | $ | 176,385,042 | |
Fair value per share(1) | $ | 23.18 | | $ | 24.12 | | $ | 24.52 | | $ | 24.23 | | $ | 23.44 | | $ | 23.63 | | |
(1)Represents the December 31, 2020 closing market price per share of each respective series of Term Preferred Stock on the New York Stock Exchange (“NYSE”). |
(2)As permitted under ASC 825-10-25, we have not elected to value our Term Preferred Stock which is categorized as Level 2 under ASC 820. |
The following sets forth the terms of the Company’s Term Preferred Stock offerings:
| | | | | | | | | | | | | | | | | | | | |
| Series A Term Preferred Stock Due 2025 | Series B Term Preferred Stock Due 2023 | Series C Term Preferred Stock Due 2024 | Series D Term Preferred Stock Due 2029 | Series E Term Preferred Stock Due 2024 | Series F Term Preferred Stock Due 2027 |
| Initial offering price | $ | 25.00 | | $ | 25.00 | | $ | 25.00 | | $ | 25.00 | | $ | 25.00 | | $ | 25.00 | |
| Term redemption date | June 30, 2025 | December 31, 2023 | June 30, 2024 | June 30, 2029 | December 31, 2024 | June 30, 2027 |
| Term redemption price per share | $ | 25.00 | | $ | 25.00 | | $ | 25.00 | | $ | 25.00 | | $ | 25.00 | | $ | 25.00 | |
| Optional redemption date | June 30, 2021 | October 23, 2020 | February 22, 2021 | March 31, 2022 | October 7, 2021 | February 25, 2023 |
| Fixed dividend rate | 6.375 | % | 6.25 | % | 6.625 | % | 7.00 | % | 6.375 | % | 6.625 | % |
Dividends payable on the Company’s Term Preferred Stock were $0 at December 31, 2020. Deferred issuance costs represent underwriting fees and other direct costs incurred that are related to the Company’s Term Preferred Stock. As of December 31, 2020, the Company had a deferred debt issuance cost balance of $1,519,422 related to the issuance of the Term Preferred Stock. Aggregate net discount on the Term Preferred Stock at the time of issuance totaled $5,950,900. As of December 31, 2020 the
2021 SEMI-ANNUAL REPORT
PRIORITY INCOME FUND, INC. 37
Company had an unamortized discount balance of $4,391,334. These amounts are amortized and are included in Preferred dividend expense on the Statement of Operations over the term of the respective shares.
The following table summarizes the components of preferred dividend expense, effective dividend rates and cash paid on the Term Preferred Stock for the six months ended December 31, 2020:
| | | | | | | | | | | | | | | | | | | | | | | |
| Series A Term Preferred Stock Due 2025 | Series B Term Preferred Stock Due 2023 | Series C Term Preferred Stock Due 2024 | Series D Term Preferred Stock Due 2029 | Series E Term Preferred Stock Due 2024 | Series F Term Preferred Stock Due 2027 | Total Term Preferred Stock |
Fixed dividend expense(1) | $ | 1,180,526 | | $ | 769,477 | | $ | 1,289,465 | | $ | 959,006 | | $ | 828,210 | | $ | 1,023,016 | | $ | 6,049,700 | |
| Amortization of deferred offering costs | 26,885 | | 32,531 | | 27,566 | | 14,470 | | 30,716 | | 9,473 | | 141,641 | |
| Amortization of discount | 77,482 | | 71,432 | | 105,074 | | 31,466 | | 66,171 | | 52,285 | | 403,910 | |
| Total preferred dividend expense | $ | 1,284,893 | | $ | 873,440 | | $ | 1,422,105 | | $ | 1,004,942 | | $ | 925,097 | | $ | 1,084,774 | | $ | 6,595,251 | |
Effective dividend rate(2) | 7.167 | % | 7.322 | % | 7.529 | % | 7.653 | % | 7.337 | % | 7.278 | % | 7.389 | % |
| Cash paid for dividend | $ | 1,180,526 | | $ | 769,477 | | $ | 1,289,465 | | $ | 959,006 | | $ | 828,210 | | $ | 1,028,699 | | $ | 6,055,383 | |
(1)Fixed dividend expense is composed of distributions declared and paid of $6,049,700 for the six months ended December 31, 2020. |
(2)Represents the effective rate for each respective series of Term Preferred Stock as of December 31, 2020. |
Note 8. Income Taxes
The information presented in this footnote is based on our most recent tax year ended June 30, 2020.
For income tax purposes, distributions made to shareholders are reported as ordinary income, capital gains, non-taxable return of capital, or a combination thereof. The expected tax character of distributions declared and paid to common shareholders during the year ended June 30, 2020 was as follows:
| | | | | |
| Year ended June 30, 2020 |
| Ordinary income | $ | 22,014,211 | |
| Return of capital | 23,043,995 | |
| Capital gain | — | |
| Total dividends declared and paid to common shareholders | $ | 45,058,206 | |
The expected tax character of distributions declared and paid to preferred shareholders during the years ended June 30, 2020 was as follows:
| | | | | |
| Year ended June 30, 2020 |
| Ordinary income | $ | 10,470,268 | |
| Return of capital | — | |
| Capital gain | — | |
| Total dividends declared and paid to preferred shareholders | $ | 10,470,268 | |
When our annual report on Form N-CSR was filed for the year ended June 30, 2020, we estimated our distributions out of ordinary income to be $6,055,444 and return of capital to be $4,414,824.
While the tax character of distributions paid to common and preferred shareholders for the year ended June 30, 2020 are expected to be characterized as ordinary income, capital gain and return of capital, the final determination of the tax character of distributions for this year will not be made until we file our tax return for the tax year ended June 30, 2020.
2021 SEMI-ANNUAL REPORT
PRIORITY INCOME FUND, INC. 38
As of June 30, 2020, the estimated components of distributable earnings on a tax basis were as follows:
| | | | | |
| Overdistributed Ordinary Income | $ | (37,403,864) | |
| Temporary Differences | $ | 3,411,327 | |
| Net Unrealized Gain on Investments | $ | (20,833,835) | |
| Capital Loss Carryforward | $ | (677,261) | |
As a result of the changes in the character of the distributions for the year ended June 30, 2020, the components of accumulated earnings on a tax basis were adjusted from our prior N-CSR filing. Per the prior N-CSR filing, overdistributed ordinary income, temporary differences, net unrealized gain on investments and capital loss carryforward were $(37,907,862), $2,835,086, $(20,326,839) and $(104,018), respectively.
In general, we may make certain adjustments to the classification of net assets as a result of permanent book-to-tax differences, which may include differences in the book and tax basis of certain assets and liabilities, amortization of offering costs and nondeductible federal excise taxes, among other items. For the year ended June 30, 2020, we increased total distributable earnings by $1,510,480, decreased paid-in capital in excess of par by $210,536, and decreased accumulated realized gain by $1,299,945.
Capital losses in excess of capital gains earned in a tax year may generally be carried forward and used to offset capital gains, subject to certain limitations. For the tax year ended June 30, 2020, we had capital loss carryforwards of approximately $677,261 available for use in later tax years. The unused balance each year will be carried forward and utilized as gains are realized, subject to limitations. While our ability to utilize losses in the future depends upon a variety of factors that cannot be known in advance, some of the Company’s capital loss carryforwards may become permanently unavailable due to limitations by the Code.
Note 9. Concentration and Credit Risks
Cash held at financial institutions, at times, may exceed the amount insured by the Federal Deposit Insurance Corporation. The Company’s portfolio may be concentrated in a limited number of investments in CLO vehicles, which is subject to a risk of loss if that sector experiences a market downturn. The Company is subject to credit risk in the normal course of pursuing its investment objectives. The Company’s maximum risk of loss from credit risk for its portfolio investments is the inability of the CLO collateral managers to return up to the cost value due to loan defaults occurring in the underlying collateral within the CLOs.
Note 10. Commitments and Contingencies
With respect to any calendar quarter, the Company has a conditional obligation to repay the Adviser for any amounts funded by the Adviser under the Expense Support Agreement if (and only to the extent that): (i) Available Operating Funds exceed the distributions paid by the Company to common stockholders; (ii) the Company has cash available for such repayment; (iii) the Company’s operating expense ratio is equal to or less than its operating expense ratio at the time the corresponding Expense Support Reimbursement was incurred; (iv) the annualized rate of the Company’s regular cash distributions to common stockholders is equal to or greater than the annualized rate of its regular cash distributions to common stockholders at the time the corresponding Expense Support Reimbursement was incurred; and (v) the payment date for the Company’s repayment to the Adviser is no more than three years subsequent to the “Expense Payment Date,” which is defined in the ESA to mean the earlier of (i) the date on which the Company closes the books for the relevant quarter and (ii) sixty days after the end of such quarter (or at such later date as determined by the Company). The Company is unable to estimate the amount that would be repaid to the Adviser at the time the above event occurs. However, the maximum exposure to the Company is the total of the Expense Support Reimbursements from the Adviser. As of December 31, 2020, the amount of expense support that is conditionally repayable by the Company to its Adviser is $531,630.
The Company is not currently subject to any material legal proceedings and, to the Company’s knowledge, no material legal proceedings are threatened against the Company. From time to time, the Company may be a party to certain legal proceedings in the ordinary course of business, including proceedings relating to the enforcement of the Company’s rights under contracts with its portfolio companies. While the outcome of any legal proceedings cannot be predicted with certainty, the Company does not expect that any such proceedings will have a material adverse effect upon its financial condition or results of operations.
2021 SEMI-ANNUAL REPORT
PRIORITY INCOME FUND, INC. 39
Note 11. Revolving Credit Facility
On December 16, 2019, we entered into a secured revolving credit facility (the “Facility”). The aggregate commitment of the Facility is $25 million and is collateralized by our CLO investments. The Facility matures on June 16, 2023. Prior to December 16, 2020, the Facility bore interest at a rate of three-month LIBOR plus 3% subject to a floor of 0.50%. Subsequent to December 16, 2020, the Facility bears interest at the current Prime Rate subject to a 3% floor plus 0.75%. Additionally, the lenders charge a fee on the unused portion of the credit facility equal to either 50 basis points if more than 60% of the credit facility is drawn, or 100 basis points if an amount more than 35% and less than or equal to 60% of the credit facility is drawn, or 150 basis points if an amount less than or equal to 35% of the credit facility is drawn.
The agreement governing our Facility requires us to comply with certain financial and operational covenants. These covenants include restrictions on the level of indebtedness that we are permitted to incur in relation to the value of our assets and a minimum total net asset level that we are required to maintain. As of December 31, 2020, we were in compliance with these covenants. As of December 31, 2020, we had $2,000,000 outstanding on our Facility. As of December 31, 2020, the investments used as collateral for the Facility had an aggregate fair value of $597,764,233, which represents 100% of our total investments. As of December 31, 2020, the fair value of the Facility was $2,000,000, the balance outstanding, and is categorized as Level 2 under ASC 820. As permitted by ASC 825-10-25, we have not elected to fair value our Facility on the Statement of Assets and Liabilities.
In connection with the origination of the Facility, we incurred $589,096 of fees, all of which are being amortized over the term of the facility in accordance with ASC 470-50. As of December 31, 2020, $388,173 remains to be amortized and is reflected as Deferred financing costs on the Statements of Assets and Liabilities.
During the six months ended December 31, 2020, we recorded $335,167 of interest costs and amortization of financing costs on the Facility as interest expense.
For the six months ended December 31, 2020, the average stated interest rate (i.e., rate in effect plus the spread) was 2.13%. For the six months ended December 31, 2020, average outstanding borrowings for the Facility were $2,146,739.
Note 12. Notes Payable
On January 27, 2020, we issued $15,000,000 principal amount of senior unsecured notes that mature on March 31, 2035 (the “2035 Notes”). The 2035 Notes bear interest at a rate of 6.50% per year, payable quarterly on March 31, June 30, September 30, and December 31 of each year, beginning March 31, 2020. Total proceeds from the issuance of the 2035 Notes, net of underwriting discounts and issuance costs, were $14,337,103. As of December 31, 2020, the fair value of the 2035 Notes is $14,548,129 and is categorized as Level 2 under ASC 820 as of December 31, 2020. As permitted by ASC 825-10-25, we have not elected to fair value our 2023 Notes on the Statement of Assets and Liabilities. As of December 31, 2020, $170,482 of underwriting discounts and debt issuance costs remain to be amortized and are included as a reduction within Notes payable on the Statement of Assets and Liabilities.
During the six months ended December 31, 2020, we recorded $500,504 of interest costs and amortization of financing costs on the 2035 Notes as interest expense on the Statement of Operations.
Note 13. Financial Highlights
The following is a schedule of financial highlights for each of the five years ended June 30 and the six months ended December 31, 2020. Although the Company has designated its differing up-front sale loads as different “share classes”, the Company does not operate as a multi-class fund and each share of the Company has the same net asset value, as well as identical voting and distributions rights, and bears its own pro rata portion of the Company’s expenses.
2021 SEMI-ANNUAL REPORT
PRIORITY INCOME FUND, INC. 40
| | | | | | | | | | | | | | | | | | | | | | | | | | | | | | | | | | | | | | | | | | | | | | | | | | |
| | | | | | Six Months Ended | | Year Ended | | Year Ended | | Year Ended | | Year Ended | | Year Ended |
| | | | | | December 31, 2020 | | June 30, 2020 | | June 30, 2019 | | June 30, 2018 | | June 30, 2017 | | June 30, 2016 |
| Per share data: | | | | | | | | | | | | |
| Net asset value, beginning of year/period | | $ | 10.57 | | | $ | 13.02 | | | $ | 13.47 | | | $ | 14.43 | | | $ | 14.24 | | | $ | 13.39 | |
Net investment income(a)(g) | | 0.90 | | | 1.48 | | | 1.61 | | | 1.60 | | | 1.76 | | | 2.03 | |
Net realized gain (loss) and net change in unrealized appreciation/depreciation on investments(a) | | 0.78 | | | (2.63) | | | (0.71) | | | (1.19) | | | (0.22) | | | 0.27 | |
Net realized gain on extinguishment of debt(a) | | — | | | 0.04 | | | — | | | — | | | — | | | — | |
| Net increase (decrease) in net assets resulting from operations | | 1.68 | | | (1.11) | | | 0.90 | | | 0.41 | | | 1.54 | | | 2.30 | |
Distributions to common stockholders(f) | | | | | | | | | | | | |
Dividends from net investment income(a) | | (0.61) | | | (0.69) | | | (1.00) | | | (0.83) | | | (1.30) | | | (1.50) | |
Capital gain(a) | | — | | | — | | | (0.01) | | | (0.03) | | | — | | | — | |
Return of capital(a) | | — | | | (0.72) | | | (0.47) | | | (0.64) | | | (0.21) | | | — | |
Total distributions(b) | | (0.61) | | | (1.41) | | | (1.48) | | | (1.50) | | | (1.51) | | | (1.50) | |
Offering costs(a) | | — | | | — | | | — | | | — | | | — | | | (0.02) | |
Other(c) | | (0.04) | | | 0.07 | | | 0.13 | | | 0.13 | | | 0.16 | | | 0.07 | |
| Net asset value, end of year/period | | $ | 11.60 | | | $ | 10.57 | | | $ | 13.02 | | | $ | 13.47 | | | $ | 14.43 | | | $ | 14.24 | |
| | | | | | | | | | | | |
Total return, based on NAV(d) | | 16.29 | % | | (8.83) | % | | 8.06 | % | | 3.94 | % | | 12.82 | % | | 19.13 | % |
| Supplemental Data: | | | | | | | | | | | | |
| Net assets, end of year/period | | $402,383,489 | | $347,800,248 | | $399,704,924 | | $332,681,912 | | $285,033,346 | | $182,280,330 |
| Ratio to average net assets: | | | | | | | | | | | | |
Total expenses excluding expense support (reimbursements)/repayments(g)(h) | | 13.53 | % | | 11.32 | % | | 8.46 | % | | 6.41 | % | | 6.91 | % | | 7.11 | % |
Expenses after expense support (reimbursements)/repayments, net(e)(g)(h) | | 13.53 | % | | 11.32 | % | | 8.46 | % | | 6.25 | % | | 7.52 | % | | 3.49 | % |
Net investment income(g)(h) | | 16.63 | % | | 12.20 | % | | 11.90 | % | | 11.46 | % | | 12.22 | % | | 14.94 | % |
| | | | | | | | | | | | |
| Portfolio turnover | | 0.47 | % | | 1.66 | % | | 1.44 | % | | 1.10 | % | | 1.00 | % | | 1.00 | % |
| | | | | | | | | | | | | | | | |
(a) Calculated based on weighted average shares outstanding during the year or period. |
(b) The per share data for distributions is the actual amount of distributions paid or payable per share of common stock outstanding during the year or period. Distributions per share are rounded to the nearest $0.01. |
(c) The amount shown represents the balancing figure derived from the other figures in the schedule, and is primarily attributable to the accretive effects from the sales of the Company’s shares and the effects of share repurchases during the year or period. |
(d) Total return is based upon the change in net asset value per share between the opening and ending net asset values per share during the year and assumes that dividends are reinvested in accordance with the Company’s dividend reinvestment plan. The computation does not reflect the sales load for any shares. Total return based on market value is not presented since the Company’s common shares are not publicly traded. For periods less than one year, total return is not annualized. |
(e) For the years ended June 30, 2018, 2017, and 2016, there were Expense Support Repayments (Reimbursements), net of ($675,148), $1,441,093 and ($4,630,655), respectively. There were no Expense Support Repayments (Reimbursements) for the years ended June 30, 2019 and 2020 or for the six months ended December 31, 2020. |
(f) The amounts reflected for the year ended June 30, 2019 have been updated based on tax information received subsequent to the filing of the annual report on Form N-CSR. |
(g) Net investment income per share data and ratios reflect income earned and expenses incurred on assets attributable to preferred shares (as described in Note 7. Mandatorily Redeemable Preferred Shares). The expense ratios also reflect expenses incurred on assets attributable to preferred shares. Preferred shares are only outstanding for periods after June 27, 2018 and the ratio of preferred dividend expense to average net assets applicable to the common shares for the years ended June 30, 2020, 2019 and 2018 are 2.94%, 1.34% and 0.00%, respectively. The ratio of preferred dividend expense to average net assets applicable to the common shares for the six months ended December 31, 2020 is 1.81%. |
| (h) Annualized for the six months ended December 31, 2020. |
2021 SEMI-ANNUAL REPORT
PRIORITY INCOME FUND, INC. 41
| | | | | | | | | | | | | | |
Senior Securities as of June 30, 2020(a) |
| Senior Securities | Aggregate Amount Outstanding | Asset Coverage per Unit | Involuntary Liquidating Price per Preferred share | Average market value per unit(b) |
| The Facility | $ | — | | $ | — | | $ | — | | $ | — | |
| 2035 Notes | $ | 15,000,000 | | $ | 36,030 | | $ | — | | $ | — | |
| Series A Term Preferred Stock Due 2025 | $ | 37,035,875 | | $ | 68 | | $ | 25.00 | | $ | 24.31 | |
| Series B Term Preferred Stock Due 2023 | $ | 24,622,950 | | $ | 68 | | $ | 25.00 | | $ | 24.42 | |
| Series C Term Preferred Stock Due 2024 | $ | 38,927,475 | | $ | 68 | | $ | 25.00 | | $ | 24.69 | |
| Series D Term Preferred Stock Due 2029 | $ | 27,400,175 | | $ | 68 | | $ | 25.00 | | $ | 24.87 | |
| Series E Term Preferred Stock Due 2024 | $ | 25,982,900 | | $ | 68 | | $ | 25.00 | | $ | 23.79 | |
| Series F Term Preferred Stock Due 2027 | $ | 30,883,700 | | $ | 68 | | $ | 25.00 | | $ | 22.74 | |
| | | | |
| (a)The asset coverage ratio for a class of senior securities representing indebtedness is calculated as our total assets, less all liabilities and indebtedness not represented by senior securities, divided by secured securities representing indebtedness. This asset coverage ratio is multiplied by $1,000 to determine the Asset Coverage Per Unit for the Facility and the 2035 Notes. The asset coverage ratio for a class of senior securities representing stock is calculated as our total assets, less all liabilities and indebtedness not represented by senior securities, divided by senior securities representing indebtedness plus the aggregate of the involuntary liquidation preference of senior securities which is a stock. With respect to the Term Preferred Stock, the asset coverage per unit figure is expressed in terms of dollar amounts per share of outstanding Preferred Stock (based on a per share liquidation preference of $25). |
(b)Represents the average daily closing market price per share of each respective series of Term Preferred Stock for the respective periods listed on NYSE from June 30, 2019 to June 30, 2020. For series that were not outstanding at June 30, 2019, the average starts from the first day of trading of that particular series. |
| | | | | | | | | | | | | | |
Mandatorily Redeemable Preferred Shares as of June 30, 2019(a) |
| Term Preferred Stock | Aggregate Amount Outstanding | Asset Coverage per Preferred Share | Involuntary Liquidating Price per Preferred share | Average market value per unit(b) |
| Series A Term Preferred Stock Due 2025 | $ | 37,504,575 | | $ | 349 | | $ | 25.00 | | $ | 24.79 | |
| Series B Term Preferred Stock Due 2023 | $ | 25,000,000 | | $ | 524 | | $ | 25.00 | | $ | 24.72 | |
| Series C Term Preferred Stock Due 2024 | $ | 40,250,000 | | $ | 325 | | $ | 25.00 | | $ | 25.02 | |
| Series D Term Preferred Stock Due 2029 | $ | 26,131,675 | | $ | 501 | | $ | 25.00 | | $ | 25.24 | |
| Total Term Preferred Stock | $ | 128,886,250 | | $ | 102 | | | |
| | | | |
(a)For financial reporting purposes, preferred shares are considered to be debt. The Asset Coverage amounts per $25 of Preferred shares (the dollar amount per share) reflects the amount of the Company’s total assets (less all liabilities not represented by borrowings and preferred shares) per $25 Preferred Share of the combined amount of borrowings and outstanding preferred shares and the Asset Coverage amounts per financial reporting purposes. |
(b)Represents the average daily closing market price per share of each respective series of Term Preferred Stock for the respective periods listed on NYSE from June 30, 2018 to June 30, 2019. |
2021 SEMI-ANNUAL REPORT
PRIORITY INCOME FUND, INC. 42
| | | | | | | | | | | | | | | | | |
Mandatorily Redeemable Preferred Shares at the End of the Year(a) |
| Year | Aggregate Amount Outstanding | Asset Coverage per Preferred Share | Involuntary Liquidating Price per Preferred share | Average market value per unit(b) |
| 2018 | $ | 34,000,000 | | $ | 268.64 | | $ | 25.00 | | $ | 24.22 | |
| | | | | |
(a)For financial reporting purposes, preferred shares are considered to be debt. The Asset Coverage amounts per $25 of Preferred shares (the dollar amount per share) reflects the amount of Fund total assets (less all liabilities not represented by borrowings and preferred shares) per $25 Preferred Share of the combined amount of borrowings and outstanding preferred shares and the Asset Coverage amounts per financial reporting purposes. |
(b)The average market value is the settlement price as of June 29, 2018. There were no settled preferred shares outstanding prior to June 29, 2018. |
Note 14. Subsequent Events
During the period from January 1, 2021 through February 24, 2021, we made 11 CLO equity investments totaling $37.4 million, 5 of which represented new investments.
On January 13, 2021, in accordance with our share pricing policy, our Board determined that an increase in the public offering prices was warranted following an increase in our estimated net asset value per share. In order to more accurately reflect our net asset value per share, we increased our public offering price to $12.54 per Class R share, $11.78 per Class RIA share, and $11.69 per Class I share from $12.04 per Class R share, $11.32 per Class RIA share, and $11.23 per Class I share. The increases in the public offering prices were effective as of our January 15, 2021 weekly closing and first applied to subscriptions received from January 8, 2021 through January 14, 2021.
On February 4, 2021, in accordance with our share pricing policy, our Board determined that an increase in the public offering prices was warranted following an increase in our estimated net asset value per share. In order to more accurately reflect our net asset value per share, we increased our public offering price to $12.56 per Class R share, $11.80 per Class RIA share, and $11.71 per Class I share from $12.54 per Class R share, $11.78 per Class RIA share, and $11.69 per Class I share. The increases in the public offering prices were effective as of our February 5, 2021 weekly closing and first applied to subscriptions received from January 29, 2021 through February 4, 2021.
On January 27, 2021, we repaid the entire amount outstanding under the Facility, $2,000,000. On February 9, 2021, we made a draw on the Facility of $2,200,000. As of February 24, 2021, there was a $2,200,000 outstanding Facility balance.
During the period from January 1, 2021 through February 24, 2021, we raised $8.2 million of capital, net of offering proceeds, through the issuance of 658,769 shares.
On January 22, 2021, our Board authorized and we declared a series of distributions for our preferred stock payable on March 31, 2021, as reflected in the following table. Preferred stockholders of record of each respective Series will be entitled to receive the respective distributions as of the close of the business on March 15, 2021.
| | | | | | | | | | | | | | | | | | | | |
| Series A Term Preferred Stock Due 2025 | Series B Term Preferred Stock Due 2023 | Series C Term Preferred Stock Due 2024 | Series D Term Preferred Stock Due 2029 | Series E Term Preferred Stock Due 2024 | Series F Term Preferred Stock Due 2027 |
| Total amount per share | $ | 0.39844 | | $ | 0.39063 | | $ | 0.41406 | | $ | 0.43750 | | $ | 0.39844 | | $ | 0.41406 | |
2021 SEMI-ANNUAL REPORT
PRIORITY INCOME FUND, INC. 43
On February 23, 2021, our Board of Directors declared a series of distributions for the months of March through May 2021 reflected in the following table. Common stockholders of record as of each respective record date will be entitled to receive the distribution.
| | | | | | | | | | | | | | |
| Record Date | | Payment Date | | Total Amount per Share(a) |
March 5, 12, 19 and 26, 2021(b) | | March 29, 2021 | | $ | 0.14306 | |
| April 2, 9, 16, 23 and 30, 2021 | | May 3, 2021 | | $ | 0.10070 | |
| May 7, 14, 21 and 28, 2021 | | June 1, 2021 | | $ | 0.08056 | |
| | | | |
(a)Total amount per share represents the total distribution rate for the record dates indicated. |
(b)Includes bonus distributions. |
2021 SEMI-ANNUAL REPORT
PRIORITY INCOME FUND, INC. 44
DISTRIBUTION REINVESTMENT PLAN
Subject to the Company’s Board of Directors’ discretion and applicable legal restrictions, the Company intends to authorize and declare ordinary cash distributions on a quarterly basis and pay such distributions on a monthly basis. The Company have adopted an “opt in” distribution reinvestment plan pursuant to which stockholders may elect to have the full amount of their cash distributions reinvested in additional shares. Any distributions of the Company’s shares pursuant to the Company’s distribution reinvestment plan are dependent on the continued registration of the Company’s securities or the availability of an exemption from registration in the recipient’s home state. Participants in the Company’s distribution reinvestment plan are free to elect or revoke reinstatement in the distribution plan within a reasonable time as specified in the plan. If stockholders do not elect to participate in the plan, stockholders will automatically receive any distributions the Company declares in cash. For example, if the Company’s Board of Directors authorizes, and the Company declares, a cash distribution, then if stockholders have “opted in” to the Company’s distribution reinvestment plan, those stockholders will have their cash distributions reinvested in additional shares, rather than receiving cash distributions. During this offering, the Company generally intends to coordinate distribution payment dates so that the same price that is used for the closing date immediately following such distribution payment date will be used to calculate the purchase price for purchasers under the distribution reinvestment plan. In such case, stockholders reinvested distributions will purchase shares at a price equal to 95% of the price that shares are sold in the offering at the closing immediately following the distribution payment date. Shares issued pursuant to the Company’s distribution reinvestment plan will have the same voting rights as shares offered pursuant to the prospectus.
If stockholders wish to receive their distribution in cash, no action will be required on their part to do so. If stockholders are a registered stockholder, they may elect to have their entire distribution reinvested in shares by notifying DST Systems, Inc., the reinvestment agent, and the Company’s transfer agent and registrar, in writing so that such notice is received by the reinvestment agent no later than the record date for distributions to stockholders. If stockholders elect to reinvest their distributions in additional shares, the reinvestment agent will set up an account for shares stockholders acquire through the plan and will hold such shares in non-certificated form. If stockholders shares are held by a broker or other financial intermediary, stockholders may “opt in” to the Company’s distribution reinvestment plan by notifying their broker or other financial intermediary of their election.
The Company intends to use newly issued shares to implement the plan and determine the number of shares the Company will issue to stockholders as follows:
To the extent the Company’s shares are not listed on a national stock exchange or quoted on an over-the-counter market or a national market system (collectively, an “Exchange”):
•during any period when the Company is making a “best-efforts” public offering of the Company’s shares, the number of shares to be issued to stockholders shall be determined by dividing the total dollar amount of the distribution payable to stockholders by a price equal to 95% of the price that the shares are sold in the offering at the closing immediately following the distribution payment date; and
•during any period when the Company is not making a “best-efforts” offering of the Company’s shares, the number of shares to be issued to stockholders shall be determined by dividing the total dollar amount of the distribution payable to stockholders by a price equal to the net asset value as determined by the Company’s Board of Directors.
To the extent the Company’s shares are listed on an Exchange, the number of shares to be issued to stockholders shall be determined by dividing the total dollar amount of the distribution payable to stockholders by the market price per share of the Company’s shares at the close of regular trading on such Exchange on the valuation date fixed by the Company’s Board of Directors for such distribution.
There will be no selling commissions, dealer manager fees or other sales charges to stockholders if they elect to participate in the distribution reinvestment plan. The Company will pay the reinvestment agent’s fees under the plan.
If stockholders receive their ordinary cash distributions in the form of shares, stockholders generally are subject to the same federal, state and local tax consequences as they would be had they elected to receive their distributions in cash. Stockholders’ basis for determining gain or loss upon the sale of shares received in a distribution from the Company will be equal to the total dollar amount of the distribution payable in cash. Any shares received in a distribution will have a holding period for tax purposes commencing on the day following the day on which the shares are credited to stockholders’ account.
2021 SEMI-ANNUAL REPORT
PRIORITY INCOME FUND, INC. 45
MANAGEMENT
Our Board of Directors oversees our management. Our Board of Directors currently consists of four members, three of whom are not “interested persons” of us as defined in Section 2(a)(19) of the 1940 Act. We refer to these individuals as our independent directors. M. Grier Eliasek is considered an interested person of us as a result of his position as President and Chief Executive Officer of us and President and Chief Operating Officer of our Adviser, and his executive positions at certain affiliates of our Adviser. Our Board of Directors elects our officers, who serve at the discretion of our Board of Directors. The responsibilities of each director will include, among other things, the oversight of our investment activity, the quarterly valuation of our assets, and oversight of our financing arrangements. Our Board of Directors has also established an Audit Committee and a Nominating and Corporate Governance Committee and may establish additional committees in the future.
Our directors and officers and their principal occupations during the past five years are set forth below. Our prospectus includes additional information about our directors and is available, without charge, upon request by calling (212) 448-0702.
Board of Directors and Executive Officers
Directors
Information regarding the Board of Directors is as follows:
| | | | | | | | | | | | | | | | | | | | |
Name (Age) Position(s) with the Company (Since) Address(1) | |
Term Expires | | Number of Companies in the Fund Complex overseen by Director(2) | | Principal
Occupation(s) and Other Public Company Directorships Held During the Past 5 Years |
Interested Directors(4) | | | | | | |
M. Grier Eliasek (47)
Chairman of the Board, Director, Chief Executive Officer and President
(February 2013) | | 2021 | | 3 | | President and Chief Operating Officer of the Adviser, President and Chief Operating Officer of the Adviser of FLEX, Chief Executive Officer and President of FLEX, President and Chief Operating Officer of PSEC, Managing Director of PCM and Prospect Administration |
| Independent Directors | | | | | | |
Andrew C. Cooper (58)
Director
(February 2013) | | 2021 | | 3 | | Mr. Cooper is an entrepreneur, who over the last 15 years has founded, built, run and sold three companies. He is Co-Chief Executive Officer of Unison Energy, LLC, a company that develops, owns and operates, distributed combined heat and power co-generation solutions. |
William J. Gremp (78)
Director
(February 2013) | | 2023 | | 3 | | Mr. Gremp has been responsible for traditional banking services, credit and lending, private equity and corporate cash management with Merrill Lynch & Co. from 1999 to present. |
Eugene S. Stark (62)
Director
(February 2013) | | 2022 | | 3 | | Principal Financial Officer, Chief Compliance Officer and Vice President—Administration of General American Investors Company, Inc. from May 2005 to present. |
(1)The business address of each director of the Company is c/o Priority Income Fund, Inc., 10 East 40th Street, 42nd Floor, New York, New York 10016.
(2)The Fund Complex consists of the Company, FLEX, and PSEC.
(3)Mr. Eliasek is an interested person of the Company as defined in the 1940 Act because of his positions with PCM and our Adviser.
2021 SEMI-ANNUAL REPORT
PRIORITY INCOME FUND, INC. 46
Executive Officers Who Are Not Directors
| | | | | | | | | | | | | | | | | | | | |
| Name, Address and Age | | Position(s) Held with the Funds | | Term at Office and Length of Time Served | | Principal Occupation(s) During Past 5 Years |
Kristin Van Dask, 41(1) | | Chief Financial Officer, Chief Compliance Officer, Treasurer and Secretary | | Since April 2018 | | Ms. Van Dask has been the Chief Financial Officer, Chief Compliance Officer, Treasurer and Secretary of the Company since April 2018. Ms. Van Dask previously served as controller at Prospect Administration. Ms. Van Dask is also the Chief Financial Officer, Chief Compliance Officer, Treasurer and Secretary of the Adviser, FLEX, PSEC, and the Adviser of FLEX. |
(1)The business address of Ms. Van Dask is c/o Priority Income Fund, Inc., 10 East 40th Street, 42nd Floor, New York, New York 10016.
Compensation of Directors
The following table sets forth compensation of our directors for the six months ended December 31, 2020.
| | | | | | | | | | | | | | | | | | | | | | | | | | | | | |
| Name | | Fees Earned(1) | | All Other Compensation(2) | | Total |
| Interested Directors | | | | | | | | | |
| M. Grier Eliasek | | $ | — | | | | $ | — | | | | $ | — | | |
| Independent Directors | | | | | | | | | |
| Andrew C. Cooper | | 25,000 | | | | — | | | | 25,000 | | |
| William J. Gremp | | 25,000 | | | | — | | | | 25,000 | | |
| Eugene S. Stark | | 25,000 | | | | — | | | | 25,000 | | |
| Total director compensation | $ | 75,000 | | |
(1)For a discussion of the independent directors’ compensation, see below.
(2)We do not maintain a stock or option plan, non-equity incentive plan or pension plan for our directors.
Prior to the Fund meeting its minimum offering requirement, our directors were not entitled to compensation. Subsequent to the Fund meeting its minimum offering requirement, our directors who do not also serve in an executive officer capacity for us or our Adviser have been and will continue to be entitled to receive annual cash retainer fees, determined based on our net asset value as of the end of each fiscal quarter. These directors are currently Messrs. Cooper, Gremp and Stark. Amounts payable under this arrangement are currently determined and paid quarterly in arrears as follows:
| | | | | | | | |
| Net Asset Value | | Annual Cash Retainer |
| $0 - $100,000,000 | | $ | — | |
| $100,000,001 - $300,000,000 | | 35,000 | |
| $300,000,001 - $500,000,000 | | 50,000 | |
| $500,000,001 - $1 billion | | 75,000 | |
| >$1 billion | | 100,000 | |
We also reimburse each of the above directors for all reasonable and authorized business expenses in accordance with our policies as in effect from time to time, including reimbursement of reasonable out-of-pocket expenses incurred in connection with attending each board meeting and each committee meeting not held concurrently with a board meeting.
We do not pay compensation to our directors who also serve in an executive officer capacity for us or our Adviser.
2021 SEMI-ANNUAL REPORT
PRIORITY INCOME FUND, INC. 47
Compensation of Executive Officers
Our executive officers will not receive any direct compensation from us. We do not currently have any employees and do not expect to have any employees. Services necessary for our business are provided by individuals who are employees of Prospect Capital Management, Prospect Administration or Stratera Holdings or by individuals who were contracted by such entities to work on behalf of us, pursuant to the terms of the Investment Advisory Agreement between the Company and our Adviser and the Administration Agreement between the Company and Prospect Administration. Each of our executive officers is an employee of our Adviser, Prospect Capital Management, Prospect Administration, Stratera Holdings or an outside contractor, and the day-to-day investment operations and administration of our portfolio are managed by our Adviser. In addition, we reimburse Prospect Administration for our actual and allocable portion of expenses incurred by Prospect Administration, as applicable, in performing its obligations under the Administration Agreement, including the allocable portion of the cost of our chief financial officer, chief compliance officer, treasurer and secretary and other administrative support personnel under the Administration Agreement.
ADDITIONAL INFORMATION
Portfolio Information
The Company prepares Form N-PORT, which contains a schedule of its portfolio holdings, on a monthly basis and makes its N-PORT filings with the Securities and Exchange Commission on a quarterly basis within 60 days after the end of the quarter. The Company’s N-PORT filings for the third month of each quarter are available on the Commission’s website at http://www.sec.gov.
Proxy Information
A description of the policies and procedures that the Company uses to determine how to vote proxies relating to portfolio securities is available (i) without charge, upon request, by calling collect (212) 448-0702; and (ii) on the SEC’s website at http://www.sec.gov.
Tax Information
For tax purposes, distributions to common stockholders during the six months ended December 31, 2020 were approximately $20,598,582 for distributions from net investment income, $0 from return of capital and $0 from capital gain. Distributions to preferred shareholders during the six months ended December 31, 2020 were $6,049,700 for distributions from net investment income and $0 from return of capital.
Privacy Policy
We are committed to protecting your privacy. This privacy notice, which is required by federal law, explains our privacy policies and our affiliated companies. This notice supersedes any other privacy notice you may have received from us.
We will safeguard, according to strict standards of security and confidentiality, all information we receive about you. The only information we collect from you is your name, date of birth, address, citizenship status (and country of origin, if applicable), number of shares you hold and your social security number. This information is used only so that we can register your shares, send you periodic reports and other information about us, and send you proxy statements or other information required by law.
We do not share this information with any non-affiliated third-party except as described below:
•Authorized personnel of our Adviser. It is our policy that only authorized personnel of our Adviser who need to know your personal information will have access to it.
•Service providers. We may disclose your personal information to companies that provide services on our behalf, such as record keeping, processing your trades and mailing you information. These companies are required to protect your information and use it solely for the purpose for which they received it.
•Courts and government officials. If required by law, we may disclose your personal information in accordance with a court order or at the request of government regulators. Only that information required by law, subpoena or court order will be disclosed.
2021 SEMI-ANNUAL REPORT
PRIORITY INCOME FUND, INC. 48
Item 2. Code of Ethics.
The information required by this item is not required in a semi-annual report on Form N-CSRS.
Item 3. Audit Committee Financial Expert.
The information required by this item is not required in a semi-annual report on Form N-CSRS.
Item 4. Principal Accountant Fees and Services.
The information required by this item is not required in a semi-annual report on Form N-CSRS.
Item 5. Audit Committee of Listed Registrant.
The information required by this item is not required in a semi-annual report on Form N-CSRS.
Item 6. Schedule of Investments.
Please see the schedule of investments contained in the report to stockholders included under Item 1 of this Form N-CSRS.
(b) Not applicable.
Item 7. Disclosure of Proxy Voting Policies and Procedures for Closed-End Management Investment Companies.
The information required by this item is not required in a semi-annual report on Form N-CSRS.
Item 8. Portfolio Managers of Closed-End Investment Companies.
(a) The information required by this item is not required in a semi-annual report on Form N-CSRS.
(b) There has been no change, as of the date of the filing of this semi-annual report on Form N-CSRS, to any of the portfolio managers identified in response to paragraph (a)(1) of this item in the Registrant's most recent annual report on Form N-CSR.
Item 9. Purchases of Equity Securities by Closed-End Management Investment Company and Affiliated Purchasers.
Neither the Registrant nor any affiliated purchasers, as defined in Rule 10b-18(a)(3) under the Securities Exchange Act of 1934, purchased any shares of the Registrant that are registered by the Registrant pursuant to Section 12 of the Securities Exchange Act of 1934, other than the 11,111 and 6,754 Class I Common Stock that our Adviser purchased on October 10, 2012 and February 6, 2013, respectively, for $9.00 and $21.70 per share, respectively.
Item 10. Submission of Matters to a Vote of Security Holders.
Not applicable.
Item 11. Controls and Procedures.
(a)Based on an evaluation of the Disclosure Controls and Procedures (as defined in Rule 30a-3(c) under the Investment Company Act of 1940, the “Disclosure Controls”) as of a date within 90 days prior to the filing date (the “Filing Date”) of this report on Form N-CSRS (the “Report”), the Chief Executive Officer (its principal executive officer) and Chief Financial Officer (its principal financial officer) have concluded that the Disclosure Controls are reasonably designed to ensure that information required to be disclosed by the Registrant in the Report is recorded, processed, summarized and reported by the Filing Date, including ensuring that information required to be disclosed in the Report is accumulated and communicated to the Registrant’s management, including the Registrant’s principal executive officer and principal financial officer, as appropriate to allow timely decisions regarding required disclosure.
(b)There was no change in the Registrant’s internal control over financial reporting (as defined in Rule 30a-3(d) under the 1940 Act) over the period covered by this report that has materially affected, or is reasonably likely to materially affect, the Registrant’s internal control over financial reporting.
Item 12. Disclosure of Securities Lending Activities for Closed-End Management Investment Companies.
Not applicable.
Item 13. Exhibits.
(a)(1) Not applicable.
(a)(3) Not applicable.
(a)(4) Not applicable.
SIGNATURES
Pursuant to the requirements of the Securities Exchange Act of 1934 and the Investment Company Act of 1940, the Registrant has duly caused this report to be signed on its behalf by the undersigned, thereunto duly authorized.
PRIORITY INCOME FUND, INC.
By: /s/ M. Grier Eliasek
M. Grier Eliasek
Chief Executive Officer and President
Date: February 24, 2021
Pursuant to the requirements of the Securities Exchange Act of 1934 and the Investment Company of 1940, this report has been signed below by the following persons on behalf of the Registrant and in the capacities and on the dates indicated.
By: /s/ M. Grier Eliasek
M. Grier Eliasek
Chief Executive Officer and President
Date: February 24, 2021
By: /s/ Kristin Van Dask
Kristin Van Dask
Chief Financial Officer, Chief Compliance Officer
Treasurer and Secretary
Date: February 24, 2021