Exhibit (d)
This description of FMS-WM and the Federal Republic is dated August 24, 2018 and appears as Exhibit (d) to the Annual Report on Form 18-K of FMS-WM for the fiscal year ended December 31, 2017.
TABLE OF CONTENTS
i
ii
THIS DOCUMENT (OTHERWISE THAN AS PART OF A PROSPECTUS CONTAINED IN A REGISTRATION STATEMENT FILED UNDER THE U.S. SECURITIES ACT OF 1933, AS AMENDED) DOES NOT CONSTITUTE AN OFFER TO SELL OR THE SOLICITATION OF AN OFFER TO BUY ANY SECURITIES OF FMS-WM. THE DELIVERY OF THIS DOCUMENT AT ANY TIME DOES NOT IMPLY THAT THE INFORMATION HEREIN IS CORRECT AS OF ANY TIME SUBSEQUENT TO ITS DATE.
PRESENTATION OF FINANCIAL AND OTHER INFORMATION
In this description, references to “€,” “euro” or “EUR” are to the single European currency of the member states of the European Union participating in the euro and references to “U.S. dollars,” “$” or “USD” are to United States dollars. See “Exchange Rate Information” below for information regarding the rates of conversion of the euro into United States dollars and “The Federal Republic of Germany—General—The European Union and European Integration” for a discussion of the introduction of the euro.
FMS-WM’s accounts are kept, and the economic data on the Federal Republic is expressed, in euro.
Any discrepancies in the tables included in this prospectus between the amounts and the totals thereof are due to rounding.
In this document, references to the “Federal Republic” and “Germany” are to the Federal Republic of Germany and references to the “Federal Government” are to the government of the Federal Republic of Germany. The term “FMS-WM” refers to FMS Wertmanagement.
EXCHANGE RATE INFORMATION
FMS-WM files reports with the Securities and Exchange Commission giving financial and economic data expressed in euro.
The following table shows noon buying rates for euro, expressed as U.S. dollars per EUR 1.00, for the periods and dates indicated, as published on a weekly basis by the Federal Reserve Bank of New York.
| | | | | | | | | | | | | | | | |
Year ended December 31, | | Period End | | | Average(1) | | | High | | | Low | |
2012 | | | 1.3186 | | | | 1.2909 | | | | 1.3463 | | | | 1.2062 | |
2013 | | | 1.3779 | | | | 1.3303 | | | | 1.3816 | | | | 1.2774 | |
2014 | | | 1.2101 | | | | 1.3210 | | | | 1.3927 | | | | 1.2101 | |
2015 | | | 1.0859 | | | | 1.1032 | | | | 1.2015 | | | | 1.0524 | |
2016 | | | 1.0552 | | | | 1.1029 | | | | 1.1516 | | | | 1.0375 | |
2017 | | | 1.2022 | | | | 1.1396 | | | | 1.2041 | | | | 1.0416 | |
| (1) | The average of the noon buying rates on the last business day of each month during the relevant period. |
The following table shows the high and low noon buying rates for euro, expressed as U.S. dollars per EUR 1.00, for each month from January 2018 through August 17, 2018, as reported by the Federal Reserve Bank of New York.
| | | | | | | | |
2018 | | High | | | Low | |
January | | | 1.2488 | | | | 1.1922 | |
February | | | 1.2482 | | | | 1.2211 | |
March | | | 1.2440 | | | | 1.2216 | |
April | | | 1.2384 | | | | 1.2074 | |
May | | | 1.2000 | | | | 1.1551 | |
June | | | 1.1815 | | | | 1.1577 | |
July | | | 1.1744 | | | | 1.1604 | |
August (through August 17) | | | 1.1666 | | | | 1.1332 | |
No representation is made that the euro or U.S. dollar amounts referred to herein could have been or could be converted into U.S. dollars or euro, as the case may be, at any particular rate.
There are, except in limited embargo circumstances, no legal restrictions in the Federal Republic on international capital movements and foreign exchange transactions. However, for statistical purposes only, every individual or corporation residing in the Federal Republic must report to the Deutsche Bundesbank, the German Central Bank, subject to a number of exceptions, any payment received from or made to an individual or a corporation resident outside of the Federal Republic if such payment exceeds EUR 12,500 (or the equivalent in a foreign currency).
1
RECENT DEVELOPMENTS
THE FEDERAL REPUBLIC OF GERMANY
Overview of Key Economic Figures
The following economic information regarding the Federal Republic is derived from the public official documents cited below. Certain of the information is preliminary.
Gross Domestic Product (GDP)
GROSS DOMESTIC PRODUCT
| | | | |
| (adjusted for price, seasonal and calendar effects)(1) |
| | |
Reference period | | Percentage change on previous quarter | | Percentage change on the same quarter in previous year |
2nd quarter 2017 | | 0.5 | | 2.2 |
3rd quarter 2017 | | 0.6 | | 2.6 |
4th quarter 2017 | | 0.5 | | 2.8 |
1st quarter 2018 | | 0.4 | | 2.1 |
2nd quarter 2018 | | 0.5 | | 2.0 |
| (1) | Adjustment for seasonal and calendar effects according to the Census X-12-ARIMA method. |
Germany’s gross domestic product (“GDP”) continued to grow, increasing by 0.5% after price, seasonal and calendar adjustments in the second quarter of 2018 compared to the first quarter of 2018. Compared to the first quarter of 2018, positive contributions to growth mainly came from domestic demand. Final consumption expenditure of households and general government increased by 0.3% and 0.6%, respectively, compared to the first quarter of 2018. Capital formation also increased slightly. Fixed capital formation in machinery and equipment increased by 0.3% and in construction by 0.6% compared to the first quarter of 2018. Overall, domestic uses increased markedly by 0.9% compared to the first quarter of 2018.
According to provisional calculations, exports of goods and services increased by 0.7% compared to the first quarter of 2018. Imports increased notably by 1.7% in the second quarter of 2018.
In a year-on-year comparison, in price and calendar-adjusted terms, the German economy slightly decelerated and grew by only 2.0% in the second quarter of 2018, following increases by 2.1% in the first quarter of 2018 and 2.8% in the fourth quarter of 2017, in each case compared to the corresponding periods in 2017 and 2016, respectively.
Source: Statistisches Bundesamt, Detailed gross domestic product results for the 2nd quarter of 2018, press release of August 24, 2018 (https://www.destatis.de/EN/PressServices/Press/pr/2018/08/PE18_316_811.html).
2
Inflation Rate
INFLATION RATE
| | | | |
| (based on overall consumer price index) |
| | |
Reference period | | Percentage change on previous month | | Percentage change on the same month in previous year |
July 2017 | | 0.4 | | 1.7 |
August 2017 | | 0.1 | | 1.8 |
September 2017 | | 0.1 | | 1.8 |
October 2017 | | 0.0 | | 1.6 |
November 2017 | | 0.3 | | 1.8 |
December 2017 | | 0.6 | | 1.7 |
January 2018 | | -0.7 | | 1.6 |
February 2018 | | 0.5 | | 1.4 |
March 2018 | | 0.4 | | 1.6 |
April 2018 | | 0.0 | | 1.6 |
May 2018 | | 0.5 | | 2.2 |
June 2018 | | 0.1 | | 2.1 |
July 2018 | | 0.3 | | 2.0 |
In July 2018, consumer prices in Germany rose by 2.0% compared to July 2017. The inflation rate thus slightly decreased again. In the preceding two months, the inflation rate had been just over two percent (June 2018: +2.1%; May 2018: +2.2%). The development of energy product prices had a considerable effect on the inflation rate in July 2018. The year-on-year increase in energy prices in July 2018 (+6.6%) was slightly higher than in June 2018: (+6.4%). In particular, heating oil prices increased by 28.5% in July 2018 compared to July 2017. In addition, motor fuel prices increased by 12.0% in July 2018 compared to July 2017. The price changes for the other energy products in July 2018 were much smaller (e.g., charges for central and district heating (+1.5%); electricity (+1.0%); gas (-1.3%)). Excluding energy prices, the inflation rate in July 2018 would have been 1.5%.
Compared to July 2017, food prices rose above average (+2.6%) in July 2018. In the last three months, the rate of price increase for food had been over three percent each. The prices of goods overall increased by 2.4% in July 2018 compared to July 2017, which was mainly due to the rise in energy prices (+6.6%) and food prices (+2.6%). Significant year-on-year price increases were also recorded for other goods such as newspapers and periodicals (+4.8%), beer (+4.0%) and tobacco products (+3.5%). Prices were down for consumer electronics (-5.5%), information processing equipment (-4.2%) and clothing (-2.0%), among other things. Prices of services overall rose by 1.6% in July 2018 compared to July 2017.
Compared to June 2018, the consumer price index increased by 0.3% in July 2018. In the holiday month of July, prices were up especially for package holidays (+19.3%, of which international holidays: +20.2%; domestic holidays: +8.3%) and air tickets (+4.4%). Furthermore, overall food prices and energy prices were slightly down in July 2018 (-0.5% and -0.1%, respectively) compared to June 2018.
Source: Statistisches Bundesamt, Consumer prices in July 2018: +2.0% on July 2017, press release of August 14, 2018
(https://www.destatis.de/EN/PressServices/Press/pr/2018/08/PE18_300_611.html).
3
Unemployment Rate
UNEMPLOYMENT RATE
| | | | |
(percent of unemployed persons in the total labor force according to the International Labour Organization (ILO) definition) (1) |
| | |
Reference period | | Original percentages | | Adjusted percentages(2) |
June 2017 | | 3.6 | | 3.8 |
July 2017 | | 3.6 | | 3.7 |
August 2017 | | 3.8 | | 3.7 |
September 2017 | | 3.5 | | 3.7 |
October 2017 | | 3.7 | | 3.6 |
November 2017 | | 3.4 | | 3.6 |
December 2017 | | 3.5 | | 3.6 |
January 2018 | | 3.6 | | 3.5 |
February 2018 | | 3.8 | | 3.5 |
March 2018 | | 3.5 | | 3.5 |
April 2018 | | 3.6 | | 3.5 |
May 2018 | | 3.4 | | 3.5 |
June 2018 | | 3.5 | | 3.4 |
| (1) | The time series on unemployment are based on the German Labour Force Survey. |
| (2) | Adjusted for seasonal and irregular effects (trend cycle component) using the X-12-ARIMA method. |
The number of employed persons increased by approximately 567,000 persons, or 1.3%, from June 2017 to June 2018. Compared to May 2018, the number of employed persons in June 2018 increased by approximately 28,000, or 0.1%, after adjustment for seasonal fluctuations.
In June 2018, the number of unemployed persons decreased by approximately 61,000, or 3.9%, compared to June 2017. Adjusted for seasonal and irregular effects (trend cycle component), the number of unemployed persons in June 2018 stood at 1.49 million, which was a decrease of roughly 5,000 compared to May 2018.
Sources: Statistisches Bundesamt, Employment up again in June 2018, press release of July 31, 2018
(https://www.destatis.de/EN/PressServices/Press/pr/2018/07/PE18_281_132.html); Statistisches Bundesamt, Genesis-Online Datenbank, Result 13231-0001, Unemployed persons, persons in employment, economically active population, unemployment rate: Germany, months, original and adjusted data
(https://www-genesis.destatis.de/genesis/online/logon?sequenz=tabelleErgebnis&selectionname=13231-0001&zeitscheiben=2&leerzeilen=false).
Current Account and Foreign Trade
CURRENT ACCOUNTAND FOREIGN TRADE
| | | | |
| | | (balance in EUR billion)(1) |
Item | | January to June 2018 | | January to June 2017 |
Trade in goods, including supplementary trade items | | 132.8 | | 133.1 |
Services | | -3.9 | | -7.7 |
Primary income | | 25.1 | | 24.4 |
Secondary income | | -19.9 | | -28.6 |
| | | | |
Current account | | 134.1 | | 121.2 |
| | | | |
| (1) | Figures may not add up due to rounding. |
Source: Statistisches Bundesamt, German exports in June 2018: +7.8% on June 2017, press release of August 7, 2018
(https://www.destatis.de/EN/PressServices/Press/pr/2018/08/PE18_288_51.html).
4
FMS WERTMANAGEMENT
GENERAL
Overview
FMS-WM is a wind-up institution (Abwicklungsanstalt) organized as a public law entity (Anstalt öffentlichen Rechts) under public law of the Federal Republic with partial legal capacity pursuant to Section 8a para 1 of the German Financial Market Stabilization Fund Act (Finanzmarktstabilisierungsfondsgesetz, “FMStFG”). Partial legal capacity, under German administrative law, means that FMS-WM does not have the right to bring an administrative proceeding against the German Federal Agency for Financial Market Stabilization (Bundesanstalt für Finanzmarktstabilisierung, “FMSA”) under its charter. FMS-WM has, however, full power and legal capacity to contract with third parties and sue and be sued in court. FMS-WM is wholly owned by the German Financial Market Stabilization Fund (Finanzmarktstabilisierungsfonds), a special pool of assets (Sondervermögen) of the Federal Republic, which is abbreviated as “FMS” in German and referred to as “SoFFin” in this document. FMS-WM is charged with liquidating a portfolio of risk positions and non-strategic assets/businesses in an original amount of EUR 175.7 billion (nominal volume) that it assumed from Hypo Real Estate Holding AG and its subsidiaries and special purpose entities (referred to herein collectively as the “HRE Group”) on October 1, 2010. As of 2007, the HRE Group was one of the largest commercial property lenders, issuers of covered bonds and providers of public finance in Germany. It encountered severe financial difficulties in 2008/09 in the course of the global financial markets crisis. Given the systemic importance of the HRE Group and the resulting public interest in stabilizing the HRE Group, the Federal Republic initiated support measures for this financial institution, including the transfer of risk positions and non-strategic assets/businesses to FMS-WM.
FMS-WM pursues its objective of managing and unwinding its portfolio according to a strategic management framework known as the “winding-up plan” (Abwicklungsplan), which is updated and adapted on a regular basis. FMS-WM aims to maximize the value of its portfolio by managing and liquidating it in a value-preserving manner over an extended period of time. For any given part of the portfolio, the plan requires an assessment of whether FMS-WM should sell, hold, or restructure its holdings. As of December 31, 2017, FMS-WM had liquidated approximately EUR 100.2 billion, including the wind-down of the portfolio extension due to the acquisition of assets of DEPFA Bank plc (“Depfa”) in November 2016 and November 2017 with an aggregate nominal amount of EUR 7.2 billion, of its initial portfolio of EUR 175.7 billion. The acquisition of assets of Depfa in November 2016 together with the acquisition of assets of Depfa in November 2017 are referred to herein as the “Portfolio Extensions” and the extension of the portfolio in November 2017 is referred to herein as the “Portfolio Extension.” For additional information on the Portfolio Extensions, see “Business and Operations—The Portfolio.”
FMS-WM engages in funding activities, including the issuance of debt securities and/or obtaining financing from financial institutions, in order to refinance funding instruments associated with the portfolio it has assumed as they expire. FMS-WM will have to engage in refinancing activities on the capital markets until its portfolio has been liquidated. As of December 31, 2017, FMS-WM had subscribed capital of EUR 200,000, the total amount of which had been paid in.
FMS-WM’s obligations are backed by the full faith and credit of the Federal Republic. Pursuant to the FMStFG, FMS-WM’s obligations benefit from a statutory guarantee of SoFFin and under FMS-WM’s charter, SoFFin is obligated to cover all losses sustained by FMS-WM and to ensure that FMS-WM is able to pay all its liabilities at any time when due and in full. According to Section 5 of the FMStFG, the Federal Republic, in turn, is directly liable for all of SoFFin’s obligations.
FMS-WM is governed by two corporate bodies: the Supervisory Board (Verwaltungsrat) and the Executive Board (Vorstand). The six-member Supervisory Board is appointed by SoFFin and is responsible for the composition and oversight of the Executive Board as well as for major strategic decisions of FMS-WM. The Executive Board has a minimum of two members (currently three) and is appointed by the Supervisory Board. It is responsible for representing FMS-WM externally and for managing its business.
FMS-WM is registered with the commercial register (Handelsregister) of the local court (Amtsgericht) of Munich under HRA 96076. Its registered office and business address is at Prinzregentenstrasse 56, 80538 Munich, Federal Republic of Germany. Its telephone number is +49 89 9547627-0. FMS-WM maintains a branch in Rome, Italy. The Italian branch was registered with the company register (Registro delle Imprese) of Rome on May 7, 2013 under registration number 12372371000. As of the date hereof, FMS-WM currently does not intend to open any additional branches.
5
Creation and Legal Status
FMS-WM’s creation and legal status are a direct result of the German Federal Government’s response to the global financial markets crisis. In October 2008, the German Federal Government enacted a comprehensive package of measures to support key German strategic financial institutions, most notably the HRE Group. This comprehensive package included the FMStFG, which provided for the implementation of SoFFin and established FMSA, a federal agency under public law with legal personality (rechtsfähige Anstalt öffentlichen Rechts) supervised by the German Federal Ministry of Finance (Bundesfinanzministerium). Section 8a of the FMStFG grants FMSA the power to create wind-up institutions. The purpose of these institutions is to assume distressed and non-strategic assets from systemically important financial institutions and to eventually dispose of or liquidate the risk positions transferred to them.
As of 2007, the HRE Group was one of the largest commercial property lenders and providers of public finance in Germany. Most of the commercial property loans were refinanced by the issuance of covered bonds, making the HRE Group the leading German issuer of covered bonds. In the course of the liquidity crisis in September 2008, the HRE Group encountered financial difficulties primarily caused by the heavy debt burden held by one of its subsidiaries, Depfa. Depfa had borrowed short-term money to fund higher interest-bearing long-term positions in public sector finance on a large scale. When the interbank lending market collapsed in September 2008, Depfa faced substantial refinancing problems. Within a short period of time, the entire HRE Group faced solvency issues as well. Due to the HRE Group’s importance for the German financial system, the Federal Republic initiated various support measures, which led to SoFFin becoming the sole owner of the HRE Group in October 2009. The government support measures also included the extension of liquidity guarantees by SoFFin and the creation of FMS-WM as a wind-up institution under Section 8a of the FMStFG on July 8, 2010. Risk positions and non-strategic assets/businesses of the HRE Group were then transferred to FMS-WM on October 1, 2010.
FMS-WM is a public law institution with partial legal capacity (teilrechtsfähige Anstalt des öffentlichen Rechts) created pursuant to German administrative law. It is wholly owned by SoFFin and is subject to the supervision and control of FMSA. FMS-WM may act in its own name, and may be subject to court proceedings. In order to achieve its mandate of unwinding the portfolio of risk positions and non-strategic assets/businesses assumed from the HRE Group, FMS-WM may engage in all kinds of banking and financial services transactions and all other transactions that directly or indirectly serve its purposes. FMS-WM is, however, neither a financial institution nor a financial services institution within the meaning of the German Banking Act (Kreditwesengesetz, “KWG”), nor a financial service provider within the meaning of the German Securities Trading Act (Wertpapierhandelsgesetz, “WpHG”), nor an insurance company within the meaning of the German Insurance Supervision Act (Versicherungsaufsichtsgesetz, “VAG”) nor regulated as such. As a consequence, FMS-WM is prohibited from engaging in transactions that would require a license under the European Union Banking Directive (2006/48/EC) or the European Union Directive on markets for financial instruments (2004/39/EC). Nonetheless, pursuant to its charter and the FMStFG, FMS-WM is subject to certain provisions of the KWG and the WpHG. In particular, FMS-WM is subject to banking supervision by the German Federal Financial Supervisory Authority (Bundesanstalt für Finanzdienstleistungsaufsicht) and must comply with the organizational obligations and restrictions on certain activities imposed by the KWG applicable to banks and financial institutions. FMS-WM is, however, exempted from the regulatory capital and liquidity requirements and the licensing requirements under the KWG. FMS-WM is also deemed to be a financial institution for purposes of the German Money Laundering Act (Geldwäschegesetz), and is therefore subject to the provisions thereof.
6
Relationship with the Federal Republic of Germany
The following chart provides an overview of the relationship between FMS-WM and the Federal Republic, including SoFFin, FMSA and the Federal Republic of Germany – Finance Agency, as of January 1, 2018 following completion of the reorganization of FMSA:
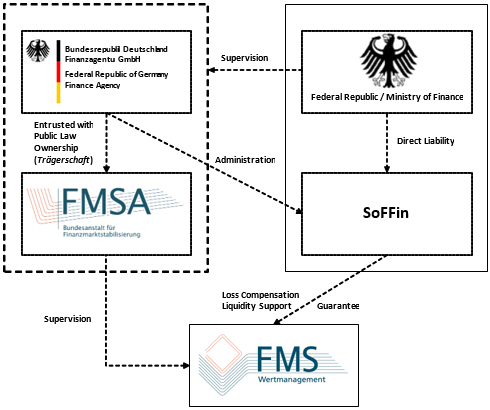
For information on certain changes to the supervision of FMSA and the administration of SoFFin as a result of the completed reorganization of FMSA, see “—Reorganization of FMSA” below.
Relationship with SoFFin
SoFFin
FMS-WM is wholly owned by SoFFin, which is established by law and designated to fulfill specific tasks of the German Federal Government assigned to it under the FMStFG. As of January 1, 2018, SoFFin is administered and managed by Federal Republic of Germany – Finance Agency (Bundesrepublik Deutschland – Finanzagentur GmbH) (see “—Reorganization of FMSA”). SoFFin is a special pool of assets (Sondervermögen) of the Federal Republic. The term special pool of assets (Sondervermögen) designates legally dependent assets of the Federal Republic. Accordingly, the FMStFG provides that SoFFin shall have no legal capacity, although in legal relations SoFFin may act, sue and be sued in its own name. There shall be no attachment of, or other measures of compulsory execution against, SoFFin. Any debt incurred by SoFFin is accounted for as direct debt of the Federal Republic. In addition, Section 5 of the FMStFG provides that the Federal Republic is directly liable for the obligations of SoFFin. SoFFin’s obligations are thus effectively obligations of the Federal Republic. FMS-WM continues to be supervised by FMSA.
7
SoFFin’s purpose is to stabilize the German financial sector by extending liquidity guarantees, providing equity capital, assuming risk positions, and setting up wind-up institutions. To this end, SoFFin has been authorized by the German legislature under Section 6 of the FMStFG to extend liquidity guarantees in a total aggregate amount of up to EUR 400 billion. In addition, Section 9 of the FMStFG authorizes the German Federal Ministry of Finance to incur debt in a total aggregate amount of up to EUR 80 billion to cover the cost of measures taken by SoFFin in connection with the provision of equity capital, the assumption of risk positions and the compensation of losses of wind-up institutions. Specifically, the authorization permits the German Federal Ministry of Finance to incur debt up to an amount of EUR 40 billion. Subject to the approval of the parliamentary control panel for financial market stabilization which is comprised of nine members of the budget committee of the German Bundestag, this amount can be increased by up to another EUR 30 billion and, subject to the approval of the budget committee of the German Bundestag, by up to another EUR 10 billion. Any financing required by SoFFin is obtained in the manner used by the Federal Republic to finance itself, i.e., through the issuance of debt instruments by the Federal Republic of Germany – Finance Agency (Bundesrepublik Deutschland – Finanzagentur GmbH). When the Federal Republic incurs debt for SoFFin it results in an increase in the net borrowings and debt of the Federal Republic. Applications for stabilization measures extended by SoFFin could initially be made only until the end of 2010. As a consequence of developments in the euro area, however, the German Federal Government subsequently re-opened the application period, which finally expired at the end of 2015. The timing of the expiration of SoFFin’s mandate to accept new applications for support measures coincided with the assumption by the European Single Resolution Board at the beginning of 2016 of responsibility for resolving and restructuring non-viable systemically important banks.
Guarantee
With effect from January 1, 2014, Section 8a of the FMStFG, which deals with the establishment of wind-up institutions, was amended to provide that SoFFin guarantees all existing and future obligations of FMS-WM with respect to moneys, debt securities and derivative transactions as well as obligations of third parties that are expressly guaranteed by FMS-WM, which FMS-WM has borrowed, issued, entered into or incurred or which have been transferred to FMS-WM during the time period for which SoFFin is the sole obligor of the loss compensation obligation (alleiniger Verlustausgleichspflichtiger). For a description of SoFFin’s loss compensation obligation, see “—Loss Compensation and Liquidity Support Obligations” below. Accordingly, under the guarantee, if FMS-WM fails to make any payment of principal or interest or any other amount required to be paid with respect to securities issued by it when that payment is due and payable, SoFFin will be liable for that payment as and when it becomes due and payable, provided that the security was issued during the time period for which SoFFin was the sole obligor of the loss compensation obligation. SoFFin’s obligation under the guarantee ranks equally, without any preference, with all of its other present and future unsecured and unsubordinated indebtedness. Holders of securities issued by FMS-WM may enforce this obligation directly against SoFFin without first having to take legal action against FMS-WM. If SoFFin fails to make any payment of principal or interest or any other amount required to be paid with respect to securities issued by FMS-WM when that payment is due and payable under the guarantee, the Federal Republic will be liable for that payment as and when it becomes due and payable pursuant to Section 5 of the FMStFG, as described above. The guarantee and the Federal Republic’s direct liability for SoFFin’s obligations pursuant to Section 5 of the FMStFG are strictly a matter of statutory law and are not evidenced by any contract or instrument. Potential claims based on the guarantee and on Section 5 of the FMStFG may be subject to defenses available to FMS-WM and SoFFin with respect to the obligations covered.
Loss Compensation and Liquidity Support Obligations
Under FMS-WM’s charter, which was enacted pursuant to Section 8a of the FMStFG, SoFFin is obligated to cover all losses sustained by FMS-WM and to ensure that FMS-WM is able to pay all its liabilities at all times when due and in full. As described above, pursuant to Section 5 of the FMStFG, the Federal Republic is directly liable for SoFFin’s obligations. Accordingly, SoFFin’s loss compensation and liquidity support obligations enable FMS-WM to pursue its operations and effectively mean that FMS-WM’s obligations, including the obligations to holders of debt securities issued by FMS-WM, are backed by the full faith and credit of the Federal Republic.
For the year ended December 31, 2017, SoFFin recorded a profit of EUR 1,456.7 million (2016: profit of EUR 98.6 million), largely due to the significant increase in other operating income primarily due to the write-up of the participation in Commerzbank AG in the amount of EUR 1,027.1 million and the revenue generated from the release of accruals with respect to its compensation obligations towards FMS-WM in the amount of EUR 634.6 million. As of December 31, 2017, the total outstanding stabilization measures provided by SoFFin amounted to EUR 14.6 billion, which related entirely to equity capital (December 31, 2016: EUR 14.6 billion).
Relationship with FMSA
FMS-WM operates under the supervision and control of the Federal Republic, which is exercised through FMSA. FMSA was established to manage SoFFin and to implement and monitor the stabilization measures extended by SoFFin. FMSA has the power to create wind-up institutions under Section 8a of FMStFG. In the course of the reorganization (see “—Reorganization of FMSA”),
8
FMSA was integrated into the Federal Republic of Germany – Finance Agency (Bundesrepublik Deutschland – Finanzagentur GmbH) which, in turn, is under the supervision of the German Federal Ministry of Finance (Bundesfinanzministerium). This structure ensures that FMSA acts in the public interest. In particular, the German Federal Ministry of Finance supervises FMSA’s activities and nominates the members of FMSA’s management committee (Leitungsausschuss). Certain decision-making powers have been delegated to the management committee by the FMStFG. In particular, the management committee manages FMSA and supervises its employees.
FMSA appoints the members of FMS-WM’s Supervisory Board. The Supervisory Board members, in turn, appoint the members of FMS-WM’s Executive Board. Both the Supervisory Board and FMSA may dismiss a member of the Executive Board for good cause.
FMSA is responsible for the legal supervision of FMS-WM. In particular, FMSA has to approve and supervise FMS-WM’s implementation of the winding-up plan as well as any deviations from, or amendments to, the winding-up plan. FMSA may give instructions to FMS-WM’s Executive Board and Supervisory Board in order to ensure that FMS-WM complies with applicable law and the requirements of its charter. Comprehensive reporting obligations by FMS-WM ensure that FMSA has a solid basis for exercising its control and instruction rights.
In keeping with its supervisory role, FMSA action is required for the dissolution of FMS-WM. While there is no set maximum duration for FMS-WM’s existence, FMS-WM’s charter provides that FMS-WM shall exist only until the transferred risk positions and non-strategic assets/businesses have been liquidated in full, at which point it is obligated to notify FMSA. FMSA may initiate the final dissolution process for FMS-WM if it has no remaining liabilities or if SoFFin has assumed any remaining liabilities. Any assets or profits remaining at the time of dissolution will be transferred to SoFFin.
Reorganization of FMSA
In December 2016, the German parliament passed a law for the reorganization of FMSA, under which Germany’s national resolution authority was integrated into the Federal Financial Supervisory Authority (Bundesanstalt für Finanzdienstleistungsaufsicht) and FMSA was integrated into the Federal Republic of Germany – Finance Agency (Bundesrepublik Deutschland – Finanzagentur GmbH). The administration and management of SoFFin, for which FMSA was initially responsible, was assumed by the Federal Republic of Germany – Finance Agency while FMSA remains responsible for the German wind-up institutions FMS-WM and Erste Abwicklungsanstalt. The reorganization was completed with effect as of January 1, 2018.
Accordingly, the reorganization of FMSA entails certain changes in the supervision of FMSA and the administration of SoFFin. However, the legal relationship between FMS-WM and each of SoFFin and FMSA, and therefore the Federal Republic, remains unchanged.
9
BUSINESS AND OPERATIONS
Introduction
FMS-WM is tasked with unwinding the portfolio of risk positions and non-strategic assets/businesses that it assumed on October 1, 2010 from the HRE Group in ways that maximize its value. As described in more detail under “—The Portfolio—Outsourced Portfolio Administration,” FMS-Wertmanagement Service GmbH (“FMS-WM Service”), a wholly owned subsidiary of FMS-WM, performs portfolio management services for FMS-WM. Plans to privatize FMS-WM Service were cancelled in May 2015.
FMS-WM’s activities are characterized by the following strategic goals:
| | • | | Unwinding of the risk assets aimed at maximizing their value: FMS-WM aims to unwind the risk assets in a manner that maximizes their value, subject to defined wind-up and risk strategies that are adjusted on a continuous basis. The winding-up plan—which is the key strategic management tool of FMS-WM—serves as the basis for the implementation of its portfolio liquidation operations. Depending on the market situation and the asset category, the winding-up plan provides for the following strategies in connection with liquidating the portfolio assumed by FMS-WM: |
| | – | | Holding assets, which includes active management of loans and securities with a view to repaying outstanding amounts (e.g., where the risk/return profile is acceptable). |
| | – | | Selling assets to the extent it makes economic sense (e.g., to reduce positions with a higher risk profile and when market opportunities arise). |
| | – | | Restructuring, including workout, wind-up and reorganization measures, relating to both performing and non-performing financial instruments, particularly in the Infrastructure and Commercial Real Estate segments, with a view to maximizing the value of the liquidation measure related to the financial instrument (including by reducing risk). |
| | • | | Cost-effective servicing and management of the risk assets: The unwinding of the risk assets is carried out in part by FMS-WM itself and in part by FMS-WM Service as portfolio servicer. FMS-WM remains solely responsible for the unwinding aimed at maximizing value and the cost-effective servicing and management of the portfolio. |
| | • | | Cost-effective funding and separate market access for FMS-WM: FMS-WM seeks to ensure cost-effective funding for the purpose of carrying out its mandate. Given its backing by the full faith and credit of the Federal Republic, FMS-WM is able to realize funding cost advantages that are not available to the HRE Group. |
In order to achieve its mandate of unwinding the portfolio of risk positions and non-strategic assets/businesses assumed from the HRE Group, FMS-WM may engage in all kinds of banking and financial services transactions and all other transactions that directly or indirectly serve its purposes. FMS-WM is, however, neither a financial institution nor a financial services institution within the meaning of the KWG, nor a financial service provider within the meaning of the WpHG, nor an insurance company within the meaning of the VAG. FMS-WM is also prohibited from engaging in transactions that would require a license under the European Union Banking Directive (2006/48/EC) or the European Union Directive on markets for financial instruments (2004/39/EC).
The Portfolio
FMS-WM assumed a portfolio of risk positions and non-strategic assets/businesses in an original amount of EUR 175.7 billion (nominal volume) from the HRE Group on October 1, 2010. As of December 31, 2017, FMS-WM had liquidated approximately EUR 100.2 billion (including the Portfolio Extensions, but excluding foreign currency effects) (December 31, 2016: EUR 92.7 billion) of its initial portfolio of EUR 175.7 billion, resulting in a nominal value of the aggregate portfolio of EUR 76.8 billion as of December 31, 2017.
As of December 31, 2017, FMS-WM’s portfolio (including the Portfolio Extensions) encompassed 1,923 individual exposures (December 31, 2016: 2,097) with 915 different counterparties (December 31, 2016: 986) and a significant amount of derivatives. The individual exposures are located in 48 countries and denominated in 14 currencies. Geographically, the greatest concentrations are in Italy, the United Kingdom, the United States, Spain, Canada and Germany. Less than half (45%) of the exposures in the portfolio are denominated in euro, approximately a third (31%) in U.S. dollars and approximately 18% in British pounds sterling. The portfolio is highly complex and diverse and consists of a particularly high proportion of illiquid exposures with extremely long maturities. To the extent that a legal transfer of risk assets could not be effected as of October 1, 2010 (for example, due to outstanding consent
10
requirements), economic ownership of such risk positions was transferred synthetically to FMS-WM (for example, through subparticipations or guarantees). FMS-WM is currently working on the physical and legal transfer of these risk positions that to date have only been transferred synthetically from the HRE Group to FMS-WM, and exposures relating to synthetically transferred receivables and derivatives still awaiting novation were significantly reduced in fiscal year 2017.
For purposes of risk management and the wind-up reports that FMS-WM submits to FMSA on a monthly basis in accordance with the winding-up plan, FMS-WM has classified the portfolio into four segments: Public Sector, Structured Products, Infrastructure and Commercial Real Estate. The segments in turn were broken down into 28 wind-up clusters as of December 31, 2017. The assets of all four segments include syndicated loans.
The Depfa Group
On December 19, 2014, FMS-WM acquired all shares in Depfa for a purchase price of EUR 320 million (excluding incidental acquisition expenses). In doing so, FMS-WM implemented the decision of May 13, 2014 by the Federal Government’s inter-ministerial steering committee, which, after considering all options, decided to unwind Depfa and its subsidiaries (“Depfa Group”) via FMS-WM. The Depfa Group is managed as an independent equity investment. FMS-WM appoints all three members of the Executive Board as non-executive members to Depfa’s board of directors. The Depfa Group’s portfolio consists mostly of positions with investment grade issuer ratings. In fiscal year 2015, FMS-WM was forced to write down the book value of its equity investment in the Depfa Group by EUR 83 million due to persistently low interest rates and higher expenses related to increased regulatory compliance obligations. Given the positive performance of the Depfa Group in fiscal years 2016 and 2017, and the resulting improvement in amounts budgeted for subsequent years, the equity investment no longer had to be considered impaired. Its book value was, therefore, revaluated up to its original cost of EUR 323 million at the end of fiscal year 2017. As of December 31, 2017, Depfa’s consolidated financial statements recognized total assets of EUR 18.6 billion, a decrease of 62% since the acquisition of the Depfa Group in December 2014.
On January 19, 2016, FMS-WM announced its intention to buy back certain securities of the Depfa Group denominated in euros, Swiss francs, U.S. dollars and Canadian dollars with a total issue volume of around EUR 3.3 billion. In the context of this public tender offer, FMS-WM purchased EUR 2.6 billion securities, or approximately 79% of the outstanding nominal amount. In addition to this public tender offer, FMS-WM also regularly acquires other bonds and registered securities issued by the Depfa Group on the capital market, when and to the extent market conditions allow. In total, FMS-WM acquired Depfa Group liabilities with a nominal value of EUR 8.0 billion in fiscal years 2016 and 2017. With the aim of ensuring that the Depfa Group is wound up in a way that maximizes its value, the acquired Depfa liabilities were subsequently sold to the Depfa Group by way of asset liability management transactions. In return, FMS-WM purchased assets from Depfa’s cover pools.
On November 4, 2016, FMS-WM sold EUR 4.9 billion of the repurchased Depfa Group liabilities to Depfa and in return acquired assets from Depfa’s cover pools with a nominal volume of EUR 5.2 billion. In a second transaction on November 6, 2017, FMS-WM sold EUR 2.0 billion of the repurchased Depfa Group liabilities to Depfa and, again, acquired assets from Depfa’s cover pools with a nominal volume of EUR 2.0 billion in return. These two transactions, referred to herein as the “Portfolio Extensions,” complied with applicable regulatory and legal requirements and each individual security was transferred at market value. In total, 327 exposures were transferred from the Depfa Group to FMS-WM in the course of the two transactions. They consist primarily of receivables and securities attributable to the portfolio’s Public Sector and Structured Products segments. Receivables from borrowers in the United States account for almost 50% of the acquired exposures’ nominal volume.
In November 2017, FMS-WM announced that it would continue to purchase Depfa Group liabilities on market terms. Third-party investors still hold EUR 0.8 billion in Depfa Group Pfandbrief securities with maturity dates from 2020 onwards. Between the asset liability management transaction in November 2017 and the end of March 2018, further investors sold their holdings to FMS-WM in response to the increasing illiquidity of Depfa Group liabilities. At the same time, the Depfa Group intends to limit the expense of having its liabilities rated to the bare minimum and where possible terminate further rating contracts. This will reduce the tradability of Depfa Group liabilities further. In June 2018, FMS-WM announced it intends to let its current program for the purchase of certain Depfa Group liabilities expire. Based on the current progress in the wind down of the Depfa Group, FMS-WM is evaluating the benefits of selling Depfa Group, or parts of it, and/or the benefits of reducing the amount of capital within the Depfa Group.
Outsourced Portfolio Administration
Until September 30, 2013, the HRE Group served as an outside administrator of the portfolio transferred to FMS-WM. The work outsourced to the HRE Group pursuant to a cooperation agreement between FMS-WM and Deutsche Pfandbriefbank AG (“PBB”), the core financial institution of the HRE Group, included many of the administrative activities in connection with the portfolio assumed and, as of December 31, 2012, approximately 500 employees of the HRE Group were working for FMS-WM in connection with portfolio servicing at a cost of approximately EUR 21 million per month.
11
As the transfer of risk positions and non-strategic assets/businesses from the HRE Group to FMS-WM could be viewed as state aid, the transfer had to be approved by the European Commission. In this context, the Federal Republic committed to ensure that, after September 30, 2013, the HRE Group would provide neither asset management services nor refinancing services for FMS-WM and that, from an organizational point of view, those services can be assumed by third parties. Pursuant to this commitment, the cooperation agreement with PBB has been terminated with effect as of September 30, 2013.
Since October 1, 2013, FMS-WM Service, a service entity established by FMS-WM in April 2012, has been tasked with the full set of portfolio management services and operations services including collateral management, settlement functions and credit operations, while FMS-WM retains final decision-making powers and ultimate responsibility for the risk assets under management. The master agreement governing the outsourcing of business processes and services also grants FMS-WM extensive rights to obtain information and perform inspections, enabling it to monitor and control the servicing of the risk assets by FMS-WM Service. Further, IBM Deutschland GmbH has assumed the provision of comprehensive information technology services as of October 1, 2013, and additional third-party service providers perform regulatory reporting and financial administration functions.
FMS-WM’s Segments
As described above, FMS-WM’s portfolio is grouped into four segments: Public Sector, Structured Products, Infrastructure and Commercial Real Estate.
Portfolio data presented in the following include the additions from the Portfolio Extensions.
Public Sector
As of December 31, 2017, the Public Sector segment held assets with an aggregate nominal value of EUR 40.6 billion, accounting for approximately 52.9% of FMS-WM’s overall portfolio (December 31, 2016: EUR 44.3 billion). As of the same date, the portfolio in this segment encompassed 966 exposures (December 31, 2016: 927) with 421 counterparties (December 31, 2016: 417).
The borrowers and issuers of the securities held by the Public Sector segment are state and regional governments, municipalities, public law entities and semi-public companies. European Union member states account for the majority of the portfolio, with Italy representing 49.7% of the portfolio’s aggregate nominal value as of December 31, 2017. The Portfolio Extensions increased the volume in the Public Sector segment by a nominal EUR 2.8 billion as of year-end 2017.
FMS-WM is working to improve its position in the medium and long term. To that end, FMS-WM negotiates directly with the issuers of the bonds or the counterparties of hedging transactions with the aim of unwinding, simplifying or untangling complex coupon or derivatives structures.
The ratings breakdown of the Public Sector segment’s portfolio has remained stable relative to the volume unwound in fiscal year 2017, as presented in the following table, which is based on FMS-WM’s internal ratings categories (for information on the corresponding Standard & Poor’s ratings categories, see footnotes to the table).
BREAKDOWNOF PUBLIC SECTOR PORTFOLIOBY RATINGS CATEGORY
| | | | | | | | |
| | | December 31, 2016 | | | December 31, 2017 | |
| | | (unaudited) | |
| | | (in € billion) | |
IR 1 – 7(1) | | | 17.3 | | | | 16.4 | |
IR 8 – 10(2) | | | 24.4 | | | | 21.5 | |
IR 11 – 13(3) | | | 2.5 | | | | 2.5 | |
IR 14 – 22(4) | | | 0.0 | | | | 0.0 | |
IR 23 – 27(5) | | | — | | | | — | |
IR 28 – 30(6) | | | 0.0 | | | | 0.0 | |
| | | | | | | | |
Total | | | 44.3 | | | | 40.6 | |
| | | | | | | | |
| (1) | Corresponds to S&P’s ratings categories AAA to A-. |
| (2) | Corresponds to S&P’s ratings categories BBB+ to BBB-. |
| (3) | Corresponds to S&P’s ratings categories BB+ to BB-. |
| (4) | Corresponds to S&P’s ratings categories B+ to B-. |
| (5) | Corresponds to S&P’s ratings categories CCC+ to CCC-. |
| (6) | Corresponds to S&P’s ratings category D. |
12
In October 2016, FMS-WM accepted the offer by the Austrian State of Carinthia in co-operation with the Austrian Government as regards eligible liabilities of HETA ASSET RESOLUTION AG (“HETA”) (bonds issued by Hypo Alpe Adria, which was nationalized in 2009) (the “HETA Bonds”) to exchange the HETA Bonds for securities from the Carinthian Compensation Fund. The HETA Bonds had been subject to a payment moratorium since May 2015. Following its acceptance of the exchange offer, FMS-WM withdrew from the litigation it had initiated in response to the moratorium. As of today, FMS-WM holds no more exposure related to HETA.
Structured Products
As of December 31, 2017, the Structured Products segment comprised assets with an aggregate nominal value of EUR 24.1 billion, accounting for 31.0% of FMS-WM’s overall portfolio (December 31, 2016: EUR 30.0 billion). As of the same date, the portfolio in this segment encompassed 473 exposures (December 31, 2016: 541) with 244 counterparties (December 31, 2016: 280). The Portfolio Extensions increased the nominal volume of the segment by EUR 3.2 billion at year-end 2017.
The Structured Products segment includes practically all types of structured credit instruments from asset-backed securities (“ABS”), commercial and residential mortgage-backed securities (“CMBS” or “RMBS”) or collateralized debt obligations (“CDO”) to exotic interest, inflation and credit derivatives. More than a third of the structured securities in FMS-WM’s portfolio are based on government-guaranteed student loans in the United States.
The following chart reflects the proportion of the various asset classes in the Structured Products segment.
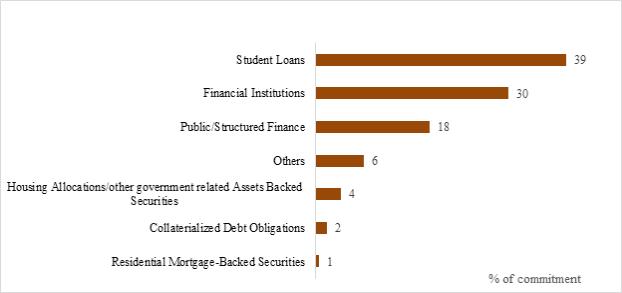
Forced sales of the exposures may be possible only at substantial discounts, due to, among other reasons, changed market conditions, sharp cuts in external ratings and the poor quality of the assets that serve as collateral for these securities. A hold strategy often is the best option for preventing losses on sales because most structured products are highly illiquid securities, i.e., they are rarely traded in the market. The objective of the portfolio managers is to improve or, where possible, unwind complex structures that are disadvantageous from FMS-WM’s perspective.
Infrastructure
As of December 31, 2017, the Infrastructure segment comprised assets with an aggregate nominal value of EUR 10.1 billion, accounting for approximately 13% of FMS-WM’s overall portfolio (December 31, 2016: EUR 11.4 billion). As of the same date, the portfolio in this segment encompassed 304 exposures (December 31, 2016: 338) with 160 counterparties (December 31, 2016: 170). Syndicated loans make up 33% and securities 67% of the portfolio.
13
The exposures in the Infrastructure segment’s portfolio are spread across all five continents, with a focus on the United Kingdom, which makes up 62% of the portfolio’s aggregate nominal value as of December 31, 2017. These exposures encompass corporate loans and securities, project financing, acquisition funding and asset-based loans. The financed properties include regulated utilities (42%), social infrastructure (22%), toll roads (12%), non-road transportation infrastructure (7%), airports and ports (7%), power/energy infrastructure (6%), environmental water/waste infrastructure (3%) and asset finance and others (1%). In fiscal year 2017, the largest repayments related to loans for an Australian infrastructure project, for a port company in North America and an international multi-storey car park operator.
Most of the loans in this segment have very long maturities and were closed at margins that are substantially below current market levels because many borrowers were either government or government-sponsored entities or are structures to which the public sector is a party in some other way, for instance as the entity that procures products and services. Furthermore, it is difficult to sell or prematurely repay individual exposures or entire sub-portfolios because the assumptions that were made at the time of entering into the exposures in many of these projects with respect to the degree of utilization or occupancy have in the meantime turned out to be too optimistic.
In view of the complexity of the portfolio held by this segment, the segment’s activities focus on restructuring individual transactions to improve the chances of effecting a subsequent redemption, (partial) settlement by a third party or subsequent sale.
Commercial Real Estate
As of December 31, 2017, the Commercial Real Estate segment comprised assets with an aggregate nominal value of EUR 2.0 billion (December 31, 2016: EUR 3.1 billion), accounting for 2.6% of FMS-WM’s overall portfolio. As of the same date, the portfolio in this segment encompassed 180 exposures (December 31, 2016: 291) with 92 counterparties (December 31, 2016: 121).
The exposures in the Commercial Real Estate segment’s portfolio are concentrated primarily in Germany and the United Kingdom, which make up 33% and 25%, respectively, of the portfolio’s aggregate nominal value as of December 31, 2017. Loans secured by mortgages on commercial real estate account for the majority of the global portfolio managed by the Commercial Real Estate segment. The properties financed include office properties (27%), shopping centers (retail) (14%), mixed use (10%), residential properties (6%), hotels (3%), industrial/logistics (1%) and others (39%).
FMS-WM’s Commercial Real Estate segment is managed by FMS-WM’s Commercial Real Estate unit. The standard wind-up strategies of the segment are to “hold,” “restructure” and “sell.” The restructuring strategy approach is pursued when it becomes evident that a borrower cannot repay the loan upon maturity. The objective here is to stabilize the exposure and thus improve the outlook for later repayment or sale of the loan or collateral.
In some cases, FMS-WM carries out foreclosures to enforce claims. In very rare cases, rescue acquisitions are made in which FMS-WM takes over a financed property with the aim of selling it again as quickly as possible after further restructuring. The principle of maximizing value remains of the utmost importance in this case as well.
A major part of the unwinding of the Commercial Real Estate segment’s portfolio is expected to be completed by 2020.
Unwinding the Portfolio
The portfolio assumed by FMS-WM is managed and liquidated in accordance with its winding-up plan, which describes the wind-up measures FMS-WM intends to take and includes a timeline for liquidation measures relating to the risk positions and non-strategic assets/businesses. The winding-up plan is proposed by FMS-WM’s Executive Board and adopted by the Supervisory Board. In accordance with its charter, FMS-WM submits monthly reports to FMSA, which include information on the process of recovery and liquidation under the winding-up plan. In its supervisory capacity, FMSA has the right to request changes to the winding-up plan and approves and supervises FMS-WM’s implementation of the winding-up plan as well as any deviations from, or amendments to, the winding-up plan. FMS-WM monitors prevailing market conditions on an ongoing basis to determine whether the winding-up plan needs to be adapted.
The winding-up plan has been designed with a view to ensuring that FMS-WM at all times has sufficient liquidity to cover its three-month liquidity requirements under stress scenario assumptions over the entire wind-up period, independently of SoFFin’s duty to provide liquidity to FMS-WM and to offset losses incurred by it. It also provides that, in principle, FMS-WM may not engage in new business with the exception of refinancing and hedging transactions and selected new business that reduces portfolio risks in a cost efficient manner (e.g., prolongations as well as selective restructuring measures).
14
The process of selling individual assets follows detailed, fixed instructions. For instance, a sale has to be based on offers from several bidders and deviations from this process are only permitted under special circumstances. The sales process aims to ensure verification and documentation that bids reflect market prices.
In addition to actively reducing the portfolio volume, an important goal for the successful management of the portfolio is the improvement of the quality of the portfolio’s structure, which FMS-WM strives to achieve by restructuring loan exposures, securities holdings and derivative positions. In this way, FMS-WM substantially improved the medium to long-term prospects for the realization of numerous exposures in fiscal year 2017, for example through intensive negotiations with borrowers, consortium members and issuers. Such successfully implemented restructuring measures have the effect of reducing the portfolio’s complexity and risk.
The unwinding of FMS-WM’s portfolio in fiscal year 2017 reflected the wind-up of the portfolio transferred from the HRE Group to FMS-WM in 2010, the Portfolio Extensions, as well as the wind-up of the latter by the balance sheet date. In connection with the Portfolio Extensions, FMS-WM has acquired risk positions with an aggregate nominal volume of EUR 7.2 billion. As of December 31, 2017, FMS-WM’s aggregate portfolio stood at EUR 76.8 billion (December 31, 2016: EUR 88.9 billion). This corresponds to a wind-up of EUR 100.2 billion (excluding foreign currency effects), or 57.0%, since October 1, 2010.
Taking into account the Portfolio Extension, in fiscal year 2017 the portfolio was reduced (before currency effects) by EUR 8.1 billion (2016: EUR 4.6 billion) which was positively impacted by currency effects of EUR –4.0 billion (2016: EUR –1.2 billion). Excluding the effects of the Portfolio Extension in 2017, portfolio wind-up before foreign currency effects in fiscal year 2017 was EUR 10.0 billion (based on exchange rates as of December 31, 2016) or EUR 14.0 billion taking foreign currency effects into account (2016: EUR 11.1 billion).
The following table shows the portfolio development in fiscal year 2017 (taking into account the Portfolio Extensions) and the reconciliation of the nominal value of the portfolio excluding derivatives from the transfer date (October 1, 2010) to total assets as of December 31, 2016 and 2017 (translated at exchange rates as of December 31, 2016 and 2017, respectively):
| | | | | | | | |
| | | As of December 31, | |
| | | 2016 | | | 2017 | |
| | | (unaudited) | |
| | | (€ in billions) | |
Wind-up portfolio commitment as of October 1, 2010 | | | 175.7 | | | | 175.7 | |
– Portfolio wind-up | | | -92.7 | | | | -100.2 | |
+ Currency effects | | | +5.9 | | | | +1.3 | |
relating to the portfolio wind-up | | | +5.7 | | | | +1.6 | |
relating to the Portfolio Extension | | | +0.2 | | | | -0.3 | |
| | | | | | | | |
Wind-up portfolio commitment | | | 88.9 | | | | 76.8 | |
– Undrawn credit lines and guarantees | | | -0.7 | | | | -0.3 | |
+ Portfolio of own issues(1) | | | +22.8 | | | | +17.7 | |
+ Other receivables including portions thereof(2) | | | +66.2 | | | | +63.1 | |
| | | | | | | | |
Total assets | | | 177.2 | | | | 157.3 | |
| | | | | | | | |
| (1) | Nominal value before accrued interest. |
| (2) | Mainly contains the cash collateral for derivatives, amortized cost of derivatives taken over, receivables from liquidity facilities used, current credit balances and accrued interest. |
Based on nominal values broken down by segment and taking the Portfolio Extensions into account, the portfolio was reduced as follows from October 1, 2010 to December 31, 2017 (translated at exchange rates as of December 31, 2017):
| | | | | | | | | | | | | | | | |
| | | October 1, 2010 | | | Portfolio wind-up | | | Currency effects | | | December 31, 2017 | |
| | | (unaudited) | |
| | | (€ in billions) | |
Public Sector | | | 86.6 | | | | -45.8 | | | | -0.2 | | | | 40.6 | |
Structured Products | | | 43.9 | | | | -21.6 | | | | +1.8 | | | | 24.1 | |
Infrastructure | | | 18.0 | | | | -7.6 | | | | -0.3 | | | | 10.1 | |
Commercial Real Estate | | | 27.2 | | | | -25.2 | | | | +0.0 | | | | 2.0 | |
| | | | | | | | | | | | | | | | |
Total | | | 175.7 | | | | –100.2 | | | | +1.3 | | | | 76.8 | |
| | | | | | | | | | | | | | | | |
15
The following table shows the remaining maturities of the assets broken down by segments as of December 31, 2017:
| | | | | | | | | | | | | | | | | | | | | | | | |
| | | Until 2017 | | | 2018–2020 | | | 2021–2030 | | | 2031–2040 | | | After 2040 | | | Total | |
| | | (unaudited) | |
| | | (€ in billions) | |
Public Sector | | | 0.0 | | | | 4.4 | | | | 9.7 | | | | 19.3 | | | | 7.1 | | | | 40.6 | |
Structured Products | | | — | | | | 1.4 | | | | 8.0 | | | | 8.5 | | | | 6.2 | | | | 24.1 | |
Infrastructure | | | 0.0 | | | | 0.1 | | | | 1.6 | | | | 2.6 | | | | 5.7 | | | | 10.1 | |
Commercial Real Estate | | | 0.7 | | | | 0.9 | | | | 0.4 | | | | 0.1 | | | | 0.0 | | | | 2.0 | |
| | | | | | | | | | | | | | | | | | | | | | | | |
Total(1) | | | 0.7 | | | | 6.8 | | | | 19.7 | | | | 30.5 | | | | 19.0 | | | | 76.8 | |
| | | | | | | | | | | | | | | | | | | | | | | | |
| (1) | Figures may not add up due to rounding. |
Exposure to Troubled Sovereigns and Concentration Risks
The portfolio of FMS-WM contains several significant concentration risks, including those in sovereign debt exposures, which are vulnerable to macroeconomic or systemic risks and can cause significant losses in FMS-WM’s portfolio. In particular, there are significant concentrations in the portfolio related to Italy and Spain (together with Portugal, Greece and Ireland, the “peripheral euro area countries”), especially in the Public Sector segment. As of December 31, 2017, Italy comprised an important part of FMS-WM’s exposures at default (“EaD”), accounting for EUR 26.0 billion, representing approximately 24% of FMS-WM’s total EaD (December 31, 2016: EUR 28.4 billion). FMS-WM completely closed its position in Greek securities in the first half of 2016. For more information on the breakdown of FMS-WM’s credit portfolio by countries and regions, see “—Risk Report—Credit Risk—Risk Position—Breakdown of Credit Portfolio by Countries and Regions.”
The following table shows a breakdown of FMS-WM’s EaD by sector for bonds, loans and customer and credit derivatives concerning Italy, Spain, Portugal, Cyprus and Ireland, including information on related microhedges, as of December 31, 2017.
| | | | | | | | | | | | | | | | | | | | | | | | |
| | | Exposure at Default – Bonds & Loans per Sector | | | | | | Microhedges(2) | |
Country(1) | | Gross
sovereign | | | Other
public
borrowers | | | Financial
institutions | | | Non-financial
corporations | | | Total EaD per
country | | | Additional (negative)
MtM of Microhedges | |
| | | (unaudited) | |
| | | (€ in billions) | |
Italy | | | 22.6 | | | | 2.5 | | | | 0.2 | | | | 1.6 | | | | 26.9 | | | | 8.1 | |
Spain | | | 0.9 | | | | 2.1 | | | | 0.2 | | | | 0.8 | | | | 4.0 | | | | 0.5 | |
Portugal | | | 0.9 | | | | 0.1 | | | | 0.0 | | | | 0.5 | | | | 1.4 | | | | 0.2 | |
Cyprus | | | 0.0 | | | | 0.0 | | | | 0.0 | | | | 0.0 | | | | 0.0 | | | | 0.0 | |
Ireland | | | 0.0 | | | | 0.1 | | | | 0.0 | | | | 0.1 | | | | 0.2 | | | | 0.0 | |
| | | | | | | | | | | | | | | | | | | | | | | | |
Total(3) | | | 24.4 | | | | 4.8 | | | | 0.4 | | | | 3.0 | | | | 32.5 | | | | 8.8 | |
| | | | | | | | | | | | | | | | | | | | | | | | |
| (1) | The allocation is based on the country of the economic risk (e.g., location of the collateral), which may be different from the legal domicile of the debtor/issuer in individual cases. |
| (2) | The EaD definition applied by FMS-WM already accounts for negative mark-to-market (“MtM”) values of microhedges as of the date of the asset transfer from the HRE Group in October 2010. In order to avoid redundancies, only the current negative mark-to-market values of microhedge instruments to the extent that they exceed their October 2010 values are included in this table. |
| (3) | Figures may not add up due to rounding. |
Treasury
FMS-WM engages in funding activities, including the issuing of debt securities and/or obtaining financing from financial institutions, in order to refinance funding instruments associated with the assumed portfolio as they expire. FMS-WM will have to engage in refinancing activities until its portfolio has been liquidated. FMS-WM monitors its financing needs and liquidity requirements by means of a liquidity management system similar to the ones used by financial institutions. FMS-WM seeks to ensure that it has sufficient liquidity to cover its three-month liquidity requirements under stress scenario assumptions at all times.
The Group Treasury unit’s core tasks are funding and liquidity management as well as the management of interest rate and foreign exchange risks. In addition, FMS-WM’s Group Treasury unit is responsible for improving FMS-WM’s funding structure on an ongoing basis with the aim of generating positive contributions to FMS-WM’s earnings.
16
Funding management’s main task is to raise long-term funds in the international capital markets. Maturities typically range from one to ten years, with the majority of bonds having a tenor of three to five years. In fiscal year 2017, FMS-WM successfully raised EUR 19.3 billion via the capital markets (2016: EUR 15.8 billion). In this context, the share of funding with an initial maturity of more than one year, as of December 31, 2017, accounted for approximately 56% of the aggregate funding volume (December 31, 2016: 47%). As a result, FMS-WM was able to maintain a balanced ratio between short- and long-term funding across all currencies in fiscal year 2017. As of December 31, 2017, FMS-WM reported a total outstanding capital market funding of approximately EUR 65.2 billion with an average remaining maturity of around 2.5 years.
FMS-WM’s bonds are being offered in a broad range of formats, including benchmark format, non-benchmark public format and private placements as well as in different currencies, primarily the euro, pound sterling and U.S. dollar, in order to fund the wind-up portfolio at matching currencies. The focus of FMS-WM’s issuance activities in fiscal year 2017 was on the euro, followed by the U.S. dollar and pound sterling and also included obtaining U.S. dollar funding on the U.S. capital market through its issuance program in global format established in the United States. FMS-WM successfully raised a total of USD 3.5 billion through two U.S. dollar benchmark issues with maturities of three and five years, respectively.
As part of its short-term liquidity management, FMS-WM utilizes instruments with maturities of up to one year. In fiscal year 2017, FMS-WM’s issuing activity under its existing money market programs, namely the European Commercial Paper/Certificates of Deposit Program (“ECP/CD Program”) and the U.S. Asset-Backed Commercial Paper Program (“U.S. ABCP Program”), further contributed to a stable and sustainable funding structure for FMS-WM. As of December 31, 2017, the ECP/CD Program had a volume of EUR 26.2 billion (December 31, 2016: EUR 31.7 billion), and the U.S. ABCP Program had a volume of EUR 9.3 billion (December 31, 2016: EUR 12.3 billion).
Interest rate and foreign exchange risks are managed in a centralized fashion on an income-oriented basis guided by a risk aversion policy within the limit system. The aim is to minimize the fluctuations in the fair value and profit/loss due to market risks. To this end, the Group Treasury unit enters into hedging transactions for individual exposures (micro hedges) or at the portfolio level (macro hedges).
17
CAPITALIZATION AND INDEBTEDNESS
The following table sets forth FMS-WM’s actual capitalization and indebtedness as of December 31, 2017.
| | | | |
| | | As of
December 31, 2017 | |
| | | audited | |
| | | (in € millions) | |
Debt | | | | |
Short-term debt | | | 5,632 | |
Bonds and notes | | | 107,719 | |
Loans and advances to bank and loans and advances to customers (not payable on demand) | | | 23,282 | |
Other borrowings and other liabilities | | | 19,255 | |
Equity | | | | |
Total equity | | | 1,400 | |
| | | | |
Total capitalization | | | 157,288 | |
| | | | |
18
ECONOMIC CONDITIONS AND MARKET DEVELOPMENTS
The following sections contain an overview of economic conditions and market developments, which affected the value of FMS-WM’s portfolio and its business in general in 2017.
Macroeconomic Developments
At the beginning of 2017, the global economy was expanding at only a modest pace. Private consumption, especially in the United States and United Kingdom, was depressed by the rise in prices. In contrast, the euro zone experienced a significant real-term rise in gross domestic product (GDP). However, global economic growth regained its momentum in the second and third quarters. A key factor in the more stable global economy was the fact that the upturn gained increasing geographic breadth compared to previous years. The stabilization of the commodity markets helped to ease the burdens of the global commodity sector and economies exporting commodities. Global industrial production and global trade recovered. Economic growth remained noticeably stronger than production potential in the euro zone in particular. As previously, energy and food were the key drivers of the price trend in the euro zone. This led to a sharp rise in prices at the start of the year, although this weakened as the year went on due to waning basis effects.
In the first three quarters of 2017, growth in the euro zone reached between 0.6% and 0.7%, slightly up on the same period in the previous year. The unemployment rate continued its positive development, falling to 8.8% in October 2017. The German economy grew at between 0.6% and 0.9% in the first three quarters of 2017 compared to between 0.3% and 0.6% in the previous year. Positive momentum came from both inside and outside Germany. In Italy, growth reached between 0.3% and 0.5% in the first three quarters of 2017 compared to 0.1% to 0.3% in the previous year. The robust recovery in the Spanish economy also continued. At the start of the year, inflation in the euro zone rose in line with the recovery in commodity prices, from 1.1% in December 2016 to 2.0% in February 2017, before falling to 1.3% in June 2017 due to waning basis effects from energy prices. Inflation remained stable, before rising slightly to 1.5% in November 2017. Although the Governing Council of the European Central Bank (“ECB”) maintained its expansive monetary policy, it reduced its bond purchases from EUR 80 billion per month to EUR 60 billion per month in April 2017 as decided at its meeting in December 2016. In November 2017, the Governing Council of the ECB (“ECB Governing Council”) announced that it would continue to make bond purchases of EUR 30 billion per month from January to September 2018. According to the Deutsche Bundesbank’s monthly report in May 2017, the ECB Governing Council will continue with its bond purchases beyond this period if necessary (and, in any case, until it detects a sustained correction in the inflation trend commensurate with its inflation target).
In the United States, growth weakened at the beginning of 2017 due to a slowdown in private consumption, while GDP rose by an annualized 1.2% in the first quarter of 2017 compared to 1.8% in the final quarter of the previous year. Economic momentum then ticked upwards again, with growth reaching just over 3% in each of the next two quarters. Inflation rose to 2.7% at the beginning of 2017 before cooling off again due to basis effects. The U.S. Federal Reserve continued to normalize its monetary policy and increased the benchmark interest rate by 25 basis points at a time in March, June and December 2017. In October 2017, the U.S. Federal Reserve announced that it would begin reducing its balance sheet and would no longer reinvest part of the principal of maturing bonds.
Economic growth in the United Kingdom has slowed, with growth reaching a subdued 0.3% to 0.4% in the first three quarters of 2017 compared to 0.6% at the end of the previous year. The expansion of the service industry softened, with gross value added even declining in some consumption-oriented sectors. Waning momentum of private consumption was accompanied by a loss of purchasing power. Inflation rates rose from 1.6% in December of the previous year to 3.1% in November 2017. The unemployment rate fell to 4.3% in October 2017, its lowest level since spring 1975. British Prime Minister Theresa May legally triggered the United Kingdom’s withdrawal from the EU on March 29, 2017 by giving written notice to the European Council in accordance with Article 50 of the Treaty on European Union. Britain is therefore expected to exit the EU in March 2019 in accordance with the two-year negotiation period set out in the Treaty. In June 2017, the United Kingdom held a snap election that resulted in a loss of the Conservative Party’s overall majority. The political and economy uncertainty triggered by this election result and the Brexit process remains significant.
Growth remained fairly stable in China, most recently recording a growth rate of 6.8%. Exports grew noticeably during the course of 2017. While economic growth in Brazil increased for the first time in two years, the economy is making slow progress. The macroeconomic recovery in Russia continued, albeit at a slightly restrained pace.
Commercial Real Estate
Developments in the real estate markets in which FMS-WM’s real estate collateral is located remained largely positive in 2017. The favorable domestic market environment was used to successfully continue with the unwinding of exposures. Geographically speaking, the remaining portfolio is now focused on German, U.K. and U.S. financing, as well as properties in Eastern Europe.
19
The aggregate transaction volume in the German commercial real estate financing market continued to be high in 2017. At around EUR 50 billion, investment turnover across all asset classes remained at a high level.
Based on the earnings potential of each asset class, investors preferred office properties followed by logistics and retail properties. Foreign investors were particularly interested in large-scale real estate investments in 2017, resulting in a supply shortage trend matched by rising market prices in this segment.
The U.K. market is still recovering from its Brexit-induced slump and in 2017 recorded a 37% year-on-year increase in investment volume. In comparison to 2016, transaction volume in the U.S. commercial real estate financing market fell by 16% to USD 224 billion in 2017. This decline in transaction activity was due to the mature investment cycle and caution among investors when selecting assets. Transaction activity in Central and Eastern European countries rose by a moderate rate of 3% in 2017 compared to 2016.
Infrastructure Markets
Global infrastructure transaction volume (including fund financing in addition to loans, bonds and equity) amounted to USD 337 billion in 2017, with the number of finalized infrastructure transactions reaching 2,529. While most transactions were carried out in Europe (935), the region with the highest volume was North America with USD 135 billion, ahead of Europe with USD 82 billion. As in previous years, renewable energy remained the most active sector.
The ECB’s sustained zero-interest monetary policy contributed to high demand for project financing. The low interest rate environment was also among the primary reasons for the high number of financing commitments in countries such as Spain, Italy and France.
Public Sector
Events in the capital markets were influenced by a fundamentally robust global economy and persistently supportive monetary policy from key central banks on the one hand and volatile political developments on the other. According to the Deutsche Bundesbank’s monthly report of May 2017, uncertainty in the markets rose temporarily, particularly in the run-up to the French presidential election held in spring 2017, leading to stronger demand for safe investments. However, this uncertainty decreased significantly once the election results were announced. The ECB Governing Council’s decision to continue its bond purchase program at a reduced level until at least September 2018 resulted in lower risk premiums on government bonds from peripheral euro zone countries and led to declining yields. The yield on ten-year German government bonds was confined to a relatively narrow trading range during 2017 and edged up slightly by the end of the year.
Spreads on French and Italian government bonds compared to German government bonds widened to their highest level in three years ahead of the French elections, but narrowed considerably after this time. Spreads on ten-year French bonds fell from more than 70 basis points to around 30 basis points by the end of 2017, significantly below the previous year’s level. Spreads on Italian bonds were practically unchanged from the start of the year at the end of 2017. While the outcome of the elections in France and the ECB’s bond purchases provided support, ongoing uncertainty surrounding the political situation in Italy weighed on the markets.
In Spain, continuing tensions over the Catalan independence movement placed a strain on the markets even though the economy continued its highly positive performance above the EU average. Nevertheless, risk premiums for Spanish bonds narrowed slightly overall during the course of the year. Portuguese bonds in particular saw spreads narrowing considerably during 2017, with positive economic development causing spreads to tighten significantly by the middle of the year. A ratings upgrade returned Portugal to investment grade status in autumn 2017, which led to another significant narrowing of spreads. One example of this is the spread to German government bonds, which began 2017 at around 400 basis points and fell to approximately 150 basis points by the end of the year. The open-ended nature of Brexit negotiations also added to the uncertainty. While this caused yields on British government bonds to be volatile during 2017, they ended the year at practically the same level as they began, at around 1.3%. In the United States, yields rose significantly on government bonds with maturities of less than ten years during 2017 due to the recovery in key interest rates. By contrast, yields on ten-year government bonds barely changed during the course of 2017. Real yields increased moderately while inflation expectations were lowered slightly.
20
Financial Institutions and Covered Bonds
The ECB’s policy of low interest rates and its bond purchase program further stabilized the markets at the beginning of 2017. The measures implemented in the banks’ balance sheets to unwind large holdings of non-performing loans during 2017 and the action taken with regard to crisis-hit banks in Italy (e.g., Banca Monte dei Paschi di Siena S.p.A.) calmed the markets considerably in this segment for the rest of the year, causing spreads to narrow significantly as a result.
Structured Products
U.S. Municipals
Investors in U.S. municipal bonds were rewarded with lower risk premiums in 2017. The credit quality of U.S. municipal bonds remained stable in 2017. Investment grade ratings continued to dominate this market.
For example, the pressure on Illinois was significantly reduced in the third quarter of 2017 after the state succeeded in approving a new budget in conjunction with a tax hike after two years without reaching agreement. Although the measures adopted initially helped and alleviated the pressure from ratings agencies, Illinois has yet to find a solution for its significantly underfunded pension system.
At almost USD 440 billion, the expected new issue volume of just over USD 400 billion was considerably exceeded in 2017. This was primarily due to high new issue activity in December 2017.
Asset-Backed Securities
In 2017, European asset-backed securities (“ABS”) performed well across all asset classes and even exceeded spread expectations at the start of the year. The issue volume of EUR 206 billion for 2017 fell short of estimates. Primary market placements slightly exceeded expectations at EUR 95 billion.
At the end of 2017, the new issue volume in the U.S. securitization markets totaled around USD 1.8 billion. Of this amount, pure ABS structures amounting to USD 220 billion to USD 230 billion were issued, significantly higher than the previous year’s level of USD 183 billion. The credit markets were stable in 2017. Risk premiums were tight in the U.S. securitization markets in general and for ABS in particular.
Liquidity in the FFELP ABS market (the U.S. Federal Family Education Loan Program) was significantly better in 2017 than in 2016. The market incorporated Moody’s and Fitch’s criteria changes well in 2016 and risk premiums continued to narrow. Due to differences in capital costs, there is still a low spread differential between transactions with AAA ratings and those downgraded due to legal maturity mismatches.
21
FINANCIAL REPORT – ASSET POSITION, FINANCIAL POSITION AND RESULTS OF OPERATIONS
Asset Position
The asset transfer from HRE Group as of October 1, 2010 continued to have a major impact on the asset position of FMS-WM as of December 31, 2017. FMS-WM took over assets, liabilities, provisions, accrued and deferred items, derivative financial instruments as well as other executory contracts from the transferring legal entities for accounting purposes as of October 1, 2010.
In fiscal year 2017, the unwinding of the portfolio, the decrease in own debt instruments, the cash reserve, and the increase in holdings due to the Portfolio Extension were the main factors influencing FMS-WM’s asset position.
Taking contingent liabilities and other obligations into account, FMS-WM posted a transaction volume of EUR 162.4 billion as of December 31, 2017 (December 31, 2016: EUR 185.9 billion). The table below provides an overview of the amount and composition of the transaction volume of FMS-WM as of December 31, 2016 and 2017:
| | | | | | | | |
| | | As of December 31,(1) | |
| | | 2016 | | | 2017 | |
| | | (€ in millions) | |
Assets | | | | | | | | |
Cash reserve | | | 5,479 | | | | 3,798 | |
Loans and advances to banks | | | 43,529 | | | | 41,458 | |
Loans and advances to customers | | | 14,093 | | | | 13,108 | |
Debt instruments | | | 106,654 | | | | 89,730 | |
Shares and other non-fixed-income securities | | | 697 | | | | 697 | |
Other long-term equity investments | | | 2 | | | | 0 | |
Shares in affiliated companies | | | 755 | | | | 491 | |
Intangible and tangible fixed assets | | | 2 | | | | 2 | |
Other assets | | | 1,279 | | | | 520 | |
Prepaid expenses | | | 4,708 | | | | 7,484 | |
| | | | | | | | |
Total assets | | | 177,198 | | | | 157,288 | |
| | | | | | | | |
| | | | | | | | |
| | | As of December 31, | |
| | | 2016 | | | 2017 | |
| | | (€ in millions) | |
Equity and liabilities | | | | | | | | |
Liabilities to banks | | | 24,126 | | | | 16,026 | |
Liabilities to customers | | | 18,119 | | | | 12,889 | |
Securitized liabilities | | | 116,243 | | | | 107,719 | |
Other liabilities | | | 633 | | | | 821 | |
Deferred income | | | 16,424 | | | | 17,915 | |
Provisions | | | 612 | | | | 518 | |
Equity | | | 1,041 | | | | 1,400 | |
| | | | | | | | |
Total equity and liabilities | | | 177,198 | | | | 157,288 | |
Contingent liabilities | | | 2,093 | | | | 1,184 | |
Other obligations | | | 6,593 | | | | 3,890 | |
| | | | | | | | |
Transaction volume | | | 185,884 | | | | 162,362 | |
| | | | | | | | |
| (1) | Figures may not add up due to rounding. |
22
The decrease in total assets as of December 31, 2017 compared to the previous year is primarily due to the unwinding of the portfolio (nominal value: EUR 10.1 billion), the decrease in own debt instruments (EUR 5.1 billion) and the reduction due to currency effects (EUR 4.9 billion, of which EUR 4.0 billion related to the nominal value of the extended wind-up portfolio). The decline in total assets is also driven by the decrease of EUR 1.7 billion in cash reserves and of EUR 1.6 billion in securities repurchase agreements (as buyer).
The additions resulting from the Portfolio Extension (as of December 31, 2017: nominal value of EUR 1.9 billion; amortized cost of EUR 2.3 billion) had an opposite effect. In connection with the wind-up task related to the Depfa Group, FMS-WM acquired derivative positions with third parties from Depfa Group companies in the fiscal year 2017. In direct connection with the acquisition of those derivatives, it entered into matching, offsetting transactions with the Depfa Group.
Lending Business
The transferred risk positions that arise from the underlying lending business encompass receivables as well as disbursement obligations under irrevocable loan commitments and guarantees. In addition to the risk positions assumed by the HRE Group as of October 1, 2010, the lending business also includes the risk positions acquired from the Depfa Group during fiscal years 2016 and 2017 as part of the Portfolio Extensions. The contingent liabilities stem from guarantees granted by FMS-WM for certain assets that are being held by companies of the former HRE Group and could not be transferred to FMS-WM. As of December 31, 2017, a guarantee of EUR 0.2 billion was outstanding, which had been granted to DEPFA ACS BANK DAC during fiscal year 2016.
The lending business had a volume of EUR 59.6 billion as of December 31, 2017, compared to EUR 66.3 billion as of December 31, 2016, and was broken down into the following balance sheet and off-balance-sheet items:
| | | | | | | | |
| | | As of December 31, | |
| | | 2016 | | | 2017 | |
| | | (unaudited) | |
| | | (in € millions) | |
Loans and advances to banks | | | 43,529 | | | | 41,458 | |
Loans and advances to customers | | | 14,093 | | | | 13,108 | |
Contingent liabilities | | | 2,093 | | | | 1,184 | |
Other obligations | | | 6,593 | | | | 3,890 | |
| | | | | | | | |
Lending business | | | 66,308 | | | | 59,640 | |
| | | | | | | | |
The development in the lending business was influenced mainly by the unwinding of EUR 2.1 billion of the portfolio (nominal value: EUR 2.9 billion) and the reduction due to currency effects of EUR 0.7 billion (of which EUR 0.4 billion related to the nominal value of the extended wind-up portfolio). The decrease in securities repurchase agreements (as buyer) of EUR 1.6 billion also contributed to the decrease in the lending business. The additions resulting from the Portfolio Extension in the amount of EUR 1.6 billion partially offset the decrease in loans and advances to customers.
The decline in contingent liabilities is mainly attributable to the reduction in a guarantee extended to DEPFA ACS BANK DAC (EUR 0.7 billion). The decrease in other obligations compared to December 31, 2016 is primarily the result of the net decrease in liquidity facilities extended to Depfa of EUR 1.9 billion and the scheduled reduction in a liquidity facility extended to PBB (reduction of EUR 0.5 billion).
Securities Holdings
Securities holdings in an amount of EUR 89.7 billion were recognized as debt instruments as of December 31, 2017, compared to an amount of EUR 106.7 billion as of December 31, 2016. As of December 31, 2017, the amount of securities holdings included debt securities issued by FMS-WM of EUR 17.7 billion that were repurchased (including accrued interest), compared to EUR 22.8 billion as of December 31, 2016. This amount was allocated to the liquidity reserve and partly pledged as collateral. The additional holdings solely concern marketable bonds and other fixed-income securities, which are classified as holdings of financial investments.
As of December 31, 2017, the securities holdings included securities from the Portfolio Extension of EUR 0.4 billion (nominal value EUR 0.4 billion) as well as securities purchased in the context of the acquisition of Depfa liabilities at a cost of EUR 85 million (nominal value: EUR 63 million) (December 31, 2016: cost of EUR 561 million; nominal value EUR 497 million). The holdings of securities are hedged against interest rate and foreign exchange risks by means of derivatives.
23
In contrast, the unwinding of a nominal EUR 7.1 billion of the portfolio, a reduction due to currency effects of EUR 4.0 billion (of which EUR 3.6 billion related to the nominal value of the extended wind-up portfolio) and a decrease in own issues of EUR 5.1 billion reduced securities holdings.
Shares and Other Non-Fixed-Income Securities
Effective May 26, 2015, FMS-WM acquired the hybrid bonds of the Depfa Group with a nominal value of EUR 1,125 million at a price of EUR 675 million (excluding incidental acquisition expenses). Taking incidental acquisition expenses into account, the book value of these bonds as of December 31, 2017 was EUR 697 million (December 31, 2016: EUR 697 million).
Shares in Affiliated Companies and Other Long-Term Equity Investments
As of December 31, 2017, a book value of EUR 491 million was recognized for shares in affiliated companies and other long-term equity investments (December 31, 2016: EUR 757 million). The decrease compared to fiscal year 2016 was mainly due to the reduced book value of the equity investment in Hypo Real Estate Capital Corp. (“HRECC”) of EUR 336 million as a result of a capital repayment. This decline was partially offset by a EUR 83 million write-up of the book value of the equity investment in Depfa.
Liabilities
Issuing bonds and engaging in repos in accordance with FMS-WM’s funding strategy had a significant impact on the following balance sheet items: (i) liabilities to banks, (ii) liabilities to customers and (iii) securitized liabilities.
FMS-WM recognized liabilities to banks of EUR 16.0 billion as of December 31, 2017 (December 31, 2016: EUR 24.1 billion). As of December 31, 2017, this item primarily included securities repurchase agreement transactions (as seller) with a nominal value of EUR 9.2 billion (December 31, 2016: EUR 12.9 billion) and a demand deposit by a banking group of EUR 4.3 billion (December 31, 2016: EUR 8.8 billion).
Liabilities to customers totaled EUR 12.9 billion (December 31, 2016: EUR 18.1 billion) and as of December 31, 2017 mainly included securities repurchase agreements transactions (as seller) with a nominal value of EUR 9.2 billion (December 31, 2016: EUR 12.3 billion) as well as time deposits of EUR 1.5 billion (December 31, 2016: EUR 4.0 billion). In addition, FMS-WM recognized securitized liabilities of EUR 107.7 billion as of December 31, 2017 (December 31, 2016: EUR 116.2 billion). The holdings of debt securities issued by FMS-WM, including pro rata interest, as of December 31, 2017 amounted to EUR 81.4 billion (December 31, 2016: EUR 84.5 billion). As of December 31, 2017, this item also included EUR 26.2 billion (December 31, 2016: EUR 31.7 billion) in commercial paper from the ECP/CD Program launched in fiscal year 2011.
Prepaid Expenses
Prepaid expenses in the total amount of EUR 7.5 billion as of December 31, 2017 (December 31, 2016: EUR 4.7 billion) included EUR 5.8 billion of derivatives costs that had not yet been amortized (December 31, 2016: EUR 3.3 billion). The item also contains unamortized payments made by FMS-WM in fiscal years 2016 and 2017 to acquire interest rate derivatives in connection with the wind-up task related to the Depfa Group. In fiscal year 2017, FMS-WM also acquired certain derivative positions from Depfa Group companies, entered into matching, offsetting transactions to those positions and in this context made payments required to be deferred. The increase seen in the unamortized cost of derivatives in fiscal year 2017 is mainly attributable to the outlined transactions with the Depfa Group, partially offset by pro rata amortization and currency translation effects.
This line item continues to include prepaid expenses accrued from the lending business of EUR 1.7 billion (December 31, 2016: EUR 1.4 billion), consisting primarily of payments made by FMS-WM in 2010 for hedge adjustments of the hedged items (receivables) taken over from the HRE Group companies in the context of the Portfolio Extensions and in connection with the acquisition of Depfa liabilities in fiscal years 2016 and 2017.
Deferred income of EUR 17.9 billion as of December 31, 2017 (December 31, 2016: EUR 16.4 billion) included EUR 17.7 billion (December 31, 2016: EUR 16.2 billion) of payments not yet amortized, received in connection with the derivatives (which were mainly taken over as of October 1, 2010) from the transferring HRE Group companies. The item also contains unamortized payments received by FMS-WM in fiscal years 2016 and 2017 for the acquisition of interest rate derivatives in connection with the wind-up task related to the Depfa Group. In fiscal year 2017, FMS-WM also acquired certain derivative positions from Depfa Group companies, entered into matching, offsetting transactions to those positions and in this context received payments required to be deferred. The increase seen in unamortized payments received for derivatives in fiscal year 2017 is therefore mainly attributable to the outlined transactions with the Depfa Group, partially offset by pro rata amortization and currency translation effects.
24
Equity and Loss Compensation Claim
The capital base of FMS-WM is structured as follows:
HRE and PBB each made an equity contribution of EUR 1 million to FMS-WM in connection with the spin-off pursuant to Section 8a (1) and (8) of the FMStFG in conjunction with Sections 123 (2) No. 1 and 131 of the German Reorganization and Transformation Act (Umwandlungsgesetz).
As in fiscal year 2016, no loss compensation claim was recognized against SoFFin in fiscal year 2017. For a description of SoFFin’s loss compensation obligation, see “General—Relationship with the Federal Republic of Germany—Relationship with SoFFin—Loss Compensation and Liquidity Support Obligations.”
FMS-WM recognized net retained profits of EUR 359 million in fiscal year 2017 (2016: EUR 313 million).
Net retained profits from fiscal year 2016 in an amount of EUR 313 million were transferred to retained earnings by a resolution dated March 27, 2017. Retained earnings as of December 31, 2017 totaled EUR 1,039 million.
Financial Position
Capital Structure
The transfer of assets and liabilities from the HRE Group initially also included funding items. These holdings were repaid in connection with the restructuring of the funding and replaced by new FMS-WM issues.
Securitized liabilities totaling EUR 107.7 billion were recognized as of December 31, 2017 in connection with debt securities issued by FMS-WM, the ECP/CD Program and accrued interest (December 31, 2016: EUR 116.2 billion). As of December 31, 2017, FMS-WM had issued EUR 81.4 billion of its own debt instruments including pro rata interest (December 31, 2016: EUR 84.5 billion); of this amount, EUR 17.7 billion (December 31, 2016: EUR 22.8 billion) including pro rata interest had been bought back and reported as an asset in the balance sheet under the “debt instruments” item.
Issuing Activity and Funding
In fiscal year 2017, FMS-WM met its targets for its funding and investor relations strategy. The overriding aim is to ensure the solvency of FMS-WM at all times. This is accomplished by utilizing a broadly diversified funding structure, characterized by a wide range of products and a highly diversified, international investor base.
In the money market, the product range includes the following instruments:
| | • | | U.S. ABCP Program (through an issuance vehicle in the United States); |
| | • | | Repos (bilateral, tri-party and transactions with EUREX Clearing AG); and |
| | • | | Deposits from institutional investors. |
The money market funding had an average remaining maturity of approximately 3.4 months as of December 31, 2017 and consisted mainly of euro, pound sterling and U.S. dollar. Money market funding is obtained at both fixed and variable rates of interest.
Capital market funding is based on strategic benchmark issues, publicly offered issues and private placements. These three instruments primarily differ in issuance volume and marketing processes. However, FMS-WM still does not issue structured products. Besides issuances in euros, foreign currency issuances are predominantly denominated in U.S. dollars and pounds sterling.
The total 2017 issuance volume of all capital market instruments amounted to an equivalent of EUR 19.3 billion. The focus of the issuance activities in fiscal year 2017 was on the euro, followed by the U.S. dollar and pound sterling. As a result, this financial performance indicator in 2017 exceeded the volume of capital market issues of EUR 11 billion to EUR 12 billion that had been forecasted for fiscal year 2017. The average maturity of the capital market instruments issued in 2017 was approximately 3.1 years, placed in various issue formats each with a volume of up to EUR 1.5 billion and USD 2 billion. At least two benchmark bonds were issued in each of the three primary currencies.
25
The capital market funding in place as of December 31, 2017 shows the following maturity structure:
| | | | | | | | |
| | | As of December 31, | |
| | | 2016 | | | 2017 | |
| | | (unaudited) | |
| | | (equivalent value in € millions) | |
Up to one year | | | 14,818 | | | | 13,900 | |
More than one year and up to five years | | | 46,119 | | | | 48,945 | |
More than five years | | | 2,196 | | | | 2,363 | |
| | | | | | | | |
Total | | | 63,133 | | | | 65,208 | |
| | | | | | | | |
If capital market funding is obtained at a fixed rate of interest, it is usually hedged by way of appropriate interest rate hedges as part of general interest rate management.
FMS-WM plans to keep the share of long-term capital market financing in its overall funding volume stable at a minimum of 50% (currently: 56%). Starting in 2019, Federal Republic of Germany – Finance Agency will provide the longer term euro funding of FMS-WM. FMS-WM will continue to raise long-term foreign currency funding, in particular pound sterling and U.S. dollars, and short-term money market funding itself.
Liquidity
FMS-WM had sufficient liquidity at all times in fiscal year 2017, and in the future expects to continue to have access to the money and capital markets, allowing maturing capital market funding to be substituted by new capital market issuances at any time, to the extent this funding cannot be supplied by inflows of funds from the unwinding of the portfolio.
Capital Expenditures
In fiscal year 2017, FMS-WM acquired further Depfa liabilities with a nominal value of EUR 1.5 billion. Large portions of these acquired liabilities and the Depfa liabilities already held by FMS-WM as of December 31, 2016 were sold to the Depfa Group with a nominal value of EUR 2.0 billion in the fourth quarter of 2017. In direct connection with the sale of these liabilities to the Depfa Group, Depfa Group risk positions of the asset side with a nominal volume of EUR 2.0 billion were acquired as a next step.
Off-balance-Sheet Obligations
Some of the outsourced services (including those provided by FMS-WM Service, IBM Deutschland GmbH, DATAGROUP Financial IT Services GmbH (formerly ikb Data GmbH) and others) are subject to long-term agreements, giving rise to other financial obligations on the part of FMS-WM. These agreements have fixed and variable performance components. A contractual volume of over EUR 100 million per year, of which an average of around 70% is attributable to FMS-WM Service, is expected for fiscal years 2018 through 2020.
For information on further off-balance-sheet obligations, see “Financial Statements and Report of the Independent Auditors—Notes to the Balance Sheet—Equity and Liabilities—Contingent Liabilities.”
Results of Operations
The results of operations were mainly influenced by current income and expenses generated from the portfolio and related valuation determinations. At EUR 577 million (2016: EUR 527 million), the balance of current income and expenses (net interest and net commission income, net income from profit transfer agreements and current income from other long-term equity investments, less general and administrative expenses and depreciation/amortization of intangible and tangible fixed assets) was positive in fiscal year 2017. However, at EUR –202 million (2016: EUR –140 million), the balance from the risk provisions and net income from investments items that were affected by valuation determinations and sales results was negative in fiscal year 2017.
26
In fiscal year 2017, FMS-WM posted a positive result of EUR 429 million (2016: EUR 391 million) from ordinary activities (after deducting the balance of other operating income and expenses). After deducting the tax expense of EUR 70 million (2016: EUR 78 million), net income for fiscal year 2017 was EUR 359 million (2016: EUR 313 million).
The table below provides an overview of the structure of the result from ordinary activities based on the items of the income statement:
INCOME STATEMENT
| | | | | | | | |
| | | January 1 –
December 31,
2016 | | | January 1 –
December 31,
2017 | |
| | | (audited)
(€ in millions) | |
Net interest income | | | 667 | | | | 520 | |
Current income from other long-term equity investments | | | 0 | | | | 193 | |
Income from profit transfer | | | 6 | | | | 5 | |
Net commission income | | | 30 | | | | 13 | |
Other operating income (loss), net | | | 4 | | | | 54 | |
General and administrative expenses | | | –175 | | | | –153 | |
Depreciation and amortization | | | –1 | | | | –1 | |
Risk provisions for the lending business | | | –129 | | | | –159 | |
Net income (loss) from investments in the securities business | | | –11 | | | | –43 | |
Results from ordinary activities | | | 391 | | | | 429 | |
Taxes (including other taxes) | | | –78 | | | | –70 | |
Net income for the fiscal year | | | 313 | | | | 359 | |
Retained profits (accumulated losses) brought forward | | | 0 | | | | 0 | |
| | | | | | | | |
Net retained profits | | | 313 | | | | 359 | |
| | | | | | | | |
Net Interest Income
Net interest income in fiscal year 2017 amounted to EUR 520 million (2016: EUR 667 million). The decrease compared to fiscal year 2016 is mainly due to the year-on-year decline in one-off effects in an amount of EUR 154 million (2016: EUR 271 million) in connection with compensation payments received for contractual adjustments of existing credit support annexes in derivatives.
As expected, excluding the aforementioned one-off effects, a year-on-year decline in net interest income from current operations was recorded in fiscal year 2017, which was mainly attributable to the reduction in the portfolio volume resulting from the portfolio wind-up.
Current Income from Other Long-Term Equity Investments
In fiscal year 2017, current income from other long-term equity investments and shares in affiliated companies resulted mainly from a payment from retained earnings made by HRECC.
Net Commission Income
Net commission income in fiscal year 2017 in an amount of EUR 13 million (2016: EUR 30 million) primarily comprised commission income from the lending and derivatives business. The reduction in net commission income is due to the unwinding of the portfolio and a year-on-year reduction in the volume of credit derivatives. Commission expenses mainly included premium payments from the issuing business, which rose slightly compared with fiscal year 2016 due to the increase in capital market funding.
Other Operating Income (Loss), Net
Other operating income and expenses of EUR 54 million in fiscal year 2017 (2016: EUR 4 million) primarily resulted from effects of currency translation, the reversal of provisions and expenses related to portfolio management. The figure for fiscal year 2016 mainly resulted from the net reversals of provisions, the passing on of costs of services to subsidiaries and the countervailing effects of currency translation and expenses related to portfolio management.
27
General and Administrative Expenses
In fiscal year 2017, general and administrative expenses decreased by EUR 22 million, or approximately 12.6%, to EUR 153 million (2016: EUR 175 million). Administrative expenses in fiscal year 2017 primarily comprised expenses incurred in the context of service outsourcing (servicing of the portfolio assets, administrative and back office activities, information technology (“IT”) services and accounting services).
Including all active service providers, expenses for servicing the portfolio totaled EUR 108 million in fiscal year 2017 (2016: EUR 125 million) which is EUR 17 million, or 13.6%, below the comparable expenses in fiscal year 2016.
Expenses for outsourced services declined in fiscal year 2017, falling by EUR 13 million, in particular with respect to FMS-WM Service. This decline is mainly due to the progressing portfolio wind-up.
Personnel expenses for the staff of FMS-WM amounted to EUR 20 million in fiscal year 2017 (2016: EUR 22 million).
The development of general and administrative expenses serves as a financial performance indicator for FMS-WM with regard to the strategic goal of cost-effective servicing and management. As mentioned above, general and administrative expenses declined overall, but they also declined in the relevant area of personnel expenses and expenses for the servicing of the portfolio. This means that the earlier forecast that administrative costs would decline slightly as a result of the ongoing portfolio reduction was fulfilled.
Risk Provisions and Net Income from Securities
The result from risk provisions (write-downs of and valuation allowances on receivables and certain securities, additions to loan loss provisions / income from reversals of write-downs of receivables and certain securities and from the reversal of loan loss provisions) and from investments (write-downs of and valuation allowances on shares in affiliated companies, other long-term equity investments and securities classified as fixed assets / income from reversals of write-downs, shares in affiliated companies) in fiscal year 2017 amounted to EUR –202 million (2016: EUR –140 million), which is below the previous year’s level.
Overall Appraisal
Overall, business developed positively for FMS-WM in fiscal year 2017. The favorable conditions in many market segments were used to accelerate the unwinding of the transferred portfolio. Excluding the effects of the Portfolio Extension, portfolio wind-up (before foreign currency effects) in fiscal year 2017 was EUR 10.0 billion based on exchange rates as of December 31, 2016. Including the addition resulting from the Portfolio Extension, the portfolio was unwound by a net EUR 8.1 billion. The wind-up amount of approximately EUR 7 billion planned in the outlook for fiscal year 2017 was therefore exceeded, even when taking into account the Portfolio Extension.
In connection with the mandate received in May 2014 to unwind the Depfa Group in a way that maximizes its value, FMS-WM acquired additional Depfa liabilities with a nominal value of EUR 1.5 billion in fiscal year 2017. As of December 31, 2017, FMS-WM held Depfa liabilities with a nominal value of EUR 1.1 billion. As in fiscal year 2016, FMS-WM again sold a large percentage of Depfa liabilities purchased (nominal value: EUR 2.0 billion) to the Depfa Group in fiscal year 2017. In direct connection with the sale of these liabilities to the Depfa Group, FMS-WM acquired Depfa Group risk positions with a nominal volume of EUR 2.0 billion.
Results of operations also exceeded previous projections for fiscal year 2017, which had anticipated that FMS-WM would break even or generate a slightly positive result. The positive development in earnings was mainly due to the contributions to earnings from net interest income and current income from other long-term equity investments, which turned out to be better than budgeted, particularly as a result of the one-off effects described above. As a result, current income from the portfolio significantly exceeded expenses from current operations by EUR 577 million (2016: EUR 527 million). In addition, there was a negative balance from impacted by valuation measures (risk provisions and net income from investments) in the amount of EUR –202 million (2016: EUR –140 million). FMS-WM recognized net income of EUR 359 million for fiscal year 2017 (2016: EUR 313 million).
FMS-WM had sufficient liquidity at all times in fiscal year 2017. As regards issuance activities at FMS-WM, the total issuance volume of all capital market instruments amounted to EUR 19.3 billion in fiscal year 2017, thus exceeding the issuance volume of EUR 11 billion to EUR 12 billion that had previously been projected for fiscal year 2017. FMS-WM plans to keep the share of long-term capital market funding in the overall funding volume stable at a minimum of 50% over the coming years. Starting in 2019, Federal Republic of Germany – Finance Agency will provide the longer term euro funding of FMS-WM. FMS-WM will continue to raise long-term foreign currency funding, in particular in pound sterling and U.S. dollar, and short-term money market funding itself.
28
RISK REPORT
The risk report has been prepared in accordance with the requirements of the German Commercial Code (Handelsgesetzbuch, “HGB”) applicable to large corporations and the supplementary provisions applicable to banks.
The disclosures in the risk report take all risk positions into account, to the extent that FMS-WM has beneficial ownership thereof and bears the value at risk. This also encompasses synthetic transfers of risk positions and receivables of FMS-WM’s subsidiaries whereby FMS-WM has assumed all default risks, directly or indirectly resulting from these subsidiaries’ funding activities. Apart from risk positions, the risk report covers properties that were taken over in connection with the disposal of collateral. In addition, the risk report describes exposures where the risks were not transferred directly for a variety of reasons but instead by means of guarantees, for instance. These disclosures do not distinguish between on-balance-sheet transactions (such as receivables and securities) and off-balance-sheet transactions (such as guarantees, loan commitments and derivatives). All risks are presented net of risk mitigation measures.
Following the takeover of the Depfa Group on December 19, 2014, FMS-WM holds the Depfa Group’s risk positions in an amount equal to the Depfa Group’s book value, the Depfa Group’s hybrid bonds acquired by FMS-WM, the intragroup receivable reported separately from the Depfa Group’s wind-up portfolio and the receivables relating to the Depfa Group’s wind-up portfolio. Given that FMS-WM is under no obligation to assume the Depfa Group’s losses, the risk positions of the Depfa Group are not reported on in FMS-WM’s risk report.
Basics of Risk Management
FMS-WM’s risk management is based on FMS-WM’s winding-up plan and risk strategy, and it is documented in FMS-WM’s Risk Manual. The key risk management functions and instruments were further refined in fiscal year 2017. Aside from the sets of tools used to steer and monitor risk, this also includes reviewing and adjusting, as necessary, approaches to management, limit setting and reporting, given the special nature of FMS-WM.
FMS-WM’s risk strategy takes into account the requirements of Section 25a (1) of the KWG, Article 2 (4) of its charter and the relevant rules and regulations of the German Minimum Requirements for Risk Management (“MaRisk”), which specify the requirements of Section 25a of the KWG. MaRisk provides a framework for risk management at financial institutions. Furthermore, it refines the requirements placed on a business organization for outsourced activities and processes requiring financial institutions to take adequate measures to ensure that outsourcing does not result in an undue increase in risk. MaRisk provides for the establishment of appropriate internal governance structures. Within the meaning of MaRisk, risk management includes the determination of appropriate strategies, as well as the establishment of appropriate internal surveillance procedures. The internal surveillance procedures comprise the internal control system and internal audit.
In particular, the internal control system has to cover:
| | • | | rules regarding the organizational and operational structure; and |
| | • | | processes for identifying, assessing, treating, monitoring and communicating risks. |
In addition, MaRisk contains specific requirements for the organization and management of counterparty default risks (credit risks), market risks, liquidity risks and operational risks.
Although FMS-WM is neither a financial institution nor a financial services institution within the meaning of the KWG, due to similarities of FMS-WM’s operations with such institutions, FMS-WM’s risk strategy complies with all relevant rules, regulations and standards applicable to banks and/or financial institutions to the extent advisable, required or stipulated in its charter. Prior to FMS-WM’s creation, extensive preliminary talks were conducted between FMS-WM and FMSA, its legal regulator, concerning the extent to which MaRisk rules and regulations would apply to FMS-WM.
The risk strategy defines long-term, general and consistent frameworks and principles for FMS-WM’s risk management to the extent that this is advisable and required in substantive terms. It provides the basis for managing and controlling different types of risks and fixes fundamental risk targets that govern all business decisions. Changes in rules, regulations and standards applicable to banks and/or financial institutions are reviewed for applicability to FMS-WM and complied with, to the extent deemed advisable or required.
29
The current risk strategy is derived from FMS-WM’s objective as set out in its charter and from the winding-up plan, which describes FMS-WM’s business strategy and risk tolerance. FMS-WM follows a strategy of unwinding the portfolio in a way that maximizes its value to the extent possible. The efficiency and operational feasibility of all risk-steering activities and the cost-effectiveness of funding constitute additional requirements for reducing risk. The risk strategy, including individual strategies for the five relevant risk categories of credit risk, market risk, liquidity risk, operational risk and other risks, is outlined in established written policies and procedures.
Because the capital adequacy requirements of the KWG do not apply to FMS-WM, the absence of any obligation to prepare an internal capital adequacy assessment process to manage its business based on economic capital pursuant to MaRisk standards results in reduced requirements on FMS-WM’s reporting system compared to other financial institutions. In particular, FMS-WM’s approach to risk management is designed to avoid seeking recourse from SoFFin under the latter’s obligation to compensate losses.
The winding-up plan and the risk strategy—including the underlying assumptions—are reviewed on a regular basis (at least annually) and updated as necessary. Deviations from the plan that are identified in the wind-up report may also require further updates.
Organizational Structure of Risk Management
Responsibility for risk management rests with the Executive Board of FMS-WM, in particular the Chief Risk Officer/Chief Financial Officer. The chart below shows the organizational structure of risk management:
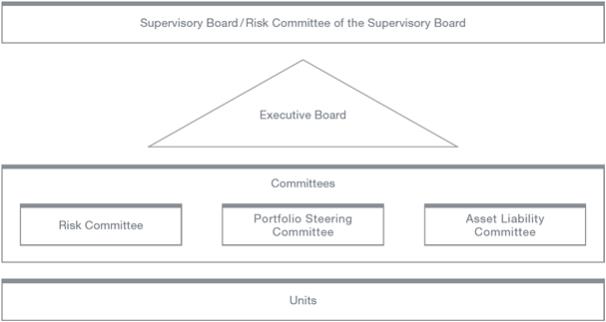
Supervisory Board / Risk Committee of the Supervisory Board
The Supervisory Board monitors the Executive Board within the meaning of FMS-WM’s charter and has delegated risk-relevant topics to the Risk Committee of the Supervisory Board. As far as loan and portfolio management are concerned, the Risk Committee of the Supervisory Board serves as the latter’s decision-making body tasked with making related decisions on a case-by-case basis that are particularly relevant to risk, have major effects on FMS-WM’s success or are of strategic significance. It reviews and approves transactions, measures, strategies and targets related to individual exposures in connection with unwinding the portfolio and monitors relevant loan decisions. All members delegated for this purpose by the Supervisory Board are entitled to vote.
30
Committees
The following committees, which generally meet weekly or monthly and can be convened at short notice, have been established at FMS-WM to support and advise the Executive Board as well as to make certain decisions:
| | • | | The Risk Committee is the corporate body for operational lending decisions at the management level of FMS-WM; it makes loan decisions on individual loans for all asset classes that fall within its scope. It is also tasked with making decisions on measures related to individual exposures and to propose transactions, strategies and objectives with regard to portfolio wind-up and to monitor relevant portfolio decisions. |
| | • | | The Portfolio Steering Committee is a strategic management and information committee at the Executive Board level whose duties include preparing decisions on adjustments to the winding-up plan and making decisions on methodological changes in risk controlling and concerning overall risk steering. |
| | • | | The Asset Liability Committee (“ALCO”) serves as the Executive Board’s key body tasked with information gathering, monitoring and management activities in connection with strategic decisions on issues related to the structure of the balance sheet, liquidity and market risk positions, funding and hedging strategies, limits as well as methodological requirements for market and liquidity risks. |
Units
The units described below are mainly responsible for risk management at FMS-WM.
The Risk Controlling department within the Risk Controlling & Quantitative Analytics unit is responsible for carrying out all risk controlling activities in accordance with MaRisk for all risk types. This includes identification, analysis, assessment, monitoring and reporting of all risks. In addition, the Quantitative Analytics department reviews the adequacy of the models used to determine credit risk and model-based market price valuation. The Finance, Controlling & Portfolio Steering unit is responsible for updating FMS-WM’s wind-up plan on an annual basis. The monthly wind-up report represents the centralized reporting system for all risk types.
Credit risk management is one of the main tasks performed by FMS-WM and the responsibility of the Asset Management unit. The main tasks of the portfolio management units entail making decisions on loans and securities at both the individual and the portfolio level. This is where the decisions of the committees on whether or not to hold risk positions to maturity or sell or restructure them are prepared and carried out.
In continuing to unwind the portfolio in fiscal year 2017, the two credit portfolio management units were combined to form the Asset Management unit comprising three departments, the responsibilities of which are defined on the basis of the relevant segments or product groups:
| | • | | The Infrastructure, Commercial Real Estate & Credit Office department primarily manages infrastructure financing and real estate loans. |
| | • | | The Public Sector, Financial Institutions & Structured Products department handles both public-sector securities and structured products. |
| | • | | The Rome Branch department is responsible for FMS-WM’s Italian branch, which manages loans to Italian Public Sector, Commercial Real Estate or Infrastructure borrowers. |
The IT, Sourcing & Operations unit comprises the following three departments with corresponding responsibilities:
| | • | | IT Steering & Project Planning: managing IT risk, monitoring and managing the contractually compliant provision of outsourced IT services, establishing appropriate guidelines and processes, and monitoring the IT project portfolio; |
| | • | | Sourcing & Servicer Steering: service provider management and managing outsourcing risks; |
| | • | | Operations & Project Management: managing operational back-office processes and the associated risks. |
Moreover, each individual department at FMS-WM must also manage the operational risks falling within the scope of its respective responsibility. For example, ensuring adequate rules of representation and carrying out measures to prevent losses are decentralized responsibilities.
31
In fiscal year 2017, the Group Internal Audit unit in the CRO / CFO division performed risk-based and process-independent audits relating to the efficacy and adequacy of risk management at FMS-WM and on behalf of FMS-WM Service. In addition, Group Internal Audit examines processes and matters implemented throughout the Group and complements the activities of the Depfa Group’s internal audit departments.
Process Organization of Risk Management
Risk management at FMS-WM encompasses the
of risks.
The material types of risks associated with the business model of FMS-WM are:
An annual risk inventory is conducted to identify and review risks classified as material. Due to the size and complexity of the portfolio transferred, credit risk in the form of borrower and issuer risk is the most important type of risk to which FMS-WM is exposed. In addition, FMS-WM is subject to considerable operational risk as a result of the extensive outsourcing of processes and considerable equity risk since the takeover of the Depfa Group. Because SoFFin is obligated to compensate any losses, none of the risk types constitute a going-concern risk for FMS-WM.
Risk management also entails limiting, monitoring and actively steering the following risks in particular: credit risk in the form of counterparty risk, market risk and liquidity risk. In addition to risk type-specific stress tests, integrated (cross-risk type) stress scenarios are run and reported on a quarterly basis. Borrower and issuer risks are monitored and managed as part of the wind-up strategies for specific wind-up clusters within the segments. Credit risk in the form of counterparty risk, market risk, liquidity risk, operational risk and other risks are managed at the portfolio level.
FMS-WM is fully liable for managing and monitoring each individual risk type. FMS-WM has outsourced significant operating duties and activities to FMS-WM Service by way of a framework agreement. The scope of services provided is set out in detailed service level agreements.
Moreover, a framework agreement was signed to outsource key areas of IT operations to IBM Deutschland GmbH and DATAGROUP Financial IT Services GmbH. Extensive service level agreements are intended to safeguard day-to-day IT system functionality and to provide for future adaptability of the systems to meet the special needs of FMS-WM through change requests.
Credit Risk
Definition
The credit risk of FMS-WM mainly comprises borrower and issuer risk, counterparty risk as well as country risk.
| | • | | Borrower and issuer risk comprises the risk that a contracting party, or a reference entity in the case of credit derivatives, does not fulfill the payment obligations resulting from loan agreements or securities issues in full or in a timely manner or that a credit event defined in derivative contracts occurs. Borrower and issuer risk is further classified as follows. |
| | – | | Default risk: The risk that a borrower cannot fulfill payment obligations in full or on time, or that a defined credit event occurs, and that FMS-WM suffers a financial disadvantage as a result. In many cases, FMS-WM is in possession of marketable collateral. Recoveries from the liquidation of collateral can partly mitigate the default losses, but they are also subject to uncertainties. |
32
| | – | | Migration risk: The risk that a borrower’s or issuer’s creditworthiness might deteriorate over time. The deterioration in creditworthiness does not immediately result in direct losses but increases the risk of incurring such losses in the future. At the portfolio level, such deterioration in creditworthiness is reflected in the rating profile. Irrespective of the required or actual treatment for accounting purposes, the deterioration of a rating profile is usually associated with declining market values. |
| | – | | Credit valuation adjustment (“CVA”): The risk that a counterparty’s creditworthiness might deteriorate, thereby reducing the positive fair value. CVA risks relate almost exclusively to customer derivatives. Derivatives may only be entered into to hedge risks if there is a credit support annex (“CSA”). |
| | • | | Counterparty risk: The risk that a contracting party’s default makes it impossible to fully collect unrealized profits from derivatives and executory contracts. Counterparty risk is further classified into replacement risk and settlement risk. |
| | – | | Replacement risk: The risk that, in the event of a derivative counterparty defaulting, the affected contract must be replaced at conditions that are less favorable than the ones applicable when the contract was initially entered into. |
| | – | | Settlement risk: The risk that FMS-WM delivers an asset that it has sold to a counterparty or makes a payment but does not receive the stipulated monetary consideration or asset, as the case may be. |
| | • | | Country risk comprises borrower or counterparty risks arising from the dependence of the contracting party on the actions of the relevant foreign states or political or economic developments. In particular, this includes the risk that a debtor cannot service its liabilities due to any of the following: |
| | – | | the government or central bank of the debtor’s country cannot or will not make available the foreign currency required for such repayment; |
| | – | | the government or central bank of the debtor’s country prohibits such repayment (transfer risk); or |
| | – | | the currency of the debtor’s country can no longer be converted due to a serious deterioration of the country’s economic or political situation (conversion risk). |
Collective country risk provisions are recognized for borrowers in countries with discernible country risks.
Risk Strategy
FMS-WM’s credit risk strategy includes minimizing losses by holding assets to maturity or unwinding them in a way that maximizes its value to the extent possible. As a rule, taking on new lending business or acquiring securities for purposes other than hedging risks is not stipulated in the winding-up plan. In individual cases, new business may be allowed to cost-effectively reduce risks from existing positions or equity investments.
Risk Identification
A catalogue of early warning indicators, which is coordinated with FMS-WM Service, is used to continuously monitor loan exposures in order to ensure early identification of problem assets. The latter are then classified into Facilities in Focus, Watchlist, Restructuring and Workout—in that order—if certain indications are present. Exposures are subject to increasingly intensified monitoring—in that order—to ensure that risks are detected and steps aimed at reducing risk can be initiated as soon as possible.
The guidelines agreed with FMS-WM Service for credit processes determine the requisite steps for performing risk reviews and risk assessments as part of regular monitoring. Early warning indicators as well as credit processes are reviewed on a regular basis but at least annually by FMS-WM Service and coordinated with the responsible units within FMS-WM.
Risk Analysis and Assessment
Credit risk is measured using internal models that calculate the probability of default (“PD”), expected amount of the receivable at the time of default (EaD), and the potential loss given default (“LGD”). The models for determining these parameters are reviewed annually by FMS-WM.
33
The aforementioned parameters are in turn used to calculate the expected loss (“EL”) for a one-year horizon. The EL is calculated on an individual transaction level and subsequently aggregated at segment and portfolio level.
In addition, the cumulative EL for a longer planning horizon and over the entire term of the positions in the wind-up portfolio is calculated as a risk reference value to be used in managing the portfolio. Stress tests are conducted at both the portfolio and segment levels, and the unexpected loss is quantified with the help of a credit portfolio model. In sensitivity analyses and both historical and hypothetical scenario analyses, stress situations are modeled for the key risk parameters PD and LGD, and their effects are measured on the cumulative EL.
Risk Steering
The credit portfolio management units and departments listed in section “—Organizational Structure of Risk Management” are responsible for steering credit risks. Restructuring and selling receivables are the two most important measures that are available to FMS-WM for steering credit risks.
In managing the portfolio, FMS-WM generally bases its decisions on the long-term value of an exposure (intrinsic value) in order to decouple decision-making from short-term fluctuations in market value. Changes in market value, however, are considered in internal credit rating analyses as they can provide timely and independent indications of creditworthiness. Additional analyses regarding borrower and issuer risk and potential write-down requirements are also performed in the event of material market value changes.
Counterparty risks are managed by means of limits and application of the “gross future exposure” approach, which takes into account not only current market values and collateral received or granted, but also the potential future changes of derivatives’ market values. Both replacement and settlement risks are managed by FMS-WM. As a rule, transactions entailing counterparty risks may not be made without a sufficient borrower-specific limit. The extent to which the limit has been utilized must be verified before any new transaction takes place (pre-deal limit check). All transactions are applied to the given borrower-specific limits immediately.
Limiting and managing counterparty risks distinguishes between two customer groups:
| | • | | Counterparty risks involving customers in the wind-up portfolio: The transferred exposures also encompass derivatives with customers in the wind-up portfolio. These derivatives are generally not collateralized. Increases in exposures are possible only in exceptional cases, for example with the aim of stabilizing the overall exposure. Therefore, limiting these risks is not an activity performed for management purposes but solely for monitoring purposes, i.e. it is intended to help the Risk Controlling department identify implausible increases in exposure. On a regular or ad hoc basis, the Risk Controlling department has the portfolio service provider adjust these limits. It becomes necessary to adjust limits in particular as transactions mature or in response to changes in market conditions. |
| | • | | Counterparty risks involving capital market partners: The Group Treasury unit enters into money market transactions, derivatives and repos to manage the risk and liquidity positions of FMS-WM. Managing these business activities requires limits that give the unit enough flexibility while enabling the Risk Controlling department to carry out its monitoring duties. The activities of the Group Treasury unit are restricted to a defined pool of counterparties (white list), are typically collateralized and are subject to an independent limit monitoring and escalation process by the Risk Controlling department. |
Risk Monitoring and Reporting
Primarily at the portfolio level, borrower and issuer risks are monitored pursuant to the current winding-up plan and described in the wind-up report that is to be prepared monthly for the Executive Board and the Supervisory Board. Furthermore, a detailed credit risk and stress test report prepared for the Executive Board on a quarterly basis evaluates credit risk-specific as well as integrated stress test scenarios.
At the level of individual exposures, FMS-WM Service monitors credit risk using approved processes. The migration of the ratings of the largest exposures is reported to the Executive Board in the wind-up report. In addition, FMS-WM Service reports monthly on the development of the watchlist and problem assets to the responsible portfolio managers at FMS-WM. Based on the data delivered and their own analyses, the portfolio managers monitor the individual exposures for their segments with regard to the decisions required in the interest of economic value maximization.
Counterparty limits and their utilization at transaction level are also recorded in the daily counterparty risk report, monitored and reported to the Executive Board as well as to the Group Treasury unit. An escalation process ensures timely reaction and communication to the Executive Board if limits are exceeded.
34
Risk Position
FMS-WM’s credit portfolio is managed through the Commercial Real Estate, Public Sector, Structured Products and Infrastructure segments. An EaD is determined for all portfolio segments based on uniform specifications. The EaD shows the potential amount of the claim against the borrower irrespective of the latter’s credit rating and any risk provisions already set up in that connection. Besides the current drawdown, the EaD also takes into account the pro rata interest payments in relation to which a borrower may default before an exposure is defined as having defaulted (maximum 90 days) as well as those loan commitments on which a borrower will still be able to draw in the future despite a significant deterioration in creditworthiness. The EaD of derivatives is defined as the sum of the current market value (after accounting for collateral) and the prescribed regulatory add-ons, which constitute a cushion for possible future market value increases.
The EL, as an additional important short-term parameter for managing the credit portfolio, is determined for the entire portfolio for a period of one year. The only risk positions exempted from the determination of the EL are those for which a specific loss provision was already recognized or for which a specific loss provision was transferred in the takeover of the portfolio.
The disclosures below correspond to the presentation of internal risk reporting in the wind-up report. As of the third quarter of 2017, the wind-up report includes customer and credit derivatives as well as the guarantee extended to DEPFA ACS BANK DAC in the tables breaking-down the credit portfolio. Hedging derivatives (bank derivatives) are still reported as a total amount. To improve comparability with fiscal year 2016, the amounts for December 2016 were adjusted accordingly. For the previous year, derivatives with an EaD of EUR 4.0 billion, FMS-WM’s guarantee commitments to DEPFA ACS BANK DAC with an EaD of EUR 0.9 billion and an EL of EUR 0.04 billion in total are therefore included in the individual segments of the credit portfolio. Unless described otherwise, the statements always refer to the overall portfolio, i.e. including the risk positions acquired from the Depfa Group as part of the Portfolio Extension.
Breakdown of the EaD and the EL of the Credit Portfolio
The following is a breakdown of the EaD and the EL of the credit portfolio by segment:
| | | | | | | | | | | | | | | | | | | | | | | | | | | | | | | | | | | | | | | | | | | | | | | | |
| | | Commercial Real
Estate | | | Public Sector | | | Structured
Products | | | Infrastructure | | | Total (excluding
derivatives) | | | Bank
Derivatives | |
| | | December 31, | |
| | | 2016 | | | 2017 | | | 2016 | | | 2017 | | | 2016 | | | 2017 | | | 2016 | | | 2017 | | | 2016 | | | 2017 | | | 2016 | | | 2017 | |
| | | (unaudited) | |
| | | (€ in billions) | |
EaD | | | 3.4 | | | | 2.2 | | | | 56.2 | | | | 51.0 | | | | 32.8 | | | | 25.4 | | | | 16.2 | | | | 14.5 | | | | 108.6 | | | | 93.1 | | | | 2.0 | | | | 2.7 | |
EL | | | 0.06 | | | | 0.01 | | | | 0.03 | | | | 0.04 | | | | 0.02 | | | | 0.01 | | | | 0.07 | | | | 0.04 | | | | 0.18 | | | | 0.10 | | | | 0.00 | | | | 0.00 | |
As of December 31, 2017, the EaD of the risk positions reported in the wind-up report (excluding bank derivatives) was EUR 93.1 billion. This also includes EUR 2.4 billion for loans and securities acquired from available assets from the Depfa Group’s cover pool effective November 6, 2017 in connection with the Portfolio Extension. EUR 0.4 billion of the assets belong to the Structured Products segment and EUR 2.0 billion to the Public Sector segment.
Compared to December 31, 2016, the EaD of the wind-up portfolio declined by EUR 15.5 billion, or 14%, including currency effects, despite the Portfolio Extension of EUR 2.4 billion.
Besides currency effects, this decline is essentially the result of scheduled and unscheduled repayments as well as sales of mainly Italian government bonds, structured financing arrangements and non-performing real estate loans.
While the EaD of the extended wind-up portfolio (excluding bank derivatives) declined by 14% year-on-year, the one-year EL declined by approximately 44% on the previous year to EUR 0.1 billion as of December 31, 2017 – including an increase of EUR 0.02 billion due to the Portfolio Extension. In relation to the EUR 91.2 billion of EaD from loans and advances for which specific loan loss provisions had not yet been recognized (internal rating classes 1 to 28) as of December 31, 2016, this corresponds to a one-year EL rate of 0.11%. In addition to repayments, the decrease in the EL of approximately EUR 0.08 billion is mainly attributable to sales of exposures.
Based on the wind-up report as of December 31, 2017, counterparty risk from bank derivatives amounted to an EaD of EUR 2.7 billion, up EUR 0.7 billion compared to fiscal year 2016. The rise is attributable to the gradual takeover of the Depfa Group’s derivatives portfolio in the course of the Depfa Group’s accelerated wind-up. The one-year EL from bank derivatives increased by EUR 0.05 million to EUR 0.1 million.
35
The wind-up portfolio does not include the shares in affiliated companies whose risks are reflected in equity risk, and receivables from subsidiaries and PBB. As of December 31, 2017, the excluded amounts included:
| | • | | Receivables of FMS-WM from subsidiaries (DEPFA ACS BANK DAC and Depfa) arising from loans or bonds with an EaD of EUR 0.4 billion; |
| | • | | Receivables from hybrid bonds (DEPFA Funding II LP, London, DEPFA Funding III LP, London, and DEPFA Funding IV LP, London) with a nominal value of EUR 1.1 billion, which were issued by Depfa in 2003, 2005 and 2007 and acquired in May 2015 by FMS-WM from the holders at a price discount of approximately 40% of the nominal value; |
| | • | | Irrevocable loan commitments in an amount of EUR 1.2 billion with respect to PBB as part of the agreed “substitute cover solution” (Ersatzdeckungslösung); |
| | • | | Liquidity facilities extended to Depfa for |
| | – | | an unsecured maximum facility in an amount of USD 1.15 billion which can be drawn down in stages (as of December 31, 2017: USD 0.7 billion). As of December 31, 2017, an amount of USD 0.18 billion was drawn down under this facility; |
| | – | | an unsecured maximum facility EUR 0.52 billion, of which an amount of EUR 0.4 billion was drawn down as of December 31, 2017; |
| | – | | a secured facility of EUR 4.2 billion, of which an amount of EUR 2.59 billion was drawn down as of December 31, 2017; |
| | • | | Purchased Depfa Group liabilities with an EaD of EUR 0.8 billion. |
Breakdown of Credit Portfolio by Currencies
The following is a breakdown of the EaD of the credit portfolio by currency:(1)
| | | | | | | | | | | | | | | | | | | | | | | | | | | | | | | | | | | | | | | | |
| | | Commercial
Real Estate | | | Public Sector | | | Structured
Products | | | Infrastructure | | | Total (excluding
derivatives) | |
| | | December 31, | |
| | | 2016 | | | 2017 | | | 2016 | | | 2017 | | | 2016 | | | 2017 | | | 2016 | | | 2017 | | | 2016 | | | 2017 | |
| | | (unaudited) | |
| | | (EaD in € billions) | |
EUR | | | 1.7 | | | | 1.1 | | | | 39.6 | | | | 36.9 | | | | 4.1 | | | | 3.0 | | | | 1.6 | | | | 1.4 | | | | 47.0 | | | | 42.4 | |
USD | | | 0.6 | | | | 0.5 | | | | 3.5 | | | | 2.8 | | | | 27.6 | | | | 21.3 | | | | 1.0 | | | | 0.6 | | | | 32.7 | | | | 25.2 | |
GBP | | | 1.0 | | | | 0.5 | | | | 10.4 | | | | 9.5 | | | | 0.4 | | | | 0.4 | | | | 10.7 | | | | 10.2 | | | | 22.5 | | | | 20.6 | |
Other currencies | | | 0.1 | | | | 0.1 | | | | 2.7 | | | | 1.8 | | | | 0.7 | | | | 0.7 | | | | 2.9 | | | | 2.3 | | | | 6.4 | | | | 4.9 | |
| | | | | | | | | | | | | | | | | | | | | | | | | | | | | | | | | | | | | | | | |
Total | | | 3.4 | | | | 2.2 | | | | 56.2 | | | | 51.0 | | | | 32.8 | | | | 25.4 | | | | 16.2 | | | | 14.5 | | | | 108.6 | | | | 93.1 | |
| | | | | | | | | | | | | | | | | | | | | | | | | | | | | | | | | | | | | | | | |
| (1) | Excluding bank derivatives with an EaD of EUR 2.7 billion. |
Changes in exchange rates compared to December 31, 2016 had the overall effect of reducing FMS-WM’s EaD by EUR 4.5 billion, the main reason being the depreciation of the U.S. dollar (–14%) and the pound sterling (–4%), which primarily affected the Infrastructure (GBP), Public Sector (GBP and USD) and Structured Products (USD) segments.
36
Breakdown of Credit Portfolio by Internal Rating Classes
The following is a breakdown of the credit portfolio by internal rating classes:(1)
| | | | | | | | | | | | | | | | | | | | | | | | | | | | | | | | | | | | | | | | |
| | | Commercial
Real Estate | | | Public Sector | | | Structured
Products | | | Infrastructure | | | Total (excluding
derivatives) | |
| | | December 31, | |
| | | 2016 | | | 2017 | | | 2016 | | | 2017 | | | 2016 | | | 2017 | | | 2016 | | | 2017 | | | 2016 | | | 2017 | |
| | | (unaudited) | |
| | | (EaD in € billions) | |
Internal rating classes 1 to 7 | | | 0.0 | | | | 0.0 | | | | 22.8 | | | | 21.2 | | | | 22.5 | | | | 17.5 | | | | 1.2 | | | | 1.0 | | | | 46.5 | | | | 39.7 | |
Internal rating classes 8 to 10 | | | 0.0 | | | | 0.0 | | | | 30.5 | | | | 26.8 | | | | 9.0 | | | | 6.7 | | | | 8.8 | | | | 8.4 | | | | 48.3 | | | | 41.9 | |
Internal rating classes 11 to 13 | | | 0.4 | | | | 0.2 | | | | 2.8 | | | | 2.9 | | | | 0.5 | | | | 0.9 | | | | 4.5 | | | | 4.3 | | | | 8.2 | | | | 8.3 | |
Internal rating classes 14 to 22 | | | 0.6 | | | | 0.6 | | | | 0.0 | | | | 0.0 | | | | 0.3 | | | | 0.0 | | | | 1.4 | | | | 0.6 | | | | 2.3 | | | | 1.2 | |
Internal rating classes 23 to 27 | | | 0.0 | | | | 0.0 | | | | 0.0 | | | | 0.0 | | | | 0.0 | | | | 0.0 | | | | 0.1 | | | | 0.1 | | | | 0.1 | | | | 0.1 | |
Internal rating classes 28 to 30 | | | 2.4 | | | | 1.4 | | | | 0.1 | | | | 0.1 | | | | 0.5 | | | | 0.3 | | | | 0.2 | | | | 0.1 | | | | 3.2 | | | | 1.9 | |
| | | | | | | | | | | | | | | | | | | | | | | | | | | | | | | | | | | | | | | | |
Total | | | 3.4 | | | | 2.2 | | | | 56.2 | | | | 51.0 | | | | 32.8 | | | | 25.4 | | | | 16.2 | | | | 14.5 | | | | 108.6 | | | | 93.1 | |
| | | | | | | | | | | | | | | | | | | | | | | | | | | | | | | | | | | | | | | | |
| (1) | Excluding bank derivatives with an EaD of EUR 2.7 billion. |
In fiscal year 2017, the breakdown of the portfolio into rating groups remained almost unchanged compared to fiscal year 2016. Overall, the percentage of investment grade financing in fiscal year 2017 was up on the previous year from 87% to 88%. Financing with an investment grade rating (IR 10 and above) was down by 14% at the end of 2017 due to sales and repayments, while non-investment grade financing (IR 11 and below) were reduced by 17%.
Within the portfolio, the internal ratings of financing with an EaD of EUR 2.7 billion improved year on year, mainly in the Infrastructure segment, while financing with an EaD of EUR 27.9 billion – primarily Italian government bonds and municipal receivables in the Public Sector segment – was downgraded compared with fiscal year 2016.
Breakdown of Credit Portfolio by Countries and Regions
The following is a breakdown of the credit portfolio by countries and regions:(1)
| | | | | | | | | | | | | | | | | | | | | | | | | | | | | | | | | | | | | | | | |
| | | Commercial
Real Estate | | | Public
Sector | | | Structured
Products | | | Infrastructure | | | Total | |
| | | December 31, | |
| | | 2016 | | | 2017 | | | 2016 | | | 2017 | | | 2016 | | | 2017 | | | 2016 | | | 2017 | | | 2016 | | | 2017 | |
| | | (unaudited) | |
| | | (EaD in € billions) | |
Peripheral euro area countries(2) | | | 0.2 | | | | 0.1 | | | | 33.8 | | | | 30.1 | | | | 2.4 | | | | 1.6 | | | | 0.8 | | | | 0.7 | | | | 37.2 | | | | 32.5 | |
Of which Italy | | | 0.1 | | | | 0.1 | | | | 27.6 | | | | 25.5 | | | | 1.5 | | | | 0.9 | | | | 0.4 | | | | 0.4 | | | | 29.6 | | | | 26.9 | |
Of which Spain | | | 0.1 | | | | 0.0 | | | | 4.4 | | | | 3.1 | | | | 0.8 | | | | 0.7 | | | | 0.2 | | | | 0.2 | | | | 5.5 | | | | 4.0 | |
Of which Ireland | | | 0.0 | | | | 0.0 | | | | 0.2 | | | | 0.1 | | | | 0.1 | | | | 0.0 | | | | 0.1 | | | | 0.1 | | | | 0.4 | | | | 0.2 | |
Of which Portugal | | | 0.0 | | | | 0.0 | | | | 1.6 | | | | 1.4 | | | | 0.0 | | | | 0.0 | | | | 0.1 | | | | 0.0 | | | | 1.7 | | | | 1.4 | |
United Kingdom | | | 0.9 | | | | 0.5 | | | | 9.3 | | | | 8.8 | | | | 4.5 | | | | 4.2 | | | | 10.6 | | | | 10.1 | | | | 25.3 | | | | 23.6 | |
Germany | | | 1.0 | | | | 0.8 | | | | 0.7 | | | | 0.6 | | | | 1.0 | | | | 1.0 | | | | 0.3 | | | | 0.1 | | | | 3.0 | | | | 2.5 | |
Rest of Europe | | | 0.7 | | | | 0.4 | | | | 10.2 | | | | 9.8 | | | | 0.6 | | | | 0.1 | | | | 0.4 | | | | 0.5 | | | | 11.9 | | | | 10.8 | |
USA | | | 0.5 | | | | 0.4 | | | | 0.0 | | | | 0.0 | | | | 21.8 | | | | 16.3 | | | | 0.6 | | | | 0.3 | | | | 22.9 | | | | 17.0 | |
Japan | | | 0.0 | | | | 0.0 | | | | 0.5 | | | | 0.2 | | | | 0.0 | | | | 0.0 | | | | 0.0 | | | | 0.0 | | | | 0.5 | | | | 0.2 | |
Asia (excluding Japan) | | | 0.1 | | | | 0.0 | | | | 0.7 | | | | 0.5 | | | | 0.0 | | | | 0.0 | | | | 0.2 | | | | 0.2 | | | | 1.0 | | | | 0.7 | |
Rest of World | | | 0.0 | | | | 0.0 | | | | 1.0 | | | | 1.0 | | | | 2.5 | | | | 2.2 | | | | 3.3 | | | | 2.6 | | | | 6.8 | | | | 5.8 | |
| | | | | | | | | | | | | | | | | | | | | | | | | | | | | | | | | | | | | | | | |
Total | | | 3.4 | | | | 2.2 | | | | 56.2 | | | | 51.0 | | | | 32.8 | | | | 25.4 | | | | 16.2 | | | | 14.5 | | | | 108.6 | | | | 93.1 | |
| | | | | | | | | | | | | | | | | | | | | | | | | | | | | | | | | | | | | | | | |
| (1) | Excluding bank derivatives with an EaD of EUR 2.7 billion. Allocation by country of the economic risk. |
| (2) | There is no longer any exposure as regards Greece. |
The breakdown of the credit portfolio by countries and regions as of December 31, 2017 continued to show a high percentage of European borrowers (approximately 75%; December 31, 2016: 71%). As of December 31, 2017, the largest shares of the portfolio were attributable to Italy at 29% (December 31, 2016: 27%), the United Kingdom at 25% (December 31, 2016: 23%) and the United States at 18% (December 31, 2016: 21%) of the portfolio volume.
Within the Commercial Real Estate segment, a large portion of country-specific exposures as of December 31, 2017 related to property in Germany (EaD of EUR 0.8 billion; December 31, 2016: EUR 1.0 billion) and the United Kingdom (EaD of EUR 0.5 billion; December 31, 2016: EUR 0.9 billion). The largest exposures in the “Rest of Europe” category comprised loans amounting to EUR 0.4 billion, with Ukraine, France, Hungary and Luxembourg each accounting for financing of around EUR 0.1 billion. The exposures in the United States comprised U.S. real estate loans amounting to EUR 0.4 billion (December 31, 2016: EUR 0.5 billion).
37
As of December 31, 2017, the Public Sector segment comprised securities and loans with an EaD of EUR 51.0 billion (December 31, 2016: EUR 56.2 billion). Significant receivables concerned borrowers in Italy (EUR 25.5 billion) and in the United Kingdom (EUR 8.8 billion). The “Rest of Europe” region accounted for EUR 9.8 billion (December 31, 2016: EUR 10.2 billion), including government bonds and loans in the Netherlands at EUR 2.4 billion (December 31, 2016: EUR 1.7 billion), France at EUR 2.0 billion (December 31, 2016: EUR 2.0 billion), Poland at EUR 1.6 billion (December 31, 2016: EUR 1.8 billion), Belgium at EUR 1.4 billion (December 31, 2016: EUR 0.8 billion) and Switzerland at EUR 0.6 billion (December 31, 2016: EUR 0.8 billion). The assets from the Portfolio Extension already included in the amounts have an EaD of EUR 2.0 billion and are centered on European countries, mainly the Netherlands (EUR 0.8 billion) and Belgium (EUR 0.7 billion).
The Structured Products segment had a total EaD of EUR 25.4 billion as of December 31, 2017 (December 31, 2016: EUR 32.8 billion). Of this amount EUR 16.3 billion, or 64%, was attributable to the United States (December 31, 2016: EUR 21.8 billion), with EUR 9.3 billion comprising FFELP (Federal Family Education Loan Program) student loan securities (December 31, 2016: EUR 11.8 billion) and EUR 5.6 billion being accounted for by securitized receivables from municipal borrowers (December 31, 2016: EUR 6.7 billion).
Furthermore, there were material risk positions totaling EUR 4.2 billion with respect to the United Kingdom (December 31, 2016: EUR 4.5 billion), EUR 2.2 billion with respect to Canada (December 31, 2016: EUR 2.4 billion), EUR 1.0 billion with respect to Germany (December 31, 2016: EUR 1.0 billion) and EUR 0.9 billion with respect to Italy (December 31, 2016: EUR 1.4 billion). Of the EUR 0.4 billion in assets attributable to Portfolio Extension in 2017, which are already included in the figures, the largest portion (EUR 0.3 billion) relates to the United States (mainly receivables from municipal borrowers).
In the Infrastructure segment, EUR 10.1 billion, or approximately two-thirds, of the EaD was attributable to the United Kingdom (December 31, 2016: EUR 10.6 billion). Other regions with large infrastructure financings were Canada at EUR 1.5 billion (December 31, 2016: EUR 1.7 billion) and Australia at EUR 0.9 billion (December 31, 2016: EUR 1.2 billion).
Breakdown of Credit Portfolio by Remaining Maturities
The following is a breakdown of the credit portfolio by remaining maturities:(1)
| | | | | | | | | | | | | | | | | | | | | | | | | | | | | | | | | | | | | | | | |
| | | Commercial
Real Estate | | | Public Sector | | | Structured
Products | | | Infrastructure | | | Total | |
| | | December 31, | |
| | | 2016 | | | 2017 | | | 2016 | | | 2017 | | | 2016 | | | 2017 | | | 2016 | | | 2017 | | | 2016 | | | 2017 | |
| | | (unaudited) | |
| | | (EaD in € billions) | |
Remaining Maturities(2) | | | | |
Due | | | 1.3 | | | | 0.8 | | | | 0.0 | | | | 0.0 | | | | 0.0 | | | | 0.0 | | | | 0.0 | | | | 0.0 | | | | 1.3 | | | | 0.8 | |
Up to 1 year | | | 0.5 | | | | 0.2 | | | | 2.5 | | | | 0.8 | | | | 0.7 | | | | 0.6 | | | | 0.1 | | | | 0.1 | | | | 3.8 | | | | 1.7 | |
1 to 5 years | | | 1.1 | | | | 0.7 | | | | 6.4 | | | | 6.2 | | | | 3.4 | | | | 2.5 | | | | 0.8 | | | | 0.6 | | | | 11.7 | | | | 10.0 | |
5 to 10 years | | | 0.4 | | | | 0.4 | | | | 7.6 | | | | 7.2 | | | | 4.7 | | | | 4.7 | | | | 1.3 | | | | 0.9 | | | | 14.0 | | | | 13.2 | |
10 to 20 years | | | 0.0 | | | | 0.1 | | | | 20.2 | | | | 20.1 | | | | 10.9 | | | | 10.3 | | | | 2.7 | | | | 2.5 | | | | 33.8 | | | | 33.0 | |
20 to 30 years | | | 0.1 | | | | 0.0 | | | | 10.8 | | | | 9.1 | | | | 9.3 | | | | 5.9 | | | | 4.6 | | | | 4.0 | | | | 24.8 | | | | 19.0 | |
More than 30 years | | | 0.0 | | | | 0.0 | | | | 8.7 | | | | 7.6 | | | | 3.8 | | | | 1.4 | | | | 6.7 | | | | 6.4 | | | | 19.2 | | | | 15.4 | |
| | | | | | | | | | | | | | | | | | | | | | | | | | | | | | | | | | | | | | | | |
Total | | | 3.4 | | | | 2.2 | | | | 56.2 | | | | 51.0 | | | | 32.8 | | | | 25.4 | | | | 16.2 | | | | 14.5 | | | | 108.6 | | | | 93.1 | |
| | | | | | | | | | | | | | | | | | | | | | | | | | | | | | | | | | | | | | | | |
| (1) | Excluding bank derivatives with an EaD of EUR 2.7 billion. |
| (2) | Calendar year in which the next adjustment of terms will be made. |
As of December 31, 2017, the remaining maturities of receivables differed greatly depending on the segment. The receivables held in the Commercial Real Estate portfolio were primarily due in less than five years. EUR 0.8 billion, or 36%, of the receivables related to called loans, while EUR 0.2 billion will become due in fiscal year 2018.
In contrast, over two-thirds of financings in the Infrastructure segment as of December 31, 2017 were due within the next 20 years. EUR 6.4 billion of the remaining financings in the Infrastructure segment had a remaining term of more than 30 years. This related mainly to inflation-indexed bonds issued by utility companies in the United Kingdom, which were instruments whose EaD was expected to increase over time.
As of December 31, 2017, EUR 16.7 billion (33%) and EUR 7.3 billion (29%) in receivables from borrowers in the Public Sector and Structured Products segments, respectively, were scheduled to mature from 2038 onwards.
38
Watchlist and Problem Assets
| | | | | | | | | | | | | | | | | | | | | | | | | | | | | | | | | | | | | | | | |
| | | Commercial
Real Estate | | | Public
Sector | | | Structured
Products | | | Infrastructure | | | Total | |
| | | December 31, | |
| | | 2016 | | | 2017 | | | 2016 | | | 2017 | | | 2016 | | | 2017 | | | 2016 | | | 2017 | | | 2016 | | | 2017 | |
| | | (unaudited) | |
| | | (EaD in € billions) | |
Watchlist Assets | | | 0.0 | | | | 0.0 | | | | 1.7 | | | | 1.2 | | | | 0.2 | | | | 0.4 | | | | 0.5 | | | | 0.4 | | | | 2.4 | | | | 2.0 | |
Problem Assets | | | 2.3 | | | | 1.4 | | | | 0.3 | | | | 0.3 | | | | 0.5 | | | | 0.3 | | | | 0.2 | | | | 0.2 | | | | 3.3 | | | | 2.2 | |
Restructuring Assets | | | 1.9 | | | | 1.0 | | | | 0.3 | | | | 0.3 | | | | 0.5 | | | | 0.3 | | | | 0.1 | | | | 0.1 | | | | 2.8 | | | | 1.7 | |
Workout Assets | | | 0.4 | | | | 0.4 | | | | 0.0 | | | | 0.0 | | | | 0.0 | | | | 0.0 | | | | 0.1 | | | | 0.1 | | | | 0.5 | | | | 0.5 | |
| | | | | | | | | | | | | | | | | | | | | | | | | | | | | | | | | | | | | | | | |
Total | | | 2.3 | | | | 1.4 | | | | 2.0 | | | | 1.5 | | | | 0.7 | | | | 0.7 | | | | 0.7 | | | | 0.6 | | | | 5.7 | | | | 4.2 | |
| | | | | | | | | | | | | | | | | | | | | | | | | | | | | | | | | | | | | | | | |
Risk positions are classified as “Watchlist Assets” if the payment is delayed for more than 60 days or if another specified criterion triggers intensified monitoring of the given risk position.
The “Restructuring Assets” category contains exposures for which specific loan loss provisions were recognized as well as exposures that have defaulted according to the Basel III criteria (e.g., payment past due for more than 90 days).
“Workout Assets” comprise risk positions where a restructuring seems unfeasible, where legal action has been initiated and where a risk provision has been recognized.
“Restructuring Assets” and “Workout Assets” are combined in the “Problem Assets” category.
The decline in watchlist and problem assets exposures by EUR 1.5 billion, or 26%, is mainly due to repayments and sales in the Commercial Real Estate and Public Sector segments.
The early warning system is designed to identify and closely monitor borrowers of FMS-WM whose credit or collateral quality might deteriorate. Non-performing risk positions where payment arrears exceed 90 days are assigned to non-performing loan management (i.e., Restructuring, Workout). This involves testing for impairment at regular intervals and upon occurrence of certain predefined events (trigger events) to determine the need for write-downs. If this is the case, a proposal for specific loan loss provisions is prepared and submitted for approval to the relevant committee of FMS-WM.
The amount of the general loan loss provisions is determined by considering the PD and the LGD.
Major Challenges from Counterparty Default Risks
FMS-WM has assumed major risks by taking over the portfolio effective October 1, 2010 and the subsequent Portfolio Extensions. These risks can lead to further recourse to the Federal Republic of Germany’s loss compensation obligations and therefore to additional burdens on Germany’s federal budget. The most important of these risks are as follows:
| | • | | Portfolio concentration: The EL of a credit portfolio shows the expected value of the credit losses occurring within a specific forecast horizon as a result of the default risks to which the portfolio is exposed. However, actual portfolio losses can be smaller or considerably larger. The greater the concentrations in the portfolio, the greater the danger that actual losses will differ significantly from the average EL. FMS-WM’s portfolio exhibits strong concentrations especially in the Public Sector segment, in particular with respect to Italy and the other peripheral euro area countries. |
| | • | | Long maturities: Around 87% of the risk positions have a remaining maturity of more than five years, and 72% will not be due for more than ten years. A total of 17% have a remaining maturity of over 30 years, and many of these are inflation-indexed securities for which the exposure is expected to grow significantly over time. |
| | • | | Risks of hedging transactions: FMS-WM’s risk strategy stipulates broad hedging of the credit portfolio against market risks, such as interest rate risk and foreign exchange risk. In the event of default of the underlying credit risk positions, substantial additional losses can arise from the termination of the associated market risk hedging transactions. |
| | • | | Restructuring risks: In many cases, FMS-WM has taken over syndicated loans; occasionally, it holds junior positions making it difficult to control or influence the structure. This in turn may trigger restructuring risks. |
| | • | | Financing structures: The financial and economic crisis has fundamentally changed the credit and capital markets. A significant number of FMS-WM’s risk positions comprise exposures that were liquid at one time but have turned out to be illiquid since the crisis. To make matters worse, in some market segments overall positive earnings contributions for FMS-WM are hardly realistic anymore, even in view of the currently favorable funding options, because the credit margins agreed at the time of entry into the agreement no longer correspond to today’s expectations of default for the risk positions. |
39
The implementation of requirements under the HGB regarding the recognition of “adequate risk provisions” is proving challenging in view of the aforementioned risks. As a rule, FMS-WM recognizes specific loan loss provisions only on exposures that are either already non-performing or where full repayment at maturity is no longer expected from today’s vantage point. The adequate amount of the specific loan loss provisions for risk positions where FMS-WM expects to liquidate the provided collateral is determined by discounting the expected proceeds from collateral disposal using a risk-free interest rate. While general loan loss provisions are recognized for potential default risks based on the EL for a one-year forecast horizon, country risk provisions are recognized as generalized specific loan loss provisions for selected countries to address transfer and conversion risks.
Market Risks
Definition
Any impairment of the value of the risk positions due to changed market conditions and market price factors gives rise to market risks. The following types of market risks are particularly relevant to FMS-WM:
| | • | | Interest rate risk: This risk concerns the change in the present value of risk positions due to changes in the respective market interest rates. |
| | • | | Foreign exchange risk: This risk results from a change in foreign exchange rates and indicates how the given change will affect the value in euros of a foreign exchange exposure. |
| | • | | Credit spread risk: This risk concerns the change in the present value in the event of changes in the underlying credit default swap or credit spread curve. |
| | • | | Other market risks primarily include: |
| | – | | Basis risk: Basis risk, such as foreign exchange basis risk or interest rate basis risk, can arise when transactions are financed with mismatches in currencies and/or terms and when reference interest rates for variable-rate transactions differ. |
| | – | | Inflation risk: Inflation risk describes the change in the present value of products whose interest or principal payments are linked to certain national or regional consumer price indices (inflation rates). |
According to the current risk profile, the key market risk factors relevant for FMS-WM’s risk management are interest rate risk and foreign exchange risk.
As in the past, FMS-WM is not exposed to equity and commodity risks. Market liquidity risk is not considered material as fire sales at unacceptable prices can be largely ruled out as a result of the funding opportunities available to FMS-WM and of the commitment made by SoFFin to provide FMS-WM with liquidity in a crisis situation.
Risk Strategy
Market risks may not be entered into purely to seek a profit, but instead only with the aim of unwinding existing risk positions or preventing new risk positions from arising. This limits possible fluctuations in portfolio value.
The objective of the market risk strategy is to minimize the fluctuations in the fair value and profit/loss of the asset portfolio induced by market risk factors. The accounting and the income statement according to the standards of the HGB are relevant in this context. The ratio of the expenditure required for hedging purposes to the realizable benefits must be commercially reasonable. The goal is to unwind the existing risk positions and avoid new ones.
To support the wind-up strategy and if requested by portfolio management, hedging derivatives can be unwound at any point in time regardless of the sale of the risk position in order to increase the flexibility of planned restructuring and wind-up activities. In a way identical to that used for the rest of the portfolio, the interest rate risks of the risk exposures from approved wind-up strategies are identified, measured, limited strictly and separately, and reported daily as a separate item. The approved wind-up strategies are monitored by the responsible portfolio managers and reported regularly (at least quarterly) to the Executive Board.
The Group Treasury unit operates on the principle that it has discretion to act within predetermined limits. Its market units are responsible for the operational management of open positions; the Risk Controlling department is responsible for monitoring, and the ALCO is in charge of setting limits and establishing principles in connection with risk steering.
40
Risk Identification
Market risks exist because of the structure of the portfolio, particularly in the form of interest rate and foreign exchange risks. The risks arising from changes in credit spreads are monitored in current reporting, but due to the general intention to hold the positions until final maturity, they are not limited. Recognition of all third-party securities using the moderate lower-of-cost-or-market principle prevents an increase in credit spreads from having a direct impact on profit or loss as long as an impairment is not permanent and FMS-WM holds the given securities to maturity.
FMS-WM Service’s daily data deliveries as well as both the information available in the IT systems along with current market data serve as the basis for identifying the market risks.
Risk Analysis and Assessment
Interest rate risks are measured using sensitivity analyses, i.e., the effects of a shift in interest rate curves by one basis point, at the net present value of the relevant risk positions. Separate analyses by maturity ranges enable FMS-WM to perform more extensive analyses of interest rate risks besides their sensitivity to a parallel shift, e.g., when the curve turns. In addition to the detailed analysis by maturity range, separate assessments by currency are performed to take into account that every currency has a different interest rate curve. In measuring interest rate risk, FMS-WM takes into account neither the margin components of cash flows nor credit spreads when discounting.
With the aim of reducing fluctuations in parameters relevant to income, FMS-WM’s on-balance-sheet foreign currency position is determined, analyzed and controlled on a monthly basis. In addition, foreign exchange risks are analyzed based on sensitivities via a change in the net present value in case of changes in exchange rates by 1% relative to the euro.
Credit spread risks are discounted based on the current credit spreads. The parameter used in this case is the change in the net present value for credit spread changes by one basis point.
Suitable quarterly stress tests based on hypothetical but plausible and historic interest rate, foreign exchange and credit spread scenarios complement risk measurement and analysis based on sensitivities. These stress scenarios encompass, among others, scenarios similar to those proposed by the Deutsche Bundesbank with respect to the interest rate, foreign exchange and credit spread risks. Apart from these scenarios arising from changes in each type of market risk, FMS-WM also analyzes the extent of the change in the net present value of the portfolio if extreme historical or hypothetical market shifts were to occur for all types of market risk.
Risk Steering
The Group Treasury unit opens risk positions only to a limited extent and subject to the existing limits for purposes of risk steering. This is particularly necessary for short-term liquidity management, which can expose FMS-WM to short-term interest rate risks, for example. In addition, the management of interest rate and foreign exchange risks may give rise to a limited amount of open risk positions subject to the existing limits. For reasons of efficiency, risk positions are not effectively hedged unless they reach certain transaction volumes in order to avoid price surcharges in the case of smaller transaction volumes or short-term market distortions. In steering market risks, write-downs are appropriately recognized for risk positions.
The portfolio management units and the Group Treasury unit may only utilize approved financial instruments for hedging the risk positions.
Interest rate risks are managed using a limit system for interest rate sensitivities per currency and maturity range, including an escalation process for limit breaches. For interest rate risks from risk positions for which hedging derivatives were unwound pursuant to a wind-up strategy at a point in time regardless of whether the risk position has been sold, separate limits are determined on submission of the wind-up strategy for the relevant portfolio. The Risk Controlling department monitors these strict limits within the approved range. Reviews of the wind-up strategies are conducted at least quarterly and include the management of interest rate risks. The Group Treasury unit is tasked with the management of interest rate risks in accordance with the stipulations from the wind-up strategies.
The approach to managing the foreign currency position is based on managing the on-balance-sheet foreign exchange position calculated monthly such that the effects of fluctuations from changes in foreign exchange rates on income are as low as possible. To this end, specific limits are defined per primary currency along with a limit for secondary currencies and an escalation process. The limits are monitored monthly based on the previous month’s on-balance-sheet foreign currency position as well as postings of foreign exchange transactions that are relevant to the balance sheet and have occurred in the interim. Foreign exchange sensitivities are additionally calculated and monitored on a daily basis. Significant changes trigger a root cause analysis in order to ensure that any foreign exchange position relevant to the balance sheet can be hedged in a timely manner if necessary.
41
The risks from changes in credit spreads are not limited, since FMS-WM’s general task is to unwind the portfolio in a way that maximizes its value. These risks are managed by the portfolio management units as part of portfolio wind-up.
Risk Monitoring and Reporting
Market risks may not exceed sensitivity limits in the daily risk management process. Limits are monitored based on the daily market risk report that is prepared by FMS-WM Service and analyzed by FMS-WM’s Risk Controlling department. The report, which also includes the credit spread sensitivities, is made available to both the Executive Board and the Group Treasury unit on a daily basis. The defined review and escalation process applies whenever limits are exceeded. In case the approved limits for exposures from wind-up strategies are exceeded, the measures defined for this event by the adopted strategies would be triggered.
Additionally, the ALCO report to the members of ALCO and the monthly wind-up report to both the Executive Board and the Supervisory Board discuss market risks in varying levels of detail.
Risk Position
The main factors affecting interest rate sensitivities are exposures in assets and liabilities with fixed interest rates where the interest rate risks are hedged largely through interest rate derivatives. As determined based on the method applied, the portfolio’s interest rate sensitivity as of December 31, 2017 was EUR 0.39 million (December 31, 2016: EUR –0.12 million). This means that, if the interest rate curves of all currencies simultaneously were to rise by one basis point, the present value of the portfolio would increase by EUR 0.39 million. Substantial interest rate sensitivity exposures as of December 31, 2017 concerned the euro in an amount of EUR 0.36 million (December 31, 2016: EUR –0.17 million) and the U.S. dollar in an amount of EUR 0.03 million (December 31, 2016: EUR 0.12 million). The change in interest rate sensitivity is largely due to positions in the short-term maturity range. As in fiscal year 2016, the positions from approved wind-up strategies do not entail additional risks as of December 31, 2017.
On all trading days in fiscal year 2017, interest rate sensitivity lay within a bandwidth of EUR -0.17 million to EUR 0.73 million.
Given the stress scenarios defined for interest rate risks, a parallel decrease in all interest rate curves by 200 basis points would have the greatest negative impact on the present value in an amount of EUR 109 million as of December 31, 2017 (December 31, 2016: EUR -85 million in the case of a 200 basis point increase). The change in the impact of this scenario results from the change in interest rate exposures.
Foreign exchange risks are managed based on the balance sheet position and the derivative hedging positions subject to compliance with the fixed limits. The open foreign exchange position as of December 31, 2017 amounted to EUR 1 million in aggregate for all currencies (December 31, 2016: EUR 8 million). The foreign exchange position shown in the balance sheet is closed to an extent that enables compliance with the approved limits. Stress scenarios are calculated comparable to the foreign exchange sensitivities that are determined on a daily basis. Given the defined foreign exchange stress scenarios, an increase by 15% in the value of the euro against all other currencies would have the greatest negative impact on the net present value in an amount of EUR –24 million (December 31, 2016: EUR –53 million in the case of a decrease in the value of the euro by 15%).
Since interest rate exposure in the wind-up portfolio is largely closed, any future changes in interest rate curves will only minimally influence the present value of FMS-WM’s portfolio.
Inflation risks—as an aspect of market risks—are still deemed to be minor. Most of them are hedged. Inflation sensitivities are low and remain relatively constant.
Liquidity Risks
Definitions
FMS-WM distinguishes between tactical and strategic liquidity risks:
| | • | | Tactical liquidity risk: The risk of not being able to generate sufficient cash on short notice such that present or future payment obligations may not be fulfilled at all or not in full when due under the contract. |
42
| | • | | Strategic liquidity risk: The risk of only being able to implement the necessary measures described in the funding strategy in the market at greater expense. For instance, an unexpected rise in funding costs might result from general market distortions or idiosyncratic events. |
Risk Strategy
The liquidity risk strategy aims to ensure that FMS-WM is solvent at all times, even under stress conditions. To ensure that this is the case, FMS-WM holds highly liquid, ECB-eligible assets in the form of own and third-party bonds, which, indirectly through securities repurchase agreements, represent a sufficient liquidity reserve, and also limits daily cash outflows to no more than EUR 2 billion. Furthermore, an average remaining maturity of at least 90 days is targeted for money market instruments.
In addition, FMS-WM diversifies its funding in terms of the investor base, maturities (money and capital market), product range (secured and unsecured products and programs), markets (e.g., countries) and currencies. FMS-WM has established broad access to foreign currency funding (in particular in USD and GBP) and is able to tap liquid foreign exchange rate markets (spot and derivative foreign exchange rates) at all times.
When obtaining liquidity, FMS-WM aims to ensure that its credit rating is not adversely affected. Within this framework, FMS-WM aims to optimize its liquidity costs.
Risk Identification
To identify the tactical liquidity risk, the liquidity maturity profile is:
| | • | | analyzed for each maturity range based on different scenarios and then compared to the liquidity cushion; and |
| | • | | analyzed by product group and compared to the internal control limits imposed by Group Treasury unit. |
Strategic liquidity risks are identified by means of an analysis of the expected funding costs based on the long-term funding structure and the expected cash outflows in accordance with the assumptions under both the winding-up plan and the funding plan.
Risk Analysis and Assessment
Analyzing the tactical liquidity risk requires determining the liquidity position by means of the maturity profile of all assets and liabilities (gap profile), which is based on the 24-month forecast for three components:
| | • | | Contractual cash inflows and outflows including nostro accounts; |
| | • | | Assumptions with respect to: |
| | – | | extensions of available assets; |
| | – | | drawdowns from credit lines granted; |
| | – | | availability of the funding instruments; and |
| | – | | liquidity effect of market scenarios (including interest rate, foreign exchange and credit spread scenarios); and |
| | • | | Liquidity reserve encompassing liquid, free securities eligible for ECB funding purposes. |
In terms of assumptions, FMS-WM analyses two scenarios in its daily risk report with a methodology that reflects the special situation of FMS-WM. Both scenarios include the normal case as the basic assumption and a global financial market crisis as the stress scenario.
Monthly back-testing enables regular reviews of the adequacy of the assumptions in the scenarios. During this process, the projected liquidity position is compared with the actual liquidity position. The assumptions for the normal case and the stress scenario remained the same as in fiscal year 2016.
Strategic liquidity risk is determined by analyzing the deviation of the actual funding volume from the funding plan, the deviation of the funding costs from the funding plan as well as funding concentrations. Building on this, an analysis of the effects of an increase in FMS-WM’s own funding cost rate on net interest income is conducted on a quarterly basis.
43
Risk Steering
Tactical liquidity is managed by Liability Management in the Group Treasury unit, which is responsible for ensuring the availability of short-term liquidity at any time. Secured and unsecured money market instruments are available to this end based on an approved product catalogue.
Strategic liquidity is also ensured by Asset Liability Management in the Group Treasury unit. This unit prepares the long-term funding strategy and the funding plan derived from such strategy. The funding plan is implemented by using direct access to the capital markets via issues with maturities of more than one year.
For the purpose of limiting liquidity risk, the scenario that would significantly affect FMS-WM, given its funding structure, was selected out of the defined stress scenarios. The global financial market crisis scenario and a minimum survival period of 90 days were fixed as the limit based on the experience of recent years. Within this period, the liquidity position must be positive even under the premises of the defined scenario such that FMS-WM remains solvent at all times by realizing its liquidity reserve.
The liquidity contingency plan fixes the actions that must be taken in the event of a liquidity shortfall.
Risk Monitoring and Reporting
FMS-WM’s liquidity profile is monitored daily and reported to both the Executive Board and the Group Treasury unit. The Risk Controlling department monitors compliance with the limit on a daily basis. The following escalation process is carried out in case of limit breaches:
| | • | | First: the Group Treasury unit verifies the limit breach and gives its view of the expected duration of the breach and the actions required to cure it. |
| | • | | Second: the Risk Controlling department comments on these measures and monitors their implementation. |
| | • | | Third: The Executive Board is notified immediately of the limit breach. |
As long as the limit breach has not been remedied, the Executive Board and the Group Treasury unit are kept informed daily of the degree to which agreed-upon steps have been implemented. The ALCO is also informed of the limit breach as part of the regular reporting. In addition, the liquidity position is reported monthly to the Executive Board and the Supervisory Board as part of the wind-up report.
Risk Position
In fiscal year 2017, FMS-WM’s funding strategy was validated in the money and capital markets by a stable and broadly diversified investor base.
FMS-WM’s issuing activity under the existing money market programs, namely the ECP/CD Program and the U.S. ABCP Program through its U.S. vehicle, Kells Funding LLC, further contributed to a stable and sustainable funding structure for FMS-WM in fiscal year 2017. The average remaining maturity of money market instruments was kept constant, and FMS-WM was able to utilize it according to plan.
FMS-WM has been a regular and reliable issuer on international capital markets since 2011. As a result, capital market issues in an amount equivalent to EUR 19.3 billion were placed by FMS-WM in fiscal year 2017 (2016: EUR 15.8 billion), with capital market issues in euro and U.S. dollar dominating the funding activities.
As of December 31, 2017, FMS-WM’s positive liquidity cushion was EUR 10.9 billion based on the assumptions of the stress scenario, global financial market crisis, and pursuant to the defined minimum survival period of 90 days (December 31, 2016: EUR 9.6 billion).
44
Operational Risks
Definitions
Operational risks include all risks that can arise from the inadequacy or failure of internal processes, employees, systems, or due to external events. The following operational risks are of particular relevance for FMS-WM:
| | • | | Outsourcing risk: The risk of potential losses from the outsourcing of institute-specific activities and processes to third parties. Aside from the default of the service providers, this also includes the risk that services contracted for are not provided at all or not in the stipulated quality or within the stipulated time. |
| | • | | Project risk: The risk that FMS-WM cannot fulfill key functions and meet planned goals for department-related and/or IT projects, or fulfill or meet these adequately, owing to unsuccessful or late implementation, or implementation at higher than anticipated project costs. |
| | • | | IT risk: Denotes all risks to FMS-WM’s asset position and results of operations as a result of shortcomings related to IT management and IT steering, respectively, the availability, confidentiality, integrity and authenticity of data, the internal control system of the IT organization, the IT strategy, IT guidelines and IT aspects of the rules of procedure or the use of information technology. |
| | • | | Legal risk: Denotes the risk of losses arising from the deliberate and inadvertent breach of applicable legal (including contractual) provisions, from the unenforceability of contractual claims and from legal disputes generally. |
Risk Strategy
The main objective is generally to prevent and reduce these risks and specifically in relation to:
| | • | | Outsourcing risk to ensure excellent performance by service providers and therefore operating stability as well as to guarantee profitable portfolio management; |
| | • | | Project risk to achieve the project objective on schedule and within the budgeted project costs; |
| | • | | IT risk to ensure a risk- and earnings-oriented approach to IT management addressing the proper functioning of IT, the stability of the applications used and the data contained in the applications; |
FMS-WM counters legal risks by involving the Legal & Compliance department at an early stage.
Risk Identification
Operational risks at FMS-WM and FMS-WM Service are identified through annual operational risk self-assessments, the documentation of operational risk events and losses, and the early warning indicators required to be captured on a regular basis.
Given the substantial significance of the outsourcing risk, FMS-WM has set up a separate department that is dedicated to managing and monitoring outsourcing risk. The relevant departments/units participate in identifying risks concerning the outsourced activities and processes.
Project risks are identified in a two-step process by which risks are reported and recorded by the relevant project manager. On certain projects, a risk database is used to perform a full risk identification exercise.
IT risk is identified by means such as error logs in the event of the unavailability of or interruptions to IT systems. The internal control system and the defined IT controls are also used in the process.
Legal risks due to changes in the existing legal environment are identified by the departments on the basis of a tool that receives information from the Association of German Public Banks (Bundesverband Öffentlicher Banken Deutschlands).
Risk Analysis and Assessment
Operational risks at FMS-WM and at FMS-WM Service are analyzed and assessed as follows:
| | • | | ex post, via the recording of relevant operational (loss) events in the common event/loss database within the common computerized operational risk workflow tool; |
45
| | • | | ex ante, via the results of the standardized operational risk self-assessments conducted each year, which includes estimating the probability of occurrence and potential losses in the common computerized operational risk workflow tool; and |
| | • | | by analyzing early warning indicators. |
The Sourcing & Servicer Steering department analyzes and assesses outsourcing risk as part of the risk analyses in conjunction with the affected departments/units and with Group Internal Audit and Risk Controlling departments. In this context, the first step is to classify the outsourced activities according to materiality using a structured questionnaire with risk assessments.
Additional risk analyses and assessments are carried out for material outsourcing activities. These risk analyses are updated as necessary but at least once a year. If material risks are identified, the affected department is required to document the risk immediately in the operational risk self-assessment. Non-material risks are recorded in the course of the annual operational risk self-assessment.
The risk with respect to relevant projects is analyzed and assessed based on evaluations of the project risk’s probability of occurring and its potential impact using defined scales. Combining the two parameters yields an overall assessment that entails classifying each individual project risk into a risk matrix. Based on specific combinations, risks are classified as low, high or critical. Analyzing and assessing the risks is the job of the project manager, who determines the criticality of the risks depending on their degree of influence on the major goals of the project.
The IT Steering & Project Planning department assesses and determines the probability of occurrence of an IT risk at regular intervals. In addition, risk analyses are performed in order to assess the need to protect applications and to assess IT service providers and their subcontractors.
The legal risks of a transaction are analyzed and assessed by staff brought in from the Legal & Group Compliance unit, if necessary with the involvement of external law firms. General legal risks arising from changes in the legal environment are analyzed and assessed by the unit responsible for the relevant requirements.
Risk Steering
For potential operational risks classified as critical in the operational risk self-assessment, action plans and measures must be agreed and implemented that serve to reduce the loss amount and/or the probability of occurrence. The measures are documented in the common computerized operational risk workflow tool. These risks are managed by FMS-WM Service or by the relevant department of FMS-WM in accordance with assigned responsibilities. A contingency plan has been defined for all processes critical to operations with the aim of hedging operational risks within FMS-WM. The new-product process (NPP) serves to lower risks arising in connection with operating new products for example.
Outsourcing risk is steered by agreeing qualitative performance indicators and by requesting regular assessment of the end products from the recipients of these deliverables. The assessments factor in timeliness and quality, and are documented in service management software. The quality of performance is ensured by regular communication with the service provider and through measures that are coordinated with them and monitored by FMS-WM. Escalation processes that start with the responsible staff member and end with the Executive Board have been defined for performance of the measures.
Project risks are managed by the respective project manager using suitable risk-reducing measures presented to the steering committee for approval and by way of monitoring of the implementation and effectiveness of the measures adopted.
IT risks are managed by FMS-WM Service acting as a retained organization. FMS-WM Service was engaged by FMS-WM to carry out measures to mitigate IT risks under a service provider agreement. Appropriate management and monitoring bodies were put in place and internal controls implemented to monitor compliance.
FMS-WM uses clearly defined governance structures and processes to manage legal risks. FMS-WM’s close cooperation with FMS-WM Service and supervisory bodies/regulators makes it possible to identify potential future risks early on and avoid them before they arise. External specialists are used as necessary in connection with legal matters.
The Legal department in the Legal & Group Compliance unit manages and controls the work of FMS-WM Service in cooperation with the Legal & Group Compliance unit of FMS-WM Service and monitors legal risks that may arise for FMS-WM in its dealings with third parties.
46
In particular, FMS-WM counteracts the risk of internal and external fraud based on an internal control system (“ICS”) and an Internal Audit unit, and by increasing employees’ risk consciousness and the need for vigilance.
Risk Monitoring and Reporting
Operational risks that concern services are monitored directly by FMS-WM Service. Operational risks and losses incurred by FMS-WM Service or by FMS-WM are reported to the Executive Board and the Supervisory Board in the monthly wind-up report. The results of the operational risk self-assessment (“ORSA”) are reported to the Executive Board and the Supervisory Board either in a separate ORSA report or in an annual operational risk report, which also covers the operational events and loss events that occurred and the key risk indicators.
FMS-WM Service publishes a quarterly report on relevant key risk indicators determined in cooperation with FMS-WM’s Risk Controlling department; this report addresses potential operational risks at FMS-WM, FMS-WM Service and potential operational outsourcing risks of FMS-WM and is presented to the Executive Board once a year as part of operational risk reporting.
The reports described above provide the Executive Board with a comprehensive overview of operational risks, both at FMS-WM Service and at FMS-WM.
Monitoring outsourcing risk is the responsibility of the Sourcing & Servicer Steering department. The performance of outsourcing partners is reported in a monthly wind-up report and in a detailed service provider management report provided to the Executive Board.
Project managers report at weekly or monthly project status meetings on changes in the project risk situation as well as the status of implementation and effectiveness of mitigation measures adopted.
IT risks are monitored by way of reports on current IT projects and the capability of IT service providers. In parallel, regular checks are performed on IT processes and workflows. In doing so, measures to mitigate IT risks are implemented and any shortcomings identified are documented and remedied.
The relevant management is informed if significant legal risks emerge or threaten to emerge in relation to individual transactions. Legal and regulatory changes as well as changes in general case law are monitored by the individual departments.
Risk Position
Operational risks at FMS-WM and FMS-WM Service were reduced in fiscal year 2017.
In fiscal year 2017, an EL of EUR 13.3 million (2016: EUR 16 million) was estimated for FMS-WM and FMS-WM Service in the context of the annual operational risk self-assessment. The lower estimate primarily reflected the portfolio wind-up and the streamlining of the organizational structure. As in fiscal year 2016, no material individual risk was identified.
Out of the total of all identified operational risks, 97% had an EL of less than EUR 0.1 million, while 3% amounted to between EUR 0.1 million and EUR 0.5 million. An EL over EUR 0.5 million is only expected for one scenario.
Other Risks
In addition to the credit risk, market risk, liquidity risk and operational risk described above, the following risk types are also material to FMS-WM.
Equity Risk
Equity risk arises at FMS-WM especially from the investment in the Depfa Group and FMS-WM Service.
Including the hybrid bonds acquired in May 2015, the book value of the Depfa Group’s equity instruments held by FMS-WM amounted to EUR 1,020 million as of December 31, 2017 (December 31, 2016: EUR 937 million). FMS-WM regularly conducts impairment testing of the book value of the investment using a discounted cash flow model, which is based on the Depfa Group’s current business plan. Assuming a one-year forecast horizon and a confidence level of 99.95%, the Depfa Group estimated in the group-wide analysis of its risk-bearing capacity, which includes all the Depfa Group risk positions, that its capital requirement for covering unexpected losses stood at EUR 0.2 billion as of December 31, 2017 (December 31, 2016: EUR 0.4 billion).
47
The decline in economic capital results from a decline in market and credit risks due to the repayments and the sale of assets to FMS-WM and rating improvements. Assuming that the unexpected losses calculated in the analysis of the risk-bearing capacity were to immediately affect cash flow and were incurred in addition to the business developments projected in the discounted cash flow valuation model, this results in an equity risk (possible reduction in the company’s value) of EUR 0.2 billion as of December 31, 2017 (December 31, 2016: EUR 0.4 billion).
The Risk Controlling department at FMS-WM receives the monthly “Depfa Wind Down Report,” which is the primary tool for monitoring and managing changes in various risk types affecting the Depfa Group. Suspicious or implausible developments and ad hoc queries regarding the Depfa Group’s risk positions can be tracked using the daily market liquidity and counterparty risk reports as well as other reports prepared at different intervals.
For major parts of the Depfa Wind Down Report, triggers have been defined which, if exceeded, require a report to be made to the head of Risk Controlling & Quantitative Analytics outlining the event that occurred, including the measures already taken by the Depfa Group.
Major operational risk events and identified material operational risks are similarly reported on an ad hoc basis to the Risk Controlling department at FMS-WM in line with the limits stipulated for FMS-WM. The Risk Controlling department informs the head of Risk Controlling & Quantitative Analytics accordingly. The risks arising from FMS-WM Service continue to be measured and managed by way of direct documentation of the operational risk in the uniform management processes for operational risk applicable to both FMS-WM and FMS-WM Service.
Tax Risk
Tax risk assessed on a qualitative basis results from potential changes in tax legislation, from potential changes in tax jurisdiction and from interpretations in the application of tax laws that potentially differ from those of the tax authorities. FMS-WM uses clearly defined processes to analyze and manage tax risks. It turns to external advisers as necessary in connection with tax matters.
Regulatory Risk
Regulatory risk, which is also assessed on a qualitative basis, is the risk that lawmakers or regulatory authorities will change the existing legal framework, with the change entailing a negative impact on FMS-WM. Among other things, a data service distributed by the Association of German Public Banks (VÖB RADAR) is used to identify regulations relevant to FMS-WM. Group Compliance department monitors the implementation of necessary measures and reports to the Executive Board at regular intervals.
Assessment of the Overall Risk Exposure and Outlook
The largest risks to which FMS-WM is exposed are credit risk, operational risk, in particular outsourcing risk, and the equity risk resulting from the takeover of the Depfa Group.
FMS-WM’s credit risks arise from the portfolio transferred to FMS-WM from the HRE Group and from the Portfolio Extensions. With the exception of a few cases related to forced extensions, restructurings and rescue acquisitions subject to strict limits, FMS-WM, according to its charter, may not engage in any new business that entails additional credit risks.
The portfolio of FMS-WM comprises financing, with some positions having very long maturities. Furthermore, the portfolio also carries high concentration risks which are expected to intensify further over time due to the varying speed with which the portfolio will be unwound through scheduled and unscheduled principal repayment or sales. The greater the concentrations in the portfolio, the greater the danger that actual losses will differ significantly from the average losses expected at the overall portfolio level. Defaults in large positions in the portfolio could therefore put significant downward pressure on financial results. In keeping with its wind-up strategy, which seeks to maximize the assets’ value, FMS-WM intends to incrementally reduce the credit risks pursuant to the guidance in the winding-up plan.
The sales in fiscal year 2017 focused on public-sector financing, in particular Italian government bonds. Securitizations, French and U.K. infrastructure loans and a relatively large position in commercial real estate financing were also sold.
FMS-WM recognizes risk provisions for at-risk and impaired risk positions by recognizing specific loan loss provisions for loans or by writing down securities. In addition general loan loss provisions are recognized for potential default risks in the portfolio. If necessary, country risk provisions are recognized for country risks.
48
Market and counterparty risks are subject to stringent limits and extensive monitoring. Changes in the interest rate risk, foreign exchange risk and counterparty risk to be monitored arise in particular from funding and hedging activities. In the case of certain sales strategies, hedging instruments can be unwound at a point in time unrelated to the sale of a position. The resulting open market risk positions are monitored, subjected to limits and reported separately. Regular reports are issued on the progress of the wind-up strategies. If necessary, when market conditions or the prospects of implementing the individual strategy change, the positions are hedged again. At the end of fiscal year 2017, there was no outstanding market risk exposure from individual sale strategies.
Besides managing the extended wind-up portfolio, activities in fiscal year 2017 focused again on the winding up of the Depfa Group. To this end, FMS-WM acquired further Depfa liabilities, a large portion of which were sold to the Depfa Group in November 2017. In return, FMS-WM purchased assets from the Depfa Group’s cover pool. The transaction brought about a further reduction in the total assets and therefore the exposures of the Depfa Group.
Liquidating the assets transferred to FMS-WM from the HRE Group and winding up the Depfa Group in a way that maximizes the assets’ value will continue to be the focus in fiscal year 2018.
49
INTERNAL CONTROL / RISK MANAGEMENT SYSTEM RELEVANT TO THE FINANCIAL REPORTING PROCESS (ICS/RMS)
The ICS and the risk management system relevant to the financial reporting process of FMS-WM serve to ensure compliance particularly with financial reporting standards and requirements and the reliability of its accounting.
Accounting (Finance & Tax department) is assigned to the Risk & Finance division and managed by the head of the Finance, Controlling & Portfolio Steering unit.
Responsibility for the general ICS, which is focused on financial reporting and business-critical processes, rests with the central ICS entity in the IT, Sourcing & Operations unit, which is part of the Chief Operating Officer division.
FMS-WM has outsourced material aspects of its accounting, with its subsidiary—FMS-WM Service—essentially handling asset management, general ledger and subledger accounting including financial accounting, master data management, payment transaction handling, regulatory reports and annual financial statement preparation.
In addition to services directly related to accounting, IT services were also outsourced; these are also relevant to the ICS.
IT services are monitored by the IT Steering & Project Planning department in the IT, Sourcing & Operations unit.
The IT service providers are also subject to the ICS at FMS-WM pursuant to contractual provisions.
FMS-WM’s departments manage and supervise these services by applying the criteria defined in service level agreements. FMS-WM’s employees in the Finance & Tax department manage outsourced activities related more specifically to accounting.
In addition to its responsibilities for monitoring and managing outsourced services, FMS-WM is also the ultimate authority for the following methods and decisions related to the financial reporting process:
| | • | | Making decisions on recognition, measurement and disclosure options; and |
| | • | | Preparing booking instructions, e.g. for valuations, provisions and deferred taxes. |
An interdepartmental new-product process (NPP) managed by the Risk Controlling department, which is part of the Chief Risk Officer/Chief Financial Officer division, ensures the correct mapping of products and product enhancements that do not yet exist.
The basic task of FMS-WM’s ICS is to fulfill the following important principles:
| | • | | Safeguarding the effectiveness and efficiency of operations; |
| | • | | Propriety and reliability of internal and external accounting; and |
| | • | | Compliance with legal requirements relevant to FMS-WM. |
Based on the target levels of customary market standards (COSO framework), the principal objectives for the ICS at FMS-WM were specified as follows:
| | • | | Increase transparency and reliability of management-related information for effective and efficient management; |
| | • | | Protect business assets by reducing the potential for fraud; |
| | • | | Increase process reliability and/or reduce the likelihood of errors in the processes; |
| | • | | Create the means to be able to point out opportunities and undesirable developments more quickly; and |
| | • | | Ensure compliance with internal and external regulations. |
The planning and design of operational control procedures for the ICS takes into account FMS-WM’s internal business policy objectives and principles. To this end, individual control objectives that are derived from the overall objectives are defined for the planned control procedures. These accounting-related control objectives relate to the statements and disclosures in the annual financial statements as to completeness, recognition, accuracy, measurement, rights and obligations, presentation and compliance with the accrual basis of accounting.
Overall responsibility for FMS-WM’s ICS lies with the Executive Board.
50
The central ICS entity ensures that the ICS framework is firmly integrated in the units of FMS-WM and its service providers. It handles the centralized management of the ICS database, the coordination of the annual standard ICS procedure, and the consolidation of the ICS control confirmation into a high-level ICS report. To ensure the effectiveness of FMS-WM’s ICS, the ICS framework is regularly reviewed for compliance with legal provisions and industry standards, and updated as appropriate.
The relevant unit heads are responsible for identifying the controls required, implementing an appropriate control system in conjunction with the risks relevant to bookkeeping and accounting and business-critical risks, and monitoring performance of the controls. The identified control owner is responsible for defining and performing the relevant ICS controls.
Process-independent audits are also utilized by the Internal Audit unit to assess the effectiveness and suitability of FMS-WM’s ICS.
As part of the annual ICS control process carried out by the central ICS entity, the existing controls are validated in the context of group-wide service performance processes. This validation is based on interviews with the relevant unit heads and control owners, and takes into account the results of the annual operational risk self-assessment conducted by the Risk Controlling department as well as the findings of internal and external audits.
For fiscal year 2017, the establishment of the ICS and proper performance of the controls were confirmed in an ICS control attestation by the relevant unit heads at FMS-WM, FMS-WM Service and its managing directors, and the external financial service provider.
The control system applicable to outsourced parts of IT services was approved by a report prepared pursuant to International Standard on Assurance Engagements No. 3402. Furthermore, FMS-WM performed additional IT controls relating to the IT services as needed.
51
MANAGEMENT AND EMPLOYEES
Supervisory Board
FMSA appointed the first Supervisory Board (Verwaltungsrat) concurrently with the creation of FMS-WM in July 2010. No particular professional qualifications are required apart from experience and expertise in economics and finance. Persons who have been convicted or are being prosecuted for a felony or property offense are precluded from serving, as are those who have been involved in insolvency proceedings or have otherwise declared bankruptcy. Since October 1, 2015, the Supervisory Board has been comprised of eight members. Members of the Supervisory Board are generally appointed for three-year terms. Reappointments are permitted. With effect from February 16, 2016, Dr. Jutta Dönges was appointed to the Supervisory Board and with effect from January 23, 2017, she was elected as Deputy Chairman of the Supervisory Board. With effect from January 23, 2017, Rita Geyermann was also elected as Deputy Chairman of the Supervisory Board. With effect from January 6, 2017, Ingo Mandt was appointed to the Supervisory Board.
The following table sets forth the names and functions of the current members of FMS-WM’s Supervisory Board, the date of their appointment and their principal occupations outside of FMS-WM as of August 24, 2018.
| | | | |
Name | | Date of appointment | | Principal occupation |
Jan Bettink (Chairman since January 27, 2014) | | January 6, 2014 | | Former Chief Executive Officer of Berlin Hyp AG and Former President of the Association of German Pfandbrief Banks |
Dr. Jutta Dönges (Deputy Chairman since January 23, 2017) | | February 16, 2016 | | Managing Director of Bundesrepublik Deutschland Finanzagentur GmbH (Federal Republic of Germany – Finance Agency) |
Rita Geyermann (Deputy Chairman since January 23, 2017) | | August 20, 2010 | | First Vice President, Head of Asset Management at KfW Bankengruppe |
Dr. Axel Berger | | June 17, 2014 | | Auditor and tax adviser |
Dr. Tammo Diemer | | July 1, 2015 | | Managing Director of Bundesrepublik Deutschland – Finanzagentur GmbH (Federal Republic of Germany – Finance Agency) |
Birgit Dietl-Benzin | | October 1, 2015 | | Chief Risk Officer, Member of the Board UBS Europe SE |
Michaela Maria Eder von Grafenstein | | October 1, 2015 | | Member of the Executive Committee and Head of Business Unit Real Assets of the Aquila Group |
Ingo Mandt | | January 6, 2017 | | Former Executive Officer at Landesbank Baden-Wuerttemberg |
Employees of FMSA regularly take part in Supervisory Board meetings in their role as non-voting representatives of the legal regulatory body (FMSA) and as statutory agents of the owner (SoFFin).
Overall, the Supervisory Board is charged with the oversight and management of the Executive Board (Vorstand) in particular and FMS-WM overall, including functions outsourced to the portfolio servicer. It is also responsible for deciding on the winding-up plan, resolutions concerning deviations from the winding-up plan, the annual wind-up report, appointing and removing members of the Executive Board, enacting rules of procedure for the Executive Board, appointing the auditor and adopting the final accounts. The Supervisory Board provides ongoing advice to the Executive Board on matters of particular strategic significance, and it may reserve decision-making for itself on a case-by-case basis.
In addition to its collective decision-making process, the Supervisory Board has also constituted specialized committees from its members, notably the Supervisory Board Risk Committee and the Supervisory Board Audit Committee. The Supervisory Board Risk Committee is tasked with making particularly important lending decisions on a case-by-case basis for loan applications received and voted upon by the Executive Board. In general, the Supervisory Board Risk Committee considers all cases that are particularly relevant to risk (as determined by the risk management process described in “Risk Report—Organizational Structure of Risk Management”), have major effects on profit or loss, or possess major strategic significance.
The Supervisory Board Audit Committee is tasked with providing the necessary information for and conducting the review of the annual financial statement and audit.
52
Subordinate to the Supervisory Board is the Executive Board and the rest of the operational management of FMS-WM.
Executive Board
The Executive Board manages the business of FMS-WM and represents it in and out of court.
The members of FMS-WM’s Executive Board (Vorstand) are appointed by the Supervisory Board. FMS-WM’s Executive Board currently has three members who are appointed for renewable terms, with each term being limited to a maximum of four years. Members of the Executive Board may be removed by either the Supervisory Board or FMSA for good cause, such as a violation of the felony and bankruptcy provisions in FMS-WM’s charter or for gross violation of their duties.
FMS-WM’s charter requires Executive Board members to exercise prudent, diligent, and sound business judgment and makes them jointly and severally liable for any losses resulting from a breach of that duty. The Executive Board is charged with the business management and legal representation of FMS-WM. It may make legally binding decisions jointly, or it may give power of attorney to one or more persons who may act in concert with each other or, in the case of one person, with another Executive Board Member.
Members of the Executive Board
FMS-WM’s Executive Board currently has three members: Stephan Winkelmeier, Frank Hellwig and Christoph Müller.
Short biographies of the current Executive Board members are set forth below:
Stephan Winkelmeier
Stephan Winkelmeier (former Chief Risk Officer and Chief Financial Officer of FMS-WM) was appointed effective October 1, 2015. Mr. Winkelmeier serves as Chief Executive Officer (CEO) and spokesmen of the Executive Board and heads the CEO division. The CEO division includes the three units of Group Treasury, Asset Management and HR, Communications & Committees.
After graduating in business administration from the University of Passau, Stephan Winkelmeier worked from 1994 to 2008 at UniCredit Bank AG in Munich and its predecessor, Bayerische Vereinsbank AG, where he held various positions, including senior risk manager and head of the non-core unit. In September 2008, he took over the position of chief risk officer on the executive board of Bank Austria Group in Vienna. In July 2010, he moved to the executive board of Bayerische Landesbank, where he held the position of chief financial officer from April 2011 and then additionally of chief operating officer/chief information officer from August 2013, while also temporarily acting as chief executive officer of the internal restructuring unit. With effect from May 1, 2017, Stephan Winkelmeier became a member of the supervisory board of Bayerische Landesbank.
Frank Hellwig
Frank Hellwig (former General Manager of FMS-WM) was appointed effective January 1, 2015. Mr. Hellwig serves as Chief Operating Officer (COO) of FMS-WM and is responsible for the COO division, which includes the Legal & Group Compliance and IT, Sourcing & Operations units.
After graduating in business administration, Frank Hellwig initially worked at Hypo-Bank AG before moving to HypoVereinsbank AG in 1998 as deputy director of group-wide accounting, management and controlling. From 2003 to 2009, Mr. Hellwig was a member of the Management Board of Hypo Real Estate Bank AG, where he was responsible for operations, personnel and finance, among other matters. Most recently, he acted as head of sourcing and corporate services at Deutsche Pfandbriefbank AG, a position with global responsibilities.
Christoph Müller
Mr. Christoph Müller (former head of FMS-WM’s Risk Controlling, Finance & Portfolio Steering unit) was appointed effective September 1, 2017. Mr. Müller serves as Chief Risk Officer (CRO) and Chief Financial Officer (CFO) of FMS-WM and heads the CRO / CFO division. This division includes the three units of Finance, Controlling & Portfolio Steering, Risk Controlling & Quantitative Analytics as well as Group Internal Audit.
After graduating in business administration from the Black Forest University Villingen-Schwenningen, Mr. Müller started his career as a credit analyst for regional banks in Germany. From 2001 until 2004, Mr. Müller worked for three years in the Credit Portfolio Management group at UBS AG in Zurich. Before joining FMS-WM in 2010, Christoph Mueller worked for seven years at Credit Suisse in Zurich, where he was responsible for credit risk measurement and credit portfolio management.
53
Executive Board Committees
The Executive Board has formed several specialized committees to carry out various operational and strategic roles. These include the Executive Board’s Risk Committee, the Portfolio Steering Committee, and the ALCO.
The Risk Committee is the corporate body that makes lending decisions in operational terms at the management level of FMS-WM. All members of the Executive Board and FMS-WM’s Head of Risk Controlling, Finance & Portfolio Steering (if absent, their deputies) have the right to vote subject to applicable substitution rules. The Executive Board’s Risk Committee makes loan decisions that must be made at the management level because they are relevant to FMS-WM’s exposure to risk.
The Portfolio Steering Committee is primarily responsible for adjustments of the winding-up plan subject to approval by the Supervisory Board and FMSA; recognition of specific and general provisions; adjustments of methods (for all risk types); and strategic decisions with respect to segments (e.g., geographic regions, asset classes, etc.); and general risk management. All members of the Executive Board and FMS-WM’s Head of Risk Controlling, Finance & Portfolio Steering (if absent, their deputies) have the right to vote.
The ALCO serves as the Executive Board’s key body tasked with information gathering, monitoring and management activities in connection with strategic decisions related to the structure of FMS-WM’s balance sheet and related liquidity and market risks. All members of the Executive Board and FMS-WM’s Head of Risk Controlling, Finance & Portfolio Steering (if absent, their deputies) have the right to vote subject to applicable substitution rules. ALCO’s main tasks include monitoring the performance of FMS-WM and the structure of its balance sheet with respect to the winding-up plan, discussing its liquidity and market risk exposures (which includes adopting the requisite funding and hedging strategies) as well as fixing the relevant standards and guidelines for management of liquidity and market risks.
Employees
Recruiting highly qualified employees was an immediate priority for the Human Resources department of FMS-WM following the launch of operations in October 2010. By the end of 2010, all second-tier management had been filled. As of December 31, 2017, FMS-WM had filled 121 out of a target 129 positions (December 31, 2016: 121 out of a target of 133). The target number is dynamically adjusted to the requirements of portfolio management and refinancing efforts. Since the fourth quarter of 2012, open positions have, with few exceptions, been filled only temporarily in accordance with the plan to reduce the workforce in subsequent years following the successful establishment of FMS-WM’s target structure and to unwind the portfolio.
A staff council (Personalrat) comprising five members was established at FMS-WM in the third quarter of fiscal year 2016.
54
INDEPENDENT AUDITORS
The financial statements for the year ended December 31, 2017, including the balance sheet, the income statement, the notes to the financial statements, the cash flow statement and the statement of changes in equity have been audited by KPMG AG Wirtschaftsprüfungsgesellschaft, independent auditors, as stated in their report appearing elsewhere herein, and are included in reliance upon their report.
The auditor’s report (Bestätigungsvermerk) has been issued in accordance with Section 322 of the HGB on the annual financial statements and the management report (Lagebericht) of FMS-WM as of and for the fiscal year ended December 31, 2017. The management report is neither included nor incorporated by reference in this Annual Report on Form 18-K.
55
FINANCIAL STATEMENTS AND REPORT OF THE INDEPENDENT AUDITORS
ANNUAL FINANCIAL STATEMENTS
BALANCE SHEET FOR THE FISCAL YEAR ENDED 31 DEC. 2017
of FMS Wertmanagement
| | | | | | | | | | | | | | | | | | | | | | |
| Assets | | in € thousand | | | in € thousand | | | 31.12.2017
in € thousand | | | 31.12.2016
in € thousand | |
1. | | Cash reserve | | | | | | | | | | | | | | | | |
| | a) | | Balances with central banks | | | | | | | 3,798,082 | | | | | | | | 5,478,514 | |
| | | | Of which: with Deutsche Bundesbank € 3,798,082 thousand (previous year: € 5,478,514 thousand) | | | | | | | | | | | | | | | | |
| | | | | | | | | | | | | | | | | | | | | | |
| | | | | | | | | | | | | | | | | 3,798,082 | | | | 5,478,514 | |
2. | | Loans and advances to banks | | | | | | | | | | | | | | | | |
| | a) | | Payable on demand | | | | | | | 35,710,100 | | | | | | | | 35,969,416 | |
| | b) | | Other loans and advances | | | | | | | 5,747,799 | | | | | | | | 7,559,797 | |
| | | | | | | | | | | | | | | | | | | | | | |
| | | | | | | | | | | | | | | | | 41,457,899 | | | | 43,529,213 | |
3. | | Loans and advances to customers | | | | | | | | | | | 13,108,237 | | | | 14,092,541 | |
| | Of which: secured by mortgages € 639,253 thousand (previous year: € 842,997 thousand) Public-sector loans EUR 5,807,319 thousand (previous year: € 5,673,630 thousand) | | | | | | | | | | | | | | | | |
4. | | Debt instruments | | | | | | | | | | | | | | | | |
| | a) | | Bonds and notes | | | | | | | | | | | | | | | | |
| | | | aa) | | Public-sector issuers | | | 35,917,530 | | | | | | | | | | | | 40,654,559 | |
| | | | | | Of which: eligible as collateral for Deutsche Bundesbank advances € 25,030,292 thousand (previous year: € 27,768,046 thousand) | | | | | | | | | | | | | | | | |
| | | | ab) | | Other issuers | | | 36,098,064 | | | | | | | | | | | | 43,167,554 | |
| | | | | | | | | | | | | | | | | | | | | | |
| | | | | | Of which: eligible as collateral for Deutsche Bundesbank advances € 4,768,025 thousand (previous year: € 5,902,690 thousand) | | | | | | | 72,015,594 | | | | | | | | 83,822,113 | |
| | b) | | Own debt instruments | | | | | | | 17,714,825 | | | | | | | | 22,831,693 | |
| | | | | | | | | | | | | | | | | | | | | | |
| | | | Principal amount € 17,712,245 thousand (previous year: € 22,828,739 thousand) | | | | | | | | | | | 89,730,419 | | | | 106,653,806 | |
5. | | Shares and other non-fixed-income securities | | | | | | | | | | | 696,760 | | | | 696,760 | |
6. | | Other long-term equity investments | | | | | | | | | | | 3 | | | | 2,029 | |
| | Of which: in banks € 0 thousand (previous year: € 0 thousand) in financial services institutions € 0 thousand (previous year: € 3 thousand) | | | | | | | | | | | | | | | | |
7. | | Shares in affiliated companies | | | | | | | | | | | 491,159 | | | | 755,085 | |
| | Of which: in banks € 323,274 thousand (previous year: € 240,000 thousand) in financial services institutions € 50,000 thousand (previous year: € 446,533 thousand) | | | | | | | | | | | | | | | | |
8. | | Intangible fixed assets | | | | | | | | | | | | | | | | |
| | purchased concessions, industrial and similar rights and assets, and licences in such rights and assets | | | | | | | | | | | 1,231 | | | | 1,981 | |
9. | | Tangible fixed assets | | | | | | | | | | | 375 | | | | 376 | |
10. | | Other assets | | | | | | | | | | | 520,315 | | | | 1,279,013 | |
11. | | Prepaid expenses | | | | | | | | | | | 7,483,848 | | | | 4,708,375 | |
Total assets | | | | | | | | | | | 157,288,328 | | | | 177,197,693 | |
F-1
| | | | | | | | | | | | | | |
| Equity and liabilities | | in € thousand | | | 31.12.2017
in € thousand | | | 31.12.2016
in € thousand | |
1. | | Liabilities to banks | | | | | | | | | | | | |
| | a) Payable on demand | | | 5,243,849 | | | | | | | | 9,665,978 | |
| | b) With agreed maturity or notice period | | | 10,781,690 | | | | | | | | 14,459,995 | |
| | | | | | | | | | | | | | |
| | | | | | | | | 16,025,539 | | | | 24,125,973 | |
2. | | Liabilities to customers | | | | | | | | | | | | |
| | Other liabilities | | | | | | | | | | | | |
| | a) Payable on demand | | | 388,411 | | | | | | | | 61,690 | |
| | b) With agreed maturity or notice period | | | 12,500,709 | | | | | | | | 18,056,839 | |
| | | | | | | | | | | | | | |
| | | | | | | | | 12,889,120 | | | | 18,118,529 | |
3. | | Securitised liabilities | | | | | | | | | | | | |
| | a) Debt instruments issued | | | 81,436,340 | | | | | | | | 84,513,304 | |
| | b) Other securitised liabilities | | | 26,282,411 | | | | | | | | 31,729,467 | |
| | Of which: Commercial paper: € 26,282,411 thousand (previous year: € 31,729,467 thousand) | | | | | | | | | | | | |
| | | | | | | | | 107,718,751 | | | | 116,242,771 | |
4. | | Other liabilities | | | | | | | 820,825 | | | | 632,640 | |
5. | | Deferred income | | | | | | | 17,915,529 | | | | 16,424,069 | |
6. | | Provisions | | | | | | | | | | | | |
| | a) Provision for taxes | | | 18,363 | | | | | | | | 6,129 | |
| | b) Other provisions | | | 499,781 | | | | | | | | 606,301 | |
| | | | | | | | | | | | | | |
| | | | | | | | | 518,144 | | | | 612,430 | |
7. | | Equity | | | | | | | | | | | | |
| | a) Subscribed capital | | | 200 | | | | | | | | 200 | |
| | b) Capital reserves | | | 1,800 | | | | | | | | 1,800 | |
| | c) Retained earnings | �� | | | | | | | | | | | |
| | Other retained earnings | | | 1,039,281 | | | | | | | | 725,961 | |
| | d) Net retained profits | | | 359,139 | | | | | | | | 313,320 | |
| | | | | | | | | | | | | | |
| | | | | | | | | 1,400,420 | | | | 1,041,281 | |
Total equity and liabilities | | | | | | | 157,288,328 | | | | 177,197,693 | |
1. | | Contingent liabilities | | | | | | | | | | | | |
| | Contingent liabilities from guarantees and indemnity agreements | | | | | | | 1,183,562 | | | | 2,093,426 | |
2. | | Other obligations | | | | | | | | | | | | |
| | Irrevocable loan commitments | | | | | | | 3,889,789 | | | | 6,593,235 | |
F-2
INCOME STATEMENT
of FMS Wertmanagement for the period from 1 January until 31 December 2017
| | | | | | | | | | | | | | | | | | | | | | |
| Income statement | | in € thousand | | | in € thousand | | | 01.01. –
31.12.2017
in € thousand | | | 01.01. –
31.12.2016
in € thousand | |
1. | | Interest income from | | | | | | | | | | | | | | | | |
| | a) | | Lending and money market transactions | | | 4,661,062 | | | | | | | | | | | | 4,469,216 | |
| | | | Of which: negative interest deducted: € 486,047 thousand (previous year: € 271,976 thousand) | | | | | | | | | | | | | | | | |
| | b) | | Fixed-income securities and registered government debt | | | 2,157,291 | | | | | | | | | | | | 2,314,875 | |
| | | | | | | | | | | | | | | | | | | | | | |
| | | | | | | | | 6,818,353 | | | | | | | | 6,784,091 | |
2. | | Interest expenses | | | | | | | | | | | | | | | | |
| | | | | | | | | | | | | | | | | | | | | | |
| | | | Of which: positive interest deducted € 463,958 thousand (previous year: € 251,296 thousand) | | | | | | | –6,298,458 | | | | | | | | –6,117,398 | |
| | | | | | | | | | | | | 519,895 | | | | 666,693 | |
3. | | Current income from | | | | | | | | | | | | | | | | |
| | a) | | Other long-term equity investments | | | | | | | 1,191 | | | | | | | | 0 | |
| | b) | | Shares in affiliated companies | | | | | | | 191,886 | | | | | | | | 162 | |
| | | | | | | | | | | | | | | 193,077 | | | | 162 | |
4. | | Income from profit pooling, profit transfer or partial profit transfer agreements | | | | | | | | | | | 4,757 | | | | 5,841 | |
5. | | Commission income | | | | | | | 32,823 | | | | | | | | 55,641 | |
6. | | Commission expenses | | | | | | | –20,041 | | | | | | | | –25,090 | |
| | | | | | | | | | | | | | | | | | | | | | |
| | | | | | | | | | | | | 12,782 | | | | 30,551 | |
7. | | Other operating income | | | | | | | | | | | 69,252 | | | | 23,610 | |
8. | | General and administrative expenses | | | | | | | | | | | | | | | | |
| | a) | | Personnel expenses | | | | | | | | | | | | | | | | |
| | | | aa) | | Wages and salaries | | | –18,325 | | | | | | | | | | | | –19,749 | |
| | | | ab) | | Social security, post-employment and other employee benefit costs | | | –1,865 | | | | | | | | | | | | –2,426 | |
| | | | | | | | | | | | | | | | | | | | | | |
| | | | | | Of which: in respect of post-employment benefits € 243 thousand (previous year: € 692 thousand) | | | | | | | –20,190 | | | | | | | | –22,175 | |
| | b) | | Other administrative expenses | | | | | | | –132,846 | | | | | | | | –152,623 | |
| | | | | | | | | | | | | | | | | | | | | | |
| | | | | | | | | | | | | | | | | –153,036 | | | | –174,798 | |
9. | | Depreciation, amortisation and write-downs of intangible and tangible fixed assets | | | | | | | | | | | –897 | | | | –931 | |
10. | | Other operating expenses | | | | | | | | | | | –14,688 | | | | –20,157 | |
11. | | Write-downs of and valuation allowances on receivables and certain securities, and additions to loan loss provisions | | | | | | | –158,623 | | | | | | | | –128,831 | |
12. | | Income from reversals of write-downs of receivables and certain securities and from the reversal of loan loss provisions | | | | | | | 0 | | | | | | | | 0 | |
| | | | | | | | | | | | | | | | | | | | | | |
| | | | | | | | | | | | | | | | | –158,623 | | | | –128,831 | |
13. | | Write-downs of and valuation allowances on shares in affiliated companies, other long-term equity investments and securities classified as fixed assets | | | | | | | –43,256 | | | | | | | | –11,063 | |
14. | | Income from reversals of write-downs on shares in affiliated companies, other long-term equity investments and securities classified as fixed assets | | | | | | | 0 | | | | | | | | 0 | |
| | | | | | | | | | | | | | | | | | | | | | |
| | | | | | | | | | | | | –43,256 | | | | –11,063 | |
15. | | Result from ordinary activities | | | | | | | | | | | 429,263 | | | | 391,077 | |
16. | | Taxes on income | | | | | | | | | | | –70,124 | | | | –77,705 | |
17. | | Other taxes not included in “10. Other operating expenses” | | | | | | | | | | | 0 | | | | –52 | |
18. | | Net income for the year | | | | | | | | | | | 359,139 | | | | 313,320 | |
19. | | Net retained profits | | | | | | | | | | | 359,139 | | | | 313,320 | |
F-3
CASH FLOW STATEMENT
of FMS Wertmanagement for the period from 1 January until 31 December 2017
| | | | | | | | | | | | | | |
| Cash flow statement | | 01.01. –
31.12.2017
in € thousand | | | 01.01. –
31.12.2016
in € thousand | |
| | 1. | | | | | Net income / loss for the period | | | 359,139 | | | | 313,320 | |
| | | | | | Non-cash items included in net income / loss for the period and reconciliation to cash flow from operating activities | | | | | | | | |
| | 2. | | | +/– | | Depreciation, amortisation and write-downs and valuation allowances on receivables and items of fixed assets / reversals of such write-downs and valuation allowances | | | 285,847 | | | | 133,316 | |
| | 3. | | | +/– | | Increase / decrease in provisions | | | –102,785 | | | | –27,566 | |
| | 4. | | | +/– | | Other non-cash expenses / income | | | –2,017,813 | | | | 1,371,242 | |
| | 5. | | | –/+ | | Gain / loss on disposal of fixed assets | | | –1 | | | | –10 | |
| | 6. | | | –/+ | | Other adjustments (net) | | | –197,834 | | | | –6,003 | |
| | 7. | | | –/+ | | Increase / decrease in loans and advances to banks | | | 1,133,019 | | | | –10,827,496 | |
| | 8. | | | –/+ | | Increase / decrease in loans and advances to customers | | | 769,153 | | | | 2,507,107 | |
| | 9. | | | –/+ | | Increase / decrease in securities | | | 7,556,795 | | | | –76,347 | |
| | 10. | | | –/+ | | Increase / decrease in other assets relating to operating activities | | | –2,172,900 | | | | –2,953,356 | |
| | 11. | | | + /– | | Increase / decrease in liabilities to banks | | | –7,968,573 | | | | 811,108 | |
| | 12. | | | + /– | | Increase / decrease in liabilities to customers | | | –3,830,224 | | | | 3,710,905 | |
| | 13. | | | + /– | | Increase / decrease in securitised liabilities | | | 1,783,959 | | | | 5,829,107 | |
| | 14. | | | + /– | | Increase / decrease in other liabilities relating to operating activities | | | 2,219,998 | | | | 1,696,680 | |
| | 15. | | | + /– | | Interest expense / interest income | | | –519,895 | | | | –666,693 | |
| | 16. | | | + /– | | Income tax expense / income | | | 70,124 | | | | 77,705 | |
| | 17. | | | + | | Interest and dividend payments received | | | 7,011,430 | | | | 6,784,253 | |
| | 18. | | | – | | Interest paid | | | –6,298,458 | | | | –6,117,398 | |
| | 19. | | | –/+ | | Income taxes paid | | | –103,772 | | | | –59,208 | |
| | 20. | | | = | | Cash flows from operating activities | | | –2,022,791 | | | | 2,500,666 | |
| | 21. | | | + | | Proceeds from disposal of long-term financial assets | | | 338,246 | | | | 4,870 | |
| | 22. | | | + | | Proceeds from disposal of tangible fixed assets | | | 4 | | | | 10 | |
| | 23. | | | – | | Payments to acquire tangible fixed assets | | | –113 | | | | –12 | |
| | 24. | | | – | | Payments to acquire intangible fixed assets | | | –33 | | | | –43 | |
| | 25. | | | = | | Cash flows from investing activities | | | 338,104 | | | | 4,825 | |
| | 26. | | | = | | Cash flows from financing activities | | | 0 | | | | 0 | |
| | 27. | | | | | Net change in cash funds | | | –1,684,687 | | | | 2,505,491 | |
| | 28. | | | + /– | | Effect on cash funds due to exchange rate movements and remeasurements | | | –3,364 | | | | –1,809 | |
| | 29. | | | + | | Cash funds at beginning of period | | | 5,530,976 | | | | 3,027,294 | |
| | 30. | | | = | | Cash funds at end of period | | | 3,842,925 | | | | 5,530,976 | |
The cash flow statement was prepared using the indirect method in accordance with DRS 21. The cash funds reported comprise demand deposits with banks that are payable on demand and do not serve as collateral for financial derivatives, as well as balances with Deutsche Bundesbank.
F-4
STATEMENT OF CHANGES IN EQUITY
for the period from 1 January until 31 December 2017
| | | | | | | | | | | | | | | | |
| | | Balance at
01.01.2017
in € thousand | | | Appropriation
of net income /loss
in € thousand | | | Net income
for the year
in € thousand | | | Balance at
31.12.2017
in € thousand | |
Subscribed capital | | | 200 | | | | 0 | | | | 0 | | | | 200 | |
Capital reserves | | | 1,800 | | | | 0 | | | | 0 | | | | 1,800 | |
Other retained earnings | | | 725,961 | | | | 313,320 | | | | 0 | | | | 1,039,281 | |
Net retained profits | | | 313,320 | | | | –313,320 | | | | 359,139 | | | | 359,139 | |
Equity as defined by German commercial law | | | 1,041,281 | | | | 0 | | | | 359,139 | | | | 1,400,420 | |
Net retained profits from the 2016 fiscal year were transferred to retained earnings by decision of the Supervisory Board of FMS Wertmanagement AöR dated 27 March 2017.
STATEMENT OF CHANGES IN EQUITY
for the period from 1 January until 31 December 2016
| | | | | | | | | | | | | | | | |
| | | Balance at
01.01.2016
in € thousand | | | Appropriation
of net income / loss
in € thousand | | | Net income
for the year
in € thousand | | | Balance at
31.12.2016
in € thousand | |
Subscribed capital | | | 200 | | | | 0 | | | | 0 | | | | 200 | |
Capital reserves | | | 1,800 | | | | 0 | | | | 0 | | | | 1,800 | |
Other retained earnings | | | 430,048 | | | | 295,913 | | | | 0 | | | | 725,961 | |
Net retained profits | | | 295,913 | | | | –295,913 | | | | 313,320 | | | | 313,320 | |
Equity as defined by German commercial law | | | 727,961 | | | | 0 | | | | 313,320 | | | | 1,041,281 | |
F-5
NOTES
GENERAL INFORMATION
Legal framework
FMS Wertmanagement AöR, Munich (FMS-WM), was founded on 8 July 2010 and recorded in the Commercial Register of the Munich Local Court under number HRA 96076 on 13 September 2010. FMS-WM is domiciled in Munich.
Under agreements dated 29 and 30 September 2010, a portfolio with a nominal value of EUR 175.7 billion, excluding derivatives, was transferred to FMS-WM effective 1 October 2010.
FMS-WM is an organisationally and financially independent winding-up institution under public law with partial legal capacity that may engage in legal transactions in its own name, sue and be sued in court. It is regulated and supervised by the Federal Agency for Financial Market Stabilisation, Frankfurt am Main (FMSA), and the Federal Financial Supervisory Authority, Bonn and Frankfurt am Main (BaFin).
In 2012, FMS-WM established its own service entity, FMS Wertmanagement Service GmbH, Munich (FMS-SG), which assumed responsibility for portfolio servicing and the supply of all material services associated with it effective 1 October 2013. FMS-WM retains final decision-making powers and ultimate responsibility for the risk assets under management. The master agreement governing the outsourcing of business processes and services also grants FMS-WM extensive rights to obtain information and perform inspections, enabling the latter to monitor and control the servicing of the risk assets by FMS-SG. FMS-SG operated from three sites in the fiscal year 2017 (Unterschleißheim, Dublin and New York). Operations at the London site were discontinued on 31 December 2016 and the branch there was closed on 31 March 2017. The operating units were mostly moved to the Dublin site.
In addition, IBM Deutschland GmbH, Ehningen (IBM Deutschland) and ikb Data GmbH, Düsseldorf (ikb Data), were engaged to provide essential IT services. Based on a shareholder resolution adopted on 22 September 2017, ikb Data was renamed DATAGROUP Financial IT Services GmbH, Düsseldorf (DG FIS).
DEPFA BANK plc
Effective 19 December 2014, FMS-WM acquired all shares in DEPFA BANK plc, Dublin (DEPFA BANK plc). With this action, FMS-WM implemented the decision of 13 May 2014 by the inter-ministerial steering committee, which, after considering all options, decided to wind up DEPFA BANK plc and its subsidiaries via FMS-WM.
F-6
Accounting principles
These annual financial statements of FMS-WM were prepared in accordance with Section 8a (1) sentence 10 in conjunction with Section 3a (4) of the German Law Establishing a Financial Market Stabilisation Fund (Gesetz zur Errichtung eines Finanzmarktstabilisierungsfonds – FMStFG) and the supplementary provisions of its Charter pursuant to the provisions of the Handelsgesetz-buch – HGB for large corporations, the supplementary provisions of the HGB for credit institutions and financial services institutions as well as the requirements of the Verordnung über die Rechnungslegung der Kreditinstitute und Finanzdienstleistungsinstitute – RechKredV.
Since FMS-WM is a capital market oriented organisation as defined by Section 264d HGB, it has expanded its annual financial statements to include a statement of changes in equity and a cash flow statement in accordance with Section 264 (1) Sentence 2 HGB. A management report has also been prepared.
Accounting policies
Assets, liabilities as well as prepaid expenses and deferred income are recognised in accordance with Section 246 ff. HGB. Assets, liabilities and executory contracts are measured based on the principles of Section 252 ff. HGB in conjunction with Section 340 ff. HGB. Pursuant to Section 2 (1) RechKredV, FMS-WM used Form 1 to structure the balance sheet and Form 3 (vertical presentation format) for the income statement.
FMS-WM took over assets, provisions, liabilities, prepaid expenses and deferred income as well as derivatives effective as at 1 October 2010 for accounting purposes. The transfer of assets is recognised in line with general principles; with respect of the assets taken over as part of the spin-off for absorption (Section 123 (2) No. 1 UmwG) recognition is based on Section 24 UmwG. FMS-WM made use of the option in Section 24 UmwG, which provides for a continuation of the transferring entity’s book values.
Those book values were used if the assets were transferred to FMS-WM under so-called “concentration agreements”. If the transferor prepares its accounting pursuant to the International Financial Reporting Standards (IFRSs), the IFRS book value corresponds to FMS-WM’s acquisition cost. The IFRS book value contains hedge adjustments for loans, advances and securities that were reported in micro valuation units; the hedge adjustments related to securities are reported under the item “debt instruments” and those for loans under prepaid expenses and deferred income. The hedge adjustments for loans or securities are generally contrasted by the market value of the hedging derivatives transferred. The payments that FMS-WM has received or made for the hedging derivatives are shown under prepaid expenses and deferred income. The hedge adjustments and the recognised items for accrued payments related to derivatives are amortised regularly over the remaining terms to maturity of the corresponding transactions. Expenses and income from such amortisation are reported under interest expense or interest income. Both amortisation and current premium payments related to credit default swap exposures are reported under the item headings “Commission income” or “Commission expenses”.
F-7
The fact that the transferring entity’s book value represents the transfer price was to be taken into account as part of the acquisition process. Consequently, the write-downs recognised by the transferring entity were to be taken into account in the determination of the transfer price. The transfer price in turn represented FMS-WM’s aquisition costs.
Loans and advances to banks and loans and advances to customers are generally carried at their nominal value less “risk provision” as specific and general loan loss provisions. Differences between the nominal value and the cost, which are similar in nature to interest, are accounted for in prepaid expenses and deferred income and recognised in profit or loss under net interest income on a pro-rata basis over the term of the receivable. The proportionate interest calculated at the reporting date is recognised together with the underlying receivable.
On the basis of proposals by the portfolio servicer, analyses by other expert third parties and analyses by FMS-WM itself, specific loan loss provisions and other provisions are recognised for individual risks that have arisen in the lending business. Expected future proceeds from the realisation of collateral were discounted over the realisation period as necessary using a market interest rate with matching maturities.
Latent risks in the lending business are covered by general loan loss provisions set up in line with the requirements of the IDW statement BFA 1/1990 on the recognition of general loan loss provisions. They are calculated based on the expected loss determined by the portfolio servicer, which is modelled case by case using several parameters: probability of default, amount of exposure in the event of a default and expected recovery rate in the event of a default.
Collective country valuation allowances are also recognised for loans to borrowers in countries with discernible country risks. They are recognised in accordance with the methods required under German tax law. The countries to be included and the amount of the valuation allowances are determined on the basis of external country ratings that reflect current and expected economic data as well as the overall political situation in the countries in question.
Debt instruments are allocated to fixed assets (financial assets) because they are continuously used for operations. These are measured at amortised cost in accordance with Section 253 (1) and (3) HGB. If FMS-WM believes that the assets are permanently impaired, impairment losses are charged in accordance with Section 340e (1) Sentence 1 HGB. The existence of permanent impairment is determined in the case in question on the basis of information supplied by the portfolio servicer, commissioned expert third parties and through FMS-WM own investigations. The test of whether there is permanent impairment is generally conducted similar to the test for impairment of loan receivables, except that market values representing an additional trigger in the test for impairment of wind-up clusters with a high percentage of securities traded on liquid markets are to be taken into account.
F-8
Investment securities that are not permanently impaired are included in the measurement base for calculating the general loan loss provision.
When the reasons for permanent impairment no longer apply, write-ups are charged in accordance with Section 253 (5) Sentence 1 HGB up to a maximum of the amortised cost.
Own bonds bought back are allocated to current assets (liquidity reserve). They are measured in accordance with the strict lower-of-cost-or-market principle in accordance with Section 253 (4) HGB.
The fair values of securities and derivatives are determined either based on external rate sources (e. g. via stock exchanges or other providers such as Reuters) or based on market value derived from internal measurement models (mark to model). Fair values of securities are largely determined on the basis of securities prices obtained from external sources. The fair value of own issues bought back and allocated to current assets takes into account FMS-WM’s own credit risk. Derivatives are largely measured using specific measurement models, whereby the counterparty risk in the case of unsecured OTC derivatives is taken into account when determining any provisions for expected losses for hedge inefficiencies or for stand-alone derivatives. In the case of provisions for hedge inefficiencies and stand-alone derivatives, the estimation techniques used to determine any excess obligation (standard measurement models such as the discounted cash flow method) factor in market data relevant to the measurement (in particular yield curves and exchange rates) as at the reporting date, the counterparties’ potential probability of default and any collateral.
In the measurement of secured derivatives, future cash flows are discounted on the basis of EONIA swap curves.
Securities holdings are measured based on the following measurement hierarchy, which is oriented above all on the availability of plausible external market data:
| | • | | If an (indicative) market price (rate) is available for a liquid market, it is used. |
| | • | | If a market price is not available or the market is not sufficiently liquid, the measurement is converted to a proxy measurement based on the available market prices for similar securities. |
| | • | | If an appropriate proxy security cannot be identified, the measurement is carried out using the benchmark spreads or estimated spreads determined by the portfolio servicer’s experts. |
| | • | | Securities not measured based on market prices, proxies, or spreads, (e. g. structured inflation-linked bonds) are measured based on financial mathematical models. |
F-9
The parameters for internal valuation models (e. g. interest rate curves, volatilities, spreads) are derived from external sources and reviewed by Risk Controlling as to their plausibility and accuracy. The models used for measuring structured derivatives are initially calibrated on the basis of market data, with the subsequent valuation being based on the resulting model parameters.
Differences that stem from the reporting of securities classified as fixed assets above their fair value based on application of the moderate lower-of-cost-or-market principle are shown separately in the notes.
FMS-WM holds positions in asset-backed securities. These structured financial instruments are not required to be separated; they are carried as a uniform asset and in compliance with IDW RS HFA 22.
Securities repurchase agreements are reported in accordance with the provisions of Section 340b HGB. The securities sold under genuine repurchase agreements are still reported in the balance sheet of FMS-WM. Depending on the transferee, the obligation to repurchase securities sold under repo agreements is presented under the balance sheet item, Liabilities to banks, or the balance sheet item, Liabilities to customers. If securities repurchase agreements were entered into (as buyer) to place excess liquidity on the money market, the resulting receivables are recognised under the balance sheet item, Loans and advances to banks, or the balance sheet item, Loans and advances to customers, depending on the transferor. The specific securities are not presented in FMS-WM’s balance sheet due to the lack of beneficial ownership.
The Shares and other non-fixed-income securities balance sheet item exclusively contains the hybrid bonds acquired in 2015 of DEPFA Funding II LP, London, DEPFA Funding III LP, London, and DEPFA Funding IV LP, London. These hybrid bonds are recognised at cost. Like fixed assets, all shares in this balance sheet item are measured in accordance with the moderate lower-of-cost-or-market principle.
Shares in affiliated companies and other long-term equity investments are recognised at cost. If impairment is expected to be permanent, write-downs to the lower fair value are recognised. As at 31 December 2017, the shares in the affiliated companies Hypo Real Estate Capital Corp., New York (HRECC), and Flint Nominees Ltd., London (Flint), are no longer classified as financial services institutions within the meaning of Section 1 (1a) German Banking Act (KWG).
Tangible fixed assets are recognised at cost less depreciation. The useful life is determined based on the expected wear and tear of the tangible fixed assets.
Intangible assets are recognised at cost less amortisation. The useful life is determined based on factors expected to limit the longevity of the intangible assets.
F-10
For the sake of simplicity and in compliance with the tax regulations, assets costing EUR 150.00 or less before VAT are written down in full in the year of acquisition. Assets costing between EUR 150.00 and EUR 1,000.00 before VAT are presented in an omnibus account that is written down over five fiscal years using the straight-line method.
Deferred tax assets and deferred tax liabilities are initially calculated as at 31 December 2017 on temporary differences between the book values of the assets or liabilities and their tax base and measured based on a tax rate of 30.03%. The combined income tax rate comprises corporate income tax, trade tax and the solidarity surcharge. In a general overview, FMS-WM’s deferred tax assets exceed its deferred tax liabilities. The surplus of deferred tax assets at 31 December 2017 stems from temporary differences, especially with respect to loans and advances to banks, loans and advances to customers, debt instruments, shares in affiliated companies as well as provisions for expected losses. Tax loss carryforwards also exist. As in the previous year, FMS-WMS does not make use of the option to recognise the surplus in the balance sheet in accordance with Section 274 (1) Sentence 2 HGB.
Based on the existing control and profit-and-loss transfer agreement dated 16 October 2012, there is a consolidated VAT, corporate income tax and trade tax group with FMS-SG. Consequently, the German tax obligations of FMS-SG are disclosed in FMS-WM’s financial statements.
Prepaid expenses include:
| | • | | Expenditures prior to the reporting date where these concern expenses in a certain period of time after the reporting date. |
| | • | | Deferrals (discounts) in connection with the issuing business. |
| | • | | Deferrals in connection with derivative products. This primarily concerns payments made by FMS-WM for entering into derivatives (positive market values). |
| | • | | Accruals of positive differences between the nominal value of receivables and the cost, which are similar in nature to interest. |
As a rule, prepaid expenses are amortised on a pro rata basis. To the extent that prepaid expenses include payments in connection with the takeover of derivatives and there are serious doubts regarding the contracts’ validity or the recoverability of the payments from these derivatives, these components of prepaid expenses are reversed through profit or loss.
Liabilities are carried at their settlement amount. Differences between the issue amount and the settlement amount of the liabilities are posted to deferred income or prepaid expenses and reversed through profit and loss on a pro rata basis.
F-11
Provisions for uncertain liabilities and provisions for expected losses from executory contracts are recognised at the settlement amount dictated by prudent business judgement. Provisions with a remaining maturity of more than one year are generally discounted in accordance with Section 253 (2) HGB using the average market interest rate of the past seven fiscal years corresponding to their remaining maturity. The applicable interest rates are published by the Bundesbank. Provisions for expected losses from executory contracts (derivatives) were recognised in the amount of the existing excess of expected obligations over expected benefits. Financial mathematical valuation models are applied to determine the excess obligation especially with regard to derivatives that have a complex structure.
Regardless of future developments, if a fixed excess obligation exists in the relevant market risk factors for a derivative, this is not recognised as a provision for expected losses but instead in other liabilities.
Deferred income includes:
| | • | | Proceeds received prior to the reporting date where these concern income in a certain period of time after the reporting date. |
| | • | | Deferrals (premiums) in connection with the issuing business. |
| | • | | Deferrals in connection with derivative products. This primarily concerns payments received by FMS-WM for entering into derivatives (negative market values). |
| | • | | Deferrals in connection with the lending business (discounts on receivables). |
Deferred income is amortised on a pro rata basis.
Derivative financial instruments are entered into to hedge interest rate risk in individual hedged items, to manage general interest rate risk and to hedge inflation, counterparty and currency risks.
| | • | | Derivative financial instruments serving to hedge the market risks (basically interest rate risks) of individual hedged items are aggregated into micro valuation units along with the hedged items in accordance with Section 254 HGB. |
| | • | | Derivative financial instruments that are used to manage the general interest rate risk are aggregated into an offsetting item with the other transactions in the banking book (securi-ties and loans) that are interest-based and regarded as non interest-induced as well as the financial instruments issued for funding purposes. Prevailing opinion holds that this is not a valuation unit under Section 254 HGB but an accounting practice. |
F-12
| | • | | Derivatives such as credit default swaps (CDS) are used to hedge counterparty risks. As a rule, these derivatives are not aggregated with other hedged items in valuation units and are measured in accordance with the general principles of commercial law (in accordance with IDW BFA 1). |
| | • | | Derivative financial instruments such as currency and cross currency interest rate swaps serve to fund or manage FMS Wertmanagement’s liquidity in the individual foreign currencies. They are used in connection with the management of foreign currency positions to close open risk positions. |
Consistent with the specifications of risk management, documented hedging relationships are entered into at the transaction level (micro valuation units) to hedge market risks. FMS-WM recognises these hedging relationships using the net hedge presentation method (“Einfrierungs-methode”) in accordance with Section 254 HGB. Where the offsetting changes in value resulting from the hedged risk (especially interest rate risk) are compensated, the changes in value in the hedged item or in the hedging instrument were not recognised. Where the offsetting changes in value resulting from the hedged risk of the hedged item and the hedging instrument are not compensated, the general accounting policies are used for this ineffective portion. The term of the hedged item is used as the time horizon. Hedged items may include acquired or issued securities, loan receivables or loan liabilities, and derivatives. In an existing excess obligation, the ineffective portion of the hedge’s hedged risk is recognised as an expense in accordance with the imparity principle pursuant to IDW RS HFA 35 through the recognition of a provision for expected losses. The ineffective portion is computed by comparing the change in value from the hedged risk of the hedged item with the change in value from the hedged risk of the hedging instrument. Excess obligations for unhedged risks are recognised in accordance with the imparity principle through the recognition of a provision for expected losses. Expenses from additions to provisions for expected losses are shown in the net revaluation gain / loss for the lending and securities business.
All hedge relationships were tested for effectiveness. The effectiveness of the hedges was examined primarily on the basis of linear regression.
In addition, FMS-WM holds credit derivatives (e. g. CDS) where it is the guarantor. These credit derivatives are accounted for in accordance with IDW RS BFA 1.
In addition to the necessary and recognised provisions for expected losses for valuation units, the entire interest rate portfolio and / or banking book is evaluated for the existence of an excess obligation. All interest-based financial instruments (“Refinanzierungsverbund”) are included in this evaluation, including those that are designated as valuation units under Section 254 HGB. Additional provisions for expected losses for the excess obligation are only recognised in accordance with IDW RS BFA 3 if an excess obligation existed in this offsetting item. SoFFin’s loss compensation obligation under Section 7 of FMS-WM’s Charter is included in the offsetting item.
F-13
For secured derivatives in valuation units, the change in value resulting from the change in the measurement of secured derivatives (discounting of future cash flows on the basis of EONIA swap curves) was not considered a portion of the hedged risk and was recognised in connection with the determination of the overall excess obligation from the banking book.
Compensation payments received in connection with amendments to credit support annexes in place for derivatives are presented as deferred income and amortised on a pro rata basis. In the reporting period, amortisation had a positive one-off effect on net interest income amounting to EUR 154 million.
Contingent liabilities are disclosed below the line at their nominal amount after deduction of any risk provisions.
Foreign currency items in the balance sheet are translated into the reporting currency (euros) in accordance with the provisions of Section 256a HGB in conjunction with Section 340a (1) and Section 340h HGB and pursuant to the provisions of IDW RS BFA 4. FMS-WM translated its assets and liabilities at the average spot rate prevailing at 29 December 2017 using the respective reference exchange rate of the ECB. Expenses and income arising from the currency translation of on-balance sheet and off-balance sheet transactions denominated in foreign currencies with special coverage in the same currency are presented net in other operating expenses or other operating income. If excess assets result from the translation of off-balance sheet transactions denominated in foreign currencies within the context of special coverage according to Section 340h HGB, these are recognised in other assets. If excess liabilities arise in this way, they are reported as other liabilities. If forward exchange transactions serve to hedge interest-bearing items, the forward rate is split into its two elements (spot rate and swap rate) in order to account for them separately for the purpose of determining the result.
To the extent that derivative financial instruments feature the exchange of principal (swap agreements with an exchange of principal), payments received or payments yet to be made are recognised in other liabilities. Payments made or payments yet to be received are reported in other assets.
Expenses and income were translated into euros at the exchange rate on the transaction date. Expenses and income arising from the currency translation are presented net under other operating expenses or other operating income. In the reporting period, other operating income includes effects in the amount of EUR 34 million that relate to previous years and were processed in the current accounts.
Interest income and interest expense for swaps entered into are presented gross, i. e. not netted, in the income statement.
F-14
Negative interest is shown in the income statement in accordance with the transaction underlying the agreement of negative interest: Negative interest contractually agreed for assets reduces interest income, whereas interest contractually agreed for liabilities reduces interest expense. For the negative interest thus deducted from interest income and interest expense, an “Of which” item was in each case added to Form 3 provided by the RechKredV and used for the presentation of the income statement (“Of which negative / positive interest deducted”).
FMS-WM avails itself of the option under Section 340f (3) HGB. Accordingly, income and expenses from the measurement of loans, advances and securities allocated to the liquidity reserve may be shown in a single item after offsetting against income and expenses from the measurement and disposal of such transactions. This also includes additions to or reversals of loan loss provisions.
FMS-WM avails itself of the option under Section 340c (2) HGB. Accordingly, expenses from write-downs on long-term equity investments, shares in affiliated companies and securities classified as fixed assets may be offset against the income from additions to such assets and shown in a single expense and income item. Under Section 340c HGB, the expenses and income from transactions involving such assets may also be included. FMS-WM also reports the profit / loss from the sale of securities as well as the profit / loss from the termination of related derivatives transactions in this item.
Significant transactions with the DEPFA Group
In connection with the commission received in May 2014 to unwind the DEPFA Group1 in a way that maximises its value, FMS-WM again acquired additional liabilities of the DEPFA Group (“DEPFA liabilities”) with a nominal volume of EUR 1.5 billion in the 2017 fiscal year. At 31 December 2016, FMS-WM was already holding purchased DEPFA liabilities with a nominal value of EUR 1.1 billion. As in fiscal year 2016, FMS-WM again sold a large percentage of the DEPFA liabilities purchased (nominal value: EUR 2.0 billion) to the DEPFA Group in 2017. In direct connection with the sale of these liabilities to the DEPFA Group, DEPFA Group assets with a nominal volume of EUR 2.0 billion were acquired as a next step (“portfolio extension”). As a hedge against interest rate risks, interest rate hedges related to these transactions were then entered into, both with third party market participants the market and with the DEPFA Group.
| 1 | DEPFA Group: DEPFA BANK plc and its subsidiaries |
F-15
NOTES TO THE BALANCE SHEET
Assets
Cash reserve
The cash reserve item shows a credit balance with Deutsche Bundesbank in the amount of EUR 3,798 million (31 December 2016: EUR 5,479 million).
Loans and advances to banks
| | | | | | | | |
| | | 31.12.2017
in € million | | | 31.12.2016
in € million | |
a) Payable on demand | | | 35,710 | | | | 35,969 | |
b) Other loans and advances | | | 5,748 | | | | 7,560 | |
| | | | | | | | |
Total | | | 41,458 | | | | 43,529 | |
| | | | | | | | |
Of which: to affiliated companies | | | 4,589 | | | | 4,532 | |
Of which: to other long-term equity investments | | | 0 | | | | 0 | |
The decline in loans and advances payable on demand is due to a decrease in cash collateral required to be provided for derivative positions. The decline in other loans and advances is mainly the result of repo transactions (as buyer) having matured in full.
Loans and advances to affiliated companies include loans and advances under liquidity facilities drawn down by a nominal amount of EUR 3,137 million as at 31 December 2017, purchased DEPFA liabilities (promissory notes) with a nominal value of EUR 510 million, a TIER II loan with a nominal value of EUR 360 million, loans and advances in connection with cash collateral required to be provided for financial derivatives in the amount of EUR 458 million and interest accruals. Loans and advances to affiliated companies include EUR 4,047 million in loans and advances to DEPFA Bank plc and EUR 542 million in loans and advances to DEPFA ACS BANK DAC, Dublin (DEPFA ACS).
F-16
The remaining maturities of the other loans and advances to banks as at 31 December 2017 are as follows:
| | | | | | | | |
| | | 31.12.2017
in € million | | | 31.12.2016
in € million | |
Up to three months | | | 2,864 | | | | 3,595 | |
More than three months and up to one year | | | 1,676 | | | | 2,661 | |
More than one year and up to five years | | | 70 | | | | 50 | |
More than five years | | | 1,138 | | | | 1,254 | |
| | | | | | | | |
Total | | | 5,748 | | | | 7,560 | |
| | | | | | | | |
The decline in loans and advances with a remaining maturity of up to three months and of more than three months up to one year is mainly due to repo transactions (as buyer) having matured.
Loans and advances to customers
| | | | | | | | |
| | | 31.12.2017
in € million | | | 31.12.2016
in € million | |
Total | | | 13,108 | | | | 14,093 | |
Of which: to affiliated companies | | | 101 | | | | 119 | |
Of which: to other long-term equity investments | | | 3 | | | | 4 | |
The decline in loans and advances to customers is due mainly to the scheduled repayment and sale of loans in the portfolio to be unwound. In the reporting period, this decline was partly offset by additions of exposures purchased from the DEPFA Group as a part of the portfolio extension. These additions increase the item by EUR 1,595 million as at 31 December 2017.
The remaining maturities of the loans and advances to customers as at 31 December 2017 are as follows:
| | | | | | | | |
| | | 31.12.2017
in € million | | | 31.12.2016
in € million | |
Payable on demand | | | 22 | | | | 117 | |
Up to three months | | | 308 | | | | 531 | |
More than three months and up to one year | | | 477 | | | | 920 | |
More than one year and up to five years | | | 2,149 | | | | 2,072 | |
More than five years | | | 10,152 | | | | 10,453 | |
| | | | | | | | |
Total | | | 13,108 | | | | 14,093 | |
| | | | | | | | |
As previously, there are no loans and advances with indefinite maturity.
F-17
Debt instruments
The debt instruments item in the balance sheet is broken down as follows:
| | | | | | | | |
| | | 31.12.2017
in € million | | | 31.12.2016
in € million | |
Book value | | | 89,730 | | | | 106,654 | |
Of which: public-sector issuers | | | 35,917 | | | | 40,655 | |
Of which: other issuers | | | 36,098 | | | | 43,167 | |
Of which: own debt instruments | | | 17,715 | | | | 22,832 | |
| | |
Marketable securities | | | 89,730 | | | | 106,654 | |
Of which: listed | | | 77,196 | | | | 91,052 | |
Of which: not listed | | | 12,534 | | | | 15,602 | |
| | |
Securities sold under repurchase agreements | | | 18,710 | | | | 18,579 | |
Securities due in the following year | | | 7,629 | | | | 10,053 | |
Securities issued by affiliated companies | | | 110 | | | | 586 | |
Of the marketable securities, securities totalling EUR 72,015 million (31 December 2016: EUR 83,822 million) are measured as fixed assets in accordance with the moderate lower-of-cost-or-market principle. Of the marketable securities, securities with a book value of EUR 110 million (31 December 2016: EUR 586 million) were issued by affiliated companies.
In addition, the marketable securities include own debt instruments and accrued interest totalling EUR 17,715 million (31 December 2016: EUR 22,832 million) which, because these are treated as current assets, are measured using the strict lower-of-cost-or-market principle. The issues of FMS-WM serve to manage liquidity and to provide collateral.
As at 31 December 2017, the “debt instruments” item in the balance sheet had increased due to exposures purchased in the amount of EUR 427 million (nominal value: EUR 358 million) in connection with the portfolio extension. In the reporting period, this increase was more than offset by sale transactions, disposals of held-to-maturity securities, scheduled repayments and foreign currency effects, as a result of which debt instruments declined overall in the fiscal year. The DEPFA liabilities held declined by EUR 475 million (nominal value: EUR 434 million) year on year to EUR 86 million (nominal value: EUR 63 million) as at the reporting date.
F-18
The deferred write-downs on debt instruments total EUR 1,551 million based on their fair values as at 31 December 2017 (31 December 2016: EUR 2,542 million). Deferred write-downs of debt instruments are based on book values of EUR 19,611 million (31 December 2016: EUR 30,019 million) and fair values of EUR 18,060 million (31 December 2016: EUR 27,476 million) as at 31 December 2017. Where securities carry hidden losses as at the reporting date, FMS-WM assumes that, due to its mostly long-term wind-up strategy and the securities’ expected performance, their fair value will be temporarily less than their book value. Corresponding write-downs were taken if there were any doubts as to collectability.
The book values and the fair values of the securities contained in the banking book, broken down by issuer group, follow from the overview below. Both the book values and the fair values contain deferred interest.
| | | | | | | | | | | | | | | | | | | | |
| | | Of which:
public-sector
issuers | | | Other issuers | | | | | | | |
| in € million | | Of which:
banks | | | Of which:
other issuers | | | Total
31.12.2017 | | | Total
31.12.2016 | |
Book value | | | 35,917 | | | | 3,017 | | | | 33,081 | | | | 72,015 | | | | 83,822 | |
Fair value | | | 38,449 | | | | 3,182 | | | | 38,840 | | | | 80,471 | | | | 91,138 | |
Hidden reserves | | | 3,353 | | | | 215 | | | | 6,439 | | | | 10,007 | | | | 9,858 | |
Hidden losses (deferred write-downs) | | | 821 | | | | 50 | | | | 680 | | | | 1,551 | | | | 2,542 | |
| | | | | |
Of which: | | | | | | | | | | | | | | | | | | | | |
Hidden losses ABS | | | | | | | | | | | | | | | 413 | | | | 928 | |
Of which: | | | | | | | | | | | | | | | | | | | | |
Hidden losses PIIGS countries 1 | | | | | | | | | | | | | | | 815 | | | | 1,098 | |
Of which: | | | | | | | | | | | | | | | | | | | | |
Portugal | | | | | | | | | | | | | | | 26 | | | | 81 | |
Ireland | | | | | | | | | | | | | | | 1 | | | | 18 | |
Italy | | | | | | | | | | | | | | | 716 | | | | 872 | |
Spain | | | | | | | | | | | | | | | 72 | | | | 127 | |
| 1 | Issuer’s country of domicile |
The hidden losses from ABS as at 31 December 2017 include EUR 98 million in losses attributable to risks related to the PIIGS countries (31 December 2016: EUR 262 million).
The hidden losses and reserves from debt instruments are also exposed in some cases to countervailing effects on derivatives (particularly interest-based derivatives). For more information, see the explanation under Derivative financial instruments.
Out of the above total of hidden reserves and hidden losses, EUR 9,495 million (31 December 2016: EUR 9,321 million) and EUR 634 million (31 December 2016: EUR 1,093 million), respectively, are attributable to securities in valuation units.
F-19
Shares and other non-fixed-income securities
The shares and other non-fixed-income securities item in the balance sheet is broken down as follows:
| | | | | | | | |
| | | 31.12.2017
in € million | | | 31.12.2016
in € million | |
Marketable securities | | | 697 | | | | 697 | |
Of which: listed | | | 0 | | | | 0 | |
Of which: not listed | | | 697 | | | | 697 | |
The “shares and other non-fixed-income securities” balance sheet item shows the purchased hybrid bonds issued by the DEPFA Group. The book value shown was EUR 697 million as at 31 December 2017 (31 December 2016: EUR 697 million). The nominal value was EUR 1,125 million.
Shares in affiliated companies and other long-term equity investments
None of the other long-term equity investments and shares in affiliated companies held by FMS-WM are marketable.
| | | | | | | | |
| Other long-term equity investments | | 31.12.2017
in € million | | | 31.12.2016
in € million | |
Book value | | | 0 | | | | 2 | |
Of which: other long-term equity investments in banks | | | 0 | | | | 0 | |
Of which: other long-term equity investments in financial services institutions | | | 0 | | | | 0 | |
The decline is due to the sale of two equity investments in the reporting period.
| | | | | | | | |
| Shares in affiliated companies | | 31.12.2017
in € million | | | 31.12.2016
in € million | |
Book value | | | 491 | | | | 755 | |
Of which: shares in affiliated companies (banks) | | | 323 | | | | 240 | |
Of which: shares in affiliated companies (financial services institutions) | | | 50 | | | | 447 | |
Shares in affiliated companies (banks) relate to DEPFA BANK plc, whereas shares in affiliated companies (financial services institutions) relate to FMS-SG. The decline in the reporting period is mainly due to a capital repayment by HRECC, which was partially offset by a write-up of the book value of DEPFA BANK plc.
F-20
Intangible and tangible fixed assets
| | | | | | | | | | | | | | | | | | | | | | | | | | | | | | | | | | | | |
| | | Cost | | | Depreciation / amortisation | | | Book value | |
| in € million | | Balance
01.01. 2017 | | | Additions
2017 | | | Disposals
2017 | | | Cumulative
01.01. 2017 | | | Current year
2017 | | | Disposals
2017 | | | Cumulative
31.12. 2017 | | | Balance
31.12. 2017 | | | Balance
31.12. 2016 | |
|
|
Intangible fixed assets | | | 4.5 | | | | 0.0 | | | | 0.0 | | | | 2.5 | | | | 0.8 | | | | 0.0 | | | | 3.3 | | | | 1.2 | | | | 2.0 | |
Tangible fixed assets | | | 1.4 | | | | 0.1 | | | | 0.0 | | | | 1.0 | | | | 0.1 | | | | 0.0 | | | | 1.1 | | | | 0.4 | | | | 0.4 | |
Other long-term equity investments | | | 2 | | | | | | | | | | | | –21 | | | | | | | | | | | | 0 | | | | 2 | |
Shares in affiliated companies | | | 755 | | | | | | | | | | | | –2641 | | | | | | | | | | | | 491 | | | | 755 | |
Bonds and notes | | | 83,822 | | | | | | | | | | | | –11,8071 | | | | | | | | | | | | 72,015 | | | | 83,822 | |
Shares and other non-fixed-income securities | | | 697 | | | | | | | | | | | | 01 | | | | | | | | | | | | 697 | | | | 697 | |
| 1 | The option to combine items in accordance with Section 34 (3) RechKredV was used. |
The intangible assets as at 31 December 2017 solely concern software licenses purchased for consideration.
The tangible fixed assets as at 31 December 2017 solely comprise operating and office equipment.
Other assets
The other assets in the amount of EUR 520 million (31 December 2016: EUR 1,279 million) mainly include the balancing item for foreign currency translation of off-balance sheet transactions in the amount of EUR 369 million (31 December 2016: EUR 1,176 million) recognised in connection with special coverage under Section 340h HGB. There are also tax assets in the amount of EUR 74 million (31 December 2016: EUR 34 million).
Prepaid expenses
Prepaid expenses are comprised of the following items:
| | | | | | | | |
| | | 31.12.2017
in € million | | | 31.12.2016
in € million | |
Unamortised cost of derivatives | | | 5,784 | | | | 3,275 | |
Lending business (premium from receivables) | | | 1,649 | | | | 1,359 | |
Issuing business / loans taken out | | | 48 | | | | 70 | |
Other | | | 3 | | | | 4 | |
| | | | | | | | |
Total | | | 7,484 | | | | 4,708 | |
| | | | | | | | |
F-21
“Unamortised cost of derivatives” includes, among other things, payments made by FMS-WM for the market values of derivatives recognised by the transferors as at the transfer date. The item also contains unamortised payments made by FMS-WM in fiscal years 2016 and 2017 to acquire interest rate derivatives in connection with the wind-up task related to the DEPFA Group. In fiscal year 2017, FMS-WM also acquired certain derivative positions from DEPFA Group companies, entered into matching, offsetting transactions to those positions and in this context made payments required to be deferred. The EUR 2,509 million increase seen in the unamortised cost of derivatives in the reporting period is mainly attributable to the outlined transactions with the DEPFA Group, partly offset by pro rata amortisation and currency translation effects.
Prepaid expenses from lending business mainly include the deferred, unamortised payments that FMS-WM made for the hedge adjustments of the hedged items (loan receivables) that were transferred from HRE Group companies1. The increase in the reporting period is mainly attributable to payments of premiums on loans acquired in connection with the portfolio extension, partly offset by amortisation.
Prepaid expenses are in each case reversed pro rata over the remaining term of the underlying transactions.
Subordinated assets
The following items on the assets side of the balance sheet contain subordinated assets:
| | | | | | | | |
| | | 31.12.2017
in € million | | | 31.12.2016
in € million | |
Loans and advances to banks | | | 360 | | | | 360 | |
Debt instruments | | | 35 | | | | 50 | |
Shares and other non-fixed-income securities | | | 697 | | | | 697 | |
| | | | | | | | |
Total | | | 1,092 | | | | 1,107 | |
| | | | | | | | |
| 1 | HRE Group: Hypo Real Estate Holding AG (HRE) and its direct and indirect, domestic and foreign subsidiaries and special purpose entities |
F-22
Equity and liabilities
Liabilities to banks
| | | | | | | | |
| | | 31.12.2017
in € million | | | 31.12.2016
in € million | |
a) Payable on demand | | | 5,244 | | | | 9,666 | |
b) With agreed maturity or notice period | | | 10,782 | | | | 14,460 | |
| | | | | | | | |
Total | | | 16,026 | | | | 24,126 | |
| | | | | | | | |
Of which: to affiliated companies | | | 212 | | | | 550 | |
Of which: to other long-term equity investments | | | 0 | | | | 0 | |
Liabilities to banks payable on demand consist of a demand deposit of EUR 4,319 million (31 December 2016: EUR 8,819 million) as well as cash collateral received for derivative positions, including interest accruals, of EUR 925 million, of which EUR 80 million is due to the DEPFA Group (31 December 2016: EUR 847 million, of which EUR 484 million due to the DEPFA Group).
Liabilities with an agreed maturity or notice period consist mainly of liabilities from repo transactions (as seller), which, including interest accruals, declined by EUR 3,711 million to EUR 9,195 million as at 31 December 2017 (31 December 2016: EUR 12,906 million). In addition, liabilities from interest accruals on derivatives amounted to EUR 1,442 million (31 December 2016: EUR 1,528 million).
The remaining maturities of the liabilities with agreed maturity or notice period as at 31 December 2017 are as follows:
| | | | | | | | |
| | | 31.12.2017
in € million | | | 31.12.2016
in € million | |
Up to three months | | | 1,661 | | | | 6,881 | |
More than three months and up to one year | | | 8,995 | | | | 7,557 | |
More than one year and up to five years | | | 43 | | | | 17 | |
More than five years | | | 83 | | | | 5 | |
| | | | | | | | |
Total | | | 10,782 | | | | 14,460 | |
| | | | | | | | |
Liabilities to customers
| | | | | | | | |
| | | 31.12.2017
in € million | | | 31.12.2016
in € million | |
a) Payable on demand | | | 388 | | | | 62 | |
b) With agreed maturity or notice period | | | 12,501 | | | | 18,057 | |
| | | | | | | | |
Total | | | 12,889 | | | | 18,119 | |
| | | | | | | | |
Of which: to affiliated companies | | | 87 | | | | 614 | |
Of which: to other long-term equity investments | | | 0 | | | | 0 | |
F-23
Liabilities payable on demand consist mainly of cash collateral received for derivative positions of EUR 335 million (31 December 2016: EUR 16 million).
Liabilities with an agreed maturity or notice period consist mainly of repo transactions (as seller), which, including interest accruals, declined by EUR 3,020 million to EUR 9,274 million as at 31 December 2017 (31 December 2016: EUR 12,294 million). In addition, term deposits and time deposits (including interest accruals) decreased by EUR 2,440 million to EUR 1,536 million as at 31 December 2017 (31 December 2016: EUR 3,976 million).
The remaining maturities of the liabilities with agreed maturity or notice period as at 31 December 2017 are as follows:
| | | | | | | | |
| | | 31.12.2017
in € million | | | 31.12.2016
in € million | |
Up to three months | | | 10,253 | | | | 10,935 | |
More than three months and up to one year | | | 626 | | | | 5,378 | |
More than one year and up to five years | | | 180 | | | | 230 | |
More than five years | | | 1,442 | | | | 1,514 | |
| | | | | | | | |
Total | | | 12,501 | | | | 18,057 | |
| | | | | | | | |
Securitised liabilities
| | | | | | | | |
| | | 31.12.2017
in € million | | | 31.12.2016
in € million | |
a) Debt instruments issued | | | 81,437 | | | | 84,513 | |
b) Other securitised liabilities | | | 26,282 | | | | 31,730 | |
| | | | | | | | |
Total | | | 107,719 | | | | 116,243 | |
| | | | | | | | |
Of which: to affiliated companies | | | 2,050 | | | | 2,050 | |
Of which: to other long-term equity investments | | | 0 | | | | 0 | |
Amounts due in the following year | | | 46,298 | | | | 53,794 | |
Of which: Debt instruments issued | | | 20,016 | | | | 22,064 | |
The securitised liabilities comprise EUR 81,437 million (31 December 2016: EUR 84,513 million) in debt instruments issued including accrued interest and EUR 26,282 million (31 December 2016: EUR 31,730 million) in issuing activities (European Commercial Paper and Certificates of Deposit) including accrued interest.
F-24
Of the debt instruments issued, repurchased own debt instruments including accrued interest amounted to EUR 17,715 million (31 December 2016: EUR 22,832 million).
The remaining maturities of the other securitised liabilities as at 31 December 2017 are as follows:
| | | | | | | | |
| | | 31.12.2017
in € million | | | 31.12.2016
in € million | |
Up to three months | | | 16,843 | | | | 20,153 | |
More than three months and up to one year | | | 9,439 | | | | 11,577 | |
More than one year and up to five years | | | 0 | | | | 0 | |
More than five years | | | 0 | | | | 0 | |
| | | | | | | | |
Total | | | 26,282 | | | | 31,730 | |
| | | | | | | | |
Other liabilities
Other liabilities mainly include currency translation adjustments of EUR 597 million from off- balance sheet transactions denominated in foreign currencies (31 December 2016: EUR 125 million), which are recognised in the context of special coverage under Section 340h HGB, and liabilities of EUR 201 million from derivatives featuring swap agreements with an exchange of principal (31 December 2016: EUR 465 million).
Deferred income
Deferred income is comprised of the following items:
| | | | | | | | |
| | | 31.12.2017
in € million | | | 31.12.2016
in € million | |
Unamortised payments received for derivatives | | | 17,721 | | | | 16,231 | |
Issuing business / loans taken out | | | 151 | | | | 126 | |
Lending business (discount on receivables) | | | 37 | | | | 57 | |
Other | | | 6 | | | | 10 | |
| | | | | | | | |
Total | | | 17,915 | | | | 16,424 | |
| | | | | | | | |
“Unamortised payments received for derivatives” includes, among other things, payments received by FMS-WM for the market values of derivatives recognised by the transferors as at the transfer date in 2010. The item also contains unamortised payments received by FMS-WM in fiscal years 2016 and 2017 for the acquisition of interest rate derivatives in connection with the wind-up task related to the DEPFA Group. In fiscal year 2017, FMS-WM also acquired certain derivative positions from DEPFA Group companies, entered into matching, offsetting transactions to those positions and in this context received payments required to be deferred. The EUR 1,490 million increase seen in unamortised payments received for derivatives in the reporting period is mainly attributable to the outlined transactions with the DEPFA Group, partly offset by pro rata amortisation and currency translation effects.
F-25
Deferred income from the lending business mainly includes deferred payments received by FMS-WM for hedge adjustments of the hedged items (receivables) taken over from HRE Group companies. The decrease in the reporting period is attributable to pro rata amortisation.
The deferred income was reversed proportionately over the remaining term of the respective underlying transactions.
Provisions
| | | | | | | | | | | | | | | | | | | | | | | | |
| in € million | | Balance
31.12.2016 | | | Addition | | | Reversal | | | FX effect/
Other | | | Utilisation | | | Balance
31.12.2017 | |
Provision for taxes | | | 6 | | | | 18 | | | | 0 | | | | 0 | | | | 6 | | | | 18 | |
Other | | | 606 | | | | 249 | | | | 163 | | | | –29 | | | | 163 | | | | 500 | |
Expected losses | | | 555 | | | | 155 | | | | 145 | | | | –29 | | | | 53 | | | | 483 | |
Non-personnel and personnel expenses | | | 42 | | | | 85 | | | | 16 | | | | 0 | | | | 101 | | | | 10 | |
Other | | | 9 | | | | 9 | | | | 2 | | | | 0 | | | | 9 | | | | 7 | |
| | | | | | | | | | | | | | | | | | | | | | | | |
Total | | | 612 | | | | 267 | | | | 163 | | | | –29 | | | | 169 | | | | 518 | |
| | | | | | | | | | | | | | | | | | | | | | | | |
Provisions consist mainly of provisions for expected losses for stand-alone derivatives and valuation unit ineffectiveness under Section 254 HGB.
Equity
Please see the section entitled Statement of changes in equity for notes on the changes in and composition of equity.
Contingent liabilities
FMS-WM reports a potential liability under guarantees in the amount of EUR 1,184 million (31 December 2016: EUR 2,093 million). This includes obligations arising from CDSs (with third parties as counterparties) in the amount of EUR 836 million after risk provisions and reported mainly as financial guarantees (31 December 2016: EUR 976 million), a guarantee extended to DEPFA ACS in the amount of EUR 175 million (31 December 2016: EUR 860 million) and so called “transfers via guarantee” in the amount of EUR 93 million (31 December 2016: EUR 142 million).
In the case of the risk positions transferred via guarantee, the assets guaranteed are still accounted for by the holder Deutsche Pfandbriefbank AG, Munich (pbb). The guarantees are designed as abstract, directly enforceable, irrevocable and unconditional guarantees.
The exposure is measured using the parameters applied in credit risk management (risk analysis and assessment).
Accordingly, the potential and specific counterparty default risk is estimated in line with the policy for the underlying lending business. If a risk provision is required, a provision is recognised and deducted from the contingent liabilities reported.
F-26
Other obligations
Irrevocable loan commitments of EUR 3,890 million (31 December 2016: EUR 6,593 million) include undrawn liquidity facilities in the amount of EUR 2,644 million (31 December 2016: EUR 4,803 million), of which EUR 2,547 million (31 December 2016: EUR 4,453 million) relates to DEPFA BANK plc.
In connection with the agreement on the “Ersatzdeckungslösung” (substitute cover solution), FMS-WM pledged to pbb to pay out up to EUR 2,995 million to pbb on request. According to the payment plan, this figure decreased to EUR 1,198 million as at 31 December 2017 (31 December 2016: EUR 1,682 million). This amount is also included in the irrevocable loan commitments. Equally, a disbursement would give rise to a claim of FMS-WM against pbb. In this respect, FMS-WM is exposed to a default risk vis-à-vis the counterparty pbb.
The exposure in the case of the “Ersatzdeckungslösung” (substitute cover solution) is measured using the parameters applied in credit risk management (risk analysis and assessment). Draw-downs may be made on liquidity facilities and other irrevocable loan commitments, depending on the counterparties’ funding requirements.
The counterparty default risk is estimated in line with the policy for the underlying lending business. If a risk provision is required, a provision is recognised and deducted from the other obligations reported.
Other financial obligations
Some of the outsourced services (inter alia FMS-SG, IBM Deutschland and DG FIS) are subject to long-term agreements, giving rise to other financial obligations on the part of FMS-WM. These agreements have fixed and variable performance components. A contractual volume of over EUR 100 million per year, of which an average of around 70% is attributable to FMS-SG, is expected for the next three years.
Assets pledged as collateral
Apart from the securities sold under repurchase agreements as at 31 December 2017 (see the description under debt instruments) in the amount of EUR 18,710 million (31 December 2016: EUR 18,579 million), there are no other assets pledged as collateral for liabilities or contingent liabilities of FMS-WM.
Loans and advances to banks include an amount of EUR 107 million (31 December 2016: EUR 95 million) that has been pledged to a customer as contractually agreed.
Derivative financial instruments
FMS-WM holds only OTC derivatives; none of them are held for trading. The market values of the derivatives are determined by means of standard measurement models based on the measurement parameters available in the market.
F-27
The table below shows the breakdown of FMS-WM’s interest-based and currency-based derivatives and the total return swaps:
| | | | | | | | | | | | | | | | | | | | |
| | | Nominal values | |
| | | Remaining maturities, 31.12.2017 | | | Total | | | Total | |
in € million | | < 1 year | | | 1 – 5 years | | | > 5 years | | | 31.12.2017 | | | 31.12.2016 | |
Interest-based transactions | | | 24,427 | | | | 63,511 | | | | 84,890 | | | | 172,828 | | | | 190,760 | |
Total return swaps | | | 0 | | | | 63 | | | | 3,978 | | | | 4,041 | | | | 4,595 | |
Currency-based transactions | | | 20,548 | | | | 6,196 | | | | 4,154 | | | | 30,898 | | | | 28,941 | |
Of which: forward exchange transactions | | | 17,161 | | | | 0 | | | | 0 | | | | 17,161 | | | | 14,044 | |
Of which: cross currency swaps | | | 3,387 | | | | 6,196 | | | | 4,154 | | | | 13,737 | | | | 14,897 | |
| | | | | | | | | | | | | | | | | | | | |
Total | | | 44,975 | | | | 69,770 | | | | 93,022 | | | | 207,767 | | | | 224,296 | |
| | | | | | | | | | | | | | | | | | | | |
| | | | | | | | | | | | | | | | |
| | | Market values | |
in € million | | 31.12.2017 | | | 31.12.2016 | |
| | | Positive | | | Negative | | | Positive | | | Negative | |
Interest-based transactions | | | 7,906 | | | | –45,430 | | | | 6,334 | | | | –47,164 | |
Total return swaps | | | 1,048 | | | | –1,191 | | | | 1,290 | | | | –1,433 | |
Currency-based transactions | | | 949 | | | | –1,133 | | | | 1,850 | | | | –652 | |
Of which: forward exchange transactions | | | 3 | | | | –327 | | | | 380 | | | | –48 | |
Of which: cross currency swaps | | | 946 | | | | –806 | | | | 1,470 | | | | –604 | |
| | | | | | | | | | | | | | | | |
Total | | | 9,903 | | | | –47,754 | | | | 9,474 | | | | –49,249 | |
| | | | | | | | | | | | | | | | |
The book value of these derivatives reported in the prepaid expenses / deferred income item (net amount of the book values recognised in assets and liabilities) totalled EUR –11,930 million as at 31 December 2017 (31 December 2016: EUR –12,953 million). The book value of these derivatives in the amount of EUR –371 million is reported in the “other assets / other liabilities” item (31 December 2016: EUR 632 million).
The table below shows the breakdown of FMS-WM’s credit derivatives:
| | | | | | | | | | | | | | | | |
in € million | | 31.12.2017 | | | 31.12.2016 | |
| | Nominal
values | | | Market
values | | | Nominal
values | | | Market
values | |
Secured party credit default swaps | | | 267 | | | | 65 | | | | 327 | | | | 87 | |
Guarantor credit default swaps | | | 877 | | | | –33 | | | | 1,027 | | | | –65 | |
| | | | | | | | | | | | | | | | |
Total | | | 1,144 | | | | 32 | | | | 1,354 | | | | 22 | |
| | | | | | | | | | | | | | | | |
The table shows the credit derivatives vis-à-vis third parties, with the derivatives where FMS-WM is the guarantor being reported under contingent liabilities in the amount of EUR 836 million after risk provisions (31 December 2016: EUR 976 million). The book values of those derivatives are recognised in prepaid expenses and deferred income. As at 31 December 2017, the book values recognised as assets and liabilities netted to EUR –6 million.
F-28
Valuation units
In accordance with Section 254 HGB, FMS-WM aggregates hedged items and hedging instruments into hedges. FMS-WM utilises the net valuation unit presentation method to account for the valuation units. In particular, the hedged risk concerns the interest rate-induced risk of changes in value (interest rate risk).
Overall, this nominal value of these hedged items is comprised as follows:
| | | | | | | | |
Nominal values of the hedged items in € million | | 31.12.2017 | | | 31.12.2016 | |
Assets | | | 46,535 | | | | 51,389 | |
Liabilities | | | 56,021 | | | | 53,203 | |
Derivatives | | | 9,662 | | | | 0 | |
| | | | | | | | |
Total | | | 112,218 | | | | 104,592 | |
| | | | | | | | |
Furthermore, hedged items with a nominal value of EUR 4,064 million (31 December 2016: EUR 4,651 million) were combined with total return swaps pursuant to IDW RS BFA 1.
The following overviews contain the nominal values, broken down by their maturities, of assets, liabilities and derivatives that are designated as hedged items in valuation units as at 31 December 2017 and whose countervailing changes in value or cash flows can be expected to balance in the future.
| | | | | | | | |
| in € million | | 31.12.2017 | | | 31.12.2016 | |
Up to three months | | | 228 | | | | 503 | |
More than three months and up to one year | | | 763 | | | | 1,643 | |
More than one year and up to five years | | | 5,391 | | | | 6,631 | |
More than five years | | | 40,153 | | | | 42,612 | |
| | | | | | | | |
Assets | | | 46,535 | | | | 51,389 | |
| | | | | | | | |
| | |
| in € million | | 31.12.2017 | | | 31.12.2016 | |
Up to three months | | | 2,030 | | | | 5,216 | |
More than three months and up to one year | | | 9,124 | | | | 8,996 | |
More than one year and up to five years | | | 42,504 | | | | 36,840 | |
More than five years | | | 2,363 | | | | 2,151 | |
| | | | | | | | |
Liabilities | | | 56,021 | | | | 53,203 | |
| | | | | | | | |
| | |
| in € million | | 31.12.2017 | | | 31.12.2016 | |
Up to three months | | | 7 | | | | 0 | |
More than three months and up to one year | | | 139 | | | | 0 | |
More than one year and up to five years | | | 2,708 | | | | 0 | |
More than five years | | | 6,808 | | | | 0 | |
| | | | | | | | |
Derivatives | | | 9,662 | | | | 0 | |
| | | | | | | | |
F-29
The net hedge presentation method does not require presentation of the positive and negative changes in value (expenses and income) of the hedged risk in a micro valuation unit. Were the gross hedge presentation method to be applied, cumulative expenses and income of EUR 26,172 million (31 December 2016: EUR 28,969 million) would arise on the basis of the current measurements.
The interest rate risk-related changes in the value of the hedged items and hedging instruments arising from valuation units with negative ineffectiveness (interest rate risk hedge) can be seen in the following overview:
| | | | | | | | |
31.12.2017 in € million | | Negative change in value
(absolute figure) | | | Positive change in value
(absolute figure) | |
Hedged items | | | 978 | | | | 15,026 | |
Hedging instruments | | | 15,132 | | | | 955 | |
| | | | | | | | |
Total | | | 16,110 | | | | 15,981 | |
| | | | | | | | |
Of which: not recognised | | | 15,981 | | | | 0 | |
Of which: recognised as a provision for expected losses | | | 129 | | | | 0 | |
Foreign-currency items
Total assets in foreign currencies are EUR 62,156 million (31 December 2016: EUR 73,305 million). Liabilities in foreign currencies at year-end are EUR 74,412 million (31 December 2016: EUR 77,859 million).
F-30
NOTES TO THE INCOME STATEMENT
Net interest income
| | | | | | | | |
| | | 01.01. – 31.12.2017
in € million | | | 01.01. – 31.12.2016
in € million | |
Interest income | | | 6,818 | | | | 6,784 | |
Lending and money market transactions | | | | | | | | |
Of which: negative interest deducted € 486 million (previous year: € 272 million) | | | 4,661 | | | | 4,469 | |
Fixed income securities and registered government debt | | | 2,157 | | | | 2,315 | |
| | |
Interest expenses | | | 6,298 | | | | 6,117 | |
Lending and money market transactions | | | | | | | | |
Of which: positive interest deducted € 464 million (previous year: € 251 million) | | | 4,753 | | | | 4,359 | |
Securitised liabilities | | | 740 | | | | 777 | |
Loans taken out | | | 44 | | | | 45 | |
Other | | | 761 | | | | 936 | |
| | | | | | | | |
Total | | | 520 | | | | 667 | |
| | | | | | | | |
Net interest income declined by EUR 147 million to EUR 520 million in the fiscal year (previous year: EUR 667 million). Net interest income includes one-off effects in the amount of EUR 154 million (previous year: EUR 271 million) in connection with compensation payments received for contractual adjustments to existing credit support annexes for derivatives. The year-on-year decrease in net interest income adjusted for one-off effects is attributable to the reduced volume of the portfolio.
The increase in interest income on the one hand and interest expense on the other is the result of DEPFA liabilities acquired in the context of winding up the DEPFA Group and the expansion of the portfolio. The unwinding of the portfolio had a partly offsetting effect.
The interest income of EUR 4,332 million (previous year: EUR 3,951 million) includes interest from derivative financial instruments and negative interest income in the amount of EUR 486 million (previous year: EUR 272 million) from negative interest on assets (reduction of interest income). Derivative financial instruments account for EUR 4,757 million (previous year: EUR 4,288 million) and negative interest on liabilities for EUR 464 million (previous year: EUR 251 million) of interest expense (reduction of interest expense).
The “Other” item under interest expenses mainly includes amortisation of differences in cases where the cost of securities exceeds their nominal value.
As previously, Western Europe and the United States account for most of the interest income.
F-31
Current income
| | | | | | | | |
| | | 01.01. – 31.12.2017
in € million | | | 01.01. – 31.12.2016
in € million | |
Current income from | | | | | | | | |
Other long-term equity investments | | | 1 | | | | 0 | |
Shares in affiliated companies | | | 192 | | | | 0 | |
| | | | | | | | |
Total | | | 193 | | | | 0 | |
| | | | | | | | |
Current income from shares in affiliated companies result exclusively from a payment from retained earnings made by HRECC.
Income from profit transfer
In the fiscal year, FMS-WM generated net income for the year of EUR 5 million from the existing profit transfer agreement with FMS-SG (previous year: EUR 6 million).
Net commission income
| | | | | | | | |
| | | 01.01. – 31.12.2017
in € million | | | 01.01. – 31.12.2016
in € million | |
Commission income | | | 33 | | | | 55 | |
Derivatives business | | | 17 | | | | 39 | |
Lending business | | | 16 | | | | 15 | |
Other (mainly securities and issuing business) | | | 0 | | | | 1 | |
Commission expenses | | | 20 | | | | 25 | |
Securities and issuing business | | | 12 | | | | 10 | |
Derivatives business | | | 7 | | | | 14 | |
Other | | | 1 | | | | 1 | |
| | | | | | | | |
Total | | | 13 | | | | 30 | |
| | | | | | | | |
In addition to the unwinding of the portfolio, the decline in net commission income is mainly due to lower commission income and expense from derivatives business, as the holdings in question matured.
Commission income and expenses from derivatives business mainly include income and expenses from credit derivatives (CDS).
F-32
Other operating income and expenses
Other operating income of EUR 69 million (previous year: EUR 24 million) mainly includes income from currency translation in the amount of EUR 48 million (previous year: other operating expenses of EUR 2 million) and the reversal of provisions in the amount of EUR 14 million (previous year: EUR 13 million). Other operating expenses of EUR 15 million (previous year: EUR 20 million) mainly include portfolio-related costs, transaction costs and additions to provisions.
General and administrative expenses
| | | | | | | | |
| | | 01.01. – 31.12.2017
in € million | | | 01.01. – 31.12.2016
in € million | |
Personnel expenses | | | 20 | | | | 22 | |
Other administrative expenses | | | 133 | | | | 153 | |
| | | | | | | | |
Total | | | 153 | | | | 175 | |
| | | | | | | | |
Administrative expenses mainly result from expenses incurred in the context of service out-sourcing (servicing of the portfolio assets, administrative and back office activities, IT services, and accounting services).
Personnel expenses for the staff employed by FMS-WM in the 2017 fiscal year amount to EUR 20 million (previous year: EUR 22 million).
Including all service providers employed, expenses for servicing the portfolio decreased by EUR 17 million to EUR 108 million (previous year: EUR 125 million). Other administrative expenses amounted to EUR 25 million in the 2017 fiscal year (previous year: EUR 28 million).
Depreciation and amortisation of intangible and tangible fixed assets
As in the previous year, depreciation and amortisation of intangible and tangible fixed assets remained unchanged at EUR 1 million.
Write-downs of and valuation allowances on receivables and
certain securities, and additions to loan loss provisions
FMS-WM avails itself of the options under Section 340f (3) HGB.
F-33
The following income and expenses are reported in this item:
| | | | | | | | |
| | | 01.01. – 31.12.2017
in € million | | | 01.01. – 31.12.2016
in € million | |
Net revaluation gain / loss in the lending business | | | –159 | | | | –133 | |
Net revaluation gain / loss from securities classified as current assets | | | 0 | | | | 4 | |
| | | | | | | | |
Total | | | –159 | | | | –129 | |
| | | | | | | | |
The net revaluation loss in the lending business of EUR –159 million reflects the valuations carried out in the reporting period to cover acute and latent credit risks.
Write-downs of and valuation allowances on shares in affiliated companies,
other long-term equity investments and securities classified as fixed assets
FMS-WM avails itself of the options under Section 340c (2) HGB.
The following income and expenses were recognised in this item:
| | | | | | | | |
| | | 01.01. – 31.12.2017
in € million | | | 01.01. – 31.12.2016
in € million | |
Net revaluation gain / loss from securities | | | –115 | | | | 35 | |
Net revaluation gain / loss from derivatives | | | 53 | | | | 29 | |
Net gain / loss on sale of securities incl. net gain / loss from derivatives | | | –64 | | | | –75 | |
Other income / expenses | | | 83 | | | | 0 | |
| | | | | | | | |
Total | | | –43 | | | | –11 | |
| | | | | | | | |
The net revaluation loss on securities resulted mainly from net additions to specific loan loss provisions of EUR 125 million and net reversals of country risk provisions of EUR 9 million.
Among other items, the net revaluation gain from derivatives includes net reversals of provisions for expected losses from stand-alone derivatives in the amount of EUR 32 million and valuation unit ineffectiveness in the amount of EUR 21 million.
The gain / loss on sale of securities incl. net gain / loss from derivatives results mainly from losses on disposal.
The other income results from a write-up of the book value of the DEPFA BANK plc equity investment.
Taxes on income
Taxes on income are attributable to corporate income tax, the solidarity surcharge and trade tax.
F-34
OTHER DISCLOSURES
Auditor’s fee
The auditor’s fee recognised during the fiscal year in the amount of EUR 2.5 million (previous year: EUR 2.7 million) is comprised as follows1:
| | | | | | | | |
| | | 01.01. – 31.12.2017
in € million | | | 01.01. – 31.12.2016
in € million | |
Audit services | | | 2.3 | | | | 2.2 | |
Other assurance services | | | 0.2 | | | | 0.2 | |
Tax advisory services | | | 0.0 | | | | 0.0 | |
Other services | | | 0.0 | | | | 0.3 | |
| | | | | | | | |
Total | | | 2.5 | | | | 2.7 | |
| | | | | | | | |
Auditing services relate to the audit of these annual financial statements and the review of the 2017 interim financial statements.
Other assurance services concern the preparation of various comfort letters in connection with FMS-WM’s issuance activities.
Of the total expenses recognised in the reporting year, EUR 0.0 million (previous year: EUR 0.1 million) are related to the previous year (of this amount, EUR 0.0 million (previous year: EUR 0.0 million) concern auditing services).
Proposal for the appropriation of net income / loss
In accordance with Section 13 of the Charter, the Executive Board proposes to the Supervisory Board that the net income for fiscal year 2017 be allocated to retained earnings.
| 1 | Due to the revision of IDW RS HFA 36 new version, the prior-year figures were adjusted to ensure comparability with the current fiscal year. |
F-35
Shareholdings
The following overview shows the shareholdings of FMS-WM, each of which is based on the company’s most recent annual financial statements.
Shares in affiliated companies at 31 December 2017:
| | | | | | | | | | | | | | | | | | | | |
Name and registered office | | Share in
capital | | | Of which:
indirectly | | | Equity
in thousand | | | Result
in thousand | | | Currency | |
DEPFA ACS BANK DAC, Dublin | | | 100.00 | % | | | 100.00 | % | | | 716,710 | 3 | | | 18,959 | 4 | | | EUR | |
DEPFA BANK plc, Dublin | | | 100.00 | % | | | | | | | 599,057 | 3 | | | 106,080 | 4 | | | EUR | |
DEPFA Finance N.V., Amsterdam | | | 100.00 | % | | | 100.00 | % | | | 21,871 | 3 | | | 5,353 | 4 | | | EUR | |
DEPFA Funding II LP, London | | | 100.00 | % | | | 100.00 | % | | | 3,794 | 3, 8 | | | 25,875 | 4 | | | EUR | |
DEPFA Funding III LP, London | | | 100.00 | % | | | 100.00 | % | | | 35,418 | 3, 9 | | | 1,808 | 4 | | | EUR | |
DEPFA Funding IV LP, London | | | 100.00 | % | | | 100.00 | % | | | 7,554 | 3, 10 | | | 7,554 | 4 | | | EUR | |
DEPFA Hold Six, Dublin | | | 100.00 | % | | | 100.00 | % | | | –1 | 3 | | | 0 | 4 | | | USD | |
DEPFA Ireland Holding Ltd, Dublin | | | 100.00 | % | | | 100.00 | % | | | –6,932 | 3 | | | –455 | 4 | | | EUR | |
DEPFA Pfandbrief Bank International S.A., Luxembourg | | | 100.00 | % | | | 100.00 | % | | | 144,962 | 3 | | | –850 | 4 | | | EUR | |
Flint Nominees Ltd., London | | | 100.00 | % | | | | | | | 52,232 | 5 | | | 149 | 6 | | | GBP | |
FMS Wertmanagement Service GmbH, Unterschleißheim | | | 100.00 | % | | | | | | | 50,000 | 1 | | | 0 | 2, 7 | | | EUR | |
Hypo Property Investment (1992) Ltd., London | | | 100.00 | % | | | 100.00 | % | | | 1 | 5 | | | 0 | 6 | | | GBP | |
Hypo Property Investment Ltd., London | | | 100.00 | % | | | 100.00 | % | | | 291 | 5 | | | 1 | 6 | | | GBP | |
Hypo Property Services Ltd., London | | | 100.00 | % | | | 100.00 | % | | | 116 | 5 | | | 1 | 6 | | | GBP | |
Hypo Real Estate Capital Corp., New York | | | 100.00 | % | | | | | | | 592,931 | 5 | | | 20,440 | 6 | | | USD | |
Upgrade 1 LLC, Wilmington / Delaware | | | 100.00 | % | | | 100.00 | % | | | 23,777 | 5 | | | 130 | 6 | | | USD | |
WH-Erste Grundstücks Verwaltungs GmbH, Munich | | | 100.00 | % | | | | | | | 70 | 5 | | | –12 | 6 | | | EUR | |
WH-Zweite Grundstücks Verwaltungs GmbH, Munich | | | 100.00 | % | | | 100.00 | % | | | 39 | 5 | | | –4 | 6 | | | EUR | |
WH-Erste Grundstücks GmbH & Co. KG, Munich | | | 93.98 | % | | | | | | | 101,807 | 5 | | | 19,311 | 6 | | | EUR | |
WH-Zweite Grundstücks GmbH & Co. KG, Munich | | | 100.00 | % | | | 100.00 | % | | | 61,211 | 5 | | | 18,972 | 6 | | | EUR | |
| 3 | 31 December 2017, preliminary |
| 8 | Not including EUR 402,902 thousand in quasi-equity bonds |
| 9 | Not including EUR 250,201 thousand in quasi-equity bonds |
| 10 | Not including EUR 500,000 thousand in quasi-equity bonds |
F-36
Other long-term equity investments at 31 December 2017:
| | | | | | | | | | | | | | | | | | | | |
Name and registered office | | Share in
capital | | | Of which:
indirectly | | | Equity
in thousand | | | Result in
thousand | | | Currency | |
Inula Grundstücks Verwaltungs-gesellschaft mbH & Co. KG, Grünwald | | | 10.00 | % | | | | | | | –19,231 | 1 | | | 4,335 | 2 | | | EUR | |
Vierte Airport Bureau Center KG Airport Bureau Verwaltungs GmbH & Co., Berlin3 | | | 32.00 | % | | | | | | | –4,917 | 4 | | | –1,748 | 5 | | | EUR | |
F-37
Corporate bodies of FMS Wertmanagement
Members of the Executive Board
Stephan Winkelmeier, CRO / CFO (until 31 August 2017), CEO (since 1 September 2017), Executive Board Spokesman
Ernst-Albrecht Brockhaus, Treasury, Markets & Commercial Real Estate (until 31 August 2017)
Frank Hellwig, COO
Christoph Müller, CRO / CFO (since 1 September 2017)
Ernst-Albrecht Brockhaus, responsible for Treasury, Markets & Commercial Real Estate, did not extend his contract when it expired on 31 August 2017. Christoph Müller was appointed to the Executive Board effective 1 September 2017.
Members of the Supervisory Board
Jan Bettink
Chairman of the Supervisory Board
Bankkaufmann (training as a banker)
Klemens Breuer (until 6 January 2017)
Deputy Chairman of the Supervisory Board
Member of the Management Board of Raiffeisen Bank International AG, Global Markets
Dr. Jutta Dönges
Deputy chairperson of the Supervisory Board (since 23 January 2017)
Chairperson of the Steering Committee of the Federal Agency for Financial Market Stabilisation (until 31 December 2017), Managing Director of Bundesrepublik Deutschland Finanzagentur GmbH (since 1 January 2018)
Rita Geyermann
Deputy chairperson of the Supervisory Board (since 23 January 2017)
Director, Head of Asset Management at KfW Bankengruppe
Dr. Axel Berger
Auditor and tax adviser
Dr. Tammo Diemer
Managing Director of Bundesrepublik Deutschland – Finanzagentur GmbH
Birgit Dietl-Benzin
Head Risk & Finance, member of the Executive Board of UBS Deutschland AG
F-38
Michaela Maria Eder von Grafenstein
Member of the Executive Committee and Business Unit Head Real Assets of the Aquila Group Spokesperson of Kapitalverwaltungsgesellschaft Aquila Capital Investmentgesellschaft Spokesperson of the Executive Management of Aquila Investment Gesellschaft mbH
Ingo Mandt (since 6 January 2017)
Bankkaufmann (training as a banker)
Changes on the Supervisory Board in the 2017 fiscal year
The FMSA appointed Ingo Mandt to the Supervisory Board of FMS-WM effective 6 January 2017. He thus succeeds Klemens Breuer, who did not extend his contract and therefore stepped down from the Supervisory Board on 6 January 2017.
Loans to members of the corporate bodies
At the reporting date, there were no claims in respect of incumbent members of the corporate bodies arising from loans or advances.
Remuneration of the corporate bodies
The members of FMS-WM’s Executive Board were paid remuneration of EUR 1,371 thousand for the 2017 fiscal year (previous year: EUR 1,405 thousand). They were also paid benefits in kind of EUR 34 thousand (previous year: EUR 39 thousand). In addition, a total of EUR 415 thousand (previous year: EUR 532 thousand) were expended in the reporting period for the pension plans applicable to the members of the Executive Board.
Total remuneration of EUR 160 thousand was paid to the members of FMS-WM’s Supervisory Board for 2017 (previous year: EUR 160 thousand).
Annual average number of employees
At 31 December 2017, FMS-WM had 121 employees (31 December 2016: 121). The average number of employees in the 2017 fiscal year was:
| | | | | | | | | | | | |
| | | Women | | | Men | | | Total | |
Full-time employees | | | 41 | | | | 80 | | | | 121 | |
F-39
Seats held by Executive Board members
In the 2017 fiscal year, the following members of the Executive Board and employees of FMS-WM held seats on a supervisory board or other supervisory bodies of large corporations in accordance with Section 340a (4) No. 1 HGB in conjunction with Section 267 (3) HGB.
Members of the Executive Board:
Since 1 May 2017, member of the Supervisory Board of Bayerische Landesbank, Munich. Since 1 April 2017, non-executive member of the Board of Directors of DEPFA BANK plc (Chairman), Dublin, (Group office held)
Non-executive member of the Board of Directors of DEPFA BANK plc, Dublin, and of DEPFA ACS BANK DAC, Dublin, (Group offices held)
Non-executive member of the Board of Directors of DEPFA BANK plc, Dublin; DEPFA ACS BANK DAC, Dublin; and DEPFA Pfandbrief Bank International S.A., Luxembourg (Chairman), (Group offices held)
| | • | | Ernst-Albrecht Brockhaus (until 31 March 2017): |
Non-executive member of the Board of Directors of DEPFA BANK plc, Dublin; DEPFA ACS BANK DAC (Chairman), Dublin; and DEPFA Pfandbrief Bank International S.A., Luxembourg, (Group offices held)
REPORT ON POST-BALANCE SHEET DATE EVENTS
In the first quarter of 2018, FMS-WM purchased further bonds and notes of DEPFA Group companies with a nominal value of EUR 0.1 billion.
F-40
RESPONSIBILITY STATEMENT
IN ACCORDANCE WITH SECTION 264 (2) SENTENCE 3 HGB
AND SECTION 289 (1) SENTENCE 5 HGB
To the best of our knowledge, and in accordance with the applicable reporting principles, the annual financial statements give a true and fair view of the assets, liabilities, financial position and profit or loss of FMS-WM, and the management report includes a fair review of the development and performance of the business and the position of FMS-WM, together with a description of the material opportunities and risks associated with the expected development of FMS-WM.
Munich, March 16, 2018
FMS Wertmanagement
The Executive Board
| | | | |
 | |  | |  |
| Stephan Winkelmeier | | Christoph Müller | | Frank Hellwig |
F-41
INDEPENDENT
AUDITOR’S REPORT
To FMS Wertmanagement AöR, Munich
REPORT ON THE AUDIT OF THE
ANNUAL FINANCIAL STATEMENTS AND
OF THE MANAGEMENT REPORT
Opinions
We have audited the annual financial statements of FMS Wertmanagement AöR, Munich (the ‘Company’), which comprise the balance sheet as at 31 December 2017, and the statement of profit and loss for the financial year from 1 January to 31 December 2017, and notes to the financial statements, including the recognition and measurement policies presented therein. In addition, we have audited the management report of FMS Wertmanagement AöR, Munich, for the financial year from 1 January to 31 December 2017.
In our opinion, on the basis of the knowledge obtained in the audit,
| | • | | the accompanying annual financial statements comply, in all material respects, with the requirements of German commercial law applicable to publicly traded companies and give a true and fair view of the assets, liabilities and financial position of the Company as at 31 December 2017 and of its financial performance for the financial year from 1 January 2017 to 31 December 2017 in compliance with German Legally Required Accounting Principles, and |
| | • | | the accompanying management report as a whole provides an appropriate view of the Company’s position. In all material respects, this management report is consistent with the annual financial statements, complies with German legal requirements and appropriately presents the opportunities and risks of future development. |
Pursuant to Section 322 (3) sentence 1 HGB (Handelsgesetzbuch: German Commercial Code), we declare that our audit has not led to any reservations relating to the legal compliance of the annual financial statements and of the management report.
F-42
Basis for the Opinions
We conducted our audit of the annual financial statements and of the management report in accordance with Section 317 HGB and EU Audit Regulation No. 537/2014 (referred to subsequently as “EU Audit Regulation”) and in compliance with German Generally Accepted Standards for Financial Statement Audits promulgated by the Institut der Wirtschaftsprüfer (Institute of Public Auditors in Germany) (IDW). Our responsibilities under those requirements and principles are further described in the “Auditor’s Responsibilities for the Audit of the Annual Financial Statements and of the Management Report” section of our auditor’s report. We are independent of the Company in accordance with the requirements of European law and German commercial and professional law, and we have fulfilled our other German professional responsibilities in accordance with these requirements. In addition, in accordance with Article 10 (2) point (f) of the EU Audit Regulation, we declare that we have not provided non-audit services prohibited under Article 5 (1) of the EU Audit Regulation. We believe that the evidence we have obtained is sufficient and appropriate to provide a basis for our opinions on the annual financial statements and on the management report.
Key Audit Matters in the Audit of the Annual Financial Statements
Key audit matters are those matters that, in our professional judgement, were of most significance in our audit of the annual financial statements for the financial year from 1 January to 31 December 2017. These matters were addressed in the context of our audit of the annual financial statements as a whole, and in forming our opinion thereon, we do not provide a separate opinion on these matters.
Valuation of bonds and other fixed-income securities unless valued as part of a valuation unit
For the accounting policies applied to bonds and other fixed-income securities of FMS Wertmanagement AöR, Munich, please refer to the details on bonds and other fixed-income securities provided in the notes to the financial statements in the sections ‘Accounting policies’ and ‘Notes to the balance sheet’.
THE FINANCIAL STATEMENT RISK
Bonds and other fixed-income securities amounted to EUR 89.7 billion as at the reporting date. Of this amount, EUR 72.0 billion is attributable to bonds and other fixed-income securities valued as assets and EUR 17.7 billion has been allocated to the liquidity reserve.
The entire item consists of unlisted bonds and other fixed-income securities amounting to EUR 12.5 billion for which there is no active market and therefore no observable market prices. In these cases, the lower fair value must be determined based on the Company’s own calculations / valuation models. The essential parameters for these models are generally based on estimates which involve uncertainties and judgements. It is therefore of particular importance
F-43
for the audit that appropriate models and parameters are used for determining the lower fair value in order to identify any indications of permanent impairment and recognise the required impairment losses. The same applies if there is no longer any evidence of such indications.
OUR AUDIT APPROACH
Based on our risk assessment and evaluation of the risks of material misstatement, we used both control-based and substantive audit procedures for our audit opinion. We therefore performed the following audit procedures, among others:
First, we gained an understanding of the development of bonds and other fixed-income securities, the associated risks and internal control with respect to the valuation of bonds and other fixed-income securities.
In addition, we confirmed the appropriateness of the accounting policies to be applied and specified in the written rules of procedure, the implementation and effectiveness of controls designed to ensure compliance with the written rules of procedure for model-based fair value measurement used as a basis for determining the lower value.
For evaluating the appropriateness of internal control with regard to measurement of fair value used as a basis for determining the lower value of those bonds and other fixed-income securities for which there are no observable market prices, we conducted interviews and inspected the relevant documents with the involvement of in-house KPMG valuation experts. A particular focus of the audit was to establish whether the models were validated independent of the market at introduction as well as on a regular basis or as required and the valuation parameters used were also reviewed independent of the market. We assessed in particular whether validation was properly conducted and documented and whether the implemented model and assumptions were appropriate and suitable for the product concerned. Furthermore, we verified on a sample basis whether the market-independent review was properly conducted and documented. We then confirmed that the lower fair value was properly derived from fair value.
Furthermore, with the involvement of our valuation experts, we conducted a revaluation of products deliberately selected on the basis of materiality and risk as well as a sample of prod ucts across all product groups based on risk, and compared the results with the values determined by the Company. The parameters selected for revaluation were derived from internal and external sources.
F-44
OUR OBSERVATIONS
The assets allocated to bonds and other fixed-income securities, for which no prices are observable on the market, are valued based on suitable models and parameters in accordance with the accounting policies. The parameters were derived using appropriate internal and external sources.
Presentation of valuation units
For the accounting policies used for the presentation of FMS Wertmanagement’s valuation units, please refer to the details on valuation units provided in the notes to the financial statements in the sections ‘Accounting policies’ and ‘Notes to the balance sheet’.
THE FINANCIAL STATEMENT RISK
FMS Wertmanagement AöR combines hedged items and hedging instruments into valuation units pursuant to Section 254 of the German Commercial Code (HGB). The hedged risk in particular refers to the risk of interest rate-induced changes in value. Hedged items at a notional value of EUR 106,620 million were included in valuation units.
FMS Wertmanagement AöR applies the so-called net hedge presentation method (“Einfrierungs-methode”) to valuation units, so that positive and negative changes in value of the hedged item and (conversely) the hedging instrument do not result in expenses or income in the financial statements, to the extent that the hedge is effective.
It is therefore of particular importance with respect to the audit that hedge accounting is based on proper procedures and models as well as appropriate assumptions and that existing inefficiencies are identified and the necessary provisions are recognised.
OUR AUDIT APPROACH
Based on our risk assessment and evaluation of the risks of material misstatement, we used both control-based and substantive audit procedures for our audit opinion. We therefore performed the following audit procedures, among others:
First, we gained an understanding of the development of existing valuation units, the associated risks and internal control with respect to assessing hedge effectiveness.
F-45
In addition, we verified that proper controls were implemented and that they are effective to ensure adherence to the written rules of procedure for assessing hedge effectiveness.
For evaluating the appropriateness of internal control with regard to the existing valuation units we conducted interviews and inspected the relevant documents with the involvement of in-house KPMG valuation experts.
Furthermore, with the involvement of our valuation experts, we conducted a revaluation of hedge derivatives deliberately selected on the basis of materiality and risk and compared the results with the values determined by the Company. The parameters selected for revaluation were derived from internal and external sources.
OUR OBSERVATIONS
The assessment of hedge effectiveness as part of hedge accounting is conducted on the basis of proper procedures. The models used for the valuation of derivatives are appropriate, and the assumptions used to measure the fair value of derivatives for which there are no observable market prices have been plausibly derived from the available capital market data.
Adequacy of specific bad debt provisions for receivables from customers
For the accounting policies used for receivables from customers, please refer to the details on receivables from customers provided in the notes to the financial statements in the sections ‘Accounting policies’ and “Notes to the balance sheet’.
THE FINANCIAL STATEMENT RISK
The financial statements of FMS Wertmanagement AöR report receivables from customers in the amount of EUR 13,108 million. In financial year 2017, accumulated write-downs on receivables through profit or loss and additions to loan loss provisions totalled EUR 159 million.
First, receivables at risk of default must be reliably separated from receivables not at risk of default by means of defined criteria. For receivables at risk of default, the lower fair value of the receivables and thereby the amount of the risk provision must be determined. This is done on the basis of assumptions regarding financial performance and the expected repayments (interest and principal repayments) derived therefrom as well as on potential proceeds from the sale of collateral, taking into account current market conditions. The associated assumptions involve considerable uncertainties and judgements.
F-46
The particular risk for the financial statements is that the criteria for determining receivables at risk of default are not sufficiently defined and that the assumptions for determining the specific bad debt provision do not properly reflect the amount of expected repayments from borrowers (their capacity to pay) or proceeds from existing collateral and therefore the required specific bad debt provisions for receivables from customers are insufficient.
OUR AUDIT APPROACH
Based on our risk assessment and evaluation of the risks of material misstatement, we used both control-based and substantive audit procedures for our audit opinion. We therefore performed the following audit procedures, among others:
In a first step, we gained a thorough understanding of the performance of the credit portfolio, the associated credit risks and the internal control system with regard to identifying, controlling, monitoring and evaluating credit risks for the credit portfolio.
Within the scope of control-based audit procedures, we assessed the implementation and effectiveness of controls established by the Company to ensure the adequacy of specific bad debt provisions for receivables from customers. The main focus was on whether the analysis and classification of credit ratings is up-to-date, appropriate and plausible, whether the criteria for determining receivables at risk of default are appropriate and suitable to ensure accurate determination of these receivables, and whether the future debt servicing capacity of borrowers is ascertained based on verifiable requirements and information.
We audited the adequacy of the specific bad debt provision for receivables from customers based on deliberate sampling of individual exposures (tests of details). We in particular verified estimates of future cash flows, taking into account the expected development of key value- determining assumptions and parameters. This particularly includes an assessment of the debt servicing capacity of borrowers based on credit rating information and assessment of the valuation of collateral. Furthermore, another representative random sample was taken from the population remaining after deliberate sampling, which was assessed for proper classification into the applicable risk category.
OUR OBSERVATIONS
The methods, instruments and procedures set up to identify and assess credit risk as well as the procedures for creating risk provisions, including the criteria for separating receivables at risk of default from those that are not, are appropriate. The assumptions used for determining the specific bad debt provisions have been plausibly derived from the available documentation for assessing the capacity of individual borrowers to pay and from the documents for valuing existing collateral.
F-47
Other Information
Management is responsible for the other information. The other information comprises:
| | • | | the remaining parts of the annual report, with the exception of the audited annual financial statements and management report and our auditor’s report. |
Our opinions on the annual financial statements and on the management report do not cover the other information, and consequently we do not express an opinion or any other form of assurance conclusion thereon.
In connection with our audit, our responsibility is to read the other information and, in doing so, to consider whether the other information
| | • | | is materially inconsistent with the annual financial statements, with the management report or our knowledge obtained in the audit, or |
| | • | | otherwise appears to be materially misstated. |
Responsibilities of Management and the Supervisory Board
for the Annual Financial Statements and the Management Report
Management is responsible for the preparation of the annual financial statements that comply, in all material respects, with the requirements of German commercial law applicable to publicly traded companies, and that the annual financial statements give a true and fair view of the assets, liabilities, financial position and financial performance of the Company in compliance with German Legally Required Accounting Principles. In addition, management is responsible for such internal control as they, in accordance with German Legally Required Accounting Principles, have determined necessary to enable the preparation of annual financial statements that are free from material misstatement, whether due to fraud or error.
In preparing the annual financial statements, management is responsible for assessing the Company’s ability to continue as a going concern. They also have the responsibility for disclosing, as applicable, matters related to going concern. In addition, they are responsible for financial reporting based on the going concern basis of accounting, provided no actual or legal circumstances conflict therewith.
Furthermore, management is responsible for the preparation of the management report that as a whole provides an appropriate view of the Company’s position and is, in all material respects, consistent with the annual financial statements, complies with German legal requirements, and appropriately presents the opportunities and risks of future development. In addition, management is responsible for such arrangements and measures (systems) as they have considered necessary to enable the preparation of a management report that is in accordance with the applicable German legal requirements, and to be able to provide sufficient appropriate evidence for the assertions in the management report.
F-48
The supervisory board is responsible for overseeing the Company’s financial reporting process for the preparation of the annual financial statements and of the management report.
Auditor’s Responsibilities for the Audit of the
Annual Financial Statements and of the Management Report
Our objectives are to obtain reasonable assurance about whether the annual financial statements as a whole are free from material misstatement, whether due to fraud or error, and whether the management report as a whole provides an appropriate view of the Company’s position and, in all material respects, is consistent with the annual financial statements and the knowledge obtained in the audit, complies with the German legal requirements and appropriately presents the opportunities and risks of future development, as well as to issue an auditor’s report that includes our opinions on the annual financial statements and on the management report.
Reasonable assurance is a high level of assurance, but is not a guarantee that an audit conducted in accordance with Section 317 HGB and the EU Audit Regulation and in compliance with German Generally Accepted Standards for Financial Statement Audits promulgated by the Institut der Wirtschaftsprüfer (IDW) will always detect a material misstatement. Misstatements can arise from fraud or error and are considered material if, individually or in the aggregate, they could reasonably be expected to influence the economic decisions of users taken on the basis of these annual financial statements and this management report.
We exercise professional judgement and maintain professional scepticism throughout the audit. We also:
| | • | | Identify and assess the risks of material misstatement of the annual financial statements and of the management report, whether due to fraud or error, design and perform audit procedures responsive to those risks, and obtain audit evidence that is sufficient and appropriate to provide a basis for our opinions. The risk of not detecting a material misstatement resulting from fraud is higher than for one resulting from error, as fraud may involve collusion, forgery, intentional omissions, misrepresentations, or the override of internal control. |
F-49
| | • | | Obtain an understanding of internal control relevant to the audit of the annual financial statements and of arrangements and measures (systems) relevant to the audit of the management report in order to design audit procedures that are appropriate in the circumstances, but not for the purpose of expressing an opinion on the effectiveness of these systems. |
| | • | | Evaluate the appropriateness of accounting policies used by management and the reasonableness of estimates made by management and related disclosures. |
| | • | | Conclude on the appropriateness of management’s use of the going concern basis of accounting and, based on the audit evidence obtained, whether a material uncertainty exists related to events or conditions that may cast significant doubt on the Company’s ability to continue as a going concern. If we conclude that a material uncertainty exists, we are required to draw attention in the auditor’s report to the related disclosures in the annual financial statements and in the management report or, if such disclosures are inadequate, to modify our respective opinions. Our conclusions are based on the audit evidence obtained up to the date of our auditor’s report. |
| | • | | Evaluate the overall presentation, structure and content of the annual financial statements, including the disclosures, and whether the annual financial statements present the underlying transactions and events in a manner that the annual financial statements give a true and fair view of the assets, liabilities, financial position and financial performance of the Company in compliance with German Legally Required Accounting Principles. |
| | • | | Evaluate the consistency of the management report with the annual financial statements, its conformity with (German) law, and the view of the Company’s position it provides. |
| | • | | Perform audit procedures on the prospective information presented by management in the management report. On the basis of sufficient appropriate audit evidence we evaluate, in particular, the significant assumptions used by management as a basis for the prospective information, and evaluate the proper derivation of the prospective information from these assumptions. We do not express a separate opinion on the prospective information and on the assumptions used as a basis. There is a substantial unavoidable risk that future events will differ materially from the prospective information. |
We communicate with those charged with governance regarding, among other matters, the planned scope and timing of the audit and significant audit findings, including any significant deficiencies in internal control that we identify during our audit.
We also provide those charged with governance with a statement that we have complied with the relevant independence requirements, and communicate with them all relationships and other matters that may reasonably be thought to bear on our independence, and where applicable, the related safeguards.
From the matters communicated with those charged with governance, we determine those matters that were of most significance in the audit of the annual financial statements of the current period and are therefore the key audit matters. We describe these matters in our auditor’s report unless law or regulation precludes public disclosure about the matter.
F-50
OTHER LEGAL AND REGULATORY REQUIREMENTS
Further Information pursuant to Article 10 of the EU Audit Regulation
We were elected as auditor by supervisory board resolution on 20 June 2017. We were engaged by the Supervisory Board on 15 July 2017. We have been the auditor of FMS Wertmanagement AöR, Munich, without interruption since financial year 2015.
We declare that the opinions expressed in this auditor’s report are consistent with the additional report to the audit committee pursuant to Article 11 of the EU Audit Regulation (long-form audit report).
GERMAN PUBLIC AUDITOR RESPONSIBLE FOR THE ENGAGEMENT
The German Public Auditor responsible for the engagement is Mr Klaus-Ulrich Pfeiffer.
Munich, 16 March 2018
KPMG AG
Wirtschaftsprüfungsgesellschaft
(Original German version signed by:)
| | |
| Klaus-Ulrich Pfeiffer | | Bettina Hillekamp |
| Wirtschaftsprüfer | | Wirtschaftsprüferin |
| (German Public Auditor) | | (German Public Auditor) |
F-51
ANNEX A
SCHEDULEOF FUNDED DEBT OUTSTANDINGASOF DECEMBER 31, 2017
FMS-WM bearer bonds as of December 31, 2017 (excluding registered bonds)
| | | | | | | | | | | | | | | | | | |
Currency / ISIN | | Number of
Issues /
coupon type | | Maturity | | | Initial amount in
currency of
borrowing | | | Initial amount
equivalent in Euro | | | Amount outstanding
equivalent in Euro | |
| | | | | | | | | | | (unaudited) | | | | |
| | | | | | | | (in thousands) | | | (in thousands) | | | (in thousands) | |
EUR | | 51 | | | | | | | 44,935,000,000 | | | | 44,935,000,000 | | | | 50,935,000,000 | |
| | | | | | | | | | | | | | | | | | |
DE000A1REUS2 | | floating | | | January 23, 2018 | | | | 250,000,000 | | | | 250,000,000 | | | | 1,000,000,000 | |
XS1349011012 | | floating | | | February 1, 2018 | | | | 300,000,000 | | | | 300,000,000 | | | | 1,000,000,000 | |
DE000A1X3FW3 | | fixed | | | March 12, 2018 | | | | 500,000,000 | | | | 500,000,000 | | | | 1,000,000,000 | |
DE000A1H3DH9 | | floating | | | March 15, 2018 | | | | 25,000,000 | | | | 25,000,000 | | | | 25,000,000 | |
DE000A1MLU59 | | fixed | | | May 23, 2018 | | | | 250,000,000 | | | | 250,000,000 | | | | 800,000,000 | |
DE000A1X3FN2 | | floating | | | June 18, 2018 | | | | 1,000,000,000 | | | | 1,000,000,000 | | | | 1,000,000,000 | |
DE000A11QB48 | | floating | | | July 16, 2018 | | | | 1,500,000,000 | | | | 1,500,000,000 | | | | 1,500,000,000 | |
DE000A1K0GG5 | | fixed | | | August 3, 2018 | | | | 1,500,000,000 | | | | 1,500,000,000 | | | | 1,500,000,000 | |
XS0963874234 | | fixed | | | September 3, 2018 | | | | 500,000,000 | | | | 500,000,000 | | | | 1,000,000,000 | |
DE000A2AAML6 | | floating | | | September 20, 2018 | | | | 250,000,000 | | | | 250,000,000 | | | | 250,000,000 | |
DE000A1X3FM4 | | floating | | | November 19, 2018 | | | | 2,000,000,000 | | | | 2,000,000,000 | | | | 2,000,000,000 | |
XS0856697536 | | floating | | | November 20, 2018 | | | | 50,000,000 | | | | 50,000,000 | | | | 50,000,000 | |
XS0725294218 | | fixed | | | December 28, 2018 | | | | 25,000,000 | | | | 25,000,000 | | | | 25,000,000 | |
XS1550202888 | | floating | | | January 16, 2019 | | | | 1,000,000,000 | | | | 1,000,000,000 | | | | 1,000,000,000 | |
DE000A1X3FL6 | | floating | | | January 23, 2019 | | | | 2,000,000,000 | | | | 2,000,000,000 | | | | 2,000,000,000 | |
DE000A11QBV2 | | floating | | | January 27, 2019 | | | | 500,000,000 | | | | 500,000,000 | | | | 1,000,000,000 | |
XS1556044763 | | floating | | | February 18, 2019 | | | | 1,000,000,000 | | | | 1,000,000,000 | | | | 1,000,000,000 | |
DE000A12T523 | | floating | | | February 26, 2019 | | | | 500,000,000 | | | | 500,000,000 | | | | 1,000,000,000 | |
DE000A11QBN9 | | fixed | | | March 14, 2019 | | | | 500,000,000 | | | | 500,000,000 | | | | 1,000,000,000 | |
DE000A11QBP4 | | floating | | | March 20, 2019 | | | | 2,000,000,000 | | | | 2,000,000,000 | | | | 2,000,000,000 | |
DE000A11QBQ2 | | floating | | | April 15, 2019 | | | | 2,000,000,000 | | | | 2,000,000,000 | | | | 2,000,000,000 | |
XS1572433495 | | floating | | | April 15, 2019 | | | | 1,000,000,000 | | | | 1,000,000,000 | | | | 1,000,000,000 | |
DE000A1MLVD8 | | fixed | | | May 9, 2019 | | | | 3,000,000,000 | | | | 3,000,000,000 | | | | 3,000,000,000 | |
DE000A2AAMF8 | | floating | | | June 20, 2019 | | | | 50,000,000 | | | | 50,000,000 | | | | 50,000,000 | |
DE000A1X3FP7 | | floating | | | July 1, 2019 | | | | 2,050,000,000 | | | | 2,050,000,000 | | | | 2,050,000,000 | |
DE000A1PGP76 | | floating | | | October 24, 2019 | | | | 100,000,000 | | | | 100,000,000 | | | | 100,000,000 | |
DE000A1REUB8 | | fixed | | | January 15, 2020 | | | | 2,500,000,000 | | | | 2,500,000,000 | | | | 2,500,000,000 | |
XS1559786279 | | floating | | | February 3, 2020 | | | | 25,000,000 | | | | 25,000,000 | | | | 25,000,000 | |
XS1566106404 | | floating | | | February 17, 2020 | | | | 1,000,000,000 | | | | 1,000,000,000 | | | | 1,000,000,000 | |
XS1586942804 | | floating | | | March 30, 2020 | | | | 1,000,000,000 | | | | 1,000,000,000 | | | | 1,000,000,000 | |
DE000A12T5X5 | | fixed | | | April 16, 2020 | | | | 1,500,000,000 | | | | 1,500,000,000 | | | | 1,500,000,000 | |
XS1669346485 | | floating | | | May 22, 2020 | | | | 1,000,000,000 | | | | 1,000,000,000 | | | | 1,000,000,000 | |
DE000A14J2X2 | | floating | | | July 30, 2020 | | | | 2,000,000,000 | | | | 2,000,000,000 | | | | 2,000,000,000 | |
DE000A161KR3 | | fixed | | | September 15, 2020 | | | | 150,000,000 | | | | 150,000,000 | | | | 150,000,000 | |
DE000A2DAC39 | | floating | | | September 18, 2020 | | | | 1,500,000,000 | | | | 1,500,000,000 | | | | 1,500,000,000 | |
DE000A161KW3 | | floating | | | October 8, 2020 | | | | 2,000,000,000 | | | | 2,000,000,000 | | | | 2,000,000,000 | |
A-1
| | | | | | | | | | | | | | | | |
Currency / ISIN | | Number of
Issues /
coupon type | | Maturity | | Initial amount in
currency of
borrowing | | | Initial amount
equivalent in Euro | | | Amount outstanding
equivalent in Euro | |
| | | | | | | | | | (unaudited) | | | | |
| | | | | | | (in thousands) | | | (in thousands) | | | (in thousands) | |
DE000A161K17 | | fixed | | October 9, 2020 | | | 150,000,000 | | | | 150,000,000 | | | | 150,000,000 | |
DE000A2AAMP7 | | floating | | October 20, 2020 | | | 1,500,000,000 | | | | 1,500,000,000 | | | | 1,500,000,000 | |
DE000A2DACY4 | | floating | | November 13, 2020 | | | 1,500,000,000 | | | | 1,500,000,000 | | | | 1,500,000,000 | |
DE000A1H3DB2 | | floating | | January 20, 2021 | | | 100,000,000 | | | | 100,000,000 | | | | 100,000,000 | |
DE000A1H3DE6 | | floating | | February 16, 2021 | | | 50,000,000 | | | | 50,000,000 | | | | 50,000,000 | |
DE000A1H3DQ0 | | floating | | April 6, 2021 | | | 500,000,000 | | | | 500,000,000 | | | | 500,000,000 | |
DE000A1KRG61 | | fixed | | May 17, 2021 | | | 10,000,000 | | | | 10,000,000 | | | | 10,000,000 | |
DE000A1KQ961 | | fixed | | June 17, 2021 | | | 1,000,000,000 | | | | 1,000,000,000 | | | | 1,000,000,000 | |
DE000A161K82 | | fixed | | July 6, 2021 | | | 1,500,000,000 | | | | 1,500,000,000 | | | | 1,500,000,000 | |
DE000A1K0ET3 | | floating | | August 1, 2021 | | | 60,000,000 | | | | 60,000,000 | | | | 60,000,000 | |
DE000A1K0SM8 | | fixed | | September 8, 2021 | | | 1,500,000,000 | | | | 1,500,000,000 | | | | 3,000,000,000 | |
DE000A1PGP84 | | fixed | | September 15, 2021 | | | 10,000,000 | | | | 10,000,000 | | | | 10,000,000 | |
DE000A1PGP92 | | fixed | | August 15, 2022 | | | 10,000,000 | | | | 10,000,000 | | | | 10,000,000 | |
DE000A1REUK9 | | floating | | November 15, 2022 | | | 20,000,000 | | | | 20,000,000 | | | | 20,000,000 | |
DE000A14J2Q6 | | fixed | | April 29, 2030 | | | 500,000,000 | | | | 500,000,000 | | | | 500,000,000 | |
| | | | | |
USD | | 17 | | | | | 19,050,000,000 | | | | 15,884,265,822 | | | | 17,009,922,455 | |
| | | | | | | | | | | | | | | | |
XS1345352881 | | floating | | January 16, 2018 | | | 500,000,000 | | | | 416,909,864 | | | | 833,819,728 | |
XS1412586486 | | floating | | May 18, 2018 | | | 500,000,000 | | | | 416,909,864 | | | | 833,819,728 | |
US30254WAH25 | | fixed | | July 30, 2018 | | | 1,500,000,000 | | | | 1,250,729,592 | | | | 1,250,729,592 | |
US30254WAD11 | | fixed | | November 20, 2018 | | | 2,000,000,000 | | | | 1,667,639,456 | | | | 1,667,639,456 | |
XS1369288052 | | floating | | February 11, 2019 | | | 1,000,000,000 | | | | 833,819,728 | | | | 833,819,728 | |
XS1566192560 | | floating | | February 15, 2019 | | | 500,000,000 | | | | 416,909,864 | | | | 416,909,864 | |
XS1576836321 | | fixed | | March 7, 2019 | | | 1,000,000,000 | | | | 833,819,728 | | | | 833,819,728 | |
XS1664635213 | | fixed | | August 9, 2019 | | | 1,000,000,000 | | | | 833,819,728 | | | | 833,819,728 | |
US30254WAK53 | | fixed | | August 16, 2019 | | | 2,000,000,000 | | | | 1,667,639,456 | | | | 1,667,639,456 | |
XS1278568420 | | floating | | August 21, 2019 | | | 500,000,000 | | | | 416,909,864 | | | | 541,982,823 | |
XS1496753887 | | floating | | November 27, 2019 | | | 750,000,000 | | | | 625,364,796 | | | | 625,364,796 | |
US30254WAL37 | | fixed | | January 24, 2020 | | | 2,000,000,000 | | | | 1,667,639,456 | | | | 1,667,639,456 | |
US30254WAG42 | | fixed | | March 17, 2020 | | | 1,500,000,000 | | | | 1,250,729,592 | | | | 1,250,729,592 | |
XS1610895168 | | fixed | | May 15, 2020 | | | 1,000,000,000 | | | | 833,819,728 | | | | 833,819,728 | |
XS1299717543 | | floating | | October 1, 2020 | | | 300,000,000 | | | | 250,145,918 | | | | 416,909,864 | |
US30254WAJ80 | | fixed | | June 8, 2021 | | | 1,500,000,000 | | | | 1,250,729,592 | | | | 1,250,729,592 | |
US30254WAM10 | | fixed | | August 1, 2022 | | | 1,500,000,000 | | | | 1,250,729,592 | | | | 1,250,729,592 | |
| | | | | |
GBP | | 13 | | | | | 6,870,000,000 | | | | 7,743,200,748 | | | | 12,420,680,094 | |
| | | | | | | | | | | | | | | | |
XS1243938849 | | fixed | | April 10, 2018 | | | 350,000,000 | | | | 394,486,210 | | | | 1,211,636,216 | |
DE000A2AAMN2 | | floating | | April 11, 2018 | | | 1,200,000,000 | | | | 1,352,524,148 | | | | 1,352,524,148 | |
XS1052681902 | | fixed | | December 7, 2018 | | | 250,000,000 | | | | 281,775,864 | | | | 1,408,879,321 | |
XS1554460649 | | fixed | | January 23, 2019 | | | 200,000,000 | | | | 225,420,691 | | | | 225,420,691 | |
XS1342851331 | | fixed | | March 8, 2019 | | | 1,000,000,000 | | | | 1,127,103,457 | | | | 1,408,879,321 | |
A-2
| | | | | | | | | | | | | | | | | | |
Currency / ISIN | | Number of
Issues /
coupon type | | Maturity | | | Initial amount in
currency of
borrowing | | | Initial amount
equivalent in Euro | | | Amount outstanding
equivalent in Euro | |
| | | | | | | | | | | (unaudited) | | | | |
| | | | | | | | (in thousands) | | | (in thousands) | | | (in thousands) | |
DE000A2DAC47 | | floating | | | April 18, 2019 | | | | 1,050,000,000 | | | | 1,183,458,630 | | | | 1,183,458,630 | |
DE000A2DAC62 | | floating | | | June 7, 2019 | | | | 600,000,000 | | | | 676,262,074 | | | | 676,262,074 | |
XS1171593020 | | fixed | | | December 13, 2019 | | | | 300,000,000 | | | | 338,131,037 | | | | 1,408,879,321 | |
XS1548389292 | | fixed | | | March 6, 2020 | | | | 1,000,000,000 | | | | 1,127,103,457 | | | | 1,127,103,457 | |
XS1522357471 | | fixed | | | May 14, 2021 | | | | 250,000,000 | | | | 281,775,864 | | | | 901,682,765 | |
XS1452619882 | | fixed | | | July 20, 2021 | | | | 120,000,000 | | | | 135,252,415 | | | | 135,252,415 | |
XS1564458195 | | fixed | | | February 14, 2022 | | | | 250,000,000 | | | | 281,775,864 | | | | 1,042,570,698 | |
XS1700386060 | | fixed | | | September 7, 2023 | | | | 300,000,000 | | | | 338,131,037 | | | | 338,131,037 | |
| | | | | |
SEK | | 2 | | | | | | | 4,900,000,000 | | | | 497,775,249 | | | | 497,775,249 | |
| | | | | | | | | | | | | | | | | | |
XS0803736510 | | fixed | | | March 12, 2019 | | | | 3,500,000,000 | | | | 355,553,750 | | | | 355,553,750 | |
XS0782368681 | | fixed | | | June 1, 2022 | | | | 1,400,000,000 | | | | 142,221,500 | | | | 142,221,500 | |
| | | | | |
AUD | | 1 | | | | | | | 300,000,000 | | | | 195,490,682 | | | | 195,490,682 | |
| | | | | | | | | | | | | | | | | | |
AU3CB0229490 | | fixed | | | May 8, 2019 | | | | 300,000,000 | | | | 195,490,682 | | | | 195,490,682 | |
| | | | | |
NOK | | 1 | | | | | | | 500,000,000 | | | | 50,811,459 | | | | 71,136,043 | |
| | | | | | | | | | | | | | | | | | |
XS0644078486 | | fixed | | | July 5, 2021 | | | | 500,000,000 | | | | 50,811,459 | | | | 71,136,043 | |
| | | | | |
Sum | | 85 | | | | | | | n.a. | | | | 69,306,543,960 | | | | 81,130,004,523 | |
| | | | | | | | | | | | | | | | | | |
A-3
THE FEDERAL REPUBLIC OF GERMANY
The following information regarding the Federal Republic is derived from the public official documents cited below. Certain of the information is preliminary.
GENERAL
Area, Location and Population
The Federal Republic is situated in central Europe and comprises an area of approximately 357,000 square kilometers (about 138,000 square miles). Its total population is estimated to have increased to at least 82.8 million at the end of 2017 compared to 82.5 million people at the end of 2016. The projected increase is again due to Germany’s expected immigration surplus, which is thought to have more than offset the birth deficit (i.e., the negative difference between births and deaths). Based on provisional results, the Federal Statistical Office estimates that net immigration of foreigners amounted to 450,000 persons in 2017, considerably below the record high of 2015. In 2015, approximately 16.6% of the total population was concentrated in metropolitan areas with more than 500,000 inhabitants; the largest of these areas were (in descending order) Berlin, Hamburg, Munich, Cologne and Frankfurt am Main.
Sources: Statistisches Bundesamt, Statistisches Jahrbuch 2017, Tables 1.2, 2.1.9 (https://www.destatis.de/DE/Publikationen/StatistischesJahrbuch/StatistischesJahrbuch2017.pdf?__blob=publicationFile); Statistisches Bundesamt,Germany’s population stood at 82.5 million at the end of 2016, press release of January 16, 2018 (https://www.destatis.de/EN/PressServices/Press/pr/2018/01/PE18_019_12411.html; German version: https://www.destatis.de/DE/PresseService/Presse/Pressemitteilungen/2018/01/PD18_019_12411.html).
G-1
The following table shows selected key demographic figures for the Federal Republic for the years stated.
POPULATION
| | | | | | | | | | | | | | | | | | | | |
| | | 2016(1) | | | 2015 | | | 2014 | | | 2013 | | | 2012 | |
| |
| | | (number of persons) | |
Total population | | | 82,521,653 | | | | 82,175,684 | | | | 81,197,537 | | | | 80,767,463 | | | | 80,523,746 | |
| |
| Age distribution | | (percent of total population) | |
Under 20 | | | 18.4 | | | | 18.3 | | | | 18.2 | | | | 18.2 | | | | 18.3 | |
20-40 | | | 24.5 | | | | 24.5 | | | | 24.1 | | | | 24.0 | | | | 23.9 | |
40-60 | | | 29.4 | | | | 29.8 | | | | 30.3 | | | | 30.7 | | | | 30.9 | |
60-80 | | | 21.6 | | | | 21.6 | | | | 21.8 | | | | 21.8 | | | | 21.6 | |
80 and more | | | 6.0 | | | | 5.8 | | | | 5.6 | | | | 5.4 | | | | 5.4 | |
| |
| Growth rate | | (percent change on the previous year) | |
Total population | | | 0.4 | | | | 1.2 | | | | 0.5 | | | | 0.3 | | | | 0.2 | |
Under 20 | | | 1.0 | | | | 2.2 | | | | 0.5 | | | | -0.3 | | | | -0.5 | |
20-40 | | | 0.6 | | | | 2.6 | | | | 1.1 | | | | 0.9 | | | | 0.4 | |
40-60 | | | -0.9 | | | | -0.4 | | | | -0.6 | | | | -0.5 | | | | -0.3 | |
60-80 | | | 0.4 | | | | 0.4 | | | | 0.7 | | | | 1.2 | | | | 1.2 | |
80 and more | | | 4.5 | | | | 4.1 | | | | 4.1 | | | | 0.9 | | | | 1.3 | |
| (1) | The development of the population in the reporting year 2016 is only comparable to the previous year’s figures to a limited extent due to methodological changes in the underlying population flow statistics. Limitations in the accuracy of the results may be due to increased immigration and the resulting problems in connection with the registration of persons seeking protection as required by German reporting laws. |
Sources: Statistisches Bundesamt, Population, Current Population, Population by age groups, Germany, Value (https://www.destatis.de/EN/FactsFigures/SocietyState/Population/CurrentPopulation/Tables_/lrbev01.html?cms_gtp=150344_list%253D1&https=1); Statistisches Bundesamt, Population, Current Population, Population by age groups, Germany, Change on the previous year (https://www.destatis.de/EN/FactsFigures/SocietyState/Population/CurrentPopulation/Tables_/lrbev01.html?cms_gtp=150344_list%253D2&https=1).
Notwithstanding the population increase in recent years due to net immigration, the German population is poised for a decline due to the gradual aging of its population. These developments are expected to continue and intensify over the next several decades and may result in a downward pressure on Germany’s growth potential in the long term. According to estimates of the Federal Statistical Office, higher net immigration is expected to have only limited effects on long-term population trends and cannot reverse the trend towards increased population aging.
Sources: Statistisches Bundesamt, New projection of Germany’s population by 2060, press release of April 28, 2015 (https://www.destatis.de/EN/PressServices/Press/pr/2015/04/PE15_153_12421.html); Statistisches Bundesamt, Currently high immigration cannot reverse population ageing, press release of January 20, 2016 (https://www.destatis.de/EN/PressServices/Press/pr/2016/01/PE16_021_12421.html).
Government
The Federal Republic is a federated republic whose constitution is codified in the Grundgesetz of 1949. The capital of the Federal Republic is Berlin. The Federal Republic consists of 16 federal states (Länder). The Länder have legislative sovereignty over matters not expressly reserved to the legislative, executive and judicial bodies of the Federal Republic.
The Grundgesetz provides for a Federal President (Bundespräsident), two Houses of Parliament (the Bundestag and the Bundesrat, which consists of representatives of the 16 Länder governments), a Chancellor (Bundeskanzler) and a Federal Constitutional Court (Bundesverfassungsgericht). The Chancellor heads the Federal Government (Bundesregierung), consisting of the Chancellor and the Federal Ministers. The Bundespräsident acts as head of state.
General elections for the Bundestag are generally held every four years on the basis of an electoral system of proportional representation. The last general election was held on September 24, 2017.
A political party is not entitled to party representation in the Bundestag unless it receives at least 5% of the votes cast or three direct mandates, awarded to the candidate with the most votes in a given electoral district, in a general election. The Chancellor is elected by and is responsible to the Bundestag.
G-2
Political Parties
The political parties currently represented in the Bundestag are the Christian Democratic Union (CDU) and its Bavarian sister party, the Christian Social Union (CSU), the Social Democratic Party (SPD), the Alternative for Germany (AfD), the Free Democratic Party (FDP), the Left-Wing Party (Die Linke, founded in 2007 by the merger of the Left-Wing Party of Democratic Socialism (Linkspartei.PDS) and the party Labor and Social Justice – The Election Alternative (WASG)) and the Greens (Bündnis 90/Die Grünen).
Since 1949, the Federal Republic has been governed by eight Chancellors over 19 electoral periods. After prolonged negotiations, the most recent general election, held in September 2017, resulted in a coalition between the Christian Democrats (CDU/CSU) and the Social Democratic Party (SPD). On March 14, 2018, the Bundestag re-elected Dr. Angela Merkel (CDU) Chancellor for the fourth time. Dr. Merkel has been serving as Chancellor since 2005.
Sources: The Federal Returning Officer, Official final result of the 2017 Bundestag Election, press release of October 12, 2017 (https://www.bundeswahlleiter.de/en/info/presse/mitteilungen/bundestagswahl-2017/34_17_endgueltiges_ergebnis.html); Koalitionsvertrag zwischen CDU, CSU und SPD Ein neuer Aufbruch für Europa. Eine neue Dynamik für Deutschland. Ein neuer Zusammenhalt für unser Land, March 12, 2018 (https://www.bundeskanzlerin.de/Content/DE/_Anlagen/2018/03/2018-03-14-koalitionsvertrag.pdf?__blob=publicationFile&v=1). The Federal Chancellor, Angela Merkel re-elected Chancellor, news of March 14, 2018 (https://www.bundeskanzlerin.de/Content/EN/Artikel/2018/03_en/2018-03-14-wahl-im-bundestag_en.html).
The following table shows the results of the five most recent general elections for the Bundestag.
ELECTION RESULTSTOTHE GERMAN BUNDESTAG
| | | | | | | | | | | | | | | | | | | | | | | | | | | | | | | | | | | | | | | | |
| | | 2017 Elections | | | 2013 Elections | | | 2009 Elections | | | 2005 Elections | | | 2002 Elections | |
| | | % of
Votes | | | Seats | | | % of
Votes | | | Seats | | | % of
Votes | | | Seats | | | % of
Votes | | | Seats | | | % of
Votes | | | Seats | |
CDU/CSU | | | 33.0 | | | | 246 | | | | 41.5 | | | | 311 | | | | 33.8 | | | | 239 | | | | 35.2 | | | | 226 | | | | 38.5 | | | | 248 | |
SPD | | | 20.5 | | | | 153 | | | | 25.7 | | | | 193 | | | | 23.0 | | | | 146 | | | | 34.2 | | | | 222 | | | | 38.5 | | | | 251 | |
AfD | | | 12.6 | | | | 94 | | | | 4.7 | | | | — | | | | — | | | | — | | | | — | | | | — | | | | — | | | | — | |
FDP | | | 10.7 | | | | 80 | | | | 4.8 | | | | — | | | | 14.6 | | | | 93 | | | | 9.8 | | | | 61 | | | | 7.4 | | | | 47 | |
Die Linke. (1) | | | 9.2 | | | | 69 | | | | 8.6 | | | | 64 | | | | 11.9 | | | | 76 | | | | 8.7 | | | | 54 | | | | 4.0 | | | | 2 | |
Bündnis 90/Die Grünen | | | 8.9 | | | | 67 | | | | 8.4 | | | | 63 | | | | 10.7 | | | | 68 | | | | 8.1 | | | | 51 | | | | 8.6 | | | | 55 | |
Others | | | 5.0 | | | | — | | | | 6.2 | | | | — | | | | 6.0 | | | | — | | | | 3.9 | | | | — | | | | 3.0 | | | | — | |
| | | | | | | | | | | | | | | | | | | | | | | | | | | | | | | | | | | | | | | | |
Total | | | | | | | 709 | | | | | | | | 631 | | | | | | | | 622 | | | | | | | | 614 | | | | | | | | 603 | |
| | | | | | | | | | | | | | | | | | | | | | | | | | | | | | | | | | | | | | | | |
| (1) | Results for the Party of Democratic Socialism (PDS) for all elections prior to 2005. |
Sources: Der Bundeswahlleiter 2017 (https://www.bundeswahlleiter.de/bundestagswahlen/2017/ergebnisse/bund-99.html), Statistisches Bundesamt, Statistisches Jahrbuch 2016, Tables 10.1.1 and 10.1.2; Statistisches Bundesamt, Statistisches Jahrbuch 2011, Tables 4.3.1, 4.3.2 and 4.6.
International Organizations
In addition to the European Union (“EU”), the Federal Republic is a member of various major multilateral institutions, including the United Nations, the International Monetary Fund (“IMF”), the International Bank for Reconstruction and Development and the International Development Association, the Council of Europe, the Organization for Economic Cooperation and Development and the North Atlantic Treaty Organization. Furthermore, the Federal Republic is a signatory to the General Agreement on Tariffs and Trade and a member of the World Trade Organization (“WTO”). It is also a shareholder of, among others, the European Investment Bank, the European Bank for Reconstruction and Development, the Asian Infrastructure Investment Bank and the European Atomic Energy Community.
G-3
The European Union and European Integration
The Federal Republic was a founding member of the European Coal and Steel Community in 1951, which later developed into the European Union. Today, the Federal Republic is one of 28 member states of the EU, which include Austria, Belgium, Bulgaria, Croatia, Cyprus, the Czech Republic, Denmark, Estonia, Finland, France, Germany, Greece, Hungary, Ireland, Italy, Latvia, Lithuania, Luxembourg, Malta, the Netherlands, Poland, Portugal, Romania, the Slovak Republic, Slovenia, Spain, Sweden and the United Kingdom (“UK”) (together, the “Member States”). According to provisional data, the aggregate population of the Member States was approximately 512 million as of January 1, 2017. The EU is still in the process of change. Formal membership negotiations are currently being conducted with Turkey, Montenegro and Serbia. The former Yugoslav Republic of Macedonia and Albania have been granted candidate status. Bosnia and Herzegovina and Kosovo are potential candidates. See “Political Integration” below for more information on the UK’s decision to withdraw from the EU.
Sources: European Union, The history of the European Union (http://europa.eu/about-eu/eu-history/index_en.htm); European Union, The history of the European Union: 2000-2009 (http://europa.eu/about-eu/eu-history/2000-2009/index_en.htm); European Union, The history of the European Union: 2010-today (http://europa.eu/european-union/about-eu/history/2010-today_en); Statistical Office of the European Communities, Total population (http://epp.eurostat.ec.europa.eu/tgm/table.do? tab=table&language=en&pcode=tps00001&tableSelection=1&footnotes=yes&labeling=labels&plugin=1); European Commission, Enlargement, Countries, Check current status (http://ec.europa.eu/enlargement/countries/check-current-status/index_en.htm).
Political Integration
The EU’s three main institutions are the Council (representing the governments of the Member States), the Parliament (elected by and representing the citizens of the Member States) and the European Commission (the executive body of the EU). After several years of negotiations about institutional issues among the Member States in an intergovernmental conference, in which the European Commission and the Parliament were also involved, the Treaty of Lisbon entered into force on December 1, 2009. It amends and supplements the existing treaties underlying the EU and aims to provide the EU with the legal framework and tools necessary to meet future challenges and to respond to citizens’ demands. Among other matters, the treaty aims to make the EU more democratic and transparent by strengthening the role of the European Parliament and national parliaments, by offering more opportunities to citizens to provide input for policy proposals, by clearly categorizing competences between Member States and the EU and by explicitly recognizing the possibility for a Member State to withdraw from the EU. To reflect the EU’s enlargement and improve the effectiveness and efficiency of its decision-making, the treaty also streamlined and modernized EU institutions and simplified their working methods and voting rules.
Sources: European Commission, Europe in 12 lessons by Pascal Fontaine, How does the EU work? (http://bookshop.europa.eu/en/europe-in-12-lessons-pbNA3110652/downloads/NA-31-10-652-EN-C/NA3110652ENC_002.pdf?FileName=NA3110652ENC_002.pdf&SKU=NA3110652ENC_PDF&
CatalogueNumber=NA-31-10-652-EN-C); Europa.eu, EU treaties: Treaty of Lisbon (http://europa.eu/european-union/law/treaties_en).
On June 23, 2016, the citizens of the UK voted to leave the EU, and on March 29, 2017, the UK notified the European Council accordingly. The EU treaties cease to apply to a withdrawing Member State from the date of entry into force of the agreement setting out the arrangements for the Member State’s withdrawal, or within two years of the notification of the withdrawal. On March 23, 2018, the European Council, meeting in an EU27 format, adopted the guidelines on the framework for a future relationship of the EU with the UK after the UK’s withdrawal from the EU. The EU intends to maintain the closest possible partnership with the UK, which would cover trade and economic cooperation, security and defense, among other areas. Previously, the negotiators from the EU and the UK had reached an agreement regarding parts of the legal text of the withdrawal agreement covering citizens’ rights, the financial settlement, a number of other withdrawal issues and the transition period. If the final withdrawal agreement is not completed by March 29, 2019, i.e.within two years after the UK’s notification of the withdrawal, the European Council may unanimously decide to extend the period for negotiations.
Sources: UK Government, Topic, EU referendum (https://www.gov.uk/government/topical-events/eu-referendum); Council of the EU, Consolidated versions of the Treaty on European Union and the Treaty on the Functioning of the European Union, Article 50, page 59-60 (http://data.consilium.europa.eu/doc/document/ST-6655-2008-REV-8/en/pdf); European Commission, Statement by the European Council (Art. 50) on the UK notification, press release, March 29, 2017 (http://www.consilium.europa.eu/en/press/press-releases/2017/03/29-euco-50-statement-uk-notification/); Council of the EU, Brexit, last reviewed on July 23, 2018 (http://www.consilium.europa.eu/en/policies/eu-uk-after-referendum/).
G-4
Economic Integration
From its inception, the EU has had the fundamental objective, in line with its predecessors, of economic integration of its Member States. Culminating a long process, a single market that provides for the free movement of goods and services, persons and capital among the Member States was established as of January 1, 1993. The integration of the Member States’ economies and the completion of a single market are also promoted by a European competition policy, which aims at creating a level playing field for Member States’ companies, thereby promoting economic efficiency, and by a European consumer policy. In addition, various liberalization and harmonization measures are being implemented, for example in the telecommunication and energy sectors. In the financial sector, the single market has been fostered by providing for the free movement of capital and the freedom to perform banking services throughout the EU under the “single passport,” which enables financial institutions to provide financial services throughout the EU based on a single license obtained in one Member State. The EU promotes economic integration with regional aid, which is designed to focus development efforts on certain disadvantaged regions and sections of population of the EU. Another important policy area for the EU has been agriculture and fisheries.
The regulation laying down the multiannual financial framework (“MFF”) of the EU was formally adopted in December 2013. The MFF determines maximum amounts for commitment appropriations for the period from 2014 until 2020, which cover commitments made to spend funds over one or more years in certain expenditure categories. Additionally, the MFF defines annual maximum amounts for payment appropriations, which cover payments made to honor the legal commitments entered into during the current financial year and/or earlier financial years. The 2018 EU budget, which was adopted by the European Parliament in November 2017 and published in February 2018, amounts to EUR 160.1 billion in commitment appropriations and EUR 144.7 billion in payment appropriations. The entire EU budget represents approximately 1% of the EU gross national income.
The EU is responsible for trade matters with non-EU Member States. In the area of trade in goods, the EU even has exclusive power. Furthermore, the EU’s responsibilities also cover trade in services, the commercial aspects of intellectual property (such as patents), public procurement and foreign direct investment. In particular, the EU is responsible for negotiating and concluding international trade agreements as well as identifying trade barriers and unfair trade practices by trading partners and adopting appropriate countermeasures. Trade agreements are negotiated by the European Commission upon authorization of the Council. Once the European Commission completes negotiations, the Council and the European Parliament examine the final negotiated agreement and decide upon its approval. Trade agreements regulating areas of mixed responsibility between the EU and its Member States can only be fully concluded after ratification by all EU Member States.
Sources: European Commission, Europe in 12 lessons by Pascal Fontaine (http://bookshop.europa.eu/en/europe-in-12-lessons-pbNA3110652/downloads/NA-31-10-652-EN-C/NA3110652ENC_002.pdf?FileName=NA3110652ENC_002.pdf&SKU=NA3110652ENC_PDF&CatalogueNumber=NA-31-10-652-EN-C); European Banking Authority, Topics, Passporting and supervision of branches (http://www.eba.europa.eu/regulation-and-policy/passporting-and-supervision-of-branches); European Council, Council adopts the multiannual financial framework 2014-2020, Press Release, December 2, 2013 (http://www.consilium.europa.eu/uedocs/cms_Data/docs/pressdata/en/ecofin/139831.pdf); European Commission, Budget, Library, Documents: Annual Budget, 2018 (http://ec.europa.eu/budget/biblio/documents/2018/2018_en.cfm); EUR-Lex, Budget 2018, General budget, Total revenue (http://eur-lex.europa.eu/legal-content/EN/TXT/PDF/?uri=OJ:L:2018:057:FULL&from=EN); European Commission, Business, Economy, Euro, Trade with non-EU countries, EU trade policy-making (http://ec.europa.eu/trade/policy/policy-making); Federal Ministry for Economic Affairs and Energy, Topics, Trade Policy, European Trade Policy (http://www.bmwi.de/Redaktion/EN/Dossier/trade-policy.html).
Monetary Integration
The Federal Republic is a signatory to and has ratified the Treaty on European Union of February 1992 (also known as the “Maastricht Treaty”). The Maastricht Treaty was the basis for the establishment of the European Economic and Monetary Union (“EMU”). The EMU led, in turn, to the adoption of irrevocable conversion rates between the euro and the national currencies of the initial participating Member States on December 31, 1998 and the introduction of the euro as the single European currency in the “euro area” on January 1, 1999. On January 1, 2002, banknotes and coins denominated in euro were introduced as legal tender to replace the national currencies in the twelve Member States forming the euro area at that time (Austria, Belgium, Finland, France, Germany, Greece, Ireland, Italy, Luxembourg, the Netherlands, Portugal and Spain). Slovenia, Malta, Cyprus, Slovakia, Estonia and Latvia subsequently joined the euro area. The most recent addition was Lithuania, which joined the euro area on January 1, 2015.
The European Central Bank (“ECB”) was established on June 1, 1998, as part of the European System of Central Banks (“ESCB”). According to the Maastricht Treaty, the primary objective of the ESCB is to maintain price stability. Without prejudice to the objective of price stability, the ESCB supports the general economic policies of the EU. See “Monetary and Financial System” for more information on the ECB and ESCB as well as on the European financial system. The Eurosystem, consisting of the ECB and the national central banks of those Member States whose currency is the euro (“Euro Area Member States”), assumed sole responsibility for the monetary policy in the euro area on January 1, 1999.
Sources: Council of the EU, Consolidated versions of the Treaty on European Union and the Treaty on the Functioning of the European Union (http://data.consilium.europa.eu/doc/document/ST-6655-2008-REV-8/en/pdf); European Central Bank, Economic and Monetary Union (EMU) (http://www.ecb.int/ecb/history/emu/html/index.en.html); European Central Bank, Lithuania joins the euro area, press release of January 1, 2015 (http://www.ecb.europa.eu/press/pr/date/2015/html/pr150101.en.html); European Central Bank, Monthly Bulletin, 10th Anniversary of the ECB (https://www.ecb.europa.eu/pub/pdf/other/10thanniversaryoftheecbmb200806en.pdf).
G-5
EU Economic Governance
The EU economic governance framework aims to detect, prevent and correct problematic economic trends such as excessive government deficits or public debt levels, which can stunt growth and put economies at risk. The framework consists of the following main components.
Stability and Growth Pact. To strengthen the monitoring and coordination of national fiscal and economic policies, the Member States established the Stability and Growth Pact (“SGP”) in 1997. The preventive arm of the SGP binds Member States to their commitments towards sound fiscal policies and coordination by setting country-specific, medium-term budgetary targets. These budget deficit (or surplus) targets are defined in structural terms by taking into consideration business cycle swings and filtering out the effect of one-off and temporary measures. The corrective arm of the SGP consists of the excessive deficit procedure (“EDP”). The EDP ensures the correction of excessive budget deficits (defined as a deficit in excess of 3% of gross domestic product (“GDP”)) or excessive public debt levels (defined as a debt ratio greater than 60% of GDP without an adequate diminishing trend). Countries that fail to respect the SGP’s preventive or corrective rules may ultimately face sanctions. For Euro Area Member States, these could take the form of warnings and financial sanctions including fines of up to 0.2% of GDP (if they fail to abide by either the preventive or the corrective rules). In addition, all Member States (except the United Kingdom) could face a suspension of commitments or payments from the EU’s structural and investment funds if they fail to abide by the corrective rules. Every April, Member States are required to lay out their fiscal plans for the next three years based on economic governance rules set forth in the SGP. In addition, to ensure the coordination of fiscal policies among Euro Area Member States, governments are required by European economic governance rules to submit their draft budgetary plans for the following year to the European Commission by October 15 of each year.
Sources: European Commission, Business, Economy, Euro, Economic and fiscal policy coordination, EU economic governance (http://ec.europa.eu/economy_finance /economic_governance/index_en.htm); European Commission, Business, Economy, Euro, Economic and fiscal policy coordination, EU economic governance, Stability and Growth Pact (http://ec.europa.eu/economy_finance/economic_governance/sgp/index_en.htm); European Commission, Business, Economy, Euro, Economic and fiscal policy coordination, EU economic governance, Stability and Growth Pact, Stability and convergence programmes (https://ec.europa. eu/ info/business-economy-euro/economic-and-fiscal-policy-coordination/eu-economic-governance-monitoring-prevention-correction/stability-and-growth-pact/stability-and-convergence- programmes_en); European Commission, Business, Economy, Euro, Economic and fiscal policy coordination, EU economic governance, Stability and Growth Pact, Annual draft budgetary plans (DBPs) of euro area countries (https://ec.europa.eu/info/ business-economy-euro/economic-and-fiscal-policy-coordination/eu-economic-governance-monitoring-prevention-correction/stability-and-growth-pact/annual-draft-budgetary-plans-dbps-euro-area-countries_en).
Macroeconomic Imbalance Procedure. Established in 2011, the macroeconomic imbalance procedure (“MIP”) is a surveillance mechanism that aims to identify potential economic risks early on, prevent the emergence of harmful macroeconomic imbalances and correct any existing excessive imbalances. The preventive arm of the procedure relies on an early warning system that uses a scoreboard of indicators and in-depth country reviews. This preventive arm allows the European Commission and the Council to make preventive recommendations to the affected Member State at an early stage. In cases of a Member State with excessive macroeconomic imbalances, the corrective arm may open an excessive imbalance procedure, under which the Member State concerned will have to submit a corrective action plan and regular progress reports. The enforcement regime of the MIP consists of financial sanctions against Euro Area Member States, including fines of up to 0.1% of GDP if a Euro Area Member State repeatedly does not comply with its obligations. In the most recent surveillance cycle, twelve Member States, including Germany, were subject to an in-depth review in the context of the MIP. Of these, eleven were found to be experiencing macroeconomic imbalances of various natures and magnitudes. According to the Commission’s assessment, Germany is experiencing macroeconomic imbalances, but these are not excessive. See “The Economy—International Economic Relations—Germany’s Current Account Surplus and the Macroeconomic Imbalance Procedure.”
Sources: European Commission, Business, Economy, Euro, Economic and fiscal policy coordination, EU economic governance, Macroeconomic imbalance procedure (http://ec.europa.eu/economy_finance/economic_governance/macroeconomic_imbalance_procedure/index_en.htm); European Commission, Business, Economy, Euro, Economic and fiscal policy coordination, EU economic governance, Macroeconomic imbalance procedure, MIP surveillance in 2018 (https://ec.europa.eu/info/business-economy-euro/economic-and-fiscal-policy-coordination/eu-economic-governance-monitoring-prevention-correction/stability-and-growth-pact/stability-and-convergence-programmes_en); European Commission, European Semester, Country Report Communication (https://ec.europa.eu/info/sites/info/files/2018-european-semester-country-report-communication_en.pdf).
Treaty on Stability, Coordination and Governance in the EMU. The Treaty on Stability, Coordination and Governance in the EMU (“TSCG”), which was signed in March 2012 and entered into force on January 1, 2013, is intended to promote budgetary discipline in the participating Member States through a fiscal pact. The fiscal pact’s provisions are binding for Euro Area Member States, while the other participating Member States will only be bound if they adopt the euro, unless they declare their intention to be bound by certain provisions of the treaty at an earlier date. The TSCG was signed by all Member States, except the UK, the Czech Republic and Croatia. The TSCG requires the participating parties to ensure convergence towards the country-specific, medium-term budgetary objectives as defined in the SGP, with a lower limit of a structural deficit of 0.5% of GDP (or of 1% of GDP, if their debt-to-GDP ratio is well below 60%). In the event of a deviation from this requirement, an automatic correction mechanism will be triggered with escape clauses for exceptional circumstances. These budget rules were to be transposed into national law through provisions of “binding force and permanent character, preferably constitutional” one year after the entry into force of the treaty, i.e., by January 1, 2014 at the latest.
G-6
Sources: European Council, Fiscal compact signed: Strengthened fiscal discipline and convergence in the euro area, press release of March 2, 2012 (http://www.consilium.europa.eu/uedocs/cms_Data/docs/pressdata/en/ec/128454.pdf); Deutsche Bundesbank, Glossary: Treaty on Stability, Coordination and Governance in the EMU (TSCG) (https://www.bundesbank.de/Redaktion/EN/Glossareintraege/T/treaty_on_stability_coordination_and_governance_in_the_emu.html); European Commission, The EU’s economic governance explained, press release of November 26, 2015 (http://europa.eu/rapid/press-release_MEMO-15-6071_en.htm).
Response to the European Sovereign Debt Crisis
Temporary Financial Stability Mechanism. In May 2010, the European Union and Euro Area Member States established a temporary stability mechanism to safeguard the financial stability amid severe tensions in euro area sovereign debt markets, consisting of the European Financial Stabilisation Mechanism (“EFSM”) and the European Financial Stability Facility (“EFSF”). Through the EFSM, which was replaced by the European Stability Mechanism (“ESM”) in 2013, the European Commission was allowed to borrow up to a total of EUR 60 billion on behalf of the EU under an implicit EU budget guarantee. For more information on the ESM, see “—European Stability Mechanism” below. The EFSF, which was created as a temporary institution and since July 1, 2013 no longer engages in new financing programs, had a lending capacity of EUR 440 billion backed by effective guarantees extended by the Euro Area Member States totaling EUR 724 billion. The Federal Republic has committed guarantees of approximately EUR 211 billion to the EFSF in accordance with its share in the paid-up capital of the ECB, which amounts to approximately 29% of the total effective guarantees. The EFSF will be dissolved and liquidated when all financial assistance provided to Euro Area Member States and all funding instruments issued by the EFSF have been repaid in full. As of March 2018, the EFSF had outstanding loans to Ireland, Portugal and Greece of approximately EUR 175 billion.
Sources: European Commission, Business, Economy, Euro, Economic and fiscal policy coordination, EU financial assistance, Loan programmes (https://ec.europa.eu/info/business-economy-euro/economic-and-fiscal-policy-coordination/eu-financial-assistance/loan-programmes_en); European Commission, Business, Economy, Euro, Economic and fiscal policy coordination, EU financial assistance, How is financial assistance given to EU countries? (http://ec.europa.eu/info/business-economy-euro/economic-and-fiscal-policy-coordination/eu-financial-assistance/how-financial-assistance-given-eu-countries_en); European Stability Mechanism, Frequently Asked Questions on the ESM (https://www.esm.europa.eu/sites/default/files/faqontheesm.pdf); European Financial Stability Facility, Publications, Investor Presentation (https://www.esm.europa.eu/sites/default/files/efsfesmnewinvestorpresentationmarch2018.pdf).
European Stability Mechanism. Since October 2012, the ESM, which was established as an intergovernmental organization under public international law by the Euro Area Member States, has been assisting in preserving the financial stability of the EMU. As of July 1, 2013, it assumed the tasks fulfilled by the EFSF and the EFSM and is currently the primary support mechanism for Euro Area Member States experiencing or threatened by severe financing problems, if such assistance is deemed essential to safeguard financial stability in the euro area as a whole. The ESM issues bonds or other debt instruments on the financial markets to raise capital to provide assistance to Euro Area Member States. Unlike the EFSF, which is based upon guarantees by Euro Area Member States, the ESM has total subscribed capital of EUR 705 billion provided by Euro Area Member States, which provides it with a lending capacity of EUR 500 billion. EUR 81 billion of the ESM’s subscribed capital is in the form of paid-in capital with the balance of EUR 624 billion being callable capital. The contribution of each Euro Area Member State is based on the paid-in capital for the ECB. On this basis, the Federal Republic’s contribution amounts to approximately 27% of the aggregate contributions to the ESM. The Federal Republic contributed approximately EUR 22 billion of paid-in capital to the ESM.
Financial assistance from the ESM is activated upon a request from a Member State to the chairperson of the ESM’s board of governors and is provided subject to conditions appropriate to the instrument chosen. The initial instruments available to the ESM have been modeled upon those available to the EFSF and include the extension of loans to a Euro Area Member State in financial difficulties, interventions in the primary and secondary debt markets, action based on a precautionary program, and the extension of loans to governments, or since December 2014 directly to affected financial institutions, for the purposes of recapitalizing financial institutions. Each instrument is to be linked to a memorandum of understanding which sets forth the conditions for financial support that the Member State has negotiated with the European Commission in liaison with the ECB, as well as the monitoring and surveillance procedures established to ensure the Member State is progressing towards financial stability. In principle, decisions under the ESM are taken by mutual agreement. However, in the event that the European Commission and the ECB conclude that an urgent decision related to financial assistance is needed because the financial and economic sustainability of the euro area is threatened, the mutual agreement rule is replaced by a qualified majority of 85%. Given its voting rights of approximately 27%, the Federal Republic may veto any decision even under the emergency voting rule. As of April 2018, the ESM had loans outstanding to Spain, Cyprus and Greece of approximately EUR 80 billion.
Sources: European Stability Mechanism, History (https://www.esm.europa.eu/about-us/history); European Commission, Business, Economy, Euro, Economic and fiscal policy coordination, EU financial assistance, How is financial assistance given to EU countries? (http://ec.europa.eu/info/business-economy-euro/economic-and-fiscal-policy-coordination/eu-financial-assistance/how-financial-assistance-given-eu-countries_en); European Commission, Business, Economy, Euro, Economic and fiscal policy coordination, EU financial assistance, Loan programmes, ESM (http://ec.europa.eu/info/business-economy-euro/economic-and-fiscal-policy-coordination/eu-financial-assistance/loan-programmes/european-stability-mechanism-esm_en); European Stability Mechanism, Financial Assistance, Lending toolkit (https://www.esm.europa.eu/assistance/lending-toolkit); European Stability Mechanism, Frequently Asked Questions on the ESM (https://www.esm.europa.eu/sites/default/files/faqontheesm.pdf); European Stability Mechanism, Publications, Investor Presentation April 2018 (https://www.esm.europa.eu/sites/default/files/efsfesmnewinvestorpresentationapril2018.pdf).
G-7
Financial Assistance to Euro Area Member States
Greece. Since May 2010, Greece has been receiving financial support from Euro Area Member States and the IMF to cope with its financial difficulties and economic challenges. This support comes in the form of economic adjustment programs, which include measures to support the Greek government’s efforts to address economic imbalances, tackle social challenges, and pave the way for sustainable economic growth and job creation. Under the first economic adjustment program, the Euro Area Member States agreed in May 2010 to provide Greece with stability support in the form of pooled bilateral loans of up to EUR 80 billion to be disbursed over the period May 2010 through June 2013, parallel to a loan facility provided by the IMF of up to EUR 30 billion. The Federal Republic committed to contribute up to approximately EUR 22.3 billion, which was to be extended by KfW on behalf of the Federal Republic. As of December 2011, a total amount of EUR 73 billion had been disbursed under the Greek Loan Facility, of which approximately EUR 53 billion were provided by Euro Area Member States and EUR 20 billion by the IMF.
Under the second economic adjustment program, which was approved by the Euro Area Member States in March 2012, the EFSF and the IMF committed the undisbursed amounts of the first program plus an additional EUR 130 billion in financial assistance for the years 2012 to 2014. Disbursements of financial assistance under the program were conditioned upon the observance of certain quantitative performance criteria and a positive evaluation of progress made on policy criteria. Following an extension by four months, the second program expired at the end of June 2015. The outstanding EFSF loan to Greece under the second program amounts to approximately EUR 130.9 billion.
In July 2015, the Greek government submitted a request to the ESM’s board of governors for further stability support. Following approval by the ESM’s board of governors, the European Commission signed a memorandum of understanding with Greece for a third economic adjustment program. Under this program, the ESM is able to disburse up to EUR 86 billion in financial assistance to Greece over a three-year period ending in August 2018. Disbursements are contingent upon the Greek government’s progress in delivering on certain policy conditions set forth in the memorandum of understanding which aim to enable the Greek economy to return to a sustainable growth path based on sound public finances, enhanced competitiveness, high employment and financial stability. As of the end of March 2018, the total disbursements of ESM financial assistance to Greece amounted to approximately EUR 45.9 billion. The outstanding ESM loan as of the end of March 2018 amounted to EUR 43.9 billion following a repayment in February 2017. After the end of the program in August 2018, the Greek government is not expected to request a precautionary credit line from the ESM. Greece will then become subject to post-program surveillance by the EU.
Sources: European Commission, Policies, Information and Services, Financial assistance to Greece (https://ec.europa.eu/info/business-economy-euro/economic-and-fiscal-policy-coordination/eu-financial-assistance/which-eu-countries-have-received-assistance/financial-assistance-greece_en); European Stability Mechanism, Financial Assistance, Greece (ongoing) (https://www.esm.europa.eu/assistance/greece); European Stability Mechanism, Greece: after the third programme, speech by Klaus Regling of March 4, 2018 (https://www.esm.europa.eu/speeches-and-presentations/%E2%80%9Cgreece-after-third-programme%E2%80%9D-speech-klaus-regling).
Ireland. The first Euro Area Member State to receive support by the EFSM and EFSF was Ireland. The financial assistance, agreed upon in December 2010 and provided subject to compliance with an economic adjustment program, consisted of financial support in a total amount of EUR 85 billion, including EUR 22.5 billion financed through the EFSM, EUR 17.7 billion through the EFSF and EUR 22.5 billion through the IMF. The financial assistance program for Ireland expired as planned in December 2013. Ireland remains subject to post-program surveillance until at least 75% of EU’s financial assistance received has been repaid; this is not expected to occur until 2031. Ireland has already repaid the loans financed through the IMF in full.
Sources: European Commission, Policies, Information and Services, Financial Assistance in EU Member States, Ireland (http://ec.europa.eu/info/business-economy-euro/economic-and-fiscal-policy-coordination/eu-financial-assistance/which-eu-countries-have-received-assistance/financial-assistance-ireland_en); European Financial Stability Facility, EFSF financial assistance for Ireland ends with successful Irish exit, press release of December 8, 2013 (https://www.esm.europa.eu/press-releases/efsf-financial-assistance-ireland-ends-successful-irish-exit); International Monetary Fund, Ireland: Transactions with the Fund from May 01, 1984 to March 31, 2018 (http://www.imf.org/external/np/fin/tad/extrans1.aspx?memberKey1=470&endDate=2099%2D12%2D31&finposition_flag=YES).
Portugal. Following the Portuguese Republic’s application for support in early April 2011, euro area, EU and IMF financial assistance was provided for the 2011 to mid-2014 period on the basis of an economic adjustment program agreed between the Portuguese authorities and officials from the European Commission, the IMF and the ECB in May 2011. The total financial package amounted to EUR 78 billion, with EFSM, EFSF and IMF each contributing EUR 26 billion. The Portuguese government decided to exit its macroeconomic adjustment program without successor arrangement in June 2014. Portugal remains subject to post-program surveillance until at least 75% of the financial assistance received has been repaid; this is not expected to occur until 2026. As of the end of March 2018, Portugal had already repaid SDR 19.1 billion of loans to the IMF.
Sources: European Commission, Policies, Information and Services, Financial Assistance in EU Member States, Portugal (https://ec.europa.eu/info/business-economy-euro/economic-and-fiscal-policy-coordination/eu-financial-assistance/which-eu-countries-have-received-assistance/financial-assistance-portugal_en); International Monetary Fund, Portugal: Transactions with the Fund from May 01, 1984 to July 31, 2018 (http://www.imf.org/external/np/fin/tad/extrans1.aspx?memberKey1=810&endDate=2099%2D12%2D31&finposition_flag=YES).
G-8
Spain. In June 2012, the Spanish government requested financial assistance from the Euro Area Member States for the recapitalization of certain of its financial institutions. In July 2012, the finance ministers of the Euro Area Member States agreed to grant such financial assistance of up to EUR 100 billion, designed to cover the estimated shortfall in capital requirements along with an additional safety margin. The financial assistance was accompanied by policy conditionality focused on the banking sector. The assistance was initially financed by the EFSF and then transferred to the ESM (without applying seniority status). On December 31, 2013, the financial assistance program expired. The ESM disbursed a total of EUR 41.3 billion to the Spanish government for the recapitalization of the country’s banking sector. Spain remains subject to post-program surveillance until at least 75% of the financial assistance received has been repaid. As of the end of March 2018, Spain has already repaid EUR 11.6 billion, in part voluntarily. Barring further early repayments, Spain is expected to be able to exit post-program surveillance in 2025.
Sources: European Commission, Policies, Information and Services, Financial Assistance in EU Member States, Spain (https://ec.europa.eu/info/business-economy-euro/economic-and-fiscal-policy-coordination/eu-financial-assistance/which-eu-countries-have-received-assistance/financial-assistance-spain_en); ESM, Financial Assistance, Spain (https://www.esm.europa.eu/assistance/spain); European Stability Mechanism, Spain successfully exits ESM financial assistance programme, press release of December 31, 2013 (https://www.esm.europa.eu/press-releases/spain-successfully-exits-esm-financial-assistance-programme).
Cyprus. The economic adjustment program for Cyprus was formally agreed in May 2013. The financial package was designed to cover financing needs of up to EUR 10 billion, with the ESM providing up to EUR 9 billion and the IMF contributing around EUR 1 billion. The program addressed Cyprus’s financial sector imbalances including an appropriate downsizing of the country’s financial sector, fiscal consolidation, structural reforms and privatization. The financial assistance program expired in March 2016 as planned. Approximately EUR 2.7 billion of the ESM financing package remained unutilized. Cyprus remains subject to post-program surveillance until at least 75% of the financial assistance received has been repaid, which is not expected before 2029.
Sources: European Commission, Policies, Information and Services, Financial Assistance in EU Member States, Cyprus (https://ec.europa.eu/info/business-economy-euro/economic-and-fiscal-policy-coordination/eu-financial-assistance/which-eu-countries-have-received-assistance/financial-assistance-cyprus_en); ESM, Financial Assistance, Cyprus (https://www.esm.europa.eu/assistance/cyprus); Eurogroup, Eurogroup Statement on Cyprus, press release of March 7, 2016 (http://www.consilium.europa.eu/de/press/press-releases/2016/03/07-eurogroup-statement-cyprus/).
Response to Migratory Pressure
EU Migration Policy. The growing instability in the EU’s southern neighboring countries has increased the number of people trying to reach the EU. The EU and the Member States have been intensifying efforts to establish an effective, humanitarian and safe European migration policy. In the Federal Government’s opinion, because a solution cannot be found by individual Member States alone but only by all Member States together, solving the problem requires a comprehensive approach covering all relevant areas. The EU policy response comprises the following activities: working with countries of origin and transit, strengthening the EU’s external borders, managing migration flows and curbing migrant smuggling activities, reforming the common European asylum system and providing legal migration pathways, as well as fostering the integration of third-country nationals. According to Frontex, the European Border and Coast Guard Agency, the total number of detected illegal border crossings in 2017 decreased for the second year in a row. The detections fell to 205,000, representing a decline by 60% compared to 2016 and by 89% compared to 2015, when the migratory crisis culminated.
Sources: European Council, Finding solutions to migratory pressures (http://www.consilium.europa.eu/en/policies/migratory-pressures/); Frontex, Publication, Risk Analysis for 2018 (https://frontex.europa.eu/publications/risk-analysis-for-2018-aJ5nJu).
Reintroduction of Internal Border Controls. Effective management of the EU’s external borders is fundamental for the well-functioning of free movement within the EU. Within the Schengen area, which encompasses most Member States, except Bulgaria, Croatia, Cyprus, Ireland, Romania and the UK, any person, irrespective of nationality, may cross internal borders without being subjected to border checks. In case of a serious threat to public policy or internal security, a Schengen country may exceptionally temporarily reintroduce border controls at its internal borders. In the context of the migrant crisis and terrorist threats, several Schengen countries, including Germany, have temporarily reintroduced internal border controls. In September 2017 the European Commission introduced a proposal to update the Schengen Borders Code to adapt the rules for the reintroduction of temporary internal border controls to the current needs. The Schengen Borders Code governs the crossing of the external borders of the Schengen Area.
Sources: European Commission, Migration and Home Affairs, Schengen Area (https://ec.europa.eu/home-affairs/what-we-do/policies/borders-and-visas/schengen_en); European Commission, Migration and Home Affairs, Temporary Reintroduction of Border Control (https://ec.europa.eu/home-affairs/what-we-do/policies/borders-and-visas/schengen/reintroduction-border-control_en); European Commission, State of the Union 2017 – Preserving and strengthening Schengen to improve security and safeguard Europe’s freedoms, press release of September 27, 2017 (http://europa.eu/rapid/press-release_IP-17-3407_en.htm).
G-9
Legal Framework. Since 1999, the EU has been working to create a Common European Asylum System (“CEAS”), which is based on a number of EU directives and regulations, to guarantee high standards of protection for refugees as well as fair and effective procedures throughout the EU. The Dublin Regulation establishes which Member State is responsible for the examination of an asylum application based on a number of criteria, including, in order of importance, family considerations, recent possession of visa or residence permit in a Member State and through which Member State the applicant has entered the EU. Migratory pressure has exposed weaknesses of the current CEAS rules. Despite the efforts to harmonize standards, asylum seekers are not treated uniformly and recognition rates among the EU Member States vary. In May and June 2016, the European Commission presented two packages of proposals to reform the CEAS. The legislative proposals are being discussed by the Council and Parliament.
Sources: European Commission, Migration and Home Affairs, Common European Asylum System (https://ec.europa.eu/home-affairs/what-we-do/policies/asylum_en); European Commission, Migration and Home Affairs, Common European Asylum System, Country responsible for asylum application (Dublin) (https://ec.europa.eu/home-affairs/what-we-do/policies/asylum/examination-of-applicants_en); Regulation (EU) No 604/2013 of the European Parliament and of the Council of June 26, 2013 (http://eur-lex.europa.eu/legal-content/EN/TXT/PDF/?uri=CELEX:32013R0604&from=EN); European Council, Reforming the common European asylum system (http://www.consilium.europa.eu/en/policies/ceas-reform/).
Statistical Standards
Statistical Standard for the National Accounts
Since August 2014, the Federal Statistical Office calculates the German national accounts in accordance with the European System of National and Regional Accounts 2010 (“ESA 2010”) which, in turn, is based on the System of National Accounts (SNA 2008) of the United Nations. Recalculations have been conducted for all time series since 1991.
Source: Federal Statistical Office, Major revision of national accounts 2014: results and background (https://www.destatis.de/EN/Methods/NationalAccountRevision/Revision2014_BackgroundPaper.pdf?__blob=publicationFile).
Statistical Standard for the Balance of Payments
Since July 2014, the methodological concept of the German balance of payments statistics follows the sixth edition of the Balance of Payments and International Investment Position Manual (“BPM6”), the revised standard of the IMF. The application of BPM6 is binding for Member States by virtue of a regulation adopted by the European Commission. Balance of payments data since 1991 have been recalculated in accordance with BPM6.
Source: Bundesbank, Changes in the methodology and classifications of the balance of payments and the international investment position, Monthly Report, June 2014 (https://www.bundesbank.de/Redaktion/EN/Downloads/Publications/Monthly_Report_Articles/2014/2014_06_methodology_balance_of_payments.pdf?__blob=publicationFile).
Statistical Disclosure Standards of the International Monetary Fund
Since February 2015, the Federal Republic meets the Special Data Dissemination Standard Plus (“SDDS Plus”) of the IMF relating to coverage, periodicity and timeliness of economic data. The SDDS Plus was created in 2012 as an extension of the existing Special Data Dissemination Standard (“SDDS”). By providing comparable economic and financial data, it is designed to improve the transparency of the financial sector and its international interdependencies, and thus contributes to the identification of risks at an early stage. Although adherence by member countries to the SDDS Plus is voluntary, it carries a commitment requiring members to observe the standard and to provide certain information to the IMF about their practices in disseminating economic and financial data.
Source: Bundesministerium der Finanzen, Deutschland stellt ab heute Indikatoren nach dem „speziellen Datenverbreitungsstandard Plus“ (SDDS Plus) des IWF bereit, press release of February 18, 2015 (http://www.bundesfinanzministerium.de/Content/DE/Pressemitteilungen/Finanzpolitik/2015/02/2015-02-18-PM07.html?source=stdNewsletter).
G-10
THE ECONOMY
Overview
Since 1945, the Federal Republic’s economic system has developed into a social market economy, combining the free initiative of the individual with progressive social principles. The Grundgesetz guarantees freedom of private enterprise and private property, provided that these basic rights are not exercised against the public good. The state mainly has a regulatory function in the market economy, setting the general framework of conditions within which market processes take place. State intervention in price setting is limited to a very small number of industries.
Key Economic Figures
The German economy is one of the world’s largest economies. In 2017, the GDP of Germany expressed at current prices was EUR 3,263.4 billion, compared to EUR 3,144.1 billion in 2016, which represents an increase of 3.8%. GDP adjusted for price effects rose by 2.2% compared to 2016, and exceeded the 1991 level by 43.2%. 1991 represents the first full year after German reunification on October 3, 1990. The growth in GDP since 1991 has been largely driven by productivity gains, as price-adjusted GDP per employee has risen by 25.4% since 1991. In calculating price-adjusted GDP, the Federal Statistical Office (Statistisches Bundesamt) uses a chain index based on the previous year’s prices. In 2017, GDP per capita at current prices was EUR 39,454, while GDP per employee at current prices was EUR 73,680.
Source: Statistisches Bundesamt, Fachserie 18, Reihe 1.4 – 2017 (March 2018), Tables 2.1.1 and 2.1.4.
As in many advanced economies, the services sector of the Federal Republic has become the largest contributor to GDP (in terms of gross value added). In 2017, services accounted for 68.7% of gross value added, measured at current prices, compared to 61.9% in 1991. The two most important subsectors were “trade, transport, accommodation and food services,” accounting for 16.1% in 2017, compared to 16.2% in 1991, and “public services, education, health,” accounting for 18.2% of gross value added in 2017, compared to 15.9% in 1991. The production sector (excluding construction) generated 25.7% of gross value added compared to 30.9% in 1991. Construction contributed 4.9% to gross value added in 2017, compared to 6.0% in 1991, and agriculture, forestry and fishing accounted for 0.7% of gross value added in 2017, compared to 1.2% in 1991.
Source: Statistisches Bundesamt, Fachserie 18, Reihe 1.4 – 2017 (March 2018), Table 2.2.1.
In 2017, private final consumption expenditure totaled 53.2% of GDP in current prices, gross capital formation amounted to 19.7% and government final consumption expenditure equaled 19.6%. Exports and imports of goods and services accounted for 47.3% and 39.6% of GDP at current prices, respectively. The trade balance (according to national accounts) thus showed a surplus equal to 7.6% of GDP in 2017, which is slightly lower than in the previous year (2016: 8.0% of GDP).
Source: Statistisches Bundesamt, Fachserie 18, Reihe 1.4 – 2017 (March 2018), Table 2.3.1.
In 2017, price-adjusted GDP rose by 2.2% compared to 2016. The GDP adjusted for both price and calendar effects, increased by 2.5% compared to 2016. Net exports had a slightly positive effect on economic growth in 2017 on a price-adjusted basis (growth contribution: 0.2 percentage points). Exports increased by 4.7% (2016: 2.6%), while imports rose by 5.1% (2016: 3.9%), all on a price-adjusted basis. Gross fixed capital formation in machinery and equipment increased in 2017 by 4.0%, compared to a 2.2% increase in 2016, in price-adjusted terms, while gross fixed capital formation in construction increased by 2.7% in price-adjusted terms. Final consumption expenditure of general government rose by 1.6% in 2017 on a price-adjusted basis, and final consumption expenditure of households rose by 1.9% on a price-adjusted basis compared to 2016.
Source: Statistisches Bundesamt, Fachserie 18, Reihe 1.4 – 2017 (March 2018), Tables 2.1.1, 2.3.2, 2.3.5 and 2.3.10.
The annual average rate of registered unemployment (as computed under the “national definition” of the Federal Employment Agency (Bundesagentur für Arbeit)) declined from 6.1% in 2016 to 5.7% in 2017. However, based on the internationally comparable method of calculation promulgated by the International Labour Organization (“ILO”), which is referred to as the “ILO definition,” the annual average unemployment rate decreased from 3.9% in 2016 to 3.6% in 2017. For an explanation of the differences between the national definition and the ILO definition, see “—Employment and Labor.” Inflation as measured by the percentage increase in the national consumer price index (“CPI”) increased to 1.8% in 2017, compared to 0.5% in 2016. Excluding energy prices, the index rose by 1.6%. General government gross debt stood at EUR 2,092.6 billion at year-end 2017, compared to EUR 2,145.5 billion at year-end 2016.
Sources: Bundesagentur für Arbeit, Monatsbericht Februar 2018, Table 6.1 (https://statistik.arbeitsagentur.de/Statistikdaten/Detail/201802/arbeitsmarktberichte/monatsbericht-monatsbericht/monatsbericht-d-0-201802-pdf.pdf); Statistisches Bundesamt, Statistisches Bundesamt, Fachserie 18, Reihe 1.4 – 2017 (March 2018), Table 2.1.13; Statistisches Bundesamt, Fachserie 17, Reihe 7 (February 2018), Table 1.1 and 1.2; Deutsche Bundesbank, Time series BBK01.BJ9059: General government debt as defined in the Maastricht Treaty—Germany—overall (http://www.bundesbank.de/Navigation/EN/Statistics/Time_series_databases/Macro_economic_time_series/its_details_value_node.html?tsId=BBK01.BJ9059&listId=www_v27_web001_02a).
G-11
The following table shows selected key economic figures for the Federal Republic for each of the years indicated.
KEY ECONOMIC FIGURES
| | | | | | | | | | | | | | | | | | | | |
| | | 2017 | | | 2016 | | | 2015 | | | 2014 | | | 2013 | |
| | | (EUR in billions, unless otherwise indicated) | |
GDP - at current prices | | | 3,263.4 | | | | 3,144.1 | | | | 3,043.7 | | | | 2,932.5 | | | | 2,826.2 | |
(change from previous year in %) | | | 3.8 | | | | 3.3 | | | | 3.8 | | | | 3.8 | | | | 2.5 | |
GDP - price-adjusted, chain-linked index (2010=100), not adjusted for calendar effects | | | 113.1 | | | | 110.7 | | | | 108.6 | | | | 106.7 | | | | 104.7 | |
(change from previous year in %) | | | 2.2 | | | | 1.9 | | | | 1.7 | | | | 1.9 | | | | 0.5 | |
GDP - price-adjusted, chain-linked index (2010=100), adjusted for calendar effects | | | 113.3 | | | | 110.5 | | | | 108.5 | | | | 106.9 | | | | 104.8 | |
(change from previous year in %) | | | 2.5 | | | | 1.9 | | | | 1.5 | | | | 1.9 | | | | 0.6 | |
Unemployment rate (ILO definition) (in %) (1) | | | 3.6 | | | | 3.9 | | | | 4.3 | | | | 4.7 | | | | 4.9 | |
Rate of inflation (year-to-year change in consumer price index (CPI) in %) | | | 1.8 | | | | 0.5 | | | | 0.3 | | | | 0.9 | | | | 1.5 | |
Balance of payments - current account | | | 262.6 | | | | 268.8 | | | | 271.4 | | | | 219.0 | | | | 190.1 | |
General government gross debt (2) | | | 2,092.6 | | | | 2,145.5 | | | | 2,161.8 | | | | 2,192.0 | | | | 2,190.5 | |
| (1) | Unemployed persons, available and seeking work. |
| (2) | Definition according to Maastricht Treaty. |
Sources: Statistisches Bundesamt, Fachserie 18, Reihe 1.2 – 4. Vierteljahr 2017 (February 2018), Tables 1.1 and 1.11; Statistisches Bundesamt, Verbraucherpreise, Verbraucherpreisindex für Deutschland, Veränderungsraten zum Vorjahr in % (https://www.destatis.de/DE/ZahlenFakten/GesamtwirtschaftUmwelt/Preise/Verbraucherpreisindizes/Tabellen_/VerbraucherpreiseKategorien.html?cms_gtp=145114_list%253D2%2526145110_slot%253D2&https=1); Deutsche Bundesbank, Monatsbericht April 2018, Table XII.2; Deutsche Bundesbank, Time series BBK01.BJ9059: General government debt as defined in the Maastricht Treaty—Germany—overall (http://www.bundesbank.de/Navigation/EN/Statistics/Time_series_databases/Macro_economic_time_series/its_details_value_node.html?tsId=BBK01.BJ9059&listId=www_v27_web001_02a).
Economic Outlook
In its forecast published in April 2018, the Federal Government projected that GDP in Germany will grow by 2.3% in 2018, with private consumption growing by 1.7% (all growth rates are expressed in price-adjusted terms). Exports and imports are expected to increase by 5.0% and 5.8%, respectively, on a price-adjusted basis compared to 2017. In price-adjusted terms, gross fixed capital formation in machinery and equipment is projected to increase by 5.5% and gross fixed capital formation in construction is forecast to increase by 2.6%. Growth is expected to be steady and broad based. The Federal Government expects that domestic employment will increase by approximately 575,000 persons or 1.3% in 2018 compared to 2017, reaching a record level of 44.9 million persons in 2018. Registered unemployment (Arbeitslose) is expected to decrease by 200,000 persons compared to 2017 to 2.33 million persons in 2018 on average.
Source: Bundesministerium für Wirtschaft und Energie, Frühjahrsprojektion der Bundesregierung: Altmaier: Der Aufschwung geht weiter!, press release of April 25, 2018 (https://www.bmwi.de/Redaktion/DE/Pressemitteilungen/2018/20180425-fruehjahrsprojektion-der-bundesregierung-altmaier-der-aufschwung-geht-weiter.html).
Economic Policy
General
The Federal Government continues the strategy of enhancing economic growth, while maintaining fiscal discipline. At the same time the aim is for the German economy to remain competitive and to strengthen its growth potential by way of increasing public investment and improving conditions for private investment, thus broadening the scope for a sustained boost to the long-term performance of the German economy. Current policy initiatives are outlined below in more detail.
Current Policy Initiatives
The Federal Government has continued the consolidation of public finances, fully adhering both to the requirements stipulated by the constitutional balanced budget rule (known as the “debt brake” (Schuldenbremse)), as well as to the European frameworks such as the SGP and the fiscal compact. For further details on the budget surveillance procedures, see “General—The European Union and European Integration—EU Economic Governance.” In 2017, overall public sector finances were again positive, with net lending of general government at 1.1% of GDP. This means that the public sector achieved a surplus for the fourth year in succession. This trend is expected to continue in the years ahead. According to the
G-12
present federal budget planning, no new borrowing will be required in the period between 2018 and 2021. However, the effects of the coalition agreement have not yet been taken into account. The goal of cutting the debt-to-GDP ratio to less than 70% was attained by the end of 2016. The Federal Government’s projection assumes that the debt ratio will fall below the “Maastricht threshold” of 60% of GDP as early as 2019. For further information on the Federal Republic’s fiscal situation and prospects, see “Public Finance—Germany’s General Government Deficit/Surplus and General Government Gross Debt” and “Public Finance—Fiscal Outlook.”
In late 2016, the Federal Government and the Länder agreed on key points for reforming the financial relations between the Federation and the Länder. The reform is aimed at creating a sustainable and equitable system of revenue sharing, to enable all levels of government to comply with the requirements of the national “debt brake.” The Federation will provide additional funding to the Länder from 2020 onwards, starting at approximately EUR 9.7 billion. This is expected to help the Länder to comply with the national “debt brake” and create room for additional public investment on the Länder and municipal levels. The new rules for revenue sharing, taking effect in 2020, will combine the current horizontal distribution of value added tax (“VAT”) revenue (with supplementary shares for Länder with lower revenues) with the current fiscal equalisation between the Länder. From 2020 onwards, all fiscal equalisation will be achieved through deductions from and supplements to the VAT revenue shares of the Länder. In addition, the reform provides for:
| | • | | the creation of a federal infrastructure company for motorways and other federal highways, which will combine responsibilities of different levels of government. The aim is to reap the potential for efficiency gains in the planning, construction, maintenance, operation and financing of highways and thus to permit quicker and cheaper investment over the life cycle of highways; |
| | • | | the introduction of a single joint IT platform for administrative services of the Federation and the Länder; |
| | • | | the strengthening of the influence of the Federation on tax administration, in particular in the area of computer-based automation; |
| | • | | the strengthening of the Stability Council (Stabilitätsrat), a joint body of the Federation and the Länder; and |
| | • | | the introduction of inspection rights of the Federal Court of Auditors (Bundesrechnungshof) in the area of joint financing at the Länder level. |
The Federal Government is focusing particularly on enhancing public sector investment. In total, federal fixed capital expenditure at current prices has risen by approximately 37% over the past legislative term (2013-2017), to EUR 34 billion in the 2017 federal budget (contributions to ESM excluded). Public investment focuses on transport infrastructure, support for broadband expansion, microelectronics, development of electromobility, support for energy efficiency measures for buildings, and the promotion of social housing. The Federal Government is also assisting the Länder and the municipalities by providing fiscal support, thus boosting the scope for municipalities and Länder to invest. For example, financially weak municipalities are projected to benefit from an additional EUR 7 billion provided by the Federal Government through the Municipal Investment Promotion Fund (Kommunalinvestitionsförderungsfonds).
The Federal Government regards digital infrastructure as a key strategic factor for the economy and aims to roll out comprehensive gigabit networks throughout Germany by 2025. Within the currently ongoing broadband program aiming at the nationwide availability of a minimum download speed of 50 Mbit/s, the Federal Government is providing EUR 4.4 billion for investments in the expansion of broadband networks, focusing especially on rural and remote areas. As part of its high-tech strategy, the Federal Government provides incentives for research and development, particularly in the priority fields of digital economy and society, sustainable economic activity and energy, innovative working environment, healthy living, intelligent mobility, and civil security.
The Federal Government has also improved the framework for private-sector investment, including by promoting venture capital and start-ups through various initiatives. To improve the general business environment, the Federal Government has cut red tape and has decreased compliance costs for companies. In addition, a reform of the public procurement laws and the enactment of a sub-threshold procurement regulation have improved the legal framework for public procurement.
The new Federal Government intends to ensure the German economy continues to grow in the coming years by continuing to improve conditions for growth in productivity, incomes, and employment. The government intends to achieve this by ensuring that private and public investments complement each other, by strengthening businesses’ innovative capacity, and by further increasing efforts in the areas of skilled labor and qualifications. Because approximately 90% of investments in Germany are made by the private sector, the Federal Government aims to continue to improve conditions to boost investments by households and businesses.
The Federal Government continues to develop and adapt tax legislation to align it with the needs of a modern society in a globalized world. In line with the OECD action plan against base erosion and profit shifting by multinational companies, the
G-13
Federal Government aims to ensure that profits generated in Germany are not shifted abroad to low-tax countries. In 2017, it enacted a law against harmful tax practices in connection with the transfer of property rights. Under certain conditions, the new scheme limits the domestic deduction of operating expenses for the transfer of rights. This is to prevent multinational companies from shifting profits through royalty payments to countries with special preferential arrangements, for example patent and license boxes.
In order to ensure that as many workers as possible can benefit from the strong labor market and to secure adequate working conditions, the Federal Government has launched a number of policy measures. Since January 1, 2015, a general statutory gross minimum wage has been in place. Every two years, the minimum wage is assessed and, if appropriate, adjustments are proposed by a commission comprising representatives of the unions and of the employers’ associations in equal shares. In connection with the first assessment, the minimum wage was raised from EUR 8.50 to EUR 8.84 per hour worked. The next assessment is due on January 1, 2019. The Federal Government has taken measures within a comprehensive concept to increase the chances of long-term unemployed persons regaining access to the regular labor market. While recognizing that the use of temporary workers enables many people to participate in working life, the Federal Government has amended legislation to address illegal contract clauses with the aim of restricting the use of temporary workers to times of extraordinary capacity needs.
The Federal Government is developing strategies to counteract the effects of demographic change on the business sector. The aim is to strengthen and activate the potential pool of skilled labor in the domestic economy and to make Germany more attractive for qualified professionals from other countries. Making family and working life more compatible not only contributes to equal opportunity, but also to activating additional skills for companies. Thus, the Federal Government has supported the Länder and local authorities with over EUR 6 billion during the past legislative term. The funds were invested in the expansion, operation and improvement of child day care, and in federal programs for language education. In order to provide greater support to working patterns that fit in with other aspects of life, the legal framework for a more flexible transition from working life to retirement was improved by the Variable Pension Act (Flexirentengesetz).
The number of refugees seeking protection in Germany has decreased from 890,000 in 2015 to about 173,000 in 2017 (January to November). Nevertheless, the integration of immigrants remains an important social and economic challenge. In 2017, the Federal Government took a number of new measures to promote the successful integration of immigrants into society and the labor market. Besides increasing the supply of high-quality language and integration courses, it has enacted regulations allowing for better monitoring of compliance of immigrants with such course measures.
Following the nuclear disaster which affected the Japanese nuclear power plant in Fukushima in March 2011, the Federal Government decided to accelerate the transition to a more sustainable energy set-up (Energiewende). Among other things, this energy concept provides for the shutdown of all nuclear power stations in Germany by 2022 and unites other key energy policy objectives (i.e., energy security, climate protection, energy efficiency, renewable energy) within a single strategy. It sets a long-term target of achieving an 80% to 95% reduction in greenhouse gas emissions by 2050, compared to 1990 levels. To this end, the energy concept is intended to increase the production and use of renewable energy sources, making them the primary source of German energy supply. The overarching principle for the future implementation of the energy reforms is the “energy policy triangle” of a secure, affordable and environmentally compatible energy supply.
The Federal Government’s reform of the Renewable Energy Sources Act (Erneuerbare-Energien-Gesetz) has placed the future expansion of renewable energy sources on a cost-efficient basis by providing for public compensation which is technology-specific. The other key projects for the past legislative term were consolidated in a ten-point Energy Agenda. The National Energy Efficiency Action Plan, which was adopted in December 2014, sets out the Federal Government’s efficiency strategy. It aims to raise awareness of the economic viability of efficiency measures on a cross-sectoral basis and to put the conditions in place in order to make full use of the potential for efficiency improvements. As of the end of 2017, most projects on the ten-point Energy Agenda have been implemented. This includes important reforms for the electricity market, the support system for renewable energies and the expansion of the grid and energy efficiency. Renewable energies are now the most important source of electricity in Germany, accounting for around one third of gross electricity generation. In order to achieve the long-term goal of an almost CO2-free energy supply, greater efforts will be required to further reduce the total energy requirement across all sectors and to make the electricity system even more flexible. Sector coupling, i.e., the efficient use of renewable electricity for heating, transport and industry, is expected to make an important contribution to decarbonization.
G-14
For information on recent government measures to stabilize Germany’s financial system, see “Monetary and Financial System—Financial System—German Financial System.” For information on government budgets, see “Public Finance.” For information on the response to the European sovereign debt crisis, see “General—The European Union and European Integration—Response to the European Sovereign Debt Crisis” and “General—The European Union and European Integration—EU Economic Governance.”
Sources: Bundesministerium für Wirtschaft und Energie, Jahreswirtschaftsbericht 2018 (https://www.bmwi.de/Redaktion/DE/Publikationen/Wirtschaft/jahreswirtschaftsbericht-2018.pdf?__blob=publicationFile&v=12); Bundesministerium für Wirtschaft und Energie, “A strengthened economy ready to embrace the future”: Federal Government adopts 2018 Annual Economic Report, press release of January 31, 2018 (https://www.bmwi.de/Redaktion/EN/Pressemitteilungen/2018/20180131-federal-government-adopts-2018-annual-economic-report.html); Bundesministerium für Wirtschaft und Energie, Jahreswirtschaftsbericht 2017 (https://www.bmwi.de/Redaktion/DE/Publikationen/Wirtschaft/jahreswirtschaftsbericht-2017.pdf?__blob=publicationFile&v=16%5bbmwi.de); Statistisches Bundesamt, General government records surplus of almost 37 billion euros in 2017, press release of February 23, 2018 (https://www.destatis.de/EN/PressServices/Press/pr/2018/02/PE18_059_813.html); Bundesministerium der Finanzen, Bundeshaushalt 2018, press release of June 28, 2017 (http://www.bundesfinanzministerium.de/Content/DE/Pressemitteilungen/Finanzpolitik/2017/06/2017-06-28-PM20-bundeshaushalt-2018.html); Bundesfinanzministerium, Entwicklung der öffentlichen Finanzen, April 2018 (http://www.bundesfinanzministerium.de/Content/DE/Standardartikel/Themen/Oeffentliche_Finanzen/Entwicklung_Oeffentliche_Finanzen/entwicklung-oeffentliche-finanzen.html); Bundesregierung, Ab 2017 beträgt der Mindestlohn 8,84 Euro (https://www.bundesregierung.de/Content/DE/Artikel/2016/10/2016-10-26-neuer-mindestlohn2017.html); Bundesministerium für Arbeit und Soziales, Klare Regeln für Leiharbeit und Werkverträge,press release of June 1, 2016 (http://www.bmas.de/DE/Presse/Pressemitteilungen/2016/pk-leiharbeit-werkvertraege.html); Climate Action Plan 2050, Executive Summary (www.bmub.bund.de/ N53483/); Bundesministerium für Wirtschaft und Energie, Nationales Reformprogramm 2018 (https://www.bmwi.de/Redaktion/DE/Publikationen/Europa/nationales-reformprogramm-2018.pdf?__blob=publicationFile&v=4).
Gross Domestic Product
The following tables show the structure of the Federal Republic’s GDP at current prices by use and origin for each of the years indicated along with changes over the respective preceding period.
STRUCTUREOF GDP—USE
| | | | | | | | | | | | | | | | | | | | | | | | | | | | | | | | | | | | | | | | |
| | | 2017 | | | 2016 | | | 2015 | | | 2014 | | | 2013 | | | | | | 2017 | | | 2016 | | | 2015 | | | 2014 | |
| | | (EUR in billions) | | | | | | (change in %) | |
Domestic uses | | | 3,015.0 | | | | 2,893.4 | | | | 2,800.3 | | | | 2,729.5 | | | | 2,657.8 | | | | | | | | 4.2 | | | | 3.3 | | | | 2.6 | | | | 2.7 | |
Final private consumption | | | 1,735.0 | | | | 1,674.4 | | | | 1,630.5 | | | | 1,593.2 | | | | 1,563.5 | | | | | | | | 3.6 | | | | 2.7 | | | | 2.3 | | | | 1.9 | |
Final government consumption | | | 638.7 | | | | 615.4 | | | | 587.1 | | | | 563.9 | | | | 542.9 | | | | | | | | 3.8 | | | | 4.8 | | | | 4.1 | | | | 3.9 | |
Gross fixed capital formation | | | 662.7 | | | | 630.0 | | | | 604.3 | | | | 586.6 | | | | 556.8 | | | | | | | | 5.2 | | | | 4.3 | | | | 3.0 | | | | 5.4 | |
Machinery and equipment | | | 214.6 | | | | 205.8 | | | | 200.8 | | | | 191.7 | | | | 180.0 | | | | | | | | 4.3 | | | | 2.5 | | | | 4.7 | | | | 6.5 | |
Construction | | | 322.7 | | | | 304.5 | | | | 291.0 | | | | 289.7 | | | | 277.2 | | | | | | | | 6.0 | | | | 4.6 | | | | 0.4 | | | | 4.5 | |
Other products | | | 125.4 | | | | 119.7 | | | | 112.5 | | | | 105.1 | | | | 99.5 | | | | | | | | 4.8 | | | | 6.4 | | | | 7.0 | | | | 5.6 | |
Changes in inventories (1) | | | -21.3 | | | | -26.4 | | | | -21.5 | | | | -14.2 | | | | -5.3 | | | | | | | | — | | | | — | | | | — | | | | — | |
Net exports (1) | | | 248.3 | | | | 250.6 | | | | 243.3 | | | | 203.0 | | | | 168.4 | | | | | | | | — | | | | — | | | | — | | | | — | |
Exports | | | 1,542.1 | | | | 1,450.0 | | | | 1,426.7 | | | | 1,340.3 | | | | 1,283.1 | | | | | | | | 6.3 | | | | 1.6 | | | | 6.4 | | | | 4.5 | |
Imports | | | 1,293.7 | | | | 1,199.4 | | | | 1,183.4 | | | | 1,137.3 | | | | 1,114.6 | | | | | | | | 7.9 | | | | 1.4 | | | | 4.1 | | | | 2.0 | |
| | | | | | | | | | | | | | | | | | | | | | | | | | | | | | | | | | | | | | | | |
Gross domestic product | | | 3,263.4 | | | | 3,144.1 | | | | 3,043.7 | | | | 2,932.5 | | | | 2,826.2 | | | | | | | | 3.8 | | | | 3.3 | | | | 3.8 | | | | 3.8 | |
| | | | | | | | | | | | | | | | | | | | | | | | | | | | | | | | | | | | | | | | |
| (1) | Percentage changes are not presented due to the potentially changing signs of these net positions. |
Source: Statistisches Bundesamt, Fachserie 18, Reihe 1.2 – 4. Vierteljahr 2017 (February 2018), Tables 3.1 and 3.9.
G-15
STRUCTUREOF GDP — ORIGIN
| | | | | | | | | | | | | | | | | | | | | | | | | | | | | | | | | | | | | | | | |
| | | 2017 | | | 2016 | | | 2015 | | | 2014 | | | 2013 | | | | | | 2017 | | | 2016 | | | 2015 | | | 2014 | |
| | | (EUR in billions) | | | | | | (change in %) | |
Gross value added of all economic sectors | | | 2,941.0 | | | | 2,831.9 | | | | 2,740.2 | | | | 2,639.8 | | | | 2,542.7 | | | | | | | | 3.9 | | | | 3.3 | | | | 3.8 | | | | 3.8 | |
Agriculture, forestry and fishing | | | 20.8 | | | | 17.4 | | | | 16.9 | | | | 20.2 | | | | 24.8 | | | | | | | | 19.8 | | | | 2.9 | | | | -16.4 | | | | -18.6 | |
Production sector (excluding construction) | | | 755.0 | | | | 728.6 | | | | 711.7 | | | | 684.5 | | | | 652.5 | | | | | | | | 3.6 | | | | 2.4 | | | | 4.0 | | | | 4.9 | |
Construction | | | 145.2 | | | | 134.9 | | | | 124.9 | | | | 119.1 | | | | 113.0 | | | | | | | | 7.6 | | | | 8.0 | | | | 4.9 | | | | 5.4 | |
Trade, transport, accommodation and food services | | | 474.2 | | | | 454.0 | | | | 440.5 | | | | 418.6 | | | | 395.4 | | | | | | | | 4.4 | | | | 3.1 | | | | 5.2 | | | | 5.9 | |
Information and communication | | | 138.5 | | | | 134.3 | | | | 129.1 | | | | 124.9 | | | | 119.9 | | | | | | | | 3.1 | | | | 4.0 | | | | 3.4 | | | | 4.1 | |
Financial and insurance services | | | 110.9 | | | | 111.5 | | | | 111.5 | | | | 109.4 | | | | 108.5 | | | | | | | | -0.5 | | | | -0.0 | | | | 2.0 | | | | 0.8 | |
Real estate activities | | | 317.5 | | | | 308.9 | | | | 299.5 | | | | 290.6 | | | | 289.9 | | | | | | | | 2.8 | | | | 3.1 | | | | 3.1 | | | | 0.2 | |
Business services | | | 323.9 | | | | 312.6 | | | | 301.3 | | | | 289.0 | | | | 275.9 | | | | | | | | 3.6 | | | | 3.8 | | | | 4.3 | | | | 4.8 | |
Public services, education, health | | | 536.5 | | | | 514.6 | | | | 493.4 | | | | 476.3 | | | | 458.4 | | | | | | | | 4.3 | | | | 4.3 | | | | 3.6 | | | | 3.9 | |
Other services | | | 118.6 | | | | 115.1 | | | | 111.5 | | | | 107.2 | | | | 104.2 | | | | | | | | 3.0 | | | | 3.3 | | | | 3.9 | | | | 2.9 | |
Taxes on products offset against subsidies on products | | | 322.3 | | | | 312.1 | | | | 303.4 | | | | 292.7 | | | | 283.6 | | | | | | | | 3.3 | | | | 2.9 | | | | 3.7 | | | | 3.2 | |
| | | | | | | | | | | | | | | | | | | | | | | | | | | | | | | | | | | | | | | | |
Gross domestic product | | | 3,263.4 | | | | 3,144.1 | | | | 3,043.7 | | | | 2,932.5 | | | | 2,826.2 | | | | | | | | 3.8 | | | | 3.3 | | | | 3.8 | | | | 3.8 | |
| | | | | | | | | | | | | | | | | | | | | | | | | | | | | | | | | | | | | | | | |
Source: Statistisches Bundesamt, Fachserie 18, Reihe 1.2 – 4. Vierteljahr 2017 (February 2018), Tables 1.14 and 2.1.
Sectors of the Economy
Production Sector
Following German reunification in 1990, industry in the eastern Länder (i.e., the former German Democratic Republic), has undergone a restructuring process. Today, the German production sector is characterized by a balanced mix of small, medium and large enterprises, and is almost entirely privately owned. Measured by its share in value added, approximately 59% of the production sector is geographically concentrated in the western Länder of Bavaria, Baden-Württemberg and North Rhine-Westphalia. The main segments of the production sector relate to the manufacturing of motor vehicles, machinery and equipment, electrical and optical equipment, basic metals and fabricated metal products, as well as chemicals and chemical products. In 2017, the production sector’s aggregate contribution to gross value added at current prices was 25.7% (excluding construction) and 30.6% (including construction), respectively. Its price-adjusted gross value added (excluding construction) increased by 2.7% year-on-year in 2017, after increasing by 1.9% in 2016.
Sources: Volkswirtschaftliche Gesamtrechnungen der Länder, Reihe 1, Länderergebnisse Band 1 (March 2018), Table 2.3; Statistisches Bundesamt, Statistisches Bundesamt, Fachserie 18, Reihe 1.4 – 2017 (February 2018), Tables 2.2.1 and 2.2.2.
G-16
OUTPUTINTHE PRODUCTION SECTOR (1)
(2015 = 100)
| | | | | | | | | | | | | | | | |
| | | 2017 | | | 2016 | | | 2015 | | | 2014 | |
Production sector, total | | | 104.9 | | | | 101.6 | | | | 99.8 | | | | 98.8 | |
Industry (2) | | | 104.8 | | | | 101.2 | | | | 99.7 | | | | 99.3 | |
of which: | | | | | | | | | | | | | | | | |
Intermediate goods (3) | | | 104.9 | | | | 100.9 | | | | 99.8 | | | | 99.9 | |
Capital goods (4) | | | 105.0 | | | | 101.3 | | | | 99.7 | | | | 98.8 | |
Durable goods (5) | | | 107.0 | | | | 102.7 | | | | 99.7 | | | | 97.5 | |
Nondurable goods (6) | | | 103.2 | | | | 101.0 | | | | 99.8 | | | | 100.1 | |
Energy (7) | | | 98.8 | | | | 98.7 | | | | 100.1 | | | | 95.2 | |
Construction (8) | | | 108.7 | | | | 105.3 | | | | 99.7 | | | | 101.9 | |
| (1) | Adjusted for working-day variations. |
| (2) | Manufacturing sector, unless assigned to the main grouping energy, plus mining and quarrying. |
| (3) | Including mining and quarrying except energy-producing goods. |
| (4) | Including manufacture of motor vehicles and components. |
| (5) | Consumption goods that have a long-term use, such as furniture. |
| (6) | Consumption goods that have a short-term use, such as food. Including printing and service activities related to printing. |
| (7) | Electricity, gas, steam and hot water supply, mining and quarrying of energy-producing materials, and especially manufacture of refined petroleum products. |
| (8) | Comprises the economic classifications “Site preparation” and “Building of complete constructions or parts thereof; civil engineering.” |
Source: Deutsche Bundesbank, Monatsbericht März 2018, Table XI.2.
Services Sector
As in most other industrialized countries, the services sector, which comprises “trade, transport, accommodation and food services,” “information and communication,” “financial and insurance services,” “real estate activities,” “business services,” “public services, education, health” as well as “other services,” has expanded rapidly in recent years and is currently the largest contributor to gross value added. In 2017, the services sector’s aggregate contribution to gross value added at current prices was 68.7%, nearly matching the previous year’s level of 68.9%, compared to only 61.9% in 1991. Within the services sector, “public services, education, health” represented the largest subsector in terms of contribution to total gross value added at current prices, contributing 18.2% in 2016 and 2017.
Source: Statistisches Bundesamt, Fachserie 18, Reihe 1.4 – 2017 (March 2018), Table 2.2.1.
Employment and Labor
As solid economic growth continued in 2017, labor market conditions improved further. In 2017, the average unemployment rate according to the national definition was 5.7%, compared to 6.1% in 2016. Under the ILO definition, the average unemployment rate was 3.6% in 2017 compared to 3.9% in 2016, having declined to the lowest level of unemployment since 1991. The number of persons resident in Germany who were either employed or self-employed in 2017 was 44.2 million, an increase of 1.5% compared to 2016.
Sources: Bundesagentur für Arbeit, Der Arbeits- und Ausbildungsmarkt in Deutschland: Monatsbericht Februar 2018, Table 6.1 (https://statistik.arbeitsagentur.de/Statistikdaten/Detail/201802/arbeitsmarktberichte/monatsbericht-monatsbericht/monatsbericht-d-0-201802-pdf.pdf); Statistisches Bundesamt, Fachserie 18, Reihe 1.4 – 2017 (March 2018), Tables 2.1.13.
The following table presents data with respect to employment and unemployment for each of the years indicated. Persons who are participating in programs such as vocational training, job creation plans or early retirement, which are designed to reduce unemployment, are not included in the unemployment rates shown below, as they are not treated as unemployed.
EMPLOYMENTAND UNEMPLOYMENT
| | | | | | | | | | | | | | | | | | | | |
| | | 2017 | | | 2016 | | | 2015 | | | 2014 | | | 2013 | |
Employed (in thousands)–ILO definition | | | 44,189 | | | | 43,544 | | | | 42,990 | | | | 42,608 | | | | 42,257 | |
Unemployed (in thousands)–ILO definition (1) | | | 1,633 | | | | 1,774 | | | | 1,950 | | | | 2,090 | | | | 2,182 | |
Unemployment rate (in %)–ILO definition | | | 3.6 | | | | 3.9 | | | | 4.3 | | | | 4.7 | | | | 4.9 | |
Unemployed (in thousands)–national definition (2) | | | 2,533 | | | | 2,691 | | | | 2,795 | | | | 2,898 | | | | 2,950 | |
Unemployment rate (in %)–national definition (3) | | | 5.7 | | | | 6.1 | | | | 6.4 | | | | 6.7 | | | | 6.9 | |
| (1) | Unemployed persons, available and seeking work. |
| (2) | Registered unemployed persons, available and seeking work (but including persons working up to 15 hours per week). |
| (3) | As a percentage of the total work force (excluding armed forces). |
Sources: Bundesagentur für Arbeit, Der Arbeits- und Ausbildungsmarkt in Deutschland: Dezember und das Jahr 2017, Table 10.1; Statistisches Bundesamt, Fachserie 18, Reihe 1.2 – 4. Vierteljahr 2017 (February 2018), Table 1.11.
G-17
The following table presents data with respect to the employment rate broken down by gender and age for 2017 and 2007.
EMPLOYMENT RATE – BREAKDOWNBY GENDERAND AGE
| | | | | | | | | | | | | | | | | | | | | | | | |
| | | Total | | | Men | | | Women | |
(Age in years) | | 2017 | | | 2007 | | | 2017 | | | 2007 | | | 2017 | | | 2007 | |
| | | (Employed persons as a percentage of total population of same gender and age) | |
15 to 19 | | | 26.9 | | | | 28.2 | | | | 28.5 | | | | 30.5 | | | | 25.2 | | | | 25.8 | |
20 to 24 | | | 64.6 | | | | 63.2 | | | | 64.7 | | | | 65.7 | | | | 64.4 | | | | 60.7 | |
25 to 29 | | | 78.3 | | | | 73.2 | | | | 80.9 | | | | 77.6 | | | | 75.4 | | | | 68.9 | |
30 to 34 | | | 82.6 | | | | 79.1 | | | | 88.3 | | | | 87.0 | | | | 76.7 | | | | 71.0 | |
35 to 39 | | | 84.2 | | | | 81.9 | | | | 90.2 | | | | 89.4 | | | | 78.0 | | | | 74.3 | |
40 to 44 | | | 86.1 | | | | 83.4 | | | | 90.4 | | | | 89.2 | | | | 81.7 | | | | 77.4 | |
45 to 49 | | | 87.7 | | | | 82.4 | | | | 90.9 | | | | 87.6 | | | | 84.5 | | | | 77.3 | |
50 to 54 | | | 85.7 | | | | 78.2 | | | | 89.3 | | | | 83.9 | | | | 82.0 | | | | 72.5 | |
55 to 59 | | | 80.1 | | | | 66.5 | | | | 84.4 | | | | 74.4 | | | | 75.8 | | | | 58.8 | |
60 to 64 | | | 58.4 | | | | 32.8 | | | | 63.7 | | | | 41.1 | | | | 53.3 | | | | 24.8 | |
65 and older | | | 7.0 | | | | 3.6 | | | | 9.8 | | | | 5.2 | | | | 4.7 | | | | 2.4 | |
| | | | | | | | | | | | | | | | | | | | | | | | |
Total (15 and older) | | | 58.9 | | | | 53.6 | | | | 63.9 | | | | 60.4 | | | | 54.0 | | | | 47.2 | |
| | | | | | | | | | | | | | | | | | | | | | | | |
Source: Statistisches Bundesamt, Erwerbsbeteiligung, Erwerbstätige und Erwerbstätigenquote nach Geschlecht und Alter 2007 und 2017, Ergebnis des Mikrozensus (https://www.destatis.de/DE/ZahlenFakten/GesamtwirtschaftUmwelt/Arbeitsmarkt/Erwerbstaetigkeit/TabellenArbeitskraefteerhebung/ET_ETQ.html).
The following table presents data with respect to the structure of employment by economic sector for 2017 and 2007.
STRUCTUREOF EMPLOYMENT—ECONOMIC SECTORS
| | | | | | | | |
| | | 2017 | | | 2007 | |
| | | (Percent of total) | |
Agriculture, forestry and fishing | | | 1.4 | | | | 1.7 | |
Production sector (excluding construction) | | | 18.4 | | | | 19.4 | |
of which: manufacturing | | | 17.1 | | | | 18.0 | |
Construction | | | 5.6 | | | | 5.7 | |
Trade, transport, accommodation and food services | | | 22.8 | | | | 23.3 | |
Information and communication | | | 2.9 | | | | 2.9 | |
Financial and insurance services | | | 2.6 | | | | 3.1 | |
Real estate activities | | | 1.1 | | | | 1.2 | |
Business services | | | 13.7 | | | | 12.1 | |
Public services, education, health | | | 24.7 | | | | 23.4 | |
Other services | | | 6.8 | | | | 7.3 | |
| | | | | | | | |
Total (1) | | | 100.0 | | | | 100.0 | |
| | | | | | | | |
| (1) | Figures may not add up due to rounding. |
Source: Statistisches Bundesamt, Fachserie 18, Reihe 1.4 – 2017 (March 2018), Table 2.2.9.
G-18
The following table shows changes in the annual wage level per employee and unit labor costs per hour worked for each of the years indicated.
WAGE TRENDSAND LABOR COSTS
| | | | | | | | | | | | | | | | | | | | |
| | | 2017 | | | 2016 | | | 2015 | | | 2014 | | | 2013 | |
Gross wages and salaries per employee in EUR | | | 34,213 | | | | 33,304 | | | | 32,511 | | | | 31,631 | | | | 30,771 | |
Change from previous year in % | | | 2.7 | | | | 2.4 | | | | 2.8 | | | | 2.8 | | | | 2.1 | |
Unit labor costs per hour worked | | | | | | | | | | | | | | | | | | | | |
Index (2010=100) | | | 112.1 | | | | 110.3 | | | | 108.6 | | | | 106.8 | | | | 105.3 | |
Change from previous year in % | | | 1.6 | | | | 1.6 | | | | 1.8 | | | | 1.4 | | | | 1.7 | |
Source: Statistisches Bundesamt, Fachserie 18, Reihe 1.2 – 4. Vierteljahr 2017 (February 2018), Tables 2.17 and 2.20.
About one-sixth of the German work force consists of members of unions. The German Trade Union Federation (Deutscher Gewerkschaftsbund) serves as an umbrella organization for eight such unions. In 2017, approximately 6 million persons were members of a union under the umbrella of the Deutscher Gewerkschaftsbund, roughly unchanged since 2013, but considerably less compared to the 11.8 million members in 1991, the first full year after German reunification. One major reason contributing to the strong decline since 1991 is the significant fall in manufacturing employment in the eastern Länder after reunification.
Each member union typically covers employees of an entire industry, regardless of the precise type of work done by those employees (the “one union, one industry” principle). As a result, employers usually deal with only one negotiating partner on the labor side in each specific industry. The unions and employers of each specific industry enter into collective labor agreements (Tarifverträge) without government intervention. The collective labor agreements often apply to all employees of a given industry, regardless of whether or not a particular employee is a member of a union, so long as the employer is a member of the relevant association of employers, which is often the case. Despite their binding character, collective labor agreements in many cases contain opt-out clauses (Öffnungsklauseln) allowing for company-specific adjustments to be negotiated between the employer and the works council at the specific company. Moreover, there is a range of additional possibilities to deviate from these agreements. Many employers in the eastern Länder are not members of employers’ associations, which means that wages are individually negotiated, often resulting in wage levels that are lower than those provided for by the collective labor agreements.
Sources: Deutscher Gewerkschaftsbund, DGB-Mitgliederzahlen ab 2010 (http://www.dgb.de/uber-uns/dgb-heute/mitgliederzahlen/2010); Deutscher Gewerkschaftsbund, Mitgliederzahlen 1950-1993 (http://www.dgb.de/uber-uns/dgb-heute/mitgliederzahlen/1950-1993); European Trade Union Institute, National Industrial Relations, Countries, Germany, Trade Unions (http://www.worker-participation.eu/National-Industrial-Relations/Countries/Germany); Bundeszentrale für politische Bildung, Tarifautonomie (http://www.bpb.de/nachschlagen/lexika/handwoerterbuch-politisches-system/202193/tarifautonomie).
Social Security, Social Protection, and Social Policy
The comprehensive system of social security and protection in effect in the Federal Republic includes in particular health insurance, long-term care insurance, retirement and disability pensions, participation benefits and benefits for medical rehabilitation, protection against the effects of occupational accidents and diseases by means of the mandatory occupational accident insurance, unemployment benefits, family benefits, benefits and rehabilitation for persons with disabilities, allowances to orphans and to single persons with dependents, and the provision of general public assistance to persons in need. The majority of the German population is covered by mandatory statutory retirement pensions and health insurance. Hospitals and institutions caring for children and handicapped persons are operated by municipalities, churches, charitable institutions, and private providers.
Most of these social services are mainly funded through social security contributions from employers and employees, and a smaller part is funded through direct contributions by the Federal Republic, the Länder, municipalities and other public institutions, depending notably upon whether the respective social service is provided by an insurance-based system funded through contributions or a social-assistance-like program funded through taxes.
The Federal Republic’s statutory retirement insurance system operates on a pay-as-you-go basis, with contributions from current employers and employees funding payments to current retired persons. Generally, all employed and some self-employed and other persons are subject to mandatory insurance in the statutory retirement system. Certain persons, including employed members of particular professions (including some freelance professions) may apply for exemption, while others, as in the case of civil servants, are automatically exempted from mandatory participation in the statutory retirement pension insurance system. Instead, exempted persons have to contribute to professional or public pension schemes or, in the case of civil servants and similar groups, they will benefit from special pension schemes for civil servants. Furthermore, the Retirement Funds Act (Altersvermögensgesetz) aims to ensure the long-term viability of the statutory retirement pension insurance system by encouraging insured persons to also sign up for designated privately funded or corporate-funded pension schemes, for which certain bonus payments and tax incentives are provided, with a view to offsetting the expected decline of payments from the statutory retirement pension insurance.
G-19
Statutory health insurance coverage must be made available to all persons fulfilling the applicable eligibility criteria. Within the statutory health insurance system, insured persons may choose among a large number of statutory health insurance funds that have developed historically. Persons whose gross income exceeds certain thresholds as well as civil servants, self-employed persons and members of certain professions may opt out of the statutory system and choose private health insurance coverage, which, in case of opting-out, is obligatory as well. Contributions to the statutory health insurance system are based solely on the insured person’s income situation and are independent of the insured person’s gender, age and medical risk. By contrast, contributions towards private health insurance coverage are mainly calculated based on age, medical risk and the desired level of coverage.
In 2017, social security revenue, as shown in the national accounts, amounted to EUR 635.4 billion, and expenditure was EUR 624.8 billion. The social security budget thus incurred a surplus of EUR 10.5 billion in 2017, after a surplus of EUR 8.2 billion in 2016.
Source: Statistisches Bundesamt, Fachserie 18, Reihe 1.4 – 2017 (March 2018), Table 3.4.3.7.
In light of a changing population structure, the Federal Government has already implemented structural reforms of the statutory pension system in order to safeguard the sustainability of the social security system in the long term. In addition, Germany has implemented reforms of the statutory pension insurance which gradually raise the regular retirement age by two years to the age of 67 between 2012 and 2029.
To increase the sustainability of the health care system, Germany has implemented several structural reform measures to strengthen competition among providers in order to improve the efficiency and quality of health care services.
Source: Bundesministerium der Gesundheit, Gesundheitsfonds (http://www.bmg.bund.de/themen/krankenversicherung/finanzierung/gesundheitsfonds.html); Bundesministerium für Arbeit und Soziales, Pensions from age 67 (http://www.bmas.de/EN/Our-Topics/Pensions/pensions-from-age-67.html).
International Economic Relations
International economic relations are of major importance to the German economy. In 2017, exports and imports of goods and services amounted to 47.3% and 39.6% of GDP at current prices, respectively. The Federal Republic supports the European Union in pursuing a liberal foreign trade policy aimed at dismantling tariffs and other barriers to trade. The responsibility for trade matters (particularly negotiating free trade agreements) in the EU rests with the European Commission. For further information on the EU’s responsibility for trade matters, see “General—The European Union and European Integration— Economic Integration.”
Source: Statistisches Bundesamt, Fachserie 18, Reihe 1.4 – 2017 (March 2018), Table 2.3.1.
Because the Federal Republic’s economy depends on exports, it is particularly vulnerable to trade barriers, such as protective tariffs. The Federal Government thus supports efforts to reduce trade barriers, such as the current negotiations within the framework of the WTO under the Doha Development Agenda. The Federal Government also supports the Comprehensive Economic and Trade Agreement (CETA), a trade agreement between the EU and Canada. This agreement was approved by the European Parliament in February 2017. On September 21, 2017, CETA entered into force provisionally, i.e. most of the agreement, with the exception of investment protection, investment market access for portfolio investment and the Investment Court System, is already in force. CETA will take full effect after ratification by all EU Member States. In December 2017, the EU finalized a free trade agreement with Japan (Economic Partnership Agreement), which is intended to remove the majority of duties and regulatory barriers.
Sources: Bundesministerium für Wirtschaft und Energie, WTO-Welthandelsrunde “Doha Development Agenda” (https://www.bmwi.de/Redaktion/DE/Artikel/Aussenwirtschaft/wto-doha.html); Bundesministerium für Wirtschaft und Energie, CETA – Das europäisch- kanadische Wirtschafts- und Handelsabkommen (http://www.bmwi.de/Redaktion/DE/Dossier/ceta.html); Bundesministerium für Wirtschaft und Energie, Europäisches Parlament stimmt CETA zu, press release of February 15, 2017 (http://www.bmwi.de/Redaktion/DE/Pressemitteilungen/2017/20170215-europaeisches-parlament-stimmt-ceta-zu.html); European Commission, CETA explained (http://ec.europa.eu/trade/policy/in-focus/ceta/ceta-explained/); European Commission, EU and Japan finalise Economic Partnership Agreement, press release of December 8, 2017 (http://trade.ec.europa.eu/doclib/press/index.cfm?id=1767&title=EU-and-Japan-finalise-Economic-Partnership-Agreement).
Balance of Payments
The Federal Republic typically achieves a surplus in the trading of goods. Traditionally, this surplus has been partially offset by deficits in other fields, such as services and secondary income. In 2017, the current account surplus totaled EUR 262.6 billion, compared to EUR 268.8 billion in 2016, a decrease of EUR 6.2 billion. Thus the current account surplus declined to 8.0% of nominal GDP.
Source: Deutsche Bundesbank, Monatsbericht April 2018, Table XII.2.
According to data prepared by the Deutsche Bundesbank, applying the annual averages of a broad monthly indicator of Germany’s price competitiveness compared to 56 trading partners based on consumer price indices, Germany’s price competitiveness has been relatively stable since 1999, fluctuating within a range of approximately 10% of the average indicator value in the period from 1999 to 2018. In 2017, price competitiveness deteriorated by 0.9% compared to 2016, mainly due to the
G-20
appreciation of the euro relative to several currencies, including the U.S. dollar, pound sterling, the Swiss franc, the Chinese yuan, the Japanese yen, the Swedish krona, and the Norwegian krona. However, the influence of variations in the exchange rates should be viewed in light of the fact that the Euro Area Member States account for a major part of German exports (36.9% in 2017).
Since the introduction of the euro, the exchange rate against the U.S. dollar has shown high volatility. After appreciating by approximately 85% against the U.S. dollar between June 2001 and July 2008, the euro depreciated considerably relative to the U.S. dollar by approximately 23% between July 2008 and June 2010. After a number of fluctuations the euro started a prolonged depreciation in mid-2014. Over the course of the years 2015 and 2016, the euro remained relatively stable at an average level of USD 1.1 per euro. In 2017, the euro appreciated by 2.1% compared to its 2016 average. Due to its steep appreciation since the first quarter of 2017, the average value of the euro against the U.S. dollar in February 2018 was 9.3% higher than the 2017 average.
Sources: Deutsche Bundesbank, Monatsbericht März 2018, Tables XII.3, XII.10 and XII.12 (https://www.bundesbank.de/Redaktion/DE/Downloads/Veroeffentlichungen/Monatsberichte/2018/2018_03_monatsbericht.pdf?__blob=publicationFile).
The following table shows the Federal Republic’s balance of payments for each of the years indicated.
BALANCEOF PAYMENTS (BALANCES)
| | | | | | | | | | | | | | | | | | | | |
| | | 2017 | | | 2016 | | | 2015 | | | 2014 | | | 2013 | |
| | | (EUR in millions) | |
Current account | | | | | | | | | | | | | | | | | | | | |
Trade in goods (1) | | | 265,442 | | | | 267,999 | | | | 261,135 | | | | 228,185 | | | | 212,662 | |
Services (2) | | | -16,123 | | | | -19,948 | | | | -16,918 | | | | -24,491 | | | | -41,376 | |
Primary income | | | 67,357 | | | | 60,639 | | | | 67,222 | | | | 56,549 | | | | 62,444 | |
Secondary income | | | -54,120 | | | | -39,879 | | | | -40,044 | | | | -41,283 | | | | -43,639 | |
| | | | | | | | | | | | | | | | | | | | |
Total current account | | | 262,556 | | | | 268,811 | | | | 271,394 | | | | 218,959 | | | | 190,092 | |
Capital account (3) | | | -254 | | | | 3,468 | | | | 534 | | | | 2,936 | | | | -563 | |
Financial account | | | | | | | | | | | | | | | | | | | | |
Net German investment abroad (increase: +) | | | 358,805 | | | | 397,043 | | | | 270,235 | | | | 308,445 | | | | 62,651 | |
Net foreign investment in Germany (increase: +) | | | 83,057 | | | | 139,350 | | | | 30,817 | | | | 68,329 | | | | -162,709 | |
| | | | | | | | | | | | | | | | | | | | |
Net financial account (net lending: + / net borrowing: -) | | | 275,748 | | | | 257,693 | | | | 239,418 | | | | 240,116 | | | | 225,360 | |
Net errors and omissions (4) | | | 13,446 | | | | -14,586 | | | | -32,511 | | | | 18,221 | | | | 35,831 | |
| (1) | Including supplementary trade items. |
| (2) | Including the freight and insurance costs of foreign trade. |
| (3) | Including net acquisition/disposal of non-produced non-financial assets. |
| (4) | Statistical errors and omissions, resulting from the difference between the balance on the financial account and the balances on the current account and the capital account. |
Sources: Deutsche Bundesbank, Zahlungsbilanzstatistik, Table I.1. Wichtige Posten der Zahlungsbilanz (https://www.bundesbank.de/Redaktion/DE/Downloads/Statistiken/Aussenwirtschaft/Zahlungsbilanz/b30607.pdf?__blob=publicationFile); Deutsche Bundesbank, Zahlungsbilanzstatistik, Table I.9.a) Kapitalbilanz insgesamt (https://www.bundesbank.de/Redaktion/DE/Downloads/Statistiken/Aussenwirtschaft/Zahlungsbilanz/b33637.pdf?__blob=publicationFile).
Balance of Trade
The following tables show information relating to foreign trade of the Federal Republic for each of the years indicated.
TRADEIN GOODS (1)
| | | | | | | | | | | | | | | | | | | | |
| | | 2017 | | | 2016 | | | 2015 | | | 2014 | | | 2013 | |
| | | (EUR in millions) | |
Exports of goods | | | 1,270,122 | | | | 1,192,058 | | | | 1,179,139 | | | | 1,115,345 | | | | 1,080,212 | |
Imports of goods | | | 1,004,680 | | | | 924,059 | | | | 918,004 | | | | 887,161 | | | | 867,550 | |
| | | | | | | | | | | | | | | | | | | | |
Trade balance | | | 265,442 | | | | 267,999 | | | | 261,135 | | | | 228,185 | | | | 212,662 | |
| | | | | | | | | | | | | | | | | | | | |
| (1) | Including supplementary trade items. |
Source: Deutsche Bundesbank, Zahlungsbilanzstatistik, Table I.1. Wichtige Posten der Zahlungsbilanz (https://www.bundesbank.de/Redaktion/DE/Downloads/Statistiken/Aussenwirtschaft/Zahlungsbilanz/b30607.pdf?__blob=publicationFile).
G-21
The Federal Republic’s principal export goods are motor vehicles, machinery of all kinds, and chemical products. The principal import goods are motor vehicles, computer, electronic and optical products, and machinery of all kinds. The Federal Republic has relatively few resources of industrial raw materials. As a result, it largely depends on imports to satisfy its demand for raw materials. This dependence on foreign supplies is particularly significant in the case of metals such as copper, tungsten, niobium, rare earth, rock phosphate, lithium carbonate, bauxite, manganese, titanium, and tin. The Federal Republic currently imports about 70% of its energy requirements, including virtually all of its oil and a significant portion of its natural gas requirements as well as all enriched uranium needed for nuclear energy.
Sources: Statistisches Bundesamt, Fachserie 7 Reihe 1 – 2017 (March 2018), page 65 and Tables 1.11.1 and 1.11.2; Bundesanstalt für Geowissenschaften und Rohstoffe, Deutschland – Rohstoffsituation 2016, pages 20 et seq (https://www.bgr.bund.de/DE/Themen/Min_rohstoffe/Downloads/rohsit-2016.pdf?__blob=publicationFile&v=4); Bundesministerium für Wirtschaft und Energie, Zahlen und Fakten Energiedaten, Tabelle 3 (http://www.bmwi.de/Redaktion/DE/Artikel/Energie/energiedaten-gesamtausgabe.html).
Germany’s Current Account Surplus and the Macroeconomic Imbalance Procedure
Within the framework of the MIP established in 2011, on November 22, 2017, the European Commission published the Alert Mechanism Report 2018, which, similar to the previous year’s report, inter alia noted the current account surplus observed in Germany. An in-depth review was conducted on Germany to scrutinize its external position and analyze internal developments, and to assess whether it is experiencing macroeconomic imbalances. According to the results of this review, Germany continues to experience macroeconomic imbalances that are not excessive. The Commission points out that subdued private and public investment has contributed to the high and persistent current account surplus. The Federal Government supports the European Commission in the resolute implementation of the MIP. Together with the European partners, the Federal Government aims to reduce economic imbalances while complying with the rules of the reformed SGP. However, it points out that the competitiveness and the exporting strength of German companies are an important pillar of the entire European economy. The Federal Government is taking a comprehensive approach to strengthen both public and private sector investments and has already taken numerous measures in the last legislative term to give a further boost to investment dynamics. Based on record-high employment, rising salaries, increasing private investment and targeted fiscal expansion especially in public investment, domestic demand continues to be the main driver of robust growth in Germany. As the European Commission notes in its in-depth review, the surplus has already edged down from its peak value reached in 2015 and is expected to gradually decline further in the coming years. Furthermore, it should be noted that Germany’s current account surplus to a large extent may be explained by temporary factors, e.g., the development of exchange rates and fluctuations in the price of oil, as well as by fundamentals, e.g., demographic change. These factors usually remain unaffected by economic and financial policy measures.
Sources: European Commission, Report from the Commission to the European Parliament, the Council, the European Central Bank and the European Economic and Social Committee, Alert Mechanism Report 2018, dated November 22, 2017 (https://eur-lex.europa.eu/legal-content/EN/TXT/PDF/?uri=CELEX:52017DC0771&from=EN); European Commission, Commission Staff Working Document, Country Report Germany 2018, Including an In-Depth Review on the prevention and correction of macroeconomic imbalances (https://ec.europa.eu/info/sites/info/files/2018-european-semester-country-report-germany-en.pdf); European Commission, Communication from the Commission to the European Parliament, the Council, the European Central Bank and the Eurogroup, 2018 European Semester: Assessment of progress on structural reforms, prevention and correction of macroeconomic imbalances, and results of in-depth reviews under regulation (EU) No 1176/2011 (https://eur-lex.europa.eu/legal-content/EN/TXT/PDF/?uri=CELEX:52018DC0120&from=EN); European Commission, Economic and Financial Affairs, EU Economic governance: monitoring, prevention, correction , Macroeconomic imbalance procedure (http://ec.europa.eu/economy_finance/economic_governance/macroeconomic_imbalance_procedure/mip_reports/index_en.htm); Bundesministerium für Wirtschaft und Energie, Nationales Reformprogramm 2018 (https://www.bmwi.de/Redaktion/DE/Publikationen/Europa/nationales-reformprogramm-2018.html); Bundesministerium der Finanzen, Monatsbericht des BMF März 2017, Analysen und Berichte, Der deutsche Leistungsbilanzsaldo – Entwicklung und wirtschaftspolitische Implikationen (http://www.bundesfinanzministerium.de/Monatsberichte/2017/03/Inhalte/Kapitel-3-Analysen/3-2-Der-deutsche-Leistungsbilanzsaldo.html).
G-22
COMPOSITIONOF EXPORTEDAND IMPORTED GOODS
| | | | | | | | |
| | | 2017 (1) | |
| | | Imports | | | Exports | |
| | | (Percent of total) | |
Products of agriculture and hunting | | | 3.0 | | | | 0.8 | |
Products of forestry | | | 0.1 | | | | 0.0 | |
Fish and products of fishing | | | 0.1 | | | | 0.0 | |
Coal and lignite | | | 0.5 | | | | 0.0 | |
Crude petroleum and natural gas | | | 5.4 | | | | 0.5 | |
Metal ores | | | 0.7 | | | | 0.0 | |
Other mining and quarrying products | | | 0.1 | | | | 0.1 | |
Food products | | | 4.5 | | | | 4.2 | |
Beverages | | | 0.6 | | | | 0.4 | |
Tobacco products | | | 0.1 | | | | 0.3 | |
Textiles | | | 1.1 | | | | 0.9 | |
Wearing apparel | | | 3.2 | | | | 1.4 | |
Leather and related products | | | 1.4 | | | | 0.7 | |
Wood and of products of wood and cork, except furniture; articles of straw and plaiting materials | | | 0.6 | | | | 0.6 | |
Paper and paper products | | | 1.4 | | | | 1.5 | |
Coke and refined petroleum products | | | 2.0 | | | | 1.0 | |
Chemicals and chemical products | | | 7.6 | | | | 9.0 | |
Basic pharmaceutical products and pharmaceutical preparations | | | 5.2 | | | | 5.9 | |
Rubber and plastic products | | | 2.9 | | | | 3.6 | |
Other non-metallic mineral products | | | 1.1 | | | | 1.2 | |
Basic metals | | | 5.7 | | | | 4.2 | |
Fabricated metal products, except machinery and equipment | | | 2.8 | | | | 3.4 | |
Computer, electronic and optical products | | | 10.9 | | | | 8.6 | |
Electrical equipment | | | 5.8 | | | | 6.5 | |
Machinery and equipment not elsewhere classified | | | 7.8 | | | | 14.4 | |
Motor vehicles, trailers and semi-trailers | | | 11.1 | | | | 18.3 | |
Other transport equipment | | | 3.2 | | | | 4.5 | |
Furniture | | | 1.2 | | | | 0.8 | |
Energy | | | 0.1 | | | | 0.2 | |
Other goods | | | 10.1 | | | | 6.9 | |
| | | | | | | | |
Total | | | 100.0 | | | | 100.0 | |
| | | | | | | | |
Source: Statistisches Bundesamt, Fachserie 7, Reihe 1 – 2017 (March 2018), Tables 1.11.1 and 1.11.2; calculation of percentages by KfW based on import and export values in EUR thousands, respectively; figures may not add up to total due to rounding.
G-23
FOREIGN TRADE (SPECIAL TRADE)BY GROUPSOF COUNTRIESAND COUNTRIES (1)
| | | | | | | | | | | | |
| | | 2017 | | | 2016 | | | 2015 | |
| | | (EUR in millions) | |
Exports to: | | | | | | | | | | | | |
Total | | | 1,279,047 | | | | 1,203,833 | | | | 1,193,555 | |
of which: | | | | | | | | | | | | |
United States | | | 111,528 | | | | 106,822 | | | | 113,733 | |
France | | | 105,208 | | | | 101,106 | | | | 102,762 | |
China (2) | | | 86,195 | | | | 76,046 | | | | 71,284 | |
The Netherlands | | | 85,886 | | | | 78,433 | | | | 79,191 | |
United Kingdom | | | 84,365 | | | | 85,939 | | | | 89,018 | |
Italy | | | 65,558 | | | | 61,265 | | | | 57,987 | |
Austria | | | 62,830 | | | | 59,778 | | | | 58,217 | |
Switzerland | | | 54,006 | | | | 50,161 | | | | 49,070 | |
New industrial countries and emerging markets of Asia (3) | | | 53,453 | | | | 51,921 | | | | 51,510 | |
Belgium/Luxembourg | | | 50,042 | | | | 46,931 | | | | 46,196 | |
Spain | | | 43,043 | | | | 40,497 | | | | 38,715 | |
Japan | | | 19,532 | | | | 18,307 | | | | 16,968 | |
| | | |
Imports from: | | | | | | | | | | | | |
Total | | | 1,034,409 | | | | 954,917 | | | | 949,245 | |
of which: | | | | | | | | | | | | |
China (2) | | | 100,452 | | | | 94,172 | | | | 91,930 | |
The Netherlands | | | 91,374 | | | | 83,142 | | | | 87,889 | |
France | | | 64,168 | | | | 65,651 | | | | 66,819 | |
United States | | | 61,067 | | | | 57,968 | | | | 60,217 | |
Italy | | | 55,803 | | | | 51,737 | | | | 49,038 | |
New industrial countries and emerging markets of Asia (3) | | | 50,807 | | | | 42,966 | | | | 42,478 | |
Switzerland | | | 45,709 | | | | 43,896 | | | | 42,089 | |
Belgium/Luxembourg | | | 44,154 | | | | 40,960 | | | | 40,116 | |
Austria | | | 41,236 | | | | 38,543 | | | | 37,250 | |
United Kingdom | | | 37,140 | | | | 35,654 | | | | 38,414 | |
Spain | | | 31,671 | | | | 27,870 | | | | 26,442 | |
Japan | | | 22,901 | | | | 21,922 | | | | 20,180 | |
| (1) | Exports (f.o.b.) by country of destination, imports (c.i.f.) by country of origin. Special trade consists mainly of goods that are imported into the Federal Republic for use, consumption, adaptation or processing, as well as goods that are produced, manufactured, adapted or processed in the Federal Republic and subsequently exported. |
| (3) | Includes Brunei Darussalam, Hong Kong, Indonesia, Malaysia, Philippines, Singapore, South Korea, Taiwan and Thailand. |
Source: Deutsche Bundesbank, Monatsbericht März 2018, Table XII.3.
G-24
Foreign Direct Investment
The following table presents data with respect to foreign direct investment stocks at year-end 2015.
FOREIGN DIRECT INVESTMENT STOCKSAT YEAR-END 2015
| | | | | | | | |
| | | Outward (1) | | | Inward (2) | |
| | | (EUR in billions) | |
Total (3) | | | 1,034.1 | | | | 465.9 | |
Selected countries and regions | | | | | | | | |
European Union | | | 429.8 | | | | 356.0 | |
of which: European Monetary Union | | | 193.9 | | | | 296.2 | |
of which: United Kingdom | | | 121.3 | | | | 38.7 | |
Switzerland | | | 34.1 | | | | 34.7 | |
Russia | | | 15.8 | | | | 3.5 | |
United States | | | 290.4 | | | | 28.1 | |
Canada | | | 14.8 | | | | 1.0 | |
Central America | | | 20.4 | | | | 4.0 | |
South America | | | 28.5 | | | | 0.2 | |
Asia | | | 144.6 | | | | 29.2 | |
of which: China | | | 69.6 | | | | 2.2 | |
of which: Japan | | | 11.6 | | | | 18.6 | |
Australia | | | 18.7 | | | | 1.2 | |
Africa | | | 8.6 | | | | 0.0 | |
Selected economic sectors of investment object | | | | | | | | |
Manufacturing | | | 365.1 | | | | 114.7 | |
of which: Chemicals and chemical products | | | 82.7 | | | | 14.0 | |
of which: Machinery and equipment | | | 34.8 | | | | 17.7 | |
of which: Motor vehicles, trailers and semi-trailers | | | 92.9 | | | | -0.2 | |
Electricity, gas, steam and air conditioning supply | | | 41.3 | | | | 16.5 | |
Wholesale and retail trade; repair of motor vehicles and motor cycles | | | 166.5 | | | | 53.6 | |
Information and communication | | | 58.1 | | | | 49.0 | |
Financial and insurance activities | | | 286.8 | | | | 163.3 | |
Real estate activities | | | 30.8 | | | | 30.9 | |
Professional, scientific and technical activities | | | 17.0 | | | | 13.1 | |
| | | | | | | | |
| (1) | German foreign direct investment abroad. |
| (2) | Foreign direct investment in Germany. |
| (3) | Primary and secondary direct investment (consolidated). |
Source: Deutsche Bundesbank, Bestandserhebung über Direktinvestitionen, Statistische Sonderveröffentlichung 10 (April 2017), Tables 1.2.a, I.2. c, II.2.a, II.2.b.
G-25
MONETARY AND FINANCIAL SYSTEM
The ESCB and the Eurosystem
The ESCB comprises the ECB and the national central banks of the Member States, while the Eurosystem consists of the ECB and the national central banks of the Euro Area Member States.
The Eurosystem is responsible for the single monetary policy for the euro area. Its decision-making bodies are the Governing Council and the Executive Board of the ECB. The national central banks of the Member States that are not part of the Eurosystem are represented in the General Council of the ECB, but have no voting right in the decision-making process, particularly with respect to monetary policy. The ESCB’s primary objective is to maintain price stability. Without prejudice to this objective, the ESCB supports the general economic policies of the EU.
The Deutsche Bundesbank – Germany’s national central bank within the ESCB – has the responsibility of implementing the single monetary policy in Germany and continues to perform various other tasks, including operating cashless payment systems, cash management and playing an important role in banking and financial market supervision, as further described below under the caption “—Financial System.”
Sources: European Central Bank, Annual Report 2016, pages 101-107 (http://www.ecb.europa.eu/pub/pdf/annrep/ar2016en.pdf); European Central Bank, About, Organisation: ECB, ESCB and the Eurosystem (https://www.ecb.europa.eu/ecb/orga/escb/html/index.en.html); Deutsche Bundesbank, Tasks (http://www.bundesbank.de/Navigation/EN/Tasks/tasks.html).
Monetary Policy Instruments of the ESCB
To achieve its operational goals, the ESCB conducts open market operations, offers standing facilities and requires credit institutions to maintain minimum reserves in accounts with the ESCB. Open market operations play an important role in the ESCB’s monetary policy for the purposes of steering interest rates and managing the liquidity situation in the market. Available open market operations are reverse transactions, outright transactions, the issuance of debt certificates or foreign exchange swaps, and the collection of fixed-term deposits. Standing facilities are designed to provide or absorb overnight liquidity, and the imposition of minimum reserve requirements allows the ESCB to stabilize money market interest rates, create (or enlarge) a structural liquidity shortage and possibly contribute to the control of monetary expansion. The ESCB has employed a variety of non-standard policy instruments in response to the global economic and financial crisis and the European sovereign debt crisis. For further information, see “—Financial System—European Financial System—Recent Policy Responses to the Global Financial and Economic Crisis.”
Source: European Central Bank, Monetary Policy: The Eurosystem’s Instruments (https://www.ecb.europa.eu/mopo/implement/html/index.en.html).
Monetary Policy Strategy and Prices
The ECB’s primary goal is to maintain medium-term price stability, which is defined as a year-on-year increase in the harmonized index of consumer prices for the euro area of less than 2%. However, the ECB has clarified that, within this definition, it aims at an inflation rate close to 2%. This goal indicates the commitment to provide an adequate margin to avoid the risk of deflation. The stability-oriented monetary policy strategy of the Eurosystem used by the ECB to achieve this goal is based on two pillars: (1) analysis and assessment of short- to medium-term risks to price stability (economic analysis); and (2) assessment of medium- to long-term monetary developments (monetary analysis).
Source: European Central Bank, Monetary Policy: Strategy (https://www.ecb.europa.eu/mopo/strategy/html/index.en.html).
G-26
The following table shows price trends in Germany for the periods indicated.
PRICE TRENDS
| | | | | | | | | | | | | | | | | | | | |
| | | 2017 | | | 2016 | | | 2015 | | | 2014 | | | 2013 | |
| | | (change from previous year in %) | |
Harmonized index of consumer prices (HICP) | | | 1.7 | | | | 0.4 | | | | 0.1 | | | | 0.8 | | | | 1.6 | |
Consumer price index (CPI) | | | 1.8 | | | | 0.5 | | | | 0.3 | | | | 0.9 | | | | 1.5 | |
Index of producer prices of industrial products sold on the domestic market (1) | | | 2.6 | | | | -1.7 | | | | -1.8 | | | | -1.0 | | | | -0.1 | |
| (1) | Excluding value-added tax. |
Sources: Statistisches Bundesamt, Verbraucherpreise, Harmonisierter Verbraucherpreisindex, Veränderungsraten zum Vorjahr in % (https://www.destatis.de/DE/ZahlenFakten/GesamtwirtschaftUmwelt/Preise/Verbraucherpreisindizes/Tabellen_/HarmonisierterVerbraucherpreisindex.html?cms_gtp=146602_list%253D2%2526146598_slot%253D2&https=1); Statistisches Bundesamt, Verbraucherpreisindizes, Harmonisierter Verbraucherpreisindex für Deutschland, Veränderungsraten zum Vorjahr in % (https://www.destatis.de/DE/ZahlenFakten/GesamtwirtschaftUmwelt/Preise/Verbraucherpreisindizes/Tabellen_/VerbraucherpreiseKategorien.html?cms_gtp=145114_list%253D2%2526145110_slot%253D2&https=1); Deutsche Bundesbank, Monatsbericht Februar 2018, Table XI.7.
Official Foreign Exchange Reserves
The following table shows the breakdown of the Federal Republic’s official foreign exchange reserves as of the end of the years indicated.
OFFICIAL FOREIGN EXCHANGE RESERVESOFTHE FEDERAL REPUBLIC (1)
| | | | | | | | | | | | | | | | | | | | |
| | | As of December 31 | |
| | | 2017 | | | 2016 | | | 2015 | | | 2014 | | | 2013 | |
| | | (EUR in millions) | |
Gold | | | 117,347 | | | | 119,253 | | | | 105,792 | | | | 107,475 | | | | 94,876 | |
Cash, deposits and securities investments | | | 31,215 | | | | 34,993 | | | | 33,423 | | | | 30,646 | | | | 28,080 | |
Special drawing rights | | | 13,987 | | | | 14,938 | | | | 15,185 | | | | 14,261 | | | | 12,837 | |
Reserve position in the IMF | | | 4,294 | | | | 6,581 | | | | 5,132 | | | | 6,364 | | | | 7,961 | |
| | | | | | | | | | | | | | | | | | | | |
Total | | | 166,842 | | | | 175,765 | | | | 159,532 | | | | 158,745 | | | | 143,753 | |
| | | | | | | | | | | | | | | | | | | | |
| (1) | External position of the Deutsche Bundesbank in the EMU. Assets and liabilities vis-à-vis all EMU member countries and non-EMU member countries. |
Source: Deutsche Bundesbank, Monatsbericht Februar 2018, Table XII.8.
The Federal Republic’s foreign reserve assets are managed by the Deutsche Bundesbank. The Euro Area Member States have transferred foreign reserve assets to the ECB in an aggregate amount equivalent to approximately EUR 40.8 billion, consisting of foreign currency reserves and gold. The ECB manages the foreign reserve assets transferred to it. The foreign reserve assets not transferred to the ECB continue to be held and managed by the national central banks of the Euro Area Member States. In order to ensure consistency within the single monetary and foreign exchange policies of the EMU, the ECB monitors and coordinates market transactions conducted with those assets.
Sources: European Central Bank, Annual Report 1998, page 74 (http://www.ecb.int/pub/pdf/annrep/ar1998en.pdf); European Central Bank, Annual Accounts 2016, page 20 (https://www.ecb.europa.eu/pub/pdf/annrep/ar2016annualaccounts_en.pdf).
G-27
External Positions of Banks
The following table shows the external assets and liabilities of the Deutsche Bundesbank and the banks (monetary financial institutions) of the Federal Republic as of the end of each of the years indicated.
EXTERNAL FINANCIAL ASSETSAND LIABILITIESBY SECTOR
| | | | | | | | | | | | | | | | | | | | |
| | | 2017 | | | 2016 | | | 2015 | | | 2014 | | | 2013 | |
| | | (EUR in billions) | |
Deutsche Bundesbank | | | | |
Assets | | | 1,142.8 | | | | 990.5 | | | | 800.7 | | | | 678.8 | | | | 721.7 | |
of which: clearing accounts within ESCB (1) | | | 906.9 | | | | 754.3 | | | | 584.2 | | | | 460.8 | | | | 510.2 | |
Liabilities (2) | | | 675.3 | | | | 592.7 | | | | 481.8 | | | | 396.3 | | | | 401.5 | |
| | | | | | | | | | | | | | | | | | | | |
Net position | | | 467.6 | | | | 397.7 | | | | 318.9 | | | | 282.5 | | | | 320.2 | |
Banks | | | | | | | | | | | | | | | | | | | | |
Loans to foreign banks | | | 963.8 | | | | 1,055.9 | | | | 1,066.9 | | | | 1,125.2 | | | | 1,019.7 | |
Loans to foreign non-banks | | | 723.9 | | | | 756.2 | | | | 751.5 | | | | 735.1 | | | | 701.0 | |
Deposits and loans from foreign banks | | | 659.0 | | | | 696.1 | | | | 611.9 | | | | 609.2 | | | | 515.7 | |
Deposits and loans from foreign non-banks | | | 241.2 | | | | 206.2 | | | | 201.1 | | | | 221.0 | | | | 257.8 | |
| (1) | Consists mainly of net claims from the interbank payment system for the real-time processing of cross-border transfers throughout the EMU (TARGET2). |
| (2) | Including estimates of currency in circulation abroad. |
Source: Deutsche Bundesbank, Monatsbericht März 2018, Tables IV.4 and XII.8.
Foreign Exchange Rates and Controls
The euro is a freely convertible currency. Since its introduction in 1999, the euro has become the second most widely used currency internationally. Currency transactions do not require licenses or other permissions. Capital market transactions are not subject to any license or similar requirements. Gold may be imported and exported freely, subject only to the levy of VAT on some transactions.
Sources: International Monetary Fund, Selected Decisions and Selected Documents of the IMF, Thirty-Ninth Issue—Freely Usable Currencies, Prepared by the Legal Department of the IMF, As updated as of March 31, 2017 (https://www.imf.org/external/pubs/ft/sd/index.asp?decision=11857-(98/130)); Bank for International Settlements, Triennial Central Bank Survey, Foreign exchange turnover in April 2016, September 2016, Annex tables revised on 11 December 2016 (http://www.bis.org/publ/rpfx16fx.pdf).
The following table shows the annual average exchange rates for selected currencies in relation to the euro for the years indicated.
ANNUAL AVERAGE EXCHANGE RATESOFTHE EURO (1)
| | | | | | | | | | | | | | | | | | | | |
| | | 2017 | | | 2016 | | | 2015 | | | 2014 | | | 2013 | |
U.S. dollars per euro | | | 1.1297 | | | | 1.1069 | | | | 1.1095 | | | | 1.3285 | | | | 1.3281 | |
Pound sterling per euro | | | 0.87667 | | | | 0.81948 | | | | 0.72584 | | | | 0.80612 | | | | 0.84926 | |
Japanese yen per euro | | | 126.71 | | | | 120.20 | | | | 134.31 | | | | 140.31 | | | | 129.66 | |
Swiss franc per euro | | | 1.1117 | | | | 1.0902 | | | | 1.0679 | | | | 1.2146 | | | | 1.2311 | |
Chinese yuan per euro | | | 7.6290 | | | | 7.3522 | | | | 6.9733 | | | | 8.1857 | | | | 8.1646 | |
| (1) | Calculated from daily values. |
Source: Deutsche Bundesbank, Monatsbericht Februar 2018, Table XII.10.
Financial System
German Financial System
Overview. As of January 31, 2018, 1,627 monetary financial institutions in Germany reported an aggregate balance sheet total of EUR 7,861.8 billion to the Deutsche Bundesbank. According to the Deutsche Bundesbank’s classification, these institutions included:
| | • | | 264 commercial banks, with an aggregate balance sheet total of EUR 3,203.5 billion; |
| | • | | 386 savings banks, with an aggregate balance sheet total of EUR 1,196.4 billion; |
G-28
| | • | | the eight regional institutions of those savings banks, including DekaBank Deutsche Girozentrale (the central asset managing institution of the German savings banks) and seven Landesbanken (German public law financial institutions traditionally focusing on the banking business for and in the Land in which they operate), with an aggregate balance sheet total of EUR 893.6 billion; |
| | • | | 19 special-purpose credit institutions, including KfW, KfW IPEX-Bank, promotional banks of the federal states (Landesförderinstitute), and, since July 2016, DZ BANK AG Deutsche Zentral-Genossenschaftsbank, Frankfurt am Main (DZ Bank), the only remaining central institution of German credit cooperatives, with an aggregate balance sheet total of EUR 1,223.0 billion; |
| | • | | 917 credit cooperatives, with an aggregate balance sheet total of EUR 889.1 billion; |
| | • | | 13 mortgage banks, with an aggregate balance sheet total of EUR 225.9 billion; |
| | • | | 20 building and loan associations, with an aggregate balance sheet total of EUR 230.2 billion; and |
| | • | | 142 subsidiaries and branches of foreign banks located in the Federal Republic with an aggregate balance sheet total of EUR 1,149.0 billion. These institutions, which are majority-owned by foreign banks, are also included in the totals of the other categories of banks listed above. |
Source: Deutsche Bundesbank, Monatsbericht März 2018, Table IV.2.
The German Banking Act (Kreditwesengesetz, or “KWG”) currently regulates all banks except for the Deutsche Bundesbank and KfW (although it does regulate KfW IPEX-Bank). Many important provisions of the KWG have become applicable by analogy to KfW with effect from January 1, 2016. German commercial banking institutions operate as “universal” banks and are not restricted by law or otherwise from offering a complete range of diverse financial services.
Supervision. The Federal Financial Supervisory Authority (Bundesanstalt für Finanzdienstleistungsaufsicht, or “BaFin”) is responsible for the integrated supervision of financial services. Its primary objective is to ensure the proper functioning, stability and integrity of Germany as a financial center in the context of European integration and international cooperation, as well as to strengthen collective consumer protection through its regulatory actions. The BaFin, which is subject to the legal and technical oversight of the Federal Ministry of Finance, operates exclusively in the public interest. It helps to ensure the ability of banks, financial services institutions and insurance companies to meet their payment obligations (solvency supervision), and it also enforces standards of professional conduct aimed at preserving investors’ trust in the financial markets (market supervision). In addition, the BaFin has an investor protection role in that it seeks to prevent unauthorized financial business from being carried out.
The Deutsche Bundesbank is closely involved in the ongoing supervision of credit institutions by the BaFin and has been assigned a substantial number of the ongoing operational tasks in banking supervision. Furthermore, the German Federal Agency for Financial Market Stabilization (Bundesanstalt für Finanzmarktstabilisierung, or “FMSA”) supervises two wind-up institutions, Erste Abwicklungsanstalt and FMS Wertmanagement, as well as Portigon AG (the legal successor of former Landesbank West LB which is in the process of being wound-up), all of which were founded under its auspices in order to stabilize the financial market (see “—Wind-up Institutions”).
In November 2014, the Single Supervisory Mechanism (“SSM”) – as one of the pillars of the European banking union – became operational. Under the SSM, the ECB is the central prudential supervisor of financial institutions in the euro area as well as in non-euro EU countries that choose to join the SSM. The ECB directly supervises the largest banks, while the national supervisors continue to monitor the remaining banks. The ECB and the national supervisors work closely together to ensure the banks’ compliance with EU banking regulations and to be able to address issues early on.
In order to facilitate the timely identification of risks to financial stability, the Financial Stability Commission (Ausschuss für Finanzstabilität), which consists of representatives of the Federal Ministry of Finance, the Deutsche Bundesbank, and BaFin, was established in March 2013. Due to its macroeconomic and financial market expertise, the Deutsche Bundesbank is responsible for contributing towards safeguarding financial stability and tasked with analyzing all relevant factors in order to identify threats to financial stability. Warnings or recommendations for corrective measures are submitted to the Financial Stability Commission, which may pass resolutions with respect thereto. In addition, the Financial Stability Commission is tasked with defining concerted reactions to emerging threats to financial stability by issuing warnings and recommendations and publishing them if appropriate. The recipients of such warnings or recommendations are obliged to report on the implementation of corrective measures.
Sources: Bundesministerium der Justiz, Gesetz über das Kreditwesen (http://www.gesetze-im-internet.de/kredwg/index.html); Bundesanstalt für Finanzdienstleistungsaufsicht, BaFin, Functions & history (https://www.bafin.de/EN/DieBaFin/AufgabenGeschichte/aufgabengeschichte_node_en.html); Deutsche Bundesbank and Bundesanstalt für Finanzdienstleistungsaufsicht, Joint press release of November 4, 2002 (http://www.bundesbank.de/Redaktion/EN/Downloads/Press/Pressenotizen/2002/2002_11_04_banking_supervision.pdf? blob=publicationFile); Bundesanstalt für Finanzdienstleistungsaufsicht, Aufsichtsrichtlinie—Richtlinie zur Durchführung und Qualitätssicherung der laufenden Überwachung der Kredit- und Finanzdienstleistungsinstitute durch die Deutsche Bundesbank (Aufsichtsrichtlinie), May 21, 2013, altered on December 19, 2016
G-29
(https://www.bafin.de/SharedDocs/Veroeffentlichungen/DE/Aufsichtsrecht/Richtlinie/rl_130521_aufsichtsrichtlinie.html); BaFin, Act on the Strengthening of German Financial Supervision, January 18, 2013 (https://www.bafin.de/SharedDocs/Veroeffentlichungen/EN/Fachartikel/2013/fa_bj_2013_01_finstabg_en.html); Bundesanstalt für Finanzmarktstabilisierung (FMSA): Federal Agency for Financial Market Stabilisation (https://www.fmsa.de/en/); Portigon AG: Unternehmensinformationen (http://www.portigon-ag.de/acm/cm/content/portigon/i/de/portigon-ag/unternehmensinformationen.html); Bundesbank, German macroprudential oversight strengthened, press release of March 18, 2013 (http://www.bundesbank.de/Redaktion/EN/Pressemitteilungen/BBK/2013/2013_03_18_macropudential_oversight.html); European Commission: Single supervisory mechanism (https://ec.europa.eu/info/business-economy-euro/banking-and-finance/banking-union/single-supervisory-mechanism_en).
Bank Recovery and Resolution. Between January 1, 2015, and December 31, 2017, FMSA (see “—Supervision”) acted as the German national resolution authority for banks. FMSA was thus responsible for the recovery and resolution of all banks in Germany under the European Bank Recovery and Resolution Directive (“BRRD”) which were not directly supervised by the ECB within the framework of the Single Supervisory Mechanism (“SSM”, see “—European Financial System—European System of Financial Supervision and European Banking Union”). The BRRD was adopted in May 2014 to provide authorities with comprehensive and effective arrangements to deal with failing banks at the national level and with cooperation arrangements to tackle cross-border banking failures. The BRRD includes rules to set up national resolution funds, which must be established by each EU Member State, and it requires banks to prepare recovery plans to overcome financial distress.
On January 1, 2018, FMSA’s duties deriving from its role as the national resolution authority were integrated into the Federal Financial Supervisory Authority (BaFin) as a new and independently operating division. At the same time, FMSA’s responsibilities of administering and managing the Financial Market Stabilisation Fund (“Sondervermögen Finanzmarktstabilisierungsfonds,” or “FMS”) were incorporated into the Federal Republic of Germany – Finance Agency (Bundesrepublik Deutschland – Finanzagentur GmbH). The FMS was originally created during the financial crisis on October 17, 2008. Until the Single Resolution Mechanism (“SRM”) became fully operational on January 1, 2016, and functionally replaced the FMS, the latter was responsible for stabilizing German banks by extending guarantees covering the banks’ securities and by granting loans. The stabilization measures provided by the FMS amounted to EUR 14.6 billion in capital injections, while loss compensation payments made to FMS Wertmanagement totaled EUR 9.3 billion.
For more information on the SRM, see “—European Financial System—European System of Financial Supervision and European Banking Union.”
Sources: Deutsche Bundesbank, Glossary: Restructuring Act (https://www.bundesbank.de/Navigation/EN/Service/Glossary/Functions/glossary.html?lv2=129546&lv3=145952#145952.de); European Commission: Bank recovery and resolution (https://ec.europa.eu/info/business-economy-euro/banking-and-finance/financial-supervision-and-risk-management/managing-risks-banks-and-financial-institutions/bank-recovery-and-resolution_en); Bundesministerium der Finanzen, Wirtschaft und Verwaltung, Was macht die Bundesanstalt für Finanzmarktstabilisierung? Neue Aufgaben der FMSA zur Stabilisierung des Finanzsektors, September 20, 2010 (http://www.bundesfinanzministerium.de/Content/DE/Standardartikel/Themen/Internationales_Finanzmarkt/Finanzmarktpolitik/Bankenabgabe/2010-09-17-FMSA.html); Bundesministerium der Finanzen, German government moves forward with package of measures for European banking union, press release of July 9, 2014 (http://www.bundesfinanzministerium.de/Content/EN/Pressemitteilungen/2014/2014-07-09-package-of-measures-for-european-banking-union.html); Bundesministerium der Finanzen, Verordnung über die Erhebung der Beiträge zum Restrukturierungsfonds für Kreditinstitute (Restrukturierungsfonds-Verordnung—RStruktFV) (http://www.bundesfinanzministerium.de/Content/DE/Gesetzestexte/Gesetze_Verordnungen/2015-07-22-RStruktFV.html); Gesetz zur Neuordnung der Aufgaben der Bundesanstalt für Finanzmarktstabilisierung (FMSA-Neuordnungsgesetz—FMSANeuOG) (http://www.bundesfinanzministerium.de/Content/DE/Gesetzestexte/Gesetze_Verordnungen/2016-12-28-FMSANeuOG.html); Federal Agency for Financial Market Stabilisation: History (https://www.fmsa.de/en/history/);Bundesrepublik Deutschland – Finanzagentur GmbH, Financial Market Stabilisation, Financial Market Stabilisation Fund (FSM) (https://www.deutsche-finanzagentur.de/en/financialmarketstabilisation/);Federal Financial Supervisory Authority (BaFin): Recovery and resolution (https://www.bafin.de/EN/Aufsicht/BankenFinanzdienstleister/Massnahmen/SanierungAbwicklung/sanierung_abwicklung_node_en.html).
Wind-up Institutions. In the wake of the global financial crisis, two wind-up institutions (Abwicklungsanstalten) for troubled German banks were established. The first wind-up institution, Erste Abwicklungsanstalt, was established in December 2009 to liquidate a portfolio of EUR 77.5 billion assumed from WestLB. It assumed a second portfolio consisting of an asset portfolio worth EUR 72.3 billion and a trading portfolio with a market value of around EUR 52.1 billion following the restructuring of WestLB. As of December 31, 2017, the combined asset portfolios had been reduced to approximately EUR 40 billion.
The second wind-up institution, FMS Wertmanagement, assumed a portfolio of EUR 175.7 billion from Hypo Real Estate Group in October 2010 to support restructuring efforts. In December 2014, FMS Wertmanagement acquired DEPFA Bank plc, which, as of December 31, 2013, had consolidated total assets amounting to EUR 49.1 billion from Hypo Real Estate Holding AG. DEPFA will have to be wound down in accordance with an EU state aid decision of July 18, 2011. As of December 31, 2017, FMS Wertmanagement’s portfolio had been reduced to EUR 76.8 billion.
Sources: Bundesministerium der Justiz, Gesetz über das Kreditwesen (http://www.gesetze-im-internet.de/kredwg/index.html); Bundesanstalt für Finanzdienstleistungsaufsicht, BaFin, Functions & history (https://www.bafin.de/EN/DieBaFin/AufgabenGeschichte/aufgabengeschichte_node_en.html); Deutsche Bundesbank and Bundesanstalt für Finanzdienstleistungsaufsicht, Joint press release of November 4, 2002 (http://www.bundesbank.de/Redaktion/EN/Downloads/Press/Pressenotizen/2002/2002_11_04_banking_supervision.pdf? blob=publicationFile); Bundesanstalt für Finanzdienstleistungsaufsicht, Aufsichtsrichtlinie—Richtlinie zur Durchführung und Qualitätssicherung der laufenden Überwachung der Kredit- und Finanzdienstleistungsinstitute durch die Deutsche Bundesbank (Aufsichtsrichtlinie), May 21, 2013, altered on December 19, 2016 (https://www.bafin.de/SharedDocs/Veroeffentlichungen/DE/Aufsichtsrecht/Richtlinie/rl_130521_aufsichtsrichtlinie.html); BaFin, Act on the Strengthening of German Financial Supervision, January 18, 2013 (https://www.bafin.de/SharedDocs/Veroeffentlichungen/EN/Fachartikel/2013/fa_bj_2013_01_finstabg_en.html); Bundesanstalt für Finanzmarktstabilisierung (FMSA): Federal Agency for Financial Market Stabilisation (https://www.fmsa.de/en/); Portigon AG: Unternehmensinformationen (http://www.portigon-ag.de/acm/cm/content/portigon/i/de/portigon-ag/unternehmensinformationen.html); Bundesbank, German macroprudential oversight strengthened, press release of March 18, 2013
G-30
(http://www.bundesbank.de/Redaktion/EN/Pressemitteilungen/BBK/2013/2013_03_18_macropudential_oversight.html); European Commission: Single supervisory mechanism (https://ec.europa.eu/info/business-economy-euro/banking-and-finance/banking-union/single-supervisory-mechanism_en); Erste Abwicklungsanstalt, Annual Report 2017 (https://www.aa1.de/index.php?eID=tx_nawsecuredl&u=0&g=0&t=1535186841&hash=08f9cc7a5e60484e776333ce763440dea3e702dc&file=/fileadmin/content/downloads/2_Finanzen/GB-2017_en.pdf); FMS Wertmanagement AöR, FMS Wertmanagement achieves a further reduction in the portfolio and an increase in profit, press release of April 10, 2018 (https://www.fms-wm.de/en/press/333-fms-wertmanagement-achieves-a-further-reduction-in-the-portfolio-and-an-increase-in-profit).
European Financial System
European System of Financial Supervision and European Banking Union. The European system of financial supervisors became operational on January 1, 2011. At the macro-financial level, a European Systemic Risk Board (“ESRB”) was established, which provides macro-prudential oversight of the financial system. The ESRB’s role is to monitor and assess potential risks to the stability of the financial system. If necessary, it will issue risk warnings and recommendations for remedial action and will monitor their implementation. The ESRB is currently chaired by the President of the ECB.
At the micro-financial level, three supervisory authorities were established:
| | • | | the European Banking Authority (“EBA”); |
| | • | | the European Insurance and Occupational Pensions Authority; and |
| | • | | the European Securities and Markets Authority. |
The three European Supervisory Authorities (“ESAs”) cooperate with the supervisory authorities of the Member States. National authorities are responsible for the day-to-day supervision of individual financial institutions, whereas the ESAs are responsible for ensuring that a single set of harmonized rules and consistent supervisory practices are applied by supervisory authorities of the Member States. The ESAs have, for example, the power to settle disputes among national financial supervisors by imposing legally binding mediation and to impose temporary bans on risky financial products or activities.
One of the key elements of Europe’s banking union, which was established in the wake of the European sovereign debt crisis, is the SSM composed of the ECB and the national supervisory authorities of participating Member States. The SSM’s main aims are to contribute to the safety and soundness of credit institutions and the stability of the European financial system and to ensure consistent supervision. The SSM became operational in November 2014. In its role within the SSM, the ECB directly supervises 118 significant banks and banking groups, which represent almost 82% of the total assets on the aggregated balance sheets of all credit institutions under its supervision. For the remaining banks, the ECB is responsible for setting and monitoring the supervisory standards and for working closely with the national competent authorities in the supervision of these banks.
Another key element of Europe’s banking union is the SRM which was established by a regulation adopted in July 2014 and has become fully operational starting January 1, 2016 with the purpose of ensuring the orderly resolution of failing banks. The SRM consists of a single resolution board (“SRB”), which has broad powers in cases of bank resolution, and the Single Resolution Fund (“SRF”). The SRB is responsible for the planning and resolution phases of cross-border banks and those directly supervised by the ECB, while since January 1, 2015 national resolution authorities are responsible for all other banks under the BRRD. However, the SRB will always be responsible if the resolution of a bank requires access to the SRF. The SRF is being built up over a period of eight years from 2016 to 2023 to reach a target level of at least 1% of the amount of covered deposits of all credit institutions authorized in all the participating Member States (estimated in 2014 to be approximately EUR 55 billion by the end of 2023). Banks will have to make annual contributions to the SRF calculated on the basis of their liabilities, excluding own funds and covered deposits, and adjusted for risk. Companies defined in article 2 paragraph 5 of the EU Capital Requirements Directive IV (“CRD IV”) are not required to contribute to the fund. In the aggregate, the European Commission estimates that the German banking sector is required to contribute just under EUR 15.5 billion to the SRF by 2023. During the transitional period each participating Member State is providing an individual national credit line to the SRB to back its banks’ contributions to the SRF in the event of possible funding shortfalls following resolution cases of its banks. By now all 19 participating Member States have signed the Loan Facility Agreements with the SRB which are the basis for the bridge financing in the form of national credit lines to the SRB. The maximum aggregate amount of the credit lines of the participating Member States will amount to around EUR 55 billion. The repartition key among Member States corresponds to the contributions to the SRF, which will be made by banks in each Member State by 2023.
In November 2015, the European Commission proposed a European Deposit Insurance Scheme (“EDIS”) as an additional element of the European banking union. Since then, work on a technical level has continued. Negotiations on a political level will start as soon as sufficient further progress has been made on the measures on risk reduction, as mentioned in the Roadmap, adopted by the Council on June 17, 2016. In a communication of October 11, 2017 regarding the completion of the Banking Union, the European Commission suggested discussing the introduction of EDIS more gradually than originally proposed in November 2015 to give new impetus to the negotiations on EDIS. To date, the EU has agreed on common rules to harmonize the national deposit insurance schemes.
G-31
In response to the global economic and financial crisis, regulatory authorities and central banks launched a comprehensive regulatory reform program. As a result, in December 2010, the Basel Committee on Banking Supervision launched a package of new standards on bank capital adequacy and liquidity to enhance the banking regulatory framework. The capital and liquidity reform package, typically referred to as Basel III, will be phased in by 2019. In order to transpose the Basel III agreement into EU law, previous EU capital requirement directives were replaced by the Capital Requirements Regulation (CRR), a regulation establishing prudential requirements, and CRD IV, a directive governing access to deposit-taking activities, both of which entered into force on January 1, 2014 and have since been gradually implemented in the Member States.
In November 2016, the European Commission published proposals which aim to further strengthen the resilience of banks, ensure an efficient and orderly resolution process and enhance financial stability in the EU. They also aim to align the EU’s banking union rules with a number of elements agreed at the international level, in particular, the standards agreed within the Basel Committee on Banking Supervision and by the Financial Stability Board. The amendments are designed to update the capital requirements for banks and make these rules less complex and burdensome for smaller banks, as well as to improve the capacity of credit institutions to support the economy. In December 2016 the Council of the European Union started working on these proposals, and in June 2017 it agreed on a negotiating position regarding them. Negotiations with the European Parliament will follow once the Parliament has agreed its own negotiating stance.
Sources: European Commission, European system of financial supervision (https://ec.europa.eu/info/business-economy-euro/banking-and-finance/financial-supervision-and-risk-management/european-system-financial-supervision_en); European Commission, Banking Union (https://ec.europa.eu/info/business-economy-euro/banking-and-finance/banking-union_en); Council of the European Union, Banking Union (http://www.consilium.europa.eu/en/policies/banking-union/); Deutsche Bundesbank, Service, Schule und Bildung, Schülerbuch Geld und Geldpolitik digital, Das Banken und Finanzsystem: Sicherung der Stabilität des Finanzsystems (https://www.bundesbank.de/Redaktion/DE/Dossier/Service/schule_und_bildung_kapitel_4.html?notFirst=true&docId=147562#chap); European Central Bank, ECB assumes responsibility for euro area banking supervision, press release of November 4, 2014 (http://www.ecb.europa.eu/press/pr/date/2014/html/pr141104.en.html); European Central Bank, Banking Supervision, Single Supervisory Mechanism (https://www.bankingsupervision.europa.eu/about/thessm/html/index.en.html); European Commission, Single Resolution Mechanism to come into effect for the Banking Union, press release of December 31, 2015 (http://europa.eu/rapid/press-release_IP-15-6397_en.htm); Deutsche Bundesbank, Compromise reached over resolution fund, article dated December 22, 2014 (https://www.bundesbank.de/Redaktion/EN/Topics/2014/2014_12_22_compromise_reached_resolution_fund.html); Single Resolution Board, Single Resolution Fund: What is the Single Resolution Fund? (https://srb.europa.eu/en/content/single-resolution-fund); Banking Union – Single Resolution Board completes signature of Loan Facility Agreements with all 19 participating Member States, February 8, 2017 (https://srb.europa.eu/en/node/196); European Banking Authority, Implementing Basel III in Europe: CRD IV Package (http://www.eba.europa.eu/regulation-and-policy/implementing-basel-iii-europe); Council of the European Union, Banking Union, Amendments to the banking union rules (http://www.consilium.europa.eu/en/policies/banking-union/2016-amendments); European Commission, Communication from the Commission: Completing the banking union, first published on October 11, 2017 (https://ec.europa.eu/info/publications/171011-communication-banking-union_en).
Recent Policy Responses to the Global Financial and Economic Crisis. In response to the tensions in the financial markets and the loss of confidence in the financial sector in the wake of the global financial and economic crisis, a number of measures were taken at the EU level in recent years to restore confidence in the financial sector and prevent market disruptions. These measures were, or continue to be, mainly directed at preserving adequate capitalization of financial institutions, at enhancing credit support measures to improve bank lending and liquidity in the euro area money market, at safeguarding the flow of credit from financial institutions to the real economy and, most recently, at addressing the risk of a prolonged period of low inflation. A central role was, and continues to be, played by the ECB, which introduced a number of non-standard monetary policy measures, including, among others, asset purchase programs, long-term refinancing operations and measures aimed at increasing collateral availability. These measures are unprecedented in nature, scope and magnitude and aim to safeguard the primary objective of price stability and ensure an appropriate monetary policy transmission mechanism.
In September 2012, the ECB announced Outright Monetary Transactions in secondary markets for euro-denominated sovereign bonds in the euro area aimed at enabling the ECB to address severe distortions in government bond markets. In June 2014, the ECB announced several measures designed to enhance the functioning of the monetary policy transmission mechanism by supporting lending to the real economy. In particular, the ECB decided to conduct a series of eight targeted longer-term refinancing operations (“TLTROs”) between September 2014 and June 2016. These TLTROs were aimed at improving bank lending to the euro-area non-financial private sector (defined as euro-area households and non-financial corporations), excluding loans to households for house purchases. The last operation of this series of TLTROs was successfully conducted and settled in June 2016. All these TLTROs will mature in September 2018.
In addition, the ECB seeks to provide monetary stimulus to the economy through its asset purchase program which was launched in October 2014 and significantly expanded in March 2015. This program is being conducted to further ease monetary and financial conditions in a context where key ECB interest rates are at their lower bound. Since mid-2016, it has consisted of four elements: a covered bond purchase program, an asset-backed securities purchase program, a public sector purchase program and a corporate sector purchase program. Monthly purchases of public and private sector securities are currently intended to amount to EUR 30 billion. The ECB has repeatedly announced that it intends to carry out these purchases at least until September 2018 and, in any case, until it sees a sustained adjustment in the path of inflation that is consistent with its aim of achieving inflation rates below, but close to 2% over the medium term.
G-32
Furthermore, the ECB conducted four additional TLTROs with four-year maturities (“TLTROs II”) on a quarterly basis from June 2016 to March 2017. Counterparties exceeding an ECB-defined lending benchmark until January 2018 may borrow at an interest rate that can be as low as the interest rate on the deposit facility prevailing at the time of allotment. Since the interest rate on the deposit facility stood below zero at the time of the allotments of all TLTROs II, this means that counterparties would, in fact, be paid for their lending efforts if they exceeded their benchmarks. Like the previous TLTROs, the TLTROs II intend to promote bank lending to the euro-area non-financial private sector and again exclude mortgage loans. Banks were able to borrow larger amounts through TLTROs II compared to the previous TLTROs. The last operation of the TLTRO II series was successfully conducted and settled in March 2017, and will mature in March 2021.
Sources: European Central Bank, The Eurosystem’s instruments (https://www.ecb.europa.eu/mopo/implement/html/index.en.html); European Central Bank, Monetary policy decisions: Non-standard measures (https://www.ecb.europa.eu/mopo/decisions/html/index.en.html); European Central Bank, Technical features of Outright Monetary Transactions, press release of September 6, 2012 (http://www.ecb.int/press/pr/date/2012/html/pr120906_1.en.html); European Central Bank, ECB announces further details of the targeted long-term refinancing operations, press release of July 3, 2014 (https://www.ecb.europa.eu/press/pr/date/2014/html/pr140703_2.en.html); European Central Bank, ECB announces new series of targeted longer-term refinancing operations (TLTRO II), press release of March 10, 2016 (http://www.ecb.europa.eu/press/pr/date/2016/html/pr160310_1.en.html); European Central Bank, Consolidated financial statement of the Eurosystem as at 1 July 2016 (https://www.ecb.europa.eu/press/pr/wfs/2016/html/fs160706.en.html); Bundesbank, Gezielte längerfristige Refinanzierungsgeschäfte I (https://www.bundesbank.de/Redaktion/DE/Standardartikel/Aufgaben/Geldpolitik/glrg_1_ausstehende_glrg.html); European Central Bank, Consolidated financial statement of the Eurosystem as at 31 March 2017 (https://www.ecb.europa.eu/press/pr/wfs/2017/html/fs170405.en.html); Bundesbank, Gezielte längerfristige Refinanzierungsgeschäfte II (https://www.bundesbank.de/Redaktion/DE/Standardartikel/Aufgaben/Geldpolitik/glrg_2_ausstehende_glrg.html); European Central Bank, Asset purchase programmes (https://www.ecb.europa.eu/mopo/implement/omt/html/index.en.html); European Central Bank, Introductory Statement to the press conference (with Q&A), Mario Draghi, President of the ECB, Frankfurt am Main, January 22, 2015 (https://www.ecb.europa.eu/press/pressconf/2015/html/is150122.en.html); European Central Bank, ECB announces expanded asset purchase programme, press release of January 22, 2015 (https://www.ecb.europa.eu/press/pr/date/2015/html/pr150122_1.en.html); European Central Bank, ECB adds corporate sector purchase programme (CSPP) to the asset purchase programme (APP) and announces changes to APP, press release of March 10, 2016 (http://www.ecb.europa.eu/press/pr/date/2016/html/pr160310_2.en.html); European Central Bank, Monetary policy decisions, press release of March 8, 2017 (https://www.ecb.europa.eu/press/pressconf/2018/html/ecb.is180308.en.html).
Securities Market
The Federal Republic’s securities market is among Europe’s largest. Trading in listed securities is not legally or otherwise confined to the stock exchanges. It is estimated, however, that most transactions in equity securities are executed through stock exchanges. By contrast, debt securities, although typically listed, are predominantly traded over-the-counter.
Highly developed secondary markets, combined with the distribution capabilities of an extensive network of financial institutions, provide the basis for the Federal Republic’s position in the world’s capital markets. Equity and debt issues are generally underwritten and distributed through banking syndicates, which typically include commercial banks as well as certain regional and specialized institutions. The regulated securities markets in Berlin, Dusseldorf, Frankfurt am Main, Hamburg, Hanover, Munich and Stuttgart and the European Energy Exchange are recognized as regulated markets of the EU according to Article 56 of Directive 2014/65/EU on Markets in Financial Instruments and comply with globally accepted regulatory standards.
Based on total turnover on German securities exchanges, the Frankfurt Stock Exchange, operated by Deutsche Börse AG, is by far the most important stock exchange in the Federal Republic.
In January 2013, the Heads of State or Government of the European Union adopted a decision authorizing eleven Member States to proceed with the introduction of a financial transaction tax (“FTT”) through “enhanced cooperation.”
In February 2013, the European Commission presented its “Proposal for a Council Directive implementing enhanced cooperation in the area of financial transaction tax.” The proposal involves a harmonized minimum 0.1% tax rate for transactions in all types of financial instruments except derivatives (0.01% rate). The proposal is still subject to discussion.
Sources: Council of the European Union, Financial transaction tax: Council agrees to enhanced cooperation, press release of January 22, 2013 (http://www.consilium.europa.eu/uedocs/cms_Data/docs/pressdata/en/ecofin/134949.pdf); Bundesministerium der Finanzen, Finanztransaktionsteuer in verstärkter Zusammenarbeit, topical information originating from press release of January 27, 2015 (http://www.bundesfinanzministerium.de/Content/DE/Standardartikel/Themen/Steuern/Weitere_Steuerthemen/Finanztransaktionsteuer/2014-01-27-ftt-statement.html).
G-33
PUBLIC FINANCE
Receipts and Expenditures
The Federal Government, each of the Länder governments and each of the municipalities (Gemeinden) have separate budgets. The federal budget is the largest single public budget.
The fiscal year of the Federal Republic is the calendar year. The annual federal budget is passed by an act of Parliament. On the basis of a proposal prepared by the Ministry of Finance, the Federal Government introduces the federal budget bill to the Parliament, generally in the summer of each year. The proposal has to pass through three Bundestag sessions, the budget committee of the Bundestag, and the Bundesrat, which deliberates on the proposal twice. The final vote on the proposal is taken by the Bundestag in its third session.
In addition to the federal, Länder and municipal budgets, there are separate budgets for the social security funds and various special funds (Sondervermögen) of the federal administration and the Länder, as well as other off-budgetary entities at all levels of government that are created for specific public purposes. General government, as defined in the national accounts, comprises all these different levels of government activity.
In 2017, total consolidated general government revenue, as presented in the national accounts, amounted to EUR 1,474.6 billion, with tax revenue of EUR 767.2 billion and net social contributions of EUR 548.1 billion.
Source: Statistisches Bundesamt, Fachserie 18, Reihe 1.4 – 2017 (March 2018), Table 3.4.3.2.
In 2017, VAT and the taxes on income and wealth, as presented in the national accounts, amounted to EUR 226.6 billion and EUR 422.6 billion, respectively. These joint taxes are distributed among the Federal Government, the Länder governments and municipal authorities, according to predetermined formulae. In addition to joint taxes, the Federal Government, the Länder governments and the municipal authorities each levied special taxes, for example, on tobacco and beer.
Source: Statistisches Bundesamt, Fachserie 18, Reihe 1.4 – 2017 (March 2018), Table 3.4.3.16.
Consolidated general government expenditure in 2017, as presented in the national accounts, amounted to a total of EUR 1,438.0 billion. The most significant consolidated general government expenditures were monetary social benefits (EUR 505.5 billion), social benefits in kind (EUR 277.9 billion) and employee compensation (EUR 246.5 billion). Other significant consolidated general government expenditures included intermediate consumption (EUR 155.3 billion), interest on public debt (EUR 38.9 billion) and gross capital formation (EUR 70.3 billion).
Source: Statistisches Bundesamt, Fachserie 18, Reihe 1.4 – 2017 (March 2018), Table 3.4.3.2.
GENERAL GOVERNMENT ACCOUNTS (1)
| | | | | | | | | | | | | | | | | | | | |
| | | 2017 | | | 2016 | | | 2015 | | | 2014 | | | 2013 | |
| | | (EUR in billions) | |
Federal Government, Länder governments and municipalities | | | | | | | | | | | | | | | | | | | | |
Revenue | | | 955.4 | | | | 918.7 | | | | 880.0 | | | | 853.5 | | | | 820.8 | |
of which: Taxes (2) | | | 767.2 | | | | 732.0 | | | | 698.0 | | | | 668.7 | | | | 646.3 | |
Expenditure | | | 929.3 | | | | 901.3 | | | | 863.3 | | | | 847.1 | | | | 830.2 | |
| | | | | | | | | | | | | | | | | | | | |
Balance | | | 26.1 | | | | 17.4 | | | | 16.7 | | | | 6.4 | | | | -9.4 | |
Social security funds | | | | | | | | | | | | | | | | | | | | |
Revenue | | | 635.4 | | | | 606.9 | | | | 579.9 | | | | 557.7 | | | | 540.1 | |
Expenditure | | | 624.8 | | | | 598.6 | | | | 577.2 | | | | 554.6 | | | | 534.7 | |
| | | | | | | | | | | | | | | | | | | | |
Balance | | | 10.5 | | | | 8.2 | | | | 2.7 | | | | 3.2 | | | | 5.4 | |
General government | | | | | | | | | | | | | | | | | | | | |
Revenue | | | 1,474.6 | | | | 1,414.2 | | | | 1,354.3 | | | | 1,308.3 | | | | 1,259.0 | |
Expenditure | | | 1,438.0 | | | | 1,388.6 | | | | 1,334.9 | | | | 1,298.8 | | | | 1,263.0 | |
| | | | | | | | | | | | | | | | | | | | |
Balance | | | 36.6 | | | | 25.7 | | | | 19.4 | | | | 9.5 | | | | -4.0 | |
| | | | | | | | | | | | | | | | | | | | |
| (1) | Definition according to the national accounts. |
| (2) | Excluding capital taxes and taxes of domestic sectors paid to EU. |
Source: Statistisches Bundesamt, Fachserie 18, Reihe 1.4 – 2017 (March 2018), Tables 3.4.3.2, 3.4.3.3 and 3.4.3.7.
G-34
FEDERAL GOVERNMENT ACCOUNTS (1)
| | | | | | | | | | | | | | | | | | | | |
| | | 2017 | | | 2016 | | | 2015 | | | 2014 | | | 2013 | |
| | | (EUR in billions) | |
Revenue | | | 415.0 | | | | 401.1 | | | | 392.0 | | | | 385.5 | | | | 370.0 | |
of which: Taxes (2) | | | 369.2 | | | | 353.5 | | | | 346.0 | | | | 336.7 | | | | 326.4 | |
Expenditure | | | 413.9 | | | | 393.7 | | | | 382.3 | | | | 376.8 | | | | 377.4 | |
| | | | | | | | | | | | | | | | | | | | |
Balance | | | 1.1 | | | | 7.4 | | | | 9.7 | | | | 8.7 | | | | -7.4 | |
| | | | | | | | | | | | | | | | | | | | |
| (1) | Definition according to the national accounts. |
| (2) | Excluding taxes of domestic sectors paid to EU. |
Source: Statistisches Bundesamt, Fachserie 18, Reihe 1.4 – 2017 (March 2018), Table 3.4.3.4.
GENERAL GOVERNMENT EXPENDITURE: BREAKDOWNBY FUNCTIONS (1)
| | | | | | | | | | | | | | | | | | | | |
| | | 2017 | | | 2016 | | | 2015 | | | 2014 | | | 2013 | |
| | | (EUR in billions) | |
General public services | | | 189.1 | | | | 183.4 | | | | 179.8 | | | | 188.3 | | | | 184.8 | |
Defense | | | 35.3 | | | | 32.6 | | | | 30.1 | | | | 29.8 | | | | 30.5 | |
Public order and safety | | | 50.5 | | | | 49.9 | | | | 47.1 | | | | 46.1 | | | | 44.8 | |
Economic affairs | | | 98.2 | | | | 96.7 | | | | 93.7 | | | | 91.0 | | | | 91.7 | |
Environmental protection | | | 20.4 | | | | 19.2 | | | | 18.0 | | | | 17.7 | | | | 17.4 | |
Housing and community amenities | | | 12.4 | | | | 11.9 | | | | 11.6 | | | | 11.5 | | | | 11.7 | |
Health | | | 233.3 | | | | 225.3 | | | | 217.5 | | | | 209.7 | | | | 198.9 | |
Recreation, culture and religion | | | 32.8 | | | | 31.7 | | | | 30.6 | | | | 30.4 | | | | 29.0 | |
Education | | | 134.7 | | | | 132.3 | | | | 127.6 | | | | 124.3 | | | | 120.7 | |
Social protection | | | 631.3 | | | | 605.5 | | | | 578.9 | | | | 549.9 | | | | 533.6 | |
| | | | | | | | | | | | | | | | | | | | |
Total expenditure | | | 1,438.0 | | | | 1,388.6 | | | | 1,334.9 | | | | 1,298.8 | | | | 1,263.0 | |
| | | | | | | | | | | | | | | | | | | | |
| (1) | Definition according to the national accounts. |
Source: Statistisches Bundesamt, Fachserie 18, Reihe 1.4 – 2017 (March 2018), Table 3.4.3.11.
Germany’s General Government Deficit/Surplus and General Government Gross Debt
For purposes of the Member States’ reports to the European Commission under the EDP, the general government or “Maastricht” deficit/surplus refers to the difference between consolidated public sector revenue and consolidated public sector expenditure and is the balancing item “net borrowing/net lending” of the general government (central government, state government, local government and social security funds) as defined in ESA 2010. In 2017, Germany’s general government surplus amounted to EUR 36.6 billion, or 1.1% of nominal GDP. The German general government gross debt-to-GDP ratio decreased from 68.2% in 2016 to 64.1% in 2017, which is above the EU’s 60% reference value.
Sources: Statistisches Bundesamt, Fachserie 18, Reihe 1.2 – 4. Vierteljahr 2017 (February 2018), Table 1.10; Council of the European Union, Consolidated versions of the Treaty on European Union and the Treaty on the Functioning of the European Union and the Charter of Fundamental Rights of the European Union (http://data.consilium.europa.eu/doc/document/ST-6655-2008-REV-8/en/pdf); Deutsche Bundesbank, German general government debt down in 2017 by €53 billion to €2.09 trillion – debt ratio down from 68.2 % to 64.1 %, press release of March 29, 2018 (https://www.bundesbank.de/Redaktion/EN/Pressemitteilungen/BBK/2018/2018_03_29_general_government_debt.html?https=1).
G-35
The following table shows historical information on the Federal Republic’s general government deficit/surplus and debt as a percentage of GDP.
THE FEDERAL REPUBLIC’S FISCAL MAASTRICHT CRITERIA
| | | | | | | | | | | | | | | | | | | | |
| | | 2017 | | | 2016 | | | 2015 | | | 2014 | | | 2013 | |
| | | (% of GDP) | |
General government deficit (-) / surplus (+) | | | 1.1 | | | | 0.8 | | | | 0.6 | | | | 0.3 | | | | -0.1 | |
General government gross debt | | | 64.1 | | | | 68.2 | | | | 71.0 | | | | 74.7 | | | | 77.5 | |
Sources: Statistisches Bundesamt, Fachserie 18, Reihe 1.2 – 4. Vierteljahr 2017 (February 2018), Table 1.10; Deutsche Bundesbank, German general government debt down in 2017 by €53 billion to €2.09 trillion – debt ratio down from 68.2 % to 64.1 %, press release of March 29, 2018 (https://www.bundesbank.de/Redaktion/EN/Pressemitteilungen/BBK/2018/2018_03_29_general_government_debt.html?https=1).
Fiscal Outlook
The April 2018 update of the German stability program forecasts the general government budget to remain in surplus until 2021, the end of the forecasting period. The medium-term objective of a structural deficit not exceeding 0.5% of GDP is expected to be met with a safety margin during the entire forecasting period (2018 to 2021).
According to the April 2018 update of the German stability program, Germany’s general government gross debt-to-GDP ratio is projected to be 61 % in 2018 and to decrease further to around 53% by 2021, the end of the forecast horizon. The reference values for the upper limit of the debt ratio according to the 1/20th-rule of the enhanced SGP are expected to be undershot significantly in all years of the forecasting period. The debt ratio is expected to fall below the EU’s reference value of 60% of nominal GDP in 2019. One reason for the decrease is expected to be the liquidation of parts of the wind-up institutions’ portfolios, which is expected to continue over the coming years. In addition to the liquidation effect, the consolidation efforts in the federal, Länder and municipal authorities’ budgets are expected to contribute to the decline in the debt-to-GDP ratio during the forecasting period.
Source: Bundesministerium der Finanzen, Deutsches Stabilitätsprogramm 2018 (https://www.bundesfinanzministerium.de/Content/DE/Downloads/Abt_2/Stabilitaetsprogramm-2018.pdf?__blob=publicationFile&v=4), Tables 14 and 17.
GENERAL GOVERNMENT BUDGETARY PROSPECTS (1)
| | | | | | | | | | | | | | | | | | | | |
| | | 2021 | | | 2020 | | | 2019 | | | 2018 | | | 2017 | |
Revenue | | | 44 3⁄4 | | | | 44 3⁄4 | | | | 44 3⁄4 | | | | 44 3⁄4 | | | | 45.2 | |
Total taxes | | | 23 3⁄4 | | | | 23 1⁄2 | | | | 23 1⁄2 | | | | 23 1⁄2 | | | | 23.5 | |
Social contributions | | | 16 3⁄4 | | | | 16 3⁄4 | | | | 16 3⁄4 | | | | 16 3⁄4 | | | | 16.8 | |
Property income | | | 1⁄2 | | | | 1⁄2 | | | | 1⁄2 | | | | 1⁄2 | | | | 0.5 | |
Other | | | 4 | | | | 4 | | | | 4 | | | | 4 1⁄4 | | | | 4.4 | |
Expenditure (2) | | | 43 1⁄4 | | | | 43 1⁄2 | | | | 43 1⁄2 | | | | 44 | | | | 44.1 | |
Compensation of employees and intermediate consumption | | | 11 3⁄4 | | | | 12 | | | | 12 | | | | 12 1⁄4 | | | | 12.3 | |
Social payments | | | 24 | | | | 24 | | | | 23 3⁄4 | | | | 23 3⁄4 | | | | 24.0 | |
Interest expenditure | | | 1 | | | | 1 | | | | 1 | | | | 1 | | | | 1.2 | |
Subsidies | | | 1 | | | | 1 | | | | 1 | | | | 1 | | | | 0.8 | |
Gross fixed capital formation | | | 2 1⁄4 | | | | 2 1⁄4 | | | | 2 1⁄4 | | | | 2 1⁄4 | | | | 2.2 | |
Capital transfers | | | 1 | | | | 1 | | | | 1 | | | | 1 1⁄4 | | | | 1.3 | |
Other | | | 3 1⁄4 | | | | 3 1⁄4 | | | | 3 1⁄2 | | | | 3 1⁄2 | | | | 3.5 | |
| | | | | | | | | | | | | | | | | | | | |
General government deficit (–) / surplus (+) | | | 1 1⁄2 | | | | 1 1⁄2 | | | | 1 1⁄4 | | | | 1 | | | | 1.1 | |
Federal Government | | | 1⁄2 | | | | 1⁄4 | | | | 1⁄4 | | | | 0 | | | | 0.0 | |
Länder governments | | | 3⁄4 | | | | 3⁄4 | | | | 3⁄4 | | | | 1⁄4 | | | | 0.5 | |
Municipalities | | | 1⁄4 | | | | 1⁄4 | | | | 1⁄4 | | | | 1⁄2 | | | | 0.3 | |
Social security funds | | | 0 | | | | 1⁄4 | | | | 1⁄4 | | | | 1⁄4 | | | | 0.3 | |
General government gross debt | | | 53 | | | | 55 3⁄4 | | | | 58 1⁄4 | | | | 61 | | | | 64.1 | |
G-36
| (1) | Forecast figures are rounded to one-quarter of a percent of GDP. |
| (2) | Adjusted by the net amount of payments in connection with swaps. |
Source: Bundesministerium der Finanzen, Deutsches Stabilitätsprogramm 2018 (https://www.bundesfinanzministerium.de/Content/DE/Downloads/Abt_2/Stabilitaetsprogramm-2018.pdf?__blob=publicationFile&v=4), Tables 14 and 17.
Tax Structure
Income Tax
Significant sources of revenue for the general government are the various types of income taxes. Income taxation for employees and self-employed persons is based on a progressive tax scale ranging from 14% to 45% subject to the amount of taxable income. Employees pay taxes on their income from employment in the form of wage taxes. Self-employed persons typically pay estimated taxes during the year before filing their annual income tax return. Income generated by partnerships (Personengesellschaften) is not subject to tax at the partnership level, but at the level of the partners. The partners pay tax on this income according to their individual income tax brackets.
Income generated by corporations is subject to corporate income tax (Körperschaftsteuer) at a flat rate of 15%.
Capital income received by domestic taxpayers (all types of income from capital as well as private shareholders’ net gains from sales of shares in corporations) is subject to a final uniform tax rate of 25% (Abgeltungssteuer), taking into consideration an allowance (Sparerpauschbetrag) of EUR 801 (EUR 1,602 for married couples).
In addition to the various types of income tax, a solidarity surcharge of 5.5% is imposed on the applicable income tax liability.
Sources: Bundesministerium der Justiz und für Verbraucherschutz, Einkommensteuergesetz (http://www.gesetze-im-internet.de/estg/index.html); Bundesministerium der Justiz und für Verbraucherschutz, Solidaritätszuschlaggesetz 1995, § 4 Zuschlagssatz (http://www.gesetze-im-internet.de/solzg_1995/__4.html); Bundesministerium der Justiz und für Verbraucherschutz, Körperschaftsteuergesetz (http://www.gesetze-im-internet.de/kstg_1977/index.html).
VAT and Consumption Taxes
VAT serves as a significant source of revenue. VAT is a general consumption tax that is imposed on the value of most goods and services. The standard rate applicable to most goods and services is 19%. Certain items that are classified as basic necessities, such as food (except food and beverages in restaurants) and books, are subject to a reduced rate of 7%.
In addition to the VAT, there are specific consumption taxes. The most significant specific consumption taxes relate to energy and tobacco.
Sources: Bundesministerium der Justiz und für Verbraucherschutz, Umsatzsteuergesetz (http://www.gesetze-im-internet.de/ustg_1980/index.html); Bundesministerium der Justiz und für Verbraucherschutz, Umsatzsteuergesetz, § 12 Steuersätze (http://www.gesetze-im-internet.de/ustg_1980/__12.html); Bundesministerium der Justiz und für Verbraucherschutz, Energiesteuergesetz (http://www.gesetze-im-internet.de/energiestg/); Bundesministerium der Justiz und für Verbraucherschutz, Tabaksteuergesetz (http://www.gesetze-im-internet.de/tabstg_2009/index.html).
Environmental Tax
The environmental tax regime aims to encourage energy conservation and to allocate the burden of taxes and contributions more equally among labor, capital and natural resources. Key points of the environmental tax regime are an electricity tax imposed on the consumption of electricity and an energy tax on mineral oil and coal. The electricity tax rate is EUR 20.50 per megawatt-hour. The rates of the energy tax are assessed in accordance with certain environmental criteria.
Sources: Bundesministerium der Justiz und für Verbraucherschutz, Stromsteuergesetz (http://www.gesetze-im-internet.de/stromstg/index.html); Bundesministerium der Justiz und für Verbraucherschutz, Stromsteuergesetz, § 3 Steuertarif (http://www.gesetze-im-internet.de/stromstg/__3.html).
Trade Tax
Trade tax (Gewerbesteuer) is levied at the municipal level and is imposed on businesses and their objective earning power. The trade tax rate varies and depends on the municipality that levies the tax. Basis of assessment are the profits of a business enterprise as determined under income tax law or corporation tax law, increased or decreased by certain adjustments. The result is multiplied by the basic federal rate (Gewerbesteuermesszahl) to achieve the base amount for the trade tax (Steuermessbetrag), which is then multiplied by the municipal multiplier (Hebesatz). Beyond a required minimum level of 200%, municipalities have discretion to fix the municipal tax collection rate.
Source: Bundesministerium der Justiz und für Verbraucherschutz, Gewerbesteuergesetz (http://www.gesetze-im-internet.de/gewstg/index.html).
G-37
The following table provides an overview of the annual tax revenues of the general government divided by categories for each of the years indicated, as presented in the national accounts.
TAXES (1)
| | | | | | | | | | | | | | | | | | | | |
| | | 2017 | | | 2016 | | | 2015 | | | 2014 | | | 2013 | |
| | | (EUR in billions) | |
Current taxes | | | 767.2 | | | | 732.0 | | | | 698.0 | | | | 668.7 | | | | 646.3 | |
Taxes on production and imports | | | 344.7 | | | | 334.7 | | | | 325.7 | | | | 314.9 | | | | 305.8 | |
of which: VAT | | | 226.6 | | | | 218.8 | | | | 211.6 | | | | 203.1 | | | | 197.0 | |
Current taxes on income and wealth | | | 422.6 | | | | 397.2 | | | | 372.3 | | | | 353.8 | | | | 340.5 | |
of which: Wage tax | | | 235.0 | | | | 223.0 | | | | 215.0 | | | | 203.9 | | | | 194.2 | |
Assessed income tax | | | 58.0 | | | | 52.1 | | | | 46.9 | | | | 43.9 | | | | 41.0 | |
Non-assessed taxes on earnings | | | 29.8 | | | | 26.6 | | | | 27.5 | | | | 25.6 | | | | 27.0 | |
Corporate tax | | | 31.6 | | | | 29.3 | | | | 21.6 | | | | 21.6 | | | | 21.1 | |
Capital taxes | | | 6.1 | | | | 7.0 | | | | 6.3 | | | | 5.5 | | | | 4.6 | |
| | | | | | | | | | | | | | | | | | | | |
Tax revenue of general government | | | 773.3 | | | | 739.0 | | | | 704.3 | | | | 674.1 | | | | 651.0 | |
Taxes of domestic sectors to EU | | | 5.2 | | | | 5.2 | | | | 5.5 | | | | 4.6 | | | | 4.3 | |
| | | | | | | | | | | | | | | | | | | | |
Taxes | | | 778.6 | | | | 744.1 | | | | 709.8 | | | | 678.7 | | | | 655.3 | |
| | | | | | | | | | | | | | | | | | | | |
| (1) | Definition according to the national accounts. |
Source: Statistisches Bundesamt, Fachserie 18, Reihe 1.4 – 2017 (March 2018), Table 3.4.3.16.
Government Participations
The Federal Republic and its various special funds held direct participations in 106 public and private enterprises as of December 31, 2016.
Source: Bundesministerium der Finanzen, Die Beteiligungen des Bundes – Beteiligungsbericht 2017 (http://www.bundesfinanzministerium.de/Content/DE/
Standardartikel/Themen/Bundesvermoegen/Privatisierungs_und_Beteiligungspolitik/Beteiligungspolitik/Beteiligungsberichte/Beteiligungsbericht-2017.html), Chapter A.
The following table shows information on the Federal Republic’s significant direct participations (including those held through special funds) as of December 31, 2016.
PARTICIPATIONSOF THE FEDERAL REPUBLIC
| | | | | | | | |
Enterprises | | Total nominal capital of enterprise | | | Participation of the Federal
Republic | |
| | | (EUR in millions) | | | (%) | |
Significant majority participations: | | | | | | | | |
Deutsche Bahn AG | | | 2,150 | | | | 100.0 | |
KfW | | | 3,750 | | | | 80.0 | |
Hypo Real Estate Holding GmbH (1) | | | 909 | | | | 100.0 | |
Significant minority participations exceeding 25%: | | | | | | | | |
Flughafen München GmbH | | | 307 | | | | 26.0 | |
| (1) | Participations held by a special fund. |
Source: Bundesministerium der Finanzen, Die Beteiligungen des Bundes – Beteiligungsbericht 2017 (http://www.bundesfinanzministerium.de/Content/DE/
Standardartikel/Themen/Bundesvermoegen/Privatisierungs_und_Beteiligungspolitik/Beteiligungspolitik/Beteiligungsberichte/Beteiligungsbericht-2017.html), Chapters B, E and O paragraph II.
Direct Debt of the Federal Government
As of December 31, 2017, the Federal Government’s direct debt totaled EUR 1,086.3 billion, compared to EUR 1,089.2 billion as of December 31, 2016.
Source: Bundesrepublik Deutschland Finanzagentur GmbH, Übersicht über den Stand der Schuld der Bundesrepublik Deutschland (http://www.deutsche-finanzagentur.de/fileadmin/user_upload/finanzagentur/pdf/schuldenstand_jahresarchiv.pdf).
The Federal Government raises funds primarily through the issuance of bonds and notes. Euro-denominated bonds and notes issued by the Federal Republic are evidenced by book entry and no certificates are issued.
G-38
In addition to its own direct debt obligations, the Federal Government and its special funds had outstanding guarantees in an aggregate amount of EUR 477.5 billion as of December 31, 2016. Of this amount, EUR 128.6 billion were outstanding in the form of export credit insurance, which is handled by Euler Hermes on behalf of and for the account of the Federal Government. Furthermore, EUR 22.4 billion of the aggregate amount were outstanding in the form of a guarantee for a loan to Greece according to the German Financial Stability Act, and EUR 85.9 billion of the aggregate amount were outstanding in the form of a guarantee for the European Financial Stability Facility.
Source: Bundesministerium der Finanzen, Finanzbericht 2018 (http://www.bundesfinanzministerium.de/Content/DE/Standardartikel/Themen/Oeffentliche_Finanzen/Wirtschafts_und_Finanzdaten/Finanzberichte/Finanzbericht-2018.html), Overview 4, page 343.
For more detailed information regarding the Federal Government’s debt and guarantees, see “Tables and Supplementary Information.”
For information on the Federal Government’s liability as of December 31, 2017 for capital subscriptions to various international financial organizations, see the table entitled “Tables and Supplementary Information—III. Liabilities to International Financial Organizations.”
G-39
TABLES AND SUPPLEMENTARY INFORMATION
I. DIRECT DEBT OF THE FEDERAL GOVERNMENT
SUMMARY
| | | | |
| | | Aggregate principal amount
outstanding as of
December 31, 2017 | |
| | | (EUR in millions) | |
Federal Bonds (Bundesanleihen) | | | 731,500 | |
Bonds of the Federal Republic and the Länder (Bund-Länder-Anleihe) | | | 405 | |
Inflation-linked Securities (inflationsindexierte Bundeswertpapiere) | | | 75,000 | |
Federal Notes (Bundesobligationen) | | | 213,000 | |
Federal Treasury Notes (Bundesschatzanweisungen) | | | 100,000 | |
Federal Savings Notes (Bundesschatzbriefe) | | | 289 | |
Treasury Discount Paper (Unverzinsliche Schatzanweisungen) | | | 10,037 | |
German Government Day-Bonds (Tagesanleihe des Bundes) | | | 966 | |
Borrowers’ note loans (Schuldscheindarlehen) | | | 9,091 | |
of which: | | | | |
– From residents | | | 9,053 | |
– From non-residents | | | 38 | |
Other debt (1) | | | 4,475 | |
– Equalization claims | | | 4,155 | |
Repurchased debt | | | -58,451 | |
| | | | |
Total | | | 1,086,311 | |
| | | | |
| (1) | Mainly equalization and covering claims of the Deutsche Bundesbank, other banks and insurance companies in connection with the currency reform of 1948. |
Source: Bundesministerium der Finanzen, Übersicht über den Stand der Schuld der Bundesrepublik Deutschland zum 30. Juni 2017 und 31. Dezember 2017 in Euro, Bundesanzeiger of February 2, 2018.
G-40
DEBT TABLES
1. FEDERAL BONDS (1)
| | | | | | | | | | | | | | | | |
Title | | Interest rate | | | Year of issue | | | Maturity | | | Aggregate
principal amount
outstanding as of
December 31, 2017 | |
| | | (% per
annum) | | | | | | | | | (EUR in millions) | |
6.25% Bonds of the Federal Republic of 1994 | | | 6.25 | | | | 1994 | | | | 2024 | | | | 10,250 | |
6.5% Bonds of the Federal Republic of 1997 | | | 6.5 | | | | 1997 | | | | 2027 | | | | 11,250 | |
5.625% Bonds of the Federal Republic of 1998 | | | 5.625 | | | | 1998 | | | | 2028 | | | | 14,500 | |
4.75% Bonds of the Federal Republic of 1998 (II) | | | 4.75 | | | | 1998 | | | | 2028 | | | | 11,250 | |
6.25% Bonds of the Federal Republic of 2000 | | | 6.25 | | | | 2000 | | | | 2030 | | | | 9,250 | |
5.5% Bonds of the Federal Republic of 2000 | | | 5.5 | | | | 2000 | | | | 2031 | | | | 17,000 | |
4.75% Bonds of the Federal Republic of 2003 | | | 4.75 | | | | 2003 | | | | 2034 | | | | 20,000 | |
4% Bonds of the Federal Republic of 2005 | | | 4 | | | | 2005 | | | | 2037 | | | | 23,000 | |
4.25% Bonds of the Federal Republic of 2007 (I) | | | 4.25 | | | | 2007 | | | | 2039 | | | | 14,000 | |
4% Bonds of the Federal Republic of 2007 | | | 4 | | | | 2007 | | | | 2018 | | | | 20,000 | |
4.25% Bonds of the Federal Republic of 2008 | | | 4.25 | | | | 2008 | | | | 2018 | | | | 21,000 | |
3.75% Bonds of the Federal Republic of 2008 | | | 3.75 | | | | 2008 | | | | 2019 | | | | 24,000 | |
4.75% Bonds of the Federal Republic of 2008 | | | 4.75 | | | | 2008 | | | | 2040 | | | | 16,000 | |
3.5% Bonds of the Federal Republic of 2009 | | | 3.5 | | | | 2009 | | | | 2019 | | | | 24,000 | |
3.25% Bonds of the Federal Republic of 2009 | | | 3.25 | | | | 2009 | | | | 2020 | | | | 22,000 | |
3.25% Bonds of the Federal Republic of 2010 | | | 3.25 | | | | 2010 | | | | 2042 | | | | 15,000 | |
3% Bonds of the Federal Republic of 2010 | | | 3 | | | | 2010 | | | | 2020 | | | | 22,000 | |
2.25% Bonds of the Federal Republic of 2010 | | | 2.25 | | | | 2010 | | | | 2020 | | | | 16,000 | |
2.5% Bonds of the Federal Republic of 2010 | | | 2.5 | | | | 2010 | | | | 2021 | | | | 19,000 | |
3.25% Bonds of the Federal Republic of 2011 | | | 3.25 | | | | 2011 | | | | 2021 | | | | 19,000 | |
2.25% Bonds of the Federal Republic of 2011 | | | 2.25 | | | | 2011 | | | | 2021 | | | | 16,000 | |
2% Bonds of the Federal Republic of 2011 | | | 2 | | | | 2011 | | | | 2022 | | | | 20,000 | |
1.75% Bonds of the Federal Republic of 2012 | | | 1.75 | | | | 2012 | | | | 2022 | | | | 24,000 | |
1.5% Bonds of the Federal Republic of 2012 | | | 1.50 | | | | 2012 | | | | 2022 | | | | 18,000 | |
2.5% Bonds of the Federal Republic of 2012 | | | 2.50 | | | | 2012 | | | | 2044 | | | | 22,000 | |
G-41
| | | | | | | | | | | | | | | | |
Title | | Interest
rate | | | Year of
issue | | | Maturity | | | Aggregate principal
amount outstanding as of
December 31, 2017 | |
| | | (% per
annum) | | | | | | | | | (EUR in millions) | |
1.5% Bonds of the Federal Republic of 2013 | | | 1.50 | | | | 2013 | | | | 2023 | | | | 18,000 | |
1.5% Bonds of the Federal Republic of 2013 (II) | | | 1.50 | | | | 2013 | | | | 2023 | | | | 18,000 | |
2% Bonds of the Federal Republic of 2013 | | | 2 | | | | 2013 | | | | 2023 | | | | 18,000 | |
1.5% Bonds of the Federal Republic and the Länder of 2013 | | | 1.50 | | | | 2013 | | | | 2020 | | | | 405 | |
1.75% Bonds of the Federal Republic of 2014 | | | 1.75 | | | | 2014 | | | | 2024 | | | | 18,000 | |
2.5% Bonds of the Federal Republic of 2014 | | | 2.50 | | | | 2014 | | | | 2046 | | | | 23,000 | |
1.5% Bonds of the Federal Republic of 2014 | | | 1.50 | | | | 2014 | | | | 2024 | | | | 18,000 | |
1% Bonds of the Federal Republic of 2014 | | | 1 | | | | 2014 | | | | 2024 | | | | 18,000 | |
0.5% Bonds of the Federal Republic of 2015 | | | 0.5 | | | | 2015 | | | | 2025 | | | | 23,000 | |
1% Bonds of the Federal Republic of 2015 | | | 1 | | | | 2015 | | | | 2025 | | | | 23,000 | |
0.5% Bonds of the Federal Republic of 2016 | | | 0.5 | | | | 2016 | | | | 2026 | | | | 26,000 | |
0% Bonds of the Federal Republic of 2016 | | | 0 | | | | 2016 | | | | 2026 | | | | 25,000 | |
0.25% Bonds of the Federal Republic of 2017 | | | 0.25 | | | | 2017 | | | | 2027 | | | | 26,000 | |
0.5% Bonds of the Federal Republic of 2017 | | | 0.5 | | | | 2017 | | | | 2027 | | | | 25,000 | |
1.25% Bonds of the Federal Republic of 2017 | | | 1.25 | | | | 2017 | | | | 2048 | | | | 4,000 | |
| | | | | | | | | | | | | | | | |
Total Federal Bonds | | | | | | | | | | | | | | | 731,905 | |
| | | | | | | | | | | | | | | | |
| (1) | Federal Bonds (Bundesanleihen) are evidenced by book entry, and no certificates are issued. Maturities are 10 to 30 years. No redemption prior to maturity; including principal strips. |
2. INFLATION-LINKED SECURITIES (1)
| | | | | | | | | | | | | | | | |
Title | | Interest
rate | | | Year of
issue | | | Maturity | | | Aggregate principal
amount outstanding as of
December 31, 2017 | |
| | | (% per
annum) | | | | | | | | | (EUR in millions) | |
1.75% Inflation-linked Bonds of the Federal Republic of 2009 | | | 1.75 | | | | 2009 | | | | 2020 | | | | 16,000 | |
0.75% Inflation-linked Notes of the Federal Republic of 2011 | | | 0.75 | | | | 2011 | | | | 2018 | | | | 15,000 | |
0.10% Inflation-linked Bonds of the Federal Republic of 2012 | | | 0.10 | | | | 2012 | | | | 2023 | | | | 16,000 | |
0.50% Inflation-linked Bonds of the Federal Republic of 2014 | | | 0.50 | | | | 2014 | | | | 2030 | | | | 9,500 | |
0.10% Inflation-linked Bonds of the Federal Republic of 2015 | | | 0.10 | | | | 2015 | | | | 2026 | | | | 12,000 | |
0.10% Inflation-linked Bonds of the Federal Republic of 2015 | | | 0.10 | | | | 2015 | | | | 2046 | | | | 6,500 | |
| | | | | | | | | | | | | | | | |
Total Inflation-linked Securities | | | | | | | | | | | | | | | 75,000 | |
| | | | | | | | | | | | | | | | |
| (1) | Inflation-linked Securities (Inflationsindexierte Bundeswertpapiere) are evidenced by book entry, and no certificates are issued. Maturities are five to ten years. No redemption prior to maturity. |
G-42
3. FEDERAL NOTES (1)
| | | | | | | | | | | | | | | | |
Title | | Interest
rate | | | Year of
issue | | | Maturity | | | Aggregate principal
amount outstanding as of
December 31, 2017 | |
| | | (% per
annum) | | | | | | | | | (EUR in millions) | |
0.50% Bonds of 2013-Series 165 | | | 0.50 | | | | 2013 | | | | 2018 | | | | 17,000 | |
0.25% Bonds of 2013-Series 166 | | | 0.25 | | | | 2013 | | | | 2018 | | | | 17,000 | |
1.00% Bonds of 2013-Series 167 | | | 1.0 | | | | 2013 | | | | 2018 | | | | 17,000 | |
1.00% Bonds of 2014-Series 168 | | | 1.0 | | | | 2014 | | | | 2019 | | | | 16,000 | |
0.50% Bonds of 2014-Series 169 | | | 0.50 | | | | 2014 | | | | 2019 | | | | 16,000 | |
0.25% Bonds of 2014-Series 170 | | | 0.25 | | | | 2014 | | | | 2019 | | | | 16,000 | |
0.00% Bonds of 2015-Series 171 | | | 0.00 | | | | 2015 | | | | 2020 | | | | 20,000 | |
0.25% Bonds of 2015-Series 172 | | | 0.25 | | | | 2015 | | | | 2020 | | | | 19,000 | |
0.00% Bonds of 2016-Series 173 | | | 0.00 | | | | 2016 | | | | 2021 | | | | 21,000 | |
0.00% Bonds of 2016-Series 174 | | | 0.00 | | | | 2016 | | | | 2021 | | | | 19,000 | |
0.00% Bonds of 2017-Series 175 | | | 0.00 | | | | 2017 | | | | 2022 | | | | 18,000 | |
0.00% Bonds of 2017-Series 176 | | | 0.00 | | | | 2017 | | | | 2022 | | | | 17,000 | |
| | | | | | | | | | | | | | | | |
Total Five-Year Federal Notes | | | | | | | | | | | | | | | 213,000 | |
| | | | | | | | | | | | | | | | |
| (1) | Five-Year Federal Notes (Bundesobligationen) are evidenced by book entry, and no certificates are issued. Maturities are approximately five years. No redemption prior to maturity. |
4 FEDERAL TREASURY NOTES (1)
| | | | | | | | | | | | | | | | |
Title | | Interest
Rate | | | Year of
Issue | | | Maturity | | | Aggregate principal
amount outstanding as of
December 31, 2017 | |
| | | (% per
annum) | | | | | | | | | (EUR in millions) | |
0.00% Notes of 2016 | | | 0.00 | | | | 2016 | | | | 2018 | | | | 13,000 | |
0.00% Notes of 2016 (II) | | | 0.00 | | | | 2016 | | | | 2018 | | | | 14,000 | |
0.00% Notes of 2016 (III) | | | 0.00 | | | | 2016 | | | | 2018 | | | | 13,000 | |
0.00% Notes of 2016 (IV) | | | 0.00 | | | | 2016 | | | | 2018 | | | | 13,000 | |
0.00% Notes of 2017 | | | 0.00 | | | | 2016 | | | | 2019 | | | | 13,000 | |
0.00% Notes of 2017 (II) | | | 0.00 | | | | 2016 | | | | 2019 | | | | 13,000 | |
0.00% Notes of 2017 (III) | | | 0.00 | | | | 2016 | | | | 2019 | | | | 13,000 | |
0.00% Notes of 2017 (IV) | | | 0.00 | | | | 2016 | | | | 2019 | | | | 8,000 | |
| | | | | | | | | | | | | | | | |
Total Federal Treasury Notes | | | | | | | | | | | | | | | 100,000 | |
| | | | | | | | | | | | | | | | |
| (1) | Federal Treasury Notes (Bundesschatzanweisungen) are evidenced by book-entry, and no certificates are issued. Maturities are two years. No redemption prior to maturity. |
G-43
5. FEDERAL SAVINGS NOTES (1)
| | | | | | | | | | | | |
| | | Interest Rate | | | Year of Issue | | Maturity | | Aggregate principal
amount outstanding as of
December 31, 2017 | |
| | | (% per annum) | | | | | | | (EUR in millions) | |
| | | | |
Federal Savings Notes | | | 0.0001% to 4.5% | | | 2011 to 2012 | | 2018 to 2019 | | | 289 | |
|
| 6. TREASURY DISCOUNT PAPER (2) | |
| | | | |
| | | Interest Rate(3) | | | Year of Issue | | Maturity | | Aggregate principal
amount outstanding as of
December 31, 2017 | |
| | | (% per annum) | | | | | | | (EUR in millions) | |
Treasury Discount Paper | | | -0.77 to -0.69 | | | 2017 | | 2018 | | | 10,000 | |
|
| 7. GERMAN GOVERNMENT DAY-BONDS | |
| | | | |
| | | Interest Rate | | | Year of Issue | | Maturity | | Aggregate principal
amount outstanding as of
December 31, 2017 | |
| | | (% per annum) | | | | | | | (EUR in millions) | |
| | | | |
German Government Day-Bonds | | | variable, tied to EONIA | | | 2008 | | unlimited | | | 966 | |
|
| 8. BORROWERS’NOTELOANS (4) | |
| | | | |
| | | Interest Rate | | | Year of Issue | | Maturity | | Aggregate principal
amount outstanding as of
December 31, 2017 | |
| | | (% per annum) | | | | | | | (EUR in millions) | |
| | | | |
Borrowers’ note loans | | | | | | | | | | | | |
(Schuldscheindarlehen) | | | 0.12% to 6.75% | | | 1954 to 2014 | | 2018 to 2037 | | | 9,091 | |
| (1) | Federal Savings Notes (Bundesschatzbriefe) are evidenced by book entry and no certificates are issued. Maturities are six or seven years. The terms of the Federal Savings Notes provide for interest rates that increase during the term of the bonds. In addition, the seven-year Federal Savings Notes provide for payment of compounded interest at maturity or upon redemption prior to maturity. No redemption is permitted prior to maturity. Since January 1, 2013 the Federal Republic of Germany stopped offering new Federal savings notes and Federal Treasury financing papers. |
| (2) | Treasury Discount Papers (Unverzinsliche Schatzanweisungen) are issued at a discount and repaid at par value on the maturity date. No interest payments are made during the term of the paper. The papers are auctioned and intended for institutional investors. Maturities range from six months to twelve months. No redemption is permitted prior to maturity. |
| (3) | Reflects annual interest rate paid to the holder by way of the initial issue discount. No redemption is permitted prior to maturity. |
| (4) | Borrowers’ note loans (Schuldscheindarlehen) are an instrument of the German capital market where the lending entity, generally an institutional investor, receives a certificate evidencing its loan to the borrower and the term of such loans. The certificate generally authorizes at least three assignments. No redemption is permitted prior to maturity. |
G-44
9. OTHER LIABILITIES
| | | | | | | | | | | | | | | | |
Title | | Interest Rate | | | Year of incurrence | | | Maturity | | | Aggregate principal
amount outstanding as of
December 31, 2017 | |
| | | (% per annum) | | | | | | | | | (EUR in millions) | |
Other debt (1) | | | 0% to 3% | | | | Various | | | | Various | | | | 4,475 | |
– Other debt (2) | | | Various | | | | Various | | | | Various | | | | 40 | |
| (1) | Includes mainly equalization and covering claims of the Deutsche Bundesbank, other banks and insurance companies in connection with the currency reform of 1948. |
| (2) | Includes liabilities of the Federal Government to repay amounts received from the Investitionshilfeabgabe, a special duty levied on income, the proceeds of which were to be used to promote investments. |
Source: Bundesrepublik Deutschland Finanzagentur GmbH, Übersicht über den Stand der Schuld der Bundesrepublik Deutschland, published on January 9, 2018 (http://www.deutsche-finanzagentur.de/fileadmin/user_upload/finanzagentur/pdf/schuldenstand_jahresarchiv.pdf).
G-45
II. GUARANTEES BY THE FEDERAL GOVERNMENT (1)
| | | | | | | | |
| | | Aggregate principal amount outstanding
as of December 31, | |
Purpose of Guarantees | | 2016 | | | 2015 | |
| | | (EUR in millions) | |
Export finance loans (including rescheduled loans) (2) | | | 128,630 | | | | 132,778 | |
Untied loans; direct foreign investments by German companies; Loans of the European Investment Bank to non-EU borrowers | | | 44,918 | | | | 45,075 | |
Loans in connection with EU agricultural policy measures | | | 0 | | | | 0 | |
Loans to domestic corporations and for projects in areas of agriculture, fishing and housing construction | | | 96,961 | | | | 106,027 | |
Contributions to international financing institutions | | | 60,067 | | | | 56,848 | |
Co-financing of bilateral projects of German financial co-operation | | | 17,556 | | | | 13,285 | |
Successor agencies to Treuhandanstalt | | | 1,009 | | | | 1,009 | |
Interest compensation guarantees | | | 10,000 | | | | 8,000 | |
| | | | | | | | |
Total guarantees pursuant to the 2010 German Budget Act | | | 359,142 | | | | 363,023 | |
| | | | | | | | |
Guarantee for a loan to Greece according to the German Financial Stability Act | | | 22,400 | | | | 22,400 | |
| | | | | | | | |
Loan guarantees under the Act on Guarantees pertaining to the European Financial Stability Facility | | | 85,932 | | | | 84,700 | |
Total guarantees | | | 467,474 | | | | 470,123 | |
| | | | | | | | |
| (1) | Does not include guarantees under the KfW Law with respect to money borrowed, bonds issued and derivative transactions entered into by KfW. |
| (2) | Includes export finance loans extended by KfW IPEX-Bank guaranteed by the Federal Republic through Euler Hermes Aktiengesellschaft (“HERMES”), the official German export credit insurer. |
Source: Bundesministerium der Finanzen, Finanzbericht 2018 (https://www.bundesfinanzministerium.de/Content/DE/Standardartikel/Themen/Oeffentliche_
Finanzen/Wirtschafts_und_Finanzdaten/Finanzberichte/Finanzbericht-2018-anl.pdf?__blob=publicationFile&v=1), Overview 4, page 343.
G-46
III. LIABILITIES TO INTERNATIONAL FINANCIAL ORGANIZATIONS
The Federal Republic is obligated to contribute to the capital subscriptions and, in some cases, to additional financing, according to the requirements of each respective membership. Such contributions were in many cases stated initially in 1944 with one U.S. dollar being an equivalent to 0.888671 grams of gold, and later – with the creation of the Special Drawing Right (“SDR”) – being an equivalent to the SDR at the same value. The SDR was established by an amendment to the Articles of Agreement of the IMF in July 1969. From July 1, 1974 to June 1978, the exchange rate between world currencies and the SDR was determined on the basis of a basket of 18 currencies, including the U.S. dollar, which accounted for approximately one-third of the value of the basket. From July 1978 to December 31, 1980, the exchange rate was determined on the basis of a basket of 15 currencies. From 1981 to 2000, the basket was further reduced to the five key currencies, including the U.S. dollar. The value of the SDR, the possible inclusion of new currencies in the basket, the weight of each of these currencies in the basket, and the financial instruments used in determining the interest rate on the SDR are reviewed every five years. During the last review in November 2015, it was decided that from October 2016 onwards, the Chinese currency renminbi will be a part of the SDR basket. With effect from October 1, 2016, the SDR basket consists of five currencies with the following weights: U.S. dollar (42%), euro (31%), Chinese renminbi (11%), Japanese yen (8%) and pound sterling (8%).
SUBSCRIPTIONS OR COMMITMENTS BY THE FEDERAL REPUBLIC
TO INTERNATIONAL FINANCIAL ORGANIZATIONS
AS OF END OF DECEMBER, 2017
| | | | | | | | |
Name of organization | | Subscription or
commitment by the
Federal Republic (1) | | | Amount paid in | |
| | | (USD in millions) | |
IMF (2) | | | 37,930.8 | | | | 37,930.8 | |
International Bank for Reconstruction and Development (IBRD) (3) | | | 11,650.2 | | | | 717.9 | |
International Development Association (IDA) (3)(4) | | | 25,585.8 | | | | 23,187.0 | |
International Finance Corporation (IFC) (3)(4) | | | 128.9 | | | | 128.9 | |
European Investment Bank (EIB) (5) | | | 41,315.5 | | | | 3,685 | |
African Development Bank (AfDB) (3) | | | 3,835.0 | | | | 245.2 | |
African Development Fund (AfDF) (3) | | | 4,420.2 | | | | 4,032.3 | |
Asian Development Bank (AsDB) (3) | | | 6,539.7 | | | | 327.1 | |
Asian Development Fund (AsDF) (3) | | | 1,933.0 | | | | 1,752.0 | |
Inter-American Development Bank (IDB) (3) | | | 3,368.7 | | | | 242.3 | |
Inter-American Investment Corporation (IIC) (3) | | | 13.3 | | | | 13.3 | |
Fund for Special Operations (FSO) (3) | | | — | | | | — | |
International Fund for Agricultural Development (IFAD) (3) | | | 522.0 | | | | 500.0 | |
Caribbean Development Bank (CDB) (3) | | | 106.6 | | | | 23.5 | |
Special Development Fund of the Caribbean Development Bank (SDF) (3) | | | 110.3 | | | | 100.1 | |
European Bank for Reconstruction and Development (EBRD) (5) | | | 3,066.0 | | | | 639.5 | |
Council of Europe Development Bank (CEB) (5) | | | 1,098.3 | | | | 121.9 | |
Asia Infrastructure Investment Bank (AIIB) (3) | | | 4,484.2 | | | | 538.1 | |
| (1) | Subscriptions are in part committed in USD, SDR or EUR. SDR or EUR commitments are converted to USD at year-end exchange rates, except that certain SDR commitments are converted at the fixed conversion rate of SDR 1 = USD 1.4241. |
| (2) | Source: computation provided by the Ministry of Finance based on data provided by the IMF; the subscription (quota) is fully paid in by the Deutsche Bundesbank. The foreign currency part of the quota (25% of the subscription) and the Deutsche Bundesbank’s further contributions to Fund’s financing are part of the foreign currency reserves of the Deutsche Bundesbank. The government does not provide any guarantees or provisions for risks of IMF loans. |
| (3) | Source: computation provided by the Ministry of Finance and the Ministry for Economic Cooperation and Development. |
| (4) | Source: IFC and IDA: World Bank Corporate Secretariat, April 2018. |
| (5) | Source: computation provided by the Ministry of Finance based on euro exchange rate of the European Central Bank at year-end 2017 of EUR 1 per USD 1.1993. |
G-47