united states
securities and exchange commission
washington, d.c. 20549
form n-csr
certified shareholder report of registered management
investment companies
Investment Company Act file number 811-22756
Advisors Preferred Trust
(Exact name of registrant as specified in charter)
225 Pictoria Drive, Suite 450, Cincinnati, OH 45246
(Address of principal executive offices) (Zip code)
Richard Malinowski, Gemini Fund Services, LLC.
80 Arkay Drive, Suite 110 Hauppauge, NY 11788
(Name and address of agent for service)
Registrant's telephone number, including area code: 631-470-2600
Date of fiscal year end: 6/30
Date of reporting period: 6/30/20
Item 1. Reports to Stockholders.

| Annual Report | |
| June 30, 2020 | |
| Quantified Managed Income Fund | Quantified Market Leaders Fund |
| Investor Class Shares QBDSX | Investor Class Shares QMLFX |
| Advisor Class Shares QBDAX | Advisor Class Shares QMLAX |
| Quantified Alternative Investment Fund | Quantified STF Fund |
| Investor Class Shares QALTX | Investor Class Shares QSTFX |
| Advisor Class Shares QALAX | Advisor Class Shares QSTAX |
| Quantified Pattern Recognition Fund | Quantified Tactical Fixed Income Fund |
| Investor Class Share QSPMX | Investor Class Shares QFITX |
| Quantified Evolution Plus Fund | Quantified Common Ground Fund |
| Investor Class Shares QEVOX | Investor Class Shares QCGDX |
1-855-64-QUANT (1-855-647-8268)
www.advisorspreferred.com
Distributed by Ceros Financial Services, Inc
| Beginning on January 1, 2021, as permitted by regulations adopted by the Securities and Exchange Commission, paper copies of the Funds’ shareholder reports like this one will no longer be sent by mail, unless you specifically request paper copies of the reports. Instead, the reports will be made available on the Funds’ website www.advisorspreferred.com and you will be notified by mail each time a report is posted and provided with a website link to access the report. |
| If you already elected to receive shareholder reports electronically, you will not be affected by this change and you need not take any action. You may elect to receive shareholder reports and other communications from the Funds electronically or to continue receiving paper copies of shareholder reports, which are available free of charge, by contacting your financial intermediary (such as a broker-dealer or bank) or, if you are a direct investor, by following the instructions included with paper Fund documents that have been mailed to you. |
August 21, 2020
Dear Shareholders:
This Annual Report for the Quantified Funds covers the period from July 1, 2019 – June 30. 2020. The Quantified Funds are a series of Funds, sub-advised by Flexible Plan Investments, Ltd., which are actively managed using dynamic asset allocation. They are created to work together in a portfolio to seek return and manage risk for an investor through changing market conditions.
The Quantified STF Fund returned 44.17% for the year for the Investor class shares and 43.29% for the Advisor class shares, versus a return of 33.78% for the NASDAQ 100 Total Return Index for the period. The Fund follows easily identifiable trends in the market in an attempt to generate gains, with rule sets that seek to take advantage of both up and down trends. The Fund uses NASDAQ 100 futures contracts to adjust its market exposure. The Fund began the period fully leveraged at 200% exposure to the NASDAQ 100 Index. The exposure fluctuated between 80% to 200% during the third and fourth quarters of calendar 2019, with the Fund fully leveraged at 200% at the beginning of 2020. At market close on February 24, leverage was reduced to 160% and the following day even further down to 80%, due to an increase in volatility. During March, exposure was once again cut back and thereafter ranged between 60% in the beginning of March to 40% mid-way through the month and ended the volatile quarter at 60%. At market close on April 3, exposure was increased to 80% and then increased to 100% on April 16 due to decreasing market volatility. On May 29, exposure changed to 200% due to a further reduction in market volatility. On June 11, exposure was cut back to 120% following uncertainty within markets that resulted in increased volatility. Towards the end of June, the Fund increased its exposure to 200% for one day at the close on June 25 and changed to 160% at the close on June 26 where it remained to finish the quarter.
The Quantified Alternative Investment Fund declined by -7.76% for the Investor class shares and by -8.26% for the Advisor class shares compared with a return of 3.09% for the HFRX Global Hedge Fund Index and 7.51% for the S&P 500 Total Return Index for the period. The Fund uses futures contracts as substitutes for certain asset classes and to adjust its market exposure. The Fund dynamically manages a ranked portfolio of alternative investments with the diversification and liquidity traditionally available only to hedge funds. The range-bound nature of the financial markets in the third quarter of calendar 2019 made it difficult for the trend-following strategy that positions securities within the sleeves to find a tradeable trend at the outset of the Fund’s fiscal year. Causing the largest drag on performance, however, was the infrastructure investment basket which ended the first quarter of 2020 down 21.96%. The Fund’s futures hedging exposure was negative for much of the period, creating a further drag on portfolio performance versus its alternative benchmarks.
The Quantified Common Ground Fund declined by -6.30% from its inception on December 27, 2019 to June 30, 2020 versus a decline of -4.30% of the S&P Composite 1500 Total Return Index for the same period. The Fund was developed to invest in common stocks and bonds of issuers that can be considered compliant with both ESG (Environmental, Social and Governance) and BRI (Biblically Responsible Investing) standards.
The Fund began reducing exposure to equity markets at the beginning of February, with remaining equity positions heavily invested in utilities and real estate, which helped the Fund avoid much of the market volatility during the quarter. The Fund further reduced stock exposure at the beginning of March and began the second quarter of 2020 with over 77% in cash due to the volatility in the markets in the previous quarter, with the majority of positions in Utilities and Real Estate. As the quarter progressed, the Fund increased its equity position, ending the quarter 32% in cash, pivoting more toward Healthcare (23% of the portfolio), Technology, and Materials.
The Quantified Evolution Plus Fund declined by -10.87% compared with a return of 5.71% for the S&P 500 Total Return Index for the period from inception on September 30, 2019 through June 20, 2020. The Fund utilizes a strategy that seeks strong absolute risk-adjusted returns on a wide variety of asset classes. The
1
Fund began 2020 largely exposed to international and domestic equities. However, as market conditions began to deteriorate, the Fund began to rotate into less risky securities. The Fund uses futures contracts as substitutes for certain asset classes and to adjust its market exposure. During March, the Fund was largely allocated to defensive asset classes: intermediate and long-term Treasuries and gold. As the second quarter of 2020 progressed, the Fund became slightly more aggressive, introducing small allocations to the S&P and NASDAQ. The Fund spent the majority of the quarter in lower risk securities, such as intermediate and long- term government bonds and gold, as the market came off of recent lows and a bear market in the first quarter. As the quarter progressed, the Fund became slightly more aggressive, introducing small allocations to the S&P and NASDAQ. The Fund experienced minimal drawdowns during the second quarter of 2020, navigating a fairly straight-line upward during the quarter, though it lagged the equity market’s raw returns.
The Quantified Managed Income Fund fell by -5.19% for the Investor class and by -5.76% for the Advisor class shares for the fiscal year, compared with a return of 8.74% for the Bloomberg Barclays U.S. Aggregate Bond Index for the period. The Fund selects income investments from a universe of bond, equity, REIT and MLP investments to create an optimized risk-adjusted return portfolio. The dividend-paying stock sleeve portion of the Fund lost 26.14% in the first quarter of 2020, but bounced back gaining 21.94% in the second quarter of 2020. The actively traded ultra-bond futures hedge contributed positively to the Fund’s performance throughout the period.
The Quantified Market Leaders Fund had returns of 17.48% for the period in the Investor class shares and 16.88% in the Advisor class shares, versus a return of 6.55% for the Wilshire 5000 Total Return Index during the same time frame. The Fund pursues an active asset allocation strategy designed to overweight portfolio investments into top-performing asset classes, while eliminating exposure to under-performing assets. The Fund uses total return swaps as substitutes for certain asset classes and to adjust its market exposure. Market conditions for the fourth quarter of calendar 2019 were close to ideal for the strategy of the Fund, and the algorithms that drive the Fund’s investments were able to take advantage of this. The Fund entered 2020 fully invested as the markets continued to make record highs. The second quarter of 2020 was the best performing quarter for the Fund since inception. It gained 18.5% for the quarter, which more than offset a small decline in the first quarter of 2020. The Fund moved from being only 9% invested at the start of the second quarter, following its defensive posture for most of the previous quarter, to being 91% invested. On June 1, the Fund’s broader momentum and trend indicator, the Market Environment Indicator, turned positive, signalling the use of leverage and a 151% invested position. This well-timed move resulted in a gain of 4.0% from 6/1-6/30 in the Fund, versus a smaller 1.5% gain in the S&P 500 Index.
The Quantified Pattern Recognition Fund returned 8.90% from its inception on August 30, 2019 through June 30, 2020, versus a return of 7.69% for the S&P 500 Total Return Index and 7.29% of a blended benchmark of 50% of the S&P 500 Total Return Index and 50% of the Bloomberg Barclays U.S. Aggregate Bond Index for the same period. The Fund seeks out daily patterns in the stock market that have been found to be determinative of probable future price direction. The Fund is typically a mean-reverting strategy, though some trend-following patterns are utilized. As the market transitioned from a bull market to a bear market in the first quarter of 2020, the algorithm did participate somewhat in downside movements while adapting to market conditions, mitigating the worst of the market drawdowns and reducing volatility, despite the occasional use of leverage. The Fund spent the majority of the latter half of March, as well as the latter half of May, in a market-neutral position with a small loss in the month of June. The Fund is re- optimized to find new market patterns each month, which helped the Fund change gears when the market switched from bear market to bull market in the second quarter of 2020.
The Quantified Tactical Fixed Income Fund returned 11.84% from its inception on September 13, 2019 through June 30, 2020, versus a gain of 7.71% in the Bloomberg Barclays U.S. Aggregate Bond Index for the same period. The Fund’s focus is to combine numerous computerized strategies to create a multi-strategy, dynamically risk-managed methodology for trading government and high yield bond market indexes represented in the ETF and futures markets. The Fund uses futures and total return swaps as substitutes for certain asset classes and to adjust its market exposure. The Fund held minimal allocations in long-term Treasuries during the fourth quarter of 2019, as longer-term indicators showed the environment was
2
unfavorable for these asset classes. In the first quarter of 2020, the Fund shifted and amassed significant allocations to long-term Treasuries as longer-term indicators showed the environment to be advantageous to them. This was particularly the case in the latter half of the quarter when the Fund held only a small position in high-yield bonds. These securities had fallen out of favor in the volatile equity market environment that commenced in late February. During the second quarter of 2020, the Fund continued to hold significant allocations to long-term Treasuries with some significant inverse position especially at the beginning of June. While they did prevent significant drawdowns to the Fund, there was a negative return contribution before the inverse positions were closed out.
Thank you for your confidence in the Quantified Funds. If you have any questions about the Funds, please contact us at our website www.flexibleplan.com/market hotline.
Very truly yours,
| Jerry Wagner | Catherine Ayers-Rigsby |
| Flexible Plan, Ltd. | Advisors Preferred, LLC |
| Sub-adviser | Adviser |
3
| Quantified Managed Income Fund |
| Portfolio Review (Unaudited) |
| June 30, 2020 |
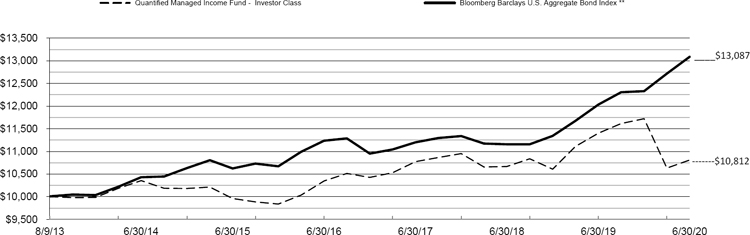
The Fund’s performance figures* for the periods ended June 30, 2020, as compared to its benchmark:
| Annualized | |||||
| Since Inception | Since Inception | ||||
| One Year | Three Year | Five Year | March 18, 2016 | August 9, 2013 | |
| Quantified Managed Income Fund - Investor Class | (5.19)% | 0.12% | 1.65% | N/A | 1.14% |
| Quantified Managed Income Fund - Advisor Class | (5.76)% | (0.54)% | N/A | 1.15% | N/A |
| Bloomberg Barclays U.S. Aggregate Bond Index ** | 8.74% | 5.32% | 4.30% | 4.29% | 3.98% |
Comparison of Change in Value of a $10,000 Investment.
Since Inception through June 30, 2020 +
| + | Inception date is August 9, 2013 |
| * | The Performance data quoted is historical. Past performance is no guarantee of future results. Current performance may be higher or lower than the performance data quoted. The principal value and investment return of an investment will fluctuate so that your shares, when redeemed, may be worth more or less than their original cost. The returns shown do not reflect the deduction of taxes that a shareholder would pay on Fund distributions or on the redemptions of Fund shares. The Fund’s total annual fund operating expense ratio, as provided in the Fund’s prospectus dated October 31, 2019, was 1.68% for Investor Class and 2.28% for Advisor Class shares. For performance information current to the most recent month-end, please call 1-855-647-8268. Investors should consider the investment objectives, risks, and charges and expenses of the Fund carefully before investing. The Fund’s prospectus and summary prospectus contain these as well as other information about the Fund and should be read carefully before investing. A prospectus or summary prospectus may be obtained by calling 1-855-647-8268. |
| ** | The Bloomberg Barclays U.S. Aggregate Bond Index is an unmanaged index comprised of U.S. investment grade, fixed rate bond market securities, including government, government agency, corporate and mortgage-backed securities. Investors cannot invest directly in an index. It is also known as Barclays U.S. Aggregate Bond Index. |
| Portfolio holdings by types of investments as of June 30, 2020 are as follows: | ||||
| Holdings by Type of Investment ^: | % of Net Assets | |||
| Common Stocks | 9.8 | % | ||
| Exchange Traded Funds: | ||||
| Debt Funds | 14.7 | % | ||
| Money Market Funds | 74.4 | % | ||
| Collateral For Securities Loaned | 0.6 | % | ||
| Other Assets less Liabilities | 0.5 | % | ||
| 100.0 | % | |||
| ^ | The Holdings by Type of Investment detail does not include derivative exposure. |
Please refer to the Portfolio of Investments in this annual report for a detailed listing of the Fund’s holdings.
4
| Quantified Managed Income Fund |
| PORTFOLIO OF INVESTMENTS |
| June 30, 2020 |
| Shares | Value | |||||||
| COMMON STOCKS - 9.8% | ||||||||
| AEROSPACE & DEFENSE - 1.0% | ||||||||
| 1,554 | General Dynamics Corp. | $ | 232,261 | |||||
| 774 | Northrop Grumman Corp. | 237,959 | ||||||
| 21,548 | Park Aerospace Corp. | 240,045 | ||||||
| 710,265 | ||||||||
| AUTO MANUFACTURERS - 0.3% | ||||||||
| 3,171 | PACCAR, Inc. | 237,349 | ||||||
| BEVERAGES - 0.3% | ||||||||
| 5,215 | Coca-Cola Co. | 233,006 | ||||||
| BIOTECHNOLOGY - 0.3% | ||||||||
| 1,009 | Amgen, Inc. | 237,983 | ||||||
| CHEMICALS - 0.3% | ||||||||
| 597 | NewMarket Corp. | 239,087 | ||||||
| �� | ||||||||
| COMPUTERS - 0.3% | ||||||||
| 650 | Apple, Inc. | 237,120 | ||||||
| FOOD - 1.0% | ||||||||
| 3,896 | General Mills, Inc. | 240,188 | ||||||
| 2,897 | John B Sanfilippo & Son, Inc. | 247,201 | ||||||
| 3,580 | Kellogg Co. (a) | 236,495 | ||||||
| 723,884 | ||||||||
| HOUSEWARES - 0.7% | ||||||||
| 1,108 | The Clorox Co. | 243,062 | ||||||
| 3,588 | The Toro Co. | 238,028 | ||||||
| 481,090 | ||||||||
| INSURANCE - 0.3% | ||||||||
| — | Fidelity National Financial, Inc. | 1 | ||||||
| 2,966 | The Progressive Corp. | 237,606 | ||||||
| 237,607 | ||||||||
| INTERNET - 0.4% | ||||||||
| 4,759 | eBay, Inc. | 249,610 | ||||||
| MISCELLANEOUS MANUFACTURERS - 0.3% | ||||||||
| 1,503 | 3M Co. | 234,453 | ||||||
| PHARMACEUTICALS - 1.3% | ||||||||
| 1,491 | Eli Lilly & Co. | 244,792 | ||||||
| 1,660 | Johnson & Johnson | 233,446 | ||||||
| 3,080 | Merck & Co., Inc. | 238,176 | ||||||
| 7,244 | Pfizer, Inc. | 236,879 | ||||||
| 953,293 | ||||||||
| REIT - 0.3% | ||||||||
| 1,983 | CoreSite Realty Corp. | 240,062 | ||||||
| RETAIL - 1.0% | ||||||||
| 1,251 | Dollar General Corp. | 238,328 | ||||||
| 1,957 | Target Corp. | 234,703 | ||||||
| 1,819 | Tractor Supply Co. | 239,726 | ||||||
| 712,757 | ||||||||
| SOFTWARE - 0.7% | ||||||||
| 1,905 | Broadridge Financial Solutions, Inc. | 240,392 | ||||||
| 1,663 | Citrix Systems, Inc. | 245,974 | ||||||
| 486,366 | ||||||||
| TELECOMMUNICATIONS - 0.3% | ||||||||
| 4,317 | Verizon Communications, Inc. | 237,996 | ||||||
| TRANSPORTATIONS - 1.0% | ||||||||
| 3,091 | CH Robinson Worldwide, Inc. (a) | 244,374 | ||||||
| 1,994 | United Parcel Serivce, Inc. | 221,693 | ||||||
| 5,555 | Werner Enterprises, Inc. | 241,809 | ||||||
| 707,876 | ||||||||
| TOTAL COMMON STOCKS (Cost - $6,858,363) | 7,159,804 | |||||||
See accompanying notes to financial statements.
5
| Quantified Managed Income Fund |
| PORTFOLIO OF INVESTMENTS (Continued) |
| June 30, 2020 |
| Shares | Value | |||||||
| EXCHANGE TRADED FUNDS - 14.7% | ||||||||
| DEBT FUNDS - 14.7% | ||||||||
| 22,089 | iShares 7-10 Year Treasury Bond ETF | $ | 2,691,986 | |||||
| 22,777 | iShares Core U.S. Aggregate Bond ETF | 2,692,469 | ||||||
| 54,268 | SPDR Doubleline Total Return Tactical ETF | 2,688,979 | ||||||
| 30,484 | Vanguard Total Bond Market ETF | 2,692,957 | ||||||
| TOTAL EXCHANGE TRADED FUNDS (Cost - $10,462,976) | 10,766,391 | |||||||
| SHORT-TERM INVESTMENTS - 74.4% | ||||||||
| MONEY MARKET FUNDS - 74.4% | ||||||||
| 27,181,397 | Fidelity Investments Money Market Funds - Government Portfolio - Class I 0.06% (b) | 27,181,397 | ||||||
| 27,181,396 | First American Government Obligations Fund - Class Z 0.06% (b) | 27,181,396 | ||||||
| TOTAL SHORT-TERM INVESTMENTS (Cost - $54,362,793) | 54,362,793 | |||||||
| COLLATERAL FOR SECURITIES LOANED - 0.6% | ||||||||
| 402,674 | Mount Vernon Liquid Assets Portfolio, LLC - 0.34% (b) (c) | |||||||
| TOTAL COLLATERAL FOR SECURITIES LOANED (Cost - $402,674) | 402,674 | |||||||
| TOTAL INVESTMENTS - 99.5% (Cost - $72,086,806) | $ | 72,691,662 | ||||||
| OTHER ASSETS LESS LIABILITIES - 0.5% | 374,517 | |||||||
| NET ASSETS - 100.0% | $ | 73,066,179 | ||||||
| ETF | Exchange Traded Fund REIT Real Estate Investment Trust |
| (a) | All or a portion of the security is on loan. Total loaned securities had a value of $400,222 at June 30, 2020. |
| (b) | Money market fund; interest rate reflects seven-day effective yield on June 30, 2020. |
| (c) | Security purchased with cash proceeds of securities lending collateral. |
| FUTURES CONTRACTS | |||||||||||||
| OPEN LONG FUTURES CONTRACTS | |||||||||||||
| No. of | Notional Value at | Unrealized | |||||||||||
| Contracts | Name | Expiration | June 30, 2020 | (Depreciation) | |||||||||
| 10 | Ultra U.S. Treasury T-Bonds | September-20 | $ | 2,181,560 | $ | (17,547 | ) | ||||||
| OPEN SHORT FUTURES CONTRACTS | |||||||||||||
| No. of | Notional Value at | Unrealized | |||||||||||
| Contracts | Name | Expiration | June 30, 2020 | (Depreciation) | |||||||||
| 47 | S&P 500 E-mini | September-20 | $ | 7,261,970 | $ | (143,157 | ) | ||||||
See accompanying notes to financial statements.
6
| Quantified Market Leaders Fund |
| Portfolio Review (Unaudited) |
| June 30, 2020 |
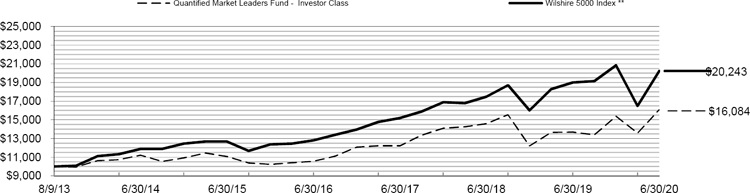
The Fund’s performance figures* for the periods ended June 30, 2020, as compared to its benchmark:
| Annualized | |||||
| Since Inception | Since Inception | ||||
| One Year | Three Year | Five Year | March 18, 2016 | August 9, 2013 | |
| Quantified Market Leaders Fund - Investor Class | 17.48% | 9.57% | 7.77% | N/A | 7.14% |
| Quantified Market Leaders Fund - Advisor Class | 16.88% | 8.92% | N/A | 10.43% | N/A |
| Wilshire 5000 Total Market Return Index ** | 6.55% | 10.02% | 9.94% | 12.17% | 10.78% |
Comparison of Change in Value of a $10,000 Investment.
Since Inception through June 30, 2020 +
| + | Inception date is August 9, 2013 |
| * | The performance data quoted is historical. Past performance is no guarantee of future results. Current performance may be higher or lower than the performance data quoted. The principal value and investment return of an investment will fluctuate so that your shares, when redeemed, may be worth more or less than their original cost. The returns shown do not reflect the deduction of taxes that a shareholder would pay on Fund distributions or on the redemptions of Fund shares. The Fund’s total annual fund operating expense ratio, as provided in the Fund’s prospectus dated October 31, 2019, was 1.73% for Investor Class and 2.33% for Advisor Class shares. For performance information current to the most recent month-end, please call 1-855-647-8268. Investors should consider the investment objectives, risks, and charges and expenses of the Fund carefully before investing. The Fund’s prospectus and summary prospectus contain these as well as other information about the Fund and should be read carefully before investing. A prospectus or summary prospectus may be obtained by calling 1-855-647-8268. |
| ** | The Wilshire 5000 Total Market Return Index or more simply the Wilshire 5000 is an unmanaged composite of U.S. traded equity securities with readily available price data and includes the reinvestment of dividends. This index is widely used by professional investors as a performance benchmark for large-cap stocks. Investors may not invest in an index directly; unlike the Fund’s returns, the index does not reflect any fees or expenses. |
| Portfolio holdings by types of investments as of June 30, 2020 are as follows: | ||||
| Holdings by Type of Investment: ^ | % of Net Assets | |||
| Exchange Traded Funds: | ||||
| Equity Funds | 80.8 | % | ||
| Money Market Funds | 14.6 | % | ||
| Other Assets Less Liabilities | 4.6 | % | ||
| 100.0 | % | |||
| ^ | The Holdings by Type of Investment detail does not include derivative exposure. |
Please refer to the Portfolio of Investments in this annual report for a detailed listing of the Fund’s holdings.
7
| Quantified Market Leaders Fund |
| PORTFOLIO OF INVESTMENTS |
| June 30, 2020 |
| Shares | Value | |||||||
| EXCHANGE TRADED FUNDS - 80.8% | ||||||||
| EQUITY FUNDS - 80.8% | ||||||||
| 280,518 | Health Care Select Sector SPDR Fund | $ | 28,071,436 | |||||
| 265,704 | iShares MSCI Emerging Markets ETF | 10,625,503 | ||||||
| 223,413 | iShares Russell 1000 Growth ETF | 42,884,125 | ||||||
| 22,213 | iShares Russell 2000 Growth ETF | 4,595,203 | ||||||
| 258,516 | Technology Select Sector SPDR Fund | 27,012,337 | ||||||
| TOTAL EXCHANGE TRADED FUNDS (Cost - $104,499,801) | 113,188,604 | |||||||
| SHORT-TERM INVESTMENTS - 14.6% | ||||||||
| MONEY MARKET FUNDS - 14.6% | ||||||||
| 10,230,783 | Fidelity Investments Money Market Funds - Government Portfolio - Class I 0.06% (a) | 10,230,783 | ||||||
| 10,230,783 | First American Government Obligations Fund - Class Z 0.06% (a) | 10,230,783 | ||||||
| TOTAL SHORT-TERM INVESTMENTS (Cost - $20,461,566) | 20,461,566 | |||||||
| TOTAL INVESTMENTS - 95.4% (Cost - $124,961,367) | $ | 133,650,170 | ||||||
| OTHER ASSETS LESS LIABILITIES - 4.6% | 6,413,145 | |||||||
| NET ASSETS - 100.0% | $ | 140,063,315 | ||||||
| ETF | Exchange Traded Fund |
| (a) | Money market fund; interest rate reflects seven-day effective yield on June 30, 2020. |
| TOTAL RETURN SWAPS | ||||||||||||||||||
| Number of | Notional Amount at | Termination | Unrealized | |||||||||||||||
| Reference Entity * | Shares | June 30, 2020 | Interest Rate Payable (1) | Counterparty | Date | Appreciation | ||||||||||||
| First Trust DJ Internet Index ETF | 156,650 | $ | 26,710,392 | 1-Mth USD_LIBOR plus 20 bp | BRC | 7/1/2021 | $ | 826,379 | ||||||||||
| iShares NASDAQ Biotechnology ETF | 195,160 | 26,676,420 | 1-Mth USD_LIBOR plus 20 bp | BRC | 7/1/2021 | 491,001 | ||||||||||||
| iShares Russell 2000 Growth ETF | 81,820 | 16,926,103 | 1-Mth USD_LIBOR plus 20 bp | BRC | 7/1/2021 | 381,511 | ||||||||||||
| iShares Russell Mid-Cap Growth ETF | 219,750 | 34,746,870 | 1-Mth USD_LIBOR plus 20 bp | BRC | 7/1/2021 | 420,394 | ||||||||||||
| Total | $ | 2,119,285 | ||||||||||||||||
BRC - Barclays Capital Inc.
| (1) | Interest rate is based upon predetermined notional amounts, which may be a multiple of the number of shares plus a specified spread. |
LIBOR - London Interbank Offered Rate
See accompanying notes to financial statements.
8
| Quantified Alternative Investment Fund |
| Portfolio Review (Unaudited) |
| June 30, 2020 |
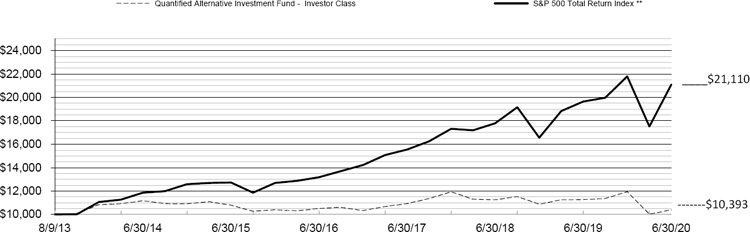
The Fund’s performance figures* for the periods ended June 30, 2020, as compared to its benchmark:
| Annualized | |||||
| Since Inception | Since Inception | ||||
| One Year | Three Year | Five Year | March 18, 2016 | August 9, 2013 | |
| Quantified Alternative Investment Fund - Investor Class | (7.76)% | (1.67)% | (0.76)% | N/A | 0.56% |
| Quantified Alternative Investment Fund - Advisor Class | (8.26)% | (2.25)% | N/A | (0.29)% | N/A |
| S&P 500 Total Return Index ** | 7.51% | 10.73% | 10.73% | 12.38% | 11.45% |
Comparison of Change in Value of a $10,000 Investment.
Since Inception through June 30, 2020 +
| + | Inception date is August 9, 2013 |
| * | The performance data quoted is historical. Past performance is no guarantee of future results. Current performance may be higher or lower than the performance data quoted. The principal value and investment return of an investment will fluctuate so that your shares, when redeemed, may be worth more or less than their original cost. The returns shown do not reflect the deduction of taxes that a shareholder would pay on Fund distributions or on the redemptions of Fund shares. The Fund’s total annual fund operating expense ratio, as provided in the Fund’s prospectus dated October 31, 2019, was 2.06% for Investor Class and 2.66% for Advisor Class shares. For performance information current to the most recent month-end, please call 1-855-647-8268. Investors should consider the investment objectives, risks, and charges and expenses of the Fund carefully before investing. The Fund’s prospectus and summary prospectus contain these as well as other information about the Fund and should be read carefully before investing. A prospectus or summary prospectus may be obtained by calling 1-855-647-8268. |
| ** | The S&P 500 Total Return Index is an unmanaged composite of 500 large capitalization companies and includes the reinvestment of dividends. This Index is widely used by professional investors as a performance benchmark for Large-Cap stocks. Investors may not invest in an index directly; unlike the Fund’s returns, the index does not reflect any fees or expenses. |
| Portfolio holdings by types of investments as of June 30, 2020 are as follows: | ||||
| Holdings by Type of Investment: ^ | % of Net Assets | |||
| Exchange Traded Funds: | ||||
| Alternative Funds | 5.0 | % | ||
| Balanced Fund | 0.6 | % | ||
| Commodity Funds | 0.0 | % | ||
| Equity Funds | 21.7 | % | ||
| Debt Funds | 19.9 | % | ||
| Mixed Allocation Fund | 0.2 | % | ||
| Open-End Mutual Funds: | ||||
| Alternative Funds | 10.9 | % | ||
| Balanced Fund | 3.0 | % | ||
| Commodity Funds | 2.3 | % | ||
| Equity Funds | 11.8 | % | ||
| Money Market Funds | 25.4 | % | ||
| Collateral for Securities Loaned | 2.3 | % | ||
| Liabilities in Excess of Other Assets | (3.1 | )% | ||
| 100.0 | % | |||
| ^ | The Holdings by Type of Investment detail does not include derivative exposure. |
Please refer to the Portfolio of Investments in this annual report for a detailed listing of the Fund’s holdings.
9
| Quantified Alternative Investment Fund |
| PORTFOLIO OF INVESTMENTS |
| June 30, 2020 |
| Shares | Value | |||||||
| EXCHANGE TRADED FUNDS - 47.4% | ||||||||
| ALTERNATIVE FUND - 5.0% | ||||||||
| 12,498 | IndexIQ ETF Trust - IQ Hedge Multi-Strategy Tracker ETF | $ | 378,939 | |||||
| BALANCED FUND - 0.6% | ||||||||
| 291 | SPDR SSgA Income Allocation ETF | 42,329 | ||||||
| COMMODITY FUND - 0.0% | ||||||||
| 106 | iShares MSCI Global Silver and Metals Miners ETF | 1,419 | ||||||
| DEBT FUNDS - 19.9% | ||||||||
| 2,747 | FlexShares Credit-Scored US Corporate Bond Index Fund | 149,890 | ||||||
| 10,691 | FlexShares iBoxx 3-Year Target Duration TIPS Index Fund | 270,268 | ||||||
| 2,150 | Invesco 1-30 Laddered Treasury ETF | 84,624 | ||||||
| 5,782 | Invesco Fundamental Investment Grade Corporate Bond ETF | 157,155 | ||||||
| 228 | iShares 10-20 Year Treasury Bond ETF | 38,156 | ||||||
| 2,815 | iShares Agency Bond ETF | 340,897 | ||||||
| 1,138 | iShares TIPS Bond ETF | 139,974 | ||||||
| 4,647 | SPDR Portfolio TIPS ETF (a) | 140,061 | ||||||
| 907 | Vident Core U.S. Bond Strategy Fund | 46,057 | ||||||
| 405 | WisdomTree Emerging Markets Local Debt Fund | 12,932 | ||||||
| 2,506 | WisdomTree Yield Enhanced US Aggregate Bond Fund Bond Fund | 134,873 | ||||||
| 1,514,887 | ||||||||
| EQUITY FUNDS - 21.7% | ||||||||
| 632 | ETFMG Prime Cyber Security ETF | 28,111 | ||||||
| 329 | First Trust Dow Jones Internet Index Fund * | 56,098 | ||||||
| 1,899 | First Trust Exchange-Traded Fund III-First Trust Long/Short Equity ETF | 77,859 | ||||||
| 199 | First Trust NYSE Arca Biotechnology Index Fund * | 33,386 | ||||||
| 318 | First Trust Technology AlphaDEX Fund | 26,518 | ||||||
| 1,223 | Global X Silver Miners ETF | 45,275 | ||||||
| 2,517 | Global X Social Media ETF * | 108,030 | ||||||
| 221 | Health Care Select Sector SPDR Fund | 22,115 | ||||||
| 125 | Invesco Dynamic Biotechnology & Genome ETF | 7,284 | ||||||
| 491 | Invesco Dynamic Software ETF | 56,367 | ||||||
| 12,876 | Invesco Global Clean Energy ETF | 204,166 | ||||||
| 364 | Invesco Solar ETF | 13,140 | ||||||
| 243 | Invesco WilderHill Clean Energy ETF | 9,873 | ||||||
| 346 | iShares Expanded Tech-Software Sector ETF (a) | 98,351 | ||||||
| 7,097 | iShares Global Clean Energy ETF | 88,854 | ||||||
| 2,361 | iShares Global Healthcare ETF | 162,390 | ||||||
| 177 | iShares Global Tech ETF | 41,691 | ||||||
| 279 | iShares Nasdaq Biotechnology ETF | 38,137 | ||||||
| 155 | iShares U.S. Healthcare ETF | 33,424 | ||||||
| 215 | iShares US Technology ETF | 58,007 | ||||||
| 596 | VanEck Vectors Biotech ETF | 97,106 | ||||||
| 1,383 | Vaneck Vectors Low Carbon Energy ETF * | 112,941 | ||||||
| 1,613 | VanEck Vectors Pharmaceutical ETF | 55,052 | ||||||
| 68 | VanEck Vectors Semiconductor ETF | 10,390 | ||||||
| 449 | Vanguard Communication Services ETF | 41,770 | ||||||
| 624 | Vanguard Health Care ETF | 120,214 | ||||||
| 1,646,549 | ||||||||
| MIXED ALLOCATION FUND - 0.2% | ||||||||
| 352 | SPDR SSgA Global Allocation ETF | 12,975 | ||||||
| TOTAL EXCHANGE TRADED FUNDS (Cost - $3,497,895) | 3,597,098 | |||||||
See accompanying notes to financial statements.
10
| Quantified Alternative Investment Fund |
| PORTFOLIO OF INVESTMENTS (Continued) |
| June 30, 2020 |
| Shares | Value | |||||||
| OPEN-END MUTUAL FUNDS - 28.0% | ||||||||
| ALTERNATIVE FUNDS - 10.9% | ||||||||
| 9,513 | BNY Mellon Dynamic Total Return Fund - Class I | $ | 150,685 | |||||
| 20,582 | Glenmede Secured Options Portfolio - Advisor Class | 231,759 | ||||||
| 8,678 | Guggenheim Multi-Hedge Strategies Fund - Class H | 221,549 | ||||||
| 17,538 | Infinity Q Diversified Alpha Fund - Class I * | 226,766 | ||||||
| 830,759 | ||||||||
| BALANCED FUND - 3.0% | ||||||||
| 22,870 | Gabelli ABC Fund - Class AAA | 229,157 | ||||||
| COMMODITY FUND - 2.3% | ||||||||
| 7,384 | Franklin Gold and Precious Metals Fund - Class A * | 173,081 | ||||||
| EQUITY FUNDS - 11.8% | ||||||||
| 8,645 | ACM Dynamic Opportunity Fund - Class A | 155,091 | ||||||
| 6,873 | Gateway Fund - Class A | 230,918 | ||||||
| 1,268 | Rydex Series Precious Metals Fund - Investor Class | 54,930 | ||||||
| 16,784 | The Arbitrage Fund - Institutional Class | 225,913 | ||||||
| 13,133 | The Merger Fund - Investor Class | 225,231 | ||||||
| 892,083 | ||||||||
| TOTAL OPEN-END MUTUAL FUNDS (Cost - $2,126,403) | 2,125,080 | |||||||
| SHORT-TERM INVESTMENTS - 25.4% | ||||||||
| MONEY MARKET FUNDS - 25.4% | ||||||||
| 965,900 | Fidelity Investments Money Market Funds - Government Portfolio - Class I 0.06% (b) | 965,900 | ||||||
| 965,900 | First American Government Obligations Fund - Class Z 0.06% (b) | 965,900 | ||||||
| TOTAL SHORT-TERM INVESTMENTS (Cost - $1,931,800) | 1,931,800 | |||||||
| COLLATERAL FOR SECURITIES LOANED - 2.3% | ||||||||
| 177,772 | Mount Vernon Liquid Assets Portfolio, LLC - 0.34% (b)(c) | |||||||
| TOTAL COLLATERAL FOR SECURITIES LOANED (Cost - $177,772) | 177,772 | |||||||
| TOTAL INVESTMENTS - 103.1% (Cost - $7,733,870) | $ | 7,831,750 | ||||||
| LlABILITIES IN EXCESS OF OTHER ASSETS - (3.1)% | (236,923 | ) | ||||||
| NET ASSETS - 100.0% | $ | 7,594,827 | ||||||
| * | Non-Income producing investment |
| ETF | Exchange Traded Fund |
| TIPS | Treasury Inflation-Protected Securities |
| (a) | All or a portion of the security is on loan. Total loaned securities had a value of $175,148 at June 30, 2020. |
| (b) | Money market fund; interest rate reflects seven-day effective yield on June 30, 2020. |
| (c) | Security purchased with cash proceeds of securities lending collateral. |
| FUTURES CONTRACTS | ||||||||||||||
| OPEN LONG FUTURES CONTRACTS | ||||||||||||||
| No. of | Notional Value at | Unrealized | ||||||||||||
| Contracts | Name | Expiration | June 30, 2020 | Appreciation | ||||||||||
| 1 | NASDAQ 100 E-Mini | September-20 | $ | 202,946 | $ | 5,496 | ||||||||
See accompanying notes to financial statements.
11
| Quantified STF Fund |
| Portfolio Review (Unaudited) |
| June 30, 2020 |
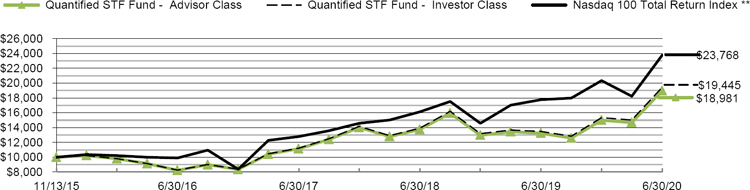
The Fund’s performance figures* for the periods ended June 30, 2020, as compared to its benchmark:
| Annualized | |||
| Since Inception | |||
| One Year | Three Year | November 13, 2015 | |
| Quantified STF Fund - Investor Class | 44.17% | 20.11% | 15.44% |
| Quantified STF Fund - Advisor Class | 43.29% | 19.40% | 14.84% |
| Nasdaq 100 Total Return Index ** | 33.78% | 22.92% | 20.56% |
Comparison of Change in Value of a $10,000 Investment.
Since Inception through June 30, 2020 +
| + | Inception date is November 13, 2015 |
| * | The performance data quoted is historical. Past performance is no guarantee of future results. Current performance may be higher or lower than the performance data quoted. The principal value and investment return of an investment will fluctuate so that your shares, when redeemed, may be worth more or less than their original cost. The returns shown do not reflect the deduction of taxes that a shareholder would pay on Fund distributions or on the redemptions of Fund shares. The Fund’s total annual fund operating expense ratio, as provided in the Fund’s prospectus dated October 31, 2019, was 1.70% for Investor Class and 2.30% for Advisor Class shares. For performance information current to the most recent month-end, please call 1-855-647-8268. Investors should consider the investment objectives, risks, and charges and expenses of the Fund carefully before investing. The Fund’s prospectus and summary prospectus contain these as well as other information about the Fund and should be read carefully before investing. A prospectus or summary prospectus may be obtained by calling 1-855-647-8268. |
| ** | The Nasdaq 100 Total Return Index includes 100 of the largest domestic and international non-financial companies listed on the NASDAQ Stock Market based on market capitalization. The index reflects companies across major industry groups including computer hardware and software, telecommunications, retail/wholesale trade and biotechnology. Index composition is reviewed on an annual basis in December. Investors may not invest in an index directly; unlike the Fund’s returns, the index does not reflect any fees or expenses. |
| Portfolio holdings by types of investments as of June 30, 2020 are as follows: | ||||
| Holdings by Sector: ^ | % of Net Assets | |||
| Agency Bonds | 2.8 | % | ||
| Bonds & Notes | 19.1 | % | ||
| Certificates of Deposit: | ||||
| Banks | 22.4 | % | ||
| Diversified Financial Services | 0.7 | % | ||
| Savings & Loans | 0.3 | % | ||
| Exchange Traded Funds: | ||||
| Debt Funds | 10.1 | % | ||
| Equity Fund | 0.1 | % | ||
| Money Market Funds | 28.7 | % | ||
| Collateral For Securities Loaned | 2.2 | % | ||
| Other Assets less Liabilities | 13.6 | % | ||
| 100.0 | % | |||
| ^ | The Holdings by Type of Investment detail does not include derivative exposure. |
Please refer to the Portfolio of Investments in this annual report for a detailed listing of the Fund’s holdings.
12
| Quantified STF Fund |
| PORTFOLIO OF INVESTMENTS |
| June 30, 2020 |
| Principal | Interest | |||||||||||
| Amount ($) | Rate (%) | Maturity | Value | |||||||||
| AGENCY BONDS - 2.8% | ||||||||||||
| SOVEREIGN - 2.8% | ||||||||||||
| 2,000,000 | Federal Home Loan Mortgage Corp. | 1.7500 | 10/17/2022 | $ | 2,000,975 | |||||||
| TOTAL AGENCY BONDS (Cost - $2,000,000) | ||||||||||||
| BONDS & NOTES - 19.1% | ||||||||||||
| AIRLINES - 1.4% | ||||||||||||
| 1,000,000 | Southwest Airlines Co. | 2.6500 | 11/5/2020 | 1,000,651 | ||||||||
| AUTO MANUFACTURERS - 0.7% | ||||||||||||
| 500,000 | Ford Motor Credit Co. LLC | 3.1570 | 8/4/2020 | 498,538 | ||||||||
| BANKS - 3.5% | ||||||||||||
| 500,000 | Credit Suisse Group Funding Guernsey Ltd. (a) | 3.1250 | 12/10/2020 | 505,784 | ||||||||
| 1,000,000 | Royal Bank of Canada | 2.5000 | 1/19/2021 | 1,011,839 | ||||||||
| 1,000,000 | Wells Fargo & Co. | 2.5500 | 12/7/2020 | 1,009,372 | ||||||||
| 2,526,995 | ||||||||||||
| FOOD - 2.9% | ||||||||||||
| 1,000,000 | Kellogg Co. | 4.0000 | 12/15/2020 | 1,015,162 | ||||||||
| 1,000,000 | Kroger Co. | 3.3000 | 1/15/2021 | 1,012,930 | ||||||||
| 2,028,092 | ||||||||||||
| INSURANCE - 1.4% | ||||||||||||
| 1,000,000 | American International Group, Inc. | 3.3750 | 8/15/2020 | 1,003,417 | ||||||||
| LEISURE TIME - 1.4% | ||||||||||||
| 1,000,000 | Carnival Corp. | 3.9500 | 10/15/2020 | 988,613 | ||||||||
| MACHINERY- CONSTRUCTION & MINING - 1.4% | ||||||||||||
| 1,000,000 | Caterpillar Financial Services Corp. | 2.5000 | 11/13/2020 | 1,007,960 | ||||||||
| PHARMACEUTICALS - 2.8% | ||||||||||||
| 1,000,000 | AbbVie, Inc. | 2.3000 | 5/14/2021 | 1,013,527 | ||||||||
| 500,000 | Cigna Corp. | 4.1250 | 9/15/2020 | 503,520 | ||||||||
| 500,000 | Mead Johnson Nutrition Co. | 3.0000 | 11/15/2020 | 504,785 | ||||||||
| 2,021,832 | ||||||||||||
| RETAIL - 2.1% | ||||||||||||
| 500,000 | Home Depot, Inc. | 2.0000 | 4/1/2021 | 505,969 | ||||||||
| 1,000,000 | McDonald’s Corp. | 3.5000 | 7/15/2020 | 1,001,097 | ||||||||
| 1,507,066 | ||||||||||||
| SOVEREIGN - 1.5% | ||||||||||||
| 1,000,000 | Export-Import Bank of Korea | 4.0000 | 1/29/2021 | 1,017,734 | ||||||||
| TOTAL BONDS & NOTES (Cost - $13,538,572) | 13,600,898 | |||||||||||
See accompanying notes to financial statements.
13
| Quantified STF Fund |
| PORTFOLIO OF INVESTMENTS (Continued) |
| June 30, 2020 |
| Principal | Interest | |||||||||||
| Amount ($) | Rate (%) | Maturity | Value | |||||||||
| CERTIFICATES OF DEPOSIT - 23.4% | ||||||||||||
| BANKS - 22.4% | ||||||||||||
| 1,000,000 | Ally Bank | 2.2000 | 12/28/2020 | $ | 1,010,502 | |||||||
| 1,000,000 | Bank of India/New York NY | 1.6500 | 7/15/2020 | 1,000,646 | ||||||||
| 500,000 | Barclays Bank Delaware | 1.9500 | 10/26/2020 | 503,016 | ||||||||
| 1,000,000 | BMO Harris Bank NA | 1.7500 | 2/27/2023 | 1,002,551 | ||||||||
| 500,000 | Capital One NA | 1.9500 | 9/28/2020 | 502,301 | ||||||||
| 1,000,000 | Comenity Capital Bank | 1.6500 | 3/18/2021 | 1,012,777 | ||||||||
| 1,000,000 | Discover Bank | 1.9500 | 10/5/2020 | 1,004,960 | ||||||||
| 250,000 | FirstBank Puerto Rico | 1.9500 | 10/13/2020 | 251,317 | ||||||||
| 1,000,000 | Goldman Sachs Bank USA/New York NY | 2.2500 | 12/9/2020 | 1,009,490 | ||||||||
| 1,000,000 | Lafayette Federal Credit Union | 1.7000 | 5/21/2021 | 1,013,949 | ||||||||
| 500,000 | Merrick Bank Corp/South Jordan UT | 1.9000 | 10/30/2020 | 503,010 | ||||||||
| 1,000,000 | Sallie Mae Bank | 2.1500 | 1/20/2021 | 1,011,313 | ||||||||
| 1,000,000 | TBK Bank SSB | 1.6000 | 2/25/2021 | 1,009,882 | ||||||||
| 1,000,000 | UBS Bank USA | 1.6500 | 6/7/2021 | 1,013,659 | ||||||||
| 1,000,000 | USAlliance Federal Credit Union | 1.9000 | 11/28/2022 | 1,007,268 | ||||||||
| 1,000,000 | Wells Fargo Bank NA | 1.9000 | 1/17/2023 | 1,041,614 | ||||||||
| 1,000,000 | Wells Fargo National Bank West | 1.9000 | 1/17/2023 | 1,041,614 | ||||||||
| 1,000,000 | World’s Foremost Bank | 1.7000 | 6/9/2021 | 1,013,731 | ||||||||
| 15,953,600 | ||||||||||||
| DIVERSIFIED FINANCIAL SERVICES - 0.7% | ||||||||||||
| 500,000 | Capital One Bank USA NA | 1.9500 | 9/28/2020 | 502,302 | ||||||||
| SAVINGS & LOANS - 0.3% | ||||||||||||
| 250,000 | Third Federal Savings & Loan Association of Cleveland | 1.9500 | 10/27/2020 | 251,521 | ||||||||
| TOTAL CERTIFICATES OF DEPOSIT (Cost - $16,500,000) | 16,707,423 | |||||||||||
| Shares | ||||||||||||
| EXCHANGE TRADED FUNDS - 10.2% | ||||||||||||
| DEBT FUNDS - 10.1% | ||||||||||||
| 56,500 | Invesco BulletShares 2020 Corporate Bond ETF | 1,202,320 | ||||||||||
| 56,250 | Invesco BulletShares 2021 Corporate Bond ETF | 1,202,062 | ||||||||||
| 55,000 | Invesco BulletShares 2022 Corporate Bond ETF | 1,200,100 | ||||||||||
| 23,750 | Invesco Ultra Short Duration ETF (a) | 1,197,950 | ||||||||||
| 10,750 | iShares Short Treasury Bond ETF | 1,190,455 | ||||||||||
| 38,250 | SPDR Portfolio Short Term Corporate Bond ETF | 1,198,755 | ||||||||||
| 7,191,642 | ||||||||||||
| EQUITY FUND - 0.1% | ||||||||||||
| 200 | Invesco QQQ Trust Series 1 | 49,520 | ||||||||||
| TOTAL EXCHANGE TRADED FUNDS (Cost - $7,184,628) | 7,241,162 | |||||||||||
| SHORT-TERM INVESTMENTS - 28.7% | ||||||||||||
| MONEY MARKET FUNDS - 28.7% | ||||||||||||
| 10,229,477 | Fidelity Investments Money Market Funds - Government Portfolio - Class I 0.06% (b) | 10,229,477 | ||||||||||
| 10,229,477 | First American Government Obligations Fund - Class Z 0.06% (b) | 10,229,477 | ||||||||||
| TOTAL SHORT-TERM INVESTMENTS (Cost - $20,458,954) | 20,458,954 | |||||||||||
See accompanying notes to financial statements.
14
| Quantified STF Fund |
| PORTFOLIO OF INVESTMENTS (Continued) |
| June 30, 2020 |
| Shares | Value | |||||||
| COLLATERAL FOR SECURITIES LOANED - 2.2% | ||||||||
| 1,577,101 | Mount Vernon Liquid Assets Portfolio, LLC - 0.34% (b)(c) | $ | 1,577,101 | |||||
| TOTAL COLLATERAL FOR SECURITIES LOANED (Cost - $1,577,101) | ||||||||
| TOTAL INVESTMENTS - 86.4% (Cost - $61,259,255) | $ | 61,586,513 | ||||||
| OTHER ASSETS LESS LIABILITIES - 13.6% | 9,731,026 | |||||||
| NET ASSETS - 100.0% | $ | 71,317,539 | ||||||
| ETF | Exchange Traded Fund |
| (a) | All or a portion of the security is on loan. Total loaned securities had a value of $1,544,442 at June 30, 2020. |
| (b) | Money market fund; interest rate reflects seven-day effective yield on June 30, 2020. |
| (c) | Security purchased with cash proceeds of securities lending collateral. |
| FUTURES CONTRACTS | ||||||||||||||
| OPEN LONG FUTURES CONTRACTS | ||||||||||||||
| No. of | Notional Value at | Unrealized | ||||||||||||
| Contracts | Name | Expiration | June 30, 2020 | Appreciation | ||||||||||
| 568 | Nasdaq 100 E-Mini | September-20 | $ | 115,273,328 | $ | 2,834,441 | ||||||||
See accompanying notes to financial statements.
15
| Quantified Pattern Recognition Fund |
| Portfolio Review (Unaudited) |
| June 30, 2020 |
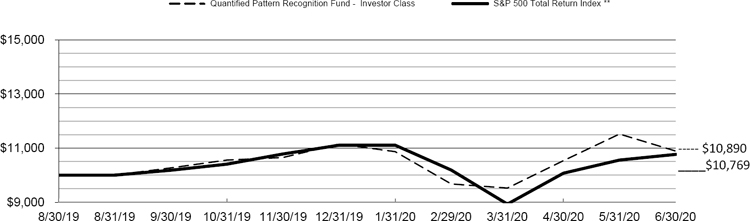
The Fund’s performance figures* for the period ended June 30, 2020, as compared to its benchmark:
| Since Inception | |
| August 30, 2019 | |
| Quantified Pattern Recognition Fund - Investor Class | 8.90% |
| S&P 500 Total Return Index ** | 7.69% |
Comparison of Change in Value of a $10,000 Investment.
Since Inception through June 30, 2020 +
| + | Inception date is August 30, 2019 |
| * | The performance data quoted is historical. Past performance is no guarantee of future results. Current performance may be higher or lower than the performance data quoted. The principal value and investment return of an investment will fluctuate so that your shares, when redeemed, may be worth more or less than their original cost. The returns shown do not reflect the deduction of taxes that a shareholder would pay on Fund distributions or on the redemptions of Fund shares. The Fund’s estimated total annual fund operating expense ratio, as provided in the Fund’s prospectus dated August 19, 2019, was 1.77% for Investor Class shares. For performance information current to the most recent month-end, please call 1-855-647-8268. Investors should consider the investment objectives, risks, and charges and expenses of the Fund carefully before investing. The Fund’s prospectus and summary prospectus contain these as well as other information about the Fund and should be read carefully before investing. A prospectus or summary prospectus may be obtained by calling 1-855-647-8268. |
| ** | The S&P 500 is a market capitalization-weighted index of 500 widely held common stocks. |
| Portfolio holdings by types of investments as of June 30, 2020 are as follows: | ||||
| Holdings by Sector ^: | % of Net Assets | |||
| Certificates of Deposit: | ||||
| Banks | 40.4 | % | ||
| Savings & Loans | 5.1 | % | ||
| Exchange Traded Funds: | ||||
| Debt Funds | 10.0 | % | ||
| Money Market Funds | 44.2 | % | ||
| Other Assets Less Liabilities | 0.3 | % | ||
| 100.0 | % | |||
| ^ | The Holdings by type of Investment detail does not include derivative exposure. |
Please refer to the Portfolio of Investments in this annual report for a detailed listing of the Fund’s holdings.
16
| Quantified Pattern Recognition Fund |
| PORTFOLIO OF INVESTMENTS |
| June 30, 2020 |
| Principal Amount ($) | Interest Rate (%) | Maturity | Value | |||||||||
| CERTIFICATES OF DEPOSIT - 45.5% | ||||||||||||
| BANKS - 40.4% | ||||||||||||
| 1,000,000 | Bank Hapoalim BM/New York NY | 1.7000 | 1/29/2021 | $ | 1,009,377 | |||||||
| 1,000,000 | Citibank NA | 1.9000 | 11/4/2022 | 1,005,983 | ||||||||
| 1,000,000 | JPMorgan Chase Bank NA | 1.9000 | 10/16/2021 | 1,000,746 | ||||||||
| 1,000,000 | Morgan Stanley Bank NA | 1.7500 | 4/19/2021 | 1,013,120 | ||||||||
| 1,000,000 | Safra National Bank of New York | 1.5500 | 11/17/2020 | 1,005,598 | ||||||||
| 1,000,000 | Sallie Mae Bank | 1.8500 | 11/7/2022 | 1,037,909 | ||||||||
| 1,000,000 | Wells Fargo Bank NA | 1.9500 | 10/18/2021 | 1,023,218 | ||||||||
| 1,000,000 | Wells Fargo National Bank West | 1.9000 | 1/17/2023 | 1,041,614 | ||||||||
| 8,137,565 | ||||||||||||
| SAVINGS & LOANS - 5.1% | ||||||||||||
| 1,000,000 | Raymond James Bank NA | 1.7000 | 11/8/2021 | 1,020,902 | ||||||||
| TOTAL CERTIFICATES OF DEPOSIT (Cost - $8,999,810) | 9,158,467 | |||||||||||
| Shares | ||||||||||||
| EXCHANGE TRADED FUNDS - 10.0% | ||||||||||||
| DEBT FUNDS - 10.0% | ||||||||||||
| 15,750 | Invesco BulletShares 2020 Corporate Bond ETF | 335,160 | ||||||||||
| 15,750 | Invesco BulletShares 2021 Corporate Bond ETF | 336,578 | ||||||||||
| 15,500 | Invesco BulletShares 2022 Corporate Bond ETF | 338,210 | ||||||||||
| 6,750 | Invesco Ultra Short Duration ETF | 340,470 | ||||||||||
| 3,000 | iShares Short Treasury Bond ETF | 332,220 | ||||||||||
| 10,750 | SPDR Portfolio Short Term Corporate Bond ETF | 336,905 | ||||||||||
| TOTAL EXCHANGE TRADED FUNDS (Cost - $1,996,347) | 2,019,543 | |||||||||||
| SHORT-TERM INVESTMENTS - 44.2% | ||||||||||||
| MONEY MARKET FUNDS - 44.2% | ||||||||||||
| 4,452,674 | Fidelity Investments Money Market Funds - Government Portfolio - Class I 0.06% (a) | 4,452,674 | ||||||||||
| 4,452,675 | First American Government Obligations Fund - Class Z 0.06% (a) | 4,452,675 | ||||||||||
| TOTAL SHORT-TERM INVESTMENTS (Cost - $8,905,349) | 8,905,349 | |||||||||||
| TOTAL INVESTMENTS - 99.7% (Cost - $19,901,506) | $ | 20,083,359 | ||||||||||
| OTHER ASSETS LESS LIABILITIES - 0.3% | 54,824 | |||||||||||
| NET ASSETS - 100.0% | $ | 20,138,183 | ||||||||||
| ETF | Exchange Traded Fund | |||||||||||
| (a) | Money market fund; interest rate reflects seven-day effective yield on June 30, 2020. | |||||||||||
See accompanying notes to financial statements.
17
| Quantified Tactical Fixed Income Fund |
| Portfolio Review (Unaudited) |
| June 30, 2020 |
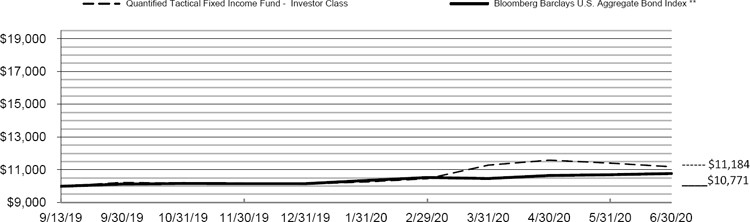
The Fund’s performance figures* for the period ended June 30, 2020 as compared to its benchmark:
| Since Inception | |
| September 13, 2019 | |
| Quantified Tactical Fixed Income Fund - Investor Class | 11.84% |
| Bloomberg Barclays U.S. Aggregate Bond Index ** | 7.71% |
Comparison of Change in Value of a $10,000 Investment.
Since Inception through June 30, 2020 +
| + | Inception date is September 13, 2019. |
| * | The performance data quoted is historical. Past performance is no guarantee of future results. Current performance may be higher or lower than the performance data quoted. The principal value and investment return of an investment will fluctuate so that your shares, when redeemed, may be worth more or less than their original cost. The returns shown do not reflect the deduction of taxes that a shareholder would pay on Fund distributions or on the redemptions of Fund shares. The Fund’s estimated total annual fund operating expense ratio, as provided in the Fund’s prospectus dated August 19, 2019, was 1.77% for Investor Class shares. For performance information current to the most recent month-end, please call 1-855-647-8268. Investors should consider the investment objectives, risks, and charges and expenses of the Fund carefully before investing. The Fund’s prospectus and summary prospectus contain these as well as other information about the Fund and should be read carefully before investing. A prospectus or summary prospectus may be obtained by calling 1-855-647-8268. |
| ** | The Bloomberg Barclays U.S. Aggregate Bond Index is an unmanaged index comprised of U.S. investment grade, fixed rate bond market securities, including government, government agency, corporate and mortgage-backed securities. Investors cannot invest directly in an index. |
| Portfolio holdings by types of investments as of June 30, 2020 are as follows: | ||||
| Holdings by Type of Investment: ^ | % of Net Assets | |||
| Certificates of Deposit: | ||||
| Banks | 19.3 | % | ||
| Savings & Loans | 1.2 | % | ||
| Exchange Traded Funds: | ||||
| Debt Funds | 10.2 | % | ||
| Money Market Funds | 64.4 | % | ||
| Collateral For Securities Loaned | 1.6 | % | ||
| Other Assets Less Liabilities | 3.3 | % | ||
| 100.0 | % | |||
| ^ | The Holdings by Type of Investment detail does not include derivative exposure. |
Please refer to the Portfolio of Investments in this annual report for a detailed listing of the Fund’s holdings.
18
| Quantified Tactical Fixed Income Fund |
| PORTFOLIO OF INVESTMENTS |
| June 30, 2020 |
| Principal Amount ($) | Interest Rate (%) | Maturity | Value | |||||||||
| CERTIFICATES OF DEPOSIT - 20.5% | ||||||||||||
| BANKS - 19.3% | ||||||||||||
| 1,000,000 | Ally Bank | 1.8000 | 10/25/2021 | $ | 1,021,657 | |||||||
| 1,000,000 | Bank Hapoalim BM/New York NY | 1.7500 | 10/27/2020 | 1,005,419 | ||||||||
| 1,000,000 | Bank of China Ltd/New York NY | 1.7500 | 12/17/2020 | 1,007,737 | ||||||||
| 1,500,000 | Bank OZK | 1.6000 | 1/14/2021 | 1,512,026 | ||||||||
| 1,000,000 | Citibank NA | 1.9000 | 11/4/2022 | 1,005,983 | ||||||||
| 1,000,000 | First Foundation Bank | 1.8000 | 7/13/2020 | 1,000,614 | ||||||||
| 1,000,000 | Flagstar Bank FSB | 1.7500 | 11/15/2021 | 1,021,877 | ||||||||
| 1,000,000 | JPMorgan Chase Bank NA | 1.9000 | 10/16/2021 | 1,000,746 | ||||||||
| 1,000,000 | Lafayette Federal Credit Union | 1.7000 | 5/21/2021 | 1,013,949 | ||||||||
| 1,000,000 | Morgan Stanley Bank NA | 1.7500 | 4/19/2021 | 1,013,120 | ||||||||
| 1,000,000 | Morgan Stanley Private Bank NA | 1.8500 | 1/9/2023 | 1,040,035 | ||||||||
| 1,000,000 | Sallie Mae Bank | 1.8000 | 7/16/2020 | 1,000,756 | ||||||||
| 1,000,000 | Stearns Bank NA | 1.6000 | 7/8/2021 | 1,014,839 | ||||||||
| 1,000,000 | Washington Trust Co of Westerly | 1.6500 | 10/28/2020 | 1,005,133 | ||||||||
| 1,000,000 | Wells Fargo Bank NA | 1.9500 | 10/18/2021 | 1,023,218 | ||||||||
| 1,000,000 | Wells Fargo National Bank West | 1.7500 | 6/30/2021 | 1,016,027 | ||||||||
| 16,703,136 | ||||||||||||
| SAVINGS & LOANS - 1.2% | ||||||||||||
| 1,000,000 | Raymond James Bank NA | 1.7000 | 11/8/2021 | 1,020,903 | ||||||||
| TOTAL CERTIFICATES OF DEPOSIT (Cost - $17,499,912) | 17,724,039 | |||||||||||
| Shares | ||||||||||||
| EXCHANGE TRADED FUNDS - 10.2% | ||||||||||||
| DEBT FUNDS - 10.2% | ||||||||||||
| 67,500 | Invesco BulletShares 2020 Corporate Bond ETF | 1,436,400 | ||||||||||
| 67,000 | Invesco BulletShares 2021 Corporate Bond ETF | 1,431,790 | ||||||||||
| 65,500 | Invesco BulletShares 2022 Corporate Bond ETF | 1,429,210 | ||||||||||
| 28,500 | Invesco Ultra Short Duration ETF (a) | 1,437,540 | ||||||||||
| 1,100 | iShares 20+ Year Treasury Bond ETF | 180,323 | ||||||||||
| 13,000 | iShares Short Treasury Bond ETF | 1,439,620 | ||||||||||
| 46,000 | SPDR Portfolio Short Term Corporate Bond ETF | 1,441,640 | ||||||||||
| TOTAL EXCHANGE TRADED FUNDS (Cost - $8,699,939) | 8,796,523 | |||||||||||
| SHORT-TERM INVESTMENTS - 64.4% | ||||||||||||
| MONEY MARKET FUNDS - 64.4% | ||||||||||||
| 27,716,508 | Fidelity Investments Money Market Funds - Government Portfolio - Class I 0.06% (b) | 27,716,508 | ||||||||||
| 27,716,508 | First American Government Obligations Fund - Class Z 0.06% (b) | 27,716,508 | ||||||||||
| TOTAL SHORT-TERM INVESTMENTS (Cost - $55,433,016) | 55,433,016 | |||||||||||
| COLLATERAL FOR SECURITIES LOANED - 1.6% | ||||||||||||
| 1,406,517 | Mount Vernon Liquid Assets Portfolio, LLC - 0.34% (b)(c) | 1,406,517 | ||||||||||
| TOTAL COLLATERAL FOR SECURITIES LOANED (Cost - $1,406,517) | ||||||||||||
| TOTAL INVESTMENTS - 96.7% (Cost - $83,039,384) | $ | 83,360,095 | ||||||||||
| OTHER ASSETS LESS LIABILITIES - 3.3% | 2,807,908 | |||||||||||
| NET ASSETS - 100.0% | $ | 86,168,003 | ||||||||||
| ETF | Exchange Traded Fund | |||||||||||
| (a) | All or a portion of the security is on loan. Total loaned securities had a value of $1,377,567 at June 30, 2020. | |||||||||||
| (b) | Money market fund; interest rate reflects seven-day effective yield on June 30, 2020. | |||||||||||
| (c) | Security purchased with cash proceeds of securities lending collateral. | |||||||||||
| FUTURES CONTRACTS | |||||||||||||
| OPEN SHORT FUTURES CONTRACTS | |||||||||||||
| Notional Value at | Unrealized | ||||||||||||
| No. of Contracts | Name | Expiration | June 30, 2020 | (Depreciation) | |||||||||
| 66 | Ultra U.S. Treasury T- Bonds | September-20 | $ | 14,398,296 | $ | (10,059 | ) | ||||||
| TOTAL RETURN SWAPS | ||||||||||||||||||
| Notional Amount | Unrealized | |||||||||||||||||
| Reference Entity | Number of Shares | at June 30, 2020 | Interest Rate Payable (1) | Termination Date | Counterparty | (Depreciation) | ||||||||||||
| iShares iBoxx High Yield Corporate Bond ETF | 94,900 | $ | 7,745,738 | 1-Mth USD_LIBOR plus 20 bp | 7/1/2021 | BRC | $ | (199,371 | ) | |||||||||
| PIMCO 0-5 Year High Yield Corporate Bond ETF | 84,900 | 7,748,823 | 1-Mth USD_LIBOR plus 20 bp | 7/1/2021 | BRC | (113,692 | ) | |||||||||||
| SPDR Bloomberg Barclays High Yield Bond ETF | 76,500 | 7,738,740 | 1-Mth USD_LIBOR plus 20 bp | 7/1/2021 | BRC | (191,362 | ) | |||||||||||
| Total | $ | (504,425 | ) | |||||||||||||||
BRC - Barclays Capital Inc.
| (1) | Interest rate is based upon predetermined notional amounts, which may be a multiple of the number of shares plus a specified spread. |
LIBOR - London Interbank Offered Rate
See accompanying notes to financial statements.
19
| Quantified Evolution Plus Fund |
| Portfolio Review (Unaudited) |
| June 30, 2020 |
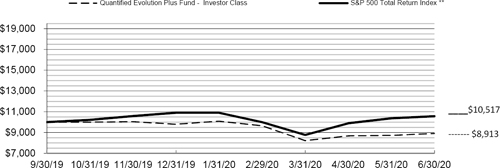
The Fund’s performance figures* for the period ended June 30, 2020, as compared to its benchmark:
| Since Inception | |
| September 30, 2019 | |
| Quantified Evolution Plus Fund - Investor Class | (10.87)% |
| S&P 500 Total Return Index ** | 5.71% |
Comparison of Change in Value of a $10,000 Investment.
Since Inception through June 30, 2020 +
| + | Inception date is September 30, 2019. |
| * | The performance data quoted is historical. Past performance is no guarantee of future results. Current performance may be higher or lower than the performance data quoted. The principal value and investment return of an investment will fluctuate so that your shares, when redeemed, may be worth more or less than their original cost. The returns shown do not reflect the deduction of taxes that a shareholder would pay on Fund distributions or on the redemptions of Fund shares. The Fund’s estimated total annual fund operating expense ratio, as provided in the Fund’s prospectus dated August 19, 2019, was 1.77% for Investor Class shares. For performance information current to the most recent month-end, please call 1-855-647-8268. Investors should consider the investment objectives, risks, and charges and expenses of the Fund carefully before investing. The Fund’s prospectus and summary prospectus contain these as well as other information about the Fund and should be read carefully before investing. A prospectus or summary prospectus may be obtained by calling 1-855 647-8268. |
| ** | The S&P 500 Total Return Index is an unmanaged composite of 500 large capitalization companies and includes the reinvestment of dividends. This index is widely used by professional investors as a performance benchmark for large-cap stocks. Investors may not invest in an index directly; unlike the Fund’s returns, the index does not reflect any fees or expenses. |
| Portfolio holdings by types of investments as of June 30, 2020 are as follows: | ||||
| Holdings by Type of Investment: ^ | % of Net Assets | |||
| Certificates of Deposit: | ||||
| Banks | 8.1 | % | ||
| Savings & Loans | 4.0 | % | ||
| Exchange Traded Funds: | ||||
| Commodity Funds | 0.2 | % | ||
| Debt Funds | 5.7 | % | ||
| Equity Funds | 0.3 | % | ||
| Money Market Funds | 72.1 | % | ||
| Other Assets Less Liabilities | 9.6 | % | ||
| 100.0 | % | |||
| ^ | The Holdings by Type of Investment detail does not include derivative exposure. |
Please refer to the Portfolio of Investments in this annual report for a detailed listing of the Fund’s holdings.
20
| Quantified Evolution Plus Fund |
| CONSOLIDATED PORTFOLIO OF INVESTMENTS |
| June 30, 2020 |
| Principal Amount ($) | Interest Rate (%) | Maturity | Value | |||||||||
| CERTIFICATES OF DEPOSIT - 12.1% | ||||||||||||
| BANKS - 8.1% | ||||||||||||
| 1,000,000 | Safra National Bank of New York | 1.5500 | 11/17/2020 | $ | 1,005,597 | |||||||
| 1,000,000 | Sallie Mae Bank | 1.8500 | 11/7/2022 | 1,037,909 | ||||||||
| 2,043,506 | ||||||||||||
| SAVINGS & LOANS - 4.0% | ||||||||||||
| 1,000,000 | Raymond James Bank NA | 1.7000 | 11/8/2021 | 1,020,902 | ||||||||
| TOTAL CERTIFICATES OF DEPOSIT (Cost - $3,000,000) | 3,064,408 | |||||||||||
| Shares | ||||||||||||
| EXCHANGE TRADED FUNDS - 6.2% | ||||||||||||
| COMMODITY FUND - 0.2% | ||||||||||||
| 350 | SPDR Gold Shares (b) * | 58,580 | ||||||||||
| TOTAL COMMODITY FUND (Cost - $58,314) | ||||||||||||
| DEBT FUNDS - 5.7% | ||||||||||||
| 10,000 | Invesco BulletShares 2020 Corporate Bond ETF | 212,800 | ||||||||||
| 9,900 | Invesco BulletShares 2021 Corporate Bond ETF | 211,563 | ||||||||||
| 9,700 | Invesco BulletShares 2022 Corporate Bond ETF | 211,654 | ||||||||||
| 4,200 | Invesco Ultra Short Duration ETF | 211,848 | ||||||||||
| 500 | iShares 20+ Year Treasury Bond ETF | 81,965 | ||||||||||
| 800 | iShares 7-10 Year Treasury Bond ETF | 97,496 | ||||||||||
| 1,900 | iShares Short Treasury Bond ETF | 210,406 | ||||||||||
| 6,800 | SPDR Portfolio Short Term Corporate Bond ETF | 213,112 | ||||||||||
| TOTAL DEBT FUNDS (Cost - $1,438,376) | 1,450,844 | |||||||||||
| EQUITY FUNDS - 0.3% | ||||||||||||
| 150 | Invesco QQQ Trust Series 1 | 37,140 | ||||||||||
| 100 | SPDR S&P 500 ETF Trust | 30,836 | ||||||||||
| TOTAL EQUITY FUNDS (Cost - $66,040) | 67,976 | |||||||||||
| TOTAL EXCHANGE TRADED FUNDS (Cost - $1,562,730) | 1,577,400 | |||||||||||
| SHORT-TERM INVESTMENTS - 72.1% | ||||||||||||
| MONEY MARKET FUNDS - 72.1% | ||||||||||||
| 8,656,521 | Fidelity Investments Money Market Funds - Government Portfolio - Class I 0.06% (a) | 8,656,521 | ||||||||||
| 1,038,279 | First American Government Obligations Fund - Class X 0.09% (a,b) | 1,038,279 | ||||||||||
| 8,656,521 | First American Government Obligations Fund - Class Z 0.06% (a) | 8,656,521 | ||||||||||
| TOTAL SHORT-TERM INVESTMENTS (Cost - $18,351,321) | 18,351,321 | |||||||||||
| TOTAL INVESTMENTS - 90.4% (Cost - $22,914,051) | $ | 22,993,129 | ||||||||||
| OTHER ASSETS LESS LIABILITIES - 9.6% | 2,448,560 | |||||||||||
| NET ASSETS - 100.0% | $ | 25,441,689 | ||||||||||
| ETF | Exchange Traded Fund | |||||||||||
| * | Non-Income producing investment | |||||||||||
| (a) | Money market fund; interest rate reflects seven-day effective yield on June 30, 2020. | |||||||||||
| (b) | All or part of this instrument is a holding of QEPF Fund Limited. | |||||||||||
| FUTURES CONTRACTS | |||||||||||||
| OPEN LONG FUTURES CONTRACTS | |||||||||||||
| Unrealized | |||||||||||||
| Notional Value at | Appreciation / | ||||||||||||
| No. of Contracts | Name | Expiration | June 30, 2020 | (Depreciation) | |||||||||
| 120 | 10 Year U.S. Treasury Note (CBT) | Sep-20 | $ | 16,700,640 | $ | 72,976 | |||||||
| 11 | Gold 100 oz. (1) | Aug-20 | 1,980,550 | 37,370 | |||||||||
| 25 | NASDAQ 100 E-mini | Sep-20 | 5,073,650 | 222,688 | |||||||||
| 13 | S&P 500 E-mini | Sep-20 | 2,008,630 | (58,774 | ) | ||||||||
| 93 | Ultra U.S. Treasury T- Bonds | Sep-20 | 20,288,508 | 356,156 | |||||||||
| $ | 630,416 | ||||||||||||
| (1) | All or part of this instrument is a holding of QEPF Fund Limited. |
See accompanying notes to consolidated financial statements.
21
| Quantified Common Ground Fund |
| Portfolio Review (Unaudited) |
| June 30, 2020 |
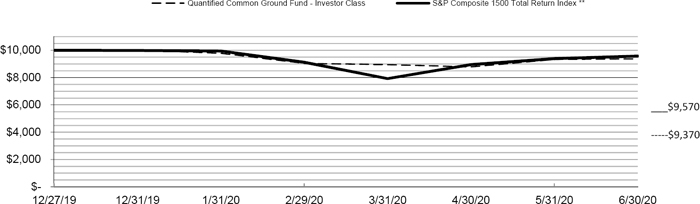
The Fund’s performance figures* for the period ended June 30, 2020, as compared to its benchmark:
| Since Inception | |
| December 27, 2019 | |
| Quantified Common Ground Fund - Investor Class | (6.30)% |
| S&P Composite 1500 Total Return Index ** | (4.30)% |
Comparison of Change in Value of a $10,000 Investment.
Since Inception through June 30, 2020 +
| + | Inception date is December 27, 2019. |
| * | The performance data quoted is historical. Past performance is no guarantee of future results. Current performance may be higher or lower than the performance data quoted. The principal value and investment return of an investment will fluctuate so that your shares, when redeemed, may be worth more or less than their original cost. The returns shown do not reflect the deduction of taxes that a shareholder would pay on Fund distributions or on the redemptions of Fund shares. The Fund’s estimated total annual fund operating expense ratio, as provided in the Fund’s prospectus dated August 19, 2019, was 1.77% for Investor Class shares. For performance information current to the most recent month-end, please call 1-855-647-8268. Investors should consider the investment objectives, risks, and charges and expenses of the Fund carefully before investing. The Fund’s prospectus and summary prospectus contain these as well as other information about the Fund and should be read carefully before investing. A prospectus or summary prospectus may be obtained by calling 1-855-647-8268. |
| ** | The S&P Composite 1500® combines three leading indices, the S&P 500®, the S&P MidCap 400®, and the S&P SmallCap 600®, to cover approximately 90% of U.S. market capitalization. It is designed for investors seeking to replicate the performance of the U.S. equity market or benchmark against a representative universe of tradable stocks. Investors cannot invest directly in an index. |
| Portfolio holdings by types of investments as of June 30, 2020 are as follows: | ||||
| Holdings by Sector ^: | % of Net Assets | |||
| Common Stocks | 60.0 | % | ||
| REITS | 8.1 | % | ||
| Money Market Funds | 30.6 | % | ||
| Collateral For Securities Loaned | 0.6 | % | ||
| Other Assets Less Liabilities | 0.7 | % | ||
| 100.0 | % | |||
| ^ | The Holdings by type of Investment detail does not include derivative exposure. |
Please refer to the Portfolio of Investments in this annual report for a detailed listing of the Fund’s holdings.
22
| Quantified Common Ground Fund |
| PORTFOLIO OF INVESTMENTS |
| June 30, 2020 |
| Shares | Value | |||||||
| COMMON STOCKS - 60.0% | ||||||||
| BIOTECHNOLOGY - 11.3% | ||||||||
| 5,597 | Alexion Pharmaceuticals, Inc. * | $ | 628,207 | |||||
| 1,579 | Regeneron Pharmaceuticals, Inc. * | 984,743 | ||||||
| 5,282 | United Therapeutics Corp. * | 639,122 | ||||||
| 2,252,072 | ||||||||
| CHEMICALS - 6.0% | ||||||||
| 1,350 | Ecolab, Inc. | 268,583 | ||||||
| 2,435 | FMC Corp. | 242,575 | ||||||
| 7,835 | Minerals Technologies, Inc. | 367,697 | ||||||
| 539 | The Sherwin-Williams Co. | 311,461 | ||||||
| 1,190,316 | ||||||||
| COMMERCIAL SERVICES - 1.9% | ||||||||
| 3,364 | FTI Consultng, Inc. * | 385,346 | ||||||
| DISTRIBUTION/WHOLESALE - 2.5% | ||||||||
| 1,816 | Pool Corp. | 493,716 | ||||||
| DIVERSIFIED FINANCIAL SERVICES - 7.0% | ||||||||
| 9,544 | Intercontinental Exchange, Inc. | 874,230 | ||||||
| 10,548 | Legg Mason, Inc. | 524,763 | ||||||
| 1,398,993 | ||||||||
| ELECTRONICS - 3.1% | ||||||||
| 6,920 | Agilent Technologies, Inc. | 611,520 | ||||||
| FOOD - 2.4% | ||||||||
| 4,582 | The JM Smucker Co. | 484,821 | ||||||
| HEALTHCARE-PRODUCTS - 6.4% | ||||||||
| 18,538 | Edwards Lifesciences Corp. * | 1,281,161 | ||||||
| HEALTHCARE-SERVICES - 2.6% | ||||||||
| 6,594 | DaVita, Inc. * | 521,849 | ||||||
| HOUSEWARES - 1.2% | ||||||||
| 1,721 | The Scotts Miracle-Gro Co. | 231,423 | ||||||
| MINING - 3.4% | ||||||||
| 11,085 | Newmont Goldcorp Corp. | 684,388 | ||||||
| RETAIL - 1.8% | ||||||||
| 9,845 | BJ’s Wholesale Club Holdings, Inc. * | 366,923 | ||||||
| SEMICONDUCTORS - 10.4% | ||||||||
| 8,470 | Advanced Micro Devices, Inc. * | 445,607 | ||||||
| 1,838 | KLA Corp. (a) | 357,454 | ||||||
| 9,213 | Maxim Integrated Products, Inc. | 558,400 | ||||||
| 1,873 | NVIDIA Corp. | 711,572 | ||||||
| 2,073,033 | ||||||||
| TOTAL COMMON STOCKS - (Cost - $11,682,156) | 11,975,561 | |||||||
See accompanying notes to financial statements.
23
| Quantified Common Ground Fund |
| PORTFOLIO OF INVESTMENTS (Continued) |
| June 30, 2020 |
| Shares | Value | |||||||
| REAL ESTATE INVESTMENT TRUSTS (REITS) - 8.1% | ||||||||
| 1,457 | CoreSite Realty Corp. | $ | 176,384 | |||||
| 7,031 | Digital Realty Trust, Inc. | 999,175 | ||||||
| 6,157 | Easterly Government Properties, Inc. | 142,350 | ||||||
| 245 | Equinix, Inc. | 172,064 | ||||||
| 1,433 | Prologis, Inc. | 133,742 | ||||||
| TOTAL REAL ESTATE INVESTMENTS TRUSTS (Cost - $1,618,393) | 1,623,715 | |||||||
| SHORT-TERM INVESTMENTS - 30.6% | ||||||||
| MONEY MARKET FUNDS - 30.6% | ||||||||
| 3,057,927 | Fidelity Investments Money Market Funds - Government Portfolio - Class I 0.06% (b) | 3,057,927 | ||||||
| 3,057,927 | First American Government Obligations Fund - Class Z 0.06% (b) | 3,057,927 | ||||||
| TOTAL SHORT-TERM INVESTMENTS (Cost - $6,115,854) | 6,115,854 | |||||||
| COLLATERAL FOR SECURITIES LOANED - 0.6% | ||||||||
| 116,275 | Mount Vernon Liquid Assets Portfolio, LLC - 0.34% (b)(c) | 116,275 | ||||||
| TOTAL COLLATERAL FOR SECURITIES LOANED (Cost - $116,275) | ||||||||
| TOTAL INVESTMENTS - 99.3% (Cost - $19,532,678) | $ | 19,831,405 | ||||||
| OTHER ASSETS LESS LIABILITIES - 0.7% | 140,439 | |||||||
| NET ASSETS - 100.0% | $ | 19,971,844 | ||||||
| * | Non-Income producing investment |
| (a) | All or a portion of the security is on loan. Total loaned securities had a value of $115,521 at June 30, 2020. |
| (b) | Money market fund; interest rate reflects seven-day effective yield on June 30, 2020. |
| (c) | Security purchased with cash proceeds of securities lending collateral. |
See accompanying notes to financial statements.
24
| STATEMENTS OF ASSETS AND LIABILITIES |
| June 30, 2020 |
| Quantified | Quantified | Quantified | Quantified | |||||||||||||
| Managed | Market Leaders | Alternative | STF | |||||||||||||
| Income Fund | Fund | Investment Fund | Fund | |||||||||||||
| Assets: | ||||||||||||||||
| Investment securities: | ||||||||||||||||
| At cost | $ | 72,086,806 | $ | 124,961,367 | $ | 7,733,870 | $ | 61,259,255 | ||||||||
| At value (a) | $ | 72,691,662 | $ | 133,650,170 | $ | 7,831,750 | $ | 61,586,513 | ||||||||
| Cash collateral for swaps | — | 4,340,000 | — | — | ||||||||||||
| Deposits with brokers for futures | 1,138,420 | — | 24,502 | 8,842,528 | ||||||||||||
| Receivable: | ||||||||||||||||
| Unrealized appreciation on futures | — | — | 5,496 | 2,834,441 | ||||||||||||
| Unrealized appreciation on swaps | — | 2,119,285 | — | — | ||||||||||||
| Securities sold | — | — | 159,701 | 12,392 | ||||||||||||
| Dividends and Interest | 10,859 | 1,386 | 890 | 174,090 | ||||||||||||
| Fund shares sold | 165,783 | 197,167 | 16,132 | 17,436 | ||||||||||||
| Prepaid expenses and other assets | 23,841 | 10,389 | 13,013 | 18,748 | ||||||||||||
| Total Assets | 74,030,565 | 140,318,397 | 8,051,484 | 73,486,148 | ||||||||||||
| Liabilities: | ||||||||||||||||
| Collateral on securities loaned | 402,674 | — | 177,772 | 1,577,101 | ||||||||||||
| Fund shares redeemed | 314,561 | 42,682 | 1,013 | 94,300 | ||||||||||||
| Unrealized depreciation on futures | 160,704 | — | — | — | ||||||||||||
| Investment advisory fees | 38,557 | 92,303 | 4,072 | 56,206 | ||||||||||||
| Payable to related parties | 27,110 | 70,515 | 3,829 | 31,678 | ||||||||||||
| Shareholder service fees - Investor Class | �� | 7,657 | 18,372 | 924 | 8,378 | |||||||||||
| Distributions (12b-1) fees | 13,123 | 31,210 | 1,590 | 14,318 | ||||||||||||
| Securities purchased | — | — | 267,457 | 386,628 | ||||||||||||
| Total Liabilities | 964,386 | 255,082 | 456,657 | 2,168,609 | ||||||||||||
| Net Assets | $ | 73,066,179 | $ | 140,063,315 | $ | 7,594,827 | $ | 71,317,539 | ||||||||
| Net Assets Consist of: | ||||||||||||||||
| Capital Stock | $ | 79,267,577 | $ | 120,609,933 | $ | 8,786,421 | $ | 56,790,828 | ||||||||
| Accumulated earnings (losses) | (6,201,398 | ) | 19,453,382 | (1,191,594 | ) | 14,526,711 | ||||||||||
| Net Assets | $ | 73,066,179 | $ | 140,063,315 | $ | 7,594,827 | $ | 71,317,539 | ||||||||
| Net Asset Value Per Share | ||||||||||||||||
| Investor Class Shares: | ||||||||||||||||
| Net Assets | $ | 72,542,883 | $ | 139,414,779 | $ | 7,532,792 | $ | 70,861,317 | ||||||||
| Shares of beneficial interest outstanding (no par value; unlimited shares authorized) | 8,024,582 | 12,646,479 | 873,547 | 5,195,580 | ||||||||||||
| Net asset value, (Net Assets ÷ Shares Outstanding), offering and redemption price per share | $ | 9.04 | $ | 11.02 | $ | 8.62 | $ | 13.64 | ||||||||
| Advisor Class Shares: | ||||||||||||||||
| Net Assets | $ | 523,296 | $ | 648,536 | $ | 62,035 | $ | 456,222 | ||||||||
| Shares of beneficial interest outstanding (no par value; unlimited shares authorized) | 57,709 | 59,647 | 7,286 | 34,205 | ||||||||||||
| Net asset value, (Net Assets ÷ Shares Outstanding), offering and redemption price per share | $ | 9.07 | $ | 10.87 | $ | 8.51 | $ | 13.34 | ||||||||
| (a) | Includes loaned securities with a value of $400,222, $0, $175,148 and $1,544,442, respectively. |
See accompanying notes to financial statements.
25
| STATEMENTS OF ASSETS AND LIABILITIES (Continued) |
| June 30, 2020 |
| Quantified | Quantified | Quantified Evolution | Quantified | |||||||||||||
| Pattern | Tactical Fixed | Plus Fund | Common | |||||||||||||
| Recognition Fund | Income Fund | (Consolidated) | Ground Fund | |||||||||||||
| Assets: | ||||||||||||||||
| Investment securities: | ||||||||||||||||
| At cost | $ | 19,901,506 | $ | 83,039,384 | $ | 22,914,051 | $ | 19,532,678 | ||||||||
| At value (a) | $ | 20,083,359 | $ | 83,360,095 | $ | 22,993,129 | $ | 19,831,405 | ||||||||
| Cash | — | — | — | — | ||||||||||||
| Cash collateral for swaps | — | 720,000 | — | — | ||||||||||||
| Deposits with brokers for futures | — | 3,814,263 | 1,779,051 | — | ||||||||||||
| Receivable: | ||||||||||||||||
| Unrealized appreciation on futures | — | — | 689,190 | — | ||||||||||||
| Dividends and Interest | 35,093 | 88,700 | 16,122 | 9,275 | ||||||||||||
| Securities sold | 29,250 | 59,228 | 279,589 | — | ||||||||||||
| Fund shares sold | 500 | 316,761 | 12,240 | 345,524 | ||||||||||||
| Prepaid expenses and other assets | 24,284 | 17,435 | 18,115 | 21,590 | ||||||||||||
| Total Assets | 20,172,486 | 88,376,482 | 25,787,436 | 20,207,794 | ||||||||||||
| Liabilities: | ||||||||||||||||
| Collateral on securities loaned | — | 1,406,517 | — | 116,275 | ||||||||||||
| Securities purchased | — | 157,388 | 246,887 | — | ||||||||||||
| Unrealized depreciation on swaps | — | 504,425 | — | — | ||||||||||||
| Unrealized depreciation on futures | — | 10,059 | 58,774 | — | ||||||||||||
| Investment advisory fees | 16,909 | 62,155 | 19,788 | 15,764 | ||||||||||||
| Shareholder service fees - Investor Class | 2,589 | 9,323 | 3,045 | 2,420 | ||||||||||||
| Payable to related parties | 9,526 | 32,418 | 9,334 | 9,707 | ||||||||||||
| Fund shares redeemed | 963 | 10,655 | 2,844 | 87,750 | ||||||||||||
| Distributions (12b-1) fees | 4,316 | 15,539 | 5,075 | 4,034 | ||||||||||||
| Total Liabilities | 34,303 | 2,208,479 | 345,747 | 235,950 | ||||||||||||
| Net Assets | $ | 20,138,183 | $ | 86,168,003 | $ | 25,441,689 | $ | 19,971,844 | ||||||||
| Net Assets Consist of: | ||||||||||||||||
| Capital Stock | $ | 19,934,458 | $ | 83,082,080 | $ | 25,927,874 | $ | 20,999,850 | ||||||||
| Accumulated earnings (losses) | 203,725 | 3,085,923 | (486,185 | ) | (1,028,006 | ) | ||||||||||
| Net Assets | $ | 20,138,183 | $ | 86,168,003 | $ | 25,441,689 | $ | 19,971,844 | ||||||||
| Net Asset Value Per Share | ||||||||||||||||
| Investor Class Shares: | ||||||||||||||||
| Net Assets | $ | 20,138,183 | $ | 86,168,003 | $ | 25,441,689 | $ | 19,971,844 | ||||||||
| Shares of beneficial interest outstanding (no par value; unlimited shares authorized) | 1,919,611 | 7,865,916 | 2,858,851 | 2,130,454 | ||||||||||||
| Net asset value, (Net Assets ÷ Shares Outstanding), offering and redemption price per share | $ | 10.49 | $ | 10.95 | $ | 8.90 | $ | 9.37 | ||||||||
| (a) | Includes loaned securities with a value of $0, $1,377,567, $0 and $115,521, respectively. |
See accompanying notes to consolidated financial statements.
26
| STATEMENTS OF OPERATIONS |
| For the Year Ended June 30, 2020 |
| Quantified | Quantified | Quantified | Quantified | |||||||||||||
| Managed | Market Leaders | Alternative | STF | |||||||||||||
| Income Fund | Fund | Investment Fund | Fund | |||||||||||||
| Investment Income | ||||||||||||||||
| Dividends (net of foreign tax withholdings $(342), $0, $0 and $0, respectively) | $ | 1,861,815 | $ | 1,790,551 | $ | 185,339 | $ | 178,522 | ||||||||
| Interest | 34,053 | 333,980 | 14,449 | 903,872 | ||||||||||||
| Securities lending, net | 39,490 | 28,369 | — | 2,906 | ||||||||||||
| Total Investment Income | 1,935,358 | 2,152,900 | 199,788 | 1,085,300 | ||||||||||||
| Expenses | ||||||||||||||||
| Investment advisory fees | 480,049 | 1,175,536 | 68,146 | 627,126 | ||||||||||||
| Administration fees | 177,517 | 428,247 | 27,869 | 174,627 | ||||||||||||
| Distribution (12b-1) fees | ||||||||||||||||
| Investor Class | 158,924 | 390,169 | 22,663 | 156,194 | ||||||||||||
| Advisor Class | 4,370 | 6,704 | 209 | 2,338 | ||||||||||||
| Third party services fees - Investor Class | 95,100 | 234,104 | 13,598 | 93,716 | ||||||||||||
| Trustee fees and expenses | 67 | 161 | 10 | 62 | ||||||||||||
| Total Operating Expenses | 916,027 | 2,234,921 | 132,495 | 1,054,063 | ||||||||||||
| Net Investment Income (Loss) | 1,019,331 | (82,021 | ) | 67,293 | 31,237 | |||||||||||
| Realized and Unrealized Gain (Loss) on Investments, Futures and Swaps | ||||||||||||||||
| Net realized gain (loss) from: | ||||||||||||||||
| Investments | (6,214,223 | ) | 14,649,974 | (656,125 | ) | 167,847 | ||||||||||
| Futures | 980,217 | — | (57,338 | ) | 21,180,300 | |||||||||||
| Swaps | — | 5,712,722 | — | — | ||||||||||||
| Capital gain distributions from underlying investments Companies | — | — | 19,955 | 1,302 | ||||||||||||
| (5,234,006 | ) | 20,362,696 | (693,508 | ) | 21,349,449 | |||||||||||
| Net change in unrealized appreciation (depreciation) on: | ||||||||||||||||
| Investments | (667,483 | ) | 6,180,025 | (118,683 | ) | 323,048 | ||||||||||
| Futures | (192,673 | ) | — | 6,936 | 1,798,343 | |||||||||||
| Swaps | — | 2,119,285 | — | — | ||||||||||||
| (860,156 | ) | 8,299,310 | (111,747 | ) | 2,121,391 | |||||||||||
| Net Realized and Unrealized Gain (Loss) on Investments, Futures and Swaps | (6,094,162 | ) | 28,662,006 | (805,255 | ) | 23,470,840 | ||||||||||
| Net Increase (Decrease) in Net Assets Resulting From Operations | $ | (5,074,831 | ) | $ | 28,579,985 | $ | (737,962 | ) | $ | 23,502,077 | ||||||
See accompanying notes to financial statements.
27
| STATEMENTS OF OPERATIONS (Continued) |
| For the Period Ended June 30, 2020 |
| Quantified | Quantified | Quantified Evolution | Quantified | |||||||||||||
| Pattern | Tactical Fixed | Plus Fund (c) | Common | |||||||||||||
| Recognition Fund (a) | Income Fund (b) | (Consolidated) | Ground Fund (d) | |||||||||||||
| Investment Income | ||||||||||||||||
| Dividends (net of foreign tax withholdings $0, $0, $0 and $0, respectively) | $ | 95,491 | $ | 177,765 | $ | 40,602 | $ | 135,992 | ||||||||
| Interest | 206,890 | 403,122 | 87,608 | 7,108 | ||||||||||||
| Securities lending, net | — | 2,843 | — | 19 | ||||||||||||
| Total Investment Income | 302,381 | 583,730 | �� | 128,210 | 143,119 | |||||||||||
| Expenses | ||||||||||||||||
| Investment advisory fees | 179,361 | 402,508 | 108,762 | 89,859 | ||||||||||||
| Administration fees | 52,619 | 113,760 | 33,273 | 28,094 | ||||||||||||
| Distribution (12b-1) fees - Investor Class | 44,840 | 100,627 | 27,191 | 22,465 | ||||||||||||
| Third party services fees - Investor Class | 26,904 | 60,376 | 16,314 | 13,479 | ||||||||||||
| Trustee fees and expenses | — | 43 | 12 | — | ||||||||||||
| Total Operating Expenses | 303,724 | 677,314 | 185,552 | 153,897 | ||||||||||||
| Net Investment Income (Loss) | (1,343 | ) | (93,584 | ) | (57,342 | ) | (10,778 | ) | ||||||||
| Realized and Unrealized Gain (Loss) on Investments, Futures and Swaps | ||||||||||||||||
| Net realized gain (loss) from: | ||||||||||||||||
| Investments | (24,348 | ) | (12,705 | ) | (63,147 | ) | (1,315,955 | ) | ||||||||
| Futures | 1,033,303 | 5,614,283 | (845,368 | ) | — | |||||||||||
| Swaps | — | (202,165 | ) | (252,751 | ) | — | ||||||||||
| Capital gain distributions from underlying investments companies | 505 | 816 | 246 | — | ||||||||||||
| 1,009,460 | 5,400,229 | (1,161,020 | ) | (1,315,955 | ) | |||||||||||
| Net change in unrealized appreciation (depreciation) on: | ||||||||||||||||
| Investments | 181,853 | 320,711 | 79,078 | 298,727 | ||||||||||||
| Futures | — | (10,059 | ) | 630,416 | — | |||||||||||
| Swaps | — | (504,425 | ) | — | — | |||||||||||
| 181,853 | (193,773 | ) | 709,494 | 298,727 | ||||||||||||
| Net Realized and Unrealized Gain (Loss) on Investments, Futures and Swaps | 1,191,313 | 5,206,456 | (451,526 | ) | (1,017,228 | ) | ||||||||||
| Net Increase (Decrease) in Net Assets Resulting From Operations | $ | 1,189,970 | $ | 5,112,872 | $ | (508,868 | ) | $ | (1,028,006 | ) | ||||||
| (a) | The Fund commenced operations on August 30, 2019. |
| (b) | The Fund commenced operations on September 13, 2019. |
| (c) | The Fund commenced operations on September 30, 2019. |
| (d) | The Fund commenced operations on December 27, 2019. |
See accompanying notes to consolidated financial statements.
28
| STATEMENTS OF CHANGES IN NET ASSETS |
| Quantified Managed Income Fund | ||||||||
| Year Ended | Year Ended | |||||||
| June 30, | June 30, | |||||||
| 2020 | 2019 | |||||||
| INCREASE (DECREASE) IN NET ASSETS FROM: | ||||||||
| Operations | ||||||||
| Net investment income | $ | 1,019,331 | $ | 1,812,026 | ||||
| Net realized gain (loss) from investments and futures | (5,234,006 | ) | 773,585 | |||||
| Net change in unrealized appreciation (depreciation) on investments and futures | (860,156 | ) | 1,503,082 | |||||
| Net Increase (Decrease) in Net Assets Resulting From Operations | (5,074,831 | ) | 4,088,693 | |||||
| Distributions to Shareholders from: | ||||||||
| Total Distributions Paid | ||||||||
| Investor Class | (1,557,072 | ) | (988,546 | ) | ||||
| Advisor Class | (2,026 | ) | (7,826 | ) | ||||
| Total Distributions to Shareholders | (1,559,098 | ) | (996,372 | ) | ||||
| Shares of Beneficial Interest: | ||||||||
| Proceeds from shares sold | ||||||||
| Investor Class | 199,349,490 | 128,886,581 | ||||||
| Advisor Class | 772,729 | 1,084,681 | ||||||
| Net asset value of shares issued in reinvestment of distributions | ||||||||
| Investor Class | 1,557,071 | 988,546 | ||||||
| Advisor Class | 2,026 | 7,826 | ||||||
| Payments for shares redeemed | ||||||||
| Investor Class | (181,195,937 | ) | (113,989,943 | ) | ||||
| Advisor Class | (790,752 | ) | (956,445 | ) | ||||
| Total Increase in Net Assets From Shares of Beneficial Interest | 19,694,627 | 16,021,246 | ||||||
| Total Increase in Net Assets | 13,060,698 | 19,113,567 | ||||||
| Net Assets: | ||||||||
| Beginning of Year | 60,005,481 | 40,891,914 | ||||||
| End of Year | $ | 73,066,179 | $ | 60,005,481 | ||||
| Share Activity | ||||||||
| Investor Class: | ||||||||
| Shares Sold | 20,850,180 | 13,726,634 | ||||||
| Shares issued in reinvestments of Distributions | 158,723 | 110,452 | ||||||
| Shares Redeemed | (19,079,699 | ) | (12,090,394 | ) | ||||
| Net Increase in Shares of Beneficial Interest Outstanding | 1,929,204 | 1,746,692 | ||||||
| Advisor Class: | ||||||||
| Shares Sold | 81,494 | 114,877 | ||||||
| Shares issued in reinvestments of Distributions | 205 | 875 | ||||||
| Shares Redeemed | (82,767 | ) | (101,736 | ) | ||||
| Net Increase (Decrease) in Shares of Beneficial Interest Outstanding | (1,068 | ) | 14,016 | |||||
See accompanying notes to financial statements.
29
| STATEMENTS OF CHANGES IN NET ASSETS |
| Quantified Market Leaders Fund | Quantified Alternative Investment Fund | |||||||||||||||
| Year Ended | Year Ended | Year Ended | Year Ended | |||||||||||||
| June 30, | June 30, | June 30, | June 30, | |||||||||||||
| 2020 | 2019 | 2020 | 2019 | |||||||||||||
| INCREASE (DECREASE) IN NET ASSETS FROM: | ||||||||||||||||
| Operations | ||||||||||||||||
| Net investment income (loss) | $ | (82,021 | ) | $ | 994,969 | $ | 67,293 | $ | 61,504 | |||||||
| Net realized gain (loss) from investments, futures and swaps | 20,362,696 | (5,419,347 | ) | (693,508 | ) | (330,607 | ) | |||||||||
| Net change in unrealized appreciation (depreciation) on investments, futures and swaps | 8,299,310 | (4,020,169 | ) | (111,747 | ) | 275,781 | ||||||||||
| Net Increase (Decrease) in Net Assets Resulting From Operations | 28,579,985 | (8,444,547 | ) | (737,962 | ) | 6,678 | ||||||||||
| Distributions to Shareholders from: | ||||||||||||||||
| Total Distributions Paid | ||||||||||||||||
| Investor Class | — | (14,368,410 | ) | (146,978 | ) | (5,603 | ) | |||||||||
| Advisor Class | — | (45,422 | ) | (126 | ) | — | ||||||||||
| Total Distributions to Shareholders | — | (14,413,832 | ) | (147,104 | ) | (5,603 | ) | |||||||||
| Shares of Beneficial Interest: | ||||||||||||||||
| Proceeds from shares sold | ||||||||||||||||
| Investor Class | 187,825,478 | 223,992,085 | 6,514,331 | 4,177,618 | ||||||||||||
| Advisor Class | 754,381 | 850,075 | 54,966 | 6,316 | ||||||||||||
| Net asset value of shares issued in reinvestment of distributions | ||||||||||||||||
| Investor Class | — | 14,368,410 | 146,977 | 5,600 | ||||||||||||
| Advisor Class | — | 45,422 | 126 | — | ||||||||||||
| Payments for shares redeemed | ||||||||||||||||
| Investor Class | (234,421,568 | ) | (160,200,578 | ) | (6,925,984 | ) | (4,594,340 | ) | ||||||||
| Advisor Class | (702,511 | ) | (1,016,175 | ) | (7,298 | ) | (6,929 | ) | ||||||||
| Total Increase (Decrease) in Net Assets From Shares of Beneficial Interest | (46,544,220 | ) | 78,039,239 | (216,882 | ) | (411,735 | ) | |||||||||
| Total Increase (Decrease) in Net Assets | (17,964,235 | ) | 55,180,860 | (1,101,948 | ) | (410,660 | ) | |||||||||
| Net Assets: | ||||||||||||||||
| Beginning of Year | 158,027,550 | 102,846,690 | 8,696,775 | 9,107,435 | ||||||||||||
| End of Year | $ | 140,063,315 | $ | 158,027,550 | $ | 7,594,827 | $ | 8,696,775 | ||||||||
| Share Activity | ||||||||||||||||
| Investor Class: | ||||||||||||||||
| Shares Sold | 19,292,930 | 22,364,234 | 698,753 | 441,250 | ||||||||||||
| Shares issued in reinvestments of Distributions | — | 1,729,044 | 14,846 | 621 | ||||||||||||
| Shares Redeemed | (23,453,819 | ) | (16,118,020 | ) | (756,322 | ) | (486,258 | ) | ||||||||
| Net Increase (Decrease) in Shares of Beneficial Interest Outstanding | (4,160,889 | ) | 7,975,258 | (42,723 | ) | (44,387 | ) | |||||||||
| Advisor Class: | ||||||||||||||||
| Shares Sold | 80,273 | 86,534 | 6,467 | 671 | ||||||||||||
| Shares issued in reinvestments of Distributions | — | 5,492 | 13 | — | ||||||||||||
| Shares Redeemed | (69,490 | ) | (100,139 | ) | (796 | ) | (737 | ) | ||||||||
| Net Increase (Decrease) in Shares of Beneficial Interest Outstanding | 10,783 | (8,113 | ) | 5,684 | (66 | ) | ||||||||||
See accompanying notes to financial statements.
30
| STATEMENTS OF CHANGES IN NET ASSETS |
| Quantified STF Fund | Quantified Pattern Recognition Fund (a) | |||||||||||
| Year Ended | Year Ended | Period Ended | ||||||||||
| June 30, 2020 | June 30, 2019 | June 30, 2020 | ||||||||||
| INCREASE (DECREASE) IN NET ASSETS FROM: | ||||||||||||
| Operations: | ||||||||||||
| Net investment income (loss) | $ | 31,237 | $ | 350,551 | $ | (1,343 | ) | |||||
| Net realized gain (loss) from investments and futures | 21,349,449 | (7,100,564 | ) | 1,009,460 | ||||||||
| Net change in unrealized appreciation (depreciation) on investments and futures | 2,121,391 | 4,913,539 | 181,853 | |||||||||
| Net Increase (Decrease) in Net Assets Resulting From Operations | 23,502,077 | (1,836,474 | ) | 1,189,970 | ||||||||
| Distributions to Shareholders from: | ||||||||||||
| Total Distributions Paid | ||||||||||||
| Investor Class | (324,678 | ) | (2,069,028 | ) | (951,554 | ) | ||||||
| Advisor Class | — | (4,245 | ) | — | ||||||||
| Total Distributions to Shareholders | (324,678 | ) | (2,073,273 | ) | (951,554 | ) | ||||||
| Shares of Beneficial Interest: | ||||||||||||
| Proceeds from shares sold: | ||||||||||||
| Investor Class | 44,145,276 | 25,503,036 | 38,142,488 | |||||||||
| Advisor Class | 337,024 | 124,374 | — | |||||||||
| Net asset value of shares issued in reinvestment of distributions: | ||||||||||||
| Investor Class | 314,001 | 2,056,813 | 951,554 | |||||||||
| Advisor Class | — | 4,144 | — | |||||||||
| Payments for shares redeemed | ||||||||||||
| Investor Class | (66,933,043 | ) | (46,083,080 | ) | (19,194,275 | ) | ||||||
| Advisor Class | (82,458 | ) | (261,486 | ) | — | |||||||
| Total Increase (Decrease) in Net Assets From Shares of Beneficial Interest | (22,219,200 | ) | (18,656,199 | ) | 19,899,767 | |||||||
| Total Increase (Decrease) in Net Assets | 958,199 | (22,565,946 | ) | 20,138,183 | ||||||||
| Net Assets: | ||||||||||||
| Beginning of Year or Period | 70,359,340 | 92,925,286 | — | |||||||||
| End of Year or Period | $ | 71,317,539 | $ | 70,359,340 | $ | 20,138,183 | ||||||
| Share Activity | ||||||||||||
| Investor Class: | ||||||||||||
| Shares Sold | 3,862,444 | 2,620,906 | 3,714,259 | |||||||||
| Shares issued in reinvestments of Distributions | 28,860 | 205,681 | 88,682 | |||||||||
| Shares Redeemed | (6,082,227 | ) | (4,661,440 | ) | (1,883,330 | ) | ||||||
| Net Increase (Decrease) in Shares of Beneficial Interest Outstanding | (2,190,923 | ) | (1,834,853 | ) | 1,919,611 | |||||||
| Share Activity | ||||||||||||
| Advisor Class: | ||||||||||||
| Shares Sold | 28,883 | 11,905 | — | |||||||||
| Shares issued in reinvestments of Distributions | — | 422 | — | |||||||||
| Shares Redeemed | (7,664 | ) | (25,802 | ) | — | |||||||
| Net Increase (Decrease) in Shares of Beneficial Interest Outstanding | 21,219 | (13,475 | ) | — | ||||||||
| (a) | The Fund commenced operations on August 30, 2019 |
See accompanying notes to financial statements.
31
| CONSOLIDATED STATEMENTS OF CHANGES IN NET ASSETS |
| Quantified Tactical Fixed Income Fund (a) | Quantified Evolution Plus Fund (b) | |||||||
| Period Ended | Period Ended | |||||||
| June 30, 2020 | June 30, 2020 | |||||||
| INCREASE (DECREASE) IN NET ASSETS FROM: | ||||||||
| Operations: | ||||||||
| Net investment (loss) | $ | (93,584 | ) | $ | (57,342 | ) | ||
| Net realized gain (loss) from investments, futures and swaps | 5,400,229 | (1,161,020 | ) | |||||
| Net change in unrealized appreciation (depreciation) on investments, futures and swaps | (193,773 | ) | 709,494 | |||||
| Net Increase (Decrease) in Net Assets Resulting From Operations | 5,112,872 | (508,868 | ) | |||||
| Distributions to Shareholders from: | ||||||||
| Total Distributions Paid | ||||||||
| Investor Class | (871,421 | ) | (18,875 | ) | ||||
| Total Distributions to Shareholders | (871,421 | ) | (18,875 | ) | ||||
| Shares of Beneficial Interest: | ||||||||
| Proceeds from shares sold: | ||||||||
| Investor Class | 129,355,700 | 36,302,350 | ||||||
| Net asset value of shares issued in reinvestment of distributions: | ||||||||
| Investor Class | 871,421 | 18,875 | ||||||
| Payments for shares redeemed | ||||||||
| Investor Class | (48,300,569 | ) | (10,351,793 | ) | ||||
| Total Increase in Net Assets From Shares of Beneficial Interest | 81,926,552 | 25,969,432 | ||||||
| Total Increase in Net Assets | 86,168,003 | 25,441,689 | ||||||
| Net Assets: | ||||||||
| Beginning of Period | — | — | ||||||
| End of Period | $ | 86,168,003 | $ | 25,441,689 | ||||
| Share Activity | ||||||||
| Investor Class: | ||||||||
| Shares Sold | 12,236,432 | 3,965,839 | ||||||
| Shares issued in reinvestments of Distributions | 87,756 | 1,928 | ||||||
| Shares Redeemed | (4,458,272 | ) | (1,108,916 | ) | ||||
| Net Increase in Shares of Beneficial Interest Outstanding | 7,865,916 | 2,858,851 | ||||||
| (a) | The Fund commenced operations on September 13, 2019 |
| (b) | The Fund commenced operations on September 30, 2019 |
See accompanying notes to consolidated financial statements.
32
| STATEMENTS OF CHANGES IN NET ASSETS |
| Quantified Common Ground Fund (a) | ||||
| Period Ended | ||||
| June 30, 2020* | ||||
| INCREASE (DECREASE) IN NET ASSETS FROM: | ||||
| Operations: | ||||
| Net investment loss | $ | (10,778 | ) | |
| Net realized gain (loss) from investments | (1,315,955 | ) | ||
| Net change in unrealized appreciation on investments | 298,727 | |||
| Net Decrease in Net Assets Resulting From Operations | (1,028,006 | ) | ||
| Shares of Beneficial Interest: | ||||
| Proceeds from shares sold: | ||||
| Investor Class | 44,769,024 | |||
| Net asset value of shares issued in reinvestment of distributions: | ||||
| Investor Class | (23,769,174 | ) | ||
| Total Increase in Net Assets From Shares of Beneficial Interest | 20,999,850 | |||
| Total Increase in Net Assets | 19,971,844 | |||
| Net Assets: | ||||
| Beginning of Period | — | |||
| End of Period | $ | 19,971,844 | ||
| Share Activity | ||||
| Investor Class: | ||||
| Shares Sold | 4,722,043 | |||
| Shares Redeemed | (2,591,589 | ) | ||
| Net Increase in Shares of Beneficial Interest Outstanding | 2,130,454 | |||
| (a) | The Fund commenced operations on December 27, 2019. |
See accompanying notes to financial statements.
33
| FINANCIAL HIGHLIGHTS |
| Quantified Managed Income Fund |
| The table sets forth financial data for one share of beneficial interest outstanding throughout each year or period. |
| Investor Class | Advisor Class | |||||||||||||||||||||||||||||||||||||||
| Period Ended | ||||||||||||||||||||||||||||||||||||||||
| Year Ended June 30, | Year Ended June 30, | June 30, | ||||||||||||||||||||||||||||||||||||||
| 2020 | 2019 | 2018 | 2017 | 2016 | 2020 | 2019 | 2018 | 2017 | 2016 (1) | |||||||||||||||||||||||||||||||
| Net asset value, beginning of year or period | $ | 9.75 | $ | 9.31 | $ | 9.64 | $ | 9.35 | $ | 9.35 | $ | 9.70 | $ | 9.28 | $ | 9.54 | $ | 9.34 | $ | 9.04 | ||||||||||||||||||||
| Activity from investment operations: | ||||||||||||||||||||||||||||||||||||||||
| Net investment income (2) | 0.15 | 0.35 | 0.22 | 0.22 | 0.13 | 0.09 | 0.30 | 0.15 | 0.14 | 0.04 | ||||||||||||||||||||||||||||||
| Net realized and unrealized gain (loss) on investments, futures and distributions from underlying investment companies | (0.64 | ) | 0.28 | (0.31 | ) | 0.16 | 0.22 | (0.64 | ) | 0.26 | (0.31 | ) | 0.17 | 0.26 | ||||||||||||||||||||||||||
| Total from investment operations | (0.49 | ) | 0.63 | (0.09 | ) | 0.38 | 0.35 | (0.55 | ) | 0.56 | (0.16 | ) | 0.31 | 0.30 | ||||||||||||||||||||||||||
| Distributions to Shareholders: | ||||||||||||||||||||||||||||||||||||||||
| Net investment income | (0.16 | ) | (0.19 | ) | (0.24 | ) | (0.09 | ) | (0.35 | ) | (0.02 | ) | (0.14 | ) | (0.10 | ) | (0.11 | ) | — | |||||||||||||||||||||
| Net realized gains | (0.06 | ) | — | — | — | — | (0.06 | ) | — | — | — | — | ||||||||||||||||||||||||||||
| Total distributions | (0.22 | ) | (0.19 | ) | (0.24 | ) | (0.09 | ) | (0.35 | ) | (0.08 | ) | (0.14 | ) | (0.10 | ) | (0.11 | ) | — | |||||||||||||||||||||
| Net asset value, end of year or period | $ | 9.04 | $ | 9.75 | $ | 9.31 | $ | 9.64 | $ | 9.35 | $ | 9.07 | $ | 9.70 | $ | 9.28 | $ | 9.54 | $ | 9.34 | ||||||||||||||||||||
| Total return (3) | (5.19 | )% | 6.89 | % | (0.99 | )% | 4.13 | % | 3.89 | % | (5.76 | )% | 6.16 | % | (1.67 | )% | 3.31 | % | 3.32 | % (4) | ||||||||||||||||||||
| Net assets, end of year or period (in 000s) | $ | 72,543 | $ | 59,435 | $ | 40,477 | $ | 42,274 | $ | 38,693 | $ | 523 | $ | 570 | $ | 415 | $ | 267 | $ | 75 | ||||||||||||||||||||
| Ratios/Supplemental Data: | ||||||||||||||||||||||||||||||||||||||||
| Ratio of gross expenses to average net assets (5) | 1.43 | % | 1.42 | % | 1.41 | % | 1.41 | % | 1.44 | % | 2.03 | % | 2.02 | % | 2.01 | % | 2.01 | % | 2.04 | % (6) | ||||||||||||||||||||
| Ratio of net investment income to average net assets (5,7) | 1.59 | % | 3.72 | % | 2.31 | % | 2.31 | % | 1.40 | % | 0.96 | % | 3.24 | % | 1.59 | % | 1.40 | % | 1.65 | % (6) | ||||||||||||||||||||
| Portfolio turnover rate | 794 | % | 640 | % | 638 | % | 491 | % | 718 | % | 794 | % | 640 | % | 638 | % | 491 | % | 718 | % (4) | ||||||||||||||||||||
| (1) | The Fund commenced operations on August 9, 2013. Advisor Class commenced operations on March 18, 2016. |
| (2) | Per share amounts calculated using the average shares method, which more appropriately presents the per share data for the year or period. |
| (3) | Total return shown assumes the reinvestment of all distributions. |
| (4) | Not Annualized. |
| (5) | The ratios of expenses to average net assets and net investment income (loss) to average net assets do not reflect the expenses of the underlying investment companies in which the Fund invests. |
| (6) | Annualized. |
| (7) | Recognition of net investment income (loss) by the Fund is affected by the timing and declaration of dividends by the underlying investment companies in which the Fund invests. |
See accompanying notes to financial statements.
34
| FINANCIAL HIGHLIGHTS |
| Quantified Market Leaders Fund |
| The table sets forth financial data for one share of beneficial interest outstanding throughout each year or period. |
| Investor Class | Advisor Class | |||||||||||||||||||||||||||||||||||||||
| Period Ended | ||||||||||||||||||||||||||||||||||||||||
| Year ended June 30, | Year ended June 30, | June 30, | ||||||||||||||||||||||||||||||||||||||
| 2020 | 2019 | 2018 | 2017 | 2016 | 2020 | 2019 | 2018 | 2017 | 2016 (1) | |||||||||||||||||||||||||||||||
| Net asset value, beginning of year or period | $ | 9.38 | $ | 11.57 | $ | 10.87 | $ | 9.60 | $ | 10.21 | $ | 9.30 | $ | 11.41 | $ | 10.76 | $ | 9.58 | $ | 9.31 | ||||||||||||||||||||
| Activity from investment operations: | ||||||||||||||||||||||||||||||||||||||||
| Net investment income (loss) (2) | 0.00 | (10) | 0.08 | (0.06 | ) | 0.05 | (0.01 | ) | (0.06 | ) | (0.01 | ) | (0.12 | ) | 0.01 | 0.03 | ||||||||||||||||||||||||
| Net realized and unrealized gain (loss) on investments, futures, swaps and other investment companies | 1.64 | (0.96 | ) | 2.12 | 1.46 | (0.45 | ) | 1.63 | (0.91 | ) | 2.08 | 1.44 | 0.24 | (3) | ||||||||||||||||||||||||||
| Total from investment operations | 1.64 | (0.88 | ) | 2.06 | 1.51 | (0.46 | ) | 1.57 | (0.92 | ) | 1.96 | 1.45 | 0.27 | |||||||||||||||||||||||||||
| Distributions to Shareholders: | ||||||||||||||||||||||||||||||||||||||||
| Net investment income | — | (0.12 | ) | (0.29 | ) | (0.24 | ) | — | — | — | (0.24 | ) | (0.27 | ) | — | |||||||||||||||||||||||||
| Net realized gains | — | (1.19 | ) | (1.07 | ) | — | (0.15 | ) | — | (1.19 | ) | (1.07 | ) | — | — | |||||||||||||||||||||||||
| Total distributions | — | (1.31 | ) | (1.36 | ) | (0.24 | ) | (0.15 | ) | — | (1.19 | ) | (1.31 | ) | (0.27 | ) | — | |||||||||||||||||||||||
| Net asset value, end of year or period | $ | 11.02 | $ | 9.38 | $ | 11.57 | $ | 10.87 | $ | 9.60 | $ | 10.87 | $ | 9.30 | $ | 11.41 | $ | 10.76 | $ | 9.58 | ||||||||||||||||||||
| Total return (4) | 17.48 | % | (6.18 | )% | 19.35 | % | 15.68 | % (5) | (4.46 | )% (5) | 16.88 | % | (6.77 | )% | 18.58 | % | 15.05 | % | 2.90 | % (6) | ||||||||||||||||||||
| Net assets, end of year or period (in 000s) | $ | 139,415 | $ | 157,573 | $ | 102,196 | $ | 69,960 | $ | 74,371 | $ | 649 | $ | 455 | $ | 650 | $ | 459 | $ | 58 | ||||||||||||||||||||
| Ratios/Supplemental Data: | ||||||||||||||||||||||||||||||||||||||||
| Ratio of gross expenses to average net assets (7) | 1.42 | % | 1.42 | % | 1.42 | % | 1.41 | % | 1.44 | % | 2.03 | % | 2.02 | % | 2.01 | % | 2.01 | % | 2.04 | % (8) | ||||||||||||||||||||
| Ratio of net investment income (loss) to average net assets (7,9) | (0.05 | )% | 0.81 | % | (0.49 | )% | 0.46 | % | (0.21 | )% | (0.65 | )% | (0.12 | )% | (1.02 | )% | (0.01 | )% | 1.57 | % (8) | ||||||||||||||||||||
| Portfolio turnover rate | 727 | % | 797 | % | 495 | % | 558 | % | 687 | % | 727 | % | 797 | % | 495 | % | 558 | % | 687 | % (6) | ||||||||||||||||||||
| (1) | The Fund commenced operations on August 9, 2013. Advisor Class commenced operations on March 18, 2016. |
| (2) | Per share amounts calculated using the average shares method, which more appropriately presents the per share data for the year or period. |
| (3) | Realized and unrealized gains and losses per share are balancing amounts necessary to reconcile the change in net asset value per share for the period, and may not reconcile with the aggregate gains and losses in the statements of operations due to share transactions for the period. |
| (4) | Total returns shown assumes the reinvestment of all distributions. |
| (5) | Includes adjustments in accordance with accounting principles generally accepted in the United States and consequently the net asset value for financial reporting purposes and the returns based upon those net asset values may differ from the net asset value and returns for shareholder transactions. |
| (6) | Not Annualized. |
| (7) | The ratios of expenses to average net assets and net investment income (loss) to average net assets do not reflect the expenses of the underlying investment companies in which the Fund invests. |
| (8) | Annualized. |
| (9) | Recognition of net investment income (loss) by the Fund is affected by the timing and declaration of dividends by the underlying investment companies in which the Fund invests. |
| (10) | Represents less than $0.01 per share. |
See accompanying notes to financial statements.
35
| FINANCIAL HIGHLIGHTS |
| Quantified Alternative Investment Fund |
| The table sets forth financial data for one share of beneficial interest outstanding throughout each year or period. |
| Investor Class | Advisor Class | |||||||||||||||||||||||||||||||||||||||
| Period Ended | ||||||||||||||||||||||||||||||||||||||||
| Year ended June 30, | Year Ended June 30, | June 30, | ||||||||||||||||||||||||||||||||||||||
| 2020 | 2019 | 2018 | 2017 | 2016 | 2020 | 2019 | 2018 | 2017 | 2016 (1) | |||||||||||||||||||||||||||||||
| Net asset value, beginning of year or period | $ | 9.48 | $ | 9.46 | $ | 9.49 | $ | 9.12 | $ | 9.50 | $ | 9.35 | $ | 9.39 | $ | 9.42 | $ | 9.12 | $ | 8.91 | ||||||||||||||||||||
| Activity from investment operations: | ||||||||||||||||||||||||||||||||||||||||
| Net investment income (loss) (2) | 0.07 | 0.07 | 0.10 | 0.05 | 0.00 | (0.05 | ) | 0.01 | 0.06 | (0.06 | ) | (0.06 | ) | |||||||||||||||||||||||||||
| Net realized and unrealized gain (loss) on investments, futures and underlying investment companies | (0.79 | ) | (0.04 | ) | 0.19 | 0.32 | (0.26 | ) | (0.71 | ) | (0.05 | ) | 0.17 | 0.36 | 0.27 | (3) | ||||||||||||||||||||||||
| Total from investment operations | (0.72 | ) | 0.03 | 0.29 | 0.37 | (0.26 | ) | (0.76 | ) | (0.04 | ) | 0.23 | 0.30 | 0.21 | ||||||||||||||||||||||||||
| Distributions to Shareholders: | ||||||||||||||||||||||||||||||||||||||||
| Net investment income | (0.14 | ) | (0.01 | ) | (0.16 | ) | — | (4) | (0.04 | ) | (0.08 | ) | — | (0.10 | ) | — | (4) | — | ||||||||||||||||||||||
| Net realized gains | — | — | (0.16 | ) | — | (0.08 | ) | — | — | (0.16 | ) | — | — | |||||||||||||||||||||||||||
| Total distributions | (0.14 | ) | (0.01 | ) | (0.32 | ) | — | (4) | (0.12 | ) | (0.08 | ) | — | (0.26 | ) | — | (4) | — | ||||||||||||||||||||||
| Net asset value, end of year or period | $ | 8.62 | $ | 9.48 | $ | 9.46 | $ | 9.49 | $ | 9.12 | $ | 8.51 | $ | 9.35 | $ | 9.39 | $ | 9.42 | $ | 9.12 | ||||||||||||||||||||
| Total return (5) | (7.76 | )% | 0.28 | % | 2.79 | % (6) | 4.09 | % | (2.75 | )% | (8.26 | )% | (0.43 | )% | 2.25 | % | 3.31 | % (6) | 2.36 | % (6,7) | ||||||||||||||||||||
| Net assets, end of year or period (in 000s) | $ | 7,533 | $ | 8,682 | $ | 9,092 | $ | 8,637 | $ | 3,938 | $ | 62 | $ | 15 | $ | 16 | $ | 18 | $ | 22 | ||||||||||||||||||||
| Ratios/Supplemental Data: | ||||||||||||||||||||||||||||||||||||||||
| Ratio of gross expenses to average net assets (8) | 1.46 | % | 1.42 | % | 1.41 | % | 1.43 | % | 1.44 | % | 2.14 | % | 2.02 | % | 2.01 | % | 2.03 | % | 2.04 | % (9) | ||||||||||||||||||||
| Ratio of net investment income (loss) to average net assets (8,10) | 0.74 | % | 0.71 | % | 1.03 | % | 0.49 | % | 0.02 | % | (0.57 | )% | 0.09 | % | 0.64 | % | (0.65 | )% | (2.17 | )% (9) | ||||||||||||||||||||
| Portfolio turnover rate | 570 | % | 595 | % | 553 | % | 625 | % | 687 | % | 570 | % | 595 | % | 553 | % | 625 | % | 687 | % (7) | ||||||||||||||||||||
| (1) | The Fund commenced operations on August 9, 2013. Advisor Class commenced operations on March 18, 2016. |
| (2) | Per share amounts calculated using the average shares method, which more appropriately presents the per share data for the year or period. |
| (3) | Realized and unrealized gains and losses per share are balancing amounts necessary to reconcile the change in net asset value per share for the period, and may not reconcile with the aggregate gains and losses in the statements of operations due to share transactions for the period. |
| (4) | Represents less than $0.01 per share. |
| (5) | Total returns shown assumes the reinvestment of all distributions. |
| (6) | Includes adjustments in accordance with accounting principles generally accepted in the United States and consequently the net asset value for financial reporting purposes and the returns based upon those net asset values may differ from the net asset values and returns for shareholder transactions. |
| (7) | Not Annualized. |
| (8) | The ratios of expenses to average net assets and net investment income (loss) to average net assets do not reflect the expenses of the underlying investment companies in which the Fund invests. |
| (9) | Annualized. |
| (10) | Recognition of net investment income (loss) by the Fund is affected by the timing and declaration of dividends by the underlying investment companies in which the Fund invests. |
See accompanying notes to financial statements.
36
| FINANCIAL HIGHLIGHTS |
| Quantified STF Fund |
| The table sets forth financial data for one share of beneficial interest outstanding throughout each year or period. |
| Investor Class | Advisor Class | |||||||||||||||||||||||||||||||||||||||
| Period Ended | Period Ended | |||||||||||||||||||||||||||||||||||||||
| Year Ended June 30, | June 30, | Year Ended June 30, | June 30, | |||||||||||||||||||||||||||||||||||||
| 2020 | 2019 | 2018 | 2017 | 2016 (1) | 2020 | 2019 | 2018 | 2017 | 2016 (1) | |||||||||||||||||||||||||||||||
| Net asset value, beginning of year or period | $ | 9.51 | $ | 10.05 | $ | 11.22 | $ | 8.25 | $ | 10.00 | $ | 9.31 | $ | 9.88 | $ | 11.14 | $ | 8.24 | $ | 10.00 | ||||||||||||||||||||
| Activity from investment operations: | ||||||||||||||||||||||||||||||||||||||||
| Net investment income (loss) (2) | 0.01 | 0.04 | 0.01 | — | (8) | (0.01 | ) | (0.07 | ) | (0.02 | ) | (0.05 | ) | (0.07 | ) | (0.01 | ) | |||||||||||||||||||||||
| Net realized and unrealized gain (loss) on investments, futures and underlying investment companies | 4.18 | (0.34 | ) | 2.82 | 2.97 | (1.74 | ) | 4.10 | (0.33 | ) | 2.79 | 2.98 | (1.75 | ) | ||||||||||||||||||||||||||
| Total from investment operations | 4.19 | (0.30 | ) | 2.83 | 2.97 | (1.75 | ) | 4.03 | (0.35 | ) | 2.74 | 2.91 | (1.76 | ) | ||||||||||||||||||||||||||
| Distributions to Shareholders: | ||||||||||||||||||||||||||||||||||||||||
| Net investment income | (0.06 | ) | (0.02 | ) | — | — | (8) | — | — | — | — | (0.01 | ) | — | ||||||||||||||||||||||||||
| Net realized gains | — | (0.22 | ) | (4.00 | ) | — | — | — | (0.22 | ) | (4.00 | ) | — | — | ||||||||||||||||||||||||||
| Total distributions | (0.06 | ) | (0.24 | ) | (4.00 | ) | — | (8) | — | — | (0.22 | ) | (4.00 | ) | (0.01 | ) | — | |||||||||||||||||||||||
| Net asset value, end of year or period | $ | 13.64 | $ | 9.51 | $ | 10.05 | $ | 11.22 | $ | 8.25 | $ | 13.34 | $ | 9.31 | $ | 9.88 | $ | 11.14 | $ | 8.24 | ||||||||||||||||||||
| Total return (3,4) | 44.17 | % | (3.12 | )% | 24.06 | % | 36.01 | % | (17.50 | )% (4) | 43.29 | % | (3.65 | )% | 23.31 | % | 35.32 | % | (17.60 | )% (4) | ||||||||||||||||||||
| Net assets, end of year or period (in 000s) | $ | 70,861 | $ | 70,238 | $ | 92,664 | $ | 88,696 | $ | 82,320 | $ | 456 | $ | 121 | $ | 261 | $ | 122 | $ | 14 | ||||||||||||||||||||
| Ratios/Supplemental Data: | ||||||||||||||||||||||||||||||||||||||||
| Ratio of gross expenses to average net assets (6) | 1.68 | % | 1.67 | % | 1.66 | % | 1.66 | % | 1.69 | % (5) | 2.28 | % | 2.27 | % | 2.26 | % | 2.26 | % | 2.29 | % (5) | ||||||||||||||||||||
| Ratio of net investment income (loss) to average net assets (6,7) | 0.05 | % | 0.42 | % | 0.12 | % | (0.04 | )% | (0.13 | )% (5) | (0.65 | )% | (0.20 | )% | (0.46 | )% | (0.80 | )% | (0.25 | )% (5) | ||||||||||||||||||||
| Portfolio turnover rate | 91 | % | 41 | % | 72 | % | 41 | % | 59 | % (4) | 91 | % | 41 | % | 72 | % | 41 | % | 59 | % (4) | ||||||||||||||||||||
| (1) | The Fund commenced operations on November 13, 2015. |
| (2) | Per share amounts calculated using the average shares method, which more appropriately presents the per share data for the period. |
| (3) | Total returns shown assumes the reinvestment of all distributions. |
| (4) | Not Annualized. |
| (5) | Annualized. |
| (6) | The ratios of expenses to average net assets and net investment income (loss) to average net assets do not reflect the expenses of the underlying investment companies in which the Fund invests. |
| (7) | Recognition of net investment income (loss) by the Fund is affected by the timing and declaration of dividends by the underlying investment companies in which the Fund invests. |
| (8) | Represents less than $0.01 per share. |
See accompanying notes to financial statements.
37
| FINANCIAL HIGHLIGHTS |
| Quantified Pattern Recognition Fund |
| The table sets forth financial data for one share of beneficial interest outstanding throughout the period. |
| Investor Class | ||||
| Period Ended | ||||
| June 30, | ||||
| 2020 (1) | ||||
| Net asset value, beginning of period | $ | 10.00 | ||
| Activity from investment operations: | ||||
| Net investment loss (2) | (0.00 | ) (8) | ||
| Net realized and unrealized gain on investments and futures | 0.90 | |||
| Total from investment operations | 0.90 | |||
| Distributions to Shareholders: | ||||
| Net investment income | (0.02 | ) | ||
| Net realized gains | (0.39 | ) | ||
| Total distributions | (0.41 | ) | ||
| Net asset value, end of period | $ | 10.49 | ||
| Total return (3,4) | 8.90 | % (4) | ||
| Net assets, end of period (in 000s) | $ | 20,138 | ||
| Ratios/Supplemental Data: | ||||
| Ratio of gross expenses to average net assets (6) | 1.69 | % (5) | ||
| Ratio of net investment loss to average net assets (6,7) | (0.01 | )% (5) | ||
| Portfolio turnover rate | 244 | % (4) | ||
| (1) | The Fund commenced operations on August 30, 2019. |
| (2) | Per share amounts calculated using the average shares method, which more appropriately presents the per share data for the period. |
| (3) | Total returns shown assumes the reinvestment of all distributions. |
| (4) | Not Annualized. |
| (5) | Annualized. |
| (6) | The ratios of expenses to average net assets and net investment income to average net assets do not reflect the expenses of the underlying investment companies in which the Fund invests. |
| (7) | Recognition of net investment income by the Fund is affected by the timing and declaration of dividends by the underlying investment companies in which the Fund invests. |
| (8) | Represents less than $0.01 per share. |
See accompanying notes to financial statements.
38
| FINANCIAL HIGHLIGHTS |
| Quantified Tactical Fixed Income Fund |
| The table sets forth financial data for one share of beneficial interest outstanding throughout the period. |
| Investor Class | ||||
| Period Ended | ||||
| June 30, | ||||
| 2020 (1) | ||||
| Net asset value, beginning of period | $ | 10.00 | ||
| Activity from investment operations: | ||||
| Net investment loss (2) | (0.02 | ) | ||
| Net realized and unrealized gain (loss) on investments, futures and swaps | 1.18 | |||
| Total from investment operations | 1.16 | |||
| Distributions to Shareholders: | ||||
| Net investment income | (0.03 | ) | ||
| Net realized gains | (0.18 | ) | ||
| Total distributions | (0.21 | ) | ||
| Net asset value, end of period | $ | 10.95 | ||
| Total return (3,4) | 11.84 | % (4) | ||
| Net assets, end of period (in 000s) | $ | 86,168 | ||
| Ratios/Supplemental Data: | ||||
| Ratio of gross expenses to average net assets (6) | 1.67 | % (5) | ||
| Ratio of net investment loss to average net assets (6,7) | (0.23 | )% (5) | ||
| Portfolio turnover rate | 177 | % (4) | ||
| (1) | The Fund commenced operations on September 13, 2019. |
| (2) | Per share amounts calculated using the average shares method, which more appropriately presents the per share data for the period. |
| (3) | Total returns shown assumes the reinvestment of all distributions. |
| (4) | Not Annualized. |
| (5) | Annualized. |
| (6) | The ratios of expenses to average net assets and net investment income to average net assets do not reflect the expenses of the underlying investment companies in which the Fund invests. |
| (7) | Recognition of net investment income by the Fund is affected by the timing and declaration of dividends by the underlying investment companies in which the Fund invests. |
See accompanying notes to financial statements.
39
| CONSOLIDATED FINANCIAL HIGHLIGHTS |
| Quantified Evolution Plus Fund |
| The table sets forth financial data for one share of beneficial interest outstanding throughout the period. |
| Investor Class | ||||
| Period Ended | ||||
| June 30, | ||||
| 2020 (1) | ||||
| Net asset value, beginning of period | $ | 10.00 | ||
| Activity from investment operations: | ||||
| Net investment loss (2) | (0.04 | ) | ||
| Net realized and unrealized gain (loss) on investments, futures and swaps | (1.05 | ) | ||
| Total from investment operations | (1.09 | ) | ||
| Distributions to Shareholders: | ||||
| Net investment income | (0.01 | ) | ||
| Net realized gains | (0.00 | ) (8) | ||
| Total distributions | (0.01 | ) | ||
| Net asset value, end of period | $ | 8.90 | ||
| Total return (3,4) | (10.87 | )% (4) | ||
| Net assets, end of period (in 000s) | $ | 25,442 | ||
| Ratios/Supplemental Data: | ||||
| Ratio of gross expenses to average net assets (6) | 1.68 | % (5) | ||
| Ratio of net investment loss to average net assets (6,7) | (0.53 | )% (5) | ||
| Portfolio turnover rate | 437 | % (4) | ||
| (1) | The Fund commenced operations on September 30, 2019. |
| (2) | Per share amounts calculated using the average shares method, which more appropriately presents the per share data for the period. |
| (3) | Total returns shown assumes the reinvestment of all distributions. |
| (4) | Not Annualized. |
| (5) | Annualized. |
| (6) | The ratios of expenses to average net assets and net investment income to average net assets do not reflect the expenses of the underlying investment companies in which the Fund invests. |
| (7) | Recognition of net investment income by the Fund is affected by the timing and declaration of dividends by the underlying investment companies in which the Fund invests. |
| (8) | Represents less than $0.01 per share. |
See accompanying notes to consolidated financial statements.
40
| FINANCIAL HIGHLIGHTS |
| Quantified Common Ground Fund |
| The table sets forth financial data for one share of beneficial interest outstanding throughout the period. |
| Investor Class | ||||
| Period Ended | ||||
| June 30, | ||||
| 2020 (1) | ||||
| Net asset value, beginning of period | $ | 10.00 | ||
| Activity from investment operations: | ||||
| Net investment loss (2) | (0.01 | ) | ||
| Net realized and unrealized gain on investments | (0.62 | ) | ||
| Total from investment operations | (0.63 | ) | ||
| Net asset value, end of period | $ | 9.37 | ||
| Total return (3,4) | (6.30 | )% (4) | ||
| Net assets, end of period (in 000s) | $ | 19,972 | ||
| Ratios/Supplemental Data: | ||||
| Ratio of gross expenses to average net assets | 1.74 | % (5) | ||
| Ratio of net investment loss to average net assets | (0.12 | )% (5) | ||
| Portfolio turnover rate | 484 | % (4) | ||
| (1) | The Fund commenced operations on December 27, 2019. |
| (2) | Per share amounts calculated using the average shares method, which more appropriately presents the per share data for the period. |
| (3) | Total returns shown assumes the reinvestment of all distributions. |
| (4) | Not Annualized. |
| (5) | Annualized. |
See accompanying notes to financial statements.
41
| The Quantified Funds |
| NOTES TO CONSOLIDATED FINANCIAL STATEMENTS |
| June 30, 2020 |
| 1. | ORGANIZATION |
Quantified Managed Income Fund, Quantified Market Leaders Fund, Quantified Alternative Investment Fund, Quantified STF Fund, Quantified Pattern Recognition Fund, Quantified Tactical Fixed Income Fund, Quantified Evolution Plus Fund and Quantified Common Ground Fund (each a “Fund” and collectively the “Funds”) are each a diversified series (except Quantified STF, Quantified Pattern Recognition, Quantified Tactical Fixed Income, Quantified Evolution Plus, and Quantified Common Ground, which are non-diversified series), of Advisors Preferred Trust (the “Trust”), a statutory trust organized under the laws of the State of Delaware on August 15, 2012 and registered under the Investment Company Act of 1940, as amended (the “1940 Act”), as an open-end management investment company. Quantified Managed Income Fund, Quantified Market Leaders Fund, Quantified Alternative Investment Fund and Quantified STF Fund currently offer two classes of shares, Investor and Advisor classes of shares each of which are offered at Net Asset Value (“NAV”). Quantified Pattern Recognition Fund, Quantified Tactical Fixed Income Fund, Quantified Evolution Plus Fund and Quantified Common Ground Fund currently offer Investor Class shares, which are offered at NAV.
The Funds’ commencement dates and their investment objectives are as follows:
| Investor Class | Advisor Class | Investment Objective | |
| Quantified Managed Income Fund | August 9, 2013 | March 18, 2016 | seeks high total return from fixed income investments on an annual basis consistent with a moderate tolerance for risk |
| Quantified Market Leaders Fund | August 9, 2013 | March 18, 2016 | seeks high appreciation on an annual basis consistent with a high tolerance for risk |
| Quantified Alternative Invest Fund | August 9, 2013 | March 18, 2016 | seeks high total return from alternative investment vehicles on an annual basis consistent with a high tolerance for risk |
| Quantified STF Fund | November 13, 2015 | November 13, 2015 | seeks high appreciation on an annual basis consistent with a high tolerance for risk. |
| Quantified Pattern Recognition Fund | August 30, 2019 | N/A | seeks capital appreciation |
| Quantified Tactical Fixed Income Fund | September 13, 2019 | N/A | seeks total return |
| Quantified Evolution Plus Fund | September 30, 2019 | N/A | seeks capital appreciation |
| Quantified Common Ground Fund | December 27, 2019 | N/A | seeks total return |
| 2. | SIGNIFICANT ACCOUNTING POLICIES |
The following is a summary of significant accounting policies followed by each Fund in preparation of their financial statements. The policies are in conformity with U.S. generally accepted accounting principles (“GAAP”). The preparation of the financial statements in conformity with GAAP requires management to make estimates and assumptions that affect the reported amounts of assets and liabilities and disclosure of contingent assets and liabilities at the date of the financial statements and the reported amounts of increases and decreases in net assets from operations during the reporting period. Actual results could differ from those estimates. Each Fund is an investment company and accordingly follows the investment company accounting and reporting guidance of the Financial Accounting Standards Board (“FASB”) Accounting Standard Codification Topic 946 Financial Services – Investment Companies including FASB Accounting Standard Update (“ASU”) 2013-08. Each Fund’s income, expenses (other than class-specific distribution and service fees) and realized and unrealized gains and losses are allocated proportionately each day based upon the relative net assets of each class.
Securities Valuation – Securities listed on an exchange are valued at the last reported sale price at the close of the regular trading session of the primary exchange on the business day the value is being determined, or in the case of securities listed on NASDAQ at the NASDAQ Official Closing Price. In the absence of a sale, such securities shall be valued at the mean between the current bid and ask prices on the day of valuation. Futures are valued at the final settled price or, in the absence of a settled price, at the last sale price on the day of valuation. Investments in open-end investment companies are valued at net asset value. Debt securities (other than short-term obligations) are valued each day by an independent pricing service approved by the Board of Trustees (the “Board”) based on methods which include consideration of: yields or prices of securities of comparable quality, coupon, maturity and type,
42
| The Quantified Funds |
| NOTES TO CONSOLIDATED FINANCIAL STATEMENTS (Continued) |
| June 30, 2020 |
indications as to values from dealers, and general market conditions or market quotations from a major market maker in the securities. Short-term debt obligations with remaining maturities in excess of sixty days are valued at current market prices by an independent pricing service approved by the Trust’s Board of Trustees. The independent pricing service does not distinguish between smaller-sized bond positions known as “odd lots” and larger institutional-sized bond positions known as “round lots”. The Funds may fair value a particular bond if the advisor does not believe that the round lot value provided by the independent pricing service reflects fair value of the Funds’ holding. Total return swaps on exchange-listed securities shall be valued at the last quoted sales price or, in the absence of a sale, at the mean between the current bid and ask prices. Exchange listed swaps shall be valued at the last quoted sales price or, in the absence of a sale, at the mean between the current bid and ask prices. Investments valued in currencies other than the U.S. dollar are converted to U.S. dollars using exchange rates obtained from pricing services. Short-term debt obligations having sixty days or less remaining until maturity, at time of purchase, may be valued at amortized cost which approximates fair value.
Each Fund may hold securities, such as private investments, interests in commodity pools, other non-traded securities or temporarily illiquid securities, for which market quotations are not readily available or are determined to be unreliable. These securities will be valued at their fair value as determined using the “fair value” procedures approved by the Board. The Board has delegated execution of these procedures to a fair value committee composed of one or more representatives from each of the (i) Trust, (ii) administrator, and (iii) advisor and/or sub-advisor. The committee may also enlist third party consultants such as a valuation specialist at a public accounting firm, valuation consultant or financial officer of a security issuer on an as-needed basis to assist in determining a security specific fair value. The Board reviews and ratifies the execution of this process and the resultant fair value prices at least quarterly to assure the process produces reliable results.
Fair Valuation Process – As noted above, the fair value committee is composed of one or more representatives from each of the (i) Trust, (ii) administrator, and (iii) advisor and/or sub-advisor. The applicable investments are valued collectively via inputs from each of these groups. For example, fair value determinations are required for the following securities: (i) securities for which market quotations are insufficient or not readily available on a particular business day (including securities for which there is a short and temporary lapse in the provision of a price by the regular pricing source) and (ii) securities for which, in the judgment of the advisor, the prices or values available do not represent the fair value of the instrument. Factors which may cause the advisor and/or sub-advisor to make such a judgment include, but are not limited to, the following: only a bid price or an asked price is available; the spread between bid and asked prices is substantial; the frequency of sales; the thinness of the market; the size of reported trades; and actions of the securities markets, such as the suspension or limitation of trading; (iii) securities determined to be illiquid; (iv) securities with respect to which an event that will affect the value thereof has occurred (a “significant event”) since the closing prices were established on the principal exchange on which they are traded, but prior to each Fund’s calculation of its net asset value. Specifically, interests in commodity pools or managed futures pools are valued on a daily basis by reference to the closing market prices of each futures contract or other asset held by a pool, as adjusted for pool expenses. Restricted or illiquid securities, such as private investments or non-traded securities are valued via inputs from the advisor based upon the current bid for the security from two or more independent dealers or other parties reasonably familiar with the facts and circumstances of the security (who should take into consideration all relevant factors as may be appropriate under the circumstances). If the advisor and/or sub-advisor is unable to obtain a current bid from such independent dealers or other independent parties, the fair value committee shall determine the fair value of such security using the following factors: (i) the type of security; (ii) the cost at date of purchase; (iii) the size and nature of the Funds’ holdings; (iv) the discount from market value of unrestricted securities of the same class at the time of purchase and subsequent thereto; (v) information as to any transactions or offers with respect to the security; (vi) the nature and duration of restrictions on disposition of the security and the existence of any registration rights; (vii) how the yield of the security compares to similar securities of companies of similar or equal creditworthiness; (viii) the level of recent trades of similar or comparable securities; (ix) the liquidity characteristics of the security; (x) current market conditions; and (xi) the market value of any securities into which the security is convertible or exchangeable.
43
| The Quantified Funds |
| NOTES TO CONSOLIDATED FINANCIAL STATEMENTS (Continued) |
| June 30, 2020 |
Valuation of Fund of Funds – Each Fund invests in portfolios of open-end or closed-end investment companies (the “Underlying Funds”). The Underlying Funds value securities in their portfolios for which market quotations are readily available at their market values (generally the last reported sale price) and all other securities and assets at their fair value based upon the methods established by the board of directors of the Underlying Funds.
Open-end investment companies are valued at their respective net asset values as reported by such investment companies. The shares of many closed-end investment companies, after their initial public offering, frequently trade at a price per share, which is different than the net asset value per share. The difference represents a market premium or market discount of such shares. There can be no assurances that the market discount or market premium on shares of any closed-end investment company purchased by the Funds will not change.
The Funds utilize various methods to measure the fair value of all of their investments on a recurring basis. GAAP establishes a hierarchy that prioritizes inputs to valuation methods. The three levels of input are:
Level 1 – Unadjusted quoted prices in active markets for identical assets and liabilities that the Funds have the ability to access.
Level 2 – Observable inputs other than quoted prices included in Level 1 that are observable for the asset or liability, either directly or indirectly. These inputs may include quoted prices for the identical instrument on an inactive market, prices for similar instruments, interest rates, prepayment speeds, credit risk, yield curves, default rates and similar data.
Level 3 – Unobservable inputs for the asset or liability, to the extent relevant observable inputs are not available, representing the Funds’ own assumptions about the assumptions a market participant would use in valuing the asset or liability, and would be based on the best information available.
The availability of observable inputs can vary from security to security and is affected by a wide variety of factors, including, for example, the type of security, whether the security is new and not yet established in the marketplace, the liquidity of markets, and other characteristics particular to the security. To the extent that valuation is based on models or inputs that are less observable or unobservable in the market, the determination of fair value requires more judgment. Accordingly, the degree of judgment exercised in determining fair value is greatest for instruments categorized in Level 3.
The inputs used to measure fair value may fall into different levels of the fair value hierarchy. In such cases, for disclosure purposes, the level in the fair value hierarchy within which the fair value measurement falls in its entirety, is determined based on the lowest level input that is significant to the fair value measurement in its entirety.
44
| The Quantified Funds |
| NOTES TO CONSOLIDATED FINANCIAL STATEMENTS (Continued) |
| June 30, 2020 |
The inputs or methodology used for valuing securities are not necessarily an indication of the risk associated with investing in those securities. The following tables summarize the inputs used as of June 30, 2020 for each Fund’s assets and liabilities measured at fair value:
| Quantified Managed Income Fund | ||||||||||||||||
| Assets | Level 1 | Level 2 | Level 3 | Total | ||||||||||||
| Investments | ||||||||||||||||
| Common Stocks * | $ | 7,159,804 | $ | — | $ | — | $ | 7,159,804 | ||||||||
| Exchange Traded Funds | 10,766,391 | — | — | 10,766,391 | ||||||||||||
| Short-Term Investments | 54,362,793 | — | — | 54,362,793 | ||||||||||||
| Collateral For Securities Loaned | 402,674 | — | — | 402,674 | ||||||||||||
| Total | $ | 72,691,662 | $ | — | $ | — | $ | 72,691,662 | ||||||||
| Liabilities | ||||||||||||||||
| Derivatives | ||||||||||||||||
| Futures Contracts | $ | (160,704 | ) | $ | — | $ | — | $ | (160,704 | ) | ||||||
| Quantified Market Leaders Fund | ||||||||||||||||
| Assets | Level 1 | Level 2 | Level 3 | Total | ||||||||||||
| Investments | ||||||||||||||||
| Exchange Traded Funds | $ | 113,188,604 | $ | — | $ | — | $ | 113,188,604 | ||||||||
| Short-Term Investments | 20,461,566 | — | — | 20,461,566 | ||||||||||||
| Total | $ | 133,650,170 | $ | — | $ | — | $ | 133,650,170 | ||||||||
| Derivatives | ||||||||||||||||
| Total Return Swaps | $ | — | $ | 2,119,285 | $ | — | $ | 2,119,285 | ||||||||
| Total Assets | $ | 133,650,170 | $ | 2,119,285 | $ | — | $ | 135,769,455 | ||||||||
| Quantified Alternative Investment Fund | ||||||||||||||||
| Assets | Level 1 | Level 2 | Level 3 | Total | ||||||||||||
| Investments | ||||||||||||||||
| Open-End Mutual Funds | $ | 2,125,080 | $ | — | $ | — | $ | 2,125,080 | ||||||||
| Exchange Traded Funds | 3,597,098 | — | — | 3,597,098 | ||||||||||||
| Short-Term Investments | 1,931,800 | — | — | 1,931,800 | ||||||||||||
| Collateral For Securities Loaned | 177,772 | — | — | 177,772 | ||||||||||||
| Total | $ | 7,831,750 | $ | — | $ | — | $ | 7,831,750 | ||||||||
| Derivatives | ||||||||||||||||
| Futures Contracts | $ | 5,496 | $ | — | $ | — | $ | 5,496 | ||||||||
| Total Assets | $ | 7,837,246 | $ | — | $ | — | $ | 7,837,246 | ||||||||
| Quantified STF Fund | ||||||||||||||||
| Assets | Level 1 | Level 2 | Level 3 | Total | ||||||||||||
| Investments | ||||||||||||||||
| Agency Bonds * | $ | — | $ | 2,000,975 | $ | — | $ | 2,000,975 | ||||||||
| Bonds & Notes * | — | 13,600,898 | — | 13,600,898 | ||||||||||||
| Certificates of Deposit * | — | 16,707,423 | — | 16,707,423 | ||||||||||||
| Exchange Traded Funds | 7,241,162 | — | — | 7,241,162 | ||||||||||||
| Short-Term Investments | 20,458,954 | — | — | 20,458,954 | ||||||||||||
| Collateral For Securities Loaned | 1,577,101 | — | — | 1,577,101 | ||||||||||||
| Total | $ | 29,277,217 | $ | 32,309,296 | $ | — | $ | 61,586,513 | ||||||||
| Derivatives | ||||||||||||||||
| Futures Contracts | $ | 2,834,441 | $ | — | $ | — | $ | 2,834,441 | ||||||||
| Total Assets | $ | 32,111,658 | $ | 32,309,296 | $ | — | $ | 64,420,954 | ||||||||
45
| The Quantified Funds |
| NOTES TO CONSOLIDATED FINANCIAL STATEMENTS (Continued) |
| June 30, 2020 |
| Quantified Pattern Recognition Fund | ||||||||||||||||
| Assets | Level 1 | Level 2 | Level 3 | Total | ||||||||||||
| Investments | ||||||||||||||||
| Certificates of Deposit * | $ | — | $ | 9,158,467 | $ | — | $ | 9,158,467 | ||||||||
| Exchange Traded Funds | 2,019,543 | — | — | 2,019,543 | ||||||||||||
| Short-Term Investments | 8,905,349 | — | — | 8,905,349 | ||||||||||||
| Total | $ | 10,924,892 | $ | 9,158,467 | $ | — | $ | 20,083,359 | ||||||||
| Quantified Tactical Fixed Income Fund | ||||||||||||||||
| Assets | Level 1 | Level 2 | Level 3 | Total | ||||||||||||
| Investments | ||||||||||||||||
| Certificates of Deposit * | $ | — | $ | 17,724,039 | $ | — | $ | 17,724,039 | ||||||||
| Exchange Traded Funds | 8,796,523 | — | — | 8,796,523 | ||||||||||||
| Short-Term Investments | 55,433,016 | — | — | 55,433,016 | ||||||||||||
| Collateral For Securities Loaned * | 1,406,517 | — | — | 1,406,517 | ||||||||||||
| Total | $ | 65,636,056 | $ | 17,724,039 | $ | — | $ | 83,360,095 | ||||||||
| Liabilities | ||||||||||||||||
| Derivatives | ||||||||||||||||
| Futures Contracts | $ | (10,059 | ) | $ | — | $ | — | $ | (10,059 | ) | ||||||
| Total Return Swaps | — | (504,425 | ) | — | (504,425 | ) | ||||||||||
| Total | $ | (10,059 | ) | $ | (504,425 | ) | $ | — | $ | (514,484 | ) | |||||
| Quantified Evolution Plus Fund | ||||||||||||||||
| Assets | Level 1 | Level 2 | Level 3 | Total | ||||||||||||
| Investments | ||||||||||||||||
| Certificates of Deposit * | $ | — | $ | 3,064,408 | $ | — | $ | 3,064,408 | ||||||||
| Exchange Traded Funds | 1,577,400 | — | — | 1,577,400 | ||||||||||||
| Short-Term Investments | 18,351,321 | — | — | 18,351,321 | ||||||||||||
| Total | $ | 19,928,721 | $ | 3,064,408 | $ | — | $ | 22,993,129 | ||||||||
| Derivatives | ||||||||||||||||
| Futures Contracts | $ | 630,416 | $ | — | $ | — | $ | 630,416 | ||||||||
| Total Assets | $ | 20,559,137 | $ | 3,064,408 | $ | — | $ | 23,623,545 | ||||||||
| Quantified Common Ground Fund | ||||||||||||||||
| Assets | Level 1 | Level 2 | Level 3 | Total | ||||||||||||
| Investments | ||||||||||||||||
| Common Stocks * | $ | 11,975,561 | $ | — | $ | — | $ | 11,975,561 | ||||||||
| Real Estate Investment Trusts | 1,623,715 | — | — | 1,623,715 | ||||||||||||
| Short-Term Investments | 6,115,854 | — | — | 6,115,854 | ||||||||||||
| Collateral For Securities Loaned | 116,275 | — | — | 116,275 | ||||||||||||
| Total | $ | 19,831,405 | $ | — | $ | — | $ | 19,831,405 | ||||||||
| * | Refer to each of the Portfolio of Investments for industry classifications. |
The Funds did not hold any Level 3 securities during the year or period ended June 30, 2020.
Consolidation of Subsidiaries – The consolidated financial statements of the Fund include the accounts of QEPF Fund Ltd. (“QEPF Ltd.”), a wholly-owned subsidiary. All inter-company accounts and transactions have been eliminated in consolidation. The Fund may invest up to 25% of its total assets in QEPF Ltd., which acts as an investment vehicle in order to affect certain investments consistent with the Fund’s investment objectives and policies. The subsidiary commenced operations on December 30, 2019 and is an exempted Cayman Islands company with limited liability.
46
| The Quantified Funds |
| NOTES TO CONSOLIDATED FINANCIAL STATEMENTS (Continued) |
| June 30, 2020 |
A summary of the Fund’s investment in QEPF Ltd. is as follows:
| Inception | % Of Net Assets | ||||||||||
| Date of QEPF | QEPF Ltd. Net Assets at | at | |||||||||
| Ltd. | June 30, 2020 | June 30, 2020 | |||||||||
| QEPF Ltd. | 12/30/19 | $1,508,282 | 5.93% |
Exchange Traded Funds (“ETFs”), Mutual Funds and Exchange Traded Notes (“ETNs”) Risk: ETFs, mutual funds and ETNs are subject to investment advisory or management and other expenses, which will be indirectly paid by the Funds. Each is subject to specific risks, depending on investment strategy. Also, each may be subject to leverage risk, which will magnify losses. ETNs are subject to default risks.
Exchange Traded Funds – Each Fund invests in ETFs. ETFs are typically a type of index fund bought and sold on a securities exchange. An ETF trades like common stock and typically represents a fixed portfolio of securities designed to track the performance and dividend yield of a particular domestic or foreign market index. Each Fund may purchase an ETF to temporarily gain exposure to a portion of the U.S. or a foreign market. The risks of owning an ETF generally reflect the risks of owning the underlying securities they are designed to track, although the lack of liquidity on an ETF could result in it being more volatile. Additionally, ETFs have fees and expenses that reduce their value.
Foreign Currency Translations – All assets and liabilities denominated in foreign currencies are translated into U.S. dollars based on the rate of exchange of such currencies against U.S. dollars on the date of valuation. Purchases and sales of securities and income and expenses are translated at the rate of exchange quoted on the respective date that such transactions are recorded. The Funds do not isolate the portion of the results of operations resulting from changes in foreign exchange rates on investments from the fluctuations arising from changes in market prices of securities held. Each Fund’s investments in foreign securities are subject to foreign currency fluctuations, higher volatility than U.S. securities, varying degrees of regulation and limited liquidity. Greater political, economic, credit and information risks are also associated with foreign securities.
Swap Contracts – Each Fund is subject to equity price risk, interest rate risk, credit risk and counterparty risk in the normal course of pursuing its investment objective. Each Fund may enter into various swap transactions for investment purposes or to manage interest rate, equity, or credit risk. These would be two-party contracts entered into primarily to exchange the returns (or differentials in rates of returns) earned or realized on particular pre-determined investments or instruments.
Standard equity swap contracts are between two parties that agree to exchange the returns (or differentials in rates of return) earned or realized on particular predetermined investments or instruments. The gross amount to be exchanged is calculated with respect to a “notional amount” (i.e. the return on or increase in value of a particular dollar amount invested in a “basket” of securities representing a particular index or industry sector on underlying fund). Most equity swap agreements entered into by a Fund calculate the obligations of the parties on a “net basis”. Consequently, a Fund’s current obligations under a swap agreement generally will be equal to the net amount to be paid or received under the agreement based on the relative value of the positions held by each party. Each Fund’s obligations are accrued daily (offset by any amounts owed to the Fund).
Each Fund may enter into swap contracts that provide the opposite return of the particular benchmark or security (“short” the index or security). The operations are similar to that of the swaps disclosed above except that the counterparty pays interest to the Fund on the notional amount outstanding and the dividends on the underlying securities reduce the return of the swap. However, in certain instances, market factors such as the interest rate environment and the demand to borrow the securities underlying the swap agreement can cause a scenario in which the Fund pays the counterparty interest. These amounts are netted with any unrealized appreciation or depreciation to determine the value of the swap. The Funds will typically enter into equity swap agreements in instances where the advisor believes that it
47
| The Quantified Funds |
| NOTES TO CONSOLIDATED FINANCIAL STATEMENTS (Continued) |
| June 30, 2020 |
may be more cost effective or practical than buying a security or the securities represented by a particular index.
Each Fund may enter into credit default swaps (“CDS”). CDS are typically two-party (bilateral) financial contracts that transfer credit exposure between the two parties. One party to a CDS (referred to as the credit protection “buyer”) receives credit protection or sheds credit risk, whereas the other party to a CDS (referred to as the credit protection “seller”) is selling credit protection or taking on credit risk. The seller typically receives pre-determined periodic payments from the other party. These payments are in consideration for agreeing to make compensating specific payments to the buyer should a negative credit event occur, such as (1) bankruptcy or (2) failure to pay interest or principal on a reference debt instrument, with respect to a specified issuer or one of the reference issuers in a CDS portfolio. In general, CDS may be used by a Fund to obtain credit risk exposure similar to that of a direct investment in high yield bonds.
The amounts to be exchanged or “swapped” between parties are calculated with respect to the notional amount. Changes in the value of swap agreements are recognized as unrealized gains or losses in the Statements of Operations by “marking to market” on a daily basis to reflect the value of the swap agreement at the end of each trading day. Payments received or paid at the beginning of the agreement are reflected as such on the Statements of Assets and Liabilities and may be referred to as upfront payments. A liquidation payment received or made at the termination of the swap agreement is recorded as a realized gain or loss on the Statements of Operations. The maximum pay-outs for these contracts are limited to the notional amount of each swap. CDS may involve greater risks than if a Fund had invested in the referenced obligation directly and are subject to general market risk, liquidity risk, counterparty risk and credit risk.
Each Fund may enter into Interest Rate Swaps. Interest rate swaps involve the exchange of commitments to pay and receive interest based on a notional principal amount. Each Fund may elect to pay a fixed rate and receive a floating rate, or receive a fixed rate and pay a floating rate on a notional principal amount.
Each Fund may enter into Total Return Swaps (“TRS”). Total Return Swaps are typically two-party (bilateral) financial contracts which one party makes payments based on a set rate, either fixed or variable, while the other party makes payments based on the return of an underlying asset, which includes both the income it generates and any capital gains. In total return swaps, the underlying asset, referred to as the reference asset, is usually an equity index, loans, or bonds. This is owned by the party receiving the set rate payment. The TRS allows one party to derive the economic benefit of owning an asset without putting that asset on its balance sheet, and allows the other party, which does retain that asset on its balance sheet, to buy protection against loss in its value.
Each Fund collateralizes swap agreements with cash and certain securities as indicated on the Portfolio of Investments of the Fund and Statements of Assets and Liabilities, respectively. Such collateral is held for the benefit of the counterparty in a segregated account at the Custodian to protect the counterparty against non-payment by the Fund. Each Fund does not net collateral. In addition, the parties have mutually agreed to settle significant unrealized appreciation / depreciation on the swap contracts as they occur, resulting in an advance or prepayment on such swaps. Such amounts, if any, would be offset against the applicable contract upon final settlement. In the event of a default by the counterparty, a Fund will seek return of this collateral and may incur certain costs exercising its rights with respect to the collateral. Amounts expected to be owed to a Fund may be collateralized either directly with the Fund or in a segregated account at the custodian.
Each Fund bears the risk of loss of the amount expected to be received under a swap agreement in the event of the default or bankruptcy of a swap agreement counterparty to the extent that posted collateral is insufficient. Each Fund will enter into swap agreements only with large, well-capitalized and established financial institutions. The creditworthiness of each of the firms that is counterparty to a swap agreement is monitored by the Advisor. The financial statements of these counterparties may be available by accessing the SEC’s website, at www.sec.gov.
48
| The Quantified Funds |
| NOTES TO CONSOLIDATED FINANCIAL STATEMENTS (Continued) |
| June 30, 2020 |
International Swaps and Derivatives Association, Inc. Master Agreements (“ISDA Master Agreements”) govern OTC financial derivative transactions entered into by the Funds and their counterparties. The ISDA Master Agreements maintain provisions for general obligations, representations, agreements, collateral and events of default or termination. Events of termination include conditions that may entitle counterparties to elect to terminate early and cause settlement of all outstanding transactions under the applicable ISDA Master Agreements. Any election to early terminate could be material to the financial statements. For the year ended June 30, 2020, Quantified Market Leaders Fund entered into total return swaps.
Futures Contracts – Each Fund may be subject to the change in value of equity and interest rate risk in the normal course of pursuing its investment objective. Each Fund may purchase or sell futures contracts to gain exposure to, or hedge against, changes in the value of equities and interest rates. Initial margin deposits required upon entering into futures contracts are satisfied by the segregation of specific securities or cash as collateral for the account of the broker (each Fund’s agent in acquiring the futures position). During the period the futures contracts are open, changes in the value of the contracts are recognized as unrealized gains or losses by “marking to market” on a daily basis to reflect the market value of the contracts at the end of each day’s trading. When the contracts are closed, each Fund recognizes a realized gain or loss equal to the difference between the proceeds from, or cost of, the closing transaction and each Fund’s basis in the contract. If the Funds were unable to liquidate a futures contract and/or enter into an offsetting closing transaction, each Fund would continue to be subject to market risk with respect to the value of the contracts and continue to be required to maintain the margin deposits on the futures contracts. Each Fund segregates cash having a value at least equal to the amount of the current obligation under any open futures contract. Risks may exceed amounts recorded in the Statements of Assets and Liabilities. With futures, there is minimal counterparty credit risk to each Fund since futures are exchange traded and the exchange’s clearinghouse, as counterparty to all exchange traded futures, guarantees the futures against default.
During the normal course of business, each Fund purchases and sells various financial instruments, which may result in risks, the amount of which is not apparent from the financial statements.
Security Transactions and Related Income – Security transactions are accounted for on trade date. Interest income is recognized on an accrual basis. Discounts are accreted and premiums are amortized on securities purchased over the lives of the respective securities using the effective interest method. Dividend income is recorded on the ex-dividend date. Realized gains or losses from sales of securities are determined by comparing the identified cost of the security lot sold with the net sales proceeds. Foreign withholding tax is recorded as incurred or known, in accordance with the Funds’ understanding of the applicable country’s tax rules and rates.
Dividends and Distributions to Shareholders – Dividends from net investment income, if any, are declared and paid annually. Distributable net realized capital gains, if any, are declared and distributed annually in December. Dividends from net investment income and distributions from net realized gains are recorded on ex-dividend date and are determined in accordance with federal income tax regulations, which may differ from GAAP. These “book/tax” differences are considered either temporary (i.e., deferred losses, capital loss carry forwards) or permanent in nature. To the extent these differences are permanent in nature, such amounts are reclassified within the composition of net assets based on their federal tax-basis treatment; temporary differences do not require reclassification. These reclassifications have no effect on net assets, results from operations or net asset value per share of the Funds.
Federal Income Tax – It is each Fund’s policy to continue to qualify as a regulated investment company by complying with the provisions of the Internal Revenue Code that are applicable to regulated investment companies and to distribute substantially all of its taxable income and net realized gains to shareholders. Therefore, no federal income tax provision is required.
The Funds recognize the tax benefits of uncertain tax positions only where the position is “more likely than not” to be sustained assuming examination by tax authorities. Management has analyzed each
49
| The Quantified Funds |
| NOTES TO CONSOLIDATED FINANCIAL STATEMENTS (Continued) |
| June 30, 2020 |
Fund’s tax positions, and has concluded that no liability for unrecognized tax benefits should be recorded related to uncertain tax positions taken on returns filed for the open tax years (June 30, 2017 – June 30, 2019) or expected to be taken in the Funds’ June 30, 2020 tax returns. The Funds identify their major tax jurisdictions as U.S. Federal and foreign jurisdictions where each Fund makes significant investments; however the Funds are not aware of any tax positions for which it is reasonably possible that the total amounts of unrecognized tax benefits will change materially in the next twelve months.
Expenses – Expenses of the Trust that are directly identifiable to a specific fund are charged to that fund. Expenses that are not readily identifiable to a specific fund are allocated in such a manner as deemed equitable, taking into consideration the nature and type of expense and the relative sizes of the funds in the Trust.
Indemnification– The Trust indemnifies its officers and Trustees for certain liabilities that may arise from the performance of their duties to the Trust. Additionally, in the normal course of business, each Fund enters into contracts that contain a variety of representations and warranties and which provide general indemnities. Each Fund’s maximum exposure under these arrangements is unknown, as this would involve future claims that may be made against the Funds that have not yet occurred. However, based on experience, the risk of loss due to these warranties and indemnities appears to be remote.
| 3. | INVESTMENT TRANSACTIONS |
The cost of purchases and proceeds from sale of securities, other than short-term investments, swaps and futures contracts, for the year or period ended June 30, 2020 for the Funds were as follows:
| Fund | Purchases | Sales | ||||||
| Quantified Managed Income Fund | $ | 420,319,338 | $ | 452,467,116 | ||||
| Quantified Market Leaders Fund | 887,933,503 | 919,658,160 | ||||||
| Quantified Alternative Investment Fund | 41,818,905 | 43,071,189 | ||||||
| Quantified STF Fund | 41,997,486 | 63,847,996 | ||||||
| Quantified Pattern Recognition Fund | 43,498,012 | 32,447,819 | ||||||
| Quantified Tactical Fixed Income Fund | 81,555,203 | 55,342,487 | ||||||
| Quantified Evolution Plus Fund | 30,543,744 | 25,917,866 | ||||||
| Quantified Common Ground Fund | 85,829,028 | 71,195,288 | ||||||
| 4. | IMPACT OF DERIVATIVES ON THE STATEMENTS OF ASSETS AND LIABILITIES AND STATEMENTS OF OPERATIONS |
The following is a summary of the location of derivative investments on the Funds’ Statements of Assets and Liabilities as of June 30, 2020:
| Derivative Investment Type | Location on the Statements of Assets and Liabilities | |
| Futures | Unrealized appreciation (depreciation) on futures | |
| Swaps | Unrealized appreciation (depreciation) on swaps |
50
| The Quantified Funds |
| NOTES TO CONSOLIDATED FINANCIAL STATEMENTS (Continued) |
| June 30, 2020 |
At June 30, 2020, the fair value of derivative instruments was as follows:
| Asset derivatives | ||||||
| Quantified Market Leaders Fund | Swaps - Equity Contracts | $ | 2,119,285 | |||
| Quantified Alternative Investment Fund | Futures - Equity Contracts | 5,496 | ||||
| Quantified STF Fund | Futures - Equity Contracts | 2,834,441 | ||||
| Quantified Evolution Plus Fund | Futures - Equity Contracts | 222,688 | ||||
| Futures - Interest Rate Contracts | 429,132 | |||||
| Futures - Commodity Contracts | 37,370 | |||||
| Liability derivatives | ||||||
| Quantified Managed Income Fund | Futures - Interest Rate Contracts | $ | (17,547 | ) | ||
| Futures - Equity Contracts | (143,157 | ) | ||||
| Quantified Tactical Fixed Income Fund | Futures - Interest Rate Contracts | (10,059 | ) | |||
| Swaps - Credit Contracts | (504,425 | ) | ||||
| Quantified Evolution Plus Fund | Futures - Equity Contracts | (58,774 | ) |
51
| The Quantified Funds |
| NOTES TO CONSOLIDATED FINANCIAL STATEMENTS (Continued) |
| June 30, 2020 |
| Transactions in derivative instruments during the year or period ended June 30,2020, were as follows: | ||||||
| Equity/Interest | ||||||
| Rate/Credit/Commodity | ||||||
| Statements of Operations location | Contracts | |||||
| Quantified Managed Income Fund | Net Realized gain (loss) from: (1) | |||||
| Interest Rate Risk | Futures | $ | 1,308,767 | |||
| Equity Risk | Futures | (328,550 | ) | |||
| 980,217 | ||||||
| Net Change in unrealized appreciation (depreciation) on: (2) | ||||||
| Equity Risk | Futures | $ | (143,157 | ) | ||
| Interest Rate Risk | Futures | (49,516 | ) | |||
| (192,673 | ) | |||||
| Quantified Market Leaders Fund | Net Realized gain (loss) from: (1) | |||||
| Equity Risk | Swaps | $ | 5,712,722 | |||
| Net Change in unrealized appreciation (depreciation) on: (2) | ||||||
| Equity Risk | Swaps | $ | 2,119,285 | |||
| Quantified Alternative Investment Fund | Net Realized gain (loss) from: (1) | |||||
| Equity Risk | Futures | $ | (57,338 | ) | ||
| Net Change in unrealized appreciation (depreciation) on: (2) | ||||||
| Equity Risk | Futures | $ | 6,936 | |||
| Quantified STF Fund | Net Realized gain (loss) from: (1) | |||||
| Equity Risk | Futures | $ | 21,180,300 | |||
| Net Change in unrealized appreciation (depreciation) on: (2) | ||||||
| Equity Risk | Futures | $ | 1,798,343 | |||
| Quantified Pattern Recognition Fund | Net Realized gain (loss) from: (1) | |||||
| Equity Risk | Futures | $ | 1,033,303 | |||
| Net Change in unrealized appreciation (depreciation) on: (2) | ||||||
| Equity Risk | Futures | $ | — | |||
| Quantified Tactical Fixed Income Fund | Net Realized gain (loss) from: (1) | |||||
| Interest Rate Risk | Futures | $ | 5,614,283 | |||
| Credit Risk | Swaps | (202,165 | ) | |||
| Net Change in unrealized appreciation (depreciation) on: (2) | ||||||
| Interest Rate Risk | Futures | $ | (10,059 | ) | ||
| Credit Risk | Swaps | (504,425 | ) | |||
| Quantified Evolution Plus Fund | Net Realized gain (loss) from: (1) | |||||
| Commodity Risk | Futures | $ | 758,466 | |||
| Equity Risk | Futures | (512,526 | ) | |||
| Interest Rate Risk | Futures | (1,091,308 | ) | |||
| (845,368 | ) | |||||
| Equity Risk | Swaps | (252,751 | ) | |||
| Net Change in unrealized appreciation (depreciation) on: (2) | ||||||
| Commodity Risk | Futures | $ | 37,370 | |||
| Interest Rate Risk | Futures | 356,156 | ||||
| Equity Risk | Futures | 236,890 | ||||
| 630,416 | ||||||
| (1) | Statement of Operations location: Net realized gain (loss) from futures, Net realized gain (loss) from swaps. |
| (2) | Statement of Operations location: Net change in unrealized appreciation (depreciation) on futures, Net change in unrealized appreciation (depreciation) on swaps. |
52
| The Quantified Funds |
| NOTES TO CONSOLIDATED FINANCIAL STATEMENTS (Continued) |
| June 30, 2020 |
The derivative instruments outstanding as of June 30, 2020 as disclosed in the Portfolios of Investments and the amounts of realized and changes in unrealized gains and losses on derivative instruments during the year as disclosed in the Statements of Operations serve as indicators of the volume of derivative activity for each Fund.
Associated Risk
Market Risk: Market risk is the risk that changes in interest rates, foreign exchange rates or equity prices will affect the positions held by each Fund. The Funds are exposed to market risk on financial instruments that are valued at market prices as disclosed in the Portfolio of Investments. The prices of derivative instruments, including swaps and futures prices, can be highly volatile. Price movements of derivative contracts in which each Fund’s assets may be invested are influenced by, among other things, interest rates, changing supply and demand relationships, trade, fiscal, monetary and exchange control programs and policies of governments, and national and international political and economic events and policies. Each Fund may be exposed to market risk on derivative contracts in that each Fund may not be able to readily dispose of its holdings when it chooses and also that the price obtained on disposal is below that at which the investment is included in the Funds’ financial statements. All financial instruments are recognized at fair value, and all changes in market conditions directly affect net income. The Funds’ investments in derivative instruments are exposed to market risk and are disclosed in the portfolio of investments.
Unexpected local, regional or global events, such as war; acts of terrorism; financial, political or social disruptions; natural, environmental or man-made disasters; the spread of infectious illnesses or other public health issues; and recessions and depressions could have a significant impact on the Funds and their investments and may impair market liquidity. Such events can cause investor fear, which can adversely affect the economies of nations, regions and the market in general, in ways that cannot necessarily be foreseen. An outbreak of infectious respiratory illness known as COVID-19, which is caused by a novel coronavirus (SARS-CoV-2), was first detected in China in December 2019 and subsequently spread globally. This coronavirus has resulted in, among other things, travel restrictions, closed international borders, enhanced health screenings at ports of entry and elsewhere, disruption of and delays in healthcare service preparation and delivery, prolonged quarantines, significant disruptions to business operations, market closures, cancellations and restrictions, supply chain disruptions, lower consumer demand, and significant volatility and declines in global financial markets, as well as general concern and uncertainty. The impact of COVID-19 has adversely affected, and other infectious illness outbreaks that may arise in the future could adversely affect, the economies of many nations and the entire global economy, individual issuers and capital markets in ways that cannot necessarily be foreseen. Public health crises caused by the COVID-19 outbreak may exacerbate other pre-existing political, social and economic risks in certain countries or globally. The duration of the COVID-19 outbreak and its effects cannot be determined with certainty.
Counterparty Risk: Each Fund may invest in swap contracts (the “Product”) with Credit Suisse or Barclays as the counterparty. If Credit Suisse or Barclays becomes insolvent, Credit Suisse or Barclays may not be able to make any payments under the Product and investors may lose their capital invested in the Product. A decline in Credit Suisse’s or Barclays’s standing is likely to reduce the market value of the Product and therefore the price an investor may receive for the Product if they sell it in the market.
Liquidity Risk: Liquidity risk is the risk that a Fund will encounter difficulty in raising funds to meet commitments. Liquidity risk may result in an inability to sell investments quickly at close to fair value. Each Fund’s financial instruments may include investments in securities which are not traded on organized public exchanges and which generally may be illiquid. As a result, a Fund may not be able to quickly liquidate its investments in these instruments at an amount close to its fair value in order to meet its liquidity requirements. The Funds’ do not anticipate any material losses as a result of liquidity risk.
53
| The Quantified Funds |
| NOTES TO CONSOLIDATED FINANCIAL STATEMENTS (Continued) |
| June 30, 2020 |
| 5. | OFFSETTING OF FINANCIAL ASSETS AND DERIVATIVE ASSETS |
Each Fund’s policy is to recognize a net asset or liability equal to the unrealized gain (loss) on future contracts and swap contracts. The following table shows additional information regarding the offsetting of assets and liabilities at June 30, 2020.
| Quantified Managed Income Fund: | ||||||||||||||||||||||||
| Gross Amounts Not Offset in the | ||||||||||||||||||||||||
| Assets: | Statements of Assets & Liabilities | |||||||||||||||||||||||
| Gross Amounts | Gross Amounts | Net Amounts of | ||||||||||||||||||||||
| Presented in the | Offset in the | Liabilities Presented | ||||||||||||||||||||||
| Statements of | Statements of Assets | in the Statements of | Financial | Cash Collateral | ||||||||||||||||||||
| Description | Assets & Liabilities | & Liabilities | Assets & Liabilities | Instruments | Received (2) | Net Amount | ||||||||||||||||||
| Securities Lending | $ | 400,222 | $ | — | $ | 400,222 | $ | — | $ | (400,222 | ) | $ | — | |||||||||||
| Gross Amounts Not Offset in the | ||||||||||||||||||||||||
| Liabilities: | Statements of Assets & Liabilities | |||||||||||||||||||||||
| Gross Amounts | Gross Amounts | Net Amounts of | ||||||||||||||||||||||
| Presented in the | Offset in the | Liabilities Presented | ||||||||||||||||||||||
| Statements of | Statements of Assets | in the Statements of | Financial | Cash Collateral | ||||||||||||||||||||
| Description | Assets & Liabilities | & Liabilities | Assets & Liabilities | Instruments | Pledged (1) | Net Amount | ||||||||||||||||||
| Futures Contracts | $ | (160,705 | ) | $ | — | $ | (160,705 | ) | $ | — | $ | 160,705 | $ | — | ||||||||||
| Quantified Market Leaders Fund: | ||||||||||||||||||||||||
| Gross Amounts Not Offset in the | ||||||||||||||||||||||||
| Assets: | Statements of Assets & Liabilities | |||||||||||||||||||||||
| Gross Amounts | Gross Amounts | Net Amounts of Assets | ||||||||||||||||||||||
| Presented in the | Offset in the | Presented in the | ||||||||||||||||||||||
| Statements of | Statements of Assets | Statements of Assets & | Financial | Cash Collateral | ||||||||||||||||||||
| Description | Assets & Liabilities | & Liabilities | Liabilities | Instruments | Received | Net Amount | ||||||||||||||||||
| Swaps | $ | 2,119,285 | $ | — | $ | 2,119,285 | $ | — | $ | — | $ | 2,119,285 | ||||||||||||
| Quantified Alternative Investment Fund: | ||||||||||||||||||||||||
| Gross Amounts Not Offset in the Statements | ||||||||||||||||||||||||
| Assets: | of Assets & Liabilities | |||||||||||||||||||||||
| Gross Amounts | Net Amounts | |||||||||||||||||||||||
| Presented in | Gross Amounts | Presented in the | ||||||||||||||||||||||
| the Statements | Offset in the | Statement of | Financial | |||||||||||||||||||||
| of Assets & | Statement of | Assets & | Instruments | Cash Collateral | ||||||||||||||||||||
| Description | Liabilities | Assets & Liabilities | Liabilities | Pledged | Received (2) | Net Amount | ||||||||||||||||||
| Futures Contracts | $ | 5,496 | $ | — | $ | 5,496 | $ | — | $ | — | $ | 5,496 | ||||||||||||
| Securities lending | 175,148 | — | 175,148 | — | (175,148 | ) | — | |||||||||||||||||
| Total | $ | 180,644 | $ | — | $ | 180,644 | $ | — | $ | (175,148 | ) | $ | 5,496 | |||||||||||
54
| The Quantified Funds |
| NOTES TO CONSOLIDATED FINANCIAL STATEMENTS (Continued) |
| June 30, 2020 |
| Quantified STF Fund: | ||||||||||||||||||||||||
| Gross Amounts Not Offset in the Statements | ||||||||||||||||||||||||
| Assets: | of Assets & Liabilities | |||||||||||||||||||||||
| Gross Amounts | Net Amounts | |||||||||||||||||||||||
| Presented in | Gross Amounts | Presented in the | ||||||||||||||||||||||
| the Statements | Offset in the | Statement of | Financial | |||||||||||||||||||||
| of Assets & | Statement of | Assets & | Instruments | Cash Collateral | ||||||||||||||||||||
| Description | Liabilities | Assets & Liabilities | Liabilities | Pledged | Received (2) | Net Amount | ||||||||||||||||||
| Futures Contracts | $ | 2,834,441 | $ | — | $ | 2,834,441 | $ | — | $ | — | $ | 2,834,441 | ||||||||||||
| Securities lending | 1,544,442 | — | 1,544,442 | — | (1,544,442 | ) | — | |||||||||||||||||
| Total | $ | 4,378,883 | $ | — | $ | 4,378,883 | $ | — | $ | (1,544,442 | ) | $ | 2,834,441 | |||||||||||
| Quantified Tactical Fixed Income Fund: | ||||||||||||||||||||||||
| Gross Amounts Not Offset in the Statements | ||||||||||||||||||||||||
| Assets: | of Assets & Liabilities | |||||||||||||||||||||||
| Gross Amounts | ||||||||||||||||||||||||
| Presented in | Gross Amounts | Net Amounts | ||||||||||||||||||||||
| the Statements | Offset in the | Presented in the | Financial | |||||||||||||||||||||
| of Assets & | Statement of | Statement of | Instruments | Cash Collateral | ||||||||||||||||||||
| Description | Liabilities | Assets & Liabilities | Assets & Liabilities | Pledged | Received (2) | Net Amount | ||||||||||||||||||
| Securities lending | $ | 1,377,567 | $ | — | $ | 1,377,567 | $ | — | $ | (1,377,567 | ) | $ | — | |||||||||||
| Gross Amounts Not Offset in the | ||||||||||||||||||||||||
| Liabilities: | Statements of Assets & Liabilities | |||||||||||||||||||||||
| Gross Amounts | Gross Amounts | Net Amounts of | ||||||||||||||||||||||
| Presented in the | Offset in the | Liabilities Presented in | ||||||||||||||||||||||
| Statements of | Statements of Assets | the Statements of | Financial | Cash Collateral | ||||||||||||||||||||
| Description | Assets & Liabilities | & Liabilities | Assets & Liabilities | Instruments | Pledged (1) | Net Amount | ||||||||||||||||||
| Futures Contracts | $ | (10,059 | ) | $ | — | $ | (10,059 | ) | $ | — | $ | 10,059 | $ | — | ||||||||||
| Swaps | (504,425 | ) | — | (504,425 | ) | — | 504,425 | — | ||||||||||||||||
| Total | $ | (514,484 | ) | $ | — | $ | (514,484 | ) | $ | — | $ | 514,484 | $ | — | ||||||||||
| Quantified Evolution Plus Fund: | ||||||||||||||||||||||||
| Gross Amounts Not Offset in the | ||||||||||||||||||||||||
| Assets: | Statements of Assets & Liabilities | |||||||||||||||||||||||
| Gross Amounts | Gross Amounts | Net Amounts of Assets | ||||||||||||||||||||||
| Presented in the | Offset in the | Presented in the | ||||||||||||||||||||||
| Statements of | Statements of Assets | Statements of Assets | Financial | Cash Collateral | ||||||||||||||||||||
| Description | Assets & Liabilities | & Liabilities | & Liabilities | Instruments | Received | Net Amount | ||||||||||||||||||
| Futures Contracts | $ | 689,190 | $ | — | $ | 689,190 | $ | (58,774 | ) | $ | — | $ | 630,416 | |||||||||||
| Gross Amounts Not Offset in the | ||||||||||||||||||||||||
| Liabilities: | Statement of Assets & Liabilities | |||||||||||||||||||||||
| Gross Amounts | Gross Amounts | Net Amounts of | ||||||||||||||||||||||
| Presented in the | Offset in the | Liabilities Presented in | ||||||||||||||||||||||
| Statements of | Statement of Assets | the Statement of | Financial | Cash Collateral | ||||||||||||||||||||
| Description | Assets & Liabilities | & Liabilities | Assets & Liabilities | Instruments | Pledged (1) | Net Amount | ||||||||||||||||||
| Futures Contracts | $ | (58,774 | ) | $ | — | $ | (58,774 | ) | $ | 58,774 | $ | — | $ | — | ||||||||||
55
| The Quantified Funds |
| NOTES TO CONSOLIDATED FINANCIAL STATEMENTS (Continued) |
| June 30, 2020 |
| Quantified Common Ground Fund: | ||||||||||||||||||||||||
| Gross Amounts Not Offset in the Statements | ||||||||||||||||||||||||
| Assets: | of Assets & Liabilities | |||||||||||||||||||||||
| Gross Amounts | ||||||||||||||||||||||||
| Presented in | Gross Amounts | Net Amounts | ||||||||||||||||||||||
| the Statements | Offset in the | Presented in the | Financial | |||||||||||||||||||||
| of Assets & | Statement of | Statement of | Instruments | Cash Collateral | ||||||||||||||||||||
| Description | Liabilities | Assets & Liabilities | Assets & Liabilities | Pledged | Received (2) | Net Amount | ||||||||||||||||||
| Securities Lending | $ | 115,521 | $ | — | $ | 115,521 | $ | — | $ | (115,521 | ) | $ | — | |||||||||||
| (1) | The amount is limited to the derivative liability balance and accordingly does not include excess collateral pledged. |
| (2) | The amount does not include excess collateral pledged by the counterparty. Detailed collateral amounts are presented in the Statements of Assets and Liabilities. |
| 6. | INVESTMENT ADVISORY AGREEMENT A ND TRANSACTIONS WITH RELATED PARTIES |
The business activities of each Fund are overseen by the Board, which is responsible for the overall management of the Funds. Advisors Preferred LLC (“Advisor”), serves as investment advisor to the Funds. The Advisor has engaged Flexible Plan Investments, Ltd. (the “Sub-Advisor”) to serve as the sub-advisor to the Funds.
Pursuant to an advisory agreement with the Funds, the Advisor, under the oversight of the Board, directs the daily operations of each Fund and supervises the performance of administrative and professional services provided by others. As compensation for its services and the related expenses borne by the Advisor, each Fund pays advisory fees accrued daily and paid monthly, based on each Fund’s average daily net assets and is computed at an annual rate of 0.75%, except for Quantified STF, Quantified Pattern Recognition, Quantified Tactical Fixed Income, Quantified Evolution Plus and Quantified Common Ground which pays 1.00%. For the year or period ended June 30, 2020, each Fund accrued the following advisory fees:
| Quantified Managed Income Fund | $ | 480,049 | ||
| Quantified Market Leaders Fund | 1,175,536 | |||
| Quantified Alternative Investment Fund | 68,146 | |||
| Quantified STF Fund | 627,126 | |||
| Quantified Pattern Recognition Fund | 179,361 | |||
| Quantified Tactical Fixed Income Fund | 402,508 | |||
| Quantified Evolution Plus Fund | 108,762 | |||
| Quantified Common Ground Fund | 89,859 |
Gemini Fund Services, LLC (“GFS”), GFS, provides administration, fund accounting, and transfer agent services to the Trust. Pursuant to the servicing agreement with GFS, each Fund pays GFS customary fees for providing administration, fund accounting and transfer agency services to the Fund. Under the terms of the Funds’ agreement with GFS, GFS pays for certain operating expenses of the Funds. Certain officers of the Trust are also officers of GFS, and are not paid any fees directly by the Funds for serving in such capacities.
In addition, certain affiliates of GFS provide services to each Fund as follows:
Blu Giant, LLC (“Blu Giant”), an affiliate of GFS, provides EDGAR conversion and filing services as well as print management services for each Fund on an ad-hoc basis. These expenses are the responsibility of GFS.
56
| The Quantified Funds |
| NOTES TO CONSOLIDATED FINANCIAL STATEMENTS (Continued) |
| June 30, 2020 |
Effective February 1, 2019, NorthStar Financial Services Group, LLC, the parent company of GFS and its affiliated companies including Blu Giant (collectively, the “Gemini Companies”), sold its interest in the Gemini Companies to a third party private equity firm that contemporaneously acquired Ultimus Fund Solutions, LLC (an independent mutual fund administration firm) and its affiliates (collectively, the “Ultimus Companies”). As a result of these separate transactions, the Gemini Companies and the Ultimus Companies are now indirectly owned through a common parent entity, The Ultimus Group, LLC.
The Trust has adopted Distribution Plans and Agreements pursuant to Rule 12b-1 under the 1940 Act for the Funds’ Investor Class and Advisor Class shares (each a “Plan” and together, the “Plans”) pursuant to which a Fund pays fees to the Ceros Financial Services, Inc. (“Ceros” or “Distributor”) for providing distribution and/or shareholder services to the Fund. Under the Plans, Investor Class shares of a Fund may pay an account maintenance fee for account maintenance services and/or distribution fee at an annual rate of up to 0.25% of the Fund’s average net assets attributable to Investor Class shares as compensation for the Distributor providing account maintenance and distribution services to shareholders; and up to 1.00% for Advisor Class shares of a Fund’s average daily net assets attributable to the Advisor Class shares. The 12b-1 Plan is a compensation plan, which means that compensation is provided regardless of 12b-1 expenses incurred.
For the year or period ended June 30, 2020, pursuant to the Rule 12b-1 PIan, each Fund accrued:
| Investor Class | Advisor Class | Total | ||||||||||
| Quantified Managed Income Fund | $ | 158,924 | $ | 4,370 | $ | 163,294 | ||||||
| Quantified Market Leaders Fund | 390,169 | 6,704 | 396,873 | |||||||||
| Quantified Alternative Investment Fund | 22,663 | 209 | 22,872 | |||||||||
| Quantified STF Fund | 156,194 | 2,338 | 158,532 | |||||||||
| Quantified Pattern Recognition Fund | 44,840 | — | 44,840 | |||||||||
| Quantified Tactical Fixed Income Fund | 100,627 | — | 100, 627 | |||||||||
| Quantified Evolution Plus Fund | 27,191 | — | 27,191 | |||||||||
| Quantified Common Ground Fund | 22,465 | — | 22,465 | |||||||||
The Board has adopted a Shareholder Servicing Plan (the “Servicing Plan”) with respect to the Investor Class of each Fund. The Servicing Plan provides that a monthly service fee is calculated by each Fund at an annual rate of up to 0.15% (currently set at 0.15%), of its average daily net assets of the Investor Class and is paid to Ceros to provide compensation for ongoing shareholder servicing activities or service and/or maintenance accounts, not otherwise required to be provided by the Advisor. Ceros is an affiliate of the Advisor.
For the year or period ended June 30, 2020, pursuant to the Shareholder Services Agreement, each Fund paid:
| Investor Class | ||||
| Quantified Managed Income Fund | $ | 95,100 | ||
| Quantified Market Leaders Fund | 234,104 | |||
| Quantified Alternative Investment Fund | 13,598 | |||
| Quantified STF Fund | 93,716 | |||
| Quantified Pattern Recognition Fund | 26,904 | |||
| Quantified Tactical Fixed Income Fund | 60,376 | |||
| Quantified Evolution Plus Fund | 16,314 | |||
| Quantified Common Ground Fund | 13,479 | |||
During the year or period ended June 30, 2020, Ceros, a registered broker/dealer, executed trades on behalf of Quantified Managed Income Fund, Quantified Market Leaders Fund, Quantified Alternative Investment Fund, Quantified STF Fund, Quantified Pattern Recognition Fund, Quantified Tactical Fixed Income Fund, Quantified Evolution Plus Fund and Quantified Common Ground Fund and received $130,109, $151,986, $16,143, $14,535, $9,404, $16,892, $4,061 and $21,024 in trade commissions, respectively.
57
| The Quantified Funds |
| NOTES TO CONSOLIDATED FINANCIAL STATEMENTS (Continued) |
| June 30, 2020 |
Each Trustee who is not an “interested person” of the Trust or Advisor is compensated at a rate of $30,000, as well as reimbursement for any reasonable expenses incurred attending the meetings, paid quarterly. The “interested persons” who serve as Trustees of the Trust receive no compensation for their services as Trustees. None of the executive officers receive compensation from the Trust. Interested trustees of the Trust are also officers or employees of the Advisor and its affiliates.
| 7. | AGGREGATE UNREALIZED APPRECIATION AND DEPRECIATION – TAX BASIS |
The identified cost of investments in securities owned by each Fund for federal income tax purposes excluding futures and swaps, and its respective gross unrealized appreciation and depreciation at June 30, 2020, were as follows:
| Gross | ||||||||||||||||
| Unrealized | Gross Unrealized | Net Unrealized | ||||||||||||||
| Tax Cost | Appreciation | (Depreciation) | Appreciation | |||||||||||||
| Quantified Managed Income Fund | $ | 72,252,869 | $ | 671,704 | $ | (232,910 | ) | $ | 438,794 | |||||||
| Quantified Market Leaders Fund | 125,567,890 | 8,688,804 | (606,524 | ) | 8,082,280 | |||||||||||
| Quantified Alternative Investment Fund | 7,818,838 | 145,245 | (132,333 | ) | 12,912 | |||||||||||
| Quantified STF Fund | 61,293,443 | 344,375 | (51,305 | ) | 293,070 | |||||||||||
| Quantified Pattern Recognition Fund | 19,923,343 | 181,853 | (21,837 | ) | 160,016 | |||||||||||
| Quantified Tactical Fixed Income Fund | 83,098,188 | 321,957 | (71,465 | ) | 250,492 | |||||||||||
| Quantified Evolution Plus Fund | 23,015,006 | 116,887 | (101,394 | ) | 15,493 | |||||||||||
| Quantified Common Ground Fund | 19,565,711 | 531,105 | (265,411 | ) | 265,694 | |||||||||||
| 8. | DISTRIBUTIONS TO SHAREHOLDERS AND TAX COMPONENTS OF CAPITAL |
The tax character of distributions paid for the years ended June 30, 2020 and June 30, 2019 was as follows:
| For the period ended June 30, 2020: | ||||||||||||||||||||
| Ordinary | Long-Term | Return | Tax Exempt | |||||||||||||||||
| Portfolio | Income | Capital Gains | of Capital | Income | Total | |||||||||||||||
| Quantified Managed Income Fund | $ | 992,119 | $ | — | $ | — | $ | 566,979 | $ | 1,559,098 | ||||||||||
| Quantified Market Leaders Fund | 3,801,517 | — | — | — | 3,801,517 | |||||||||||||||
| Quantified Alternative Investment Fund | 144,452 | — | 2,652 | — | 147,104 | |||||||||||||||
| Quantified STF Fund | 324,678 | 5,819,789 | — | — | 6,144,467 | |||||||||||||||
| Quantified Pattern Recognition Fund | 420,936 | 576,593 | — | — | 997,529 | |||||||||||||||
| Quantified Tactical Fixed Income Fund | 432,018 | 1,612,800 | — | — | 2,044,818 | |||||||||||||||
| Quantified Evolution Plus Fund | 18,235 | 640 | — | — | 18,875 | |||||||||||||||
| Quantified Common Ground Fund | — | — | — | — | — | |||||||||||||||
| For the period ended June 30, 2019: | ||||||||||||||||||||
| Ordinary | Long-Term | Return | Tax Exempt | |||||||||||||||||
| Portfolio | Income | Capital Gains | of Capital | Income | Total | |||||||||||||||
| Quantified Managed Income Fund | $ | 996,372 | $ | — | $ | — | $ | — | $ | 996,372 | ||||||||||
| Quantified Market Leaders Fund | 14,413,832 | — | — | — | 14,413,832 | |||||||||||||||
| Quantified Alternative Investment Fund | 5,603 | — | — | — | 5,603 | |||||||||||||||
| Quantified STF Fund | 670,804 | 1,402,469 | — | — | 2,073,273 | |||||||||||||||
| Quantified Pattern Recognition Fund | — | — | — | — | — | |||||||||||||||
| Quantified Tactical Fixed Income Fund | — | — | — | — | — | |||||||||||||||
| Quantified Evolution Plus Fund | — | — | — | — | — | |||||||||||||||
| Quantified Common Ground Fund | — | — | — | — | — | |||||||||||||||
58
| The Quantified Funds |
| NOTES TO CONSOLIDATED FINANCIAL STATEMENTS (Continued) |
| June 30, 2020 |
Tax equalization allows a Fund to treat as distribution that portion of redemption proceeds representing a redeeming shareholder’s portion of undistributed taxable and net capital gains. The Quantified Market Leaders Fund, Quantified STF Fund, Quantified Pattern Recognition Fund and Quantified Tactical Fixed Income Fund utilized equalization in the amount of $3,801,517, $5,819,789, $45,975 and $1,173,397 respectively, which resulted in a difference between tax distributions and book distributions as disclosed on the Statement of Changes for the period ended June 30, 2020. Net investment income and net realized gains(losses), as disclosed on the Statements of Operations and net assets were not affected by these reclassifications.
As of June 30, 2020, the components of accumulated earnings/(deficit) on a tax basis were as follows:
| Undistributed | Undistributed | Post October Loss | Capital Loss | Other | Unrealized | Total | ||||||||||||||||||||||
| Ordinary | Long-Term | and | Carry | Book/Tax | Appreciation/ | Accumulated | ||||||||||||||||||||||
| Portfolio | Income | Capital Gains | Late Year Loss | Forwards | Differences | (Depreciation) | Earnings/(Deficits) | |||||||||||||||||||||
| Quantified Managed Income Fund | $ | 726,313 | $ | — | $ | (6,944,060 | ) | $ | (422,445 | ) | $ | — | 438,794 | $ | (6,201,398 | ) | ||||||||||||
| Quantified Market Leaders Fund | 11,371,102 | — | — | — | — | 8,082,280 | 19,453,382 | |||||||||||||||||||||
| Quantified Alternative Investment Fund | — | — | (825,711 | ) | (378,795 | ) | — | 12,912 | (1,191,594 | ) | ||||||||||||||||||
| Quantified STF Fund | 8,086,471 | 6,147,170 | — | — | — | 293,070 | 14,526,711 | |||||||||||||||||||||
| Quantified Pattern Recognition Fund | — | 43,709 | — | — | — | 160,016 | 203,725 | |||||||||||||||||||||
| Quantified Tactical Fixed Income Fund | 1,085,151 | 1,750,280 | — | — | — | 250,492 | 3,085,923 | |||||||||||||||||||||
| Quantified Evolution Plus Fund | 729,108 | — | (1,268,156 | ) | — | 37,370 | 15,493 | (486,185 | ) | |||||||||||||||||||
| Quantified Common Ground Fund | — | — | (1,293,700 | ) | — | — | 265,694 | (1,028,006 | ) | |||||||||||||||||||
The difference between book basis and tax basis unrealized appreciation undistributed net investment income (loss) and accumulated net realized gains (losses) from investments is primarily attributable to the tax deferral of losses on wash sales, the mark-to-market on open Section 1256 and swap contracts and adjustments for the Funds’ wholly owned subsidiary.
Late year losses incurred after December 31 within the fiscal year are deemed to arise on the first business day of the following fiscal year for tax purposes. The Quantified Alternative Investment Fund and Quantified Common Ground Fund incurred and elected to defer such late year losses of $34,454 and $10,778 respectively.
Capital losses incurred after October 31 within the fiscal year are deemed to arise on the first business day of the following fiscal year for tax purposes. The Funds incurred and elected to defer such capital losses as follows:
| Post October | ||||
| Portfolio | Losses | |||
| Quantified Managed Income Fund | $ | 6,944,060 | ||
| Quantified Market Leaders Fund | — | |||
| Quantified Alternative Investment Fund | 791,257 | |||
| Quantified STF Fund | — | |||
| Quantified Pattern Recognition Fund | — | |||
| Quantified Tactical Fixed Income Fund | — | |||
| Quantified Evolution Plus Fund | 1,268,156 | |||
| Quantified Common Ground Fund | 1,282,922 | |||
59
| The Quantified Funds |
| NOTES TO CONSOLIDATED FINANCIAL STATEMENTS (Continued) |
| June 30, 2020 |
At June 30, 2020, the Funds below had capital loss carry forwards for federal income tax purposes available to offset future capital gains and utilized capital loss carryforwards as follows:
| Non-Expiring | ||||||||||||||||
| Portfolio | Short-Term | Long-Term | Total | CLCF Utilized | ||||||||||||
| Quantified Managed Income Fund | $ | 70,495 | $ | 351,950 | $ | 422,445 | $ | 1,549,623 | ||||||||
| Quantified Alternative Investment Fund | 378,795 | — | 378,795 | — | ||||||||||||
| Quantified STF Fund | — | — | — | 164,035 | ||||||||||||
Permanent book and tax differences, primarily attributable to the book/tax basis treatment of non-deductible expenses, return of capital distributions, equalization credits resulted in reclassification for the year ended June 30, 2020 as follows:
| Paid | ||||||||
| In | Accumulated | |||||||
| Portfolio | Capital | Earnings (Losses) | ||||||
| Quantified Managed Income Fund | $ | — | $ | — | ||||
| Quantified Market Leaders Fund | 1,316,826 | (1,316,826 | ) | |||||
| Quantified Alternative Investment Fund | (3,650 | ) | 3,650 | |||||
| Quantified STF Fund | 5,819,789 | (5,819,789 | ) | |||||
| Quantified Pattern Recognition Fund | 34,691 | (34,691 | ) | |||||
| Quantified Tactical Fixed Income Fund | 1,155,528 | (1,155,528 | ) | |||||
| Quantified Evolution Plus Fund | (41,558 | ) | 41,558 | |||||
| Quantified Common Ground Fund | — | — | ||||||
| 9. | CONTROL OWNERSHIP |
The beneficial ownership, either directly or indirectly, of more than 25% of the voting securities of a fund creates presumption of control of the fund pursuant to Section 2(a)(9) of the 1940 Act. As of June 30, 2020, E*Trade Savings Bank held approximately 84.08% of the Quantified Managed Income Fund, 81.29% of the Quantified Market Leaders Fund, 77.77% of the Quantified Alternative Investment Fund, 71.43% of the Quantified STF Fund, 95.14% of the Quantified Pattern Recognition Fund, 93.13% of the Quantified Tactical Fixed Income Fund, 98.61% of the Quantified Evolution Plus Fund and 91.38% of the Quantified Common Ground Fund.
| 10. | UNDERLYING INVESTMENT IN OTHER INVESTMENT COMPANIES |
The following Funds currently invest a portion of their assets in the corresponding investments. The Funds may redeem their investment from the investments at any time if the Advisor determines that it is in the best interest of the Funds and their shareholders to do so. The performance of the Funds will be directly affected by the performance of the investments. The financial statements of the investments, including their portfolio of investments, can be found at the Securities and Exchange Commission’s website www.sec.gov and should be read in conjunction with the Funds’ financial statements.
60
| The Quantified Funds |
| NOTES TO CONSOLIDATED FINANCIAL STATEMENTS (Continued) |
| June 30, 2020 |
| Fund | Investment | Percentage of Net Assets | ||
| Quantified Managed Income Fund | Fidelity Investments Money Market Funds - Government Portfolio | 37.2% | ||
| First American Government Obligations Fund | 37.2% | |||
| Quantified Market Leaders Fund | iShares Russell 1000 Growth ETF | 30.6% | ||
| Quantified Tactical Fixed Income Fund | Fidelity Investments Money Market Funds - Government Portfolio | 32.3% | ||
| First American Government Obligations Fund | 32.3% | |||
| Quantified Evolution Plus Fund | Fidelity Investments Money Market Funds - Government Portfolio | 34.0% | ||
| First American Government Obligations Fund | 38.1% |
| 11. | SECURITIES LENDING |
The Funds have entered into a securities lending arrangement (the “Agreement”) with U.S. Bank (the “Lending Agent”). Under the terms of the Agreement, the Funds are authorized to loan securities to the Lending Agent. In exchange, the Funds receive cash and “non-cash” or “securities” collateral in the amount of at least 105% of the value of any loaned securities that are foreign securities or 102% of the value of any other loaned securities marked-to-market daily. Loans shall be marked to market daily and the margin restored in the event collateralization is below 100% of the value of securities loaned. The value of securities loaned is disclosed in a footnote on the Statements of Assets and Liabilities and on the Portfolios of Investments. Securities lending income is disclosed in the Funds’ Statements of Operations. Although risk is mitigated by the collateral, the Funds could experience a delay in recovering their securities and possible loss of income or value if the Lending Agent fails to return the securities on loan. The Funds’ cash collateral received in securities lending transactions is invested in the Mount Vernon Liquid Assets Portfolio, LLC, as presented below.
As of June 30, 2020, the following Funds loaned securities which were collateralized by cash. The value of securities on loan and the value of the related collateral were as follows:
| Overnight and Continuous | ||||||||
| Fund | Value of Securities Loaned | Value of Collateral* | ||||||
| Quantified Managed Income Fund | $ | 400,222 | $ | 402,674 | ||||
| Quantified Alternative Investment Fund | 175,148 | 177,772 | ||||||
| Quantified STF Fund | 1,544,442 | 1,577,101 | ||||||
| Quantified Tactical Fixed Income Fund | 1,377,567 | 1,406,517 | ||||||
| Quantified Common Ground Fund | 115,521 | 116,275 | ||||||
| * | The above Funds received cash collateral, which was subsequently invested in the Mount Vernon Liquid Assets Portfolio, LLC as reported in the Portfolios of Investments. |
| 12. | SUBSEQUENT EVENTS |
Subsequent events after the date of the Statements of Assets and Liabilities have been evaluated through the date the financial statements were issued. Management has determined that no events or transactions occurred requiring adjustment or disclosure in the financial statements.
61

REPORT OF INDEPENDENT REGISTERED PUBLIC ACCOUNTING FIRM
To the Shareholders of Quantified Managed Income Fund, Quantified Market Leaders Fund, Quantified Alternative Investment Fund, Quantified STF Fund, Quantified Pattern Recognition Fund, Quantified Tactical Fixed Income Fund, Quantified Evolution Plus Fund and Quantified Common Ground Fund and Board of Trustees of Advisors Preferred Trust
Opinion on the Financial Statements
We have audited the accompanying statements of assets and liabilities, including the portfolios of investments, of Quantified Funds comprising the funds listed below (the “Funds”) as of June 30, 2020, the related statements of operations, the statements of changes in net assets, and the financial highlights for each of the periods indicated below, including the related notes (collectively referred to as the “financial statements”). In our opinion, the financial statements present fairly, in all material respects, the financial position of each of the Funds as of June 30, 2020, the results of their operations, the changes in their net assets, and the financial highlights for each of the periods indicated below, in conformity with accounting principles generally accepted in the United States of America.
| Statements of | Statements of Changes in | ||
| Fund Name | Operations | Net Assets | Financial Highlights |
| Quantified Managed Income Fund, Quantified Market Leaders Fund and Quantified Alternative Investment Fund | For the year ended June 30, 2020 | For the years ended June 30, 2020 and 2019 | For the years ended June 30, 2020, 2019, 2018, 2017, and 2016 |
| Quantified STF Fund | For the year ended June 30, 2020 | For the years ended June 30, 2020 and 2019 | For the years ended June 30, 2020, 2019, 2018, 2017, and for the period from November 13, 2015 (commencement of operations) through June 30, 2016 |
| Quantified Pattern Recognition Fund | For the period from August 30, 2019 (commencement of operations) through June 30, 2020 | ||
| Quantified Tactical Fixed Income Fund | For the period from September 13, 2019 (commencement of operations) through June 30, 2020 | ||
| Quantified Evolution Plus Fund* | For the period from September 30, 2019 (commencement of operations) through June 30, 2020 | ||
| Quantified Common Ground Fund | For the period from December 27, 2019 (commencement of operations) through June 30, 2020 | ||
| * | The financial statements referred to throughout are Consolidated Financial Statements. |
C O H E N & C O M P A N Y , L T D.
800.229.1099 | 866.818.4535 fax | cohencpa.com
Registered with the Public Company Accounting Oversight Board
62
Basis for Opinion
These financial statements are the responsibility of the Funds’ management. Our responsibility is to express an opinion on the Funds’ financial statements based on our audits. We are a public accounting firm registered with the Public Company Accounting Oversight Board (United States) (“PCAOB”) and are required to be independent with respect to the Funds in accordance with the U.S. federal securities laws and the applicable rules and regulations of the Securities and Exchange Commission and the PCAOB.
We conducted our audits in accordance with the standards of the PCAOB. Those standards require that we plan and perform the audit to obtain reasonable assurance about whether the financial statements are free of material misstatement whether due to error or fraud.
Our audits included performing procedures to assess the risks of material misstatement of the financial statements, whether due to error or fraud, and performing procedures that respond to those risks. Such procedures included examining, on a test basis, evidence regarding the amounts and disclosures in the financial statements. Our procedures included confirmation of securities owned as of June 30, 2020, by correspondence with the custodian and brokers. Our audits also included evaluating the accounting principles used and significant estimates made by management, as well as evaluating the overall presentation of the financial statements. We believe that our audits provide a reasonable basis for our opinion.
We have served as the auditor of one or more investment companies within the Advisors Preferred Trust since 2012.

| COHEN & COMPANY, LTD. |
| Chicago, Illinois |
| August 27, 2020 |
63
| QUANTIFIED FUNDS |
| EXPENSE EXAMPLES (Unaudited) |
| June 30, 2020 |
Example
As a shareholder of a Fund you will pay ongoing expenses, such as advisory fees, distribution and service fees (12b-1), and other fund expenses. The following examples are intended to help you understand the ongoing cost (in dollars) of investing in a Fund and to compare these costs with the ongoing costs of investing in other mutual funds. Please note, the expenses shown in the tables are meant to highlight ongoing costs only and do not reflect any transactional costs, such as sales charges (loads), or contingent deferred sales charges on redemptions which may be assessed by mutual funds. This Example is based on an investment of $1,000 invested at the beginning of the period and held for the entire period as indicated below.
Actual Expenses
The columns under the heading entitled “Actual” help you estimate the actual expenses you paid over the period. The “Actual Ending Account Value” shown is derived from the Fund’s actual return, and the “Actual Expenses Paid During Period” shows the dollar amount that would have been paid by an investor who started with $1,000 in the Fund. To estimate the expenses you paid on your account during this period, simply divide your account value by $1,000 (for example, an $8,600 account value divided by $1,000 = 8.6), then multiply the result by the number in the column under the heading entitled “Actual Expenses Paid During Period”.
Hypothetical Examples for Comparison Purposes
The columns under the heading entitled “Hypothetical” provide information about hypothetical account value and hypothetical expenses based on the Fund’s actual expense ratio and an assumed rate of return of 5% per year before expenses, which is not the Fund’s actual return. The hypothetical account values and expenses may not be used to estimate the actual ending account balance or expenses you paid for the period. You may use this information to compare the ongoing costs of investing in the Fund and other funds. To do so, compare this 5% hypothetical example with the 5% hypothetical examples that appear in the shareholder reports of other funds.
Please note that the expenses shown in the table on the next page are meant to highlight your ongoing costs only and do not reflect any transactional costs which may be applicable to your account. Therefore, the last column of the table (Hypothetical Expenses Paid During Period) is useful in comparing ongoing costs only, and will not help you determine the relative total costs of owning different funds. In addition, if these transactional costs were included, your costs would have been higher.
| Hypothetical | ||||||||||||
| Actual | (5% return before expenses) | |||||||||||
| Ending | ||||||||||||
| Fund’s | Beginning | Ending | Expenses | Account | Expenses | |||||||
| Annualized | Account Value | Account Value | Paid During | Value | Paid During | |||||||
| Expense Ratio | 1/1/20 | 6/30/20 | Period* | 6/30/20 | Period* | |||||||
| Quantified Managed Income Fund | ||||||||||||
| Investor Class | 1.43% | $1,000.00 | $922.40 | $6.84 | $1,017.75 | $7.17 | ||||||
| Advisor Class | 2.03% | $1,000.00 | $919.90 | $9.69 | $1,014.77 | $10.17 | ||||||
| Quantified Market Leaders Fund | ||||||||||||
| Investor Class | 1.42% | $1,000.00 | $1,045.50 | $7.22 | $1,017.80 | $7.12 | ||||||
| Advisor Class | 2.03% | $1,000.00 | $1,042.20 | $10.31 | $1,014.77 | $10.17 | ||||||
| Quantified Alternative Investment Fund | ||||||||||||
| Investor Class | 1.46% | $1,000.00 | $869.80 | $6.79 | $1,017.60 | $7.32 | ||||||
| Advisor Class | 2.14% | $1,000.00 | $867.50 | $9.94 | $1,014.22 | $10.72 | ||||||
| Quantified STF Fund | ||||||||||||
| Investor Class | 1.68% | $1,000.00 | $1,267.70 | $9.47 | $1,016.51 | $8.42 | ||||||
| Advisor Class | 2.28% | $1,000.00 | $1,264.50 | $12.84 | $1,013.53 | $11.41 | ||||||
| Quantified Pattern Recognition Fund | ||||||||||||
| Investor Class | 1.69% | $1,000.00 | $976.70 | $8.26 | $1,016.46 | $8.42 | ||||||
| Quantified Tactical Fixed Income Fund | ||||||||||||
| Investor Class | 1.67% | $1,000.00 | $1,113.80 | $8.79 | $1,016.56 | $8.42 | ||||||
| Quantified Evolution Plus Fund | ||||||||||||
| Investor Class | 1.68% | $1,000.00 | $909.10 | $7.97 | $1,016.51 | $8.42 | ||||||
| Quantified Common Ground Fund | ||||||||||||
| Investor Class | 1.74% | $1,000.00 | $936.10 | $8.09 | $1,016.21 | $8.42 | ||||||
| * | Expenses are equal to the average account value over the period, multiplied by each Fund’s annualized expense ratio, multiplied by the number of days in the period (182) divided by the number of days in the fiscal year (366). |
64
| THE QUANTIFIED FUNDS |
| SUPPLEMENTAL INFORMATION (Unaudited) |
| June 30, 2020 |
The following table provides information regarding each Trustee who is not an “interested person” of the Trust, as defined in the 1940 Act.
| Name, Address 1 and Year of Birth | Position(s) Held with the Trust | Term of Office /Length of Time Served | Principal Occupation(s) During Past 5 Years | Number of Portfolios in Fund Complex Overseen by Trustee (2) | Other Directorships Held by Trustee |
| Charles R. Ranson Born: 1947 | Trustee | Indefinite, since November 2012 | Principal, Ranson & Associates (strategic analysis and planning, including risk assessment and capital formation for entrepreneurial ventures), (since 2003); | 15 | Northern Lights Fund Trust IV, (Since July 2015) |
| Felix Rivera Born: 1963 | Trustee | Indefinite, since November 2012 | Managing Partner, Independent Channel Advisors, LLC (investment advisory consultancy), (since January 2011) | 15 | Centerstone Investors Trust (since March 2016) BlueArc MultiStrategy Fund (2014-2017 |
| David Feldman Born: 1963 | Trustee | Indefinite, Since September 2017 | Independent Consultant (since January 2015). Head of Intermediary Sales, Baron Capital Inc. (February 2010 to December 2014) | 15 | None |
| 1 | Unless otherwise specified, the mailing address of each Trustee is c/o Advisors Preferred Trust, 4221 North 203rd St., Suite 100, Elkhorn, Nebraska 68022-3474. |
| 2 | The “Fund Complex” consists of the series of the Trust |
AP 6/30/20 v1
65
| THE QUANTIFIED FUNDS |
| SUPPLEMENTAL INFORMATION (Unaudited) (Continued) |
| June 30, 2020 |
The following table provides information regarding each Trustee who is an “interested person” of the Trust, as defined in the 1940 Act, and each officer of the Trust.
| Name, Address, 1 Year of Birth | Position(s) Held with the Fund | Term of Office/ Length of Time Served | Principal Occupation(s) During Past 5 Years | Number of Portfolios in Fund Complex Overseen by Trustee (2) | Other Directorships Held by Trustee |
| Catherine Ayers-Rigsby Born: 1948 | Trustee, Chairman, President | Indefinite; since November 2012 | CEO, Advisors Preferred, LLC (since April 2011); President, Ceros Financial Services, Inc.), (since August 2009); President Atcap Partners, LLC (since July 2011) | 15 | None |
| Brian S. Humphrey Born: 1972 | Trustee | Indefinite; since November 2012 | Managing Director, Ceros Financial Services, Inc. (since January 2011) | 15 | None |
| Christine Casares Born: 1975 | Treasurer | Indefinite; Since May 2019 | Vice President, Tax Administration, Gemini Fund Services, LLC (since February 2016); Assistant Vice President, Tax Administration (January 2014 – January 2016) | N/A | N/A |
| R. Michael Fox Born: 1950 | Chief Compliance Officer | Indefinite; since December 2016 | CCO and CFO of Advisors Preferred, LLC (since January 2013); CCO AtCap Partners (since 2013); CFO and CRO of Ceros Financial Services, Inc. (since February 2012); CCO of Foothill Securities, Inc. (November – December 2016) and CCO and CFO Grail Partners, LLC (August 2016 – February 2017) | N/A | N/A |
| Richard Malinowski Born: 1983 | Secretary | Indefinite; Since November 2012 | Senior Vice President and Senior Managing Counsel, Gemini Fund Services, LLC; (since February 2020); Senior Vice President (February 2017 – February 2020); Vice President and Counsel (April 2016 – 2017) and AVP and Staff Attorney (September 2012 – March 2016) | N/A | N/A |
| 1 | Unless otherwise specified, the address of each Trustee and officer is c/o Advisors Preferred Trust, 4221 North 203rd St., Suite 100, Elkhorn, Nebraska 68022-3474. |
| 2 | The “Fund Complex” consists of the series of the Trust. |
The Funds’ Statement of Additional Information includes additional information about the Trustees and is available free of charge by calling toll- free 1-855-647-8268.
AP 6/30/20 v1
66
PRIVACY NOTICE
Rev. May 2014
| FACTS | WHAT DOES ADVISORS PREFERRED TRUST DO WITH YOUR PERSONAL INFORMATION? | |||
| Why? | Financial companies choose how they share your personal information. Federal law gives consumers the right to limit some but not all sharing. Federal law also requires us to tell you how we collect, share, and protect your personal information. Please read this notice carefully to understand what we do. | |||
| What? | The types of personal information we collect and share depend on the product or service you have with us. This information can include: | |||
| ■ | Social Security number | ■ | Purchase History | |
| ■ | Assets | ��� | Account Balances | |
| ■ | Retirement Assets | ■ | Account Transactions | |
| ■ | Transaction History | ■ | Wire Transfer Instructions | |
| ■ | Checking Account Information | |||
| When you are no longer our customer, we continue to share your information as described in this notice. | ||||
| How? | All financial companies need to share customers’ personal information to run their everyday business. In the section below, we list the reasons financial companies can share their customers’ personal information; the reasons Advisors Preferred Trust chooses to share; and whether you can limit this sharing. | |||
| Reasons we can share your personal information | Does Advisors Preferred Trust share? | Can you limit this sharing? |
For our everyday business purposes – such as to process your transactions, maintain your account(s), respond to court orders and legal investigations, or report to credit bureaus | Yes | No |
For our marketing purposes – to offer our products and services to you | No | We don’t share |
| For joint marketing with other financial companies | No | We don’t share |
For our affiliates’ everyday business purposes – information about your transactions and experiences | No | We don’t share |
For our affiliates’ everyday business purposes – information about your creditworthiness | No | We don’t share |
| For nonaffiliates to market to you | No | We don’t share |
| Questions? | Call 1-866-862-9686 | ||||
67
| Who we are | |||||
Who is providing this notice?
| Advisors Preferred Trust | ||||
| What we do | |||||
| How does Advisors Preferred Trust protect my personal information? | To protect your personal information from unauthorized access and use, we use security measures that comply with federal law. These measures include computer safeguards and secured files and buildings.
Our service providers are held accountable for adhering to strict policies and procedures to prevent any misuse of your nonpublic personal information. | ||||
| How does Advisors Preferred Trust collect my personal information? | We collect your personal information, for example, when you
■ Open an account
■ Provide account information
■ Give us your contact information
■ Make deposits or withdrawals from your account
■ Make a wire transfer
■ Tell us where to send the money
■ Tells us who receives the money
■ Show your government-issued ID
■ Show your driver’s license
We also collect your personal information from other companies. | ||||
| Why can’t I limit all sharing? | Federal law gives you the right to limit only ■ Sharing for affiliates’ everyday business purposes – information about your creditworthiness ■ Affiliates from using your information to market to you
■ Sharing for nonaffiliates to market to you
State laws and individual companies may give you additional rights to limit sharing. | ||||
| Definitions | |||||
| Affiliates | Companies related by common ownership or control. They can be financial and nonfinancial companies.
■ Advisors Preferred Trust does not share with our affiliates. | ||||
| Nonaffiliates | Companies not related by common ownership or control. They can be financial and nonfinancial companies. ■ Advisors Preferred Trust does not share with nonaffiliates so they can market to you. | ||||
| Joint marketing | A formal agreement between nonaffiliated financial companies that together market financial products or services to you.
■ Advisors Preferred Trust doesn’t jointly market. | ||||
68
PROXY VOTING POLICY
Information regarding how the Funds voted proxies relating to portfolio securities for the most recent twelve month period ended June 30 as well as a description of the policies and procedures that the Funds use to determine how to vote proxies is available without charge, upon request, by calling 1-855-647-8268 or by referring to the Securities and Exchange Commission’s (“SEC”) website at http://www.sec.gov.
PORTFOLIO HOLDINGS
The Funds file their complete schedule of portfolio holdings with the SEC for the first and third quarters of each fiscal year as an exhibit to its reports on Form N-PORT, within sixty days after the end of the period. Form N-PORT reports are available on the SEC’s website at http://www.sec.gov. The information on Form N-PORT is available without charge, upon request, by calling 1-855-647-8268.
| INVESTMENT ADVISOR |
| Advisors Preferred LLC |
| 1445 Research Blvd., Suite 530 |
| Rockville, MD 20850 |
| SUB-ADVISOR |
| Flexible Plan Investments, Ltd. |
| 3883 Telegraph Road, Suite 100 |
| Bloomfield Hills, MI 48302 |
| ADMINISTRATOR |
| Gemini Fund Services, LLC |
| 4221 North 203rd Street, |
| Suite 100, Elkhorn, NE 68022 |
Item 2. Code of Ethics.
(a) As of the end of the period covered by this report, the registrant has adopted a code of ethics that applies to the registrant's principal executive officer, principal financial officer, principal accounting officer or controller, or persons performing similar functions, regardless of whether these individuals are employed by the registrant or a third party.
(b) For purposes of this item, “code of ethics” means written standards that are reasonably designed to deter wrongdoing and to promote:
| (1) | Honest and ethical conduct, including the ethical handling of actual or apparent conflicts of interest between personal and professional relationships; |
| (2) | Full, fair, accurate, timely, and understandable disclosure in reports and documents that a registrant files with, or submits to, the Commission and in other public communications made by the registrant; |
(3) Compliance with applicable governmental laws, rules, and regulations;
| (4) | The prompt internal reporting of violations of the code to an appropriate person or persons identified in the code; and |
(5) Accountability for adherence to the code.
(c) Amendments: During the period covered by the report, there have not been any amendments to the provisions of the code of ethics.
(d) Waivers: During the period covered by the report, the registrant has not granted any express or implicit waivers from the provisions of the code of ethics.
(e) The Code of Ethics is not posted on Registrant’ website.
(f) A copy of the Code of Ethics is attached as an exhibit.
Item 3. Audit Committee Financial Expert.
| (a) | The Registrant’s board of trustees has determined that Felix Rivera is the audit committee financial expert, as defined in Item 3 of Form N-CSR. Mr. Rivera is independent for purposes of this Item 3. |
Item 4. Principal Accountant Fees and Services.
| (a) | Audit Fees |
2020 - $98,000
2019 - $65,000
| (b) | Audit-Related Fees |
2020 - None
2019 - None
| (c) | Tax Fees |
2020 - $20,000
2019 - $20,000
Preparation of Federal & State income tax returns, assistance with calculation of required income, capital gain and excise distributions and preparation of Federal excise tax returns.
| (d) | All Other Fees |
2020 - None
2019 - None
| (e) | (1) Audit Committee’s Pre-Approval Policies |
The registrant’s Audit Committee is required to pre-approve all audit services and, when appropriate, any non-audit services (including audit-related, tax and all other services) to the registrant. The registrant’s Audit Committee also is required to pre-approve, when appropriate, any non-audit services (including audit-related, tax and all other services) to its adviser, or any entity controlling, controlled by or under common control with the adviser that provides ongoing services to the registrant, to the extent that the services may be determined to have an impact on the operations or financial reporting of the registrant. Services are reviewed on an engagement by engagement basis by the Audit Committee.
| (2) | Percentages of Services Approved by the Audit Committee |
2020 2019
Audit-Related Fees: 100% 100%
Tax Fees: 100% 100%
All Other Fees: 100% 100%
| (f) | During the audit of registrant's financial statements for the most recent fiscal year, less than 50 percent of the hours expended on the principal accountant's engagement were attributed to work performed by persons other than the principal accountant's full-time, permanent employees. |
| (g) | The aggregate non-audit fees billed by the registrant's accountant for services rendered to the registrant, and rendered to the registrant's investment adviser (not including any sub-adviser whose role is primarily portfolio management and is subcontracted with or overseen by another investment adviser), and any entity controlling, controlled by, or under common control with the adviser that provides ongoing services to the registrant: |
2020 - $20,000
2019 - $20,000
(h) The registrant's audit committee has considered whether the provision of non-audit services to the registrant's investment adviser (not including any sub-adviser whose role is primarily portfolio management and is subcontracted with or overseen by another investment adviser), and any entity controlling, controlled by, or under common control with the investment adviser that provides ongoing services to the registrant, that were not pre-approved pursuant to paragraph (c)(7)(ii) of Rule 2-01 of Regulation S-X, is compatible with maintaining the principal accountant's independence.
Item 5. Audit Committee of Listed Companies. Not applicable to open-end investment companies.
Item 6. Schedule of Investments. Schedule of investments in securities of unaffiliated issuers is included under Item 1.
Item 7. Disclosure of Proxy Voting Policies and Procedures for Closed-End Funds. Not applicable to open-end investment companies.
Item 8. Portfolio Managers of Closed-End Management Investment Companies. Not applicable to open-end investment companies.
Item 9. Purchases of Equity Securities by Closed-End Funds. Not applicable to open-end investment companies.
Item 10. Submission of Matters to a Vote of Security Holders. Vote of security holders is included under item 1.
Item 11. Controls and Procedures.
(a) Based on an evaluation of the Registrant’s disclosure controls and procedures as of a date within 90 days of filing date of this Form N-CSR, the principal executive officer and principal financial officer of the Registrant have concluded that the disclosure controls and procedures of the Registrant are reasonably designed to ensure that the information required in filings on Form N-CSR is recorded, processed, summarized, and reported by the filing date, including that information required to be disclosed is accumulated and communicated to the Registrant’s management, including the Registrant’s principal executive officer and principal financial officer, as appropriate to allow timely decisions regarding required disclosure.
(b) There were no significant changes in the Registrant’s internal control over financial reporting that occurred during the Registrant’s last fiscal half-year that have materially affected, or are reasonably likely to materially affect, the Registrant’s internal control over financial reporting.
Item 12. Disclosure of Securities Lending Activities for Closed-End Management Investment Companies. Not applicable.
Item 13. Exhibits.
(a)(1) Code of Ethics filed herewith.
(a)(3) Not applicable for open-end investment companies.
SIGNATURES
Pursuant to the requirements of the Securities Exchange Act of 1934 and the Investment Company Act of 1940, the registrant has duly caused this report to be signed on its behalf by the undersigned, thereunto duly authorized.
(Registrant) Advisors Preferred Trust
By (Signature and Title)
/s/ Catherine Ayers-Rigsby
Catherine Ayer-Rigsby, President/Principal Executive Officer
Date 9/4/20
Pursuant to the requirements of the Securities Exchange Act of 1934 and the Investment Company Act of 1940, this report has been signed below by the following persons on behalf of the registrant and in the capacities and on the dates indicated.
By (Signature and Title)
/s/Catherine Ayers-Rigsby
Catherine Ayers-Rigsby, President/Principal Executive Officer
Date 9/4/20
By (Signature and Title)
/s/ Christine Casares
Christine Casares, Treasurer/Principal Financial Officer
Date 9/4/20