united states
securities and exchange commission
washington, d.c. 20549
form n-csr
certified shareholder report of registered management
investment companies
Investment Company Act file number 811-22756
Advisors Preferred Trust
(Exact name of registrant as specified in charter)
225 Pictoria Drive, Ste 450, Cincinnati, Ohio 45246
(Address of principal executive offices) (Zip code)
Richard Malinowski, Gemini Fund Services, LLC.
80 Arkay Drive, Suite 110 Hauppauge, NY 11788
(Name and address of agent for service)
Registrant's telephone number, including area code: 631-470-2734
Date of fiscal year end: 9/30
Date of reporting period: 9/30/20
Item 1. Reports to Stockholders.
 | ||||
| Spectrum Low Volatility Fund | ||||
| Spectrum Advisors Preferred Fund | ||||
| Annual Report | ||||
| September 30, 2020 | ||||
| Beginning on January 1, 2021, as permitted by regulations adopted by the Securities and Exchange Commission, paper copies of the Funds’ shareholder reports like this one will no longer be sent by mail, unless you specifically request paper copies of the reports. Instead, the reports will be made available on the Funds’ website www.thespectrumfunds.com and you will be notified by mail each time a report is posted and provided with a website link to access the report. | ||||
| If you already elected to receive shareholder reports electronically, you will not be affected by this change and you need not take any action. You may elect to receive shareholder reports and other communications from the Funds electronically or to continue receiving paper copies of shareholder reports, which are available free of charge, by contacting your financial intermediary (such as a broker-dealer or bank) or, if you are a direct investor, by following the instructions included with paper Fund documents that have been mailed to you. | ||||
| Investor Information: 1-866-862-9686 | ||||
| This report and the financial statements contained herein are submitted for the general information of shareholders and are not authorized for distribution to prospective investors unless preceded or accompanied by an effective prospectus. Nothing herein contained is to be considered an offer of sale or solicitation of an offer to buy shares of the Spectrum Funds. Such offering is made only by prospectus, which includes details as to offering price and other material information. | ||||
| Distributed by Ceros Financial Services, Inc. | ||||
| Member FINRA | ||||
November 23, 2020
Dear Shareholders:
This annual report for the Spectrum Funds addresses the period from October 1, 2019 –September 30, 2020. The Spectrum Low Volatility Fund, a non-traditional bond fund, seeks total return and low volatility in all market conditions. The Fund returned +18.76% for the year; the Fund’s primary benchmark, the S&P/LSTA U.S. Leveraged Loan 100 Total Return Index, returned 1.71% for the same period. The Fund’s secondary benchmark, a customized index composed of a 50% weighting of the Barclays U.S. High Yield Very Liquid Total Return Index and a 50% weighting of the S&P Leveraged Loan 100 Total Return Index, rose by 2.18% for the year.
In the fourth quarter of 2019, risk-on, or economically sensitive bond classes, firmed modestly. The Spectrum Low Volatility Fund lowered exposure to municipal bonds and added positions within the high yield and floating rate space. As the quarter progressed, the Fund increased investments significantly, primarily in high yield and floating rate/bank loan classes. Equities and credit-sensitive bonds continued their upward march at the outset of 2020. The Fund added opportunistically to liquid high yield positions. Once municipal bonds broke out of their stalled pattern and gained momentum, the Sub-advisor increased investments in this segment to further diversify the Fund’s portfolio. When coronavirus fears took hold of headlines and high yield spreads began to widen, brought on partially by falling energy prices, the Sub- advisor rapidly trimmed exposure. Tactical trades within Treasury bond instruments proved advantageous throughout mid-month to dampen volatility; increases in preferred stocks also contributed because that asset class maintained its consistent, slow growth profile. Concerns began to rise in mid- February, and the Fund began to slowly pull back on risk-on assets and added hedge exposure, as well as investment grade and Treasury bond allocations before cracks in the markets materialized. This reaction proved timely, as global markets shortly thereafter went from new all-time highs to correction territory in under a week, while the Fund maintained its year-to-date gains. In March, the Sub-advisor broadly and swiftly lowered market exposure in the Fund amid developing signs of the global market entering a capitulation phase. From a safe position in cash, the Sub-advisor watched the liquidity crisis unfold, taking illiquid markets down with it when traditional bond portfolio managers were forced to sell to meet redemptions. The alarm consumed nearly every asset class, raising volatility even in risk-off assets such as investment-grade bonds. As the market approached a technical oversold position, and there was positive support coming in both monetarily and fiscally, small positions were taken within high yield and senior loans to capture short-term opportunities.
After the substantial declines in February and March across assets, April saw a sharp rebound and unprecedented demand for high yield bonds. Early in the month, positions were taken within that asset class, as well as in senior loans and preferred stock. Shortly thereafter, the Federal Reserve’s asset purchase program announcement led to a sharp increase in prices, particularly within high yield bonds. Price action was choppy early in May, as the markets worked to normalize future economic expectations versus the ongoing headwinds of negative statistics, including surges of defaults on high yield and loans in the retail and energy sectors. However, demand for high yield assets remained strong. Faster trades
1
were made within investment grade, high yield, and inflation themes. Once optimism related to reopening of the global economy began to take hold and corporate credit made broad steps toward recovery, allocations were added across high yield, bank loans, preferred stock and structural credit assets, such as mortgage-backed bonds. In June, both high yield and leveraged loan asset classes gave back a small portion of their gains. As momentum waned, the Sub-advisor took a more defensive stance and dramatically reduced positions in these segments and added to mortgage-backed and municipal bond classes as these both exhibited steady uptrends.
July was a very strong month for high yield bonds with the Federal Reserve continuing to serve as a backstop for the markets. The Spectrum Low Volatility Fund posted its best one-month gain since inception. Additional diversification, such as municipal and emerging market bonds, was added throughout the month with a thematic focus on potential future inflation and a falling dollar. Inflation themes continued to play a role in early August, giving way to rising prices within credit assets mid-month. As this rotation became evident, the Sub-advisor tactically rotated portions of the Fund’s portfolio, pushing further into high yield bond, senior loans and preferred stock allocations. Municipal bonds and other risk-off asset classes were trimmed. Defaults, while still elevated, had begun to decline, and with the Federal Reserve maintaining an accommodating policy, these asset classes continued to perform well. The strong upward march that had been seen in markets since the bottom in late March stalled in September. Equities legged lower in a mostly technical sell-off, with corporate credit holding up considerably better than its more volatile equity counterpart. Early in the month, as trends began to deteriorate, the Sub-advisor began to lower the Fund’s risk level. Hedges were added and diversification was increased. Positions in investment-grade developed sovereign bonds were increased, while allocations within mortgage-backed bonds and securitized credit were maintained. The Sub-advisor used total return swaps on mutual funds to execute a portion of its strategy during the period.
The Spectrum Advisors Preferred Fund returned 16.46% for the fiscal year ending September 30, 2020. The Fund’s benchmark, the S&P 500 Total Return Index, returned 15.15% for the period. A customized benchmark comprised of a 60% weighting of the NYSE Composite Index and a 40% weighting of the Bloomberg Barclays U.S. Aggregate Bond Index returned 2.88% for the period. The Fund is designed to provide lower volatility equity exposure.
Equity markets began the fourth quarter of 2019 under modest pressure. Leadership rotation was visible during October as small-caps performed better than large-caps after months of underperformance. The tech heavy NASDAQ also transitioned from poor relative strength in September to outperformance in October. Late in December, signs of excessive optimism prompted the Sub-advisor to reduce exposure in the Fund modestly in an effort to reduce risk.
January began with bullish sentiment running at extreme levels before news surrounding the growing threat of the coronavirus finally caught the attention of investors. Selling pressure accelerated and caused most of the broad-based equity indices to close down for the month. The Sub-advisor took quick action, entering January positioned to take advantage of the market’s uptrend, but then shifted to reducing exposure moderately as warning signs became apparent. Equities pushed to new highs in early February along with investor sentiment. The Sub-advisor reduced positions in the Fund early in the month in response to warning flags. The adjustment was modest while the equity market’s trend remained favorable. The stock market gapped sharply lower on February 24, 2020, resulting in further reduction in exposure. This action led to a minimal loss for the month relative to what had been the fastest 10% loss
2
from a new high by the S&P 500 Index. Equities began the month of March rebounding from a sharp pullback in what initially appeared to be potential support within the major uptrend. After a brief pause, those levels did not hold. The Sub-advisor adjusted investments of the Fund’s portfolio throughout the month in response to market conditions. In April, major equity indexes posted large gains, recovering approximately half of the losses taken during the correction. The path, however, was very jagged as equities often saw large upside and downside swings from close to open, keeping risk elevated. The Sub- advisor adjusted exposure with the Fund adapting to the threat of an often-seen test of correction lows versus the opportunity of recovery. Most major equity indexes consolidated gains during the first half of May, although ongoing strength was seen in the NASDAQ 100 Index. In the latter half of the month, the NASDAQ 100 Index slowed its ascent and other areas, such as consumer discretionary and financials, accelerated higher. The Sub-adviser took a moderately defensive stance early in the month as stocks consolidated. Proprietary methods improved enough to increase exposure prior to the S&P 500 Index’s break above its 200-day moving average, a traditional measure by chart watchers to label a major uptrend. Major equity indexes posted gains in June, but with increased volatility within consolidation patterns. Technology and biotech were sector leaders, showing a continued leaning toward risk versus defensiveness. Exposure within the Spectrum Advisors Preferred Fund was active during the month, taking a moderately defensive stance several times while quickly adding positions as signals were issued. Positive momentum returned late in the month, and the Fund was positioned primarily favoring large-cap technology and diverse small-cap exposure. Large-cap technology accelerated even higher in early July. Exposure within the Spectrum Advisors Preferred Fund started the month with high levels of equity exposure, riding the trend of large-cap tech leadership. Major equity indexes advanced in August but were plagued by poor breadth as a relatively small number of dominant technology stocks were responsible for the majority of gains. The Fund started the month with high levels of equity exposure, then eased it back modestly as technical methods began to show cracks in the trend quality. Large-cap technology led the sharp pullbacks in the equity market in early to mid-September. The NASDAQ 100 Index lost over 10% for the month by September 23rd. The Sub-advisor took defensive steps, decreasing exposure and rotating away from higher beta stocks, but felt the impact of the initial dips. The Sub-advisor responded to oversold opportunities and a quick return to positive momentum by establishing positions in equity indexes and individual stocks. The Sub-advisor used futures and total return swaps on ETF’s to execute a portion of its strategy during the period.
Thank you for your investment in the Funds. Please visit the website www.thespectrumfunds.com at any time for information regarding the Funds.
| Spectrum Financial, Inc. | Advisors Preferred, LLC |
| Sub-advisor to the Funds | Advisor to the Funds |
3
| Spectrum Low Volatility Fund |
| Portfolio Review (Unaudited) |
| September 30, 2020 |
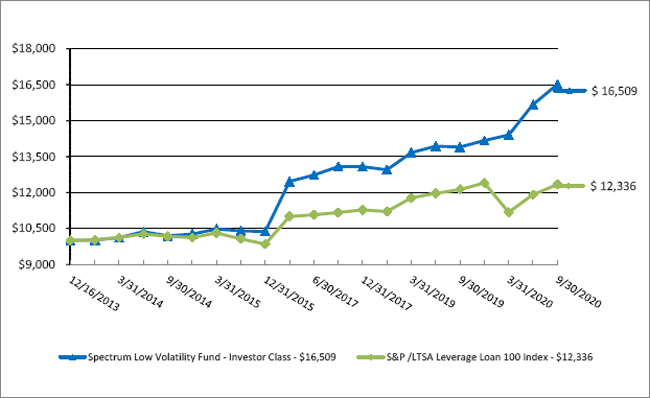
The Fund’s performance figures* for the periods ended September 30, 2020, as compared to its benchmark:
| Annualized | |||
| One Year | Five Year | Since Inception ** | |
| Spectrum Low Volatility Fund - Investor Class | 18.76% | 9.68% | 7.66% |
| S&P/LSTA Leveraged Loan 100 Index.*** | 1.71% | 4.14% | 3.15% |
| * | The performance data quoted is historical. Past performance is no guarantee of future results. Current performance may be higher or lower than the performance data quoted. The principal value and investment return of an investment will fluctuate so that your shares, when redeemed, may be worth more or less than their original cost. The returns shown do not reflect the deduction of taxes that a shareholder would pay on Fund distributions or on the redemptions of Fund shares. Returns greater than 1 year are annualized. The total gross annual operating expenses as stated in the fee table of the Fund’s prospectus dated February 1, 2020 is 2.95% for the Investor Class. The gross expense ratio shown above does not tie to the financial highlights in the annual report due to acquired funds fees. For performance information current to the most recent month-end, please call 1-866-862-9686. |
| ** | Inception date is December 16, 2013. |
| *** | The S&P/LSTA Leveraged Loan 100 Index is designed to reflect the performance of the largest facilities in the leverage loan market. |
Comparison of the Change in Value of a $10,000 Investment
Since Inception through September 30, 2020
| Portfolio Composition as of September 30, 2020 (Unaudited) | ||||
| Holdings by Type of Investment: | % of Net Assets * | |||
| Mutual Funds | 50.5 | % | ||
| Short-term Investments | 40.7 | % | ||
| Other Assets in Excess of Liabilities | 8.8 | % | ||
| 100.0 | % | |||
* The portfolio composition detailed above does not include derivative exposure.
Please refer to the Portfolio of Investments and the Shareholder Letter in this report for a detailed listing of the Fund’s holdings.
4
| Spectrum Advisors Preferred Fund |
| Portfolio Review (Unaudited) |
| September 30, 2020 |
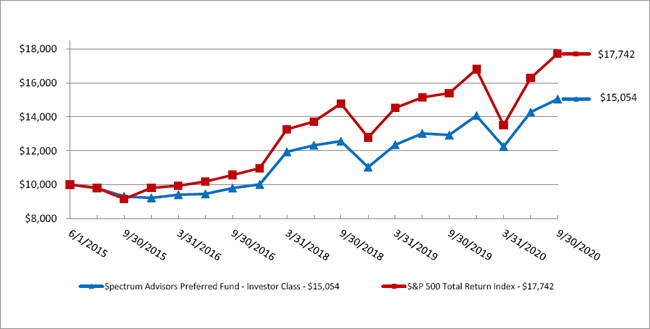
The Fund’s performance figures* for the periods ended September 30, 2020, as compared to its benchmark:
| Annualized | |||
| One Year | Five Years | Since Inception ** | |
| Spectrum Advisors Preferred Fund - Investor Class | 16.46% | 10.10% | 7.97% |
| S&P 500 Total Return Index *** | 15.15% | 14.15% | 11.35% |
| * | The performance data quoted is historical. Past performance is no guarantee of future results. Current performance may be higher or lower than the performance data quoted. The principal value and investment return of an investment will fluctuate so that your shares, when redeemed, may be worth more or less than their original cost. The returns shown do not reflect the deduction of taxes that a shareholder would pay on Fund distributions or on the redemptions of Fund shares. Spectrum Advisors Preferred Fund’s Investor Class shares are subject to a gross annual operating expense ratio of 2.45%, as per the February 1, 2020 Investor Class prospectus. The gross expense ratio shown above does not tie to the financial highlights in the annual report due to acquired funds fees. For performance information current to the most recent month-end, please call 1-866-862-9686. |
| ** | Inception date is June 1, 2015. |
| *** | The S&P 500 Total Return Index is an unmanaged composite of 500 large capitalization companies and includes the reinvestment of dividends. This index is widely used by professional investors as a performance benchmark for large-cap stocks. Investors cannot invest directly in an index. |
Comparison of the Change in Value of a $10,000 Investment
Since Inception through September 30, 2020
| Portfolio Composition as of September 30, 2020 (Unaudited) | ||||
| Holdings by Type of Investment: | % of Net Assets * | |||
| Short-term Investments | 51.3 | % | ||
| Exchange Traded Funds | 23.4 | % | ||
| Mutual Fund | 10.5 | % | ||
| Other Assets in Excess of Liabilities | 14.8 | % | ||
| 100.0 | % | |||
* The portfolio composition detailed above does not include derivative exposure.
Please refer to the Portfolio of Investments and the Shareholder Letter in this report for a detailed listing of the Fund’s holdings.
5
| Spectrum Low Volatility Fund |
| Portfolio of Investments |
| September 30, 2020 |
| Shares | Value | |||||||
| MUTUAL FUNDS - 50.49% | ||||||||
| DEBT FUNDS - 50.49% | ||||||||
| 3,571,755 | AlphaCentric Income Opportunities Fund - Class I | $ | 37,967,759 | |||||
| 4,579,455 | BlackRock High Yield Bond Portfolio - Institutional Class | 33,979,557 | ||||||
| 3,598,315 | Braddock Multi-Strategy Income Fund - Institutional Class | 24,900,342 | ||||||
| 2,368,428 | Columbia Mortgage Opportunities Fund - Class I3 | 24,015,489 | ||||||
| TOTAL MUTUAL FUNDS (Cost - $116,113,855) | 120,863,147 | |||||||
| SHORT-TERM INVESTMENTS - 40.74% | ||||||||
| MONEY MARKET FUND - 40.74% | ||||||||
| 97,522,971 | Fidelity Investments Money Market Funds - Government Portfolio - Class I - 0.01% (a) | 97,522,971 | ||||||
| TOTAL SHORT-TERM INVESTMENTS (Cost - $97,522,971) | ||||||||
| TOTAL INVESTMENTS - 91.23% (Cost - $213,636,826) | $ | 218,386,118 | ||||||
| OTHER ASSETS LESS LIABILITIES - 8.77% | 21,006,573 | |||||||
| NET ASSETS - 100.0% | $ | 239,392,691 | ||||||
| (a) | Money market fund; interest rate reflects seven-day effective yield on September 30, 2020. |
| TOTAL RETURN SWAPS | ||||||||||||||||||
| Notional Value at | ||||||||||||||||||
| September 30, | Unrealized Appreciation/ | |||||||||||||||||
| Number of Shares | Reference Entity | 2020 | Interest Rate Payable (1) | Termination Date | Counterparty | (Depreciation) | ||||||||||||
| Long Position: | ||||||||||||||||||
| 2,443,992 | Eaton Vance Floating-Rate Advantaged Fund | $ | 24,635,439 | 3-Mth USD_LIBOR plus 185 bp | 6/30/2022 | BRC | $ | — | ||||||||||
| 1,970,117 | Nuveen Preferred Securities and Income Fund | 32,979,759 | 3-Mth USD_LIBOR plus 185 bp | 6/30/2022 | BRC | — | ||||||||||||
| 1,051,696 | PIMCO Dynamic Bond Fund | 11,274,181 | 3-Mth USD_LIBOR plus 185 bp | 6/30/2022 | BRC | — | ||||||||||||
| 25,247,719 | PIMCO Government Money Market Fund | 25,247,719 | 3-Mth USD_LIBOR plus 185 bp | 6/30/2022 | BRC | — | ||||||||||||
| 1,041,845 | PIMCO Income Fund | 12,200,005 | 3-Mth USD_LIBOR plus 185 bp | 6/30/2022 | BRC | — | ||||||||||||
| 1,047,359 | PIMCO International Bond Fund | 11,500,002 | 3-Mth USD_LIBOR plus 185 bp | 6/30/2022 | BRC | — | ||||||||||||
| 2,004,486 | PIMCO Preferred and Capital Security Fund | 21,287,641 | 3-Mth USD_LIBOR plus 185 bp | 6/30/2022 | BRC | — | ||||||||||||
| — | ||||||||||||||||||
| Short Position: | ||||||||||||||||||
| (1,088,600 | ) | Invesco Senior Loan ETF | (23,666,164 | ) | 1-Mth USD_LIBOR minus 30 bp | 5/20/2021 | CS | 24,598 | ||||||||||
| (658,500 | ) | iShares Preferred and Income Securities ETF | (24,002,325 | ) | 1-Mth USD_LIBOR minus 30 bp | 5/20/2021 | CS | (626,632 | ) | |||||||||
| (602,034 | ) | |||||||||||||||||
| $ | (602,034 | ) | ||||||||||||||||
BRC - Barclays Capital Inc.
CS - Credit Suisse Securities (Europe) Limited
ETF - Exchange Traded Fund
LIBOR - London Interbank Offered Rate
| (1) | Interest rate is based upon predetermined notional amounts, which may be a multiple of the number of shares plus or minus a specified spread. |
See accompanying notes to financial statements.
6
| Spectrum Advisors Preferred Fund |
| Portfolio of Investments |
| September 30, 2020 |
| Shares | Value | |||||||
| EXCHANGE TRADED FUNDS - 23.42% | ||||||||
| DEBT FUNDS - 23.42% | ||||||||
| 9,300 | iShares JPMorgan USD Emerging Market Bond ETF | $ | 1,031,277 | |||||
| 28,300 | iShares Preferred and Income Securities ETF | 1,031,535 | ||||||
| 15,400 | SDPR Bloomberg Barclays Convertible Securities ETF | 1,060,906 | ||||||
| TOTAL EXCHANGE TRADED FUNDS (Cost - $3,124,904) | 3,123,718 | |||||||
| MUTUAL FUND - 10.48% | ||||||||
| DEBT FUND - 10.48% | ||||||||
| 202,921 | Braddock Multi-Strategy Income Fund - Institutional Class | 1,404,212 | ||||||
| TOTAL MUTUAL FUND (Cost - $1,226,125) | ||||||||
| SHORT-TERM INVESTMENTS - 51.35% | ||||||||
| MONEY MARKET FUNDS - 51.35% | ||||||||
| 3,424,574 | Fidelity Investments Money Market Funds - Government Portfolio - Class I - 0.01% (a) | 3,424,574 | ||||||
| 3,424,574 | First American Government Obligations Fund - Class Z - 0.05% (a) | 3,424,574 | ||||||
| TOTAL SHORT-TERM INVESTMENTS (Cost - $6,849,148) | 6,849,148 | |||||||
| TOTAL INVESTMENTS - 85.25% (Cost - $11,200,177) | $ | 11,377,078 | ||||||
| OTHER ASSETS IN EXCESS OF LIABILITIES - 14.75% | 1,960,732 | |||||||
| NET ASSETS - 100.0% | $ | 13,337,810 | ||||||
ETF - Exchange Traded Fund
| (a) | Money market fund; interest rate reflects seven-day effective yield on September 30, 2020. |
| OPEN FUTURES CONTRACTS | ||||||||||||||
| Number of | Notional Value at | Unrealized | ||||||||||||
| Contracts | Open Long Futures Contracts | Expiration | September 30, 2020 | Appreciation | ||||||||||
| 18 | E-Mini Russell 2000 Index | Dec-20 | $ | 1,353,960 | $ | 32,795 | ||||||||
| 38 | NASDAQ 100 E-mini Index | Dec-20 | 8,669,548 | 202,423 | ||||||||||
| TOTAL FUTURES CONTRACTS | $ | 235,218 | ||||||||||||
| TOTAL RETURN SWAPS | ||||||||||||||||||
| Number of | Notional Value at | Termination | Unrealized | |||||||||||||||
| Shares | Reference Entity | September 30, 2020 | Interest Rate Payable (i) | Date | Counterparty | Appreciation | ||||||||||||
| 2,193 | Align Technology, Inc. | $ | 717,900 | 1-Mth USD_LIBOR plus 35 bp | 1/19/2021 | CS | $ | 17,951 | ||||||||||
| 12,037 | Applied Materials, Inc. | 715,600 | 1-Mth USD_LIBOR plus 35 bp | 1/19/2021 | CS | 15,146 | ||||||||||||
| 3,072 | Autodesk, Inc. | 709,663 | 1-Mth USD_LIBOR plus 35 bp | 1/19/2021 | CS | 9,116 | ||||||||||||
| 5,204 | Automatic Data Processing, Inc. | 725,906 | 1-Mth USD_LIBOR plus 35 bp | 1/19/2021 | CS | 25,212 | ||||||||||||
| 1,961 | Broadcom, Inc. | 714,432 | 1-Mth USD_LIBOR plus 35 bp | 1/19/2021 | CS | 15,208 | ||||||||||||
| 6,212 | CDW Corp. | 742,520 | 1-Mth USD_LIBOR plus 35 bp | 1/19/2021 | CS | 42,281 | ||||||||||||
| 6,858 | Fiserv, Inc. | 706,716 | 1-Mth USD_LIBOR plus 35 bp | 1/19/2021 | CS | 5,199 | ||||||||||||
| 3,725 | KLA Corp. | 721,682 | 1-Mth USD_LIBOR plus 35 bp | 1/19/2021 | CS | 21,965 | ||||||||||||
| 2,118 | Lam Research Corp. | 702,647 | 1-Mth USD_LIBOR plus 35 bp | 1/19/2021 | CS | 4,628 | ||||||||||||
| 5,845 | NXP Semiconductors NV | 729,514 | 1-Mth USD_LIBOR plus 35 bp | 1/19/2021 | CS | 29,228 | ||||||||||||
| 9,004 | Paychex, Inc. | 718,249 | 1-Mth USD_LIBOR plus 35 bp | 1/19/2021 | CS | 17,800 | ||||||||||||
| 5,058 | Skyworks Solutions, Inc. | 735,939 | 1-Mth USD_LIBOR plus 35 bp | 1/19/2021 | CS | 35,879 | ||||||||||||
| $ | 239,613 | |||||||||||||||||
CS - Credit Suisse Securities (Europe) Limited
LIBOR - London Interbank Offered Rate
| (i) | Interest rate is based upon predetermined notional amounts, which may be a multiple of the number of shares plus a specified spread. |
See accompanying notes to financial statements.
7
| Spectrum Funds |
| Statements of Assets and Liabilities |
| September 30, 2020 |
| Spectrum Low | Spectrum Advisors | |||||||
| Volatility Fund | Preferred Fund | |||||||
| ASSETS | ||||||||
| Investment securities: | ||||||||
| At cost | $ | 213,636,826 | $ | 11,200,177 | ||||
| At value | $ | 218,386,118 | $ | 11,377,078 | ||||
| Segregated cash - Collateral for swaps | 14,690,000 | 1,770,000 | ||||||
| Deposit with broker for swaps | 4,865,572 | — | ||||||
| Receivable for swaps | 1,614,790 | — | ||||||
| Deposit with broker for futures | 1,295,844 | 787,728 | ||||||
| Dividend and interest receivable | 42,161 | 115 | ||||||
| Receivable for Fund shares sold | 182,452 | — | ||||||
| Unrealized appreciation on swaps | 24,598 | 239,613 | ||||||
| Unrealized appreciation on futures | — | 235,218 | ||||||
| Prepaid expenses | — | 17,514 | ||||||
| TOTAL ASSETS | 241,101,535 | 14,427,266 | ||||||
| LIABILITIES | ||||||||
| Payable for investments purchased | — | 1,062,255 | ||||||
| Payable for swaps | 627,047 | — | ||||||
| Unrealized depreciation on swaps | 626,632 | — | ||||||
| Investment advisory fees payable | 416,910 | 16,433 | ||||||
| Accrued expenses | 21,256 | — | ||||||
| Payable for Fund shares redeemed | 9,516 | 10,017 | ||||||
| Shareholder servicing fees payable | 7,483 | 751 | ||||||
| TOTAL LIABILITIES | 1,708,844 | 1,089,456 | ||||||
| NET ASSETS | $ | 239,392,691 | $ | 13,337,810 | ||||
| NET ASSET VALUE | ||||||||
| Net Assets | $ | 239,392,691 | $ | 13,337,810 | ||||
| Shares of beneficial interest outstanding | 9,657,816 | 488,008 | ||||||
| Net Asset Value, Offering and Redemption Price Per Share (Net Assets ÷ Shares Outstanding) | $ | 24.79 | $ | 27.33 | ||||
| NET ASSETS CONSIST OF: | ||||||||
| Paid in capital ($0 par value, unlimited shares authorized) | $ | 224,005,819 | $ | 10,596,729 | ||||
| Accumulated distributable earnings (loss) | 15,386,872 | 2,741,081 | ||||||
| NET ASSETS | $ | 239,392,691 | $ | 13,337,810 | ||||
See accompanying notes to financial statements.
8
| Spectrum Funds |
| Statements of Operations |
| For the Year Ended September 30, 2020 |
| Spectrum Low | Spectrum Advisors | |||||||
| Volatility Fund | Preferred Fund | |||||||
| INVESTMENT INCOME | ||||||||
| Dividends | $ | 2,797,413 | $ | 171,432 | ||||
| Interest | 271,291 | 29,251 | ||||||
| TOTAL INVESTMENT INCOME | 3,068,704 | 200,683 | ||||||
| EXPENSES | ||||||||
| Investment advisory fees | 2,482,830 | 196,646 | ||||||
| Shareholder servicing fees | 34,662 | 3,923 | ||||||
| Administration expenses (Note 5) | 383,927 | 40,797 | ||||||
| Trustees’ fees and expenses | 717 | 809 | ||||||
| Miscellaneous expenses | 7,196 | 6,076 | ||||||
| TOTAL EXPENSES | 2,909,332 | 248,251 | ||||||
| NET INVESTMENT INCOME/(LOSS) | 159,372 | (47,568 | ) | |||||
| REALIZED AND UNREALIZED GAIN (LOSS) ON INVESTMENTS | ||||||||
| Net realized gain (loss) from: | ||||||||
| Investments | 4,571,299 | 1,705,329 | ||||||
| Swaps | 9,011,782 | (29,947 | ) | |||||
| Futures | 181,051 | 949,277 | ||||||
| Distributions received from underlying investment companies | — | 97,201 | ||||||
| TOTAL NET REALIZED GAIN | 13,764,132 | 2,721,860 | ||||||
| Net change in unrealized appreciation (depreciation) on: | ||||||||
| Investments | 4,740,652 | (1,294,673 | ) | |||||
| Swaps | (626,328 | ) | 233,981 | |||||
| Futures | — | 248,638 | ||||||
| TOTAL NET CHANGE IN UNREALIZED APPRECIATION (DEPRECIATION) | 4,114,324 | (812,054 | ) | |||||
| NET REALIZED AND UNREALIZED GAIN ON INVESTMENTS | 17,878,456 | 1,909,806 | ||||||
| NET INCREASE IN NET ASSETS FROM OPERATIONS | $ | 18,037,828 | $ | 1,862,238 | ||||
See accompanying notes to financial statements.
9
| Spectrum Low Volatility Fund |
| Statements of Changes in Net Assets |
| For the | For the | |||||||
| Year Ended | Year Ended | |||||||
| September 30, 2020 | September 30, 2019 | |||||||
| INCREASE (DECREASE) IN NET ASSETS | ||||||||
| FROM OPERATIONS | ||||||||
| Net investment income | $ | 159,372 | $ | 60,225 | ||||
| Net realized gain from security transactions, swaps, and futures contracts | 13,764,132 | 4,096,732 | ||||||
| Net change in unrealized appreciation (depreciation) of investments, swaps and futures contracts | 4,114,324 | (633,538 | ) | |||||
| Net increase in net assets resulting from operations | 18,037,828 | 3,523,419 | ||||||
| DISTRIBUTIONS TO SHAREHOLDERS | ||||||||
| Total distributions paid | (3,280,545 | ) | (2,246,066 | ) | ||||
| Net decrease in net assets from distributions to shareholders | (3,280,545 | ) | (2,246,066 | ) | ||||
| FROM SHARES OF BENEFICIAL INTEREST | ||||||||
| Proceeds from shares sold | 174,401,309 | 22,054,592 | ||||||
| Net asset value of shares issued in reinvestment of distributions | 3,038,916 | 2,062,027 | ||||||
| Payments for shares redeemed | (35,000,238 | ) | (9,923,138 | ) | ||||
| Net increase in net assets from shares of beneficial interest | 142,439,987 | 14,193,481 | ||||||
| TOTAL INCREASE IN NET ASSETS | 157,197,270 | 15,470,834 | ||||||
| NET ASSETS | ||||||||
| Beginning of Year | 82,195,421 | 66,724,587 | ||||||
| End of Year | $ | 239,392,691 | $ | 82,195,421 | ||||
| SHARE ACTIVITY | ||||||||
| Shares Sold | 7,239,131 | 1,024,682 | ||||||
| Shares Reinvested | 143,571 | 98,590 | ||||||
| Shares Redeemed | (1,508,837 | ) | (464,516 | ) | ||||
| Net increase in shares of beneficial interest outstanding | 5,873,865 | 658,756 | ||||||
See accompanying notes to financial statements.
10
| Spectrum Advisors Preferred Fund |
| Statements of Changes in Net Assets |
| For the | For the | |||||||
| Year Ended | Year Ended | |||||||
| September 30, 2020 | September 30, 2019 | |||||||
| INCREASE (DECREASE) IN NET ASSETS | ||||||||
| FROM OPERATIONS | ||||||||
| Net investment income/(loss) | $ | (47,568 | ) | $ | 9,107 | |||
| Net realized gain (loss) from security transactions, swaps and futures contracts | 2,624,659 | (214,683 | ) | |||||
| Distibutions from underlying investment companies | 97,201 | 62,395 | ||||||
| Net change in unrealized appreciation (depreciation) of investments, swaps and futures contracts | (812,054 | ) | 541,320 | |||||
| Net increase in net assets resulting from operations | 1,862,238 | 398,139 | ||||||
| DISTRIBUTIONS TO SHAREHOLDERS | ||||||||
| From return of capital | — | (92,632 | ) | |||||
| Total distributions paid | (83,676 | ) | (301,785 | ) | ||||
| Net decrease in net assets from distributions to shareholders | (83,676 | ) | (394,417 | ) | ||||
| FROM SHARES OF BENEFICIAL INTEREST | ||||||||
| Proceeds from shares sold | 2,331,410 | 2,045,224 | ||||||
| Net asset value of shares issued in reinvestment of distributions | 83,624 | 394,417 | ||||||
| Payments for shares redeemed | (3,537,769 | ) | (1,188,460 | ) | ||||
| Net increase (decrease) in net assets from shares of beneficial interest | (1,122,735 | ) | 1,251,181 | |||||
| TOTAL INCREASE (DECREASE) IN NET ASSETS | 655,827 | 1,254,903 | ||||||
| NET ASSETS | ||||||||
| Beginning of Year | 12,681,983 | 11,427,080 | ||||||
| End of Year | $ | 13,337,810 | $ | 12,681,983 | ||||
| SHARE ACTIVITY | ||||||||
| Shares Sold | 93,280 | 92,155 | ||||||
| Shares Reinvested | 3,591 | 18,098 | ||||||
| Shares Redeemed | (145,399 | ) | (53,279 | ) | ||||
| Net increase (decrease) in shares of beneficial interest outstanding | (48,528 | ) | 56,974 | |||||
See accompanying notes to financial statements.
11
| Spectrum Low Volatility Fund |
| Financial Highlights |
Per Share Data and Ratios for a Share of Beneficial Interest Outstanding Throughout Each Year Presented
| For the | For the | For the | For the | For the | ||||||||||||||||
| Year Ended | Year Ended | Year Ended | Year Ended | Year Ended | ||||||||||||||||
| September 30, 2020 | September 30, 2019 | September 30, 2018 | September 30, 2017 | September 30, 2016 | ||||||||||||||||
| Net asset value, beginning of year | $ | 21.72 | $ | 21.35 | $ | 22.58 | $ | 22.16 | $ | 19.88 | ||||||||||
| Activity from investment operations: | ||||||||||||||||||||
| Net investment income (loss) (1) | 0.03 | 0.02 | 0.02 | (0.04 | ) | (0.06 | ) | |||||||||||||
| Net realized and unrealized gain on investments, swaps and futures contracts | 3.89 | 1.04 | 0.21 | 2.35 | 2.62 | |||||||||||||||
| Total from investment operations | 3.92 | 1.06 | 0.23 | 2.31 | 2.56 | |||||||||||||||
| Less distributions from: | ||||||||||||||||||||
| Net investment income | (0.52 | ) | (0.69 | ) | (1.01 | ) | (1.39 | ) | (0.28 | ) | ||||||||||
| Net realized gains | (0.33 | ) | — | (0.45 | ) | (0.50 | ) | — | ||||||||||||
| Total distributions | (0.85 | ) | (0.69 | ) | (1.46 | ) | (1.89 | ) | (0.28 | ) | ||||||||||
| Net asset value, end of year | $ | 24.79 | $ | 21.72 | $ | 21.35 | $ | 22.58 | $ | 22.16 | ||||||||||
| Total return (2) | 18.76 | % | 5.12 | % | 1.06 | % | 11.32 | % | 13.04 | % | ||||||||||
| Net assets, end of year (000s) | $ | 239,393 | $ | 82,195 | $ | 66,725 | $ | 65,313 | $ | 34,875 | ||||||||||
| Ratio of expenses to average net assets, | ||||||||||||||||||||
| net of fee waivers (3) | 2.51 | % | 2.53 | % | 2.53 | % | 2.54 | % | 2.55 | % | ||||||||||
| before fee waivers (3) | 2.51 | % | 2.53 | % | 2.53 | % | 2.54 | % | 2.57 | % | ||||||||||
| Ratio of net investment income (loss) to average net assets (3,4) | 0.14 | % | 0.08 | % | 0.10 | % | (0.20 | )% | (0.24 | )% | ||||||||||
| Portfolio Turnover Rate | 389 | % | 675 | % | 438 | % | 319 | % | 649 | % | ||||||||||
| (1) | Per share amounts calculated using the average shares method, which more appropriately presents the per share data for the year. |
| (2) | Assumes reinvestment of all dividends and distributions if any. |
| (3) | The ratios of expenses to average net assets and net investment income (loss) to average net assets do not reflect the expenses of the underlying investment companies in which the Fund invests. |
| (4) | Recognition of net investment income (loss) by the Fund is affected by the timing and declaration of dividends by the underlying investment companies in which the Fund invests. |
See accompanying notes to financial statements.
12
| Spectrum Advisors Preferred Fund |
| Financial Highlights |
Per Share Data and Ratios for a Share of Beneficial Interest Outstanding Throughout Each Year Presented
| For the | For the | For the | For the | For the | ||||||||||||||||
| Year Ended | Year Ended | Year Ended | Year Ended | Year Ended | ||||||||||||||||
| September 30, 2020 | September 30, 2019 | September 30, 2018 | September 30, 2017 | September 30, 2016 | ||||||||||||||||
| Net asset value, beginning of year | $ | 23.64 | $ | 23.83 | $ | 21.95 | $ | 19.46 | $ | 18.61 | ||||||||||
| Activity from investment operations: | ||||||||||||||||||||
| Net investment income (loss) (1) | (0.09 | ) | 0.02 | (0.15 | ) | 0.09 | (0.12 | ) | ||||||||||||
| Net realized and unrealized gain (loss) on investments, swaps and future contracts | 3.95 | 0.60 | 2.93 | 2.51 | 1.10 | |||||||||||||||
| Total from investment operations | 3.86 | 0.62 | 2.78 | 2.60 | 0.98 | |||||||||||||||
| Less distributions from: | ||||||||||||||||||||
| Net investment income | (0.17 | ) | (0.18 | ) | (0.29 | ) | (0.11 | ) | (0.13 | ) | ||||||||||
| Net realized gains | — | (0.45 | ) | (0.61 | ) | — | — | |||||||||||||
| Return of capital | — | (0.18 | ) | — | — | — | ||||||||||||||
| Total distributions | (0.17 | ) | (0.81 | ) | (0.90 | ) | (0.11 | ) | (0.13 | ) | ||||||||||
| Net asset value, end of year | $ | 27.33 | $ | 23.64 | $ | 23.83 | $ | 21.95 | $ | 19.46 | ||||||||||
| Total return (2) | 16.46 | % | 2.89 | % | 13.07 | % | 13.39 | % | 5.31 | % | ||||||||||
| Net assets, end of year (000s) | $ | 13,338 | $ | 12,682 | $ | 11,427 | $ | 7,350 | $ | 4,321 | ||||||||||
| Ratio of expenses to average net assets (3) | 1.89 | % | 1.83 | % | 1.81 | % | 1.86 | % | 1.95 | % | ||||||||||
| Ratio of net investment income (loss) to average net assets (3,4) | (0.36 | )% | 0.08 | % | (0.65 | )% | 0.45 | % | (0.66 | )% | ||||||||||
| Portfolio Turnover Rate | 831 | % | 360 | % | 269 | % | 260 | % | 228 | % | ||||||||||
| (1) | Per share amounts calculated using the average shares method, which more appropriately presents the per share data for the year. |
| (2) | Assumes reinvestment of all dividends and distributions if any. |
| (3) | The ratios of expenses to average net assets and net investment income (loss) to average net assets do not reflect the expenses of the underlying investment companies in which the Fund invests. |
| (4) | Recognition of net investment income (loss) by the Fund is affected by the timing and declaration of dividends by the underlying investment companies in which the Fund invests. |
See accompanying notes to financial statements.
13
| Spectrum Funds |
| Notes to Financial Statements |
| September 30, 2020 |
| 1. | ORGANIZATION |
The Spectrum Low Volatility Fund (the “Low Volatility Fund”) and Spectrum Advisors Preferred Fund (the “Advisors Preferred Fund”) (collectively, the “Funds”) are each a diversified series of Advisors Preferred Trust (the “Trust”), a statutory trust organized under the laws of the State of Delaware on August 15, 2012 and registered under the Investment Company Act of 1940, as amended (the “1940 Act”), as an open-end management investment company. The Low Volatility Fund’s investment objective is total return with lower downside volatility and risk compared to major stock market indices while the Advisors Preferred Fund seeks long term capital appreciation. Each Fund currently offers one class of shares, Investor Class shares, which is offered at net asset value. The Low Volatility Fund also offers Advisor Class shares, but as of the date of this report none have been issued. The Low Volatility Fund commenced operations on December 16, 2013 and the Advisors Preferred Fund commenced operations on June 1, 2015. The Trust’s Agreement and Declaration of Trust permits the Trust’s Board of Trustees (“Board”) to authorize and issue an unlimited number of shares of beneficial interest of separate series without par value. The investment adviser to each Fund is Advisors Preferred LLC (the “Adviser”). The investment sub-adviser to each Fund is Spectrum Financial, Inc. (the “Sub-Adviser”).
| 2. | SIGNIFICANT ACCOUNTING POLICIES |
The following is a summary of significant accounting policies followed by the Funds in preparation of their financial statements. These policies are in conformity with accounting principles generally accepted in the United States of America (“GAAP”). The preparation of the financial statements in conformity with GAAP requires management to make estimates and assumptions that affect the reported amounts of assets and liabilities and disclosure of contingent assets and liabilities at the date of the financial statements and the reported amounts of increases and decreases in net assets from operations during the reporting period. Actual results could differ from those estimates. The Funds are each an investment company and accordingly follow the investment company accounting and reporting guidance of the Financial Accounting Standards Board (FASB) Accounting Standard Codification Topic 946 “Financial Services – Investment Companies” including FASB Accounting Standard Update ASU 2013-08.
Securities Valuation – Securities listed on an exchange are valued at the last reported sale price at the close of the regular trading session of the exchange on the business day the value is being determined, or in the case of securities listed on NASDAQ at the NASDAQ Official Closing Price (“NOCP”). In the absence of a sale, such securities shall be valued at the mean of the last bid and offer price on the day of valuation. Futures are valued at the final settled price or, in the absence of a settled price, at the last sale price on the day of valuation. Swaps are valued based upon prices from third party vendor models or quotations from market makers to the extent available. Investments valued in currencies other than the U.S. dollar are converted to U.S. dollars using exchange rates obtained from pricing services. Short-term debt obligations, excluding U.S. Treasury Bills, having 60 days or less remaining until maturity, at time of purchase, may be valued at amortized cost.
The Funds may hold securities, such as private placements, interests in commodity pools, other non-traded securities or temporarily illiquid securities, for which market quotations are not readily available or are determined to be unreliable. These securities will be valued using the “fair value” procedures approved by the Board. The Board has delegated execution of these procedures to a fair value committee composed of one or more representatives from each of the (i) Trust, (ii) administrator, and (iii) advisor and/or sub-advisor. The committee may also enlist third party consultants such as a valuation specialist at a public accounting firm, valuation consultant or financial officer of a security issuer on an as-needed basis to assist in determining a security-specific fair value. The Board reviews and ratifies the execution of this process and the resultant fair value prices at least quarterly to assure the process produces reliable results.
Fair Valuation Process – As noted above, the fair value committee is composed of one or more representatives from each of the (i) Trust, (ii) administrator, and (iii) Adviser and/or Sub -Adviser. The applicable investments are valued collectively via inputs from each of these groups. For example, fair value determinations are required for the following securities: (i) securities for which market quotations are insufficient or not readily available on a particular business day (including securities for which there is a short and temporary lapse in the provision of a
14
| Spectrum Funds |
| Notes to Financial Statements (Continued) |
| September 30, 2020 |
price by the regular pricing source), (ii) securities for which, in the judgment of the Adviser or Sub-Adviser, the prices or values available do not represent the fair value of the instrument. Factors which may cause the Adviser or Sub- Adviser to make such a judgment include, but are not limited to, the following: only a bid price or an asked price is available; the spread between bid and asked prices is substantial; the frequency of sales; the thinness of the market; the size of reported trades; and actions of the securities markets, such as the suspension or limitation of trading; (iii) securities determined to be illiquid; (iv) securities with respect to which an event that will affect the value thereof has occurred (a “significant event”) since the closing prices were established on the principal exchange on which they are traded, but prior to a Fund’s calculation of its net asset value. Specifically, interests in commodity pools or managed futures pools are valued on a daily basis by reference to the closing market prices of each futures contract or other asset held by a pool, as adjusted for pool expenses. Restricted or illiquid securities, such as private investments or non-traded securities are valued via inputs from the Adviser or Sub-Adviser based upon the current bid for the security from two or more independent dealers or other parties reasonably familiar with the facts and circumstances of the security (who should take into consideration all relevant factors as may be appropriate under the circumstances). If the Adviser or Sub-Adviser is unable to obtain a current bid from such independent dealers or other independent parties, the fair value committee shall determine the fair value of such security using the following factors: (i) the type of security; (ii) the cost at date of purchase; (iii) the size and nature of a Fund’s holdings; (iv) the discount from market value of unrestricted securities of the same class at the time of purchase and subsequent thereto; (v) information as to any transactions or offers with respect to the security; (vi) the nature and duration of restrictions on disposition of the security and the existence of any registration rights; (vii) how the yield of the security compares to similar securities of companies of similar or equal creditworthiness; (viii) the level of recent trades of similar or comparable securities; (ix) the liquidity characteristics of the security; (x) current market conditions; and (xi) the market value of any securities into which the security is convertible or exchangeable.
Valuation of Fund of Funds – The Funds may invest in open-end or closed-end investment companies (the “Underlying Funds”). The Underlying Funds value securities in their funds for which market quotations are readily available at their market values (generally the last reported sale price) and all other securities and assets at their fair value to the methods established by the board of directors of the Underlying Funds.
Open-end investment companies are valued at their respective net asset values as reported by such investment companies. The shares of many closed-end investment companies, after their initial public offering, frequently trade at a price per share, which is different than the net asset value per share. The difference represents a market premium or market discount of such shares. There can be no assurances that the market discount or market premium on shares of any closed-end investment company purchased by the Funds will not change.
The Funds utilize various methods to measure the fair value of all of their investments on a recurring basis. GAAP establishes a hierarchy that prioritizes inputs to valuation methods. The three levels of input are:
Level 1 – Unadjusted quoted prices in active markets for identical assets and liabilities that the Funds have the ability to access.
Level 2 – Observable inputs other than quoted prices included in Level 1 that are observable for the asset or liability, either directly or indirectly. These inputs may include quoted prices for the identical instrument on an inactive market, prices for similar instruments, interest rates, prepayment speeds, credit risk, yield curves, default rates and similar data.
Level 3 – Unobservable inputs for the asset or liability, to the extent relevant observable inputs are not available, representing the Funds’ own assumptions about the assumptions a market participant would use in valuing the asset or liability, and would be based on the best information available.
The availability of observable inputs can vary from security to security and is affected by a wide variety of factors, including, for example, the type of security, whether the security is new and not yet established in the marketplace, the liquidity of markets, and other characteristics particular to the security. To the extent that valuation is based on models or inputs that are less observable or unobservable in the market, the determination of fair value requires more judgment. Accordingly, the degree of judgment exercised in determining fair value is greatest for instruments categorized in Level 3.
15
| Spectrum Funds |
| Notes to Financial Statements (Continued) |
| September 30, 2020 |
The inputs used to measure fair value may fall into different levels of the fair value hierarchy. In such cases, for disclosure purposes, the level in the fair value hierarchy within which the fair value measurement falls in its entirety, is determined based on the lowest level input that is significant to the fair value measurement in its entirety.
The inputs or methodology used for valuing securities are not necessarily an indication of the risk associated with investing in those securities. The following table summarizes the inputs used as of September 30, 2020 for each Fund’s investments measured at fair value:
| Spectrum Low Volatility Fund | ||||||||||||||||
| Assets * | Level 1 | Level 2 | Level 3 | Total | ||||||||||||
| Mutual Funds | $ | 120,863,147 | $ | — | $ | — | $ | 120,863,147 | ||||||||
| Short-term Investments | 97,522,971 | — | — | 97,522,971 | ||||||||||||
| Total Assets | $ | 218,386,118 | $ | — | $ | — | $ | 218,386,118 | ||||||||
| Liabilities* | ||||||||||||||||
| Derivatives | ||||||||||||||||
| Swaps | $ | — | $ | (602,034 | ) | $ | — | $ | (602,034 | ) | ||||||
| Total Liabilities | $ | — | $ | (602,034 | ) | $ | — | $ | (602,034 | ) | ||||||
| Spectrum Advisors Preferred Fund | ||||||||||||||||
| Assets * | Level 1 | Level 2 | Level 3 | Total | ||||||||||||
| Exchange Traded Funds | $ | 3,123,718 | $ | — | $ | — | $ | 3,123,718 | ||||||||
| Mutual Fund | 1,404,212 | — | — | 1,404,212 | ||||||||||||
| Short-term Investments | 6,849,148 | — | — | 6,849,148 | ||||||||||||
| Derivatives | ||||||||||||||||
| Futures Contracts | 235,218 | — | — | 235,218 | ||||||||||||
| Swaps | — | 239,613 | — | 239,613 | ||||||||||||
| Total Assets | $ | 11,612,296 | $ | 239,613 | $ | — | $ | 11,851,909 | ||||||||
| * | Refer to the Portfolios of Investments for sector classifications. |
The Funds did not hold any Level 3 securities during the current period.
Exchange Traded Funds – The Funds may invest in exchange traded funds (“ETFs”). ETFs are typically a type of fund bought and sold on a securities exchange. An ETF trades like common stock and represents a portfolio of securities that may be designed to track the performance and dividend yield of a particular domestic or foreign market index. The Funds may purchase an ETF to temporarily gain exposure to a portion of the U.S. or a foreign market while awaiting purchase of underlying securities. The risks of owning an ETF generally reflect the risks of owning the underlying securities they are designed to track, although the lack of liquidity on an ETF could result in it being more volatile. Additionally, ETFs have fees and expenses which reduce their value.
Futures Contracts – The Funds are subject to interest rate risk, equity risk and forward currency exchange rate risk in the normal course of pursuing their respective investment objectives. The Funds have purchased or sold futures contracts to gain exposure to, or hedge against, changes in the value of equities and interest rates. Initial margin deposits required upon entering into futures contracts are satisfied by the segregation of specific securities or cash as collateral for the account of the broker (the Funds’ agent in acquiring the futures position). During the period the futures contracts are open, changes in the value of the contracts are recognized as unrealized gains or losses by “marking to market” on a daily basis to reflect the market value of the contracts at the end of each day’s trading. Variation margin payments are received or made depending upon whether unrealized gains or losses are incurred. When the contracts are closed, the Funds recognize a realized gain or loss equal to the difference between the proceeds from, or cost of, the closing transaction and the Funds’ basis in the contract. If the Funds were unable to liquidate a futures contract and/or enter into an offsetting closing transaction, the Funds would continue to be subject to market risk with respect to the value of the contracts and continue to be required to maintain the margin deposits on the futures contracts. The Funds segregate cash having a value at least equal
16
| Spectrum Funds |
| Notes to Financial Statements (Continued) |
| September 30, 2020 |
to the amount of the current obligation under any open futures contract. Risks may exceed amounts recognized in the Statements of Assets and Liabilities. With futures, there is minimal counterparty credit risk to the Funds since futures are exchange traded and the exchange’s clearinghouse, as counterparty to all exchange traded futures, guarantees the futures against default.
Swap Contracts – Each Fund is subject to equity price, credit risk, and interest rate risk in the normal course of pursuing its investment objective. The Funds have entered into various swap transactions for investment purposes or to manage interest rate, equity, or credit risk. These would typically be two -party contracts entered into primarily to exchange the returns (or differentials in rates of returns) typically earned or realized on particular pre-determined investments or instruments.
Standard equity swap contracts are between two parties that agree to exchange the returns (or differentials in rates of return) earned or realized on particular predetermined investments or instruments. The gross amount to be exchanged is calculated with respect to a “notional amount” (i.e. the return on or increase in value of a particular dollar amount invested in a “basket” of securities representing a particular index or industry sector). Most equity swap agreements entered into by a Fund calculate the obligations of the parties on a “net basis”. Consequently, a Fund’s current obligations under a swap agreement generally will be equal to the net amount to be paid or received under the agreement based on the relative value of the positions held by each party. A Fund’s obligations are accrued daily (offset by any amounts owed to a Fund).
The Funds may enter into swap contracts that provide the opposite return of the particular benchmark or security (“short” the index or security). The operations are similar to that of the swaps disclosed above except that the counterparty pays interest to the Fund on the notional amount outstanding and the dividends on the underlying securities reduce the return of the swap. However, in certain instances, market factors such as the interest rate environment and the demand to borrow the securities underlying the swap agreement can cause a scenario in which a Fund pays the counterparty interest. These amounts are netted with any unrealized appreciation or depreciation to determine the value of the swap. The Funds will typically enter into equity swap agreements in instances where the Adviser or Sub-Adviser believes that it may be more cost effective or practical than buying a security or the securities represented by a particular index.
The Funds may enter into credit default swaps (“CDS”) . CDS are typically two-party (bilateral) financial contracts that transfer credit exposure between the two parties. One party to a CDS (referred to as the credit protection “buyer”) receives credit protection or sheds credit risk, whereas the other party to a CDS (referred to as the credit protection “seller”) is selling credit protection or taking on credit risk. The seller typically receives pre-determined periodic payments from the other party. These payments are in consideration for agreeing to make compensating specific payments to the buyer should a negative credit event occur, such as (1) bankruptcy or (2) failure to pay interest or principal on a reference debt instrument, with respect to a specified issuer or one of the reference issuers in a CDS portfolio. In general, CDS may be used by the Funds to obtain credit risk exposure similar to that of a direct investment in high yield bonds. Higher swap spreads generally imply a higher risk of default.
The amounts to be exchanged or “swapped” between parties are calculated with respect to the notional amount. Changes in the value of swap agreements are recognized as unrealized gains or losses in the Statements of Operations by “marking to market” on a daily basis to reflect the value of the swap agreement at the end of each trading day. Payments received or paid at the beginning of the agreement are reflected as such on the Statements of Assets and Liabilities and may be referred to as upfront payments. A liquidation payment received or made at the termination of the swap agreement is recorded as a realized gain or loss on the Statements of Operations. The maximum pay-outs for these contracts are limited to the notional amount of each swap. CDS may involve greater risks than if the Funds had invested in the referenced obligation directly and are subject to general market risk, liquidity risk, counterparty risk and credit risk.
By contrast, certain swap transactions are subject to mandatory central clearing. These swaps are executed through a derivatives clearing member (“DCM”), acting in an agency capacity, and submitted to a central counterparty (“CCP”) (“centrally cleared swaps”), in which case all payments are settled with the CCP through the DCM. Swaps are marked-to-market daily using pricing vendor quotations, counterparty or clearinghouse prices or model prices, and the change in value, if any, is recorded as an unrealized gain or loss. Upon entering into a
17
| Spectrum Funds |
| Notes to Financial Statements (Continued) |
| September 30, 2020 |
swap contract, a Fund is required to satisfy an initial margin requirement by delivering cash or securities to the counterparty (or in some cases, segregated in a triparty account on behalf of the counterparty), which can be adjusted by any mark-to-market gains or losses pursuant to bilateral or centrally cleared arrangements. For centrally cleared swaps the daily change in valuation, if any, is recorded as a receivable or payable for variation margin.
The Funds collateralize swap agreements with cash and certain securities as indicated on the Portfolios of Investments and Statements of Assets and Liabilities of the Funds, respectively. Such collateral is held for the benefit of the counterparty in a segregated account at the Custodian to protect the counterparty against non-payment by the Funds. The Funds do not net collateral. In the event of a default by the counterparty, the Funds will seek return of this collateral and may incur certain costs exercising their rights with respect to the collateral. Amounts expected to be owed by the Funds are regularly collateralized either directly with the Funds or in a segregated account at the Custodian.
A Fund bears the risk of loss of the amount expected to be received under a swap agreement in the event of the default or bankruptcy of a swap agreement counterparty to the extent that posted collateral, if any, is insufficient. The Funds will enter into swap agreements only with large, well-capitalized and established financial institutions. The creditworthiness of each of the firms that is counterparty to a swap agreement is monitored by the Adviser. The financial statements of these counterparties may be available by accessing the SEC’s website, at www.sec.gov.
International Swaps and Derivatives Association, Inc. Master Agreements (“ISDA Master Agreements”) govern OTC financial derivative transactions entered into by the Funds and those counterparties. The ISDA Master Agreements maintain provisions for general obligations, representations, agreements, collateral and events of default or termination. Events of termination include conditions that may entitle counterparties to elect to terminate early and cause settlement of all outstanding transactions under the applicable ISDA Master Agreements. Any election to early terminate could be material to the financial statements.
During the normal course of business, the Funds purchase and sell various financial instruments, which may result in market, credit and liquidity risks, the amount of which is not apparent from the financial statements.
Security Transactions and Related Income – Security transactions are accounted for on trade date. Interest income is recognized on an accrual basis. Discounts are accreted and premiums are amortized on securities purchased over the lives of the respective securities using the effective yield method. Dividend income is recorded on the ex-dividend date. Realized gains or losses from sales of securities are determined by comparing the identified cost of the security lot sold with the net sales proceeds. Foreign withholding tax is recorded as incurred or known, in accordance with the Funds’ understanding of the applicable country’s tax rules and rates.
Dividends and Distributions to Shareholders – Dividends from net investment income, if any, are declared and paid quarterly. Distributable net realized capital gains, if any, are declared and distributed annually in December. Dividends from net investment income and distributions from net realized gains are recorded on ex-dividend date and are determined in accordance with federal income tax regulations, which may differ from GAAP. These “book/tax” differences are considered either temporary (i.e., deferred losses, capital loss carryforwards) or permanent in nature. To the extent these differences are permanent in nature, such amounts are reclassified within the composition of net assets based on their federal tax-basis treatment; temporary differences do not require reclassification. These reclassifications have no effect on net assets, results from operations or net asset value per share of the Funds.
Federal Income Tax – It is each Fund’s policy to continue to qualify as a regulated investment company by complying with the provisions of Subchapter M of the Internal Revenue Code that are applicable to regulated investment companies and to distribute substantially all of its taxable income and net realized gains to shareholders. Therefore, no federal income tax provision is required.
The Funds recognize the tax benefits of uncertain tax positions only where the position is “more likely than not” to be sustained assuming examination by tax authorities. Management has analyzed each Fund’s tax positions, and
18
| Spectrum Funds |
| Notes to Financial Statements (Continued) |
| September 30, 2020 |
has concluded that no liability for unrecognized tax benefits should be recorded related to uncertain tax positions expected to be taken on returns filed for the open tax years 2017 – 2019 or expected to be taken in the Funds’ 2020 tax returns. The Funds identify their major tax jurisdictions as U.S. Federal and foreign jurisdictions where the Funds make significant investments; however, the Funds are not aware of any tax positions for which it is reasonably possible that the total amounts of unrecognized tax benefits will change materially in the next twelve months.
The Funds recognize interest and penalties, if any, related to unrecognized tax benefits as income tax expense in the Statements of Operations. During the period, the Funds did not incur any interest or penalties.
Expenses – Expenses of the Trust that are directly identifiable to a specific Fund are charged to that Fund. Expenses which are not readily identifiable to a specific fund are allocated in such a manner as deemed equitable, taking into consideration the nature and type of expense and the relative sizes of the funds in the Trust.
Indemnification – The Trust indemnifies its officers and trustees for certain liabilities that may arise from the performance of their duties to the Trust. Additionally, in the normal course of business, the Funds enter into contracts that contain a variety of representations and warranties and which provide general indemnities. Each Fund’s maximum exposure under these arrangements is unknown, as this would involve future claims that may be made against the Funds that have not yet occurred. However, based on experience, the risk of loss due to these warranties and indemnities appears to be remote.
| 3. | INVESTMENT TRANSACTIONS |
For the year ended September 30, 2020, cost of purchases and proceeds from sales of portfolio securities, other than short-term investments and derivatives amounted to $333,367,164 and $248,547,419 for the Low Volatility Fund and $52,596,475 and $56,814,919 for the Advisors Preferred Fund.
| 4. | OFFSETTING OF FINANCIAL AND DERIVATIVE ASSETS AND LIABILITIES |
The Funds’ policy is to recognize a gross asset or liability equal to the unrealized gain/(loss) for futures and gross asset or liability equal to unrealized gain/(loss) for swap contracts. During the year ended September 30, 2020, the Funds were subject to a master netting arrangement for the swap contracts. The following table shows additional information regarding the offsetting of assets and liabilities at September 30, 2020.
| Spectrum Low Volatility Fund | ||||||||||||||||||||||||
| Assets: | ||||||||||||||||||||||||
| Gross Amounts Not Offset in the | ||||||||||||||||||||||||
| Statements of Assets & | ||||||||||||||||||||||||
| Gross Amount | Gross Amounts | Net Amounts of | ||||||||||||||||||||||
| Presended in the | Offset in the | Assets Presented | Cash | |||||||||||||||||||||
| Statements of | Statements of | in the Statements of | Financial | Collateral | ||||||||||||||||||||
| Description | Assets | Assets & Liabilities | Assets & Liabilities | Instruments | Received | Net Amount | ||||||||||||||||||
| Swaps Contracts - OTC | $ | 24,598 | $ | — | $ | 24,598 | $ | (24,598 | ) | $ | — | $ | — | |||||||||||
| Liabilities: | Gross Amounts Not Offset in the | |||||||||||||||||||||||
| Statements of Assets & | ||||||||||||||||||||||||
| Net Amounts of | ||||||||||||||||||||||||
| Gross Amount | Gross Amounts | Liabilities | ||||||||||||||||||||||
| Presended in the | Offset in the | Presented in the | Cash | |||||||||||||||||||||
| Statements of | Statements of | Statements of | Financial | Collateral | ||||||||||||||||||||
| Description | Liabilities | Assets & Liabilities | Assets & Liabilities | Instruments | Pledged (1) | Net Amount | ||||||||||||||||||
| Swaps Contracts - OTC | $ | (626,632 | ) | $ | — | $ | (626,632 | ) | $ | 24,598 | $ | 602,034 | $ | — | ||||||||||
| (1) | The amount is limited to the derivative liability balance and accordingly does not include excess collateral pledged. |
19
| Spectrum Funds |
| Notes to Financial Statements (Continued) |
| September 30, 2020 |
| Spectrum Advisors Preferred Fund | ||||||||||||||||||||||||
| Assets: | ||||||||||||||||||||||||
| Gross Amounts Not Offset in the | ||||||||||||||||||||||||
| Statements of Assets & Liabilities | ||||||||||||||||||||||||
| Gross Amounts | ||||||||||||||||||||||||
| Gross Amount | Offset in the | Net Amounts of | ||||||||||||||||||||||
| Presented in the | Statements of | Assets Presented in | ||||||||||||||||||||||
| Statements of | Assets & | the Statements of | Financial | Cash Collateral | ||||||||||||||||||||
| Description | Assets | Liabilities | Assets & Liabilities | Instruments | Received | Net Amount | ||||||||||||||||||
| Futures Contracts | $ | 235,218 | $ | — | $ | 235,218 | $ | — | $ | — | $ | 235,218 | ||||||||||||
| Swaps Contracts - OTC | 239,613 | — | 239,613 | — | — | 239,613 | ||||||||||||||||||
| Total | $ | 474,831 | $ | — | $ | 474,831 | $ | — | $ | — | $ | 474,831 | ||||||||||||
Impact of Derivatives on the Statements of Assets and Liabilities and Statements of Operations
The following is a summary of the location of derivative investments on the Funds’ Statements of Assets and Liabilities as of September 30, 2020:
| Derivative Investment Type | Location on the Statement of Assets and Liabilities | |
| Total Return Swaps | Unrealized appreciation/depreciation on swaps | |
| Futures Contracts (Advisors Preferred Fund) | Unrealized appreciation on futures |
The following table sets forth the fair value of the Funds’ derivative contracts as of September 30, 2020:
| Spectrum Low Volatility Fund | ||||||||
| Asset (Liability) Derivatives Investment Value | ||||||||
| Multiple Risks (Equity, | Total as of | |||||||
| Derivative Investment Type | Interest, and Currency) | September 30, 2020 | ||||||
| Total Return Swaps | $ | (602,034 | ) | $ | (602,034 | ) | ||
| Total | $ | (602,034 | ) | $ | (602,034 | ) | ||
| Spectrum Advisors Preferred Fund | ||||||||
| Asset (Liability) Derivatives Investment Value | ||||||||
| Total as of | ||||||||
| Derivative Investment Type | Equity Risk | September 30, 2020 | ||||||
| Total Return Swaps | $ | 239,613 | $ | 239,613 | ||||
| Futures Contracts * | 235,218 | 235,218 | ||||||
| Total | $ | 474,831 | $ | 474,831 | ||||
| * | Represents cumulative appreciation (depreciation) on futures contracts as reported in the Portfolios of Investments. |
The following is a summary of the location of derivative investments on the Funds’ Statements of Operations for the year ended September 30, 2020:
| Derivative Investment Type | Location of Gain/Loss on Derivative | |
| Swaps/Futures | Net realized gain (loss) from Swaps | |
| Net realized gain from Futures | ||
| Net change in unrealized appreciation (depreciation) on Swaps | ||
| Net change in unrealized appreciation on Futures |
20
| Spectrum Funds |
| Notes to Financial Statements (Continued) |
| September 30, 2020 |
The following is a summary of the Funds’ realized gain/(loss) on derivative investments recognized in the Statements of Operations categorized by primary risk exposure for the year ended September 30, 2020:
| Spectrum Low Volatility Fund | ||||||||||||||||
| Realized gain on derivatives recognized in the Statements of Operations | ||||||||||||||||
| Total for the | ||||||||||||||||
| Year Ended | ||||||||||||||||
| Derivative Investment Type | Interest Rate Risk | Commodity Risk | Equity Risk | September 30, 2020 | ||||||||||||
| Swaps | $ | 10,875,443 | $ | — | $ | (1,863,661 | ) | $ | 9,011,782 | |||||||
| Futures | 324,313 | (137,499 | ) | (5,763 | ) | 181,051 | ||||||||||
| Total | $ | 11,199,756 | $ | (137,499 | ) | $ | (1,869,424 | ) | $ | 9,192,833 | ||||||
| Changes in unrealized depreciation on derivatives recognized in the Statements of Operations | ||||||||||||||||
| Multiple Risks (Credit, | Total for the | |||||||||||||||
| Equity, Interest, and | Year Ended | |||||||||||||||
| Derivative Investment Type | Interest Rate Risk | Currency) | September 30, 2020 | |||||||||||||
| Swaps | $ | — | $ | (626,328 | ) | $ | (626,328 | ) | ||||||||
| Total | $ | — | $ | (626,328 | ) | $ | (626,328 | ) | ||||||||
| Spectrum Advisors Preferred Fund | ||||||||||||||||
| Realized gain/(loss) on derivatives recognized in the Statements of Operations | ||||||||||||||||
| Total for the | ||||||||||||||||
| Year Ended | ||||||||||||||||
| Derivative Investment Type | Interest Rate Risk | Equity Risk | September 30, 2020 | |||||||||||||
| Swaps | $ | — | $ | (29,947 | ) | $ | (29,947 | ) | ||||||||
| Futures | 51,834 | 897,443 | 949,277 | |||||||||||||
| Total | $ | 51,834 | $ | 867,496 | $ | 919,330 | ||||||||||
| Changes in unrealized appreciation/(depreciation) on derivatives recognized in the Statements of Operations | ||||||||||||||||
| Multiple Risks (Equity, | Total for the | |||||||||||||||
| Interest, and | Year Ended | |||||||||||||||
| Derivative Investment Type | Currency) | Equity Risk | September 30, 2020 | |||||||||||||
| Swaps | $ | 233,981 | $ | — | $ | 233,981 | ||||||||||
| Futures | — | 248,638 | 248,638 | |||||||||||||
| Total | $ | 233,981 | $ | 248,638 | $ | 482,619 | ||||||||||
The notional value of the derivative instruments outstanding as of September 30, 2020 as disclosed in the Portfolios of Investments and the amounts realized and changes in unrealized gains and losses on derivative instruments during the year or period as disclosed above and within the Statements of Operations serve as indicators of the volume of derivative activity for the Funds.
Market Risk: Market risk is the risk that changes in interest rates, foreign exchange rates or equity prices will affect the positions held by the Funds. The Funds are exposed to market risk on financial instruments that are valued at market prices as disclosed in the Portfolios of Investments. The prices of derivative instruments, including swaps and futures prices, can be highly volatile. Price movements of derivative contracts in which the Funds’ assets may be invested are influenced by, among other things, interest rates, changing supply and demand relationships, trade, fiscal, monetary and exchange control programs and policies of governments, and national and international political and economic events and policies. The Funds are exposed to market risk on derivative contracts in that the Funds may not be able to readily dispose of its holdings when it chooses and also that the price obtained on disposal is below that at which the investment is included in Funds’ financial statements. All financial instruments are recognized at fair value, and all changes in market conditions directly affect net income. A Fund’s investments in derivative instruments are exposed to market risk and are disclosed in the portfolio of investments.
21
| Spectrum Funds |
| Notes to Financial Statements (Continued) |
| September 30, 2020 |
Unexpected local, regional or global events, such as war; acts of terrorism; financial, political or social disruptions; natural, environmental or man-made disasters; the spread of infectious illnesses or other public health issues; and recessions and depressions could have a significant impact on the Funds and their investments and may impair market liquidity. Such events can cause investor fear, which can adversely affect the economies of nations, regions and the market in general, in ways that cannot necessarily be foreseen. An outbreak of infectious respiratory illness known as COVID-19, which is caused by a novel coronavirus (SARS-CoV-2), was first detected in China in December 2019 and subsequently spread globally. This coronavirus has resulted in, among other things, travel restrictions, closed international borders, enhanced health screenings at ports of entry and elsewhere, disruption of and delays in healthcare service preparation and delivery, prolonged quarantines, significant disruptions to business operations, market closures, cancellations and restrictions, supply chain disruptions, lower consumer demand, and significant volatility and declines in global financial markets, as well as general concern and uncertainty. The impact of COVID-19 has adversely affected, and other infectious illness outbreaks that may arise in the future could adversely affect, the economies of many nations and the entire global economy, individual issuers and capital markets in ways that cannot necessarily be foreseen. Public health crises caused by the COVID-19 outbreak may exacerbate other pre-existing political, social and economic risks in certain countries or globally. The duration of the COVID-19 outbreak and its effects cannot be determined with certainty.
Counterparty Risk: The Funds invest in derivative instruments (the “Product”) issued for the Funds by Credit Suisse Securities (Europe) Limited, Credit Suisse Securities (USA) LLC (“Credit Suisse”) and Barclays Capital, Inc. (“Barclays”). If Credit Suisse or Barclays become insolvent, each may not be able to make any payments under the Product and a Fund may lose their capital invested in the Product. A decline in Credit Suisse’s or Barclays’ financial standing is likely to reduce the market value of the Product and therefore the price a Fund may receive for the Product if sold it in the market.
Liquidity Risk: Liquidity risk is the risk that a Fund will encounter difficulty in raising funds to meet commitments. Liquidity risk may result in an inability to sell investments quickly at close to fair value. The Funds’ financial instruments include investments in securities which are not traded on organized public exchanges and which generally may be illiquid. As a result, the Funds may not be able to quickly liquidate its investments in these instruments at an amount close to its fair value in order to meet its liquidity requirements. The Funds do not anticipate any material losses as a result of liquidity risk.
| 5. | INVESTMENT ADVISORY AGREEMENT AND TRANSACTIONS WITH RELATED PARTIES |
The business activities of the Funds are overseen by the Board, which is responsible for the overall management of the Funds. Advisors Preferred, LLC, serves as investment adviser to the Funds. The Adviser has engaged Spectrum Financial, Inc. to serve as the sub-adviser to the Funds. These expenses are the responsibility of the Adviser.
Pursuant to an advisory agreement with the Funds, the Adviser, under the oversight of the Board, directs the daily operations of the Funds and supervises the performance of administrative and professional services provided by others. As compensation for its services and the related expenses borne by the Adviser, the Funds pay the Adviser computed and accrued daily and paid monthly at an annual rate of 2.15% for Spectrum Low Volatility Fund and 1.50% for the Spectrum Advisors Preferred Fund of the average daily net assets. The Adviser, not the Fund, pays the Sub-Adviser. Pursuant to the advisory agreement, the Advisor earned $2,482,830 and $196,646 for Spectrum Low Volatility Fund and Spectrum Advisors Preferred Fund, respectively, in advisory fees for the year ended September 30, 2020.
Gemini Fund Services, LLC (“GFS”), provides administration, fund accounting, and transfer agent services to the Trust. Pursuant to a separate servicing agreement with GFS, the Funds pay GFS customary fees for providing administration, fund accounting and transfer agency services to the Funds. Under the terms of the Funds’
22
| Spectrum Funds |
| Notes to Financial Statements (Continued) |
| September 30, 2020 |
agreement with GFS, GFS pays for certain operating expenses of the Funds. Certain officers of the Trust are also officers of GFS, and are not paid any fees directly by the Funds for serving in such capacities.
In addition, certain affiliates of GFS provide ancillary services to the Funds as follows:
Blu Giant, LLC (“Blu Giant”) Blu Giant, an affiliate of GFS, provides EDGAR conversion and filing services as well as print management services for the Funds on an ad-hoc basis. These expenses are the responsibility of GFS.
The Funds pay Ceros Financial Services Inc. (the “Distributor”) to provide compensation for ongoing servicing related activities or services and/or maintenance of the Investor Class accounts, not otherwise required to be provided by the Adviser. For the year ended September 30, 2020, the Funds paid $34,662 and $3,923 for Spectrum Low Volatility Fund and Spectrum Advisors Preferred Fund, respectively, which was paid out to brokers and dealers.
During the year ended September 30, 2020, Ceros Financial Services, Inc. (“Ceros”), a registered broker/dealer and an affiliate of the Adviser, executed trades on behalf of the Funds. Spectrum Low Volatility Fund and Spectrum Advisor Preferred Fund paid trade commissions of $1,776 and $9,598 to Ceros, respectively. Any 12b-1 fees received by Ceros related to a Fund’s investment in another Fund are returned to the respective Fund.
Each Trustee who is not an “interested person” of the Trust or Adviser is compensated at a rate of $30,000 per year as well as reimbursement for any reasonable expenses incurred attending the meetings, paid quarterly. The “interested persons” who serve as Trustees of the Trust receive no compensation for their services as Trustees. None of the executive officers receive compensation from the Trust. Interested Trustees of the Trust are also officers or employees of the Adviser and its affiliates. Trustee fees are not borne by the Funds, but by the Adviser.
| 6. | AGGREGATE UNREALIZED APPRECIATION AND DEPRECIATION – TAX BASIS |
The identified cost of investments in securities owned by each Fund for federal income tax purposes excluding futures and swaps, and its respective gross unrealized appreciation and depreciation at September 30, 2020, were as follows:
| Gross Unrealized | Gross Unrealized | Net Unrealized | ||||||||||||||
| Tax Cost | Appreciation | (Depreciation) | Appreciation | |||||||||||||
| Spectrum Low Volatility Fund | $ | 213,636,826 | $ | 5,296,772 | $ | (547,480 | ) | $ | 4,749,292 | |||||||
| Spectrum Advisors Preferred Fund | 11,208,301 | 180,333 | (11,556 | ) | 168,777 | |||||||||||
23
| Spectrum Funds |
| Notes to Financial Statements (Continued) |
| September 30, 2020 |
| 7. | DISTRIBUTION TO SHAREHOLDERS AND TAX COMPONENTS OF CAPITAL |
The tax character of fund distributions paid for the years ended September 30, 2020 and September 30, 2019 were as follows:
| For the year ended September 30, 2020: | ||||||||||||||||||||
| Ordinary | Long-Term | Return | Tax-Exempt | |||||||||||||||||
| Portfolio | Income | Capital Gains | of Capital | Income | Total | |||||||||||||||
| Spectrum Low Volatility Fund | $ | 3,981,333 | $ | 989,623 | $ | — | $ | — | $ | 4,970,956 | ||||||||||
| Spectrum Advisors Preferred Fund | 83,676 | 234,581 | — | — | 318,257 | |||||||||||||||
| For the year ended September 30, 2019: | ||||||||||||||||||||
| Ordinary | Long-Term | Return | ||||||||||||||||||
| Portfolio | Income | Capital Gains | of Capital | Total | ||||||||||||||||
| Spectrum Low Volatility Fund | $ | 2,246,066 | $ | — | $ | — | $ | 2,246,066 | ||||||||||||
| Spectrum Advisors Preferred Fund | 15,961 | 285,824 | 92,632 | $ | 394,417 | |||||||||||||||
Tax equalization allows a Fund to treat as distribution that portion of redemption proceeds representing a redeeming shareholder’s portion of undistributed taxable and net capital gains. The Spectrum Low Volatility Fund and Spectrum Advisors Preferred Fund utilized equalization in the amount of $1,690,411 and $234,581, respectively, which resulted in a difference between tax distributions and book distributions as disclosed on the Statement of Changes for the year ended September 30, 2020. Net investment income and net realized gains (losses), as disclosed on the Statements of Operations and net assets were not affected by these reclassifications.
As of September 30, 2020, the components of accumulated earnings/(deficit) on a tax basis were as follows:
| Undistributed | Undistributed | Undistributed | Post October Loss | Capital Loss | Other | Unrealized | Total | |||||||||||||||||||||||||
| Ordinary | Ordinary | Long-Term | and | Carry | Book/Tax | Appreciation/ | Accumulated | |||||||||||||||||||||||||
| Portfolio | Tax-Exempt Income | Income | Capital Gains | Late Year Loss | Forwards | Differences | (Depreciation) | Earnings/(Deficits) | ||||||||||||||||||||||||
| Spectrum Low Volatility Fund | $ | — | $ | 10,637,580 | $ | — | $ | — | $ | — | $ | — | $ | 4,749,292 | $ | 15,386,872 | ||||||||||||||||
| Spectrum Advisors Preferred Fund | — | 950,194 | 1,622,110 | — | — | — | 168,777 | 2,741,081 | ||||||||||||||||||||||||
The difference between book basis and tax basis undistributed net investment income/(loss), accumulated net realized gain/(loss), and unrealized appreciation/(depreciation) from investments is primarily attributable to the tax deferral of losses on wash sales, mark-to-market on open swap contracts and open Section 1256 contracts.
At September 30, 2020, the Spectrum Advisors Preferred Fund utilized capital loss carryforwards of $274,474.
Permanent book and tax differences, primarily attributable to the book/tax basis treatment of equalization credits, resulted in reclassification for the year ended September 30, 2020 as follows:
| Paid | ||||||||
| In | Accumulated | |||||||
| Portfolio | Capital | Earnings (Losses) | ||||||
| Spectrum Low Volatility Fund | $ | 1,690,411 | $ | (1,690,411 | ) | |||
| Spectrum Advisors Preferred Fund | 234,507 | (234,507 | ) | |||||
| 8. | CONTROL OWNERSHIP |
The beneficial ownership, either directly or indirectly, of more than 25% of the voting securities of a fund creates presumption of control of the fund pursuant to Section 2(a)(9) of the 1940 Act. As of September 30, 2020, National Financial Services LLC held approximately 48% of the Spectrum Low Volatility Fund and 96% of the Spectrum Advisors Preferred Fund.
24
| Spectrum Funds |
| Notes to Financial Statements (Continued) |
| September 30, 2020 |
| 9. | UNDERLYING INVESTMENT IN OTHER INVESTMENT COMPANIES |
The Advisors Preferred Fund currently invests a portion of its assets in Fidelity Investments Money Market Funds – Government Portfolio (“Fidelity”) and First American Government Obligations Fund (“First American”). The Advisors Preferred Fund may redeem its investment at any time if the Adviser or Sub-Adviser determines that it is in the best interest of the Advisors Preferred Fund and its shareholders to do so.
The performance of the Advisors Preferred Fund will be directly affected by the performance of Fidelity and First American. The financial statements of Fidelity and First American, including the portfolio of investments, can be found at the Securities and Exchange Commission’s website www.sec.gov and should be read in conjunction with the Advisors Preferred Fund’s financial statements. As of September 30, 2020, the percentage of the Low Volatility Fund’s net assets invested in Fidelity was 40.74% and Advisors Preferred Fund’s net assets invested in Fidelity and First American was 25.68% and 25.67% respectively.
| 10. | SUBSEQUENT EVENTS |
Subsequent events after the date of the Statements of Assets and Liabilities have been evaluated through the date the financial statements were issued. Management has determined that no events or transactions occurred requiring adjustment or disclosure in the financial statements.
25

REPORT OF INDEPENDENT REGISTERED PUBLIC ACCOUNTING FIRM
To the Shareholders of Spectrum Low Volatility Fund and Spectrum Advisors Preferred Fund and
Board of Trustees of Advisors Preferred Trust
Opinion on the Financial Statements
We have audited the accompanying statements of assets and liabilities, including the portfolios of investments, of Spectrum Low Volatility Fund and Spectrum Advisors Preferred Fund (the “Funds”), each a series of Advisors Preferred Trust, as of September 30, 2020, and the related statements of operations for the year then ended, the statements of changes in net assets for each of the two years in the period then ended, including the related notes, and the financial highlights for each of the five years in the period then ended (collectively referred to as the “financial statements”). In our opinion, the financial statements present fairly, in all material respects, the financial position of each of the Funds as of September 30, 2020, the results of their operations for the year then ended, the changes in their net assets for each of the two years in the period then ended, and the financial highlights for each of the five years in the period then ended, in conformity with accounting principles generally accepted in the United States of America.
Basis for Opinion
These financial statements are the responsibility of the Funds’ management. Our responsibility is to express an opinion on the Funds’ financial statements based on our audits. We are a public accounting firm registered with the Public Company Accounting Oversight Board (United States) (“PCAOB”) and are required to be independent with respect to the Funds in accordance with the U.S. federal securities laws and the applicable rules and regulations of the Securities and Exchange Commission and the PCAOB.
We conducted our audits in accordance with the standards of the PCAOB. Those standards require that we plan and perform the audits to obtain reasonable assurance about whether the financial statements are free of material misstatement whether due to error or fraud.
Our audits included performing procedures to assess the risks of material misstatement of the financial statements, whether due to error or fraud, and performing procedures that respond to those risks. Such procedures included examining, on a test basis, evidence regarding the amounts and disclosures in the financial statements. Our procedures included confirmation of securities owned as of September 30, 2020, by correspondence with the custodian and brokers. Our audits also included evaluating the accounting principles used and significant estimates made by management, as well as evaluating the overall presentation of the financial statements. We believe that our audits provide a reasonable basis for our opinion.
We have served as the auditor of one or more investment companies advised by Advisors Preferred, LLC since 2012.

COHEN & COMPANY, LTD.
Chicago, Illinois
November 24, 2020
C O H E N & C O M P A N Y , L T D .
800.229.1099 | 866.818.4535 fax | cohencpa.com
Registered with the Public Company Accounting Oversight Board
26
Spectrum Funds |
| Expense Example (Unaudited) |
| September 30, 2020 |
As a shareholder of Spectrum Funds, you incur ongoing costs, including management fees; service fees; and other Fund expenses. This example is intended to help you understand your ongoing costs (in dollars) of investing in the Funds and to compare these costs with the ongoing costs of investing in other mutual funds.
The example is based on an investment of $1,000 invested at the beginning of the period and held for the entire period from April 1, 2020 through September 30, 2020.
Table 1. Actual Expenses
The “Actual Expenses” line in the table below provides information about actual account values and actual expenses. You may use the information below; together with the amount you invested, to estimate the expenses that you paid over the period. Simply divide your account value by $1,000 (for example, an $8,600 account value divided by $1,000 = 8.6), then multiply the result by the number in the table under the heading entitled “Expenses Paid During Period” to estimate the expenses you paid on your account during this period.
Table 2. Hypothetical Example for Comparison Purposes
The “Hypothetical” line in the table below provides information about hypothetical account values and hypothetical expenses based on the Funds’ actual expense ratio and an assumed rate of return of 5% per year before expenses, which is not the Funds’ actual return. The hypothetical account values and expenses may not be used to estimate the actual ending account balances or expenses you paid for the period. You may use this information to compare this 5% hypothetical example with the 5% hypothetical examples that appear in the shareholder reports of other funds.
Please note that the expenses shown in the table are meant to highlight your ongoing costs. Therefore, the table is useful in comparing ongoing costs only, and will not help you determine the relative total costs of owning different funds. In addition, if these transactional costs were included, your costs would have been higher.
| Actual Expenses | Annualized Expense Ratio | Beginning Account 4/1/2020 | Ending Account 9/30/2020 | Expenses Paid During Period * 4/1/2020-9/30/2020 |
| Spectrum Low Volatility Fund | 2.50% | $1,000.00 | $1,146.60 | $13.42 |
| Spectrum Advisors Preferred Fund | 1.94% | $1,000.00 | $1,229.40 | $10.81 |
| Hypothetical (5% return before expenses) | Annualized Expense Ratio | Beginning Account 4/1/2020 | Ending Account 9/30/2020 | Expenses Paid During Period * 4/1/2020-9/30/2020 |
| Spectrum Low Volatility Fund | 2.50% | $1,000.00 | $1,012.50 | $12.58 |
| Spectrum Advisors Preferred Fund | 1.94% | $1,000.00 | $1,015.30 | $9.77 |
| * | Expenses are equal to the average account value over the period, multiplied by the Fund’s annualized expense ratio, multiplied by the number of days in the period (183) divided by the numbers of days in the fiscal year (366). |
27
| Spectrum Funds |
| SUPPLEMENTAL INFORMATION (Unaudited) |
| September 30, 2020 |
Independent Trustees
The following table provides information regarding each Trustee who is not an “interested person” of the Trust, as defined in the 1940 Act.
| Name, Address 1 and Year of Birth | Position(s) Held with the Trust | Term of Office/Length of Time Served | Principal Occupation(s) During Past 5 Years | Number of Portfolios in Fund Complex Overseen by Trustee 2 | Other Directorships Held by Trustee |
| Charles R. Ranson Born: 1947 | Trustee | Indefinite, since November 2012 | Principal, Ranson & Associates (business consultancy) (since 2003); | 15 | Northern Lights Fund Trust IV (since July 2015) |
| Felix Rivera Born: 1963 | Trustee | Indefinite, since November 2012 | Managing Partner, Independent Channel Advisors, LLC (Consultancy Practice), (since January 2011) | 15 | Centerstone Investors Trust (since 2016) |
| David Feldman Born: 1963 | Trustee | Indefinite, Since September 2017 | Independent Consultant (since January 2015); Head of Intermediary Sales, Baron Capital Inc., (February 2010 to December 2014) | 15 | None |
| 1 | Unless otherwise specified, the mailing address of each Trustee is Advisors Preferred Trust, 1445 Research Blvd, Suite 530, Rockville, MD 20850. |
| 2 | The “Fund Complex” consists of the series of the Trust. |
AP 9/30/20 v2
28
| Spectrum Funds |
| SUPPLEMENTAL INFORMATION (Unaudited) (Continued) |
| September 30, 2020 |
Interested Trustees and Officers
The following table provides information regarding each Trustee who is an “interested person” of the Trust, as defined in the 1940 Act, and each officer of the Trust.
| Name, Address 1 And Year of Birth | Position(s) Held with the Fund | Term of Office/ Length of Time Served | Principal Occupation(s) During Past 5 Years | Number of Portfolios in Fund Complex Overseen by Trustee 2 | Other Directorships Held by Trustee |
| Catherine Ayers-Rigsby Born: 1948 | Trustee, Chairman, President | Indefinite; since November 2012 | CEO, Advisors Preferred, LLC (since June 2011); President, Ceros Financial Services, Inc., (since August 2009); CEO, AtCap Partners, LLC (since July 2011) | 15 | None |
| Brian S. Humphrey Born: 1972 | Trustee | Indefinite; since November 2012 | Managing Director, Marketing, Ceros Financial Services, Inc., (since January 2011) | 15 | None |
| Christine Casares Born: 1975 | Treasurer | Indefinite; Since May 2019 | Vice President, Tax Administration, Ultimus Fund Solutions (since February 2016); Assistant Vice President, Tax Administration (February 2012 January 2016) | N/A | N/A |
| Angela Holland Born 1970 | Chief Compliance Officer | Indefinite; since July 1, 2020 | Chief Compliance Officer, Ceros Financial Services, Inc. (since January 2016; Sales Supervisor /AML Compliance Officer, Ceros Financial Services, Inc. (April 2012 – January 2016); Compliance Manager, Advisors Preferred, LLC and AtCap Partners, LLC (since April 2012) | N/A | N/A |
| Richard Malinowski Born: 1983 | Secretary | Indefinite; since November 2012 | Senior Vice President and Senior Managing Counsel, Ultimus Fund Services, LLC; (since February 2020); Senior Vice President, Legal Administration, Ultimus Fund Solutions, LLC (February 2017-January 2019); Vice President and Counsel (April 2016–2017): and AVP and Staff Attorney (September 2012 – March.2016) | N/A | N/A |
| 1 | Unless otherwise specified, the mailing address of each Trustee is Advisors Preferred Trust, 1445 Research Blvd, Suite 530, Rockville, MD 20850. |
| 2 | The “Fund Complex” consists of the series of the Trust. |
The Funds’ Statement of Additional Information includes additional information about the Trustees and is available free of charge by calling toll- free 1-866-862-9686.
AP 9/30/20 v2
29
PRIVACY NOTICE
Rev. May 2014
| FACTS | WHAT DOES ADVISORS PREFERRED TRUST DO WITH YOUR PERSONAL INFORMATION? | |||
| Why? | Financial companies choose how they share your personal information. Federal law gives consumers the right to limit some but not all sharing. Federal law also requires us to tell you how we collect, share, and protect your personal information. Please read this notice carefully to understand what we do. | |||
| What? | The types of personal information we collect and share depend on the product or service you have with us. This information can include: | |||
| ■ | Social Security number | ■ | Purchase History | |
| ■ | Assets | ■ | Account Balances | |
| ■ | Retirement Assets | ■ | Account Transactions | |
| ■ | Transaction History | ■ | Wire Transfer Instructions | |
| ■ | Checking Account Information | |||
| When you are no longer our customer, we continue to share your information as described in this notice. | ||||
| How? | All financial companies need to share customers’ personal information to run their everyday business. In the section below, we list the reasons financial companies can share their customers’ personal information; the reasons Advisors Preferred Trust chooses to share; and whether you can limit this sharing. | |||
| Reasons we can share your personal information | Does Advisors Preferred Trust share? | Can you limit this sharing? |
For our everyday business purposes – such as to process your transactions, maintain your account(s), respond to court orders and legal investigations, or report to credit bureaus | Yes | No |
For our marketing purposes – to offer our products and services to you | No | We don’t share |
| For joint marketing with other financial companies | No | We don’t share |
For our affiliates’ everyday business purposes – information about your transactions and experiences | No | We don’t share |
For our affiliates’ everyday business purposes – information about your creditworthiness | No | We don’t share |
| For nonaffiliates to market to you | No | We don’t share |
| Questions? | Call 1-866-862-9686 | ||||
30
| Who we are | |||||
Who is providing this notice?
| Advisors Preferred Trust | ||||
| What we do | |||||
| How does Advisors Preferred Trust protect my personal information? | To protect your personal information from unauthorized access and use, we use security measures that comply with federal law. These measures include computer safeguards and secured files and buildings.
Our service providers are held accountable for adhering to strict policies and procedures to prevent any misuse of your nonpublic personal information. | ||||
| How does Advisors Preferred Trust collect my personal information? | We collect your personal information, for example, when you
■ Open an account
■ Provide account information
■ Give us your contact information
■ Make deposits or withdrawals from your account
■ Make a wire transfer
■ Tell us where to send the money
■ Tells us who receives the money
■ Show your government-issued ID
■ Show your driver’s license
We also collect your personal information from other companies. | ||||
| Why can’t I limit all sharing? | Federal law gives you the right to limit only ■ Sharing for affiliates’ everyday business purposes – information about your creditworthiness ■ Affiliates from using your information to market to you
■ Sharing for nonaffiliates to market to you
State laws and individual companies may give you additional rights to limit sharing. | ||||
| Definitions | |||||
| Affiliates | Companies related by common ownership or control. They can be financial and nonfinancial companies.
■ Advisors Preferred Trust does not share with our affiliates. | ||||
| Nonaffiliates | Companies not related by common ownership or control. They can be financial and nonfinancial companies. ■ Advisors Preferred Trust does not share with nonaffiliates so they can market to you. | ||||
| Joint marketing | A formal agreement between nonaffiliated financial companies that together market financial products or services to you.
■ Advisors Preferred Trust doesn’t jointly market. | ||||
31
PROXY VOTING POLICY
Information regarding how the Funds voted proxies relating to portfolio securities for the most recent twelve month period ended June 30 as well as a description of the policies and procedures that the Fund use to determine how to vote proxies will be available without charge, upon request, by calling 1-866-862-9686 or by referring to the Securities and Exchange Commission’s (“SEC”) website at http://www.sec.gov.
PORTFOLIO HOLDINGS
The Fund files its complete schedule of portfolio holdings with the SEC for the first and third quarters of each fiscal year as an exhibit to its reports on Form N-PORT, within sixty days after the end of the period. Form N-PORT reports are available on the SEC’s website at http://www.sec.gov. The information on Form N-PORT is available without charge, upon request, by calling 1-866-862-9686.
| INVESTMENT ADVISOR |
| Advisors Preferred LLC |
| 1445 Research Blvd., Suite 530 |
| Rockville, Maryland 20850 |
| INVESTMENT SUB-ADVISOR |
| Spectrum Financial, Inc. |
| 2940 N. Lynnhaven Rd. Suite 200 |
| Virginia Beach, VA 23452 |
| ADMINISTRATOR |
| Gemini Fund Services, LLC |
| 80 Arkay Drive, Suite 110 |
| Hauppauge, New York 11788 |
Item 2. Code of Ethics.
(a) As of the end of the period covered by this report, the registrant has adopted a code of ethics that applies to the registrant's principal Principal Executive Officer, principal Principal Financial Officer, principal accounting officer or controller, or persons performing similar functions, regardless of whether these individuals are employed by the registrant or a third party.
(b) For purposes of this item, “code of ethics” means written standards that are reasonably designed to deter wrongdoing and to promote:
| (1) | Honest and ethical conduct, including the ethical handling of actual or apparent conflicts of interest between personal and professional relationships; |
| (2) | Full, fair, accurate, timely, and understandable disclosure in reports and documents that a registrant files with, or submits to, the Commission and in other public communications made by the registrant; |
| (3) | Compliance with applicable governmental laws, rules, and regulations; |
| (4) | The prompt internal reporting of violations of the code to an appropriate person or persons identified in the code; and |
| (5) | Accountability for adherence to the code. |
(c) Amendments: During the period covered by the report, there have not been any amendments to the provisions of the code of ethics.
(d) Waivers: During the period covered by the report, the registrant has not granted any express or implicit waivers from the provisions of the code of ethics.
(e) The Code of Ethics is not posted on Registrant’ website.
(f) A copy of the Code of Ethics is attached as an exhibit.
Item 3. Audit Committee Financial Expert.
| (a) | The Registrant’s board of trustees has determined that Felix Rivera is an audit committee financial expert, as defined in Item 3 of Form N-CSR. Mr. Rivera is independent for purposes of this Item 3. |
Item 4. Principal Accountant Fees and Services.
| (a) | Audit Fees |
2020 - $29,400
2019 - $29,400
| (b) | Audit-Related Fees |
2020 - $0
2019 - $0
| (c) | Tax Fees |
2020 - $6,300
2019 - $6,300
Preparation of Federal & State income tax returns, assistance with calculation of required income, capital gain and excise distributions and preparation of Federal excise tax returns.
| (d) | All Other Fees |
2020 - None
2019 - None
| (e) | (1) Audit Committee’s Pre-Approval Policies |
The registrant’s Audit Committee is required to pre-approve all audit services and, when appropriate, any non-audit services (including audit-related, tax and all other services) to the registrant. The registrant’s Audit Committee also is required to pre-approve, when appropriate, any non-audit services (including audit-related, tax and all other services) to its adviser, or any entity controlling, controlled by or under common control with the adviser that provides ongoing services to the registrant, to the extent that the services may be determined to have an impact on the operations or financial reporting of the registrant. Services are reviewed on an engagement by engagement basis by the Audit Committee.
| (2) | Percentages of Services Approved by the Audit Committee |
| 2020 | 2019 | |||||||
| Audit-Related Fees: | 100 | % | 100 | % | ||||
| Tax Fees: | 100 | % | 100 | % | ||||
| All Other Fees: | 100 | % | 100 | % | ||||
| (f) | During the audit of registrant's financial statements for the most recent fiscal year, less than 50 percent of the hours expended on the principal accountant's engagement were attributed to work performed by persons other than the principal accountant's full-time, permanent employees. |
| (g) | The aggregate non-audit fees billed by the registrant's accountant for services rendered to the registrant, and rendered to the registrant's investment adviser (not including any sub-adviser whose role is primarily portfolio management and is subcontracted with or overseen by another investment adviser), and any entity controlling, controlled by, or under common control with the adviser that provides ongoing services to the registrant: |
2020 - $6,300
2019 - $6,300
(h) The registrant's audit committee has considered whether the provision of non-audit services to the registrant's investment adviser (not including any sub-adviser whose role is primarily portfolio management and is subcontracted with or overseen by another investment adviser), and any entity controlling, controlled by, or under common control with the investment adviser that provides ongoing services to the registrant, that were not pre-approved pursuant to paragraph (c)(7)(ii) of Rule 2-01 of Regulation S-X, is compatible with maintaining the principal accountant's independence.
Item 5. Audit Committee of Listed Companies. Not applicable to open-end investment companies.
Item 6. Schedule of Investments. Schedule of investments in securities of unaffiliated issuers is included under Item 1.
Item 7. Disclosure of Proxy Voting Policies and Procedures for Closed-End Funds. Not applicable to open-end investment companies.
Item 8. Portfolio Managers of Closed-End Management Investment Companies. Not applicable to open-end investment companies.
Item 9. Purchases of Equity Securities by Closed-End Funds. Not applicable to open-end investment companies.
Item 10. Submission of Matters to a Vote of Security Holders. Vote of security holders is included under item 1.
Item 11. Controls and Procedures.
(a) Based on an evaluation of the Registrant’s disclosure controls and procedures as of a date within 90 days of filing date of this Form N-CSR, the principal Principal Executive Officer and principal Principal Financial Officer of the Registrant have concluded that the disclosure controls and procedures of the Registrant are reasonably designed to ensure that the information required in filings on Form N-CSR is recorded, processed, summarized, and reported by the filing date, including that information required to be disclosed is accumulated and communicated to the Registrant’s management, including the Registrant’s principal Principal Executive Officer and principal Principal Financial Officer, as appropriate to allow timely decisions regarding required disclosure.
(b) There were no significant changes in the Registrant’s internal control over financial reporting that occurred during the Registrant’s last fiscal half-year that have materially affected, or are reasonably likely to materially affect, the Registrant’s internal control over financial reporting.
Item 12. Disclosure of Securities Lending Activities for Closed-End Management Investment Companies. Not applicable.
Item 13. Exhibits.
(a)(1) Code of Ethics filed herewith.
(a)(3) Not applicable for open-end investment companies.
SIGNATURES
Pursuant to the requirements of the Securities Exchange Act of 1934 and the Investment Company Act of 1940, the registrant has duly caused this report to be signed on its behalf by the undersigned, thereunto duly authorized.
(Registrant) Advisors Preferred Trust
By (Signature and Title)
/s/ Catherine Ayer-Rigsby
Catherine Ayer-Rigsby, Principal Executive Officer
Date 12/3/20
Pursuant to the requirements of the Securities Exchange Act of 1934 and the Investment Company Act of 1940, this report has been signed below by the following persons on behalf of the registrant and in the capacities and on the dates indicated.
By (Signature and Title)
/s/ Catherine Ayer-Rigsby
Catherine Ayers-Rigsby, Principal Executive Officer
Date 12/3/20
By (Signature and Title)
/s/Christine Casares
Christine Casares, Principal Financial Officer
Date 12/3/20