united states
securities and exchange commission
washington, d.c. 20549
form n-csr
certified shareholder report of registered management
investment companies
Investment Company Act file number 811-22756
Advisors Preferred Trust
(Exact name of registrant as specified in charter)
225 Pictoria Drive, Suite 450, Cincinnati, OH 45246
(Address of principal executive offices) (Zip code)
Richard Malinowski, Gemini Fund Services, LLC
4221 North 203rd Street, Suite 100, Elkhorn, NE 68022
(Name and address of agent for service)
Registrant's telephone number, including area code: 631-470-2734
Date of fiscal year end: 6/30
Date of reporting period: 6/30/21
Item 1. Reports to Stockholders.

| Annual Report | |
| June 30, 2021 | |
| Quantified Managed Income Fund | Quantified Market Leaders Fund |
| Investor Class Shares QBDSX | Investor Class Shares QMLFX |
| Advisor Class Shares QBDAX | Advisor Class Shares QMLAX |
| Quantified Alternative Investment Fund | Quantified STF Fund |
| Investor Class Shares QALTX | Investor Class Shares QSTFX |
| Advisor Class Shares QALAX | Advisor Class Shares QSTAX |
| Quantified Pattern Recognition Fund | Quantified Tactical Fixed Income Fund |
| Investor Class Share QSPMX | Investor Class Shares QFITX |
| Quantified Evolution Plus Fund | Quantified Common Ground Fund |
| Investor Class Shares QEVOX | Investor Class Shares QCGDX |
| Quantified Tactical Sectors Fund | Quantified Rising Dividend Tactical Fund |
| Investor Class Shares QTSSX | Investor Class Shares QRDTX |
Quantified Government Income Tactical Fund
Investor Class Shares QGITX
1-855-64-QUANT (1-855-647-8268)
www.advisorspreferred.com
Distributed by Ceros Financial Services, Inc.
August 19, 2021
Dear Shareholders:
This Annual Report for the Quantified Funds covers the period from July 1, 2020 – June 30, 2021. The Quantified Funds are a series of Funds, sub-advised by Flexible Plan Investments, Ltd., which are actively managed using dynamic asset allocation. We are pleased to announce that during the period, three new Quantified Funds were launched – the Quantified Tactical Sectors Fund, the Quantified Rising Dividend Tactical Fund, and the Quantified Government Income Tactical Fund. All the Quantified Funds are created to work together in a portfolio to seek return and manage risk for an investor through changing market conditions.
The Quantified Market Leaders Fund returned 60.94% for the period in the Investor class shares and 60.23% in the Advisor class shares, versus a return of 44.82% for the Wilshire 5000 Total Return Index. The Fund was leveraged for the entire fourth quarter of 2020, allowing it to take advantage of market movements, which significantly increased the Fund’s performance for the quarter. Rotation into value and sectors like Banking, Retail, and Energy led to outsized performance for the first quarter 2021. Additionally, leverage was utilized as market momentum became clearer among certain sectors. The Fund uses total return swaps as substitutes for certain asset classes and to adjust its market exposure. June saw a shift in leadership away from value stocks into growth stocks, led by the mega-technology names. The Fund was overweighted to the value style and “reopening” sectors like Energy and Banking. They all posted small declines or minor gains during that time period. On June 23rd, a shift out of Developed Countries into Large Growth and out of Financial Services into Real Estate added to positive returns.
The Quantified STF Fund returned 51.86% for the year for the Investor class shares and 50.87% for the Advisor class shares, versus a return of 44.36% for the NASDAQ 100 Total Return Index for the period. The Fund began 2021 with 2.0X exposure, changing to 1.6X at the close on January 27th. At market close on February 1st, exposure was decreased to 1.2X and then increased to 1.6X on February 3rd. On February 10th, exposure increased to 2.0X and then down to 0.8X on February 25th. The Fund took on 1.0X exposure on March 11th and then zero exposure on March 18th. Exposure increased to 1.0X on March 19th, where it remained to end the quarter. It changed to 2.0X at the close on April 7th. At market close on May 12th, exposure was decreased to 1.0X and then down to 0.8X on May 14th. On May 24th, exposure increased to 1.0X and then up to 2.0X on May 27th, where it remained to end the period. Overall, the use of varying amounts of leverage during the year contributed to the Fund’s above-index returns.
The Quantified Common Ground Fund returned 38.99% for the period versus a return of 42.12% of the S&P Composite 1500 Total Return Index for the same period. During the third and fourth quarters of 2020, the Fund favored stocks in economically sensitive sectors, while defensive sectors were underweighted. The Fund favored stocks in COVID-sensitive sectors, particularly HealthCare and Information Technology during the first quarter of 2021 and Utilities and Healthcare during the months of April and May, while also maintaining a concentration in growth stocks. Healthcare and Technology were the top contributors to performance for the second quarter of 2021. The Fund behaved largely as a growth fund for the first two months of the quarter, while transitions to more value-oriented stocks occurred for the month of June. Materials, Consumer Staples, and Communications contributed relatively little to the Fund for the quarter. As a result of this investment behavior, the Fund slightly underperformed its benchmark for the quarter ending June 30th.
The Quantified Pattern Recognition Fund returned 28.21% for the period versus a return of 40.79% for the S&P 500 Total Return Index, and versus 18.86% of a blended benchmark of 50% of the S&P 500 Total Return Index and 50% of the Bloomberg Barclays U.S. Aggregate Bond Index for the same period. During the second half of 2020, when the market trended fairly strongly, the Fund had little opportunity to capitalize on traditional range-bound market patterns in which it performs better. The Fund spent much of the first quarter of 2021 invested
1
and was able to take advantage of several market movements, utilizing leverage in the form of futures and swaps to outperform the underlying index. The Fund spent a significant period in an inverse position in the middle of February, a trade that was ultimately profitable. However, the majority of returns occurred when the Fund went 1.6X to 2X long during the month of March as the markets moved higher. The Fund slowly reduced its exposure down to -1.3X in mid-April, the highest inverse exposure for the quarter. From there, the Fund quickly rebounded to 0.8X long, increasing to 2X long by the end of May, largely remaining there until the end of the quarter, when the position was reduced to 0.1X long.
The Quantified Alternative Investment Fund returned 26.68% for the Investor class shares for the period and 25.97% for the Advisor class shares compared with a return of 11.91% for the HFRX Global Hedge Fund Index and 40.79% for the S&P 500 Total Return Index. The sector rotation portion of the Fund, specifically the “New Energy” sector, focusing on newer, cleaner sources of energy generation, had the largest contribution to performance throughout the period. This cash position was just over 30% at the end of the first quarter of the year, signifying a higher-than-normal risk environment which was reduced to 16% at the end of the second quarter of the year, signifying a fairly average risk environment. The Fund uses futures contracts as substitutes for certain asset classes and to adjust its market exposure. The Fund’s futures hedging exposure was negative for 2021, adding a drag to performance.
The Quantified Evolution Plus Fund returned 13.50% compared with a return of 40.79% for the S&P 500 Total Return Index for the year. After spending the majority of the first three quarters of the period in gold-related assets which reduced performance, the Fund eliminated the position entirely by March 1st and expanded exposures to equities. The Fund began the second quarter of 2021 most heavily invested in the S&P 500, a position which was maintained throughout the quarter, though reduced somewhat by quarter’s end. Overall, major asset classes tended to trend during the quarter, and the Fund was able to take advantage of it.
The Quantified Managed Income Fund fell by -1.92% for the Investor class for the year and by -2.65% for the Advisor class shares, compared with a decline of -0.33% for the Bloomberg Barclays U.S. Aggregate Bond Index. The dividend-paying stock sleeve portion of the Fund was the best-performing component throughout the second half of 2020 and again in the second quarter of 2021. The rotational bond ETF portfolio portion was the lowest-returning component of the Fund for the second half of 2021, but became a positive contributor to performance in the first half of 2021. The actively-traded long-term government bond futures overlay contributed positively to the Fund’s performance for the last half of 2021, but was the only detractor to performance versus the benchmark in the first quarter of this year. However, in the quarter ending June 30th, the actively-traded long-term government bond futures overlay was positive, but trailed the Fund’s benchmark for the quarter.
The Quantified Tactical Fixed Income Fund declined by -6.83% while the Bloomberg Barclays U.S. Aggregate Bond Index fell by -0.33% for the same period. The Fund held significant allocations to long-term Treasury’s in three separate periods during the third quarter of 2020 and again in the fourth quarter. However, inverse long-term bond exposures occurred near the beginning of each month. The Fund began the first quarter of the year in an inverse position relative to long-term government bonds, steadily increasing to fully leveraged by the second week in March, where it remained until the final day of the quarter, when overall exposure was slightly decreased. The Fund began the second quarter of 2021 in an inverse position relative to long-term government bonds, changing to a long position about half-way through April. The month of May also began with a slightly inverse position, changing to long for the second half of the month. The beginning of June was also slightly inverse relative to long-term bonds, while some exposure materialized for the second half of the month. During this period exposure to high-yield bonds was positive, though never exceeding about 20%.
The Quantified Tactical Sectors Fund returned 5.60% from its inception date of March 4, 2021 through the end of the period versus a return of 14.56% for the S&P 500 Total Return Index. With the broad-based Market Environment Indicator remaining bullish, the Fund attained and held its maximum equity exposure of 200%. The Fund performed well with the exception of the month of June. Leveraged gains in Oil Services
2
and Retail for that month were not enough to offset a decline in Regional Banking and Financial Services before they were sold on 6/23/21.
The Quantified Rising Dividend Tactical Fund gained 2.40% from its inception date on April 14th while the S&P 500 was up 4.49% for the same period. Within the fund, the 15% allocation to the NASDAQ 100 and its 3.87% gain was the position that gained the most, while low-volatility securities struggled, up only 1.86% for the quarter.
The Quantified Government Income Tactical Fund returned 0.90% from its launch on April 15th, versus a gain of 0.76% for Bloomberg Barclays U.S. Aggregate Bond Index for the same period. The Fund began 40% exposed to long-term U.S. Treasury’s, becoming slightly inverse at the beginning of May, but moving to a nearly fully long position by the end of that month. June also began with a small inverse position, building to a long position, but with exposure in the 20-50% range for the remainder of the quarter. The Fund seeks to outperform bonds over the long-term cycle by taking advantage of market inefficiencies in trading Treasury Bonds.
Thank you for your confidence in the Quantified Funds. If you have any questions about the Funds, please contact us at our website www.flexibleplan.com/market hotline.
| Very truly yours, | |
| Jerry Wagner | Catherine Ayers-Rigsby |
| Flexible Plan, Ltd. | Advisors Preferred, LLC |
| Sub-adviser | Adviser |
3
| Quantified Managed Income Fund |
| Portfolio Review (Unaudited) |
| June 30, 2021 |
The Fund’s performance figures* for the periods ended June 30, 2021, as compared to its benchmark:
| Annualized | |||||
| Since Inception | Since Inception | ||||
| One Year | Three Year | Five Year | March 18, 2016 | August 9, 2013 | |
| Quantified Managed Income Fund - Investor Class | (1.92)% | (0.20)% | 0.49% | N/A | 0.75% |
| Quantified Managed Income Fund - Advisor Class | (2.65)% | (0.88)% | (0.21)% | 0.42% | N/A |
| Bloomberg U.S. Aggregate Bond Index ** | (0.33)% | 5.34% | 3.03% | 3.40% | 3.42% |
Comparison of Change in Value of a $10,000 Investment.
Since Inception through June 30, 2021 +
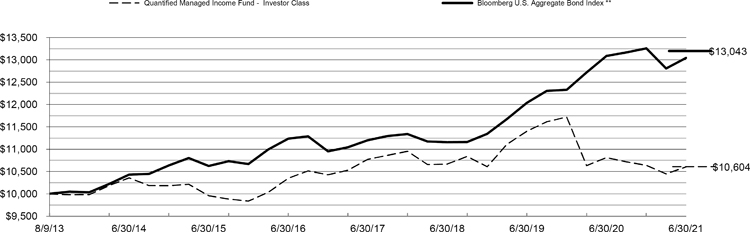
| + | Inception date is August 9, 2013 |
| * | The Performance data quoted is historical. Past performance is no guarantee of future results. Current performance may be higher or lower than the performance data quoted. The principal value and investment return of an investment will fluctuate so that your shares, when redeemed, may be worth more or less than their original cost. The returns shown do not reflect the deduction of taxes that a shareholder would pay on Fund distributions or on the redemptions of Fund shares. The Fund’s total annual fund operating expense ratio, as provided in the Fund’s prospectus dated October 31, 2020, was 1.64% for Investor Class and 2.24% for Advisor Class shares. For performance information current to the most recent month-end, please call 1-855-647-8268. Investors should consider the investment objectives, risks, and charges and expenses of the Fund carefully before investing. The Fund’s prospectus and summary prospectus contain these as well as other information about the Fund and should be read carefully before investing. A prospectus or summary prospectus may be obtained by calling 1-855-647-8268. |
| ** | The Bloomberg U.S. Aggregate Bond Index is an unmanaged index comprised of U.S. investment grade, fixed rate bond market securities, including government, government agency, corporate and mortgage-backed securities. Investors cannot invest directly in an index; unlike the Fund’s returns, the index does not reflect any fees or expenses. |
| Portfolio holdings by types of investments as of June 30, 2021 are as follows: | ||||
| Holdings by Type of Investment ^: | % of Net Assets | |||
| Common Stocks | 10.2 | % | ||
| Exchange Traded Funds: | ||||
| Debt Funds | 73.8 | % | ||
| Equity Funds | 12.8 | % | ||
| Money Market Funds | 1.8 | % | ||
| Collateral For Securities Loaned | 32.4 | % | ||
| Liabilities in Excess of Other Assets | (31.0 | )% | ||
| 100.0 | % | |||
| ^ | The Holdings by Type of Investment detail does not include derivative exposure. |
Please refer to the Schedule of Investments in this annual report for a detailed listing of the Fund’s holdings.
4
| QUANTIFIED MANAGED INCOME FUND |
| SCHEDULE OF INVESTMENTS |
| June 30, 2021 |
| Shares | Fair Value | |||||||
| COMMON STOCKS — 10.2% | ||||||||
| AEROSPACE & DEFENSE - 1.1% | ||||||||
| 2,206 | General Dynamics Corporation | $ | 415,302 | |||||
| 1,122 | Northrop Grumman Corporation | 407,768 | ||||||
| 26,945 | Park Aerospace Corporation | 401,481 | ||||||
| 1,224,551 | ||||||||
| BEVERAGES - 0.3% | ||||||||
| 7,768 | Coca-Cola Company | 420,326 | ||||||
| BIOTECH & PHARMA - 1.7% | ||||||||
| 1,720 | Amgen, Inc. | 419,250 | ||||||
| 1,771 | Eli Lilly and Company | 406,480 | ||||||
| 2,542 | Johnson & Johnson | 418,769 | ||||||
| 5,531 | Merck & Company, Inc. | 430,146 | ||||||
| 10,967 | Pfizer, Inc. | 429,468 | ||||||
| 2,104,113 | ||||||||
| CHEMICALS - 0.3% | ||||||||
| 1,300 | NewMarket Corporation | 418,574 | ||||||
| DATA CENTER REIT - 0.4% | ||||||||
| 3,226 | CoreSite Realty Corporation | 434,220 | ||||||
| DIVERSIFIED INDUSTRIALS - 0.3% | ||||||||
| 2,142 | 3M Company | 425,465 | ||||||
| E-COMMERCE DISCRETIONARY - 0.4% | ||||||||
| 6,227 | eBay, Inc. | 437,197 | ||||||
| FOOD - 1.0% | ||||||||
| 7,070 | General Mills, Inc. | 430,776 | ||||||
| 4,595 | John B Sanfilippo & Son, Inc. | 406,979 | ||||||
| 6,627 | Kellogg Company | 426,315 | ||||||
| 1,264,070 | ||||||||
| HOUSEHOLD PRODUCTS - 0.4% | ||||||||
| 2,434 | Clorox Company | 437,901 | ||||||
See accompanying notes to financial statements.
5
| QUANTIFIED MANAGED INCOME FUND |
| SCHEDULE OF INVESTMENTS (Continued) |
| June 30, 2021 |
| Shares | Fair Value | |||||||
| COMMON STOCKS — 10.2% (Continued) | ||||||||
| INSURANCE - 0.3% | ||||||||
| 4,334 | Progressive Corporation | $ | 425,642 | |||||
| MACHINERY - 0.3% | ||||||||
| 3,835 | Toro Company | 421,390 | ||||||
| RETAIL - CONSUMER STAPLES - 0.7% | ||||||||
| 2,002 | Dollar General Corporation | 433,213 | ||||||
| 1,729 | Target Corporation | 417,968 | ||||||
| 851,181 | ||||||||
| RETAIL - DISCRETIONARY - 0.3% | ||||||||
| 2,292 | Tractor Supply Company | 426,450 | ||||||
| SOFTWARE - 0.4% | ||||||||
| 3,750 | Citrix Systems, Inc. | 439,763 | ||||||
| TECHNOLOGY HARDWARE - 0.3% | ||||||||
| 3,233 | Apple, Inc. | 442,791 | ||||||
| TECHNOLOGY SERVICES - 0.3% | ||||||||
| 2,583 | Broadridge Financial Solutions, Inc. | 417,232 | ||||||
| TELECOMMUNICATIONS - 0.3% | ||||||||
| 7,357 | Verizon Communications, Inc. | 412,213 | ||||||
| TRANSPORTATION & LOGISTICS - 1.1% | ||||||||
| 4,376 | CH Robinson Worldwide, Inc. | 409,900 | ||||||
| 2,007 | United Parcel Service, Inc., Class B | 417,395 | ||||||
| 9,328 | Werner Enterprises, Inc. | 415,282 | ||||||
| 1,242,577 | ||||||||
| TRANSPORTATION EQUIPMENT - 0.3% | ||||||||
| 4,838 | PACCAR, Inc. | 431,792 | ||||||
| TOTAL COMMON STOCKS (Cost $11,679,063) | 12,677,448 | |||||||
| EXCHANGE-TRADED FUNDS — 86.6% | ||||||||
| EQUITY FUNDS - 12.8% | ||||||||
| 354,587 | Alerian MLP ETF(a) | 12,910,513 | ||||||
See accompanying notes to financial statements.
6
| QUANTIFIED MANAGED INCOME FUND |
| SCHEDULE OF INVESTMENTS (Continued) |
| June 30, 2021 |
| Shares | Fair Value | |||||||
| EXCHANGE-TRADED FUNDS — 86.6% (Continued) | ||||||||
| EQUITY FUNDS - 12.8% (Continued) | ||||||||
| 25,003 | WisdomTree US LargeCap Dividend Fund(a) | $ | 3,008,361 | |||||
| 15,918,874 | ||||||||
| DEBT FUNDS - 73.8% | ||||||||
| 197,552 | Invesco Fundamental High Yield Corporate Bond ETF(a) | 3,860,166 | ||||||
| 830,761 | Invesco Preferred ETF(a) | 12,727,258 | ||||||
| 27,906 | iShares 7-10 Year Treasury Bond ETF(a) | 3,222,864 | ||||||
| 27,881 | iShares Core U.S. Aggregate Bond ETF | 3,215,516 | ||||||
| 43,996 | iShares iBoxx High Yield Corporate Bond ETF(a) | 3,873,408 | ||||||
| 93,673 | iShares TIPS Bond ETF | 11,991,081 | ||||||
| 768,307 | ProShares Short 20+ Year Treasury | 12,969,021 | ||||||
| 224,251 | Quadratic Interest Rate Volatility and Inflation(a) | 6,193,813 | ||||||
| 34,309 | SPDR Bloomberg Barclays Convertible Securities ETF | 2,975,620 | ||||||
| 166,696 | SPDR Bloomberg Barclays High Yield Bond ETF(a) | 18,329,891 | ||||||
| 64,307 | SPDR Doubleline Total Return Tactical ETF | 3,113,102 | ||||||
| 57,951 | Vanguard Long-Term Corporate Bond ETF | 6,197,280 | ||||||
| 37,429 | Vanguard Total Bond Market ETF | 3,214,777 | ||||||
| 91,883,797 | ||||||||
| TOTAL EXCHANGE-TRADED FUNDS (Cost $107,623,440) | 107,802,671 | |||||||
| SHORT-TERM INVESTMENTS — 1.8% | ||||||||
| MONEY MARKET FUNDS - 1.8% | ||||||||
| 1,152,102 | Fidelity Government Portfolio, Institutional Class, 0.01%(b) | 1,152,102 | ||||||
| 1,152,102 | First American Government Obligations Fund, Class Z, 0.02%(b) | 1,152,102 | ||||||
| TOTAL MONEY MARKET FUNDS (Cost $2,304,204) | 2,304,204 | |||||||
| TOTAL SHORT-TERM INVESTMENTS (Cost $2,304,204) | 2,304,204 | |||||||
| Units | ||||||||
| COLLATERAL FOR SECURITIES LOANED — 32.4% | ||||||||
| 40,317,607 | Mount Vernon Liquid Assets Portfolio, LLC - 0.11% (b)(c) | |||||||
| TOTAL COLLATERAL FOR SECURITIES LOANED (Cost $40,317,607) | 40,317,607 | |||||||
| TOTAL INVESTMENTS — 131.0% (Cost $161,924,314) | $ | 163,101,930 | ||||||
| LIABILITIES IN EXCESS OF OTHER ASSETS — (31.0)% | (38,632,311 | ) | ||||||
| NET ASSETS - 100.0% | $ | 124,469,619 | ||||||
See accompanying notes to financial statements.
7
| QUANTIFIED MANAGED INCOME FUND |
| SCHEDULE OF INVESTMENTS (Continued) |
| June 30, 2021 |
| OPEN FUTURES CONTRACTS | ||||||||||||||
| Number of Contracts | Open Short Futures Contracts | Expiration | Notional Amount | Unrealized Depreciation | ||||||||||
| 47 | CME E-Mini Standard & Poor’s 500 Index Future | 09/17/2021 | $ | 10,078,210 | $ | (41,948 | ) | |||||||
| 19 | CME Ultra Long-Term US Treasury Bond Future | 09/21/2021 | 3,661,072 | (7,727 | ) | |||||||||
| TOTAL FUTURES CONTRACTS | $ | (49,675 | ) | |||||||||||
ETF - Exchange-Traded Fund
REIT - Real Estate Investment Trust
TIPS - Treasury Inflation-Protected Securities
| (a) | All or a portion of the security is on loan. Total loaned securities had a value of $39,694,253 at June 30, 2021. |
| (b) | Rate disclosed is the seven-day effective yield as of June 30, 2021. |
| (c) | Security purchased with cash proceeds of securities lending collateral. |
See accompanying notes to financial statements.
8
| Quantified Market Leaders Fund |
| Portfolio Review (Unaudited) |
| June 30, 2021 |
The Fund’s performance figures* for the periods ended June 30, 2021, as compared to its benchmark:
| Annualized | |||||
| Since Inception | Since Inception | ||||
| One Year | Three Year | Five Year | March 18, 2016 | August 9, 2013 | |
| Quantified Market Leaders Fund - Investor Class | 60.94% | 21.05% | 19.64% | N/A | 12.81% |
| Quantified Market Leaders Fund - Advisor Class | 60.23% | 20.42% | 18.96% | 18.49% | N/A |
| Wilshire 5000 Total Market Return Index ** | 44.82% | 18.84% | 18.01% | 17.73% | 14.60% |
Comparison of Change in Value of a $10,000 Investment.
Since Inception through June 30, 2021 +
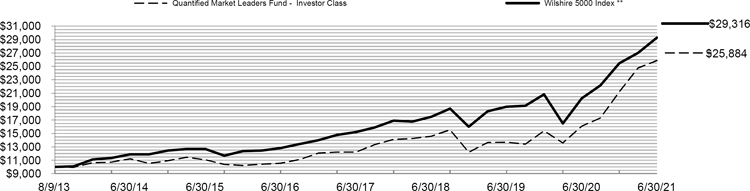
| + | Inception date is August 9, 2013 |
| * | The performance data quoted is historical. Past performance is no guarantee of future results. Current performance may be higher or lower than the performance data quoted. The principal value and investment return of an investment will fluctuate so that your shares, when redeemed, may be worth more or less than their original cost. The returns shown do not reflect the deduction of taxes that a shareholder would pay on Fund distributions or on the redemptions of Fund shares. The Fund’s total annual fund operating expense ratio, as provided in the Fund’s prospectus dated October 31, 2020, was 1.68% for Investor Class and 2.29% for Advisor Class shares. For performance information current to the most recent month-end, please call 1-855-647-8268. Investors should consider the investment objectives, risks, and charges and expenses of the Fund carefully before investing. The Fund’s prospectus and summary prospectus contain these as well as other information about the Fund and should be read carefully before investing. A prospectus or summary prospectus may be obtained by calling 1-855-647-8268. |
| ** | The Wilshire 5000 Total Market Return Index or more simply the Wilshire 5000 is an unmanaged composite of U.S. traded equity securities with readily available price data and includes the reinvestment of dividends. This index is widely used by professional investors as a performance benchmark for large-cap stocks. Investors may not invest in an index directly; unlike the Fund’s returns, the index does not reflect any fees or expenses. |
| Portfolio holdings by types of investments as of June 30, 2021 are as follows: | ||||
| Holdings by Type of Investment: ^ | % of Net Assets | |||
| Exchange Traded Funds: | ||||
| Equity Funds | 79.5 | % | ||
| Money Market Funds | 18.9 | % | ||
| Collateral for Securities Loaned | 4.8 | % | ||
| Liabilities in Excess of Other Assets | (3.2 | )% | ||
| 100.0 | % | |||
| ^ | The Holdings by Type of Investment detail does not include derivative exposure. |
Please refer to the Schedule of Investments in this annual report for a detailed listing of the Fund’s holdings.
9
| QUANTIFIED MARKET LEADERS FUND |
| SCHEDULE OF INVESTMENTS |
| June 30, 2021 |
| Shares | Fair Value | |||||||
| EXCHANGE-TRADED FUNDS — 79.5% | ||||||||
| EQUITY FUNDS - 79.5% | ||||||||
| 175,677 | iShares Russell 1000 Value ETF | $ | 27,865,886 | |||||
| 400,188 | iShares Russell 2000 Value ETF (a) | 66,339,165 | ||||||
| 482,854 | iShares Russell Mid-Cap Value ETF(a) | 55,518,553 | ||||||
| 673,940 | iShares U.S. Real Estate ETF | 68,701,443 | ||||||
| 1,044,284 | SPDR S&P Regional Banking ETF(a) | 68,431,930 | ||||||
| 286,856,977 | ||||||||
| TOTAL EXCHANGE-TRADED FUNDS (Cost $280,535,263) | 286,856,977 | |||||||
| SHORT-TERM INVESTMENTS — 18.9% | ||||||||
| MONEY MARKET FUNDS - 18.9% | ||||||||
| 34,161,242 | Fidelity Government Portfolio, Institutional Class, 0.01%(b) | 34,161,243 | ||||||
| 34,161,242 | First American Government Obligations Fund, Class Z, 0.02%(b) | 34,161,242 | ||||||
| TOTAL MONEY MARKET FUNDS (Cost $68,322,485) | 68,322,485 | |||||||
| TOTAL SHORT-TERM INVESTMENTS (Cost $68,322,485) | 68,322,485 | |||||||
| Units | ||||||||
| COLLATERAL FOR SECURITIES LOANED — 4.8% | ||||||||
| 17,520,350 | Mount Vernon Liquid Assets Portfolio, LLC - 0.11% (b)(c) | 17,520,350 | ||||||
| TOTAL COLLATERAL FOR SECURITIES LOANED (Cost $17,520,350) | ||||||||
| TOTAL INVESTMENTS - 103.2% (Cost $366,378,098) | $ | 372,699,812 | ||||||
| LIABILITIES IN EXCESS OF OTHER ASSETS - (3.2)% | (11,730,936 | ) | ||||||
| NET ASSETS - 100.0% | $ | 360,968,876 | ||||||
ETF - Exchange-Traded Fund
| (a) | All or a portion of the security is on loan. Total loaned securities had a value of $17,189,805 at June 30, 2021. |
| (b) | Rate disclosed is the seven-day effective yield as of June 30, 2021. |
| (c) | Security purchased with cash proceeds of securities lending collateral. |
See accompanying notes to financial statements.
10
| QUANTIFIED MARKET LEADERS FUND |
| SCHEDULE OF INVESTMENTS (Continued) |
| June 30, 2021 |
TOTAL RETURN SWAPS
| Number of | Notional Amount at | Termination | Unrealized | ||||||||||||||
| Shares | Reference Entity | June 30, 2021 | Interest Rate Payable (1) | Date | Counterparty | Appreciation | |||||||||||
| Long Position: | |||||||||||||||||
| 310,390 | iShares Russell 1000 Growth ETF | $ | 84,264,677 | 1-Mth USD LIBOR plus 20 bp | 7/19/2021 | BRC | $ | 1,256,244 | |||||||||
| 259,470 | iShares Russell 2000 | 43,012,342 | 1-Mth USD LIBOR plus 20 bp | 6/23/2022 | BRC | 373,837 | |||||||||||
| 717,000 | SPDR S&P Retail ETF Value ETF | 69,713,910 | 1-Mth USD LIBOR plus 20 bp | 6/22/2022 | BRC | 2,916,812 | |||||||||||
| 303,110 | VanEck Vectors Oil Services ETF | 66,359,872 | 1-Mth USD LIBOR plus 20 bp | 7/15/2021 | BRC | 817,002 | |||||||||||
| Total: | $ | 5,363,895 | |||||||||||||||
BRC - Barclays Capital
LIBOR - London Interbank Offered Rate
| (1) | Interest rate is based upon predetermined notional amounts, which may be a multiple of the number of shares plus a specified spread. |
See accompanying notes to financial statements.
11
| Quantified Alternative Investment Fund |
| Portfolio Review (Unaudited) |
| June 30, 2021 |
The Fund’s performance figures* for the periods ended June 30, 2021, as compared to its benchmark:
| Annualized | |||||
| Since Inception | Since Inception | ||||
| One Year | Three Year | Five Year | March 18, 2016 | August 9, 2013 | |
| Quantified Alternative Investment Fund - Investor Class | 26.68% | 5.39% | 4.63% | N/A | 3.55% |
| Quantified Alternative Investment Fund - Advisor Class | 25.97% | 4.79% | 4.00% | 4.22% | N/A |
| S&P 500 Total Return Index ** | 40.79% | 18.67% | 17.65% | 17.28% | 14.80% |
Comparison of Change in Value of a $10,000 Investment.
Since Inception through June 30, 2021 +
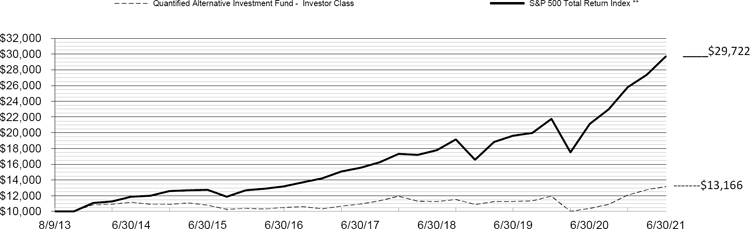
| + | Inception date is August 9, 2013 |
| * | The performance data quoted is historical. Past performance is no guarantee of future results. Current performance may be higher or lower than the performance data quoted. The principal value and investment return of an investment will fluctuate so that your shares, when redeemed, may be worth more or less than their original cost. The returns shown do not reflect the deduction of taxes that a shareholder would pay on Fund distributions or on the redemptions of Fund shares. The Fund’s total annual fund operating expense ratio, as provided in the Fund’s prospectus dated October 31, 2020, was 2.11% for Investor Class and 2.79% for Advisor Class shares. For performance information current to the most recent month-end, please call 1-855-647-8268. Investors should consider the investment objectives, risks, and charges and expenses of the Fund carefully before investing. The Fund’s prospectus and summary prospectus contain these as well as other information about the Fund and should be read carefully before investing. A prospectus or summary prospectus may be obtained by calling 1-855-647-8268. |
| ** | The S&P 500 Total Return Index is an unmanaged composite of 500 large capitalization companies and includes the reinvestment of dividends. This Index is widely used by professional investors as a performance benchmark for Large-Cap stocks. Investors may not invest in an index directly; unlike the Fund’s returns, the index does not reflect any fees or expenses. |
| Portfolio holdings by types of investments as of June 30, 2021 are as follows: | ||||
| Holdings by Type of Investment: ^ | % of Net Assets | |||
| Exchange Traded Funds: | ||||
| Alternative Funds | 6.6 | % | ||
| Equity Funds | 50.8 | % | ||
| Debt Funds | 11.1 | % | ||
| Mixed Allocation Funds | 3.5 | % | ||
| Open-End Mutual Funds: | ||||
| Alternative Funds | 11.9 | % | ||
| Money Market Funds | 14.1 | % | ||
| Collateral for Securities Loaned | 8.0 | % | ||
| Liabilities in Excess of Other Assets | (6.0 | )% | ||
| 100.0 | % | |||
| ^ | The Holdings by Type of Investment detail does not include derivative exposure. |
Please refer to the Schedule of Investments in this annual report for a detailed listing of the Fund’s holdings.
12
| QUANTIFIED ALTERNATIVE INVESTMENT FUND |
| SCHEDULE OF INVESTMENTS |
| June 30, 2021 |
| Shares | Fair Value | |||||||
| EXCHANGE-TRADED FUNDS — 72.0% | ||||||||
| ALTERNATIVE FUNDS - 6.6% | ||||||||
| 2,044 | Hull Tactical US ETF | $ | 67,515 | |||||
| 12,168 | WisdomTree Managed Futures Strategy Fund | 503,998 | ||||||
| 571,513 | ||||||||
| EQUITY FUNDS - 50.8% | ||||||||
| 1,569 | Energy Select Sector SPDR Fund | 84,522 | ||||||
| 4,133 | Financial Select Sector SPDR Fund | 151,640 | ||||||
| 3,505 | First Trust Energy AlphaDEX Fund | 39,992 | ||||||
| 2,547 | First Trust Materials AlphaDEX Fund | 146,427 | ||||||
| 4,565 | FlexShares Global Upstream Natural Resources Index | 174,794 | ||||||
| 1,781 | Global X Lithium & Battery Tech ETF | 129,051 | ||||||
| 416 | Invesco DWA SmallCap Momentum ETF | 37,324 | ||||||
| 1,183 | Invesco Dynamic Leisure and Entertainment ETF | 61,835 | ||||||
| 1,324 | Invesco Dynamic Media ETF | 74,607 | ||||||
| 1,287 | Invesco S&P 500 Equal Weight Materials ETF | 211,679 | ||||||
| 101 | Invesco S&P Spin-Off ETF | 6,517 | ||||||
| 1,483 | InvInvesco S&P Midcap 400 Revenue ETF | 131,305 | ||||||
| 3,141 | iShares Global Consumer Discretionary ETF | 538,463 | ||||||
| 6,372 | iShares Global Energy ETF (a) | 169,431 | ||||||
| 401 | iShares Global Financials ETF | 31,122 | ||||||
| 3,635 | iShares Global Materials ETF (a) | 330,531 | ||||||
| 10,583 | iShares MSCI International Momentum Factor ETF | 409,350 | ||||||
| 6,967 | iShares North American Natural Resources ETF(a) | 212,006 | ||||||
| 1,327 | iShares U.S. Broker-Dealers & Securities Exchanges | 135,447 | ||||||
| 1,256 | iShares U.S. Energy ETF | 36,537 | ||||||
| 359 | iShares U.S. Financial Services ETF (a) | 66,498 | ||||||
| 257 | iShares U.S. Insurance ETF | 19,893 | ||||||
| 1,380 | iShares U.S. Oil & Gas Exploration & Production ETF (a) | 79,074 | ||||||
| 2,276 | iShares US Financials ETF | 184,470 | ||||||
| 2,220 | Nuveen ESG Large-Cap Growth ETF | 143,234 | ||||||
| 2,212 | Pacer US Small Cap Cash Cows 100 ETF | 98,677 | ||||||
| 881 | SPDR S&P Capital Markets ETF | 82,849 | ||||||
| 1,173 | SPDR S&P Global Natural Resources ETF | 62,169 | ||||||
| 1,370 | SPDR S&P Metals & Mining ETF (a) | 58,992 | ||||||
| 141 | SPDR S&P Oil & Gas Exploration & Production ETF | 13,633 | ||||||
| 534 | VanEck Vectors Retail ETF | 93,851 | ||||||
| 284 | Vanguard Consumer Discretionary ETF | 89,179 | ||||||
| 2,214 | Vanguard Energy ETF | 168,020 | ||||||
See accompanying notes to financial statements.
13
| QUANTIFIED ALTERNATIVE INVESTMENT FUND |
| SCHEDULE OF INVESTMENTS (Continued) |
| June 30, 2021 |
| Shares | Fair Value | |||||||
| EXCHANGE-TRADED FUNDS — 72.0% (Continued) | ||||||||
| EQUITY FUNDS - 50.8% (Continued) | ||||||||
| 1,105 | Vanguard Financials ETF | $ | 99,947 | |||||
| 900 | VictoryShares US Discovery Enhanced Volatility Wtd ETF | 54,525 | ||||||
| 4,427,591 | ||||||||
| DEBT FUNDS - 11.1% | ||||||||
| 5,088 | iShares Convertible Bond ETF | 518,823 | ||||||
| 5,135 | SPDR Bloomberg Barclays Convertible Securities ETF | 445,359 | ||||||
| 964,182 | ||||||||
| MIXED ALLOCATION FUNDS - 3.5% | ||||||||
| 1,371 | SPDR SSgA Global Allocation ETF | 63,093 | ||||||
| 6,787 | SPDR SSgA Income Allocation ETF | 241,812 | ||||||
| 304,905 | ||||||||
| TOTAL EXCHANGE-TRADED FUNDS (Cost $6,249,935) | 6,268,191 | |||||||
| OPEN END MUTUAL FUNDS — 11.9% | ||||||||
| ALTERNATIVE FUNDS - 11.9% | ||||||||
| 12,366 | Alger Dynamic Opportunities Fund, Class A | 257,955 | ||||||
| 17,533 | Driehaus Event Driven Fund | 258,433 | ||||||
| 23,826 | PIMCO TRENDS Managed Futures Strategy Fund, Institutional Class | 263,991 | ||||||
| 22,524 | Vivaldi Merger Arbitrage Fund, Class I | 253,845 | ||||||
| 1,034,224 | ||||||||
| TOTAL OPEN-END MUTUAL FUNDS (Cost $1,019,944) | 1,034,224 | |||||||
| SHORT-TERM INVESTMENTS — 14.1% | ||||||||
| MONEY MARKET FUNDS - 14.1% | ||||||||
| 616,355 | Fidelity Government Portfolio, Institutional Class, 0.01%(b) | 616,355 | ||||||
| 616,355 | First American Government Obligations Fund, Class Z, 0.02%(b) | 616,354 | ||||||
| TOTAL MONEY MARKET FUNDS (Cost $1,232,709) | 1,232,709 | |||||||
| TOTAL SHORT-TERM INVESTMENTS (Cost $1,232,709) | 1,232,709 | |||||||
See accompanying notes to financial statements.
14
| QUANTIFIED ALTERNATIVE INVESTMENT FUND |
| SCHEDULE OF INVESTMENTS (Continued) |
| June 30, 2021 |
| Units | Fair Value | |||||||
| COLLATERAL FOR SECURITIES LOANED — 8.0% | ||||||||
| 698,694 | Mount Vernon Liquid Assets Portfolio, LLC - 0.11% (b)(c) | $ | 698,694 | |||||
| TOTAL COLLATERAL FOR SECURITIES LOANED (Cost $698,694) | ||||||||
| TOTAL INVESTMENTS - 106.0% (Cost $9,201,282) | $ | 9,233,818 | ||||||
| LIABILITIES IN EXCESS OF OTHER ASSETS – (6.0)% | (525,344 | ) | ||||||
| NET ASSETS - 100.0% | $ | 8,708,474 | ||||||
| OPEN FUTURES CONTRACTS | ||||||||||||||
| Number of Contracts | Open Long Futures Contracts | Expiration | Notional Amount | Unrealized Appreciation | ||||||||||
| 2 | CME E-Mini NASDAQ 100 Index Future | 09/17/2021 | $ | 581,960 | $ | 22,482 | ||||||||
| TOTAL FUTURES CONTRACTS | ||||||||||||||
ETF - Exchange-Traded Fund
| (a) | All or a portion of the security is on loan. Total loaned securities had a value of $689,681 at June 30, 2021. |
| (b) | Rate disclosed is the seven-day effective yield as of June 30, 2021. |
| (c) | Security purchased with cash proceeds of securities lending collateral. |
See accompanying notes to financial statements.
15
| Quantified STF Fund |
| Portfolio Review (Unaudited) |
| June 30, 2021 |
The Fund’s performance figures* for the periods ended June 30, 2021, as compared to its benchmark:
| Annualized | ||||
| Since Inception | ||||
| One Year | Three Year | Five Year | November 13, 2015 | |
| Quantified STF Fund - Investor Class | 51.86% | 28.48% | 29.05% | 21.21% |
| Quantified STF Fund - Advisor Class | 50.87% | 27.71% | 28.29% | 20.55% |
| Nasdaq 100 Total Return Index ** | 44.36% | 28.61% | 28.24% | 24.48% |
Comparison of Change in Value of a $10,000 Investment.
Since Inception through June 30, 2021 +
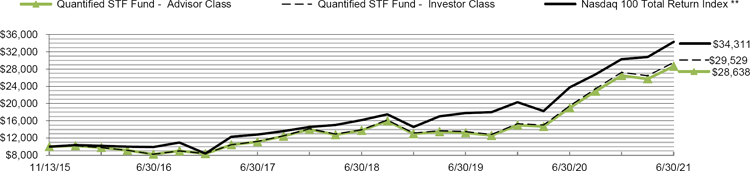
| + | Inception date is November 13, 2015 |
| * | The performance data quoted is historical. Past performance is no guarantee of future results. Current performance may be higher or lower than the performance data quoted. The principal value and investment return of an investment will fluctuate so that your shares, when redeemed, may be worth more or less than their original cost. The returns shown do not reflect the deduction of taxes that a shareholder would pay on Fund distributions or on the redemptions of Fund shares. The Fund’s total annual fund operating expense ratio, as provided in the Fund’s prospectus dated October 31, 2020, was 1.72% for Investor Class and 2.32% for Advisor Class shares. For performance information current to the most recent month-end, please call 1-855-647-8268. Investors should consider the investment objectives, risks, and charges and expenses of the Fund carefully before investing. The Fund’s prospectus and summary prospectus contain these as well as other information about the Fund and should be read carefully before investing. A prospectus or summary prospectus may be obtained by calling 1-855-647-8268. |
| ** | The Nasdaq 100 Total Return Index includes 100 of the largest domestic and international non-financial companies listed on the NASDAQ Stock Market based on market capitalization. The index reflects companies across major industry groups including computer hardware and software, telecommunications, retail/wholesale trade and biotechnology. Index composition is reviewed on an annual basis in December. Investors may not invest in an index directly; unlike the Fund’s returns, the index does not reflect any fees or expenses. |
| Portfolio holdings by types of investments as of June 30, 2021 are as follows: | ||||
| Holdings by Type of Investment: ^ | % of Net Assets | |||
| Certificates of Deposit: | ||||
| Banking | 1.7 | % | ||
| Corporate Bonds | 11.8 | % | ||
| Exchange Traded Funds: | ||||
| Debt Funds | 20.1 | % | ||
| Equity Fund | 0.0 | % + | ||
| Money Market Funds | 38.9 | % | ||
| Collateral For Securities Loaned | 4.3 | % | ||
| Other Assets less Liabilities | 23.2 | % | ||
| 100.0 | % | |||
| ^ | The Holdings by Type of Investment detail does not include derivative exposure. |
| + | Percentage is less than 0.1% |
Please refer to the Schedule of Investments in this annual report for a detailed listing of the Fund’s holdings.
16
| QUANTIFIED STF FUND |
| SCHEDULE OF INVESTMENTS |
| June 30, 2021 |
| Shares | Fair Value | |||||||
| EXCHANGE-TRADED FUNDS — 20.1% | ||||||||
| EQUITY FUNDS - 0.0%(a) | ||||||||
| 200 | Invesco QQQ Trust Series 1 | $ | 70,886 | |||||
| DEBT FUNDS - 20.1% | ||||||||
| 280,000 | Invesco BulletShares 2021 Corporate Bond ETF | 5,908,000 | ||||||
| 275,000 | Invesco BulletShares 2022 Corporate Bond ETF | 5,937,250 | ||||||
| 270,000 | Invesco BulletShares 2024 Corporate Bond ETF | 5,991,300 | ||||||
| 120,000 | Invesco Ultra Short Duration ETF | 6,057,600 | ||||||
| 55,000 | iShares Short Treasury Bond ETF(d) | 6,076,950 | ||||||
| 190,000 | SPDR Portfolio Short Term Corporate Bond ETF | 5,947,000 | ||||||
| 35,918,100 | ||||||||
| TOTAL EXCHANGE-TRADED FUNDS (Cost $36,044,902) | 35,988,986 | |||||||
| Principal | Coupon Rate | |||||||||||
| Amount ($) | (%) | Maturity | ||||||||||
| CORPORATE BONDS — 11.8% | ||||||||||||
| BANKING — 1.8% | ||||||||||||
| 1,000,000 | Canadian Imperial Bank of Commerce | 3.1000 | 04/02/24 | 1,063,286 | ||||||||
| 1,000,000 | Mitsubishi UFJ Financial Group, Inc. | 3.4070 | 03/07/24 | 1,072,021 | ||||||||
| 1,000,000 | PNC Financial Services Group, Inc. | 3.9000 | 04/29/24 | 1,086,543 | ||||||||
| 3,221,850 | ||||||||||||
| ELECTRIC UTILITIES — 1.2% | ||||||||||||
| 1,000,000 | Enel Generacion Chile S.A. | 4.2500 | 04/15/24 | 1,071,087 | ||||||||
| 1,000,000 | WEC Energy Group, Inc. | 0.8000 | 03/15/24 | 1,002,748 | ||||||||
| 2,073,835 | ||||||||||||
| INSTITUTIONAL FINANCIAL SERVICES — 2.2% | ||||||||||||
| 1,000,000 | Bank of New York Mellon Corporation | 0.5000 | 04/26/24 | 999,462 | ||||||||
| 1,000,000 | Brookfield Finance, Inc. | 4.0000 | 04/01/24 | 1,081,363 | ||||||||
| 1,000,000 | Goldman Sachs Group, Inc. | 0.8000 | 03/25/24 | 994,725 | ||||||||
| 1,000,000 | Intercontinental Exchange, Inc. | 3.4500 | 09/21/23 | 1,061,939 | ||||||||
| 4,137,489 | ||||||||||||
| MACHINERY — 0.6% | ||||||||||||
| 1,000,000 | Parker-Hannifin Corporation | 2.7000 | 06/14/24 | 1,054,506 | ||||||||
| MEDICAL EQUIPMENT & DEVICES — 0.6% | ||||||||||||
| 1,000,000 | Becton Dickinson and Company(d) | 3.3630 | 06/06/24 | 1,071,830 | ||||||||
See accompanying notes to financial statements.
17
| QUANTIFIED STF FUND |
| SCHEDULE OF INVESTMENTS (Continued) |
| June 30, 2021 |
| Principal | ||||||||||||
| Amount ($) | Coupon Rate (%) | Maturity | Fair Value | |||||||||
| REAL ESTATE INVESTMENT TRUSTS — 0.6% | ||||||||||||
| 1,000,000 | Welltower, Inc. | 3.6250 | 03/15/24 | $ | 1,072,837 | |||||||
| RETAIL - CONSUMER STAPLES — 0.6% | ||||||||||||
| 1,000,000 | 7-Eleven, Inc.(b) | 0.8000 | 02/10/24 | 997,971 | ||||||||
| SPECIALTY FINANCE — 0.6% | ||||||||||||
| 1,000,000 | Capital One Financial Corp | 3.9000 | 01/29/24 | 1,079,660 | ||||||||
| TECHNOLOGY HARDWARE — 1.2% | ||||||||||||
| 1,000,000 | Apple, Inc. | 3.0000 | 02/09/24 | 1,061,677 | ||||||||
| 1,000,000 | Hewlett Packard Enterprise Company | 1.4500 | 04/01/24 | 1,017,139 | ||||||||
| 2,078,816 | ||||||||||||
| TECHNOLOGY SERVICES — 0.6% | ||||||||||||
| 1,000,000 | International Business Machines Corporation | 3.0000 | 05/15/24 | 1,066,252 | ||||||||
| TELECOMMUNICATIONS — 0.6% | ||||||||||||
| 1,000,000 | Verizon Communications, Inc. (d) | 0.7500 | 03/22/24 | 1,004,677 | ||||||||
| TRANSPORTATION & LOGISTICS — 1.2% | ||||||||||||
| 1,000,000 | Ryder System, Inc. (d) | 3.6500 | 03/18/24 | 1,074,996 | ||||||||
| 1,000,000 | Union Pacific Corporation | 3.6460 | 02/15/24 | 1,073,253 | ||||||||
| 2,148,249 | ||||||||||||
| TOTAL CORPORATE BONDS (Cost $21,048,037) | 21,007,972 | |||||||||||
| CERTIFICATES OF DEPOSIT — 1.7% | ||||||||||||
| BANKING - 1.7% | ||||||||||||
| 1,000,000 | Texas Exchange Bank SSB | 0.5000 | 07/09/24 | 1,000,899 | ||||||||
| 1,000,000 | Well Fargo Bank NA | 1.9000 | 01/17/23 | 1,027,025 | ||||||||
| 1,000,000 | Well Fargo National Bank West | 1.9000 | 01/17/23 | 1,027,026 | ||||||||
| 3,054,950 | ||||||||||||
| TOTAL CERTIFICATES OF DEPOSIT (Cost $3,000,000) | 3,054,950 | |||||||||||
See accompanying notes to financial statements.
18
| QUANTIFIED STF FUND |
| SCHEDULE OF INVESTMENTS (Continued) |
| June 30, 2021 |
| Shares | Fair Value | |||||||
| SHORT-TERM INVESTMENTS — 38.9% | ||||||||
| MONEY MARKET FUNDS - 38.9% | ||||||||
| 34,684,587 | Fidelity Government Portfolio, Institutional Class, 0.01%(c) | $ | 34,684,587 | |||||
| 34,684,587 | First American Government Obligations Fund, Class Z, 0.02%(c) | 34,684,587 | ||||||
| TOTAL MONEY MARKET FUNDS (Cost $69,369,174) | 69,369,174 | |||||||
| TOTAL SHORT-TERM INVESTMENTS (Cost $69,369,174) | 69,369,174 | |||||||
| Units | ||||||||
| COLLATERAL FOR SECURITIES LOANED — 4.3% | ||||||||
| 7,654,963 | Mount Vernon Liquid Assets Portfolio, LLC - 0.11% (c)(e) | |||||||
| TOTAL COLLATERAL FOR SECURITIES LOANED (Cost $7,654,963) | 7,654,963 | |||||||
| TOTAL INVESTMENTS — 76.8% (Cost $137,117,076) | $ | 137,076,045 | ||||||
| OTHER ASSETS IN EXCESS OF LIABILITIES - 23.2% | 41,460,046 | |||||||
| NET ASSETS - 100.0% | $ | 178,536,091 | ||||||
| OPEN FUTURES CONTRACTS | ||||||||||||||
| Number of Contracts | Open Long Futures Contracts | Expiration | Notional Amount | Unrealized Appreciation | ||||||||||
| 1,227 | CME E-Mini NASDAQ 100 Index Future | 09/17/2021 | $ | 357,032,460 | $ | 11,849,965 | ||||||||
| TOTAL FUTURES CONTRACTS | ||||||||||||||
ETF - Exchange-Traded Fund
REIT - Real Estate Investment Trust
| (a) | Percentage rounds to less than 0.1%. |
| (b) | Security exempt from registration under Rule 144A or Section 4(2) of the Securities Act of 1933. The security may be resold in transactions exempt from registration, normally to qualified institutional buyers. As of June 30, 2021, the total market value of 144A securities is $997,971 or 0.6% of net assets. |
| (c) | Rate disclosed is the seven-day effective yield as of June 30, 2021. |
| (d) | All or a portion of the security is on loan. Total loaned securities had a value of $7,501,270 at June 30, 2021. |
| (e) | Security purchased with cash proceeds of securities lending collateral. |
See accompanying notes to financial statements.
19
| Quantified Pattern Recognition Fund |
| Portfolio Review (Unaudited) |
| June 30, 2021 |
The Fund’s performance figures* for the period ended June 30, 2021, as compared to its benchmark:
| Since Inception | ||
| One Year | August 30, 2019 | |
| Quantified Pattern Recognition Fund - Investor Class | 28.21% | 19.94% |
| S&P 500 Total Return Index ** | 40.79% | 25.45% |
Comparison of Change in Value of a $10,000 Investment.
Since Inception through June 30, 2021 +
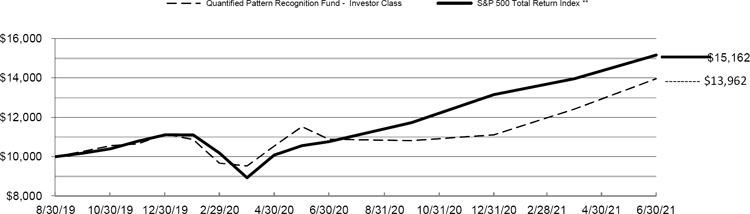
| + | Inception date is August 30, 2019 |
| * | The performance data quoted is historical. Past performance is no guarantee of future results. Current performance may be higher or lower than the performance data quoted. The principal value and investment return of an investment will fluctuate so that your shares, when redeemed, may be worth more or less than their original cost. The returns shown do not reflect the deduction of taxes that a shareholder would pay on Fund distributions or on the redemptions of Fund shares. The Fund’s estimated total annual fund operating expense ratio, as provided in the Fund’s prospectus dated October 31, 2020, was 1.78% for Investor Class shares. For performance information current to the most recent month-end, please call 1-855-647-8268. Investors should consider the investment objectives, risks, and charges and expenses of the Fund carefully before investing. The Fund’s prospectus and summary prospectus contain these as well as other information about the Fund and should be read carefully before investing. A prospectus or summary prospectus may be obtained by calling 1-855-647-8268. |
| ** | The S&P 500 Total Return Index is an unmanaged composite of 500 large capitalization companies and includes the reinvestment of dividends. This Index is widely used by professional investors as a performance benchmark for Large-Cap stocks. Investors may not invest in an index directly; unlike the Fund’s returns, the index does not reflect any fees or expenses. |
| Portfolio holdings by types of investments as of June 30, 2021 are as follows: | ||||
| Holdings by Type of Investment ^: | % of Net Assets | |||
| Certificates of Deposit: | ||||
| Banking | 5.7 | % | ||
| Exchange Traded Funds: | ||||
| Debt Funds | 15.0 | % | ||
| Equity Fund | 0.1 | % | ||
| Money Market Funds | 74.9 | % | ||
| Collateral for Securities Loaned | 2.5 | % | ||
| Other Assets In Excess of Liabilities | 1.8 | % | ||
| 100.0 | % | |||
| ^ | The Holdings by type of Investment detail does not include derivative exposure. |
Please refer to the Schedule of Investments in this annual report for a detailed listing of the Fund’s holdings.
20
| QUANTIFIED PATTERN RECOGNITION FUND |
| SCHEDULE OF INVESTMENTS |
| June 30, 2021 |
| Shares | Fair Value | |||||||
| EXCHANGE-TRADED FUNDS — 15.1% | ||||||||
| EQUITY FUNDS - 0.1% | ||||||||
| 100 | SPDR S&P 500 ETF Trust | $ | 42,806 | |||||
| DEBT FUNDS - 15.0% | ||||||||
| 84,000 | Invesco BulletShares 2021 Corporate Bond ETF | 1,772,400 | ||||||
| 82,000 | Invesco BulletShares 2022 Corporate Bond ETF | 1,770,380 | ||||||
| 80,000 | Invesco BulletShares 2024 Corporate Bond ETF | 1,775,200 | ||||||
| 35,000 | Invesco Ultra Short Duration ETF | 1,766,800 | ||||||
| 16,000 | iShares Short Treasury Bond ETF(a) | 1,767,840 | ||||||
| 57,000 | SPDR Portfolio Short Term Corporate Bond ETF | 1,784,100 | ||||||
| 10,636,720 | ||||||||
| TOTAL EXCHANGE-TRADED FUNDS (Cost $10,692,162) | 10,679,526 | |||||||
| Principal | Coupon Rate | |||||||||||||||
| Amount ($) | (%) | Maturity | ||||||||||||||
| CERTIFICATES OF DEPOSIT — 5.7% | ||||||||||||||||
| BANKING - 5.7% | ||||||||||||||||
| 1,000,000 | Raymond James Bank NA | 1.7000 | 11/08/21 | 1,006,058 | ||||||||||||
| 1,000,000 | Sallie Mac Bank | 1.8500 | 11/07/22 | 1,023,442 | ||||||||||||
| 1,000,000 | Well Fargo Bank NA | 1.9500 | 10/18/21 | 1,005,745 | ||||||||||||
| 1,000,000 | Well Fargo National Bank West | 1.9000 | 01/17/23 | 1,027,025 | ||||||||||||
| 4,062,270 | ||||||||||||||||
| TOTAL CERTIFICATES OF DEPOSIT (Cost $4,000,000) | 4,062,270 | |||||||||||||||
| Shares | ||||||||
| SHORT-TERM INVESTMENTS — 74.9% | ||||||||
| MONEY MARKET FUNDS - 74.9% | ||||||||
| 26,570,291 | Fidelity Government Portfolio, Institutional Class, 0.01%(a) (d) | 26,570,291 | ||||||
| 26,570,291 | First American Government Obligations Fund, Class Z, 0.02%(a) (d) | 26,570,291 | ||||||
| TOTAL MONEY MARKET FUNDS (Cost $53,140,582) | 53,140,582 | |||||||
| TOTAL SHORT-TERM INVESTMENTS (Cost $53,140,582) | 53,140,582 | |||||||
21
| QUANTIFIED PATTERN RECOGNITION FUND |
| SCHEDULE OF INVESTMENTS (Continued) |
| June 30, 2021 |
| Units | Fair Value | |||||||
| COLLATERAL FOR SECURITIES LOANED — 2.5% | ||||||||
| 1,785,960 | Mount Vernon Liquid Assets Portfolio, LLC - 0.11% (b)(c) | |||||||
| TOTAL COLLATERAL FOR SECURITIES LOANED (Cost $1,785,960) | $ | 1,785,960 | ||||||
| TOTAL INVESTMENTS — 98.2% (Cost $69,618,704) | $ | 69,668,338 | ||||||
| OTHER ASSETS IN EXCESS OF LIABILITIES- 1.8% | 1,284,614 | |||||||
| NET ASSETS - 100.0% | $ | 70,952,952 | ||||||
| OPEN FUTURES CONTRACTS | ||||||||||||||
| Number of Contracts | Open Long Futures Contracts | Expiration | Notional Amount | Unrealized Appreciation | ||||||||||
| 33 | CME E-Mini Standard & Poor’s 500 Index Future | 09/17/2021 | $ | 7,076,190 | $ | 88,053 | ||||||||
| TOTAL FUTURES CONTRACTS | ||||||||||||||
ETF - Exchange-Traded Fund
| (a) | All or a portion of the security is on loan. Total loaned securities had a value of $1,750,162 at June 30, 2021. |
| (b) | Rate disclosed is the seven-day effective yield as of June 30, 2021. |
| (c) | Security purchased with cash proceeds of securities lending collateral. |
| (d) | See note 10. |
See accompanying notes to financial statements.
22
| Quantified Tactical Fixed Income Fund |
| Portfolio Review (Unaudited) |
| June 30, 2021 |
The Fund’s performance figures* for the period ended June 30, 2021 as compared to its benchmark:
| Since Inception | ||
| One Year | September 13, 2019 | |
| Quantified Tactical Fixed Income Fund - Investor Class | (6.83)% | 2.32% |
| Bloomberg U.S. Aggregate Bond Index ** | (0.33)% | 4.03% |
Comparison of Change in Value of a $10,000 Investment.
Since Inception through June 30, 2021 +
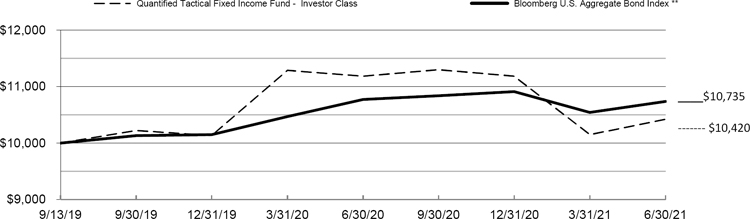
| + | Inception date is September 13, 2019. |
| * | The performance data quoted is historical. Past performance is no guarantee of future results. Current performance may be higher or lower than the performance data quoted. The principal value and investment return of an investment will fluctuate so that your shares, when redeemed, may be worth more or less than their original cost. The returns shown do not reflect the deduction of taxes that a shareholder would pay on Fund distributions or on the redemptions of Fund shares. The Fund’s estimated total annual fund operating expense ratio, as provided in the Fund’s prospectus dated October 31, 2020, was 1.77% for Investor Class shares. For performance information current to the most recent month-end, please call 1-855-647-8268. Investors should consider the investment objectives, risks, and charges and expenses of the Fund carefully before investing. The Fund’s prospectus and summary prospectus contain these as well as other information about the Fund and should be read carefully before investing. A prospectus or summary prospectus may be obtained by calling 1-855-647-8268. |
| ** | The Bloomberg U.S. Aggregate Bond Index is an unmanaged index comprised of U.S. investment grade, fixed rate bond market securities, including government, government agency, corporate and mortgage-backed securities. Investors cannot invest directly in an index; unlike the Fund’s returns, the index does not reflect any fees or expenses. |
| Portfolio holdings by types of investments as of June 30, 2021 are as follows: | ||||
| Holdings by Type of Investment: ^ | % of Net Assets | |||
| Corporate Bonds | 11.7 | % | ||
| Certificates of Deposit: | ||||
| Banking | 3.5 | % | ||
| Exchange Traded Funds: | ||||
| Debt Funds | 15.1 | % | ||
| Money Market Funds | 49.2 | % | ||
| Collateral For Securities Loaned | 4.4 | % | ||
| Other Assets in Excess of Liabilities | 16.1 | % | ||
| 100.0 | % | |||
| ^ | The Holdings by Type of Investment detail does not include derivative exposure. |
Please refer to the Schedule of Investments in this annual report for a detailed listing of the Fund’s holdings.
23
| QUANTIFIED TACTICAL FIXED INCOME FUND |
| SCHEDULE OF INVESTMENTS |
| June 30, 2021 |
| Shares | Fair Value | |||||||
| EXCHANGE-TRADED FUNDS — 15.1% | ||||||||
| DEBT FUNDS - 15.1% | ||||||||
| 205,000 | Invesco BulletShares 2021 Corporate Bond ETF | $ | 4,325,500 | |||||
| 200,000 | Invesco BulletShares 2022 Corporate Bond ETF | 4,318,000 | ||||||
| 195,000 | Invesco BulletShares 2024 Corporate Bond ETF | 4,327,050 | ||||||
| 85,000 | Invesco Ultra Short Duration ETF(b) | 4,290,800 | ||||||
| 600 | iShares 20+ Year Treasury Bond ETF(b) | 86,610 | ||||||
| 40,000 | iShares Short Treasury Bond ETF(b) | 4,419,600 | ||||||
| 140,000 | SPDR Portfolio Short Term Corporate Bond ETF | 4,382,000 | ||||||
| 26,149,560 | ||||||||
| TOTAL EXCHANGE-TRADED FUNDS (Cost $26,239,907) | 26,149,560 | |||||||
| Principal | Coupon Rate | |||||||||||||||
| Amount ($) | (%) | Maturity | ||||||||||||||
| CORPORATE BONDS — 11.7% | ||||||||||||||||
| BANKING — 1.3% | ||||||||||||||||
| 1,000,000 | Mitsubishi UFJ Financial Group, Inc. (b) | 3.4070 | 03/07/24 | 1,072,021 | ||||||||||||
| 1,000,000 | PNC Financial Services Group, Inc. | 3.9000 | 04/29/24 | 1,086,542 | ||||||||||||
| 2,158,563 | ||||||||||||||||
| ELECTRIC UTILITIES — 1.2% | ||||||||||||||||
| 1,000,000 | Enel Generacion Chile S.A. | 4.2500 | 04/15/24 | 1,071,087 | ||||||||||||
| 1,000,000 | WEC Energy Group, Inc. (b) | 0.8000 | 03/15/24 | 1,002,748 | ||||||||||||
| 2,073,835 | ||||||||||||||||
| ENTERTAINMENT CONTENT — 0.7% | ||||||||||||||||
| 1,000,000 | Walt Disney Company | 7.7500 | 01/20/24 | 1,176,771 | ||||||||||||
| INSTITUTIONAL FINANCIAL SERVICES — 1.2% | ||||||||||||||||
| 1,000,000 | Bank of New York Mellon Corporation | 0.5000 | 04/26/24 | 999,462 | ||||||||||||
| 1,000,000 | Intercontinental Exchange, Inc. | 3.4500 | 09/21/23 | 1,061,939 | ||||||||||||
| 2,061,401 | ||||||||||||||||
| MACHINERY — 0.6% | ||||||||||||||||
| 1,000,000 | Parker-Hannifin Corporation | 2.7000 | 06/14/24 | 1,054,506 | ||||||||||||
| MEDICAL EQUIPMENT & DEVICES — 0.6% | ||||||||||||||||
| 1,000,000 | Becton Dickinson and Company(b) | 3.3630 | 06/06/24 | 1,071,830 | ||||||||||||
| REAL ESTATE INVESTMENT TRUSTS — 1.2% | ||||||||||||||||
| 1,000,000 | Ventas Realty, L.P. | 3.5000 | 04/15/24 | 1,071,043 | ||||||||||||
See accompanying notes to financial statements.
24
| QUANTIFIED TACTICAL FIXED INCOME FUND |
| SCHEDULE OF INVESTMENTS (Continued) |
| June 30, 2021 |
| Principal | Coupon Rate | |||||||||||||||
| Amount ($) | (%) | Maturity | Fair Value | |||||||||||||
| CORPORATE BONDS — 11.7% (Continued) | ||||||||||||||||
| REAL ESTATE INVESTMENT TRUSTS — 1.2% (Continued) | ||||||||||||||||
| 1,000,000 | Welltower, Inc. | 3.6250 | 03/15/24 | $ | 1,072,837 | |||||||||||
| 2,143,880 | ||||||||||||||||
| RETAIL - CONSUMER STAPLES — 0.6% | ||||||||||||||||
| 1,000,000 | 7-Eleven, Inc.(a) | 0.8000 | 02/10/24 | 997,971 | ||||||||||||
| SPECIALTY FINANCE — 0.6% | ||||||||||||||||
| 1,000,000 | Capital One Financial Corp | 3.9000 | 01/29/24 | 1,079,660 | ||||||||||||
| TECHNOLOGY HARDWARE — 1.2% | ||||||||||||||||
| 1,000,000 | Apple, Inc. | 3.0000 | 02/09/24 | 1,061,677 | ||||||||||||
| 1,000,000 | Hewlett Packard Enterprise Company | 1.4500 | 04/01/24 | 1,017,139 | ||||||||||||
| 2,078,816 | ||||||||||||||||
| TECHNOLOGY SERVICES — 0.6% | ||||||||||||||||
| 1,000,000 | International Business Machines Corporation | 3.0000 | 05/15/24 | 1,066,252 | ||||||||||||
| TELECOMMUNICATIONS — 0.6% | ||||||||||||||||
| 1,000,000 | Verizon Communications, Inc. (b) | 0.7500 | 03/22/24 | 1,004,677 | ||||||||||||
| TRANSPORTATION & LOGISTICS — 1.3% | ||||||||||||||||
| 1,000,000 | Ryder System, Inc. | 3.6500 | 03/18/24 | 1,074,996 | ||||||||||||
| 1,000,000 | Union Pacific Corporation | 3.6460 | 02/15/24 | 1,073,253 | ||||||||||||
| 2,148,249 | ||||||||||||||||
| TOTAL CORPORATE BONDS (Cost $20,162,651) | 20,116,411 | |||||||||||||||
| CERTIFICATES OF DEPOSIT — 3.5% | ||||||||||||||||
| BANKING - 3.5% | ||||||||||||||||
| 1,000,000 | Ally Bank | 1.8000 | 10/25/21 | 1,005,735 | ||||||||||||
| 1,000,000 | Flagstar Bank FSB | 1.7500 | 11/15/21 | 1,006,573 | ||||||||||||
| 1,000,000 | Morgan Stanley Bank NA | 1.8500 | 01/09/23 | 1,025,912 | ||||||||||||
| 1,000,000 | Raymond James Bank NA | 1.7000 | 11/08/21 | 1,006,058 | ||||||||||||
| 1,000,000 | Stearns Bank NA | 1.6000 | 07/08/21 | 1,000,348 | ||||||||||||
| 1,000,000 | Wells Fargo Bank NA | 1.9500 | 10/18/21 | 1,005,745 | ||||||||||||
| 6,050,371 | ||||||||||||||||
See accompanying notes to financial statements.
25
| QUANTIFIED TACTICAL FIXED INCOME FUND |
| SCHEDULE OF INVESTMENTS (Continued) |
| June 30, 2021 |
| Shares | Fair Value | |||||||
| TOTAL CERTIFICATES OF DEPOSIT (Cost $6,000,000) | $ | 6,050,371 | ||||||
| SHORT-TERM INVESTMENTS — 49.2% | ||||||||
| MONEY MARKET FUNDS - 49.2% | ||||||||
| 42,436,548 | Fidelity Government Portfolio, Institutional Class, 0.01%(b) | $ | 42,436,548 | |||||
| 42,436,548 | First American Government Obligations Fund, Class Z, 0.02%(b) | 42,436,548 | ||||||
| TOTAL MONEY MARKET FUNDS (Cost $84,873,096) | 84,873,096 | |||||||
| TOTAL SHORT-TERM INVESTMENTS (Cost $84,873,096) | 84,873,096 | |||||||
| Units | ||||||||
| COLLATERAL FOR SECURITIES LOANED — 4.4% | ||||||||
| 7,630,450 | Mount Vernon Liquid Assets Portfolio, LLC - 0.11% (b)(c) | |||||||
| TOTAL COLLATERAL FOR SECURITIES LOANED (Cost $7,630,450) | 7,630,450 | |||||||
| TOTAL INVESTMENTS — 83.9% (Cost $144,906,104) | $ | 144,819,888 | ||||||
| OTHER ASSETS IN EXCESS OF LIABILITIES- 16.1% | 27,775,690 | |||||||
| NET ASSETS - 100.0% | $ | 172,595,578 | ||||||
| OPEN FUTURES CONTRACTS | ||||||||||||||
| Number of Contracts | Open Short Futures Contracts | Expiration | Notional Amount | Unrealized Depreciation | ||||||||||
| 109 | CME Ultra Long-Term US Treasury Bond Futures | 09/21/2021 | $ | 21,002,992 | $ | (17,113 | ) | |||||||
ETF - Exchange-Traded Fund
| (a) | Security exempt from registration under Rule 144A or Section 4(2) of the Securities Act of 1933. The security may be resold in transactions exempt from registration, normally to qualified institutional buyers. As of June 30, 2021, the total market value of 144A securities is $997,971 or 0.6% of net assets. |
| (b) | All or a portion of the security is on loan. Total loaned securities had a value of $7,477,302 at June 30, 2021. |
| (c) | Rate disclosed is the seven-day effective yield as of June 30, 2021. |
| (d) | Security purchased with cash proceeds of securities lending collateral. |
| TOTAL RETURN SWAPS | |||||||||||||||||||||
| Number of | Notional Amount at | Termination | Unrealized | ||||||||||||||||||
| Shares | Reference Entity | June 30, 2021 | Interest Rate Payable (1) | Date | Counterparty | Appreciation | |||||||||||||||
| Long Position: | |||||||||||||||||||||
| 103,300 | iShares iBoxx $High Yield Corporate Bond ETF | $ | 9,094,532 | 1-Mth USD LIBOR plus 20 bp | 7/29/2022 | BRC | $ | 116,413 | |||||||||||||
| 91,000 | PIMCO 0-5 Year High Yield Corporate Bond Index ETF | 9,094,540 | 1-Mth USD LIBOR plus 20 bp | 7/29/2022 | BRC | 113,401 | |||||||||||||||
| 82,600 | SPDR Bloomberg Barclays High Yield Bond ETF | 9,082,696 | 1-Mth USD LIBOR plus 20 bp | 7/29/2022 | BRC | 124,122 | |||||||||||||||
| Total: | $ | 353,936 | |||||||||||||||||||
BRC - Barclays Capital
LIBOR - London Interbank Offered Rate
| (1) | Interest rate is based upon predetermined notional amounts, which may be a multiple of the number of shares plus a specified spread. |
See accompanying notes to financial statements.
26
| Quantified Evolution Plus Fund |
| Portfolio Review (Unaudited) |
| June 30, 2021 |
The Fund’s performance figures* for the period ended June 30, 2021, as compared to its benchmark:
| Since Inception | ||
| One year | September 30, 2019 | |
| Quantified Evolution Plus Fund - Investor Class | 13.50% | 0.66% |
| S&P 500 Total Return Index ** | 40.79% | 25.50% |
Comparison of Change in Value of a $10,000 Investment.
Since Inception through June 30, 2021 +
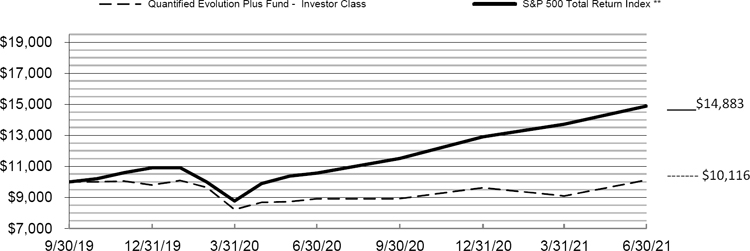
| + | Inception date is September 30, 2019. |
| * | The performance data quoted is historical. Past performance is no guarantee of future results. Current performance may be higher or lower than the performance data quoted. The principal value and investment return of an investment will fluctuate so that your shares, when redeemed, may be worth more or less than their original cost. The returns shown do not reflect the deduction of taxes that a shareholder would pay on Fund distributions or on the redemptions of Fund shares. The Fund’s estimated total annual fund operating expense ratio, as provided in the Fund’s prospectus dated October 31, 2020 was 1.81% for Investor Class shares. For performance information current to the most recent month-end, please call 1-855-647-8268. Investors should consider the investment objectives, risks, and charges and expenses of the Fund carefully before investing. The Fund’s prospectus and summary prospectus contain these as well as other information about the Fund and should be read carefully before investing. A prospectus or summary prospectus may be obtained by calling 1-855-647-8268. |
| ** | The S&P 500 Total Return Index is an unmanaged composite of 500 large capitalization companies and includes the reinvestment of dividends. This index is widely used by professional investors as a performance benchmark for large-cap stocks. Investors may not invest in an index directly; unlike the Fund’s returns, the index does not reflect any fees or expenses. |
| Portfolio holdings by types of investments as of June 30, 2021 are as follows: | ||||
| Holdings by Type of Investment: ^ | % of Net Assets | |||
| Certificates of Deposit: | ||||
| Banking | 3.5 | % | ||
| Exchange Traded Funds: | ||||
| Debt Funds | 14.9 | % | ||
| Equity Funds | 0.2 | % | ||
| Money Market Funds | 55.3 | % | ||
| Collateral For Securities Loaned | 2.3 | % | ||
| Other Assets in Excess of Liabilities | 23.8 | % | ||
| 100.0 | % | |||
| ^ | The Holdings by Type of Investment detail does not include derivative exposure. |
Please refer to the Schedule of Investments in this annual report for a detailed listing of the Fund’s holdings.
27
| QUANTIFIED EVOLUTION PLUS FUND |
| CONSOLIDATED SCHEDULE OF INVESTMENTS |
| June 30, 2021 |
| Shares | Fair Value | |||||||
| EXCHANGE-TRADED FUNDS — 15.1% | ||||||||
| EQUITY FUNDS - 0.2% | ||||||||
| 150 | Invesco QQQ Trust Series 1 | $ | 53,165 | |||||
| 300 | iShares Russell 2000 ETF | 68,811 | ||||||
| 150 | iShares U.S. Real Estate ETF | 15,291 | ||||||
| 137,267 | ||||||||
| DEBT FUNDS - 14.9% | ||||||||
| 70,100 | Invesco BulletShares 2021 Corporate Bond ETF | 1,479,109 | ||||||
| 66,000 | Invesco BulletShares 2022 Corporate Bond ETF | 1,424,940 | ||||||
| 66,000 | Invesco BulletShares 2024 Corporate Bond ETF | 1,464,540 | ||||||
| 29,000 | Invesco Ultra Short Duration ETF | 1,463,920 | ||||||
| 13,000 | iShares Short Treasury Bond ETF(d) | 1,436,370 | ||||||
| 47,000 | SPDR Portfolio Short Term Corporate Bond ETF | 1,471,100 | ||||||
| 8,739,979 | ||||||||
| TOTAL EXCHANGE-TRADED FUNDS (Cost $8,887,780) | 8,877,246 | |||||||
| Principal | Coupon Rate | |||||||||||||||
| Amount ($) | (%) | Maturity | ||||||||||||||
| CERTIFICATES OF DEPOSIT — 3.5% | ||||||||||||||||
| BANKING - 3.5% | ||||||||||||||||
| 1,000,000 | Raymond James Bank NA | 1.7000 | 11/08/21 | 1,006,058 | ||||||||||||
| 1,000,000 | Sallie Mac Bank/Salt Lake | 1.8500 | 11/07/22 | 1,023,442 | ||||||||||||
| 2,029,500 | ||||||||||||||||
| TOTAL CERTIFICATES OF DEPOSIT (Cost $2,000,000) | 2,029,500 | |||||||||||||||
| Shares | ||||||||
| SHORT-TERM INVESTMENTS — 55.3% | ||||||||
| MONEY MARKET FUNDS - 55.3% | ||||||||
| 15,778,398 | Fidelity Government Portfolio, Institutional Class, 0.01%(a) (e) | 15,778,398 | ||||||
| 948,371 | First American Government Obligations Fund, Class X, 0.03%(a)(b) | 948,371 | ||||||
| 15,778,398 | First American Government Obligations Fund, Class Z, 0.02%(a) (e) | 15,778,398 | ||||||
| TOTAL MONEY MARKET FUNDS (Cost $32,505,167) | 32,505,167 | |||||||
| TOTAL SHORT-TERM INVESTMENTS (Cost $32,505,167) | 32,505,167 | |||||||
See accompanying notes to financial statements.
28
| QUANTIFIED EVOLUTION PLUS FUND |
| CONSOLIDATED SCHEDULE OF INVESTMENTS (Continued) |
| June 30, 2021 |
| Units | Fair Value | |||||||
| COLLATERAL FOR SECURITIES LOANED — 2.3% | ||||||||
| 1,354,128 | Mount Vernon Liquid Assets Portfolio, LLC - 0.11% (a)(c) | |||||||
| TOTAL COLLATERAL FOR SECURITIES LOANED (Cost $1,354,128) | $ | 1,354,128 | ||||||
| TOTAL INVESTMENTS — 76.2% (Cost $44,747,075) | $ | 44,766,041 | ||||||
| OTHER ASSETS IN EXCESS OF LIABILITIES- 23.8% | 13,978,072 | |||||||
| NET ASSETS - 100.0% | $ | 58,744,113 | ||||||
| OPEN FUTURES CONTRACTS | ||||||||||||||
| Number of Contracts | Open Long Futures Contracts | Expiration | Notional Amount | Unrealized Appreciation (Depreciation) | ||||||||||
| 1,180 | CBOT Dow Jones US Real Estate Futures | 09/17/2021 | $ | 46,834,200 | $ | (1,038,167 | ) | |||||||
| 20 | CME E-Mini NASDAQ 100 Index Futures | 09/17/2021 | 5,819,600 | 168,591 | ||||||||||
| 40 | CME E-Mini Russell 2000 Index Futures | 09/17/2021 | 4,615,600 | (18,527 | ) | |||||||||
| 104 | CME E-Mini Standard & Poor’s 500 Index Futures | 09/17/2021 | 22,300,720 | 147,750 | ||||||||||
| TOTAL FUTURES CONTRACTS | $ | (740,353 | ) | |||||||||||
ETF - Exchange-Traded Fund
| * | - Non-Income producing investment |
| (a) | Rate disclosed is the seven-day effective yield as of June 30, 2021. |
| (b) | All or part of this instrument is a holding of QEPF Fund Limited. |
| (c) | Security purchased with cash proceeds of securities lending collateral. |
| (d) | All or a portion of the security is on loan. Total loaned securities had a value of $1,326,985 at June 30, 2021 |
| (e) | See note 10. |
| TOTAL RETURN SWAPS | ||||||||||||||||||||
| Number of | Notional Amount | Termination | Unrealized | |||||||||||||||||
| Shares | Reference Entity | at June 30, 2021 | Interest Rate Payable (1) | Date | Counterparty | (Depreciation) | ||||||||||||||
| Long Position: | ||||||||||||||||||||
| 560,000 | Vanguard FTSE Europe ETF | $ | 37,665,600 | 1-Mth USD LIBOR plus 20 bp | 7/19/2021 | BRC | $ | (653,158 | ) | |||||||||||
BRC - Barclays Capital
LIBOR - London Interbank Offered Rate
| (1) | Interest rate is based upon predetermined notional amounts, which may be a multiple of the number of shares plus a specified spread. |
See accompanying notes to financial statements.
29
| Quantified Common Ground Fund |
| Portfolio Review (Unaudited) |
| June 30, 2021 |
The Fund’s performance figures* for the period ended June 30, 2021, as compared to its benchmark:
| Since Inception | ||
| One Year | December 27, 2019 | |
| Quantified Common Ground Fund - Investor Class | 38.99% | 19.12% |
| S&P Composite 1500 Total Return Index ** | 42.12% | 22.60% |
Comparison of Change in Value of a $10,000 Investment.
Since Inception through June 30, 2021 +
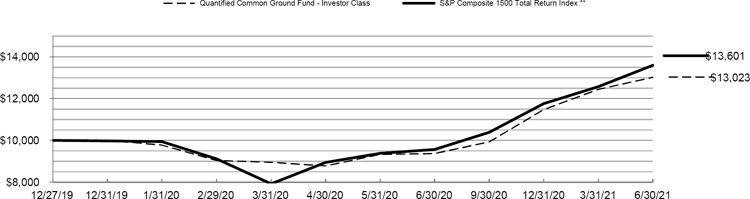
| + | Inception date is December 27, 2019. |
| * | The performance data quoted is historical. Past performance is no guarantee of future results. Current performance may be higher or lower than the performance data quoted. The principal value and investment return of an investment will fluctuate so that your shares, when redeemed, may be worth more or less than their original cost. The returns shown do not reflect the deduction of taxes that a shareholder would pay on Fund distributions or on the redemptions of Fund shares. The Fund’s estimated total annual fund operating expense ratio, as provided in the Fund’s prospectus dated October 31, 2020, was 1.86% for Investor Class shares. For performance information current to the most recent month-end, please call 1-855-647-8268. Investors should consider the investment objectives, risks, and charges and expenses of the Fund carefully before investing. The Fund’s prospectus and summary prospectus contain these as well as other information about the Fund and should be read carefully before investing. A prospectus or summary prospectus may be obtained by calling 1-855-647-8268. |
| ** | The S&P Composite 1500® combines three leading indices, the S&P 500®, the S&P MidCap 400®, and the S&P SmallCap 600®, to cover approximately 90% of U.S. market capitalization. It is designed for investors seeking to replicate the performance of the U.S. equity market or benchmark against a representative universe of tradable stocks. Investors cannot invest directly in an index; unlike the Fund’s returns, the index does not reflect any fees or expenses. |
| Portfolio holdings by types of investments as of June 30, 2021 are as follows: | ||||
| Holdings by Type of Investment ^: | % of Net Assets | |||
| Common Stocks | 94.3 | % | ||
| Money Market Funds | 5.0 | % | ||
| Collateral For Securities Loaned | 13.8 | % | ||
| Liabilities in Excess of Other Assets | (13.1 | )% | ||
| 100.0 | % | |||
| ^ | The Holdings by type of Investment detail does not include derivative exposure. |
Please refer to the Schedule of Investments in this annual report for a detailed listing of the Fund’s holdings.
30
| QUANTIFIED COMMON GROUND FUND |
| SCHEDULE OF INVESTMENTS |
| June 30, 2021 |
| Shares | Fair Value | |||||||
| COMMON STOCKS — 94.3% | ||||||||
| APPAREL & TEXTILE PRODUCTS - 8.0% | ||||||||
| 8,123 | Deckers Outdoor Corporation(a) | $ | 3,119,802 | |||||
| 25,221 | Tapestry, Inc. | 1,096,609 | ||||||
| 4,216,411 | ||||||||
| AUTOMOTIVE - 2.9% | ||||||||
| 52,508 | Goodyear Tire & Rubber Company | 900,512 | ||||||
| 4,847 | Visteon Corporation(a) | 586,196 | ||||||
| 1,486,708 | ||||||||
| BANKING - 1.4% | ||||||||
| 21,669 | Great Western Bancorp, Inc. | 710,527 | ||||||
| BIOTECH & PHARMA - 1.6% | ||||||||
| 9,942 | Incyte Corporation(a) | 836,420 | ||||||
| CHEMICALS - 2.2% | ||||||||
| 4,663 | Celanese Corporation | 706,911 | ||||||
| 4,112 | FMC Corporation | 444,918 | ||||||
| 1,151,829 | ||||||||
| COMMERCIAL SUPPORT SERVICES - 3.7% | ||||||||
| 20,222 | AMN Healthcare Services, Inc.(a) | 1,961,129 | ||||||
| CONSUMER SERVICES - 0.5% | ||||||||
| 8,522 | American Public Education, Inc.(a) | 241,513 | ||||||
| ELECTRIC UTILITIES - 0.7% | ||||||||
| 13,651 | AES Corporation | 355,882 | ||||||
| FORESTRY, PAPER & WOOD PRODUCTS - 4.5% | ||||||||
| 4,372 | Boise Cascade Company | 255,106 | ||||||
| 16,366 | Domtar Corporation | 899,475 | ||||||
| 19,246 | Louisiana-Pacific Corporation(b) | 1,160,342 | ||||||
| 2,314,923 | ||||||||
| GAS & WATER UTILITIES - 1.2% | ||||||||
| 26,279 | NiSource, Inc. | 643,835 | ||||||
| HEALTH CARE FACILITIES & SERVICES - 15.3% | ||||||||
| 45,285 | Community Health Systems, Inc.(a)(b) | 699,200 | ||||||
| 11,548 | HCA Healthcare, Inc. | 2,387,434 | ||||||
See accompanying notes to financial statements.
31
| QUANTIFIED COMMON GROUND FUND |
| SCHEDULE OF INVESTMENTS (Continued) |
| June 30, 2021 |
| Shares | Fair Value | |||||||
| COMMON STOCKS — 94.3% (Continued) | ||||||||
| HEALTH CARE FACILITIES & SERVICES - 15.3% (Continued) | ||||||||
| 1,476 | IQVIA Holdings, Inc.(a) | $ | 357,664 | |||||
| 32,676 | Magellan Health, Inc.(a) (b) | 3,078,080 | ||||||
| 21,610 | Tenet Healthcare Corporation(a) (b) | 1,447,654 | ||||||
| 7,970,032 | ||||||||
| HOME & OFFICE PRODUCTS - 0.8% | ||||||||
| 9,654 | HNI Corporation | 424,486 | ||||||
| HOME CONSTRUCTION - 5.4% | ||||||||
| 25,134 | Interface, Inc. | 384,550 | ||||||
| 60,230 | KB Home | 2,452,566 | ||||||
| 2,837,116 | ||||||||
| LEISURE FACILITIES & SERVICES - 1.0% | ||||||||
| 3,388 | Cracker Barrel Old Country Store, Inc. | 502,982 | ||||||
| LEISURE PRODUCTS - 1.8% | ||||||||
| 27,363 | Callaway Golf Company | 922,954 | ||||||
| MACHINERY - 1.6% | ||||||||
| 1,678 | Deere & Company(b) | 591,848 | ||||||
| 1,807 | Oshkosh Corporation | 225,224 | ||||||
| 817,072 | ||||||||
| METALS & MINING - 3.6% | ||||||||
| 31,878 | Cleveland-Cliffs, Inc. (b) | 687,290 | ||||||
| 31,804 | Freeport-McMoRan, Inc. | 1,180,246 | ||||||
| 1,867,536 | ||||||||
| OIL & GAS PRODUCERS - 0.5% | ||||||||
| 11,532 | APA Corporation | 249,437 | ||||||
| OIL & GAS SERVICES & EQUIPMENT - 2.6% | ||||||||
| 44,834 | Baker Hughes Company | 1,025,353 | ||||||
| 10,556 | Schlumberger N.V. | 337,898 | ||||||
| 1,363,251 | ||||||||
| RETAIL - DISCRETIONARY - 3.2% | ||||||||
| 24,286 | American Eagle Outfitters, Inc. (b) | 911,454 | ||||||
| 27,976 | Guess?, Inc. (b) | 738,566 | ||||||
| 1,650,020 | ||||||||
See accompanying notes to financial statements.
32
| QUANTIFIED COMMON GROUND FUND |
| SCHEDULE OF INVESTMENTS (Continued) |
| June 30, 2021 |
| Shares | Fair Value | |||||||
| COMMON STOCKS — 94.3% (Continued) | ||||||||
| SEMICONDUCTORS - 11.4% | ||||||||
| 2,175 | Advanced Micro Devices, Inc.(a) | $ | 204,298 | |||||
| 14,997 | Kulicke & Soffa Industries, Inc. (b) | 917,816 | ||||||
| 3,328 | NVIDIA Corporation | 2,662,733 | ||||||
| 15,892 | Teradyne, Inc. | 2,128,892 | ||||||
| 5,913,739 | ||||||||
| SOFTWARE - 4.5% | ||||||||
| 12,514 | Omnicell, Inc.(a) (b) | 1,895,245 | ||||||
| 8,911 | Teradata Corporation(a) (b) | 445,283 | ||||||
| 2,340,528 | ||||||||
| SPECIALTY FINANCE - 7.8% | ||||||||
| 9,748 | Alliance Data Systems Corporation | 1,015,644 | ||||||
| 144,997 | SLM Corporation | 3,036,237 | ||||||
| 4,051,881 | ||||||||
| STEEL - 2.4% | ||||||||
| 21,070 | Steel Dynamics, Inc. | 1,255,772 | ||||||
| TECHNOLOGY HARDWARE - 2.9% | ||||||||
| 6,112 | Arrow Electronics, Inc.(a) | 695,729 | ||||||
| 18,072 | NCR Corporation(a) | 824,264 | ||||||
| 1,519,993 | ||||||||
| TECHNOLOGY SERVICES - 2.2% | ||||||||
| 1,638 | CDW Corporation/DE | 286,077 | ||||||
| 21,651 | DXC Technology Company | 843,090 | ||||||
| 1,129,167 | ||||||||
| WHOLESALE - DISCRETIONARY - 0.6% | ||||||||
| 16,418 | KAR Auction Services, Inc. (b) | 288,136 | ||||||
| TOTAL COMMON STOCKS (Cost $48,345,447) | 49,023,279 | |||||||
| SHORT-TERM INVESTMENTS — 5.0% | ||||||||
| MONEY MARKET FUNDS - 5.0% | ||||||||
| 1,290,487 | Fidelity Government Portfolio, Institutional Class, 0.01%(c) | 1,290,487 | ||||||
| 1,290,487 | First American Government Obligations Fund, Class Z, 0.02%(c) | 1,290,487 | ||||||
| TOTAL MONEY MARKET FUNDS (Cost $2,580,974) | 2,580,974 | |||||||
| TOTAL SHORT-TERM INVESTMENTS (Cost $2,580,974) | 2,580,974 | |||||||
See accompanying notes to financial statements.
33
| QUANTIFIED COMMON GROUND FUND |
| SCHEDULE OF INVESTMENTS (Continued) |
| June 30, 2021 |
| Units | Fair Value | |||||||
| COLLATERAL FOR SECURITIES LOANED — 13.8% | ||||||||
| 7,163,955 | Mount Vernon Liquid Assets Portfolio, LLC - 0.11% (c)(d) | |||||||
| TOTAL COLLATERAL FOR SECURITIES LOANED (Cost $7,163,955) | $ | 7,163,955 | ||||||
| TOTAL INVESTMENTS — 113.1% (Cost $58,090,376) | $ | 58,768,208 | ||||||
| LIABILITIES IN EXCESS OF OTHER ASSETS — (13.1)% | (6,787,032) | |||||||
| NET ASSETS - 100.0% | $ | 51,981,176 | ||||||
N.V. - Dutch Limited Liability Company
| (a) | Non-income producing security. |
| (b) | All or a portion of the security is on loan. Total loaned securities had a value of $7,102,226 at June 30, 2021. |
| (c) | Rate disclosed is the seven-day effective yield as of June 30, 2021. |
| (d) | Security purchased with cash proceeds of securities lending collateral. |
See accompanying notes to financial statements.
34
| Quantified Tactical Sectors Fund |
| Portfolio Review (Unaudited) |
| June 30, 2021 |
The Fund’s performance figures* for the period ended June 30, 2021, as compared to its benchmark:
| Since Inception | |
| March 4, 2021 | |
| Quantified Tactical Sectors Fund - Investor Class | 5.60% |
| S&P 500 Total Return Index ** | 14.56% |
Comparison of Change in Value of a $10,000 Investment.
Since Inception through June 30, 2020 +
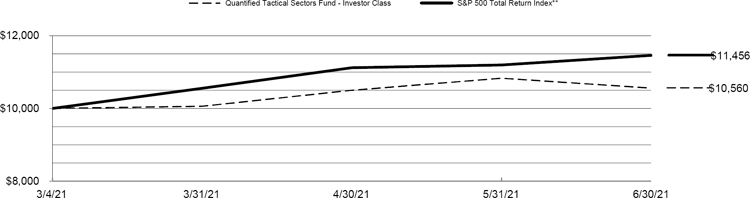
| + | Inception date is March 4, 2021. |
| * | The performance data quoted is historical. Past performance is no guarantee of future results. Current performance may be higher or lower than the performance data quoted. The principal value and investment return of an investment will fluctuate so that your shares, when redeemed, may be worth more or less than their original cost. The returns shown do not reflect the deduction of taxes that a shareholder would pay on Fund distributions or on the redemptions of Fund shares. The Fund’s estimated total annual fund operating expense ratio, as provided in the Fund’s prospectus dated February 24, 2021 was 1.77% for Investor Class shares. For performance information current to the most recent month-end, please call 1-855-647-8268. Investors should consider the investment objectives, risks, and charges and expenses of the Fund carefully before investing. The Fund’s prospectus and summary prospectus contain these as well as other information about the Fund and should be read carefully before investing. A prospectus or summary prospectus may be obtained by calling 1-855-647-8268. |
| ** | The S&P 500 Total Return Index is an unmanaged composite of 500 large capitalization companies and includes the reinvestment of dividends. This index is widely used by professional investors as a performance benchmark for large-cap stocks. Investors may not invest in an index directly; unlike the Fund’s returns, the index does not reflect any fees or expenses. |
| Portfolio holdings by types of investments as of June 30, 2021 are as follows: | ||||
| Holdings by Type of Investment ^: | % of Net Assets | |||
| Exchange-Traded Funds | ||||
| Equity Funds | 67.8 | % | ||
| Money Market Funds | 32.6 | % | ||
| Collateral For Securities Loaned | 9.8 | % | ||
| Liabilities in Excess of Other Assets | (10.2 | )% | ||
| 100.0 | % | |||
| ^ | The Holdings by type of Investment detail does not include derivative exposure. |
Please refer to the Schedule of Investments in this annual report for a detailed listing of the Fund’s holdings.
35
| QUANTIFIED TACTICAL SECTORS FUND |
| SCHEDULE OF INVESTMENTS |
| June 30, 2021 |
| Shares | Fair Value | |||||||
| EXCHANGE-TRADED FUNDS — 67.8% | ||||||||
| EQUITY FUNDS - 67.8% | ||||||||
| 90,595 | iShares U.S. Real Estate ETF | $ | 9,235,254 | |||||
| 140,484 | SPDR S&P Regional Banking ETF(a) | 9,205,917 | ||||||
| 97,019 | SPDR S&P Retail ETF(a) | 9,433,157 | ||||||
| 40,673 | VanEck Vectors Oil Services ETF(a) | 8,904,540 | ||||||
| 36,778,868 | ||||||||
| TOTAL EXCHANGE-TRADED FUNDS (Cost $36,342,309) | 36,778,868 | |||||||
| Shares | ||||||||
| SHORT-TERM INVESTMENTS — 32.6% | ||||||||
| MONEY MARKET FUNDS - 32.6% | ||||||||
| 8,840,002 | Fidelity Government Portfolio, Institutional Class, 0.01%(b) | 8,840,001 | ||||||
| 8,840,002 | First American Government Obligations Fund, Class Z, 0.02%(b) | 8,840,002 | ||||||
| TOTAL MONEY MARKET FUNDS (Cost $17,680,003) | 17,680,003 | |||||||
| TOTAL SHORT-TERM INVESTMENTS (Cost $17,680,003) | 17,680,003 | |||||||
| Units | ||||||||
| COLLATERAL FOR SECURITIES LOANED — 9.8% | ||||||||
| 5,344,246 | Mount Vernon Liquid Assets Portfolio, LLC - 0.11% (b)(c) | |||||||
| TOTAL COLLATERAL FOR SECURITIES LOANED (Cost $5,344,246) | 5,344,246 | |||||||
| TOTAL INVESTMENTS - 110.2% (Cost $59,366,558) | $ | 59,803,117 | ||||||
| LIABILITIES IN EXCESS OF OTHER ASSETS - (10.2)% | (5,551,848 | ) | ||||||
| NET ASSETS - 100.0% | $ | 54,251,269 | ||||||
ETF - Exchange-Traded Fund
| (a) | All or a portion of the security is on loan. Total loaned securities had a value of $5,262,683 at June 30, 2021. |
| (b) | Rate disclosed is the seven-day effective yield as of June 30, 2021. |
| (c) | Security purchased with cash proceeds of securities lending collateral. |
See accompanying notes to financial statements.
36
| QUANTIFIED TACTICAL SECTORS FUND |
| SCHEDULE OF INVESTMENTS (Continued) |
| June 30, 2021 |
| TOTAL RETURN SWAPS | ||||||||||||||||||||||
| Unrealized | ||||||||||||||||||||||
| Number of | Notional Amount | Termination | Appreciation | |||||||||||||||||||
| Shares | Reference Entity | at June 30, 2021 | Interest Rate Payable (1) | Date | Counterparty | (Depreciation) | ||||||||||||||||
| Long Position: | ||||||||||||||||||||||
| 181,060 | iShare US Real Estate ETF | $ | 18,457,256 | 1-Mth USD LIBOR plus 30 bp | 7/21/2022 | BRC | $ | (187,129 | ) | |||||||||||||
| 280,620 | SPDR S&P Regional Banking ETF | 18,389,029 | 1-Mth USD LIBOR plus 30 bp | 7/19/2021 | BRC | (989,683 | ) | |||||||||||||||
| 193,890 | SPDR S&P Retail ETF | 18,851,925 | 1-Mth USD LIBOR plus 30 bp | 7/15/2022 | BRC | 647,498 | ||||||||||||||||
| 81,430 | VanEck Vectors Oil Services ETF | 17,827,470 | 1-Mth USD LIBOR plus 30 bp | 6/9/2022 | BRC | 187,287 | ||||||||||||||||
| Total: | $ | (342,027 | ) | |||||||||||||||||||
BRC - Barclays Capital
LIBOR - London Interbank Offered Rate
| (1) | Interest rate is based upon predetermined notional amounts, which may be a multiple of the number of shares plus a specified spread. |
See accompanying notes to financial statements.
37
| Quantified Rising Dividend Tactical Fund |
| Portfolio Review (Unaudited) |
| June 30, 2021 |
The Fund’s performance figures* for the period ended June 30, 2021, as compared to its benchmark:
| Since Inception | |
| April 14, 2021 | |
| Quantified Rising Dividend Tactical Fund - Investor Class | 2.40% |
| S&P 500 Total Return Index ** | 4.49% |
Comparison of Change in Value of a $10,000 Investment.
Since Inception through June 30, 2020 +
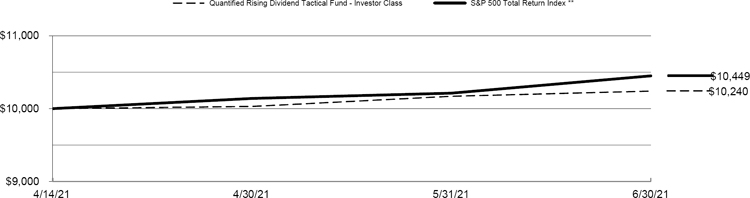
| + | Inception date is April 14, 2021. |
| * | The performance data quoted is historical. Past performance is no guarantee of future results. Current performance may be higher or lower than the performance data quoted. The principal value and investment return of an investment will fluctuate so that your shares, when redeemed, may be worth more or less than their original cost. The returns shown do not reflect the deduction of taxes that a shareholder would pay on Fund distributions or on the redemptions of Fund shares. The Fund’s estimated total annual fund operating expense ratio, as provided in the Fund’s prospectus dated April 12, 2021 was 1.87% for Investor Class shares. For performance information current to the most recent month-end, please call 1-855-647-8268. Investors should consider the investment objectives, risks, and charges and expenses of the Fund carefully before investing. The Fund’s prospectus and summary prospectus contain these as well as other information about the Fund and should be read carefully before investing. A prospectus or summary prospectus may be obtained by calling 1-855-647-8268. |
| ** | The S&P 500 Total Return Index is an unmanaged composite of 500 large capitalization companies and includes the reinvestment of dividends. This index is widely used by professional investors as a performance benchmark for large-cap stocks. Investors may not invest in an index directly; unlike the Fund’s returns, the index does not reflect any fees or expenses. |
| Portfolio holdings by types of investments as of June 30, 2021 are as follows: | ||||
| Holdings by Type of Investment ^: | % of Net Assets | |||
| Exchange Traded Funds | ||||
| Equity Funds | 93.0 | % | ||
| Money Market Funds | 7.1 | % | ||
| Liabilities in Excess of Other Assets | (0.1 | )% | ||
| 100.0 | % | |||
| ^ | The Holdings by type of Investment detail does not include derivative exposure. |
Please refer to the Schedule of Investments in this annual report for a detailed listing of the Fund’s holdings.
38
| QUANTIFIED RISING DIVIDEND TACTICAL FUND |
| SCHEDULE OF INVESTMENTS |
| June 30, 2021 |
| Shares | Fair Value | |||||||
| EXCHANGE-TRADED FUNDS — 93.0% | ||||||||
| EQUITY FUNDS - 93.0% | ||||||||
| 8,588 | Invesco QQQ Trust Series 1 | $ | 3,043,845 | |||||
| 26,910 | Invesco S&P 500 Equal Weight ETF | 4,056,144 | ||||||
| 65,157 | Invesco S&P 500 Low Volatility ETF | 3,968,713 | ||||||
| 32,365 | Vanguard Dividend Appreciation ETF | 5,009,778 | ||||||
| 45,731 | Vanguard International Dividend Appreciation ETF | 4,000,548 | ||||||
| 20,079,028 | ||||||||
| TOTAL EXCHANGE-TRADED FUNDS (Cost $19,601,970) | 20,079,028 | |||||||
| SHORT-TERM INVESTMENTS — 7.1% | ||||||||
| MONEY MARKET FUNDS - 7.1% | ||||||||
| 761,578 | Fidelity Government Portfolio, Institutional Class, 0.01%(a) | 761,578 | ||||||
| 761,578 | First American Government Obligations Fund, Class Z, 0.02%(a) | 761,579 | ||||||
| TOTAL MONEY MARKET FUNDS (Cost $1,523,157) | 1,523,157 | |||||||
| TOTAL SHORT-TERM INVESTMENTS (Cost $1,523,157) | 1,523,157 | |||||||
| TOTAL INVESTMENTS - 100.1% (Cost $21,125,127) | $ | 21,602,185 | ||||||
| LIABILITIES IN EXCESS OF OTHER ASSETS — (0.1)% | (23,848 | ) | ||||||
| NET ASSETS - 100.0% | $ | 21,578,337 | ||||||
ETF - Exchange-Traded Fund
| (a) | Rate disclosed is the seven-day effective yield as of June 30, 2021. |
See accompanying notes to financial statements.
39
| Quantified Government Income Tactical Fund |
| Portfolio Review (Unaudited) |
| June 30, 2021 |
The Fund’s performance figures* for the period ended June 30, 2021, as compared to its benchmark:
| Since Inception | |
| April 15, 2021 | |
| Quantified Government Income Tactical Fund - Investor Class | 0.90% |
| Bloomberg U.S. Aggregate Bond Index ** | 0.76% |
Comparison of Change in Value of a $10,000 Investment.
Since Inception through June 30, 2020 +
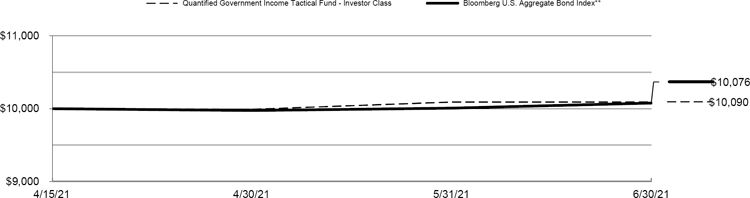
| + | Inception date is April 15, 2021. |
| * | The performance data quoted is historical. Past performance is no guarantee of future results. Current performance may be higher or lower than the performance data quoted. The principal value and investment return of an investment will fluctuate so that your shares, when redeemed, may be worth more or less than their original cost. The returns shown do not reflect the deduction of taxes that a shareholder would pay on Fund distributions or on the redemptions of Fund shares. The Fund’s estimated total annual fund operating expense ratio, as provided in the Fund’s prospectus dated April 12, 2021 was 1.77% for Investor Class shares. For performance information current to the most recent month-end, please call 1-855-647-8268. Investors should consider the investment objectives, risks, and charges and expenses of the Fund carefully before investing. The Fund’s prospectus and summary prospectus contain these as well as other information about the Fund and should be read carefully before investing. A prospectus or summary prospectus may be obtained by calling 1-855-647-8268. |
| ** | The Bloomberg U.S. Aggregate Bond Index is an unmanaged index comprised of U.S. investment grade, fixed rate bond market securities, including government, government agency, corporate and mortgage-backed securities. Investors cannot invest directly in an index; unlike the Fund’s returns, the index does not reflect any fees or expenses. |
| Portfolio holdings by types of investments as of June 30, 2021 are as follows: | ||||
| Holdings by Type of Investment ^: | % of Net Assets | |||
| Exchange Traded Funds | ||||
| Debt Funds | 31.3 | % | ||
| Money Market Funds | 65.1 | % | ||
| Other Assets in Excess of Liabilities | 3.6 | % | ||
| 100.0 | % | |||
| ^ | The Holdings by type of Investment detail does not include derivative exposure. |
Please refer to the Schedule of Investments in this annual report for a detailed listing of the Fund’s holdings.
40
| QUANTIFIED GOVERNMENT INCOME TACTICAL FUND |
| SCHEDULE OF INVESTMENTS |
| June 30, 2021 |
| Shares | Fair Value | |||||||
| EXCHANGE-TRADED FUNDS — 31.3% | ||||||||
| DEBT FUNDS - 31.3% | ||||||||
| 15,000 | Invesco BulletShares 2021 Corporate Bond ETF | $ | 316,500 | |||||
| 15,000 | Invesco BulletShares 2022 Corporate Bond ETF | 323,850 | ||||||
| 15,000 | Invesco BulletShares 2024 Corporate Bond ETF | 332,850 | ||||||
| 5,000 | Invesco Ultra Short Duration ETF | 252,400 | ||||||
| 600 | iShares 20+ Year Treasury Bond ETF | 86,610 | ||||||
| 5,000 | iShares Short Treasury Bond ETF | 552,450 | ||||||
| 10,000 | SPDR Portfolio Short Term Corporate Bond ETF | 313,000 | ||||||
| 2,177,660 | ||||||||
| TOTAL EXCHANGE-TRADED FUNDS (Cost $2,180,467) | 2,177,660 | |||||||
| SHORT-TERM INVESTMENTS — 65.1% | ||||||||
| MONEY MARKET FUNDS — 65.1% | ||||||||
| 2,259,618 | Fidelity Government Portfolio, Institutional Class, 0.01%(a) (b) | 2,259,618 | ||||||
| 2,259,618 | First American Government Obligations Fund, Class Z, 0.02%(a) (b) | 2,259,618 | ||||||
| TOTAL MONEY MARKET FUNDS (Cost $4,519,236) | 4,519,236 | |||||||
| TOTAL SHORT-TERM INVESTMENTS (Cost $4,519,236) | 4,519,236 | |||||||
| TOTAL INVESTMENTS - 96.4% (Cost $6,699,703) | $ | 6,696,896 | ||||||
| OTHER ASSETS IN EXCESS OF LIABILITIES- 3.6% | 250,258 | |||||||
| NET ASSETS - 100.0% | $ | 6,947,154 | ||||||
| OPEN FUTURES CONTRACTS | ||||||||||||||
| Number of Contracts | Open Short Futures Contracts | Expiration | Notional Amount | Unrealized Depreciation | ||||||||||
| 8 | CME Ultra Long Term US Treasury Bond Future | 09/21/2021 | $ | 1,541,504 | $ | (1,504 | ) | |||||||
| TOTAL FUTURES CONTRACTS | ||||||||||||||
ETF - Exchange-Traded Fund
| (a) | Rate disclosed is the seven-day effective yield as of June 30, 2021. |
| (b) | See note 10. |
See accompanying notes to financial statements.
41
| STATEMENTS OF ASSETS AND LIABILITIES |
| June 30, 2021 |
| Quantified | Quantified | Quantified | Quantified | |||||||||||||
| Managed | Market Leaders | Alternative | STF | |||||||||||||
| Income Fund | Fund | Investment Fund | Fund | |||||||||||||
| Assets: | ||||||||||||||||
| Investment securities: | ||||||||||||||||
| At cost | $ | 161,924,314 | $ | 366,378,098 | $ | 9,201,282 | $ | 137,117,076 | ||||||||
| At value (a) | $ | 163,101,930 | $ | 372,699,812 | $ | 9,233,818 | $ | 137,076,045 | ||||||||
| Cash | — | — | — | 25,010,379 | ||||||||||||
| Deposits with brokers for futures | 1,655,850 | — | 187,139 | 13,081,967 | ||||||||||||
| Receivable: | ||||||||||||||||
| Unrealized appreciation on futures | — | — | 22,482 | 11,849,965 | ||||||||||||
| Unrealized appreciation on swaps | — | 5,363,895 | — | — | ||||||||||||
| Fund shares sold | 320,170 | 1,085,777 | — | 410,559 | ||||||||||||
| Securities sold | — | — | 452,506 | 70,986 | ||||||||||||
| Dividends and Interest | 21,794 | 880 | 94 | 142,223 | ||||||||||||
| Prepaid expenses and other assets | 30,481 | 34,050 | 29,111 | 16,611 | ||||||||||||
| Total Assets | 165,130,225 | 379,184,414 | 9,925,150 | 187,658,735 | ||||||||||||
| Liabilities: | ||||||||||||||||
| Collateral on securities loaned | 40,317,607 | 17,520,350 | 698,694 | 7,654,963 | ||||||||||||
| Fund shares redeemed | 124,974 | 235,520 | 7,033 | 187,166 | ||||||||||||
| Investment advisory fees | 81,503 | 228,131 | 4,825 | 116,598 | ||||||||||||
| Unrealized depreciation on futures | 49,675 | — | — | — | ||||||||||||
| Payable to related parties | 48,262 | 109,740 | 13,231 | 31,044 | ||||||||||||
| Shareholder service fees - Investor Class | 16,336 | 45,614 | 1,060 | 16,971 | ||||||||||||
| Distribution (12b-1) fees | 22,249 | 76,183 | 1,834 | 28,717 | ||||||||||||
| Securities purchased | — | — | 489,999 | 1,070,934 | ||||||||||||
| Miscellaneous fees | — | — | — | 16,251 | ||||||||||||
| Total Liabilities | 40,660,606 | 18,215,538 | 1,216,676 | 9,122,644 | ||||||||||||
| Net Assets | $ | 124,469,619 | $ | 360,968,876 | $ | 8,708,474 | $ | 178,536,091 | ||||||||
| Net Assets Consist of: | ||||||||||||||||
| Capital Stock | $ | 133,088,165 | $ | 289,838,720 | $ | 8,103,521 | $ | 157,871,162 | ||||||||
| Accumulated earnings (losses) | (8,618,546 | ) | 71,130,156 | 604,953 | 20,664,929 | |||||||||||
| Net Assets | $ | 124,469,619 | $ | 360,968,876 | $ | 8,708,474 | $ | 178,536,091 | ||||||||
| Net Asset Value Per Share Investor Class Shares: | ||||||||||||||||
| Net Assets | $ | 124,442,582 | $ | 360,779,630 | $ | 8,626,926 | $ | 177,970,007 | ||||||||
| Shares of beneficial interest outstanding (no par value; unlimited shares authorized) | 14,162,318 | 22,272,280 | 790,281 | 10,395,484 | ||||||||||||
| Net asset value, (Net Assets ÷ Shares Outstanding), offering and redemption price per share | $ | 8.79 | $ | 16.20 | $ | 10.92 | $ | 17.12 | ||||||||
| Advisor Class Shares: | ||||||||||||||||
| Net Assets | $ | 27,037 | $ | 189,246 | $ | 81,548 | $ | 566,084 | ||||||||
| Shares of beneficial interest outstanding (no par value; unlimited shares authorized) | 3,062 | 11,891 | 7,604 | 34,204 | ||||||||||||
| Net asset value, (Net Assets ÷ Shares Outstanding), offering and redemption price per share | $ | 8.83 | $ | 15.92 | $ | 10.72 | $ | 16.55 | ||||||||
| (a) | Includes loaned securities with a value of $39,694,253, $17,189,805, $689,681 and $7,501,270, respectively. |
See accompanying notes to financial statements.
42
| STATEMENTS OF ASSETS AND LIABILITIES (Continued) |
| June 30, 2021 |
| Quantified | Quantified | Quantified Evolution | Quantified | |||||||||||||
| Pattern | Tactical Fixed | Plus Fund | Common | |||||||||||||
| Recognition Fund | Income Fund | (Consolidated) | Ground Fund | |||||||||||||
| Assets: | ||||||||||||||||
| Investment securities: | ||||||||||||||||
| At cost | $ | 69,618,704 | $ | 144,906,104 | $ | 44,747,075 | $ | 58,090,376 | ||||||||
| At value (a) | $ | 69,668,338 | $ | 144,819,888 | $ | 44,766,041 | $ | 58,768,208 | ||||||||
| Cash | 2,001,411 | 29,012,754 | 10,004,124 | — | ||||||||||||
| Cash collateral for swaps | — | — | 360,000 | — | ||||||||||||
| Deposits with brokers | 1,039,131 | 5,931,209 | 6,313,041 | — | ||||||||||||
| Receivable: | — | — | ||||||||||||||
| Unrealized appreciation on futures | 88,053 | — | 316,341 | — | ||||||||||||
| Unrealized appreciation on swaps | — | 353,936 | — | — | ||||||||||||
| Fund shares sold | 37,800 | 550,070 | 44,356 | 442,607 | ||||||||||||
| Dividends and Interest | 7,803 | 180,494 | 6,603 | 13,779 | ||||||||||||
| Securities sold | — | 129,186 | 332,283 | — | ||||||||||||
| Prepaid expenses and other assets | 22,048 | 12,992 | 10,606 | 10,230 | ||||||||||||
| Total Assets | 72,864,584 | 180,990,529 | 62,153,395 | 59,234,824 | ||||||||||||
| Liabilities: | ||||||||||||||||
| Payables: | ||||||||||||||||
| Collateral on securities loaned | 1,785,960 | 7,630,450 | 1,354,128 | 7,163,955 | ||||||||||||
| Investment advisory fees | 41,390 | 138,739 | 59,735 | 36,093 | ||||||||||||
| Fund shares redeemed | 37,492 | 270,007 | 52,974 | 21,810 | ||||||||||||
| Shareholder service fees - Investor Class | 6,212 | 20,813 | 8,867 | 5,414 | ||||||||||||
| Payable to related parties | 30,225 | 54,442 | 29,522 | 17,353 | ||||||||||||
| Securities purchased | — | 228,699 | 179,426 | — | ||||||||||||
| Unrealized depreciation on swaps | — | — | 653,158 | — | ||||||||||||
| Unrealized depreciation on futures | — | 17,113 | 1,056,694 | — | ||||||||||||
| Distribution (12b-1) fees | 10,353 | 34,688 | 14,778 | 9,023 | ||||||||||||
| Total Liabilities | 1,911,632 | 8,394,951 | 3,409,282 | 7,253,648 | ||||||||||||
| Net Assets | $ | 70,952,952 | $ | 172,595,578 | $ | 58,744,113 | $ | 51,981,176 | ||||||||
| Net Assets Consist of: | ||||||||||||||||
| Capital Stock | $ | 67,488,905 | $ | 184,475,381 | $ | 54,461,687 | $ | 46,345,060 | ||||||||
| Accumulated earnings (losses) | 3,464,047 | (11,879,803 | ) | 4,282,426 | 5,636,116 | |||||||||||
| Net Assets | $ | 70,952,952 | $ | 172,595,578 | $ | 58,744,113 | $ | 51,981,176 | ||||||||
| Net Asset Value Per Share Investor Class Shares: | ||||||||||||||||
| Net Assets | $ | 70,952,952 | $ | 172,595,578 | $ | 58,744,113 | $ | 51,981,176 | ||||||||
| Shares of beneficial interest outstanding (no par value; unlimited shares authorized) | 5,286,615 | 17,280,724 | 5,951,131 | 4,059,121 | ||||||||||||
| Net asset value, (Net Assets ÷ Shares Outstanding), offering and redemption price per share | $ | 13.42 | $ | 9.99 | $ | 9.87 | $ | 12.81 | ||||||||
| (a) | Includes loaned securities with a value of $1,750,162, $7,477,302, $1,326,985 and $7,102,226, respectively. |
See accompanying notes to consolidated financial statements.
43
| STATEMENTS OF ASSETS AND LIABILITIES (Continued) |
| June 30, 2021 |
| Quantified | Quantified | Quantified | ||||||||||
| Tactical | Rising Dividend | Government Income | ||||||||||
| Sectors Fund | Tactical Fund | Tactical Fund | ||||||||||
| Assets: | ||||||||||||
| Investment securities: | ||||||||||||
| At cost | $ | 59,366,558 | $ | 21,125,127 | $ | 6,699,703 | ||||||
| At value (a) | $ | 59,803,117 | $ | 21,602,185 | $ | 6,696,896 | ||||||
| Cash collateral for swaps | 270,000 | — | — | |||||||||
| Deposits with brokers | — | — | 169,710 | |||||||||
| Receivable: | ||||||||||||
| Fund shares sold | 232,531 | 45,708 | 57 | |||||||||
| Dividends and Interest | 198 | 3,422 | 57 | |||||||||
| Securities sold | — | — | 86,586 | |||||||||
| Prepaid expenses and other assets | 27,272 | 22,188 | 24,103 | |||||||||
| Total Assets | 60,333,118 | 21,673,503 | 6,977,409 | |||||||||
| Liabilities: | ||||||||||||
| Payables: | ||||||||||||
| Collateral on securities loaned | 5,344,246 | — | — | |||||||||
| Unrealized depreciation on swaps | 342,027 | — | — | |||||||||
| Fund shares redeemed | 319,622 | 79,517 | 23,691 | |||||||||
| Investment advisory fees | 46,292 | 9,506 | 3,614 | |||||||||
| Distribution (12b-1) fees | 11,573 | 2,376 | 904 | |||||||||
| Payable to related parties | 11,145 | 3,342 | — | |||||||||
| Shareholder service fees - Investor Class | 6,944 | 425 | 542 | |||||||||
| Unrealized depreciation on futures | — | — | 1,504 | |||||||||
| Total Liabilities | 6,081,849 | 95,166 | 30,255 | |||||||||
| Net Assets | $ | 54,251,269 | $ | 21,578,337 | $ | 6,947,154 | ||||||
| Net Assets Consist of: | ||||||||||||
| Capital Stock | $ | 51,563,242 | $ | 21,086,302 | $ | 6,888,133 | ||||||
| Accumulated earnings | 2,688,027 | 492,035 | 59,021 | |||||||||
| Net Assets | $ | 54,251,269 | $ | 21,578,337 | $ | 6,947,154 | ||||||
| Net Asset Value Per Share Investor Class Shares: | ||||||||||||
| Net Assets | $ | 54,251,269 | $ | 21,578,337 | $ | 6,947,154 | ||||||
| Shares of beneficial interest outstanding (no par value; unlimited shares authorized) | 5,138,257 | 2,107,783 | 688,522 | |||||||||
| Net asset value, (Net Assets ÷ Shares Outstanding), offering and redemption price per share | $ | 10.56 | $ | 10.24 | $ | 10.09 | ||||||
| (a) | Includes loaned securities with a value of $5,262,683, $0, and $0, respectively. |
See accompanying notes to financial statements.
44
| STATEMENTS OF OPERATIONS |
| For the Year Ended June 30, 2021 |
| Quantified | Quantified | Quantified | Quantified | |||||||||||||
| Managed | Market Leaders | Alternative | STF | |||||||||||||
| Income Fund | Fund | Investment Fund | Fund | |||||||||||||
| Investment Income | ||||||||||||||||
| Dividends | $ | 2,149,960 | $ | 3,164,919 | $ | 147,015 | $ | 247,176 | ||||||||
| Interest | 5,096 | 8,846 | 766 | 343,780 | ||||||||||||
| Securities lending, net | 96,556 | 177,518 | 11,712 | 6,850 | ||||||||||||
| Total Investment Income | 2,251,612 | 3,351,283 | 159,493 | 597,806 | ||||||||||||
| Expenses | ||||||||||||||||
| Investment advisory fees | 805,133 | 1,895,586 | 106,080 | 1,195,720 | ||||||||||||
| Administration fees | 274,597 | 627,050 | 41,218 | 310,943 | ||||||||||||
| Distribution (12b-1) fees | ||||||||||||||||
| Investor Class | 267,087 | 631,300 | 35,187 | 296,597 | ||||||||||||
| Advisor Class | 1,378 | 2,248 | 690 | 6,014 | ||||||||||||
| Custody overdraft fees | 4,073 | — | 16,646 | — | ||||||||||||
| Shareholder services fees - Investor Class | 160,252 | 378,780 | 21,112 | 177,958 | ||||||||||||
| Total Operating Expenses | 1,512,520 | 3,534,964 | 220,933 | 1,987,232 | ||||||||||||
| Net Investment Income (Loss) | 739,092 | (183,681 | ) | (61,440 | ) | (1,389,426 | ) | |||||||||
| Realized and Unrealized Gain (Loss) on Investments, Futures and Swaps | ||||||||||||||||
| Net realized gain (loss) from: | ||||||||||||||||
| Investments | 681,700 | 77,954,514 | 2,990,042 | (74,005 | ) | |||||||||||
| Futures | (3,798,620 | ) | — | 115,007 | 37,149,015 | |||||||||||
| Swaps | — | 28,590,608 | — | — | ||||||||||||
| Capital gain distributions from underlying investments companies | 3,968 | — | 62,000 | 18,446 | ||||||||||||
| (3,112,952 | ) | 106,545,122 | 3,167,049 | 37,093,456 | ||||||||||||
| Net change in unrealized appreciation (depreciation) on: | ||||||||||||||||
| Investments | 572,760 | (2,367,089 | ) | (65,344 | ) | (368,289 | ) | |||||||||
| Futures | 111,029 | — | 16,986 | 9,015,524 | ||||||||||||
| Swaps | — | 3,244,610 | — | — | ||||||||||||
| 683,789 | 877,521 | (48,358 | ) | 8,647,235 | ||||||||||||
| Net Realized and Unrealized Gain (Loss) on Investments, Futures and Swaps | (2,429,163 | ) | 107,422,643 | 3,118,691 | 45,740,691 | |||||||||||
| Net Increase (Decrease) in Net Assets Resulting From Operations | $ | (1,690,071 | ) | $ | 107,238,962 | $ | 3,057,251 | $ | 44,351,265 | |||||||
See accompanying notes to financial statements.
45
| STATEMENTS OF OPERATIONS (Continued) |
| For the Year Ended June 30, 2021 |
| Quantified | Quantified | Quantified Evolution | Quantified | |||||||||||||
| Pattern | Tactical Fixed | Plus Fund | Common | |||||||||||||
| Recognition Fund | Income Fund | (Consolidated) | Ground Fund | |||||||||||||
| Investment Income | ||||||||||||||||
| Dividends | $ | 51,469 | $ | 238,834 | $ | 55,345 | $ | 369,978 | ||||||||
| Interest | 116,619 | 246,571 | 50,709 | 709 | ||||||||||||
| Securities lending, net | 337 | 8,083 | 501 | 2,185 | ||||||||||||
| Total Investment Income | 168,425 | 493,488 | 106,555 | 372,872 | ||||||||||||
| Expenses | ||||||||||||||||
| Investment advisory fees | 305,801 | 1,441,622 | 360,750 | 403,911 | ||||||||||||
| Distribution (12b-1) fees - Investor Class | 76,450 | 360,405 | 89,609 | 100,978 | ||||||||||||
| Administration fees | 81,575 | 370,255 | 92,200 | 109,303 | ||||||||||||
| Shareholder services fees - Investor Class | 45,870 | 216,243 | 53,766 | 60,587 | ||||||||||||
| Custody overdraft fees | — | — | — | 44,073 | ||||||||||||
| Total Operating Expenses | 509,696 | 2,388,525 | 596,325 | 718,852 | ||||||||||||
| Net Investment Loss | (341,271 | ) | (1,895,037 | ) | (489,770 | ) | (345,980 | ) | ||||||||
| Realized and Unrealized Gain (Loss) on Investments, Futures and Swaps | ||||||||||||||||
| Net realized gain (loss) from: | ||||||||||||||||
| Investments | 5,070 | 7,160 | 29,294 | 14,245,794 | ||||||||||||
| Futures | 10,565,905 | (11,453,591 | ) | 5,525,737 | — | |||||||||||
| Swaps | — | 332,762 | 539,785 | — | ||||||||||||
| Capital gain distributions from underlying investments companies | 2,299 | 15,624 | 3,091 | — | ||||||||||||
| 10,573,274 | (11,098,045 | ) | 6,097,907 | 14,245,794 | ||||||||||||
| Net change in unrealized appreciation (depreciation) on: | ||||||||||||||||
| Investments | (132,219 | ) | (406,927 | ) | (60,112 | ) | 379,105 | |||||||||
| Futures | 88,053 | (7,054 | ) | (1,370,769 | ) | — | ||||||||||
| Swaps | — | 858,361 | (653,158 | ) | — | |||||||||||
| (44,166 | ) | 444,380 | (2,084,039 | ) | 379,105 | |||||||||||
| Net Realized and Unrealized Gain (Loss) on Investments, Futures and Swaps | 10,529,108 | (10,653,665 | ) | 4,013,868 | 14,624,899 | |||||||||||
| Net Increase (Decrease) in Net Assets Resulting From Operations | $ | 10,187,837 | $ | (12,548,702 | ) | $ | 3,524,098 | $ | 14,278,919 | |||||||
See accompanying notes to consolidated financial statements.
46
| STATEMENTS OF OPERATIONS (Continued) |
| For the Period Ended June 30, 2021 |
| Quantified | Quantified | Quantified | ||||||||||
| Tactical | Rising Dividend | Government Income | ||||||||||
| Sectors Fund (a) | Tactical Fund (b) | Tactical Fund (c) | ||||||||||
| Investment Income | ||||||||||||
| Dividends | $ | 154,153 | $ | 71,990 | $ | 4,519 | ||||||
| Interest | 875 | 60 | 147 | |||||||||
| Securities lending, net | 10,397 | — | — | |||||||||
| Total Investment Income | 165,425 | 72,050 | 4,666 | |||||||||
| Expenses | ||||||||||||
| Investment advisory fees | 171,902 | 40,996 | 12,714 | |||||||||
| Distribution (12b-1) fees - Investor Class | 42,976 | 10,249 | 3,179 | |||||||||
| Administration fees | 38,057 | 9,928 | 3,800 | |||||||||
| Shareholder services fees - Investor Class | 25,785 | 6,149 | 1,907 | |||||||||
| Total Operating Expenses | 278,720 | 67,322 | 21,600 | |||||||||
| Net Investment Income (Loss) | (113,295 | ) | 4,728 | (16,934 | ) | |||||||
| Realized and Unrealized Gain (Loss) on Investments, Futures and Swaps | ||||||||||||
| Net realized gain from: | ||||||||||||
| Investments | 2,289,831 | — | 1,744 | |||||||||
| Futures | — | — | 80,260 | |||||||||
| Swaps | 492,598 | — | — | |||||||||
| 2,782,429 | — | 82,004 | ||||||||||
| Net change in unrealized appreciation (depreciation) on: | ||||||||||||
| Investments | 436,559 | 477,058 | (2,807 | ) | ||||||||
| Futures | — | — | (1,504 | ) | ||||||||
| Swaps | (342,027 | ) | — | — | ||||||||
| 94,532 | 477,058 | (4,311 | ) | |||||||||
| Net Realized and Unrealized Gain on Investments, Futures and Swaps | 2,876,961 | 477,058 | 77,693 | |||||||||
| Net Increase in Net Assets Resulting From Operations | $ | 2,763,666 | $ | 481,786 | $ | 60,759 | ||||||
| (a) | The Fund commenced operations on March 4, 2021. |
| (b) | The Fund commenced operations on April 14, 2021. |
| (c) | The Fund commenced operations on April 15, 2021. |
See accompanying notes to financial statements.
47
| STATEMENTS OF CHANGES IN NET ASSETS |
| Quantified Managed Income Fund | ||||||||
| Year Ended | Year Ended | |||||||
| June 30, | June 30, | |||||||
| 2021 | 2020 | |||||||
| INCREASE (DECREASE) IN NET ASSETS FROM: | ||||||||
| Operations | ||||||||
| Net investment income | $ | 739,092 | $ | 1,019,331 | ||||
| Net realized loss from investments and futures | (3,112,952 | ) | (5,234,006 | ) | ||||
| Net change in unrealized appreciation (depreciation) on investments and futures | 683,789 | (860,156 | ) | |||||
| Net Decrease in Net Assets Resulting From Operations | (1,690,071 | ) | (5,074,831 | ) | ||||
| Distributions to Shareholders from: | ||||||||
| Total Distributions Paid | ||||||||
| Investor Class | (727,077 | ) | (1,557,072 | ) | ||||
| Advisor Class | — | (2,026 | ) | |||||
| Total Distributions to Shareholders | (727,077 | ) | (1,559,098 | ) | ||||
| Shares of Beneficial Interest: | ||||||||
| Proceeds from shares sold | ||||||||
| Investor Class | 330,559,606 | 199,349,490 | ||||||
| Advisor Class | 74,928 | 772,729 | ||||||
| Net asset value of shares issued in reinvestment of distributions | ||||||||
| Investor Class | 726,721 | 1,557,071 | ||||||
| Advisor Class | — | 2,026 | ||||||
| Payments for shares redeemed | ||||||||
| Investor Class | (276,969,772 | ) | (181,195,937 | ) | ||||
| Advisor Class | (570,895 | ) | (790,752 | ) | ||||
| Total Increase in Net Assets From Shares of Beneficial Interest | 53,820,588 | 19,694,627 | ||||||
| Total Increase in Net Assets | 51,403,440 | 13,060,698 | ||||||
| Net Assets: | ||||||||
| Beginning of Year | 73,066,179 | 60,005,481 | ||||||
| End of Year | $ | 124,469,619 | $ | 73,066,179 | ||||
| Share Activity | ||||||||
| Investor Class: | ||||||||
| Shares Sold | 37,379,603 | 20,850,180 | ||||||
| Shares issued in reinvestments of Distributions | 82,676 | 158,723 | ||||||
| Shares Redeemed | (31,324,543 | ) | (19,079,699 | ) | ||||
| Net Increase in Shares of Beneficial Interest Outstanding | 6,137,736 | 1,929,204 | ||||||
| Advisor Class: | ||||||||
| Shares Sold | 8,342 | 81,494 | ||||||
| Shares issued in reinvestments of Distributions | — | 205 | ||||||
| Shares Redeemed | (62,989 | ) | (82,767 | ) | ||||
| Net Decrease in Shares of Beneficial Interest Outstanding | (54,647 | ) | (1,068 | ) | ||||
See accompanying notes to financial statements.
48
| STATEMENTS OF CHANGES IN NET ASSETS |
| Quantified Market Leaders Fund | Quantified Alternative Investment Fund | |||||||||||||||
| Year Ended | Year Ended | Year Ended | Year Ended | |||||||||||||
| June 30, | June 30, | June 30, | June 30, | |||||||||||||
| 2021 | 2020 | 2021 | 2020 | |||||||||||||
| INCREASE (DECREASE) IN NET ASSETS FROM: | ||||||||||||||||
| Operations | ||||||||||||||||
| Net investment income (loss) | $ | (183,681 | ) | $ | (82,021 | ) | $ | (61,440 | ) | $ | 67,293 | |||||
| Net realized gain (loss) from investments, futures and swaps | 106,545,122 | 20,362,696 | 3,167,049 | (693,508 | ) | |||||||||||
| Net change in unrealized appreciation (depreciation) on investments, futures and swaps | 877,521 | 8,299,310 | (48,358 | ) | (111,747 | ) | ||||||||||
| Net Increase (Decrease) in Net Assets Resulting From Operations | 107,238,962 | 28,579,985 | 3,057,251 | (737,962 | ) | |||||||||||
| Distributions to Shareholders from: | ||||||||||||||||
| Total Distributions Paid | ||||||||||||||||
| Investor Class | (20,817,298 | ) | — | — | (146,978 | ) | ||||||||||
| Advisor Class | (10,440 | ) | — | — | (126 | ) | ||||||||||
| Total Distributions to Shareholders | (20,827,738 | ) | — | — | (147,104 | ) | ||||||||||
| Shares of Beneficial Interest: | ||||||||||||||||
| Proceeds from shares sold | ||||||||||||||||
| Investor Class | 404,007,154 | 187,825,478 | 106,442,131 | 6,514,331 | ||||||||||||
| Advisor Class | 114,704 | 754,381 | 64,064 | 54,966 | ||||||||||||
| Net asset value of shares issued in reinvestment of distributions | ||||||||||||||||
| Investor Class | 20,809,226 | — | — | 146,977 | ||||||||||||
| Advisor Class | 10,440 | — | — | 126 | ||||||||||||
| Payments for shares redeemed | ||||||||||||||||
| Investor Class | (289,756,688 | ) | (234,421,568 | ) | (108,390,364 | ) | (6,925,984 | ) | ||||||||
| Advisor Class | (690,499 | ) | (702,511 | ) | (59,435 | ) | (7,298 | ) | ||||||||
| Total Increase (Decrease) in Net Assets From Shares of Beneficial Interest | 134,494,337 | (46,544,220 | ) | (1,943,604 | ) | (216,882 | ) | |||||||||
| Total Increase (Decrease) in Net Assets | 220,905,561 | (17,964,235 | ) | 1,113,647 | (1,101,948 | ) | ||||||||||
| Net Assets: | ||||||||||||||||
| Beginning of Year | 140,063,315 | 158,027,550 | 7,594,827 | 8,696,775 | ||||||||||||
| End of Year | $ | 360,968,876 | $ | 140,063,315 | $ | 8,708,474 | $ | 7,594,827 | ||||||||
| Share Activity | ||||||||||||||||
| Investor Class: | ||||||||||||||||
| Shares Sold | 28,158,125 | 19,292,930 | 10,669,457 | 698,753 | ||||||||||||
| Shares issued in reinvestments of Distributions | 1,549,458 | — | — | 14,846 | ||||||||||||
| Shares Redeemed | (20,081,782 | ) | (23,453,819 | ) | (10,752,723 | ) | (756,322 | ) | ||||||||
| Net Increase (Decrease) in Shares of Beneficial Interest Outstanding | 9,625,801 | (4,160,889 | ) | (83,266 | ) | (42,723 | ) | |||||||||
| Advisor Class: | ||||||||||||||||
| Shares Sold | 7,752 | 80,273 | 6,534 | 6,467 | ||||||||||||
| Shares issued in reinvestments of Distributions | 789 | — | — | 13 | ||||||||||||
| Shares Redeemed | (56,297 | ) | (69,490 | ) | (6,216 | ) | (796 | ) | ||||||||
| Net Increase (Decrease) in Shares of Beneficial Interest Outstanding | (47,756 | ) | 10,783 | 318 | 5,684 | |||||||||||
See accompanying notes to financial statements.
49
| STATEMENTS OF CHANGES IN NET ASSETS |
| Quantified STF Fund | Quantified Pattern Recognition Fund | |||||||||||||||
| Year Ended | Year Ended | Year Ended | Period Ended | |||||||||||||
| June 30, 2021 | June 30, 2020 | June 30, 2021 | June 30, 2020 (a) | |||||||||||||
| INCREASE (DECREASE) IN NET ASSETS FROM: | ||||||||||||||||
| Operations: | ||||||||||||||||
| Net investment income (loss) | $ | (1,389,426 | ) | $ | 31,237 | $ | (341,271 | ) | $ | (1,343 | ) | |||||
| Net realized gain from investments and futures | 37,093,456 | 21,349,449 | 10,573,274 | 1,009,460 | ||||||||||||
| Net change in unrealized appreciation (depreciation) on investments and futures | 8,647,235 | 2,121,391 | (44,166 | ) | 181,853 | |||||||||||
| Net Increase in Net Assets Resulting From Operations | 44,351,265 | 23,502,077 | 10,187,837 | 1,189,970 | ||||||||||||
| Distributions to Shareholders from: | ||||||||||||||||
| Total Distributions Paid | ||||||||||||||||
| Investor Class | (22,340,805 | ) | (324,678 | ) | (43,751 | ) | (951,554 | ) | ||||||||
| Advisor Class | (99,874 | ) | — | — | — | |||||||||||
| Total Distributions to Shareholders | (22,440,679 | ) | (324,678 | ) | (43,751 | ) | (951,554 | ) | ||||||||
| Shares of Beneficial Interest: | ||||||||||||||||
| Proceeds from shares sold: | ||||||||||||||||
| Investor Class | 313,466,549 | 44,145,276 | 122,498,250 | 38,142,488 | ||||||||||||
| Advisor Class | 2,542,535 | 337,024 | — | — | ||||||||||||
| Net asset value of shares issued in reinvestment of distributions: | ||||||||||||||||
| Investor Class | 22,054,043 | 314,001 | 43,747 | 951,554 | ||||||||||||
| Advisor Class | 96,857 | — | — | — | ||||||||||||
| Payments for shares redeemed | ||||||||||||||||
| Investor Class | (250,323,289 | ) | (66,933,043 | ) | (81,871,314 | ) | (19,194,275 | ) | ||||||||
| Advisor Class | (2,528,729 | ) | (82,458 | ) | — | — | ||||||||||
| Total Increase (Decrease) in Net Assets From Shares of Beneficial Interest | 85,307,966 | (22,219,200 | ) | 40,670,683 | 19,899,767 | |||||||||||
| Total Increase in Net Assets | 107,218,552 | 958,199 | 50,814,769 | 20,138,183 | ||||||||||||
| Net Assets: | ||||||||||||||||
| Beginning of Year/Period | 71,317,539 | 70,359,340 | 20,138,183 | — | ||||||||||||
| End of Year or Year/Period | $ | 178,536,091 | $ | 71,317,539 | $ | 70,952,952 | $ | 20,138,183 | ||||||||
| Share Activity | ||||||||||||||||
| Investor Class: | ||||||||||||||||
| Shares Sold | 19,157,058 | 3,862,444 | 10,118,583 | 3,714,259 | ||||||||||||
| Shares issued in reinvestments of Distributions | 1,409,204 | 28,860 | 4,143 | 88,682 | ||||||||||||
| Shares Redeemed | (15,366,358 | ) | (6,082,227 | ) | (6,755,722 | ) | (1,883,330 | ) | ||||||||
| Net Increase (Decrease) in Shares of Beneficial Interest Outstanding | 5,199,904 | (2,190,923 | ) | 3,367,004 | 1,919,611 | |||||||||||
| Share Activity | ||||||||||||||||
| Advisor Class: | ||||||||||||||||
| Shares Sold | 152,140 | 28,883 | — | — | ||||||||||||
| Shares issued in reinvestments of Distributions | 6,381 | — | — | — | ||||||||||||
| Shares Redeemed | (158,522 | ) | (7,664 | ) | — | — | ||||||||||
| Net Increase (Decrease) in Shares of Beneficial Interest Outstanding | (1 | ) | 21,219 | — | — | |||||||||||
| (a) | The Fund commenced operations on August 30, 2019. |
See accompanying notes to financial statements.
50
| STATEMENTS OF CHANGES IN NET ASSETS |
| Quantified Tactical Fixed Income Fund | Quantified Evolution Plus Fund (Consolidated) | |||||||||||||||
| Year Ended | Period Ended | Year Ended | Period Ended | |||||||||||||
| June 30, 2021 | June 30, 2020 (a) | June 30, 2021 | June 30, 2020 (b) | |||||||||||||
| INCREASE (DECREASE) IN NET ASSETS FROM: | ||||||||||||||||
| Operations: | ||||||||||||||||
| Net investment (loss) | $ | (1,895,037 | ) | $ | (93,584 | ) | $ | (489,770 | ) | $ | (57,342 | ) | ||||
| Net realized gain (loss) from investments, futures and swaps | (11,098,045 | ) | 5,400,229 | 6,097,907 | (1,161,020 | ) | ||||||||||
| Net change in unrealized appreciation (depreciation) on investments, futures and swaps | 444,380 | (193,773 | ) | (2,084,039 | ) | 709,494 | ||||||||||
| Net Increase (Decrease) in Net Assets Resulting From Operations | (12,548,702 | ) | 5,112,872 | 3,524,098 | (508,868 | ) | ||||||||||
| Distributions to Shareholders from: | ||||||||||||||||
| Return of Capital | — | — | — | |||||||||||||
| Investor Class | 1,273 | |||||||||||||||
| Total Distributions Paid | ||||||||||||||||
| Investor Class | (2,837,977 | ) | (871,421 | ) | (729,716 | ) | (18,875 | ) | ||||||||
| Total Distributions to Shareholders | (2,836,704 | ) | (871,421 | ) | (729,716 | ) | (18,875 | ) | ||||||||
| Shares of Beneficial Interest: | ||||||||||||||||
| Proceeds from shares sold: | ||||||||||||||||
| Investor Class | 316,387,473 | 129,355,700 | 141,633,890 | 36,302,350 | ||||||||||||
| Net asset value of shares issued in reinvestment of distributions: | ||||||||||||||||
| Investor Class | 2,836,192 | 871,421 | 729,190 | 18,875 | ||||||||||||
| Payments for shares redeemed | ||||||||||||||||
| Investor Class | (217,410,684 | ) | (48,300,569 | ) | (111,855,038 | ) | (10,351,793 | ) | ||||||||
| Total Increase in Net Assets From Shares of Beneficial Interest | 101,812,981 | 81,926,552 | 30,508,042 | 25,969,432 | ||||||||||||
| Total Increase in Net Assets | 86,427,575 | 86,168,003 | 33,302,424 | 25,441,689 | ||||||||||||
| Net Assets: | ||||||||||||||||
| Beginning of Year/Period | 86,168,003 | — | 25,441,689 | — | ||||||||||||
| End of Year/Period | $ | 172,595,578 | $ | 86,168,003 | $ | 58,744,113 | $ | 25,441,689 | ||||||||
| Share Activity | ||||||||||||||||
| Investor Class: | ||||||||||||||||
| Shares Sold | 29,522,430 | 12,236,432 | 14,816,171 | 3,965,839 | ||||||||||||
| Shares issued in reinvestments of Distributions | 265,065 | 87,756 | 79,519 | 1,928 | ||||||||||||
| Shares Redeemed | (20,372,687 | ) | (4,458,272 | ) | (11,803,410 | ) | (1,108,916 | ) | ||||||||
| Net Increase in Shares of Beneficial Interest Outstanding | 9,414,808 | 7,865,916 | 3,092,280 | 2,858,851 | ||||||||||||
| (a) | The Fund commenced operations on September 13, 2019. |
| (b) | The Fund commenced operations on September 30, 2019. |
See accompanying notes to consolidated financial statements.
51
| STATEMENTS OF CHANGES IN NET ASSETS |
| Quantified Common Ground Fund | Quantified Tactical Sectors Fund | |||||||||||
| Year Ended | Period Ended | Period Ended | ||||||||||
| June 30, 2021 | June 30, 2020 (a) | June 30, 2021 (b) | ||||||||||
| INCREASE (DECREASE) IN NET ASSETS FROM: | ||||||||||||
| Operations: | ||||||||||||
| Net investment loss | $ | (345,980 | ) | $ | (10,778 | ) | $ | (113,295 | ) | |||
| Net realized gain (loss) from investments, futures and swaps | 14,245,794 | (1,315,955 | ) | 2,782,429 | ||||||||
| Net change in unrealized appreciation on investments, futures and swaps | 379,105 | 298,727 | 94,532 | |||||||||
| Net Increase (Decrease) in Net Assets Resulting From Operations | 14,278,919 | (1,028,006 | ) | 2,763,666 | ||||||||
| Distributions to Shareholders from: | ||||||||||||
| Total Distributions Paid | (1,111,919 | ) | — | — | ||||||||
| Total Distributions to Shareholders | (1,111,919 | ) | — | — | ||||||||
| Shares of Beneficial Interest: | ||||||||||||
| Proceeds from shares sold: | ||||||||||||
| Investor Class | 280,265,420 | 44,769,024 | 56,873,922 | |||||||||
| Net asset value of shares issued in reinvestment of distributions: | ||||||||||||
| Investor Class | 1,111,905 | — | — | |||||||||
| Payments for shares redeemed | ||||||||||||
| Investor Class | (262,534,993 | ) | (23,769,174 | ) | (5,386,319 | ) | ||||||
| Total Increase in Net Assets From Shares of Beneficial Interest | 18,842,332 | 20,999,850 | 51,487,603 | |||||||||
| Total Increase in Net Assets | 32,009,332 | 19,971,844 | 54,251,269 | |||||||||
| Net Assets: | ||||||||||||
| Beginning of Year/Period | 19,971,844 | — | — | |||||||||
| End of Year/Period | $ | 51,981,176 | $ | 19,971,844 | $ | 54,251,269 | ||||||
| Share Activity | ||||||||||||
| Investor Class: | ||||||||||||
| Shares Sold | 25,139,810 | 4,722,043 | 5,644,189 | |||||||||
| Shares issued in reinvestments of Distributions | 99,455 | — | — | |||||||||
| Shares Redeemed | (23,310,598 | ) | (2,591,589 | ) | (505,932 | ) | ||||||
| Net Increase in Shares of Beneficial Interest Outstanding | 1,928,667 | 2,130,454 | 5,138,257 | |||||||||
| (a) | The Fund commenced operations on December 27, 2019. |
| (b) | The Fund commenced operations on March 4, 2021 |
See accompanying notes to financial statements.
52
| STATEMENTS OF CHANGES IN NET ASSETS |
| Quantified Rising Dividend Tactical Fund | Quantified Government Income Tactical Fund | |||||||
| Period Ended | Period Ended | |||||||
| June 30, 2021 (a) | June 30, 2021 (b) | |||||||
| INCREASE (DECREASE) IN NET ASSETS FROM: | ||||||||
| Operations: | ||||||||
| Net investment income (loss) | $ | 4,728 | $ | (16,934 | ) | |||
| Net realized gain from investments, futures and swaps | — | 82,004 | ||||||
| Net change in unrealized appreciation (depreciation) on investments, futures and swaps | 477,058 | (4,311 | ) | |||||
| Net Increase in Net Assets Resulting From Operations | 481,786 | 60,759 | ||||||
| Shares of Beneficial Interest: | ||||||||
| Proceeds from shares sold: | ||||||||
| Investor Class | 22,070,614 | 8,085,058 | ||||||
| Payments for shares redeemed | ||||||||
| Investor Class | (974,063 | ) | (1,198,663 | ) | ||||
| Total Increase in Net Assets From Shares of Beneficial Interest | 21,096,551 | 6,886,395 | ||||||
| Total Increase in Net Assets | 21,578,337 | 6,947,154 | ||||||
| Net Assets: | ||||||||
| Beginning of Period | — | — | ||||||
| End of Period | $ | 21,578,337 | $ | 6,947,154 | ||||
| Share Activity | ||||||||
| Investor Class: | ||||||||
| Shares Sold | 2,204,921 | 807,520 | ||||||
| Shares Redeemed | (97,138 | ) | (118,998 | ) | ||||
| Net Increase in Shares of Beneficial Interest Outstanding | 2,107,783 | 688,522 | ||||||
| (a) | The Fund commenced operations on April 14, 2021 |
| (b) | The Fund commenced operations on April 15, 2021 |
See accompanying notes to financial statements.
53
| FINANCIAL HIGHLIGHTS |
| Quantified Managed Income Fund |
| The table sets forth financial data for one share of beneficial interest outstanding throughout each year. |
| Investor Class | Advisor Class | |||||||||||||||||||||||||||||||||||||||
| Year Ended June 30, | Year Ended June 30, | |||||||||||||||||||||||||||||||||||||||
| 2021 | 2020 | 2019 | 2018 | 2017 | 2021 | 2020 | 2019 | 2018 | 2017 | |||||||||||||||||||||||||||||||
| Net asset value, beginning of year | $ | 9.04 | $ | 9.75 | $ | 9.31 | $ | 9.64 | $ | 9.35 | $ | 9.07 | $ | 9.70 | $ | 9.28 | $ | 9.54 | $ | 9.34 | ||||||||||||||||||||
| Activity from investment operations: | ||||||||||||||||||||||||||||||||||||||||
| Net investment income (loss) (1) | 0.06 | 0.15 | 0.35 | 0.22 | 0.22 | (0.02 | ) | 0.09 | 0.30 | 0.15 | 0.14 | |||||||||||||||||||||||||||||
| Net realized and unrealized gain (loss) on investments, futures and distributions from underlying investment companies | (0.23 | ) | (0.64 | ) | 0.28 | (0.31 | ) | 0.16 | (0.22 | ) | (0.64 | ) | 0.26 | (0.31 | ) | 0.17 | ||||||||||||||||||||||||
| Total from investment operations | (0.17 | ) | (0.49 | ) | 0.63 | (0.09 | ) | 0.38 | (0.24 | ) | (0.55 | ) | 0.56 | (0.16 | ) | 0.31 | ||||||||||||||||||||||||
| Distributions to Shareholders: | ||||||||||||||||||||||||||||||||||||||||
| Net investment income | (0.08 | ) | (0.16 | ) | (0.19 | ) | (0.24 | ) | (0.09 | ) | — | (0.02 | ) | (0.14 | ) | (0.10 | ) | (0.11 | ) | |||||||||||||||||||||
| Net realized gains | — | (0.06 | ) | — | — | — | — | (0.06 | ) | — | — | — | ||||||||||||||||||||||||||||
| Total distributions | (0.08 | ) | (0.22 | ) | (0.19 | ) | (0.24 | ) | (0.09 | ) | — | (0.08 | ) | (0.14 | ) | (0.10 | ) | (0.11 | ) | |||||||||||||||||||||
| Net asset value, end of year | $ | 8.79 | $ | 9.04 | $ | 9.75 | $ | 9.31 | $ | 9.64 | $ | 8.83 | $ | 9.07 | $ | 9.70 | $ | 9.28 | $ | 9.54 | ||||||||||||||||||||
| Total return (2) | (1.92 | )% | (5.19 | )% | 6.89 | % | (0.99 | )% | 4.13 | % | (2.65 | )% (4) | (5.76 | )% | 6.16 | % | (1.67 | )% | 3.31 | % | ||||||||||||||||||||
| Net assets, end of year (in 000s) | $ | 124,443 | $ | 72,543 | $ | 59,435 | $ | 40,477 | $ | 42,274 | $ | 27 | $ | 523 | $ | 570 | $ | 415 | $ | 267 | ||||||||||||||||||||
| Ratios/Supplemental Data: | ||||||||||||||||||||||||||||||||||||||||
| Ratio of expenses to average net assets (3) | 1.41 | % | 1.43 | % | 1.42 | % | 1.41 | % | 1.41 | % | 2.02 | % (6) | 2.03 | % | 2.02 | % | 2.01 | % | 2.01 | % | ||||||||||||||||||||
| Ratio of net investment income (loss) to average net assets (3,4) | 0.70 | % | 1.59 | % | 3.72 | % | 2.31 | % | 2.31 | % | (0.25 | )% (6) | 0.96 | % | 3.24 | % | 1.59 | % | 1.40 | % | ||||||||||||||||||||
| Portfolio turnover rate | 619 | % | 794 | % | 640 | % | 638 | % | 491 | % | 619 | % (4) | 794 | % | 640 | % | 638 | % | 491 | % | ||||||||||||||||||||
| (1) | Per share amounts calculated using the average shares method, which more appropriately presents the per share data for the year or period. |
| (2) | Total return shown assumes the reinvestment of all distributions. |
| (3) | The ratios of expenses to average net assets and net investment income (loss) to average net assets do not reflect the expenses of the underlying investment companies in which the Fund invests. |
| (4) | Recognition of net investment income (loss) by the Fund is affected by the timing and declaration of dividends by the underlying investment companies in which the Fund invests. |
See accompanying notes to financial statements.
54
| FINANCIAL HIGHLIGHTS |
| Quantified Market Leaders Fund |
| The table sets forth financial data for one share of beneficial interest outstanding throughout each year. |
| Investor Class | Advisor Class | |||||||||||||||||||||||||||||||||||||||
| Year ended June 30, | Year ended June 30, | |||||||||||||||||||||||||||||||||||||||
| 2021 | 2020 | 2019 | 2018 | 2017 | 2021 | 2020 | 2019 | 2018 | 2017 | |||||||||||||||||||||||||||||||
| Net asset value, beginning of year | $ | 11.02 | $ | 9.38 | $ | 11.57 | $ | 10.87 | $ | 9.60 | $ | 10.87 | $ | 9.30 | $ | 11.41 | $ | 10.76 | $ | 9.58 | ||||||||||||||||||||
| Activity from investment operations: | ||||||||||||||||||||||||||||||||||||||||
| Net investment income (loss) (1) | (0.01 | ) | 0.00 | (2) | 0.08 | (0.06 | ) | 0.05 | (0.19 | ) | (0.06 | ) | (0.01 | ) | (0.12 | ) | 0.01 | |||||||||||||||||||||||
| Net realized and unrealized gain (loss) on investments, futures, swaps and other investment companies | 6.46 | 1.64 | (0.96 | ) | 2.12 | 1.46 | 6.48 | 1.63 | (0.91 | ) | 2.08 | 1.44 | ||||||||||||||||||||||||||||
| Total from investment operations | 6.45 | 1.64 | (0.88 | ) | 2.06 | 1.51 | 6.29 | 1.57 | (0.92 | ) | 1.96 | 1.45 | ||||||||||||||||||||||||||||
| Distributions to Shareholders: | ||||||||||||||||||||||||||||||||||||||||
| Net investment income | (0.03 | ) | — | (0.12 | ) | (0.29 | ) | (0.24 | ) | — | — | — | (0.24 | ) | (0.27 | ) | ||||||||||||||||||||||||
| Net realized gains | (1.24 | ) | — | (1.19 | ) | (1.07 | ) | — | (1.24 | ) | — | (1.19 | ) | (1.07 | ) | — | ||||||||||||||||||||||||
| Total distributions | (1.27 | ) | — | (1.31 | ) | (1.36 | ) | (0.24 | ) | (1.24 | ) | — | (1.19 | ) | (1.31 | ) | (0.27 | ) | ||||||||||||||||||||||
| Net asset value, end of year | $ | 16.20 | $ | 11.02 | $ | 9.38 | $ | 11.57 | $ | 10.87 | $ | 15.92 | $ | 10.87 | $ | 9.30 | $ | 11.41 | $ | 10.76 | ||||||||||||||||||||
| Total return (3) | 60.94 | % | 17.48 | % | (6.18 | )% | 19.35 | % | 15.68 | % (4) | 60.23 | % | 16.88 | % | (6.77 | )% | 18.58 | % | 15.05 | % | ||||||||||||||||||||
| Net assets, end of year (in 000s) | $ | 360,780 | $ | 139,415 | $ | 157,573 | $ | 102,196 | $ | 69,960 | $ | 189 | $ | 649 | $ | 455 | $ | 650 | $ | 459 | ||||||||||||||||||||
| Ratios/Supplemental Data: | ||||||||||||||||||||||||||||||||||||||||
| Ratio of expenses to average net assets (5) | 1.40 | % | 1.42 | % | 1.42 | % | 1.42 | % | 1.41 | % | 2.00 | % | 2.03 | % | 2.02 | % | 2.01 | % | 2.01 | % | ||||||||||||||||||||
| Ratio of net investment income (loss) to average net assets (5,6) | (0.07 | )% | (0.05 | )% | 0.81 | % | (0.49 | )% | 0.46 | % | (1.48 | )% | (0.65 | )% | (0.12 | )% | (1.02 | )% | (0.01 | )% | ||||||||||||||||||||
| Portfolio turnover rate | 568 | % | 727 | % | 797 | % | 495 | % | 558 | % | 568 | % | 727 | % | 797 | % | 495 | % | 558 | % | ||||||||||||||||||||
| (1) | Per share amounts calculated using the average shares method, which more appropriately presents the per share data for the year or period. |
| (2) | Represents less than $0.01 per share. |
| (3) | Total returns shown assumes the reinvestment of all distributions. |
| (4) | Includes adjustments in accordance with accounting principles generally accepted in the United States and consequently the net asset value for financial reporting purposes and the returns based upon those net asset values may differ from the net asset values and returns for shareholder transactions. |
| (5) | The ratios of expenses to average net assets and net investment income (loss) to average net assets do not reflect the expenses of the underlying investment companies in which the Fund invests. |
| (6) | Recognition of net investment income (loss) by the Fund is affected by the timing and declaration of dividends by the underlying investment companies in which the Fund invests. |
See accompanying notes to financial statements.
55
| FINANCIAL HIGHLIGHTS |
| Quantified Alternative Investment Fund |
| The table sets forth financial data for one share of beneficial interest outstanding throughout each year. |
| Investor Class | Advisor Class | |||||||||||||||||||||||||||||||||||||||
| Year ended June 30, | Year Ended June 30, | |||||||||||||||||||||||||||||||||||||||
| 2021 | 2020 | 2019 | 2018 | 2017 | 2021 | 2020 | 2019 | 2018 | 2017 | |||||||||||||||||||||||||||||||
| Net asset value, beginning of year | $ | 8.62 | $ | 9.48 | $ | 9.46 | $ | 9.49 | $ | 9.12 | $ | 8.51 | $ | 9.35 | $ | 9.39 | $ | 9.42 | $ | 9.12 | ||||||||||||||||||||
| Activity from investment operations: | ||||||||||||||||||||||||||||||||||||||||
| Net investment income (loss) (1) | (0.04 | ) | 0.07 | 0.07 | 0.10 | 0.05 | (0.05 | ) | (0.05 | ) | 0.01 | 0.06 | (0.06 | ) | ||||||||||||||||||||||||||
| Net realized and unrealized gain (loss) on investments, futures and underlying investment companies | 2.34 | (0.79 | ) | (0.04 | ) | 0.19 | 0.32 | 2.26 | (0.71 | ) | (0.05 | ) | 0.17 | 0.36 | ||||||||||||||||||||||||||
| Total from investment operations | 2.30 | (0.72 | ) | 0.03 | 0.29 | 0.37 | 2.21 | (0.76 | ) | (0.04 | ) | 0.23 | 0.30 | |||||||||||||||||||||||||||
| Distributions to Shareholders: | ||||||||||||||||||||||||||||||||||||||||
| Net investment income | — | (0.14 | ) | (0.01 | ) | (0.16 | ) | — | (6) | — | (0.08 | ) | — | (0.10 | ) | — | (6) | |||||||||||||||||||||||
| Net realized gains | — | — | — | (0.16 | ) | — | — | — | — | (0.16 | ) | — | ||||||||||||||||||||||||||||
| Total distributions | — | (0.14 | ) | (0.01 | ) | (0.32 | ) | — | (6) | — | (0.08 | ) | — | (0.26 | ) | — | (6) | |||||||||||||||||||||||
| Net asset value, end of year | $ | 10.92 | $ | 8.62 | $ | 9.48 | $ | 9.46 | $ | 9.49 | $ | 10.72 | $ | 8.51 | $ | 9.35 | $ | 9.39 | $ | 9.42 | ||||||||||||||||||||
| Total return (2) | 26.68 | % | (7.76 | )% | 0.28 | % | 2.79 | %(3) | 4.09 | % | 25.97 | % | (8.26 | )% | (0.43 | )% | 2.25 | % | 3.31 | % | ||||||||||||||||||||
| Net assets, end of year (in 000s) | $ | 8,627 | $ | 7,533 | $ | 8,682 | $ | 9,092 | $ | 8,637 | $ | 82 | $ | 62 | $ | 15 | $ | 16 | $ | 18 | ||||||||||||||||||||
| Ratios/Supplemental Data: | ||||||||||||||||||||||||||||||||||||||||
| Ratio of expenses to average net assets (4) | 1.56 | % | 1.46 | % | 1.42 | % | 1.41 | % | 1.43 | % | 2.24 | % | 2.14 | % | 2.02 | % | 2.01 | % | 2.03 | % | ||||||||||||||||||||
| Ratio of net investment income (loss) to average net assets (4,5) | (0.43 | )% | 0.74 | % | 0.71 | % | 1.03 | % | 0.49 | % | (0.49 | )% | (0.57 | )% | 0.09 | % | 0.64 | % | (0.65 | )% | ||||||||||||||||||||
| Portfolio turnover rate | 1031 | % | 570 | % | 595 | % | 553 | % | 625 | % | 1031 | % | 570 | % | 595 | % | 553 | % | 625 | % | ||||||||||||||||||||
| (1) | Per share amounts calculated using the average shares method, which more appropriately presents the per share data for the year or period. |
| (2) | Total returns shown assumes the reinvestment of all distributions. |
| (3) | Includes adjustments in accordance with accounting principles generally accepted in the United States and consequently the net asset value for financial reporting purposes and the returns based upon those net asset values may differ from the net asset values and returns for shareholder transactions. |
| (4) | The ratios of expenses to average net assets and net investment income (loss) to average net assets do not reflect the expenses of the underlying investment companies in which the Fund invests. |
| (5) | Recognition of net investment income (loss) by the Fund is affected by the timing and declaration of dividends by the underlying investment companies in which the Fund invests. |
| (6) | Represents less than $0.01 per share. |
See accompanying notes to financial statements.
56
| FINANCIAL HIGHLIGHTS |
| Quantified STF Fund |
| The table sets forth financial data for one share of beneficial interest outstanding throughout each year. |
| Investor Class | Advisor Class | |||||||||||||||||||||||||||||||||||||||
| Year Ended June 30, | Year Ended June 30, | |||||||||||||||||||||||||||||||||||||||
| 2021 | 2020 | 2019 | 2018 | 2017 | 2021 | 2020 | 2019 | 2018 | 2017 | |||||||||||||||||||||||||||||||
| Net asset value, beginning of year | $ | 13.64 | $ | 9.51 | $ | 10.05 | $ | 11.22 | $ | 8.25 | $ | 13.34 | $ | 9.31 | $ | 9.88 | $ | 11.14 | $ | 8.24 | ||||||||||||||||||||
| Activity from investment operations: | ||||||||||||||||||||||||||||||||||||||||
| Net investment income (loss) (1) | (0.19 | ) | 0.01 | 0.04 | 0.01 | — | (2) | (0.28 | ) | (0.07 | ) | (0.02 | ) | (0.05 | ) | (0.07 | ) | |||||||||||||||||||||||
| Net realized and unrealized gain (loss) on investments, futures and underlying investment companies | 6.95 | 4.18 | (0.34 | ) | 2.82 | 2.97 | 6.77 | 4.10 | (0.33 | ) | 2.79 | 2.98 | ||||||||||||||||||||||||||||
| Total from investment operations | 6.76 | 4.19 | (0.30 | ) | 2.83 | 2.97 | 6.49 | 4.03 | (0.35 | ) | 2.74 | 2.91 | ||||||||||||||||||||||||||||
| Distributions to Shareholders: | ||||||||||||||||||||||||||||||||||||||||
| Net investment income | — | (2) | (0.06 | ) | (0.02 | ) | — | — | (2) | — | — | — | — | (0.01 | ) | |||||||||||||||||||||||||
| Net realized gains | (3.28 | ) | — | (0.22 | ) | (4.00 | ) | — | (3.28 | ) | — | (0.22 | ) | (4.00 | ) | — | ||||||||||||||||||||||||
| Total distributions | (3.28 | ) | (0.06 | ) | (0.24 | ) | (4.00 | ) | — | (2) | (3.28 | ) | 0.00 | (0.22 | ) | (4.00 | ) | (0.01 | ) | |||||||||||||||||||||
| Net asset value, end of year | $ | 17.12 | $ | 13.64 | $ | 9.51 | $ | 10.05 | $ | 11.22 | $ | 16.55 | $ | 13.34 | $ | 9.31 | $ | 9.88 | $ | 11.14 | ||||||||||||||||||||
| Total return (3) | 51.86 | % | 44.17 | % | (3.12 | )% | 24.06 | % | 36.01 | % | 50.87 | % | 43.29 | % | (3.65 | )% | 23.31 | % | 35.32 | % | ||||||||||||||||||||
| Net assets, end of year (in 000s) | $ | 177,970 | $ | 70,861 | $ | 70,238 | $ | 92,664 | $ | 88,696 | $ | 566 | $ | 456 | $ | 121 | $ | 261 | $ | 122 | ||||||||||||||||||||
| Ratios/Supplemental Data: | ||||||||||||||||||||||||||||||||||||||||
| Ratio of expenses to average net assets (4) | 1.66 | % | 1.68 | % | 1.67 | % | 1.66 | % | 1.66 | % | 2.27 | % | 2.28 | % | 2.27 | % | 2.26 | % | 2.26 | % | ||||||||||||||||||||
| Ratio of net investment income (loss) to average net assets (4,5) | (1.16 | )% | 0.05 | % | 0.42 | % | 0.12 | % | (0.04 | )% | (1.74 | )% | (0.65 | )% | (0.20 | )% | (0.46 | )% | (0.80 | )% | ||||||||||||||||||||
| Portfolio turnover rate | 238 | % | 91 | % | 41 | % | 72 | % | 41 | % | 238 | % | 91 | % | 41 | % | 72 | % | 41 | % | ||||||||||||||||||||
| (1) | Per share amounts calculated using the average shares method, which more appropriately presents the per share data for the period. |
| (2) | Represents less than $0.01 per share. |
| (3) | Total returns shown assumes the reinvestment of all distributions. |
| (4) | The ratios of expenses to average net assets and net investment income (loss) to average net assets do not reflect the expenses of the underlying investment companies in which the Fund invests. |
| (5) | Recognition of net investment income (loss) by the Fund is affected by the timing and declaration of dividends by the underlying investment companies in which the Fund invests. |
See accompanying notes to financial statements.
57
| FINANCIAL HIGHLIGHTS |
| Quantified Pattern Recognition Fund |
| The table sets forth financial data for one share of beneficial interest outstanding throughout the year or period. |
| Investor Class | ||||||||
| Year Ended | Period Ended | |||||||
| June 30, | June 30, | |||||||
| 2021 | 2020 (1) | |||||||
| Net asset value, beginning of year or period | $ | 10.49 | $ | 10.00 | ||||
| Activity from investment operations: | ||||||||
| Net investment loss (2) | (0.13 | ) | (0.00 | ) (8) | ||||
| Net realized and unrealized gain on investments and futures | 3.08 | 0.90 | ||||||
| Total from investment operations | 2.95 | 0.90 | ||||||
| Distributions to Shareholders: | ||||||||
| Net investment income | — | (0.02 | ) | |||||
| Net realized gains | (0.02 | ) | (0.39 | ) | ||||
| Total distributions | (0.02 | ) | (0.41 | ) | ||||
| Net asset value, end of year or period | $ | 13.42 | $ | 10.49 | ||||
| Total return (3,4) | 28.21 | % | 8.90 | % (4) | ||||
| Net assets, end of year or period (in 000s) | $ | 70,953 | $ | 20,138 | ||||
| Ratios/Supplemental Data: | ||||||||
| Ratio of expenses to average net assets (6) | 1.67 | % | 1.69 | % (5) | ||||
| Ratio of net investment loss to average net assets (6,7) | (1.12 | )% | (0.01 | )% (5) | ||||
| Portfolio turnover rate | 226 | % | 244 | % (4) | ||||
| (1) | The Fund commenced operations on August 30, 2019. |
| (2) | Per share amounts calculated using the average shares method, which more appropriately presents the per share data for the period. |
| (3) | Total returns shown assumes the reinvestment of all distributions. |
| (4) | Not Annualized. |
| (5) | Annualized. |
| (6) | The ratios of expenses to average net assets and net investment income to average net assets do not reflect the expenses of the underlying investment companies in which the Fund invests. |
| (7) | Recognition of net investment income by the Fund is affected by the timing and declaration of dividends by the underlying investment companies in which the Fund invests. |
| (8) | Represents less than $0.01 per share. |
See accompanying notes to financial statements.
58
| FINANCIAL HIGHLIGHTS |
| Quantified Tactical Fixed Income Fund |
| The table sets forth financial data for one share of beneficial interest outstanding throughout the year or period. |
| Investor Class | ||||||||
| Year Ended | Period Ended | |||||||
| June 30, | June 30, | |||||||
| 2021 | 2020 (1) | |||||||
| Net asset value, beginning of year or period | $ | 10.95 | $ | 10.00 | ||||
| Activity from investment operations: | ||||||||
| Net investment loss (2) | (0.14 | ) | (0.02 | ) | ||||
| Net realized and unrealized gain (loss) on investments, futures and swaps | (0.59 | ) | 1.18 | |||||
| Total from investment operations | (0.73 | ) | 1.16 | |||||
| Distributions to Shareholders: | �� | |||||||
| Net investment income | — | (0.03 | ) | |||||
| Net realized gains | (0.23 | ) | (0.18 | ) | ||||
| Return of capital | (0.00 | ) (8) | (0.18 | ) | ||||
| Total distributions | (0.23 | ) | (0.21 | ) | ||||
| Net asset value, end of year or period | $ | 9.99 | $ | 10.95 | ||||
| Total return (3,4) | (6.83 | )% | 11.84 | % (4) | ||||
| Net assets, end of year or period (in 000s) | $ | 172,596 | $ | 86,168 | ||||
| Ratios/Supplemental Data: | ||||||||
| Ratio of expenses to average net assets (6) | 1.66 | % | 1.67 | %(5) | ||||
| Ratio of net investment loss to average net assets (6,7) | (1.31 | )% | (0.23 | )% (5) | ||||
| Portfolio turnover rate | 121 | % | 177 | % (4) | ||||
| (1) | The Fund commenced operations on September 13, 2019. |
| (2) | Per share amounts calculated using the average shares method, which more appropriately presents the per share data for the period. |
| (3) | Total returns shown assumes the reinvestment of all distributions. |
| (4) | Not Annualized. |
| (5) | Annualized. |
| (6) | The ratios of expenses to average net assets and net investment income to average net assets do not reflect the expenses of the underlying investment companies in which the Fund invests. |
| (7) | Recognition of net investment income by the Fund is affected by the timing and declaration of dividends by the underlying investment companies in which the Fund invests. |
| (8) | Represents less than $0.01 per share. |
See accompanying notes to financial statements.
59
| CONSOLIDATED FINANCIAL HIGHLIGHTS |
| Quantified Evolution Plus Fund |
| The table sets forth financial data for one share of beneficial interest outstanding throughout the year or period. |
| Investor Class | ||||||||
| Year Ended | Period Ended | |||||||
| June 30, | June 30, | |||||||
| 2021 | 2020 (1) | |||||||
| Net asset value, beginning of year or period | $ | 8.90 | $ | 10.00 | ||||
| Activity from investment operations: | ||||||||
| Net investment loss (2) | (0.13 | ) | (0.04 | ) | ||||
| Net realized and unrealized gain (loss) on investments, futures and swaps | 1.32 | (1.05 | ) | |||||
| Total from investment operations | 1.19 | (1.09 | ) | |||||
| Distributions to Shareholders: | ||||||||
| Net investment income | (0.22 | ) | (0.01 | ) | ||||
| Net realized gains | — | (0.00 | ) (8) | |||||
| Total distributions | (0.22 | ) | (0.01 | ) | ||||
| Net asset value, end of year or period | $ | 9.87 | $ | 8.90 | ||||
| Total return (3,4) | 13.50 | % | (10.87 | )% (4) | ||||
| Net assets, end of year or period (in 000s) | $ | 58,744 | $ | 25,442 | ||||
| Ratios/Supplemental Data: | ||||||||
| Ratio of expenses to average net assets (6) | 1.66 | % | 1.68 | % (5) | ||||
| Ratio of net investment loss to average net assets (6,7) | (1.37 | )% | (0.53 | )% (5) | ||||
| Portfolio turnover rate | 594 | % | 437 | % (4) | ||||
| (1) | The Fund commenced operations on September 30, 2019. |
| (2) | Per share amounts calculated using the average shares method, which more appropriately presents the per share data for the period. |
| (3) | Total returns shown assumes the reinvestment of all distributions. |
| (4) | Not Annualized. |
| (5) | Annualized. |
| (6) | The ratios of expenses to average net assets and net investment income to average net assets do not reflect the expenses of the underlying investment companies in which the Fund invests. |
| (7) | Recognition of net investment income by the Fund is affected by the timing and declaration of dividends by the underlying investment companies in which |
| (8) | Represents less than $0.01 per share. |
See accompanying notes to consolidated financial statements.
60
| FINANCIAL HIGHLIGHTS |
| Quantified Common Ground Fund |
| The table sets forth financial data for one share of beneficial interest outstanding throughout the year or period. |
| Investor Class | ||||||||
| Year Ended | Period Ended | |||||||
| June 30, | June 30, | |||||||
| 2021 | 2020 (1) | |||||||
| Net asset value, beginning of year or period | $ | 9.37 | $ | 10.00 | ||||
| Activity from investment operations: | ||||||||
| Net investment loss (2) | (0.10 | ) | (0.01 | ) | ||||
| Net realized and unrealized gain (loss) on investments | 3.73 | (0.62 | ) | |||||
| Total from investment operations | 3.63 | (0.63 | ) | |||||
| Distributions to Shareholders: | ||||||||
| Net realized gains | (0.19 | ) | — | |||||
| Total distributions | (0.19 | ) | — | |||||
| Net asset value, end of year or period | $ | 12.81 | $ | 9.37 | ||||
| Total return (3,4) | 38.99 | % | (6.30 | )% (4) | ||||
| Net assets, end of year or period (in 000s) | $ | 51,981 | $ | 19,972 | ||||
| Ratios/Supplemental Data: | ||||||||
| Ratio of expenses to average net assets | 1.78 | % | 1.74 | % (5) | ||||
| Ratio of net investment loss to average net assets | (0.86 | )% | (0.12 | )% (5) | ||||
| Portfolio turnover rate | 1001 | % | 484 | % (4) | ||||
| (1) | The Fund commenced operations on December 27, 2019. |
| (2) | Per share amounts calculated using the average shares method, which more appropriately presents the per share data for the period. |
| (3) | Total returns shown assumes the reinvestment of all distributions. |
| (4) | Not Annualized. |
| (5) | Annualized. |
See accompanying notes to financial statements.
61
| FINANCIAL HIGHLIGHTS |
| Quantified Tactical Sectors Fund |
| The table sets forth financial data for one share of beneficial interest outstanding throughout the period. |
| Investor Class | ||||
| Period Ended | ||||
| June 30, | ||||
| 2021 (1) | ||||
| Net asset value, beginning of period | $ | 10.00 | ||
| Activity from investment operations: | ||||
| Net investment loss (2) | (0.02 | ) | ||
| Net realized and unrealized gain (loss) on investments | 0.58 | |||
| Total from investment operations | 0.56 | |||
| Net asset value, end of period | $ | 10.56 | ||
| Total return (3,4) | 5.60 | % (4) | ||
| Net assets, end of period (in 000s) | $ | 54,251 | ||
| Ratios/Supplemental Data: | ||||
| Ratio of expenses to average net assets | 1.62 | % (5) | ||
| Ratio of net investment loss to average net assets | (0.66 | )% (5) | ||
| Portfolio turnover rate | 205 | % (4) | ||
| (1) | The Fund commenced operations on March 4, 2021. |
| (2) | Per share amounts calculated using the average shares method, which more appropriately presents the per share data for the period. |
| (3) | Total returns shown assumes the reinvestment of all distributions. |
| (4) | Not Annualized. |
| (5) | Annualized. |
See accompanying notes to financial statements.
62
| FINANCIAL HIGHLIGHTS |
| Quantified Rising Dividend Tactical Fund |
| The table sets forth financial data for one share of beneficial interest outstanding throughout the period. |
| Investor Class | ||||
| Period Ended June 30, | ||||
| 2021 (a) | ||||
| Net asset value, beginning of period | $ | 10.00 | ||
| Activity from investment operations: | ||||
| Net investment income (loss) (1) | — | (5) | ||
| Net realized and unrealized gain (loss) on investments, futures and underlying investment companies | 0.24 | |||
| Total from investment operations | 0.24 | |||
| Net asset value, end of period | $ | 10.24 | ||
| Total return (2,3) | 2.40 | % (4) | ||
| Net assets, end of period (in 000s) | $ | 21,578 | ||
| Ratios/Supplemental Data: | ||||
| Ratio of expenses to average net assets | 1.58 | % (3) | ||
| Ratio of net investment income to average net assets | 0.11 | % (3) | ||
| Portfolio turnover rate | 0 | % (4) | ||
| (a) | The Fund commenced operations on April 14, 2021. |
| (1) | Per share amounts calculated using the average shares method, which more appropriately presents the per share data for the period. |
| (2) | Total returns shown assumes the reinvestment of all distributions. |
| (3) | Not Annualized. |
| (4) | Annualized. |
| (5) | Represents less than $0.01 per share. |
See accompanying notes to financial statements.
63
| FINANCIAL HIGHLIGHTS |
| Quantified Government Income Tactical Fund |
| The table sets forth financial data for one share of beneficial interest outstanding throughout the period. |
| Investor Class | ||||
| Period Ended June 30, | ||||
| 2021 (a) | ||||
| Net asset value, beginning of period | $ | 10.00 | ||
| Activity from investment operations: | ||||
| Net investment income (loss) (1) | (0.03 | ) | ||
| Net realized and unrealized gain (loss) on investments, futures and underlying investment companies | 0.12 | |||
| Total from investment operations | 0.09 | |||
| Net asset value, end of period | $ | 10.09 | ||
| Total return (2,3) | 0.90 | % (4) | ||
| Net assets, end of period (in 000s) | $ | 6,947 | ||
| Ratios/Supplemental Data: | ||||
| Ratio of expenses to average net assets | 1.63 | % (3) | ||
| Ratio of net investment loss to average net assets | (1.28 | )% (3) | ||
| Portfolio turnover rate (6) | 98 | % (4) | ||
| (a) | The Fund commenced operations on April 15, 2021. |
| (1) | Per share amounts calculated using the average shares method, which more appropriately presents the per share data for the period. |
| (2) | Total returns shown assumes the reinvestment of all distributions. |
| (3) | Not Annualized. |
| (4) | Annualized. |
See accompanying notes to financial statements.
64
| The Quantified Funds |
| NOTES TO CONSOLIDATED FINANCIAL STATEMENTS |
| June 30, 2021 |
| 1. | ORGANIZATION |
Quantified Managed Income Fund, Quantified Market Leaders Fund, Quantified Alternative Investment Fund, Quantified STF Fund, Quantified Pattern Recognition Fund, Quantified Tactical Fixed Income Fund, Quantified Evolution Plus Fund, Quantified Common Ground Fund, Quantified Tactical Sectors Fund, Quantified Rising Dividend Tactical Fund (“Quantified Rising Dividend”) and Quantified Government Income Tactical Fund (“Quantified Government Income”) (each a “Fund” and collectively the “Funds”) are each a diversified series (except Quantified Pattern Recognition, Quantified Tactical Fixed Income, Quantified Evolution Plus, Quantified Common Ground and Quantified Tactical Sectors Funds, which are non-diversified series), of Advisors Preferred Trust (the “Trust”), a statutory trust organized under the laws of the State of Delaware on August 15, 2012 and registered under the Investment Company Act of 1940, as amended (the “1940 Act”), as an open-end management investment company. Quantified Managed Income Fund, Quantified Market Leaders Fund, Quantified Alternative Investment Fund and Quantified STF Fund currently offer two classes of shares, Investor and Advisor classes of shares each of which are offered at Net Asset Value per share (“NAV”). Quantified Pattern Recognition Fund, Quantified Tactical Fixed Income Fund, Quantified Evolution Plus Fund, Quantified Common Ground Fund, Quantified Tactical Sectors Fund, Quantified Rising Dividend Tactical Fund and Quantified Government Income Tactical Fund currently offer Investor Class shares, which are offered at NAV.
The Funds’ commencement dates and their investment objectives are as follows:
| Fund | Investor Class | Advisor Class | Investment Objective |
| Quantified Managed Income Fund | August 9, 2013 | March 18, 2016 | seeks high total return from fixed income investments on an annual basis consistent with a moderate tolerance for risk |
| Quantified Market Leaders Fund | August 9, 2013 | March 18, 2016 | seeks high appreciation on an annual basis consistent with a high tolerance for risk |
| Quantified Alternative Investment Fund | August 9, 2013 | March 18, 2016 | seeks high total return from alternative investment vehicles on an annual basis consistent with a high tolerance for risk |
| Quantified STF Fund | November 13, 2015 | November 13, 2015 | seeks high appreciation on an annual basis consistent with a high tolerance for risk. |
| Quantified Pattern Recognition Fund | August 30, 2019 | N/A | seeks capital appreciation |
| Quantified Tactical Fixed Income Fund | September 13, 2019 | N/A | seeks total return |
| Quantified Evolution Plus Fund | September 30, 2019 | N/A | seeks capital appreciation |
| Quantified Common Ground Fund | December 27, 2019 | N/A | seeks total return |
| Quantified Tactical Sectors Fund | March 4, 2021 | N/A | seeks high appreciation on an annual basis consistent with a high tolerance for risk |
| Quantified Rising Dividend Tactical Fund | April 14, 2021 | N/A | seeks total return consistent with a moderate tolerance for risk |
| Quantified Government Income Tactical Fund | April 15, 2021 | N/A | seeks high total return consistent with a moderate tolerance for risk |
| 2. | SIGNIFICANT ACCOUNTING POLICIES |
The following is a summary of significant accounting policies followed by each Fund in preparation of their financial statements. The policies are in conformity with U.S. generally accepted accounting principles (“GAAP”). The preparation of the financial statements in conformity with GAAP requires management to make estimates and assumptions that affect the reported amounts of assets and liabilities and disclosure of contingent assets and liabilities at the date of the financial statements and the reported amounts of increases and decreases in net assets from operations during the reporting period. Actual results could differ from those estimates. Each Fund is an investment company and accordingly follows the investment company accounting and reporting guidance of the Financial Accounting Standards Board (“FASB”) Accounting Standard Codification Topic 946 Financial Services – Investment Companies including FASB Accounting Standard Update (“ASU”) 2013-08. Each Fund’s income, expenses (other than class-specific distribution and service fees) and realized and unrealized gains and losses are allocated proportionately each day based upon the relative net assets of each class.
Securities Valuation – Securities listed on an exchange are valued at the last reported sale price at the close of the regular trading session of the primary exchange on the business day the value is being determined, or in the case of securities listed on NASDAQ at the NASDAQ Official Closing Price. In the absence of a sale, such securities shall be valued at the mean between the current bid and ask prices on the day of valuation. Futures are valued at the final settled price or, in the absence of a settled price, at
65
| The Quantified Funds |
| NOTES TO CONSOLIDATED FINANCIAL STATEMENTS (Continued) |
| June 30, 2021 |
the last sale price on the day of valuation. Investments in open-end investment companies are valued at net asset value. Debt securities (other than short-term obligations) are valued each day by an independent pricing service approved by the Board of Trustees (the “Board”) based on methods which include consideration of: yields or prices of securities of comparable quality, coupon, maturity and type, indications as to values from dealers, and general market conditions or market quotations from a major market maker in the securities. Short-term debt obligations with remaining maturities in excess of sixty days are valued at current market prices by an independent pricing service approved by the Trust’s Board of Trustees. The independent pricing service does not distinguish between smaller-sized bond positions known as “odd lots” and larger institutional-sized bond positions known as “round lots”. The Funds may fair value a particular bond if the advisor does not believe that the round lot value provided by the independent pricing service reflects fair value of the Funds’ holding. Total return swaps on exchange-listed securities shall be valued at the last quoted sales price or, in the absence of a sale, at the mean between the current bid and ask prices. Exchange listed swaps shall be valued at the last quoted sales price or, in the absence of a sale, at the mean between the current bid and ask prices. Investments valued in currencies other than the U.S. dollar are converted to U.S. dollars using exchange rates obtained from pricing services. Short-term debt obligations having sixty days or less remaining until maturity, at time of purchase, may be valued at amortized cost which approximates fair value.
Each Fund may hold securities, such as private investments, interests in commodity pools, other non-traded securities or temporarily illiquid securities, for which market quotations are not readily available or are determined to be unreliable. These securities will be valued at their fair value as determined using the “fair value” procedures approved by the Board. The Board has delegated execution of these procedures to a fair value committee composed of one or more representatives from each of the (i) Trust, (ii) administrator, and (iii) advisor and/or sub-advisor. The committee may also enlist third party consultants such as a valuation specialist at a public accounting firm, valuation consultant or financial officer of a security issuer on an as-needed basis to assist in determining a security specific fair value. The Board reviews and ratifies the execution of this process and the resultant fair value prices at least quarterly to assure the process produces reliable results.
Fair Valuation Process – As noted above, the fair value committee is composed of one or more representatives from each of the (i) Trust, (ii) administrator, and (iii) advisor and/or sub-advisor. The applicable investments are valued collectively via inputs from each of these groups. For example, fair value determinations are required for the following securities: (i) securities for which market quotations are insufficient or not readily available on a particular business day (including securities for which there is a short and temporary lapse in the provision of a price by the regular pricing source) and (ii) securities for which, in the judgment of the advisor, the prices or values available do not represent the fair value of the instrument. Factors which may cause the advisor and/or sub-advisor to make such a judgment include, but are not limited to, the following: only a bid price or an asked price is available; the spread between bid and asked prices is substantial; the frequency of sales; the thinness of the market; the size of reported trades; and actions of the securities markets, such as the suspension or limitation of trading; (iii) securities determined to be illiquid; (iv) securities with respect to which an event that will affect the value thereof has occurred (a “significant event”) since the closing prices were established on the principal exchange on which they are traded, but prior to each Fund’s calculation of its net asset value. Specifically, interests in commodity pools or managed futures pools are valued on a daily basis by reference to the closing market prices of each futures contract or other asset held by a pool, as adjusted for pool expenses. Restricted or illiquid securities, such as private investments or non-traded securities are valued via inputs from the advisor based upon the current bid for the security from two or more independent dealers or other parties reasonably familiar with the facts and circumstances of the security (who should take into consideration all relevant factors as may be appropriate under the circumstances). If the advisor and/or sub-advisor is unable to obtain a current bid from such independent dealers or other independent parties, the fair value committee shall determine the fair value of such security using the following factors: (i) the type of security; (ii) the cost at date of purchase; (iii) the size and nature of the Funds’ holdings; (iv) the discount from market value of unrestricted securities of the same class at the time of purchase and subsequent thereto; (v) information as to any transactions or offers with respect to the security; (vi) the nature and duration of restrictions on disposition of the security and the existence of any registration rights; (vii) how
66
| The Quantified Funds |
| NOTES TO CONSOLIDATED FINANCIAL STATEMENTS (Continued) |
| June 30, 2021 |
the yield of the security compares to similar securities of companies of similar or equal creditworthiness; (viii) the level of recent trades of similar or comparable securities; (ix) the liquidity characteristics of the security; (x) current market conditions; and (xi) the market value of any securities into which the security is convertible or exchangeable.
Valuation of Fund of Funds – Each Fund invests in portfolios of exchange traded funds or closed-end investment companies (the “Underlying Funds”). The Underlying Funds value securities in their portfolios for which market quotations are readily available at their market values (generally the last reported sale price) and all other securities and assets at their fair value based upon the methods established by the board of directors of the Underlying Funds.
Open-end mutual funds are valued at their respective net asset values as reported by such investment companies. The shares of many Underlying Funds frequently trade at a price per share, which is different than the net asset value per share. The difference represents a market premium or market discount of such shares. There can be no assurances that the market discount or market premium on shares of any Underlying Funds purchased by the Funds will not change.
Units of Mount Vernon Liquid Assets Portfolio, LLC are not traded on or exchange and are valued at the investment company’s NAV per unit as provided by the Underlying Fund’s administrator.
The Funds utilize various methods to measure the fair value of all of their investments on a recurring basis. GAAP establishes a hierarchy that prioritizes inputs to valuation methods. The three levels of input are:
Level 1 – Unadjusted quoted prices in active markets for identical assets and liabilities that the Funds have the ability to access.
Level 2 – Observable inputs other than quoted prices included in Level 1 that are observable for the asset or liability, either directly or indirectly. These inputs may include quoted prices for the identical instrument on an inactive market, prices for similar instruments, interest rates, prepayment speeds, credit risk, yield curves, default rates and similar data.
Level 3 – Unobservable inputs for the asset or liability, to the extent relevant observable inputs are not available, representing the Funds’ own assumptions about the assumptions a market participant would use in valuing the asset or liability, and would be based on the best information available.
The availability of observable inputs can vary from security to security and is affected by a wide variety of factors, including, for example, the type of security, whether the security is new and not yet established in the marketplace, the liquidity of markets, and other characteristics particular to the security. To the extent that valuation is based on models or inputs that are less observable or unobservable in the market, the determination of fair value requires more judgment. Accordingly, the degree of judgment exercised in determining fair value is greatest for instruments categorized in Level 3.
The inputs used to measure fair value may fall into different levels of the fair value hierarchy. In such cases, for disclosure purposes, the level in the fair value hierarchy within which the fair value measurement falls in its entirety, is determined based on the lowest level input that is significant to the fair value measurement in its entirety.
67
| The Quantified Funds |
| NOTES TO CONSOLIDATED FINANCIAL STATEMENTS (Continued) |
| June 30, 2021 |
The inputs or methodology used for valuing securities are not necessarily an indication of the risk associated with investing in those securities. The following tables summarize the inputs used as of June 30, 2021 for each Fund’s assets and liabilities measured at fair value:
| Quantified Managed Income Fund | ||||||||||||||||
| Assets | Level 1 | Level 2 | Level 3 | Total | ||||||||||||
| Investments | ||||||||||||||||
| Common Stocks * | $ | 12,677,448 | $ | — | $ | — | $ | 12,677,448 | ||||||||
| Exchange-Traded Funds | 107,802,671 | — | — | 107,802,671 | ||||||||||||
| Short-Term Investments | 2,304,204 | — | — | 2,304,204 | ||||||||||||
| Collateral For Securities Loaned | 40,317,607 | — | — | 40,317,607 | ||||||||||||
| Total Investments | $ | 163,101,930 | $ | — | $ | — | $ | 163,101,930 | ||||||||
| Liabilities | ||||||||||||||||
| Derivatives | ||||||||||||||||
| Futures Contracts | $ | (49,675 | ) | $ | — | $ | — | $ | (49,675 | ) | ||||||
| Total Liabilities | $ | (49,675 | ) | $ | — | $ | — | $ | (49,675 | ) | ||||||
| Quantified Market Leaders Fund | ||||||||||||||||
| Assets | Level 1 | Level 2 | Level 3 | Total | ||||||||||||
| Investments | ||||||||||||||||
| Exchange-Traded Funds | $ | 286,856,977 | $ | — | $ | — | $ | 286,856,977 | ||||||||
| Short-Term Investments | 68,322,485 | — | — | 68,322,485 | ||||||||||||
| Collateral For Securities Loaned | 17,520,350 | — | — | 17,520,350 | ||||||||||||
| Total Investments | $ | 372,699,812 | $ | — | $ | — | $ | 372,699,812 | ||||||||
| Derivatives | ||||||||||||||||
| Total Return Swaps | $ | — | $ | 5,363,895 | $ | — | $ | 5,363,895 | ||||||||
| Total Assets | $ | 372,699,812 | $ | 5,363,895 | $ | — | $ | 378,063,707 | ||||||||
| Quantified Alternative Investment Fund | ||||||||||||||||
| Assets | Level 1 | Level 2 | Level 3 | Total | ||||||||||||
| Investments | ||||||||||||||||
| Exchange-Traded Funds | $ | 6,268,191 | $ | — | $ | — | $ | 6,268,191 | ||||||||
| Open End Mutual Funds | 1,034,224 | — | — | 1,034,224 | ||||||||||||
| Short-Term Investments | 1,232,709 | — | — | 1,232,709 | ||||||||||||
| Collateral For Securities Loaned | 698,694 | — | — | 698,694 | ||||||||||||
| Total Investments | $ | 9,233,818 | $ | — | $ | — | $ | 9,233,818 | ||||||||
| Derivatives | ||||||||||||||||
| Futures Contracts | $ | 22,482 | $ | — | $ | — | $ | 22,482 | ||||||||
| Total Assets | $ | 9,256,300 | $ | — | $ | — | $ | 9,256,300 | ||||||||
| Quantified STF Fund | ||||||||||||||||
| Assets | Level 1 | Level 2 | Level 3 | Total | ||||||||||||
| Investments | ||||||||||||||||
| Certificates of Deposit * | $ | — | $ | 3,054,950 | $ | — | $ | 3,054,950 | ||||||||
| Corporate Bonds * | — | 21,007,972 | — | 21,007,972 | ||||||||||||
| Exchange-Traded Funds | 35,988,986 | — | — | 35,988,986 | ||||||||||||
| Short-Term Investments | 69,369,174 | — | — | 69,369,174 | ||||||||||||
| Collateral For Securities Loaned | 7,654,963 | — | — | 7,654,963 | ||||||||||||
| Total Investments | $ | 113,013,123 | $ | 24,062,922 | $ | — | $ | 137,076,045 | ||||||||
| Derivatives | ||||||||||||||||
| Futures Contracts | $ | 11,849,965 | $ | — | $ | — | $ | 11,849,965 | ||||||||
| Total Assets | $ | 124,863,088 | $ | 24,062,922 | $ | — | $ | 148,926,010 | ||||||||
68
| The Quantified Funds |
| NOTES TO CONSOLIDATED FINANCIAL STATEMENTS (Continued) |
| June 30, 2021 |
| Quantified Pattern Recognition Fund | ||||||||||||||||
| Assets | Level 1 | Level 2 | Level 3 | Total | ||||||||||||
| Investments | ||||||||||||||||
| Certificates of Deposit * | $ | — | $ | 4,062,270 | $ | — | $ | 4,062,270 | ||||||||
| Exchange-Traded Funds | 10,679,526 | — | — | 10,679,526 | ||||||||||||
| Short-Term Investments | 53,140,582 | — | — | 53,140,582 | ||||||||||||
| Collateral For Securities Loaned | 1,785,960 | — | — | 1,785,960 | ||||||||||||
| Total Investments | $ | 65,606,068 | $ | 4,062,270 | $ | — | $ | 69,668,338 | ||||||||
| Derivatives | ||||||||||||||||
| Futures Contracts | $ | 88,053 | $ | — | $ | — | $ | 88,053 | ||||||||
| Total Assets | $ | 65,694,121 | $ | 4,062,270 | $ | — | $ | 69,756,391 | ||||||||
| Quantified Tactical Fixed Income Fund | ||||||||||||||||
| Assets | Level 1 | Level 2 | Level 3 | Total | ||||||||||||
| Investments | ||||||||||||||||
| Certificates of Deposit * | $ | — | $ | 6,050,371 | $ | — | $ | 6,050,371 | ||||||||
| Corporate Bonds* | — | 20,116,411 | — | 20,116,411 | ||||||||||||
| Exchange-Traded Funds | 26,149,560 | — | — | 26,149,560 | ||||||||||||
| Short-Term Investments | 84,873,096 | — | — | 84,873,096 | ||||||||||||
| Collateral For Securities Loaned | 7,630,450 | — | — | 7,630,450 | ||||||||||||
| Total Investments | $ | 118,653,106 | $ | 26,166,782 | $ | — | $ | 144,819,888 | ||||||||
| Liabilities | ||||||||||||||||
| Derivatives | ||||||||||||||||
| Futures Contracts | $ | (17,113 | ) | $ | — | $ | — | $ | (17,113 | ) | ||||||
| Total Liabilities | $ | (17,113 | ) | $ | — | $ | — | $ | (17,113 | ) | ||||||
| Quantified Evolution Plus Fund | ||||||||||||||||
| Assets | Level 1 | Level 2 | Level 3 | Total | ||||||||||||
| Investments | ||||||||||||||||
| Certificates of Deposit * | $ | — | $ | 2,029,500 | $ | — | $ | 2,029,500 | ||||||||
| Exchange-Traded Funds | 8,877,246 | — | — | 8,877,246 | ||||||||||||
| Short-Term Investments | 32,505,167 | — | — | 32,505,167 | ||||||||||||
| Collateral For Securities Loaned | 1,354,128 | — | — | 1,354,128 | ||||||||||||
| Total Investments | $ | 42,736,541 | $ | 2,029,500 | $ | — | $ | 44,766,041 | ||||||||
| Derivatives | ||||||||||||||||
| Futures Contracts | $ | 316,341 | $ | — | $ | — | $ | 316,341 | ||||||||
| Total Assets | $ | 43,052,882 | $ | 2,029,500 | $ | — | $ | 45,082,382 | ||||||||
| Liabilities | ||||||||||||||||
| Derivatives | ||||||||||||||||
| Futures Contracts | $ | (1,056,694 | ) | $ | — | $ | — | $ | (1,056,694 | ) | ||||||
| Total Return Swaps | — | (653,158 | ) | — | (653,158 | ) | ||||||||||
| Total Liabilities | $ | (1,056,694 | ) | $ | (653,158 | ) | $ | — | $ | (1,709,852 | ) | |||||
69
| The Quantified Funds |
| NOTES TO CONSOLIDATED FINANCIAL STATEMENTS (Continued) |
| June 30, 2021 |
| Quantified Common Ground Fund | ||||||||||||||||
| Assets | Level 1 | Level 2 | Level 3 | Total | ||||||||||||
| Investments | ||||||||||||||||
| Common Stocks * | $ | 49,023,279 | $ | — | $ | — | $ | 49,023,279 | ||||||||
| Short-Term Investments | 2,580,974 | — | — | 2,580,974 | ||||||||||||
| Collateral For Securities Loaned | 7,163,955 | — | — | 7,163,955 | ||||||||||||
| Total Investments | $ | 58,768,208 | $ | — | $ | — | $ | 58,768,208 | ||||||||
| Quantified Tactical Sectors Fund | ||||||||||||||||
| Assets | Level 1 | Level 2 | Level 3 | Total | ||||||||||||
| Investments | ||||||||||||||||
| Exchange-Traded Funds | $ | 36,778,868 | $ | — | $ | — | $ | 36,778,868 | ||||||||
| Short-Term Investments | 17,680,003 | — | — | 17,680,003 | ||||||||||||
| Collateral For Securities Loaned | 5,344,246 | — | — | 5,344,246 | ||||||||||||
| Total Investments | $ | 59,803,117 | $ | — | $ | — | $ | 59,803,117 | ||||||||
| Derivatives | ||||||||||||||||
| Total Return Swaps | $ | — | $ | 834,785 | $ | — | $ | 834,785 | ||||||||
| Total Assets | $ | 59,803,117 | $ | 834,785 | $ | — | $ | 60,637,902 | ||||||||
| Liabilities | ||||||||||||||||
| Derivatives | ||||||||||||||||
| Total Return Swaps | $ | — | $ | (1,176,812 | ) | $ | — | $ | (1,176,812 | ) | ||||||
| Total Liabilities | $ | — | $ | (1,176,812 | ) | $ | — | $ | (1,176,812 | ) | ||||||
| Quantified Rising Dividend Tactical Fund | ||||||||||||||||
| Assets | Level 1 | Level 2 | Level 3 | Total | ||||||||||||
| Investments | ||||||||||||||||
| Exchange-Traded Funds | $ | 20,079,028 | $ | — | $ | — | $ | 20,079,028 | ||||||||
| Short-Term Investments | 1,523,157 | — | — | 1,523,157 | ||||||||||||
| Total Investments | $ | 21,602,185 | $ | — | $ | — | $ | 21,602,185 | ||||||||
| Quantified Government Income Tactical Fund | ||||||||||||||||
| Assets | Level 1 | Level 2 | Level 3 | Total | ||||||||||||
| Investments | ||||||||||||||||
| Exchange-Traded Funds | $ | 2,177,660 | $ | — | $ | — | $ | 2,177,660 | ||||||||
| Short-Term Investments | 4,519,236 | — | — | 4,519,236 | ||||||||||||
| Total Investments | $ | 6,696,896 | $ | — | $ | — | $ | 6,696,896 | ||||||||
| Liabilities | ||||||||||||||||
| Derivatives | ||||||||||||||||
| Futures Contracts | $ | (1,504 | ) | $ | — | $ | — | $ | (1,504 | ) | ||||||
| Total Liabilities | $ | (1,504 | ) | $ | — | $ | — | $ | (1,504 | ) | ||||||
| * | Refer to each of the Schedule of Investments for industry classifications. |
The Funds did not hold any Level 3 securities during the year ended June 30, 2021.
Consolidation of Subsidiaries – The consolidated financial statements of the Quantified Evolution Plus Fund include the accounts of QEPF Fund Ltd. (“QEPF Ltd.”), a wholly-owned subsidiary. All inter-company accounts and transactions have been eliminated in consolidation. The Fund may invest up to 25% of its total assets in QEPF Ltd., which acts as an investment vehicle in order to affect certain investments consistent with the Fund’s investment objectives and policies. The subsidiary commenced operations on December 30, 2019 and is an exempted Cayman Islands company with limited liability.
70
| The Quantified Funds |
| NOTES TO CONSOLIDATED FINANCIAL STATEMENTS (Continued) |
| June 30, 2021 |
A summary of the Fund’s investment in QEPF Ltd. is as follows:
| Inception | % Of Net Assets | ||||||||||
| Date of QEPF | QEPF Ltd. Net Assets at | at | |||||||||
| Ltd. | June 30, 2021 | June 30, 2021 | |||||||||
| QEPF Ltd. | 12/30/19 | $1,871,799 | 3.19% |
Exchange Traded Funds (“ETFs”), Mutual Funds and Exchange Traded Notes (“ETNs”) Risk – ETFs, mutual funds and ETNs are subject to investment advisory or management and other expenses, which will be indirectly paid by the Funds. Each is subject to specific risks, depending on investment strategy. Also, each may be subject to leverage risk, which will magnify losses. ETNs are subject to default risks.
Each Fund invests in ETFs. ETFs are typically a type of index fund bought and sold on a securities exchange. An ETF trades like common stock and typically represents a fixed portfolio of securities designed to track the performance and dividend yield of a particular domestic or foreign market index. Each Fund may purchase an ETF to temporarily gain exposure to a portion of the U.S. or a foreign market. The risks of owning an ETF generally reflect the risks of owning the underlying securities they are designed to track, although the lack of liquidity on an ETF could result in it being more volatile. Additionally, ETFs have fees and expenses that reduce their value.
Cash Accounts – At times, the Funds may invest cash in a short-term deposit sweep vehicle program. Such deposits are in amounts at any such depositary institution not in excess of the Federal Deposit Insurance Corporation (“FDIC”) or National Credit Union Share Insurance Fund standard maximum deposit insurance amount such that funds are insured across the various banks or credit unions at which such funds are deposited. StoneCastle Cash Management, LLC (“StoneCastle”) provides ministerial deposit placement assistance to the Funds with respect to the short-term deposit sweep vehicle program. These deposits are not custodied by StoneCastle. These amounts are included as Cash on the Statements of Assets and Liabilities to the extent they are held by the Funds as of June 30, 2021.
Foreign Currency Translations – All assets and liabilities denominated in foreign currencies are translated into U.S. dollars based on the rate of exchange of such currencies against U.S. dollars on the date of valuation. Purchases and sales of securities and income and expenses are translated at the rate of exchange quoted on the respective date that such transactions are recorded. The Funds do not isolate the portion of the results of operations resulting from changes in foreign exchange rates on investments from the fluctuations arising from changes in market prices of securities held. Each Fund’s investments in foreign securities are subject to foreign currency fluctuations, higher volatility than U.S. securities, varying degrees of regulation and limited liquidity. Greater political, economic, credit and information risks are also associated with foreign securities.
Swap Contracts – Each Fund is subject to equity price risk, interest rate risk, credit risk and counterparty risk in the normal course of pursuing its investment objective. Each Fund may enter into various swap transactions for investment purposes or to manage interest rate, equity, or credit risk. These would be two-party contracts entered into primarily to exchange the returns (or differentials in rates of returns) earned or realized on particular pre-determined investments or instruments.
Standard equity swap contracts are between two parties that agree to exchange the returns (or differentials in rates of return) earned or realized on particular predetermined investments or instruments. The gross amount to be exchanged is calculated with respect to a “notional amount” (i.e. the return on or increase in value of a particular dollar amount invested in a “basket” of securities representing a particular index or industry sector on underlying fund). Most equity swap agreements entered into by a Fund calculate the obligations of the parties on a “net basis”. Consequently, a Fund’s current obligations under a swap agreement generally will be equal to the net amount to be paid or received under the agreement based on the relative value of the positions held by each party. Each Fund’s obligations are accrued daily (offset by any amounts owed to the Fund).
71
| The Quantified Funds |
| NOTES TO CONSOLIDATED FINANCIAL STATEMENTS (Continued) |
| June 30, 2021 |
Each Fund may enter into swap contracts that provide the opposite return of the particular benchmark or security (“short” the index or security). The operations are similar to that of the swaps disclosed above except that the counterparty pays interest to the Fund on the notional amount outstanding and the dividends on the underlying securities reduce the return of the swap. However, in certain instances, market factors such as the interest rate environment and the demand to borrow the securities underlying the swap agreement can cause a scenario in which the Fund pays the counterparty interest. These amounts are netted with any unrealized appreciation or depreciation to determine the value of the swap. The Funds will typically enter into equity swap agreements in instances where the advisor believes that it may be more cost effective or practical than buying a security or the securities represented by a particular index.
Each Fund may enter into credit default swaps (“CDS”). CDS are typically two-party (bilateral) financial contracts that transfer credit exposure between the two parties. One party to a CDS (referred to as the credit protection “buyer”) receives credit protection or sheds credit risk, whereas the other party to a CDS (referred to as the credit protection “seller”) is selling credit protection or taking on credit risk. The seller typically receives pre-determined periodic payments from the other party. These payments are in consideration for agreeing to make compensating specific payments to the buyer should a negative credit event occur, such as (1) bankruptcy or (2) failure to pay interest or principal on a reference debt instrument, with respect to a specified issuer or one of the reference issuers in a CDS portfolio. In general, CDS may be used by a Fund to obtain credit risk exposure similar to that of a direct investment in high yield bonds.
The amounts to be exchanged or “swapped” between parties are calculated with respect to the notional amount. Changes in the value of swap agreements are recognized as unrealized gains or losses in the Statements of Operations by “marking to market” on a daily basis to reflect the value of the swap agreement at the end of each trading day. Payments received or paid at the beginning of the agreement are reflected as such on the Statements of Assets and Liabilities and may be referred to as upfront payments. A liquidation payment received or made at the termination of the swap agreement is recorded as a realized gain or loss on the Statements of Operations. The maximum pay-outs for these contracts are limited to the notional amount of each swap. CDS may involve greater risks than if a Fund had invested in the referenced obligation directly and are subject to general market risk, liquidity risk, counterparty risk and credit risk.
Each Fund may enter into Interest Rate Swaps. Interest rate swaps involve the exchange of commitments to pay and receive interest based on a notional principal amount. Each Fund may elect to pay a fixed rate and receive a floating rate, or receive a fixed rate and pay a floating rate on a notional principal amount.
Each Fund may enter into Total Return Swaps (“TRS”). Total Return Swaps are typically two-party (bilateral) financial contracts which one party makes payments based on a set rate, either fixed or variable, while the other party makes payments based on the return of an underlying asset, which includes both the income it generates and any capital gains. In total return swaps, the underlying asset, referred to as the reference asset, is usually an equity index, loans, or bonds. This is owned by the party receiving the set rate payment. The TRS allows one party to derive the economic benefit of owning an asset without putting that asset on its balance sheet, and allows the other party, which does retain that asset on its balance sheet, to buy protection against loss in its value.
Each Fund collateralizes swap agreements with cash and certain securities as indicated on the Schedule of Investments of the Fund and Statements of Assets and Liabilities, respectively. Such collateral is held for the benefit of the counterparty in a segregated account at the Custodian to protect the counterparty against non-payment by the Fund. Each Fund does not net collateral. In addition, the parties have mutually agreed to settle significant unrealized appreciation / depreciation on the swap contracts as they occur, resulting in an advance or prepayment on such swaps. Such amounts, if any, would be offset against the applicable contract upon final settlement. In the event of a default by the counterparty, a Fund will seek return of this collateral and may incur certain costs exercising its rights with respect to the
72
| The Quantified Funds |
| NOTES TO CONSOLIDATED FINANCIAL STATEMENTS (Continued) |
| June 30, 2021 |
collateral. Amounts expected to be owed to a Fund may be collateralized either directly with the Fund or in a segregated account at the custodian.
Each Fund bears the risk of loss of the amount expected to be received under a swap agreement in the event of the default or bankruptcy of a swap agreement counterparty to the extent that posted collateral is insufficient. Each Fund will enter into swap agreements only with large, well-capitalized and established financial institutions. The creditworthiness of each of the firms that is counterparty to a swap agreement is monitored by the Advisor. The financial statements of these counterparties may be available by accessing the SEC’s website, at www.sec.gov.
International Swaps and Derivatives Association, Inc. Master Agreements (“ISDA Master Agreements”) govern OTC financial derivative transactions entered into by the Funds and their counterparties. The ISDA Master Agreements maintain provisions for general obligations, representations, agreements, collateral and events of default or termination. Events of termination include conditions that may entitle counterparties to elect to terminate early and cause settlement of all outstanding transactions under the applicable ISDA Master Agreements. Any election to early terminate could be material to the financial statements. For the year or period ended June 30, 2021, Quantified Market Leaders Fund, Quantified Tactical Fixed Income Fund, Quantified Evolution Plus Fund and Quantified Tactical Sectors Fund entered into total return swaps and are subject to applicable master netting arrangements.
Futures Contracts – Each Fund may be subject to the change in value of equity and interest rate risk in the normal course of pursuing its investment objective. Each Fund may purchase or sell futures contracts to gain exposure to, or hedge against, changes in the value of equities and interest rates. Initial margin deposits required upon entering into futures contracts are satisfied by the segregation of specific securities or cash as collateral for the account of the broker (each Fund’s agent in acquiring the futures position). During the period the futures contracts are open, changes in the value of the contracts are recognized as unrealized gains or losses by “marking to market” on a daily basis to reflect the market value of the contracts at the end of each day’s trading. When the contracts are closed, each Fund recognizes a realized gain or loss equal to the difference between the proceeds from, or cost of, the closing transaction and each Fund’s basis in the contract. If the Funds were unable to liquidate a futures contract and/or enter into an offsetting closing transaction, each Fund would continue to be subject to market risk with respect to the value of the contracts and continue to be required to maintain the margin deposits on the futures contracts. Each Fund segregates cash having a value at least equal to the amount of the current obligation under any open futures contract. Risks may exceed amounts recorded in the Statements of Assets and Liabilities. With futures, there is minimal counterparty credit risk to each Fund since futures are exchange traded and the exchange’s clearinghouse, as counterparty to all exchange traded futures, guarantees the futures against default.
During the normal course of business, each Fund purchases and sells various financial instruments, which may result in risks, the amount of which is not apparent from the financial statements.
Security Transactions and Related Income – Security transactions are accounted for on trade date. Interest income is recognized on an accrual basis. Discounts are accreted and premiums are amortized on securities purchased over the lives of the respective securities using the effective interest method. Dividend income is recorded on the ex-dividend date. Realized gains or losses from sales of securities are determined by comparing the identified cost of the security lot sold with the net sales proceeds. Foreign withholding tax is recorded as incurred or known, in accordance with the Funds’ understanding of the applicable country’s tax rules and rates.
Dividends and Distributions to Shareholders – Dividends from net investment income, if any, are declared and paid annually. Distributable net realized capital gains, if any, are declared and distributed annually in December. Dividends from net investment income and distributions from net realized gains are recorded on ex-dividend date and are determined in accordance with federal income tax regulations, which may differ from GAAP. These “book/tax” differences are considered either temporary (i.e., deferred losses, capital loss carry forwards) or permanent in nature. To the extent these differences are permanent
73
| The Quantified Funds |
| NOTES TO CONSOLIDATED FINANCIAL STATEMENTS (Continued) |
| June 30, 2021 |
in nature, such amounts are reclassified within the composition of net assets based on their federal tax-basis treatment; temporary differences do not require reclassification. These reclassifications have no effect on net assets, results from operations or net asset value per share of the Funds.
Federal Income Tax – It is each Fund’s policy to continue to qualify as a regulated investment company by complying with the provisions of the Internal Revenue Code that are applicable to regulated investment companies and to distribute substantially all of its taxable income and net realized gains to shareholders. Therefore, no federal income tax provision is required.
The Funds recognize the tax benefits of uncertain tax positions only where the position is “more likely than not” to be sustained assuming examination by tax authorities. Management has analyzed each Fund’s tax positions, and has concluded that no liability for unrecognized tax benefits should be recorded related to uncertain tax positions taken on returns filed for the open tax years (June 30, 2018 – June 30, 2020) or expected to be taken in the Funds’ June 30, 2021 tax returns. The Funds identify their major tax jurisdictions as U.S. Federal, Ohio and foreign jurisdictions where each Fund makes significant investments; however the Funds are not aware of any tax positions for which it is reasonably possible that the total amounts of unrecognized tax benefits will change materially in the next twelve months.
For tax purposes, QEPF Fund Limited (“QEPF”) is an exempted Cayman Islands investment company. QEPF has received an undertaking from the Government of the Cayman Islands exempting it from all local income, profits, and capital gains taxes. No such taxes are levied in the Cayman Islands at the present time. For U.S. income tax purposes, QEPF is a controlled foreign corporation (“CFC”) and as such is not subject to U.S. income tax. However, as a wholly-owned CFC, the net income and capital gain of the CFC, to the extent of its earnings and profits, will be included each year in the respective Fund’s investment company taxable income.
Expenses – Expenses of the Trust that are directly identifiable to a specific fund are charged to that fund. Expenses that are not readily identifiable to a specific fund are allocated in such a manner as deemed equitable, taking into consideration the nature and type of expense and the relative sizes of the funds in the Trust.
Indemnification – The Trust indemnifies its officers and Trustees for certain liabilities that may arise from the performance of their duties to the Trust. Additionally, in the normal course of business, each Fund enters into contracts that contain a variety of representations and warranties and which provide general indemnities. Each Fund’s maximum exposure under these arrangements is unknown, as this would involve future claims that may be made against the Funds that have not yet occurred. However, based on experience, the risk of loss due to these warranties and indemnities appears to be remote.
74
| The Quantified Funds |
| NOTES TO CONSOLIDATED FINANCIAL STATEMENTS (Continued) |
| June 30, 2021 |
| 3. | INVESTMENT TRANSACTIONS |
The cost of purchases and proceeds from sale of securities, other than short-term investments, swaps and futures contracts, for year or period ended June 30, 2021 for the Funds were as follows:
| Fund | Purchases | Sales | ||||||
| Quantified Managed Income Fund | $ | 644,810,308 | $ | 543,476,855 | ||||
| Quantified Market Leaders Fund | 1,265,028,232 | 1,166,947,277 | ||||||
| Quantified Alternative Investment Fund | 110,829,599 | 112,175,940 | ||||||
| Quantified STF Fund | 117,611,093 | 96,570,037 | ||||||
| Quantified Pattern Recognition Fund | 28,038,231 | 24,347,445 | ||||||
| Quantified Tactical Fixed Income Fund | 67,734,461 | 41,484,631 | ||||||
| Quantified Evolution Plus Fund | 51,286,431 | 44,990,678 | ||||||
| Quantified Common Ground Fund | 400,670,677 | 379,860,753 | ||||||
| Quantified Tactical Sectors Fund | 111,762,437 | 77,708,627 | ||||||
| Quantified Rising Dividend Tactical Fund | 19,601,970 | — | ||||||
| Quantified Government Income Tactical Fund | 4,276,219 | 2,097,496 | ||||||
| 4. | IMPACT OF DERIVATIVES ON THE STATEMENTS OF ASSETS AND LIABILITIES AND STATEMENTS OF OPERATIONS |
The following is a summary of the location of derivative investments on the Funds’ Statements of Assets and Liabilities as of June 30, 2021:
| Derivative Investment Type | Location on the Statements of Assets and Liabilities |
| Futures | Unrealized appreciation (depreciation) on futures |
| Swaps | Unrealized appreciation (depreciation) on swaps |
| Asset derivatives | |||||||
| Quantified Market Leaders Fund | Swaps - Equity Contracts | $ | 5,363,895 | ||||
| Quantified Alternative Investment Fund | Futures - Equity Contracts | 22,482 | |||||
| Quantified STF Fund | Futures - Equity Contracts | 11,849,965 | |||||
| Quantified Pattern Recognition Fund | Futures - Equity Contracts | 88,053 | |||||
| Quantified Evolution Plus Fund | Futures - Equity Contracts | 316,341 | |||||
| Quantified Tactical Fixed Income Fund | Swaps - Credit Contracts | 353,936 | |||||
| Liability derivatives | |||||||
| Quantified Managed Income Fund | Futures - Interest Rate Contracts | $ | (49,675 | ) | |||
| Quantified Evolution Plus Fund | Futures - Equity Contracts | (1,056,694 | ) | ||||
| Swaps - Equity Contracts | (653,158 | ) | |||||
| Quantified Tactical Fixed Income Fund | Futures - Interest Rate Contracts | (17,113 | ) | ||||
| Quantified Tactical Sectors Fund | Swaps - Equity Contracts | (342,027 | ) | ||||
| Quantified Government Income Tactical Fund | Futures - Interest Rate Contracts | (1,504 | ) | ||||
75
| The Quantified Funds |
| NOTES TO CONSOLIDATED FINANCIAL STATEMENTS (Continued) |
| June 30, 2021 |
| Transactions in derivative instruments during the year or period ended June 30,2021, were as follows: | |||||||
| Equity/Interest | |||||||
| Rate/Credit/Commodity | |||||||
| Statements of Operations location | Contracts | ||||||
| Quantified Managed Income Fund | Net Realized gain (loss) from: (1) | $ | (1,301,623 | ) | |||
| Interest Rate Risk | Futures | ||||||
| Equity Risk | Futures | (2,496,997 | ) | ||||
| (3,798,620 | ) | ||||||
| Net Change in unrealized appreciation (depreciation) on: (2) | |||||||
| Interest Rate Risk | Futures | $ | 9,820 | ||||
| Equity Risk | Futures | 101,209 | |||||
| 111,029 | |||||||
| Quantified Market Leaders Fund | Net Realized gain (loss) from: (1) | ||||||
| Equity Risk | Swaps | $ | 28,590,608 | ||||
| Net Change in unrealized appreciation (depreciation) on: (2) | |||||||
| Equity Risk | Swaps | $ | 3,244,610 | ||||
| Quantified Alternative Investment Fund | Net Realized gain (loss) from: (1) | ||||||
| Equity Risk | Futures | $ | 115,007 | ||||
| Net Change in unrealized appreciation (depreciation) on: (2) | |||||||
| Equity Risk | Futures | $ | 16,986 | ||||
| Quantified STF Fund | Net Realized gain (loss) from: (1) | ||||||
| Equity Risk | Futures | $ | 37,149,015 | ||||
| Net Change in unrealized appreciation (depreciation) on: (2) | |||||||
| Equity Risk | Futures | $ | 9,015,524 | ||||
| Quantified Pattern Recognition Fund | Net Realized gain (loss) from: (1) | ||||||
| Equity Risk | Futures | $ | 10,565,905 | ||||
| Net Change in unrealized appreciation (depreciation) on: (2) | |||||||
| Equity Risk | Futures | $ | 88,053 | ||||
| Quantified Tactical Fixed Income Fund | Net Realized gain (loss) from: (1) | ||||||
| Interest Rate Risk | Futures | $ | (11,453,591 | ) | |||
| Credit Risk | Swaps | 332,762 | |||||
| Net Change in unrealized appreciation (depreciation) on: (2) | |||||||
| Interest Rate Risk | Futures | $ | (7,054 | ) | |||
| Credit Risk | Swaps | 858,361 | |||||
| Quantified Evolution Plus Fund | Net Realized gain (loss) from: (1) | ||||||
| Commodity Risk | Futures | $ | (4,880,264 | ) | |||
| Equity Risk | Futures | 10,173,361 | |||||
| Interest Rate Risk | Futures | 232,640 | |||||
| 5,525,737 | |||||||
| Equity Risk | Swaps | 539,785 | |||||
| Net Change in unrealized appreciation (depreciation) on: (2) | |||||||
| Commodity Risk | Futures | $ | (37,370 | ) | |||
| Interest Rate Risk | Futures | (429,132 | ) | ||||
| Equity Risk | Futures | (904,267 | ) | ||||
| (1,370,769 | ) | ||||||
| Equity Risk | Swaps | (653,158 | ) | ||||
| Quantified Tactical Sectors Fund | Net Realized gain (loss) from: (1) | ||||||
| Equity Risk | Swaps | $ | 492,598 | ||||
| Net Change in unrealized appreciation (depreciation) on: (2) | |||||||
| Equity Risk | Swaps | $ | (342,027 | ) | |||
| Quantified Government Income Tactical Fund | Net Realized gain (loss) from: (1) | ||||||
| Interest Rate Risk | Futures | $ | 80,260 | ||||
| Net Change in unrealized appreciation (depreciation) on: (2) | |||||||
| Interest Rate Risk | Futures | $ | (1,504 | ) | |||
| (1) | Statement of Operations location: Net realized gain (loss) from futures, Net realized gain (loss) from swaps. |
| (2) | Statement of Operations location: Net change in unrealized appreciation (depreciation) on futures, Net change in unrealized appreciation (depreciation) on swaps. |
76
| The Quantified Funds |
| NOTES TO CONSOLIDATED FINANCIAL STATEMENTS (Continued) |
| June 30, 2021 |
The derivative instruments outstanding as of June 30, 2021 as disclosed in the Schedules of Investments and the amounts of realized and changes in unrealized gains and losses on derivative instruments during the year as disclosed in the Statements of Operations serve as indicators of the volume of derivative activity for each Fund.
Associated Risk
Market Risk: Market risk is the risk that changes in interest rates, foreign exchange rates or equity prices will affect the positions held by each Fund. The Funds are exposed to market risk on financial instruments that are valued at market prices as disclosed in the Schedule of Investments. The prices of derivative instruments, including swaps and futures prices, can be highly volatile. Price movements of derivative contracts in which each Fund’s assets may be invested are influenced by, among other things, interest rates, changing supply and demand relationships, trade, fiscal, monetary and exchange control programs and policies of governments, and national and international political and economic events and policies. Each Fund may be exposed to market risk on derivative contracts in that each Fund may not be able to readily dispose of its holdings when it chooses and also that the price obtained on disposal is below that at which the investment is included in the Funds’ financial statements. All financial instruments are recognized at fair value, and all changes in market conditions directly affect net income. The Funds’ investments in derivative instruments are exposed to market risk and are disclosed in the schedule of investments.
Unexpected local, regional or global events, such as war; acts of terrorism; financial, political or social disruptions; natural, environmental or man-made disasters; the spread of infectious illnesses or other public health issues; and recessions and depressions could have a significant impact on the Funds and their investments and may impair market liquidity. Such events can cause investor fear, which can adversely affect the economies of nations, regions and the market in general, in ways that cannot necessarily be foreseen. An outbreak of infectious respiratory illness known as COVID-19, which is caused by a novel coronavirus (SARS-CoV-2), was first detected in China in December 2019 and subsequently spread globally. This coronavirus has resulted in, among other things, travel restrictions, closed international borders, enhanced health screenings at ports of entry and elsewhere, disruption of and delays in healthcare service preparation and delivery, prolonged quarantines, significant disruptions to business operations, market closures, cancellations and restrictions, supply chain disruptions, lower consumer demand, and significant volatility and declines in global financial markets, as well as general concern and uncertainty. The impact of COVID-19 has adversely affected, and other infectious illness outbreaks that may arise in the future could adversely affect, the economies of many nations and the entire global economy, individual issuers and capital markets in ways that cannot necessarily be foreseen. Public health crises caused by the COVID-19 outbreak may exacerbate other pre-existing political, social and economic risks in certain countries or globally. The duration of the COVID-19 outbreak and its effects cannot be determined with certainty.
Counterparty Risk: Each Fund may invest in swap contracts (the “Product”) with Credit Suisse or Barclays as the counterparty. If Credit Suisse or Barclays becomes insolvent, Credit Suisse or Barclays may not be able to make any payments under the Product and investors may lose their capital invested in the Product. A decline in Credit Suisse’s or Barclays’s standing is likely to reduce the market value of the Product and therefore the price an investor may receive for the Product if they sell it in the market.
Liquidity Risk: Liquidity risk is the risk that a Fund will encounter difficulty in raising funds to meet commitments. Liquidity risk may result in an inability to sell investments quickly at close to fair value. Each Fund’s financial instruments may include investments in securities which are not traded on organized public exchanges and which generally may be illiquid. As a result, a Fund may not be able to quickly liquidate its investments in these instruments at an amount close to its fair value in order to meet its liquidity requirements. The Funds’ do not anticipate any material losses as a result of liquidity risk.
77
| The Quantified Funds |
| NOTES TO CONSOLIDATED FINANCIAL STATEMENTS (Continued) |
| June 30, 2021 |
| 5. | OFFSETTING OF FINANCIAL ASSETS AND DERIVATIVE ASSETS |
Each Fund’s policy is to recognize a gross asset or liability equal to the unrealized gain (loss) on futures contracts and swap contracts. The following table shows additional information regarding the offsetting of assets and liabilities as of June 30, 2021.
Quantified Managed Income Fund:
| Gross Amounts Not Offset in the | ||||||||||||||||||||||||
| Assets: | Statements of Assets & Liabilities | |||||||||||||||||||||||
| Gross Amounts | Gross Amounts | Net Amounts of | ||||||||||||||||||||||
| Presented in the | Offset in the | Liabilities Presented | ||||||||||||||||||||||
| Statements of Assets | Statements of Assets | in the Statements of | Financial | Cash Collateral | ||||||||||||||||||||
| Description | & Liabilities | & Liabilities | Assets & Liabilities | Instruments (2) | Received | Net Amount | ||||||||||||||||||
| Securities Lending | $ | 39,694,253 | $ | — | $ | 39,694,253 | $ | (39,694,253 | ) | $ | — | $ | — | |||||||||||
| Gross Amounts Not Offset in the | ||||||||||||||||||||||||
| Liabilities: | Statement of Assets & Liabilities | |||||||||||||||||||||||
| Gross Amounts | Net Amounts of | |||||||||||||||||||||||
| Gross Amounts of | Offset in the | Assets Presented in | ||||||||||||||||||||||
| Recognized | Statement of Assets | the Statement of | Financial | Cash Collateral | ||||||||||||||||||||
| Description | Liabilities | & Liabilities | Assets & Liabilities | Instruments | Pledged (1) | Net Amount | ||||||||||||||||||
| Futures Contracts | $ | (49,675 | ) | $ | — | $ | (49,675 | ) | $ | — | $ | 49,675 | $ | — | ||||||||||
Quantified Market Leaders Fund:
| Gross Amounts Not Offset in the | ||||||||||||||||||||||||
| Assets: | Statements of Assets & Liabilities | |||||||||||||||||||||||
| Gross Amounts | Gross Amounts | Net Amounts of Assets | ||||||||||||||||||||||
| Presented in the | Offset in the | Presented in the | ||||||||||||||||||||||
| Statements of Assets | Statements of Assets | Statements of Assets & | Financial | Cash Collateral | ||||||||||||||||||||
| Description | & Liabilities | & Liabilities | Liabilities | Instruments (2) | Received | Net Amount | ||||||||||||||||||
| Swaps | $ | 5,363,895 | $ | — | $ | 5,363,895 | $ | (5,364,407 | ) | $ | — | $ | (512 | ) | ||||||||||
| Securities Lending | 17,189,805 | — | 17,189,805 | (17,189,805 | ) | — | ||||||||||||||||||
| Total | $ | 22,553,700 | $ | — | $ | 22,553,700 | $ | (22,554,212 | ) | $ | — | $ | (512 | ) | ||||||||||
Quantified Alternative Investment Fund:
| Gross Amounts Not Offset in the | ||||||||||||||||||||||||
| Assets: | Statements of Assets & Liabilities | |||||||||||||||||||||||
| Gross Amounts | ||||||||||||||||||||||||
| Presented in | Gross Amounts | Net Amounts | ||||||||||||||||||||||
| the Statements | Offset in the | Presented in the | Financial | |||||||||||||||||||||
| of Assets & | Statement of | Statement of | Instruments | Cash Collateral | ||||||||||||||||||||
| Description | Liabilities | Assets & Liabilities | Assets & Liabilities | Pledged (2) | Received | Net Amount | ||||||||||||||||||
| Futures Contracts | $ | 22,482 | $ | — | $ | 22,482 | $ | — | $ | — | $ | 22,482 | ||||||||||||
| Securities lending | 689,681 | — | 689,681 | (689,681 | ) | — | — | |||||||||||||||||
| Total | $ | 712,163 | $ | — | $ | 712,163 | $ | (689,681 | ) | $ | — | $ | 22,482 | |||||||||||
78
| The Quantified Funds |
| NOTES TO CONSOLIDATED FINANCIAL STATEMENTS (Continued) |
| June 30, 2021 |
Quantified STF Fund:
| Gross Amounts Not Offset in the Statements of | ||||||||||||||||||||||||
| Assets: | Assets & Liabilities | |||||||||||||||||||||||
| Gross Amounts | ||||||||||||||||||||||||
| Presented in the | Gross Amounts | Net Amounts | ||||||||||||||||||||||
| Statements of | Offset in the | Presented in the | Financial | |||||||||||||||||||||
| Assets & | Statement of Assets | Statement of | Instruments | Cash Collateral | ||||||||||||||||||||
| Description | Liabilities | & Liabilities | Assets & Liabilities | Pledged (2) | Received | Net Amount | ||||||||||||||||||
| Futures Contracts | $ | 11,849,965 | $ | — | $ | 11,849,965 | $ | — | $ | — | $ | 11,849,965 | ||||||||||||
| Securities lending | 7,501,270 | — | 7,501,270 | (7,501,270 | ) | — | — | |||||||||||||||||
| Total | $ | 19,351,235 | $ | — | $ | 19,351,235 | $ | (7,501,270 | ) | $ | — | $ | 11,849,965 | |||||||||||
Quantified Pattern Recognition Fund
| Gross Amounts Not Offset in the Statements of | ||||||||||||||||||||||||
| Assets: | Assets & Liabilities | |||||||||||||||||||||||
| Gross Amounts | ||||||||||||||||||||||||
| Presented in the | Gross Amounts | Net Amounts | ||||||||||||||||||||||
| Statements of | Offset in the | Presented in the | Financial | |||||||||||||||||||||
| Assets & | Statement of Assets | Statement of | Instruments | Cash Collateral | ||||||||||||||||||||
| Description | Liabilities | & Liabilities | Assets & Liabilities | Pledged (2) | Received | Net Amount | ||||||||||||||||||
| Futures Contracts | $ | 88,053 | $ | — | $ | 88,053 | $ | — | $ | — | $ | 88,053 | ||||||||||||
| Securities lending | 1,750,162 | — | 1,750,162 | (1,750,162 | ) | — | — | |||||||||||||||||
| Total | $ | 1,838,215 | $ | — | $ | 1,838,215 | $ | (1,750,162 | ) | $ | — | $ | 88,053 | |||||||||||
Quantified Tactical Fixed Income Fund:
| Gross Amounts Not Offset in the Statements | ||||||||||||||||||||||||
| Assets: | of Assets & Liabilities | |||||||||||||||||||||||
| Gross Amounts | Gross Amounts | Net Amounts | ||||||||||||||||||||||
| Presented in the | Offset in the | Presented in the | Financial | |||||||||||||||||||||
| Statements of | Statement of | Statement of Assets | Instruments | |||||||||||||||||||||
| Description | Assets & Liabilities | Assets & Liabilities | & Liabilities | Pledged (2) | Cash Collateral Received | Net Amount | ||||||||||||||||||
| Swaps | $ | 353,936 | $ | — | $ | 353,936 | $ | — | $ | — | $ | 353,936 | ||||||||||||
| Securities lending | 7,477,302 | * | — | 7,477,302 | (7,477,302 | ) | — | — | ||||||||||||||||
| Total | $ | 7,831,238 | $ | — | $ | 7,831,238 | $ | (7,477,302 | ) | $ | — | $ | 353,936 | |||||||||||
| Gross Amounts Not Offset in the | ||||||||||||||||||||||||
| Liabilities: | Statements of Assets & Liabilities | |||||||||||||||||||||||
| Gross Amounts | Gross Amounts | Net Amounts of | ||||||||||||||||||||||
| Presented in the | Offset in the | Liabilities Presented in | ||||||||||||||||||||||
| Statements of Assets | Statements of Assets | the Statements of | Financial | Cash Collateral | ||||||||||||||||||||
| Description | & Liabilities | & Liabilities | Assets & Liabilities | Instruments | Pledged (1) | Net Amount | ||||||||||||||||||
| Futures Contracts | $ | (17,113 | ) | $ | — | $ | (17,113 | ) | $ | — | $ | 17,113 | $ | — | ||||||||||
| Total | $ | (17,113 | ) | $ | — | $ | (17,113 | ) | $ | — | $ | 17,113 | $ | — | ||||||||||
79
| The Quantified Funds |
| NOTES TO CONSOLIDATED FINANCIAL STATEMENTS (Continued) |
| June 30, 2021 |
Quantified Evolution Plus Fund:
| Gross Amounts Not Offset in the | ||||||||||||||||||||||||
| Assets: | Statements of Assets & Liabilities | |||||||||||||||||||||||
| Gross Amounts | Gross Amounts | Net Amounts of Assets | ||||||||||||||||||||||
| Presented in the | Offset in the | Presented in the | ||||||||||||||||||||||
| Statements of Assets | Statements of Assets | Statements of Assets & | Financial | Cash Collateral | ||||||||||||||||||||
| Description | & Liabilities | & Liabilities | Liabilities | Instruments (2) | Received | Net Amount | ||||||||||||||||||
| Futures Contracts | $ | 316,341 | $ | — | $ | 316,341 | $ | (316,341 | ) | $ | — | $ | — | |||||||||||
| Securities lending | 1,326,985 | — | 1,326,985 | (1,326,985 | ) | — | — | |||||||||||||||||
| Total | $ | 1,643,326 | $ | — | $ | 1,643,326 | $ | (1,643,326 | ) | $ | — | $ | — | |||||||||||
| Gross Amounts Not Offset in the | ||||||||||||||||||||||||
| Liabilities: | Statement of Assets & Liabilities | |||||||||||||||||||||||
| Gross Amounts | Gross Amounts | Net Amounts of | ||||||||||||||||||||||
| Presented in the | Offset in the | Liabilities Presented in | ||||||||||||||||||||||
| Statements of Assets | Statement of Assets | the Statement of | Financial | Cash Collateral | ||||||||||||||||||||
| Description | & Liabilities | & Liabilities | Assets & Liabilities | Instruments | Pledged (1) | Net Amount | ||||||||||||||||||
| Futures Contracts | $ | (1,056,694 | ) | $ | — | $ | (1,056,694 | ) | $ | 316,341 | $ | 740,353 | $ | — | ||||||||||
| Swaps | (653,158 | ) | — | (653,158 | ) | — | 360,000 | (293,158 | ) | |||||||||||||||
| Total | $ | (1,709,852 | ) | $ | — | $ | (1,709,852 | ) | $ | 316,341 | $ | 1,100,353 | $ | — | ||||||||||
Quantified Common Ground Fund:
| Gross Amounts Not Offset in the Statements of | ||||||||||||||||||||||||
| Assets: | Assets & Liabilities | |||||||||||||||||||||||
| Gross Amounts | ||||||||||||||||||||||||
| Presented in | Gross Amounts | Net Amounts | ||||||||||||||||||||||
| the Statements | Offset in the | Presented in the | Financial | |||||||||||||||||||||
| of Assets & | Statement of | Statement of | Instruments | Cash Collateral | ||||||||||||||||||||
| Description | Liabilities | Assets & Liabilities | Assets & Liabilities | Pledged (2) | Received | Net Amount | ||||||||||||||||||
| Securities lending | $ | 7,102,226 | $ | — | $ | 7,102,226 | $ | (7,102,226 | ) | $ | — | $ | — | |||||||||||
Quantified Tactical Sectors Fund:
| Gross Amounts Not Offset in the | ||||||||||||||||||||||||
| Assets: | Statements of Assets & Liabilities | |||||||||||||||||||||||
| Gross Amounts | Gross Amounts | Net Amounts of Assets | ||||||||||||||||||||||
| Presented in the | Offset in the | Presented in the | ||||||||||||||||||||||
| Statements of Assets | Statements of Assets | Statements of Assets & | Financial | Cash Collateral | ||||||||||||||||||||
| Description | & Liabilities | & Liabilities | Liabilities | Instruments (2) | Received | Net Amount | ||||||||||||||||||
| Swaps | $ | 834,785 | $ | (834,785 | ) | $ | — | $ | — | $ | — | $ | — | |||||||||||
| Securities lending | 5,262,683 | — | 5,262,683 | (5,262,683 | ) | — | — | |||||||||||||||||
| Total | $ | 6,097,468 | $ | (834,785 | ) | $ | 5,262,683 | $ | (5,262,683 | ) | $ | — | $ | — | ||||||||||
| Gross Amounts Not Offset in the | ||||||||||||||||||||||||
| Liabilities: | Statement of Assets & Liabilities | |||||||||||||||||||||||
| Gross Amounts | Gross Amounts | Net Amounts of | ||||||||||||||||||||||
| Presented in the | Offset in the | Liabilities Presented in | ||||||||||||||||||||||
| Statements of Assets | Statement of Assets | the Statement of | Financial | Cash Collateral | ||||||||||||||||||||
| Description | & Liabilities | & Liabilities | Assets & Liabilities | Instruments | Pledged (1) | Net Amount | ||||||||||||||||||
| Swaps | $ | (1,176,812 | ) | $ | 834,785 | $ | (342,027 | ) | $ | — | $ | 270,000 | $ | (72,027 | ) | |||||||||
| Total | $ | (1,176,812 | ) | $ | 834,785 | $ | (342,027 | ) | $ | — | $ | 270,000 | $ | (72,027 | ) | |||||||||
80
The Quantified Funds
NOTES TO CONSOLIDATED FINANCIAL STATEMENTS (Continued)
June 30, 2021
Quantified Government Income Tactical Fund:
| Gross Amounts Not Offset in the | ||||||||||||||||||||||||
| Liabilities: | Statement of Assets & Liabilities | |||||||||||||||||||||||
| Gross Amounts | Gross Amounts | Net Amounts of | ||||||||||||||||||||||
| Presented in the | Offset in the | Liabilities Presented in | ||||||||||||||||||||||
| Statements of Assets | Statement of Assets | the Statement of | Financial | Cash Collateral | ||||||||||||||||||||
| Description | & Liabilities | & Liabilities | Assets & Liabilities | Instruments | Pledged (1) | Net Amount | ||||||||||||||||||
| Futures Contracts | $ | (1,504 | ) | $ | — | $ | (1,504 | ) | $ | — | $ | 1,504 | $ | — | ||||||||||
| (1) | The amount is limited to the derivative liability balance and accordingly does not include excess collateral pledged. |
| (2) | The amount does not include excess collateral pledged by the counterparty. Detailed collateral amounts are presented in the Statements of Assets and Liabilities. |
| 6. | INVESTMENT ADVISORY AGREEMENT AND TRANSACTIONS WITH RELATED PARTIES |
The business activities of each Fund are overseen by the Board, which is responsible for the overall management of the Funds. Advisors Preferred LLC (“Advisor”), serves as investment advisor to the Funds. The Advisor has engaged Flexible Plan Investments, Ltd. (the “Sub-Advisor”) to serve as the sub-advisor to the Funds.
Pursuant to an advisory agreement with the Funds, the Advisor, under the oversight of the Board, directs the daily operations of each Fund and supervises the performance of administrative and professional services provided by others. As compensation for its services and the related expenses borne by the Advisor, each Fund pays advisory fees accrued daily and paid monthly, based on each Fund’s average daily net assets and is computed at an annual rate of 1.00%, except for Quantified Alternative, Quantified Managed Income and Quantified Market Leaders which pay 0.75%. For the year or period ended June 30, 2021, each Fund accrued the following advisory fees:
| Quantified Managed Income Fund | $ | 805,133 | ||
| Quantified Market Leaders Fund | 1,895,586 | |||
| Quantified Alternative Investment Fund | 106,080 | |||
| Quantified STF Fund | 1,195,720 | |||
| Quantified Pattern Recognition Fund | 305,801 | |||
| Quantified Tactical Fixed Income Fund | 1,441,622 | |||
| Quantified Evolution Plus Fund | 360,750 | |||
| Quantified Common Ground Fund | 403,911 | |||
| Quantified Tactical Sectors Fund | 171,902 | |||
| Quantified Rising Dividend Tactical Fund | 40,996 | |||
| Quantified Government Income Tactical Fund | 12,714 |
Gemini Fund Services, LLC (“GFS”), GFS, provides administration, fund accounting, and transfer agent services to the Trust. Pursuant to the servicing agreement with GFS, each Fund pays GFS customary fees for providing administration, fund accounting and transfer agency services to the Fund. Under the terms of the Funds’ agreement with GFS, GFS pays for certain operating expenses of the Funds. Certain officers of the Trust are also officers of GFS, and are not paid any fees directly by the Funds for serving in such capacities.
81
| The Quantified Funds |
| NOTES TO CONSOLIDATED FINANCIAL STATEMENTS (Continued) |
| June 30, 2021 |
In addition, certain affiliates of GFS provide services to each Fund as follows:
Blu Giant, LLC (“Blu Giant”), an affiliate of GFS, provides EDGAR conversion and filing services as well as print management services for each Fund on an ad-hoc basis. These expenses are the responsibility of GFS.
The Trust has adopted Distribution Plans and Agreements pursuant to Rule 12b-1 under the 1940 Act for the Funds’ Investor Class and Advisor Class shares (each a “Plan” and together, the “Plans”) pursuant to which a Fund pays fees to the Ceros Financial Services, Inc. (“Ceros” or “Distributor”) for providing distribution and/or shareholder services to the Fund. Under the Plans, Investor Class shares of a Fund may pay an account maintenance fee for account maintenance services and/or distribution fee at an annual rate of up to 0.25% of the Fund’s average net assets attributable to Investor Class shares as compensation for the Distributor providing account maintenance and distribution services to shareholders; and up to 1.00% for Advisor Class shares of a Fund’s average daily net assets attributable to the Advisor Class shares. The 12b-1 Plan is a compensation plan, which means that compensation is provided regardless of 12b-1 expenses incurred.
For the year or period ended June 30, 2021, pursuant to the Rule 12b-1 Plan, each Fund accrued:
| Investor Class | Advisor Class | Total | ||||||||||
| Quantified Managed Income Fund | $ | 267,087 | $ | 1,378 | $ | 268,465 | ||||||
| Quantified Market Leaders Fund | 631,300 | 2,248 | 633,548 | |||||||||
| Quantified Alternative Investment Fund | 35,187 | 690 | 35,877 | |||||||||
| Quantified STF Fund | 296,597 | 6,014 | 302,611 | |||||||||
| Quantified Pattern Recognition Fund | 76,450 | — | 76,450 | |||||||||
| Quantified Tactical Fixed Income Fund | 360,405 | — | 360,405 | |||||||||
| Quantified Evolution Plus Fund | 89,609 | — | 89,609 | |||||||||
| Quantified Common Ground Fund | 100,978 | — | 100,978 | |||||||||
| Quantified Tactical Sectors Fund | 42,976 | — | 42,976 | |||||||||
| Quantified Rising Dividend Tactical Fund | 10,249 | — | 10,249 | |||||||||
| Quantified Government Income Tactical Fund | 3,179 | — | 3,179 | |||||||||
The Board has adopted a Shareholder Servicing Plan (the “Servicing Plan”) with respect to the Investor Class of each Fund. The Servicing Plan provides that a monthly service fee is calculated by each Fund at an annual rate of up to 0.15% (currently set at 0.15%), of its average daily net assets of the Investor Class and is paid to Ceros to provide compensation for ongoing shareholder servicing activities or service and/or maintenance accounts, not otherwise required to be provided by the Advisor. Ceros is an affiliate of the Advisor.
For the year or period ended June 30, 2021, pursuant to the Shareholder Services Agreement, each Fund paid:
| Investor Class | ||||
| Quantified Managed Income Fund | $ | 160,252 | ||
| Quantified Market Leaders Fund | 378,780 | |||
| Quantified Alternative Investment Fund | 21,112 | |||
| Quantified STF Fund | 177,958 | |||
| Quantified Pattern Recognition Fund | 45,870 | |||
| Quantified Tactical Fixed Income Fund | 216,243 | |||
| Quantified Evolution Plus Fund | 53,766 | |||
| Quantified Common Ground Fund | 60,587 | |||
| Quantified Tactical Sectors Fund | 25,785 | |||
| Quantified Rising Dividend Tactical Fund | 6,149 | |||
| Quantified Government Income Tactical Fund | 1,907 | |||
82
| The Quantified Funds |
| NOTES TO CONSOLIDATED FINANCIAL STATEMENTS (Continued) |
| June 30, 2021 |
During the year or period ended June 30, 2021, Ceros, a registered broker/dealer, executed trades on behalf of Quantified Managed Income Fund, Quantified Market Leaders Fund, Quantified Alternative Investment Fund, Quantified STF Fund, Quantified Pattern Recognition Fund, Quantified Tactical Fixed Income Fund, Quantified Evolution Plus Fund, Quantified Common Ground Fund, Quantified Tactical Sectors Fund, Quantified Rising Dividend Tactical Fund and Quantified Government Income Tactical Fund received $153,041, $185,866, $36,101, $34,327, $8,734, $15,165, $11,057, $111,744, $18,277, $1,341 and $1,429 in trade commissions, respectively.
Each Trustee who is not an “interested person” of the Trust or Advisor is compensated by the Advisor at a rate of $50,000 per year plus $2,500 per meeting for certain special meetings as well as for reimbursement for any reasonable expenses incurred attending the meetings, paid quarterly. The “interested persons” who serve as Trustees of the Trust receive no compensation for their services as Trustees. None of the executive officers receive compensation from the Trust. Interested trustees of the Trust are also officers or employees of the Advisor and its affiliates.
| 7. | AGGREGATE UNREALIZED APPRECIATION AND DEPRECIATION – TAX BASIS |
The identified cost of investments in securities owned by each Fund for federal income tax purposes excluding futures and swaps, and its respective gross unrealized appreciation and depreciation at June 30, 2021, were as follows:
| Gross | Gross | Net Unrealized | ||||||||||||||
| Tax | Unrealized | Unrealized | Appreciation/ | |||||||||||||
| Cost | Appreciation | (Depreciation) | (Depreciation) | |||||||||||||
| Quantified Managed Income Fund | $ | 162,557,104 | $ | 2,156,320 | $ | (1,611,494 | ) | $ | 544,826 | |||||||
| Quantified Market Leaders Fund | 366,433,780 | 8,991,926 | (2,725,894 | ) | 6,266,032 | |||||||||||
| Quantified Alternative Investment Fund | 9,298,902 | 108,086 | (173,170 | ) | (65,084 | ) | ||||||||||
| Quantified STF Fund | 137,299,192 | 60,110 | (283,257 | ) | (223,147 | ) | ||||||||||
| Quantified Pattern Recognition Fund | 69,650,576 | 150,618 | (132,856 | ) | 17,762 | |||||||||||
| Quantified Tactical Fixed Income Fund | 145,031,099 | 53,466 | (264,677 | ) | (211,211 | ) | ||||||||||
| Quantified Evolution Plus Fund | 44,797,623 | 4,158,468 | (4,190,050 | ) | (31,582 | ) | ||||||||||
| Quantified Common Ground Fund | 58,578,525 | 2,071,918 | (1,882,235 | ) | 189,683 | |||||||||||
| Quantified Tactical Sectors Fund | 59,366,558 | 74,503,607 | (74,067,048 | ) | 436,559 | |||||||||||
| Quantified Rising Dividend Tactical Fund | 21,125,127 | 477,058 | — | 477,058 | ||||||||||||
| Quantified Government Income Tactical Fund | 6,701,225 | 2,177 | (6,506 | ) | (4,329 | ) | ||||||||||
83
| The Quantified Funds |
| NOTES TO CONSOLIDATED FINANCIAL STATEMENTS (Continued) |
| June 30, 2021 |
| 8. | DISTRIBUTIONS TO SHAREHOLDERS AND TAX COMPONENTS OF CAPITAL |
The tax character of distributions paid for the periods ended June 30, 2021 and June 30, 2020 was as follows:
| For the period ended June 30, 2021: | ||||||||||||||||||||
| Ordinary | Long-Term | Return of | Tax Exempt | |||||||||||||||||
| Portfolio | Income | Capital Gains | Capital | Income | Total | |||||||||||||||
| Quantified Managed Income Fund | $ | 727,077 | $ | — | $ | — | $ | — | $ | 727,077 | ||||||||||
| Quantified Market Leaders Fund | 20,827,738 | — | — | — | 20,827,738 | |||||||||||||||
| Quantified Alternative Investment Fund | — | — | — | — | — | |||||||||||||||
| Quantified STF Fund | 10,992,115 | 11,448,564 | — | — | 22,440,679 | |||||||||||||||
| Quantified Pattern Recognition Fund | — | 43,751 | — | — | 43,751 | |||||||||||||||
| Quantified Tactical Fixed Income Fund | 1,085,151 | 1,750,280 | 1,273 | — | 2,836,704 | |||||||||||||||
| Quantified Evolution Plus Fund | 729,716 | — | — | — | 729,716 | |||||||||||||||
| Quantified Common Ground Fund | 1,107,232 | 4,687 | — | — | 1,111,919 | |||||||||||||||
| Quantified Tactical Sectors Fund | — | — | — | — | — | |||||||||||||||
| Quantified Rising Dividend Tactical Fund | — | — | — | — | — | |||||||||||||||
| Quantified Government Income Tactical Fund | — | — | — | — | — | |||||||||||||||
| For the period ended June 30, 2020: | ||||||||||||||||||||
| Ordinary | Long-Term | Return of | Tax Exempt | |||||||||||||||||
| Portfolio | Income | Capital Gains | Capital | Income | Total | |||||||||||||||
| Quantified Managed Income Fund | $ | 992,119 | $ | — | $ | — | $ | 566,979 | $ | 1,559,098 | ||||||||||
| Quantified Market Leaders Fund | 3,801,517 | — | — | — | 3,801,517 | |||||||||||||||
| Quantified Alternative Investment Fund | 144,452 | — | 2,652 | — | 147,104 | |||||||||||||||
| Quantified STF Fund | 324,678 | 5,819,789 | — | — | 6,144,467 | |||||||||||||||
| Quantified Pattern Recognition Fund | 420,936 | 576,593 | — | — | 997,529 | |||||||||||||||
| Quantified Tactical Fixed Income Fund | 432,018 | 1,612,800 | — | — | 2,044,818 | |||||||||||||||
| Quantified Evolution Plus Fund | 18,235 | 640 | — | — | 18,875 | |||||||||||||||
| Quantified Common Ground Fund | — | — | — | — | — | |||||||||||||||
| Quantified Tactical Sectors Fund | — | — | — | — | — | |||||||||||||||
| Quantified Rising Dividend Tactical Fund | — | — | — | — | — | |||||||||||||||
| Quantified Government Income Tactical Fund | — | — | — | — | — | |||||||||||||||
As of June 30, 2021, the components of accumulated earnings/(deficit) on a tax basis were as follows:
| Undistributed | Undistributed | Post October Loss | Capital Loss | Other | Unrealized | Total | ||||||||||||||||||||||
| Ordinary | Long-Term | and | Carry | Book/Tax | Appreciation/ | Accumulated | ||||||||||||||||||||||
| Income | Capital Gains | Late Year Loss | Forwards | Differences | (Depreciation) | Earnings/(Deficits) | ||||||||||||||||||||||
| Quantified Managed Income Fund | $ | 475,303 | $ | — | $ | (1,615,179 | ) | $ | (8,023,496 | ) | $ | — | $ | 544,826 | $ | (8,618,546 | ) | |||||||||||
| Quantified Market Leaders Fund | 64,864,124 | — | — | — | — | 6,266,032 | 71,130,156 | |||||||||||||||||||||
| Quantified Alternative Investment Fund | 670,037 | — | — | — | — | (65,084 | ) | 604,953 | ||||||||||||||||||||
| Quantified STF Fund | 14,274,318 | 6,613,758 | — | — | — | (223,147 | ) | 20,664,929 | ||||||||||||||||||||
| Quantified Pattern Recognition Fund | 3,446,285 | — | — | — | — | 17,762 | 3,464,047 | |||||||||||||||||||||
| Quantified Tactical Fixed Income Fund | — | — | (9,529,908 | ) | (2,138,684 | ) | — | (211,211 | ) | (11,879,803 | ) | |||||||||||||||||
| Quantified Evolution Plus Fund | 2,403,038 | 1,910,970 | — | — | — | (31,582 | ) | 4,282,426 | ||||||||||||||||||||
| Quantified Common Ground Fund | 5,446,433 | — | — | — | — | 189,683 | 5,636,116 | |||||||||||||||||||||
| Quantified Tactical Sectors Fund | 2,251,468 | — | — | — | — | 436,559 | 2,688,027 | |||||||||||||||||||||
| Quantified Rising Dividend Tactical Fund | 14,977 | — | — | — | — | 477,058 | 492,035 | |||||||||||||||||||||
| Quantified Government Income Tactical Fund | 21,013 | 42,337 | — | — | — | (4,329 | ) | 59,021 | ||||||||||||||||||||
The difference between book basis and tax basis unrealized appreciation, undistributed net investment income (loss) and accumulated net realized gains (losses) from investments is primarily attributable to the tax deferral of losses on wash sales, the mark-to-market on open Section 1256 and swap contracts, and C-Corporation return of capital distributions.
84
| The Quantified Funds |
| NOTES TO CONSOLIDATED FINANCIAL STATEMENTS (Continued) |
| June 30, 2021 |
Capital losses incurred after October 31 within the fiscal year are deemed to arise on the first business day of the following fiscal year for tax purposes. The Funds incurred and elected to defer such capital losses as follows:
| Post October | ||||
| Losses | ||||
| Quantified Managed Income Fund | $ | 1,615,179 | ||
| Quantified Market Leaders Fund | — | |||
| Quantified Alternative Investment Fund | — | |||
| Quantified STF Fund | — | |||
| Quantified Pattern Recognition Fund | — | |||
| Quantified Tactical Fixed Income Fund | 9,529,908 | |||
| Quantified Evolution Plus Fund | — | |||
| Quantified Common Ground Fund | — | |||
| Quantified Tactical Sectors Fund | — | |||
| Quantified Rising Dividend Tactical Fund | — | |||
| Quantified Government Income Tactical Fund | — | |||
At June 30, 2021, the Funds below had capital loss carry forwards for federal income tax purposes available to offset future capital gains and utilized capital loss carryforwards as follows:
| Short-Term | Long-Term | Total | Utilized | |||||||||||||
| Quantified Managed Income Fund | $ | 7,248,468 | $ | 775,028 | $ | 8,023,496 | $ | — | ||||||||
| Quantified Alternative Investment Fund | — | — | — | 378,795 | ||||||||||||
| Quantified Tactical Fixed Income Fund | 1,217,414 | 921,270 | 2,138,684 | — | ||||||||||||
During the fiscal period ended June 30, 2021, certain of the Funds utilized tax equalization which is the use of earnings and profits distributions to shareholders on redemption of shares as part of the dividends paid deduction for income tax purposes. Permanent book and tax differences, primarily attributable to the book/tax basis treatment of non-deductible expenses and net operating losses, reclassification of Fund distributions, use of tax equalization, credits adjustments for prior year tax returns and adjustments related to the Quantified Evolution Plus Fund’s wholly owned subsidiary, resulted in reclassification for the period ended June 30, 2021 as follows:
| Paid | ||||||||
| In | Accumulated | |||||||
| Capital | Earnings (Losses) | |||||||
| Quantified Managed Income Fund | $ | — | $ | — | ||||
| Quantified Market Leaders Fund | 34,734,450 | (34,734,450 | ) | |||||
| Quantified Alternative Investment Fund | 1,260,704 | (1,260,704 | ) | |||||
| Quantified STF Fund | 15,772,368 | (15,772,368 | ) | |||||
| Quantified Pattern Recognition Fund | 6,883,764 | (6,883,764 | ) | |||||
| Quantified Tactical Fixed Income Fund | (419,680 | ) | 419,680 | |||||
| Quantified Evolution Plus Fund | (1,974,229 | ) | 1,974,229 | |||||
| Quantified Common Ground Fund | 6,502,878 | (6,502,878 | ) | |||||
| Quantified Tactical Sectors Fund | 75,639 | (75,639 | ) | |||||
| Quantified Rising Dividend Tactical Fund | (10,249 | ) | 10,249 | |||||
| Quantified Government Income Tactical Fund | 1,738 | (1,738 | ) | |||||
| 9. | CONTROL OWNERSHIP |
The beneficial ownership, either directly or indirectly, of more than 25% of the voting securities of a fund creates presumption of control of the fund pursuant to Section 2(a)(9) of the 1940 Act. As of June 30, 2021, E*Trade Savings Bank held 80.16% of the Quantified Managed Income Fund, 79.77% of the
85
| The Quantified Funds |
| NOTES TO CONSOLIDATED FINANCIAL STATEMENTS (Continued) |
| June 30, 2021 |
Quantified Market Leaders Fund, 66.48% of the Quantified Alternative Investment Fund, 69.84% of the Quantified STF Fund, 72.10% of the Quantified Pattern Recognition Fund, 85.00% of the Quantified Tactical Fixed Income Fund, 85.34% of the Quantified Evolution Plus Fund, 81.69% of the Quantified Common Ground Fund, 99.90% of the Quantified Tactical Sectors Fund, 99.72% of the Quantified Rising Dividend Tactical Fund and 100.00% of the Quantified Government Income Tactical Fund.
| 10. | UNDERLYING INVESTMENT IN OTHER INVESTMENT COMPANIES |
The following Funds currently invest greater than 25% of their assets in the corresponding investments. The Fund may redeem its investment from the investments at any time if the Advisor or Subadvisor determines that it is in the best interest of the Fund and its shareholders to do so. The performance of the Fund will be directly affected by the performance of the investments. The financial statements of the investments, including their schedule of investments, can be found at the Securities and Exchange Commission’s website www.sec.gov and should be read in conjunction with the Funds’ financial statements.
| Fund | Investment | Percentage of Net Assets | ||
| Quantified Pattern Recognition Fund | Fidelity Government Portfolio | 37.5% | ||
| First American Government Obligations Fund | 37.5% | |||
| Quantified Evolution Plus Fund | Fidelity Government Portfolio | 27.0% | ||
| First American Government Obligations Fund | 27.0% | |||
| Quantified Government Income Tactical Fund | Fidelity Government Portfolio | 32.5% | ||
| First American Government Obligations Fund | 32.5% |
| 11. | SECURITIES LENDING |
The Funds have entered into a securities lending arrangement (the “Agreement”) with U.S. Bank (the “Lending Agent”). Under the terms of the Agreement, the Funds are authorized to loan securities to the Lending Agent. In exchange, the Funds receive cash and “non-cash” or “securities” collateral in the amount of at least 105% of the value of any loaned securities that are foreign securities or 102% of the value of any other loaned securities marked-to-market daily. Loans shall be marked to market daily and the margin restored in the event collateralization is below 100% of the value of securities loaned. The value of securities loaned is disclosed in a footnote on the Statements of Assets and Liabilities and on the Schedules of Investments. Securities lending income is disclosed in the Funds’ Statements of Operations. Although risk is mitigated by the collateral, the Funds could experience a delay in recovering their securities and possible loss of income or value if the Lending Agent fails to return the securities on loan. The Funds’ cash collateral received in securities lending transactions is invested in the Mount Vernon Liquid Assets Portfolio, LLC, a privately offered liquidity fund, as presented below. The investment objective is to seek to maximize current income to the extent consistent with the preservation of capital and liquidity and maintain a stable NAV of $1.00 per unit
86
| The Quantified Funds |
| NOTES TO CONSOLIDATED FINANCIAL STATEMENTS (Continued) |
| June 30, 2021 |
As of June 30, 2021, the following Funds loaned securities which were collateralized by cash. The value of securities on loan and the value of the related collateral were as follows:
| Overnight and Continuous | ||||||||
| Fund | Value of Securities Loaned | Value of Collateral* | ||||||
| Quantified Managed Income Fund | $ | 39,694,253 | $ | 40,317,607 | ||||
| Quantified Market Leaders Fund | 17,189,805 | 17,520,350 | ||||||
| Quantified Alternative Investment Fund | 689,681 | 698,694 | ||||||
| Quantified STF Fund | 7,501,270 | 7,654,963 | ||||||
| Quantified Pattern Recognition Fund | 1,750,162 | 1,785,960 | ||||||
| Quantified Tactical Fixed Income Fund | 7,477,302 | 7,630,450 | ||||||
| Quantified Evolution Plusd Fund | 1,326,985 | 1,354,128 | ||||||
| Quantified Common Ground Fund | 7,102,226 | 7,163,955 | ||||||
| Quantified Tactical Sectors Fund | 5,262,683 | 5,344,246 | ||||||
| * | The above Funds received cash collateral, which was subsequently invested in the Mount Vernon Liquid Assets Portfolio, LLC as reported in the Schedules of Investments. |
| 12. | SUBSEQUENT EVENTS |
Subsequent events after the date of the Statements of Assets and Liabilities have been evaluated through the date the financial statements were issued. Management has determined that no events or transactions occurred requiring adjustment or disclosure in the financial statements.
87

REPORT OF INDEPENDENT REGISTERED PUBLIC ACCOUNTING FIRM
To the Shareholders of Quantified Funds and Board of Trustees of Advisors Preferred Trust
Opinion on the Financial Statements
We have audited the accompanying statements of assets and liabilities, including the schedules of investments, of Quantified Funds comprising the funds listed below (the “Funds”) as of June 30, 2021, the related statements of operations, the statements of changes in net assets, the related notes, and the financial highlights for each of the periods indicated below, including the related notes (collectively referred to as the “financial statements”). In our opinion, the financial statements present fairly, in all material respects, the financial position of each of the Funds as of June 30, 2021, the results of their operations, the changes in net assets, and the financial highlights for each of the of the periods indicated below in conformity with accounting principles generally accepted in the United States of America.
| Statements of | Statements of Changes in | ||
| Fund Name | Operations | Net Assets | Financial Highlights |
| Quantified Managed Income Fund, Quantified Market Leaders Fund, Quantified Alternative Investment Fund, and Quantified STF Fund | For the year ended June 30, 2021 | For the years ended June 30, 2021 and 2020 | For the years ended June 30, 2021, 2020, 2019, 2018, and 2017
|
| Quantified Pattern Recognition Fund | For the year ended June 30, 2021 | For the year ended June 30, 2021 and the period from August 30, 2019 (commencement of operations) through June 30, 2020 | |
| Quantified Tactical Fixed Income Fund | For the year ended June 30, 2021 | For the year ended June 30, 2021 and the period from September 13, 2019 (commencement of operations) through June 30, 2020 | |
| Quantified Evolution Plus Fund* | For the year ended June 30, 2021 | For the year ended June 30, 2021 and the period from September 30, 2019 (commencement of operations) through June 30, 2020 | |
| Quantified Common Ground Fund | For the year ended June 30, 2021 | For the year ended June 30, 2021 and the period from December 27, 2019 (commencement of operations) through June 30, 2020 | |
| Quantified Tactical Sectors Fund | For the period from June 30, 2021 | March 4, 2021 (commencement of operations) through | |
| Quantified Rising Dividend Tactical Fund | For the period from June 30, 2021 | April 14, 2021 (commencement of operations) through | |
| Quantified Government Income Tactical Fund | For the period from June 30, 2021 | April 15, 2021 (commencement of operations) through | |
| * | The financial statements referred to throughout are Consolidated Financial Statements. |
C O H E N & C O M P A N Y , L T D .
800.229.1099 | 866.818.4538 fax | cohencpa.com
Registered with the Public Company Accounting Oversight Board
88
Basis for Opinion
These financial statements are the responsibility of the Funds’ management. Our responsibility is to express an opinion on the Funds’ financial statements based on our audits. We are a public accounting firm registered with the Public Company Accounting Oversight Board (United States) (“PCAOB”) and are required to be independent with respect to the Funds in accordance with the U.S. federal securities laws and the applicable rules and regulations of the Securities and Exchange Commission and the PCAOB.
We conducted our audits in accordance with the standards of the PCAOB. Those standards require that we plan and perform the audit to obtain reasonable assurance about whether the financial statements are free of material misstatement whether due to error or fraud.
Our audits included performing procedures to assess the risks of material misstatement of the financial statements, whether due to error or fraud, and performing procedures that respond to those risks. Such procedures included examining, on a test basis, evidence regarding the amounts and disclosures in the financial statements. Our procedures included confirmation of securities owned as of June 30, 2021, by correspondence with the custodian and brokers; when replies were not received from brokers, we performed other auditing procedures. Our audits also included evaluating the accounting principles used and significant estimates made by management, as well as evaluating the overall presentation of the financial statements. We believe that our audits provide a reasonable basis for our opinion.
We have served as the auditor of one or more investment companies within the Advisors Preferred Trust since 2012.
COHEN & COMPANY, LTD.
Chicago, Illinois
August 27, 2021
89
| QUANTIFIED FUNDS |
| EXPENSE EXAMPLES (Unaudited) |
| June 30, 2021 |
Example
As a shareholder of a Fund you will pay ongoing expenses, such as advisory fees, distribution and service fees (12b-1), and other fund expenses. The following examples are intended to help you understand the ongoing cost (in dollars) of investing in a Fund and to compare these costs with the ongoing costs of investing in other mutual funds. Please note, the expenses shown in the tables are meant to highlight ongoing costs only and do not reflect any transactional costs, such as sales charges (loads), or contingent deferred sales charges on redemptions which may be assessed by mutual funds. This Example is based on an investment of $1,000 invested at the beginning of the period and held for the entire period as indicated below.
Actual Expenses
The columns under the heading entitled “Actual” help you estimate the actual expenses you paid over the period. The “Actual Ending Account Value” shown is derived from the Fund’s actual return, and the “Actual Expenses Paid During Period” shows the dollar amount that would have been paid by an investor who started with $1,000 in the Fund. To estimate the expenses you paid on your account during this period, simply divide your account value by $1,000 (for example, an $8,600 account value divided by $1,000 = 8.6), then multiply the result by the number in the column under the heading entitled “Actual Expenses Paid During Period”.
Hypothetical Examples for Comparison Purposes
The columns under the heading entitled “Hypothetical” provide information about hypothetical account value and hypothetical expenses based on the Fund’s actual expense ratio and an assumed rate of return of 5% per year before expenses, which is not the Fund’s actual return. The hypothetical account values and expenses may not be used to estimate the actual ending account balance or expenses you paid for the period. You may use this information to compare the ongoing costs of investing in the Fund and other funds. To do so, compare this 5% hypothetical example with the 5% hypothetical examples that appear in the shareholder reports of other funds.
Please note that the expenses shown in the table on the next page are meant to highlight your ongoing costs only and do not reflect any transactional costs which may be applicable to your account. Therefore, the last column of the table (Hypothetical Expenses Paid During Period) is useful in comparing ongoing costs only, and will not help you determine the relative total costs of owning different funds. In addition, if these transactional costs were included, your costs would have been higher.
| Hypothetical | ||||||
| Actual | (5% return before expenses) | |||||
| Fund’s | Ending | |||||
| Annualized | Beginning | Ending | Expenses | Account | Expenses | |
| Expense | Account Value | Account Value | Paid During | Value | Paid During | |
| Ratio | 1/1/21 | 6/30/21 | Period* | 6/30/21 | Period* | |
| Quantified Managed Income Fund | ||||||
| Investor Class | 1.41% | $1,000.00 | $996.60 | $ 6.98 | $1,017.80 | $ 7.05 |
| Advisor Class | 2.02% | $1,000.00 | $993.30 | $9.98 | $1,014.78 | $10.09 |
| Quantified Market Leaders Fund | ||||||
| Investor Class | 1.40% | $1,000.00 | $1,219.90 | $ 7.71 | $1,017.85 | $ 7.00 |
| Advisor Class | 2.00% | $1,000.00 | $1,216.20 | $10.99 | $1,014.88 | $9.99 |
| Quantified Alternative Investment Fund | ||||||
| Investor Class | 1.56% | $1,000.00 | $1,090.90 | $ 8.08 | $1,017.07 | $ 7.80 |
| Advisor Class | 2.24% | $1,000.00 | $1,087.20 | $11.59 | $1,013.69 | $11.18 |
| Quantified STF Fund | ||||||
| Investor Class | 1.66% | $1,000.00 | $1,084.90 | $ 8.58 | $1,016.56 | $ 8.30 |
| Advisor Class | 2.27% | $1,000.00 | $1,081.70 | $11.72 | $1,013.54 | $11.33 |
| Quantified Pattern Recognition Fund | ||||||
| Investor Class | 1.67% | $1,000.00 | $1,256.60 | $9.34 | $1,016.51 | $8.35 |
| Quantified Tactical Fixed Income Fund | ||||||
| Investor Class | 1.66% | $1,000.00 | $931.90 | $7.95 | $1,016.56 | $8.30 |
| Quantified Evolution Plus Fund | ||||||
| Investor Class | 1.66% | $1,000.00 | $1,051.10 | $8.44 | $1,016.56 | $8.30 |
| Quantified Common Ground Fund | ||||||
| Investor Class | 1.78% | $1,000.00 | $1,134.60 | $9.42 | $1,015.97 | $8.90 |
| Quantified Tactical Sectors Fund** | ||||||
| Investor Class | 1.62% | $1,000.00 | $1,056.00 | $5.34 | $1,016.76 | $8.10** |
| Quantified Rising Dividend Tactical Fund*** | ||||||
| Investor Class | 1.58% | $1,000.00 | $1,024.00 | $ 3.29 | $1,016.96 | $ 7.90*** |
| Quantified Government Income Tactical Fund**** | ||||||
| Investor Class | 1.63% | $1,000.00 | $1,009..00 | $ 3.23 | $1,016.71 | $ 8.15**** |
| * | Expenses are equal to the average account value over the period, multiplied by each Fund’s annualized expense ratio, multiplied by the number of days in the period (181) divided by the number of days in the fiscal year (365). |
| ** | Expenses are equal to the average account value over the period, multiplied by each Fund’s annualized expense ratio, multiplied by the number of days in the period (117) divided by the number of days in the fiscal year (365). |
| *** | Expenses are equal to the average account value over the period, multiplied by each Fund’s annualized expense ratio, multiplied by the number of days in the period (75) divided by the number of days in the fiscal year (365). |
| **** | Expenses are equal to the average account value over the period, multiplied by each Fund’s annualized expense ratio, multiplied by the number of days in the period (72) divided by the number of days in the fiscal year (365). |
90
LIQUIDITY RISK MANAGEMENT PROGRAM
The Funds have adopted and implemented a written liquidity risk management program as required by Rule 22e-4 (the “Liquidity Rule”) under the Investment Company Act. The program is reasonably designed to assess and manage the Funds’ liquidity risk, taking into consideration, among other factors, each Fund’s investment strategies and the liquidity of portfolio investments during normal and reasonably foreseeable stressed conditions; short and long-term cash flow projections; and cash holdings and access to other funding sources.
During the year ended June 30, 2021, the Trust’s Liquidity Program Administrator (“LPA”) and the Board reviewed the then-active Funds’ investments and they determined that, generally, the Funds held adequate levels of cash and highly liquid investments to meet shareholder redemption activities in accordance with applicable requirements. Accordingly, the Board and the LPA concluded that (i) the Funds’ liquidity risk management program is reasonably designed to prevent violations of the Liquidity Rule and (ii) the Funds’ liquidity risk management program has been effectively implemented.
91
Approval of Renewal of the Investment Advisory and Sub-Advisory Agreements for the Quantified Managed Income Fund, Quantified Market Leaders; Quantified Alternative Investment Fund, Quantified STF Fund, Quantified Tactical Fixed Income Fund, Quantified Common Ground Fund, Quantified Evolution Plus Fund, and Quantified Pattern Recognition Fund
At a video conference meeting held on May 25, 2021 (the “Meeting”), held in accordance with relief granted by the U.S. Securities and Exchange Commission (the “SEC”) to ease certain governance obligations required under the Investment Company Act of 1940, as amended (the “1940 Act”) in light of travel concerns related to the COVID-19 pandemic (the “SEC Relief Order”) the Board of Trustees (the “Board”), of Advisors Preferred Trust (the “Trust”), including a majority of Trustees who are not “interested persons” (the “Independent Trustees”), as such term is defined under Section 2(a)(19) of the 1940 Act, considered the renewal of the investment advisory agreement (the “Advisory Agreement”) between Advisors Preferred, LLC (the “Adviser”) and the Trust, on behalf of the Quantified Managed Income Fund, Quantified Market Leaders Fund; Quantified Alternative Investment Fund, Quantified STF Fund, Quantified Tactical Fixed Income Fund, Quantified Common Ground Fund, Quantified Evolutions Plus Fund, and Quantified Pattern Recognition Fund (together the “Quantified Funds”); and the renewal of each sub-advisory agreement (the “Sub-Advisory Agreement”) between the Adviser and Flexible Plan Investment, Ltd. (the “Sub-Adviser” or “FPI”). The Independent Trustees, each of whom also serve as a Director of the QEPF Fund Limited, a wholly owned foreign subsidiary of Quantified Evolution Plus Fund, approved an investment advisory agreement between QEPF Fund Limited and the Adviser (the “Subsidiary Advisory Agreement”) as well as a sub-advisory agreement (the “Subsidiary Sub-Advisory Agreement”) between the Advisor and FPI with respect to QEPF Fund Limited. The Fund level agreements and subsidiary agreements are referred to collectively for convenience and references to the Fund include the subsidiary as the context indicates.
Each Trustee may have afforded different weight to the various factors in reaching conclusions with respect to the Agreements. The Trustees reviewed the quality of work and abilities of the Adviser and its relationship with the respective Sub-Advisers and the performance of the Funds. In light of each Fund’s performance and the compliance/review relationship with the Sub-Adviser, the Trustees concluded that the Adviser had sufficient quality and depth of personnel, resources, investment methods and compliance policies and procedures essential to performing its duties to the Funds. The Trustees conducted some of their deliberations on a joint basis for the Adviser and the Sub-Adviser given the close working relationship of the Adviser and Sub-Adviser and conducted their deliberations on a consolidated basis for the Fund that has a subsidiary.
The Board’s review of materials and deliberations are presented contemporaneously given the overlapping considerations, paralleled issues and conclusions drawn by the Board.
Nature, Extent and Quality of Services. With respect to the nature, extent and quality of services provided, the Trustees reviewed the Adviser’s Form ADV, and the Sub-Adviser’s Form ADV, a description of the manner in which investment decisions will be made for each Fund by the Sub-Adviser, a description of the services provided by the Adviser and those services provided by the Sub-Adviser and those executed by the Adviser. The Board reviewed the experience of professional personnel from both the Adviser and Sub-Adviser performing services for the Quantified Funds, including the team of individuals that primarily monitor and execute the investment and administration process, and the respective portfolio managers. Further reviewed by the Board was a certification from each of the Adviser and Sub-Adviser certifying that each has adopted a Code of Ethics
92
containing provisions reasonably necessary to prevent Access Persons, as that term is defined in Rule 17j-1 under the 1940 Act, from engaging in conduct prohibited by Rule 17j-1(b) and that each the of the Adviser and Sub-Adviser have adopted procedures reasonably necessary to prevent Access Persons from violating such Code of Ethics. The Trustees also noted the financial resources of the Adviser and the Sub-Adviser appeared adequate.
The Board also discussed the Adviser’s compliance program with the Chief Compliance Officer of the Trust. The Board noted that the Adviser continues to have in place procedures which are currently working to prevent violations of applicable securities laws. The Chief Compliance Officer noted she works closely with the Adviser’s the Chief Compliance Officer. The Board concluded that the Adviser has qualified professionals, resources, and compliance policies essential to performing its duties under the Advisory Agreement.
Regarding the compliance programs of the Sub-Adviser, the Trust’s the Chief Compliance Officer noted that she works with the Chief Compliance Officer of the Sub-Adviser and had reviewed the policies and procedures manual of the Sub-Adviser, including latest revisions and business continuity plans. The Board determined that the Sub-Adviser has a compliance program in place that prevents violations of the applicable securities laws.
Performance. The Board considered that the Adviser delegates day-to-day investment decisions to the Sub-Adviser and, therefore, would not directly control the performance of the Quantified Funds. The Board considered the Adviser’s other responsibilities under the Advisory Agreement, including with respect to trade oversight, reviewing daily positions and balance reports for the Quantified Funds, obtaining derivative agreements and reporting to the Board, and concluded that the Adviser appears to be adequately monitoring the Sub-Adviser’s adherence to the respective Quantified Fund’s investment objectives and appears to be carrying out its functions appropriately.
With respect to the performance results from the Sub-Adviser’s daily management and investment strategies, the Board considered the updated performance of each of the Quantified Funds compared to their primary benchmark and Morningstar category for various periods provided by the Adviser. The Trustees also reviewed the Sub-Adviser’s strategy and each Quantified Fund’s performance for various periods with explanations for over/under performance.
Quantified Managed Income Fund
With respect to the Managed Income, the Trustees noted the Fund underperformed the Bloomberg Barclays Aggregate Bond Index benchmark by 3.40% during the last 12 months ended April 30, 2021 but had produced a positive since-inception return. The Trustees noted the Fund had underperformed the Morningstar Multisector Bond and Morningstar Intermediate Core Bond Intermediate Term Bond categories for the one-, three- and five-year periods. The Trustees further noted the somewhat novel nature of the Fund’s total return seeking strategy and observed that the Fund does not follow an index-tracking strategy and therefore, swings in performance are to be expected. The Board noted that the Sub-Adviser was focused on refining Fund strategies and noted the Sub-Adviser may use the Fund as a diversifying investment without purely focusing on the specific performance of the Fund. The Board concluded that Fund performance was acceptable in light of the previous factors and noted it expects the Fund will continue to grow as part of the Sub-Adviser’s rebalancing of clients’ accounts.
Quantified Market Leaders Fund
The Board was pleased with the strong performance of Market Leaders, and noted the Fund outperformed the Wilshire 5000 Index by 25.68% and by 4.63% respectively, for the one-year and
93
three-year periods ended April 30, 2021. The Trustees further found the Fund outperformed the Morningstar Mid-Cap Growth category for the same periods. The Trustees stated the Sub-Adviser’s consistent refinement of the Fund’s strategy was successful as the Fund’s performance has improved greatly.
Quantified Alternative Investment Fund
For Alternative Investment, the Board noted the Fund underperformed the S&P 500 Index by 18.52% and 13.80%, respectively, for the one year- and three-year periods ending April 30, 20201. The Board discussed an aspect of the Fund strategy that leads to investment in ultra-long futures, thus making it difficult to benchmark. They further noted the Fund outperformed the Morningstar Macro Trading category by 15.13% and 0.67%, respectively for the one- and three years period ended April 30, 2021. The Board acknowledged that the S&P 500 Index does not correspond to the Fund’s investment strategy and noted that the Marco Trading category better follows the novel nature of the investment strategy followed for the Fund.
Quantified STF Fund
The Board acknowledged the strong performance returns for STF, and noted it outperformed all benchmarks, Nasdaq 100 Index, Morningstar Tactical and Morningstar Large Cap Growth categories or the one- and three-year periods ended April 30, 2021. The Board noted that the STF Fund’s strategy includes a risk management element that attempts to deliver on reducing return risk in a downside market.
Quantified Tactical Fixed Income Fund (inception 9-13-2019)
For the one-year period ended April 30, 2021, the Board noted Tactical Fixed lagged its benchmarks, Bloomberg Barclays Aggregate Bond Index, Morningstar Nontraditional Bond, and Morningstar High Yield by 11.28%, 21.98%, and 30.60% respectively, but had produced a positive since-inception return. The Trustees further noted the somewhat novel nature of the Fund’s total return seeking strategy and observed that the Fund does not follow an index-tracking strategy, has a market timing element and therefore, swings in performance are to be expected. The Board noted that the Sub-Adviser was focused on refining Fund strategies in the hopes of improving performance and that a longer time period may be needed to genuinely assess the Fund’s performance.
Quantified Common Ground Fund (inception 12-27-2019)
For the one-year period ended April 30, 2021, Common Ground outperformed its benchmarks, S&P 1500, Morningstar Tactical Allocation, Morningstar 50 70 Equity by 1.82%, 20.68%, and 16.16% respectively.
Quantified Pattern Recognition (inception 8-30-2019)
For the one-year period ended April 30, 2021, Pattern Recognition Fund lagged its benchmarks, S&P 500, and Morningstar Large Cap Blend by 23.45%, 23.91% respectively. However, the Board noted that Pattern Recognition tends to invest more in large cap securities, and it outperformed the Ultrashort Bond category by 10.22% for the one-year period. The Trustees further noted the Sub-Adviser’s comments on the trending pattern focus of the Fund and observed that the Fund does not follow an index-tracking strategy and therefore, swings in performance are to be expected. The Board also took into consideration the Sub-Adviser’s ongoing refinement of the Fund’s strategy to attempt to capture returns in range-bound market conditions. The Board noted that a longer time period may be needed to genuinely assess the Fund’s performance.
94
Quantified Evolutions Plus Fund (and Subsidiary) (inception 9-30-2019)
The Board reviewed performance of Evolution Plus for the one-year period ended April 30, 2021, and noted the Fund lagged its benchmarks, S&P 500, Morningstar Tactical Allocation category, and Morningstar 50% - 70% Equity category by 29.11%, 12.17%, and 16.69% respectively, but had produced a positive since-inception return and double-digit one-year return. The Trustees further noted the wide-ranging and novel nature of the Fund’s capital appreciation seeking strategy and observed that the Fund does not follow an index-tracking strategy and therefore, swings in performance are to be expected. The Board noted that a longer time period may be needed to genuinely assess the Fund’s performance.
In summary for the performance of the Quantified Funds, the Board felt that with Adviser oversight, under FPI’s portfolio management, all the Quantified Funds are expected to continue to provide an acceptable level of investment returns for shareholders over the long term.
Fees and Expenses. As to the costs of the services to be provided to each Quantified Fund by the Adviser and Sub-Adviser, respectively, the Board reviewed and discussed the advisory fee and total operating expenses of each Quantified Fund compared to its peer group and Morningstar category as presented in the Meeting Materials.
Quantified Managed Income Fund
The Board noted that advisory fee of 0.75% for Managed Income was slightly above the average for the Morningstar Multisector Bond Category, and well below the maximum management fee. It was further discussed that the net expenses of 1.64% for Investor Class were within range and below the maximum net expense for the Morningstar Multisector Bond A category. With regards to Managed Income Adviser Class, the net expense ratio of 2.24% was well below the maximum net expenses for the Morningstar Multisector Bond C category. The Board concluded that the advisory fee and net expenses for the Managed Income were not unreasonable.
Quantified Market Leaders Fund
The Board noted that advisory fee of 0.75% for Market Leaders was slightly below average for the Morningstar Multisector Mid-Cap Growth Category, and well below the maximum management fee. It was further discussed that the net expenses of 1.68% for Investor Class were within range and below the maximum net expense for the Morningstar Midcap Growth A category. With regards to Market Leaders Adviser Class, the net expense ratio of 2.29% was within range and below the maximum net expense ratio for the Morningstar Mid-Cap Growth C Category. The Board concluded that the advisory fee and net expenses for Market Leaders were not unreasonable.
Quantified Alternative Investment Fund
The Board noted that advisory fee of 0.75% for Alternative Investment was below the average for the Morningstar Multialternative Category. The Trustees discussed that the net expenses of 2.11% for Investor Class was slightly above the average and well below the maximum net expense for the Morningstar Multialternative A category. With regards to Adviser Class, the Trustees noted the net expense ratio of 2.79% was somewhat above the average and well below the maximum net expense ratio for the Morningstar Multialternative C category. The Board concluded that the advisory fee and net expenses for Alternative Investment were not unreasonable.
95
Quantified STF Fund
The Board noted that advisory fee of 1.00% for STF was above the average for the Morningstar Tactical Allocation Category while well within range for the category. The Trustees discussed that the net expenses of 1.72% for Investor Class was slightly above the average and well below the maximum net expense for the Morningstar Tactical Allocation A category. With regards to STF Adviser Class, the Board noted the net expense ratio of 2.32% was slightly above the average and well below the maximum net expense ratio for the Morningstar Tactical Allocation C category. The Board concluded that the advisory fee and net expenses for STF Fund were not unreasonable.
Quantified Tactical Fixed Income Fund
The Board noted that advisory fee of 1.00% for Tactical Fixed Income was above average for the Morningstar Nontraditional Bond Category and below the maximum management fee. The Trustees discussed that the net expenses of 1.77% for Investor Class was above the average and well below the maximum net expense for the Morningstar Nontraditional Bond A category. With regards to Tactical Fixed Adviser Class, the Board noted the net expense ratio of 2.37% was above the average and well below the maximum net expense ratio for the Morningstar Nontraditional Bond C category. The Board concluded that the advisory fee and net expenses for Tactical Fixed were not unreasonable.
Quantified Common Ground Fund
The Board noted that advisory fee of 1.00% for Common Ground was above the average for the Morningstar Allocation 50% - 70% Equity Category and well below the maximum management fee. It was further discussed that the net expenses of 1.86% for Investor Class was above the average and well below the maximum net expense for the Morningstar Allocation 50% - 70% Equity A category. With regards to Common Ground Adviser Class, the Board noted the net expense ratio of 2.46% was above the average and well below the maximum net expense ratio for the Morningstar Allocation 50% - 70% Equity Class C category. The Board concluded that the advisory fee and net expenses for Common Ground were not unreasonable.
Quantified Pattern Recognition Fund
The Board noted that advisory fee of 1.00% for Pattern Recognition was above the average for the Morningstar Large-Cap Blend category and well below the maximum management fee. The Trustees discussed that the net expenses of 1.78% for Investor Class was above the average and below the maximum net expense for the Morningstar Large-Cap Blend A category. With regards to Adviser Class, the Board noted the net expense ratio of 2.38% was above the average and below the maximum net expense ratio for the Morningstar Large-Cap Blend C category. The Board concluded that the advisory fee and net expenses for Pattern Recognition were not unreasonable.
Quantified Evolutions Plus Fund (and Subsidiary)
The Board noted that advisory fee of 1.00% for Evolution Plus was above the average for the Morningstar Allocation 50%-70% Equity Category and well below the maximum management fee. It was further discussed that the net expenses of 1.81% for Investor Class was above the average and well below the maximum net expense for the Morningstar Allocation 50% - 70% Equity A category. With regards to Evolution Plus Adviser Class, the net expense ratio of 2.38% was above the average and well below the maximum net expense ratio for the Morningstar Allocation 50%-70% Equity Class C category. The Board concluded that the advisory fee and net expenses for Evolution Plus was not unreasonable.
96
For each Fund, the Trustees reviewed and considered the split of the Advisory fee between the Adviser and Sub-Adviser (the Sub-Adviser being paid by the Adviser, not the respective Fund), and determined it was acceptable and reasonable for the services to be provided to the respective Fund.
Profitability of Adviser. The Board reviewed the levels of profits to the Adviser for the two most recent fiscal years or partial fiscal periods from each Quantified Fund with respect to advisory fees and from the total relationship with each Quantified Fund. They considered whether profits from each Quantified Fund were reasonable in light of services provided, including the assets levels and payments to the Sub-Adviser, and any breakpoints in fee structures for respective fund.
Quantified Managed Income, Market Leaders, Alternative Investment, STF
With respect to Quantified Funds referenced above, the Board noted that after fees paid to the Sub-Adviser, the Adviser operated at a very slight profit. The Board concluded that based on the assets levels and services provided the profit level was not excessive.
Quantified Tactical Fixed Income, Common Ground, Pattern Recognition, and Evolution Plus Fund
In discussing the Adviser’s profits with respect to the Quantified Funds listed above, the Board acknowledged the Adviser was operating these Funds at a loss. The Board concluded that any excess profit to the Adviser was unlikely and they would continue to monitor as assets of the Funds growth.
Profitability of Sub-Adviser: The Board reviewed the levels of profits for the Sub-Adviser for the two most recent fiscal years or partial fiscal periods from each Fund with respect to sub-advisory fees and from the total relationship with each Fund. With regards to all Funds, the Board noted that the Sub-Advisers usually charge higher fees from separately managed accounts with similar investment strategies, if any.
Quantified Managed Income, Market Leaders Fund, Alternative Investment
With respect to the Sub-Adviser’s profitability review, the Board noted FPI operated the above referenced Quantified Funds at loss from sub-advisory fees, and it remained at a loss when including additional fees. The Board concluded that based on the assets levels and services provided, the Sub-Adviser having excess profits was not a current concern.
STF Fund
The Board reviewed the profitability of FPI with respect to STF and noted the Sub-Adviser made a small profit from managing STF Fund. They further noted that Sub-Adviser’s profit increased to a modest 22% when including other income earned from the relationship with STF Fund. The Board concluded that based on the assets levels and services provided, the Sub-Adviser having excess profits from STF was not a current concern.
Quantified Tactical Fixed Income, Common Ground Fund, Pattern Recognition, and Evolution Plus Fund
In discussing the Sub-Adviser’s profits with respect to the Quantified Tactical Fixed Income, Common Ground, Pattern Recognition, and Evolution Plus Fund, the Board acknowledged FPI was managing these Funds at a slight profit. When taking into account other fees earned, the Board acknowledged the profits were higher at 22%. The Board determined that this was acceptable for the services provided. The Board concluded that based on the asset levels and services provided, the Sub-Adviser having excess profits was not a current concern.
97
With the fees based on average assets of combined Quantified Funds, even with a slight reverse fee breakpoint schedule, the Board acknowledge it unlikely that the Sub-Adviser will, with respect to sub-advisory fees, or when taking into account the totality of the relationship, experience excess profits from its relationship with the any of Quantified Funds. The Board stated they will monitor profit levels from each Fund as FPI continues to build assets of the Funds.
Economies of Scale. As to the extent to which the Quantified Funds will realize economies of scale, the Adviser reported an estimate of $500 million per Fund to be the minimum asset level required to reach such economies of scale and that some Funds may not achieve economies of scale as they may face capacity issues. The Board discussed the Adviser’s expectations for the growth of each Fund and concluded that any material economies of scale were not a concern at present assets levels. The Trustees agreed to revisit economies of scale as assets of the Funds continue to grow.
Conclusion. Independent legal counsel assisted the Board throughout the Advisory Agreement and Sub-Advisory Agreement review process. The Board members relied upon the advice of independent counsel, and their own business judgment in determining the material factors to be considered in evaluating each Advisory Agreement and Subsidiary Advisory Agreement where appropriate; as well as each Sub-Advisory Agreement and Subsidiary Sub-Advisory Agreement where appropriate. In considering the approval Board noted that each Trustee may have afforded different weight to the various factors in reaching his conclusions and determined that approval of each of the Advisory Agreements was in the best interests of each of the Quantified Funds and its respective shareholders.
98
Approval of the Investment Advisory and Sub-Advisory Agreements for Quantified Tactical Sectors Fund, Quantified Government Income Tactical Fund and Quantified Rising Dividend Tactical Fund
At a video conference meeting held on February 23, 2021 (the “Meeting”), held in accordance with relief granted by the U.S. Securities and Exchange Commission (the “SEC”) to ease certain governance obligations required under the Investment Company Act of 1940, as amended (the “1940 Act”) in light of travel concerns related to the COVID-19 pandemic (the “SEC Relief Order”), the Board of Trustees (the “Board”) of Advisors Preferred Trust (the “Trust”), including a majority of Trustees who are not “interested persons” (the “Independent Trustees”), as such term is defined under Section 2(a)(19) of the 1940 Act, considered and approved an investment advisory agreement (the “Advisory Agreement”) between Advisors Preferred, LLC (the “Adviser”) and the Trust on behalf of Quantified Tactical Sectors Fund, Quantified Government Income Tactical Fund, and Quantified Rising Dividend Tactical Fund (each a New Quantified Fund” and together the (“New Quantified Funds”); and a Sub-Advisory Agreement between the Adviser and Flexible Plan Investment, Ltd. (the “Sub-Adviser” or (“FPI”) with respect to the New Quantified Funds.
The Board reviewed and discussed the written materials that were provided in advance of the Meeting and deliberated on the approval of the proposed Advisory Agreements with respect to each of the New Quantified Funds. The Board members relied upon the advice of independent legal counsel and their own business judgment in determining the material factors to be considered in evaluating the Advisory Agreements with respect to each of the New Quantified Funds and the weight to be given to each such factor. The conclusions reached by the Board were based on a comprehensive evaluation of all the information provided, both in written and verbal form, and were not the result of any one factor. Moreover, each Trustee may have afforded different weight to the various factors in reaching his conclusions with respect to the Advisory Agreements. The Trustees reviewed the quality of work and abilities of the Adviser and its relationship with the Sub-Adviser and the performance of the existing quantified funds. In light of the performance history of the existing quantified funds and the compliance/review relationship with the Sub-Adviser, the Trustees concluded that the Adviser had sufficient quality and depth of personnel, resources, investment methods and compliance policies and procedures essential to performing its duties to the New Quantified Funds. The Trustees conducted some of their deliberations on a joint Adviser and Sub-Adviser basis given the close working relationship of the Adviser and Sub-Adviser.
Nature, Extent and Quality of Services. With respect to the nature, extent and quality of services provided, the Trustees reviewed each of the Adviser’s and the Sub-Adviser’s Form ADV, a description of the manner in which investment decisions will be made for each New Quantified Fund by the Sub-Adviser, a description of the services to be provided by the Adviser and those services to be provided by the Sub-Adviser and those to be executed by the Adviser, a review of the experience of professional personnel that would be performing services for the New Quantified Funds, including the team of individuals that primarily monitor and execute the investment and administration process, and a certification from each of the Adviser and Sub-Adviser certifying that each has adopted a Code of Ethics containing provisions reasonably necessary to prevent Access Persons, as that term is defined in Rule 17j-1 under the 1940 Act, from engaging in conduct prohibited by Rule 17j-1(b) and that each the of the Adviser and Sub-Adviser has adopted procedures reasonably necessary to prevent Access Persons from violating such Code of Ethics. The Trustees also noted the financial resources of the Adviser appeared adequate.
The Board also discussed the Adviser’s compliance program with the Chief Compliance Officer of the Trust. The Board noted that the Adviser continues to have in place procedures which are
99
currently working to prevent violations of applicable securities laws. The Chief Compliance Officer noted she works closely with the Adviser’s Chief Compliance Officer. The Board concluded that the Adviser has qualified professionals, resources, and compliance policies essential to performing its duties under the Advisory Agreement.
With respect to the Sub-Adviser, the Trustees considered that the Sub-Adviser will be primarily responsible for investment management with respect to each New Quantified Fund. The Board considered the Sub-Adviser’s skills and experience relating to the existing quantified funds and its portfolio management and research techniques. The Board also noted that the Sub-Adviser’s compliance policies and procedures appear to be operating effectively, and that the level of communication between the Adviser and Sub-Adviser appeared to be effective. The Trustees also noted the financial resources of the Sub-Adviser appeared adequate. The Board concluded that the Sub-Adviser had sufficient quality and depth of personnel, resources, investment methods and compliance policies and procedures essential to performing its duties under the Sub-Advisory Agreement and that the nature, overall quality and extent of the management services to be provided by the Sub-Adviser to each of the New Quantified Funds was expect to be satisfactory and reliable.
Performance. The Board considered that the Adviser generally delegates its day-to-day investment decisions to the Sub-Adviser and, therefore, would not directly control the performance of the New Quantified Funds. The Trustees reviewed the existing quantified funds’ performance for various periods and earlier discussions with Mr. Wagner of the Sub-Adviser in his role as a portfolio manager. The Board noted that based on the experience of the portfolio managers and performance of the existing quantified funds, the Adviser and Sub-Adviser should be able to provide satisfactory performance for each of the New Quantified Funds and its shareholders.
Fees and Expenses. As to the costs of the services to be provided to each New Quantified Fund by the Adviser and Sub-Adviser the Board reviewed and discussed the advisory fee and total operating expenses of each New Quantified Fund compared to its peer group and Morningstar category as presented in the Meeting Materials.
Quantified Tactical Sectors Fund (“Tactical Sectors”). The Trustees noted that the proposed advisory fee of 1.00% was within the range of the reasonable management fees of the Morningstar Mid and Large Cap Equity Blend category viewed together and well below the maximum management fee. The Board then reviewed the projected expense ratio of 1.77% for the Investor Class, and 2.37% for the Adviser Class. In both Classes, it was noted the ratios were within range of the Morningstar categories viewed together. The Board concluded that the advisory fee to be charged by the Adviser and projected expenses for Tactical Sectors were not unreasonable.
Quantified Government Income Tactical Fund (“Government Income”). The Trustees noted that the proposed advisory fee of 1.00% was within the range of the Tactical Allocation Morningstar and the Long Government Morningstar category management fees and below the maximum management fee for Morningstar categories. The Board then reviewed the projected expense ratio of 1.77% for the Investor Class, and 2.37% for the Adviser Class. In the Investor Class, the ratio was below average, while in the Advisor Class, the ratio was only slightly above the average Morningstar category. The Board concluded that the advisory fee to be charged by the Adviser and projected expenses for Government Income were not unreasonable.
Quantified Rising Dividend Tactical Fund (“Rising Dividend”). The Trustees noted that the proposed advisory fee of 1.00% was within the range of the Mid and Large Cap Equity Blend Morningstar category management fees and well below the maximum management fee of
100
Morningstar category. The Board then reviewed the projected expense ratio of 1.87% for the Investor Class, and 2.47% for the Adviser Class. In both Classes, the ratio was below maximum Morningstar category and above the average for the peer group. The Board concluded that the advisory fee to be charged by the Adviser and projected expenses for Rising Dividend were not unreasonable.
For each New Quantified Fund, the Trustees reviewed and considered the split of the Advisory fee between the Adviser and Sub-Adviser (the Sub-Advisor being paid by the Adviser, not the respective Fund), and determined it was acceptable and reasonable for the services to be provided to the respective New Quantified Fund.
Profitability. The Board reviewed the levels of projected profits to the Adviser from each New Quantified Fund. With respect to Tactical Sectors, the Trustees found that with expected assets of $75 million for the first year, the Adviser would realize a modest 4% profit from the advisory services, and for year two, with expected assets at $94 million, the Adviser would achieve approximately a 6% profit from advisory services. When taking into account the totality of the relationship, the Advisor expected 3% and 5% profitability for year one and year two respectively. With respect to Government Income and Rising Dividend Fund, with estimated assets of $25 million each for the first year and $31 million for the second year, the Board acknowledged the Adviser would not be expected to make a profit for advisory services or when taking into account the totality of the relationship; and further that the Adviser forecasted no profits for year two. After review and discussion, the Board concluded that, based on the services to be provided by the Adviser the anticipated level of profit from the Adviser’s relationship with each New Quantified Fund was not excessive.
With respect to the Sub-Adviser’s profitability, the Trustees reviewed the projected profitability of the Sub-Adviser for each New Quantified Fund. With expected assets for Tactical Sectors and Government Income of $75 million and $20 million, respectively, for the first year, the Board noted the Sub-Adviser would achieve approximately 13% sub-advisory profit from each Fund and 23% profitability when combined with service fees related to the Fund. For year two, with projected assets of $80 million and $21 million, respectively, the Board noted the expected profits for the Sub-Adviser would be substantially similar to year one. With respect to Rising Dividend for the first year with projected assets of $35, the Trustees found the Sub-Advisor would achieve about 13% in expected profits from sub-advisory fees, and 23% profitability when combined with service fees related to the Fund. With respect to year two, with a slight increase in assets, the Board noted profitability for the Sub-Adviser would be substantially similar. After further discussion, the Board concluded that, based on the services to be provided by the Sub-Adviser, the anticipated level of profit from the Sub-Adviser’s relationship with each of the New Quantified Funds was not excessive.
Economies of Scale. As to the extent to which the New Quantified Funds will realize economies of scale, the Adviser reported $500 million per New Quantified Fund to be the minimum asset level required to reach such economies of scale. The Board discussed the Adviser’s expectations for growth of each of the New Quantified Funds and concluded that any material economies of scale would not be achieved in the near term. The Trustees agreed to revisit economies of scale as assets of New Quantified Funds grow.
Conclusion. Independent legal counsel assisted the Board throughout the Advisory Agreement and Sub-Advisory Agreement review process. The Board members relied upon the advice of independent counsel, and their own business judgment in determining the material factors to be considered in evaluating each of the Advisory Agreements and the weight to be given to each such factor. In considering the approval of each of the Advisory Agreements, the Board did not identify any one factor as all important, but rather considered these factors collectively and determined that approval of each of the Advisory Agreements was in the best interests of each of the New Quantified Funds and its respective shareholders.
101
| Quantified Funds |
| SUPPLEMENTAL INFORMATION (Unaudited) |
| June 30, 2021 |
Independent Trustees
The following table provides information regarding each Trustee who is not an “interested person” of the Trust, as defined in the 1940 Act.
| Name, Address 1 and Year of Birth | Position(s) Held with the Trust | Term of Office/Length of Time Served | Principal Occupation(s) During Past 5 Years | Number of Portfolios in Fund Complex Overseen by Trustee 2 | Other Directorships Held by Trustee During Past 5 Years |
| Charles R. Ranson Born: 1947 | Trustee | Indefinite, since November 2012 | Principal, Ranson & Associates (business consultancy) (since 2003) | 23 | Northern Lights Fund Trust IV (27 series) (since 2015) |
| Felix Rivera Born: 1963 | Trustee | Indefinite, since November 2012 | Managing Partner, Independent Channel Advisors, LLC (investment advisory consultancy), (since January 2011). | 23 | Centerstone Investors Trust (2 series) (since March 2016); BlueArc Multi-Strategy Fund (2014-2017) |
| David Feldman Born: 1963 | Trustee | Indefinite, since September 2017 | Independent Consultant (since January 2015). Head of Intermediary Sales, Baron Capital Inc. (February 2010 to December 2014) | 23 | None |
AP 6/30/21 v1
102
| Quantified Funds |
| SUPPLEMENTAL INFORMATION (Unaudited) (Continued) |
| June 30, 2021 |
Interested Trustees and Officers
The following table provides information regarding each Trustee who is an “interested person” of the Trust, as defined in the 1940 Act, and each officer of the Trust.
| Name, Address1 and Year of Birth | Position(s) Held with the Fund | Term of Office/ Length of Time Served | Principal Occupation(s) During Past Five Years | Number of Portfolios in Fund Complex Overseen by Trustee(2) | Other Directorships Held by Trustee During Past Five Years |
| Catherine Ayers- Rigsby 3 Born: 1948 | Trustee, Chairperson, President | Indefinite; since November 2012 | CEO, Advisors Preferred, LLC (since April 2011); President, Ceros Financial Services, Inc.), (since August 2009); President Atcap Partners, LLC (investment adviser) (since July 2011). | 23 | None |
| Brian S. Humphrey 4 Born: 1972 | Trustee | Indefinite; since November 2012 | Managing Director, Ceros Financial Services, Inc. (since January 2011). | 23 | None |
| Christine Casares Born: 1975 | Treasurer | Indefinite; since May 2019 | Vice President, Tax Administration, Ultimus Fund Solutions, LLC (since February 2016); Assistant Vice President, Tax Administration (January 2014 – January 2016). | N/A | N/A |
| Angela Holland Born: 1970 | Chief Compliance Officer | Indefinite; since July 1, 2020 | Chief Compliance Officer, Ceros Financial Services, Inc. (since January 2016), Sales Supervisor/AML Compliance Officer, Ceros Financial Services, Inc. (April 2012 – January 2016); Compliance Manager, Advisors Preferred, LLC (April 2012 to Present); Compliance Manager, AtCap Partners, LLC (investment adviser) (Since April 2012). | N/A | N/A |
| Richard Malinowski Born: 1983 | Secretary | Indefinite; since November 2012 | Senior Vice President and Senior Managing Counsel, Ultimus Fund Solutions, LLC; (since February 2020); Senior Vice President (February 2017- February 2020); Vice President Legal Administration and Counsel (April 2016 – 2017) and AVP and Staff Attorney (September 2012 – March 2016). | N/A | N/A |
| 1 | Unless otherwise specified, the address of each Trustee and officer is c/o Advisors Preferred Trust, 1445 Research Blvd., Suite 530, Rockville, MD 20850. |
| 2 | The “Fund Complex” consists of the series of the Trust. |
| 3 | Ms. Ayers-Rigsby is an interested person Trustee because she is an officer of the Trust, an officer of the Trust’s investment adviser, and an officer of the Trust’s principal underwriter. |
| 4 | Mr. Humphrey is an interested person Trustee because he is an officer of the Trust’s principal underwriter. The Funds’ Statement of Additional Information includes additional information about the Trustees and is available free of charge by calling toll- free 1-855-647-8268. |
AP 6/30/21 v1
103
PRIVACY NOTICE
Rev. May 2014
| FACTS | WHAT DOES ADVISORS PREFERRED TRUST DO WITH YOUR PERSONAL INFORMATION? | |||
| Why? | Financial companies choose how they share your personal information. Federal law gives consumers the right to limit some but not all sharing. Federal law also requires us to tell you how we collect, share, and protect your personal information. Please read this notice carefully to understand what we do. | |||
| What? | The types of personal information we collect and share depend on the product or service you have with us. This information can include: | |||
| ■ | Social Security number | ■ | Purchase History | |
| ■ | Assets | ■ | Account Balances | |
| ■ | Retirement Assets | ■ | Account Transactions | |
| ■ | Transaction History | ■ | Wire Transfer Instructions | |
| ■ | Checking Account Information | |||
| When you are no longer our customer, we continue to share your information as described in this notice. | ||||
| How? | All financial companies need to share customers’ personal information to run their everyday business. In the section below, we list the reasons financial companies can share their customers’ personal information; the reasons Advisors Preferred Trust chooses to share; and whether you can limit this sharing. | |||
| Reasons we can share your personal information | Does Advisors Preferred Trust share? | Can you limit this sharing? |
For our everyday business purposes – such as to process your transactions, maintain your account(s), respond to court orders and legal investigations, or report to credit bureaus | Yes | No |
For our marketing purposes – to offer our products and services to you | No | We don’t share |
| For joint marketing with other financial companies | No | We don’t share |
For our affiliates’ everyday business purposes – information about your transactions and experiences | No | We don’t share |
For our affiliates’ everyday business purposes – information about your creditworthiness | No | We don’t share |
| For nonaffiliates to market to you | No | We don’t share |
| Questions? | Call 1-866-862-9686 |
104
| Who we are | |||||
Who is providing this notice?
| Advisors Preferred Trust | ||||
| What we do | |||||
| How does Advisors Preferred Trust protect my personal information? | To protect your personal information from unauthorized access and use, we use security measures that comply with federal law. These measures include computer safeguards and secured files and buildings.
Our service providers are held accountable for adhering to strict policies and procedures to prevent any misuse of your nonpublic personal information. | ||||
| How does Advisors Preferred Trust collect my personal information? | We collect your personal information, for example, when you
■ Open an account
■ Provide account information
■ Give us your contact information
■ Make deposits or withdrawals from your account
■ Make a wire transfer
■ Tell us where to send the money
■ Tells us who receives the money
■ Show your government-issued ID
■ Show your driver’s license
We also collect your personal information from other companies. | ||||
| Why can’t I limit all sharing? | Federal law gives you the right to limit only ■ Sharing for affiliates’ everyday business purposes – information about your creditworthiness ■ Affiliates from using your information to market to you
■ Sharing for nonaffiliates to market to you
State laws and individual companies may give you additional rights to limit sharing. | ||||
| Definitions | |||||
| Affiliates | Companies related by common ownership or control. They can be financial and nonfinancial companies.
■ Advisors Preferred Trust does not share with our affiliates. | ||||
| Nonaffiliates | Companies not related by common ownership or control. They can be financial and nonfinancial companies. ■ Advisors Preferred Trust does not share with nonaffiliates so they can market to you. | ||||
| Joint marketing | A formal agreement between nonaffiliated financial companies that together market financial products or services to you.
■ Advisors Preferred Trust doesn’t jointly market. | ||||
105
PROXY VOTING POLICY
Information regarding how the Funds voted proxies relating to portfolio securities for the most recent twelve month period ended June 30 as well as a description of the policies and procedures that the Funds use to determine how to vote proxies is available without charge, upon request, by calling 1-855-647-8268 or by referring to the Securities and Exchange Commission’s (“SEC”) website at http://www.sec.gov.
PORTFOLIO HOLDINGS
The Funds file their complete schedule of portfolio holdings with the SEC for the first and third quarters of each fiscal year as an exhibit to its reports on Form N-PORT, within sixty days after the end of the period. Form N-PORT reports are available on the SEC’s website at http://www.sec.gov. The information on Form N-PORT is available without charge, upon request, by calling 1-855-647-8268.
| INVESTMENT ADVISOR |
| Advisors Preferred LLC |
| 1445 Research Blvd., Suite 530 |
| Rockville, MD 20850 |
| SUB-ADVISOR |
| Flexible Plan Investments, Ltd. |
| 3883 Telegraph Road, Suite 100 |
| Bloomfield Hills, MI 48302 |
| ADMINISTRATOR |
| Gemini Fund Services, LLC |
| 4221 North 203rd Street, |
| Suite 100, Elkhorn, NE 68022 |
| QUANT-AR21 |
(b) Not applicable.
Item 2. Code of Ethics.
(a) As of the end of the period covered by this report, the registrant has adopted a code of ethics that applies to the registrant's principal executive officer, principal financial officer, principal accounting officer or controller, or persons performing similar functions, regardless of whether these individuals are employed by the registrant or a third party.
(b) For purposes of this item, “code of ethics” means written standards that are reasonably designed to deter wrongdoing and to promote:
| (1) | Honest and ethical conduct, including the ethical handling of actual or apparent conflicts of interest between personal and professional relationships; |
| (2) | Full, fair, accurate, timely, and understandable disclosure in reports and documents that a registrant files with, or submits to, the Commission and in other public communications made by the registrant; |
| (3) | Compliance with applicable governmental laws, rules, and regulations; |
| (4) | The prompt internal reporting of violations of the code to an appropriate person or persons identified in the code; and |
| (5) | Accountability for adherence to the code. |
(c) Amendments: During the period covered by the report, there have not been any amendments to the provisions of the code of ethics.
(d) Waivers: During the period covered by the report, the registrant has not granted any express or implicit waivers from the provisions of the code of ethics.
(e) The Code of Ethics is not posted on Registrant’ website.
(f) A copy of the Code of Ethics is attached as an exhibit.
Item 3. Audit Committee Financial Expert.
| (a) | The Registrant’s board of trustees has determined that Felix Rivera is the audit committee financial expert, as defined in Item 3 of Form N-CSR. Mr. Rivera is independent for purposes of this Item 3. |
Item 4. Principal Accountant Fees and Services.
| (a) | Audit Fees |
2021 - $98,000
2020 - $98,000
| (b) | Audit-Related Fees |
2021 - None
2020 - None
| (c) | Tax Fees |
2021 - $20,000
2020 - $20,000
Preparation of Federal & State income tax returns, assistance with calculation of required income, capital gain and excise distributions and preparation of Federal excise tax returns.
| (d) | All Other Fees |
2021 - None
2020 - None
| (e) | (1) Audit Committee’s Pre-Approval Policies |
The registrant’s Audit Committee is required to pre-approve all audit services and, when appropriate, any non-audit services (including audit-related, tax and all other services) to the registrant. The registrant’s Audit Committee also is required to pre-approve, when appropriate, any non-audit services (including audit-related, tax and all other services) to its adviser, or any entity controlling, controlled by or under common control with the adviser that provides ongoing services to the registrant, to the extent that the services may be determined to have an impact on the operations or financial reporting of the registrant. Services are reviewed on an engagement by engagement basis by the Audit Committee.
| (2) | Percentages of Services Approved by the Audit Committee |
| 2021 | 2020 | |||||||
| Audit-Related Fees: | 100 | % | 100 | % | ||||
| Tax Fees: | 100 | % | 100 | % | ||||
| All Other Fees: | 100 | % | 100 | % | ||||
| (f) | During the audit of registrant's financial statements for the most recent fiscal year, less than 50 percent of the hours expended on the principal accountant's engagement were attributed to work performed by persons other than the principal accountant's full-time, permanent employees. |
| (g) | The aggregate non-audit fees billed by the registrant's accountant for services rendered to the registrant, and rendered to the registrant's investment adviser (not including any sub-adviser whose role is primarily |
portfolio management and is subcontracted with or overseen by another investment adviser), and any entity controlling, controlled by, or under common control with the adviser that provides ongoing services to the registrant:
2021 - $20,000
2020 - $20,000
(h) The registrant's audit committee has considered whether the provision of non-audit services to the registrant's investment adviser (not including any sub-adviser whose role is primarily portfolio management and is subcontracted with or overseen by another investment adviser), and any entity controlling, controlled by, or under common control with the investment adviser that provides ongoing services to the registrant, that were not pre-approved pursuant to paragraph (c)(7)(ii) of Rule 2-01 of Regulation S-X, is compatible with maintaining the principal accountant's independence.
Item 5. Audit Committee of Listed Companies. Not applicable to open-end investment companies.
Item 6. Schedule of Investments. Schedule of investments in securities of unaffiliated issuers is included under Item 1.
Item 7. Disclosure of Proxy Voting Policies and Procedures for Closed-End Funds. Not applicable to open-end investment companies.
Item 8. Portfolio Managers of Closed-End Management Investment Companies. Not applicable to open-end investment companies.
Item 9. Purchases of Equity Securities by Closed-End Funds. Not applicable to open-end investment companies.
Item 10. Submission of Matters to a Vote of Security Holders. Vote of security holders is included under item 1.
Item 11. Controls and Procedures.
(a) Based on an evaluation of the Registrant’s disclosure controls and procedures as of a date within 90 days of filing date of this Form N-CSR, the principal executive officer and principal financial officer of the Registrant have concluded that the disclosure controls and procedures of the Registrant are reasonably designed to ensure that the information required in filings on Form N-CSR is recorded, processed, summarized, and reported by the filing date, including that information required to be disclosed is accumulated and communicated to the Registrant’s management, including the Registrant’s principal executive officer and principal financial officer, as appropriate to allow timely decisions regarding required disclosure.
(b) There were no significant changes in the Registrant’s internal control over financial reporting that occurred during the Registrant’s last fiscal half-year that have materially affected, or are reasonably likely to materially affect, the Registrant’s internal control over financial reporting.
Item 12. Disclosure of Securities Lending Activities for Closed-End Management Investment Companies.
Not applicable.
Item 13. Exhibits.
(a)(1) Code of Ethics filed herewith.
(a)(3) Not applicable for open-end investment companies.
SIGNATURES
Pursuant to the requirements of the Securities Exchange Act of 1934 and the Investment Company Act of 1940, the registrant has duly caused this report to be signed on its behalf by the undersigned, thereunto duly authorized.
(Registrant) Advisors Preferred Trust
By (Signature and Title)
/s/ Catherine Ayers-Rigsby
Catherine Ayer-Rigsby, President/Principal Executive Officer
Date 9/3/21
Pursuant to the requirements of the Securities Exchange Act of 1934 and the Investment Company Act of 1940, this report has been signed below by the following persons on behalf of the registrant and in the capacities and on the dates indicated.
By (Signature and Title)
/s/Catherine Ayers-Rigsby
Catherine Ayers-Rigsby, President/Principal Executive Officer
Date ___9/3/21
By (Signature and Title)
/s/ Christine Casares
Christine Casares, Treasurer/Principal Financial Officer
Date 9/3/21