UNITED STATES
SECURITIES AND EXCHANGE COMMISSION
Washington, D.C. 20549
FORM N-CSR
CERTIFIED SHAREHOLDER REPORT OF REGISTERED
MANAGEMENT INVESTMENT COMPANIES
Investment Company Act file number 811-22781
Goldman Sachs Trust II
(Exact name of registrant as specified in charter)
71 South Wacker Drive,
Chicago, Illinois 60606
(Address of principal executive offices) (Zip code)
| | |
Copies to: |
Caroline Kraus | | Geoffrey R.T. Kenyon, Esq. |
Goldman, Sachs & Co. | | Dechert LLP |
200 West Street | | 100 Oliver Street |
New York, New York 10282 | | 40th Floor |
| | Boston, MA 02110-2605 |
(Name and address of agents for service)
Registrant’s telephone number, including area code: (312) 655-4400
Date of fiscal year end: December 31
Date of reporting period: December 31, 2013
| ITEM 1. | REPORTS TO STOCKHOLDERS. |
| | The Annual Report to Stockholders is filed herewith. |
Goldman Sachs Funds

| | | | |
| | |
| Annual Report | | | | December 31, 2013 |
| | |
| | | | Multi-Manager Alternatives Fund |

Goldman Sachs Multi-Manager Alternatives Fund
| | | | |
TABLE OF CONTENTS | | | | |
| |
Principal Investment Strategies and Risks | | | 1 | |
| |
Portfolio Management Discussion and Performance Summaries | | | 3 | |
| |
Schedules of Investments | | | 10 | |
| |
Financial Statements | | | 35 | |
| |
Financial Highlights | | | 38 | |
| |
Notes to Financial Statements | | | 40 | |
| |
Report of Independent Registered Public Accounting Firm | | | 54 | |
| |
Other Information | | | 55 | |
| | | | |
| | | |
| NOT FDIC-INSURED | | May Lose Value | | No Bank Guarantee |
GOLDMAN SACHS MULTI-MANAGER ALTERNATIVES FUND
Principal Investment Strategies and Risks
This is not a complete list of risks that may affect the Fund. For additional information concerning the risks applicable to the Funds, please see the Fund’s Prospectus.
The Goldman Sachs Multi-Manager Alternatives Fund allocates its assets among multiple investment managers (“Underlying Managers”) who are unaffiliated with the Investment Adviser and who employ one or more non-traditional and alternative investment strategies. A strategy implemented by an Underlying Manager and/or the use of quantitative models to implement that strategy may fail to produce the intended results. Different investment styles (e.g., “alternative”) tend to shift in and out of favor, and at times the Fund may underperform other funds that invest in similar asset classes. The Fund’s equity investments are subject to market risk, which means that the value of the securities in which it invests may go up or down in response to the prospects of individual companies, particular sectors and/or general economic conditions. The securities of mid- and small-capitalization companies involve greater risks than those associated with larger, more established companies and may be subject to more abrupt or erratic price movements. At times, the Fund may be unable to sell certain of its illiquid investments without a substantial drop in price, if at all. The Fund’s investments in fixed income securities and loans are subject to the risks associated with debt securities generally, including credit, interest rate, liquidity, call and extension risk. Foreign and emerging market investments may be more volatile and less liquid than investments in U.S. securities and will be subject to the risks of currency fluctuations and adverse economic or political developments. Derivative instruments may involve a high degree of financial risk, including the risk that a small movement in the price of the underlying security or benchmark may result in a disproportionately large movement, unfavorable or favorable, in the price of the derivative instrument; the risk of default by a counterparty; and liquidity risk. Over-the-counter transactions are subject to less government regulation and supervision. The Fund is subject to the risks associated with short selling of securities, which involves leverage of the Fund’s assets and presents various other risks. The Fund may have a high rate of portfolio turnover, which involves correspondingly greater expenses which must be borne by the Fund, and is also likely to result in short-term capital gains taxable to shareholders. The Fund’s investments in other pooled investment vehicles subject it to additional expenses. The Fund is “non-diversified” and may invest more of its assets in fewer issuers than “diversified” funds. Accordingly, the Fund may be more susceptible to adverse developments affecting any single issuer held in its portfolio and to greater losses resulting from these developments.
The Investment Adviser’s Alternative Investments & Manager Selection (“AIMS”) Group is responsible for making recommendations with respect to hiring, terminating, or replacing the Fund’s Underlying Managers, as well as the Fund’s asset allocations. With respect to the Fund, the AIMS Group applies a multifaceted process with respect to manager due diligence, portfolio construction, and risk management. The AIMS Group also manages additional pooled vehicles which have similar investment strategies to those of the Fund that are not offered to retail investors and are not registered under the Investment Company Act of 1940, as amended (the “Act”). Because these vehicles are not registered under the Act, they are (i) subject to fewer regulatory restraints than the Fund (e.g., fewer trading constraints), (ii) may invest with managers other than the Fund’s Underlying Managers, (iii) may employ strategies that are not subject to the same constraints as the Fund, and (iv) may perform differently than the Fund, despite their similar strategies.
1
GOLDMAN SACHS MULTI-MANAGER ALTERNATIVES FUND
What Differentiates Goldman Sachs’ Multi-Manager Alternatives Fund Investment Process?
The Goldman Sachs Multi-Manager Alternatives Fund seeks long-term growth of capital by allocating its assets to underlying managers who employ a range of alternative and non-traditional investment strategies. The Fund benefits from the dedicated expertise of GSAM’s alternative investment team that has a legacy dating back to 19691 and a team of over 275 people located in 10 offices globally.2

| n | | We have over 100 alternative investment professionals3 dedicated to manager selection |
| n | | We employ a rigorous due diligence process to evaluate manager’s skill, strategy, and team and continually monitor managers after an investment is made |
| n | | Our Investment Committee process includes an independent “Devil’s advocate” to promote fluid debate and intense examination of each manager |

| n | | We combine “top down” market and economic environment considerations with “bottom up” manager-specific factors |
| n | | We incorporate judgment and quantitative tools to determine the appropriate investment size in each manager |
| n | | The process is continual with ongoing re-balancing and active management to optimize diversification |

| n | | We have over 40 professionals3 focused on alternative investment risk management and operational diligence |
| n | | We consider risk management an all-encompassing and real time discipline |
| n | | Our dedicated strategists leverage our proprietary risk management systems to continually monitor risk |
| 1In | | June 1997, The Goldman Sachs Group, Inc. (GSG, Inc.) acquired the assets and business of Commodities Corporation, which GSG, Inc. subsequently renamed Goldman Sachs Hedge Fund Strategies LLC in December 2004. |
| The | | portfolio risk management process includes an effort to monitor and manage risk, but does not imply low risk. Diversification does not protect an investor from market risk and does not ensure a profit. |
2
PORTFOLIO RESULTS
Goldman Sachs Multi-Manager Alternatives Fund
Investment Objective
The Fund seeks long-term growth of capital.
Portfolio Management Discussion and Analysis
Below, the Goldman Sachs Alternative Investments & Manager Selection Group discusses the Goldman Sachs Multi-Manager Alternatives Fund’s (the “Fund”) performance and positioning for period from its inception on April 30, 2013 through December 31, 2013 (the “Reporting Period”).
| Q | | How did the Fund perform during the Reporting Period? |
| A | | During the Reporting Period, the Fund’s Class A, Class C, Institutional, Class IR and Class R Shares generated cumulative total returns of 5.20%, 4.60%, 5.40%, 5.40% and 5.00%, respectively. These returns compare to the 0.05% cumulative total return of the Fund’s primary benchmark, the BofA Merrill Lynch U.S. Dollar 3-Month U.S. Treasury Bill Index (the “Index”) during the same time period. The HFRX Global Hedge Fund Index(a) a broad proxy for hedge fund performance and the Fund’s secondary benchmark, returned 2.8% during the Reporting Period. |
| | To compare, the MSCI World Index (net), not the Fund’s benchmark but designed to measure the equity market performance of developed markets, had a cumulative total return of 14.0% during the Reporting Period. Similarly, not benchmarks of the Fund, the Barclays Global Aggregate Bond Index, designed to measure the broad global investment grade fixed income market, and the Barclays U.S. Corporate High Yield Bond Index, designed to measure the U.S. non-investment grade fixed-rate debt market, had cumulative total returns of -0.9% and 2.6%, respectively, during the Reporting Period. |
| | References to the Fund’s benchmarks and to other indices mentioned herein are for informational purposes only, and unless otherwise noted, are not an indication of how the Fund is managed. The use of the Index as the Fund’s benchmark does not imply the Fund is being managed like cash and does not imply low risk or low volatility. |
| | Notably, during the Reporting Period, the Fund had a realized beta to the MSCI World Index of 0.41. (Beta is a measure of the sensitivity of an asset’s returns to broad market returns.) The Fund’s overall annualized volatility was 4.6% during the Reporting Period, while the overall |
| (a) | | The HFRX Global Hedge Fund Index is a trademark of Hedge Fund Research, Inc. (“HFR”). HFR has not participated in the formation of the Fund. HFR does not endorse or approve the Fund or make any recommendation with respect to investing in the Fund. |
| | annualized volatility of the global equity markets, as measured by the MSCI World Index, during the same time period was 10.0%. It is important, of course, to emphasize the brevity of the Reporting Period since the launch of the Fund. |
| Q | | What economic and market factors most influenced the financial markets as a whole during the Reporting Period? |
| A | | During the Reporting Period, developed equity markets rallied, as investors showed increased confidence in the ability of the U.S. Federal Reserve (the “Fed”) to successfully taper its quantitative easing asset purchases. Investors also looked to renewed signs of steady, if slow, economic recoveries in the U.S., Europe and Japan. In the U.S., economic growth remained slower than expected, and unemployment, while declining, remained stubbornly high. However, in spite of the partial federal government shutdown in October 2013, signs that the housing market was in a sustained recovery and slight improvements to unemployment in the last half of 2013 helped push the U.S. equity market rally to all-time highs. The S&P 500 Index, as representative of the U.S. equity market, rose 32.4% during the full calendar year 2013 and 17.4% during the Reporting Period. In the non-U.S. equity markets, both political turmoil in the Middle East and Southeast Asia and fears of a splitting of the Eurozone when Cypriot banks underwent funding crises in the spring tempered investor sentiment. However, as central banks intervened to fight unemployment and deflation in certain regions, European equity markets rallied as well. Indeed, the Dow Jones Eurostoxx Index, representing the European equity markets, rose 24.6% during the full calendar year 2013 and 19.5% during the Reporting Period. The year also marked a major “de-coupling” of emerging equity markets from developed equity markets, as emerging equity markets declined on concerns that capital outflows and rising borrowing costs would have adverse impacts on its governments and companies. (De-coupling is the occurrence of returns on asset classes diverging from their expected or normal pattern of correlation.) |
3
PORTFOLIO RESULTS
| | Loose monetary policy — and uncertainty regarding its conclusion — drove fixed income markets during the Reporting Period. In a reflection of the market’s risk appetite and investors’ search for yield, lower-rated high yield bonds and loans as a whole outperformed higher rated securities during the Reporting Period. In May 2013, the Fed’s hint that it might taper its asset purchases was followed by a steady decline in developed economies’ fixed income markets and a sharp fall in some large emerging market credit markets, a trend that remained largely in place through the end of the calendar year. In September 2013, the Fed’s announcement that it would continue its asset purchases for the time being and the expectation of new Fed Chair Janet Yellen’s continuation of a more dovish monetary policy helped risk assets to rally worldwide. This rallying trend continued after the fixed income markets largely shrugged off the Fed’s December 2013 announcement that it would indeed begin tapering its stimulus program in January 2014. |
| | Foreign exchange markets were also driven through much of the Reporting Period by lingering questions over the cessation of central bank stimulus programs. Emerging market currencies suffered some of their worst declines in years, with only a moderate rebound in December 2013, as investors weighed the potential of higher interest rates in the U.S. against the possibility of the U.S. economy stimulating emerging market exports. |
| Q | | What key factors were responsible for the Fund’s performance during the Reporting Period? |
| A | | The Fund generated positive returns, as measured by asset class, strategy and geography overall, during the Reporting Period as a whole. The Fund’s performance can be attributed primarily to its equity- oriented strategies’ participation in the stock market rally, while maintaining fixed income and credit-oriented strategies with the flexibility to allocate across the credit spectrum, e.g., the ability to move up the capital structure or away from fixed corporate bonds to floating rate leveraged loans. |
| | More specifically, the Fund’s performance during the Reporting Period can be attributed to the performance of the Fund’s Underlying Managers, who are unaffiliated investment managers that employ one or more non-traditional and alternative investment strategies. At the time of its launch on April 30, 2013, the Fund allocated capital to five Underlying Managers — Ares Capital Management II, LLC (“Ares”); Brigade Capital Management, LLC (“Brigade”); GAM International Management Limited (“GAM”); Karsch Capital Management, L.P. (“Karsch”); and Lateef Investment Management, L.P. (“Lateef”); These Underlying Managers represented four strategies — dynamic equity; equity long/short; event driven and credit; and opportunistic fixed income. |
| | The Fund subsequently added two Underlying Managers — Graham Capital Management, L.P. (“Graham”) in August 2013 and First Pacific Advisors, LLC (“FPA”) in October 2013. Graham is a tactical trading manager that employs a systematic price-based trend-following strategy that seeks to profit from trends in the global equity, fixed income and currency markets. The Fund added Graham’s tactical trading strategy due to its ability to adjust exposures depending on views of market conditions and its historically low correlation to other hedge fund strategies. FPA is an equity long/short manager that utilizes an opportunistic value investment philosophy that aims to achieve equity-like returns with less risk. FPA’s strategy is characterized by the manager’s ability to invest across the capital structure as well as its opportunistic nature and focus on capital preservation. |
| | The Fund also redeemed from one manager, Karsch, in August 2013. Karsch, which employs a diversified fundamental long/short equity strategy, was redeemed due to the departure of a key portfolio manager. |
| | As of December 31, 2013, the Fund had seven Underlying Managers, with capital allocated to six. (We expect to allocate capital to the seventh Underlying Manager, Halcyon Liquid Strategies IC Management LP (“Halcyon”), during the first quarter of 2014.) |
| | Of the seven Underlying Managers with allocated capital during the Reporting Period, six generated positive returns and one produced a negative return from the time of its addition to the Fund through December 31, 2013. |
| | The seven Underlying Managers with allocated capital during the Reporting Period represented five strategies — dynamic equity (Lateef), equity long/short (Karsch and FPA), tactical trading (Graham), event driven and credit (Ares and Brigade), and opportunistic fixed income (GAM). |
| Q | | Which strategies most significantly affected Fund performance? |
| A | | Of the five strategies employed across the Underlying Managers during the Reporting Period, four generated positive returns and one produced a negative return. |
| | The dynamic equity strategy used in the Fund posted the strongest positive performance during the Reporting Period, driven primarily by equity market exposure and stock selection, with positions in the information technology and consumer discretionary sectors particularly strong contributors. Dynamic equity strategies generally involve investing in equity instruments, often with a long-term view. Dynamic equity strategies are less likely to track a benchmark than traditional long-only strategies, and dynamic equity managers are less constrained than traditional long-only managers with respect to factors such as position concentration, sector and country weights, style and market capitalization. |
4
PORTFOLIO RESULTS
| | The Fund’s equity long/short strategy generated positive performance attributable primarily to long positions in the financials and information technology sectors. Equity long/short strategies generally involve long and short investing, based on fundamental evaluations, research and various analytical measurements, in equity and equity-related investments. Equity long/short managers may, for example, buy stocks they expect to outperform or they believe are undervalued, and may also sell short stocks they believe will underperform or they believe are overvalued. Long positions benefit from an increase in the price of the underlying instrument or asset class, while short positions benefit from a decrease in that price. |
| | The Fund’s tactical trading strategy also performed well during the Reporting Period, with equity, currency and long-dated fixed income exposure all contributing to gains. Tactical trading strategies seek to produce total return by long and short investing across global fixed income, currency, equity and commodity markets. Tactical trading managers may employ various investment styles. Tactical trading managers that employ a global macro style may select their investments based upon fundamental analysis, or determining an asset’s value based upon factors that directly affect its value. Tactical trading managers that employ a managed futures investing style may use quantitative modeling techniques, i.e. determining an asset’s value based upon an analysis of price history, price momentum and the asset’s value relative to that of other assets, among other factors. Some tactical trading managers may employ both fundamental analysis and quantitative modeling techniques. Tactical trading managers typically have no bias to be long, short or neutral. |
| | The Fund’s event driven and credit strategies posted positive performance, aided most by positions in select corporate high yield bonds and bank loans. Event driven and credit strategies seek to achieve gains from market movements in security prices caused by specific corporate events or changes in perceived relative value. These strategies may include, among others, merger arbitrage, distressed credit, opportunistic credit and value with a catalyst investing styles. |
| | The Fund’s opportunistic fixed income strategy posted negative returns during the Reporting Period, due largely to net long exposure to emerging market fixed income securities, which, as discussed earlier, performed poorly during the Reporting Period. Opportunistic fixed income strategies seek to deliver positive absolute returns in excess of cash investments regardless of economic cycle (i.e., downturns and upswings) or cyclical credit availability. Opportunistic fixed income managers seek to maintain diversified exposure across various fixed income and floating rate market segments, with a focus on more liquid markets, assessing the relative value across sectors and adjusting portfolio weightings based on opportunity. |
| Q | | How did the Fund use derivatives and similar instruments during the Reporting Period? |
| A | | The Underlying Managers of the Fund employ derivatives and similar instruments as part of their underlying strategies to hedge market exposure and/or to gain implicit leverage, subject to the constraints of the 1940 Act. During the Reporting Period, credit default swaps, equity futures, interest rate futures, interest rate swaps, options on interest rate futures, interest rate swaptions, bond futures, options on bond futures, forward foreign currency exchange contracts and foreign currency exchange options were used in the Fund. |
| Q | | Were there any notable changes in the Fund’s allocations during the Reporting Period? |
| A | | The Fund launched on April 30, 2013 with initial weights of approximately 25% of total net assets to equity long/short, 20% to dynamic equity, 30% to event driven and credit and 20% to opportunistic fixed income. The balance of approximately 5% of total net assets was held in cash. |
| | During the Reporting Period, shifts to the Fund’s asset allocation were made in response to the market environment and as a result of new additions and terminations of Underlying Managers. For example, we increased the Fund’s allocation to opportunistic fixed income and reduced its allocations to dynamic equity, equity long/short and event driven and credit, paring gains in these strategies in a rising equity market in order to initiate the tactical trading strategy. The Fund’s allocation to cash also decreased during the Reporting Period. |
| Q | | What is the Fund’s tactical view and strategy for the months ahead? |
| A | | We intend to continue to monitor global economic recovery, monetary policy and market volatility, while using active portfolio management and alternative investment strategies to position the Fund as we aim to deliver positive absolute returns across a variety of market environments. We believe the flexibility to allocate tactically across these alternative strategies may enable us to provide investors with positive absolute returns in a variety of market conditions and with significant diversification benefits. |
5
FUND BASICS
Multi-Manager Alternatives Fund
as of December 31, 2013
| | | | | | | | | | |
| | PERFORMANCE REVIEW | |
| | | April 30, 2013– December 31, 2013 | | Fund Total Return (based on NAV)1 | | | BofA Merrill Lynch U.S. Dollar 3-Month
U.S. Treasury Bill Index2 | |
| | Class A | | | 5.20 | % | | | 0.05 | % |
| | Class C | | | 4.60 | | | | 0.05 | |
| | Institutional | | | 5.40 | | | | 0.05 | |
| | Class IR | | | 5.40 | | | | 0.05 | |
| | | Class R | | | 5.00 | | | | 0.05 | |
| | 1 | | The net asset value (“NAV”) represents the net assets of the class of the Fund (ex-dividend) divided by the total number of shares of the class outstanding. The Fund’s performance reflects the reinvestment of dividends and other distributions. The Fund’s performance does not reflect the deduction of any applicable sales charges. |
| | 2 | | The BofA Merrill Lynch US 3-Month Treasury Bill Index is comprised of a single issue purchased at the beginning of the month and held for a full month. At the end of the month that issue is sold and rolled into a newly selected issue. The issue selected at each month-end rebalancing is the outstanding Treasury Bill that matures closest to, but not beyond, three months from the rebalancing date. To qualify for selection, an issue must have settled on or before the month-end rebalancing date. While the index will often hold the Treasury Bill issued at the most recent 3-month auction, it is also possible for a seasoned 6-month Bill to be selected. |
| | | | | | | | | | |
| | STANDARDIZED TOTAL RETURNS3 | |
| | | For the period ended 12/31/13 | | Since Inception | | | Inception Date | |
| | Class A | | | -0.56 | % | | | 4/30/13 | |
| | Class C | | | 3.60 | | | | 4/30/13 | |
| | Institutional | | | 5.40 | | | | 4/30/13 | |
| | Class IR | | | 5.40 | | | | 4/30/13 | |
| | | Class R | | | 5.00 | | | | 4/30/13 | |
| | 3 | | The Standardized Average Annual Total Returns are cumulative total returns as of the most recent calendar quarter-end. They assume reinvestment of all distributions at NAV. These returns reflect a maximum initial sales charge of 5.50% for Class A Shares and the assumed contingent deferred sales charge for Class C Shares (1% if redeemed within 12 months of purchase). Because Institutional, Class IR and Class R Shares do not involve a sales charge, such a charge is not applied to their Standardized Total Returns. |
The returns set forth in the tables above represent past performance. Past performance does not guarantee future results. The Fund’s investment return and principal value will fluctuate so that an investor’s shares, when redeemed, may be worth more or less than their original cost. Current performance may be lower or higher than the performance quoted above. Please visit our web site at www.GSAMFUNDS.com to obtain the most recent month-end returns. Performance reflects applicable fee waivers and/or expense limitations in effect during the periods shown. In their absence, performance would be reduced. Returns do not reflect the deduction of taxes that a shareholder would pay on Fund distributions or the redemption of Fund shares.
6
FUND BASICS
| | | | | | | | | | |
| | EXPENSE RATIOS4 | |
| | | | | Net Expense Ratio (Current) | | | Gross Expense Ratio (Before Waivers) | |
| | Class A | | | 2.55 | % | | | 3.28 | % |
| | Class C | | | 3.30 | | | | 4.03 | |
| | Institutional | | | 2.15 | | | | 2.88 | |
| | Class IR | | | 2.30 | | | | 3.03 | |
| | | Class R | | | 2.80 | | | | 3.53 | |
| | 4 | | The expense ratios of the Fund, both current (net of applicable fee waivers and/or expense limitations) and before waivers (gross of applicable fee waivers and/or expense limitations) are as set forth above according to the most recent publicly available Prospectus for the Fund and may differ from the expense ratios disclosed in the Financial Highlights in this report. The Fund’s waivers and/or expense limitations will remain in place through at least April 30, 2014, and prior to such date the Investment Adviser may not terminate the arrangements without the approval of the Fund’s Board of Trustees. If these arrangements are discontinued in the future, the expense ratios may change without shareholder approval. |
|
| FUND COMPOSITION (%) |
| As of December 31, 2013 |
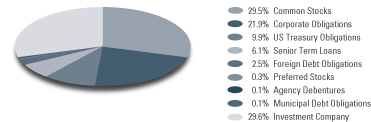
The percentage shown for each investment category reflects the value of investments in that category as a percentage of the Fund’s market value. The graph depicts the Fund’s investments but may not represent the Fund’s market exposure due to the exclusion of certain derivatives, if any, as listed in the Additional Investment Information section of the Schedule of Investments.
| | | | | | | | |
| | TOP TEN HOLDINGS AS OF 12/31/135 |
| | | Holding | | % of Net Assets | | | Line of Business |
| | Aon PLC | | | 1.4 | % | | Insurance |
| | Stanley Black & Decker, Inc. | | | 1.1 | | | Machinery |
| | AMETEK, Inc. | | | 1.0 | | | Electrical Equipment |
| | Hospira, Inc. | | | 0.9 | | | Pharmaceuticals |
| | Trimble Navigation Ltd. | | | 0.9 | | | Electronic Equipment, Instruments &
Components |
| | The Progressive Corp. | | | 0.9 | | | Insurance |
| | Waters Corp. | | | 0.9 | | | Life Sciences Tools & Services |
| | Twenty-First Century Fox, Inc. | | | 0.9 | | | Media |
| | Starwood Hotels & Resorts Worldwide, Inc. | | | 0.9 | | | Hotels, Restaurants & Leisure |
| | | Motorola Solutions, Inc. | | | 0.8 | | | Communications Equipment |
| | 5 | | The top 10 holdings may not be representative of the Fund’s future investments. |
7
FUND BASICS
| | | | | | |
| | SUBADVISOR ALLOCATION (%) | |
| | | As of December 31, 2013 | | | |
| | Ares Capital Management II, LLC | | | 12.1 | % |
| | Brigade Capital Management, LLC | | | 9.5 | |
| | First Pacific Advisors, LLC | | | 15.4 | |
| | GAM International Management Limited | | | 23.3 | |
| | Lateef Investment Management, L.P. | | | 18.4 | |
| | | Graham Capital Management, L.P. | | | 18.4 | |
|
| STRATEGY ALLOCATION6 (%) |
| As of December 31, 2013 |
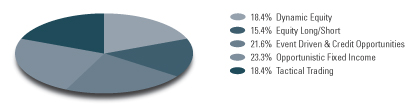
Equity Long/Short Strategies generally involve long and short investing, based on analytical measurements, in equity and equity-related investments. Dynamic Equity Strategies generally are long-biased strategies that are less constrained than traditional long-only managers with respect to factors such as position concentration, sector and country weights, style, and market capitalization. Event Driven and Credit Strategies typically seek to take advantage of corporate events and company-specific catalysts such as bankruptcies, mergers or takeovers. Opportunistic Fixed Income Strategies seek to maintain diversified exposure across various fixed income and floating rate market segments, including, among others, global emerging markets, investment grade and high yield debt markets, convertible bonds, and bank loans. Tactical Trading Strategies seek to produce total return by long and short investing across global fixed income, currency, equity, and commodity markets. Tactical Trading managers typically have no bias to be long, short, or neutral.
| | 6 | | This chart only represents capital allocated to the Underlying Managers and as such weightings may not sum to 100%. |
8
GOLDMAN SACHS MULTI-MANAGER ALTERNATIVES FUND
Performance Summary
December 31, 2013
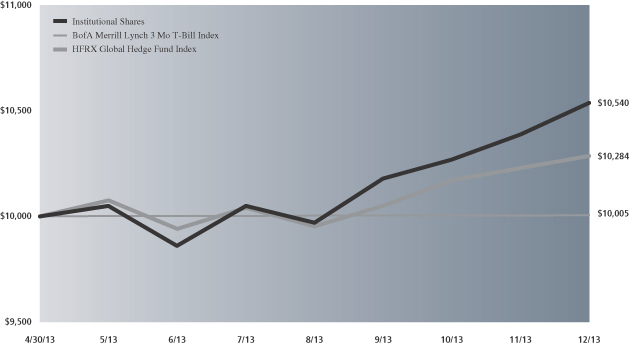
The following graph shows the value, as of December 31, 2013, of a $10,000 investment made on April 30, 2013 (commencement of operations) in Institutional Shares at NAV. For comparative purposes, the performance of the Fund’s current benchmarks, the BofA Merrill Lynch 3 Mo T-Bill Index and the HFRX Global Hedge Fund Index, are shown. This performance data represents past performance and should not be considered indicative of future performance, which will fluctuate with changes in market conditions. These performance fluctuations will cause an investor’s shares, when redeemed, to be worth more or less than their original cost. Performance reflects applicable fee waivers and/or expense limitations in effect during the periods shown and in their absence, performance would be reduced. Returns do not reflect the deduction of taxes that a shareholder would pay on Fund distributions or the redemption of Fund shares. Performance of Class A, Class C, Class IR and Class R Shares will vary from Institutional Shares due to differences in class specific fees and any applicable sales charges. In addition to the Investment Adviser’s decisions regarding issuer/industry investment selection and allocation, other factors may affect Fund performance. These factors include, but are not limited to, Fund operating fees and expenses, portfolio turnover and subscription and redemption cash flows affecting the Fund.
|
| Multi-Manager Alternatives Fund’s Lifetime Performance |
Performance of a $10,000 Investment, with distributions reinvested, from April 30, 2013 through December 31, 2013.
| | |
| Average Annual Total Return through December 31, 2013 | | Since Inception |
Class A (Commenced April 30, 2013) | | |
Excluding sales charges | | 5.20%* |
Including sales charges | | -0.56%* |
| | |
Class C (Commenced April 30, 2013) | | |
Excluding contingent deferred sales charges | | 4.60%* |
Including contingent deferred sales charges | | 3.60%* |
| | |
Institutional Class (Commenced April 30, 2013) | | 5.40%* |
| | |
Class IR (Commenced April 30, 2013) | | 5.40%* |
| | |
Class R (Commenced April 30, 2013) | | 5.00%* |
| | |
| | * | | Total return for periods of less than one year represents cumulative total return. |
9
GOLDMAN SACHS MULTI-MANAGER ALTERNATIVES FUND
Schedule of Investments
December 31, 2013
| | | | | | | | |
Shares | | | Description | | Value | |
| | | | | | | | |
| | Common Stocks – 28.5% | |
| | Beverages – 0.3% | |
| | 5,400 | | | Anheuser-Busch InBev NV ADR | | $ | 574,884 | |
| | |
| | Capital Markets – 0.9% | |
| | 14,365 | | | T. Rowe Price Group, Inc. | | | 1,203,356 | |
| | 12,600 | | | The Bank of New York Mellon Corp. | | | 440,244 | |
| | | | | | | | |
| | | | | | | 1,643,600 | |
| | |
| | Commercial Banks – 0.1% | |
| | 5,300 | | | CIT Group, Inc. | | | 276,289 | |
| | |
| | Commercial Services & Supplies – 0.8% | |
| | 38,269 | | | Tyco International Ltd. | | | 1,570,560 | |
| | |
| | Communications Equipment – 1.7% | |
| | 19,600 | | | ARRIS Group, Inc.* | | | 477,554 | |
| | 26,800 | | | Cisco Systems, Inc. | | | 601,660 | |
| | 24,004 | | | Motorola Solutions, Inc. | | | 1,620,270 | |
| | 6,000 | | | QUALCOMM, Inc. | | | 445,500 | |
| | | | | | | | |
| | | | | | | 3,144,984 | |
| | |
| | Computers & Peripherals – 0.8% | |
| | 58,573 | | | EMC Corp. | | | 1,473,111 | |
| | |
| | Containers & Packaging* – 0.3% | |
| | 17,600 | | | Owens-Illinois, Inc. | | | 629,728 | |
| | |
| | Diversified Financial Services – 0.5% | |
| | 6,800 | | | Citigroup, Inc. | | | 354,348 | |
| | 6,200 | | | Groupe Bruxelles Lambert SA | | | 569,539 | |
| | | | | | | | |
| | | | | | | 923,887 | |
| | |
| | Electrical Equipment – 1.0% | |
| | 34,815 | | | AMETEK, Inc. | | | 1,833,706 | |
| | |
| | Electronic Equipment, Instruments & Components – 0.9% | |
| | 1,000 | | | TE Connectivity Ltd. | | | 55,110 | |
| | 47,118 | | | Trimble Navigation Ltd.* | | | 1,634,995 | |
| | | | | | | | |
| | | | | | | 1,690,105 | |
| | |
| | Food & Staples Retailing – 1.4% | |
| | 17,400 | | | CVS Caremark Corp. | | | 1,245,318 | |
| | 92,200 | | | Tesco PLC | | | 512,017 | |
| | 6,800 | | | Unilever NV | | | 273,396 | |
| | 2,600 | | | Wal-Mart Stores, Inc. | | | 204,594 | |
| | 6,800 | | | Walgreen Co. | | | 390,592 | |
| | | | | | | | |
| | | | | | | 2,625,917 | |
| | |
| | Health Care Equipment & Supplies – 0.7% | |
| | 12,200 | | | CareFusion Corp.* | | | 485,804 | |
| | 12,600 | | | Covidien PLC | | | 858,060 | |
| | | | | | | | |
| | | | | | | 1,343,864 | |
| | |
| | Health Care Providers & Services – 0.3% | |
| | 5,700 | | | WellPoint, Inc. | | | 526,623 | |
| | |
| | | | | | | | |
| | Common Stocks – (continued) | |
| | Hotels, Restaurants & Leisure – 1.7% | |
| | 20,437 | | | Starwood Hotels & Resorts Worldwide, Inc. | | $ | 1,623,719 | |
| | 8,289 | | | Wynn Resorts Ltd. | | | 1,609,807 | |
| | | | | | | | |
| | | | | | | 3,233,526 | |
| | |
| | Household Products – 0.2% | |
| | 2,800 | | | Henkel AG & Co. KGaA | | | 291,925 | |
| | | | | | | | |
| | |
| | Industrial Conglomerates – 0.0% | |
| | 400 | | | Jardine Matheson Holdings Ltd. | | | 20,940 | |
| | 200 | | | Jardine Strategic Holdings Ltd. | | | 6,350 | |
| | | | | | | | |
| | | | | | | 27,290 | |
| | |
| | Insurance – 2.8% | |
| | 655 | | | Alleghany Corp.* | | | 261,974 | |
| | 16,100 | | | American International Group, Inc. | | | 821,905 | |
| | 31,846 | | | Aon PLC | | | 2,671,561 | |
| | 59,668 | | | The Progressive Corp. | | | 1,627,146 | |
| | | | | | | | |
| | | | | | | 5,382,586 | |
| | |
| | Internet Software & Services* – 0.4% | |
| | 655 | | | Google, Inc. Class A | | | 734,065 | |
| | |
| | IT Services – 1.2% | |
| | 17,676 | | | Accenture PLC Class A | | | 1,453,321 | |
| | 1,085 | | | MasterCard, Inc. Class A | | | 906,474 | |
| | | | | | | | |
| | | | | | | 2,359,795 | |
| | |
| | Life Sciences Tools & Services – 1.3% | |
| | 8,400 | | | Thermo Fisher Scientific, Inc. | | | 935,340 | |
| | 16,241 | | | Waters Corp.* | | | 1,624,100 | |
| | | | | | | | |
| | | | | | | 2,559,440 | |
| | |
| | Machinery – 2.0% | |
| | 3,700 | | | Joy Global, Inc. | | | 216,413 | |
| | 25,216 | | | Stanley Black & Decker, Inc. | | | 2,034,679 | |
| | 20,854 | | | Wabtec Corp. | | | 1,548,827 | |
| | | | | | | | |
| | | | | | | 3,799,919 | |
| | |
| | Media – 2.2% | |
| | 17,675 | | | Scripps Networks Interactive Class A | | | 1,527,297 | |
| | 28,800 | | | The Interpublic Group of Cos., Inc. | | | 509,760 | |
| | 46,157 | | | Twenty-First Century Fox, Inc. | | | 1,623,803 | |
| | 25,700 | | | WPP PLC | | | 588,631 | |
| | | | | | | | |
| | | | | | | 4,249,491 | |
| | |
| | Metals & Mining – 0.4% | |
| | 50,200 | | | Alcoa, Inc. | | | 533,626 | |
| | 60,000 | | | Norsk Hydro ASA | | | 268,411 | |
| | | | | | | | |
| | | | | | | 802,037 | |
| | |
| | Oil, Gas & Consumable Fuels – 0.7% | |
| | 15,100 | | | Canadian Natural Resources Ltd. | | | 510,984 | |
| | 8,500 | | | Occidental Petroleum Corp. | | | 808,350 | |
| | | | | | | | |
| | | | | | | 1,319,334 | |
| | |
| | |
| 10 | | The accompanying notes are an integral part of these financial statements. |
GOLDMAN SACHS MULTI-MANAGER ALTERNATIVES FUND
| | | | | | | | |
Shares | | | Description | | Value | |
| | | | | | | | |
| | Common Stocks – (continued) | |
| | Pharmaceuticals – 1.1% | |
| | 43,706 | | | Hospira, Inc.* | | $ | 1,804,184 | |
| | 3,800 | | | Johnson & Johnson | | | 348,042 | |
| | | | | | | | |
| | | | | | | 2,152,226 | |
| | |
| | Professional Services – 2.1% | |
| | 32,086 | | | Nielsen Holdings NV | | | 1,472,427 | |
| | 36,308 | | | Robert Half International, Inc. | | | 1,524,573 | |
| | 8,353 | | | Towers Watson & Co. Class A | | | 1,065,926 | |
| | | | | | | | |
| | | | | | | 4,062,926 | |
| | |
| | Semiconductors & Semiconductor Equipment – 0.5% | |
| | 9,800 | | | Analog Devices, Inc. | | | 499,114 | |
| | 16,600 | | | Intel Corp. | | | 430,936 | |
| | | | | | | | |
| | | | | | | 930,050 | |
| | |
| | Software – 2.0% | |
| | 7,768 | | | ANSYS, Inc.* | | | 677,369 | |
| | 7,000 | | | Check Point Software Technologies Ltd.* | | | 451,640 | |
| | 38,300 | | | Microsoft Corp. | | | 1,433,569 | |
| | 32,600 | | | Oracle Corp. | | | 1,247,276 | |
| | | | | | | | |
| | | | | | | 3,809,854 | |
| | |
| | Wireless Telecommunication Services – 0.2% | |
| | 11,300 | | | Vodafone Group PLC ADR | | | 444,203 | |
| | |
| | TOTAL COMMON STOCKS | |
| | (Cost $48,878,073) | | $ | 54,415,925 | |
| | |
| | | | | | | | | | | | | | |
Principal
Amount | | | Interest
Rate | | | Maturity
Date | | | Value | |
| | | | | | | | | | | | | | |
| | Corporate Obligations – 21.1% | | | | | |
| | Aerospace & Defense(a)(b) – 0.1% | | | | | |
| Alliant Techsystems, Inc. | |
| $ | 200,000 | | | | 5.250 | % | | | 10/01/21 | | | $ | 200,500 | |
| | |
| | Airlines – 0.2% | |
| Air France-KLM(c) | |
| EUR | 800,000 | | | | 2.030 | | | | 02/15/23 | | | | 120,951 | |
| International Consolidated Airlines Group SA | |
| | 100,000 | | | | 1.750 | | | | 05/31/18 | | | | 182,308 | |
| | | | | | | | | | | | | | |
| | | | | | | | | | | | | 303,259 | |
| | |
| | Automotive – 0.6% | |
| Affinia Group, Inc.(b) | |
| $ | 150,000 | | | | 7.750 | | | | 05/01/21 | | | | 158,250 | |
| Faurecia | |
| EUR | 400,000 | | | | 3.250 | | | | 01/01/18 | | | | 181,647 | |
| General Motors Financial Co., Inc.(a) | |
| $ | 125,000 | | | | 3.250 | | | | 05/15/18 | | | | 125,313 | |
| Gestamp Funding Luxembourg SA(a)(b) | |
| | 250,000 | | | | 5.625 | | | | 05/31/20 | | | | 254,700 | |
| RCI Banque SA(a) | |
| | 100,000 | | | | 3.500 | | | | 04/03/18 | | | | 101,913 | |
| | |
| | | | | | | | | | | | | | |
| | Corporate Obligations – (continued) | |
| | Automotive – (continued) | |
| Stackpole International Intermediate Co.(a)(b) | |
| $ | 210,000 | | | | 7.750 | % | | | 10/15/21 | | | $ | 218,400 | |
| TRW Automotive, Inc.(a) | |
| | 100,000 | | | | 4.500 | | | | 03/01/21 | | | | 101,250 | |
| | | | | | | | | | | | | | |
| | | | | | | | | | | | | 1,141,473 | |
| | |
| | Banks – 2.6% | |
| African Export-Import Bank | |
| | 200,000 | | | | 5.750 | | | | 07/27/16 | | | | 210,750 | |
| Bangkok Bank PCL | |
| | 200,000 | | | | 3.300 | | | | 10/03/18 | | | | 198,467 | |
| Bank of America Corp.(d) | |
| | 300,000 | | | | 1.281 | | | | 01/15/19 | | | | 302,345 | |
| Barclays Bank PLC(b)(d) | |
| EUR | 30,000 | | | | 4.750 | | | | 03/15/49 | | | | 35,098 | |
| | 70,000 | | | | 4.875 | | | | 12/15/49 | | | | 86,669 | |
| Barclays PLC(b)(d) | |
| $ | 175,000 | | | | 8.250 | | | | 12/15/49 | | | | 180,250 | |
| Citigroup, Inc.(d) | |
| | 250,000 | | | | 0.921 | | | | 11/15/16 | | | | 250,350 | |
| Deutsche Bank AG(b)(d) | |
| | 200,000 | | | | 4.296 | | | | 05/24/28 | | | | 181,037 | |
| Deutsche Bank Capital Funding Trust IV(b)(d) | |
| EUR | 15,000 | | | | 2.288 | | | | 03/19/49 | | | | 19,659 | |
| HSBC Bank PLC(a) | |
| $ | 200,000 | | | | 1.500 | | | | 05/15/18 | | | | 195,294 | |
| HSBC USA, Inc.(d) | |
| | 350,000 | | | | 1.128 | | | | 09/24/18 | | | | 350,486 | |
| ING Bank NV(a) | |
| | 200,000 | | | | 1.375 | | | | 03/07/16 | | | | 200,315 | |
| JPMorgan Chase & Co.(b)(d) | |
| | 95,000 | | | | 5.150 | | | | 05/01/49 | | | | 85,262 | |
| JPMorgan Chase Bank NA(b)(d) | |
| EUR | 400,000 | | | | 0.994 | | | | 05/31/17 | | | | 543,676 | |
| Lloyds Banking Group PLC(a)(b)(d) | |
| $ | 35,000 | | | | 6.657 | | | | 05/21/49 | | | | 33,775 | |
| Lloyds TSB Bank PLC | |
| | 300,000 | | | | 6.375 | | | | 01/21/21 | | | | 353,356 | |
| Macquarie Bank Ltd. | |
| | 461,000 | | | | 5.000 | | | | 02/22/17 | | | | 499,927 | |
| Royal Bank of Scotland NV(b)(d) | |
| AUD | 350,000 | | | | 3.372 | | | | 05/17/18 | | | | 280,345 | |
| Royal Bank of Scotland PLC | |
| $ | 250,000 | | | | 2.550 | | | | 09/18/15 | | | | 255,767 | |
| GBP | 20,000 | | | | 6.000 | (d) | | | 09/08/49 | | | | 29,462 | |
| Santander International Debt SA | |
| | 200,000 | | | | 3.160 | | | | 12/01/15 | | | | 336,036 | |
| Standard Bank PLC | |
| $ | 100,000 | | | | 8.125 | | | | 12/02/19 | | | | 113,250 | |
| Standard Chartered PLC(a) | |
| | 150,000 | | | | 3.850 | | | | 04/27/15 | | | | 155,759 | |
| Wachovia Capital Trust III(b)(d) | |
| | 80,000 | | | | 5.570 | | | | 02/10/49 | | | | 73,200 | |
| | | | | | | | | | | | | | |
| | | | | | | | | | | | | 4,970,535 | |
| | |
| | |
| The accompanying notes are an integral part of these financial statements. | | 11 |
GOLDMAN SACHS MULTI-MANAGER ALTERNATIVES FUND
Schedule of Investments (continued)
December 31, 2013
| | | | | | | | | | | | | | |
Principal
Amount | | | Interest
Rate | | | Maturity
Date | | | Value | |
| | | | | | | | | | | | | | |
| | Corporate Obligations – (continued) | |
| | Brokerage(d) – 0.2% | |
| Morgan Stanley, Inc. | |
| $ | 200,000 | | | | 0.696 | % | | | 10/18/16 | | | $ | 198,353 | |
| The Bear Stearns Cos. LLC | |
| | 200,000 | | | | 0.629 | | | | 11/21/16 | | | | 198,803 | |
| | | | | | | | | | | | | | |
| | | | | | | | | | | | | 397,156 | |
| | |
| | Building Materials(b) – 0.3% | |
| Building Materials Corp. of America(a) | |
| | 175,000 | | | | 7.500 | | | | 03/15/20 | | | | 189,000 | |
| Cemex SAB de CV(a) | |
| | 200,000 | | | | 7.250 | | | | 01/15/21 | | | | 206,172 | |
| Gibraltar Industries, Inc. | |
| | 200,000 | | | | 6.250 | | | | 02/01/21 | | | | 206,500 | |
| | | | | | | | | | | | | | |
| | | | | | | | | | | | | 601,672 | |
| | |
| | Chemicals – 0.4% | |
| Celanese US Holdings LLC | |
| | 170,000 | | | | 4.625 | | | | 11/15/22 | | | | 162,350 | |
| Cornerstone Chemical Co.(a)(b) | |
| | 60,000 | | | | 9.375 | | | | 03/15/18 | | | | 63,150 | |
| Hexion US Finance Corp./Hexion Nova Scotia Finance ULC(b) | |
| | 225,000 | | | | 8.875 | | | | 02/01/18 | | | | 233,719 | |
| SABIC Capital II BV | |
| | 200,000 | | | | 2.625 | | | | 10/03/18 | | | | 197,700 | |
| SPCM SA(a)(b) | |
| | 49,000 | | | | 6.000 | | | | 01/15/22 | | | | 51,394 | |
| Styrolution Group GmbH(b) | |
| EUR | 100,000 | | | | 7.625 | | | | 05/15/16 | | | | 144,449 | |
| | | | | | | | | | | | | | |
| | | | | | | | | | | | | 852,762 | |
| | |
| | Construction & Engineering(a)(b) – 0.1% | |
| Michael Baker International LLC/CDL Acquisition Co., Inc. | |
| $ | 150,000 | | | | 8.250 | | | | 10/15/18 | | | | 153,000 | |
| | |
| | Consumer Cyclical Services(b) – 0.4% | |
| APX Group, Inc. | |
| | 75,000 | | | | 6.375 | | | | 12/01/19 | | | | 75,938 | |
| | 155,000 | | | | 8.750 | | | | 12/01/20 | | | | 156,937 | |
| Ashtead Capital, Inc.(a) | |
| | 115,000 | | | | 6.500 | | | | 07/15/22 | | | | 122,187 | |
| First Data Corp.(a) | |
| | 200,000 | | | | 6.750 | | | | 11/01/20 | | | | 207,000 | |
| FTI Consulting, Inc. | |
| | 105,000 | | | | 6.000 | | | | 11/15/22 | | | | 106,837 | |
| Monitronics International, Inc. | |
| | 75,000 | | | | 9.125 | | | | 04/01/20 | | | | 79,688 | |
| United Rentals North America, Inc. | |
| | 90,000 | | | | 7.375 | | | | 05/15/20 | | | | 99,788 | |
| | | | | | | | | | | | | | |
| | | | | | | | | | | | | 848,375 | |
| | |
| | Consumer Noncyclical – 0.1% | |
| BAT International Finance PLC | |
| | 200,000 | | | | 1.125 | | | | 03/29/16 | | | | 200,220 | |
| | |
| | Consumer Products – Household & Leisure(b) – 0.2% | |
| Albea Beauty Holdings SA(a) | |
| $ | 150,000 | | | | 8.375 | % | | | 11/01/19 | | | | 155,895 | |
| | |
| | | | | | | | | | | | | | |
| | Corporate Obligations – (continued) | |
| | Consumer Products – Household & Leisure – (continued) | |
| Elizabeth Arden, Inc. | |
| $ | 150,000 | | | | 7.375 | % | | | 03/15/21 | | | $ | 162,750 | |
| | | | | | | | | | | | | | |
| | | | | | | | | | | | | 318,645 | |
| | |
| | | | | | | | | | | | | | |
| | Consumer Products – Non Durable(b) – 0.1% | |
| Sally Holdings LLC | | | | | |
| | 100,000 | | | | 6.875 | | | | 11/15/19 | | | | 110,000 | |
| | |
| | Diversified Financial Services – 0.4% | |
| Alphabet Holding Co., Inc.(a)(b)(e) | |
| | 177,000 | | | | 7.750 | | | | 11/01/17 | | | | 182,752 | |
| China Overseas Finance Cayman IV Ltd. | |
| | 400,000 | | | | 4.875 | | | | 02/15/17 | | | | 422,948 | |
| Henderson UK Finance PLC | |
| GBP | 100,000 | | | | 7.250 | | | | 03/24/16 | | | | 174,827 | |
| | | | | | | | | | | | | | |
| | | | | | | | | | | | | 780,527 | |
| | |
| | Energy – 0.1% | |
| Total Capital International SA(d) | |
| $ | 100,000 | | | | 0.809 | | | | 08/10/18 | | | | 100,546 | |
| Total Capital SA | |
| | 100,000 | | | | 2.125 | | | | 08/10/18 | | | | 100,601 | |
| | | | | | | | | | | | | | |
| | | | | | | | | | | | | 201,147 | |
| | |
| | Energy – Exploration & Production – 2.1% | |
| Aabar Investments PJSC | |
| EUR | 100,000 | | | | 4.000 | | | | 05/27/16 | | | | 162,264 | |
| Arch Coal, Inc.(b) | |
| $ | 65,000 | | | | 7.250 | | | | 10/01/20 | | | | 50,375 | |
| CNOOC Finance 2012 Ltd. | |
| | 300,000 | | | | 3.875 | | | | 05/02/22 | | | | 288,207 | |
| CNPC General Capital Ltd. | |
| | 400,000 | | | | 3.950 | | | | 04/19/22 | | | | 383,708 | |
| Energy XXI Gulf Coast, Inc.(a)(b) | |
| | 135,000 | | | | 7.500 | | | | 12/15/21 | | | | 141,075 | |
| Etablissements Maurel et Prom | |
| EUR | 29,400 | | | | 7.125 | | | | 07/31/14 | | | | 6,799 | |
| Forest Oil Corp.(b) | |
| $ | 190,000 | | | | 7.500 | | | | 09/15/20 | | | | 190,712 | |
| Halcon Resources Corp.(b) | |
| | 360,000 | | | | 8.875 | | | | 05/15/21 | | | | 363,600 | |
| Harvest Operations Corp. | |
| | 400,000 | | | | 2.125 | | | | 05/14/18 | | | | 390,025 | |
| Indian Oil Corp., Ltd. | |
| | 200,000 | | | | 5.750 | | | | 08/01/23 | | | | 191,556 | |
| Linn Energy LLC/Linn Energy Finance Corp.(a)(b) | |
| | 100,000 | | | | 6.250 | | | | 11/01/19 | | | | 100,875 | |
| Memorial Production Partners LP/Memorial Production Finance
Corp.(a)(b) |
|
| | 200,000 | | | | 7.625 | | | | 05/01/21 | | | | 205,500 | |
| Midstates Petroleum Co., Inc./Midstates Petroleum Co. LLC(b) | |
| | 50,000 | | | | 10.750 | | | | 10/01/20 | | | | 54,188 | |
| | 100,000 | | | | 9.250 | | | | 06/01/21 | | | | 104,500 | |
| Murray Energy Corp.(a)(b) | |
| | 105,000 | | | | 8.625 | | | | 06/15/21 | | | | 108,675 | |
| Peabody Energy Corp. | |
| | 100,000 | | | | 6.250 | | | | 11/15/21 | | | | 101,250 | |
| | |
| | |
| 12 | | The accompanying notes are an integral part of these financial statements. |
GOLDMAN SACHS MULTI-MANAGER ALTERNATIVES FUND
| | | | | | | | | | | | | | |
Principal
Amount | | | Interest
Rate | | | Maturity
Date | | | Value | |
| | | | | | | | | | | | | | |
| | Corporate Obligations – (continued) | |
| | Energy – Exploration & Production – (continued) | |
| Penn Virginia Resource Partners LP/Penn Virginia Resource
Finance Corp.(a)(b) |
|
| $ | 200,000 | | | | 6.500 | % | | | 05/15/21 | | | $ | 207,500 | |
| Plains Exploration & Production Co.(b) | |
| | 100,000 | | | | 6.875 | | | | 02/15/23 | | | | 111,250 | |
| Range Resources Corp.(b) | |
| | 280,000 | | | | 5.000 | | | | 03/15/23 | | | | 274,400 | |
| SandRidge Energy, Inc.(b) | |
| | 210,000 | | | | 7.500 | | | | 02/15/23 | | | | 212,625 | |
| Tullow Oil PLC(a)(b) | |
| | 30,000 | | | | 6.000 | | | | 11/01/20 | | | | 30,298 | |
| Walter Energy, Inc.(b) | |
| | 100,000 | | | | 9.500 | (a) | | | 10/15/19 | | | | 105,500 | |
| | 40,000 | | | | 9.875 | | | | 12/15/20 | | | | 34,700 | |
| | 125,000 | | | | 8.500 | | | | 04/15/21 | | | | 104,375 | |
| | | | | | | | | | | | | | |
| | | | | | | | | | | | | 3,923,957 | |
| | |
| | Energy – Services(a)(b) – 0.2% | |
| Hiland Partners LP/Hiland Partners Finance Corp. | |
| | 150,000 | | | | 7.250 | | | | 10/01/20 | | | | 160,688 | |
| Sea Trucks Group Ltd. | |
| | 200,000 | | | | 9.000 | | | | 03/26/18 | | | | 191,000 | |
| | | | | | | | | | | | | | |
| | | | | | | | | | | | | 351,688 | |
| | |
| | Entertainment & Leisure – 0.2% | |
| Cedar Fair LP/Canada’s Wonderland Co./Magnum Management
Corp.(b) |
|
| | 150,000 | | | | 5.250 | | | | 03/15/21 | | | | 148,125 | |
| Six Flags Entertainment Corp.(a)(b) | |
| | 200,000 | | | | 5.250 | | | | 01/15/21 | | | | 197,000 | |
| Time Warner Entertainment Co. LP | |
| | 5,000 | | | | 8.375 | | | | 07/15/33 | | | | 5,447 | |
| | | | | | | | | | | | | | |
| | | | | | | | | | | | | 350,572 | |
| | |
| | Environmental(b) – 0.1% | |
| Clean Harbors, Inc. | |
| | 244,000 | | | | 5.125 | | | | 06/01/21 | | | | 245,220 | |
| | |
| | Finance – 1.2% | |
| Ally Financial, Inc. | |
| | 80,000 | | | | 7.500 | | | | 09/15/20 | | | | 93,600 | |
| | 60,000 | | | | 8.000 | | | | 11/01/31 | | | | 71,700 | |
| CIT Group, Inc.(a) | |
| | 100,000 | | | | 5.500 | | | | 02/15/19 | | | | 107,750 | |
| Fidelity National Information Services, Inc.(b) | |
| | 215,000 | | | | 3.500 | | | | 04/15/23 | | | | 194,885 | |
| Icahn Enterprises LP/Icahn Enterprises Finance Corp.(b) | |
| | 150,000 | | | | 8.000 | | | | 01/15/18 | | | | 156,187 | |
| La Financiere Atalian SA(b) | |
| EUR | 100,000 | | | | 7.250 | | | | 01/15/20 | | | | 145,824 | |
| Nationstar Mortgage LLC/Nationstar Capital Corp.(b) | |
| $ | 150,000 | | | | 6.500 | | | | 08/01/18 | | | | 152,438 | |
| | 75,000 | | | | 6.500 | | | | 07/01/21 | | | | 71,250 | |
| | 75,000 | | | | 6.500 | | | | 06/01/22 | | | | 70,875 | |
| Nomura Holdings, Inc. | |
| | 500,000 | | | | 2.000 | | | | 09/13/16 | | | | 501,755 | |
| | |
| | | | | | | | | | | | | | |
| | Corporate Obligations – (continued) | |
| | Finance – (continued) | |
| Nuveen Investments, Inc.(a)(b) | |
| $ | 100,000 | | | | 9.125 | % | | | 10/15/17 | | | $ | 100,500 | |
| Opal Acquisition, Inc.(a)(b) | |
| | 120,000 | | | | 8.875 | | | | 12/15/21 | | | | 119,100 | |
| Provident Funding Associates LP/PFG Finance Corp.(a)(b) | |
| | 75,000 | | | | 6.750 | | | | 06/15/21 | | | | 74,438 | |
| TRAC Intermodal LLC/TRAC Intermodal Corp.(b) | |
| | 55,000 | | | | 11.000 | | | | 08/15/19 | | | | 62,700 | |
| USB Realty Corp.(a)(b)(d) | |
| | 300,000 | | | | 1.391 | | | | 01/15/49 | | | | 276,000 | |
| | | | | | | | | | | | | | |
| | | | | | | | | | | | | 2,199,002 | |
| | |
| | Food & Beverage – 0.6% | |
| B&G Foods, Inc.(b) | |
| | 200,000 | | | | 4.625 | | | | 06/01/21 | | | | 191,500 | |
| Carlsberg Breweries A/S | |
| GBP | 200,000 | | | | 7.250 | | | | 11/28/16 | | | | 378,188 | |
| Constellation Brands, Inc. | |
| $ | 30,000 | | | | 3.750 | | | | 05/01/21 | | | | 28,350 | |
| Hawk Acquisition Sub, Inc.(a)(b) | |
| | 275,000 | | | | 4.250 | | | | 10/15/20 | | | | 265,375 | |
| Heineken NV | |
| GBP | 70,000 | | | | 7.250 | | | | 03/10/15 | | | | 123,541 | |
| Michael Foods Holding, Inc.(a)(b)(e) | |
| $ | 100,000 | | | | 8.500 | | | | 07/15/18 | | | | 105,250 | |
| | | | | | | | | | | | | | |
| | | | | | | | | | | | | 1,092,204 | |
| | |
| | Gaming – 0.7% | |
| Ameristar Casinos, Inc.(b) | |
| | 300,000 | | | | 7.500 | | | | 04/15/21 | | | | 327,000 | |
| Chester Downs & Marina LLC(a)(b) | |
| | 135,000 | | | | 9.250 | | | | 02/01/20 | | | | 135,675 | |
| GLP Capital LP/GLP Financing II, Inc.(a)(b) | |
| | 115,000 | | | | 4.375 | | | | 11/01/18 | | | | 117,587 | |
| International Game Technology(b) | |
| | 210,000 | | | | 5.350 | | | | 10/15/23 | | | | 215,490 | |
| MGM Resorts International | |
| | 100,000 | | | | 6.625 | | | | 12/15/21 | | | | 105,375 | |
| MTR Gaming Group, Inc.(b) | |
| | 110,000 | | | | 11.500 | | | | 08/01/19 | | | | 122,375 | |
| Seneca Gaming Corp.(a)(b) | |
| | 50,000 | | | | 8.250 | | | | 12/01/18 | | | | 53,750 | |
| Shingle Springs Tribal Gaming Authority(a)(b) | |
| | 170,000 | | | | 9.750 | | | | 09/01/21 | | | | 183,175 | |
| | | | | | | | | | | | | | |
| | | | | | | | | | | | | 1,260,427 | |
| | |
| | Health Care – Medical Products(b) – 0.2% | |
| | Alere, Inc. | | | | | | | | | | | | | |
| | 100,000 | | | | 6.500 | | | | 06/15/20 | | | | 102,250 | |
| | Biomet, Inc. | | | | | | | | | | | | | |
| | 150,000 | | | | 6.500 | | | | 08/01/20 | | | | 157,500 | |
| Immucor, Inc. | |
| | 130,000 | | | | 11.125 | | | | 08/15/19 | | | | 145,925 | |
| | | | | | | | | | | | | | |
| | | | | | | | | | | | | 405,675 | |
| | |
| | |
| The accompanying notes are an integral part of these financial statements. | | 13 |
GOLDMAN SACHS MULTI-MANAGER ALTERNATIVES FUND
Schedule of Investments (continued)
December 31, 2013
| | | | | | | | | | | | | | |
Principal
Amount | | | Interest
Rate | | | Maturity
Date | | | Value | |
| | | | | | | | | | | | | | |
| | Corporate Obligations – (continued) | |
| | Health Care – Pharmaceuticals(b) – 0.0% | |
| Lantheus Medical Imaging, Inc. | |
| $ | 65,000 | | | | 9.750 | % | | | 05/15/17 | | | $ | 58,013 | |
| | |
| | Health Care – Services – 0.6% | |
| Community Health Systems, Inc.(b) | |
| | 150,000 | | | | 8.000 | | | | 11/15/19 | | | | 162,750 | |
| DaVita HealthCare Partners, Inc.(b) | |
| | 75,000 | | | | 6.625 | | | | 11/01/20 | | | | 80,625 | |
| HCA, Inc. | |
| | 310,000 | | | | 6.500 | | | | 02/15/20 | | | | 340,612 | |
| Health Management Associates, Inc.(b) | |
| | 90,000 | | | | 7.375 | | | | 01/15/20 | | | | 100,912 | |
| INC Research LLC(a)(b) | |
| | 100,000 | | | | 11.500 | | | | 07/15/19 | | | | 111,250 | |
| Tenet Healthcare Corp. | |
| | 75,000 | | | | 6.000 | (a) | | | 10/01/20 | | | | 78,563 | |
| | 195,000 | | | | 8.125 | | | | 04/01/22 | | | | 209,869 | |
| | | | | | | | | | | | | | |
| | | | | | | | | | | | | 1,084,581 | |
| | |
| | Home Construction(b) – 0.0% | |
| ServiceMaster Co. | |
| | 100,000 | | | | 7.250 | | | | 03/01/38 | | | | 74,500 | |
| | |
| | Hotels, Restaurants & Leisure(a)(b) – 0.1% | |
| Wok Acquisition Corp. | |
| | 100,000 | | | | 10.250 | | | | 06/30/20 | | | | 108,500 | |
| | |
| | Lodging(b) – 0.2% | |
| Eldorado Resorts LLC/Eldorado Capital Corp.(a) | |
| | 130,000 | | | | 8.625 | | | | 06/15/19 | | | | 138,775 | |
| Marriott International Inc. | |
| | 215,000 | | | | 3.000 | | | | 03/01/19 | | | | 215,850 | |
| MISA Investments Ltd.(a)(e) | |
| | 35,000 | | | | 8.625 | | | | 08/15/18 | | | | 36,225 | |
| | | | | | | | | | | | | | |
| | | | | | | | | | | | | 390,850 | |
| | |
| | Machinery(b) – 0.4% | |
| Boart Longyear Management Pty Ltd.(a) | |
| | 225,000 | | | | 7.000 | | | | 04/01/21 | | | | 168,750 | |
| Doosan Infracore Co., Ltd.(d) | |
| | 300,000 | | | | 3.250 | | | | 10/05/42 | | | | 292,782 | |
| Trinseo Materials Operating SCA/Trinseo Materials Finance, Inc.(a) | |
| | 175,000 | | | | 8.750 | | | | 02/01/19 | | | | 177,494 | |
| Tyco Electronics Group SA | |
| | 215,000 | | | | 2.375 | | | | 12/17/18 | | | | 212,385 | |
| | | | | | | | | | | | | | |
| | | | | | | | | | | | | 851,411 | |
| | |
| | Media – Broadcasting & Radio(b) – 0.4% | |
| Nexstar Broadcasting, Inc. | |
| | 80,000 | | | | 6.875 | | | | 11/15/20 | | | | 85,500 | |
| Sinclair Television Group, Inc. | |
| | 300,000 | | | | 5.375 | | | | 04/01/21 | | | | 295,500 | |
| Sirius XM Radio, Inc.(a) | |
| | 140,000 | | | | 4.250 | | | | 05/15/20 | | | | 132,650 | |
| Univision Communications, Inc.(a) | |
| | 200,000 | | | | 8.500 | | | | 05/15/21 | | | | 221,000 | |
| | | | | | | | | | | | | | |
| | | | | | | | | | | | | 734,650 | |
| | |
| | | | | | | | | | | | | | |
| | Corporate Obligations – (continued) | |
| | Media – Cable – 0.4% | |
| Brocade Communications Systems, Inc.(a)(b) | |
| $ | 50,000 | | | | 4.625 | % | | | 01/15/23 | | | $ | 46,250 | |
| Cablevision Systems Corp. | |
| | 100,000 | | | | 7.750 | | | | 04/15/18 | | | | 111,625 | |
| CCO Holdings LLC/CCO Holdings Capital Corp.(b) | |
| | 200,000 | | | | 5.125 | | | | 02/15/23 | | | | 185,500 | |
| Cequel Communications Holdings I LLC/Cequel Capital Corp.(a)(b) | |
| | 300,000 | | | | 6.375 | | | | 09/15/20 | | | | 306,750 | |
| Midcontinent Communications & Midcontinent Finance Corp.(a)(b) | |
| | 200,000 | | | | 6.250 | | | | 08/01/21 | | | | 202,000 | |
| | | | | | | | | | | | | | |
| | | | | | | | | | | | | 852,125 | |
| | |
| | Media – Non Cable – 1.2% | |
| Affinion Group, Inc.(b) | |
| | 105,000 | | | | 7.875 | | | | 12/15/18 | | | | 94,500 | |
| Gannett Co., Inc.(a)(b) | |
| | 200,000 | | | | 5.125 | | | | 10/15/19 | | | | 208,250 | |
| InterActiveCorp.(a)(b) | |
| | 220,000 | | | | 4.875 | | | | 11/30/18 | | | | 224,950 | |
| Liberty Interactive LLC | |
| | 15,000 | | | | 8.250 | | | | 02/01/30 | | | | 15,975 | |
| | 21,000 | | | | 1.000 | (a)(b) | | | 09/30/43 | | | | 22,155 | |
| Nielsen Finance LLC/Nielsen Finance Co.(b) | |
| | 100,000 | | | | 4.500 | | | | 10/01/20 | | | | 97,500 | |
| Priceline.com, Inc. | |
| | 138,000 | | | | 1.000 | | | | 03/15/18 | | | | 190,267 | |
| Reed Elsevier Investments PLC | |
| GBP | 350,000 | | | | 5.625 | | | | 10/20/16 | | | | 635,924 | |
| The McClatchy Co.(b) | |
| $ | 30,000 | | | | 9.000 | | | | 12/15/22 | | | | 32,925 | |
| VeriSign, Inc.(b) | |
| | 100,000 | | | | 4.625 | | | | 05/01/23 | | | | 95,250 | |
| | WPP PLC | | | | | | | | | | | | | |
| GBP | 370,000 | | | | 6.000 | | | | 04/04/17 | | | | 680,276 | |
| | | | | | | | | | | | | | |
| | | | | | | | | | | | | 2,297,972 | |
| | |
| | Metals & Mining – 0.4% | |
| Commercial Metals Co.(b) | |
| $ | 250,000 | | | | 4.875 | | | | 05/15/23 | | | | 231,875 | |
| FMG Resources (August 2006) Pty Ltd.(a)(b) | |
| | 50,000 | | | | 6.875 | | | | 02/01/18 | | | | 52,690 | |
| Glencore Funding LLC(d) | |
| | 250,000 | | | | 1.396 | | | | 05/27/16 | | | | 248,876 | |
| Hecla Mining Co.(a)(b) | |
| | 50,000 | | | | 6.875 | | | | 05/01/21 | | | | 48,000 | |
| IAMGOLD Corp.(a)(b) | |
| | 300,000 | | | | 6.750 | | | | 10/01/20 | | | | 256,500 | |
| | | | | | | | | | | | | | |
| | | | | | | | | | | | | 837,941 | |
| | |
| | Noncaptive – Financial – 0.1% | |
| General Electric Capital Corp.(d) | |
| | 150,000 | | | | 0.894 | | | | 07/12/16 | | | | 151,052 | |
| | PHH Corp.(b) | | | | | | | | | | | | | |
| | 85,000 | | | | 6.375 | | | | 08/15/21 | | | | 85,213 | |
| | | | | | | | | | | | | | |
| | | | | | | | | | | | | 236,265 | |
| | |
| | |
| 14 | | The accompanying notes are an integral part of these financial statements. |
GOLDMAN SACHS MULTI-MANAGER ALTERNATIVES FUND
| | | | | | | | | | | | | | |
Principal
Amount | | | Interest
Rate | | | Maturity
Date | | | Value | |
| | | | | | | | | | | | | | |
| | Corporate Obligations – (continued) | |
| | Packaging(b) – 0.3% | |
| Ardagh Packaging Finance PLC | |
| EUR | 100,000 | | | | 7.375 | % | | | 10/15/17 | | | $ | 147,372 | |
| Ball Corp. | |
| $ | 150,000 | | | | 5.000 | | | | 03/15/22 | | | | 148,125 | |
| Beverage Packaging Holdings Luxembourg II SA/Beverage
Packaging Holdings II Is(a) |
|
| | 145,000 | | | | 5.625 | | | | 12/15/16 | | | | 147,900 | |
| Reynolds Group Issuer, Inc. | |
| | 100,000 | | | | 5.750 | | | | 10/15/20 | | | | 102,000 | |
| | | | | | | | | | | | | | |
| | | | | | | | | | | | | 545,397 | |
| | |
| | Paper(a)(b) – 0.1% | |
| Georgia-Pacific LLC | |
| | 200,000 | | | | 3.734 | | | | 07/15/23 | | | | 192,497 | |
| Sappi Papier Holding GmbH | |
| | 50,000 | | | | 7.750 | | | | 07/15/17 | | | | 54,437 | |
| | | | | | | | | | | | | | |
| | | | | | | | | | | | | 246,934 | |
| | |
| | Pharmaceuticals(a)(b) – 0.0% | |
| Salix Pharmaceuticals Ltd. | |
| | 70,000 | | | | 6.000 | | | | 01/15/21 | | | | 71,750 | |
| | |
| | Pipelines(a) – 0.6% | |
| Atlas Pipeline Partners LP/Atlas Pipeline Finance Corp.(b) | |
| | 100,000 | | | | 4.750 | | | | 11/15/21 | | | | 91,500 | |
| Gibson Energy, Inc.(b) | |
| | 59,000 | | | | 6.750 | | | | 07/15/21 | | | | 62,540 | |
| Kinder Morgan, Inc.(b) | |
| | 200,000 | | | | 5.000 | | | | 02/15/21 | | | | 196,000 | |
| Rockies Express Pipeline LLC | |
| | 15,000 | | | | 6.000 | | | | 01/15/19 | | | | 13,875 | |
| | 260,000 | | | | 5.625 | | | | 04/15/20 | | | | 228,800 | |
| Sabine Pass Liquefaction LLC | |
| | 200,000 | | | | 5.625 | | | | 02/01/21 | | | | 195,750 | |
| | 100,000 | | | | 6.250 | (b) | | | 03/15/22 | | | | 99,250 | |
| | 250,000 | | | | 5.625 | | | | 04/15/23 | | | | 233,750 | |
| SemGroup LP(b) | |
| | 95,000 | | | | 7.500 | | | | 06/15/21 | | | | 100,462 | |
| | | | | | | | | | | | | | |
| | | | | | | | | | | | | 1,221,927 | |
| | |
| | Property Insurance(a)(b) – 0.2% | |
| A-S Co.-Issuer Subsidiary, Inc. / A-S Merger Sub LLC | |
| | 85,000 | | | | 7.875 | | | | 12/15/20 | | | | 89,463 | |
| Hockey Merger Sub 2, Inc. | |
| | 200,000 | | | | 7.875 | | | | 10/01/21 | | | | 207,000 | |
| | | | | | | | | | | | | | |
| | | | | | | | | | | | | 296,463 | |
| | |
| | Real Estate – 0.5% | |
| CB Richard Ellis Services, Inc.(b) | |
| | 25,000 | | | | 5.000 | | | | 03/15/23 | | | | 23,937 | |
| Country Garden Holdings Co., Ltd. | |
| | 100,000 | | | | 11.750 | | | | 09/10/14 | | | | 105,650 | |
| Greentown China Holdings Ltd.(b) | |
| | 200,000 | | | | 8.000 | | | | 03/24/19 | | | | 204,000 | |
| Host Hotels & Resorts LP(b) | |
| | 100,000 | | | | 3.750 | | | | 10/15/23 | | | | 92,854 | |
| | |
| | | | | | | | | | | | | | |
| | Corporate Obligations – (continued) | |
| | Real Estate – (continued) | |
| Intu Properties PLC | |
| GBP | 100,000 | | | | 2.500 | % | | | 10/04/18 | | | $ | 172,798 | |
| RHP Hotel Properties LP/RHP Finance Corp.(b) | |
| $ | 120,000 | | | | 5.000 | | | | 04/15/21 | | | | 118,500 | |
| Sabra Health Care LP/Sabra Capital Corp.(b) | |
| | 150,000 | | | | 5.375 | | | | 06/01/23 | | | | 145,875 | |
| | | | | | | | | | | | | | |
| | | | | | | | | | | | | 863,614 | |
| | |
| | Retailers – 0.9% | |
| Burlington Coat Factory Warehouse Corp.(b) | |
| | 55,000 | | | | 10.000 | | | | 02/15/19 | | | | 61,738 | |
| Ferrellgas LP/Ferrellgas Finance Corp.(b) | |
| | 200,000 | | | | 6.500 | | | | 05/01/21 | | | | 203,750 | |
| | 100,000 | | | | 6.750 | (a) | | | 01/15/22 | | | | 101,500 | |
| Grupo Famsa SAB de CV(a)(b) | |
| | 60,000 | | | | 7.250 | | | | 06/01/20 | | | | 60,288 | |
| JC Penney Corp., Inc. | |
| | 40,000 | | | | 7.950 | | | | 04/01/17 | | | | 34,800 | |
| | 145,000 | | | | 5.650 | | | | 06/01/20 | | | | 114,550 | |
| L Brands, Inc. | |
| | 100,000 | | | | 5.625 | | | | 02/15/22 | | | | 102,250 | |
| New Albertsons, Inc. | |
| | 15,000 | | | | 7.750 | | | | 06/15/26 | | | | 12,150 | |
| | 20,000 | | | | 7.450 | | | | 08/01/29 | | | | 16,350 | |
| | 140,000 | | | | 8.000 | | | | 05/01/31 | | | | 114,800 | |
| Next PLC | |
| GBP | 200,000 | | | | 5.875 | | | | 10/12/16 | | | | 365,919 | |
| Roundy’s Supermarkets, Inc.(a)(b) | |
| $ | 55,000 | | | | 10.250 | | | | 12/15/20 | | | | 55,825 | |
| Supervalu, Inc.(b) | |
| | 115,000 | | | | 6.750 | | | | 06/01/21 | | | | 113,563 | |
| The Bon-Ton Department Stores, Inc.(b) | |
| | 40,000 | | | | 8.000 | | | | 06/15/21 | | | | 40,100 | |
| The Pantry, Inc.(b) | |
| | 215,000 | | | | 8.375 | | | | 08/01/20 | | | | 228,437 | |
| Toys R US, Inc.(b) | |
| | 65,000 | | | | 10.375 | | | | 08/15/17 | | | | 56,550 | |
| | 20,000 | | | | 7.375 | | | | 10/15/18 | | | | 14,850 | |
| | | | | | | | | | | | | | |
| | | | | | | | | | | | | 1,697,420 | |
| | |
| | Technology – Hardware – 0.4% | |
| Advanced Micro Devices, Inc.(b) | |
| | 200,000 | | | | 7.750 | | | | 08/01/20 | | | | 198,000 | |
| | 185,000 | | | | 7.500 | | | | 08/15/22 | | | | 180,375 | |
| Amkor Technology, Inc.(b) | |
| | 190,000 | | | | 6.375 | | | | 10/01/22 | | | | 195,225 | |
| Lam Research Corp. | |
| | 100,000 | | | | 0.500 | | | | 05/15/16 | | | | 113,875 | |
| NCR Escrow Corp.(a)(b) | |
| | 25,000 | | | | 6.375 | | | | 12/15/23 | | | | 25,500 | |
| SanDisk Corp.(a) | |
| | 50,000 | | | | 0.500 | | | | 10/15/20 | | | | 49,418 | |
| | | | | | | | | | | | | | |
| | | | | | | | | | | | | 762,393 | |
| | |
| | |
| The accompanying notes are an integral part of these financial statements. | | 15 |
GOLDMAN SACHS MULTI-MANAGER ALTERNATIVES FUND
Schedule of Investments (continued)
December 31, 2013
| | | | | | | | | | | | | | |
Principal
Amount | | | Interest
Rate | | | Maturity
Date | | | Value | |
| | | | | | | | | | | | | | |
| | Corporate Obligations – (continued) | |
| | Technology – Software/Services – 0.4% | |
| ACI Worldwide, Inc.(a)(b) | |
| $ | 45,000 | | | | 6.375 | % | | | 08/15/20 | | | $ | 47,025 | |
| Electronic Arts, Inc. | |
| | 11,000 | | | | 0.750 | | | | 07/15/16 | | | | 11,701 | |
| Equinix, Inc.(b) | |
| | 50,000 | | | | 4.875 | | | | 04/01/20 | | | | 49,750 | |
| iGATE Corp.(b) | |
| | 100,000 | | | | 9.000 | | | | 05/01/16 | | | | 106,250 | |
| MModal, Inc.(a)(b) | |
| | 60,000 | | | | 10.750 | | | | 08/15/20 | | | | 22,200 | |
| Nuance Communications, Inc.(a)(b) | |
| | 200,000 | | | | 5.375 | | | | 08/15/20 | | | | 194,000 | |
| Oracle Corp. | |
| | 100,000 | | | | 3.625 | | | | 07/15/23 | | | | 98,553 | |
| Syniverse Holdings, Inc.(b) | |
| | 100,000 | | | | 9.125 | | | | 01/15/19 | | | | 109,250 | |
| Yahoo!, Inc.(a)(f) | |
| | 100,000 | | | | 0.000 | | | | 12/01/18 | | | | 103,313 | |
| | | | | | | | | | | | | | |
| | | | | | | | | | | | | 742,042 | |
| | |
| | Telecommunications(a)(b) – 0.1% | |
| tw telecom holdings, Inc. | |
| | 125,000 | | | | 5.375 | | | | 10/01/22 | | | | 122,500 | |
| | |
| | Telecommunications – Cellular(a) – 0.3% | |
| Sable International Finance Ltd.(b) | |
| | 50,000 | | | | 7.750 | | | | 02/15/17 | | | | 51,500 | |
| | 100,000 | | | | 8.750 | | | | 02/01/20 | | | | 112,750 | |
| Softbank Corp. | |
| | 337,000 | | | | 4.500 | | | | 04/15/20 | | | | 328,452 | |
| Wind Acquisition Finance SA(b) | |
| | 150,000 | | | | 7.250 | | | | 02/15/18 | | | | 157,125 | |
| | | | | | | | | | | | | | |
| | | | | | | | | | | | | 649,827 | |
| | |
| | Telecommunications – Satellites(a)(b) – 0.2% | |
| Intelsat Luxembourg SA | |
| | 200,000 | | | | 7.750 | | | | 06/01/21 | | | | 214,500 | |
| Unitymedia Hessen GmbH & Co. KG | |
| | 150,000 | | | | 5.500 | | | | 01/15/23 | | | | 145,125 | |
| | | | | | | | | | | | | | |
| | | | | | | | | | | | | 359,625 | |
| | |
| | Textiles & Apparel(a)(b) – 0.2% | |
| Burlington Holdings LLC/Burlington Holding Finance, Inc.(e) | |
| | 82,000 | | | | 9.000 | | | | 02/15/18 | | | | 83,845 | |
| Quiksilver, Inc. | |
| | 60,000 | | | | 7.875 | | | | 08/01/18 | | | | 65,100 | |
| The William Carter Co. | |
| | 185,000 | | | | 5.250 | | | | 08/15/21 | | | | 187,313 | |
| | | | | | | | | | | | | | |
| | | | | | | | | | | | | 336,258 | |
| | |
| | Tobacco – 0.1% | |
| Imperial Tobacco Finance PLC | |
| EUR | 150,000 | | | | 8.375 | | | | 02/17/16 | | | | 237,379 | |
| | |
| | Transportation – 0.4% | |
| Bluewater Holding BV(a)(b) | |
| $ | 200,000 | | | | 10.000 | | | | 12/10/19 | | | | 200,500 | |
| CHC Helicopter SA(b) | |
| | 110,000 | | | | 9.375 | | | | 06/01/21 | | | | 112,200 | |
| | |
| | | | | | | | | | | | | | |
| | Corporate Obligations – (continued) | |
| | Transportation – (continued) | |
| DryShips, Inc. | |
| $ | 50,000 | | | | 5.000 | % | | | 12/01/14 | | | $ | 50,531 | |
| Navistar International Corp.(b) | |
| | 100,000 | | | | 8.250 | | | | 11/01/21 | | | | 103,250 | |
| Syncreon Group BV/Syncreon Global Finance US, Inc.(a)(b) | |
| | 200,000 | | | | 8.625 | | | | 11/01/21 | | | | 197,496 | |
| Watco Cos LLC/Watco Finance Corp.(a)(b) | |
| | 100,000 | | | | 6.375 | | | | 04/01/23 | | | | 99,500 | |
| | | | | | | | | | | | | | |
| | | | | | | | | | | | | 763,477 | |
| | |
| | Utilities – Distribution – 0.2% | |
| Sabine Pass LNG LP | |
| | 250,000 | | | | 7.500 | | | | 11/30/16 | | | | 282,500 | |
| Suburban Propane Partners LP/Suburban Energy Finance Corp.(b) | |
| | 105,000 | | | | 7.375 | | | | 03/15/20 | | | | 112,613 | |
| | | | | | | | | | | | | | |
| | | | | | | | | | | | | 395,113 | |
| | |
| | Utilities – Electric – 0.6% | |
| Calpine Corp.(a)(b) | |
| | 133,000 | | | | 7.500 | | | | 02/15/21 | | | | 145,635 | |
| | 31,000 | | | | 6.000 | | | | 01/15/22 | | | | 31,698 | |
| Energy Future Intermediate Holding Co. LLC/EFIH Finance, Inc.(a)(b) | |
| | 125,000 | | | | 10.000 | | | | 12/01/20 | | | | 132,812 | |
| Homer City Generation LP(b)(e) | |
| | 125,000 | | | | 8.137 | | | | 10/01/19 | | | | 130,938 | |
| Meiya Power Co., Ltd. | |
| | 200,000 | | | | 4.000 | | | | 08/19/18 | | | | 196,808 | |
| NGG Finance PLC(b)(d) | |
| GBP | 100,000 | | | | 5.625 | | | | 06/18/73 | | | | 166,847 | |
| EUR | 300,000 | | | | 4.250 | | | | 06/18/76 | | | | 418,149 | |
| | | | | | | | | | | | | | |
| | | | | | | | | | | | | 1,222,887 | |
| | |
| | Wireless Telecommunications – 0.4% | |
| Altice Financing SA(a)(b) | |
| $ | 200,000 | | | | 6.500 | | | | 01/15/22 | | | | 199,000 | |
| AT&T, Inc. | |
| | 100,000 | | | | 1.146 | (d) | | | 11/27/18 | | | | 100,762 | |
| | 105,000 | | | | 2.375 | | | | 11/27/18 | | | | 105,179 | |
| Digicel Group Ltd.(a)(b) | |
| | 200,000 | | | | 8.250 | | | | 09/30/20 | | | | 208,000 | |
| Sprint Corp.(a) | |
| | 120,000 | | | | 7.875 | | | | 09/15/23 | | | | 128,850 | |
| | | | | | | | | | | | | | |
| | | | | | | | | | | | | 741,791 | |
| | |
| | Wirelines Telecommunications – 0.3% | |
| CenturyLink, Inc. | |
| | 100,000 | | | | 5.625 | | | | 04/01/20 | | | | 102,735 | |
| | 90,000 | | | | 6.750 | | | | 12/01/23 | | | | 90,923 | |
| Cincinnati Bell, Inc.(b) | |
| | 50,000 | | | | 8.750 | | | | 03/15/18 | | | | 52,375 | |
| Verizon Communications, Inc. | |
| | 102,000 | | | | 5.150 | | | | 09/15/23 | | | | 109,173 | |
| | 165,000 | | | | 6.550 | | | | 09/15/43 | | | | 193,020 | |
| | | | | | | | | | | | | | |
| | | | | | | | | | | | | 548,226 | |
| | |
| | TOTAL CORPORATE OBLIGATIONS | |
| | (Cost $39,909,333) | | | $ | 40,259,847 | |
| | |
| | |
| 16 | | The accompanying notes are an integral part of these financial statements. |
GOLDMAN SACHS MULTI-MANAGER ALTERNATIVES FUND
| | | | | | | | | | | | | | |
Principal
Amount | | | Interest
Rate | | | Maturity
Date | | | Value | |
| | | | | | | | | | | | | | |
| | Agency Debentures(g) – 0.1% | |
| FNMA | |
| $ | 100,000 | | | | 3.150 | % | | | 12/27/27 | | | $ | 87,786 | |
| | 100,000 | | | | 1.000 | | | | 01/25/28 | | | | 90,501 | |
| | |
| | TOTAL AGENCY DEBENTURES | |
| | (Cost $183,587) | | | $ | 178,287 | |
| | |
| | | | | | | | | | | | | | |
| | Foreign Debt Obligations – 2.4% | |
| | Sovereign – 2.4% | |
| Brazil Notas do Tesouro Nacional | |
| BRL | 1,000,000 | | | | 10.000 | % | | | 01/01/21 | | | $ | 367,480 | |
| | 2,351,066 | | | | 6.000 | | | | 08/15/22 | | | | 975,350 | |
| Canada Government International Bond | |
| $ | 250,000 | | | | 0.875 | | | | 02/14/17 | | | | 250,004 | |
| Dubai DOF Sukuk Ltd. | |
| | 200,000 | | | | 4.900 | | | | 05/02/17 | | | | 212,200 | |
| Hungary Government Bond | |
| | 50,000 | | | | 4.125 | | | | 02/19/18 | | | | 50,335 | |
| New Zealand Government Bond | |
| NZD | 60,000 | | | | 3.000 | | | | 09/20/30 | | | | 49,407 | |
| Qatar Government Bond | |
| $ | 400,000 | | | | 5.750 | | | | 01/20/42 | | | | 418,000 | |
| Ras Al Khaimah United Arab Emirates | |
| | 200,000 | | | | 3.297 | | | | 10/21/18 | | | | 203,000 | |
| Republic of Chile | |
| CLP | 46,619,120 | | | | 3.000 | | | | 07/01/17 | | | | 91,546 | |
| Republic of Indonesia | |
| $ | 200,000 | | | | 6.125 | | | | 03/15/19 | | | | 212,750 | |
| Republic of Ireland | |
| EUR | 60,000 | | | | 4.500 | | | | 04/18/20 | | | | 90,257 | |
| Republic of Italy | |
| | 150,000 | | | | 4.500 | | | | 07/15/15 | | | | 216,610 | |
| | 250,000 | | | | 4.750 | | | | 05/01/17 | | | | 372,952 | |
| | 252,128 | | | | 1.700 | | | | 09/15/18 | | | | 347,905 | |
| Spain Government Bond(a) | |
| | 170,000 | | | | 4.400 | | | | 10/31/23 | | | | 238,336 | |
| United Kingdom Gilt | |
| GBP | 110,500 | | | | 2.250 | | | | 09/07/23 | | | | 171,004 | |
| | 163,000 | | | | 3.250 | | | | 01/22/44 | | | | 248,731 | |
| United Mexican States | |
| MXN | 1,400,000 | | | | 6.500 | | | | 06/10/21 | | | | 110,072 | |
| | |
| | TOTAL FOREIGN DEBT OBLIGATIONS | |
| | (Cost $4,768,318) | | | $ | 4,625,939 | |
| | |
| | | | | | | | | | | | | | |
| | Municipal Debt Obligations – 0.1% | |
| | New Jersey – 0.1% | |
| Tobacco Settlement Financing Corp. RB Series 1A | |
| $ | 210,000 | | | | 4.750 | % | | | 06/01/34 | | | $ | 148,764 | |
| | 140,000 | | | | 5.000 | | | | 06/01/41 | | | | 98,542 | |
| | |
| | TOTAL MUNICIPAL DEBT OBLIGATIONS | |
| | (Cost $293,476) | | | $ | 247,306 | |
| | |
| | | | | | | | | | | | | | |
| | U.S. Treasury Obligations – 9.6% | |
| United States Treasury Bills(f) | |
| $ | 500,000 | | | | 0.000 | % | | | 01/09/14 | | | $ | 499,999 | |
| | 500,000 | | | | 0.000 | | | | 01/16/14 | | | | 499,998 | |
| | 500,000 | | | | 0.000 | | | | 01/23/14 | | | | 499,995 | |
| | 500,000 | | | | 0.000 | | | | 01/30/14 | | | | 499,994 | |
| | 500,000 | | | | 0.000 | | | | 02/06/14 | | | | 499,991 | |
| | 1,000,000 | | | | 0.000 | | | | 03/06/14 | | | | 999,902 | |
| | 500,000 | | | | 0.000 | | | | 03/13/14 | | | | 499,958 | |
| | 700,000 | | | | 0.000 | | | | 04/03/14 | | | | 699,871 | |
| | 700,000 | | | | 0.000 | | | | 05/01/14 | | | | 699,876 | |
| United States Treasury Bond | |
| | 275,000 | | | | 4.375 | | | | 05/15/41 | | | | 298,367 | |
| United States Treasury Inflation Protected Securities | |
| | 244,642 | | | | 1.625 | | | | 01/15/15 | | | | 252,211 | |
| | 457,155 | | | | 0.625 | | | | 02/15/43 | | | | 352,581 | |
| United States Treasury Notes | |
| | 500,000 | | | | 0.250 | | | | 01/31/14 | | | | 500,040 | |
| | 500,000 | | | | 1.750 | | | | 01/31/14 | | | | 500,645 | |
| | 500,000 | | | | 1.250 | | | | 02/15/14 | | | | 500,680 | |
| | 500,000 | | | | 0.250 | | | | 02/28/14 | | | | 500,115 | |
| | 500,000 | | | | 1.875 | | | | 02/28/14 | | | | 501,405 | |
| | 1,000,000 | | | | 0.250 | | | | 03/31/14 | | | | 1,000,350 | |
| | 500,000 | | | | 1.750 | | | | 03/31/14 | | | | 501,990 | |
| | 500,000 | | | | 1.875 | | | | 04/30/14 | | | | 502,865 | |
| | 500,000 | | | | 4.750 | | | | 05/15/14 | | | | 508,510 | |
| | 500,000 | | | | 2.250 | | | | 05/31/14 | | | | 504,350 | |
| | 4,800,000 | | | | 0.750 | (h) | | | 06/15/14 | | | | 4,813,584 | |
| | 500,000 | | | | 2.625 | | | | 06/30/14 | | | | 506,230 | |
| | 350,000 | | | | 4.250 | | | | 11/15/17 | | | | 389,739 | |
| | 830,000 | | | | 1.750 | | | | 05/15/23 | | | | 748,021 | |
| | |
| | TOTAL U.S. TREASURY OBLIGATIONS | |
| | (Cost $18,374,071) | | | $ | 18,281,267 | |
| | |
| | | | | | | | | | | | | | |
| | Senior Term Loans(i) – 5.9% | |
| | Automotive – Parts – 0.0% | |
| Allison Transmission, Inc. | |
| $ | 30,901 | | | | 3.750 | % | | | 08/23/19 | | | $ | 31,046 | |
| | |
| | Chemicals – 0.4% | |
| Chromaflo Technologies Corp. | |
| | 145,000 | | | | 4.500 | | | | 11/30/19 | | | | 144,910 | |
| | 40,000 | | | | 8.250 | | | | 05/30/20 | | | | 40,200 | |
| OCI Beaumont LLC | |
| | 264,199 | | | | 6.250 | | | | 08/20/19 | | | | 266,841 | |
| Oxea Finance LLC | |
| | 70,000 | | | | 4.250 | | | | 01/15/20 | | | | 70,350 | |
| Teine Energy Ltd. | |
| | 198,500 | | | | 7.500 | | | | 05/09/19 | | | | 200,485 | |
| | | | | | | | | | | | | | |
| | | | | | | | | | | | | 722,786 | |
| | |
| | Consumer Products – Household & Leisure – 0.1% | |
| Merlin Entertainment Group | |
| | 72,168 | | | | 3.420 | | | | 06/28/19 | | | | 72,258 | |
| | |
| | |
| The accompanying notes are an integral part of these financial statements. | | 17 |
GOLDMAN SACHS MULTI-MANAGER ALTERNATIVES FUND
Schedule of Investments (continued)
December 31, 2013
| | | | | | | | | | | | | | |
Principal
Amount | | | Interest
Rate | | | Maturity
Date | | | Value | |
| | | | | | | | | | | | | | |
| | Senior Term Loans(i) – (continued) | |
| | Consumer Products – Household & Leisure – (continued) | |
| Spectrum Brands, Inc. | |
| $ | 43,135 | | | | 3.500 | % | | | 09/04/19 | | | $ | 43,167 | |
| | | | | | | | | | | | | | |
| | | | | | | | | | | | | 115,425 | |
| | |
| | Consumer Products – Industrial – 0.2% | |
| Harbor Freight Tools USA, Inc. | |
| | 149,625 | | | | 4.750 | | | | 07/26/19 | | | | 151,269 | |
| Minimax Gmbh & Co. | |
| | 199,000 | | | | 4.500 | | | | 08/14/20 | | | | 199,830 | |
| | | | | | | | | | | | | | |
| | | | | | | | | | | | | 351,099 | |
| | |
| | Diversified Manufacturing – 0.2% | |
| Manitowoc Co., Inc. | |
| | 200,000 | | | | 3.250 | | | | 11/25/20 | | | | 200,000 | |
| Rexnord LLC | |
| | 114,327 | | | | 4.000 | | | | 08/21/20 | | | | 114,564 | |
| | | | | | | | | | | | | | |
| | | | | | | | | | | | | 314,564 | |
| | |
| | Energy – 0.6% | |
| Alinta Energy U.S. Finance LLC | |
| | 107,702 | | | | 6.375 | | | | 08/13/19 | | | | 107,791 | |
| Atlas Energy LP | |
| | 29,925 | | | | 6.500 | | | | 07/31/19 | | | | 30,598 | |
| Bennu Oil & Gas LLC | |
| | 207,000 | | | | 10.250 | | | | 11/01/18 | | | | 208,552 | |
| EFS Cogen Holdings I, Inc. | |
| | 299,627 | | | | 3.750 | | | | 12/01/20 | | | | 301,500 | |
| Foresight Energy LLC | |
| | 99,750 | | | | 5.500 | | | | 08/19/20 | | | | 100,623 | |
| Pacific Drilling SA | |
| | 149,250 | | | | 4.500 | | | | 06/04/18 | | | | 150,837 | |
| Peabody Energy Corp. | |
| | 99,750 | | | | 4.250 | | | | 09/24/20 | | | | 100,329 | |
| Stallion Oilfield Services, Ltd. | |
| | 74,625 | | | | 8.000 | | | | 06/19/18 | | | | 76,117 | |
| | | | | | | | | | | | | | |
| | | | | | | | | | | | | 1,076,347 | |
| | |
| | Energy – Coal – 0.0% | |
| Walter Energy, Inc. | |
| | 50,000 | | | | 6.750 | | | | 04/02/18 | | | | 48,979 | |
| | |
| | Energy – Exploration & Production – 0.1% | |
| Bowie Resource Holdings LLC | |
| | 153,063 | | | | 6.750 | | | | 08/14/20 | | | | 153,445 | |
| Rice Energy LLC | |
| | 99,250 | | | | 8.500 | | | | 10/25/18 | | | | 100,987 | |
| | | | | | | | | | | | | | |
| | | | | | | | | | | | | 254,432 | |
| | |
| | Entertainment – 0.0% | |
| Guitar Center, Inc. | |
| | 49,738 | | | | 6.250 | | | | 04/10/17 | | | | 48,432 | |
| | |
| | Finance – 0.3% | |
| Digital Insight Corp. | |
| | 34,286 | | | | 4.750 | | | | 10/16/19 | | | | 34,286 | |
| Drillships Financing Holding, Inc. | |
| | 89,775 | | | | 5.500 | | | | 07/15/16 | | | | 90,935 | |
| | |
| | | | | | | | | | | | | | |
| | Senior Term Loans(i) – (continued) | |
| | Finance – (continued) | |
| Faenza Acquisition GmbH | |
| $ | 7,020 | | | | 4.250 | % | | | 08/20/20 | | | $ | 7,035 | |
| | 21,685 | | | | 4.250 | | | | 08/28/20 | | | | 21,730 | |
| | 71,295 | | | | 4.250 | | | | 08/31/20 | | | | 71,443 | |
| One Call Medical, Inc. | |
| | 100,000 | | | | 5.000 | | | | 11/27/20 | | | | 99,938 | |
| | 67,340 | | | | 1.000 | | | | 11/19/21 | | | | 67,761 | |
| Sears Holding Corp. | |
| | 105,000 | | | | 5.500 | | | | 06/30/18 | | | | 105,576 | |
| Walter Investment Management Corp. | |
| | 115,000 | | | | 6.750 | % | | | 12/11/20 | | | | 115,086 | |
| | | | | | | | | | | | | | |
| | | | | | | | | | | | | 613,790 | |
| | |
| | Finance Insurance – 0.1% | |
| Hub International Ltd. | |
| | 99,750 | | | | 4.750 | | | | 10/02/20 | | | | 100,872 | |
| | |
| | Food & Beverages – 0.1% | |
| Pinnacle Foods Finance LLC | |
| | 99,183 | | | | 3.250 | | | | 04/29/20 | | | | 98,991 | |
| | |
| | Gaming – 0.4% | |
| Boyd Gaming Corp. | |
| | 199,500 | | | | 4.000 | | | | 08/14/20 | | | | 199,811 | |
| Graton Economic Development Authority | |
| | 100,000 | | | | 9.000 | | | | 08/22/18 | | | | 105,417 | |
| Mashantucket (Western) Pequot Tribe | |
| | 194,361 | | | | 9.375 | | | | 06/30/20 | | | | 182,505 | |
| Mohegan Tribal Gaming Authority New | |
| | 217,000 | | | | 5.500 | | | | 11/19/19 | | | | 220,120 | |
| Shingle Springs Tribal Gaming Authority | |
| | 89,325 | | | | 6.250 | | | | 08/29/19 | | | | 89,660 | |
| | | | | | | | | | | | | | |
| | | | | | | | | | | | | 797,513 | |
| | |
| | Health Care – Medical Products – 0.1% | |
| Carestream Health, Inc. | |
| | 247,500 | | | | 5.000 | | | | 06/07/19 | | | | 251,271 | |
| | |
| | Health Care – Services – 0.3% | |
| Air Medical Group Holdings, Inc. | |
| | 250,000 | | | | 7.625 | | | | 05/31/18 | | | | 245,000 | |
| Bioscrip, Inc. | |
| | 148,125 | | | | 6.500 | | | | 07/31/20 | | | | 146,891 | |
| Sheridan Holdings, Inc. | |
| | 149,367 | | | | 4.500 | | | | 06/29/18 | | | | 149,378 | |
| | 70,000 | | | | 8.250 | | | | 12/13/21 | | | | 70,394 | |
| | | | | | | | | | | | | | |
| | | | | | | | | | | | | 611,663 | |
| | |
| | Lodging – 0.2% | |
| Four Seasons Holdings, Inc. | |
| | 299,625 | | | | 4.250 | | | | 06/27/20 | | | | 300,374 | |
| Hilton Worldwide Finance LLC | |
| | 146,053 | | | | 3.750 | | | | 10/26/20 | | | | 147,148 | |
| | | | | | | | | | | | | | |
| | | | | | | | | | | | | 447,522 | |
| | |
| | |
| 18 | | The accompanying notes are an integral part of these financial statements. |
GOLDMAN SACHS MULTI-MANAGER ALTERNATIVES FUND
| | | | | | | | | | | | | | |
Principal
Amount | | | Interest
Rate | | | Maturity
Date | | | Value | |
| | | | | | | | | | | | | | |
| | Senior Term Loans(i) – (continued) | |
| | Media – Broadcasting & Radio – 0.1% | |
| Clear Channel Communications, Inc. | |
| $ | 13,926 | | | | 3.819 | % | | | 01/29/16 | | | $ | 13,471 | |
| | 96,074 | | | | 6.919 | | | | 01/30/19 | | | | 91,631 | |
| Entravision Communications Corp. | |
| | 97,083 | | | | 3.500 | | | | 05/29/20 | | | | 95,446 | |
| | | | | | | | | | | | | | |
| | | | | | | | | | | | | 200,548 | |
| | |
| | Media – Cable – 0.0% | |
| Midcontinent Communications | |
| | 49,750 | | | | 3.500 | | | | 07/30/20 | | | | 49,775 | |
| | |
| | Media – Non Cable – 0.1% | |
| Affinion Group, Inc. | |
| | 99,741 | | | | 6.750 | | | | 10/10/16 | | | | 98,187 | |
| Media General, Inc. | |
| | 100,000 | | | | 4.250 | | | | 07/31/20 | | | | 100,938 | |
| | | | | | | | | | | | | | |
| | | | | | | | | | | | | 199,125 | |
| | |
| | Packaging – 0.1% | |
| Berry Plastics Holding Corp. | |
| | 200,000 | | | | 3.750 | | | | 01/09/21 | | | | 199,584 | |
| | |
| | Pharmaceuticals – 0.2% | |
| Aquilex Holdings LLC | |
| | 135,000 | | | | 5.000 | | | | 12/31/20 | | | | 135,338 | |
| Salix Pharmaceuticals Ltd. | |
| | 228,274 | | | | 4.250 | | | | 11/07/19 | | | | 230,486 | |
| | | | | | | | | | | | | | |
| | | | | | | | | | | | | 365,824 | |
| | |
| | Real Estate – 0.2% | |
| Hudson’s Bay Co. | |
| | 200,000 | | | | 4.750 | | | | 11/04/20 | | | | 203,076 | |
| Starwood Property Trust, Inc. | |
| | 144,636 | | | | 3.500 | | | | 04/17/20 | | | | 144,365 | |
| | | | | | | | | | | | | | |
| | | | | | | | | | | | | 347,441 | |
| | |
| | Restaurants – 0.0% | |
| ARG IH Corp. | |
| | 70,000 | | | | 5.000 | | | | 11/15/20 | | | | 70,307 | |
| | |
| | Retailers – 0.7% | |
| Albertsons LLC | |
| | 206,432 | | | | 4.750 | | | | 03/21/19 | | | | 207,377 | |
| BJ’s Wholesale Club, Inc. | |
| | 29,880 | | | | 8.500 | | | | 03/26/20 | | | | 30,441 | |
| J Crew Group, Inc. | |
| | 299,616 | | | | 4.000 | | | | 03/07/18 | | | | 301,261 | |
| Leslie’s Poolmart, Inc. | |
| | 199,495 | | | | 4.250 | | | | 10/16/19 | | | | 200,120 | |
| Otter Products LLC | |
| | 146,250 | | | | 5.250 | | | | 04/29/19 | | | | 145,519 | |
| Supervalu, Inc. | |
| | 148,461 | | | | 5.000 | | | | 03/21/19 | | | | 149,736 | |
| Toys R US – Delaware, Inc. | |
| | 74,960 | | | | 6.000 | | | | 09/01/16 | | | | 67,517 | |
| True Religion Apparel, Inc. | |
| | 100,000 | | | | 5.875 | | | | 07/30/19 | | | | 94,833 | |
| | |
| | | | | | | | | | | | | | |
| | Senior Term Loans(i) – (continued) | |
| | Retailers – (continued) | |
| Wilton Brands LLC | |
| $ | 157,895 | | | | 7.500 | % | | | 08/30/18 | | | $ | 149,605 | |
| | | | | | | | | | | | | | |
| | | | | | | | | | | | | 1,346,409 | |
| | |
| | Services Cyclical – Business Services – 0.3% | |
| Ceridian Corp. | |
| | 123,376 | | | | 4.415 | | | | 05/09/17 | | | | 123,723 | |
| Language Line LLC | |
| | 148,070 | | | | 6.250 | | | | 06/20/16 | | | | 147,699 | |
| Redtop Acquisition Ltd. | |
| | 100,000 | | | | 4.500 | | | | 12/03/20 | | | | 100,125 | |
| Tribune Co. | |
| | 85,000 | | | | 4.000 | | | | 11/12/20 | | | | 84,469 | |
| WCA Waste Systems, Inc. | |
| | 53,557 | | | | 4.000 | | | | 03/23/18 | | | | 53,523 | |
| | | | | | | | | | | | | | |
| | | | | | | | | | | | | 509,539 | |
| | |
| | Services Cyclical – Consumer Services – 0.1% | |
| Lonestar Intermediate Super Holdings LLC | |
| | 100,000 | | | | 11.000 | | | | 09/02/19 | | | | 102,875 | |
| | |
| | Technology – Hardware – 0.1% | |
| Freescale Semiconductor Corp. | |
| | 99,750 | | | | 5.000 | | | | 01/15/21 | | | | 100,782 | |
| | |
| | Technology – Software – 0.1% | |
| Activision Blizzard, Inc. | |
| | 99,750 | | | | 3.250 | | | | 10/12/20 | | | | 100,323 | |
| | |
| | Technology – Software/Services – 0.3% | |
| CompuCom Systems, Inc. | |
| | 99,500 | | | | 4.250 | | | | 05/11/20 | | | | 99,252 | |
| Ion Trading Technologies S.A.R.L. | |
| | 59,700 | | | | 4.500 | | | | 05/22/20 | | | | 60,073 | |
| | 155,000 | | | | 8.250 | | | | 05/21/21 | | | | 157,810 | |
| MModal, Inc. | |
| | 187,268 | | | | 7.750 | | | | 08/16/19 | | | | 159,646 | |
| Zayo Group LLC | |
| | 100,000 | | | | 4.000 | | | | 07/02/19 | | | | 100,023 | |
| | | | | | | | | | | | | | |
| | | | | | | | | | | | | 576,804 | |
| | |
| | Telecommunications – Internet & Data – 0.1% | |
| Level 3 Financing, Inc. | |
| | 150,000 | | | | 4.000 | | | | 01/15/20 | | | | 151,032 | |
| Vince Intermediate Holding LLC | |
| | 100,000 | | | | 6.000 | | | | 11/04/19 | | | | 100,750 | |
| | | | | | | | | | | | | | |
| | | | | | | | | | | | | 251,782 | |
| | |
| | Transportation Services – 0.1% | |
| Atlas Iron Ltd. | |
| | 79,399 | | | | 8.750 | | | | 12/07/17 | | | | 79,399 | |
| State Class Tankers II LLC | |
| | 90,000 | | | | 6.750 | | | | 06/22/20 | | | | 90,675 | |
| | | | | | | | | | | | | | |
| | | | | | | | | | | | | 170,074 | |
| | |
| | |
| The accompanying notes are an integral part of these financial statements. | | 19 |
GOLDMAN SACHS MULTI-MANAGER ALTERNATIVES FUND
Schedule of Investments (continued)
December 31, 2013
| | | | | | | | | | | | | | |
Principal
Amount | | | Interest
Rate | | | Maturity
Date | | | Value | |
| | | | | | | | | | | | | | |
| | Senior Term Loans(i) – (continued) | |
| | Utilities – 0.3% | |
| La Frontera Generation LLC | |
| $ | 186,826 | | | | 4.500 | % | | | 09/30/20 | | | $ | 188,636 | |
| Raven Power Finance LLC | |
| | 185,000 | | | | 5.250 | | | | 12/19/20 | | | | 184,538 | |
| Texas Competitive Electric Holdings Co. | |
| | 425,000 | | | | 3.730 | | | | 10/10/14 | | | | 300,369 | |
| | | | | | | | | | | | | | |
| | | | | | | | | | | | | 673,543 | |
| | |
| | TOTAL SENIOR TERM LOANS | |
| | (Cost $11,095,907) | | | $ | 11,149,467 | |
| | |
| | | | | | | | |
| Shares | | | Description | | Value | |
| | | | | | | | |
| | Preferred Stocks – 0.3% | |
| | Consumer Finance – 0.3% | |
| | 350 | | | Ally Financial, Inc. | | $ | 334,283 | |
| | 7,100 | | | Citigroup, Inc. | | | 179,736 | |
| | |
| | TOTAL PREFERRED STOCKS – 0.3% | |
| | (Cost $521,495) | | $ | 514,019 | |
| | |
| | | | | | | | | | | | |
Notional
Amount | | Exercise
Rate | | | Expiration
Date | | | Value | |
| | | | | | | | | | | | |
| Options Purchased – 0.3% | |
| Cross Currency Options | |
| Barclays Bank PLC | | | | | | | | | | | | |
| Put CAD 198,720 | | | | | | | | | | | | |
| Call NZD 230,000 | | | 0.864 | | | | 02/20/14 | | | $ | 3,619 | |
Barclays Bank PLC | | | | | |
| Put EUR 10,500 | | | | | | | | | | | | |
| Call NOK 82,084 | | | 8.243/7.910(j) | | | | 04/15/14 | | | | — | |
Barclays Bank PLC | | | | | |
| Put EUR 15,000 | | | | | | | | | | | | |
| Call GBP 12,225 | | | 0.769 | (j) | | | 10/23/14 | | | | 15,815 | |
| Barclays Bank PLC | | | | | | | | | | | | |
| Put EUR 10,500 | | | | | | | | | | | | |
| Call GBP 8,673 | | | 0.879/0.825(j) | | | | 10/23/14 | | | | 153 | |
| Barclays Bank PLC | | | | | | | | | | | | |
| Put EUR 618,250 | | | | | | | | | | | | |
| Call AUD 878,842 | | | 1.422 | | | | 05/02/14 | | | | 1,322 | |
| Barclays Bank PLC | | | | | | | | | | | | |
| Put NZD 230,000 | | | | | | | | | | | | |
| Call CAD 198,720 | | | 0.864 | | | | 02/20/14 | | | | 1,699 | |
Credit Suisse International (London) | | | | | |
| Put CAD 560,200 | | | | | | | | | | | | |
| Call EUR 400,000 | | | 1.401 | | | | 01/15/14 | | | | 23,312 | |
Credit Suisse International (London) | | | | | |
| Put EUR 400,000 | | | | | | | | | | | | |
| Call CAD 560,200 | | | 1.401 | | | | 01/15/14 | | | | 75 | |
Deutsche Bank Securities, Inc. | | | | | |
| Put EUR 10,500 | | | | | | | | | | | | |
| Call NOK 81,900 | | | 8.240/7.920(j) | | | | 04/08/14 | | | | — | |
| |
| | | | | | | | | | | | | | |
| | Options Purchased – (continued) | |
| | Cross Currency Options – (continued) | | | | | | | | | |
| Deutsche Bank Securities, Inc. | | | | | |
| | Put EUR 11,000 | | | | | | | | | | | | | |
| | Call GBP 8,916 | | | | 0.811 | | | | 04/29/14 | | | $ | 104 | |
| Deutsche Bank Securities, Inc. | | | | | |
| | Put EUR 10,000 | | | | | | | | | | | | | |
| | Call MXN 171,250 | | | | 18.310 | (j) | | | 03/28/14 | | | | 3,142 | |
| Deutsche Bank Securities, Inc. | | | | | |
| | Put EUR 10,000 | | | | | | | | | | | | | |
| | Call MXN 171,500 | | | | 18.355 | (j) | | | 03/31/14 | | | | 3,489 | |
| Merrill Lynch International Bank Ltd. | | | | | |
| | Put EUR 11,000 | | | | | | | | | | | | | |
| | Call GBP 8,938 | | | | 0.758 | (j) | | | 04/04/14 | | | | 14,582 | |
| | |
| | Currency Options | |
| Bank of America Securities LLC | | | | | |
| | Put SEK 2,032,000 | | | | | | | | | | | | | |
| | Call USD 317,500 | | | | 6.400 | | | | 01/20/14 | | | | 4,394 | |
| Bank of America Securities LLC | | | | | |
| | Put USD 317,500 | | | | | | | | | | | | | |
| | Call SEK 2,032,000 | | | | 6.400 | | | | 01/20/14 | | | | 2,271 | |
| | Barclays Bank PLC | | | | | | | | | | | | | |
| | Put CAD 430,018 | | | | | | | | | | | | | |
| | Call USD 411,500 | | | | 1.045 | | | | 05/02/14 | | | | 11,168 | |
| | Barclays Bank PLC | | | | | | | | | | | | | |
| | Put USD 411,500 | | | | | | | | | | | | | |
| | Call CAD 430,018 | | | | 1.045 | | | | 05/02/14 | | | | 2,976 | |
| | Barclays Bank PLC | | | | | | | | | | | | | |
| | Put USD 273,500 | | | | | | | | | | | | | |
| | Call MXN 3,437,895 | | | | 12.570 | | | | 03/28/14 | | | | 1,401 | |
| Credit Suisse International (London) | | | | | |
| | Put EUR 16,000 | | | | | | | | | | | | | |
| | Call USD 20,960 | | | | 1.303 | (j) | | | 07/17/14 | | | | 21,982 | |
| Deutsche Bank Securities, Inc. | | | | | |
| | Put EUR 21,000 | | | | | | | | | | | | | |
| | Call USD 27,384 | | | | 1.203 | (j) | | | 04/11/14 | | | | 28,331 | |
| Deutsche Bank Securities, Inc. | | | | | |
| | Put CAD 449,792 | | | | | | | | | | | | | |
| | Call USD 431,000 | | | | 1.044 | | | | 05/05/14 | | | | 12,177 | |
| Deutsche Bank Securities, Inc. | | | | | |
| | Put JPY 12,000 | | | | | | | | | | | | | |
| | Call USD 1,316,400 | | | | 120.100 | (j) | | | 11/10/14 | | | | 9,691 | |
| Deutsche Bank Securities, Inc. | | | | | | | | | |
| | Put USD 431,000 | | | | | | | | | | | | | |
| | Call CAD 449,792 | | | | 1.044 | | | | 05/05/14 | | | | 2,999 | |
| Deutsche Bank Securities, Inc. | | | | | |
| | EUR/NOK and EUR/GBP Dual Currency Put | |
| | 17,500 | | | | 8.090/0.825(j) | | | | 05/14/14 | | | | 2,346 | |
| | | | | | | | | | | | | | |
| | |
| | Interest Rate Swaptions | |
| Barclays Bank PLC Call – OTC – USD 3 month LIBOR Strike
Price 1.830% |
|
| | 2,300,000 | | | | 1.830 | % | | | 05/21/14 | | | | 36,856 | |
| Barclays Bank PLC Call – OTC – GBP 6 month BP Strike Price
3.818% |
|
| | 729,500 | | | | 3.818 | | | | 09/26/28 | | | | 64,820 | |
| | |
| | |
| 20 | | The accompanying notes are an integral part of these financial statements. |
GOLDMAN SACHS MULTI-MANAGER ALTERNATIVES FUND
| | | | | | | | | | | | | | |
Notional
Amount | | | Exercise
Rate | | | Expiration
Date | | | Value | |
| | | | | | | | | | | | | | |
| | Options Purchased – (continued) | |
| | Interest Rate Swaptions – (continued) | |
| Credit Suisse International (London) Put – OTC – EUR 6 month
EURO Strike Price 2.050% |
|
| $ | 364,500 | | | | 2.050 | | | | 09/30/14 | | | $ | 4,356 | |
| Credit Suisse International (London) Call – OTC – USD 3 month
LIBOR Strike Price 4.500% |
|
| | 182,500 | | | | 4.500 | | | | 09/25/23 | | | | 17,300 | |
| Credit Suisse International (London) Call – OTC – USD 3 month
LIBOR Strike Price 3.500% |
|
| | 600,000 | | | | 3.500 | | | | 04/15/14 | | | | 6,378 | |
| Credit Suisse International (London) Call – OTC – USD 3 month
LIBOR Strike Price 1.000% |
|
| | 1,821,500 | | | | 1.000 | | | | 10/02/14 | | | | 6,993 | |
| Credit Suisse International (London) Call – OTC – JPY 6 month
JYOR Strike Price 0.823% |
|
| | 28,500,000 | | | | 0.823 | | | | 12/10/14 | | | | 2,485 | |
| Deutsche Bank Securities, Inc. Put – OTC – EUR 6 month EURO
Strike Price 0.750% |
|
| | 1,440,000 | | | | 0.750 | | | | 10/14/14 | | | | 5,860 | |
| Deutsche Bank Securities, Inc. Put – OTC – USD 3 month
LIBOR Strike Price 4.660% |
|
| | 365,000 | | | | 4.660 | | | | 09/26/23 | | | | 14,842 | |
| Deutsche Bank Securities, Inc. Call – OTC – USD 3 month
LIBOR Strike Price 4.660% |
|
| | 365,000 | | | | 4.660 | | | | 09/26/23 | | | | 11,060 | |
| Deutsche Bank Securities, Inc. Call – OTC – USD 3 month
LIBOR Strike Price 1.000% |
|
| | 3,455,000 | | | | 1.000 | % | | | 09/24/14 | | | | 12,403 | |
| Deutsche Bank Securities, Inc. Call – OTC – KRW 3 month
KWCDC Strike Price 3.050% |
|
| | 483,724,500 | | | | 3.050 | | | | 10/13/14 | | | | 1,513 | |
| Deutsche Bank Securities, Inc. Call – OTC – GBP 6 month BP
Strike Price 3.630% |
|
| | 1,100,000 | | | | 3.630 | | | | 11/21/16 | | | | 101,382 | |
| Deutsche Bank Securities, Inc. Call – OTC – GBP 6 month BP
Strike Price 3.795% |
|
| | 182,500 | | | | 3.795 | | | | 09/26/28 | | | | 16,431 | |
| Deutsche Bank Securities, Inc. Call – OTC – GBP 6 month BP
Strike Price 3.795% |
|
| | 547,000 | | | | 3.795 | | | | 09/26/28 | | | | 49,247 | |
| Morgan Stanley & Co. Call – OTC – USD 3 month LIBOR Strike
Price 5.420% |
|
| | 243,500 | | | | 5.420 | | | | 11/19/20 | | | | 15,621 | |
| | |
| | | | | | | | | | | | | | |
| | | | | | | | | | | | | | |
| Contracts | | | Exercise
Rate | | | Expiration
Date | | | Value | |
| | |
| | Options on Futures | |
| Deutsche Bank Securities, Inc. Put – 5 Year U.S. Treasury Notes
Futures Strike Price 120% |
|
| | 10 | | | | 120.000 | | | | 02/21/14 | | | | 9,453 | |
| | |
| | TOTAL OPTIONS PURCHASED – 0.3% | |
| | (Cost $472,988) | | | $ | 544,048 | |
| | |
| | | | | | |
Shares | | Distribution
Rate | | Value | |
| Investment Company(d) – 28.6% | | | | |
SSgA U.S. Government Money Market Fund | |
| 54,510,443 | | 0.000% | | $ | 54,510,443 | |
| (Cost $54,510,443) | | | | |
| |
| TOTAL INVESTMENTS – 96.9% | |
| (Cost $179,007,691) | | $ | 184,726,548 | |
| |
| OTHER ASSETS IN EXCESS OF LIABILITIES – 3.1% | | | 5,930,331 | |
| |
| NET ASSETS – 100.0% | | $ | 190,656,879 | |
| |
| | |
| The percentage shown for each investment category reflects the value of investments in that category as a percentage of net assets. |
* | | Non-income producing security. |
(a) | | Exempt from registration under Rule 144A of the Securities Act of 1933. Under procedures approved by the Board of Trustees, such securities have been determined to be liquid by the investment adviser and may be resold, normally to qualified institutional buyers in transactions exempt from registration. Total market value of Rule 144A securities amounts to $14,139,312, which represents approximately 7.4% of net assets as of December 31, 2013. |
(b) | | Security with “Call” features with resetting interest rates. Maturity dates disclosed are the final maturity dates. |
(c) | | Security with “Put” features and resetting interest rates. Maturity dates disclosed are the puttable dates. Interest rate disclosed is that which is in effect at December 31, 2013. |
(d) | | Variable rate security. Interest rate or distribution rate disclosed is that which is in effect at December 31, 2013. |
(e) | | Pay-in-kind securities. |
(f) | | Issued with a zero coupon. Income is recognized through the accretion of discount. |
(g) | | Coupon increases periodically based upon a predetermined schedule. Stated interest rate in effect at December 31, 2013. |
(h) | | A portion of this security is segregated as collateral for initial margin requirements on swaps transactions. |
(i) | | Senior Term Loans often require prepayments from excess cash flows or permit the borrower to repay at its election. The degree to which borrowers repay, whether as a contractual requirement or at their election, cannot be predicted with accuracy. As a result, the actual remaining maturity may be substantially less than the stated maturities shown. The stated interest rate represents the weighted average interest rate of all contracts within the senior loan facility at December 31, 2013. Senior Term Loans typically have rates of interest which are predetermined either daily, monthly, quarterly or semi-annually by reference to a base lending rate, plus a premium. These base lending rates are primarily the London-Interbank Offered Rate (“LIBOR”), and secondarily the prime rate offered by one or more major United States banks (the “Prime Rate”) and the certificate of deposit (“CD”) rate or other base lending rates used by commercial lenders. |
(j) | | Represents barrier rates. |
| | |
| The accompanying notes are an integral part of these financial statements. | | 21 |
GOLDMAN SACHS MULTI-MANAGER ALTERNATIVES FUND
Schedule of Investments (continued)
December 31, 2013
| | |
|
Currency Abbreviations: |
AUD | | —Australian Dollar |
BGN | | —New Bulgarian Lev |
BRL | | —Brazilian Real |
CAD | | —Canadian Dollar |
CHF | | —Swiss Franc |
CLP | | —Chilean Peso |
CZK | | —Czech Koruna |
EUR | | —Euro |
GBP | | —British Pound |
HUF | | —Hungarian Forint |
JPY | | —Japanese Yen |
KRW | | —South Korean Won |
MXN | | —Mexican Peso |
NOK | | —Norwegian Krone |
NZD | | —New Zealand Dollar |
PHP | | —Philippine Peso |
PLN | | —Polish Zloty |
SEK | | —Swedish Krona |
ZAR | | —South African Rand |
| | |
Investment Abbreviations: |
ADR | | —American Depositary Receipt |
AUDOR | | —Australian Dollar Offered Rate |
BP | | —British Pound Offered Rate |
CDOR | | —Canadian Dollar Offered Rate |
EURO | | —Euro Offered Rate |
FNMA | | —Federal National Mortgage Association |
JIBAR | | —Johannesburg Interbank Agreed Rate |
JYOR | | —Japanese Yen Offered Rate |
KWCDC | | —South Korean Won Certificate of Deposit |
LIBOR | | —London Interbank Offered Rate |
NIBOR | | —Norwegian Interbank Offered Rate |
NZDOR | | —New Zealand Dollar Offered Rate |
OTC | | —Over the Counter |
RB | | —Revenue Bond |
SPA | | —Stand-by Purchase Agreement |
STIBOR | | —Stockholm Interbank Offered Rate |
TIIE | | —La Tasa de Interbank Equilibrium Interest Rate |
|
|
| ADDITIONAL INVESTMENT INFORMATION |
UNFUNDED LOAN COMMITMENTS — At December 31, 2013, the Fund had unfunded loan commitments which could be extended at the option of the borrowers, pursuant to the following loan agreements:
| | | | | | | | | | | | |
| Borrower | | Principal
Amount | | | Current
Value | | | Unrealized
Gain (Loss) | |
Alinta Energy Finance Pty Ltd., due 08/13/18 | | $ | 7,063 | | | $ | 7,069 | | | $ | 6 | |
FORWARD FOREIGN CURRENCY EXCHANGE CONTRACTS — At December 31, 2013, the Fund had the following forward foreign currency exchange contracts:
FORWARD FOREIGN CURRENCY EXCHANGE CONTRACTS WITH UNREALIZED GAIN
| | | | | | | | | | | | | | |
| Counterparty | | Contracts to
Buy/Sell | | Settlement
Date | | | Current
Value | | | Unrealized
Gain | |
Barclays Bank PLC | | AUD/NZD | | | 02/12/14 | | | $ | 106,692 | | | $ | 160 | |
| | CAD/EUR | | | 01/17/14 | | | | 133,614 | | | | 294 | |
| | CAD/NZD | | | 02/24/14 | | | | 94,215 | | | | 560 | |
| | CZK/EUR | | | 02/12/14 | | | | 82,541 | | | | 1,094 | |
| | EUR/AUD | | | 01/22/14 | | | | 484,226 | | | | 38,534 | |
| | EUR/GBP | | | 01/14/14 | | | | 381,440 | | | | 1,002 | |
| | EUR/ZAR | | | 01/10/14 | | | | 323,132 | | | | 20,791 | |
| | GBP/EUR | | | 01/14/14 | | | | 382,442 | | | | 10,377 | |
| | GBP/EUR | | | 02/12/14 | | | | 174,809 | | | | 671 | |
| | MXN/EUR | | | 02/12/14 | | | | 89,419 | | | | 650 | |
| | MXN/USD | | | 01/10/14 | | | | 357,062 | | | | 3,914 | |
| | NZD/EUR | | | 02/12/14 | | | | 89,419 | | | | 1,197 | |
| | NZD/USD | | | 02/12/14 | | | | 120,369 | | | | 369 | |
| | PHP/USD | | | 05/15/14 | | | | 139,738 | | | | 142 | |
| | PLN/SEK | | | 01/22/14 | | | | 540,166 | | | | 8,523 | |
| | PLN/USD | | | 02/12/14 | | | | 108,742 | | | | 742 | |
| | SEK/PLN | | | 01/22/14 | | | | 548,689 | | | | 4,347 | |
| | SEK/USD | | | 01/22/14 | | | | 99,885 | | | | 3,885 | |
| | USD/EUR | | | 02/07/14 | | | | 331,538 | | | | 967 | |
| | USD/JPY | | | 01/10/14 | | | | 63,076 | | | | 3,424 | |
| | USD/MXN | | | 02/12/14 | | | | 32,814 | | | | 186 | |
| | USD/NZD | | | 02/12/14 | | | | 48,374 | | | | 136 | |
| | USD/PHP | | | 01/08/14 | | | | 138,998 | | | | 125 | |
| | USD/ZAR | | | 01/10/14 | | | | 42,740 | | | | 1,959 | |
| | USD/ZAR | | | 04/11/14 | | | | 124,091 | | | | 909 | |
| | |
| 22 | | The accompanying notes are an integral part of these financial statements. |
GOLDMAN SACHS MULTI-MANAGER ALTERNATIVES FUND
|
| ADDITIONAL INVESTMENT INFORMATION (continued) |
FORWARD FOREIGN CURRENCY EXCHANGE CONTRACTS WITH UNREALIZED GAIN (continued)
| | | | | | | | | | | | | | |
| Counterparty | | Contracts to
Buy/Sell | | Settlement
Date | | | Current
Value | | | Unrealized
Gain | |
Citibank NA | | USD/BRL | | | 01/10/14 | | | $ | 1,033,849 | | | $ | 37,282 | |
| | USD/CLP | | | 01/10/14 | | | | 91,409 | | | | 3,805 | |
| | USD/EUR | | | 02/04/14 | | | | 343,920 | | | | 250 | |
| | USD/JPY | | | 01/10/14 | | | | 383,966 | | | | 20,534 | |
Credit Suisse International (London) | | CHF/EUR | | | 01/22/14 | | | | 143,071 | | | | 635 | |
| | CLP/USD | | | 02/24/14 | | | | 110,727 | | | | 227 | |
| | EUR/USD | | | 01/07/14 | | | | 214,608 | | | | 751 | |
| | EUR/USD | | | 02/07/14 | | | | 132,065 | | | | 959 | |
| | GBP/EUR | | | 02/12/14 | | | | 297,146 | | | | 7,034 | |
| | GBP/USD | | | 01/07/14 | | | | 2,803,389 | | | | 41,544 | |
| | USD/AUD | | | 01/07/14 | | | | 269,082 | | | | 7,678 | |
| | USD/AUD | | | 04/02/14 | | | | 267,585 | | | | 186 | |
| | USD/BRL | | | 01/10/14 | | | | 834,519 | | | | 53,790 | |
| | USD/EUR | | | 01/07/14 | | | | 148,575 | | | | 67 | |
| | USD/EUR | | | 04/02/14 | | | | 1,584,775 | | | | 1,477 | |
| | USD/ZAR | | | 01/10/14 | | | | 95,521 | | | | 3,683 | |
Deutsche Bank AG (London) | | AUD/USD | | | 02/12/14 | | | | 85,481 | | | | 152 | |
| | BRL/USD | | | 01/02/14 | | | | 119,429 | | | | 929 | |
| | CHF/EUR | | | 01/22/14 | | | | 151,325 | | | | 347 | |
| | CZK/EUR | | | 02/12/14 | | | | 660,325 | | | | 5,464 | |
| | EUR/BGN | | | 11/28/14 | | | | 160,804 | | | | 400 | |
| | EUR/CAD | | | 01/17/14 | | | | 254,821 | | | | 10,687 | |
| | EUR/NOK | | | 02/12/14 | | | | 144,597 | | | | 1,225 | |
| | EUR/USD | | | 03/11/14 | | | | 31,640 | | | | 667 | |
| | GBP/EUR | | | 02/12/14 | | | | 462,227 | | | | 7,017 | |
| | HUF/EUR | | | 02/12/14 | | | | 82,541 | | | | 1,706 | |
| | MXN/NZD | | | 02/12/14 | | | | 188,168 | | | | 450 | |
| | NOK/EUR | | | 02/12/14 | | | | 145,822 | | | | 322 | |
| | NZD/EUR | | | 02/12/14 | | | | 66,032 | | | | 206 | |
| | NZD/MXN | | | 02/12/14 | | | | 186,421 | | | | 1,747 | |
| | NZD/USD | | | 02/12/14 | | | | 120,951 | | | | 951 | |
| | SEK/USD | | | 02/12/14 | | | | 83,215 | | | | 2,715 | |
| | USD/BRL | | | 01/02/14 | | | | 237,453 | | | | 1,388 | |
| | USD/JPY | | | 02/12/14 | | | | 65,444 | | | | 1,556 | |
| | USD/MXN | | | 02/12/14 | | | | 65,518 | | | | 482 | |
Merrill Lynch International Bank Ltd. | | AUD/USD | | | 03/21/14 | | | | 57,072 | | | | 423 | |
| | CAD/EUR | | | 02/12/14 | | | | 97,673 | | | | 196 | |
| | CAD/USD | | | 03/21/14 | | | | 2,538,882 | | | | 11,608 | |
| | CHF/USD | | | 03/21/14 | | | | 1,513,951 | | | | 4,480 | |
| | EUR/USD | | | 03/21/14 | | | | 8,165,253 | | | | 15,983 | |
| | GBP/USD | | | 03/21/14 | | | | 9,664,277 | | | | 118,601 | |
| | JPY/USD | | | 03/25/14 | | | | 1,466,553 | | | | 658 | |
| | NZD/USD | | | 03/21/14 | | | | 508,383 | | | | 2,431 | |
| | USD/AUD | | | 03/21/14 | | | | 220,448 | | | | 132 | |
| | USD/CAD | | | 03/21/14 | | | | 1,219,550 | | | | 2,003 | |
| | USD/CHF | | | 03/21/14 | | | | 490,581 | | | | 2,820 | |
| | USD/EUR | | | 03/21/14 | | | | 170,522 | | | | 147 | |
| | USD/JPY | | | 03/25/14 | | | | 6,602,847 | | | | 129,675 | |
| | USD/MXN | | | 03/21/14 | | | | 2,935,078 | | | | 5,954 | |
| | | USD/NZD | | | 03/21/14 | | | | 91,301 | | | | 308 | |
| TOTAL | | | $ | 618,690 | |
| | |
| The accompanying notes are an integral part of these financial statements. | | 23 |
GOLDMAN SACHS MULTI-MANAGER ALTERNATIVES FUND
Schedule of Investments (continued)
December 31, 2013
|
| ADDITIONAL INVESTMENT INFORMATION (continued) |
FORWARD FOREIGN CURRENCY EXCHANGE CONTRACTS WITH UNREALIZED LOSS
| | | | | | | | | | | | | | |
| Counterparty | | Contracts to
Buy/Sell | | Settlement
Date | | | Current
Value | | | Unrealized
Loss | |
Barclays Bank PLC | | AUD/EUR | | | 01/22/14 | | | $ | 522,760 | | | $ | (29,679 | ) |
| | AUD/EUR | | | 02/12/14 | | | | 79,101 | | | | (3,154 | ) |
| | CHF/EUR | | | 02/12/14 | | | | 79,101 | | | | (374 | ) |
| | EUR/CHF | | | 02/12/14 | | | | 159,306 | | | | (416 | ) |
| | EUR/GBP | | | 02/12/14 | | | | 175,480 | | | | (1,730 | ) |
| | KRW/USD | | | 01/10/14 | | | | 145,972 | | | | (86 | ) |
| | MXN/USD | | | 01/10/14 | | | | 73,272 | | | | (676 | ) |
| | MXN/USD | | | 02/12/14 | | | | 264,327 | | | | (673 | ) |
| | NOK/EUR | | | 01/13/14 | | | | 382,442 | | | | (21,885 | ) |
| | PHP/USD | | | 01/08/14 | | | | 138,998 | | | | (5,002 | ) |
| | PHP/USD | | | 02/12/14 | | | | 89,704 | | | | (1,372 | ) |
| | USD/EUR | | | 03/04/14 | | | | 550,442 | | | | (4,704 | ) |
| | USD/EUR | | | 03/18/14 | | | | 109,366 | | | | (270 | ) |
| | USD/GBP | | | 02/12/14 | | | | 175,480 | | | | (4,271 | ) |
| | USD/KRW | | | 01/10/14 | | | | 145,972 | | | | (1,972 | ) |
| | USD/KRW | | | 05/15/14 | | | | 145,378 | | | | (369 | ) |
| | USD/MXN | | | 01/10/14 | | | | 304,872 | | | | (1,089 | ) |
| | USD/MXN | | | 02/12/14 | | | | 184,272 | | | | (2,772 | ) |
| | USD/MXN | | | 04/11/14 | | | | 126,975 | | | | (1,975 | ) |
| | USD/PLN | | | 02/12/14 | | | | 229,541 | | | | (1,541 | ) |
| | USD/SEK | | | 01/22/14 | | | | 97,387 | | | | (1,387 | ) |
| | USD/SEK | | | 02/12/14 | | | | 81,514 | | | | (1,014 | ) |
| | ZAR/USD | | | 01/10/14 | | | | 137,975 | | | | (4,497 | ) |
Credit Suisse International (London) | | AUD/USD | | | 01/07/14 | | | | 269,082 | | | | (197 | ) |
| | CHF/EUR | | | 02/12/14 | | | | 237,992 | | | | (618 | ) |
| | EUR/CHF | | | 02/12/14 | | | | 158,620 | | | | (418 | ) |
| | EUR/GBP | | | 02/12/14 | | | | 135,525 | | | | (3,460 | ) |
| | EUR/PLN | | | 02/12/14 | | | | 279,674 | | | | (2,475 | ) |
| | EUR/USD | | | 01/07/14 | | | | 1,584,800 | | | | (1,510 | ) |
| | MXN/USD | | | 02/12/14 | | | | 59,637 | | | | (363 | ) |
| | USD/EUR | | | 01/07/14 | | | | 1,650,834 | | | | (39,438 | ) |
| | USD/EUR | | | 02/07/14 | | | | 449,846 | | | | (3,774 | ) |
| | USD/EUR | | | 03/18/14 | | | | 39,894 | | | | (260 | ) |
| | USD/GBP | | | 01/07/14 | | | | 2,803,389 | | | | (85,377 | ) |
| | USD/GBP | | | 01/10/14 | | | | 178,830 | | | | (6,616 | ) |
| | USD/GBP | | | 02/07/14 | | | | 181,281 | | | | (5,587 | ) |
| | USD/GBP | | | 02/12/14 | | | | 251,632 | | | | (5,712 | ) |
| | USD/GBP | | | 03/18/14 | | | | 32,273 | | | | (399 | ) |
| | USD/GBP | | | 04/02/14 | | | | 2,801,665 | | | | (41,614 | ) |
| | USD/HUF | | | 01/10/14 | | | | 2,354 | | | | (25 | ) |
| | USD/PLN | | | 02/12/14 | | | | 173,173 | | | | (2,673 | ) |
| | ZAR/NZD | | | 02/12/14 | | | | 66,002 | | | | (1,554 | ) |
Deutsche Bank AG (London) | | BRL/USD | | | 01/02/14 | | | | 118,024 | | | | (901 | ) |
| | BRL/USD | | | 01/10/14 | | | | 933,191 | | | | (37,309 | ) |
| | CAD/EUR | | | 01/17/14 | | | | 682,170 | | | | (11,263 | ) |
| | CLP/USD | | | 02/24/14 | | | | 54,858 | | | | (142 | ) |
| | EUR/CHF | | | 01/22/14 | | | | 295,490 | | | | (1,093 | ) |
| | EUR/GBP | | | 02/12/14 | | | | 293,133 | | | | (2,865 | ) |
| | JPY/USD | | | 02/12/14 | | | | 66,042 | | | | (958 | ) |
| | MXN/USD | | | 02/12/14 | | | | 124,890 | | | | (1,110 | ) |
| | NOK/EUR | | | 02/12/14 | | | | 318,469 | | | | (10,927 | ) |
| | NOK/SEK | | | 02/12/14 | | | | 445,620 | | | | (13,099 | ) |
| | USD/BRL | | | 02/03/14 | | | | 119,452 | | | | (952 | ) |
| | USD/EUR | | | 02/20/14 | | | | 443,654 | | | | (13,995 | ) |
| | USD/EUR | | | 03/11/14 | | | | 31,640 | | | | (804 | ) |
| | |
| 24 | | The accompanying notes are an integral part of these financial statements. |
GOLDMAN SACHS MULTI-MANAGER ALTERNATIVES FUND
|
| ADDITIONAL INVESTMENT INFORMATION (continued) |
FORWARD FOREIGN CURRENCY EXCHANGE CONTRACTS WITH UNREALIZED LOSS (continued)
| | | | | | | | | | | | | | |
| Counterparty | | Contracts to
Buy/Sell | | Settlement
Date | | | Current
Value | | | Unrealized
Loss | |
Deutsche Bank AG (London) (continued) | | USD/PLN | | | 02/12/14 | | | $ | 229,703 | | | $ | (1,703 | ) |
| | ZAR/USD | | | 04/24/14 | | | | 29,738 | | | | (262 | ) |
JPMorgan Securities, Inc. | | EUR/CZK | | | 02/12/14 | | | | 92,700 | | | | (530 | ) |
Merrill Lynch International Bank Ltd. | | AUD/USD | | | 03/21/14 | | | | 62,526 | | | | (721 | ) |
| | CAD/USD | | | 03/21/14 | | | | 69,045 | | | | (249 | ) |
| | CHF/USD | | | 03/21/14 | | | | 8,508,005 | | | | (27,765 | ) |
| | EUR/USD | | | 03/21/14 | | | | 1,325,192 | | | | (1,902 | ) |
| | JPY/USD | | | 03/21/14 | | | | 50,562 | | | | (265 | ) |
| | MXN/USD | | | 03/21/14 | | | | 2,891,599 | | | | (20,552 | ) |
| | NZD/USD | | | 03/21/14 | | | | 3,320,385 | | | | (8,375 | ) |
| | USD/AUD | | | 03/21/14 | | | | 4,941,205 | | | | (30,219 | ) |
| | USD/CAD | | | 03/21/14 | | | | 6,693,081 | | | | (20,018 | ) |
| | USD/CHF | | | 03/21/14 | | | | 230,159 | | | | (955 | ) |
| | USD/EUR | | | 03/21/14 | | | | 585,716 | | | | (5,030 | ) |
| | USD/GBP | | | 03/21/14 | | | | 349,942 | | | | (4,427 | ) |
| | | USD/MXN | | | 03/21/14 | | | | 106,547 | | | | (269 | ) |
| TOTAL | | | $ | (511,638 | ) |
FUTURES CONTRACTS — At December 31, 2013, the Fund had the following futures contracts:
| | | | | | | | | | | | | | |
| Type | | Number of
Contracts
Long (Short) | | | Expiration
Date | | Current
Value | | | Unrealized
Gain (Loss) | |
Australian 3 year Government Bonds | | | 11 | | | March 2014 | | $ | 1,066,126 | | | $ | 995 | |
Australian 10 year Government Bonds | | | (51 | ) | | March 2014 | | | (5,221,526 | ) | | | (53,572 | ) |
CAC40 Index | | | 19 | | | January 2014 | | | 1,123,554 | | | | 43,881 | |
Canada 10 Year Government Bonds | | | (22 | ) | | March 2014 | | | (2,624,881 | ) | | | 4,122 | |
DAX Index | | | 3 | | | March 2014 | | | 991,071 | | | | 50,451 | |
DJIA E-Mini Index | | | 38 | | | March 2014 | | | 3,133,860 | | | | 94,324 | |
Eurodollar | | | 294 | | | June 2015 | | | 73,003,875 | | | | (94,571 | ) |
Euro Stoxx 50 Index | | | 86 | | | March 2014 | | | 3,677,079 | | | | 173,519 | |
French 10 Year Government Bonds | | | (1 | ) | | March 2014 | | | (180,822 | ) | | | 1,483 | |
FTSE 100 Index | | | 33 | | | March 2014 | | | 3,659,939 | | | | 24,237 | |
Japan 10 Year Government Bonds | | | (2 | ) | | March 2014 | | | (2,721,869 | ) | | | 11,476 | |
Japan 10 Year Government Bonds Mini | | | 69 | | | March 2014 | | | 9,387,171 | | | | (67,002 | ) |
Nasdaq 100 E-Mini Index | | | 20 | | | March 2014 | | | 1,433,500 | | | | 19,753 | |
Nikkei 225 Index | | | 53 | | | March 2014 | | | 4,090,376 | | | | 148,755 | |
S&P 500 E-Mini Index | | | 13 | | | March 2014 | | | 1,196,715 | | | | 26,474 | |
Topix Index | | | 24 | | | March 2014 | | | 2,968,379 | | | | 106,802 | |
Ultra Long U.S. Treasury Bonds | | | (4 | ) | | March 2014 | | | (545,000 | ) | | | 12,238 | |
3 Month Euribor Interest Rate | | | 15 | | | June 2015 | | | 5,417 | | | | (7,480 | ) |
3 Month Euribor Interest Rate | | | (15 | ) | | June 2015 | | | (4,127 | ) | | | 5,933 | |
3 Month Euribor Interest Rate | | | (6 | ) | | March 2015 | | | (2,528 | ) | | | (533 | ) |
3 Month Euro Euribor | | | 221 | | | June 2015 | | | 75,589,350 | | | | (97,222 | ) |
3 Month Sterling Interest Rate | | | (118 | ) | | June 2015 | | | (24,105,290 | ) | | | 4,659 | |
5 Year German Euro-Bobl | | | (3 | ) | | March 2014 | | | (513,535 | ) | | | 5,342 | |
10 Year German Euro-Bund | | | 5 | | | March 2014 | | | 957,280 | | | | (2,434 | ) |
10 Year U.K. Long Gilt | | | (32 | ) | | March 2014 | | | (5,646,657 | ) | | | 50,686 | |
5 Year U.S. Treasury Notes | | | (37 | ) | | March 2014 | | | (4,414,562 | ) | | | 52,802 | |
10 Year U.S. Treasury Notes | | | (61 | ) | | March 2014 | | | (7,505,859 | ) | | | 42,256 | |
20 Year U.S. Treasury Bonds | | | (77 | ) | | March 2014 | | | (9,880,062 | ) | | | 72,113 | |
| TOTAL | | | $ | 629,487 | |
| | |
| The accompanying notes are an integral part of these financial statements. | | 25 |
GOLDMAN SACHS MULTI-MANAGER ALTERNATIVES FUND
Schedule of Investments (continued)
December 31, 2013
|
| ADDITIONAL INVESTMENT INFORMATION (continued) |
SWAP CONTRACTS — At December 31, 2013, the Fund had the following swap contracts:
OVER THE COUNTER INTEREST RATE SWAP CONTRACTS
| | | | | | | | | | | | | | | | | | | | | | | | |
| | | | | | | | | | | | Rates Exchanged | | Market Value | |
| Counterparty | | Notional
Amount
(000s) | | | Termination
Date | | | Payments
Received | | Payments
Made | | Upfront
Payments
Made (Received) | | | Unrealized
Gain (Loss) | |
Bank of America Securities LLC | | | NZD | | | | 383 | (a) | | | 12/24/16 | | | 4.623% | | 3 month NZDOR | | $ | — | | | $ | (14 | ) |
| | | CAD | | | | 259 | (a) | | | 10/15/23 | | | 4.068 | | 6 month CDOR | | | — | | | | (1,410 | ) |
| | | | | | | 259 | (a) | | | 10/18/23 | | | 3.940 | | 6 month CDOR | | | — | | | | (2,703 | ) |
| | | | | | | 244 | (a) | | | 10/23/23 | | | 3.853 | | 6 month CDOR | | | — | | | | (3,400 | ) |
| | | | | | | 400 | (a) | | | 10/29/23 | | | 3.845 | | 6 month CDOR | | | (12,424 | ) | | | 6,680 | |
Barclays Bank PLC | | | KRW | | | | 264,507 | (a) | | | 10/14/17 | | | 3 month KWCDC | | 3.240% | | | — | | | | 32 | |
| | | MXN | | | | 2,137 | (a) | | | 11/01/17 | | | 5.830 | | Mexico Interbank
TIIE 28 Days | | | — | | | | (282 | ) |
| | | ZAR | | | | 1,210 | (a) | | | 11/02/17 | | | 7.850 | | 3 month JIBAR | | | — | | | | (245 | ) |
| | | MXN | | | | 2,218 | (a) | | | 11/06/17 | | | 5.900 | | Mexico Interbank
TIIE 28 Days | | | — | | | | (117 | ) |
| | | ZAR | | | | 5,540 | (a) | | | 09/30/19 | | | 7.825 | | 3 month JIBAR | | | — | | | | (2,522 | ) |
| | | BRL | | | | 88 | | | | 01/04/21 | | | 12.360 | | 1 month Brazilian
Interbank Deposit Average | | | — | | | | (32 | ) |
| | | | | | | 181 | | | | 01/04/21 | | | 12.530 | | 1 month Brazilian
Interbank Deposit Average | | | — | | | | (766 | ) |
| | | | | | | 199 | | | | 01/04/21 | | | 12.750 | | 1 month Brazilian
Interbank Deposit Average | | | — | | | | (452 | ) |
| | | MXN | | | | 994 | (a) | �� | | 09/22/23 | | | 8.230 | | Mexico Interbank
TIIE 28 Days | | | — | | | | (604 | ) |
| | | NOK | | | | 785 | (a) | | | 09/25/23 | | | 6 month NIBOR | | 4.270 | | | — | | | | (191 | ) |
| | | SEK | | | | 828 | (a) | | | 09/25/23 | | | 3.625 | | 3 month STIBOR | | | — | | | | (202 | ) |
| | | ZAR | | | | 7,500 | (a) | | | 09/30/23 | | | 9.295 | | 3 month JIBAR | | | — | | | | (4,791 | ) |
| | | NOK | | | | 2,226 | (a) | | | 10/11/23 | | | 6 month NIBOR | | 4.118 | | | — | | | | 1,774 | |
| | | | | | | 2,942 | (a) | | | 10/17/23 | | | 6 month NIBOR | | 4.190 | | | — | | | | 1,002 | |
| | | MXN | | | | 1,099 | (a) | | | 10/23/23 | | | 8.350 | | Mexico Interbank
TIIE 28 Days | | | — | | | | (392 | ) |
| | | | | | | 1,162 | (a) | | | 10/25/23 | | | 8.530 | | Mexico Interbank
TIIE 28 Days | | | — | | | | 133 | |
| | | KRW | | | | 241,152 | (a) | | | 10/29/23 | | | 3 month KWCDC | | 3.535 | | | — | | | | 1,936 | |
| | | NOK | | | | 1,589 | (a) | | | 11/12/23 | | | 6 month NIBOR | | 4.141 | | | — | | | | 1,156 | |
| | | | | | | 2,439 | (a) | | | 11/13/23 | | | 6 month NIBOR | | 4.152 | | | — | | | | 1,612 | |
| | | ZAR | | | | 2,188 | (a) | | | 11/19/23 | | | 9.400 | | 3 month JIBAR | | | — | | | | (968 | ) |
| | | | | | | 763 | (a) | | | 11/20/23 | | | 9.430 | | 3 month JIBAR | | | — | | | | (278 | ) |
| | | | | | | 922 | (a) | | | 12/02/23 | | | 9.670 | | 3 month JIBAR | | | — | | | | 225 | |
| | | KRW | | | | 163,233 | (a) | | | 12/20/23 | | | 3 month KWCDC | | 3.760 | | | — | | | | (8 | ) |
| | | | | | | 239,772 | (a) | | | 12/24/23 | | | 3 month KWCDC | | 3.760 | | | — | | | | (6 | ) |
| | | ZAR | | | | 3,000 | (a) | | | 11/25/28 | | | 10.650 | | 3 month JIBAR | | | — | | | | (713 | ) |
| | | | | | | 771 | (a) | | | 11/14/33 | | | 3 month JIBAR | | 10.160 | | | — | | | | 371 | |
Citibank NA | | | AUD | | | | 259 | (a) | | | 12/16/17 | | | 6 month AUDOR | | 3.800 | | | — | | | | (113 | ) |
| | | NZD | | | | 292 | (a) | | | 12/17/17 | | | 4.805 | | 3 month NZDOR | | | — | | | | (344 | ) |
| | | AUD | | | | 299 | (a) | | | 12/16/20 | | | 5.283 | | 6 month AUDOR | | | — | | | | 364 | |
| | | NZD | | | | 340 | (a) | | | 12/17/20 | | | 3 month NZDOR | | 5.903 | | | — | | | | (131 | ) |
| | |
| 26 | | The accompanying notes are an integral part of these financial statements. |
GOLDMAN SACHS MULTI-MANAGER ALTERNATIVES FUND
|
| ADDITIONAL INVESTMENT INFORMATION (continued) |
OVER THE COUNTER INTEREST RATE SWAP CONTRACTS (continued)
| | | | | | | | | | | | | | | | | | | | | | | | |
| | | | | | | | | | | | Rates Exchanged | | Market Value | |
| Counterparty | | Notional
Amount
(000s) | | | Termination
Date | | | Payments
Received | | Payments
Made | | Upfront
Payments
Made (Received) | | | Unrealized
Gain (Loss) | |
Deutsche Bank Securities, Inc. | | | ZAR | | | | 1,215 | (a) | | | 11/12/16 | | | 7.520% | | 3 month JIBAR | | $ | — | | | $ | 849 | |
| | | NZD | | | | 327 | (a) | | | 12/24/16 | | | 4.620 | | 3 month NZDOR | | | — | | | | 425 | |
| | | AUD | | | | 370 | (a) | | | 01/20/17 | | | 6 month AUDOR | | 3.302% | | | — | | | | (954 | ) |
| | | | | | | 775 | (a) | | | 02/24/17 | | | 6 month AUDOR | | 3.390 | | | — | | | | (21,667 | ) |
| | | | | | | 536 | (a) | | | 10/22/17 | | | 4.190 | | 6 month AUDOR | | | — | | | | 1,691 | |
| | | | | | | 260 | (a) | | | 10/26/17 | | | 4.070 | | 6 month AUDOR | | | — | | | | 290 | |
| | | ZAR | | | | 3,065 | (a) | | | 11/02/17 | | | 7.762 | | 3 month JIBAR | | | — | | | | (1,042 | ) |
| | | AUD | | | | 255 | (a) | | | 12/16/17 | | | 6 month AUDOR | | 3.790 | | | — | | | | (48 | ) |
| | | NZD | | | | 253 | (a) | | | 12/17/17 | | | 4.810 | | 3 month NZDOR | | | — | | | | (270 | ) |
| | | MXN | | | | 6,000 | (a) | | | 09/24/19 | | | 6.120 | | Mexico Interbank
TIIE 28 Days | | | — | | | | (801 | ) |
| | | AUD | | | | 298 | (a) | | | 12/16/20 | | | 5.290 | | 6 month AUDOR | | | — | | | | 411 | |
| | | NZD | | | | 300 | (a) | | | 12/17/20 | | | 3 month NZDOR | | 5.900 | | | — | | | | (102 | ) |
| | | MXN | | | | 7,570 | (a) | | | 09/19/23 | | | 8.275 | | Mexico Interbank
TIIE 28 Days | | | — | | | | (3,643 | ) |
| | | CAD | | | | 243 | (a) | | | 10/18/23 | | | 3.950 | | 6 month CDOR | | | — | | | | (2,442 | ) |
| | | | | | | 245 | (a) | | | 10/23/23 | | | 3.838 | | 6 month CDOR | | | — | | | | (3,556 | ) |
| | | | | | | 245 | (a) | | | 10/23/23 | | | 3.825 | | 6 month CDOR | | | — | | | | (3,675 | ) |
| | | | | | | 192 | (a) | | | 10/25/23 | | | 3.830 | | 6 month CDOR | | | — | | | | (2,850 | ) |
| | | NZD | | | | 838 | (a) | | | 10/25/23 | | | 3 month NZDOR | | 5.598 | | | — | | | | 8,689 | |
| | | MXN | | | | 918 | (a) | | | 11/22/23 | | | 8.747 | | Mexico Interbank
TIIE 28 Days | | | — | | | | 571 | |
| | | | | | | 1,296(a) | | | | 11/23/23 | | | 8.753 | | Mexico Interbank
TIIE 28 Days | | | — | | | | 823 | |
| | | | | | | 2,259(a) | | | | 11/28/23 | | | 8.460 | | Mexico Interbank
TIIE 28 Days | | | — | | | | (328 | ) |
| | | | | | | 286 | (a) | | | 11/29/23 | | | 8.598 | | Mexico Interbank
TIIE 28 Days | | | — | | | | 61 | |
| | | | | | | 202 | (a) | | | 12/01/23 | | | 8.600 | | Mexico Interbank
TIIE 28 Days | | | — | | | | 43 | |
| | | CAD | | | | 147 | (a) | | | 12/19/23 | | | 4.215 | | 6 month CDOR | | | — | | | | (170 | ) |
| | | AUD | | | | 132 | (a) | | | 10/22/25 | | | 6 month AUDOR | | 5.108 | | | — | | | | 655 | |
| | | | | | | 64 | (a) | | | 10/26/25 | | | 6 month AUDOR | | 4.950 | | | — | | | | 1,009 | |
| | | | | | | 317 | (a) | | | 12/13/25 | | | 6.030 | | 6 month AUDOR | | | — | | | | 37 | |
| | | MXN | | | | 274 | (a) | | | 09/20/28 | | | 9.810 | | Mexico Interbank
TIIE 28 Days | | | — | | | | (50 | ) |
| | | | | | | 821 | (a) | | | 09/21/28 | | | 9.860 | | Mexico Interbank
TIIE 28 Days | | | — | | | | (78 | ) |
| | | | | | | 1,266 | (a) | | | 10/25/28 | | | 10.145 | | Mexico Interbank
TIIE 28 Days | | | — | | | | 471 | |
| | | | | | | 549 | (a) | | | 11/23/28 | | | 10.130 | | Mexico Interbank
TIIE 28 Days | | | — | | | | 187 | |
| | | AUD | | | | 247 | (a) | | | 12/13/28 | | | 6 month AUDOR | | 5.840 | | | — | | | | 303 | |
| | | MXN | | | | 694 | (a) | | | 09/13/33 | | | 9.925 | | Mexico Interbank
TIIE 28 Days | | | — | | | | (395 | ) |
| | | | | | | 985 | (a) | | | 09/14/33 | | | 9.954 | | Mexico Interbank
TIIE 28 Days | | | — | | | | (477 | ) |
| | | | | | | 480 | (a) | | | 09/21/33 | | | 9.950 | | Mexico Interbank
TIIE 28 Days | | | — | | | | (242 | ) |
| | |
| The accompanying notes are an integral part of these financial statements. | | 27 |
GOLDMAN SACHS MULTI-MANAGER ALTERNATIVES FUND
Schedule of Investments (continued)
December 31, 2013
|
| ADDITIONAL INVESTMENT INFORMATION (continued) |
OVER THE COUNTER INTEREST RATE SWAP CONTRACTS (continued)
| | | | | | | | | | | | | | | | | | | | | | | | |
| | | | | | | | | | | | Rates Exchanged | | Market Value | |
| Counterparty | | Notional
Amount
(000s) | | | Termination
Date | | | Payments
Received | | Payments
Made | | Upfront
Payments
Made (Received) | | | Unrealized
Gain (Loss) | |
Deutsche Bank Securities, Inc. (continued) | | | | | | | 432 | (a) | | | 11/14/33 | | | 10.300% | | Mexico Interbank
TIIE 28 Days | | $ | — | | | $ | 203 | |
| | | ZAR | | | | 370 | (a) | | | 11/15/33 | | | 3 month JIBAR | | 10.160% | | | — | | | | 178 | |
Morgan Stanley Capital Services, Inc. | | | | | | | 2,402 | (a) | | | 11/24/16 | | | 7.250 | | 3 month JIBAR | | | — | | | | 447 | |
| | | | | | | | | | | | | | | | | | | | | | | | | |
| TOTAL | | | | | | | | | | | | | | | | | | $ | (12,424 | ) | | $ | (30,846 | ) |
| | (a) | | Represents forward starting interest rate swaps whose effective dates of commencement of accruals and cash flows occur subsequent to December 31, 2013. |
CENTRALLY CLEARED INTEREST RATE SWAP CONTRACTS
| | | | | | | | | | | | | | |
| | | Rates Exchanged | | | |
Notional
Amount
(000s) | | | Termination
Date | | Payments
Received | | | Payments
Made | | Unrealized
Gain (Loss)* | |
| GBP | 929 | (a) | | 10/01/16 | | | 6 month BP | | | 1.723% | | $ | 4,770 | |
| | 1,908 | (a) | | 10/03/17 | | | 2.433% | | | 6 month BP | | | (13,663 | ) |
| $ | 772 | (a) | | 10/30/17 | | | 3 month LIBOR | | | 1.690 | | | 4,914 | |
| | 1,030 | (a) | | 11/02/17 | | | 3 month LIBOR | | | 1.710 | | | 6,393 | |
| EUR | 305 | (a) | | 11/25/17 | | | 6 month EURO | | | 1.240 | | | 1,546 | |
| $ | 1,129 | (a) | | 05/31/18 | | | 3 month LIBOR | | | 1.337 | | | 12,259 | |
| GBP | 1,077 | (a) | | 10/02/18 | | | 6 month BP | | | 2.940 | | | 7,270 | |
| $ | 954 | (a) | | 11/26/18 | | | 3 month LIBOR | | | 2.748 | | | 7,000 | |
| | 453 | (a) | | 11/29/18 | | | 3 month LIBOR | | | 2.650 | | | 4,153 | |
| | 452 | (a) | | 11/29/18 | | | 3 month LIBOR | | | 2.680 | | | 3,881 | |
| | 452 | (a) | | 11/29/18 | | | 3 month LIBOR | | | 2.730 | | | 3,452 | |
| | 496 | (a) | | 11/29/18 | | | 3 month LIBOR | | | 2.757 | | | 3,534 | |
| | 884 | (a) | | 12/19/18 | | | 2.930 | | | 3 month LIBOR | | | (4,198 | ) |
| | 569 | (a) | | 12/20/18 | | | 2.970 | | | 3 month LIBOR | | | (2,294 | ) |
| | 1,134 | (a) | | 12/23/18 | | | 3.125 | | | 3 month LIBOR | | | (1,426 | ) |
| | 935 | (a) | | 12/27/18 | | | 3.150 | | | 3 month LIBOR | | | (888 | ) |
| | 608 | (a) | | 12/28/18 | | | 3.106 | | | 3 month LIBOR | | | (1,095 | ) |
| | 609 | (a) | | 03/09/19 | | | 3 month LIBOR | | | 1.727 | | | 5,636 | |
| EUR | 317 | (a) | | 11/25/19 | | | 2.300 | | | 6 month EURO | | | (1,303 | ) |
| JPY | 64,752 | (a) | | 10/08/20 | | | 0.940 | | | 6 month JYOR | | | (1,803 | ) |
| | 22,851 | (a) | | 10/21/20 | | | 0.928 | | | 6 month JYOR | | | (732 | ) |
| $ | 645 | (a) | | 10/30/20 | | | 2.736 | | | 3 month LIBOR | | | (13,519 | ) |
| | 861 | (a) | | 11/02/20 | | | 2.750 | | | 3 month LIBOR | | | (17,806 | ) |
| | 1,332 | (a) | | 11/26/20 | | | 4.090 | | | 3 month LIBOR | | | (5,854 | ) |
| | 653 | (a) | | 11/27/20 | | | 4.060 | | | 3 month LIBOR | | | (3,056 | ) |
| | 599 | (a) | | 11/27/20 | | | 4.061 | | | 3 month LIBOR | | | (2,792 | ) |
| | 910 | (a) | | 11/27/20 | | | 4.110 | | | 3 month LIBOR | | | (3,454 | ) |
| | 597 | (a) | | 11/29/20 | | | 4.057 | | | 3 month LIBOR | | | (2,847 | ) |
| | 597 | (a) | | 11/29/20 | | | 4.062 | | | 3 month LIBOR | | | (2,794 | ) |
| | 597 | (a) | | 11/29/20 | | | 4.108 | | | 3 month LIBOR | | | (2,314 | ) |
| | 656 | (a) | | 12/03/20 | | | 4.137 | | | 3 month LIBOR | | | (2,245 | ) |
| | 624 | (a) | | 12/04/20 | | | 4.165 | | | 3 month LIBOR | | | (1,836 | ) |
| EUR | 708 | (a) | | 12/04/20 | | | 6 month EURO | | | 2.663 | | | 2,146 | |
| | |
| 28 | | The accompanying notes are an integral part of these financial statements. |
GOLDMAN SACHS MULTI-MANAGER ALTERNATIVES FUND
|
| ADDITIONAL INVESTMENT INFORMATION (continued) |
CENTRALLY CLEARED INTEREST RATE SWAP CONTRACTS (continued)
| | | | | | | | | | | | |
| | | Rates Exchanged | | | |
Notional
Amount
(000s) | | | Termination
Date | | Payments
Received | | Payments
Made | | Unrealized
Gain (Loss)* | |
| | 764 | (a) | | 12/04/20 | | 6 month EURO | | 2.675% | | $ | 2,082 | |
| $ | 629 | (a) | | 12/10/20 | | 4.238% | | 3 month LIBOR | | | (1,109 | ) |
| | 986 | (a) | | 02/15/21 | | 3 month LIBOR | | 2.329 | | | 16,299 | |
| GBP | 229 | (a) | | 10/07/22 | | 3.546 | | 6 month BP | | | (3,998 | ) |
| | 138 | (a) | | 10/07/22 | | 3.556 | | 6 month BP | | | (2,307 | ) |
| $ | 190 | (a) | | 11/13/22 | | 3.975 | | 3 month LIBOR | | | (2,698 | ) |
| | 270 | (a) | | 11/14/22 | | 4.153 | | 3 month LIBOR | | | (1,759 | ) |
| | 415 | (a) | | 11/26/22 | | 4.088 | | 3 month LIBOR | | | (4,341 | ) |
| | 563 | (a) | | 11/26/22 | | 4.090 | | 3 month LIBOR | | | (5,821 | ) |
| | 199 | (a) | | 11/29/22 | | 3.990 | | 3 month LIBOR | | | (2,792 | ) |
| | 265 | (a) | | 11/29/22 | | 4.030 | | 3 month LIBOR | | | (3,268 | ) |
| | 198 | (a) | | 11/29/22 | | 4.036 | | 3 month LIBOR | | | (2,388 | ) |
| | 198 | (a) | | 11/29/22 | | 4.080 | | 3 month LIBOR | | | (2,013 | ) |
| | 509 | (a) | | 11/29/22 | | 4.102 | | 3 month LIBOR | | | (4,686 | ) |
| | 530 | (a) | | 12/04/22 | | 4.050 | | 3 month LIBOR | | | (6,248 | ) |
| | 389 | (a) | | 12/06/22 | | 4.179 | | 3 month LIBOR | | | (2,444 | ) |
| | 389 | (a) | | 12/06/22 | | 4.184 | | 3 month LIBOR | | | (2,359 | ) |
| | 250 | (a) | | 12/11/22 | | 4.165 | | 3 month LIBOR | | | (1,769 | ) |
| | 375 | (a) | | 12/12/22 | | 4.141 | | 3 month LIBOR | | | (3,053 | ) |
| EUR | 132 | (a) | | 12/19/22 | | 2.757 | | 6 month EURO | | | (1,029 | ) |
| | 132 | (a) | | 12/19/22 | | 2.769 | | 6 month EURO | | | (930 | ) |
| | 132 | (a) | | 12/20/22 | | 2.769 | | 6 month EURO | | | (937 | ) |
| GBP | 103 | | | 09/07/23 | | 6 month BP | | 2.665 | | | 3,903 | |
| JPY | 87,552 | (a) | | 10/08/23 | | 6 month JYOR | | 1.440 | | | 4,924 | |
| EUR | 248 | (a) | | 10/11/23 | | 3.069 | | 6 month EURO | | | (395 | ) |
| GBP | 147 | (a) | | 10/15/23 | | 6 month BP | | 3.858 | | | 970 | |
| EUR | 307 | (a) | | 10/17/23 | | 3.155 | | 6 month EURO | | | 1,051 | |
| GBP | 147 | (a) | | 10/18/23 | | 6 month BP | | 3.763 | | | 1,947 | |
| | 137 | (a) | | 10/18/23 | | 6 month BP | | 3.768 | | | 1,763 | |
| JPY | 30,723 | (a) | | 10/21/23 | | 6 month JYOR | | 1.440 | | | 1,781 | |
| GBP | 109 | (a) | | 10/29/23 | | 6 month BP | | 3.955 | | | 16 | |
| | 109 | (a) | | 10/29/23 | | 6 month BP | | 3.959 | | | (14 | ) |
| | 433 | (a) | | 11/09/23 | | 6 month BP | | 4.018 | | | 1,425 | |
| $ | 668 | (a) | | 11/12/23 | | 4.534 | | 3 month LIBOR | | | (3,808 | ) |
| GBP | 205 | (a) | | 11/12/23 | | 6 month BP | | 4.095 | | | 46 | |
| $ | 257 | (a) | | 11/14/23 | | 4.640 | | 3 month LIBOR | | | (818 | ) |
| | 1,583 | (a) | | 11/26/23 | | 3 month LIBOR | | 4.671 | | | 4,511 | |
| EUR | 924 | (a) | | 12/04/23 | | 3.289 | | 6 month EURO | | | (2,981 | ) |
| | 994 | (a) | | 12/04/23 | | 3.301 | | 6 month EURO | | | (2,784 | ) |
| GBP | 567 | (a) | | 12/04/23 | | 6 month BP | | 3.907 | | | 2,441 | |
| $ | 163 | (a) | | 02/29/24 | | 3 month LIBOR | | 2.882 | | | 3,911 | |
| | 631 | (a) | | 03/10/24 | | 3 month LIBOR | | 3.030 | | | 7,625 | |
| | 580 | (a) | | 12/23/24 | | 4.819 | | 3 month LIBOR | | | (907 | ) |
| JPY | 67,716 | (a) | | 10/08/25 | | 1.949 | | 6 month JYOR | | | (1,533 | ) |
| | 52,786 | (a) | | 10/18/25 | | 6 month JYOR | | 1.990 | | | 871 | |
| | 23,734 | (a) | | 10/21/25 | | 1.961 | | 6 month JYOR | | | (512 | ) |
| $ | 177 | (a) | | 10/30/25 | | 3 month LIBOR | | 3.505 | | | 6,404 | |
| | 236 | (a) | | 11/02/25 | | 3 month LIBOR | | 3.520 | | | 8,384 | |
| | 223 | (a) | | 12/19/26 | | 3 month LIBOR | | 4.229 | | | 2,471 | |
| | 149 | (a) | | 12/20/26 | | 3 month LIBOR | | 4.223 | | | 1,737 | |
| | |
| The accompanying notes are an integral part of these financial statements. | | 29 |
GOLDMAN SACHS MULTI-MANAGER ALTERNATIVES FUND
Schedule of Investments (continued)
December 31, 2013
|
| ADDITIONAL INVESTMENT INFORMATION (continued) |
CENTRALLY CLEARED INTEREST RATE SWAP CONTRACTS (continued)
| | | | | | | | | | | | |
| | | Rates Exchanged | | | |
Notional
Amount
(000s) | | | Termination
Date | | Payments
Received | | Payments
Made | | Unrealized
Gain (Loss)* | |
| | 296 | (a) | | 12/23/26 | | 3 month LIBOR | | 4.303% | | $ | 1,588 | |
| | 219 | (a) | | 12/27/26 | | 3 month LIBOR | | 4.223 | | | 2,664 | |
| | 152 | (a) | | 12/28/26 | | 3 month LIBOR | | 4.270 | | | 1,269 | |
| GBP | 456 | (a) | | 10/09/28 | | 6 month BP | | 4.025 | | | 3,937 | |
| | 285 | (a) | | 10/09/28 | | 6 month BP | | 4.043 | | | 2,172 | |
| JPY | 74,190 | (a) | | 10/18/28 | | 2.435% | | 6 month JYOR | | | (1,062 | ) |
| $ | 169 | (a) | | 11/27/28 | | 3 month LIBOR | | 4.550 | | | 2,589 | |
| | 153 | (a) | | 11/27/28 | | 3 month LIBOR | | 4.559 | | | 2,241 | |
| | 232 | (a) | | 11/27/28 | | 3 month LIBOR | | 4.597 | | | 2,742 | |
| | 155 | (a) | | 11/29/28 | | 3 month LIBOR | | 4.549 | | | 2,370 | |
| | 155 | (a) | | 11/29/28 | | 3 month LIBOR | | 4.553 | | | 2,321 | |
| | 155 | (a) | | 11/29/28 | | 3 month LIBOR | | 4.588 | | | 1,924 | |
| | 169 | (a) | | 12/03/28 | | 3 month LIBOR | | 4.615 | | | 1,797 | |
| | 162 | (a) | | 12/04/28 | | 3 month LIBOR | | 4.627 | | | 1,575 | |
| EUR | 285 | (a) | | 12/04/28 | | 6 month EURO | | 3.573 | | | 1,248 | |
| | 307 | (a) | | 12/04/28 | | 6 month EURO | | 3.585 | | | 1,154 | |
| $ | 163 | (a) | | 12/10/28 | | 3 month LIBOR | | 4.690 | | | 848 | |
| | 417 | (a) | | 12/23/29 | | 3 month LIBOR | | 4.835 | | | 1,408 | |
| JPY | 45,361 | (a) | | 11/01/32 | | 2.606 | | 6 month JYOR | | | (2,638 | ) |
| | 24,261 | (a) | | 10/18/33 | | 6 month JYOR | | 2.660 | | | 1,188 | |
| $ | 415 | (a) | | 11/26/33 | | 3 month LIBOR | | 4.719 | | | 4,381 | |
| | 194 | (a) | | 11/29/33 | | 3 month LIBOR | | 4.680 | | | 2,226 | |
| | 214 | (a) | | 11/29/33 | | 3 month LIBOR | | 4.727 | | | 1,867 | |
| | 390 | (a) | | 12/04/33 | | 3 month LIBOR | | 4.690 | | | 4,273 | |
| | 204 | (a) | | 12/11/33 | | 3 month LIBOR | | 4.721 | | | 1,856 | |
| | 307 | (a) | | 12/12/33 | | 3 month LIBOR | | 4.702 | | | 3,137 | |
| JPY | 50,573 | (a) | | 11/01/37 | | 6 month JYOR | | 2.465 | | | 3,840 | |
| EUR | 293 | (a) | | 12/19/43 | | 6 month EURO | | 2.536 | | | 1,248 | |
| | 293 | (a) | | 12/19/43 | | 6 month EURO | | 2.538 | | | 1,236 | |
| | 293 | (a) | | 12/20/43 | | 6 month EURO | | 2.500 | | | 1,598 | |
| GBP | 92 | | | 01/22/44 | | 6 month BP | | 3.316 | | | 2,758 | |
| | 50 | | | 01/22/44 | | 6 month BP | | 3.348 | | | 1,047 | |
| | TOTAL | | $ | 46,698 | |
| | (a) | | Represents forward starting interest rate swaps whose effective dates of commencement of accruals and cash flows occur subsequent to December 31, 2013. |
| | * | | There are no upfront payments on the swap contract(s), therefore the unrealized gain/loss of the swap contract(s) is equal to their market value. |
| | |
| 30 | | The accompanying notes are an integral part of these financial statements. |
GOLDMAN SACHS MULTI-MANAGER ALTERNATIVES FUND
|
| ADDITIONAL INVESTMENT INFORMATION (continued) |
OVER THE COUNTER CREDIT DEFAULT SWAP CONTRACTS
| | | | | | | | | | | | | | | | | | | | | | | | | | | | | | |
| | | | | | | | | | | | | | | | | | | | Market Value | |
| Counterparty | | Referenced
Obligation | | Notional
Amount
(000s) | | | Rates Received
(Paid) | | | Termination
Date | | | Credit
Spread at
December 31,
2013(b) | | | Upfront
Payments
Made (Received) | | | Unrealized
Gain (Loss) | |
Protection Purchased: | | | | | | | | | | | | | | | | | | | | | | | | | | | | |
Barclays Bank PLC | | Federal Republic of Brazil, 12.250%, 03/06/30 | | | $ | | | | 200 | | | | (1.000 | )% | | | 12/20/16 | | | | 1.323 | % | | $ | 3,333 | | | $ | (1,507 | ) |
| | Intesa Sanpaolo SPA, 4.750%, 06/15/17 | | | EUR | | | | 150 | | | | (3.000 | ) | | | 12/20/18 | | | | 1.376 | | | | (7,365 | ) | | | (8,707 | ) |
| | HCA, Inc., 8.000%, 10/01/18 | | | $ | | | | 160 | | | | (5.000 | ) | | | 12/20/18 | | | | 2.221 | | | | (18,529 | ) | | | (2,394 | ) |
| | Reed Elsevier Investment, 5.625%, 10/20/16 | | | EUR | | | | 150 | | | | (1.000 | ) | | | 03/20/19 | | | | 0.464 | | | | (5,113 | ) | | | (598 | ) |
| | Bank of America Corp., 5.650%, 05/01/18 | | | $ | | | | 150 | | | | (1.000 | ) | | | 03/20/19 | | | | 0.762 | | | | (893 | ) | | | (942 | ) |
Credit Suisse International (London) | | Kingfisher PLC, 5.625%, 12/15/14 | | | EUR | | | | 150 | | | | (1.000 | ) | | | 12/20/18 | | | | 0.603 | | | | (1,254 | ) | | | (2,787 | ) |
Deutsche Bank Securities, Inc. | | JC Penney Corp., 6.375%, 10/15/36 | | | $ | | | | 25 | | | | (5.000 | ) | | | 12/20/16 | | | | 12.376 | | | | 4,472 | | | | (300 | ) |
| | Republic of Korea, 4.875%, 09/22/14 | | | | | | | 50 | | | | (1.000 | ) | | | 12/20/18 | | | | 0.623 | | | | (666 | ) | | | (259 | ) |
| | Republic of Indonesia, 6.875%, 03/09/17 | | | | | | | 30 | | | | (1.000 | ) | | | 12/20/18 | | | | 2.193 | | | | 1,837 | | | | (203 | ) |
| | Intesa Sanpaolo SPA, 4.750%, 06/15/17 | | | EUR | | | | 100 | | | | (3.000 | ) | | | 12/20/18 | | | | 1.376 | | | | (5,578 | ) | | | (5,136 | ) |
| | H.J. Heinz Co., 6.375%, 07/15/28 | | | $ | | | | 275 | | | | (1.000 | ) | | | 12/20/18 | | | | 1.236 | | | | 6,962 | | | | (3,963 | ) |
| | Carlsberg Breweries A/S, 3.375%, 10/13/17 | | | EUR | | | | 100 | | | | (1.000 | ) | | | 12/20/18 | | | | 0.853 | | | | (573 | ) | | | (449 | ) |
| | Rite Aid Corp., 7.700%, 02/15/27 | | | $ | | | | 25 | | | | (5.000 | ) | | | 12/20/18 | | | | 2.571 | | | | (2,535 | ) | | | (327 | ) |
| | Reed Elsevier Investment, 5.625%, 10/20/16 | | | EUR | | | | 150 | | | | (1.000 | ) | | | 03/20/19 | | | | 0.464 | | | | (5,131 | ) | | | (580 | ) |
| | Normura Holdings, Inc., 6.700%, 03/04/20 | | | JPY | | |
|
40,000 |
| | | (1.000 | ) | | | 03/20/19 | | | | 0.724 | | | | (403 | ) | | | (5,133 | ) |
| | Tranches of Commercial Mortgages-Backed Index BBB Series 6 | | | $ | | | | 100 | | | | (3.000 | ) | | | 06/20/63 | | | | 3.234 | | | | 9,253 | | | | (7,661 | ) |
Protection Sold: | | | | | | | | | | | | | | | | | | | | | | | | | | | | | | |
Barclays Bank PLC | | JPMorgan Chase & Co., 4.750%, 03/01/15 | | | | | | | 150 | | | | 1.000 | | | | 03/20/19 | | | | 0.684 | | | | 1,719 | | | | 706 | |
| TOTAL | | | $ | (20,464 | ) | | $ | (40,240 | ) |
| | (b) | | Credit spread on the Referenced Obligation, together with the term of the swap contract, are indicators of payment/performance risk. The likelihood of a credit event occurring which would require a fund to make a payment or otherwise be required to perform under the swap contract is generally greater as the credit spread and the term of the swap contract increase. |
| | |
| The accompanying notes are an integral part of these financial statements. | | 31 |
GOLDMAN SACHS MULTI-MANAGER ALTERNATIVES FUND
Schedule of Investments (continued)
December 31, 2013
|
| ADDITIONAL INVESTMENT INFORMATION (continued) |
CENTRALLY CLEARED CREDIT DEFAULT SWAP CONTRACTS
| | | | | | | | | | | | | | | | | | | | | | |
| | | | Market Value | |
| Referenced Obligation | | Notional
Amount
(000s) | | Rates Received
(Paid) | | | Termination
Date | | | Credit
Spread at
December 31,
2013(b) | | | Upfront
Payments
Made (Received) | | | Unrealized
Gain
(Loss) | |
Protection Purchased: | | | | | | | | | | | | | | | | | | | | | | |
iTraxx Europe Crossover Index 20 | | EUR 211 | | | (5.000 | )% | | | 12/20/18 | | | | 2.867 | % | | $ | (19,261 | ) | | $ | (8,374 | ) |
iTraxx Europe Crossover Index 20 | | 317 | | | (5.000 | ) | | | 12/20/18 | | | | 2.867 | | | | (28,764 | ) | | | (12,689 | ) |
Protection Sold: | | | | | | | | | | | | | | | | | | | | | | |
iTraxx Europe Crossover Index 20 | | 221 | | | 5.000 | | | | 12/20/18 | | | | 2.867 | | | | (23,881 | ) | | | (4,050 | ) |
| TOTAL | | | $ | (71,906 | ) | | $ | (25,113 | ) |
| | (b) | | Credit spread on the Referenced Obligation, together with the term of the swap contract, are indicators of payment/performance risk. The likelihood of a credit event occurring which would require a fund to make a payment or otherwise be required to perform under the swap contract is generally greater as the credit spread and the term of the swap contract increase. |
WRITTEN OPTIONS CONTRACTS — At December 31, 2013, the Fund had the following written options:
CURRENCY WRITTEN OPTION CONTRACTS
| | | | | | | | | | | | | | | | | | |
| Counterparty | | Description | | Notional
Amount
(000s) | | | Expiration
Date | | | Strike
Price | | | Value | |
Bank of America Securities LLC | | Put EUR/Call SEK Strike Price 8.760 | | EUR | 233 | | | | 01/20/14 | | | | 8.760 | | | $ | (953 | ) |
| | Call EUR/Put SEK Strike Price 8.760 | | | 233 | | | | 01/20/14 | | | | 8.760 | | | | (4,541 | ) |
Barclays Bank PLC | | Put USD/Call CAD Strike Price 1.066 | | | $ 411 | | | | 01/03/14 | | | | 1.066 | | | | (1,561 | ) |
| | Call USD/Put CAD Strike Price 1.066 | | | 411 | | | | 01/03/14 | | | | 1.066 | | | | (648 | ) |
| | Put USD/Call NZD Strike Price 0.855 | | | 274 | | | | 03/28/14 | | | | 0.855 | | | | — | |
| | Put EUR/Call AUD Strike Price 1.350 | | EUR | 618 | | | | 05/02/14 | | | | 1.350 | | | | (206 | ) |
| | Call EUR/Put AUD Strike Price 1.480 | | | 618 | | | | 05/02/14 | | | | 1.480 | | | | (44,758 | ) |
Deutsche Bank Securities, Inc. | | Put USD/Call CAD Strike Price 1.044 | | | $ 431 | | | | 05/05/14 | | | | 1.044 | | | | (2,999 | ) |
| | | Call USD/Put CAD Strike Price 1.044 | | | 431 | | | | 05/05/14 | | | | 1.044 | | | | (12,177 | ) |
| TOTAL (Premiums Received $53,503) | | | 3,660 | | | | | | | | | | | $ | (67,843 | ) |
For the period ended December 31, 2013, the Fund had the following written options activity:
CURRENCY WRITTEN OPTION CONTRACTS
| | | | | | | | |
| | | Notional Amount (000s) | | | Premiums
Received | |
Contracts Written | | $ | 7,859 | | | $ | 74,476 | |
Contracts Bought to Close | | | (823 | ) | | | (5,210 | ) |
Contracts Expired | | | (3,376 | ) | | | (15,763 | ) |
Contracts Outstanding December 31, 2013 | | $ | 3,660 | | | $ | 53,503 | |
| | |
| 32 | | The accompanying notes are an integral part of these financial statements. |
GOLDMAN SACHS MULTI-MANAGER ALTERNATIVES FUND
|
| ADDITIONAL INVESTMENT INFORMATION (continued) |
OPTIONS ON FUTURES CONTRACTS
| | | | | | | | | | | | | | | | | | |
| Counterparty | | Description | | Contracts | | | Expiration
Date | | | Strike
Price | | | Value | |
Deutsche Bank Securities, Inc. | | Put-5yr U.S. Treasury Notes Futures Strike Price 119% | | | 10 | | | | 02/21/14 | | | | 1.190 | % | | $ | (4,375 | ) |
| | | Call-Eurodollar Futures Strike Price 99.625 | | | 4 | | | | 09/14/15 | | | | 0.996 | | | | (675 | ) |
| TOTAL (Premiums Received $2,174) | | | 14 | | | | | | | | | | | $ | (5,050 | ) |
For the period ended December 31, 2013, the Fund had the following written options activity:
OPTIONS ON FUTURES CONTRACTS
| | | | | | | | |
| | | Contracts | | | Premiums
Received | |
Contracts Written | | | 192 | | | $ | 68,172 | |
Contracts Bought to Close | | | (111 | ) | | | (48,394 | ) |
Contracts Exercised | | | (7 | ) | | | (1,770 | ) |
Contracts Expired | | | (60 | ) | | | (15,834 | ) |
Contracts Outstanding December 31, 2013 | | | 14 | | | $ | 2,174 | |
| | |
| The accompanying notes are an integral part of these financial statements. | | 33 |
GOLDMAN SACHS MULTI-MANAGER ALTERNATIVES FUND
Schedule of Investments (continued)
December 31, 2013
|
| ADDITIONAL INVESTMENT INFORMATION (continued) |
INTEREST RATE SWAPTION CONTRACTS
| | | | | | | | | | | | | | | | | | |
| Counterparty | | Description | | Notional
Amount
(000s) | | | Expiration
Date | | | Strike
Price | | | Value | |
Credit Suisse International (London) | | Call-OTC USD 3 month LIBOR Strike Price 4.000% | | | $ 2,000 | | | | 04/15/14 | | | | 4.000 | % | | $ | (9,046 | ) |
| | Put-OTC EUR 6 month EURO Strike Price 1.786% | | EUR | 729 | | | | 09/30/14 | | | | 1.786 | | | | (3,526 | ) |
| | Call-OTC EUR 6 month EURO Strike Price 0.860% | | | 1,349 | | | | 10/02/14 | | | | 0.860 | | | | (5,574 | ) |
| | Call-OTC USD 3 month LIBOR Strike Price 4.500% | | | $183 | | | | 09/25/15 | | | | 4.500 | | | | (9,813 | ) |
Deutsche Bank Securities, Inc. | | Call-OTC USD 3 month LIBOR Strike Price 3.220% | | | 1,296 | | | | 05/21/14 | | | | 3.220 | | | | (25,967 | ) |
| | Call-OTC EUR 6 month EURO Strike Price 0.850% | | EUR | 2,591 | | | | 09/24/14 | | | | 0.850 | | | | (10,362 | ) |
| | Put-OTC EUR 6 month EURO Strike Price 0.450% | | | 2,880 | | | | 10/14/14 | | | | 0.450 | | | | (2,508 | ) |
| | Call-OTC GBP 6 month BP Strike Price 3.030% | | GBP | 1,100 | | | | 11/19/14 | | | | 3.030 | | | | (73,950 | ) |
| | Call-OTC GBP 6 month BP Strike Price 4.000% | | | 913 | | | | 09/26/17 | | | | 4.000 | | | | (42,867 | ) |
| | Put-OTC EUR 6 month EURO Strike Price 3.066% | | EUR | 299 | | | | 09/26/18 | | | | 3.066 | | | | (13,866 | ) |
| | Call-OTC EUR 6 month EURO Strike Price 3.066% | | | 299 | | | | 09/26/18 | | | | 3.066 | | | | (13,417 | ) |
Morgan Stanley Capital Services, Inc. | | Call-OTC USD 3 month LIBOR Strike Price 5.035% | | | $243 | | | | 11/19/15 | | | | 5.035 | | | | (7,619 | ) |
| TOTAL (Premiums Received $193,768) | | | 13,882 | | | | | | | | | | | $ | (218,515 | ) |
For the period ended December 31, 2013, the Fund had the following written options activity:
INTEREST RATE SWAPTION CONTRACTS
| | | | | | | | |
| | | Notional Amount (000s) | | | Premiums
Received | |
Contracts Written | | $ | 14,503 | | | $ | 198,368 | |
Contracts Bought to Close | | | (621 | ) | | | (4,600 | ) |
Contracts Outstanding December 31, 2013 | | $ | 13,882 | | | $ | 193,768 | |
| | |
| 34 | | The accompanying notes are an integral part of these financial statements. |
GOLDMAN SACHS MULTI-MANAGER ALTERNATIVES FUND
Statement of Assets and Liabilities
December 31, 2013
| | | | | | |
| | | | | | |
| | Assets: | | | | |
| | Investments, at value (cost $179,007,691) | | $ | 184,726,548 | |
| | Cash | | | 3,178,706 | |
| | Foreign currency, at value (cost $340,681) | | | 342,712 | |
| | Receivables: | | | | |
| | Fund shares sold | | | 3,739,817 | |
| | Variation margin on certain derivative contracts(a) | | | 2,184,036 | |
| | Dividends and interest | | | 769,893 | |
| | Collateral on certain derivative contracts | | | 680,000 | |
| | Unrealized gain on forward foreign currency exchange contracts | | | 618,690 | |
| | Reimbursement from investment adviser | | | 280,332 | |
| | Investments sold on an extended settlement basis | | | 199,625 | |
| | Investments sold | | | 11,055 | |
| | Due from broker | | | 62,821 | |
| | Unrealized gain on swap contracts | | | 33,334 | |
| | Upfront payments made on swap contracts | | | 27,576 | |
| | Foreign tax reclaims | | | 332 | |
| | Unrealized gain on unfunded loan commitment | | | 6 | |
| | Deferred offering costs | | | 317,988 | |
| | Total assets | | | 197,173,471 | |
| | | | | | |
| | Liabilities: | | | | |
| | Payables: | | | | |
| | Investments purchased on an extended settlement basis | | | 2,394,596 | |
| | Investments purchased | | | 2,251,973 | |
| | Unrealized loss on forward foreign currency exchange contracts | | | 511,638 | |
| | Amounts owed to affiliates | | | 302,156 | |
| | Written option contracts, at value (premium received $249,445) | | | 291,408 | |
| | Unrealized loss on swap contracts | | | 104,420 | |
| | Upfront payments received on swap contracts | | | 60,464 | |
| | Fund shares redeemed | | | 27,780 | |
| | Due to broker | | | 3,876 | |
| | Accrued expenses | | | 568,281 | |
| | Total liabilities | | | 6,516,592 | |
| | | | | | |
| | Net Assets: | | | | |
| | Paid-in capital | | | 184,024,022 | |
| | Undistributed net investment income | | | 199,876 | |
| | Net realized gain | | | 64,635 | |
| | Net unrealized gain | | | 6,368,346 | |
| | | NET ASSETS | | $ | 190,656,879 | |
| | | Net Assets: | | | | |
| | | Class A | | $ | 25,303,872 | |
| | | Class C | | | 1,426,727 | |
| | | Institutional | | | 156,849,476 | |
| | | Class IR | | | 7,050,554 | |
| | | Class R | | | 26,250 | |
| | | Total Net Assets | | $ | 190,656,879 | |
| | | Shares Outstanding $0.001 par value (unlimited number of shares authorized): | | | | |
| | | Class A | | | 2,419,279 | |
| | | Class C | | | 137,146 | |
| | | Institutional | | | 14,959,086 | |
| | | Class IR | | | 672,810 | |
| | | Class R | | | 2,514 | |
| | | Net asset value, offering and redemption price per share:(b) | | | | |
| | | Class A | | | $10.46 | |
| | | Class C | | | 10.40 | |
| | | Institutional | | | 10.49 | |
| | | Class IR | | | 10.48 | |
| | | Class R | | | 10.44 | |
| | (a) | | Includes segregated cash of $2,042,845 relating to initial margin requirements on futures transactions. |
| | (b) | | Maximum public offering price per share for Class A Shares is $11.07. At redemption, Class C Shares may be subject to a contingent deferred sales charge, assessed on the amount equal to the lesser of the current net asset value or the original purchase price of the shares. |
| | |
| The accompanying notes are an integral part of these financial statements. | | 35 |
GOLDMAN SACHS MULTI-MANAGER ALTERNATIVES FUND
Statement of Operations
For the Period Ended December 31, 2013(a)
| | | | | | |
| | | | | | |
| | Investment income: | | | | |
| | Interest | | $ | 1,137,754 | |
| | Dividends (net of foreign withholding taxes of $2,691) | | | 325,774 | |
| | Total investment income | | | 1,463,528 | |
| | | | | | |
| | Expenses: | | | | |
| | Management fees | | | 1,461,059 | |
| | Professional fees | | | 403,727 | |
| | Amortization of offering costs | | | 291,618 | |
| | Custody, accounting and administrative services | | | 134,682 | |
| | Trustee fees | | | 110,193 | |
| | Registration fees | | | 93,586 | |
| | Printing and mailing costs | | | 64,666 | |
| | Transfer Agent fees(b) | | | 43,225 | |
| | Distribution and Service fees(b) | | | 19,198 | |
| | Other | | | 82,068 | |
| | Total expenses | | | 2,704,022 | |
| | Less — expense reductions | | | (1,097,259 | ) |
| | Net expenses | | | 1,606,763 | |
| | NET INVESTMENT LOSS | | | (143,235 | ) |
| | | | | | |
| | Realized and unrealized gain (loss): | | | | |
| | Net realized gain (loss) from: | | | | |
| | Investments | | | 695,919 | |
| | Futures contracts | | | 243,432 | |
| | Written options | | | 10,802 | |
| | Swap contracts | | | (94,599 | ) |
| | Forward foreign currency exchange contracts | | | 368,250 | |
| | Foreign currency transactions | | | 51,047 | |
| | Net unrealized gain (loss) on: | | | | |
| | Investments | | | 5,718,857 | |
| | Futures contracts | | | 629,487 | |
| | Unfunded Loan Commitment | | | 6 | |
| | Written options | | | (41,963 | ) |
| | Swap contracts | | | (49,501 | ) |
| | Forward foreign currency exchange contracts | | | 107,052 | |
| | Foreign currency translation | | | 4,408 | |
| | Net realized and unrealized gain | | | 7,643,197 | |
| | NET INCREASE IN NET ASSETS RESULTING FROM OPERATIONS | | $ | 7,499,962 | |
| | (a) | | Commenced operations on April 30, 2013. |
| | (b) | | Class specific Distribution and Service, and Transfer Agent fees were as follows: |
| | | | | | | | | | | | | | | | | | | | | | | | | | | | | | |
Distribution and Service | | | Transfer Agent Fees | |
Class A | | | Class C | | | Class R | | | Class A | | | Class C | | | Institutional | | | Class IR | | | Class R | |
| | 16,569 | | | | 2,544 | | | | 85 | | | | 12,592 | | | | 483 | | | | 25,487 | | | | 4,631 | | | | 32 | |
| | |
| 36 | | The accompanying notes are an integral part of these financial statements. |
GOLDMAN SACHS MULTI-MANAGER ALTERNATIVES FUND
Statement of Changes in Net Assets
For the Period Ended December, 2013(a)
| | | | | | |
| | | | | | |
| | From operations: | | | | |
| | Net investment loss | | $ | (143,235 | ) |
| | Net realized gain | | | 1,274,851 | |
| | Net unrealized gain | | | 6,368,346 | |
| | Net increase in net assets resulting from operations | | | 7,499,962 | |
| | | | | | |
| | Distributions to shareholders: | | | | |
| | From net realized gains | | | | |
| | Class A Shares | | | (115,948 | ) |
| | Class C Shares | | | (5,511 | ) |
| | Institutional Shares | | | (731,502 | ) |
| | Class IR Shares | | | (37,110 | ) |
| | Class R Shares | | | (147 | ) |
| | Total distributions to shareholders | | | (890,218 | ) |
| | | | | | |
| | From share transactions: | | | | |
| | Proceeds from sales of shares | | | 189,767,210 | |
| | Reinvestment of distributions | | | 835,259 | |
| | Cost of shares redeemed | | | (6,655,334 | ) |
| | Net increase in net assets resulting from share transactions | | | 183,947,135 | |
| | TOTAL INCREASE | | | 190,556,879 | |
| | | | | | |
| | Net assets: | | | | |
| | Beginning of period | | $ | 100,000 | |
| | End of period | | $ | 190,656,879 | |
| | Undistributed net Investment Income | | $ | 199,876 | |
| | (a) | | Commenced operations on April 30, 2013. |
| | |
| The accompanying notes are an integral part of these financial statements. | | 37 |
GOLDMAN SACHS MULTI-MANAGER ALTERNATIVES FUND
Financial Highlights
Selected Data for a Share Outstanding Throughout The Period
| | | | | | | | | | | | | | | | | | | | |
| | | | | | | Income (loss) from
investment operations | | | | |
| | | Year - Share Class | | Net asset value, beginning of period | | Net
investment
loss(a) | | | Net realized
and unrealized
gain | | | Total from
investment
operations | | | Distribution
to shareholders
from net
realized gains | |
| | FOR THE PERIOD ENDED DECEMBER 31, | | | | | | | | | | | | | | | | | | |
| | 2013 - A (Commenced April 30, 2013) | | $10.00 | | $ | (0.03 | ) | | $ | 0.55 | | | $ | 0.52 | | | $ | (0.06 | ) |
| | 2013 - C (Commenced April 30, 2013) | | 10.00 | | | (0.08 | ) | | | 0.54 | | | | 0.46 | | | | (0.06 | ) |
| | 2013 - Institutional (Commenced April 30, 2013) | | 10.00 | | | (0.01 | ) | | | 0.56 | | | | 0.55 | | | | (0.06 | ) |
| | 2013 - IR (Commenced April 30, 2013) | | 10.00 | | | (0.01 | ) | | | 0.55 | | | | 0.54 | | | | (0.06 | ) |
| | 2013 - R (Commenced April 30, 2013) | | 10.00 | | | (0.06 | ) | | | 0.56 | | | | 0.50 | | | | (0.06 | ) |
| | (a) | | Calculated based on the average shares outstanding methodology. |
| | (b) | | Assumes investment at the net asset value at the beginning of the period, reinvestment of all dividends and distributions, a complete redemption of the investment at the net asset value at the end of the period and no sales or redemption charges. Total returns would be reduced if a sales or redemption charge was taken into account. Returns do not reflect the deduction of taxes that a shareholder would pay on Fund distributions or the redemption of Fund shares. Total returns for periods less than one full year are not annualized. |
| | (d) | | The Fund’s portfolio turnover rate is calculated in accordance with regulatory requirements, without regard to transactions involving short term investments and certain derivatives. If such transactions were included, the Fund’s portfolio turnover rate may be higher. |
| | |
| 38 | | The accompanying notes are an integral part of these financial statements. |
GOLDMAN SACHS MULTI-MANAGER ALTERNATIVES FUND
| | | | | | | | | | | | | | | | | | | | | | | | | | | | | | | | | | | | | | | | |
| | | | | | | | | | | | | | | | | | | | | | | | | | | | | | | | | | |
| | | Net asset
value, end
of period | | | | | Total
return(b) | | | | | Net assets,
end of
period
(in 000s) | | | | | Ratio of
net expenses
to average
net assets(c) | | | | | Ratio of
total expenses
to average
net assets(c) | | | | | Ratio of net
investment loss
to average
net assets(c) | | | | | Portfolio Turnover Rate(d) | |
| | | | | | | | | | | | | | | | | | | | | | | | | | | | | | | | | | | | | | | | |
| | $ | 10.46 | | | | | | 5.20 | % | | | | $ | 25,304 | | | | | | 2.55 | % | | | | | 3.88 | % | | | | | (0.42 | )% | | | | | 102 | % |
| | | 10.40 | | | | | | 4.60 | | | | | | 1,427 | | | | | | 3.30 | | | | | | 4.72 | | | | | | (1.19 | ) | | | | | 102 | |
| | | 10.49 | | | | | | 5.40 | | | | | | 156,849 | | | | | | 2.15 | | | | | | 3.64 | | | | | | (0.17 | ) | | | | | 102 | |
| | | 10.48 | | | | | | 5.40 | | | | | | 7,051 | | | | | | 2.30 | | | | | | 3.62 | | | | | | (0.19 | ) | | | | | 102 | |
| | | 10.44 | | | | | | 5.00 | | | | | | 26 | | | | | | 2.79 | | | | | | 4.36 | | | | | | (0.90 | ) | | | | | 102 | |
| | |
| The accompanying notes are an integral part of these financial statements. | | 39 |
GOLDMAN SACHS MULTI-MANAGER ALTERNATIVES FUND
Notes to Financial Statements
December 31, 2013
Goldman Sachs Trust II (the “Trust”) is a Delaware statutory trust registered under the Investment Company Act of 1940, as amended (the “Act”), as an open-end management investment company. The Trust includes the Goldman Sachs Multi-Manager Alternatives Fund (the “Fund”). The Fund is a non-diversified portfolio and currently offers five classes of shares: Class A, Class C, Class IR, Class R and Institutional Shares. The Fund commenced operations on April 30, 2013.
Class A Shares are sold with a front-end sales charge of up to 5.50%. Class C Shares are sold with a contingent deferred sales charge (“CDSC”) of 1.00%, which is imposed on redemptions made within 12 months of purchase. Institutional, Class IR and Class R are not subject to a sales charge.
Goldman Sachs Asset Management, L.P. (“GSAM”), an affiliate of Goldman, Sachs & Co. (“Goldman Sachs”), serves as investment adviser to the Fund pursuant to a management agreement (the “Agreement”) with the Trust. The Fund has investment advisory agreements (the “Sub-Advisory Agreements”) with Ares Capital Management II, LLC (“Ares”), Brigade Capital Management, LLC (“Brigade”), First Pacific Advisors, LLC (“FPA”), GAM International Management Limited (“GAM”), Graham Capital Management, L.P. (“GCM”), Halcyon Liquid Strategies IC Management LP (“Halcyon”) and Lateef Investment Management, L.P. (“Lateef”) (the “Underlying Managers”). Pursuant to the terms of the Sub-Advisory Agreements, the Underlying Managers are responsible for making investment decisions and managing the investments of the Fund. GSAM compensates the Underlying Managers directly in accordance with the terms of the Sub-Advisory Agreements. The Fund is not charged any separate or additional investment advisory fees by the Subadvisors.
|
| 2. SIGNIFICANT ACCOUNTING POLICIES |
The financial statements have been prepared in accordance with accounting principles generally accepted in the United States of America (“GAAP”) and require management to make estimates and assumptions that may affect the reported amounts and disclosures. Actual results may differ from those estimates and assumptions.
A. Investment Valuation — The Fund’s valuation policy is to value investments at fair value.
B. Investment Income and Investments — Investment income includes interest income and dividend income, net of any foreign withholding taxes, less any amounts reclaimable. Interest income is accrued daily and adjusted for amortization of premiums and accretion of discounts. Dividend income is recognized on ex-dividend date or, for certain foreign securities, as soon as such information is obtained subsequent to the ex-dividend date. Investment transactions are reflected on trade date. Realized gains and losses are calculated using identified cost. Investment transactions are recorded on the following business day for daily net asset value (“NAV”) calculations. Any foreign capital gains tax is accrued daily based upon net unrealized gains, and is payable upon sale of such investments. Distributions received from the Fund’s investments in U.S. real estate investment trusts (“REITs”) may be characterized as ordinary income, net capital gain or a return of capital. A return of capital is recorded by the Fund as a reduction to the cost basis of the REIT.
For derivative contracts, realized gains and losses are recorded upon settlement of the contract. Upfront payments are made or received upon entering into a swap agreement and are reflected as such in the Statement of Assets and Liabilities. Upfront payments are recognized over the contract’s term/event as realized gains or losses, with the exception of forward starting interest rate swaps whose realized gains or losses are recognized from the effective start date. For securities with paydown provisions, principal payments received are treated as a proportionate reduction to the cost basis of the securities, and excess or shortfall amounts are recorded as gains or losses. For treasury inflation protected securities (“TIPS”), adjustments to principal due to inflation/deflation are reflected as increases/decreases to interest income with a corresponding adjustment to cost.
C. Class Allocations and Expenses — Investment income, realized and unrealized gain (loss), and non-class specific expenses of the Fund are allocated daily based upon the proportion of net assets of each class. Class specific expenses, where applicable, are borne by the respective share classes and include Distribution and Service, and Transfer Agent fees. Non-class specific expenses directly incurred by the Fund are charged to the Fund.
40
GOLDMAN SACHS MULTI-MANAGER ALTERNATIVES FUND
|
| 2. SIGNIFICANT ACCOUNTING POLICIES (continued) |
D. Offering and Organization Costs — Offering costs paid in connection with the offering of shares of the Fund are being amortized on a straight-line basis over 12 months from the date of commencement of operations. Organization costs paid in connection with the organization of the Fund have been borne directly by GSAM.
E. Federal Taxes and Distributions to Shareholders — It is the Fund’s policy to comply with the requirements of the Internal Revenue Code of 1986, as amended (the “Code”), applicable to regulated investment companies (mutual funds) and to distribute each year substantially all of its investment company taxable income and capital gains to its shareholders. Accordingly, the Fund is not required to make any provisions for the payment of federal income tax. Distributions to shareholders are recorded on the ex-dividend date. Income and capital gains distributions, if any, are declared and paid annually.
Net capital losses are carried forward to future fiscal years and may be used to the extent allowed by the Code to offset any future capital gains. Losses that are carried forward will retain their character as either short-term or long-term capital losses. Utilization of capital loss carryforwards will reduce the requirement of future capital gains distributions.
The characterization of distributions to shareholders for financial reporting purposes is determined in accordance with federal income tax rules, which may differ from GAAP. The source of the Fund’s distributions may be shown in the accompanying financial statements as either from net investment income, net realized gain or capital. Certain components of the Fund’s net assets on the Statement of Assets and Liabilities reflect permanent GAAP/tax differences based on the appropriate tax character.
F. Foreign Currency Translation — The accounting records and reporting currency of the Fund are maintained in United States (“U.S.”) dollars. Assets and liabilities denominated in foreign currencies are translated into U.S. dollars using the current exchange rates at the close of each business day. The effect of changes in foreign currency exchange rates on investments is included within net realized and unrealized gain (loss) on investments. Changes in the value of other assets and liabilities as a result of fluctuations in foreign exchange rates are included in the Statement of Operations within net change in unrealized gain (loss) on foreign currency transactions. Transactions denominated in foreign currencies are translated into U.S. dollars on the date the transaction occurred, the effects of which are included within net realized gain (loss) on foreign currency transactions.
| | |
| 3. INVESTMENTS AND FAIR VALUE MEASUREMENTS | | |
The fair value of a financial instrument is the amount that would be received to sell an asset or paid to transfer a liability in an orderly transaction between market participants at the measurement date (i.e., the exit price). GAAP establishes a fair value hierarchy that prioritizes the inputs to valuation techniques used to measure fair value. The hierarchy gives the highest priority to unadjusted quoted prices in active markets for identical assets or liabilities (Level 1 measurements) and the lowest priority to unobservable inputs (Level 3 measurements). The levels used for classifying investments are not necessarily an indication of the risk associated with investing in these investments. The three levels of the fair value hierarchy are described below:
Level 1 — Unadjusted quoted prices in active markets that are accessible at the measurement date for identical, unrestricted assets or liabilities;
Level 2 — Quoted prices in markets that are not active or financial instruments for which significant inputs are observable (including, but not limited to, quoted prices for similar investments, interest rates, foreign exchange rates, volatility and credit spreads), either directly or indirectly;
Level 3 — Prices or valuations that require significant unobservable inputs (including GSAM’s assumptions in determining fair value measurement).
The Trustees have adopted Valuation Procedures that govern the valuation of the portfolio investments held by the Fund, including investments for which market quotations are not readily available. The Trustees have delegated to GSAM day-to-day responsibility for implementing and maintaining internal controls and procedures related to the valuation of the Fund’s portfolio investments. To assess the continuing appropriateness of pricing sources and methodologies, GSAM regularly performs price verification procedures and issues challenges as necessary to third party pricing vendors or brokers, and any differences are reviewed in accordance with the Valuation Procedures.
41
GOLDMAN SACHS MULTI-MANAGER ALTERNATIVES FUND
Notes to Financial Statements (continued)
December 31, 2013
|
| 3. INVESTMENTS AND FAIR VALUE MEASUREMENTS (continued) |
A. Level 1 and Level 2 Fair Value Investments — The valuation techniques and significant inputs used in determining the fair values for investments classified as Level 1 and Level 2 are as follows:
Equity Securities — Equity securities and investment companies traded on a U.S. securities exchange or the NASDAQ system, or those located on certain foreign exchanges, including but not limited to the Americas, are valued daily at their last sale price or official closing price on the principal exchange or system on which they are traded. If no sale occurs, equity securities and exchange traded investment companies are valued at the last bid price for long positions and at the last ask price for short positions. Investments in investment companies (other than those that are exchange traded) are valued at the NAV on the valuation date. To the extent these investments are actively traded, they are classified as Level 1 of the fair value hierarchy.
Unlisted equity securities for which market quotations are available are valued at the last sale price on the valuation date, or if no sale occurs, at the last bid price. Securities traded on certain foreign securities exchanges are valued daily at fair value determined by an independent fair value service (if available) under Valuation Procedures approved by the Trustees and consistent with applicable regulatory guidance. The independent fair value service takes into account multiple factors including, but not limited to, movements in the securities markets, certain depositary receipts, futures contracts and foreign currency exchange rates that have occurred subsequent to the close of the foreign securities exchange. These investments are generally classified as Level 2 of the fair value hierarchy.
Debt Securities — Debt securities for which market quotations are readily available are valued daily on the basis of quotations supplied by dealers or an independent pricing service approved by the Trustees. The pricing services may use valuation models or matrix pricing, which consider: (i) yield or price with respect to bonds that are considered comparable in characteristics such as rating, interest rate and maturity date or (ii) quotations from securities dealers to determine current value. Short-term debt obligations that mature in sixty days or less and that do not exhibit signs of credit deterioration are valued at amortized cost, which approximates fair value. With the exception of treasury securities of G8 countries (not held in money market funds), which are generally classified as Level 1, these investments are generally classified as Level 2 of the fair value hierarchy.
i. Senior Term Loans — Senior Term Loans (“Loans”) are interests in amounts owed by corporate, governmental, or other borrowers to lenders or lending syndicates. Loans are arranged through private negotiations between the borrower and one or more financial institutions (“Lenders”). A Fund’s investments in Loans are in the form of either participations in Loans (“Participations”) or assignments of all or a portion of Loans from third parties (“Assignments”). With respect to Participations, a Fund has the right to receive payments of principal, interest and any fees to which it is entitled from the Lender selling the Participations and only upon receipt by the Lender of the payments from the borrower. A Fund generally has no right to enforce compliance by the borrower with the terms of the loan agreement with respect to Participations. Conversely, Assignments result in the Fund having a direct contractual relationship with the borrower, and a Fund may enforce compliance by the borrower with the terms of the loan agreement.
The Fund may also enter into certain credit arrangements, all or a portion of which may be unfunded. Unfunded loan commitments represent the remaining obligation of a Fund to the borrower. A Fund is obligated to fund these commitments at the borrower’s discretion. A Fund may receive a commitment fee based on the undrawn portion of the underlying line of credit of a Loan. All Loans and unfunded loan commitments involve interest rate risk, liquidity risk and credit risk, including the potential default or insolvency of the borrower. Loans, including unfunded loan commitments, are marked to market daily using pricing vendor quotations and the change in value, if any, is recorded as an unrealized gain or loss.
ii. Treasury Inflation Protected Securities — TIPS are treasury securities in which the principal amount is adjusted daily to keep pace with inflation, as measured by the U.S. Consumer Pricing Index for Urban Consumers. The repayment of the original bond principal upon maturity is guaranteed by the full faith and credit of the U.S. Government.
Derivative Contracts — A derivative is an instrument whose value is derived from underlying assets, indices, reference rates or a combination of these factors.
Exchange-traded derivatives, including futures contracts, typically fall within Level 1 of the fair value hierarchy. Over-the-counter (“OTC”) derivatives are valued using market transactions and other market evidence, including market-based inputs to
42
GOLDMAN SACHS MULTI-MANAGER ALTERNATIVES FUND
|
| 3. INVESTMENTS AND FAIR VALUE MEASUREMENTS (continued) |
models, calibration to market-clearing transactions, broker or dealer quotations, or other alternative pricing sources. Where models are used, the selection of a particular model to value an OTC derivative depends upon the contractual terms of, and specific risks inherent in, the instrument, as well as the availability of pricing information in the market. Valuation models require a variety of inputs, including contractual terms, market prices, yield curves, credit curves, measures of volatility, voluntary and involuntary prepayment rates, loss severity rates and correlations of such inputs. For OTC derivatives that trade in liquid markets, model inputs can generally be verified and model selection does not involve significant management judgment. OTC derivatives are classified within Level 2 of the fair value hierarchy when significant inputs are corroborated by market evidence.
i. Forward Foreign Currency Exchange Contracts — In a forward foreign currency contract, a Fund agrees to receive or deliver a fixed quantity of one currency for another, at a pre-determined price at a future date. All forward foreign currency exchange contracts are marked-to-market daily at the applicable forward rate.
ii. Futures Contracts — Futures contracts are contracts to buy or sell a standardized quantity of a specified commodity or security and are valued based on exchanged settlement prices or independent market quotes. Futures contracts are valued at the last settlement price, or in the absence of a sale, the last bid price for long positions and at the last ask price for short positions, at the end of each day on the board of trade or exchange upon which they are traded. Upon entering into a futures contract, a Fund deposits cash or securities in an account on behalf of the broker in an amount sufficient to meet the initial margin requirement. Subsequent payments are made or received by the Fund equal to the daily change in the contract value and are recorded as variation margin receivable or payable with a corresponding offset to unrealized gains or losses.
iii. Options — When a Fund writes call or put options, an amount equal to the premium received is recorded as a liability and is subsequently marked-to-market to reflect the current value of the option written. Swaptions are options on interest rate swap contracts. Options on a futures contract may be written with premiums to be determined on a future date. The premiums for these options are based upon implied volatility parameters at specified terms.
Upon the purchase of a call option or a put option by a Fund, the premium paid is recorded as an investment and subsequently marked-to-market to reflect the current value of the option. Certain options may be purchased with premiums to be determined on a future date. The premiums for these options are based upon implied volatility parameters at specified terms.
iv. Swap Contracts — Bilateral swap contracts are agreements in which a Fund and a counterparty agree to exchange periodic payments on a specified notional amount or make a net payment upon termination. Bilateral swap transactions are privately negotiated in the OTC market and payments are settled through direct payments between a Fund and the counterparty. By contrast, certain swap transactions are subject to mandatory central clearing. These swaps are executed through a derivatives clearing member (“DCM”), acting in an agency capacity, and submitted to a central counterparty (“CCP”) (“centrally cleared swaps”), in which case all payments are settled with the CCP through the DCM. Swaps are marked-to-market daily using pricing vendor quotations, counterparty or clearinghouse prices or model prices, and the change in value, if any, is recorded as an unrealized gain or loss. Upon entering into a swap contract, a Fund is required to satisfy an initial margin requirement by delivering cash or securities to the counterparty (or in some cases, segregated in a triparty account on behalf of the counterparty), which can be adjusted by any mark-to-market gains or losses pursuant to bilateral or centrally cleared arrangements. For centrally cleared swaps the daily change in valuation, if any, is recorded as a receivable or payable for variation margin.
An interest rate swap is an agreement that obligates two parties to exchange a series of cash flows at specified intervals, based upon or calculated by reference to changes in interest rates on a specified notional principal amount. The payment flows are usually netted against each other, with the difference being paid by one party to the other.
A credit default swap is an agreement that involves one party (the buyer of protection) making a stream of payments to another party (the seller of protection) in exchange for the right to receive protection on a reference security or obligation including a group of assets or exposure to the performance of an index. A Fund’s investment in credit default swaps may involve greater risks than if the Fund had invested in the referenced obligation directly. Credit events are contract specific but may include bankruptcy, failure to pay, restructuring and obligation acceleration. If a Fund buys protection through a credit
43
GOLDMAN SACHS MULTI-MANAGER ALTERNATIVES FUND
Notes to Financial Statements (continued)
December 31, 2013
|
| 3. INVESTMENTS AND FAIR VALUE MEASUREMENTS (continued) |
default swap and no credit event occurs, its payments are limited to the periodic payments previously made to the counterparty. Upon the occurrence of a specified credit event, a Fund, as a buyer of credit protection, is entitled to receive an amount equal to the notional amount of the swap and deliver to the seller the defaulted reference obligation in a physically settled trade. A Fund may also receive a net settlement amount in the form of cash or securities equal to the notional amount of the swap reduced by the recovery value of the reference obligation in cash settled trade.
As a seller of protection, a Fund generally receives a payment stream throughout the term of the swap, provided that there is no credit event. In addition, if a Fund sells protection through a credit default swap, a Fund could suffer a loss because the value of the referenced obligation and the premium payments received may be less than the notional amount of the swap paid to the buyer of protection. Upon the occurrence of a specified credit event, a Fund, as a seller of credit protection, may be required to take possession of the defaulted reference obligation and pay the buyer an amount equal to the notional amount of the swap in a physically settled trade. A Fund may also pay a net settlement amount in the form of cash or securities equal to the notional amount of the swap reduced by the recovery value of the reference obligation in cash settled trade. Recovery values are at times established through the credit event auction process in which market participants are ensured that a transparent price has been set for the defaulted security or obligation. In addition, a Fund is entitled to a return of any assets, which have been pledged as collateral to the counterparty.
The maximum potential amount of future payments (undiscounted) that a Fund as seller of protection could be required to make under a credit default swap would be an amount equal to the notional amount of the agreement. These potential amounts would be partially offset by any recovery values of the respective referenced obligations or net amounts received from a settlement of a credit default swap for the same reference security or obligation where a Fund bought credit protection.
A total return swap is an agreement that gives a Fund the right to receive the appreciation in the value of a specified security, index or other instrument in return for a fee paid to the counterparty, which will typically be an agreed upon interest rate. If the underlying asset declines in value over the term of the swap, a Fund may also be required to pay the dollar value of that decline to the counterparty.
B. Level 3 Fair Value Investments — To the extent that the aforementioned significant inputs are unobservable, or if quotations are not readily available, or if GSAM believes that such quotations do not accurately reflect fair value, the fair value of the Fund’s investments may be determined under Valuation Procedures approved by the Trustees. GSAM, consistent with its procedures and applicable regulatory guidance, may make an adjustment to the most recent valuation prices of either domestic or foreign securities in light of significant events to reflect what it believes to be the fair value of the securities at the time of determining a Fund’s NAV. Significant events which could affect a large number of securities in a particular market may include, but are not limited to: significant fluctuations in U.S. or foreign markets; market dislocations; market disruptions; or unscheduled market closings. Significant events which could also affect a single issuer may include, but are not limited to: corporate actions such as reorganizations, mergers and buy outs, ratings downgrades; and bankruptcies.
To the extent investments are valued using single source broker quotations obtained directly from the broker or passed through from a third party pricing vendors such investments are classified as Level 3 investments.
44
GOLDMAN SACHS MULTI-MANAGER ALTERNATIVES FUND
|
| 3. INVESTMENTS AND FAIR VALUE MEASUREMENTS (continued) |
C. Fair Value Hierarchy — The following is a summary of the Fund’s investments and derivatives classified in the fair value hierarchy as of December 31, 2013:
| | | | | | | | | | | | |
| | | |
| Investment Type | | Level 1 | | | Level 2 | | | Level 3 | |
| Assets | | | | | | | | | | | | |
Common Stocks | | | | | | | | | | | | |
North and South America | | $ | 51,912,006 | | | $ | — | | | $ | — | |
Other | | | 2,230,523 | | | | 273,396 | (a) | | | — | |
Preferred Stocks | | | — | | | | 514,019 | | | | — | |
Fixed Income | | | | | | | | | | | | |
Corporate Obligations | | | — | | | | 40,259,847 | | | | — | |
U.S. Treasury Obligations and/or Other U.S. Government Agencies | | | 18,281,267 | | | | 178,287 | | | | — | |
Foreign Debt Obligations | | | 1,607,206 | | | | 3,018,733 | | | | — | |
Municipal Debt Obligations | | | — | | | | 247,306 | | | | — | |
Senior Term Loans | | | — | | | | 9,767,340 | | | | 1,382,127 | |
Unfunded Loan Commitments(b) | | | — | | | | 6 | | | | — | |
Investment Company | | | 54,510,443 | | | | — | | | | — | |
| Total | | $ | 128,541,445 | | | $ | 54,258,934 | | | $ | 1,382,127 | |
| | | |
| Derivative Type | | | | | | | | | |
| Assets | | | | | | | | | | | | |
Options Purchased | | $ | — | | | $ | 544,048 | | | $ | — | |
Forward Foreign Currency Exchange Contracts(b) | | | — | | | | 618,690 | | | | — | |
Futures Contracts(b) | | | 952,301 | | | | — | | | | — | |
Interest Rate Swap Contracts(b) | | | — | | | | 238,646 | | | | — | |
Credit Default Swap Contracts(b) | | | — | | | | 706 | | | | — | |
| Total | | $ | 952,301 | | | $ | 1,402,090 | | | $ | — | |
| Liabilities | | | | | | | | | | | | |
Forward Foreign Currency Exchange Contracts(b) | | $ | — | | | $ | (511,638 | ) | | $ | — | |
Futures Contracts(b) | | | (322,814 | ) | | | — | | | | — | |
Interest Rate Swap Contracts(b) | | | — | | | | (222,794 | ) | | | — | |
Credit Default Swap Contracts(b) | | | — | | | | (66,059 | ) | | | — | |
Written Options Contracts | | | — | | | | (291,408 | ) | | | — | |
| Total | | $ | (322,814 | ) | | $ | (1,091,899 | ) | | $ | — | |
| (a) | | To adjust for the time difference between local market close and the calculation of net asset value, the Fund utilizes fair value model prices for international equities provided by an independent fair value service resulting in a Level 2 classification. |
| (b) | | Amount shown represents unrealized gain (loss) at period end. |
For further information regarding security characteristics, see the Schedule of Investments.
45
GOLDMAN SACHS MULTI-MANAGER ALTERNATIVES FUND
Notes to Financial Statements (continued)
December 31, 2013
|
| 4. INVESTMENTS IN DERIVATIVES |
The following table sets forth, by certain risk types, the gross value of derivative contracts as of December 31, 2013. These instruments were used to meet the Fund’s investment objectives and to obtain and/or manage exposure related to the risks below. The values in the table below exclude the effects of cash collateral received or posted pursuant to these derivative contracts, and therefore are not representative of the Fund’s net exposure.
| | | | | | | | | | | | |
| Risk | | Statement of Assets and Liabilities | | Assets | | | Statement of Assets and Liabilities | | Liabilities | |
Interest Rate | | Receivable for unrealized gain on swap contracts; Variation margin on certain derivative contracts; Investments, at value | | $ | 879,751 | (a) | | Payable for unrealized loss on swap contracts; Variation margin on certain derivative contracts; Options written, at value | | $ | (769,173) | (a)(b) |
Credit | | Receivable for unrealized gain on swap contracts | | | 706 | | | Payable for unrealized loss on swap contracts; Variation margin on certain derivative contracts | | | (66,059) | (a)(b) |
Equity | | Variation margin on certain derivative contracts | | | 688,196 | (a) | | — | | | — | |
Currency | | Receivable for unrealized gain on forward foreign currency exchange contracts; Investments, at value | | | 785,738 | | | Payable for unrealized loss on forward foreign currency exchange contracts; Options written, at value | | | (579,481) | |
| Total | | $ | 2,354,391 | | | | | $ | (1,414,713) | |
| (a) | | Includes unrealized gain (loss) on futures contracts and centrally cleared swaps contracts described in the Additional Investment Information sections of the Schedule of Investments. Only current day’s variation margin is reported within the Statement of Assets and Liabilities. |
| (b) | | Aggregate of amounts includes $104,420 which represents the payments to be made pursuant to bilateral agreements should counterparties exercise their “right to terminate” provisions based on, among others, the Fund’s performance, its failure to pay on its obligations or failure to pledge collateral. The amount does not include incremental charges directly associated with the close-out of the agreements. It also does not reflect the fair value of any assets pledged as collateral which, through the daily margining process, substantially offsets the aforementioned amounts and for which the Fund is entitled to a full return. |
The following table sets forth, by certain risk types, the Fund’s gains (losses) related to these derivatives and their indicative volumes for the period ended December 31, 2013. These gains (losses) should be considered in the context that these derivative contracts may have been executed to economically hedge certain investments, and accordingly, certain gains (losses) on such derivative contracts may offset certain (losses) gains attributable to investments. These gains (losses) are included in “Net realized gain (loss)” or “Net change in unrealized gain (loss)” on the Statement of Operations:
| | | | | | | | | | | | | | |
| Risk | | Statement of Operations | | Net
Realized
Gain (Loss) | | | Net
Unrealized
Gain (Loss) | | | Average
Number of
Contracts(a) | |
| Interest rate | | Net realized gain (loss) from investments, futures contracts, swap contracts and written options/Net unrealized gain (loss) on investments, futures contracts, swap contracts and written options | | $ | (267,929 | ) | | $ | (56,143 | ) | | | 535 | |
| Credit | | Net realized gain (loss) from swap contracts/Net unrealized gain (loss) on swap contracts | | | (4,414 | ) | | | (65,353 | ) | | | 6 | |
| Equity | | Net realized gain (loss) from investments, futures contracts and swap contracts/Net unrealized gain (loss) on futures contracts | | | 369,286 | | | | 688,196 | | | | 135 | |
| Currency | | Net realized gain (loss) from investments, forward foreign currency exchange contracts and written options/Net unrealized gain (loss) on investments, forward foreign currency exchange contracts and written options | | | 292,120 | | | | 149,435 | | | | 217 | |
| Total | | | | $ | 389,063 | | | $ | 716,135 | | | | 893 | |
| (a) | | Average number of contracts is based on the average of month end balances for the period ended December 31, 2013. |
46
GOLDMAN SACHS MULTI-MANAGER ALTERNATIVES FUND
|
| 4. INVESTMENTS IN DERIVATIVES (continued) |
The Financial Accounting Standards Board (“FASB”) issued an Accounting Standards Update (“ASU”) No. 2011-11: Disclosures about Offsetting Assets and Liabilities (“netting”) on the Statement of Assets and Liabilities that are subject to master netting arrangements or similar agreements. ASU 2011-11 was amended by ASU No. 2013-01, clarifying which investments and transactions are subject to the netting disclosure. The scope of the disclosure requirements is limited to derivative instruments, repurchase agreements and reverse repurchase agreements, and securities borrowing and securities lending transactions. This information is intended to enable users of the Fund’s financial statements to evaluate the effect or potential effect of netting arrangements on the Fund’s financial position.
For financial reporting purposes, the Fund does not offset financial assets and financial liabilities that are subject to master netting arrangements or similar agreements on the Statement of Assets and Liabilities.
In order to better define its contractual rights and to secure rights that will help a Fund mitigate its counterparty risk, a Fund may enter into an International Swaps and Derivatives Association, Inc. Master Agreement (“ISDA Master Agreement”) or similar agreement with its derivatives’ counterparties. An ISDA Master Agreement is a bilateral agreement between a Fund and a counterparty that governs OTC derivatives, including foreign exchange contracts, and typically contains, among other things, collateral posting terms and netting provisions in the event of a default and/or termination event. The provisions of the ISDA Master Agreement typically permit a single net payment in the event of a default (close-out netting) or similar event, including the bankruptcy or insolvency of the counterparty.
Collateral and margin requirements differ between exchange traded derivatives and OTC derivatives. Margin requirements are established by the broker or clearing house for exchange-traded and centrally cleared derivatives (financial futures contracts, options and centrally cleared swaps) pursuant to governing agreements for those instrument types. Brokers can ask for margin in excess of the minimum in certain circumstances. Collateral terms are contract-specific for OTC derivatives (foreign currency exchange contracts, options and certain swaps). For derivatives traded under an ISDA Master Agreement, the collateral requirements are typically calculated by netting the marked-to-market amount for each transaction under such agreement and comparing that amount to the value of any collateral currently pledged by a Fund and the counterparty. Additionally, a Fund may be required to post initial margin to the counterparty, the terms of which would be outlined in the confirmation of the OTC transaction.
For financial reporting purposes, cash collateral that has been pledged to cover obligations of a Fund and cash collateral received from the counterparty, if any, is reported separately on the Statement of Assets and Liabilities as receivables/payables for collateral on certain derivative contracts. Non-cash collateral pledged by a Fund, if any, is noted in the Schedule of Investments. Generally, the amount of collateral due from or to a counterparty must exceed a minimum transfer amount threshold before a transfer is required to be made. To the extent amounts due to a Fund from its counterparties are not fully collateralized, contractually or otherwise, the Fund bears the risk of loss from counterparty nonperformance. A Fund attempts to mitigate counterparty risk by only entering into agreements with counterparties that it believes to be of good standing and by monitoring the financial stability of those counterparties.
Additionally, the netting of assets and liabilities and the offsetting of collateral pledged or received are based on contractual netting/set-off provisions in the ISDA Master Agreement or similar agreements. However, in the event of a default or insolvency of a counterparty, a court could determine that such rights are not enforceable due to the restrictions or prohibitions against the right of setoff that may be imposed due to a particular jurisdiction’s bankruptcy or insolvency laws.
The following tables set forth the Fund’s net exposure for derivative instruments that are subject to enforceable master netting arrangements or similar agreements as of December 31, 2013:
| | | | | | | | | | | | | | | | | | | | | | | | | | | | | | | | | | | | | | | | | | | | | | | | |
| | | Derivative Assets(1) | | | Derivative Liabilities(1) | | | Net
Derivative
Assets
(Liabilities) | | | | | | | |
| Counterparty | | Options
Purchased | | | Swaps | | | Forward
Currency
Contracts | | | Futures | | | Total | | | Swaps | | | Forward
Currency
Contracts | | | Options | | | Total | | | | Collateral
(Received)
Pledged(1) | | | Net
Amount(2) | |
Barclays Bank PLC | | $ | 139,829 | | | $ | 8,947 | | | $ | 104,958 | | | $ | — | | | $ | 253,734 | | | $ | (26,717 | ) | | $ | (90,908 | ) | | $ | (47,173 | ) | | $ | (164,798 | ) | | $ | 88,936 | | | $ | — | | | $ | 88,936 | |
Bank of America Securities LLC | | | 6,665 | | | | 6,680 | | | | — | | | | — | | | | 13,345 | | | | (7,527 | ) | | | — | | | | (5,494 | ) | | | (13,021 | ) | | | 324 | | | | — | | | | 324 | |
47
GOLDMAN SACHS MULTI-MANAGER ALTERNATIVES FUND
Notes to Financial Statements (continued)
December 31, 2013
|
| 4. INVESTMENTS IN DERIVATIVES (continued) |
| | | | | | | | | | | | | | | | | | | | | | | | | | | | | | | | | | | | | | | | | | | | | | | | |
| | | Derivative Assets(1) | | | Derivative Liabilities(1) | | | Net
Derivative
Assets
(Liabilities) | | | | | | | |
| Counterparty | | Options
Purchased | | | Swaps | | | Forward
Currency
Contracts | | | Futures | | | Total | | | Swaps | | | Forward
Currency
Contracts | | | Options | | | Total | | | | Collateral
(Received)
Pledged(1) | | | Net
Amount(2) | |
Citibank NA | | $ | — | | | $ | 364 | | | $ | 61,871 | | | $ | — | | | $ | 62,235 | | | $ | (588 | ) | | $ | — | | | $ | — | | | $ | (588 | ) | | $ | 61,647 | | | $ | — | | | $ | 61,647 | |
Credit Suisse International (London) | | | 82,881 | | | | — | | | | 118,031 | | | | — | | | | 200,912 | | | | (2,787 | ) | | | (202,070 | ) | | | (27,959 | ) | | | (232,816 | ) | | | (31,904 | ) | | | — | | | | (31,904 | ) |
Deutsche Bank Securities, Inc. | | | 284,470 | | | | 16,896 | | | | — | | | | — | | | | 301,366 | | | | (66,801 | ) | | | — | | | | (203,163 | ) | | | (269,964 | ) | | | 31,402 | | | | — | | | | 31,402 | |
Deutsche Bank AG (London) | | | — | | | | — | | | | 38,411 | | | | — | | | | 38,411 | | | | — | | | | (97,383 | ) | | | — | | | | (97,383 | ) | | | (58,972 | ) | | | — | | | | (58,972 | ) |
JP Morgan Securities, Inc. | | | — | | | | — | | | | — | | | | — | | | | — | | | | — | | | | (530 | ) | | | — | | | | (530 | ) | | | (530 | ) | | | — | | | | (530 | ) |
Merrill Lynch International Bank Ltd.(3) | | | 14,582 | | | | — | | | | 295,223 | | | | — | | | | 309,805 | | | | — | | | | (120,747 | ) | | | — | | | | (120,747 | ) | | | 189,058 | | | | — | | | | 189,058 | |
Merrill Lynch International Bank Ltd.(3) | | | — | | | | — | | | | 196 | | | | — | | | | 196 | | | | — | | | | — | | | | — | | | | — | | | | 196 | | | | — | | | | 196 | |
Morgan Stanley Capital Services, Inc. | | | 15,621 | | | | 447 | | | | — | | | | — | | | | 16,068 | | | | — | | | | — | | | | (7,619 | ) | | | (7,619 | ) | | | 8,449 | | | | — | | | | 8,449 | |
Total | | $ | 544,048 | | | $ | 33,334 | | | $ | 618,690 | | | $ | — | | | $ | 1,196,072 | | | $ | (104,420 | ) | | $ | (511,638 | ) | | $ | (291,408 | ) | | $ | (907,466 | ) | | $ | 288,606 | | | $ | — | | | $ | 288,606 | |
| (1) | | Gross amounts available for offset but not netted in the Statement of Assets and Liabilities. |
| (2) | | Net amount represents the net amount due (to) from counterparty in the event of a default based on the contractual set-off rights under the agreement. Net amount excludes any over-collateralized amounts. |
| (3) | | Derivative contracts were executed through separate Underlying Managers. |
| | |
| 5. AGREEMENTS AND AFFILIATED TRANSACTIONS | | |
A. Management Agreement — Under the Agreement, GSAM manages the Fund, subject to the general supervision of the Trustees.
As compensation for the services rendered pursuant to the Agreement, the assumption of the expenses related thereto and administration of the Fund’s business affairs, including providing facilities, GSAM is entitled to a management fee, accrued daily and paid monthly, equal to an annual percentage rate of the Fund’s average daily net assets.
For the period ended December 31, 2013, the contractual and effective net management fee with GSAM was at the following rates:
| | | | | | | | | | | | | | | | | | |
| Contractual Management Fee Rate | |
First
$2 billion | | | Next
$3 billion | | | Next
$3 billion | | | Over
$8 billion | | | Effective Management
Fee Rate | |
| | 2.00% | | | | 1.80% | | | | 1.71% | | | | 1.68% | | | | 2.00% | |
B. Distribution and Service Plans — The Trust, on behalf of the Fund, has adopted Distribution and Service Plans (“Plans”). Under the Plans, Goldman Sachs, which serves as distributor (the “Distributor”), is entitled to a fee accrued daily and paid
48
GOLDMAN SACHS MULTI-MANAGER ALTERNATIVES FUND
|
| 5. AGREEMENTS AND AFFILIATED TRANSACTIONS (continued) |
monthly, for distribution services and personal and account maintenance services, which may then be paid by Goldman Sachs to authorized dealers, at the following annual rates calculated on the Fund’s average daily net assets of each respective share class:
| | | | | | | | | | | | |
| | | Distribution and Service Plan Rates | |
| | | Class��A* | | | Class C | | | Class R* | |
Distribution Plan | | | 0.25 | % | | | 0.75 | % | | | 0.50 | % |
Service Plan | | | — | | | | 0.25 | | | | — | |
| * | | With respect to Class A and Class R Shares, the Distributor, at its discretion may use compensation for distribution services paid under the Distribution Plan to compensate service organizations for personal and account maintenance services and expenses as long as such total compensation does not exceed the maximum cap on “service fees” imposed by the Financial Industry Regulatory Authority. |
C. Distribution Agreement — Goldman Sachs, as Distributor of the shares of the Fund pursuant to a Distribution Agreement, may retain a portion of the Class A front end sales charge and Class C Shares’ CDSC. During the period ended December 31, 2013, Goldman Sachs advised that it retained $2,642 of Class A and did not retain any portion of Class C.
D. Transfer Agency Agreement — Goldman Sachs also serves as the transfer agent of the Fund for a fee pursuant to Transfer Agency Agreement. The fees charged for such transfer agency services are accrued daily and paid monthly at annual rates as follows: 0.19% of the average daily net assets of Class A, Class C, Class IR and Class R Shares; and 0.04% of the average daily net assets of Institutional Shares.
E. Other Expense Agreements and Affiliated Transactions — GSAM has agreed to limit certain “Other Expense” of the Fund (excluding transfer agent fees and expenses, service fees and shareholder administration fees (as applicable), taxes, interest, brokerage fees, shareholder meetings, litigation, indemnification, and extraordinary expenses) to the extent such expenses exceed, on an annual basis, a percentage rate of the average daily net assets of the Fund. Such Other Expense reimbursements, if any, are accrued daily and paid monthly. In addition, the Fund is not obligated to reimburse GSAM for prior fiscal year expense reimbursements, if any. The Other Expense limitations as an annual percentage rate of average daily net assets for the Fund are 0.114%. These Other Expense limitations will remain in place through at least April 30, 2014, and prior to such date GSAM may not terminate the arrangements without the approval of the Trustees. In addition, the Fund has entered into certain offset arrangements with the custodian and the transfer agent, which may result in a reduction of the Fund’s expenses and are received irrespective of the application of the “Other Expense” limitations described above. Such Other Expense reimbursements, if any, are accrued daily and paid monthly and are disclosed in the Statement of Operations for the period ended December 31, 2013.
As of December 31, 2013, the amounts owed to affiliates of the Fund were as follows:
| | | | | | | | | | | | | | |
Management Fee | | | Distribution and Service Fees | | | Transfer Agent Fees | | | Total | |
| $ | 287,034 | | | $ | 5,583 | | | $ | 9,539 | | | $ | 302,156 | |
F. Other Transactions with Affiliates — For the period ended December 31, 2013, Goldman Sachs earned $90,580 in brokerage commissions from portfolio transactions, including futures transactions executed with Goldman Sachs as the Futures Commission Merchant, on behalf of the Fund.
As of December 31, 2013, the Goldman Sachs Group (“GSG”), Inc. was the beneficial owner of approximately 34% and 100% of Institutional and Class R, respectively of the Fund.
| | |
| 6. PORTFOLIO SECURITIES TRANSACTIONS | | |
The cost of purchases and proceeds from sales and maturities of long-term securities for the period ended December 31, 2013, were $175,205,180 and $68,222,128, respectively. Included in these amounts are the cost of purchases and proceeds from sales and maturities of U.S. Government and agency obligations in the amount of $2,764,038 and $445,180, respectively.
49
GOLDMAN SACHS MULTI-MANAGER ALTERNATIVES FUND
Notes to Financial Statements (continued)
December 31, 2013
The tax character of distributions paid during the period ended December 31, 2013 was as follows:
| | | | |
Distributions paid from: | | | | |
Ordinary income | | $ | 820,693 | |
Net long-term capital gains | | | 69,525 | |
Total taxable distributions | | $ | 890,218 | |
As of December 31, 2013, the components of accumulated earnings (losses) on a tax basis were as follows:
| | | | |
Undistributed ordinary income — net | | $ | 647,816 | |
Undistributed long-term capital gains | | | 308,904 | |
Total undistributed earnings | | | 956,720 | |
Timing Differences (Straddle Loss Deferral) | | | (66,020 | ) |
Unrealized gains — net | | | 5,742,157 | |
Total accumulated earnings — net | | $ | 6,632,857 | |
As of December 31, 2013, the Fund’s aggregate security unrealized gains and losses based on cost for U.S. federal income tax purposes were as follows:
| | | | |
Tax Cost | | $ | 178,607,011 | |
Gross unrealized gain | | | 7,085,382 | |
Gross unrealized loss | | | (965,845 | ) |
Net unrealized security gain | | $ | 6,119,537 | |
Net unrealized loss on other investments | | | (377,380 | ) |
Net unrealized gain | | $ | 5,742,157 | |
The difference between GAAP-basis and tax-basis unrealized gains (losses) is attributable primarily to wash sales, and net mark to market gains (losses) on regulated futures contracts and foreign currency contracts.
In order to present certain components of the Fund’s capital accounts on a tax-basis, certain reclassifications have been recorded to the Fund’s accounts. These reclassifications have no impact on the net asset value of the Fund and result primarily from certain non-deductible expenses, and differences in the tax treatment of foreign currency transactions and consent fees.
| | | | | | | | | | |
| Paid-in-Capital | | | Accumulated Net Realized Gain (Loss) | | | Undistributed Net Investment Income (Loss) | |
| $ | (23,113 | ) | | $ | (319,998 | ) | | $ | 343,111 | |
GSAM has reviewed the Fund’s tax positions for all open tax years (the current year, as applicable), and has concluded that no provision for income tax is required in the Fund’s financial statements. Such open tax years remain subject to examination and adjustment by tax authorities.
50
GOLDMAN SACHS MULTI-MANAGER ALTERNATIVES FUND
The Fund’s risks include, but are not limited to, the following:
Foreign Custody Risk — A Fund that invests in foreign securities may hold such securities and foreign currency with foreign banks, agents, and securities depositories appointed by the Fund’s custodian (each a “Foreign Custodian”). In some countries, Foreign Custodians may be subject to little or no regulatory oversight or independent evaluation of their operations. Further, the laws of certain countries may place limitations on a Fund’s ability to recover its assets if a Foreign Custodian enters into bankruptcy. Investments in emerging markets may be subject to greater custody risks than investments in more developed markets. Custody services in emerging market countries are often undeveloped and may be less regulated than in more developed countries, and thus may not afford the same level of investor protection as would apply in developed countries.
Investments in Other Investment Companies — As a shareholder of another investment company, including an exchange traded fund (“ETF”), a Fund will directly bear its proportionate share of any management fees and other expenses paid by such other investment companies, in addition to the fees and expenses regularly borne by the Fund. ETFs are subject to risks that do not apply to conventional mutual funds, including but not limited to the following: (i) the market price of the ETF’s shares may trade at a premium or a discount to their NAV; and (ii) an active trading market for an ETF’s shares may not develop or be maintained.
Liquidity Risk — The Fund may make investments that are illiquid or that may become less liquid in response to market developments or adverse investor perceptions. Illiquid investments may be more difficult to value. Liquidity risk may also refer to the risk that a Fund will not be able to pay redemption proceeds within the allowable time period because of unusual market conditions, an unusually high volume of redemption requests, or other reasons. To meet redemption requests, a Fund may be forced to sell investments at an unfavorable time and/or under unfavorable conditions.
Market and Credit Risks — In the normal course of business, the Fund trades financial instruments and enters into financial transactions where risk of potential loss exists due to changes in the market (market risk). Additionally, the Fund may also be exposed to credit risk in the event that an issuer fails to perform or that an institution or entity with which the Fund has unsettled or open transactions defaults.
Investing in foreign markets may involve special risks and considerations not typically associated with investing in the U.S. These risks include revaluation of currencies, high rates of inflation, repatriation restrictions on income and capital, and adverse political and economic developments. Moreover, securities issued in these markets may be less liquid, be subject to government ownership controls, have delayed settlements and their prices may be more volatile than those of comparable securities in the U.S.
Multi-Manager Approach Risk — The Fund’s performance depends on the ability of the Investment Adviser in selecting, overseeing, and allocating Fund assets to the Underlying Managers. The Underlying Managers’ investment styles may not always be complementary. The Fund’s multi-manager approach may result in the Fund investing a significant percentage of its assets in certain types of investments, which could be beneficial or detrimental to the Fund’s performance depending on the performance of those investments and the overall market environment. The Fund’s Underlying Managers may underperform the market generally or underperform other investment managers that could have been selected for the Fund. Because the Fund’s Underlying Managers may trade with counterparties, prime brokers, clearing brokers or futures commission merchants on terms that are different than those on which the Investment Adviser would trade, and because each Underlying Manager applies its own risk analysis in evaluating potential counterparties for the Fund, the Fund may be subject to greater counterparty risk than if it were managed directly by the Investment Adviser.
Non-Diversification Risk — The Fund is non-diversified, meaning that it is permitted to invest a larger percentage of its assets in fewer issuers than diversified mutual funds. Thus, the Fund may be more susceptible to adverse developments affecting any single issuer held in its portfolio, and may be more susceptible to greater losses because of these developments.
Shareholder Concentration Risk — Certain funds, accounts, individuals or Goldman Sachs affiliates may from time to time own (beneficially or of record) or control a significant percentage of the Fund’s shares. Redemptions by these entities of their holdings in the Fund may impact the Fund’s liquidity and NAV. These redemptions may also force the Fund to sell securities.
51
GOLDMAN SACHS MULTI-MANAGER ALTERNATIVES FUND
Notes to Financial Statements (continued)
December 31, 2013
Under the Trust’s organizational documents, its Trustees, officers, employees and agents are indemnified, to the extent permitted by the Act and state law, against certain liabilities that may arise out of performance of their duties to the Fund. Additionally, in the course of business, the Fund enters into contracts that contain a variety of indemnification clauses. The Fund’s maximum exposure under these arrangements is unknown, as this would involve future claims that may be made against the Fund that have not yet occurred. However, GSAM believes the risk of loss under these arrangements to be remote.
Subsequent events after the Statement of Assets and Liabilities date have been evaluated through the date the financial statements were issued. GSAM has concluded that there is no impact requiring adjustment or disclosure in the financial statements.
52
GOLDMAN SACHS MULTI-MANAGER ALTERNATIVES FUND
|
| 11. SUMMARY OF SHARE TRANSACTIONS |
Share activity is as follow:
| | | | | | | | |
| | | For the Period Ended
December 31, 2013(a) | |
| | | Shares | | | Dollars | |
| | | | |
| Class A Shares | |
Shares sold | | | 2,574,479 | | | $ | 26,146,713 | |
Reinvestment of distributions | | | 11,345 | | | | 115,948 | |
Shares redeemed | | | (166,545 | ) | | | (1,675,241 | ) |
| | | | 2,419,279 | | | | 24,587,420 | |
| Class C Shares | |
Shares sold | | | 137,252 | | | | 1,398,013 | |
Reinvestment of distributions | | | 542 | | | | 5,510 | |
Shares redeemed | | | (648 | ) | | | (6,542 | ) |
| | | | 137,146 | | | | 1,396,981 | |
| Institutional Shares | |
Shares sold | | | 15,329,295 | | | | 154,985,312 | |
Reinvestment of distributions | | | 66,069 | | | | 676,544 | |
Shares redeemed | | | (446,278 | ) | | | (4,519,402 | ) |
| | | | 14,949,086 | | | | 151,142,454 | |
| Class IR Shares | |
Shares sold | | | 713,636 | | | | 7,212,162 | |
Reinvestment of distributions | | | 3,628 | | | | 37,110 | |
Shares redeemed | | | (44,454 | ) | | | (454,139 | ) |
| | | | 672,810 | | | | 6,795,133 | |
| Class R Shares | |
Shares sold | | | 2,501 | | | | 25,010 | |
Reinvestment of distributions | | | 14 | | | | 147 | |
Shares redeemed | | | (1 | ) | | | (10 | ) |
| | | | 2,514 | | | | 25,147 | |
NET INCREASE | | | 18,180,835 | | | $ | 183,947,135 | |
| (a) | | Commenced operations on April 30, 2013. |
53
Report of Independent Registered Public
Accounting Firm
To the Board of Trustees and Shareholders of
Goldman Sachs Trust II — Goldman Sachs Multi-Manager Alternatives Fund:
In our opinion, the accompanying statement of assets and liabilities, including the schedule of investments, and the related statements of operations and of changes in net assets and the financial highlights present fairly, in all material respects, the financial position of Goldman Sachs Multi-Manager Alternatives Fund (the “Fund”), a portfolio of Goldman Sachs Trust II, at December 31, 2013, the results of its operations, the changes in its net assets and the financial highlights for the period April 30, 2013 (commencement of operations) through December 31, 2013, in conformity with accounting principles generally accepted in the United States of America. These financial statements and financial highlights (hereafter referred to as “financial statements”) are the responsibility of the Fund’s management. Our responsibility is to express an opinion on these financial statements based on our audit. We conducted our audit of these financial statements in accordance with the standards of the Public Company Accounting Oversight Board (United States). Those standards require that we plan and perform the audit to obtain reasonable assurance about whether the financial statements are free of material misstatement. An audit includes examining, on a test basis, evidence supporting the amounts and disclosures in the financial statements, assessing the accounting principles used and significant estimates made by management, and evaluating the overall financial statement presentation. We believe that our audit, which included confirmation of securities at December 31, 2013, by correspondence with the custodian, brokers, transfer agent of the investment company, and the application of alternative auditing procedures where securities purchased confirmations had not been received, provides a reasonable basis for our opinion.
PricewaterhouseCoopers LLP
Boston, Massachusetts
February 26, 2014
54
GOLDMAN SACHS MULTI-MANAGER ALTERNATIVES FUND
| | |
Fund Expenses Six Month Period Ended December 31, 2013 (Unaudited) | | |
As a shareholder of Class A, Class C, Institutional, Class IR or Class R Shares of the Fund, you incur two types of costs: (1) transaction costs, including sales charges on purchase payments (with respect to Class A Shares), contingent deferred sales charges on redemptions (with respect to Class C Shares), and (2) ongoing costs, including management fees; distribution and service (12b-1) fees (with respect to Class A, Class C and Class R Shares); and other Fund expenses. This Example is intended to help you understand your ongoing costs (in dollars) of investing in Class A, Class C, Institutional, Class IR or Class R Shares of the Fund and to compare these costs with the ongoing costs of investing in other mutual funds.
The Example is based on an investment of $1,000 invested at the beginning of the period and held for the entire period from July 1, 2013 through December 31, 2013.
Actual Expenses — The first line under each share class in the table below provides information about actual account values and actual expenses. You may use the information in this line, together with the amount you invested, to estimate the expenses that you paid over the period. Simply divide your account value by $1,000 (for example, an $8,600 account value divided by $1,000=8.6), then multiply the result by the number in the first line under the heading entitled “Expenses Paid” to estimate the expenses you paid on your account during this period.
Hypothetical Example for Comparison Purposes — The second line under each share class in the table below provides information about hypothetical account values and hypothetical expenses based on the Fund’s actual net expense ratios and an assumed rate of return of 5% per year before expenses, which is not the Fund’s actual return. The hypothetical account values and expenses may not be used to estimate the actual ending account balance or expenses you paid for the period. You may use this information to compare the ongoing costs of investing in the Fund and other funds. To do so, compare this 5% hypothetical example with the 5% hypothetical examples that appear in the shareholder reports of the other funds.
Please note that the expenses shown in the table are meant to highlight your ongoing costs only and do not reflect any transactional costs, such as sales charges, redemption fees, or exchange fees. Therefore, the second line of the table is useful in comparing ongoing costs only, and will not help you determine the relative total costs of owning different funds. In addition, if these transactional costs were included, your costs would have been higher.
| | | | | | | | | | | | |
| | | Multi-Manager Alternatives Fund | |
| Share Class | | Beginning
Account Value
07/01/13 | | | Ending
Account Value
12/31/13 | | | Expenses Paid for the
Period ended
12/31/13* | |
| Class A | | | | | | | | | | | | |
Actual | | $ | 1,000.00 | | | $ | 1,067.00 | | | $ | 13.29 | |
Hypothetical 5% return | | | 1,000.00 | | | | 1,012.35 | + | | | 12.93 | |
| Class C | | | | | | | | | | | | |
Actual | | | 1,000.00 | | | | 1,063.00 | | | | 17.16 | |
Hypothetical 5% return | | | 1,000.00 | | | | 1,008.57 | + | | | 16.71 | |
| Institutional | | | | | | | | | | | | |
Actual | | | 1,000.00 | | | | 1,069.00 | | | | 11.21 | |
Hypothetical 5% return | | | 1,000.00 | | | | 1,014.37 | + | | | 10.92 | |
| Class IR | | | | | | | | | | | | |
Actual | | | 1,000.00 | | | | 1,069.00 | | | | 11.99 | |
Hypothetical 5% return | | | 1,000.00 | | | | 1,013.61 | + | | | 11.67 | |
| Class R | | | | | | | | | | | | |
Actual | | | 1,000.00 | | | | 1,066.00 | | | | 14.58 | |
Hypothetical 5% return | | | 1,000.00 | | | | 1,011.09 | + | | | 14.19 | |
| | * | | Expenses for each share class are calculated using the Fund’s annualized net expense ratio for each class, which represents the ongoing expenses as a percentage of net assets for the period ended December 31, 2013. Expenses are calculated by multiplying the annualized net expense ratio by the average account value for the period; then multiplying the result by the number of days in the most recent fiscal half year; and then dividing that result by the number of days in the fiscal year. The annualized net expense ratios for the period were as follows: | |
| | | | | | | | | | | | | | | | | | | | |
| Fund | | Class A | | | Class C | | | Institutional | | | Class IR | | | Class R | |
Multi-Manager Alternatives | | | 2.55 | % | | | 3.30 | % | | | 2.15 | % | | | 2.30 | % | | | 2.80 | % |
| | + | | Hypothetical expenses are based on the Fund’s actual annualized net expense ratios and an assumed rate of return of 5% per year before expenses. | |
55
GOLDMAN SACHS MULTI-MANAGER ALTERNATIVES FUND
Statement Regarding Basis for Approval of Sub-Advisory Agreement (Unaudited)
The Goldman Sachs Multi-Manager Alternatives Fund (the “Fund”) is an investment portfolio of Goldman Sachs Trust II (the “Trust”) that commenced investment operations on April 30, 2013. The Fund employs a “manager of managers” structure, whereby Goldman Sachs Asset Management, L.P. (the “Investment Adviser”) is responsible for selecting sub-advisers (subject to Board approval), allocating the Fund’s assets among them, and overseeing their day-to-day management of Fund assets. Since June 30, 2013 three new sub-advisers have joined the Fund’s roster of sub-advisers. Upon the recommendation of the Investment Adviser, at meetings held on August 7, 2013, October 17, 2013, and December 19, 2013 (the “Meetings”) the Trustees, including all of the Trustees present who are not parties to the Fund’s investment management agreement or any sub-advisory agreement or “interested persons” (as defined in the Investment Company Act of 1940, as amended) of any party thereto (the “Independent Trustees”) approved the respective sub-advisory agreements (each a “Sub-Advisory Agreement”) between the Investment Adviser and each of Graham Capital Management, L.P. (“Graham”), First Pacific Advisors, LLC (“FPA”) and Halcyon Liquid Strategies IC Management, LP (“Halcyon”) (each, a “Sub-Adviser” and, together, the “Sub-Advisers”).
In connection with the Meetings, the Trustees received written materials and oral presentations on the topics covered, and were advised by their independent legal counsel. In addition, each Sub-Adviser provided information in response to a request from the Investment Adviser.
Nature, Extent and Quality of the Services Provided Under the Sub-Advisory Agreement and Performance
In evaluating the respective Sub-Advisory Agreements at the Meetings, the Trustees relied upon materials furnished and presentations made by the Investment Adviser and the Sub-Advisers. In evaluating the nature, extent and quality of services to be provided by each Sub-Adviser, the Trustees considered information on the services provided to the Fund by each Sub-Adviser, including information about the Sub-Adviser’s (a) personnel and compensation structure; (b) track record in managing accounts with investment strategies similar to those to be employed on behalf of the Fund; (c) policies and procedures in place to address potential conflicts of interest; and (d) compliance program. In this regard, they considered assessments provided by the Investment
56
GOLDMAN SACHS MULTI-MANAGER ALTERNATIVES FUND
Statement Regarding Basis for Approval of Sub-Advisory Agreement (Unaudited) (continued)
Adviser of each Sub-Adviser and its investment strategy and personnel and compliance program. With respect to the approvals of FPA and Halcyon, the Trustees considered that FPA and one or more affiliates of Halcyon currently manage other assets for the Investment Adviser, and they reviewed performance information for a fund managed by FPA and composites of accounts managed by Graham and by Halcyon’s affiliates with investment objectives and strategies similar to those to be employed on behalf of the Fund. The Trustees noted that, because these Sub-Advisers had not previously provided services to the Fund, there was no performance information to evaluate with respect to the Fund.
Costs of Services to be Provided
The Trustees reviewed the terms of each Sub-Advisory Agreement, including the proposed fee schedule for each Sub-Adviser. They also considered the fees that FPA charges to funds and accounts with investment objectives and strategies similar to those to be employed on behalf of the Fund. They noted that the other accounts managed by Halcyon and its affiliates had performance fees. The Trustees noted that the compensation paid to each Sub-Adviser would be paid by the Investment Adviser, not by the Fund. They also noted that the terms of each Sub-Advisory Agreement were the result of arms’ length negotiations between the Investment Adviser and the Sub-Adviser. The Trustees reviewed the anticipated blended average of all sub-advisory fees to be paid by the Investment Adviser and how it would change upon hiring each Sub-Adviser. They also considered this information in light of the overall management fee to be paid by the Fund.
In connection with their consideration of each Sub-Advisory Agreement at the respective Meeting, the Trustees gave weight to various factors, but did not identify any particular factor as controlling their decision. After deliberation and consideration of the information provided, the Independent Trustees unanimously concluded in each instance that the Sub-Adviser’s management of a sleeve of the Fund would likely benefit the Fund and its shareholders; and that each Sub-Advisory Agreement should be approved.
57
GOLDMAN SACHS MULTI-MANAGER ALTERNATIVES FUND
Trustees and Officers (Unaudited)
Independent Trustees
| | | | | | | | | | |
Name,
Address and Age1 | | Position(s) Held with the Trust | | Term of Office and
Length of
Time Served2 | | Principal Occupation(s)
During Past 5 Years | | Number of
Portfolios in
Fund Complex
Overseen by
Trustee3 | | Other
Directorships Held by Trustee4 |
Ashok N. Bakhru Age: 71 | | Chairman of the Board of Trustees | | Since 1996 (Trustee since 1991) | | Mr. Bakhru is retired. He was formerly Director, Apollo Investment Corporation (a business development company) (2008-2013); President, ABN Associates (a management and financial consulting firm) (1994-1996 and 1998-2012); Trustee, Scholarship America (1998-2005); Trustee, Institute for Higher Education Policy (2003-2008); Director, Private Equity Investors — III and IV (1998-2007), and Equity-Linked Investors II (April 2002-2007). Chairman of the Board of Trustees — Goldman Sachs Fund Complex. | | 111 | | None |
John P. Coblentz, Jr. Age: 72 | | Trustee | | Since 2003 | | Mr. Coblentz is retired. Formerly, he was Partner, Deloitte & Touche LLP (1975-2003); Director, Emerging Markets Group, Ltd. (2004-2006); and Director, Elderhostel, Inc. (2006-2012). Trustee — Goldman Sachs Fund Complex. | | 111 | | None |
Richard P. Strubel Age: 74 | | Trustee | | Since 1987 | | Mr. Strubel is retired. Formerly, he was Director, Cardean Learning Group (provider of educational services via the internet) (2003-2008); Trustee, Emeritus, The University of Chicago (1987-Present). Trustee — Goldman Sachs Fund Complex. | | 111 | | The Northern Trust Mutual Fund Complex (64 Portfolios) (Chairman of the Board of Trustees); Gildan Activewear Inc. (a clothing marketing and manufacturing company). |
James A. McNamara* Age: 51 | | President and Trustee | | Since 2007 | | Managing Director, Goldman Sachs (December 1998-Present); Director of Institutional Fund Sales, GSAM (April 1998-December 2000); and Senior Vice President and Manager, Dreyfus Institutional Service Corporation (January 1993- April 1998). President — Goldman Sachs Fund Complex (November 2007-Present); Senior Vice President — Goldman Sachs Fund Complex (May 2007-November 2007); and Vice President — Goldman Sachs Fund Complex (2001-2007). Trustee — Goldman Sachs Fund Complex (since November 2007 and December 2002-May 2004). | | 111 | | None |
| | | | | | | | | | |
| * | | These persons are considered to be “Interested Trustees” because they hold positions with Goldman Sachs and own securities issued by The Goldman Sachs Group, Inc. Each Interested Trustee holds comparable positions with certain other companies of which Goldman Sachs, GSAM or an affiliate thereof is the investment adviser, administrator and/or distributor. |
| 1 | | Each Trustee may be contacted by writing to the Trustee, c/o Goldman Sachs, 200 West Street, New York, New York, 10282, Attn: Caroline Kraus. |
| 2 | | Each Trustee holds office for an indefinite term until the earliest of: (a) the election of his or her successor; (b) the date the Trustee resigns or is removed by the Board of Trustees or shareholders, in accordance with the Trust’s Declaration of Trust; (c) the conclusion of the first Board meeting held subsequent to the day the Trustee attains the age of 74 years, subject to waiver by a majority of the Trustees (in accordance with the current resolutions of the Board of Trustees, which may be changed by the Trustees without shareholder vote); or (d) the termination of the Trust. By resolution of the Board of Trustees determining that an extension of service would be beneficial to the Trust, the retirement age has been extended for one year with respect to Richard P. Strubel. |
| 3 | | The Goldman Sachs Fund Complex includes the Trust, Goldman Sachs Trust, Goldman Sachs Credit Strategies Fund, Goldman Sachs Variable Insurance Trust, Goldman Sachs MLP Income Opportunities Fund and Goldman Sachs BDC, Inc. As of December 31, 2013, each of the Trust, Goldman Sachs Credit Strategies Fund, Goldman Sachs MLP Income Opportunities Fund and Goldman Sachs BDC, Inc. consisted of one portfolio, the Goldman Sachs Trust consisted of 93 portfolios (84 of which offered shares to the public), and the Goldman Sachs Variable Insurance Trust consisted of 14 portfolios (12 of which offered shares to the public). The Goldman Sachs BDC, Inc. did not offer shares to the public. |
| 4 | | This column includes only directorships of companies required to report to the Securities and Exchange Commission under the Securities Exchange Act of 1934 (i.e., “public companies”) or other investment companies registered under the Act. |
Additional information about the Trustees is available in the Fund’s Statement of Additional Information, which can be obtained from Goldman Sachs free of charge by calling this toll-free number (in the United States of America): 1-800-292-4726.
58
GOLDMAN SACHS MULTI-MANAGER ALTERNATIVES FUND
Trustees and Officers (Unaudited) (continued)
Officers of the Trust*
| | | | | | |
Name, Address and Age | | Position(s) Held With the Trust | | Term of Office and
Length of
Time Served1 | | Principal Occupation(s) During Past 5 Years |
James A. McNamara 200 West Street New York, NY 10282 Age: 51 | | President and Trustee | | Since 2007 | | Managing Director, Goldman Sachs (December 1998-Present); Director of Institutional Fund Sales, GSAM (April 1998-December 2000); and Senior Vice President and Manager, Dreyfus Institutional Service Corporation (January 1993-April 1998). President — Goldman Sachs Mutual Fund Complex (November 2007-Present); Senior Vice President — Goldman Sachs Mutual Fund Complex (May 2007-November 2007); and Vice President — Goldman Sachs Mutual Fund Complex (2001-2007). Trustee — Goldman Sachs Fund Complex (November 2007-Present and December 2002-May 2004). |
Caroline L. Kraus 200 West Street New York, NY 10282 Age: 36 | | Secretary | | Since 2012 | | Vice President, Goldman Sachs (August 2006-Present); Associate General Counsel, Goldman Sachs (2012-Present); Assistant General Counsel, Goldman Sachs (August 2006-December 2011) and Associate, Weil, Gotshal & Manges-LLP (2002-2006). Secretary — Goldman Sachs Fund Complex (August 2012-Present); and Assistant Secretary — Goldman Sachs Fund Complex (June 2012-August 2012). |
Scott M. McHugh 200 West Street New York, NY 10282 Age: 42 | | Principal Financial Officer and Treasurer | | Since 2009 (Principal Financial Officer since 2013) | | Vice President, Goldman Sachs (February 2007-Present); Assistant Treasurer of certain mutual funds administered by DWS Scudder (2005-2007); and Director (2005-2007), Vice President (2000-2005) and Assistant Vice President (1998-2000), Deutsche Asset Management or its predecessor (1998-2007). Principal Financial Officer — Goldman Sachs Fund Complex (November 2013-Present); Treasurer — Goldman Sachs Fund Complex (October 2009-Present); Senior Vice President — Goldman Sachs Fund Complex (November 2009-Present); and Assistant Treasurer — Goldman Sachs Fund Complex (May 2007-October 2009). |
| | | | | | |
| 1 | | Officers hold office at the pleasure of the Board of Trustees or until their successors are duly elected and qualified. Each officer holds comparable positions with certain other companies of which Goldman Sachs, GSAM or an affiliate thereof is the investment adviser, administrator and/or distributor. Information is provided as of December 31, 2013. |
| * | | Represents a partial list of officers of the Trust. Additional information about all the officers is available in the Fund’s Statement of Additional Information, which can be obtained from Goldman Sachs free of charge by calling this toll-free number (in the United States): 1-800-292-4726. |
59
GOLDMAN SACHS MULTI-MANAGER ALTERNATIVES FUND
Goldman Sachs Trust — Multi-Manager Alternatives Fund — Tax Information (Unaudited)
For the fiscal year ended December 31, 2013, 8.18% of the dividends paid from net investment company taxable income by the Multi-Manager Alternatives Fund qualify for the dividends received deduction available to corporations.
For the fiscal year ended December 31, 2013, 32.56% of the dividends paid from net investment company taxable income by the Multi-Manager Alternatives Fund qualify for the reduced tax rate under the Jobs and Growth Tax Relief and Reconciliation Act of 2003.
Pursuant to Section 852 of the Internal Revenue Code, the Multi-Manager Alternatives Fund designates $69,525, if different, the maximum amount allowable, as capital gain dividends paid during the fiscal year ended December 31, 2013.
During the fiscal year ended December 31, 2013, the Multi-Manager Alternatives Fund designates $820,693 as short-term capital gain dividends pursuant to Section 871(k) of the Internal Revenue Code.
60
FUNDS PROFILE
Goldman Sachs Funds

Goldman Sachs is a premier financial services firm, known since 1869 for creating thoughtful and customized investment solutions in complex global markets.
Today, the Investment Management Division of Goldman Sachs serves a diverse set of clients worldwide, including private institutions, public entities and individuals. With approximately $807.6 billion in assets under management as of December 31, 2013, Goldman Sachs Asset Management (“GSAM”) has portfolio management teams located around the world and our investment professionals bring firsthand knowledge of local markets to every investment decision. GSAM’s assets under management includes assets managed by Goldman Sachs Asset Management, L.P. and its Investment Advisory Affiliates.
|
| OVERVIEW OF GOLDMAN SACHS FUNDS* |

Money Market1
Financial Square FundsSM
| n | | Financial Square Tax-Exempt Funds |
| n | | Financial Square Federal Fund |
| n | | Financial Square Government Fund |
| n | | Financial Square Money Market Fund |
| n | | Financial Square Prime Obligations Fund |
| n | | Financial Square Treasury Instruments Fund |
| n | | Financial Square Treasury Obligations Fund |
Fixed Income
Short Duration and Government
| n | | High Quality Floating Rate Fund |
| n | | Short Duration Government Fund |
| n | | Short Duration Income Fund |
| n | | Inflation Protected Securities Fund |
Multi-Sector
| n | | Core Plus Fixed Income Fund |
Municipal and Tax-Free
| n | | High Yield Municipal Fund |
| n | | Short Duration Tax-Free Fund |
Single Sector
| n | | Investment Grade Credit Fund |
| n | | High Yield Floating Rate Fund |
| n | | Emerging Markets Debt Fund |
| n | | Local Emerging Markets Debt Fund |
| n | | Dynamic Emerging Markets Debt Fund |
Corporate Credit
Fundamental Equity
| n | | Small/Mid Cap Growth Fund |
| n | | Flexible Cap Growth Fund |
| n | | Concentrated Growth Fund |
| n | | Technology Tollkeeper Fund |
| n | | Growth Opportunities Fund |
| n | | Rising Dividend Growth Fund |
Structured Equity
| n | | Structured Tax Managed Equity Fund |
| n | | Structured International Tax-Managed Equity Fund |
| n | | U.S. Equity Dividend and Premium Fund |
| n | | International Equity Dividend and Premium Fund |
Equity Insights2
| n | | Small Cap Equity Insights Fund |
| n | | U.S. Equity Insights Fund |
| n | | Small Cap Growth Insights Fund |
| n | | Large Cap Growth Insights Fund |
| n | | Large Cap Value Insights Fund |
| n | | Small Cap Value Insights Fund |
| n | | International Small Cap Insights Fund |
| n | | International Equity Insights Fund |
| n | | Emerging Markets Equity Insights Fund |
Fundamental Equity International
| n | | Strategic International Equity Fund |
| n | | Concentrated International Equity Fund |
| n | | International Small Cap Fund |
| n | | Emerging Markets Equity Fund |
| n | | BRIC Fund (Brazil, Russia, India, China) |
Select Satellite3
| n | | Real Estate Securities Fund |
| n | | International Real Estate Securities Fund |
| n | | Commodity Strategy Fund |
| n | | Dynamic Allocation Fund |
| n | | Absolute Return Tracker Fund |
| n | | Managed Futures Strategy Fund |
| n | | MLP Energy Infrastructure Fund |
| n | | Multi-Manager Alternatives Fund |
| n | | Multi-Asset Real Return Fund |
| n | | Retirement Portfolio Completion Fund |
| n | | Income Strategies Portfolio |
| n | | Fixed Income Macro Strategies Fund |
Total Portfolio Solutions3
| n | | Balanced Strategy Portfolio |
| n | | Growth and Income Strategy Portfolio |
| n | | Growth Strategy Portfolio |
| n | | Equity Growth Strategy Portfolio |
| n | | Satellite Strategies Portfolio |
| n | | Enhanced Dividend Global Equity Portfolio |
| n | | Tax Advantaged Global Equity Portfolio |
| 1 | | An investment in a money market fund is neither insured nor guaranteed by the Federal Deposit Insurance Corporation (“FDIC”) or any other government agency. Although the Funds seek to preserve the value of your investment at $1.00 per share, it is possible to lose money by investing in the Funds. |
| 2 | | Effective at the close of business May 3, 2013, the Goldman Sachs Structured Large Cap Growth, Structured Large Cap Value, Structured Small Cap Equity, Structured Small Cap Growth, Structured Small Cap Value, Structured U.S. Equity, Structured Emerging Markets Equity, Structured International Equity and Structured International Small Cap Funds were renamed the Goldman Sachs Large Cap Growth Insights, Large Cap Value Insights, Small Cap Equity Insights, Small Cap Growth Insights, Small Cap Value Insights, U.S. Equity Insights, Emerging Markets Equity Insights, International Equity Insights and International Small Cap Insights Funds, respectively. |
| 3 | | Individual Funds within the Total Portfolio Solutions and Select Satellite categories will have various placement on the risk/return spectrum and may have greater or lesser risk than that indicated by the placement of the general Total Portfolio Solutions or Select Satellite category. |
Financial Square FundsSM is a registered service mark of Goldman, Sachs & Co.
| *This | | list covers open-end funds only. Please visit our website at www.GSAMFUNDS.com to learn about our closed-end funds. |
| | |
TRUSTEES Ashok N. Bakhru, Chairman John P. Coblentz, Jr. James A. McNamara Richard P. Strubel | | OFFICERS James A. McNamara, President Scott M. McHugh, Principal Financial Officer and Treasurer Caroline L. Kraus, Secretary |
| |
GOLDMAN, SACHS & CO. Distributor and Transfer Agent | | GOLDMAN SACHS ASSET MANAGEMENT, L.P. Investment Adviser |
Visit our Website at www.GSAMFUNDS.com to obtain the most recent month-end returns.
Goldman Sachs Asset Management, L.P., 200 West Street, New York, New York 10282
The reports concerning the Fund included in this shareholder report may contain certain forward-looking statements about the factors that may affect the performance of the Fund in the future. These statements are based on Fund management’s predictions and expectations concerning certain future events and their expected impact on the Fund, such as performance of the economy as a whole and of specific industry sectors, changes in the levels of interest rates, the impact of developing world events, and other factors that may influence the future performance of the Fund. Management believes these forward-looking statements to be reasonable, although they are inherently uncertain and difficult to predict. Actual events may cause adjustments in portfolio management strategies from those currently expected to be employed.
A description of the policies and procedures that the Fund uses to determine how to vote proxies relating to portfolio securities and information regarding how a Fund voted proxies relating to portfolio securities during the most recent 12-month period ended June 30 is available (I) without charge, upon request by calling 1-800-526-7384 (for Retail Shareholders) or 1-800-621-2550 (for Institutional Shareholders); and (II) on the Securities and Exchange Commission web site at http://www.sec.gov.
The Fund files its complete schedule of portfolio holdings with the Securities and Exchange Commission (“SEC”) for the first and third quarters of each fiscal year on Form N-Q. The Fund’s Forms N-Q are available on the SEC’s web site at http://www.sec.gov within 60 days after the Fund’s first and third fiscal quarters. The Fund’s Forms N-Q may be reviewed and copied at the SEC’s Public Reference Room in Washington, D.C., and information on the operation of the Public Reference Room may also be obtained by calling 1-800-SEC-0330. Form N-Q may be obtained upon request and without charge by calling 1-800-526-7384 (for Retail Shareholders) or 1-800-621-2550 (for Institutional Shareholders).
The website links provided are for your convenience only and are not an endorsement or recommendation by GSAM of any of these websites or the products or services offered. GSAM is not responsible for the accuracy and validity of the content of these websites.
Holdings and allocations shown are as of December 31, 2013 and may not be representative of future investments. Fund holdings should not be relied on in making investment decisions and should not be construed as research or investment advice regarding particular securities. Current and future holdings are subject to risk.
Economic and market forecasts presented herein reflect our judgment as of the date of this presentation and are subject to change without notice. These forecasts do not take into account the specific investment objectives, restrictions, tax and financial situation or other needs of any specific client. Actual data will vary and may not be reflected here. These forecasts are subject to high levels of uncertainty that may affect actual performance. Accordingly, these forecasts should be viewed as merely representative of a broad range of possible outcomes. These forecasts are estimated, based on assumptions, and are subject to significant revision and may change materially as economic and market conditions change. Goldman Sachs has no obligation to provide updates or changes to these forecasts. Case studies and examples are for illustrative purposes only.
The Global Industry Classification Standard (GICS) was developed by and is the exclusive property and a service mark of Morgan Stanley Capital International Inc. (MSCI) and Standard & Poor’s, a division of The McGraw-Hill Companies, Inc. (S&P) and is licensed for use by Goldman Sachs. Neither MSCI, S&P nor any other party involved in making or compiling the GICS or any GICS classifications makes any express or implied warranties or representations with respect to such standard or classification (or the results to be obtained by the use thereof), and all such parties hereby expressly disclaim all warranties of originality, accuracy, completeness, merchantability or fitness for a particular purpose with respect to any of such standard or classification. Without limiting any of the foregoing, in no event shall MSCI, S&P, any of their affiliates or any third party involved in making or compiling the GICS or any GICS classifications have any liability for any direct, indirect, special, punitive, consequential or any other damages (including lost profits) even if notified of the possibility of such damages.
The portfolio risk management process includes an effort to monitor and manage risk, but does not imply low risk.
This material is not authorized for distribution to prospective investors unless preceded or accompanied by a current Prospectus or summary prospectus, if applicable. Investors should consider a Fund’s objective, risks, and charges and expenses, and read the summary prospectus, if available, and/or the Prospectus carefully before investing or sending money. The summary prospectus, if available, and the Prospectus contain this and other information about a Fund and may be obtained from your authorized dealer or from Goldman, Sachs & Co. by calling (retail – 1-800-526-7384) (institutional – 1-800-621-2550).
© 2014 Goldman Sachs. All rights reserved. 122374.MF.MED.TMPL/2/2014/MMALTAR14/1.7K
| | (a) | As of the end of the period covered by this report, the registrant has adopted a code of ethics that applies to the registrant’s principal executive officer, principal financial officer, principal accounting officer or controller, or persons performing similar functions, regardless of whether these individuals are employed by the registrant or a third party (the “Code of Ethics”). |
| | (b) | During the period covered by this report, no amendments were made to the provisions of the Code of Ethics. |
| | (c) | During the period covered by this report, the registrant did not grant any waivers, including an implicit waiver, from any provision of the Code of Ethics. |
| | (d) | A copy of the Code of Ethics is available as provided in Item 12(a)(1) of this report. |
| ITEM 3. | AUDIT COMMITTEE FINANCIAL EXPERT. |
| | The registrant’s board of trustees has determined that the registrant has at least one “audit committee financial expert” (as defined in Item 3 of Form N-CSR) serving on its audit committee. John P. Coblentz, Jr. is the “audit committee financial expert” and is “independent” (as each term is defined in Item 3 of Form N-CSR). |
| ITEM 4. | PRINCIPAL ACCOUNTANT FEES AND SERVICES. |
Table 1 — Items 4(a) - 4(d). The accountant fees below reflect the aggregate fees billed by the Fund of the Goldman Sachs Trust II to which this certified shareholder report relates.
| | | | | | | |
| | | 2013 | | Description of Services Rendered |
| | | | | | | |
| | |
Audit Fees: | | | | | | | |
| | |
• PricewaterhouseCoopers LLP
(“PwC”) | | | $ | 10,000 | | | Financial Statement audits. |
| | |
Audit-Related Fees: | | | | | | | |
| | |
• PwC | | | $ | 0 | | | |
| | |
Tax Fees: | | | | | | | |
| | |
• PwC | | | $ | 0 | | | |
Table 2 — Items 4(b)(c) & (d). Non-Audit Services to the Goldman Sachs Trust II’s service affiliates * that were pre-approved by the Audit Committee of the Goldman Sachs Trust II pursuant to Rule 2-01(c)(7)(ii) of Regulation S-X.
| | | | | | | |
| | | 2013 | | Description of Services Rendered |
| | | | | | | |
| | |
Audit-Related Fees: | | | | | | | |
| | |
• PwC | | | $ | 1,486,420 | | | Internal control review performed in accordance with Statement on Standards for Attestation Engagements No. 16. These fees are borne by the Fund’s Adviser. |
| * | These include the advisor (excluding sub-advisors) and any entity controlling, controlled by or under common control with the advisor that provides ongoing services to the registrant (hereinafter referred to as “service affiliates”). |
Item 4(e)(1) — Audit Committee Pre-Approval Policies and Procedures
Pre-Approval of Audit and Non-Audit Services Provided to the Funds of the Goldman Sachs Trust II. The Audit and Non-Audit Services Pre-Approval Policy (the “Policy”) adopted by the Audit Committee of Goldman Sachs Trust (“GST II”) sets forth the procedures and the conditions pursuant to which services performed by an independent auditor for GST II may be pre-approved. Services may be pre-approved specifically by the Audit Committee as a whole or, in certain circumstances, by the Audit Committee Chairman or the person designated as the Audit Committee Financial Expert. In addition, subject to specified cost limitations, certain services may be pre-approved under the provisions of the Policy. The Policy provides that the Audit Committee will consider whether the services provided by an independent auditor are consistent with the Securities and Exchange Commission’s rules on auditor independence. The Policy provides for periodic review and pre-approval by the Audit Committee of the services that may be provided by the independent auditor.
De Minimis Waiver. The pre-approval requirements of the Policy may be waived with respect to the provision of non-audit services that are permissible for an independent auditor to perform, provided (1) the aggregate amount of all such services provided constitutes no more than five percent of the total amount of revenues subject to pre-approval that was paid to the independent auditors during the fiscal year in which the services are provided; (2) such services were not recognized by GST II at the time of the engagement to be non-audit services; and (3) such services are promptly brought to the attention of the Audit Committee and approved prior to the completion of the audit by the Audit Committee or by one or more members of the Audit Committee to whom authority to grant such approvals has been delegated by the Audit Committee, pursuant to the pre-approval provisions of the Policy.
Pre-Approval of Non-Audit Services Provided to GST’s Investment Advisers. The Policy provides that, in addition to requiring pre-approval of audit and non-audit services provided to GST II, the Audit Committee will pre-approve those non-audit services provided to GST II’s investment advisers (and entities controlling, controlled by or under common control with the investment advisers that provide ongoing services to GST II) where the engagement relates directly to the operations or financial reporting of GST II.
Item 4(e)(2) – 0% of the audit-related fees, tax fees and other fees listed in Table 1 were approved by GST II’s Audit Committee pursuant to the “de minimis” exception of Rule 2-01(c)(7)(i)(C) of Regulation S-X. In addition, 0% of the non-audit services to the GST II’s service affiliates listed in Table 2 were approved by GST II’s Audit Committee pursuant to the “de minimis” exception of Rule 2-01(c)(7)(i)(C) of Regulation S-X.
Item 4(f) – Not applicable.
Item 4(g) Aggregate Non-Audit Fees Disclosure
The aggregate non-audit fees billed to GST II by PwC for the twelve months ended December 31, 2013 were none. The aggregate non-audit fees billed to GST II’s adviser and service affiliates by PwC for non-audit services for the twelve months ended December 31, 2012 were approximately $10.0 million. The figures for these entities are not yet available for twelve months ended December 31, 2013. With regard to the aggregate non-audit fees billed to GST II’s adviser and service affiliates, the 2012 amounts include fees for non-audit services required to be pre-approved [see Table 2] and fees for non-audit services that did not require pre-approval since they did not directly relate to GST II’s operations or financial reporting.
Item 4(h) — GST II’s Audit Committee has considered whether the provision of non-audit services to GST II’s investment adviser and service affiliates that did not require pre-approval pursuant to paragraph (c)(7)(ii) of Rule 2-01 of Regulation S-X is compatible with maintaining the auditors’ independence.
| ITEM 5. | AUDIT COMMITTEE OF LISTED REGISTRANTS. |
| ITEM 6. | SCHEDULE OF INVESTMENTS. |
| | Schedule of Investments is included as part of the Report to Stockholders filed under Item 1. |
| ITEM 7. | DISCLOSURE OF PROXY VOTING POLICIES AND PROCEDURES FOR CLOSED-END MANAGEMENT INVESTMENT COMPANIES. |
| ITEM 8. | PORTFOLIO MANAGERS OF CLOSED-END MANAGEMENT INVESTMENT COMPANIES. |
| ITEM 9. | PURCHASES OF EQUITY SECURITIES BY CLOSED-END MANAGEMENT INVESTMENT COMPANY AND AFFILIATED PURCHASERS. |
| ITEM 10. | SUBMISSION OF MATTERS TO A VOTE OF SECURITY HOLDERS. |
| | There have been no material changes to the procedures by which shareholders may recommend nominees to the registrant’s board of trustees. |
| ITEM 11. | CONTROLS AND PROCEDURES. |
| | (a) | The registrant’s principal executive and principal financial officers, or persons performing similar functions have concluded that the registrant’s disclosure controls and procedures (as defined in Rule 30a-3(c) under the Investment Company Act of 1940, as amended (the “1940 Act”)) are effective as of a date within 90 days of the filing of this report that includes the disclosure required by this paragraph, based on the evaluation of these controls and procedures required by Rule 30a-3(b) under the 1940 Act and 15d-15(b) under the Securities Exchange Act of 1934, as amended. |
| | (b) | There were no changes in the registrant’s internal control over financial reporting (as defined in Rule 30a-3(d) under the 1940 Act) that occurred during the registrant’s second fiscal quarter of the period covered by this report that have materially affected, or are reasonably likely to materially affect, the registrant’s internal control over financial reporting. |
| | | | |
| (a)(1) | | Goldman Sachs Trust II’s Code of Ethics for Principal Executive and Senior Financial Officers is filed herewith. |
| | |
| (a)(2) | | Exhibit 99.CERT | | Certifications pursuant to Section 302 of the Sarbanes-Oxley Act of 2002 filed herewith. |
| | |
| (b) | | Exhibit 99.906CERT | | Certifications pursuant to Section 906 of the Sarbanes-Oxley Act of 2002 filed herewith. |
SIGNATURES
Pursuant to the requirements of the Securities Exchange Act of 1934 and the Investment Company Act of 1940, the registrant has duly caused this report to be signed on its behalf by the undersigned, thereunto duly authorized.
| | | | |
| | | | Goldman Sachs Trust II |
| | |
| By: | | | | /s/ James A. McNamara |
| | | | James A. McNamara |
| | | | President/Principal Executive Officer |
| | | | Goldman Sachs Trust II |
| | |
| Date: | | | | March 9, 2015 |
Pursuant to the requirements of the Securities Exchange Act of 1934 and the Investment Company Act of 1940, this report has been signed below by the following persons on behalf of the registrant and in the capacities and on the dates indicated.
| | | | |
| By: | | | | /s/ James A. McNamara |
| | | | James A. McNamara |
| | | | President/Principal Executive Officer |
| | | | Goldman Sachs Trust II |
| | |
| Date: | | | | March 9, 2015 |
| | |
| By: | | | | /s/ Scott McHugh |
| | | | Scott McHugh |
| | | | Principal Financial Officer |
| | | | Goldman Sachs Trust II |
| | |
| Date: | | | | March 9, 2015 |