UNITED STATES
SECURITIES AND EXCHANGE COMMISSION
Washington, D.C. 20549
FORM N-CSR
CERTIFIED SHAREHOLDER REPORT OF REGISTERED
MANAGEMENT INVESTMENT COMPANIES
Investment Company Act file number 811-22781
Goldman Sachs Trust II
(Exact name of registrant as specified in charter)
71 South Wacker Drive,
Chicago, Illinois 60606
(Address of principal executive offices) (Zip code)
| | |
Copies to: |
Caroline Kraus | | Geoffrey R.T. Kenyon, Esq. |
Goldman, Sachs & Co. | | Dechert LLP |
200 West Street | | 100 Oliver Street |
New York, New York 10282 | | 40th Floor |
| | Boston, MA 02110-2605 |
(Name and address of agents for service)
Registrant’s telephone number, including area code: (312) 655-4400
Date of fiscal year end: October 31
Date of reporting period: October 31, 2015
| ITEM 1. | REPORTS TO STOCKHOLDERS. |
| | The Annual Report to Shareholders is filed herewith. |
Goldman Sachs Funds

| | | | |
| | |
| Annual Report | | | | October 31, 2015 |
| | |
| | | | Strategic Multi-Asset Class Funds |
| | | | Multi-Manager Global Equity |
| | | | Multi-Manager Non-Core Fixed Income |
| | | | Multi-Manager Real Assets Strategy |

Goldman Sachs Strategic
Multi-Asset Class Funds
| n | | MULTI-MANAGER GLOBAL EQUITY |
| n | | MULTI-MANAGER NON-CORE FIXED INCOME |
| n | | MULTI-MANAGER REAL ASSETS STRATEGY |
| | | | |
TABLE OF CONTENTS | | | | |
| |
Principal Investment Strategies and Risks | | | 1 | |
| |
Portfolio Management Discussion and Performance Summaries | | | 3 | |
| |
Schedules of Investments | | | 21 | |
| |
Financial Statements | | | 53 | |
| |
Financial Highlights | | | 56 | |
| |
Notes to Financial Statements | | | 62 | |
| |
Report of Independent Registered Public Accounting Firm | | | 79 | |
| |
Other Information | | | 80 | |
| | | | |
| | | |
| NOT FDIC-INSURED | | May Lose Value | | No Bank Guarantee |
GOLDMAN SACHS STRATEGIC MULTI-ASSET CLASS FUNDS
Principal Investment Strategies and Risks
This is not a complete list of risks that may affect the Funds. For additional information concerning the risks applicable to the Funds, please see the Funds’ Prospectus.
The Goldman Sachs Multi-Manager Global Equity Fund invests primarily in equity investments of U.S. and non-U.S. companies. The Fund allocates its assets among multiple investment managers who are unaffiliated with the Investment Adviser. The Fund’s equity investments are subject to market risk, which means that the value of the securities in which it invests may go up or down in response to the prospects of individual companies, particular sectors or governments and/or general economic conditions. Foreign and emerging markets securities may be more volatile and less liquid than investments in U.S. securities and are subject to the risks of currency fluctuations and adverse economic or political developments. The securities of mid- and small-capitalization companies involve greater risks than those associated with larger, more established companies and may be subject to more abrupt or erratic price movements. Derivative instruments may involve a high degree of financial risk. These risks include the risk that a small movement in the price of the underlying security or benchmark may result in a disproportionately large movement, unfavorable or favorable, in the price of the derivative instrument; risk of default by a counterparty; and liquidity risk. The Fund’s use of derivatives may result in leverage, which can make the Fund more volatile. At times, the Fund may be unable to sell certain of its illiquid investments without a substantial drop in price, if at all.
The Goldman Sachs Multi-Manager Non-Core Fixed Income Fund invests primarily in fixed income securities, which may be represented by forwards or other derivatives such as options, futures contracts or swap agreements. The Fund allocates its assets among multiple investment managers who are unaffiliated with the Investment Adviser. Investments in fixed income securities are subject to the risks associated with debt securities generally, including credit, interest rate, liquidity, call and extension risk. The Fund may invest in non-investment grade securities and distressed securities. High yield, lower rated investments involve greater price volatility and present greater risks than higher rated fixed income securities. Foreign and emerging markets investments may be more volatile and less liquid than investments in U.S. securities and are subject to the risks of currency fluctuations and adverse economic or political developments. Derivative instruments may involve a high degree of financial risk. These risks include the risk that a small movement in the price of the underlying security or benchmark may result in a disproportionately large movement, unfavorable or favorable, in the price of the derivative instrument; the risk of default by a counterparty; and liquidity risk. At times, the Fund may be unable to sell certain of its illiquid investments without a substantial drop in price, if at all. The Fund’s borrowing and use of derivatives result in leverage, which can make the Fund more volatile. The Fund is “non-diversified” and may invest more of its assets in fewer issuers than “diversified” funds. Accordingly, the Fund may be more susceptible to adverse developments affecting any single issuer held in its portfolio and to greater losses resulting from these developments.
The Goldman Sachs Multi-Manager Real Assets Strategy Fund invests primarily in “real assets”, which includes investments in companies and derivatives (futures, options, swaps and other instruments) that provide exposure to real assets. Real assets are defined broadly by the Fund and include any assets that have physical properties or inflation sensitive characteristics, such as energy, real estate, infrastructure, commodities, and inflation-linked or floating rate fixed income securities. The Fund allocates its assets among multiple investment managers who are unaffiliated with the Investment Adviser. The Fund is subject to market risk, which means that the value of the securities in which it invests may go up or down in response to the prospects of individual companies, particular sectors and/or general economic conditions. Foreign and emerging markets investments may be more volatile and less liquid than investments in U.S. securities and are subject to the risks of currency fluctuations and adverse economic or political developments. Because the Fund concentrates its investments in the real estate group of industries, the Fund is subject to greater risk of loss as a result of adverse economic, business or other developments affecting industries within those industries than if its
1
GOLDMAN SACHS STRATEGIC MULTI-ASSET CLASS FUNDS
investments were more diversified across different industries. Investments in fixed income securities are subject to the risks associated with debt securities generally, including credit, liquidity and interest rate risk.
The Fund primarily gains exposure to the commodities markets by investing in a wholly-owned subsidiary of the Fund organized as a company under the laws of the Cayman Islands (the “Subsidiary”). The Subsidiary primarily obtains its commodity exposure by investing in commodity-linked derivative instruments (which may include total return swaps). The Subsidiary also invests in other instruments, including fixed income securities, either as investments or to serve as margin or collateral for its swap positions. The Fund is subject to the risk that exposure to the commodities markets may subject the Fund to greater volatility than investments in traditional securities. The Fund is subject to tax risk as a result of its investments in the Subsidiary, as the Fund has not received a private letter ruling from the Internal Revenue Service (“IRS”) concluding that income and gains from such investments are “qualifying income.” The IRS has suspended granting such private letter rulings, and the Fund cannot rely on private letter rulings granted to other taxpayers. The tax treatment of investments in the Subsidiary may be adversely affected by future legislation and/or IRS guidance. While the Fund has obtained an opinion of counsel regarding such investments, if the IRS were to successfully assert that the Fund’s income from such investments was not “qualifying income,” in which case the Fund would fail to qualify as a regulated investment company, the Fund would be subject to federal and state income tax on all of its taxable income at regular corporate tax rates with no deduction for any distributions paid to shareholders, which would significantly adversely affect the returns to Fund shareholders.
Derivative instruments may involve a high degree of financial risk. These risks include the risk that a small movement in the price of the underlying security or benchmark may result in a disproportionately large movement, unfavorable or favorable, in the price of the derivative instrument; the risk of default by a counterparty; and liquidity risk. The Fund’s use of derivatives may result in leverage, which can make the Fund more volatile. At times, the Fund may be unable to sell certain of its illiquid investments without a substantial drop in price, if at all.
2
PORTFOLIO RESULTS
Goldman Sachs Multi-Manager
Global Equity Fund
Investment Objective
The Fund seeks to provide long-term capital growth.
Portfolio Management Discussion and Analysis
Below, the Goldman Sachs Global Portfolio Solutions (“GPS”) and Alternative Investments & Manager Selection (“AIMS”) Groups discuss the Goldman Sachs Multi-Manager Global Equity Fund’s (the “Fund”) performance and positioning for the period from inception on June 24, 2015 through October 31, 2015 (the “Reporting Period”).
| Q | | How did the Fund perform during the Reporting Period? |
| A | | During the Reporting Period, the Fund’s Institutional Shares generated a cumulative total return of -5.40%. This return compares to the -5.03% cumulative total return of the Fund’s benchmark, the MSCI All Country World Index Investable Market Index (“ACWI IMI”) (Net, USD, 50% Non-U.S. Developed Hedged to USD) (the “Index”) during the same time period. |
| Q | | What economic and market factors most influenced the global equity markets as a whole during the Reporting Period? |
| A | | U.S. economic data continued to recover, albeit sluggishly, during the Reporting Period. Underlying second quarter 2015 Gross Domestic Product (“GDP”) growth was strong at 3.9% year over year, driven largely by an increase in exports as well as by positive numbers in housing and consumer spending. Third quarter 2015 GDP growth decelerated to 1.5% year over year, based on advance estimates, primarily due to an inventory drag. However, economists generally believe the inventory downturn to be temporary, and the majority appear to be encouraged by solid domestic consumer spending. (Inventory is defined as finished product that is ready for sale, but has not been sold yet. Inventory is considered a current asset and shown on the balance sheet, generally at cost. On the scale of the national economy, changes in inventory levels can impact GDP.) |
| | | Despite these numbers, uncertainty surrounding the Federal Reserve’s (the “Fed”) rate hike timing, combined with fears of a slowdown in China and other emerging markets, resulted in a dramatic sell-off in equity markets globally in August and September 2015. In the U.S., the most weakness was observed in the health care sector, particularly in the biotechnology industry, which declined approximately 8% as measured by the S&P 500 Index and approximately 23% in the Russell 2000 Index during the Reporting Period. Energy names declined approximately 10% in the S&P 500 Index and approximately 28% in the Russell 2000 Index. While U.S. equities rallied in October 2015, driven largely by rebounds in information technology, consumer discretionary, health care and energy, the S&P 500 Index ended the Reporting Period down approximately 1%, while the Russell 2000 Index was down approximately 9%. |
| | | Internationally, we saw the most weakness in the energy and materials sectors. The energy sector declined approximately 12% in the MSCI Europe, Australasia and Far East (“EAFE”) Index and approximately 19% in the MSCI Emerging Markets Index during the Reporting Period. The materials sector was down approximately 16% in both the MSCI EAFE Index and the MSCI Emerging Markets Index during the Reporting Period. Weak Chinese economic data weighed heavily on emerging markets, and Chinese equities fell approximately 19% in the MSCI Emerging Markets Index during the Reporting Period. Brazil was also an area of focus, as the country’s debt was downgraded by independent ratings agency Standard & Poor’s Ratings Services to non-investment grade in September 2015. Brazilian equities were down approximately 31% in the MSCI Emerging Markets Index during the Reporting Period. Australian equities, which declined approximately 14% in the MSCI EAFE Index during the Reporting Period, significantly underperformed given weakness in commodity markets. Japanese equities, down approximately 4% in the MSCI EAFE Index during the Reporting Period, succumbed to the global equity sell-off in September 2015, yet still managed to lead other regions, as the country benefited from positive market reception to governmental reforms and pension inflows into its equity market during the first half of 2015. A strong U.S. dollar weighed on corporate earnings, particularly for companies with significant international exposure. |
3
PORTFOLIO RESULTS
| | | International equities enjoyed a strong month in October 2015, largely driven by information technology, energy and materials, as the price of oil modestly increased. Despite the global equity market rebound, major international indices largely trended downward for the Reporting Period overall. The MSCI EAFE Index was down approximately 7%, while the MSCI Emerging Markets Index was down approximately 13% during the Reporting Period as a whole. |
| Q | | What key factors were responsible for the Fund’s performance during the Reporting Period? |
| A | | The Fund’s performance during the Reporting Period can be attributed to the performance of the Fund’s Underlying Managers, who are unaffiliated investment managers that employ a global equity investment strategy. During the Reporting Period, the Fund allocated capital to eight Underlying Managers — Causeway Capital Management LLC (“Causeway”), Epoch Investment Partners, Inc. (“Epoch”), Fisher Asset Management, LLC (“Fisher”), GW&K Investment Management, LLC (“GW&K”), Robeco Investment Management, Inc. doing business as Boston Partners (“Boston Partners”), Scharf Investments, LLC (“Scharf”); Vulcan Value Partners, LLC (“Vulcan”) and WCM Investment Management (“WCM”). These eight Underlying Managers represented five asset classes across global equity as part of the Fund’s top-level strategy allocation — U.S. large cap (Scharf and Vulcan), EAFE large cap (Causeway and WCM), U.S. small cap (GW&K and Boston Partners), EAFE small cap (Epoch) and emerging markets (Fisher). Of the eight Underlying Managers with allocated capital during the Reporting Period, all eight generated negative absolute returns amidst the sell-off in global equity markets. |
| | | Parametric Portfolio Associates LLC (“Parametric”) was approved by the Fund’s Board but did not have assets allocated to it during the Reporting Period. |
| | | The Fund additionally uses Russell Implementation Services Inc. (“Russell”) for a currency overlay program given the hedged nature of the Fund’s benchmark. The Fund also had exposure to two exchange-traded funds during the Reporting Period. |
| | | Of the five global equity asset classes to which the Fund had exposure via Underlying Manager strategies during the Reporting Period, all five generated negative absolute returns amidst persistent market pressure. Performance relative to the Index was mainly driven by strategic asset allocation, which reflects a longer-term perspective to diversify and invest across global equity markets, and manager selection. We would note that while the Fund posted muted performance since inception, we do not consider the brief Reporting Period to be a strong indicator of Fund performance in light of the impact of short-term market dynamics. |
| | | That said, strategic asset allocation performance relative to the Index had a positive effect on the Fund’s results, as an overweight to EAFE small cap relative to U.S. large cap bolstered performance. |
| | | Manager selection detracted from the Fund’s performance relative to the Index during the Reporting Period. The weakest relative performance came from U.S. equity Underlying Manager Vulcan, who significantly underperformed the S&P 500 Index, the primary index to which we compare this Underlying Manager. This was partially offset by international growth-oriented Underlying Manager WCM, who outperformed the Morgan Stanley Capital International All Country World Index ex-U.S. (“MSCI ACWI ex-U.S.”), the index to which we compare this Underlying Manager. |
| Q | | Which global equity asset classes most significantly affected Fund performance? |
| A | | From an absolute return perspective, EAFE large cap had the most significant effect on the Fund’s negative performance during the Reporting Period, followed by emerging markets. As mentioned earlier, uncertainty around the timing of interest rate hikes, combined with fears of an economic slowdown in China and other emerging markets, resulted in volatility across most global equity markets during the Reporting Period. |
| | | Also relative to the Index, EAFE large cap detracted most. This was due to significant underperformance by value- oriented Underlying Manager Causeway, whose results were only partially offset by stronger relative performance by growth-oriented Underlying Manager WCM. |
| Q | | How did the Fund use derivatives and similar instruments during the Reporting Period? |
| A | | Russell manages a currency overlay allocation that seeks to minimize unintended currency exposures that either reduce performance or increase risk of the Fund’s portfolio. Russell uses currency forwards as part of this strategy. Outside of Russell, the Fund did not use derivatives during the Reporting Period. |
4
PORTFOLIO RESULTS
| Q | | Were there any notable changes in the Fund’s allocations during the Reporting Period? |
| A | | Given the Fund’s launch on June 24, 2015, it was not a matter of making changes but of building the Fund’s portfolio via allocating assets to Underlying Managers. |
| | | Throughout the Reporting Period, the Fund’s assets were allocated 33% to U.S. large cap, 28% to EAFE large cap, 9% to U.S. small cap, 17% to EAFE small cap and 11% to emerging markets. The remainder of the Fund’s assets were invested in cash and cash equivalents. |
| Q | | What is the Fund’s tactical view and strategy for the months ahead? |
| A | | At the end of the Reporting Period, we maintained our belief that the current environment is supportive of risk assets, which should be underpinned by economic improvement in developed markets, quiescent inflation and supportive policy. We remained more constructive on equities over credit and credit over rates. We anticipate equities will have a positive, albeit low, Sharpe ratio into year-end, led by Europe, with strong data supporting conviction in the European recovery. (The Sharpe ratio is a measure for calculating risk-adjusted return, and this ratio has become the industry standard for such calculations. The Sharpe ratio is the average return earned in excess of the risk-free rate per unit of volatility or total risk. Generally, the greater the value of the Sharpe ratio, the more attractive the risk-adjusted return.) We maintain confidence in the U.S. expansion, as the consumer continues to play a key role and as signs appear to indicate that the labor market is continuing its healing process. We expect there to be a continued focus on China. Looking forward, we have rising confidence in the view that the near term data momentum in China is bottoming out and thus, too, its potential impact on Asia. |
| | | Overall, we intend to continue to position the Fund in alignment with our longer-term strategic views within the equity complex as a complement to additional strategic market exposures. We further intend to continue to monitor allocations and Underlying Manager performance as we seek to generate long-term capital growth. |
5
FUND BASICS
Multi-Manager Global Equity Fund
as of October 31, 2015
| | | | | | | | | | |
| | PERFORMANCE REVIEW | |
| | | June 24, 2015–
October 31, 2015 | | Fund Total Return
(based on NAV)1 | | | MSCI ACWI IMI (Net, USD, 50% Non-U.S. Developed Hedged to USD)2 | |
| | | Institutional | | | -5.40 | % | | | -5.03 | % |
| | 1 | | The net asset value (“NAV”) represents the net assets of the class of the Fund (ex-dividend) divided by the total number of shares of the class outstanding. The Fund’s performance reflects the reinvestment of dividends and other distributions. The Fund’s performance does not reflect the deduction of any applicable sales charges. |
| | 2 | | The MSCI ACWI IMI (Net, USD, 50% Non-US Developed Hedged to USD) captures large, mid and small cap representation across 23 developed markets and 23 emerging markets. With 8,575 constituents, the MSCI ACWI IMI is comprehensive, covering approximately 99% of the global equity investment opportunity set. As of February 28, 2015, the 23 developed markets in the MSCI ACWI IMI include Australia, Austria, Belgium, Canada, Denmark, Finland, France, Germany, Hong Kong, Ireland, Israel, Italy, Japan, Netherlands, New Zealand, Norway, Portugal, Singapore, Spain, Sweden, Switzerland, the U.K. and the U.S. The 23 emerging markets include Brazil, Chile, China, Colombia, Czech Republic, Egypt, Greece, Hungary, India, Indonesia, South Korea, Malaysia, Mexico, Peru, Philippines, Poland, Russia, Qatar, South Africa, Taiwan, Thailand, Turkey and United Arab Emirates. |
| | | | | | | | |
| | STANDARDIZED TOTAL RETURNS3 |
| | | For the period ended 9/30/15 | | Since Inception | | | Inception Date |
| | | Institutional | | | -11.00 | % | | 6/24/2015 |
| | 3 | | The Standardized Total Returns are cumulative total returns as of the most recent calendar quarter-end. They assume reinvestment of all distributions at NAV. Because Institutional Shares do not involve a sales charge, such a charge is not applied to their Standardized Total Returns. |
The returns set forth in the tables above represent past performance. Past performance does not guarantee future results. The Fund’s investment return and principal value will fluctuate so that an investor’s shares, when redeemed, may be worth more or less than their original cost. Current performance may be lower or higher than the performance quoted above. Please visit our web site at www.GSAMFUNDS.com to obtain the most recent month-end returns. Performance reflects applicable fee waivers and/or expense limitations in effect during the periods shown. In their absence, performance would be reduced. Returns do not reflect the deduction of taxes that a shareholder would pay on Fund distributions or the redemption of Fund shares.
| | | | | | | | | | |
| | EXPENSE RATIOS4 | |
| | | | | Net Expense Ratio (Current) | | | Gross Expense Ratio (Before Waivers) | |
| | | Institutional | | | 0.85 | % | | | 1.50 | % |
| | 4 | | The expense ratios of the Fund, both current (net of applicable fee waivers and/or expense limitations) and before waivers (gross of applicable fee waivers and/or expense limitations) are as set forth above according to the most recent publicly available Prospectus for the Fund and may differ from the expense ratios disclosed in the Financial Highlights in this report. Pursuant to a contractual arrangement, the Fund’s waivers and/or expense limitations will remain in place through at least May 20, 2016, and prior to such date the investment adviser may not terminate the arrangements without the approval of the Fund’s Board of Trustees. If these arrangements are discontinued in the future, the expense ratios may change without shareholder approval. |
6
FUND BASICS
|
| FUND COMPOSITION (%)5 |
| As of October 31, 2015 |
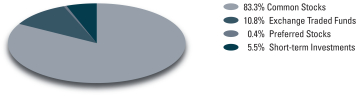
| | 5 | | The percentage shown for each investment category reflects the value of investments in that category as a percentage of net assets. Short-term investments represent repurchase agreements. Figures in the graph may not sum to 100% due to the exclusion of other assets and liabilities. The graph depicts the Fund’s investments but may not represent the Fund’s market exposure due to the exclusion of certain derivatives, if any, as listed in the Additional Investment Information section of the Schedule of Investments. |
7
PORTFOLIO RESULTS
Goldman Sachs Multi-Manager Non-Core Fixed Income Fund
Investment Objective
The Fund seeks a total return consisting of income and capital appreciation.
Portfolio Management Discussion and Analysis
Below, the Goldman Sachs Global Portfolio Solutions (“GPS”) and Alternative Investments & Manager Selection (“AIMS”) Groups discuss the Goldman Sachs Multi-Manager Non-Core Fixed Income Fund’s (the “Fund”) performance and positioning for the period from inception on March 31, 2015 through October 31, 2015 (the “Reporting Period”).
| Q | | How did the Fund perform during the Reporting Period? |
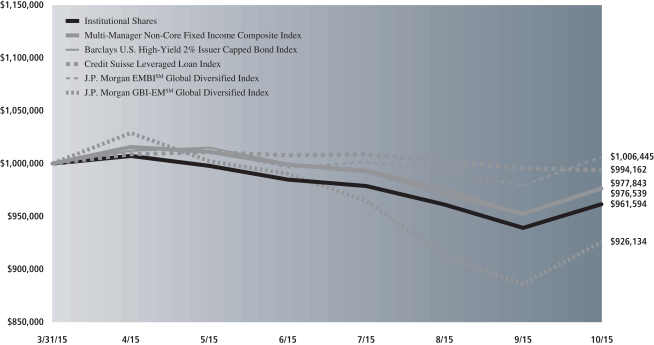
| A | | During the Reporting Period, the Fund’s Institutional Shares generated a cumulative total return of -3.84%. This return compares to the -2.35% cumulative total return of the Fund’s benchmark, the Multi-Manager Non-Core Fixed Income Composite Index (the “Index”) during the same time period. |
| | | The Index is composed 40% of the Barclays U.S. High-Yield 2% Issuer Capped Bond Index (Gross, USD, Unhedged); 20% of the Credit Suisse Leveraged Loan Index (Gross, USD, Unhedged); 20% of the J.P. Morgan Emerging Market Bond Index (EMBISM) Global Diversified Index (Gross, USD, Unhedged); and 20% of the J.P. Morgan Government Bond Index — Emerging Markets (GBI-EMSM) Global Diversified Index (Gross, USD, Unhedged), which returned -2.22%, -0.58%, 0.64% and -7.39%, respectively, during the Reporting Period. |
| Q | | What economic and market factors most influenced the non-core fixed income markets as a whole during the Reporting Period? |
| A | | U.S. economic data continued to recover, albeit sluggishly, during the Reporting Period. Underlying second quarter 2015 Gross Domestic Product (“GDP”) growth was strong at 3.9% year over year, driven largely by an increase in exports as well as by positive numbers in housing and consumer spending. Third quarter 2015 GDP growth decelerated to 1.5% year over year, based on advance estimates, primarily due to an inventory drag. However, economists generally believe the inventory downturn to be temporary, and the majority appear to be encouraged by solid domestic consumer spending. (Inventory is defined as finished product that is ready for sale, but has not been sold yet. Inventory is considered a current asset and shown on the balance sheet, generally at cost. On the scale of the national economy, changes in inventory levels can impact GDP.) |
| | | Three macro drivers have affected the non-core fixed income markets most during the Reporting Period. The first was volatility around oil prices. Risk assets generally traded inline with oil — i.e. a sharp rally in the second quarter of 2015 with West Texas Intermediate crude oil prices climbing to more than $60 per barrel followed by a steep sell-off in the third quarter of 2015 as crude oil prices fell back to less than $40 per barrel. This volatility affected virtually all segments of the non-core fixed income markets, particularly energy-related bonds and emerging market currencies. |
| | | The second was slowing economic growth in China and its government’s policy making. This macro driver mostly impacted the emerging market debt sector. China’s GDP growth fell below 7% for the first time during the Reporting Period in conjunction with the correction in its stock market and its government surprisingly devaluing its currency. All of this brought into question by market participants the ability of Chinese policy makers to navigate a soft landing. Latin American and Asian markets were most impacted by these events. |
| | | The third macro driver that affected the non-core fixed income markets during the Reporting Period was uncertainty around the hiking of interest rates by the Federal Reserve (the “Fed”). Market consensus appeared to be surprised as the lift-off, or first interest rate hike, continued to be pushed out. While such a delay ostensibly would benefit U.S. duration-sensitive sectors, such as U.S. dollar-denominated emerging market debt and high yield corporate bonds, recent postponements seemed to be perceived by the market as negative events. |
8
PORTFOLIO RESULTS
| | | Against this backdrop, emerging market debt was the worst performing sector in the non-core fixed income market during the Reporting Period. In particular, local currency bonds declined 7.4% in U.S. dollar terms during the Reporting Period, primarily due to the sharp weakening of emerging market currencies. For example, the Brazilian real depreciated 17.1% during the Reporting Period. External emerging market debt outperformed local currency markets but still posted negative returns, as spreads, or yield differentials, widened to 393 basis points during the Reporting Period. (A basis point is 1/100th of a percentage point.) U.S. high yield also posted negative performance during the Reporting Period, with the Barclays U.S. High- Yield 2% Issuer Capped Index down 2.22%, driven largely by high yield bonds in the energy sector, which makes up approximately 13% of this index. Energy-related bonds particularly suffered from persistent volatility and a large decline in oil prices during the summer months of 2015. Finally, loans experienced some spread widening, particularly during the third quarter of 2015. The Credit Suisse Leveraged Loan Index was down 0.58% for the Reporting Period as a whole but was down 1.3% in the third quarter of 2015. This was the first time the loan market had posted three consecutive months of negative performance since 2008. Still, loans outperformed high yield bonds primarily, in our view, because they are higher in the capital structure and because less of the loan market has exposure to commodity prices. |
| Q | | What key factors were responsible for the Fund’s performance during the Reporting Period? |
| A | | The Fund’s performance during the Reporting Period can be attributed to the performance of the Fund’s Underlying Managers, who are unaffiliated investment managers that employ a non-core fixed income investment strategy. During the Reporting Period, the Fund allocated capital to four Underlying Managers — Ares Capital Management II LLC (“Ares”), BlueBay Asset Management LLP (“BlueBay”), Lazard Asset Management LLC (“Lazard”) and Symphony Asset Management LLC (“Symphony”). These four Underlying Managers represented four sectors across non- core fixed income as part of the Fund’s top-level strategy allocation — high yield (Ares), bank loans (Symphony), external emerging market debt (BlueBay and Lazard) and local emerging market debt (BlueBay and Lazard). Of the four Underlying Managers with allocated capital during the Reporting Period, three generated negative absolute returns and one posted positive absolute returns. |
| | | Of the four sectors of the non-core fixed income market to which the Fund had exposure via Underlying Manager strategies during the Reporting Period, three generated negative absolute returns amidst persistent market pressure and one posted positive absolute returns. |
| | | Performance relative to the Index was mainly driven by strategic asset allocation, which reflects a longer-term perspective to diversify and invest in non-core fixed income sectors, and manager selection. We would note that while the Fund posted muted performance since inception, we do not consider the brief Reporting Period to be a strong indicator of Fund performance, particularly in light of the impact of short-term market dynamics. |
| | | That said, strategic asset allocation performance relative to the Index was most significantly impacted by the performance of local emerging market debt, to which the Fund was overweight relative to the Index. Fears about emerging market economic weakness and strength in the U.S. dollar during the Reporting Period put pressure on local emerging market currencies, which performed poorly. |
| | | From a manager selection perspective, underperformance relative to the Index primarily came from BlueBay, one of the emerging market debt Underlying Managers. This was partially offset by modestly positive relative returns from Ares, the high yield Underlying Manager. |
| Q | | Which non-core fixed income sectors most significantly affected Fund performance? |
| A | | On an absolute return basis and from a contribution to return perspective, emerging market debt posted the most negative returns during the Reporting Period amidst persistent volatility in the emerging markets. The Fund currently has two managers — BlueBay and Lazard — within the emerging market debt strategy. BlueBay posted negative absolute returns, while Lazard posted significant positive absolute returns. That said, from an absolute return perspective, the divergence in returns was primarily due to the different funding dates. BlueBay was funded on March 31, 2015, i.e. for the full Reporting Period, while Lazard was allocated capital for a much shorter time frame, beginning September 30, 2015, which was the start of a rally in the sector. |
| | | Bank loans, as a sector, posted the least negative returns during the Reporting Period, as spreads widened less given the seniority of loans in the capital structure. |
9
PORTFOLIO RESULTS
| Q | | How did the Fund use derivatives and similar instruments during the Reporting Period? |
| A | | The Fund’s Underlying Managers used currency forwards, bond futures, credit default swaps and interest rate swaps during the Reporting Period to implement their strategies for the Fund. |
| Q | | Were there any notable changes in the Fund’s allocations during the Reporting Period? |
| A | | Given the Fund’s launch on March 31, 2015, it was not a matter of making changes but of building the Fund’s portfolio via allocating assets to Underlying Managers. |
| | | Throughout the Reporting Period, the Fund’s assets were allocated 25% to local emerging market debt, 14% to external emerging market debt, 21% to bank loans and 40% to high yield. Within the emerging market debt sectors, we did reduce BlueBay’s allocation as we funded Lazard on September 30, 2015. |
| Q | | What is the Fund’s tactical view and strategy for the months ahead? |
| A | | At the end of the Reporting Period, we remained neutral on non-investment grade credit, including U.S. high yield and bank loans. In this environment, we anticipate carry- generative strategies may outperform. (The carry of an asset is the return obtained from holding it, if positive, or the cost of holding it, if negative.) Low real rates and a benign U.S. default outlook imply, in our view, that spreads provide sufficient compensation for credit risk. However, given tightening toward the end of the Reporting Period, we do not expect material capital appreciation in the near term and generally find the rates exposure of cash bonds unattractive relative to other risk assets. We believe credit fundamentals largely remain in line with an expansionary phase of the business cycle. At the same time, we are cognizant that the credit cycle is exhibiting a number of late-cycle behaviors that suggest to us that the cycle is maturing. Strategically, we believe emerging market debt is still a valuable portfolio allocation. Still, we are moderately bearish on a tactical basis given its longer duration and weaker domestic fundamentals. Further, the higher sensitivity to U.S. rates to these emerging market debt assets is a key point of concern for us. |
| | | Overall, we intend to continue to position the Fund in alignment with our longer-term strategic views on the non-core fixed income market as a complement to additional strategic market exposures. We further intend to continue to monitor allocations and Underlying Manager performance as we seek to generate income and capital appreciation. |
10
FUND BASICS
Non-Core Fixed Income Fund
as of October 31, 2015
| | | | | | | | | | | | | | | | | | | | | | | | | | |
| | PERFORMANCE REVIEW | |
| | | March 31, 2015– October 31, 2015 | | Fund Total Return (based on NAV)1 | | | Multi- Manager Non-Core Fixed Income Composite Index2 | | | Barclays U.S. High-Yield 2% Issuer Capped Bond Index (Gross, USD, Unhedged) | | | Credit Suisse Leveraged Loan Index (Gross, USD, Unhedged) | | | JP Morgan EMBISM Global Diversified Index (Gross, USD, Unhedged) | | | JP Morgan GBI-EMSM Global Diversified Index (Gross, USD, Unhedged) | |
| | | Institutional | | | -3.84 | % | | | -2.35 | % | | | -2.22 | % | | | -0.58 | % | | | 0.64 | % | | | -7.39 | % |
| | 1 | | The net asset value (“NAV”) represents the net assets of the class of the Fund (ex-dividend) divided by the total number of shares of the class outstanding. The Fund’s performance reflects the reinvestment of dividends and other distributions. The Fund’s performance does not reflect the deduction of any applicable sales charges. |
| | 2 | | The Multi-Manager Non-Core Fixed Income Composite Index is comprised of the Barclays U.S. High-Yield 2% Issuer Capped Bond (Gross, USD, Unhedged) Index (40%), the Credit Suisse Leveraged Loan (Gross, USD, Unhedged) Index (20%), the J.P. Morgan EMBISM Global Diversified (Gross, USD, Unhedged) Index (20%), and the J.P. Morgan GBI-EMSM Global Diversified (Gross, USD, Unhedged) Index (20%). |
| | | | | | | | |
| | STANDARDIZED TOTAL RETURNS3 |
| | | For the period ended 9/30/15 | | Since Inception | | | Inception Date |
| | | Institutional | | | -6.06 | % | | 3/31/2015 |
| | 3 | | The Standardized Total Returns are cumulative total returns as of the most recent calendar quarter-end. They assume reinvestment of all distributions at NAV. Because Institutional Shares do not involve a sales charge, such a charge is not applied to their Standardized Total Returns. |
The returns set forth in the tables above represent past performance. Past performance does not guarantee future results. The Fund’s investment return and principal value will fluctuate so that an investor’s shares, when redeemed, may be worth more or less than their original cost. Current performance may be lower or higher than the performance quoted above. Please visit our web site at www.GSAMFUNDS.com to obtain the most recent month-end returns. Performance reflects applicable fee waivers and/or expense limitations in effect during the periods shown. In their absence, performance would be reduced. Returns do not reflect the deduction of taxes that a shareholder would pay on Fund distributions or the redemption of Fund shares.
| | | | | | | | | | |
| | EXPENSE RATIOS4 | |
| | | | | Net Expense Ratio (Current) | | | Gross Expense Ratio (Before Waivers) | |
| | | Institutional | | | 0.70 | % | | | 1.13 | % |
| | 4 | | The expense ratios of the Fund, both current (net of applicable fee waivers and/or expense limitations) and before waivers (gross of applicable fee waivers and/or expense limitations) are as set forth above according to the most recent publicly available Prospectus for the Fund and may differ from the expense ratios disclosed in the Financial Highlights in this report. Pursuant to a contractual arrangement, the Fund’s waivers and/or expense limitations will remain in place through at least January 31, 2016, and prior to such date the Investment Adviser may not terminate the arrangements without the approval of the Fund’s Board of Trustees. If these arrangements are discontinued in the future, the expense ratios may change without shareholder approval. |
11
FUND BASICS
|
| FUND COMPOSITION (%)5 |
| As of October 31, 2015 |
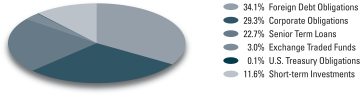
| | 5 | | The percentage shown for each investment category reflects the value of investments in that category as a percentage of net assets. Short-term investments represent repurchase agreements. Figures in the graph may not sum to 100% due to the exclusion of other assets and liabilities. The graph depicts the Fund’s investments but may not represent the Fund’s market exposure due to the exclusion of certain derivatives, if any, as listed in the Additional Investment Information section of the Schedule of Investments. |
12
GOLDMAN SACHS MULTI-MANAGER NON-CORE FIXED INCOME FUND
Performance Summary
October 31, 2015
The following graph shows the value, as of October 31, 2015, of a $1,000,000 investment made on March 31, 2015 (commencement of operations) in Institutional Shares at NAV. For comparative purposes, the performance of the Fund’s benchmark, the Multi- Manager Non-Core Fixed Income Composite Index which is composed of the Barclays U.S. High-Yield 2% Issuer Capped Bond Index (Gross, USD, Unhedged) (40%), the Credit Suisse Leveraged Loan Index (Gross, USD, Unhedged) (20%), the J.P. Morgan Emerging Market Bond Index (EMBISM) Global Diversified Index (Gross, USD, Unhedged) (20%) and the J.P. Morgan Government Bond Index — Emerging Markets (GBI-EMSM) Global Diversified Index (Gross, USD, Unhedged) (20%), is shown. This performance data represents past performance and should not be considered indicative of future performance, which will fluctuate with changes in market conditions. These performance fluctuations will cause an investor’s shares, when redeemed, to be worth more or less than their original cost. Performance reflects applicable fee waivers and/or expense limitations in effect during the periods shown and in their absence, performance would be reduced. Returns do not reflect the deduction of taxes that a shareholder would pay on Fund distributions or the redemption of Fund shares. In addition to the Underlying Managers’ decisions regarding issuer/industry investment selection and allocation, other factors may affect Fund performance. These factors include, but are not limited to, Fund operating fees and expenses, portfolio turnover and subscription and redemption cash flows affecting the Fund.
|
| Multi-Manager Non-Core Fixed Income Fund’s Lifetime Performance |
Performance of a $1,000,000 Investment, with distributions reinvested, from March 31, 2015 through October 31, 2015.
| | |
| Average Annual Total Return through October 31, 2015 | | Since Inception |
Institutional (Commenced March 31, 2015) | | -3.84%* |
| | |
| * | | Total return for periods of less than one year represents cumulative total return. |
13
PORTFOLIO RESULTS
Goldman Sachs Multi-Manager
Real Assets Strategy Fund
Investment Objective
The Fund seeks to provide long-term capital growth through investments related to real assets.
Portfolio Management Discussion and Analysis
Below, the Goldman Sachs Global Portfolio Solutions (“GPS”) and Alternative Investments & Manager Selection (“AIMS”) Groups discuss the Goldman Sachs Multi-Manager Real Assets Strategy Fund’s (the “Fund”) performance and positioning for the period from inception on June 30, 2015 through October 31, 2015 (the “Reporting Period”).
| Q | | How did the Fund perform during the Reporting Period? |
| A | | During the Reporting Period, the Fund’s Institutional Shares generated a cumulative total return of -4.30%. This return compares to the -3.40% cumulative total return of the Fund’s benchmark, the Multi-Manager Real Assets Strategy Composite Index (the “Index”) during the same time period. |
| | | The Index is composed 20% of the S&P GSCI® Commodity Index (Net, USD, Unhedged); 40% of the FTSE EPRA/NAREIT Developed Index (Net, USD, Unhedged); and 40% of the Dow Jones Brookfield Global Infrastructure Index (Net, USD, Unhedged), which returned -19.11%, 4.02% and -2.78%, respectively, during the Reporting Period. |
| Q | | What economic and market factors most influenced the real assets-oriented markets as a whole during the Reporting Period? |
| A | | Global equity markets were volatile during the Reporting Period, selling off through the third quarter of 2015 and then rebounding sharply in October 2015. For the Reporting Period overall, the S&P 500 Index returned approximately 1%; the MSCI® EAFE® Index returned approximately -3%; and the MSCI Emerging Markets Index returned approximately -12%. |
| | | The sell-off in the third calendar quarter was led by Asia and driven mainly around concerns about Chinese economic growth and about the impact of the surprise devaluation of its renminbi in August 2015. Equity markets sold off in August and September 2015, after achieving positive results in July 2015, to end the third calendar quarter sharply lower. Markets then rebounded in October 2015, although uncertainty remained given the Federal Reserve’s (the “Fed”) decision to leave rates unchanged in the wake of global market volatility and mixed U.S. economic data. In Europe, trend growth remained positive, though political uncertainty remained around the fiscal stability of Greece. Also, broader concerns around low inflation throughout the European Union led the European Central Bank to keep interest rates at historic lows. The U.S. dollar strengthened given the relative growth profile of the U.S. economy and expected divergent monetary policy versus other major trading partners. A strengthening U.S. dollar put pressure on U.S. companies conducting business abroad and on U.S. dollar returns of foreign assets. |
| | | Commodity markets sold off during the Reporting Period on the back of downward pressure within the energy and materials sectors. The supply/demand structure within oil depressed prices. The U.S. shale revolution pumped extra supply into the market, while global demand remained tepid given mixed growth prospects, especially within emerging markets where economic growth was below potential and missed expectations. Within materials, a slowing of growth |
14
PORTFOLIO RESULTS
| | in demand from China coupled with an abundance of supply from mines recently brought online put pressure on prices. |
| | | Global infrastructure securities posted negative returns and underperformed global equities during the Reporting Period. The Dow Jones Brookfield Global Infrastructure Index (Net, USD, Unhedged) returned approximately -4% during the Reporting Period compared to an approximately -1% return for the MSCI World Index. Infrastructure stocks exhibited a return path similar to that of global equities, posting strongly negative returns in the third quarter of 2015 before rebounding in October 2015. Most of the losses in infrastructure were concentrated within energy midstream1 names given the heightened volatility in energy prices. For example, the oil & gas storage & transportation industry returned approximately -13% during the Reporting Period. Conversely, global regulated utilities outperformed during the Reporting Period given the more defensive nature of the industry and its higher dividend yield characteristics as rates remained at record low levels. North American energy names experienced a reversal in performance in October 2015 and led global infrastructure stocks higher. However, global infrastructure lagged broader equities for the month of October, as stable cash flow businesses, such as regulated utilities and toll roads did not keep up with the broader equity markets, where high growth stocks continued to outperform. |
| | | Global real estate securities held up well amidst market volatility. As evidence, the global real estate benchmark, the FTSE EPRA/NAREIT Developed Index (Net, USD, Unhedged) returned approximately 4% during the Reporting Period. Real estate investment trust (“REITs”) found some support due to their yield orientation. Additionally, accommodative interest rate policy out of the Fed and |
| | 1 | | The downstream component of the energy industry is usually defined as the oil and gas operations that take place after the production phase, through to the point of sale. Downstream operations can include refining crude oil and distributing the by-products down to the retail level. By-products can include gasoline, natural gas liquids, diesel and a variety of other energy sources. The upstream component of the energy industry is usually defined as those operations stages in the oil and gas industry that involve exploration and production. Upstream operations deal primarily with the exploration stages of the oil and gas industry, with upstream firms taking the first steps to first locate, test and drill for oil and gas. Later, once reserves are proven, upstream firms will extract any oil and gas from the reserve. The midstream component of the energy industry is usually defined as those companies providing products or services that help link the supply side, i.e. energy producers, and the demand side, i.e. energy end-users, for any type of energy commodity. Such midstream business can include, but are not limited to, those that process, store, market and transport various energy commodities. |
| | positive supply/demand characteristics in the U.S. and Europe provided tailwinds to global real estate securities’ performance. |
| Q | | What key factors were responsible for the Fund’s performance during the Reporting Period? |
| A | | The Fund’s performance during the Reporting Period can be attributed to the performance of the Fund’s Underlying Managers, who are unaffiliated investment managers that employ a real assets investment strategy. Real assets are defined broadly by the Fund and include any assets that have physical properties or inflation sensitive characteristics, such as energy, real estate, infrastructure, commodities and inflation linked or floating rate fixed income securities. Inflation is a sustained increase in prices that erodes the purchasing power of money. Assets with inflation sensitive characteristics are assets that benefit from rising real cash flows in times of rising inflation. |
| | | During the Reporting Period, the Fund allocated capital to three Underlying Managers — Prudential Real Estate Investors, a business unit of Prudential Investment Management Inc. (“Prudential”); RREEF America L.L.C. (“RREEF”) and Gresham Investment Management LLC (“Gresham”). These three Underlying Managers represented three asset classes across real assets as part of the Fund’s top-level strategy allocation — commodities (Gresham), global infrastructure (RREEF) and global real estate (Prudential). Of the three Underlying Managers with allocated capital during the Reporting Period, two generated negative absolute returns and one posted positive absolute returns. |
| | | Of the three asset classes of the real assets universe to which the Fund had exposure via Underlying Manager strategies during the Reporting Period, two generated negative absolute returns amidst persistent market pressure, while one, i.e. real estate, posted positive absolute returns. |
| | | Performance relative to the Index was mainly driven by strategic asset allocation, which reflects a longer-term perspective to diversify and invest across real assets, and manager selection. We would note that while the Fund posted muted performance since inception, we do not consider the brief Reporting Period to be a strong indicator of performance in light of the impact of short-term market dynamics. |
15
PORTFOLIO RESULTS
| | | That said, strategic asset allocation performance relative to the Index was most significantly impacted by an overweight allocation to global infrastructure and, to a lesser degree, commodities as well as by an underweight allocation to real estate. As discussed above, commodities and global infrastructure sold off relative to global real estate, which generated positive returns during the Reporting Period. |
| | | From a manager selection perspective, Gresham outperformed the commodities benchmark. However, this was largely offset by Prudential, the global real estate Underlying Manager, who underperformed the global real estate benchmark. |
| Q | | Which real assets asset classes most significantly affected Fund performance? |
| A | | On an absolute return basis, commodities posted the most negative returns during the Reporting Period amidst persistent market pressure. Indeed, Gresham posted dramatically negative absolute performance given the sell-off in commodities, but it protected better than its strategy specific benchmark — the S&P GSCI® (Net, USD, Unhedged). |
| | | Conversely, global real estate posted positive absolute returns during the Reporting Period. Prudential also generated positive absolute returns but underperformed its strategy specific benchmark — the FTSE EPRA/NAREIT Developed Index (Net, USD, Unhedged). |
| Q | | How did the Fund use derivatives and similar instruments during the Reporting Period? |
| A | | An Underlying Manager that focused on commodities used commodity futures to implement its strategy. |
| Q | | Were there any notable changes in the Fund’s allocations during the Reporting Period? |
| A | | Given the Fund’s launch on June 30, 2015, it was not a matter of making changes but of building the Fund’s portfolio via allocating assets to Underlying Managers. |
| | | Throughout the Reporting Period, the Fund’s assets were allocated 23% to commodities, 30% to global real estate and 46% to global infrastructure. The remainder of the Fund’s assets were invested in cash and cash equivalents |
| Q | | What is the Fund’s tactical view and strategy for the months ahead? |
| A | | At the end of the Reporting Period, we remained neutral on global infrastructure and global real estate but recognized the likelihood of near-term volatility, as sensitivity to energy prices and interest rates, respectively, may well, in our view, continue to drive returns in the months ahead. With respect to global infrastructure, we expect its greater correlations with crude oil prices of late to likely continue in the near term. Therefore, the market could experience choppiness should crude oil markets continue to experience heightened volatility. Critically, we are less constructive on commodities as a strategic allocation in the Fund, driven by what we believe are diminished hedging properties, modest sources of returns and higher correlations to equities all minimizing any potential diversification benefits of the allocation. |
| | | Overall, we intend to continue to position the Fund in alignment with our longer-term strategic views on the real assets complex as a complement to additional strategic market exposures, potentially adjusting the Fund’s commodities exposure materially downward in the near term. We further intend to continue to monitor allocations and Underlying Manager performance as we seek to generate long-term capital growth. |
16
FUND BASICS
Multi-Manager Real Assets Strategy Fund
as of October 31, 2015
| | | | | | | | | | | | | | | | | | | | | | |
| | PERFORMANCE REVIEW | |
| | | June 30, 2015– October 31, 2015 | | Fund Total Return (based on NAV)1 | | | Multi-Manager Real Assets Strategy Composite Index2 | | | S&P GSCI® Commodity Index (Net, USD,
Unhedged) | | | FTSE EPRA/ NAREIT Developed Index (Net, USD,
Unhedged) | | | Dow Jones Brookfield Global Infrastructure Index (Net, USD,
Unhedged) | |
| | | Institutional | | | -4.30 | % | | | -3.40 | % | | | -19.11 | % | | | 4.02 | % | | | -2.78 | % |
| | 1 | | The net asset value (“NAV”) represents the net assets of the class of the Fund (ex-dividend) divided by the total number of shares of the class outstanding. The Fund’s performance reflects the reinvestment of dividends and other distributions. The Fund’s performance does not reflect the deduction of any applicable sales charges. |
| | 2 | | The Fund’s benchmark index is the Multi-Manager Real Assets Strategy Composite Index, which is composed of the S&P GSCI® Commodity Index (20%) (Net, USD, Unhedged), the FTSE EPRA/ NAREIT Developed Index (40%) (Net, USD, Unhedged) and the Dow Jones Brookfield Global Infrastructure Index (40%) (Net, USD, Unhedged). |
| | | | The S&P GSCI® is an unmanaged composite index of commodity sector returns, representing an unleveraged, long-only investment in commodity futures that is broadly diversified across the spectrum of commodities. Individual components qualify for inclusion in the S&P GSCI® on the basis of liquidity and are weighted by their respective world production quantities. |
| | | | The FTSE EPRA/NAREIT Developed Index is designed to measure the stock performance of companies engaged in specific real estate activities of the North American, European and Asian real estate markets. Relevant real estate activities are defined as the ownership, trading and development of income-producing real estate. |
| | | | Dow Jones Brookfield Global Infrastructure Index includes companies domiciled globally that qualify as “pure-play” infrastructure companies — companies whose primary business is the ownership and operation of infrastructure assets, activities that generally generate long-term stable cash flows. Index components are required to have more than 70% of cash flows derived from infrastructure lines of business. The index intends to measure all sectors of the infrastructure market. |
| | | | | | | | |
| | STANDARDIZED TOTAL RETURNS3 |
| | | For the period ended 9/30/15 | | Since Inception | | | Inception Date |
| | | Institutional | | | -7.60 | % | | 6/30/2015 |
| | 3 | | The Standardized Total Returns are cumulative total returns as of the most recent calendar quarter-end. They assume reinvestment of all distributions at NAV. Because Institutional Shares do not involve a sales charge, such a charge is not applied to their Standardized Total Returns. |
The returns set forth in the tables above represent past performance. Past performance does not guarantee future results. The Fund’s investment return and principal value will fluctuate so that an investor’s shares, when redeemed, may be worth more or less than their original cost. Current performance may be lower or higher than the performance quoted above. Please visit our web site at www.GSAMFUNDS.com to obtain the most recent month-end returns. Performance reflects applicable fee waivers and/or expense limitations in effect during the periods shown. In their absence, performance would be reduced. Returns do not reflect the deduction of taxes that a shareholder would pay on Fund distributions or the redemption of Fund shares.
17
FUND BASICS
| | | | | | | | | | |
| | EXPENSE RATIOS4 | |
| | | | | Net Expense Ratio (Current) | | | Gross Expense Ratio (Before Waivers) | |
| | | Institutional | | | 0.90 | % | | | 1.36 | % |
| | 4 | | The expense ratios of the Fund, both current (net of applicable fee waivers and/or expense limitations) and before waivers (gross of applicable fee waivers and/or expense limitations) are as set forth above according to the most recent publicly available Prospectus for the Fund and may differ from the expense ratios disclosed in the Financial Highlights in this report. Pursuant to a contractual arrangement, the Fund’s waivers and/or expense limitations will remain in place through at least May 20, 2016, and prior to such date the investment adviser may not terminate the arrangements without the approval of the Fund’s Board of Trustees. If these arrangements are discontinued in the future, the expense ratios may change without shareholder approval. |
| | | | | | | | |
| | TOP TEN EQUITY HOLDINGS AS OF 10/31/155 |
| | | Holding | | % of Net Assets | | | Line of Business |
| | National Grid PLC | | | 3.4 | % | | Multi-Utilities |
| | American Tower Corp. | | | 2.9 | | | Real Estate Investment Trusts |
| | Sempra Energy | | | 2.8 | | | Multi-Utilities |
| | Crown Castle International Corp. | | | 2.3 | | | Real Estate Investment Trusts |
| | PG&E Corp. | | | 2.2 | | | Multi-Utilities |
| | Enbridge, Inc. | | | 1.8 | | | Oil, Gas & Consumable Fuels |
| | Spectra Energy Corp. | | | 1.6 | | | Oil, Gas & Consumable Fuels |
| | TransCanada Corp. | | | 1.6 | | | Oil, Gas & Consumable Fuels |
| | Ferrovial SA | | | 1.6 | | | Construction & Engineering |
| | | Eversource Energy | | | 1.4 | | | Electric Utilities |
| | 5 | | The top 10 holdings may not be representative of the Fund’s future investments. |
18
FUND BASICS
|
| FUND COMPOSITION (%)6 |
| As of October 31, 2015 |
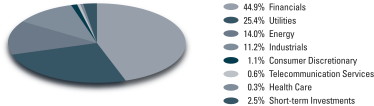
| | 6 | | The Fund is actively managed and, as such, its composition may differ over time. Consequently, the Fund’s overall sector allocations may differ from the percentages contained in the graph above. The graph categorizes investments using the Global Industry Classification Standard (“GICS”), however, the sector classifications used by the portfolio management team may differ from GICS. The percentage shown for each investment category reflects the value of investments in that category as a percentage of market value. Short-term investments represent repurchase agreements. The graph depicts the Fund’s investments but may not represent the Fund’s market exposure due to the exclusion of certain derivatives, if any, as listed in the Additional Investment Information section of the Schedule of Investments. |
19
PORTFOLIO RESULTS
Index Definitions:
The Barclays U.S. High-Yield 2% Issuer Capped Bond Index (Gross, USD, Unhedged) is an issuer-constrained version of the U.S. Corporate High-Yield Index that measures the market of USD-denominated, non-investment grade, fixed-rate, taxable corporate bonds. The index follows the same rules as the uncapped index but limits the exposure of each issuer to 2% of the total market value and redistributes any excess market value index-wide on a pro-rata basis.
The Credit Suisse Leveraged Loan Index (Gross, USD, Unhedged) is designed to mirror the investable universe of the U.S. dollar-denominated leveraged loan market.
The J.P. Morgan EMBISM Global Diversified Index (Gross, USD, Unhedged) tracks total returns for U.S. dollar-denominated debt instruments issued by emerging market sovereign and quasi-sovereign entities.
The J.P. Morgan GBI-EMSM Global Diversified Index (Gross, USD, Unhedged) is a comprehensive local emerging markets index, consisting of regularly traded, fixed-rate, local currency government bonds.
The S&P 500® Total Return Index is an American stock market index based on the market capitalizations of 500 large companies listed on the NYSE or NASDAQ.
The Russell 2000® Index is an unmanaged index of common stock prices that measures the performance of the 2000 smallest companies in the Russell 3000® Index. The Index is constructed to provide a comprehensive and unbiased small-cap barometer and is completely reconstituted annually to ensure larger stocks do not distort the performance and characteristics of the true small-cap opportunity set.
The MSCI® EAFE® Index is a stock market index that is designed to measure the equity market performance of developed markets in Europe, Australasia and the Far East, excluding the U.S. and Canada.
The MSCI Emerging Markets Index (Net, USD, Unhedged) is a free float-adjusted market capitalization index that is designed to measure equity market performance of emerging markets. As of January 1, 2015, the MSCI Emerging Markets Index (Net, USD, Unhedged) consisted of the following 21 emerging market country indices: Brazil, Chile, China, Colombia, Czech Republic, Egypt, Greece, Hungary, India, Indonesia, Korea, Malaysia, Mexico, Peru, Philippines, Poland, Russia, South Africa, Taiwan, Thailand and Turkey.
The MSCI World Index captures large and mid cap representation across 23 Developed Markets (DM) countries. DM countries include: Australia, Austria, Belgium, Canada, Denmark, Finland, France, Germany, Hong Kong, Ireland, Israel, Italy, Japan, Netherlands, New Zealand, Norway, Portugal, Singapore, Spain, Sweden, Switzerland, the UK and the US. With 1,642 constituents, the index covers approximately 85% of the free float-adjusted market capitalization in each country.
The MSCI World Growth Index captures large and mid-cap securities exhibiting overall growth style characteristics across 23 Developed Markets countries. Developed Markets countries include: Australia, Austria, Belgium, Canada, Denmark, Finland, France, Germany, Hong Kong, Ireland, Israel, Italy, Japan, Netherlands, New Zealand, Norway, Portugal, Singapore, Spain, Sweden, Switzerland, the UK and the US. The growth investment style characteristics for index construction are defined using five variables: long-term forward EPS growth rate, short-term forward EPS growth rate, current internal growth rate and long-term historical EPS growth trend and long-term historical sales per share growth trend.
The MSCI World Value Index captures large and mid-cap securities exhibiting overall value style characteristics across 23 Developed Markets countries. The index includes all Developed Market countries: Australia, Austria, Belgium, Canada, Denmark, Finland, France, Germany, Hong Kong, Ireland, Israel, Italy, Japan, Netherlands, New Zealand, Norway, Portugal, Singapore, Spain, Sweden, Switzerland, the UK and the USA. The value investment style characteristics for index construction are defined using three variables: book value to price, 12-month forward earnings to price and dividend yield. With 850 constituents, the index targets 50% coverage of the free float-adjusted market capitalization of the MSCI World Index.
20
GOLDMAN SACHS MULTI-MANAGER GLOBAL EQUITY FUND
Schedule of Investments
October 31, 2015
| | | | | | | | |
Shares | | | Description | | Value | |
| | Common Stocks – 83.3% | |
| | Australia – 0.7% | |
| | 84,100 | | | Ainsworth Game Technology Ltd. (Hotels, Restaurants & Leisure) | | $ | 189,351 | |
| | 52,100 | | | Aristocrat Leisure Ltd. (Hotels, Restaurants & Leisure) | | | 343,908 | |
| | 124,000 | | | Asaleo Care Ltd. (Personal Products) | | | 154,741 | |
| | 25,545 | | | CSL Ltd. (Biotechnology) | | | 1,697,982 | |
| | 2,300 | | | Flight Centre Travel Group Ltd. (Hotels, Restaurants & Leisure) | | | 61,878 | |
| | 48,800 | | | Pact Group Holdings Ltd. (Containers & Packaging) | | | 177,077 | |
| | 124,900 | | | Spotless Group Holdings Ltd. (Commercial Services & Supplies) | | | 190,731 | |
| | 63,264 | | | Westfield Corp. (Real Estate Investment Trusts) | | | 458,988 | |
| | | | | | | | |
| | | | | | | 3,274,656 | |
| | |
| | Belgium – 0.1% | |
| | 6,177 | | | KBC Groep NV (Commercial Banks) | | | 375,572 | |
| | 6,000 | | | Ontex Group NV (Personal Products) | | | 184,310 | |
| | | | | | | | |
| | | | | | | 559,882 | |
| | |
| | Bermuda – 0.7% | |
| | 2,834 | | | Assured Guaranty Ltd. (Insurance) | | | 77,765 | |
| | 42,886 | | | Axis Capital Holdings Ltd. (Insurance) | | | 2,315,844 | |
| | 3,951 | | | Essent Group Ltd.* (Thrifts & Mortgage Finance) | | | 95,219 | |
| | 4,639 | | | Everest Re Group Ltd. (Insurance) | | | 825,603 | |
| | | | | | | | |
| | | | | | | 3,314,431 | |
| | |
| | Brazil – 0.4% | |
| | 92,851 | | | Ambev SA ADR (Beverages) | | | 452,184 | |
| | 61,700 | | | Cielo SA (IT Services) | | | 585,697 | |
| | 12,315 | | | Embraer SA ADR (Aerospace & Defense) | | | 361,692 | |
| | 17,700 | | | JSL SA (Road & Rail) | | | 43,037 | |
| | 25,092 | | | Petroleo Brasileiro SA ADR (Oil, Gas & Consumable Fuels) | | | 122,449 | |
| | 18,500 | | | Ultrapar Participacoes SA (Oil, Gas & Consumable Fuels) | | | 321,200 | |
| | | | | | | | |
| | | | | | | 1,886,259 | |
| | |
| | Cambodia – 0.0% | |
| | 228,000 | | | NagaCorp Ltd. (Hotels, Restaurants & Leisure) | | | 161,242 | |
| | |
| | Canada – 2.2% | |
| | 44,200 | | | Algonquin Power & Utilities Corp. (Independent Power Producers & Energy Traders) | | | 341,066 | |
| | 18,100 | | | ATS Automation Tooling Systems, Inc.* (Machinery) | | | 190,606 | |
| | 36,200 | | | Baytex Energy Corp. (Oil, Gas & Consumable Fuels) | | | 147,281 | |
| | 32,639 | | | Canadian Pacific Railway Ltd. (Road & Rail) | | | 4,585,780 | |
| | 99,400 | | | Capstone Mining Corp.* (Metals & Mining) | | | 50,932 | |
| | |
| | Common Stocks – (continued) | |
| | Canada – (continued) | |
| | 3,600 | | | CCL Industries, Inc. Class B (Containers & Packaging) | | $ | 510,018 | |
| | 3,800 | | | Constellation Software, Inc. (Software) | | | 1,641,939 | |
| | 26,535 | | | Element Financial Corp.* (Diversified Financial Services) | | | 343,153 | |
| | 24,900 | | | Imperial Oil Ltd. (Oil, Gas & Consumable Fuels) | | | 828,540 | |
| | 13,455 | | | Ritchie Bros. Auctioneers, Inc. (Commercial Services & Supplies) | | | 349,426 | |
| | 122,000 | | | Surge Energy, Inc. (Oil, Gas & Consumable Fuels) | | | 274,304 | |
| | 42,600 | | | Whitecap Resources, Inc. (Oil, Gas & Consumable Fuels) | | | 378,240 | |
| | | | | | | | |
| | | | | | | 9,641,285 | |
| | |
| | China – 3.2% | |
| | 5,738 | | | Alibaba Group Holding Ltd. ADR* (Internet Software & Services) | | | 481,016 | |
| | 18,778 | | | Baidu, Inc. ADR* (Internet Software & Services) | | | 3,520,312 | |
| | 434,000 | | | Brilliance China Automotive Holdings Ltd. (Automobiles) | | | 601,803 | |
| | 524,000 | | | China Construction Bank Corp. Class H (Commercial Banks) | | | 379,772 | |
| | 133,600 | | | China Pacific Insurance Group Co. Ltd. Class H (Insurance) | | | 532,182 | |
| | 311,500 | | | CITIC Securities Co. Ltd. Class H (Capital Markets) | | | 671,227 | |
| | 16,624 | | | Ctrip.com International Ltd. ADR* (Internet & Catalog Retail) | | | 1,545,533 | |
| | 39,000 | | | Hengan International Group Co. Ltd. (Personal Products) | | | 421,139 | |
| | 610,000 | | | Industrial and Commercial Bank of China Ltd. Class H (Commercial Banks) | | | 386,926 | |
| | 185,000 | | | Ping An Insurance Group Co. of China Ltd. Class H (Insurance) | | | 1,038,451 | |
| | 164,400 | | | Sands China Ltd. (Hotels, Restaurants & Leisure) | | | 591,997 | |
| | 197,000 | | | Tencent Holdings Ltd. (Internet Software & Services) | | | 3,713,326 | |
| | | | | | | | |
| | | | | | | 13,883,684 | |
| | |
| | Denmark – 2.1% | |
| | 2,500 | | | ALK-Abello A/S (Pharmaceuticals) | | | 271,929 | |
| | 44,845 | | | Chr Hansen Holding A/S (Chemicals) | | | 2,694,419 | |
| | 25,935 | | | Coloplast A/S Class B (Health Care Equipment & Supplies) | | | 1,860,168 | |
| | 46,645 | | | Novo Nordisk A/S ADR (Pharmaceuticals) | | | 2,480,581 | |
| | 40,160 | | | Novozymes A/S (Chemicals) | | | 1,861,701 | |
| | | | | | | | |
| | | | | | | 9,168,798 | |
| | |
| | Finland – 0.1% | |
| | 16,400 | | | Cramo OYJ (Trading Companies & Distributors) | | | 301,156 | |
| | |
| | |
| The accompanying notes are an integral part of these financial statements. | | 21 |
GOLDMAN SACHS MULTI-MANAGER GLOBAL EQUITY FUND
Schedule of Investments (continued)
October 31, 2015
| | | | | | | | |
Shares | | | Description | | Value | |
| | Common Stocks – (continued) | |
| | France – 3.3% | |
| | 5,900 | | | Alten SA (IT Services) | | $ | 305,844 | |
| | 69,500 | | | Altran Technologies SA (IT Services) | | | 866,413 | |
| | 13,116 | | | AXA SA (Insurance) | | | 350,041 | |
| | 20,701 | | | BNP Paribas SA (Commercial Banks) | | | 1,254,423 | |
| | 19,800 | | | Elior(a) (Commercial Services & Supplies) | | | 375,398 | |
| | 93,341 | | | Engie SA (Multi-Utilities) | | | 1,633,542 | |
| | 700 | | | Eurofins Scientific SE (Life Sciences Tools & Services) | | | 253,217 | |
| | 17,500 | | | Havas SA (Media) | | | 151,564 | |
| | 4,800 | | | IPSOS (Media) | | | 97,370 | |
| | 23,680 | | | Legrand SA (Electrical Equipment) | | | 1,297,759 | |
| | 9,610 | | | LVMH Moet Hennessy Louis Vuitton SE (Textiles, Apparel & Luxury Goods) | | | 1,789,089 | |
| | 7,200 | | | Nexity SA (Real Estate Management & Development) | | | 318,602 | |
| | 3,000 | | | Saft Groupe SA (Electrical Equipment) | | | 77,326 | |
| | 13,441 | | | Sanofi (Pharmaceuticals) | | | 1,355,872 | |
| | 22,311 | | | Schneider Electric SE (Electrical Equipment) | | | 1,345,691 | |
| | 5,600 | | | Sopra Steria Group (IT Services) | | | 637,024 | |
| | 18,868 | | | Technip SA (Energy Equipment & Services) | | | 983,207 | |
| | 31,590 | | | TOTAL SA (Oil, Gas & Consumable Fuels) | | | 1,527,655 | |
| | | | | | | | |
| | | | | | | 14,620,037 | |
| | |
| | Germany – 1.9% | |
| | 8,348 | | | Bayer AG (Pharmaceuticals) | | | 1,113,084 | |
| | 1,300 | | | Duerr AG (Machinery) | | | 108,242 | |
| | 5,300 | | | Gerresheimer AG (Life Sciences Tools & Services) | | | 413,267 | |
| | 10,000 | | | KION Group AG* (Machinery) | | | 450,619 | |
| | 8,156 | | | Linde AG (Chemicals) | | | 1,414,702 | |
| | 3,300 | | | MorphoSys AG* (Life Sciences Tools & Services) | | | 204,171 | |
| | 7,700 | | | ProSiebenSat.1 Media SE (Media) | | | 416,074 | |
| | 13,398 | | | SAP SE (Software) | | | 1,056,232 | |
| | 40,673 | | | SAP SE ADR (Software) | | | 3,201,372 | |
| | 3,200 | | | Stroeer SE (Media) | | | 201,905 | |
| | | | | | | | |
| | | | | | | 8,579,668 | |
| | |
| | Hong Kong – 1.8% | |
| | 168,000 | | | China Merchants Holdings International Co. Ltd. (Transportation Infrastructure) | | | 557,927 | |
| | 202,000 | | | China Mobile Ltd. (Wireless Telecommunication Services) | | | 2,421,957 | |
| | 41,638 | | | China Mobile Ltd. ADR (Wireless Telecommunication Services) | | | 2,511,188 | |
| | 986,000 | | | CNOOC Ltd. (Oil, Gas & Consumable Fuels) | | | 1,113,698 | |
| | 312,000 | | | Dawnrays Pharmaceutical Holdings Ltd. (Pharmaceuticals) | | | 258,820 | |
| | |
| | Common Stocks – (continued) | |
| | Hong Kong – (continued) | |
| | 1,030,000 | | | Emperor Watch & Jewellery Ltd. (Specialty Retail) | | $ | 27,298 | |
| | 394,000 | | | Hutchison Telecommunications Hong Kong Holdings Ltd. (Diversified Telecommunication Services) | | | 145,376 | |
| | 784,000 | | | Lenovo Group Ltd. (Computers & Peripherals) | | | 728,443 | |
| | | | | | | | |
| | | | | | | 7,764,707 | |
| | |
| | India – 1.5% | |
| | 65,541 | | | Cipla Ltd. GDR (Pharmaceuticals) | | | 689,287 | |
| | 18,674 | | | Dr. Reddy’s Laboratories Ltd. ADR (Pharmaceuticals) | | | 1,209,888 | |
| | 40,702 | | | HDFC Bank Ltd. ADR (Commercial Banks) | | | 2,488,520 | |
| | 19,830 | | | ICICI Bank Ltd. ADR (Commercial Banks) | | | 170,935 | |
| | 75,141 | | | Infosys Ltd. ADR (IT Services) | | | 1,364,561 | |
| | 120,572 | | | Tata Global Beverages Ltd. GDR (Food Products) | | | 217,030 | |
| | 21,795 | | | Tata Motors Ltd. ADR (Automobiles) | | | 644,478 | |
| | | | | | | | |
| | | | | | | 6,784,699 | |
| | |
| | Indonesia – 0.4% | |
| | 737,100 | | | Bank Mandiri Persero Tbk PT (Commercial Banks) | | | 466,488 | |
| | 283,700 | | | Bank Negara Indonesia Persero Tbk PT (Commercial Banks) | | | 98,073 | |
| | 797,200 | | | Bank Rakyat Indonesia Persero Tbk PT (Commercial Banks) | | | 610,142 | |
| | 135,200 | | | Semen Indonesia Persero Tbk PT (Construction Materials) | | | 96,153 | |
| | 1,894,900 | | | Telekomunikasi Indonesia Persero Tbk PT (Diversified Telecommunication Services) | | | 371,756 | |
| | | | | | | | |
| | | | | | | 1,642,612 | |
| | |
| | Ireland – 0.8% | |
| | 2,373 | | | Global Indemnity PLC* (Insurance) | | | 67,417 | |
| | 28,053 | | | ICON PLC* (Life Sciences Tools & Services) | | | 1,791,745 | |
| | 6,500 | | | Kingspan Group PLC (Building Products) | | | 157,229 | |
| | 6,960 | | | Perrigo Co. PLC (Pharmaceuticals) | | | 1,097,870 | |
| | 4,777 | | | Ryanair Holdings PLC ADR (Airlines) | | | 373,514 | |
| | 8,300 | | | Smurfit Kappa Group PLC (Containers & Packaging) | | | 236,210 | |
| | | | | | | | |
| | | | | | | 3,723,985 | |
| | |
| | Israel* – 0.1% | |
| | 6,610 | | | Check Point Software Technologies Ltd. (Software) | | | 561,453 | |
| | |
| | Italy – 0.9% | |
| | 18,200 | | | Astaldi SpA (Construction & Engineering) | | | 146,603 | |
| | |
| | |
| 22 | | The accompanying notes are an integral part of these financial statements. |
GOLDMAN SACHS MULTI-MANAGER GLOBAL EQUITY FUND
| | | | | | | | |
Shares | | | Description | | Value | |
| | Common Stocks – (continued) | |
| | Italy – (continued) | |
| | 25,100 | | | Azimut Holding SpA (Capital Markets) | | $ | 603,730 | |
| | 5,700 | | | Banca Generali SpA (Capital Markets) | | | 175,558 | |
| | 52,100 | | | Banca Popolare dell’Emilia Romagna SC (Commercial Banks) | | | 420,451 | |
| | 21,200 | | | Banco Popolare SC* (Commercial Banks) | | | 316,796 | |
| | 12,900 | | | Buzzi Unicem SpA (Construction Materials) | | | 218,269 | |
| | 349,800 | | | Credito Valtellinese SC* (Commercial Banks) | | | 440,345 | |
| | 160,200 | | | Hera SpA (Multi-Utilities) | | | 420,399 | |
| | 3,100 | | | Industria Macchine Automatiche SpA (Machinery) | | | 160,059 | |
| | 98,900 | | | Infrastrutture Wireless Italiane SpA*(a) (Diversified Telecommunication Services) | | | 513,120 | |
| | 30,200 | | | Mediolanum SpA (Insurance) | | | 246,040 | |
| | 26,500 | | | RAI Way SpA(a) (Media) | | | 134,922 | |
| | | | | | | | |
| | | | | | | 3,796,292 | |
| | |
| | Japan – 5.4% | |
| | 13,000 | | | Air Water, Inc. (Chemicals) | | | 212,716 | |
| | 10,500 | | | Asahi Holdings, Inc. (Metals & Mining) | | | 154,520 | |
| | 5,100 | | | Century Tokyo Leasing Corp. (Diversified Financial Services) | | | 172,999 | |
| | 2,300 | | | CyberAgent, Inc. (Media) | | | 94,467 | |
| | 37,600 | | | Daicel Corp. (Chemicals) | | | 496,861 | |
| | 25,400 | | | Daifuku Co. Ltd. (Machinery) | | | 375,916 | |
| | 14,000 | | | Doutor Nichires Holdings Co. Ltd. (Hotels, Restaurants & Leisure) | | | 203,870 | |
| | 14,700 | | | DTS Corp. (IT Services) | | | 347,480 | |
| | 18,800 | | | East Japan Railway Co. (Road & Rail) | | | 1,787,420 | |
| | 10,700 | | | GMO internet, Inc. (Internet Software & Services) | | | 151,545 | |
| | 19,300 | | | Hakuhodo DY Holdings, Inc. (Media) | | | 202,782 | |
| | 287,000 | | | Hitachi Ltd. (Electronic Equipment, Instruments & Components) | | | 1,655,643 | |
| | 7,200 | | | Horiba Ltd. (Electronic Equipment, Instruments & Components) | | | 283,309 | |
| | 6,200 | | | IBJ Leasing Co. Ltd. (Diversified Financial Services) | | | 130,915 | |
| | 5,800 | | | Japan Airlines Co. Ltd. (Airlines) | | | 218,504 | |
| | 67 | | | Japan Logistics Fund, Inc. (Real Estate Investment Trusts) | | | 125,299 | |
| | 2,400 | | | Kanamoto Co. Ltd. (Trading Companies & Distributors) | | | 48,497 | |
| | 13,600 | | | Kansai Paint Co. Ltd. (Chemicals) | | | 207,315 | |
| | 91,700 | | | KDDI Corp. (Wireless Telecommunication Services) | | | 2,218,985 | |
| | 3,000 | | | Keyence Corp. (Electronic Equipment, Instruments & Components) | | | 1,561,825 | |
| | 46,100 | | | Leopalace21 Corp.* (Real Estate Management & Development) | | | 245,617 | |
| | 3,900 | | | Meitec Corp. (Professional Services) | | | 141,639 | |
| | |
| | Common Stocks – (continued) | |
| | Japan – (continued) | |
| | 29,900 | | | MISUMI Group, Inc. (Trading Companies & Distributors) | | $ | 389,361 | |
| | 47,000 | | | Nachi-Fujikoshi Corp. (Machinery) | | | 210,993 | |
| | 26,000 | | | Nichias Corp. (Building Products) | | | 163,869 | |
| | 6,300 | | | Nifco, Inc. (Auto Components) | | | 242,860 | |
| | 84,600 | | | Nikon Corp. (Household Durables) | | | 1,094,425 | |
| | 6,000 | | | Nippo Corp. (Construction & Engineering) | | | 104,555 | |
| | 2,500 | | | Nippon Shokubai Co. Ltd. (Chemicals) | | | 195,643 | |
| | 6,700 | | | Nishio Rent All Co. Ltd. (Trading Companies & Distributors) | | | 155,936 | |
| | 9,600 | | | Obic Co. Ltd. (IT Services) | | | 506,659 | |
| | 3,600 | | | Sawai Pharmaceutical Co. Ltd. (Pharmaceuticals) | | | 230,463 | |
| | 13,800 | | | SCSK Corp. (IT Services) | | | 529,092 | |
| | 12,300 | | | Shin-Etsu Chemical Co. Ltd. (Chemicals) | | | 731,471 | |
| | 28,300 | | | Skylark Co. Ltd. (Hotels, Restaurants & Leisure) | | | 368,097 | |
| | 6,700 | | | St Marc Holdings Co. Ltd. (Hotels, Restaurants & Leisure) | | | 199,169 | |
| | 25,100 | | | Sumitomo Mitsui Financial Group, Inc. (Commercial Banks) | | | 1,001,330 | |
| | 8,900 | | | Sundrug Co. Ltd. (Food & Staples Retailing) | | | 468,847 | |
| | 6,200 | | | Suruga Bank Ltd. (Commercial Banks) | | | 122,059 | |
| | 39,400 | | | Sysmex Corp. (Health Care Equipment & Supplies) | | | 2,252,056 | |
| | 39,000 | | | Temp Holdings Co. Ltd. (Professional Services) | | | 582,263 | |
| | 4,900 | | | Tokyo Ohka Kogyo Co. Ltd. (Chemicals) | | | 156,610 | |
| | 22,400 | | | Toyota Motor Corp. (Automobiles) | | | 1,372,323 | |
| | 54,600 | | | Unicharm Corp. (Household Products) | | | 1,166,052 | |
| | 8,700 | | | Zenkoku Hosho Co. Ltd. (Diversified Financial Services) | | | 294,383 | |
| | | | | | | | |
| | | | | | | 23,576,640 | |
| | |
| | Malaysia – 0.1% | |
| | 220,100 | | | CIMB Group Holdings Bhd (Commercial Banks) | | | 235,796 | |
| | 112,400 | | | Genting Bhd (Hotels, Restaurants & Leisure) | | | 193,753 | |
| | 92,600 | | | Malayan Banking Bhd (Commercial Banks) | | | 177,521 | |
| | | | | | | | |
| | | | | | | 607,070 | |
| | |
| | Mexico – 1.0% | |
| | 15,708 | | | America Movil SAB de CV ADR Class L (Wireless Telecommunication Services) | | | 279,760 | |
| | 752,300 | | | Cemex SAB de CV* (Construction Materials) | | | 476,854 | |
| | |
| | |
| The accompanying notes are an integral part of these financial statements. | | 23 |
GOLDMAN SACHS MULTI-MANAGER GLOBAL EQUITY FUND
Schedule of Investments (continued)
October 31, 2015
| | | | | | | | |
Shares | | | Description | | Value | |
| | Common Stocks – (continued) | |
| | Mexico – (continued) | |
| | 34,200 | | | Fomento Economico Mexicano SAB de CV (Beverages) | | $ | 337,842 | |
| | 7,000 | | | Grupo Aeroportuario del Sureste SAB de CV Class B (Transportation Infrastructure) | | | 108,413 | |
| | 115,200 | | | Grupo Bimbo SAB de CV Series A* (Food Products) | | | 326,885 | |
| | 180,000 | | | Grupo Financiero Santander Mexico SAB de CV Class B (Commercial Banks) | | | 330,734 | |
| | 20,174 | | | Grupo Televisa SAB ADR (Media) | | | 587,870 | |
| | 683,034 | | | Wal-Mart de Mexico SAB de CV (Food & Staples Retailing) | | | 1,802,094 | |
| | | | | | | | |
| | | | | | | 4,250,452 | |
| | |
| | Monaco – 0.1% | |
| | 29,500 | | | Scorpio Tankers, Inc. (Oil, Gas & Consumable Fuels) | | | 269,040 | |
| | |
| | Netherlands – 2.5% | |
| | 11,100 | | | Aalberts Industries NV (Machinery) | | | 359,865 | |
| | 34,125 | | | Akzo Nobel NV (Chemicals) | | | 2,413,674 | |
| | 16,760 | | | Core Laboratories NV (Energy Equipment & Services) | | | 1,949,691 | |
| | 97,814 | | | PostNL NV (Air Freight & Logistics) | | | 402,967 | |
| | 120,339 | | | RELX NV (Media) | | | 2,052,596 | |
| | 41,060 | | | Sensata Technologies Holding NV* (Electrical Equipment) | | | 1,974,575 | |
| | 28,300 | | | USG People NV (Professional Services) | | | 449,810 | |
| | 12,417 | | | Wright Medical Group NV* (Health Care Equipment & Supplies) | | | 240,021 | |
| | 66,680 | | | Yandex NV Class A* (Internet Software & Services) | | | 1,073,548 | |
| | | | | | | | |
| | | | | | | 10,916,747 | |
| | |
| | New Zealand – 0.1% | |
| | 97,500 | | | SKYCITY Entertainment Group Ltd. (Hotels, Restaurants & Leisure) | | | 264,489 | |
| | |
| | Norway – 0.0% | |
| | 14,700 | | | SpareBank 1 SMN (Commercial Banks) | | | 92,169 | |
| | |
| | Peru – 0.1% | |
| | 3,543 | | | Credicorp Ltd. (Commercial Banks) | | | 400,997 | |
| | |
| | Philippines – 0.2% | |
| | 219,950 | | | Metropolitan Bank & Trust Co. (Commercial Banks) | | | 398,977 | |
| | 21,120 | | | SM Investments Corp. (Industrial Conglomerates) | | | 393,896 | |
| | | | | | | | |
| | | | | | | 792,873 | |
| | |
| | Common Stocks – (continued) | |
| | Poland – 0.1% | |
| | 4,484 | | | Bank Pekao SA (Commercial Banks) | | $ | 174,372 | |
| | 22,857 | | | Powszechna Kasa Oszczednosci Bank Polski SA (Commercial Banks) | | | 169,280 | |
| | | | | | | | |
| | | | | | | 343,652 | |
| | |
| | Portugal – 0.1% | |
| | 81,700 | | | Mota-Engil SGPS SA (Construction & Engineering) | | | 204,365 | |
| | 19,600 | | | NOS SGPS SA (Media) | | | 162,651 | |
| | | | | | | | |
| | | | | | | 367,016 | |
| | |
| | Russia – 0.1% | |
| | 10,462 | | | Magnit PJSC GDR (Food & Staples Retailing) | | | 474,853 | |
| | |
| | South Africa – 0.4% | |
| | 18,716 | | | Aspen Pharmacare Holdings Ltd.* (Pharmaceuticals) | | | 419,558 | |
| | 55,692 | | | Mediclinic International Ltd. (Health Care Providers & Services) | | | 488,831 | |
| | 65,875 | | | Shoprite Holdings Ltd. (Food & Staples Retailing) | | | 684,550 | |
| | | | | | | | |
| | | | | | | 1,592,939 | |
| | |
| | South Korea – 2.1% | |
| | 2,611 | | | Hyundai Heavy Industries Co. Ltd.* (Machinery) | | | 216,852 | |
| | 3,564 | | | Hyundai Motor Co. (Automobiles) | | | 486,823 | |
| | 16,862 | | | Industrial Bank of Korea (Commercial Banks) | | | 206,404 | |
| | 15,518 | | | KB Financial Group, Inc. ADR (Commercial Banks) | | | 489,283 | |
| | 2,122 | | | LG Chem Ltd. (Chemicals) | | | 564,115 | |
| | 1,740 | | | NAVER Corp. (Internet Software & Services) | | | 913,630 | |
| | 4,544 | | | Samsung Electronics Co. Ltd. GDR | | | 2,717,429 | |
| | 8,251 | | | Samsung Life Insurance Co. Ltd. (Insurance) | | | 787,791 | |
| | 11,414 | | | Shinhan Financial Group Co. Ltd. ADR (Commercial Banks) | | | 437,727 | |
| | 21,993 | | | SK Hynix, Inc. (Semiconductors & Semiconductor Equipment) | | | 588,582 | |
| | 2,521 | | | SK Innovation Co. Ltd.* (Oil, Gas & Consumable Fuels) | | | 261,399 | |
| | 65,100 | | | SK Telecom Co. Ltd. ADR (Wireless Telecommunication Services) | | | 1,533,756 | |
| | | | | | | | |
| | | | | | | 9,203,791 | |
| | |
| | Spain – 1.2% | |
| | 93,200 | | | Abengoa SA (Construction & Engineering) | | | 90,264 | |
| | 250,580 | | | CaixaBank SA (Commercial Banks) | | | 959,761 | |
| | 10,800 | | | Fomento de Construcciones y Contratas SA (Construction & Engineering) | | | 82,218 | |
| | 43,810 | | | Industria de Diseno Textil SA (Specialty Retail) | | | 1,640,437 | |
| | |
| | |
| 24 | | The accompanying notes are an integral part of these financial statements. |
GOLDMAN SACHS MULTI-MANAGER GLOBAL EQUITY FUND
| | | | | | | | |
Shares | | | Description | | Value | |
| | Common Stocks – (continued) | |
| | Spain – (continued) | |
| | 89,149 | | | International Consolidated Airlines Group SA* (Airlines) | | $ | 798,983 | |
| | 498,230 | | | Liberbank SA* (Commercial Banks) | | | 308,129 | |
| | 17,100 | | | Mediaset Espana Comunicacion SA (Media) | | | 207,483 | |
| | 25,100 | | | Melia Hotels International SA (Hotels, Restaurants & Leisure) | | | 362,445 | |
| | 59,800 | | | Merlin Properties Socimi SA (Real Estate Investment Trusts) | | | 766,320 | |
| | 7,017 | | | Tecnicas Reunidas SA (Energy Equipment & Services) | | | 312,515 | |
| | | | | | | | |
| | | | | | | 5,528,555 | |
| | |
| | Sweden – 0.1% | |
| | 19,700 | | | BillerudKorsnas AB (Containers & Packaging) | | | 356,517 | |
| | 2,300 | | | Modern Times Group MTG AB (Media) | | | 65,244 | |
| | | | | | | | |
| | | | | | | 421,761 | |
| | |
| | Switzerland – 5.4% | |
| | 21,955 | | | ACE Ltd. (Insurance) | | | 2,492,771 | |
| | 18,789 | | | Aryzta AG* (Food Products) | | | 846,069 | |
| | 10,628 | | | Cie Financiere Richemont SA (Textiles, Apparel & Luxury Goods) | | | 911,325 | |
| | 39,807 | | | Clariant AG* (Chemicals) | | | 731,985 | |
| | 12,813 | | | Credit Suisse Group AG* (Capital Markets) | | | 319,572 | |
| | 6,700 | | | EFG International AG* (Capital Markets) | | | 67,308 | |
| | 8,400 | | | Gategroup Holding AG* (Commercial Services & Supplies) | | | 314,950 | |
| | 167 | | | Givaudan SA* (Chemicals) | | | 298,629 | |
| | 300 | | | Kuoni Reisen Holding AG* (Hotels, Restaurants & Leisure) | | | 62,116 | |
| | 34,520 | | | Nestle SA (Food Products) | | | 2,636,428 | |
| | 16,818 | | | Novartis AG (Pharmaceuticals) | | | 1,523,520 | |
| | 27,477 | | | Novartis AG ADR (Pharmaceuticals) | | | 2,484,745 | |
| | 6,314 | | | Roche Holding AG (Pharmaceuticals) | | | 1,714,244 | |
| | 850 | | | SGS SA (Professional Services) | | | 1,618,487 | |
| | 34,232 | | | Swiss Re AG (Insurance) | | | 3,177,783 | |
| | 10,300 | | | Temenos Group AG* (Software) | | | 481,158 | |
| | 2,205 | | | The Swatch Group AG (Textiles, Apparel & Luxury Goods) | | | 861,139 | |
| | 86,107 | | | UBS Group AG (Capital Markets) | | | 1,719,766 | |
| | 5,214 | | | Zurich Insurance Group AG* (Insurance) | | | 1,375,974 | |
| | | | | | | | |
| | | | | | | 23,637,969 | |
| | |
| | Taiwan – 1.4% | |
| | 83,683 | | | Advanced Semiconductor Engineering, Inc. ADR (Semiconductors & Semiconductor Equipment) | | | 480,340 | |
| | 286,000 | | | CTBC Financial Holding Co. Ltd. (Commercial Banks) | | | 156,687 | |
| | |
| | Common Stocks – (continued) | |
| | Taiwan – (continued) | |
| | 114,782 | | | Hon Hai Precision Industry Co. Ltd. GDR (Electronic Equipment, Instruments & Components) | | $ | 655,774 | |
| | 21,000 | | | MediaTek, Inc. (Semiconductors & Semiconductor Equipment) | | | 163,765 | |
| | 564,000 | | | Mega Financial Holding Co. Ltd. (Commercial Banks) | | | 410,960 | |
| | 200,908 | | | Taiwan Semiconductor Manufacturing Co. Ltd. ADR (Semiconductors & Semiconductor Equipment) | | | 4,411,940 | |
| | | | | | | | |
| | | | | | | 6,279,466 | |
| | |
| | Thailand – 0.2% | |
| | 53,869 | | | Advanced Info Service PCL ADR (Wireless Telecommunication Services) | | | 359,845 | |
| | 18,687 | | | Bangkok Bank PCL ADR (Banks) | | | 431,296 | |
| | | | | | | | |
| | | | | | | 791,141 | |
| | |
| | Turkey – 0.1% | |
| | 162,720 | | | Turkiye Garanti Bankasi A/S (Commercial Banks) | | | 421,352 | |
| | |
| | United Kingdom – 9.5% | |
| | 19,535 | | | Abengoa Yield PLC (Independent Power Producers & Energy Traders) | | | 361,984 | |
| | 640,001 | | | Aberdeen Asset Management PLC (Capital Markets) | | | 3,412,485 | |
| | 15,288 | | | Aon PLC (Insurance) | | | 1,426,523 | |
| | 40,150 | | | ARM Holdings PLC ADR (Semiconductors & Semiconductor Equipment) | | | 1,904,314 | |
| | 35,200 | | | Ashtead Group PLC (Trading Companies & Distributors) | | | 541,226 | |
| | 233,021 | | | Aviva PLC (Insurance) | | | 1,741,498 | |
| | 19,800 | | | Babcock International Group PLC (Commercial Services & Supplies) | | | 293,517 | |
| | 175,386 | | | Balfour Beatty PLC (Construction & Engineering) | | | 672,212 | |
| | 381,841 | | | Barclays PLC (Commercial Banks) | | | 1,360,415 | |
| | 23,600 | | | Bovis Homes Group PLC (Household Durables) | | | 372,254 | |
| | 34,352 | | | British American Tobacco PLC (Tobacco) | | | 2,040,837 | |
| | 103,875 | | | Compass Group PLC (Hotels, Restaurants & Leisure) | | | 1,785,704 | |
| | 1,653 | | | Consort Medical PLC (Health Care Equipment & Supplies) | | | 24,871 | |
| | 36,022 | | | Diageo PLC (Beverages) | | | 1,038,512 | |
| | 21,700 | | | Domino’s Pizza Group PLC (Hotels, Restaurants & Leisure) | | | 364,683 | |
| | 98,935 | | | Experian PLC (Professional Services) | | | 1,685,858 | |
| | 84,473 | | | GlaxoSmithKline PLC (Pharmaceuticals) | | | 1,821,720 | |
| | 27,200 | | | Halma PLC (Electronic Equipment, Instruments & Components) | | | 319,725 | |
| | 186,100 | | | Hays PLC (Professional Services) | | | 403,184 | |
| | |
| | |
| The accompanying notes are an integral part of these financial statements. | | 25 |
GOLDMAN SACHS MULTI-MANAGER GLOBAL EQUITY FUND
Schedule of Investments (continued)
October 31, 2015
| | | | | | | | |
Shares | | | Description | | Value | |
| | Common Stocks – (continued) | |
| | United Kingdom – (continued) | |
| | 214,400 | | | HSBC Holdings PLC (Commercial Banks) | | $ | 1,676,366 | |
| | 22,500 | | | Inchcape PLC (Distributors) | | | 276,715 | |
| | 79,342 | | | Intermediate Capital Group PLC (Capital Markets) | | | 690,547 | |
| | 21,200 | | | Just Eat PLC* (Internet Software & Services) | | | 139,031 | |
| | 168,700 | | | Ladbrokes PLC (Hotels, Restaurants & Leisure) | | | 274,200 | |
| | 15,200 | | | Lancashire Holdings Ltd. (Insurance) | | | 166,511 | |
| | 45,500 | | | Lavendon Group PLC (Trading Companies & Distributors) | | | 105,565 | |
| | 1,099,944 | | | Lloyds Banking Group PLC (Commercial Banks) | | | 1,248,448 | |
| | 84,450 | | | Michael Page International PLC (Professional Services) | | | 643,224 | |
| | 18,900 | | | Micro Focus International PLC (Software) | | | 365,323 | |
| | 64,570 | | | Nielsen Holdings PLC (Professional Services) | | | 3,067,721 | |
| | 51,400 | | | Playtech PLC (Software) | | | 677,215 | |
| | 123,400 | | | Premier Oil PLC* (Oil, Gas & Consumable Fuels) | | | 129,849 | |
| | 25,925 | | | Reckitt Benckiser Group PLC (Household Products) | | | 2,530,032 | |
| | 58,500 | | | Saga PLC (Insurance) | | | 187,221 | |
| | 19,700 | | | Savills PLC (Real Estate Management & Development) | | | 278,042 | |
| | 88,435 | | | SIG PLC (Trading Companies & Distributors) | | | 181,542 | |
| | 78,852 | | | Smith & Nephew PLC ADR (Health Care Equipment & Supplies) | | | 2,690,430 | |
| | 71,613 | | | SSE PLC (Electric Utilities) | | | 1,666,047 | |
| | 21,700 | | | SThree PLC (Professional Services) | | | 120,623 | |
| | 82,700 | | | Stock Spirits Group PLC (Beverages) | | | 242,869 | |
| | 91,000 | | | Taylor Wimpey PLC (Household Durables) | | | 277,218 | |
| | 26,300 | | | The Paragon Group Cos. PLC (Thrifts & Mortgage Finance) | | | 169,857 | |
| | 19,800 | | | The Restaurant Group PLC (Hotels, Restaurants & Leisure) | | | 218,553 | |
| | 211,100 | | | Thomas Cook Group PLC* (Hotels, Restaurants & Leisure) | | | 399,229 | |
| | 30,200 | | | Vesuvius PLC (Machinery) | | | 166,105 | |
| | 378,523 | | | Vodafone Group PLC (Wireless Telecommunication Services) | | | 1,245,694 | |
| | 36,500 | | | William Hill PLC (Hotels, Restaurants & Leisure) | | | 178,093 | |
| | | | | | | | |
| | | | | | | 41,583,792 | |
| | |
| | United States – 32.9% | |
| | 5,445 | | | Abercrombie & Fitch Co. Class A (Specialty Retail) | | | 115,380 | |
| | 3,598 | | | ABM Industries, Inc. (Commercial Services & Supplies) | | | 102,183 | |
| | 2,960 | | | Actuant Corp. Class A (Machinery) | | | 67,488 | |
| | |
| | Common Stocks – (continued) | |
| | United States – (continued) | |
| | 17,339 | | | Advance Auto Parts, Inc. (Specialty Retail) | | $ | 3,440,578 | |
| | 4,940 | | | Aegion Corp.* (Construction & Engineering) | | | 95,293 | |
| | 18,267 | | | Aetna, Inc. (Health Care Providers & Services) | | | 2,096,686 | |
| | 1,960 | | | Air Lease Corp. (Trading Companies & Distributors) | | | 66,072 | |
| | 5,230 | | | Air Methods Corp.* (Health Care Providers & Services) | | | 214,064 | |
| | 10,655 | | | Allergan PLC* (Pharmaceuticals) | | | 3,286,748 | |
| | 8,935 | | | American Campus Communities, Inc. (Real Estate Investment Trusts) | | | 362,493 | |
| | 2,057 | | | American Capital Mortgage Investment Corp. (Real Estate Investment Trusts) | | | 29,847 | |
| | 9,686 | | | American Eagle Outfitters, Inc. (Specialty Retail) | | | 148,002 | |
| | 45,702 | | | American International Group, Inc. (Insurance) | | | 2,881,968 | |
| | 5,019 | | | American Residential Properties, Inc. (Real Estate Investment Trusts) | | | 83,165 | |
| | 6,045 | | | AMERISAFE, Inc. (Insurance) | | | 330,843 | |
| | 1,809 | | | Amsurg Corp.* (Health Care Providers & Services) | | | 126,793 | |
| | 3,175 | | | Analogic Corp. (Health Care Equipment & Supplies) | | | 278,193 | |
| | 1,096 | | | Anixter International, Inc.* (Electronic Equipment, Instruments & Components) | | | 75,164 | |
| | 15,091 | | | Anthem, Inc. (Health Care Providers & Services) | | | 2,099,913 | |
| | 8,963 | | | Anworth Mortgage Asset Corp. (Real Estate Investment Trusts) | | | 42,753 | |
| | 26,069 | | | Apache Corp. (Oil, Gas & Consumable Fuels) | | | 1,228,632 | |
| | 29,015 | | | Apple, Inc. (Computers & Peripherals) | | | 3,467,292 | |
| | 7,549 | | | Ares Commercial Real Estate Corp. (Real Estate Investment Trusts) | | | 93,155 | |
| | 11,654 | | | Ascena Retail Group, Inc.* (Specialty Retail) | | | 155,231 | |
| | 6,215 | | | Aspen Technology, Inc.* (Software) | | | 257,239 | |
| | 28,551 | | | Baker Hughes, Inc. (Energy Equipment & Services) | | | 1,504,067 | |
| | 4,315 | | | Balchem Corp. (Chemicals) | | | 294,714 | |
| | 31,179 | | | Baxalta, Inc. (Biotechnology) | | | 1,074,428 | |
| | 2,884 | | | Belden, Inc. (Electronic Equipment, Instruments & Components) | | | 184,662 | |
| | 24,169 | | | Berkshire Hathaway, Inc. Class B* (Diversified Financial Services) | | | 3,287,467 | |
| | 8,175 | | | Blackbaud, Inc. (Software) | | | 512,491 | |
| | 3,248 | | | Booz Allen Hamilton Holding Corp. (IT Services) | | | 95,686 | |
| | 3,565 | | | Brady Corp. Class A (Commercial Services & Supplies) | | | 81,104 | |
| | |
| | |
| 26 | | The accompanying notes are an integral part of these financial statements. |
GOLDMAN SACHS MULTI-MANAGER GLOBAL EQUITY FUND
| | | | | | | | |
Shares | | | Description | | Value | |
| | Common Stocks – (continued) | |
| | United States – (continued) | |
| | 1,213 | | | Bristow Group, Inc. (Energy Equipment & Services) | | $ | 42,127 | |
| | 3,107 | | | Brooks Automation, Inc. (Semiconductors & Semiconductor Equipment) | | | 34,301 | |
| | 1,787 | | | Cabot Corp. (Chemicals) | | | 64,225 | |
| | 9,809 | | | CalAtlantic Group, Inc. (Household Durables) | | | 373,625 | |
| | 4,875 | | | Cantel Medical Corp. (Health Care Equipment & Supplies) | | | 288,990 | |
| | 6,650 | | | Cardtronics, Inc.* (IT Services) | | | 229,425 | |
| | 24,707 | | | Carnival PLC (Hotels, Restaurants & Leisure) | | | 1,375,084 | |
| | 12,090 | | | Catalent, Inc.* (Pharmaceuticals) | | | 321,352 | |
| | 10,545 | | | Cathay General Bancorp (Commercial Banks) | | | 330,058 | |
| | 5,840 | | | Cavium, Inc.* (Semiconductors & Semiconductor Equipment) | | | 414,348 | |
| | 5,890 | | | CEB, Inc. (Professional Services) | | | 440,336 | |
| | 22,650 | | | Cerner Corp.* (Health Care Technology) | | | 1,501,468 | |
| | 4,077 | | | Chatham Lodging Trust (Real Estate Investment Trusts) | | | 93,323 | |
| | 1,257 | | | Chemed Corp. (Health Care Providers & Services) | | | 197,714 | |
| | 98,543 | | | Cisco Systems, Inc. (Communications Equipment) | | | 2,842,966 | |
| | 6,195 | | | CLARCOR, Inc. (Machinery) | | | 308,883 | |
| | 10,736 | | | Cloud Peak Energy, Inc.* (Oil, Gas & Consumable Fuels) | | | 31,886 | |
| | 11,270 | | | Cognex Corp. (Electronic Equipment, Instruments & Components) | | | 423,752 | |
| | 8,530 | | | Cohen & Steers, Inc. (Capital Markets) | | | 260,933 | |
| | 1,048 | | | Coherent, Inc.* (Electronic Equipment, Instruments & Components) | | | 56,802 | |
| | 1,612 | | | Colony Capital, Inc. Class A (Real Estate Investment Trusts) | | | 32,788 | |
| | 4,168 | | | Columbia Banking System, Inc. (Commercial Banks) | | | 138,878 | |
| | 2,845 | | | Compass Minerals International, Inc. (Metals & Mining) | | | 231,128 | |
| | 1,822 | | | Convergys Corp. (IT Services) | | | 46,771 | |
| | 2,957 | | | Cubic Corp. (Aerospace & Defense) | | | 132,621 | |
| | 1,296 | | | Curtiss-Wright Corp. (Aerospace & Defense) | | | 90,150 | |
| | 27,075 | | | CVS Health Corp. (Food & Staples Retailing) | | | 2,674,468 | |
| | 15,280 | | | CYS Investments, Inc. (Real Estate Investment Trusts) | | | 117,962 | |
| | 7,220 | | | Diplomat Pharmacy, Inc.* (Health Care Providers & Services) | | | 202,954 | |
| | 134,352 | | | Discovery Communications, Inc. Class C* (Media) | | | 3,697,367 | |
| | |
| | Common Stocks – (continued) | |
| | United States – (continued) | |
| | 31,541 | | | Dollar General Corp. (Multiline Retail) | | $ | 2,137,534 | |
| | 38,589 | | | Dover Corp. (Machinery) | | | 2,486,289 | |
| | 3,210 | | | Drew Industries, Inc.* (Auto Components) | | | 192,054 | |
| | 3,655 | | | Dril-Quip, Inc.* (Energy Equipment & Services) | | | 225,002 | |
| | 46,265 | | | eBay, Inc.* (Internet Software & Services) | | | 1,290,793 | |
| | 7,680 | | | Education Realty Trust, Inc. (Real Estate Investment Trusts) | | | 275,789 | |
| | 3,440 | | | EnerSys (Electrical Equipment) | | | 209,806 | |
| | 4,670 | | | EPAM Systems, Inc.* (IT Services) | | | 361,224 | |
| | 18,798 | | | F5 Networks, Inc.* (Communications Equipment) | | | 2,071,540 | |
| | 5,790 | | | FEI Co. (Electronic Equipment, Instruments & Components) | | | 417,980 | |
| | 5,738 | | | First American Financial Corp. (Insurance) | | | 218,790 | |
| | 2,027 | | | First Cash Financial Services, Inc.* (Consumer Finance) | | | 77,330 | |
| | 439 | | | First Citizens BancShares, Inc. Class A (Commercial Banks) | | | 112,445 | |
| | 8,955 | | | Five Below, Inc.* (Specialty Retail) | | | 307,515 | |
| | 14,190 | | | Flotek Industries, Inc.* (Chemicals) | | | 256,839 | |
| | 15,391 | | | Forum Energy Technologies, Inc.* (Energy Equipment & Services) | | | 203,931 | |
| | 52,355 | | | Fossil Group, Inc.* (Textiles, Apparel & Luxury Goods) | | | 2,848,636 | |
| | 91,097 | | | Franklin Resources, Inc. (Capital Markets) | | | 3,713,114 | |
| | 677 | | | Fresh Del Monte Produce, Inc. (Food Products) | | | 30,891 | |
| | 2,907 | | | FTD Cos., Inc.* (Internet & Catalog Retail) | | | 82,326 | |
| | 2,479 | | | FTI Consulting, Inc.* (Professional Services) | | | 84,311 | |
| | 1,186 | | | G&K Services, Inc. Class A (Commercial Services & Supplies) | | | 78,063 | |
| | 90,357 | | | Gentex Corp. (Auto Components) | | | 1,480,951 | |
| | 14,675 | | | Glacier Bancorp, Inc. (Commercial Banks) | | | 401,508 | |
| | 5,499 | | | Globe Specialty Metals, Inc. (Metals & Mining) | | | 69,397 | |
| | 14,065 | | | Globus Medical, Inc. Class A* (Health Care Equipment & Supplies) | | | 314,353 | |
| | 13,405 | | | Grand Canyon Education, Inc.* (Diversified Consumer Services) | | | 557,112 | |
| | 2,970 | | | Granite Construction, Inc. (Construction & Engineering) | | | 97,535 | |
| | 21,653 | | | Graphic Packaging Holding Co. (Containers & Packaging) | | | 306,606 | |
| | 1,754 | | | Group 1 Automotive, Inc. (Specialty Retail) | | | 152,510 | |
| | 3,292 | | | Hanger, Inc.* (Health Care Providers & Services) | | | 47,471 | |
| | |
| | |
| The accompanying notes are an integral part of these financial statements. | | 27 |
GOLDMAN SACHS MULTI-MANAGER GLOBAL EQUITY FUND
Schedule of Investments (continued)
October 31, 2015
| | | | | | | | |
Shares | | | Description | | Value | |
| | Common Stocks – (continued) | |
| | United States – (continued) | |
| | 6,417 | | | Hatteras Financial Corp. (Real Estate Investment Trusts) | | $ | 91,827 | |
| | 12,290 | | | Healthcare Services Group, Inc. (Commercial Services & Supplies) | | | 457,925 | |
| | 18,075 | | | Heartland Express, Inc. (Road & Rail) | | | 340,352 | |
| | 4,470 | | | HEICO Corp. (Aerospace & Defense) | | | 225,467 | |
| | 1,750 | | | HEICO Corp. Class A (Aerospace & Defense) | | | 76,440 | |
| | 2,837 | | | Heidrick & Struggles International, Inc. (Professional Services) | | | 75,351 | |
| | 13,165 | | | Helix Energy Solutions Group, Inc.* (Energy Equipment & Services) | | | 76,094 | |
| | 6,650 | | | Hibbett Sports, Inc.* (Specialty Retail) | | | 227,164 | |
| | 3,125 | | | Hillenbrand, Inc. (Machinery) | | | 92,719 | |
| | 13,678 | | | Honeywell International, Inc. (Aerospace & Defense) | | | 1,412,664 | |
| | 966 | | | Huntington Ingalls Industries, Inc. (Aerospace & Defense) | | | 115,862 | |
| | 4,290 | | | IBERIABANK Corp. (Commercial Banks) | | | 260,103 | |
| | 4,385 | | | ICU Medical, Inc.* (Health Care Equipment & Supplies) | | | 482,218 | |
| | 826 | | | Infinity Property & Casualty Corp. (Insurance) | | | 66,510 | |
| | 3,492 | | | Insight Enterprises, Inc.* (Electronic Equipment, Instruments & Components) | | | 88,697 | |
| | 2,075 | | | Integra LifeSciences Holdings Corp.* (Health Care Equipment & Supplies) | | | 123,608 | |
| | 2,874 | | | International Speedway Corp. Class A (Hotels, Restaurants & Leisure) | | | 99,699 | |
| | 2,195 | | | IPC Healthcare, Inc.* (Health Care Providers & Services) | | | 172,307 | |
| | 11,425 | | | KapStone Paper and Packaging Corp. (Paper & Forest Products) | | | 248,494 | |
| | 3,273 | | | KAR Auction Services, Inc. (Commercial Services & Supplies) | | | 125,683 | |
| | 6,010 | | | Kindred Healthcare, Inc. (Health Care Providers & Services) | | | 80,534 | |
| | 3,406 | | | Knoll, Inc. (Commercial Services & Supplies) | | | 79,155 | |
| | 2,216 | | | Korn/Ferry International (Professional Services) | | | 80,596 | |
| | 629 | | | Landstar System, Inc. (Road & Rail) | | | 39,652 | |
| | 1,436 | | | LifePoint Health, Inc.* (Health Care Providers & Services) | | | 98,912 | |
| | 4,315 | | | Lithia Motors, Inc. Class A (Specialty Retail) | | | 506,538 | |
| | 3,858 | | | Live Nation Entertainment, Inc.* (Media) | | | 105,246 | |
| | 5,280 | | | LogMeIn, Inc.* (Internet Software & Services) | | | 355,661 | |
| | 1,450 | | | LSB Industries, Inc.* (Chemicals) | | | 22,692 | |
| | 11,348 | | | Maiden Holdings Ltd. (Insurance) | | | 176,461 | |
| | 6,105 | | | MarketAxess Holdings, Inc. (Diversified Financial Services) | | | 618,498 | |
| | |
| | Common Stocks – (continued) | |
| | United States – (continued) | |
| | 28,334 | | | MasterCard, Inc. Class A (IT Services) | | $ | 2,804,783 | |
| | 14,165 | | | Matador Resources Co.* (Oil, Gas & Consumable Fuels) | | | 364,182 | |
| | 771 | | | Matthews International Corp. Class A (Commercial Services & Supplies) | | | 44,510 | |
| | 2,870 | | | Mattress Firm Holding Corp.* (Specialty Retail) | | | 122,176 | |
| | 2,283 | | | MAXIMUS, Inc. (IT Services) | | | 155,701 | |
| | 6,195 | | | Medidata Solutions, Inc.* (Health Care Technology) | | | 266,385 | |
| | 20,115 | | | MFA Financial, Inc. (Real Estate Investment Trusts) | | | 139,196 | |
| | 112,101 | | | Microsoft Corp. (Software) | | | 5,900,997 | |
| | 1,203 | | | Minerals Technologies, Inc. (Chemicals) | | | 70,905 | |
| | 7,365 | | | Mobile Mini, Inc. (Commercial Services & Supplies) | | | 252,178 | |
| | 3,020 | | | Monro Muffler Brake, Inc. (Specialty Retail) | | | 223,993 | |
| | 42,161 | | | Motorola Solutions, Inc. (Communications Equipment) | | | 2,950,005 | |
| | 5,062 | | | MRC Global, Inc.* (Trading Companies & Distributors) | | | 60,238 | |
| | 29,931 | | | MSC Industrial Direct Co., Inc. Class A (Trading Companies & Distributors) | | | 1,878,769 | |
| | 1,325 | | | Mueller Industries, Inc. (Machinery) | | | 41,764 | |
| | 3,183 | | | Multi Packaging Solutions International Ltd.* (Containers & Packaging) | | | 52,042 | |
| | 4,875 | | | National Health Investors, Inc. (Real Estate Investment Trusts) | | | 286,357 | |
| | 86,870 | | | National Oilwell Varco, Inc. (Energy Equipment & Services) | | | 3,269,787 | |
| | 5,552 | | | Nationstar Mortgage Holdings, Inc.* (Thrifts & Mortgage Finance) | | | 73,675 | |
| | 8,909 | | | Navigant Consulting, Inc.* (Professional Services) | | | 153,235 | |
| | 2,274 | | | Nelnet, Inc. Class A (Consumer Finance) | | | 81,364 | |
| | 2,138 | | | NETGEAR, Inc.* (Communications Equipment) | | | 88,513 | |
| | 8,325 | | | NorthWestern Corp. (Multi-Utilities) | | | 451,132 | |
| | 1,936 | | | Nu Skin Enterprises, Inc. Class A (Personal Products) | | | 73,975 | |
| | 231,626 | | | Oracle Corp. (Software) | | | 8,996,354 | |
| | 3,516 | | | Owens & Minor, Inc. (Health Care Providers & Services) | | | 126,049 | |
| | 4,365 | | | Oxford Industries, Inc. (Textiles, Apparel & Luxury Goods) | | | 317,859 | |
| | 1,584 | | | PAREXEL International Corp.* (Life Sciences Tools & Services) | | | 99,982 | |
| | 51,184 | | | Parker-Hannifin Corp. (Machinery) | | | 5,358,965 | |
| | 6,762 | | | Parsley Energy, Inc. Class A* (Oil, Gas & Consumable Fuels) | | | 119,890 | |
| | 46,265 | | | PayPal Holdings, Inc.* (IT Services) | | | 1,666,003 | |
| | |
| | |
| 28 | | The accompanying notes are an integral part of these financial statements. |
GOLDMAN SACHS MULTI-MANAGER GLOBAL EQUITY FUND
| | | | | | | | |
Shares | | | Description | | Value | |
| | Common Stocks – (continued) | |
| | United States – (continued) | |
| | 9,595 | | | Pebblebrook Hotel Trust (Real Estate Investment Trusts) | | $ | 327,957 | |
| | 7,206 | | | PHH Corp.* (Thrifts & Mortgage Finance) | | | 105,928 | |
| | 11,730 | | | Pier 1 Imports, Inc. (Specialty Retail) | | | 87,037 | |
| | 2,335 | | | PNM Resources, Inc. (Electric Utilities) | | | 65,660 | |
| | 6,500 | | | Power Integrations, Inc. (Semiconductors & Semiconductor Equipment) | | | 328,965 | |
| | 6,500 | | | PRA Group, Inc.* (Consumer Finance) | | | 356,200 | |
| | 13,710 | | | Primoris Services Corp. (Construction & Engineering) | | | 273,103 | |
| | 6,600 | | | ProAssurance Corp. (Insurance) | | | 349,536 | |
| | 4,570 | | | Proto Labs, Inc.* (Machinery) | | | 296,319 | |
| | 848 | | | QTS Realty Trust, Inc. Class A (Real Estate Investment Trusts) | | | 36,472 | |
| | 39,662 | | | QUALCOMM, Inc. (Communications Equipment) | | | 2,356,716 | |
| | 7,474 | | | Radian Group, Inc. (Thrifts & Mortgage Finance) | | | 108,149 | |
| | 4,725 | | | RBC Bearings, Inc.* (Machinery) | | | 323,143 | |
| | 3,445 | | | Rent-A-Center, Inc. (Specialty Retail) | | | 63,354 | |
| | 8,275 | | | Rofin-Sinar Technologies, Inc.* (Electronic Equipment, Instruments & Components) | | | 239,644 | |
| | 7,322 | | | RPX Corp.* (Professional Services) | | | 104,265 | |
| | 4,789 | | | RSP Permian, Inc. (Oil, Gas & Consumable Fuels) | | | 131,314 | |
| | 687 | | | Safety Insurance Group, Inc. (Insurance) | | | 39,812 | |
| | 27,196 | | | Schlumberger Ltd. (Energy Equipment & Services) | | | 2,125,639 | |
| | 2,479 | | | Schweitzer-Mauduit International, Inc. (Paper & Forest Products) | | | 96,235 | |
| | 9,700 | | | SciQuest, Inc.* (Internet Software & Services) | | | 115,042 | |
| | 6,446 | | | Select Medical Holdings Corp. (Health Care Providers & Services) | | | 72,840 | |
| | 658 | | | Sensient Technologies Corp. (Chemicals) | | | 42,948 | |
| | 4,905 | | | Silgan Holdings, Inc. (Containers & Packaging) | | | 249,517 | |
| | 2,973 | | | Silver Bay Realty Trust Corp. (Real Estate Investment Trusts) | | | 48,163 | |
| | 16,238 | | | SLM Corp.* (Consumer Finance) | | | 114,640 | |
| | 4,975 | | | Solera Holdings, Inc. (Software) | | | 271,933 | |
| | 14,880 | | | STAG Industrial, Inc. (Real Estate Investment Trusts) | | | 305,338 | |
| | 1,000 | | | StanCorp Financial Group, Inc. (Insurance) | | | 114,720 | |
| | 3,350 | | | Starz Class A* (Media) | | | 112,258 | |
| | 36,925 | | | State Street Corp. (Capital Markets) | | | 2,547,825 | |
| | 1,099 | | | Steven Madden Ltd.* (Textiles, Apparel & Luxury Goods) | | | 38,300 | |
| | |
| | Common Stocks – (continued) | |
| | United States – (continued) | |
| | 8,330 | | | Stifel Financial Corp.* (Capital Markets) | | $ | 370,102 | |
| | 5,093 | | | Stock Building Supply Holdings, Inc.* (Trading Companies & Distributors) | | | 88,007 | |
| | 6,009 | | | Sykes Enterprises, Inc.* (IT Services) | | | 174,261 | |
| | 5,874 | | | Symetra Financial Corp. (Insurance) | | | 186,382 | |
| | 3,531 | | | SYNNEX Corp. (Electronic Equipment, Instruments & Components) | | | 312,282 | |
| | 27,413 | | | T. Rowe Price Group, Inc. (Capital Markets) | | | 2,072,971 | |
| | 5,360 | | | Team Health Holdings, Inc.* (Health Care Providers & Services) | | | 319,831 | |
| | 4,546 | | | TeleTech Holdings, Inc. (IT Services) | | | 132,289 | |
| | 844 | | | Tempur Sealy International, Inc.* (Household Durables) | | | 65,697 | |
| | 3,972 | | | Teradyne, Inc. (Semiconductors & Semiconductor Equipment) | | | 77,533 | |
| | 5,784 | | | Terex Corp. (Machinery) | | | 116,027 | |
| | 3,631 | | | Tetra Tech, Inc. (Commercial Services & Supplies) | | | 97,674 | |
| | 6,550 | | | Texas Capital Bancshares, Inc.* (Commercial Banks) | | | 361,560 | |
| | 14,525 | | | Texas Roadhouse, Inc. (Hotels, Restaurants & Leisure) | | | 498,934 | |
| | 47,189 | | | The Bank of New York Mellon Corp. (Capital Markets) | | | 1,965,422 | |
| | 19,535 | | | The Boeing Co. (Aerospace & Defense) | | | 2,892,547 | |
| | 2,135 | | | The Brink’s Co. (Commercial Services & Supplies) | | | 66,142 | |
| | 7,495 | | | The Finish Line, Inc. Class A (Specialty Retail) | | | 139,632 | |
| | 1,933 | | | The Hanover Insurance Group, Inc. (Insurance) | | | 162,855 | |
| | 4,641 | | | The Men’s Wearhouse, Inc. (Specialty Retail) | | | 185,547 | |
| | 593 | | | The Navigators Group, Inc.* (Insurance) | | | 50,613 | |
| | 1,247 | | | The Priceline Group, Inc.* (Internet & Catalog Retail) | | | 1,813,437 | |
| | 5,740 | | | The Toro Co. (Machinery) | | | 432,050 | |
| | 9,974 | | | The Walt Disney Co. (Media) | | | 1,134,443 | |
| | 3,355 | | | Thor Industries, Inc. (Automobiles) | | | 181,438 | |
| | 13,144 | | | Time Warner, Inc. (Media) | | | 990,269 | |
| | 15,485 | | | Tumi Holdings, Inc.* (Textiles, Apparel & Luxury Goods) | | | 248,225 | |
| | 4,520 | | | Tupperware Brands Corp. (Household Durables) | | | 266,092 | |
| | 2,948 | | | Tutor Perini Corp.* (Construction & Engineering) | | | 49,467 | |
| | 18,390 | | | Two Harbors Investment Corp. (Real Estate Investment Trusts) | | | 155,579 | |
| | 3,730 | | | Tyler Technologies, Inc.* (Software) | | | 635,443 | |
| | 2,034 | | | Universal Corp. (Tobacco) | | | 109,856 | |
| | |
| | |
| The accompanying notes are an integral part of these financial statements. | | 29 |
GOLDMAN SACHS MULTI-MANAGER GLOBAL EQUITY FUND
Schedule of Investments (continued)
October 31, 2015
| | | | | | | | |
Shares | | | Description | | Value | |
| | Common Stocks – (continued) | |
| | United States – (continued) | |
| | 4,620 | | | Universal Forest Products, Inc. (Building Products) | | $ | 335,551 | |
| | 5,025 | | | US Ecology, Inc. (Commercial Services & Supplies) | | | 197,030 | |
| | 19,918 | | | Verizon Communications, Inc. (Diversified Telecommunication Services) | | | 933,756 | |
| | 36,792 | | | Visa, Inc. Class A (IT Services) | | | 2,854,323 | |
| | 6,541 | | | Walker & Dunlop, Inc.* (Thrifts & Mortgage Finance) | | | 189,754 | |
| | 5,377 | | | Washington Federal, Inc. (Thrifts & Mortgage Finance) | | | 134,102 | |
| | 3,045 | | | WD-40 Co. (Household Products) | | | 291,041 | |
| | 7,640 | | | Webster Financial Corp. (Commercial Banks) | | | 283,444 | |
| | 2,441 | | | WESCO International, Inc.* (Trading Companies & Distributors) | | | 119,438 | |
| | 9,495 | | | West Pharmaceutical Services, Inc. (Health Care Equipment & Supplies) | | | 569,795 | |
| | 3,325 | | | Western Refining, Inc. (Oil, Gas & Consumable Fuels) | | | 138,386 | |
| | 9,682 | | | World Fuel Services Corp. (Oil, Gas & Consumable Fuels) | | | 430,462 | |
| | | | | | | | |
| | | | | | | 144,478,878 | |
| | |
| | TOTAL COMMON STOCKS | |
| | (Cost $376,433,074) | | $ | 365,960,488 | |
| | |
| | | | | | | | |
| Shares | | Rate | | | Value | |
| Preferred Stocks – 0.4% | |
| Brazil* – 0.0% | |
| Banco ABC Brasil SA (Commercial Banks) | |
| 15,200 | | | 0.000 | % | | $ | 33,522 | |
| |
| Germany* – 0.4% | |
| Volkswagen AG (Automobiles) | |
| 12,180 | | | 0.000 | | | | 1,462,027 | |
| |
| TOTAL PREFERRED STOCKS | |
| (Cost $2,409,513) | | | $ | 1,495,549 | |
| |
| | | | | | | | | | | | |
| Units | | | Description | | Expiration
Month | | | Value | |
| | | | | | | | | | | | |
| | Rights* – 0.0% | | | | | |
| | Italy – 0.0% | | | | | |
| | 30,200 | | | Mediolanum SpA | | | 11/26/15 | | | $ | 2 | |
| | (Cost $—) | | | | | | | | |
| | |
| | | | | | | | |
Shares | | | Description | | Value | |
| | Exchange Traded Funds – 10.8% | |
| | 714,785 | | | iShares MSCI EAFE Small-Cap ETF | | $ | 35,825,024 | |
| | 329,176 | | | Vanguard FTSE Emerging Markets ETF | | | 11,468,492 | |
| | |
| | TOTAL EXCHANGE TRADED FUNDS | |
| | (Cost $49,670,990) | | $ | 47,293,516 | |
| | |
| TOTAL INVESTMENTS BEFORE SHORT-TERM
INVESTMENT |
|
| | (Cost $428,513,577) | | $ | 414,749,555 | |
| | |
| | | | | | | | | | | | |
Principal
Amount | | | Interest
Rate | | Maturity
Date | | | Value | |
| | Short-term Investment(b) – 5.5% | |
| Joint Repurchase Agreement Account II | | | | | |
| $ | 24,200,000 | | | 0.092% | | | 11/02/15 | | | $ | 24,200,000 | |
| | (Cost $24,200,000) | | | | | | | | |
| | |
| | TOTAL INVESTMENTS – 100.0% | | | | | |
| | (Cost $452,713,577) | | | | | | $ | 438,949,555 | |
| | |
| OTHER ASSETS IN EXCESS OF
LIABILITIES – 0.0% |
| | | 204,985 | |
| | |
| | NET ASSETS – 100.0% | | | | | | $ | 439,154,540 | |
| | |
| | |
| The percentage shown for each investment category reflects the value of investments in that category as a percentage of net assets. |
* | | Non-income producing security. |
(a) | | Securities are exempt from registration under Rule 144A of the Securities Act of 1933. Under procedures approved by the Board of Trustees, such securities have been determined to be liquid by an Underlying Manager and may be resold, normally to qualified institutional buyers in transactions exempt from registration. Total market value of Rule 144A securities amounts to $1,023,440, which represents approximately 0.2% of net assets as of October 31, 2015. |
(b) | | Joint repurchase agreement was entered into on October 30, 2015. Additional information appears on page 52. |
| | |
|
Investment Abbreviations: |
ADR | | —American Depositary Receipt |
ETF | | —Exchange Traded Fund |
GDR | | —Global Depository Receipt |
|
| | |
| 30 | | The accompanying notes are an integral part of these financial statements. |
GOLDMAN SACHS MULTI-MANAGER GLOBAL EQUITY FUND
|
| ADDITIONAL INVESTMENT INFORMATION |
FORWARD FOREIGN CURRENCY EXCHANGE CONTRACTS – At October 31, 2015, the Fund had the following forward foreign currency exchange contracts:
FORWARD FOREIGN CURRENCY EXCHANGE CONTRACTS WITH UNREALIZED GAIN
| | | | | | | | | | | | | | | | | | | | | | | | | | |
| Counterparty | | Currency
Purchased | | | Currency
Sold | | | Current
Value | | | Settlement
Date | | | Unrealized
Gain | |
Bank of America Securities LLC | | USD | | | 394,764 | | | | AUD | | | | 554,600 | | | $ | 394,547 | | | | 12/16/15 | | | $ | 217 | |
| | USD | | | 6,049,102 | | | | CHF | | | | 5,898,580 | | | | 5,977,200 | | | | 12/16/15 | | | | 71,902 | |
| | USD | | | 1,185,068 | | | | DKK | | | | 7,911,450 | | | | 1,168,051 | | | | 12/16/15 | | | | 17,016 | |
| | USD | | | 10,499,705 | | | | EUR | | | | 9,396,950 | | | | 10,341,420 | | | | 12/16/15 | | | | 158,285 | |
| | USD | | | 1,232,095 | | | | GBP | | | | 798,060 | | | | 1,230,040 | | | | 12/16/15 | | | | 2,056 | |
| | USD | | | 20,203 | | | | ILS | | | | 78,020 | | | | 20,172 | | | | 12/16/15 | | | | 32 | |
| | USD | | | 859,878 | | | | JPY | | | | 102,897,210 | | | | 853,402 | | | | 12/16/15 | | | | 6,476 | |
| | USD | | | 438,903 | | | | NOK | | | | 3,625,760 | | | | 426,401 | | | | 12/16/15 | | | | 12,501 | |
| | USD | | | 2,110,145 | | | | SEK | | | | 17,745,970 | | | | 2,079,496 | | | | 12/16/15 | | | | 30,650 | |
| | USD | | | 84,590 | | | | SGD | | | | 118,650 | | | | 84,559 | | | | 12/16/15 | | | | 32 | |
Commonwealth Bank of Australia | | USD | | | 3,148,791 | | | | CHF | | | | 3,064,900 | | | | 3,105,751 | | | | 12/16/15 | | | | 43,040 | |
| | USD | | | 652,339 | | | | DKK | | | | 4,347,700 | | | | 641,897 | | | | 12/16/15 | | | | 10,441 | |
| | USD | | | 20,980,853 | | | | EUR | | | | 18,796,240 | | | | 20,685,415 | | | | 12/16/15 | | | | 295,438 | |
| | USD | | | 2,830,965 | | | | JPY | | | | 338,458,890 | | | | 2,807,088 | | | | 12/16/15 | | | | 23,877 | |
| | USD | | | 249,158 | | | | NOK | | | | 2,068,900 | | | | 243,309 | | | | 12/16/15 | | | | 5,848 | |
| | | USD | | | 1,149,582 | | | | SEK | | | | 9,629,100 | | | | 1,128,350 | | | | 12/16/15 | | | | 21,231 | |
| TOTAL | | | | | | | $ | 699,042 | |
| | |
| The accompanying notes are an integral part of these financial statements. | | 31 |
GOLDMAN SACHS MULTI-MANAGER GLOBAL EQUITY FUND
Schedule of Investments (continued)
October 31, 2015
|
| ADDITIONAL INVESTMENT INFORMATION (continued) |
FORWARD FOREIGN CURRENCY EXCHANGE CONTRACTS WITH UNREALIZED LOSS
| | | | | | | | | | | | | | | | | | | | | | | | | | |
| Counterparty | | Currency
Purchased | | | Currency
Sold | | | Current
Value | | | Settlement
Date | | | Unrealized
Loss | |
Bank of America Securities LLC | | USD | | | 3,902,458 | | | | AUD | | | | 5,586,060 | | | $ | 3,973,969 | | | | 12/16/15 | | | $ | (71,511 | ) |
| | USD | | | 8,753,774 | | | | GBP | | | | 5,717,850 | | | | 8,812,849 | | | | 12/16/15 | | | | (59,076 | ) |
| | USD | | | 6,495,698 | | | | HKD | | | | 50,352,060 | | | | 6,497,567 | | | | 12/16/15 | | | | (1,869 | ) |
| | USD | | | 437,348 | | | | ILS | | | | 1,701,660 | | | | 439,959 | | | | 12/16/15 | | | | (2,611 | ) |
| | USD | | | 11,013,223 | | | | JPY | | | | 1,331,344,470 | | | | 11,041,818 | | | | 12/16/15 | | | | (28,596 | ) |
| | USD | | | 70,401 | | | | NOK | | | | 601,300 | | | | 70,715 | | | | 12/16/15 | | | | (314 | ) |
| | USD | | | 160,246 | | | | NZD | | | | 250,910 | | | | 169,312 | | | | 12/16/15 | | | | (9,067 | ) |
| | USD | | | 869,366 | | | | SGD | | | | 1,235,430 | | | | 880,465 | | | | 12/16/15 | | | | (11,100 | ) |
Commonwealth Bank of Australia | | USD | | | 2,091,775 | | | | AUD | | | | 2,989,310 | | | | 2,126,619 | | | | 12/16/15 | | | | (34,845 | ) |
| | USD | | | 11,046,831 | | | | GBP | | | | 7,218,320 | | | | 11,125,505 | | | | 12/16/15 | | | | (78,673 | ) |
| | USD | | | 3,499,220 | | | | HKD | | | | 27,123,870 | | | | 3,500,138 | | | | 12/16/15 | | | | (918 | ) |
| | USD | | | 248,714 | | | | ILS | | | | 969,870 | | | | 250,757 | | | | 12/16/15 | | | | (2,043 | ) |
| | USD | | | 9,975,036 | | | | JPY | | | | 1,205,267,920 | | | | 9,996,172 | | | | 12/16/15 | | | | (21,136 | ) |
| | USD | | | 90,318 | | | | NZD | | | | 142,050 | | | | 95,855 | | | | 12/16/15 | | | | (5,537 | ) |
| | | USD | | | 442,506 | | | | SGD | | | | 630,600 | | | | 449,416 | | | | 12/16/15 | | | | (6,907 | ) |
| TOTAL | | | | | | | $ | (334,203 | ) |
| | |
| 32 | | The accompanying notes are an integral part of these financial statements. |
GOLDMAN SACHS MULTI-MANAGER NON-CORE FIXED INCOME FUND
Schedule of Investments
October 31, 2015
| | | | | | | | | | | | | | |
Principal Amount | | | Interest
Rate | | | Maturity
Date | | | Value | |
| | Corporate Obligations – 29.3% | |
| | Aerospace & Defense(a)(b) – 0.1% | |
| Bombardier, Inc. | |
| $ | 254,000 | | | | 6.000 | % | | | 10/15/22 | | | $ | 195,580 | |
| | |
| | Automotive(a) – 0.3% | |
| Affinia Group, Inc. | |
| | 199,000 | | | | 7.750 | | | | 05/01/21 | | | | 206,463 | |
| Schaeffler Finance BV(b) | |
| | 700,000 | | | | 4.250 | | | | 05/15/21 | | | | 700,000 | |
| | | | | | | | | | | | | | |
| | | | | | | | | | | | | 906,463 | |
| | |
| | Building Materials(a) – 0.8% | |
| American Builders & Contractors Supply Co., Inc.(b) | |
| | 640,000 | | | | 5.625 | | | | 04/15/21 | | | | 658,400 | |
| Gibraltar Industries, Inc. | |
| | 500,000 | | | | 6.250 | | | | 02/01/21 | | | | 515,000 | |
| Masonite International Corp.(b) | |
| | 1,000,000 | | | | 5.625 | | | | 03/15/23 | | | | 1,045,000 | |
| | | | | | | | | | | | | | |
| | | | | | | | | | | | | 2,218,400 | |
| | |
| | Consumer Cyclical Services(a)(b) – 0.8% | |
| CEB, Inc. | |
| | 36,000 | | | | 5.625 | | | | 06/15/23 | | | | 36,585 | |
| First Data Corp. | |
| | 600,000 | | | | 6.750 | | | | 11/01/20 | | | | 632,250 | |
| | 300,000 | | | | 8.250 | | | | 01/15/21 | | | | 314,625 | |
| Iron Mountain, Inc. | |
| | 1,000,000 | | | | 6.000 | | | | 10/01/20 | | | | 1,058,750 | |
| | | | | | | | | | | | | | |
| | | | | | | | | | | | | 2,042,210 | |
| | |
| | Consumer Noncyclical(a) – 0.2% | |
| NeuStar, Inc. | |
| | 675,000 | | | | 4.500 | | | | 01/15/23 | | | | 587,250 | |
| | |
| | Consumer Products – Household & Leisure(a)(b) – 1.1% | |
| Jarden Corp. | |
| | 667,000 | | | | 5.000 | | | | 11/15/23 | | | | 685,342 | |
| Spectrum Brands, Inc. | |
| | 1,015,000 | | | | 5.750 | | | | 07/15/25 | | | | 1,082,244 | |
| The Scotts Miracle-Gro Co. | |
| | 1,200,000 | | | | 6.000 | | | | 10/15/23 | | | | 1,269,000 | |
| | | | | | | | | | | | | | |
| | | | | | | | | | | | | 3,036,586 | |
| | |
| | Diversified Financial Services – 0.5% | |
| Banco Nacional de Comercio Exterior SNC(b) | |
| | 200,000 | | | | 4.375 | | | | 10/14/25 | | | | 200,000 | |
| Bankrate, Inc.(a)(b) | |
| | 700,000 | | | | 6.125 | | | | 08/15/18 | | | | 698,250 | |
| Corp Financiera de Desarrollo SA | |
| | 200,000 | | | | 4.750 | | | | 07/15/25 | | | | 202,750 | |
| Majapahit Holding BV | |
| | 100,000 | | | | 8.000 | | | | 08/07/19 | | | | 112,625 | |
| Ukreximbank Via Biz Finance PLC | |
| | 150,000 | | | | 9.625 | | | | 04/27/22 | | | | 136,688 | |
| | | | | | | | | | | | | | |
| | | | | | | | | | | | | 1,350,313 | |
| | |
| | Energy – 1.2% | |
| Blue Racer Midstream LLC/Blue Racer Finance Corp.(a)(b) | |
| | 1,067,000 | | | | 6.125 | | | | 11/15/22 | | | | 994,977 | |
| | |
| | Corporate Obligations – (continued) | |
| | Energy – (continued) | |
| CITGO Petroleum Corp.(a)(b) | |
| $ | 500,000 | | | | 6.250 | % | | | 08/15/22 | | | $ | 491,250 | |
| Ecopetrol SA(a) | |
| | 269,000 | | | | 5.375 | | | | 06/26/26 | | | | 249,901 | |
| Pertamina Persero PT | |
| | 200,000 | | | | 5.625 | | | | 05/20/43 | | | | 165,243 | |
| Petrobras Global Finance BV | |
| | 420,000 | | | | 5.375 | | | | 01/27/21 | | | | 340,746 | |
| Petroleos de Venezuela SA | |
| | 95,000 | | | | 8.500 | | | | 11/02/17 | | | | 57,347 | |
| | 119,426 | | | | 9.000 | | | | 11/17/21 | | | | 48,905 | |
| | 205,000 | | | | 6.000 | | | | 05/16/24 | | | | 72,570 | |
| | 537,469 | | | | 6.000 | | | | 11/15/26 | | | | 188,007 | |
| | 230,000 | | | | 9.750 | | | | 05/17/35 | | | | 95,450 | |
| | 375,000 | | | | 5.500 | | | | 04/12/37 | | | | 127,969 | |
| Petroleos Mexicanos | |
| | 80,000 | | | | 6.625 | | | | 06/15/35 | | | | 78,504 | |
| | 125,000 | | | | 5.500 | | | | 06/27/44 | | | | 106,525 | |
| State Oil Company of the Azerbaijan Republic | |
| | 200,000 | | | | 4.750 | | | | 03/13/23 | | | | 175,500 | |
| YPF SA | |
| | 40,000 | | | | 8.875 | | | | 12/19/18 | | | | 41,200 | |
| | 38,000 | | | | 8.750 | | | | 04/04/24 | | | | 38,380 | |
| | | | | | | | | | | | | | |
| | | | | | | | | | | | | 3,272,474 | |
| | |
| | Energy – Exploration & Production – 1.6% | |
| Chesapeake Energy Corp.(a) | |
| | 650,000 | | | | 4.875 | | | | 04/15/22 | | | | 403,000 | |
| CNOOC Curtis Funding No. 1 Pty Ltd. | |
| | 250,000 | | | | 4.500 | | | | 10/03/23 | | | | 261,485 | |
| Halcon Resources Corp.(a)(b) | |
| | 650,000 | | | | 8.625 | | | | 02/01/20 | | | | 560,625 | |
| KazMunayGas National Co. JSC | |
| | 190,000 | | | | 9.125 | | | | 07/02/18 | | | | 209,237 | |
| | 375,000 | | | | 7.000 | | | | 05/05/20 | | | | 391,875 | |
| | 200,000 | | | | 4.400 | | | | 04/30/23 | | | | 175,500 | |
| Linn Energy LLC/Linn Energy Finance Corp.(a) | |
| | 655,000 | | | | 6.250 | | | | 11/01/19 | | | | 144,100 | |
| MEG Energy Corp.(a)(b) | |
| | 450,000 | | | | 6.375 | | | | 01/30/23 | | | | 381,375 | |
| | 150,000 | | | | 7.000 | | | | 03/31/24 | | | | 130,125 | |
| Memorial Production Partners LP/Memorial Production Finance
Corp.(a) |
|
| | 300,000 | | | | 7.625 | | | | 05/01/21 | | | | 201,000 | |
| Midstates Petroleum Co., Inc./Midstates Petroleum Co. LLC(a) | |
| | 600,000 | | | | 10.000 | (b) | | | 06/01/20 | | | | 414,000 | |
| | 72,000 | | | | 10.750 | | | | 10/01/20 | | | | 12,960 | |
| | 300,000 | | | | 9.250 | | | | 06/01/21 | | | | 60,000 | |
| Newfield Exploration Co.(a) | |
| | 580,000 | | | | 5.375 | | | | 01/01/26 | | | | 551,000 | |
| PDC Energy, Inc.(a) | |
| | 500,000 | | | | 7.750 | | | | 10/15/22 | | | | 500,000 | |
| Peabody Energy Corp. | |
| | 40,000 | | | | 6.250 | | | | 11/15/21 | | | | 5,600 | |
| | | | | | | | | | | | | | |
| | | | | | | | | | | | | 4,401,882 | |
| | |
| | |
| The accompanying notes are an integral part of these financial statements. | | 33 |
GOLDMAN SACHS MULTI-MANAGER NON-CORE FIXED INCOME FUND
Schedule of Investments (continued)
October 31, 2015
| | | | | | | | | | | | | | |
Principal Amount | | | Interest
Rate | | | Maturity
Date | | | Value | |
| | Corporate Obligations – (continued) | |
| | Energy – Services(a)(b) – 0.3% | |
| Hiland Partners LP/Hiland Partners Finance Corp. | |
| $ | 757,000 | | | | 5.500 | % | | | 05/15/22 | | | $ | 737,110 | |
| | |
| | Entertainment & Leisure(a) – 0.4% | |
| AMC Entertainment, Inc. | |
| | 200,000 | | | | 5.875 | | | | 02/15/22 | | | | 206,500 | |
| Cinemark USA, Inc. | |
| | 1,000,000 | | | | 4.875 | | | | 06/01/23 | | | | 982,500 | |
| | | | | | | | | | | | | | |
| | | | | | | | | | | | | 1,189,000 | |
| | |
| | Finance – 1.0% | |
| Ally Financial, Inc. | |
| | 1,000,000 | | | | 4.125 | | | | 03/30/20 | | | | 1,032,500 | |
| CIT Group, Inc.(b) | |
| | 500,000 | | | | 5.500 | | | | 02/15/19 | | | | 531,250 | |
| Icahn Enterprises LP/Icahn Enterprises Finance Corp.(a) | |
| | 1,000,000 | | | | 5.875 | | | | 02/01/22 | | | | 1,030,000 | |
| | | | | | | | | | | | | | |
| | | | | | | | | | | | | 2,593,750 | |
| | |
| | Finance Insurance(a)(b) – 0.2% | |
| Hub International Ltd. | |
| | 500,000 | | | | 7.875 | | | | 10/01/21 | | | | 499,375 | |
| | |
| | Food & Beverage(a) – 0.5% | |
| B&G Foods, Inc. | |
| | 700,000 | | | | 4.625 | | | | 06/01/21 | | | | 698,250 | |
| NBTY, Inc. | |
| | 603,000 | | | | 9.000 | | | | 10/01/18 | | | | 617,321 | |
| | | | | | | | | | | | | | |
| | | | | | | | | | | | | 1,315,571 | |
| | |
| | Gaming – 0.8% | |
| MGM Resorts International | |
| | 1,100,000 | | | | 6.625 | | | | 12/15/21 | | | | 1,171,500 | |
| Seminole Hard Rock Entertainment, Inc.(a)(b) | |
| | 1,000,000 | | | | 5.875 | | | | 05/15/21 | | | | 1,000,000 | |
| | | | | | | | | | | | | | |
| | | | | | | | | | | | | 2,171,500 | |
| | |
| | Health Care – Medical Products – 0.7% | |
| Fresenius Medical Care US Finance II, Inc.(b) | |
| | 700,000 | | | | 5.875 | | | | 01/31/22 | | | | 764,750 | |
| Grifols Worldwide Operations Ltd.(a) | |
| | 965,000 | | | | 5.250 | | | | 04/01/22 | | | | 998,775 | |
| | | | | | | | | | | | | | |
| | | | | | | | | | | | | 1,763,525 | |
| | |
| | Health Care – Pharmaceuticals – 0.9% | |
| Mallinckrodt International Finance SA | |
| | 678,000 | | | | 4.750 | | | | 04/15/23 | | | | 598,335 | |
| Mallinckrodt International Finance SA/Mallinckrodt CB LLC(a)(b) | |
| | 300,000 | | | | 5.500 | | | | 04/15/25 | | | | 273,000 | |
| Quintiles Transnational Corp.(a)(b) | |
| | 1,000,000 | | | | 4.875 | | | | 05/15/23 | | | | 1,020,000 | |
| Valeant Pharmaceuticals International, Inc.(a)(b) | |
| | 500,000 | | | | 6.750 | | | | 08/15/18 | | | | 481,250 | |
| | | | | | | | | | | | | | |
| | | | | | | | | | | | | 2,372,585 | |
| | |
| | Corporate Obligations – (continued) | |
| | Health Care – Services(a) – 1.3% | |
| Acadia Healthcare Co., Inc. | |
| $ | 600,000 | | | | 5.625 | % | | | 02/15/23 | | | $ | 604,500 | |
| | 200,000 | | | | 5.625 | (b) | | | 02/15/23 | | | | 201,500 | |
| Amsurg Corp. | |
| | 1,000,000 | | | | 5.625 | | | | 07/15/22 | | | | 982,500 | |
| CHS/Community Health Systems, Inc. | |
| | 700,000 | | | | 5.125 | | | | 08/01/21 | | | | 724,500 | |
| DaVita HealthCare Partners, Inc. | |
| | 900,000 | | | | 5.125 | | | | 07/15/24 | | | | 915,750 | |
| | 100,000 | | | | 5.000 | | | | 05/01/25 | | | | 99,250 | |
| | | | | | | | | | | | | | |
| | | | | | | | | | | | | 3,528,000 | |
| | |
| | Lodging(a)(b) – 0.4% | |
| Interval Acquisition Corp. | |
| | 1,000,000 | | | | 5.625 | | | | 04/15/23 | | | | 1,025,000 | |
| | |
| | Machinery(b) – 0.2% | |
| Boart Longyear Management Pty Ltd. | |
| | 500,000 | | | | 10.000 | | | | 10/01/18 | | | | 425,000 | |
| | |
| | Media – Broadcasting & Radio(a)(b) – 1.3% | |
| Sinclair Television Group, Inc. | |
| | 1,000,000 | | | | 5.625 | | | | 08/01/24 | | | | 978,750 | |
| Sirius XM Radio, Inc. | |
| | 1,200,000 | | | | 4.625 | | | | 05/15/23 | | | | 1,188,000 | |
| Townsquare Media, Inc. | |
| | 500,000 | | | | 6.500 | | | | 04/01/23 | | | | 480,000 | |
| Univision Communications, Inc. | |
| | 1,000,000 | | | | 5.125 | | | | 02/15/25 | | | | 982,500 | |
| | | | | | | | | | | | | | |
| | | | | | | | | | | | | 3,629,250 | |
| | |
| | Media – Cable – 1.9% | |
| Altice US Finance I Corp.(a)(b) | |
| | 600,000 | | | | 5.375 | | | | 07/15/23 | | | | 603,750 | |
| CCO Holdings LLC/CCO Holdings Capital Corp.(a) | |
| | 600,000 | | | | 5.125 | | | | 02/15/23 | | | | 600,000 | |
| CCO Safari II LLC(a)(b) | |
| | 500,000 | | | | 4.908 | | | | 07/23/25 | | | | 508,960 | |
| CSC Holdings LLC | |
| | 1,100,000 | | | | 6.750 | | | | 11/15/21 | | | | 1,067,000 | |
| Numericable – SFR SAS(a)(b) | |
| | 800,000 | | | | 6.250 | | | | 05/15/24 | | | | 800,000 | |
| Videotron Ltd. | |
| | 600,000 | | | | 5.000 | | | | 07/15/22 | | | | 622,500 | |
| Virgin Media Secured Finance PLC(a)(b) | |
| | 900,000 | | | | 5.250 | | | | 01/15/26 | | | | 896,625 | |
| | | | | | | | | | | | | | |
| | | | | | | | | | | | | 5,098,835 | |
| | |
| | Media – Non Cable(a) – 1.5% | |
| LIN Television Corp. | |
| | 800,000 | | | | 6.375 | | | | 01/15/21 | | | | 835,000 | |
| Nielsen Finance LLC/Nielsen Finance Co.(b) | |
| | 1,100,000 | | | | 5.000 | | | | 04/15/22 | | | | 1,113,750 | |
| Outfront Media Capital LLC/Outfront Media Capital Corp. | |
| | 1,090,000 | | | | 5.875 | | | | 03/15/25 | | | | 1,128,150 | |
| | |
| | |
| 34 | | The accompanying notes are an integral part of these financial statements. |
GOLDMAN SACHS MULTI-MANAGER NON-CORE FIXED INCOME FUND
| | | | | | | | | | | | | | |
Principal Amount | | | Interest
Rate | | | Maturity
Date | | | Value | |
| | Corporate Obligations – (continued) | |
| | Media – Non Cable(a) – (continued) | |
| VeriSign, Inc. | |
| $ | 1,000,000 | | | | 4.625 | % | | | 05/01/23 | | | $ | 997,500 | |
| | | | | | | | | | | | | | |
| | | | | | | | | | | | | 4,074,400 | |
| | |
| | Metals & Mining(a)(b) – 0.2% | |
| New Gold, Inc. | |
| | 565,000 | | | | 6.250 | | | | 11/15/22 | | | | 483,075 | |
| | |
| | Packaging – 1.1% | |
| Ball Corp. | |
| | 100,000 | | | | 4.000 | | | | 11/15/23 | | | | 97,625 | |
| | 775,000 | | | | 5.250 | | | | 07/01/25 | | | | 790,500 | |
| Reynolds Group Issuer, Inc.(a) | |
| | 1,100,000 | | | | 5.750 | | | | 10/15/20 | | | | 1,142,625 | |
| Sealed Air Corp.(a)(b) | |
| | 1,000,000 | | | | 5.125 | | | | 12/01/24 | | | | 1,030,000 | |
| | | | | | | | | | | | | | |
| | | | | | | | | | | | | 3,060,750 | |
| | |
| | Pipelines(a) – 2.1% | |
| Genesis Energy LP/Genesis Energy Finance Corp. | |
| | 283,000 | | | | 6.750 | | | | 08/01/22 | | | | 273,802 | |
| | 61,000 | | | | 6.000 | | | | 05/15/23 | | | | 55,510 | |
| | 500,000 | | | | 5.625 | | | | 06/15/24 | | | | 437,500 | |
| MarkWest Energy Partners LP/MarkWest Energy Finance Corp. | |
| | 500,000 | | | | 4.875 | | | | 12/01/24 | | | | 470,000 | |
| | 500,000 | | | | 4.875 | | | | 06/01/25 | | | | 470,000 | |
| ONEOK, Inc. | |
| | 285,000 | | | | 7.500 | | | | 09/01/23 | | | | 281,782 | |
| Regency Energy Partners LP/Regency Energy Finance Corp. | |
| | 1,000,000 | | | | 5.000 | | | | 10/01/22 | | | | 980,000 | |
| Rose Rock Midstream LP/Rose Rock Finance Corp. | |
| | 800,000 | | | | 5.625 | | | | 07/15/22 | | | | 688,000 | |
| Sabine Pass Liquefaction LLC | |
| | 800,000 | | | | 5.625 | | | | 02/01/21 | | | | 794,000 | |
| | 200,000 | | | | 5.625 | (b) | | | 03/01/25 | | | | 191,500 | |
| Summit Midstream Holdings LLC/Summit Midstream Finance
Corp. |
|
| | 702,000 | | | | 5.500 | | | | 08/15/22 | | | | 608,985 | |
| Targa Resources Partners LP/Targa Resources Partners Finance
Corp. |
|
| | 500,000 | | | | 5.250 | | | | 05/01/23 | | | | 466,250 | |
| | | | | | | | | | | | | | |
| | | | | | | | | | | | | 5,717,329 | |
| | |
| | Real Estate(a) – 0.5% | |
| Communications Sales & Leasing, Inc./CSL Capital LLC(b) | |
| | 300,000 | | | | 6.000 | | | | 04/15/23 | | | | 291,000 | |
| RHP Hotel Properties LP/RHP Finance Corp. | |
| | 940,000 | | | | 5.000 | | | | 04/15/23 | | | | 961,150 | |
| | | | | | | | | | | | | | |
| | | | | | | | | | | | | 1,252,150 | |
| | |
| | Retailers – 1.2% | |
| CVS Health Corp.(a)(b) | |
| | 600,000 | | | | 4.750 | | | | 12/01/22 | | | | 654,660 | |
| Dollar Tree, Inc.(a)(b) | |
| | 1,000,000 | | | | 5.750 | | | | 03/01/23 | | | | 1,050,000 | |
| GameStop Corp.(a)(b) | |
| | 600,000 | | | | 5.500 | | | | 10/01/19 | | | | 626,265 | |
| | |
| | Corporate Obligations – (continued) | |
| | Retailers – (continued) | |
| L Brands, Inc. | |
| $ | 680,000 | | | | 5.625 | % | | | 02/15/22 | | | $ | 741,200 | |
| | 295,000 | | | | 6.875 | (b) | | | 11/01/35 | | | | 306,063 | |
| | | | | | | | | | | | | | |
| | | | | | | | | | | | | 3,378,188 | |
| | |
| | Technology – Hardware – 0.9% | |
| CommScope, Inc.(a)(b) | |
| | 390,000 | | | | 5.500 | | | | 06/15/24 | | | | 387,562 | |
| NCR Corp.(a) | |
| | 800,000 | | | | 5.000 | | | | 07/15/22 | | | | 788,000 | |
| Sensata Technologies BV(b) | |
| | 1,200,000 | | | | 5.000 | | | | 10/01/25 | | | | 1,164,000 | |
| | | | | | | | | | | | | | |
| | | | | | | | | | | | | 2,339,562 | |
| | |
| | Technology – Software/Services(a) – 0.9% | |
| Audatex North America, Inc.(b) | |
| | 500,000 | | | | 6.125 | | | | 11/01/23 | | | | 503,125 | |
| Equinix, Inc. | |
| | 100,000 | | | | 5.375 | | | | 04/01/23 | | | | 104,000 | |
| | 800,000 | | | | 5.750 | | | | 01/01/25 | | | | 834,000 | |
| MSCI, Inc.(b) | |
| | 1,000,000 | | | | 5.250 | | | | 11/15/24 | | | | 1,050,000 | |
| | | | | | | | | | | | | | |
| | | | | | | | | | | | | 2,491,125 | |
| | |
| | Telecommunications – Cellular – 0.6% | |
| SoftBank Group Corp. | |
| | 600,000 | | | | 4.500 | (b) | | | 04/15/20 | | | | 595,500 | |
| | 400,000 | | | | 6.000 | (a) | | | 07/30/25 | | | | 409,000 | |
| T-Mobile USA, Inc.(a) | |
| | 500,000 | | | | 6.625 | | | | 04/01/23 | | | | 511,250 | |
| | 200,000 | | | | 6.375 | | | | 03/01/25 | | | | 200,250 | |
| | | | | | | | | | | | | | |
| | | | | | | | | | | | | 1,716,000 | |
| | |
| | Telecommunications – Satellites(a) – 0.2% | |
| Intelsat Jackson Holdings SA | |
| | 400,000 | | | | 7.500 | | | | 04/01/21 | | | | 362,000 | |
| | 100,000 | | | | 5.500 | | | | 08/01/23 | | | | 83,000 | |
| | | | | | | | | | | | | | |
| | | | | | | | | | | | | 445,000 | |
| | |
| | Transportation – 0.1% | |
| Air Medical Merger Sub Corp.(a)(b) | |
| | 140,000 | | | | 6.375 | | | | 05/15/23 | | | | 128,450 | |
| Pelabuhan Indonesia II PT | |
| | 200,000 | | | | 4.250 | | | | 05/05/25 | | | | 184,000 | |
| | | | | | | | | | | | | | |
| | | | | | | | | | | | | 312,450 | |
| | |
| | Utilities – Electric – 0.9% | |
| Eskom Holdings SOC Ltd. | |
| | 200,000 | | | | 6.750 | | | | 08/06/23 | | | | 185,950 | |
| | 200,000 | | | | 7.125 | | | | 02/11/25 | | | | 186,250 | |
| NRG Energy, Inc.(a) | |
| | 1,000,000 | | | | 6.250 | | | | 05/01/24 | | | | 895,000 | |
| Talen Energy Supply, LLC(a)(b) | |
| | 500,000 | | | | 5.125 | | | | 07/15/19 | | | | 458,750 | |
| WESCO Distribution, Inc.(a) | |
| | 800,000 | | | | 5.375 | | | | 12/15/21 | | | | 774,000 | |
| | | | | | | | | | | | | | |
| | | | | | | | | | | | | 2,499,950 | |
| | |
| | |
| The accompanying notes are an integral part of these financial statements. | | 35 |
GOLDMAN SACHS MULTI-MANAGER NON-CORE FIXED INCOME FUND
Schedule of Investments (continued)
October 31, 2015
| | | | | | | | | | | | | | |
Principal Amount | | | Interest
Rate | | | Maturity
Date | | | Value | |
| | Corporate Obligations – (continued) | |
| | Wireless Telecommunications – 1.6% | |
| Altice Financing SA(a)(b) | |
| $ | 600,000 | | | | 6.500 | % | | | 01/15/22 | | | $ | 607,500 | |
| Altice Luxembourg SA(a)(b) | |
| | 174,000 | | | | 7.750 | | | | 05/15/22 | | | | 167,475 | |
| Digicel Group Ltd.(a)(b) | |
| | 600,000 | | | | 8.250 | | | | 09/30/20 | | | | 531,000 | |
| Digicel Ltd.(a)(b) | |
| | 200,000 | | | | 6.000 | | | | 04/15/21 | | | | 180,000 | |
| DigitalGlobe, Inc.(a)(b) | |
| | 1,000,000 | | | | 5.250 | | | | 02/01/21 | | | | 897,500 | |
| Hughes Satellite Systems Corp. | |
| | 185,000 | | | | 7.625 | | | | 06/15/21 | | | | 202,112 | |
| Inmarsat Finance PLC(a)(b) | |
| | 800,000 | | | | 4.875 | | | | 05/15/22 | | | | 794,000 | |
| Sprint Corp. | |
| | 800,000 | | | | 7.875 | | | | 09/15/23 | | | | 740,000 | |
| | 100,000 | | | | 7.625 | (a) | | | 02/15/25 | | | | 88,250 | |
| Wind Acquisition Finance SA(a)(b) | |
| | 240,000 | | | | 4.750 | | | | 07/15/20 | | | | 244,200 | |
| | | | | | | | | | | | | | |
| | | | | | | | | | | | | 4,452,037 | |
| | |
| | Wirelines Telecommunications – 1.0% | |
| Anixter, Inc. | |
| | 1,000,000 | | | | 5.125 | % | | | 10/01/21 | | | | 1,025,000 | |
| CenturyLink, Inc. | |
| | 383,000 | | | | 5.625 | | | | 04/01/20 | | | | 383,928 | |
| | 399,000 | | | | 5.625 | (a) | | | 04/01/25 | | | | 361,849 | |
| Level 3 Financing, Inc.(a)(b) | |
| | 100,000 | | | | 5.375 | | | | 05/01/25 | | | | 100,250 | |
| West Corp.(a)(b) | |
| | 800,000 | | | | 5.375 | | | | 07/15/22 | | | | 762,000 | |
| | | | | | | | | | | | | | |
| | | | | | | | | | | | | 2,633,027 | |
| | |
| | TOTAL CORPORATE OBLIGATIONS | |
| | (Cost $80,963,127) | | | $ | 79,214,702 | |
| | |
| | | | | | | | | | | | | | |
| | Foreign Debt Obligations – 34.1% | |
| | Sovereign – 34.1% | |
| Banco Nacional de Desenvolvimento Economico e Social | |
| $ | 100,000 | | | | 6.500 | % | | | 06/10/19 | | | $ | 100,000 | |
| Brazil Letras do Tesouro Nacional(c) | |
| | 2,750,000 | | | | 0.000 | | | | 01/01/17 | | | | 603,077 | |
| | 5,900,000 | | | | 0.000 | | | | 01/01/19 | | | | 959,254 | |
| Brazil Notas do Tesouro Nacional | |
| | 11,000,000 | | | | 10.000 | | | | 01/01/18 | | | | 2,575,736 | |
| | 12,300,000 | | | | 10.000 | | | | 01/01/21 | | | | 2,577,906 | |
| | 3,200,000 | | | | 10.000 | | | | 01/01/25 | | | | 607,681 | |
| | 625,055 | | | | 6.000 | | | | 08/15/50 | | | | 138,759 | |
| Dominican Republic | |
| | 100,000 | | | | 7.500 | | | | 05/06/21 | | | | 109,125 | |
| | 375,000 | | | | 5.875 | | | | 04/18/24 | | | | 380,625 | |
| | 455,000 | | | | 5.500 | | | | 01/27/25 | | | | 449,312 | |
| | 535,000 | | | | 6.850 | | | | 01/27/45 | | | | 529,650 | |
| | |
| | Foreign Debt Obligations – (continued) | |
| | Sovereign – (continued) | |
| Ecuador Government International Bond | |
| $ | 650,000 | | | | 10.500 | % | | | 03/24/20 | | | $ | 537,062 | |
| | 350,000 | | | | 7.950 | | | | 06/20/24 | | | | 264,250 | |
| El Salvador Government International Bond | |
| | 60,000 | | | | 7.375 | | | | 12/01/19 | | | | 61,200 | |
| | 244,000 | | | | 5.875 | | | | 01/30/25 | | | | 215,940 | |
| | 205,000 | | | | 6.375 | | | | 01/18/27 | | | | 182,706 | |
| Federal Republic of Brazil | |
| | 175,000 | | | | 4.875 | | | | 01/22/21 | | | | 172,156 | |
| | 360,000 | | | | 2.625 | | | | 01/05/23 | | | | 297,450 | |
| | 608,000 | | | | 4.250 | | | | 01/07/25 | | | | 540,208 | |
| | 85,000 | | | | 8.250 | | | | 01/20/34 | | | | 90,950 | |
| | 245,000 | | | | 5.000 | | | | 01/27/45 | | | | 185,894 | |
| Government of Belize(d) | |
| | 125,000 | | | | 5.000 | | | | 02/20/38 | | | | 91,563 | |
| Government of Jamaica | |
| | 65,000 | | | | 8.000 | | | | 06/24/19 | | | | 70,931 | |
| | 315,000 | | | | 6.750 | | | | 04/28/28 | | | | 318,937 | |
| | 200,000 | | | | 7.875 | | | | 07/28/45 | | | | 201,750 | |
| Hungary Government Bond | |
| | 50,130,000 | | | | 2.500 | | | | 06/22/18 | | | | 180,220 | |
| | 88,320,000 | | | | 6.500 | | | | 06/24/19 | | | | 358,003 | |
| | 84,520,000 | | | | 7.000 | | | | 06/24/22 | | | | 368,326 | |
| | 120,000 | | | | 5.375 | | | | 02/21/23 | | | | 131,992 | |
| | 550,000 | | | | 5.750 | | | | 11/22/23 | | | | 619,913 | |
| | 395,000 | | | | 5.375 | | | | 03/25/24 | | | | 436,335 | |
| | 104,500,000 | | | | 3.000 | | | | 06/26/24 | | | | 357,697 | |
| | 525,290,000 | | | | 5.500 | | | | 06/24/25 | | | | 2,174,354 | |
| | 40,000 | | | | 7.625 | | | | 03/29/41 | | | | 54,552 | |
| Indonesia Treasury Bond | |
| | 9,790,000,000 | | | | 7.875 | | | | 04/15/19 | | | | 695,796 | |
| | 42,859,000,000 | | | | 8.375 | | | | 03/15/24 | | | | 3,046,316 | |
| | 9,415,000,000 | | | | 8.375 | | | | 09/15/26 | | | | 664,659 | |
| | 12,101,000,000 | | | | 9.000 | | | | 03/15/29 | | | | 874,742 | |
| | 15,800,000,000 | | | | 8.750 | | | | 05/15/31 | | | | 1,121,292 | |
| | 1,430,000,000 | | | | 8.375 | | | | 03/15/34 | | | | 97,154 | |
| Islamic Republic of Pakistan | |
| | 125,000 | | | | 6.875 | | | | 06/01/17 | | | | 129,219 | |
| | 200,000 | | | | 7.250 | | | | 04/15/19 | | | | 207,477 | |
| | 75,000 | | | | 8.250 | (b) | | | 04/15/24 | | | | 79,907 | |
| | 200,000 | | | | 8.250 | (b) | | | 09/30/25 | | | | 212,875 | |
| Ivory Coast Government International Bond | |
| | 600,000 | | | | 6.375 | | | | 03/03/28 | | | | 552,000 | |
| Malaysia Government Bond | |
| | 1,045,000 | | | | 4.262 | | | | 09/15/16 | | | | 246,047 | |
| | 365,000 | | | | 4.012 | | | | 09/15/17 | | | | 86,484 | |
| | 365,000 | | | | 3.795 | | | | 09/30/22 | | | | 83,391 | |
| | 700,000 | | | | 3.955 | | | | 09/15/25 | | | | 160,460 | |
| Malaysia Sovereign Sukuk Bhd | |
| | 300,000 | | | | 3.043 | | | | 04/22/25 | | | | 288,750 | |
| Morocco Government Bond | |
| | 600,000 | | | | 4.250 | | | | 12/11/22 | | | | 605,700 | |
| Perusahaan Penerbit SBSN | |
| | 160,000 | | | | 4.325 | | | | 05/28/25 | | | | 155,100 | |
| Philippine Government Bond | |
| | PHP 5,000,000 | | | | 3.625 | | | | 09/09/25 | | | | 105,879 | |
| | |
| | |
| 36 | | The accompanying notes are an integral part of these financial statements. |
GOLDMAN SACHS MULTI-MANAGER NON-CORE FIXED INCOME FUND
| | | | | | | | | | | | | | |
Principal Amount | | | Interest
Rate | | | Maturity
Date | | | Value | |
| | Foreign Debt Obligations – (continued) | |
| | Sovereign – (continued) | |
| Poland Government Bond | |
| $ | 1,875,000 | | | | 4.750 | % | | | 10/25/16 | | | $ | 500,154 | |
| | 1,770,000 | | | | 5.500 | | | | 10/25/19 | | | | 520,765 | |
| | 135,000 | | | | 5.125 | | | | 04/21/21 | | | | 152,748 | |
| | 2,175,000 | | | | 5.750 | | | | 09/23/22 | | | | 681,545 | |
| | 364,000 | | | | 3.000 | | | | 03/17/23 | | | | 366,876 | |
| | 3,260,000 | | | | 4.000 | | | | 10/25/23 | | | | 930,425 | |
| | 660,000 | | | | 4.000 | | | | 01/22/24 | | | | 701,224 | |
| | 5,015,000 | | | | 3.250 | | | | 07/25/25 | | | | 1,360,455 | |
| Republic of Argentina | |
| | 622,441 | | | | 7.000 | | | | 04/17/17 | | | | 617,392 | |
| | 140,000 | | | | 8.750 | (e) | | | 06/02/17 | | | | 152,950 | |
| | 176,405 | | | | 8.750 | | | | 05/07/24 | | | | 178,840 | |
| | 601,474 | | | | 8.280 | (e) | | | 12/31/33 | | | | 667,636 | |
| | 415,000 | | | | 2.500 | (e) | | | 12/31/38 | | | | 261,450 | |
| Republic of Azerbaijan | |
| | 400,000 | | | | 4.750 | | | | 03/18/24 | | | | 382,500 | |
| Republic of Chile | |
| CLP | 15,000,000 | | | | 5.500 | | | | 08/05/20 | | | | 22,467 | |
| Republic of Colombia | |
| $ | 865,300,000 | | | | 7.250 | | | | 06/15/16 | | | | 301,786 | |
| | 250,000 | | | | 2.625 | | | | 03/15/23 | | | | 225,750 | |
| | 3,957,600,000 | | | | 10.000 | | | | 07/24/24 | | | | 1,551,838 | |
| | 1,290,800,000 | | | | 7.500 | | | | 08/26/26 | | | | 428,713 | |
| | 4,402,000,000 | | | | 6.000 | | | | 04/28/28 | | | | 1,246,950 | |
| | 245,000 | | | | 5.000 | | | | 06/15/45 | | | | 217,437 | |
| Republic of Costa Rica | |
| | 100,000 | | | | 4.375 | | | | 04/30/25 | | | | 86,250 | |
| | 90,000 | | | | 7.000 | | | | 04/04/44 | | | | 80,888 | |
| | 200,000 | | | | 7.158 | | | | 03/12/45 | | | | 181,250 | |
| Republic of Croatia | |
| | 135,000 | | | | 6.750 | | | | 11/05/19 | | | | 146,644 | |
| | 515,000 | | | | 6.750 | | | | 11/05/19 | | | | 559,419 | |
| | 650,000 | | | | 5.500 | | | | 04/04/23 | | | | 669,500 | |
| | 530,000 | | | | 6.000 | | | | 01/26/24 | | | | 561,800 | |
| Republic of Egypt | |
| | 250,000 | | | | 5.875 | | | | 06/11/25 | | | | 233,000 | |
| Republic of Gabon | |
| | 200,000 | | | | 6.375 | | | | 12/12/24 | | | | 172,250 | |
| Republic of Georgia | |
| | 215,000 | | | | 6.875 | | | | 04/12/21 | | | | 228,384 | |
| Republic of Ghana | |
| | 280,000 | | | | 7.875 | | | | 08/07/23 | | | | 240,800 | |
| | 455,000 | | | | 10.750 | (b) | | | 10/14/30 | | | | 480,025 | |
| Republic of Guatemala | |
| | 20,000 | | | | 5.750 | | | | 06/06/22 | | | | 21,200 | |
| | 30,000 | | | | 4.875 | | | | 02/13/28 | | | | 29,138 | |
| Republic of Indonesia | |
| | 115,000 | | | | 5.875 | | | | 03/13/20 | | | | 127,363 | |
| | 190,000 | | | | 4.125 | | | | 01/15/25 | | | | 185,250 | |
| | 100,000 | | | | 6.625 | | | | 02/17/37 | | | | 109,750 | |
| | 175,000 | | | | 7.750 | | | | 01/17/38 | | | | 216,125 | |
| | 180,000 | | | | 5.125 | | | | 01/15/45 | | | | 168,300 | |
| Republic of Ivory Coast(d) | |
| | 860,000 | | | | 5.750 | | | | 12/31/32 | | | | 767,550 | |
| | |
| | Foreign Debt Obligations – (continued) | |
| | Sovereign – (continued) | |
| Republic of Kazakhstan | |
| $ | 200,000 | | | | 5.125 | % | | | 07/21/25 | | | $ | 199,000 | |
| | 200,000 | | | | 4.875 | | | | 10/14/44 | | | | 164,250 | |
| | 500,000 | | | | 6.500 | | | | 07/21/45 | | | | 487,500 | |
| Republic of Kenya | |
| | 405,000 | | | | 6.875 | | | | 06/24/24 | | | | 376,144 | |
| Republic of Lithuania | |
| | 200,000 | | | | 7.375 | | | | 02/11/20 | | | | 240,089 | |
| Republic of Malaysia | |
| | 2,890,000 | | | | 3.654 | | | | 10/31/19 | | | | 669,624 | |
| | 9,824,000 | | | | 4.181 | | | | 07/15/24 | | | | 2,279,409 | |
| Republic of Mozambique | |
| | 182,000 | | | | 6.305 | | | | 09/11/20 | | | | 161,525 | |
| Republic of Namibia(b) | |
| | 40,000 | | | | 5.250 | | | | 10/29/25 | | | | 39,500 | |
| Republic of Nigeria | |
| | 200,000 | | | | 6.750 | | | | 01/28/21 | | | | 197,250 | |
| Republic of Panama | |
| | 350,000 | | | | 4.000 | | | | 09/22/24 | | | | 354,375 | |
| | 280,000 | | | | 6.700 | | | | 01/26/36 | | | | 344,400 | |
| Republic of Paraguay | |
| | 380,000 | | | | 4.625 | | | | 01/25/23 | | | | 383,800 | |
| | 265,000 | | | | 6.100 | | | | 08/11/44 | | | | 268,975 | |
| Republic of Peru | |
| | 150,000 | | | | 7.840 | | | | 08/12/20 | | | | 49,149 | |
| | 1,500,000 | | | | 5.700 | | | | 08/12/24 | | | | 425,097 | |
| | 250,000 | | | | 6.950 | | | | 08/12/31 | | | | 73,087 | |
| | 790,000 | | | | 6.900 | | | | 08/12/37 | | | | 225,418 | |
| Republic of Poland | |
| | 32,000 | | | | 5.000 | | | | 03/23/22 | | | | 36,002 | |
| Republic of Romania | |
| | 800,000 | | | | 5.850 | | | | 04/26/23 | | | | 232,122 | |
| | 410,000 | | | | 4.375 | | | | 08/22/23 | | | | 431,012 | |
| | 210,000 | | | | 2.750 | (b) | | | 10/29/25 | | | | 233,120 | |
| | 135,000 | | | | 3.875 | (b) | | | 10/29/35 | | | | 150,754 | |
| | 514,000 | | | | 6.125 | | | | 01/22/44 | | | | 608,062 | |
| Republic of Serbia | |
| | 200,000 | | | | 5.875 | | | | 12/03/18 | | | | 212,000 | |
| Republic of Slovenia | |
| | 470,000 | | | | 5.850 | | | | 05/10/23 | | | | 540,996 | |
| | 1,195,000 | | | | 5.250 | | | | 02/18/24 | | | | 1,345,600 | |
| Republic of South Africa | |
| | 6,465,000 | | | | 8.250 | | | | 09/15/17 | | | | 476,839 | |
| | 26,530,486 | | | | 6.750 | | | | 03/31/21 | | | | 1,824,039 | |
| | 125,000 | | | | 4.665 | | | | 01/17/24 | | | | 126,063 | |
| | 37,185,000 | | | | 10.500 | | | | 12/21/26 | | | | 3,103,205 | |
| | 7,916,667 | | | | 8.000 | | | | 01/31/30 | | | | 537,550 | |
| | 7,664,643 | | | | 7.000 | | | | 02/28/31 | | | | 470,636 | |
| | 950,000 | | | | 8.250 | | | | 03/31/32 | | | | 65,112 | |
| | 3,200,000 | | | | 6.250 | | | | 03/31/36 | | | | 173,237 | |
| | 6,450,000 | | | | 6.500 | | | | 02/28/41 | | | | 349,814 | |
| | 35,000 | | | | 6.250 | | | | 03/08/41 | | | | 38,826 | |
| | 210,000 | | | | 5.375 | | | | 07/24/44 | | | | 205,800 | |
| Republic of Sri Lanka | |
| | 400,000 | | | | 5.875 | | | | 07/25/22 | | | | 383,500 | |
| | 445,000 | | | | 6.850 | (b) | | | 11/03/25 | | | | 439,994 | |
| | |
| | |
| The accompanying notes are an integral part of these financial statements. | | 37 |
GOLDMAN SACHS MULTI-MANAGER NON-CORE FIXED INCOME FUND
Schedule of Investments (continued)
October 31, 2015
| | | | | | | | | | | | | | |
Principal Amount | | | Interest
Rate | | | Maturity
Date | | | Value | |
| | Foreign Debt Obligations – (continued) | |
| | Sovereign – (continued) | |
| Republic of Turkey | |
| $ | 2,190,000 | | | | 9.000 | % | | | 01/27/16 | | | $ | 748,651 | |
| | 1,910,000 | | | | 6.300 | | | | 02/14/18 | | | | 607,120 | |
| | 6,000,000 | | | | 8.500 | | | | 07/10/19 | | | | 1,973,040 | |
| | 966,350 | | | | 9.400 | | | | 07/08/20 | | | | 326,446 | |
| | 220,000 | | | | 7.375 | | | | 02/05/25 | | | | 262,790 | |
| | 6,120,000 | | | | 8.000 | | | | 03/12/25 | | | | 1,898,094 | |
| | 500,000 | | | | 4.250 | | | | 04/14/26 | | | | 479,000 | |
| Republic of Uruguay | |
| | 519,513 | | | | 4.375 | | | | 10/27/27 | | | | 514,967 | |
| | 120,000 | | | | 5.100 | | | | 06/18/50 | | | | 107,850 | |
| Republic of Venezuela | |
| | 670,000 | | | | 8.250 | | | | 10/13/24 | | | | 254,600 | |
| | 160,000 | | | | 11.750 | | | | 10/21/26 | | | | 70,800 | |
| | 125,000 | | | | 7.000 | | | | 03/31/38 | | | | 46,563 | |
| Republic of Zambia | |
| | 200,000 | | | | 8.970 | | | | 07/30/27 | | | | 168,000 | |
| Romania Government Bond | |
| | 1,000,000 | | | | 5.950 | | | | 06/11/21 | | | | 288,940 | |
| | 500,000 | | | | 4.750 | | | | 02/24/25 | | | | 136,427 | |
| Russian Federation | |
| | 6,800,000 | | | | 6.900 | | | | 08/03/16 | | | | 103,944 | |
| | 18,325,000 | | | | 7.500 | | | | 02/27/19 | | | | 267,597 | |
| | 40,000,000 | | | | 6.800 | | | | 12/11/19 | | | | 561,476 | |
| | 39,550,000 | | | | 7.600 | | | | 07/20/22 | | | | 550,308 | |
| | 53,080,000 | | | | 7.000 | | | | 01/25/23 | | | | 708,667 | |
| | 400,000 | | | | 4.875 | | | | 09/16/23 | | | | 412,800 | |
| | 59,990,000 | | | | 8.150 | | | | 02/03/27 | | | | 834,405 | |
| | 130,900 | | | | 7.500 | (d) | | | 03/31/30 | | | | 155,836 | |
| | 600,000 | | | | 5.625 | | | | 04/04/42 | | | | 594,750 | |
| Senegal Government Bond | |
| | 200,000 | | | | 6.250 | | | | 07/30/24 | | | | 185,789 | |
| Socialist Republic of Vietnam | |
| | 25,000 | | | | 6.750 | | | | 01/29/20 | | | | 27,750 | |
| | 30,000 | | | | 4.800 | | | | 11/19/24 | | | | 29,475 | |
| Thailand Government Bond | |
| | 29,790,000 | | | | 3.250 | | | | 06/16/17 | | | | 860,857 | |
| | 3,940,000 | | | | 3.875 | | | | 06/13/19 | | | | 118,325 | |
| | 6,350,000 | | | | 3.650 | | | | 12/17/21 | | | | 190,315 | |
| | 6,000,000 | | | | 3.625 | | | | 06/16/23 | | | | 179,840 | |
| | 89,630,000 | | | | 3.850 | | | | 12/12/25 | | | | 2,776,819 | |
| | 4,000,000 | | | | 4.875 | | | | 06/22/29 | | | | 136,934 | |
| Ukraine Government Bond | |
| | 570,000 | | | | 6.580 | | | | 11/21/16 | | | | 444,600 | |
| | 200,000 | | | | 9.250 | | | | 07/24/17 | | | | 156,750 | |
| | 320,000 | | | | 6.750 | | | | 11/14/17 | | | | 249,600 | |
| United Mexican States | |
| | 20,000,000 | | | | 6.250 | | | | 06/16/16 | | | | 1,231,825 | |
| | 30,000,000 | | | | 8.500 | | | | 12/13/18 | | | | 2,014,954 | |
| | 18,902,000 | | | | 5.000 | | | | 12/11/19 | | | | 1,140,645 | |
| | 16,950,000 | | | | 6.500 | | | | 06/10/21 | | | | 1,078,695 | |
| | 580,000 | | | | 4.000 | | | | 10/02/23 | | | | 598,850 | |
| | 20,750,000 | | | | 8.000 | | | | 12/07/23 | | | | 1,425,672 | |
| | 3,500,000 | | | | 10.000 | | | | 12/05/24 | | | | 271,242 | |
| | 29,033,000 | | | | 10.000 | | | | 12/05/24 | | | | 2,249,988 | |
| | 4,250,000 | | | | 7.500 | | | | 06/03/27 | | | | 282,724 | |
| | |
| | Foreign Debt Obligations – (continued) | |
| | Sovereign – (continued) | |
| United Mexican States – (continued) | |
| $ | 7,500,000 | | | | 8.500 | % | | | 05/31/29 | | | $ | 540,113 | |
| | 12,700,000 | | | | 7.750 | | | | 05/29/31 | | | | 862,039 | |
| | 5,420,000 | | | | 10.000 | | | | 11/20/36 | | | | 450,855 | |
| | 160,000 | | | | 6.050 | | | | 01/11/40 | | | | 180,800 | |
| | 220,000 | | | | 5.550 | | | | 01/21/45 | | | | 233,200 | |
| | 400,000 | | | | 4.600 | | | | 01/23/46 | | | | 371,000 | |
| | |
| | TOTAL FOREIGN DEBT OBLIGATIONS | |
| | (Cost $95,141,711) | | | $ | 92,377,151 | |
| | |
| | | | | | | | | | | | | | |
| | U.S. Treasury Obligation – 0.1% | |
| United States Treasury Note | |
| $ | 300,000 | | | | 0.625 | % | | | 06/30/17 | | | $ | 299,856 | |
| | (Cost $299,698) | | | | | |
| | |
| | |
| | Senior Term Loans(f) – 22.7% | |
| | Aerospace & Defense – 0.2% | |
| BE Aerospace, Inc. | |
| $ | 235,133 | | | | 4.000 | % | | | 12/16/21 | | | $ | 236,210 | |
| Transdigm, Inc. | |
| | 248,741 | | | | 3.750 | | | | 06/04/21 | | | | 245,010 | |
| | | | | | | | | | | | | | |
| | | | | | | | | | | | | 481,220 | |
| | |
| | Airlines – 1.0% | |
| American Airlines, Inc. | |
| | 1,000,000 | | | | 3.250 | | | | 06/26/20 | | | | 990,210 | |
| CEVA Group PLC | |
| | 54,585 | | | | 6.500 | | | | 03/19/21 | | | | 47,830 | |
| Delta Air Lines, Inc. | |
| | 500,000 | | | | 4.750 | | | | 07/30/21 | | | | 489,790 | |
| US Airways Group, Inc. | |
| | 1,247,475 | | | | 3.500 | | | | 05/23/19 | | | | 1,243,918 | |
| | | | | | | | | | | | | | |
| | | | | | | | | | | | | 2,771,748 | |
| | |
| | Automotive – Parts – 1.3% | |
| Allison Transmission, Inc. | |
| | 248,734 | | | | 3.500 | | | | 08/23/19 | | | | 248,811 | |
| Capital Automotive LP | |
| | 248,658 | | | | 4.000 | | | | 04/10/19 | | | | 248,907 | |
| Chrysler Group LLC | |
| | 1,743,687 | | | | 3.250 | | | | 12/31/18 | | | | 1,737,148 | |
| Evergreen Skills Lux S.a.r.l. | |
| | 522,702 | | | | 5.750 | | | | 04/28/21 | | | | 441,683 | |
| Gates Global LLC | |
| | 248,117 | | | | 4.250 | | | | 07/05/21 | | | | 232,471 | |
| Jaguar Holding Company II | |
| | 749,375 | | | | 4.250 | | | | 08/18/22 | | | | 737,730 | |
| | | | | | | | | | | | | | |
| | | | | | | | | | | | | 3,646,750 | |
| | |
| | Building Materials – 0.7% | |
| American Builders & Contractors Supply Co., Inc. | |
| | 498,728 | | | | 3.500 | | | | 04/16/20 | | | | 495,302 | |
| | |
| | |
| 38 | | The accompanying notes are an integral part of these financial statements. |
GOLDMAN SACHS MULTI-MANAGER NON-CORE FIXED INCOME FUND
| | | | | | | | | | | | | | |
Principal Amount | | | Interest
Rate | | | Maturity
Date | | | Value | |
| | Senior Term Loans(f) – (continued) | |
| | Building Materials – (continued) | |
| Jeld-Wen, Inc. | |
| $ | 1,000,000 | | | | 5.000 | % | | | 06/18/22 | | | $ | 1,000,630 | |
| Wilsonart LLC | |
| | 312,016 | | | | 4.000 | | | | 10/31/19 | | | | 309,482 | |
| | | | | | | | | | | | | | |
| | | | | | | | | | | | | 1,805,414 | |
| | |
| | Chemicals – 0.5% | |
| Ineos US Finance LLC | |
| | 412,804 | | | | 3.750 | | | | 05/04/18 | | | | 407,301 | |
| | 248,749 | | | | 4.250 | | | | 03/31/22 | | | | 245,018 | |
| MacDermid, Inc. | |
| | 596,992 | | | | 4.750 | | | | 06/07/20 | | | | 576,098 | |
| | | | | | | | | | | | | | |
| | | | | | | | | | | | | 1,228,417 | |
| | |
| | Consumer Cyclical Services – 0.8% | |
| First Data Corp. | |
| | 300,000 | | | | 3.700 | | | | 03/24/17 | | | | 299,202 | |
| | 1,800,000 | | | | 3.700 | | | | 03/24/18 | | | | 1,785,222 | |
| | | | | | | | | | | | | | |
| | | | | | | | | | | | | 2,084,424 | |
| | |
| | Consumer Products – Household & Leisure – 0.1% | |
| B&G Foods, Inc. | |
| | 152,000 | | | | 3.750 | | | | 10/07/22 | | | | 151,953 | |
| Revlon Consumer Products Corp. | |
| | 248,734 | | | | 4.000 | | | | 10/08/19 | | | | 248,423 | |
| | | | | | | | | | | | | | |
| | | | | | | | | | | | | 400,376 | |
| | |
| | Diversified Manufacturing – 0.1% | |
| Rexnord LLC | |
| | 248,731 | | | | 4.000 | | | | 08/21/20 | | | | 245,570 | |
| | |
| | Energy – 0.3% | |
| CJ Holding Co. | |
| | 497,500 | | | | 6.500 | | | | 03/23/20 | | | | 321,718 | |
| Seadrill Partners Finco LLC | |
| | 548,734 | | | | 4.000 | | | | 02/21/21 | | | | 318,782 | |
| Templar Energy LLC | |
| | 326,333 | | | | 8.500 | | | | 11/25/20 | | | | 138,962 | |
| | | | | | | | | | | | | | |
| | | | | | | | | | | | | 779,462 | |
| | |
| | Energy – Exploration & Production – 0.0% | |
| Murray Energy Corp. | |
| | 99,750 | | | | 7.500 | | | | 04/16/20 | | | | 64,463 | |
| | |
| | Entertainment – 0.5% | |
| Sabre, Inc. | |
| | 497,452 | | | | 4.000 | | | | 02/19/19 | | | | 496,920 | |
| Zuffa LLC | |
| | 994,888 | | | | 3.750 | | | | 02/25/20 | | | | 979,965 | |
| | | | | | | | | | | | | | |
| | | | | | | | | | | | | 1,476,885 | |
| | |
| | Environmental – 0.1% | |
| Tervita Corp. | |
| | 246,918 | | | | 6.250 | | | | 05/15/18 | | | | 191,438 | |
| | |
| | Finance Insurance – 0.3% | |
| Hub International Ltd. | |
| | 746,212 | | | | 4.000 | | | | 10/02/20 | | | | 725,848 | |
| | |
| | Senior Term Loans(f) – (continued) | |
| | Financial Services – 0.4% | |
| AlixPartners LLP | |
| $ | 500,000 | | | | 4.500 | % | | | 07/28/22 | | | $ | 499,480 | |
| Sophia LP | |
| | 500,000 | | | | 4.750 | | | | 09/30/22 | | | | 498,905 | |
| | | | | | | | | | | | | | |
| | | | | | | | | | | | | 998,385 | |
| | |
| | Food & Drug Retailers – 0.1% | |
| Rite Aid Corp. | |
| | 250,000 | | | | 5.750 | | | | 08/21/20 | | | | 250,207 | |
| | |
| | Gaming – 0.4% | |
| Boyd Gaming Corp. | |
| | 217,874 | | | | 4.000 | | | | 08/14/20 | | | | 217,952 | |
| MGM Resorts International | |
| | 248,721 | | | | 3.500 | | | | 12/20/19 | | | | 248,204 | |
| Scientific Games International, Inc. | |
| | 731,987 | | | | 6.000 | | | | 10/01/21 | | | | 714,149 | |
| | | | | | | | | | | | | | |
| | | | | | | | | | | | | 1,180,305 | |
| | |
| | Health Care – Medical Products – 0.6% | |
| Carestream Health, Inc. | |
| | 243,151 | | | | 5.000 | | | | 06/07/19 | | | | 230,587 | |
| | 250,000 | | | | 9.500 | | | | 12/07/19 | | | | 231,563 | |
| Kinetic Concepts, Inc. | |
| | 248,734 | | | | 4.000 | | | | 11/04/16 | | | | 248,528 | |
| | 996,831 | | | | 4.500 | | | | 05/04/18 | | | | 995,943 | |
| | | | | | | | | | | | | | |
| | | | | | | | | | | | | 1,706,621 | |
| | |
| | Health Care – Services – 1.0% | |
| Air Medical Group Holdings, Inc. | |
| | 806,728 | | | | 4.500 | | | | 04/28/22 | | | | 791,941 | |
| Community Health Systems, Inc. | |
| | 498,747 | | | | 3.580 | | | | 12/31/18 | | | | 496,044 | |
| | 1,000,000 | | | | 4.000 | | | | 01/27/21 | | | | 996,670 | |
| Iasis Healthcare LLC | |
| | 248,721 | | | | 4.500 | | | | 05/03/18 | | | | 248,980 | |
| Millennium Laboratories, Inc. | |
| | 485,147 | | | | 5.250 | | | | 04/16/21 | | | | 171,014 | |
| | | | | | | | | | | | | | |
| | | | | | | | | | | | | 2,704,649 | |
| | |
| | Home Construction – 0.1% | |
| The ServiceMaster Co. | |
| | 248,744 | | | | 4.250 | | | | 07/01/21 | | | | 248,550 | |
| | |
| | Media – Broadcasting & Radio – 0.9% | |
| Cumulus Media Holdings, Inc. | |
| | 590,000 | | | | 4.250 | | | | 12/23/20 | | | | 500,397 | |
| iHeart Communications, Inc. | |
| | 1,000,000 | | | | 6.940 | | | | 01/30/19 | | | | 835,940 | |
| | 250,000 | | | | 7.690 | | | | 07/30/19 | | | | 210,357 | |
| Tribune Media Co. | |
| | 997,500 | | | | 3.750 | | | | 12/27/20 | | | | 994,388 | |
| | | | | | | | | | | | | | |
| | | | | | | | | | | | | 2,541,082 | |
| | |
| | Media – Cable – 2.0% | |
| Cequel Communications LLC | |
| | 994,720 | | | | 3.750 | | | | 12/14/22 | | | | 975,134 | |
| | |
| | |
| The accompanying notes are an integral part of these financial statements. | | 39 |
GOLDMAN SACHS MULTI-MANAGER NON-CORE FIXED INCOME FUND
Schedule of Investments (continued)
October 31, 2015
| | | | | | | | | | | | | | |
Principal Amount | | | Interest
Rate | | | Maturity
Date | | | Value | |
| | Senior Term Loans(f) – (continued) | |
| | Media – Cable – (continued) | |
| Charter Communications Operating LLC | |
| $ | 1,000,000 | | | | 3.500 | % | | | 01/24/23 | | | $ | 998,590 | |
| Communications Sales & Leasing, Inc. | |
| | 997,500 | | | | 5.000 | | | | 10/24/22 | | | | 940,144 | |
| Numericable U.S. LLC | |
| | 497,494 | | | | 4.500 | | | | 05/21/20 | | | | 490,594 | |
| UPC Financing Partnership | |
| | 250,000 | | | | 3.250 | | | | 06/30/21 | | | | 245,625 | |
| WideOpenWest Finance LLC | |
| | 399,146 | | | | 4.500 | | | | 04/01/19 | | | | 391,993 | |
| Ziggo N.V. | |
| | 416,809 | | | | 3.250 | | | | 01/15/22 | | | | 410,152 | |
| | 1,033,191 | | | | 3.500 | | | | 01/15/22 | | | | 1,016,691 | |
| | | | | | | | | | | | | | |
| | | | | | | | | | | | | 5,468,923 | |
| | |
| | Media – Non Cable – 0.7% | |
| Advantage Sales & Marketing, Inc. | |
| | 612,293 | | | | 4.250 | | | | 07/23/21 | | | | 598,186 | |
| | 250,000 | | | | 7.500 | | | | 07/25/22 | | | | 229,845 | |
| Cengage Learning Acquisitions, Inc. | |
| | 750,000 | | | | 7.000 | | | | 03/31/20 | | | | 744,563 | |
| Interactive Data Corp. | |
| | 248,741 | | | | 4.750 | | | | 05/02/21 | | | | 248,636 | |
| | | | | | | | | | | | | | |
| | | | | | | | | | | | | 1,821,230 | |
| | |
| | Packaging – 0.5% | |
| Ardagh Holdings USA, Inc. | |
| | 241,523 | | | | 4.000 | | | | 12/17/19 | | | | 241,071 | |
| Berry Plastics Holding Corp. | |
| | 500,000 | | | | 4.000 | | | | 10/01/22 | | | | 500,695 | |
| Klockner-Pentaplast of America, Inc. | |
| | 707,453 | | | | 5.000 | | | | 04/28/20 | | | | 708,337 | |
| | | | | | | | | | | | | | |
| | | | | | | | | | | | | 1,450,103 | |
| | |
| | Pharmaceutical – 0.6% | |
| Catalent Pharma Solutions, Inc. | |
| | 248,741 | | | | 4.250 | | | | 05/20/21 | | | | 248,089 | |
| DPx Holdings B.V. | |
| | 248,741 | | | | 4.250 | | | | 03/11/21 | | | | 243,455 | |
| PRA Holdings, Inc. | |
| | 241,247 | | | | 4.500 | | | | 09/23/20 | | | | 240,894 | |
| Valeant Pharmaceuticals International, Inc. | |
| | 1,034,995 | | | | 4.000 | | | | 04/01/22 | | | | 960,735 | |
| | | | | | | | | | | | | | |
| | | | | | | | | | | | | 1,693,173 | |
| | |
| | Property/Casualty Insurance – 0.4% | |
| York Risk Services Holding Corp. | |
| | 994,975 | | | | 4.750 | | | | 10/01/21 | | | | 954,758 | |
| | |
| | Real Estate – 0.2% | |
| Realogy Corp. | |
| | 497,468 | | | | 3.750 | | | | 03/05/20 | | | | 497,095 | |
| | |
| | Restaurants – 0.6% | |
| 1011778 B.C. Unlimited Liability Co. | |
| | 1,495,023 | | | | 3.750 | | | | 12/12/21 | | | | 1,497,519 | |
| | |
| | Senior Term Loans(f) – (continued) | |
| | Retailers – 2.8% | |
| Academy Ltd. | |
| $ | 209,873 | | | | 5.000 | % | | | 07/01/22 | | | $ | 208,956 | |
| Albertson’s Holdings LLC | |
| | 243,750 | | | | 5.000 | | | | 08/25/19 | | | | 243,445 | |
| | 1,246,338 | | | | 5.500 | | | | 08/25/21 | | | | 1,245,628 | |
| Albertsons LLC | |
| | 248,169 | | | | 5.375 | | | | 03/21/19 | | | | 247,832 | |
| BJ’s Wholesale Club, Inc. | |
| | 248,949 | | | | 4.500 | | | | 09/26/19 | | | | 246,459 | |
| Hudson’s Bay Co. | |
| | 500,000 | | | | 4.750 | | | | 09/30/22 | | | | 500,470 | |
| New Albertson’s, Inc. | |
| | 248,744 | | | | 4.750 | | | | 06/27/21 | | | | 247,035 | |
| PetSmart, Inc. | |
| | 1,493,747 | | | | 4.250 | | | | 03/11/22 | | | | 1,492,940 | |
| Rite Aid Corp. | |
| | 1,250,000 | | | | 4.875 | | | | 06/21/21 | | | | 1,251,950 | |
| Staples, Inc. | |
| | 1,500,000 | | | | 3.500 | | | | 04/07/21 | | | | 1,491,825 | |
| Supervalu, Inc. | |
| | 496,396 | | | | 4.500 | | | | 03/21/19 | | | | 495,289 | |
| | | | | | | | | | | | | | |
| | | | | | | | | | | | | 7,671,829 | |
| | |
| | Services Cyclical – Business Services – 0.8% | |
| ADS Waste Holdings, Inc. | |
| | 500,000 | | | | 3.750 | | | | 10/09/19 | | | | 493,440 | |
| Ceridian LLC | |
| | 248,747 | | | | 4.500 | | | | 09/15/20 | | | | 228,641 | |
| TransUnion LLC | |
| | 1,000,000 | | | | 3.500 | | | | 04/09/21 | | | | 985,420 | |
| Travelport Finance S.a.r.l. | |
| | 501,213 | | | | 5.750 | | | | 09/02/21 | | | | 496,686 | |
| | | | | | | | | | | | | | |
| | | | | | | | | | | | | 2,204,187 | |
| | |
| | Special Purpose – 0.1% | |
| KP Germany Erste GmbH | |
| | 302,330 | | | | 5.000 | | | | 04/28/20 | | | | 302,708 | |
| | |
| | Technology – Hardware – 0.1% | |
| Zebra Technologies Corp. | |
| | 240,698 | | | | 4.750 | | | | 10/27/21 | | | | 242,036 | |
| | |
| | Technology – Software/Services – 2.4% | |
| Avago Technologies Cayman Ltd. | |
| | 748,552 | | | | 3.750 | | | | 05/06/21 | | | | 748,343 | |
| Black Knight InfoServ LLC | |
| | 76,145 | | | | 3.750 | | | | 05/27/22 | | | | 76,193 | |
| Blackboard, Inc. | |
| | 500,000 | | | | 4.750 | | | | 10/04/18 | | | | 489,690 | |
| BMC Software Finance, Inc. | |
| | 848,163 | | | | 5.000 | | | | 09/10/20 | | | | 762,550 | |
| Dell, Inc. | |
| | 995,623 | | | | 4.000 | | | | 04/29/20 | | | | 995,066 | |
| Emdeon, Inc. | |
| | 248,725 | | | | 3.750 | | | | 11/02/18 | | | | 245,864 | |
| | |
| | |
| 40 | | The accompanying notes are an integral part of these financial statements. |
GOLDMAN SACHS MULTI-MANAGER NON-CORE FIXED INCOME FUND
| | | | | | | | | | | | | | |
Principal Amount | | | Interest
Rate | | | Maturity
Date | | | Value | |
| | Senior Term Loans(f) – (continued) | |
| | Technology – Software/Services – (continued) | |
| Freescale Semiconductor, Inc. | |
| $ | 1,248,734 | | | | 4.250 | % | | | 02/28/20 | | | $ | 1,247,286 | |
| | 248,731 | | | | 5.000 | | | | 01/15/21 | | | | 248,619 | |
| Informatica Corp. | |
| | 750,000 | | | | 4.500 | | | | 08/05/22 | | | | 739,372 | |
| Lawson Software, Inc. | |
| | 747,422 | | | | 3.750 | | | | 06/03/20 | | | | 726,636 | |
| Magic NewCo. LLC | |
| | 248,720 | | | | 5.000 | | | | 12/12/18 | | | | 248,284 | |
| | | | | | | | | | | | | | |
| | | | | | | | | | | | | 6,527,903 | |
| | |
| | Telecommunications – Internet & Data – 0.9% | |
| Asurion LLC | |
| | 500,000 | | | | 5.000 | | | | 05/24/19 | | | | 476,250 | |
| | 700,000 | | | | 8.500 | | | | 03/03/21 | | | | 628,544 | |
| Avaya, Inc. | |
| | 165,267 | | | | 4.820 | | | | 10/26/17 | | | | 137,998 | |
| | 347,927 | | | | 5.250 | | | | 05/29/20 | | | | 266,359 | |
| Level 3 Financing, Inc. | |
| | 1,000,000 | | | | 4.000 | | | | 01/15/20 | | | | 1,001,750 | |
| | | | | | | | | | | | | | |
| | | | | | | | | | | | | 2,510,901 | |
| | |
| | Transportation – 0.3% | |
| CEVA Intercompany B.V. | |
| | 56,699 | | | | 6.500 | | | | 03/19/21 | | | | 49,682 | |
| Ceva Logistics Canada ULC | |
| | 9,776 | | | | 6.500 | | | | 03/19/21 | | | | 8,566 | |
| Ceva Logistics US Holdings, Inc. | |
| | 78,206 | | | | 6.500 | | | | 03/19/21 | | | | 68,528 | |
| Syncreon Group Holdings B.V. | |
| | 687,780 | | | | 5.250 | | | | 10/28/20 | | | | 548,848 | |
| | | | | | | | | | | | | | |
| | | | | | | | | | | | | 675,624 | |
| | |
| | Utilities – 0.9% | |
| Calpine Corp. | |
| | 498,715 | | | | 4.000 | | | | 10/09/19 | | | | 499,104 | |
| Energy Future Intermediate Holding Co. LLC | |
| | 1,750,000 | | | | 4.250 | | | | 06/19/16 | | | | 1,748,915 | |
| Penn Products Terminals LLC | |
| | 89,550 | | | | 4.750 | | | | 04/13/22 | | | | 89,774 | |
| | | | | | | | | | | | | | |
| | | | | | | | | | | | | 2,337,793 | |
| | |
| | TOTAL SENIOR TERM LOANS | |
| | (Cost $63,193,229) | | | $ | 61,387,596 | |
| | |
| | | | | | | | |
Shares | | | Description | | Value | |
| | Exchange Traded Funds – 3.0% | |
| | 48,000 | | | iShares iBoxx $ High Yield Corporate Bond ETF | | $ | 4,107,360 | |
| | 112,000 | | | SPDR Barclays High Yield Bond ETF | | | 4,084,640 | |
| | |
| | TOTAL EXCHANGE TRADED FUNDS | |
| | (Cost $7,990,546) | | $ | 8,192,000 | |
| | |
| TOTAL INVESTMENTS BEFORE SHORT-TERM
INVESTMENT |
|
| | (Cost $247,588,311) | | $ | 241,471,305 | |
| | |
| | | | | | | | | | | | | | |
Principal Amount | | | Interest
Rate | | | Maturity
Date | | | Value | |
| | Short-term Investment(g) – 11.6% | |
| | Repurchase Agreements – 11.6% | |
| Joint Repurchase Agreement Account II | |
| $ | 31,500,000 | | | | 0.092 | % | | | 11/02/15 | | | $ | 31,500,000 | |
| | (Cost $31,500,000) | | | | | |
| | |
| | TOTAL INVESTMENTS – 100.8% | | | | | |
| | (Cost $279,088,311) | | | $ | 272,971,305 | |
| | |
| LIABILITIES IN EXCESS OF
OTHER ASSETS – (0.8)% |
| | | (2,284,160 | ) |
| | |
| | NET ASSETS – 100.0% | | | $ | 270,687,145 | |
| | |
| | |
| The percentage shown for each investment category reflects the value of investments in that category as a percentage of net assets. |
(a) | | Security with “Call” features with resetting interest rates. Maturity dates disclosed are the final maturity dates. |
(b) | | Exempt from registration under Rule 144A of the Securities Act of 1933. Under procedures approved by the Board of Trustees, such securities have been determined to be liquid by an Underlying Manager and may be resold, normally to qualified institutional buyers in transactions exempt from registration. Total market value of Rule 144A securities amounts to $40,898,998, which represents approximately 15.1% of net assets as of October 31, 2015. |
(c) | | Issued with a zero coupon. Income is recognized through the accretion of discount. |
(d) | | Coupon changes periodically based upon a predetermined schedule. Interest rate disclosed is that which is in effect on October 31, 2015. |
(e) | | Security is currently in default and/or non-income producing. |
| | |
| The accompanying notes are an integral part of these financial statements. | | 41 |
GOLDMAN SACHS MULTI-MANAGER NON-CORE FIXED INCOME FUND
Schedule of Investments (continued)
October 31, 2015
| | |
(f) | | Senior Term Loans often require prepayments from excess cash flows or permit the borrower to repay at its election. The degree to which borrowers repay, whether as a contractual requirement or at their election, cannot be predicted with accuracy. As a result, the actual remaining maturity may be substantially less than the stated maturities shown. The stated interest rate represents the weighted average interest rate of all contracts within the senior loan facility on October 31, 2015. Senior Term Loans typically have rates of interest which are predetermined either daily, monthly, quarterly or semi-annually by reference to a base lending rate, plus a premium. These base lending rates are primarily the London-Interbank Offered Rate (“LIBOR”), and secondarily the prime rate offered by one or more major United States banks (the “Prime Rate”) and the certificate of deposit (“CD”) rate or other base lending rates used by commercial lenders. |
(g) | | Joint repurchase agreement was entered into on October 30, 2015. Additional information appears on page 52. |
| | |
|
Currency Abbreviations: |
BRL | | —Brazilian Real |
CLP | | —Chilean Peso |
CNY | | —Chinese Yuan |
COP | | —Colombian Peso |
EUR | | —Euro |
HKD | | —Hong Kong Dollar |
HUF | | —Hungarian Forint |
IDR | | —Indonesian Rupiah |
INR | | —Indian Rupee |
JPY | | —Japanese Yen |
KRW | | —South Korean Won |
MXN | | —Mexican Peso |
MYR | | —Malaysian Ringgit |
PEN | | —Peruvian Nuevo Sol |
PHP | | —Philippine Peso |
PLN | | —Polish Zloty |
RON | | —New Romanian Leu |
RUB | | —Russian Ruble |
THB | | —Thai Baht |
TRY | | —Turkish Lira |
TWD | | —Taiwan Dollar |
ZAR | | —South African Rand |
| | |
Investment Abbreviations: |
ETF | | —Exchange Traded Fund |
LLC | | —Limited Liability Company |
LP | | —Limited Partnership |
WIBOR | | —Warsaw Interbank Offered Rate |
|
| | |
| 42 | | The accompanying notes are an integral part of these financial statements. |
GOLDMAN SACHS MULTI-MANAGER NON-CORE FIXED INCOME FUND
|
| ADDITIONAL INVESTMENT INFORMATION |
FORWARD FOREIGN CURRENCY EXCHANGE CONTRACTS — At October 31, 2015, the Fund had the following forward foreign currency exchange contracts:
FORWARD FOREIGN CURRENCY EXCHANGE CONTRACTS WITH UNREALIZED GAIN
| | | | | | | | | | | | | | | | | | | | | | |
| Counterparty | | Currency
Purchased | | | Currency
Sold | | | Current
Value | | | Settlement
Date | | Unrealized
Gain | |
Citibank NA (London) | | BRL | | | 8,018,613 | | | USD | | | 2,046,476 | | | $ | 2,076,481 | | | 11/04/15 | | $ | 30,004 | |
| | BRL | | | 2,315,297 | | | USD | | | 592,633 | | | | 593,818 | | | 12/02/15 | | | 1,185 | |
| | CNY | | | 1,159,791 | | | USD | | | 182,000 | | | | 182,721 | | | 11/24/15 | | | 721 | |
| | COP | | | 6,494,736,064 | | | USD | | | 2,214,360 | | | | 2,235,353 | | | 11/24/15 | | | 20,993 | |
| | IDR | | | 1,989,646,000 | | | USD | | | 143,617 | | | | 144,067 | | | 11/24/15 | | | 450 | |
| | INR | | | 46,277,000 | | | USD | | | 700,000 | | | | 704,961 | | | 11/24/15 | | | 4,961 | |
| | KRW | | | 50,315,320 | | | USD | | | 44,000 | | | | 44,037 | | | 11/24/15 | | | 37 | |
| | MXN | | | 8,443,697 | | | USD | | | 507,369 | | | | 510,256 | | | 11/24/15 | | | 2,887 | |
| | PLN | | | 3,335,720 | | | USD | | | 860,905 | | | | 862,521 | | | 11/24/15 | | | 1,616 | |
| | RUB | | | 4,065,031 | | | USD | | | 63,124 | | | | 63,206 | | | 11/24/15 | | | 82 | |
| | THB | | | 62,422,749 | | | USD | | | 1,732,276 | | | | 1,753,492 | | | 11/24/15 | | | 21,216 | |
| | TRY | | | 2,319,297 | | | USD | | | 778,216 | | | | 789,927 | | | 11/24/15 | | | 11,711 | |
| | USD | | | 90,000 | | | BRL | | | 349,245 | | | | 89,573 | | | 12/02/15 | | | 427 | |
| | USD | | | 751,000 | | | CLP | | | 512,151,913 | | | | 738,859 | | | 11/24/15 | | | 12,141 | |
| | USD | | | 1,934,781 | | | COP | | | 5,617,636,859 | | | | 1,933,473 | | | 11/24/15 | | | 1,308 | |
| | USD | | | 1,381,911 | | | EUR | | | 1,248,000 | | | | 1,372,772 | | | 11/24/15 | | | 9,139 | |
| | USD | | | 377,899 | | | EUR | | | 342,269 | | | | 376,612 | | | 12/10/15 | | | 1,287 | |
| | USD | | | 1,524,479 | | | HKD | | | 11,814,282 | | | | 1,524,422 | | | 11/24/15 | | | 56 | |
| | USD | | | 2,455,909 | | | HUF | | | 679,339,994 | | | | 2,402,775 | | | 11/24/15 | | | 53,134 | |
| | USD | | | 205,000 | | | IDR | | | 2,810,665,000 | | | | 203,515 | | | 11/24/15 | | | 1,485 | |
| | USD | | | 117,000 | | | INR | | | 7,643,594 | | | | 116,439 | | | 11/24/15 | | | 561 | |
| | USD | | | 7,737 | | | JPY | | | 929,453 | | | | 7,704 | | | 11/24/15 | | | 33 | |
| | USD | | | 1,975,000 | | | KRW | | | 2,237,965,150 | | | | 1,958,712 | | | 11/24/15 | | | 16,288 | |
| | USD | | | 1,829,437 | | | MXN | | | 30,000,177 | | | | 1,812,922 | | | 11/24/15 | | | 16,514 | |
| | USD | | | 255,000 | | | MYR | | | 1,080,889 | | | | 251,195 | | | 11/24/15 | | | 3,805 | |
| | USD | | | 309,215 | | | PEN | | | 1,005,997 | | | | 305,254 | | | 11/24/15 | | | 3,961 | |
| | USD | | | 476,501 | | | PLN | | | 1,808,907 | | | | 467,731 | | | 11/24/15 | | | 8,770 | |
| | USD | | | 114,000 | | | RON | | | 447,136 | | | | 110,838 | | | 11/24/15 | | | 3,162 | |
| | USD | | | 539,786 | | | RUB | | | 34,232,215 | | | | 532,268 | | | 11/24/15 | | | 7,518 | |
| | USD | | | 231,000 | | | THB | | | 8,201,400 | | | | 230,382 | | | 11/24/15 | | | 618 | |
| | USD | | | 210,000 | | | TRY | | | 613,183 | | | | 208,843 | | | 11/24/15 | | | 1,157 | |
| | USD | | | 670,000 | | | TWD | | | 21,755,570 | | | | 669,868 | | | 11/24/15 | | | 131 | |
| | | USD | | | 1,211,481 | | | ZAR | | | 16,396,289 | | | | 1,179,902 | | | 11/24/15 | | | 31,579 | |
| TOTAL | | | | | | | | | | | | | | | | | | | | $ | 268,937 | |
| | |
| The accompanying notes are an integral part of these financial statements. | | 43 |
GOLDMAN SACHS MULTI-MANAGER NON-CORE FIXED INCOME FUND
Schedule of Investments (continued)
October 31, 2015
|
| ADDITIONAL INVESTMENT INFORMATION (continued) |
FORWARD FOREIGN CURRENCY EXCHANGE CONTRACTS WITH UNREALIZED LOSS
| | | | | | | | | | | | | | | | | | | | | | |
| Counterparty | | Currency
Purchased | | | Currency
Sold | | | Current
Value | | | Settlement
Date | | Unrealized
Loss | |
Citibank NA (London) | | CLP | | | 1,478,782,767 | | | USD | | | 2,176,926 | | | $ | 2,133,377 | | | 11/24/15 | | $ | (43,549 | ) |
| | CNY | | | 190,203 | | | USD | | | 30,000 | | | | 29,966 | | | 11/24/15 | | | (34 | ) |
| | HKD | | | 6,069,882 | | | USD | | | 783,246 | | | | 783,210 | | | 11/24/15 | | | (36 | ) |
| | HUF | | | 336,347,873 | | | USD | | | 1,200,627 | | | | 1,189,636 | | | 11/24/15 | | | (10,992 | ) |
| | IDR | | | 1,898,883,525 | | | USD | | | 138,191 | | | | 137,495 | | | 11/24/15 | | | (696 | ) |
| | INR | | | 46,911,150 | | | USD | | | 715,000 | | | | 714,621 | | | 11/24/15 | | | (379 | ) |
| | KRW | | | 229,266,970 | | | USD | | | 202,000 | | | | 200,659 | | | 11/24/15 | | | (1,341 | ) |
| | MXN | | | 13,663,537 | | | USD | | | 830,526 | | | | 825,692 | | | 11/24/15 | | | (4,833 | ) |
| | MYR | | | 13,794,129 | | | USD | | | 3,283,727 | | | | 3,205,710 | | | 11/24/15 | | | (78,016 | ) |
| | PEN | | | 2,365,658 | | | USD | | | 730,000 | | | | 717,822 | | | 11/24/15 | | | (12,178 | ) |
| | PHP | | | 10,381,555 | | | USD | | | 224,660 | | | | 221,665 | | | 11/24/15 | | | (2,995 | ) |
| | PLN | | | 9,161,507 | | | USD | | | 2,436,268 | | | | 2,368,899 | | | 11/24/15 | | | (67,368 | ) |
| | RON | | | 4,495,539 | | | USD | | | 1,149,255 | | | | 1,114,369 | | | 11/24/15 | | | (34,886 | ) |
| | RUB | | | 90,854,630 | | | USD | | | 1,435,729 | | | | 1,412,677 | | | 11/24/15 | | | (23,052 | ) |
| | THB | | | 3,390,205 | | | USD | | | 96,299 | | | | 95,233 | | | 11/24/15 | | | (1,066 | ) |
| | TRY | | | 2,610,069 | | | USD | | | 899,026 | | | | 888,959 | | | 11/24/15 | | | (10,067 | ) |
| | TWD | | | 68,772,717 | | | USD | | | 2,134,000 | | | | 2,117,557 | | | 11/24/15 | | | (16,443 | ) |
| | USD | | | 2,010,594 | | | BRL | | | 8,018,613 | | | | 2,076,481 | | | 11/04/15 | | | (65,887 | ) |
| | USD | | | 1,645,658 | | | BRL | | | 6,461,263 | | | | 1,657,158 | | | 12/02/15 | | | (11,499 | ) |
| | USD | | | 41,000 | | | CLP | | | 28,458,428 | | | | 41,056 | | | 11/24/15 | | | (56 | ) |
| | USD | | | 2,202,999 | | | CNY | | | 14,059,541 | | | | 2,215,029 | | | 11/24/15 | | | (12,030 | ) |
| | USD | | | 379,000 | | | COP | | | 1,119,024,476 | | | | 385,145 | | | 11/24/15 | | | (6,145 | ) |
| | USD | | | 565,725 | | | IDR | | | 7,943,482,310 | | | | 575,175 | | | 11/24/15 | | | (9,450 | ) |
| | USD | | | 1,107,025 | | | KRW | | | 1,290,006,410 | | | | 1,129,039 | | | 11/24/15 | | | (22,015 | ) |
| | USD | | | 480,000 | | | KRW | | | 569,457,600 | | | | 498,388 | | | 11/25/15 | | | (18,388 | ) |
| | USD | | | 1,111,070 | | | MXN | | | 18,508,687 | | | | 1,118,486 | | | 11/24/15 | | | (7,416 | ) |
| | USD | | | 124,000 | | | MYR | | | 534,834 | | | | 124,294 | | | 11/24/15 | | | (294 | ) |
| | USD | | | 124,000 | | | PLN | | | 480,098 | | | | 124,139 | | | 11/24/15 | | | (139 | ) |
| | USD | | | 353,421 | | | RUB | | | 22,785,032 | | | | 354,279 | | | 11/24/15 | | | (858 | ) |
| | USD | | | 200,000 | | | THB | | | 7,134,786 | | | | 200,421 | | | 11/24/15 | | | (421 | ) |
| | USD | | | 1,502,212 | | | TRY | | | 4,441,915 | | | | 1,512,867 | | | 11/24/15 | | | (10,655 | ) |
| | USD | | | 2,125,525 | | | TWD | | | 69,238,971 | | | | 2,131,913 | | | 11/24/15 | | | (6,388 | ) |
| | | ZAR | | | 20,317,476 | | | USD | | | 1,481,917 | | | | 1,462,078 | | | 11/24/15 | | | (19,840 | ) |
| TOTAL | | | | | | | | | | | | | | | | | | | | $ | (499,412 | ) |
| | |
| 44 | | The accompanying notes are an integral part of these financial statements. |
GOLDMAN SACHS MULTI-MANAGER NON-CORE FIXED INCOME FUND
|
| ADDITIONAL INVESTMENT INFORMATION (continued) |
FUTURES CONTRACTS — At October 31, 2015, the Fund had the following futures contracts:
| | | | | | | | | | | | | | |
| Type | | Number of Contracts Long (Short) | | | Expiration Date | | Current Value | | | Unrealized Gain (Loss) | |
Euro Buxl 30 Year Bonds | | | (1 | ) | | December 2015 | | $ | (173,437 | ) | | $ | (1,914 | ) |
Ultra Long U.S. Treasury Bonds | | | 6 | | | December 2015 | | | 958,500 | | | | 366 | |
10 Year German Euro-Bund | | | (1 | ) | | December 2015 | | | (172,876 | ) | | | (705 | ) |
5 Year U.S. Treasury Notes | | | (15 | ) | | December 2015 | | | (1,796,602 | ) | | | 8,437 | |
10 Year U.S. Treasury Notes | | | (27 | ) | | December 2015 | | | (3,447,562 | ) | | | 22,397 | |
| TOTAL | | | | | | | | | | | | $ | 28,581 | |
SWAP CONTRACTS — At October 31, 2015, the Fund had the following swap contracts:
OVER THE COUNTER INTEREST RATE SWAP CONTRACTS
| | | | | | | | | | | | | | | | |
| | | | | | | | | | Rates Exchanged | | | |
| Counterparty | | Notional
Amount
(000s) | | | Termination
Date | | Payments
Received | | Payments Made | | Unrealized
Gain (Loss)* | |
BNP Paribas SA | | CNY | | | 23,100 | | | 10/20/16 | | 2.300% | | China Foreign Exchange Trade System Renminbi Index | | $ | 2,990 | |
| | | | | 22,100 | | | 10/21/16 | | 2.290 | | China Foreign Exchange Trade System Renminbi Index | | | 1,296 | |
HSBC Bank PLC | | BRL | | | 3,727 | (a) | | 01/04/21 | | 1 month Brazilian
Interbank Deposit
Average | | 12.604% | | | 70,826 | |
| TOTAL | | | | | | | | | | | | | | $ | 75,112 | |
| | (a) | | Represents forward starting interest rate swaps whose effective dates of commencement of accruals and cash flows occur subsequent to October 31, 2015. |
| | * | | There are no upfront payments on the swap contracts, therefore the unrealized gain (loss) on the swap contracts is equal to their market value. |
CENTRALLY CLEARED INTEREST RATE SWAP CONTRACT
| | | | | | | | | | | | | | |
| | | | | | Rates Exchanged | | | |
Notional
Amount
(000s) | | | Termination
Date | | Payments Received | | | Payments Made | | Unrealized Gain (Loss)* | |
| | PLN 5,100 | | | 10/27/20 | | | 1.860 | % | | 6 month WIBOR | | $ | 4,397 | |
| | * | | There are no upfront payments on the swap contracts, therefore the unrealized gain (loss) on the swap contracts is equal to their market value. |
| | |
| The accompanying notes are an integral part of these financial statements. | | 45 |
GOLDMAN SACHS MULTI-MANAGER NON-CORE FIXED INCOME FUND
Schedule of Investments (continued)
October 31, 2015
|
| ADDITIONAL INVESTMENT INFORMATION (continued) |
OVER THE COUNTER CREDIT DEFAULT SWAP CONTRACTS
| | | | | | | | | | | | | | | | | | | | | | | | | | |
| | | | | | | | | | | | | | | | | Market Value | |
| Counterparty | | Referenced
Obligation | | Notional
Amount
(000s) | | | Rates Received
(Paid) | | | Termination
Date | | | Credit
Spread at
October 31,
2015(b) | | | Upfront
Payments
Made (Received) | | | Unrealized
Gain (Loss) | |
Protection Purchased: | | | | | | | | | | | | | | | | | | | | | | | | | | |
Citibank NA | | People’s Republic of China
1.000%, 06/20/21 | | $ | 600 | | | | (1.000 | )% | | | 12/20/20 | | | | 1.003 | % | | $ | 6,902 | | | $ | (7,504 | ) |
BNP Paribas SA | | People’s Republic of China
1.000%, 06/20/21 | | | 825 | | | | (1.000 | ) | | | 12/20/20 | | | | 1.049 | | | | 3,393 | | | | (2,339 | ) |
BNP Paribas SA | | Russian Federation
1.000%, 12/20/20 | | | 250 | | | | (1.000 | ) | | | 12/20/20 | | | | 2.712 | | | | 23,104 | | | | (3,268 | ) |
| TOTAL | | | | | | | | | | | | | | | | | | | | $ | 33,399 | | | $ | (13,111 | ) |
| | (b) | | Credit spread on the Referenced Obligation, together with the term of the swap contract, are indicators of payment/performance risk. The likelihood of a credit event occurring which would require a fund to make a payment or otherwise be required to perform under the swap contract is generally greater as the credit spread and the term of the swap contract increase. |
| | |
| 46 | | The accompanying notes are an integral part of these financial statements. |
GOLDMAN SACHS MULTI-MANAGER REAL ASSETS STRATEGY FUND
Consolidated Schedule of Investments
October 31, 2015
| | | | | | | | |
Shares | | | Description | | Value | |
| | | | | | | | |
| | Common Stocks – 75.2% | |
| | Australia – 3.1% | |
| | 59,034 | | | Dexus Property Group (Real Estate Investment Trusts) | | $ | 324,059 | |
| | 192,822 | | | Federation Centres (Real Estate Investment Trusts) | | | 398,324 | |
| | 175,221 | | | Goodman Group (Real Estate Investment Trusts) | | | 751,763 | |
| | 75,499 | | | Investa Office Fund (Real Estate Investment Trusts) | | | 216,084 | |
| | 204,622 | | | Mirvac Group (Real Estate Investment Trusts) | | | 261,558 | |
| | 105,121 | | | Stockland (Real Estate Investment Trusts) | | | 301,703 | |
| | 429,200 | | | Sydney Airport (Transportation Infrastructure) | | | 1,961,488 | |
| | 124,299 | | | Transurban Group (Transportation Infrastructure) | | | 921,061 | |
| | 147,323 | | | Westfield Corp. (Real Estate Investment Trusts) | | | 1,068,846 | |
| | | | | | | | |
| | | | | | | 6,204,886 | |
| | |
| | Canada – 5.8% | |
| | 7,347 | | | Boardwalk Real Estate Investment Trust (Real Estate Investment Trusts) | | | 301,836 | |
| | 8,710 | | | Brookfield Canada Office Properties (Real Estate Investment Trusts) | | | 182,913 | |
| | 15,098 | | | Canadian Apartment Properties REIT (Real Estate Investment Trusts) | | | 310,828 | |
| | 41,097 | | | Chartwell Retirement Residences (Health Care Providers & Services) | | | 397,581 | |
| | 83,446 | | | Enbridge, Inc. (Oil, Gas & Consumable Fuels) | | | 3,566,685 | |
| | 85,300 | | | Inter Pipeline Ltd. (Oil, Gas & Consumable Fuels) | | | 1,598,233 | |
| | 82,407 | | | Pembina Pipeline Corp. (Oil, Gas & Consumable Fuels) | | | 2,071,519 | |
| | 92,244 | | | TransCanada Corp. (Oil, Gas & Consumable Fuels) | | | 3,103,958 | |
| | | | | | | | |
| | | | | | | 11,533,553 | |
| | |
| | Cayman Islands – 0.4% | |
| | 27,500 | | | Cheung Kong Property Holdings Ltd. (Real Estate Management & Development) | | | 192,421 | |
| | 118,153 | | | ENN Energy Holdings Ltd. (Gas Utilities) | | | 676,856 | |
| | | | | | | | |
| | | | | | | 869,277 | |
| | |
| | France – 3.6% | |
| | 3,383 | | | Fonciere Des Regions (Real Estate Investment Trusts) | | | 318,427 | |
| | 172,895 | | | Groupe Eurotunnel SE (Transportation Infrastructure) | | | 2,420,218 | |
| | 9,980 | | | Klepierre (Real Estate Investment Trusts) | | | 472,650 | |
| | 10,777 | | | SES SA (Media) | | | 317,979 | |
| | |
| | | | | | | | |
| | Common Stocks – (continued) | |
| | France – (continued) | |
| | 4,127 | | | Unibail-Rodamco SE (Real Estate Investment Trusts) | | $ | 1,148,671 | |
| | 35,000 | | | Vinci SA (Construction & Engineering) | | | 2,356,419 | |
| | | | | | | | |
| | | | | | | 7,034,364 | |
| | |
| | Germany – 0.6% | |
| | 16,467 | | | alstria office REIT AG* (Real Estate Investment Trusts) | | | 229,758 | |
| | 6,097 | | | Hamburger Hafen und Logistik AG (Transportation Infrastructure) | | | 88,188 | |
| | 12,878 | | | TLG Immobilien AG (Real Estate Management & Development) | | | 242,244 | |
| | 4,543 | | | VIB Vermoegen AG (Real Estate Management & Development) | | | 87,175 | |
| | 13,892 | | | Vonovia SE (Real Estate Management & Development) | | | 463,075 | |
| | | | | | | | |
| | | | | | | 1,110,440 | |
| | |
| | Hong Kong – 3.9% | |
| | 231,900 | | | Beijing Enterprises Holdings Ltd. (Industrial Conglomerates) | | | 1,463,925 | |
| | 587,495 | | | Beijing Enterprises Water Group Ltd.* (Water Utilities) | | | 465,309 | |
| | 45,000 | | | Hang Lung Properties Ltd. (Real Estate Management & Development) | | | 110,107 | |
| | 79,000 | | | Henderson Land Development Co. Ltd. (Real Estate Management & Development) | | | 504,553 | |
| | 467,202 | | | Hong Kong & China Gas Co. Ltd. (Gas Utilities) | | | 947,268 | |
| | 171,700 | | | Hongkong Land Holdings Ltd. (Real Estate Management & Development) | | | 1,287,439 | |
| | 62,000 | | | Kerry Properties Ltd. (Real Estate Management & Development) | | | 183,529 | |
| | 428,000 | | | Sino Land Co. Ltd. (Real Estate Management & Development) | | | 660,619 | |
| | 123,000 | | | Sun Hung Kai Properties Ltd. (Real Estate Management & Development) | | | 1,643,009 | |
| | 63,000 | | | The Wharf Holdings Ltd. (Real Estate Management & Development) | | | 374,877 | |
| | | | | | | | |
| | | | | | | 7,640,635 | |
| | |
| | Ireland – 0.4% | |
| | 154,689 | | | Green REIT PLC (Real Estate Investment Trusts) | | | 267,260 | |
| | 226,713 | | | Hibernia REIT PLC (Real Estate Investment Trusts) | | | 335,565 | |
| | 159,604 | | | Irish Residential Properties REIT PLC (Real Estate Investment Trusts) | | | 196,318 | |
| | | | | | | | |
| | | | | | | 799,143 | |
| | |
| | Italy – 0.9% | |
| | 65,000 | | | Atlantia SpA (Transportation Infrastructure) | | | 1,800,067 | |
| | |
| | |
| The accompanying notes are an integral part of these financial statements. | | 47 |
GOLDMAN SACHS MULTI-MANAGER REAL ASSETS STRATEGY FUND
Consolidated Schedule of Investments (continued)
October 31, 2015
| | | | | | | | |
Shares | | | Description | | Value | |
| | | | | | | | |
| | Common Stocks – (continued) | |
| | Japan – 3.4% | |
| | 92 | | | Activia Properties, Inc. (Real Estate Investment Trusts) | | $ | 390,772 | |
| | 175 | | | AEON REIT Investment Corp. (Real Estate Investment Trusts) | | | 208,969 | |
| | 10,200 | | | Daiwa House Industry Co., Ltd. (Real Estate Management & Development) | | | 267,753 | |
| | 42 | | | Daiwa House REIT Investment Corp. (Real Estate Investment Trusts) | | | 168,858 | |
| | 193 | | | GLP J-REIT (Real Estate Investment Trusts) | | | 192,047 | |
| | 39 | | | Japan Real Estate Investment Corp. (Real Estate Investment Trusts) | | | 180,277 | |
| | 65 | | | Japan Retail Fund Investment Corp. (Real Estate Investment Trusts) | | | 125,890 | |
| | 239 | | | Kenedix Retail REIT Corp. (Real Estate Investment Trusts) | | | 467,367 | |
| | 53,000 | | | Mitsubishi Estate Co. Ltd. (Real Estate Management & Development) | | | 1,136,663 | |
| | 83,000 | | | Mitsui Fudosan Co. Ltd. (Real Estate Management & Development) | | | 2,258,733 | |
| | 155 | | | Nomura Real Estate Master Fund, Inc. (Real Estate Investment Trusts) | | | 196,399 | |
| | 27,000 | | | Sumitomo Realty & Development Co. Ltd. (Real Estate Management & Development) | | | 889,066 | |
| | 8,600 | | | Tokyo Tatemono Co. Ltd. (Real Estate Management & Development) | | | 106,858 | |
| | 6,800 | | | Tokyu Fudosan Holdings Corp. (Real Estate Management & Development) | | | 47,798 | |
| | | | | | | | |
| | | | | | | 6,637,450 | |
| | |
| | Luxembourg* – 0.1% | |
| | 8,200 | | | Ado Properties SA (Real Estate Management & Development) | | | 209,648 | |
| | |
| | Mexico* – 0.2% | |
| | 36,000 | | | Promotora y Operadora de Infraestructura SAB de CV (Construction & Engineering) | | | 392,696 | |
| | |
| | Netherlands – 1.5% | |
| | 5,160 | | | Eurocommercial Properties NV (Real Estate Investment Trusts) | | | 246,092 | |
| | 68,300 | | | Koninklijke Vopak NV (Oil, Gas & Consumable Fuels) | | | 2,743,644 | |
| | | | | | | | |
| | | | | | | 2,989,736 | |
| | |
| | Singapore – 0.5% | |
| | 133,600 | | | Ascendas Real Estate Investment Trust (Real Estate Investment Trusts) | | | 227,458 | |
| | 241,500 | | | Cache Logistics Trust (Real Estate Investment Trusts) | | | 173,072 | |
| | 165,700 | | | Capitaland Ltd. (Real Estate Management & Development) | | | 365,519 | |
| | 321,100 | | | Keppel REIT (Real Estate Investment Trusts) | | | 220,993 | |
| | | | | | | | |
| | | | | | | 987,042 | |
| | |
| | | | | | | | |
| | Common Stocks – (continued) | |
| | Spain – 1.7% | |
| | 14,033 | | | Axiare Patrimonio SOCIMI SA (Real Estate Investment Trusts) | | $ | 200,365 | |
| | 122,000 | | | Ferrovial SA (Construction & Engineering) | | | 3,077,745 | |
| | | | | | | | |
| | | | | | | 3,278,110 | |
| | |
| | Sweden – 0.5% | |
| | 13,889 | | | Atrium Ljungberg AB (Real Estate Management & Development) | | | 215,384 | |
| | 15,361 | | | Fabege AB (Real Estate Management & Development) | | | 244,037 | |
| | 15,619 | | | Hufvudstaden AB (Real Estate Management & Development) | | | 220,689 | |
| | 20,421 | | | Kungsleden AB (Real Estate Management & Development) | | | 152,943 | |
| | 10,506 | | | Pandox AB* (Hotels, Restaurants & Leisure) | | | 171,304 | |
| | | | | | | | |
| | | | | | | 1,004,357 | |
| | |
| | Switzerland – 0.9% | |
| | 1,900 | | | Flughafen Zuerich AG (Transportation Infrastructure) | | | 1,438,069 | |
| | 3,141 | | | PSP Swiss Property AG* (Real Estate Management & Development) | | | 273,236 | |
| | | | | | | | |
| | | | | | | 1,711,305 | |
| | |
| | United Kingdom – 7.7% | |
| | 24,250 | | | Big Yellow Group PLC (Real Estate Investment Trusts) | | | 279,938 | |
| | 11,184 | | | Capital & Counties Properties PLC (Real Estate Management & Development) | | | 76,540 | |
| | 6,495 | | | Derwent London PLC (Real Estate Investment Trusts) | | | 387,901 | |
| | 124,820 | | | Empiric Student Property PLC (Real Estate Investment Trusts) | | | 210,837 | |
| | 34,711 | | | Great Portland Estates PLC (Real Estate Investment Trusts) | | | 475,378 | |
| | 49,375 | | | Hammerson PLC (Real Estate Investment Trusts) | | | 483,762 | |
| | 6,351 | | | Kennedy Wilson Europe Real Estate PLC (Real Estate Investment Trusts) | | | 116,873 | |
| | 52,096 | | | Land Securities Group PLC (Real Estate Investment Trusts) | | | 1,073,266 | |
| | 475,505 | | | National Grid PLC (Multi-Utilities) | | | 6,773,510 | |
| | 66,295 | | | Segro PLC (Real Estate Investment Trusts) | | | 459,234 | |
| | 75,300 | | | Severn Trent PLC (Water Utilities) | | | 2,596,930 | |
| | 23,410 | | | Shaftesbury PLC (Real Estate Investment Trusts) | | | 338,856 | |
| | 63,564 | | | The British Land Co. PLC (Real Estate Investment Trusts) | | | 851,420 | |
| | 73,713 | | | Tritax Big Box REIT PLC (Real Estate Investment Trusts) | | | 146,249 | |
| | |
| | |
| 48 | | The accompanying notes are an integral part of these financial statements. |
GOLDMAN SACHS MULTI-MANAGER REAL ASSETS STRATEGY FUND
| | | | | | | | |
Shares | | | Description | | Value | |
| | | | | | | | |
| | Common Stocks – (continued) | |
| | United Kingdom – (continued) | |
| | 64,600 | | | United Utilities Group PLC (Water Utilities) | | $ | 983,029 | |
| | | | | | | | |
| | | | | | | 15,253,723 | |
| | |
| | United States – 40.0% | |
| | 14,381 | | | Acadia Realty Trust (Real Estate Investment Trusts) | | | 472,991 | |
| | 5,819 | | | Alexandria Real Estate Equities, Inc. (Real Estate Investment Trusts) | | | 522,197 | |
| | 56,100 | | | American Tower Corp. (Real Estate Investment Trusts) | | | 5,735,103 | |
| | 39,011 | | | American Water Works Co., Inc. (Water Utilities) | | | 2,237,671 | |
| | 19,910 | | | Apartment Investment & Management Co. Class A (Real Estate Investment Trusts) | | | 780,273 | |
| | 9,306 | | | AvalonBay Communities, Inc. (Real Estate Investment Trusts) | | | 1,626,968 | |
| | 5,266 | | | Boston Properties, Inc. (Real Estate Investment Trusts) | | | 662,726 | |
| | 17,700 | | | Camden Property Trust (Real Estate Investment Trusts) | | | 1,306,083 | |
| | 45,121 | | | Cheniere Energy, Inc.* (Oil, Gas & Consumable Fuels) | | | 2,234,392 | |
| | 17,411 | | | Chesapeake Lodging Trust (Real Estate Investment Trusts) | | | 479,499 | |
| | 52,621 | | | Crown Castle International Corp. (Real Estate Investment Trusts) | | | 4,496,991 | |
| | 10,814 | | | CubeSmart (Real Estate Investment Trusts) | | | 300,845 | |
| | 46,962 | | | Duke Realty Corp. (Real Estate Investment Trusts) | | | 972,113 | |
| | 28,800 | | | Edison International (Electric Utilities) | | | 1,742,976 | |
| | 28,136 | | | Empire State Realty Trust, Inc. Class A (Real Estate Investment Trusts) | | | 501,384 | |
| | 76,832 | | | Enbridge Energy Management LLC* (Oil, Gas & Consumable Fuels) | | | 2,087,525 | |
| | 2,595 | | | Equinix, Inc. (Real Estate Investment Trusts) | | | 769,885 | |
| | 11,339 | | | Equity LifeStyle Properties, Inc. (Real Estate Investment Trusts) | | | 685,783 | |
| | 28,065 | | | Equity One, Inc. (Real Estate Investment Trusts) | | | 745,968 | |
| | 5,042 | | | Essex Property Trust, Inc. (Real Estate Investment Trusts) | | | 1,111,458 | |
| | 54,068 | | | Eversource Energy (Electric Utilities) | | | 2,754,224 | |
| | 12,889 | | | Extra Space Storage, Inc. (Real Estate Investment Trusts) | | | 1,021,324 | |
| | 28,424 | | | First Industrial Realty Trust, Inc. (Real Estate Investment Trusts) | | | 616,232 | |
| | 40,095 | | | First Potomac Realty Trust (Real Estate Investment Trusts) | | | 472,720 | |
| | 48,919 | | | General Growth Properties, Inc. (Real Estate Investment Trusts) | | | 1,416,205 | |
| | 29,741 | | | Hilton Worldwide Holdings, Inc. (Hotels, Restaurants & Leisure) | | | 743,228 | |
| | |
| | | | | | | | |
| | Common Stocks – (continued) | |
| | United States – (continued) | |
| | 20,843 | | | Hudson Pacific Properties, Inc. (Real Estate Investment Trusts) | | $ | 595,485 | |
| | 39,415 | | | ITC Holdings Corp. (Electric Utilities) | | | 1,289,659 | |
| | 10,199 | | | Kilroy Realty Corp. (Real Estate Investment Trusts) | | | 671,502 | |
| | 31,254 | | | Kinder Morgan, Inc. (Oil, Gas & Consumable Fuels) | | | 854,797 | |
| | 19,741 | | | La Quinta Holdings, Inc.* (Hotels, Restaurants & Leisure) | | | 299,076 | |
| | 32,698 | | | Monogram Residential Trust, Inc. (Real Estate Investment Trusts) | | | 322,402 | |
| | 28,460 | | | National Retail Properties, Inc. (Real Estate Investment Trusts) | | | 1,081,480 | |
| | 107,466 | | | New York REIT, Inc. (Real Estate Investment Trusts) | | | 1,225,112 | |
| | 106,119 | | | NiSource, Inc. (Multi-Utilities) | | | 2,033,240 | |
| | 33,500 | | | NorthWestern Corp. (Multi-Utilities) | | | 1,815,365 | |
| | 26,085 | | | Parkway Properties, Inc. (Real Estate Investment Trusts) | | | 436,402 | |
| | 36,266 | | | Pattern Energy Group, Inc. (Independent Power Producers & Energy Traders) | | | 848,262 | |
| | 26,199 | | | Pennsylvania Real Estate Investment Trust (Real Estate Investment Trusts) | | | 588,954 | |
| | 27,559 | | | Pepco Holdings, Inc. (Electric Utilities) | | | 733,896 | |
| | 81,927 | | | PG&E Corp. (Multi-Utilities) | | | 4,374,902 | |
| | 22,673 | | | Physicians Realty Trust (Real Estate Investment Trusts) | | | 362,315 | |
| | 3,164 | | | Public Storage (Real Estate Investment Trusts) | | | 726,011 | |
| | 26,595 | | | Republic Services, Inc. (Commercial Services & Supplies) | | | 1,163,265 | |
| | 45,635 | | | Retail Properties of America, Inc. Class A (Real Estate Investment Trusts) | | | 683,156 | |
| | 9,154 | | | RLJ Lodging Trust (Real Estate Investment Trusts) | | | 229,674 | |
| | 8,130 | | | SBA Communications Corp. Class A* (Wireless Telecommunication Services) | | | 967,633 | |
| | 54,237 | | | Sempra Energy (Multi-Utilities) | | | 5,554,411 | |
| | 31,311 | | | Senior Housing Properties Trust (Real Estate Investment Trusts) | | | 475,614 | |
| | 12,806 | | | Simon Property Group, Inc. (Real Estate Investment Trusts) | | | 2,579,897 | |
| | 7,534 | | | Sovran Self Storage, Inc. (Real Estate Investment Trusts) | | | 752,421 | |
| | 109,271 | | | Spectra Energy Corp. (Oil, Gas & Consumable Fuels) | | | 3,121,872 | |
| | 1,362 | | | Starwood Hotels & Resorts Worldwide, Inc. (Hotels, Restaurants & Leisure) | | | 108,783 | |
| | 57,622 | | | Sunstone Hotel Investors, Inc. (Real Estate Investment Trusts) | | | 833,214 | |
| | 7,549 | | | Taubman Centers, Inc. (Real Estate Investment Trusts) | | | 581,122 | |
| | 17,009 | | | Tier REIT, Inc. (Real Estate Investment Trusts) | | | 247,821 | |
| | |
| | |
| The accompanying notes are an integral part of these financial statements. | | 49 |
GOLDMAN SACHS MULTI-MANAGER REAL ASSETS STRATEGY FUND
Consolidated Schedule of Investments (continued)
October 31, 2015
| | | | | | | | |
Shares | | | Description | | Value | |
| | | | | | | | |
| | Common Stocks – (continued) | |
| | United States – (continued) | |
| | 22,274 | | | UDR, Inc. (Real Estate Investment Trusts) | | $ | 767,562 | |
| | 17,700 | | | UIL Holdings Corp. (Electric Utilities) | | | 902,523 | |
| | 13,906 | | | Urban Edge Properties (Real Estate Investment Trusts) | | | 330,128 | |
| | 22,706 | | | Weingarten Realty Investors (Real Estate Investment Trusts) | | | 811,967 | |
| | 33,783 | | | Welltower, Inc. (Real Estate Investment Trusts) | | | 2,191,503 | |
| | 46,900 | | | Westar Energy, Inc. (Electric Utilities) | | | 1,861,930 | |
| | | | | | | | |
| | | | | | | 78,920,120 | |
| | |
| | TOTAL COMMON STOCKS | |
| | (Cost $145,009,717) | | $ | 148,376,552 | |
| | |
| | | | | | | | | | | | | | |
| | Short-term Investment(a) – 1.9% | | | | | |
| Joint Repurchase Agreement Account II | | | | | |
| $ | 3,800,000 | | | | 0.092 | % | | | 11/02/15 | | | $ | 3,800,000 | |
| | (Cost $3,800,000) | | | | | | | | | |
| | |
| | TOTAL INVESTMENTS – 77.1% | | | | | |
| | (Cost $148,809,717) | | | | | | | $ | 152,176,552 | |
| | |
| OTHER ASSETS IN EXCESS OF
LIABILITIES – 22.9% |
| | | 45,252,475 | |
| | |
| | NET ASSETS – 100.0% | | | $ | 197,429,027 | |
| | |
| | |
| The percentage shown for each investment category reflects the value of investments in that category as a percentage of net assets. |
* | | Non-income producing security. |
(a) | | Joint repurchase agreement was entered into on October 30, 2015. Additional information appears on page 52. |
| | |
|
Investment Abbreviations: |
LIBOR | | —London Interbank Offered Rate |
LLC | | —Limited Liability Company |
REIT | | —Real Estate Investment Trust |
|
|
| ADDITIONAL INVESTMENT INFORMATION |
FUTURES CONTRACTS — At October 31, 2015, the Fund had the following futures contracts:
| | | | | | | | | | | | | | |
| Type | | Number of
Contracts
Long (Short) | | | Expiration
Date | | Current
Value | | | Unrealized
Gain (Loss) | |
Brent Crude | | | 136 | | | December 2015 | | $ | 6,842,160 | | | $ | (6,271 | ) |
Brent Crude | | | 68 | | | January 2016 | | | 3,475,480 | | | | 55,156 | |
Cattle Feeder | | | 6 | | | January 2016 | | | 549,600 | | | | 8,995 | |
Cocoa | | | 5 | | | December 2015 | | | 162,950 | | | | 8,722 | |
Cocoa | | | 3 | | | March 2016 | | | 97,890 | | | | 2,509 | |
Coffee | | | 9 | | | December 2015 | | | 408,206 | | | | (39,019 | ) |
Copper | | | (10 | ) | | November 2015 | | | (1,282,750 | ) | | | (7,902 | ) |
Copper | | | 10 | | | November 2015 | | | 1,282,750 | | | | (16,517 | ) |
Copper | | | (7 | ) | | January 2016 | | | (895,300 | ) | | | 26,781 | |
Copper | | | 7 | | | January 2016 | | | 895,300 | | | | (475 | ) |
Copper | | | (5 | ) | | March 2016 | | | (638,188 | ) | | | 10,612 | |
Copper | | | 14 | | | March 2016 | | | 1,786,925 | | | | (29,388 | ) |
Copper | | | 4 | | | May 2016 | | | 509,925 | | | | (11,161 | ) |
Corn | | | 56 | | | December 2015 | | | 1,070,300 | | | | (3,910 | ) |
Corn | | | 58 | | | March 2016 | | | 1,135,350 | | | | 12,520 | |
Cotton No.2 | | | 19 | | | December 2015 | | | 601,540 | | | | (11,884 | ) |
Crude Oil | | | 50 | | | December 2015 | | | 2,373,500 | | | | 102,980 | |
| | |
| 50 | | The accompanying notes are an integral part of these financial statements. |
GOLDMAN SACHS MULTI-MANAGER REAL ASSETS STRATEGY FUND
|
| ADDITIONAL INVESTMENT INFORMATION (continued) |
FUTURES CONTRACTS (continued)
| | | | | | | | | | | | | | |
| Type | | Number of
Contracts
Long (Short) | | | Expiration
Date | | Current
Value | | | Unrealized
Gain (Loss) | |
| | | | | | | | | | | | | | |
Crude Oil | | | 81 | | | February 2016 | | $ | 3,964,950 | | | $ | 150,918 | |
Gasoline RBOB | | | 35 | | | December 2015 | | | 2,015,664 | | | | 96 | |
Gold | | | 14 | | | February 2016 | | | 1,599,220 | | | | 20,683 | |
Hard Red Winter Wheat | | | 45 | | | December 2015 | | | 1,110,938 | | | | 37,538 | |
Hard Red Winter Wheat | | | 12 | | | December 2015 | | | 296,250 | | | | (6,791 | ) |
Lead | | | (7 | ) | | November 2015 | | | (294,919 | ) | | | (5,612 | ) |
Lead | | | 7 | | | November 2015 | | | 294,919 | | | | (5,575 | ) |
Lead | | | 1 | | | January 2016 | | | 42,350 | | | | (309 | ) |
Lead | | | 6 | | | March 2016 | | | 255,375 | | | | 6,628 | |
Lean Hogs | | | 11 | | | December 2015 | | | 260,480 | | | | (28,401 | ) |
Lean Hogs | | | 26 | | | February 2016 | | | 652,600 | | | | (66,390 | ) |
Live Cattle | | | 16 | | | December 2015 | | | 907,040 | | | | 19,876 | |
Live Cattle | | | 14 | | | February 2016 | | | 803,180 | | | | 15,830 | |
Live Cattle | | | 10 | | | April 2016 | | | 568,500 | | | | 1,779 | |
Low Sulphur Gas Oil | | | 59 | | | December 2015 | | | 2,714,000 | | | | (62,709 | ) |
Natural Gas | | | 56 | | | November 2015 | | | 1,299,760 | | | | 18,758 | |
Nickel | | | (3 | ) | | November 2015 | | | (180,756 | ) | | | 256 | |
Nickel | | | 3 | | | November 2015 | | | 180,756 | | | | (10,673 | ) |
Nickel | | | (1 | ) | | January 2016 | | | (60,360 | ) | | | (1,311 | ) |
Nickel | | | 1 | | | January 2016 | | | 60,360 | | | | (2,181 | ) |
Nickel | | | (1 | ) | | March 2016 | | | (60,456 | ) | | | 2,721 | |
Nickel | | | 4 | | | March 2016 | | | 241,824 | | | | 1,249 | |
Nickel | | | 1 | | | May 2016 | | | 60,510 | | | | (2,733 | ) |
NY Harbor ULSD | | | 34 | | | December 2015 | | | 2,203,832 | | | | (56,769 | ) |
Primary Aluminum | | | (26 | ) | | November 2015 | | | (944,288 | ) | | | 66,600 | |
Primary Aluminum | | | 26 | | | November 2015 | | | 944,288 | | | | (107,728 | ) |
Primary Aluminum | | | (7 | ) | | January 2016 | | | (258,956 | ) | | | 3,125 | |
Primary Aluminum | | | 7 | | | January 2016 | | | 258,956 | | | | (22,787 | ) |
Primary Aluminum | | | (6 | ) | | March 2016 | | | (221,813 | ) | | | 10,147 | |
Primary Aluminum | | | 32 | | | March 2016 | | | 1,183,000 | | | | (63,787 | ) |
Primary Aluminum | | | 6 | | | May 2016 | | | 223,575 | | | | (10,403 | ) |
Silver | | | 3 | | | March 2016 | | | 234,225 | | | | 10,962 | |
Soybean | | | 26 | | | January 2016 | | | 1,151,475 | | | | (10,316 | ) |
Soybean | | | 5 | | | March 2016 | | | 222,188 | | | | 2,323 | |
Sugar No.11 | | | 36 | | | February 2016 | | | 585,446 | | | | 77,114 | |
Sugar No.11 | | | 18 | | | April 2016 | | | 285,667 | | | | 3,361 | |
Wheat | | | 30 | | | December 2015 | | | 783,000 | | | | 17,011 | |
Zinc | | | (7 | ) | | November 2015 | | | (296,538 | ) | | | 7,556 | |
Zinc | | | 7 | | | November 2015 | | | 296,538 | | | | (21,006 | ) |
Zinc | | | 4 | | | January 2016 | | | 170,775 | | | | (5,748 | ) |
Zinc | | | (2 | ) | | March 2016 | | | (85,875 | ) | | | 3,520 | |
Zinc | | | 4 | | | March 2016 | | | 171,750 | | | | 189 | |
Zinc | | | 2 | | | May 2016 | | | 86,250 | | | | (3,530 | ) |
| TOTAL | | | $ | 85,229 | |
| | |
| The accompanying notes are an integral part of these financial statements. | | 51 |
GOLDMAN SACHS STRATEGIC MULTI-ASSETS CLASS FUNDS
Schedule of Investments
October 31, 2015
|
| ADDITIONAL INVESTMENT INFORMATION |
JOINT REPURCHASE AGREEMENT ACCOUNT II — At October 31, 2015, the Funds had undivided interests in the Joint Repurchase Agreement Account II, with a maturity date of November 2, 2015, as follows:
| | | | | | | | | | | | |
| Fund | | Principal Amount | | | Maturity Value | | | Collateral
Allocation
Value | |
Multi-Manager Global Equity | | $ | 24,200,000 | | | $ | 24,200,124 | | | $ | 24,737,244 | |
Multi-Manager Non-Core Fixed Income | | | 31,500,000 | | | | 31,500,161 | | | | 32,199,306 | |
Multi-Manager Real Assets Strategy | | | 3,800,000 | | | | 3,800,019 | | | | 3,884,361 | |
REPURCHASE AGREEMENTS — At October 31, 2015, the Principal Amounts of the Funds’ interests in the Joint Repurchase Agreement Account II were as follows:
| | | | | | | | | | | | | | | | |
| Counterparty | | Interest Rate | | | Multi-Manager Global Equity | | | Multi-Manager Non-Core Fixed Income | | | Multi-Manager Real Assets
Strategy | |
BNP Paribas Securities Co. | | | 0.090 | % | | $ | 10,347,395 | | | $ | 13,468,717 | | | $ | 1,624,798 | |
Citigroup Global Markets, Inc. | | | 0.100 | | | | 5,324,370 | | | | 6,930,481 | | | | 836,058 | |
Merrill Lynch & Co., Inc. | | | 0.090 | | | | 8,528,235 | | | | 11,100,802 | | | | 1,339,144 | |
| TOTAL | | | | | | $ | 24,200,000 | | | $ | 31,500,000 | | | $ | 3,800,000 | |
At October 31, 2015, the Joint Repurchase Agreement Account II was fully collateralized by:
| | | | | | | | |
| Issuer | | Interest Rates | | | Maturity Dates | |
Federal Home Loan Bank | | | 0.625 | % | | | 12/28/16 | |
Federal Home Loan Mortgage Corp. | | | 1.000 to 7.500 | | | | 07/28/17 to 07/01/45 | |
Federal National Mortgage Association | | | 2.000 to 7.500 | | | | 04/01/16 to 11/01/45 | |
Government National Mortgage Association | | | 3.000 to 6.000 | | | | 05/15/18 to 10/20/45 | |
United States Treasury Inflation Protected Securities | | | 1.875 | | | | 07/15/19 | |
U.S. Treasury Notes | | | 1.000 | | | | 09/30/19 | |
United States Treasury Stripped Securities | | | 0.000 | | | | 05/15/34 to 11/15/36 | |
| | |
| 52 | | The accompanying notes are an integral part of these financial statements. |
GOLDMAN SACHS STRATEGIC MULTI-ASSET CLASS FUNDS
Statements of Assets and Liabilities
October 31, 2015
| | | | | | | | | | | | | | |
| | | | | Multi-Manager
Global Equity
Fund | | | Multi-Manager
Non-Core Fixed
Income Fund | | | Multi-Manager
Real Assets
Strategy Fund(a) | |
| | Assets: | | | | | | | | | | | | |
| | Investments, at value (cost $428,513,577, $247,588,311 and $145,009,717) | | $ | 414,749,555 | | | $ | 241,471,305 | | | $ | 148,376,552 | |
| | Repurchase agreement, at value which equals cost | | | 24,200,000 | | | | 31,500,000 | | | | 3,800,000 | |
| | Cash | | | 1,897,615 | | | | — | | | | 37,941,134 | |
| | Foreign currencies, at value (cost $27,954, $1,603,989 and $1,513,373) | | | 27,815 | | | | 1,610,985 | | | | 1,512,823 | |
| | Unrealized gain on forward foreign currency exchange contracts | | | 699,042 | | | | 268,937 | | | | — | |
| | Unrealized gain on swap contracts | | | — | | | | 75,112 | | | | — | |
| | Variation margin on certain derivative contracts | | | — | | | | 69,850 | | | | 1,295,595 | |
| | Receivables: | | | | | | | | | | | | |
| | Investments sold | | | 366,740 | | | | 3,407,237 | | | | 1,337,427 | |
| | Investments sold on an extended — settlement basis | | | 174,833 | | | | 1,388,913 | | | | — | |
| | Dividends and interest | | | 276,098 | | | | 3,103,507 | | | | 189,908 | |
| | Foreign tax reclaims | | | 27,511 | | | | 23,290 | | | | 4,612 | |
| | Reimbursement from investment adviser | | | 25,886 | | | | — | | | | 45,510 | |
| | Due from broker — upfront payment | | | — | | | | 16,930 | | | | — | |
| | Collateral on certain derivative contracts(b) | | | — | | | | 368,770 | | | | 3,710,414 | |
| | Upfront payments made on swap contracts | | | — | | | | 33,399 | | | | — | |
| | Other assets | | | — | | | | — | | | | 13,764 | |
| | Total assets | | | 442,445,095 | | | | 283,338,235 | | | | 198,227,739 | |
| | | | | | | | | | | | | | |
| | Liabilities: | | | | |
| | Due to custodian | | | — | | | | 75,428 | | | | — | |
| | Unrealized loss on forward foreign currency exchange contracts | | | 334,203 | | | | 499,412 | | | | — | |
| | Unrealized loss on swap contracts | | | — | | | | 13,111 | | | | — | |
| | Payables: | | | | | | | | | | | | |
| | Investments purchased | | | 2,379,255 | | | | 1,022,029 | | | | 586,675 | |
| | Investments purchased on an extended — settlement basis | | | 14,708 | | | | 10,642,992 | | | | — | |
| | Management fees | | | 235,531 | | | | 138,918 | | | | — | |
| | Transfer agency fees | | | 25,774 | | | | 21,041 | | | | 9,670 | |
| | Due to broker | | | — | | | | 92,287 | | | | — | |
| | Accrued expenses | | | 301,084 | | | | 145,872 | | | | 202,367 | |
| | Total liabilities | | | 3,290,555 | | | | 12,651,090 | | | | 798,712 | |
| | | | | | | | | | | | | | |
| | Net Assets: | | | | |
| | Paid-in capital | | | 452,000,005 | | | | 279,880,283 | | | | 197,053,313 | |
| | Undistributed (distributions in excess of) net investment income | | | 1,604,703 | | | | (1,244,225 | ) | | | 52,137 | |
| | Accumulated net realized loss | | | (1,049,361 | ) | | | (1,684,811 | ) | | | (3,129,170 | ) |
| | Net unrealized gain (loss) | | | (13,400,807 | ) | | | (6,264,102 | ) | | | 3,452,747 | |
| | NET ASSETS | | $ | 439,154,540 | | | $ | 270,687,145 | | | $ | 197,429,027 | |
| | Shares Outstanding $0.001 par value (unlimited number of shares authorized): | | | 46,415,557 | | | | 28,874,345 | | | | 20,625,770 | |
| | Net asset value, offering and redemption price per share: | | | $9.46 | | | | $9.37 | | | | $9.57 | |
| | (a) | | Statement of Assets and Liabilities for the Multi-Manager Real Assets Strategy Fund is consolidated and includes the balances of a wholly-owned subsidiary, Cayman Commodity — MMRA, Ltd. Accordingly, all interfund balances and transactions have been eliminated. |
| | (b) | | Includes amounts segregated for initial margin and/or collateral on futures transactions, swaps transactions and forwards transactions of $44,085, $54,685 and $270,000, respectively for Multi-Manager Non-Core Fixed Income Fund and $3,710,414, $0, and $0, respectively for Multi-Manager Real Assets Strategy Fund. |
| | |
| The accompanying notes are an integral part of these financial statements. | | 53 |
GOLDMAN SACHS STRATEGIC MULTI-ASSET CLASS FUNDS
Statements of Operations
For the Period Ended October 31, 2015
| | | | | | | | | | | | | | |
| | | | | Multi-Manager
Global Equity
Fund(a) | | | Multi-Manager
Non-Core Fixed
Income Fund(b) | | | Multi-Manager
Real Assets
Strategy Fund(c) | |
| | Investment income: | |
| | Dividends (net of foreign withholding taxes of $88,510, $0 and $28,015) | | $ | 2,043,821 | | | $ | 122,254 | | | $ | 755,785 | |
| | Interest (net of foreign withholding taxes of $0, $47,954 and $0) | | | 11,324 | | | | 5,296,532 | | | | 2,384 | |
| | Total investment income | | | 2,055,145 | | | | 5,418,786 | | | | 758,169 | |
| | | | | | | | | | | | | | |
| | Expenses: | |
| | Management fees | | | 1,327,378 | | | | 894,216 | | | | 483,489 | |
| | Custody, accounting and administrative services | | | 280,133 | | | | 167,132 | | | | 77,481 | |
| | Professional fees | | | 77,930 | | | | 106,193 | | | | 116,440 | |
| | Printing and mailing costs | | | 30,152 | | | | 42,511 | | | | 30,000 | |
| | Transfer Agency fees | | | 25,774 | | | | 21,041 | | | | 9,670 | |
| | Trustee fees | | | 18,179 | | | | 32,333 | | | | 18,087 | |
| | Other | | | 1,309 | | | | 6,783 | | | | 3,704 | |
| | Total expenses | | | 1,760,855 | | | | 1,270,209 | | | | 738,871 | |
| | Less — expense reductions | | | (665,438 | ) | | | (533,270 | ) | | | (303,574 | ) |
| | Net expenses | | | 1,095,417 | | | | 736,939 | | | | 435,297 | |
| | NET INVESTMENT INCOME | | | 959,728 | | | | 4,681,847 | | | | 322,872 | |
| | | | | | | | | | | | | | |
| | Realized and unrealized gain (loss): | |
| | Net realized gain (loss) from: | | | | | | | | | | | | |
| | Investments | | | (990,885 | ) | | | (2,849,528 | ) | | | (3,131,111 | ) |
| | Futures contracts | | | — | | | | (24,357 | ) | | | (4,563,119 | ) |
| | Swap contracts | | | — | | | | 409 | | | | — | |
| | Forward foreign currency exchange contracts | | | 662,733 | | | | 217,611 | | | | (50,458 | ) |
| | Foreign currency transactions | | | (76,234 | ) | | | (524,740 | ) | | | 98,091 | |
| | Net unrealized gain (loss) on: | | | | | | | | | | | | |
| | Investments | | | (13,764,022 | ) | | | (6,117,006 | ) | | | 3,366,835 | |
| | Futures contracts | | | — | | | | 28,581 | | | | 85,229 | |
| | Swap contracts | | | — | | | | 66,398 | | | | — | |
| | Forward foreign currency exchange contracts | | | 364,839 | | | | (230,475 | ) | | | — | |
| | Foreign currency translation | | | (1,624 | ) | | | (11,600 | ) | | | 683 | |
| | Net realized and unrealized loss | | | (13,805,193 | ) | | | (9,444,707 | ) | | | (4,193,850 | ) |
| | NET DECREASE IN NET ASSETS RESULTING FROM OPERATIONS | | $ | (12,845,465 | ) | | $ | (4,762,860 | ) | | $ | (3,870,978 | ) |
| | (a) | | Commenced operations on June 24, 2015. |
| | (b) | | Commenced operations on March 31, 2015. |
| | (c) | | Commenced operations on June 30, 2015. Statement of Operations for the Multi-Manager Real Assets Strategy Fund is consolidated and includes the balances of a wholly-owned subsidiary, Cayman Commodity — MMRA, Ltd. Accordingly, all interfund balances and transactions have been eliminated. |
| | |
| 54 | | The accompanying notes are an integral part of these financial statements. |
GOLDMAN SACHS STRATEGIC MULTI-ASSET CLASS FUNDS
Statements of Changes in Net Assets
For the Period Ended October 31, 2015
| | | | | | | | | | | | | | |
| | | | | Multi-Manager
Global Equity
Fund(a) | | | Multi-Manager
Non-Core Fixed
Income Fund(b) | | | Multi-Manager
Real Assets
Strategy Fund(c) | |
| | From operations: | |
| | Net investment income | | $ | 959,728 | | | $ | 4,681,847 | | | $ | 322,872 | |
| | Net realized loss | | | (404,386 | ) | | | (3,180,605 | ) | | | (7,646,597 | ) |
| | Net unrealized gain (loss) | | | (13,400,807 | ) | | | (6,264,102 | ) | | | 3,452,747 | |
| | Net decrease in net assets resulting from operations | | | (12,845,465 | ) | | | (4,762,860 | ) | | | (3,870,978 | ) |
| | | | | | | | | | | | | | |
| | Distributions to shareholders: | |
| | From net investment income | | | | | | | | | | | | |
| | Institutional Shares | | | — | | | | (4,430,278 | ) | | | — | |
| | From Capital | | | | | | | | | | | | |
| | Institutional Shares | | | — | | | | (181,066 | ) | | | — | |
| | Total distributions to shareholders | | | — | | | | (4,611,344 | ) | | | — | |
| | | | | | | | | | | | | | |
| | From share transactions: | |
| | Proceeds from sales of shares | | | 453,850,015 | | | | 277,000,010 | | | | 201,300,015 | |
| | Reinvestment of distributions | | | — | | | | 4,611,344 | | | | — | |
| | Cost of shares redeemed | | | (1,850,010 | ) | | | (1,550,005 | ) | | | (10 | ) |
| | Net increase in net assets resulting from share transactions | | | 452,000,005 | | | | 280,061,349 | | | | 201,300,005 | |
| | TOTAL INCREASE | | | 439,154,540 | | | | 270,687,145 | | | | 197,429,027 | |
| | | | | | | | | | | | | | |
| | Net assets: | |
| | Beginning of period | | | — | | | | — | | | | — | |
| | End of period | | $ | 439,154,540 | | | $ | 270,687,145 | | | $ | 197,429,027 | |
| | Undistributed (distributions in excess of) net investment income | | $ | 1,604,703 | | | $ | (1,244,225 | ) | | $ | 52,137 | |
| | (a) | | Commenced operations on June 24, 2015. |
| | (b) | | Commenced operations on March 31, 2015. |
| | (c) | | Commenced operations on June 30, 2015. Statement of Changes in Net Assets for the Multi-Manager Real Assets Strategy Fund is consolidated and includes the balances of wholly-owned subsidiary, CaymanCommodity — MMRA, Ltd. Accordingly, all interfund balances and transactions have been eliminated. |
| | |
| The accompanying notes are an integral part of these financial statements. | | 55 |
GOLDMAN SACHS MULTI-MANAGER GLOBAL EQUITY FUND
Financial Highlights
Selected Data for a Share Outstanding Throughout The Period
| | | | | | | | | | | | | | | | | | |
| | | | | | | | Income (loss) from
investment operations | |
| | | Year - Share Class | | Net asset
value,
beginning
of period | | | Net
investment
income(a) | | | Net realized
and unrealized
gain (loss) | | | Total from
investment
operations | |
| | FOR THE PERIOD ENDED OCTOBER 31, | |
| | 2015 - Institutional (Commenced June 24, 2015) | | $ | 10.00 | | | $ | 0.02 | | | $ | (0.56 | ) | | $ | (0.54 | ) |
| | (a) | | Calculated based on the average shares outstanding methodology. |
| | (b) | | Assumes investment at the NAV at the beginning of the period, reinvestment of all dividends and distributions, a complete redemption of the investment at the NAV at the end of the period and no sales or redemption charges. Total returns would be reduced if a sales or redemption charge was taken into account. Returns do not reflect the deduction of taxes that a shareholder would pay on Fund distributions or the redemption of Fund shares. Total returns for periods less than one full year are not annualized. |
| | (d) | | The Fund’s portfolio turnover rate is calculated in accordance with regulatory requirements, without regard to transactions involving short term investments and certain derivatives. If such transactions were included, the Fund’s portfolio turnover rate may be higher. |
| | |
| 56 | | The accompanying notes are an integral part of these financial statements. |
GOLDMAN SACHS MULTI-MANAGER GLOBAL EQUITY FUND
| | | | | | | | | | | | | | | | | | | | | | | | | | | | | | | | | | | | | | | | |
| | | | | | | | | | | | | | | | | | | | | | | | | | | | | | | | | | |
| | | Net asset
value, end
of period | | | | | Total
return(b) | | | | | Net assets,
end of
period
(in 000s) | | | | | Ratio of
net expenses
to average
net assets(c) | | | | | Ratio of
total expenses
to average
net assets(c) | | | | | Ratio of
net investment
income
to average
net assets(c) | | | | | Portfolio
turnover
rate(d) | |
| | | | | | | | | | | | | | | | | | | | | | | | | | | | | | | | | | | | | | | | |
| | $ | 9.46 | | | | | | (5.40 | )% | | | | $ | 439,155 | | | | | | 0.85 | % | | | | | 1.34 | % | | | | | 0.74 | % | | | | | 10 | % |
| | |
| The accompanying notes are an integral part of these financial statements. | | 57 |
GOLDMAN SACHS MULTI-MANAGER NON-CORE FIXED INCOME FUND
Financial Highlights
Selected Data for a Share Outstanding Throughout the Period
| | | | | | | | | | | | | | | | | | | | | | | | | | | | | | |
| | | | | | | | Income (loss) from
investment operations | | | Distributions to shareholders | |
| | | Year - Share Class | |
Net asset
value,
beginning
of period | | | Net
investment
income(a) | | | Net realized
and unrealized
gain (loss) | | | Total from
investment
operations | | | From net
investment
income | | | From
capital | | | Total
distributions | |
| | FOR THE PERIOD ENDED OCTOBER 31, | | | | | | | | | | | | | | | | | |
| | 2015 - Institutional (Commenced March 31, 2015) | | $ | 10.00 | | | $ | 0.25 | | | $ | (0.63 | ) | | $ | (0.38 | ) | | $ | (0.24 | ) | | $ | (0.01 | ) | | $ | (0.25 | ) |
| | (a) | | Calculated based on the average shares outstanding methodology. |
| | (b) | | Assumes investment at the NAV at the beginning of the period, reinvestment of all dividends and distributions, a complete redemption of the investment at the NAV at the end of the period and no sales or redemption charges. Total returns would be reduced if a sales or redemption charge was taken into account. Returns do not reflect the deduction of taxes that a shareholder would pay on Fund distributions or the redemption of Fund shares. Total returns for periods less than one full year are not annualized. |
| | (d) | | The Fund’s portfolio turnover rate is calculated in accordance with regulatory requirements, without regard to transactions involving short term investments and certain derivatives. If such transactions were included, the Fund’s portfolio turnover rate may be higher. |
| | |
| 58 | | The accompanying notes are an integral part of these financial statements. |
GOLDMAN SACHS MULTI-MANAGER NON-CORE FIXED INCOME FUND
| | | | | | | | | | | | | | | | | | | | | | | | | | | | | | | | | | | | | | | | |
| | | | | | | | | | | | | | | | | | | | | | | | | | | | | | | | | | |
| | | Net asset
value, end
of period | | | | | Total
return(b) | | | | | Net assets,
end of
period
(in 000s) | | | | | Ratio of
net expenses
to average
net assets(c) | | | | | Ratio of
total expenses
to average
net assets(c) | | | | | Ratio of
net investment
income
to average
net assets(c) | | | | | Portfolio
turnover
rate(d) | |
| | | | | | | | | | | | | | | | | | | | | | | | | | | | | | | | | | | | | | | | |
| | $ | 9.37 | | | | | | (3.84 | )% | | | | $ | 270,687 | | | | | | 0.70 | % | | | | | 1.19 | % | | | | | 4.45 | % | | | | | 82 | % |
| | |
| The accompanying notes are an integral part of these financial statements. | | 59 |
GOLDMAN SACHS MULTI-MANAGER REAL ASSETS STRATEGY FUND
Financial Highlights
Selected Data for a Share Outstanding Throughout The Period
| | | | | | | | | | | | | | | | | | |
| | | | | | | | Income (loss) from
investment operations | |
| | | Year | | Net asset
value,
beginning
of period | | | Net
investment
income(a) | | | Net realized
and unrealized
gain (loss) | | | Total from
investment
operations | |
| | FOR THE PERIOD ENDED OCTOBER 31, | |
| | 2015 - Institutional (Commenced June 30, 2015) | | $ | 10.00 | | | $ | 0.02 | | | $ | (0.45 | ) | | $ | (0.43 | ) |
| | (a) | | Calculated based on the average shares outstanding methodology. |
| | (b) | | Assumes investment at the net asset value at the beginning of the period, reinvestment of all dividends and distributions, a complete redemption of the investment at the net asset value at the end of the period and no sales or redemption charges. Total returns would be reduced if a sales or redemption charge was taken into account. Returns do not reflect the deduction of taxes that a shareholder would pay on Fund distributions or the redemption of Fund shares. Total returns for periods less than one full year are not annualized. |
| | (d) | | The Fund’s portfolio turnover rate is calculated in accordance with regulatory requirements, without regard to transactions involving short term investments and certain derivatives. If such transactions were included, the Fund’s portfolio turnover rate may be higher. |
| | |
| 60 | | The accompanying notes are an integral part of these financial statements. |
GOLDMAN SACHS MULTI-MANAGER REAL ASSETS STRATEGY FUND
| | | | | | | | | | | | | | | | | | | | | | | | | | | | | | | | | | | | | | | | |
| | | | | | | | | | | | | | | | | | | | | | | | | | | | | | | | | | |
| | | Net asset
value, end
of period | | | | | Total
return(b) | | | | | Net assets,
end of
period
(in 000s) | | | | | Ratio of
net expenses
to average
net assets(c) | | | | | Ratio of
total expenses
to average
net assets(c) | | | | | Ratio of
net investment
income
to average
net assets(c) | | | | | Portfolio
turnover
rate(d) | |
| | | | | | | | | | | | | | | | | | | | | | | | | | | | | | | | | | | | | | | | |
| | $ | 9.57 | | | | | | (4.30 | )% | | | | $ | 197,429 | | | | | | 0.90 | % | | | | | 1.42 | % | | | | | 0.67 | % | | | | | 35 | % |
| | |
| The accompanying notes are an integral part of these financial statements. | | 61 |
GOLDMAN SACHS STRATEGIC MULTI-ASSET CLASS FUNDS
Notes to Financial Statements
October 31, 2015
Goldman Sachs Trust II (the “Trust”) is a Delaware statutory trust registered under the Investment Company Act of 1940, as amended (the “Act”), as an open-end management investment company. The following table lists those series of the Trust that are included in this report (collectively, the “Funds” or individually a “Fund”), along with their corresponding share classes and respective diversification status under the Act:
| | | | |
| Fund | | Share Classes Offered | | Diversified/ Non-diversified |
Multi-Manager Global Equity Fund (Commenced June 24, 2015) | | Institutional | | Diversified |
Multi-Manager Non-Core Fixed Income Fund (Commenced March 31, 2015) | | Institutional | | Non-diversified |
Multi-Manager Real Assets Strategy Fund (Commenced June 30, 2015) | | Institutional | | Diversified |
Goldman Sachs Asset Management, L.P. (“GSAM”), an affiliate of Goldman, Sachs & Co. (“Goldman Sachs”), serves as investment adviser to the Fund pursuant to a management agreement (the “Agreement”) with the Trust. As of October 31, 2015, GSAM had sub-advisory agreements (the “Sub-Advisory Agreements”) for the Multi-Manager Global Equity Fund with Causeway Capital Management LLC, Epoch Investment Partners, Inc., Fisher Asset Management, LLC, GW&K Investment Management, LLC, Parametric Portfolio Associates LLC, Robeco Investment Management, Inc., doing business as Boston Partners, Russell Implementation Services Inc., Scharf Investments, LLC, Vulcan Value Partners, LLC and WCM Investment Management; for the Multi-Manager Non-Core Fixed Income Fund with Ares Capital Management II, LLC, BlueBay Asset Management, LLP, Lazard Asset Management LLC and Symphony Asset Management LLC; and for the Multi-Manager Real Assets Strategy Fund with Prudential Real Estate Investors, a business unit of Prudential Investment Management Inc. and RREEF America L.L.C. and Gresham Investment Management LLC (for the Subsidiary, as defined below) (the “Underlying Managers”). Pursuant to the terms of the Sub-Advisory Agreements, the Underlying Managers are responsible for making investment decisions and managing the investments of the Fund. GSAM compensates the Underlying Managers directly in accordance with the terms of the Sub-Advisory Agreements. The Funds are not charged any separate or additional investment advisory fees by the Underlying Managers.
|
| 2. SIGNIFICANT ACCOUNTING POLICIES |
The financial statements have been prepared in accordance with accounting principles generally accepted in the United States of America (“GAAP”) and require management to make estimates and assumptions that may affect the reported amounts and disclosures. Actual results may differ from those estimates and assumptions.
A. Basis of Consolidation for Multi-Manager Real Assets Strategy Fund — The Cayman Commodity-MMRA, Ltd., (the “Subsidiary”), a Cayman Islands exempted company, was incorporated on February 20, 2015 and is currently a wholly-owned subsidiary of the Multi-Manager Real Assets Strategy Fund (the “Fund”). The Subsidiary acts as an investment vehicle for the Fund to enable the Fund to gain exposure to certain types of commodity-linked derivative instruments. The Fund is the sole shareholder of the Subsidiary pursuant to a subscription agreement dated as of June 30, 2015, and it is intended that the Fund will remain the sole shareholder and will continue to control the Subsidiary. Under the Memorandum and Articles of Association of the Subsidiary, shares issued by the Subsidiary confer upon a shareholder the right to vote at general meetings of the Subsidiary and certain rights in connection with any winding-up or repayment of capital, as well as the right to participate in the profits or assets of the Subsidiary. All inter-fund balances and transactions have been eliminated in consolidation. As of October 31, 2015, the Fund’s net assets were $197,383,707, of which, $42,908,468, or 22%, represented the Subsidiary’s net assets.
B. Investment Valuation — The Funds’ valuation policy is to value investments at fair value.
62
GOLDMAN SACHS STRATEGIC MULTI-ASSET CLASS FUNDS
|
| 2. SIGNIFICANT ACCOUNTING POLICIES (continued) |
C. Investment Income and Investments — Investment income includes interest income and dividend income, net of any foreign withholding taxes, less any amounts reclaimable. Interest income is accrued daily and adjusted for amortization of premiums and accretion of discounts. Dividend income is recognized on ex-dividend date or, for certain foreign securities, as soon as such information is obtained subsequent to the ex-dividend date. Investment transactions are reflected on trade date. Realized gains and losses are calculated using identified cost. Investment transactions are recorded on the following business day for daily net asset value (“NAV”) calculations. Any foreign capital gains tax is accrued daily based upon net unrealized gains, and is payable upon sale of such investments. Distributions received from the Funds’ investments in U.S. real estate investment trusts (“REITs”) may be characterized as ordinary income, net capital gain or a return of capital. A return of capital is recorded by the Funds as a reduction to the cost basis of the REIT.
For derivative contracts, realized gains and losses are recorded upon settlement of the contract. Upfront payments, if any, are made or received upon entering into a swap agreement and are reflected in the Statement of Assets and Liabilities. Upfront payments are recognized over the contract’s term/event as realized gains or losses, with the exception of forward starting interest rate swaps whose realized gains or losses are recognized from the effective start date.
For securities with paydown provisions, principal payments received are treated as a proportionate reduction to the cost basis of the securities, and excess or shortfall amounts are recorded as income.
D. Expenses — Expenses incurred directly by a Fund are charged to the Fund, and certain expenses incurred by the Trust are allocated across the applicable Funds on a straight-line and/or pro-rata basis, depending upon the nature of the expenses, and are accrued daily.
E. Offering and Organization Costs — Offering costs paid in connection with the initial offering of shares of the Funds and organization costs paid in connection with the organization of the Funds were borne directly by GSAM.
F. Federal Taxes and Distributions to Shareholders — It is each Fund’s policy to comply with the requirements of the Internal Revenue Code of 1986, as amended (the “Code”), applicable to regulated investment companies (mutual funds) and to distribute each year substantially all of its investment company taxable income and capital gains to its shareholders. Accordingly, the Funds are not required to make any provisions for the payment of federal income tax. Distributions to shareholders are recorded on the ex-dividend date. Income and capital gains distributions, if any, are declared and paid according to the following schedule:
| | | | | | |
| Fund | | | | Income Distributions Declared/Paid | | Capital Gains Distributions Declared/Paid |
Multi-Manager Global Equity | | | | Annually | | Annually |
Multi-Manager Non-Core Fixed Income | | | | Daily/Monthly | | Annually |
Multi-Manager Real Assets Strategy | | | | Quarterly | | Annually |
Net capital losses are carried forward to future fiscal years and may be used to the extent allowed by the Code to offset any future capital gains. Losses that are carried forward will retain their character as either short-term or long-term capital losses. Utilization of capital loss carryforwards will reduce the requirement of future capital gains distributions.
The characterization of distributions to shareholders for financial reporting purposes is determined in accordance with federal income tax rules, which may differ from GAAP. The source of each Fund’s distributions may be shown in the accompanying financial statements as either from net investment income, net realized gain or capital. Certain components of the Funds’ net assets on the Statements of Assets and Liabilities reflect permanent GAAP/tax differences based on the appropriate tax character.
G. Foreign Currency Translation —The accounting records and reporting currency of the Funds are maintained in U.S. dollars. Assets and liabilities denominated in foreign currencies are translated into U.S. dollars using the current exchange rates at the close of each business day. The effect of changes in foreign currency exchange rates on investments is included within net realized and unrealized gain (loss) on investments. Changes in the value of other assets and liabilities as a result of fluctuations in foreign
63
GOLDMAN SACHS STRATEGIC MULTI-ASSET CLASS FUNDS
Notes to Financial Statements (continued)
October 31, 2015
|
| 2. SIGNIFICANT ACCOUNTING POLICIES (continued) |
exchange rates are included in the Statements of Operations within net change in unrealized gain (loss) on foreign currency translations. Transactions denominated in foreign currencies are translated into U.S. dollars on the date the transaction occurred, the effects of which are included within net realized gain (loss) on foreign currency transactions.
|
| 3. INVESTMENTS AND FAIR VALUE MEASUREMENTS |
The fair value of a financial instrument is the amount that would be received to sell an asset or paid to transfer a liability in an orderly transaction between market participants at the measurement date (i.e., the exit price). GAAP establishes a fair value hierarchy that prioritizes the inputs to valuation techniques used to measure fair value. The hierarchy gives the highest priority to unadjusted quoted prices in active markets for identical assets or liabilities (Level 1 measurements) and the lowest priority to unobservable inputs (Level 3 measurements). The levels used for classifying investments are not necessarily an indication of the risk associated with investing in these investments. The three levels of the fair value hierarchy are described below:
Level 1 — Unadjusted quoted prices in active markets that are accessible at the measurement date for identical, unrestricted assets or liabilities;
Level 2 — Quoted prices in markets that are not active or financial instruments for which significant inputs are observable (including, but not limited to, quoted prices for similar investments, interest rates, foreign exchange rates, volatility and credit spreads), either directly or indirectly;
Level 3 — Prices or valuations that require significant unobservable inputs (including GSAM’s assumptions in determining fair value measurement).
Changes in valuation techniques may result in transfers into or out of an assigned level within the hierarchy. In accordance with the Funds’ policy, transfers between different levels of the fair value hierarchy resulting from such changes are deemed to have occurred as of the beginning of the reporting period.
The Board of Trustees (“Trustees”) has approved Valuation Procedures that govern the valuation of the portfolio investments held by the Funds, including investments for which market quotations are not readily available. The Trustees have delegated to GSAM day-to-day responsibility for implementing and maintaining internal controls and procedures related to the valuation of the Funds’ portfolio investments. To assess the continuing appropriateness of pricing sources and methodologies, GSAM regularly performs price verification procedures and issues challenges as necessary to third party pricing vendors or brokers, and any differences are reviewed in accordance with the Valuation Procedures.
A. Level 1 and Level 2 Fair Value Investments — The valuation techniques and significant inputs used in determining the fair values for investments classified as Level 1 and Level 2 are as follows:
Equity Securities — Equity securities and investment companies traded on a United States (“U.S.”) securities exchange or the NASDAQ system, or those located on certain foreign exchanges, including but not limited to the Americas, are valued daily at their last sale price or official closing price on the principal exchange or system on which they are traded. If there is no sale or official closing price or such price is believed by GSAM to not represent fair value, equity securities and exchange traded investment companies are valued at the last bid price for long positions and at the last ask price for short positions. Investments in investment companies (other than those that are exchange traded) are valued at the NAV on the valuation date. To the extent these investments are actively traded, they are classified as Level 1 of the fair value hierarchy, otherwise they are generally classified as Level 2.
Unlisted equity securities for which market quotations are available are valued at the last sale price on the valuation date, or if no sale occurs, at the last bid price. Securities traded on certain foreign securities exchanges are valued daily at fair value determined by an independent fair value service (if available) under Valuation Procedures approved by the Trustees and consistent with applicable regulatory guidance. The independent fair value service takes into account multiple factors including, but not limited to, movements in the securities markets, certain depositary receipts, futures contracts and foreign currency exchange rates
64
GOLDMAN SACHS STRATEGIC MULTI-ASSET CLASS FUNDS
|
| 3. INVESTMENTS AND FAIR VALUE MEASUREMENTS (continued) |
that have occurred subsequent to the close of the foreign securities exchange. These investments are generally classified as Level 2 of the fair value hierarchy.
Debt Securities — Debt securities for which market quotations are readily available are valued daily on the basis of quotations supplied by dealers or an independent pricing service approved by the Trustees. The pricing services may use valuation models or matrix pricing, which consider: (i) yield or price with respect to bonds that are considered comparable in characteristics such as rating, interest rate and maturity date or (ii) quotations from securities dealers to determine current value. Short-term debt obligations that mature in sixty days or less and that do not exhibit signs of credit deterioration are valued at amortized cost, which approximates fair value. With the exception of treasury securities of G8 countries (not held in money market funds), which are generally classified as Level 1, these investments are generally classified as Level 2 of the fair value hierarchy.
i. Senior Term Loans — Senior term loans (“Loans”) are interests in amounts owed by corporate, governmental, or other borrowers to lenders or lending syndicates. Loans are arranged through private negotiations between the borrower and one or more financial institutions (“Lenders”). A Fund’s investments in Loans are in the form of either participations in Loans (“Participations”) or assignments of all or a portion of Loans from third parties (“Assignments”). With respect to Participations, a Fund has the right to receive payments of principal, interest and any fees to which it is entitled from the Lender selling the Participations and only upon receipt by the Lender of the payments from the borrower. A Fund generally has no right to enforce compliance by the borrower with the terms of the loan agreement with respect to Participations. Conversely, Assignments result in a Fund having a direct contractual relationship with the borrower, and the Fund may be permitted to enforce compliance by the borrower with the terms of the loan agreement.
Derivative Contracts — A derivative is an instrument whose value is derived from underlying assets, indices, reference rates or a combination of these factors. The Funds enter into derivative transactions to hedge against changes in interest rates, securities prices, and/or currency exchange rates, to increase total return, or to gain access to certain markets or attain exposure to other underliers.
Exchange-traded derivatives, including futures and options contracts, are valued at the last sale or settlement price and typically fall within Level 1 of the fair value hierarchy. Over-the-counter (“OTC”) and centrally cleared derivatives are valued using market transactions and other market evidence, including market-based inputs to models, calibration to market-clearing transactions, broker or dealer quotations, or other alternative pricing sources. Where models are used, the selection of a particular model to value OTC and centrally cleared derivatives depends upon the contractual terms of, and specific risks inherent in, the instrument, as well as the availability of pricing information in the market. Valuation models require a variety of inputs, including contractual terms, market prices, yield curves, credit curves, measures of volatility, voluntary and involuntary prepayment rates, loss severity rates and correlations of such inputs. For OTC and centrally cleared derivatives that trade in liquid markets, model inputs can generally be verified and model selection does not involve significant management judgment. OTC and centrally cleared derivatives are classified within Level 2 of the fair value hierarchy when significant inputs are corroborated by market evidence.
i. Forward Contracts — A forward contract is a contract between two parties to buy or sell an asset at a specified price on a future date. A forward contract settlement can occur on a cash or delivery basis. Forward contracts are marked-to-market daily using independent vendor prices, and the change in value, if any, is recorded as an unrealized gain or loss. Cash and certain investments may be used to collateralize forward contracts.
A forward foreign currency contract is a forward contract in which a Fund agrees to receive or deliver a fixed quantity of one currency for another, at a pre-determined price at a future date. All forward foreign currency exchange contracts are marked-to-market daily at the applicable forward rate. Non-deliverable forward foreign currency exchange contracts are settled with the counterparty in cash without the delivery of foreign currency.
ii. Futures Contracts — Futures contracts are contracts to buy or sell a standardized quantity of a specified commodity or security and are valued based on exchanged settlement prices or independent market quotes. Futures contracts are valued at the last settlement price, or in the absence of a sale, the last bid price for long positions and at the last ask price for short positions, at the end of each day on the board of trade or exchange upon which they are traded. Upon entering into a futures
65
GOLDMAN SACHS STRATEGIC MULTI-ASSET CLASS FUNDS
Notes to Financial Statements (continued)
October 31, 2015
|
| 3. INVESTMENTS AND FAIR VALUE MEASUREMENTS (continued) |
contract, a Fund deposits cash or securities in an account on behalf of the broker in an amount sufficient to meet the initial margin requirement. Subsequent payments are made or received by a Fund equal to the daily change in the contract value and are recorded as variation margin receivable or payable with a corresponding offset to unrealized gains or losses.
iii. Swap Contracts — Bilateral swap contracts are agreements in which a Fund and a counterparty agree to exchange periodic payments on a specified notional amount or make a net payment upon termination. Bilateral swap transactions are privately negotiated in the OTC market and payments are settled through direct payments between a Fund and the counterparty. By contrast, certain swap transactions are subject to mandatory central clearing. These swaps are executed through a derivatives clearing member (“DCM”), acting in an agency capacity, and submitted to a central counterparty (“CCP”)(“centrally cleared swaps”), in which case all payments are settled with the CCP through the DCM. Swaps are marked-to-market daily using pricing vendor quotations, counterparty or clearinghouse prices or model prices, and the change in value, if any, is recorded as an unrealized gain or loss. Upon entering into a swap contract, a Fund is required to satisfy an initial margin requirement by delivering cash or securities to the counterparty (or in some cases, segregated in a triparty account on behalf of the counterparty), which can be adjusted by any mark-to-market gains or losses pursuant to bilateral or centrally cleared arrangements. For centrally cleared swaps the daily change in valuation, if any, is recorded as a receivable or payable for variation margin.
An interest rate swap is an agreement that obligates two parties to exchange a series of cash flows at specified intervals, based upon or calculated by reference to changes in interest rates on a specified notional principal amount. The payment flows are usually netted against each other, with the difference being paid by one party to the other.
A credit default swap is an agreement that involves one party (the buyer of protection) making a stream of payments to another party (the seller of protection) in exchange for the right to receive protection on a reference security or obligation, including a group of assets or exposure to the performance of an index. A Fund’s investment in credit default swaps may involve greater risks than if the Fund had invested in the referenced obligation directly. Credit events are contract specific but may include bankruptcy, failure to pay, restructuring and obligation acceleration. If a Fund buys protection through a credit default swap and no credit event occurs, its payments are limited to the periodic payments previously made to the counterparty. Upon the occurrence of a specified credit event, a Fund, as a buyer of credit protection, is entitled to receive an amount equal to the notional amount of the swap and deliver to the seller the defaulted reference obligation in a physically settled trade. A Fund may also receive a net settlement amount in the form of cash or securities equal to the notional amount of the swap reduced by the recovery value of the reference obligation in a cash settled trade.
As a seller of protection, a Fund generally receives a payment stream throughout the term of the swap, provided that there is no credit event. In addition, if a Fund sells protection through a credit default swap, a Fund could suffer a loss because the value of the referenced obligation and the premium payments received may be less than the notional amount of the swap paid to the buyer of protection. Upon the occurrence of a specified credit event, a Fund, as a seller of credit protection, may be required to take possession of the defaulted reference obligation and pay the buyer an amount equal to the notional amount of the swap in a physically settled trade. A Fund may also pay a net settlement amount in the form of cash or securities equal to the notional amount of the swap reduced by the recovery value of the reference obligation in a cash settled trade. Recovery values are at times established through the credit event auction process in which market participants are ensured that a transparent price has been set for the defaulted security or obligation. In addition, a Fund is entitled to a return of any assets, which have been pledged as collateral to the counterparty.
The maximum potential amount of future payments (undiscounted) that a Fund as seller of protection could be required to make under a credit default swap would be an amount equal to the notional amount of the agreement. These potential amounts would be partially offset by any recovery values of the respective referenced obligations or net amounts received from a settlement of a credit default swap for the same reference security or obligation where a Fund bought credit protection.
66
GOLDMAN SACHS STRATEGIC MULTI-ASSET CLASS FUNDS
|
| 3. INVESTMENTS AND FAIR VALUE MEASUREMENTS (continued) |
Short Term Investments — Short-term investments having a maturity of 60 days or less are generally valued at amortized cost which approximates fair market value. These investments are classified as Level 2 of the fair value hierarchy.
i. Repurchase Agreements — Repurchase agreements involve the purchase of securities subject to the seller’s agreement to repurchase the securities at a mutually agreed upon date and price, under the terms of a Master Repurchase Agreement (“MRA”). During the term of a repurchase agreement, the value of the underlying securities held as collateral on behalf of a Fund, including accrued interest, is required to exceed the value of the repurchase agreement, including accrued interest. The gross value of repurchase agreements is included in the Statements of Assets and Liabilities for financial reporting purposes. The underlying securities for all repurchase agreements are held at the Funds’ custodian or designated sub-custodians under tri-party repurchase agreements.
An MRA governs transactions between a Fund and select counterparties. An MRA contains provisions for, among other things, initiation of the transaction, income payments, events of default and maintenance of securities for both repurchase and reverse repurchase agreements. An MRA also permits offsetting with collateral to create one single net payment in the event of default or similar events, including the bankruptcy or insolvency of a counterparty.
If the seller defaults, a Fund could suffer a loss to the extent that the proceeds from the sale of the underlying securities and other collateral held by the Fund are less than the repurchase price and the Fund’s costs associated with delay and enforcement of the repurchase agreement. In addition, in the event of default or insolvency of the seller, a court could determine that a Fund’s interest in the collateral is not enforceable, resulting in additional losses to the Fund.
Pursuant to exemptive relief granted by the Securities and Exchange Commission (“SEC”) and terms and conditions contained therein, the Funds, together with other funds of the Trust and registered investment companies having management agreements with GSAM or its affiliates, may transfer uninvested cash into joint accounts, the daily aggregate balance of which is invested in one or more repurchase agreements. Under these joint accounts, the Funds maintain pro-rata credit exposure to the underlying repurchase agreements’ counterparties. With the exception of certain transaction fees, the Funds are not subject to any expenses in relation to these investments.
B. Level 3 Fair Value Investments — To the extent that significant inputs to valuation models and other alternative pricing sources are unobservable, or if quotations are not readily available, or if GSAM believes that such quotations do not accurately reflect fair value, the fair value of the Funds’ investments may be determined under Valuation Procedures approved by the Trustees. GSAM, consistent with its procedures and applicable regulatory guidance, may make an adjustment to the most recent valuation prices of either domestic or foreign securities in light of significant events to reflect what it believes to be the fair value of the securities at the time of determining a Fund’s NAV. Significant events which could affect a large number of securities in a particular market may include, but are not limited to: significant fluctuations in U.S. or foreign markets; market dislocations; market disruptions; or unscheduled market closings. Significant events which could also affect a single issuer may include, but are not limited to: corporate actions such as reorganizations, mergers and buy-outs; ratings downgrades; and bankruptcies.
67
GOLDMAN SACHS STRATEGIC MULTI-ASSET CLASS FUNDS
Notes to Financial Statements (continued)
October 31, 2015
|
| 3. INVESTMENTS AND FAIR VALUE MEASUREMENTS (continued) |
C. Fair Value Hierarchy — The following is a summary of the Funds’ investments and derivatives classified in the fair value hierarchy as of October 31, 2015:
| | | | | | | | | | | | |
| | | |
| Multi-Manager Global Equity | | | | | | | | | | | | |
| | | |
| Investment Type | | Level 1 | | | Level 2 | | | Level 3 | |
| Assets | | | | | | | | | | | | |
Common Stock and/or Other Equity Investments(a) | | | | | | | | | | | | |
Africa | | $ | — | | | $ | 1,592,939 | | | $ | — | |
Asia | | | 24,328,418 | | | | 47,720,960 | | | | — | |
Australia and Oceania | | | — | | | | 3,539,145 | | | | — | |
Europe | | | 26,642,897 | | | | 96,558,133 | | | | — | |
North America | | | 163,377,683 | | | | 1,375,084 | | | | — | |
South America | | | 1,337,322 | | | | 983,456 | | | | — | |
Rights | | | — | | | | 2 | | | | | |
Exchange Traded Funds | | | 47,293,516 | | | | — | | | | — | |
Short-term Investments | | | — | | | | 24,200,000 | | | | — | |
| Total | | $ | 262,979,836 | | | $ | 175,969,719 | | | $ | — | |
| | | |
| Multi-Manager Global Equity (continued) | | | | | | | | | | | | |
| | | |
| Derivative Type(b) | | Level 1 | | | Level 2 | | | Level 3 | |
| Assets | | | | | | | | | | | | |
Forward Foreign Currency Exchange Contracts | | $ | — | | | $ | 699,042 | | | $ | — | |
| Liabilities | | | | | | | | | | | | |
Forward Foreign Currency Exchange Contracts | | $ | — | | | $ | (334,203 | ) | | $ | — | |
| (a) | | Amounts are disclosed by continent to highlight the impact of time zone differences between local market close and the calculation of NAV. Security valuations are based on the principal exchange or system on which they are traded, which may differ from country of domicile. The Fund utilizes fair value model prices provided by an independent fair value service for international equities, resulting in a Level 2 classification. |
| (b) | | Amount shown represents unrealized gain (loss) at period end. |
| | | | | | | | | | | | |
| | | |
| Multi-Manager Non-Core Fixed Income | | | | | | | | | | | | |
| | | |
| Investment Type | | Level 1 | | | Level 2 | | | Level 3 | |
| Assets | | | | | | | | | | | | |
Fixed Income | | | | | | | | | | | | |
Corporate Obligations | | $ | — | | | $ | 79,214,702 | | | $ | — | |
Foreign Debt Obligations | | | — | | | | 92,486,901 | | | | — | |
U.S. Treasury Obligations | | | 299,856 | | | | — | | | | — | |
Senior Term Loans | | | — | | | | 63,633,941 | | | | — | |
Exchange Traded Funds | | | 8,192,000 | | | | — | | | | — | |
Short-term Investments | | | — | | | | 31,500,000 | | | | — | |
| Total | | $ | 8,491,856 | | | $ | 266,835,544 | | | $ | — | |
68
GOLDMAN SACHS STRATEGIC MULTI-ASSET CLASS FUNDS
|
| 3. INVESTMENTS AND FAIR VALUE MEASUREMENTS (continued) |
| | | | | | | | | | | | |
| | | |
| Multi-Manager Non-Core Fixed Income (continued) | | | | | | | | | | | | |
| | | |
| Derivative Type | | Level 1 | | | Level 2 | | | Level 3 | |
| Assets(b) | | | | | | | | | | | | |
Forward Foreign Currency Exchange Contracts | | $ | — | | | $ | 268,937 | | | $ | — | |
Futures Contracts | | | 31,200 | | | | — | | | | — | |
Interest Rate Swap Contracts | | | — | | | | 79,509 | | | | — | |
| Total | | $ | 31,200 | | | $ | 348,446 | | | $ | — | |
| Liabilities(b) | | | | | | | | | | | | |
Forward Foreign Currency Exchange Contracts | | $ | — | | | $ | (499,412 | ) | | $ | — | |
Futures Contracts | | | (2,619 | ) | | | — | | | | — | |
Credit Default Swap Contracts | | | — | | | | (13,111 | ) | | | — | |
| Total | | $ | (2,619 | ) | | $ | (512,523 | ) | | $ | — | |
| (a) | | Amount shown represents unrealized gain (loss) at period end. |
| | | | | | | | | | | | |
| | | |
| Multi-Manager Real Assets Strategy | | | | | | | | | | | | |
| | | |
| Investment Type | | Level 1 | | | Level 2 | | | Level 3 | |
| Assets | | | | | | | | | | | | |
Common Stock and/or Other Equity Investments(a) | | | | | | | | | | | | |
Asia | | $ | 196,399 | | | $ | 15,938,005 | | | $ | — | |
Australia and Oceania | | | — | | | | 6,204,886 | | | | — | |
Europe | | | 778,637 | | | | 34,412,256 | | | | — | |
North America | | | 90,846,369 | | | | — | | | | — | |
Short-term Investments | | | — | | | | 3,800,000 | | | | — | |
| Total | | $ | 91,821,405 | | | $ | 60,355,147 | | | $ | — | |
| | | |
| Derivative Type | | | | | | | | | |
| Assets(b) | | | | | | | | | | | | |
Futures Contracts | | $ | 706,515 | | | $ | — | | | $ | — | |
| Liabilities(b) | | | | | | | | | | | | |
Futures Contracts | | $ | (621,286 | ) | | $ | — | | | $ | — | |
| (a) | | Amounts are disclosed by continent to highlight the impact of time zone differences between local market close and the calculation of NAV. Security valuations are based on the principal exchange or system on which they are traded, which may differ from country of domicile. The Fund utilizes fair value model prices provided by an independent fair value service for international equities, resulting in a Level 2 classification. |
| (b) | | Amount shown represents unrealized gain (loss) at period end. |
For further information regarding security characteristics, see the Schedules of Investments.
69
GOLDMAN SACHS STRATEGIC MULTI-ASSET CLASS FUNDS
Notes to Financial Statements (continued)
October 31, 2015
|
| 4. INVESTMENTS IN DERIVATIVES |
The following tables set forth, by certain risk types, the gross value of derivative contracts as of October 31, 2015. These instruments were used as part of the Funds’ investment strategies and to obtain and/or manage exposure related to the risks below. The values in the tables below exclude the effects of cash collateral received or posted pursuant to these derivative contracts, and therefore are not representative of the Funds’ net exposure.
| | | | | | | | | | | | |
| |
| Multi-Manager Global Equity | | | | |
| Risk | | Statements of Assets and Liabilities | | Assets | | | Statements of Assets and Liabilities | | Liabilities | |
Currency | | Receivable for unrealized gain on forward foreign currency exchange contracts | | $ | 699,042 | | | Payable for unrealized loss on forward foreign currency exchange contracts | | $ | (334,203) | |
| |
| Multi-Manager Non-Core Fixed Income | | | | |
| Risk | | Statements of Assets and Liabilities | | Assets | | | Statements of Assets and Liabilities | | Liabilities | |
Interest Rate | | Receivable for unrealized gain on swap contracts; Variation margin on certain derivative contracts | | $ | 110,709 | (a) | | Variation margin on certain derivative contracts | | $ | (2,619) | (a) |
Credit | | — | | | — | | | Payable for unrealized loss on swap contracts | | | (13,111) | (b) |
Currency | | Receivable for unrealized gain on forward foreign currency exchange contracts | | | 268,937 | | | Payable for unrealized loss on forward foreign currency exchange contracts | | | (499,412) | |
| Total | | | | $ | 379,646 | | | | | $ | (515,142) | |
| (a) | | Includes unrealized gain (loss) on futures contracts and centrally cleared swaps described in the Additional Investment Information sections of the Schedules of Investments. Only current day’s variation margin is reported within the Statements of Assets and Liabilities. |
| (b) | | Amount represents the payments to be made pursuant to bilateral agreements should counterparties exercise their “right to terminate” provisions based on, among others, the Fund’s performance, their failure to pay on their obligations or failure to pledge collateral. Such amount does not include incremental charges directly associated with the close-out of the agreements. It also does not reflect the fair value of any assets pledged as collateral which, through the daily margining process, substantially offsets the aforementioned amounts and for which the Fund is entitled to a full return. |
| | | | | | | | | | | | |
| |
| Multi-Manager Real Assets Strategy | | | | |
| Risk | | Statements of Assets and Liabilities | | Assets | | | Statements of Assets and Liabilities | | Liabilities | |
Commodity | | Variation margin on certain derivative contracts | | $ | 706,515 | (a) | | Variation margin on certain derivative contracts | | $ | (621,286) | (a) |
| (a) | | Includes unrealized gain (loss) on futures contracts described in the Additional Investment Information sections of the Consolidated Schedule of Investments. Only current day’s variation margin is reported within the Consolidated Statement of Assets and Liabilities. |
The following tables set forth, by certain risk types, the Funds’ gains (losses) related to these derivatives and their indicative volumes for the period ended October 31, 2015. These gains (losses) should be considered in the context that these derivative contracts may have been executed to create investment opportunities and/or economically hedge certain investments, and
70
GOLDMAN SACHS STRATEGIC MULTI-ASSET CLASS FUNDS
|
| 4. INVESTMENTS IN DERIVATIVES (continued) |
accordingly, certain gains (losses) on such derivative contracts may offset certain (losses) gains attributable to investments. These gains (losses) are included in “Net realized gain (loss)” or “Net change in unrealized gain (loss)” on the Statements of Operations:
| | | | | | | | | | | | | | |
| | |
| Multi-Manager Global Equity | | | | | | | | | |
| Risk | | Statements of Operations | | Net Realized
Gain (Loss) | | | Unrealized
Gain (Loss) | | | Average
Number of
Contracts(a) | |
Currency | | Net realized gain (loss) from forward foreign currency exchange contracts/Net unrealized gain (loss) on forward foreign currency exchange contracts | | $ | 662,733 | | | $ | 364,839 | | | | 80 | |
| |
| Multi-Manager Non-Core Fixed Income | | | | | |
| Risk | | Statements of Operations | | Net Realized
Gain (Loss) | | | Unrealized
Gain (Loss) | | | Average
Number of
Contracts(a) | |
Interest rate | | Net realized gain (loss) from futures and swap contracts/Net unrealized gain (loss) on futures and swap contracts | | $ | (22,119 | ) | | $ | 108,090 | | | | 24 | |
Credit | | Net realized gain (loss) from swap contracts/Net unrealized gain (loss) on swap contracts | | | (1,821 | ) | | | (13,111 | ) | | | 1 | |
Currency | | Net realized gain (loss) from forward foreign currency exchange contracts/Net unrealized gain (loss) on forward foreign currency exchange contracts | | | 217,611 | | | | (230,475 | ) | | | 77 | |
| Total | | | | $ | 193,671 | | | $ | (135,496 | ) | | | 102 | |
|
| Multi-Manager Real Assets Strategy | |
| Risk | | Statements of Operations | | Net Realized
Gain (Loss) | | | Net
Unrealized
Gain (Loss) | | | Average
Number of
Contracts(a) | |
Commodity | | Net realized gain (loss) from futures contracts/Net unrealized gain (loss) on futures contracts | | $ | (4,563,119 | ) | | $ | 85,229 | | | | 971 | |
Currency | | Net realized gain (loss) from forward foreign currency exchange contracts/Net unrealized gain (loss) on forward foreign currency exchange contracts | | | (50,458 | ) | | | — | | | | 18 | |
| Total | | | | $ | (4,613,577 | ) | | $ | 85,229 | | | | 989 | |
| (a) | | Average number of contracts is based on the average of month end balances for the period ended October 31, 2015. |
In order to better define its contractual rights and to secure rights that will help a Fund mitigate its counterparty risk, a Fund may enter into an International Swaps and Derivatives Association, Inc. Master Agreement (“ISDA Master Agreement”) or similar agreement with its derivatives counterparties. An ISDA Master Agreement is a bilateral agreement between a Fund and a counterparty that governs OTC derivatives, (including forward foreign currency exchange contracts, and certain options and swaps) and typically contains, among other things, collateral posting terms and netting provisions in the event of a default and/or termination event. The provisions of the ISDA Master Agreement typically permit a single net payment in the event of a default (close-out netting) or similar event, including the bankruptcy or insolvency of the counterparty.
Collateral and margin requirements differ between exchange traded derivatives and OTC derivatives. Margin requirements are established by the broker or clearing house for exchange-traded and centrally cleared derivatives (financial futures contracts, options and centrally cleared swaps) pursuant to governing agreements for those instrument types. Brokers can ask for margin in excess of the minimum in certain circumstances. Collateral terms are contract-specific for OTC derivatives. For derivatives traded under an ISDA Master Agreement, the collateral requirements are typically calculated by netting the marked to market amount for each transaction under such agreement and comparing that amount to the value of any collateral currently pledged by a Fund and
71
GOLDMAN SACHS STRATEGIC MULTI-ASSET CLASS FUNDS
Notes to Financial Statements (continued)
October 31, 2015
|
| 4. INVESTMENTS IN DERIVATIVES (continued) |
the counterparty. Additionally, a Fund may be required to post initial margin to the counterparty, the terms of which would be outlined in the confirmation of the OTC transaction.
For financial reporting purposes, cash collateral that has been pledged to cover obligations of a Fund and cash collateral received from the counterparty, if any, is reported separately on the Statements of Assets and Liabilities as receivables/payables for collateral on certain derivative contracts. Non-cash collateral pledged by a Fund, if any, is noted in the Schedules of Investments. Generally, the amount of collateral due from or to a counterparty must exceed a minimum transfer amount threshold before a transfer is required to be made. To the extent amounts due to a Fund from its counterparties are not fully collateralized, contractually or otherwise, the Fund bears the risk of loss from counterparty nonperformance. A Fund attempts to mitigate counterparty risk by only entering into agreements with counterparties that the Investment Adviser believes to be of good standing and by monitoring the financial stability of those counterparties.
Additionally, the netting of assets and liabilities and the offsetting of collateral pledged or received are based on contractual netting/set-off provisions in the ISDA Master Agreement or similar agreements. However, in the event of a default or insolvency of a counterparty, a court could determine that such rights are not enforceable due to the restrictions or prohibitions against the right of setoff that may be imposed in accordance with a particular jurisdiction’s bankruptcy or insolvency laws.
|
| 5. AGREEMENTS AND AFFILIATED TRANSACTIONS |
A. Management Agreement — Under the Agreement, GSAM manages the Funds, subject to the general supervision of the Trustees.
As compensation for the services rendered pursuant to the Agreement, the assumption of the expenses related thereto and administration of the Funds’ business affairs, including providing facilities, GSAM is entitled to a management fee, accrued daily and paid monthly, equal to an annual percentage rate of each Fund’s average daily net assets.
For the period ended October 31, 2015, contractual and effective net management fees with GSAM were at the following rates:
| | | | | | | | | | | | | | | | | | | | | | | | | | | | |
| | | Contractual Management Rate | | | Effective Net
Management
Rate* | |
| Fund | | First
$1 billion | | | Next
$1 billion | | | Next
$3 billion | | | Next
$3 billion | | | Over
$8 billion | | | Effective Rate | | |
Multi-Manager Global Equity | | | 1.03 | % | | | 0.93 | % | | | 0.89 | % | | | 0.87 | % | | | 0.84 | % | | | 1.03 | % | | | 0.64 | % |
Multi-Manager Non-Core Fixed Income | | | 0.85 | | | | 0.85 | | | | 0.77 | | | | 0.73 | | | | 0.71 | | | | 0.85 | | | | 0.55 | |
Multi-Manager Real Assets Strategy | | | 1.00 | | | | 0.90 | | | | 0.86 | | | | 0.84 | | | | 0.82 | | | | 1.00 | | | | 0.50^ | |
| * | | GSAM has agreed to waive a portion of its management fee for each Fund in order to achieve an effective net management fee rate that is equal to the actual cost of fees paid to the Fund’s Underlying Managers (including, with respect to the Multi-Manager Real Assets Strategy Fund, the Underlying Manager of the Subsidiary). These arrangements will remain in effect through at least May 20, 2016 for the Multi-Manager Global Equity Fund and Multi-Manager Real Assets Strategy Fund, and January 31, 2016 for the Multi-Manager Non-Core Fixed Income Fund, and prior to such date GSAM may not terminate the arrangements without the approval of the Board of Trustees. |
| ^ | | Reflects combined management fees paid to GSAM under the Agreement and the Fund’s Subsidiary Agreement (as defined below) after the waivers. |
GSAM also provides management services to the Subsidiary of the Multi-Manager Real Assets Strategy Fund pursuant to a Subsidiary Management Agreement (the “Subsidiary Agreement”) and is entitled to a management fee accrued daily and paid monthly, equal to an annual percentage rate of 0.43% of the Subsidiary’s average daily net assets. In consideration of the Subsidiary’s management fee, and for as long as the Subsidiary Agreement remains in effect, GSAM has contractually agreed to waive irrevocably a portion of the Multi-Manager Real Assets Strategy Fund’s management fee in an amount equal to the management fee paid to GSAM by the Subsidiary under the Subsidiary Agreement. For the period ended October 31, 2015, GSAM waived $45,320 of the Fund’s management fee. This waiver represents an inter-fund transaction and, accordingly, has been eliminated in consolidation.
72
GOLDMAN SACHS STRATEGIC MULTI-ASSET CLASS FUNDS
|
| 5. AGREEMENTS AND AFFILIATED TRANSACTIONS (continued) |
B. Transfer Agency Agreement — Goldman Sachs also serves as the transfer agent of the Funds for a fee pursuant to the Transfer Agency Agreement. The fees charged for such transfer agency services are accrued daily and paid monthly at annual rates as follows: 0.02% of the average daily net assets of Institutional Shares.
C. Other Expense Agreements and Affiliated Transactions — GSAM has agreed to limit each Fund’s “Total Annual Operating Expenses” (excluding acquired fund fees and expenses, taxes, interest, brokerage fees, shareholder meeting, litigation, indemnification, and extraordinary expenses) to the extent such expenses exceed, on an annual basis, a percentage rate of the average daily net assets of each Fund. Such expense reimbursements, if any, are accrued daily and paid monthly. In addition, the Funds are not obligated to reimburse GSAM for prior fiscal year expense reimbursements, if any. The expense limitations as an annual percentage rate of average daily net assets for the Multi-Manager Global Equity, Multi-Manager Non-Core Fixed Income and Multi-Manager Real Assets Strategy are 0.85%, 0.70%, and 0.90% respectively. These expense limitations will remain in place through at least May 20, 2016 for the Multi-Manager Global Equity Fund and Multi-Manager Real Assets Strategy Fund, and January 31, 2016 for the Multi-Manager Non-Core Fixed Income Fund, and prior to such date GSAM may not terminate the arrangements without the approval of the Trustees. In addition, the Funds have entered into certain offset arrangements with the transfer agent, which may result in a reduction of the Funds’ expenses and are received irrespective of the application of the “Total Annual Operating Expense” limitations described above.
For the period ended October 31, 2015, these expense reductions, including any fee waivers and Total Annual Operating Expense reimbursements, were as follows:
| | | | | | | | | | | | | | |
| Fund | | | | Management
Fee Waiver | | | Total Annual
Operating Expense
Reimbursements | | | Total
Expense
Reductions | |
Multi-Manager Global Equity | | | | $ | 496,751 | | | $ | 168,687 | | | $ | 665,438 | |
Multi-Manager Non-Core Fixed Income | | | | | 312,550 | | | | 220,720 | | | | 533,270 | |
Multi-Manager Real Asset Strategy | | | | | 287,683 | | | | 15,891 | | | | 303,574 | |
D. Line of Credit Facility — As of October 31, 2015, the Multi-Manager Non-Core Fixed Income Fund participated in a $1,205,000,000 committed, unsecured revolving line of credit facility (the “facility”) together with other funds of the Trust and registered investment companies having management agreements with GSAM or its affiliates (“Other Borrowers”). Pursuant to the terms of the facility, the Fund and Other Borrowers could increase the credit amount by up to an additional $115,000,000 for a total of up to $1,320,000,000. This facility is to be used for temporary emergency purposes, or to allow for an orderly liquidation of securities to meet redemption requests. The interest rate on borrowings is based on the federal funds rate. The facility also requires a fee to be paid by the Fund based on the amount of the commitment that has not been utilized. For the period ended October 31, 2015, the Fund did not have any borrowings under the facility.
|
| 6. PORTFOLIO SECURITIES TRANSACTIONS |
The cost of purchases and proceeds from sales and maturities of long-term securities for the period ended October 31, 2015, were as follows:
| | | | | | | | | | | | | | | | | | |
| Fund | | | | Purchases of Government Securities | | | Purchases Excluding Government
Securities | | | Sales of
Government Securities | | | Sales Excluding Government
Securities | |
Multi-Manager Global Equity | | | | $ | — | | | $ | 463,645,971 | | | $ | — | | | $ | 34,101,868 | |
Multi-Manager Non-Core Fixed Income | | | | | 22,153,850 | | | | 354,956,520 | | | | 21,822,214 | | | | 105,612,067 | |
Multi-Manager Real Assets Strategy | | | | | — | | | | 188,125,502 | | | | — | | | | 39,922,130 | |
73
GOLDMAN SACHS STRATEGIC MULTI-ASSET CLASS FUNDS
Notes to Financial Statements (continued)
October 31, 2015
The tax character of distributions paid during the period ended October 31, 2015 was as follows:
| | | | | | | | | | | | |
| | | Multi-Manager Global
Equity Fund | | | Multi-Manager Non-Core
Fixed Income | | | Multi-Manager Real Assets
Strategy | |
Distribution paid from: | | | | | | | | | | | | |
Ordinary income | | $ | — | | | $ | 4,430,286 | | | $ | — | |
Tax Return of Capital | | $ | — | | | $ | 181,058 | | | $ | — | |
As of October 31, 2015, the components of accumulated earnings (losses) on a tax basis were as follows:
| | | | | | | | | | | | |
| | | Multi-Manager Global
Equity Fund | | | Multi-Manager Non-Core
Fixed Income | | | Multi-Manager Real Assets
Strategy | |
Undistributed ordinary income — net | | $ | 2,074,618 | | | $ | — | | | $ | 573,155 | |
Undistributed long-term capital gains | | | — | | | | — | | | | — | |
Total undistributed earnings | | $ | 2,074,618 | | | $ | — | | | $ | 573,155 | |
Capital loss carryforwards: | | | | | | | | | | | | |
Perpetual Short-Term | | $ | (812,356 | ) | | $ | (1,166,264 | ) | | $ | (1,784,448 | ) |
Perpetual Long-Term | | | — | | | | (33,935 | ) | | | — | |
Total Capital loss carryforwards | | $ | (812,356 | ) | | $ | (1,200,199 | ) | | $ | (1,784,448 | ) |
Timing differences (Straddle Deferrals, Defaulted Bond accrual interest) | | $ | (31 | ) | | $ | (722,429 | ) | | $ | (89,756 | ) |
Unrealized gains (losses) — net | | | (14,107,696 | ) | | | (7,270,518 | ) | | | 1,676,763 | |
Total accumulated earnings (losses) net | | $ | (12,845,465 | ) | | $ | (9,193,146 | ) | | $ | 375,714 | |
As of October 31, 2015, the Funds’ aggregate security unrealized gains and losses based on cost for U.S. federal income tax purposes were as follows:
| | | | | | | | | | | | |
| | | Multi-Manager Global
Equity Fund | | | Multi-Manager Non-Core
Fixed Income | | | Multi-Manager Real Assets
Strategy | |
Tax Cost | | $ | 453,034,864 | | | $ | 280,186,396 | | | $ | 150,311,032 | |
Gross unrealized gain | | | 10,637,555 | | | | 3,437,885 | | | | 6,059,949 | |
Gross unrealized loss | | | (24,722,864 | ) | | | (10,652,976 | ) | | | (4,194,429 | ) |
Net unrealized gains (losses) on securities | | $ | (14,085,309 | ) | | $ | (7,215,091 | ) | | $ | 1,865,520 | |
Net unrealized loss on other investments | | | (22,387 | ) | | | (55,427 | ) | | | (188,757 | ) |
Net unrealized gains (losses) | | $ | (14,107,696 | ) | | $ | (7,270,518 | ) | | $ | 1,676,763 | |
The difference between GAAP-basis and tax-basis unrealized gains (losses) is attributable primarily to wash sales, net mark to market gains (losses) on foreign currency contracts, regulated futures and differences in tax treatment of underlying fund investments, swap transactions and passive foreign investment company investments.
In order to present certain components of the Funds’ capital accounts on a tax-basis, certain reclassifications have been recorded to the Funds’ accounts. These reclassifications have no impact on the net asset value of the Funds and result primarily from differences in the tax treatment of foreign currency transactions, partnerships, underlying fund investments, swap transactions and passive foreign investment company investments.
74
GOLDMAN SACHS STRATEGIC MULTI-ASSET CLASS FUNDS
|
| 7. TAX INFORMATION (continued) |
| | | | | | | | | | | | | | |
| Fund | | | | Paid-in-
Capital | | | Accumulated
Net Realized
Gain (Loss) | | | Undistributed
Net Investment
Income (Loss) | |
Multi-Manager Global Equity | | | | $ | — | | | $ | (644,975 | ) | | $ | 644,975 | |
Multi-Manager Non-Core Fixed Income | | | | | — | | | | 1,495,794 | | | | (1,495,794 | ) |
Multi-Manager Real Assets Strategy | | | | | (4,246,692 | ) | | | 4,517,427 | | | | (270,735 | ) |
GSAM has reviewed the Funds’ tax positions for all open tax years (the current year, as applicable) and has concluded that no provision for income tax is required in the Funds’ financial statements. Such open tax years remain subject to examination and adjustment by tax authorities.
The Funds’ risks include, but are not limited to, the following:
Foreign Custody Risk — A Fund that invests in foreign securities may hold such securities and cash with foreign banks, agents, and securities depositories appointed by the Fund’s custodian (each a “Foreign Custodian”). Some foreign custodians may be recently organized or new to the foreign custody business. In some countries, Foreign Custodians may be subject to little or no regulatory oversight over, or independent evaluation of, their operations. Further, the laws of certain countries may place limitations on a Fund’s ability to recover its assets if a Foreign Custodian enters bankruptcy.
Interest Rate Risk — When interest rates increase, fixed income securities or instruments held by the Fund will generally decline in value. Long-term fixed income securities or instruments will normally have more price volatility because of this risk than short-term fixed income securities or instruments.
Investments in Other Investment Companies — As a shareholder of another investment company, including an exchange-traded fund (“ETF”), a Fund will indirectly bear its proportionate share of any net management fees and other expenses paid by such other investment companies, in addition to the fees and expenses regularly borne by the Fund. ETFs are subject to risks that do not apply to conventional mutual funds, including but not limited to the following: (i) the market price of the ETF’s shares may trade at a premium or a discount to their NAV; and (ii) an active trading market for an ETF’s shares may not develop or be maintained.
Large Shareholder Transactions Risk — A Fund may experience adverse effects when certain large shareholders, such as institutional investors and Goldman Sachs affiliates, purchase or redeem large amounts of shares of a Fund. Such large shareholder redemptions may cause the Fund to sell portfolio securities at times when it would not otherwise do so, which may negatively impact a Fund’s NAV and liquidity. These transactions may also accelerate the realization of taxable income to shareholders if such sales of investments resulted in gains, and may also increase transaction costs. In addition, a large redemption could result in a Fund’s current expenses being allocated over a smaller asset base, leading to an increase in the Fund’s expense ratio. Similarly, large Fund share purchases may adversely affect a Fund’s performance to the extent that a Fund is delayed in investing new cash and is required to maintain a larger cash position than it ordinarily would.
Leverage Risk — Leverage creates exposure to potential gains and losses in excess of the initial amount invested. Borrowings and the use of derivatives may result in leverage and may make the Funds more volatile. When the Funds use leverage, the sum of each Fund’s investment exposure may significantly exceed the amount of assets invested in each Fund, although these exposures may vary over time. Relatively small market movements may result in large changes in the value of a leveraged investment. Each Fund will identify liquid assets on its books or otherwise cover transactions that may give rise to such risk, to the extent required by applicable law. The use of leverage may cause the Funds to liquidate portfolio positions to satisfy their obligations or to meet
75
GOLDMAN SACHS STRATEGIC MULTI-ASSET CLASS FUNDS
Notes to Financial Statements (continued)
October 31, 2015
|
| 8. OTHER RISKS (continued) |
segregation requirements when it may not be advantageous to do so. The use of leverage by each Fund can substantially increase the adverse impact to which each Fund’s investment portfolio may be subject.
Liquidity Risk — The Funds may make investments that are illiquid or that may become less liquid in response to market developments or adverse investor perceptions. Illiquid investments may be more difficult to value. Liquidity risk may also refer to the risk that a Fund will not be able to pay redemption proceeds within the allowable time period because of unusual market conditions, an unusually high volume of redemption requests, or other reasons. To meet redemption requests, a Fund may be forced to sell investments at an unfavorable time and/or under unfavorable conditions. Liquidity risk may be the result of, among other things, the reduced number and capacity of traditional market participants to make a market in fixed income securities or the lack of an active market. The potential for liquidity risk may be magnified by a rising interest rate environment or other circumstances where investor redemptions from fixed income mutual funds may be higher than normal, potentially causing increased supply in the market due to selling activity.
Market and Credit Risks — In the normal course of business, the Funds trade financial instruments and enter into financial transactions where risk of potential loss exists due to changes in the market (market risk). Additionally, the Funds may also be exposed to credit risk in the event that an issuer or guarantor fails to perform or that an institution or entity with which the Funds have unsettled or open transactions defaults.
Investing in foreign markets may involve special risks and considerations not typically associated with investing in the United States. Foreign securities may be subject to risk of loss because of more or less foreign government regulation, less public information and less economic, political and social stability in the countries in which the Funds invest. Loss may also result from the imposition of exchange controls, confiscations and other government restrictions by the United States or other governments, or from problems in registration, settlement or custody. Foreign risk also involves the risk of negative foreign currency rate fluctuations, which may cause the value of securities denominated in such foreign currency (or other instruments through which the Funds have exposure to foreign currencies) to decline in value. Currency exchange rates may fluctuate significantly over short periods of time. To the extent that the Funds also invest in securities of issuers located in emerging markets, these risks may be more pronounced.
Multi-Manager Approach Risk — The Funds’ performance depends on the ability of the Investment Adviser in selecting, overseeing, and allocating Fund assets to the Underlying Managers. The Underlying Managers’ investment styles may not always be complementary. The Funds’ multi-manager approach may result in the Fund investing a significant percentage of its assets in certain types of investments, which could be beneficial or detrimental to the Funds’ performance depending on the performance of those investments and the overall market environment. The Funds’ Underlying Managers may underperform the market generally or underperform other investment managers that could have been selected for the Funds. Because the Funds’ Underlying Managers may trade with counterparties, prime brokers, clearing brokers or futures commission merchants on terms that are different than those on which the Investment Adviser would trade, and because each Underlying Manager applies its own risk analysis in evaluating potential counterparties for the Funds, the Funds may be subject to greater counterparty risk than if they were managed directly by the Investment Adviser.
Non-Diversification Risk — The Multi-Manager Non-Core Fixed Income Fund is non-diversified, meaning that it is permitted to invest a larger percentage of its assets in fewer issuers than diversified mutual funds. Thus, the Fund may be more susceptible to adverse developments affecting any single issuer held in its portfolio, and may be more susceptible to greater losses because of these developments.
Portfolio Concentration Risk — The Multi-Manager Real Assets Strategy Fund concentrates its investments in the real estate group of industries, which has historically experienced substantial price volatility. This concentration subjects the Fund to greater risk of loss as a result of adverse economic, business or other developments than if its investments were diversified across different industries.
Tax Risk — The Multi-Manager Real Assets Strategy Fund will seek to gain exposure to the commodity markets primarily through investments in the Subsidiaries and/or commodity index-linked structured notes, as applicable. Historically, the Internal
76
GOLDMAN SACHS STRATEGIC MULTI-ASSET CLASS FUNDS
|
| 8. OTHER RISKS (continued) |
Revenue Service (“IRS”) issued private letter rulings (“PLRs”) in which the IRS specifically concluded that income and gains from investments in commodity index-linked structured notes or a wholly-owned foreign subsidiary that invests in commodity-linked instruments are “qualifying income” for purposes of compliance with Subchapter M of the Code. However, the Fund has not received a PLR, and is not able to rely on PLRs issued to other taxpayers. Additionally, the IRS has suspended the granting of such PLRs, pending review of its position on this matter. In light of this, the Fund has obtained an opinion of counsel that the Funds’ income from such investments should constitute “qualifying income.” However, no assurances can be provided that the IRS would not be able to successfully assert that the Fund’s income from such investments was not “qualifying income”, in which case the Fund would fail to qualify as regulated investment company (“RIC”) under Subchapter M of the Code if over 10% of its gross income were derived from these investments. If the Fund failed to qualify as a RIC, it would be subject to federal and state income tax on all of its taxable income at regular corporate tax rates. This would significantly adversely affect the returns to, and could cause substantial losses for, Fund shareholders.
Under the Trust’s organizational documents, its Trustees, officers, employees and agents are indemnified, to the extent permitted by the Act and state law, against certain liabilities that may arise out of performance of their duties to the Funds. Additionally, in the course of business, the Funds enter into contracts that contain a variety of indemnification clauses. The Funds’ maximum exposure under these arrangements is unknown, as this would involve future claims that may be made against the Funds that have not yet occurred. However, GSAM believes the risk of loss under these arrangements to be remote.
Subsequent events after the Statements of Assets and Liabilities date have been evaluated through the date the financial statements were issued.
On November 3, 2015, the Trustees approved Principal Global Investors, LLC (“Principal”) as an Underlying Manager of the Multi-Manager Global Equity Fund. Principal will manage an allocation of international small-capitalization equity securities.
Effective on or before December 31, 2015, the performance benchmark index for the Multi-Manager Real Assets Strategy Fund will change. Effective such date, the Multi-Manager Real Assets Strategy Composite Index will be composed of the FTSE EPRA / NAREIT Developed Index (50%) (Net, USD, Unhedged) and the Dow Jones Brookfield Global Infrastructure Index (50%) (Net, USD, Unhedged). Additionally, effective on or before February 2, 2016, Gresham Investment Management LLC will no longer be an Underlying Manager for the Subsidiary of the Fund. GSAM has determined not to allocate assets to the Subsidiary but retains the right to do so in the future.
77
GOLDMAN SACHS STRATEGIC MULTI-ASSET CLASS FUNDS
Notes to Financial Statements (continued)
October 31, 2015
|
| 11. SUMMARY OF SHARE TRANSACTIONS |
Share activity is as follows:
| | | | | | | | | | |
| | | Multi-Manager Global Equity Fund(a) | |
| | | | |
| | | For the Period Ended
October 31, 2015
| |
| | | | |
| | | Shares | | | | | Dollars | |
| | | | |
| Institutional Shares | | | | | | | | | | |
Shares sold | | | 46,612,176 | | | | | $ | 453,850,015 | |
Shares redeemed | | | (196,619 | ) | | | | | (1,850,010 | ) |
NET INCREASE | | | 46,415,557 | | | | | $ | 452,000,005 | |
| (a) | | Commenced operations on June 24, 2015. |
| | | | | | | | | | |
| | | Multi-Manager Non-Core
Fixed Income Fund(a) | |
| | | | |
| | | For the Period Ended
October 31, 2015
| |
| | | | |
| | | Shares | | | | | Dollars | |
| | | | |
| Institutional Shares | | | | | | | | | | |
Shares sold | | | 28,553,941 | | | | | $ | 277,000,010 | |
Reinvestment of distributions | | | 482,606 | | | | | | 4,611,344 | |
Shares redeemed | | | (162,202 | ) | | | | | (1,550,005 | ) |
NET INCREASE | | | 28,874,345 | | | | | $ | 280,061,349 | |
| (a) | | Commenced operations on March 31, 2015. |
| | | | | | | | | | |
| | | Multi-Manager Real Assets
Strategy Fund(a) | |
| | | | |
| | | For the Period Ended
October 31, 2015
| |
| | | | |
| | | Shares | | | | | Dollars | |
| | | | |
| Institutional Shares | | | | | | | | | | |
Shares sold | | | 20,625,771 | | | | | $ | 201,300,015 | |
Shares redeemed | | | (1 | ) | | | | | (10 | ) |
NET INCREASE | | | 20,625,770 | | | | | $ | 201,300,005 | |
| (a) | | Commenced operations on June 30, 2015. |
78
Report of Independent Registered Public
Accounting Firm
To the Board of Trustees of Goldman Sachs Trust II and Shareholders of
Goldman Sachs Strategic Multi-Asset Class Funds:
In our opinion, the accompanying statements of assets and liabilities, including the schedules of investments, and the related statements of operations and of changes in net assets and the financial highlights present fairly, in all material respects, the financial position of Goldman Sachs Multi-Manager Global Equity Fund, Goldman Sachs Multi-Manager Non-Core Fixed Income Fund, and Goldman Sachs Multi-Manager Real Assets Strategy Fund (collectively the “Funds”), funds of the Goldman Sachs Trust II, at October 31, 2015, and the results of each of their operations, the changes in each of their net assets and the financial highlights for each of the periods indicated, in conformity with accounting principles generally accepted in the United States of America. These financial statements and financial highlights (consolidated financial statements and financial highlights for Goldman Sachs Multi-Manager Real Assets Strategy Fund) (hereafter referred to as “financial statements”) are the responsibility of the Funds’ management. Our responsibility is to express an opinion on these financial statements based on our audits. We conducted our audits of these financial statements in accordance with the standards of the Public Company Accounting Oversight Board (United States). Those standards require that we plan and perform the audit to obtain reasonable assurance about whether the financial statements are free of material misstatement. An audit includes examining, on a test basis, evidence supporting the amounts and disclosures in the financial statements, assessing the accounting principles used and significant estimates made by management, and evaluating the overall financial statement presentation. We believe that our audits, which included confirmation of securities at October 31, 2015 by correspondence with the custodian, brokers, agent banks, and the application of alternative auditing procedures where securities purchased confirmations had not been received, provide a reasonable basis for our opinion.
PricewaterhouseCoopers LLP
Boston, Massachusetts
December 28, 2015
79
GOLDMAN SACHS STRATEGIC MULTI-ASSET CLASS FUNDS
Fund Expenses — Period Ended October 31, 2015 (Unaudited)
As a shareholder of Institutional Shares of the Funds, you incur ongoing costs, including management fees; and other Fund expenses. This Example is intended to help you understand your ongoing costs (in dollars) of investing in the Funds and to compare these costs with the ongoing costs of investing in other mutual funds.
The Example is based on an investment of $1,000 invested at the beginning of the period and held for the entire period from June 24, 2015 through October 31, 2015, which represents a period of 129 days in a 365 day year for Multi-Manager Global Equity Fund; from May 1, 2015 through October 31, 2015, which represents a period of 184 days in a 365 day year for Multi-Manager Non-Core Fixed Income Fund; and from June 30, 2015 through October 31, 2015, which represents a period of 123 days in a 365 day year for Multi-Manager Real Assets Strategy Fund.
Actual Expenses — The first line under each share class in the table below provides information about actual account values and actual expenses. You may use the information in this line, together with the amount you invested, to estimate the expenses that you paid over the period. Simply divide your account value by $1,000 (for example, an $8,600 account value divided by $1,000=8.6), then multiply the result by the number in the first line under the heading entitled “Expenses Paid” to estimate the expenses you paid on your account during this period.
Hypothetical Example for Comparison Purposes — The second line under each share class in the table below provides information about hypothetical account values and hypothetical expenses based on the Funds’ actual net expense ratios and an assumed rate of return of 5% per year before expenses, which is not the Funds’ actual return. The hypothetical account values and expenses may not be used to estimate the actual ending account balance or expenses you paid for the period. You may use this information to compare the ongoing costs of investing in the Funds and other funds. To do so, compare this 5% hypothetical example with the 5% hypothetical examples that appear in the shareholder reports of the other funds.
Please note that the expenses shown in the table are meant to highlight your ongoing costs only and do not reflect any transactional costs, such as sales charges, redemption fees, or exchange fees. Therefore, the second line of the table is useful in comparing ongoing costs only, and will not help you determine the relative total costs of owning different funds. In addition, if these transactional costs were included, your costs would have been higher.
| | | | | | | | | | | | | | | | | | | | | | | | | | | | | | | | | | | | |
| | | Multi-Manager Global Equity(a) | | | Multi-Manager Non-Core Fixed Income(b) | | | Multi-Manager Real Assets Strategy(c) | |
| Share Class | | Beginning
Account
Value
6/24/15 | | | Ending
Account
Value
10/31/15 | | | Expenses
Paid for the
Period Ended
10/31/15* | | | Beginning
Account
Value
5/1/15 | | | Ending
Account
Value
10/31/15 | | | Expenses
Paid for the
Six Month Ended
10/31/15* | | | Beginning
Account
Value
6/30/15 | | | Ending
Account
Value
10/31/15 | | | Expenses
Paid for the
Period Ended
10/31/15* | |
| Institutional | | | | | | | | | | | | | | | | | | | | | | | | | | | | | | | | | | | | |
Actual | | $ | 1,000.00 | | | $ | 946.00 | | | $ | 2.89 | | | $ | 1,000.00 | | | $ | 954.70 | | | $ | 3.45 | | | $ | 1,000.00 | | | $ | 957.00 | | | $ | 2.97 | |
Hypothetical 5% return | | | 1,000.00 | | | | 1,014.70 | + | | | 2.99 | | | | 1,000.00 | | | | 1,021.68 | + | | | 3.57 | | | | 1,000.00 | | | | 1,013.82 | + | | | 3.05 | |
| (a) | | Commenced operations on June 24, 2015. |
| (b) | | Commenced operations on March 31, 2015. |
| (c) | | Commenced operations on June 30, 2015. |
| * | | Expenses are calculated using each Fund’s annualized net expense ratio, which represents the ongoing expenses as a percentage of net assets for the period ended October 31, 2015. Expenses are calculated by multiplying the annualized net expense ratio by the average account value for the period; then multiplying the result by the number of days in the most recent fiscal half year; and then dividing that result by the number of days in the period. The annualized net expense ratios for the period were as follows: |
| | | | |
| Fund | | Institutional | |
Multi-Manager Global Equity | | | 0.84 | % |
Multi-Manager Non-Core Fixed Income | | | 0.70 | |
Multi-Manager Real Assets Strategy | | | 0.99 | |
| + | | Hypothetical expenses are based on the Fund’s actual annualized net expense ratios and an assumed rate of return of 5% per year before expenses. |
80
GOLDMAN SACHS STRATEGIC MULTI-ASSET CLASS FUNDS
Statement Regarding Basis for Approval of Management Agreement and Sub-Advisory Agreements (Unaudited)
Background
The Goldman Sachs Multi-Manager Real Assets Strategy Fund (formerly the Goldman Sachs Multi-Manager Real Assets Fund) and Goldman Sachs Multi-Manager Global Equity Fund (each, a “Fund” and together, the “Funds”) are newly-organized investment portfolios of Goldman Sachs Trust II (the “Trust”) that commenced investment operations on June 30, 2015 and June 24, 2015, respectively. At meetings held on February 25, March 11, April 8, May 12, and June 11, 2015 (the “Meetings”) in connection with the Funds’ launch, the Trustees, including all of the Trustees present who are not parties to the Funds’ investment management agreement or any sub-advisory agreements or “interested persons” (as defined in the Investment Company Act of 1940, as amended) of any party thereto (the “Independent Trustees”) approved (i) the investment management agreement (the “Management Agreement”) between the Trust on behalf of the Funds and Goldman Sachs Asset Management, L.P. (the “Investment Adviser”); and (ii) the sub-advisory agreements (each a “Sub-Advisory Agreement” and, collectively with the Management Agreement, the “Agreements”) between the Investment Adviser and each of the Funds’ Sub-Advisers, as defined below, each for a term of two years.
In connection with the Meetings, the Trustees received written materials and oral presentations on the topics covered, and were advised by their independent legal counsel regarding their responsibilities under applicable law. In evaluating the Agreements at the Meetings, the Trustees relied upon information included in presentations made by the Investment Adviser (and, with respect to the Sub-Advisory Agreements, materials furnished and presentations made by the Sub-Advisers) and information received at prior Board meetings. The Trustees also drew on information they had received in their capacity as Trustees of other registered investment companies sponsored by the Investment Adviser.
Management Agreement for Goldman Sachs Multi-Manager Global Equity Fund and Goldman Sachs Multi-Manager Real Assets Strategy Fund
At the February 25, 2015 meeting, the Trustees reviewed the Management Agreement, including information regarding the terms of the Management Agreement; the nature, extent and quality of the Investment Adviser’s anticipated services; the fees and expenses to be paid by the Funds; a comparison of each Fund’s proposed management fees and anticipated expenses with those paid by other similar mutual funds; the Investment Adviser’s proposal to waive a specified portion of the fee payable under its Management Agreement; and potential benefits to be derived by the Investment Adviser and its affiliates from their relationships with the Funds.
Nature, Extent and Quality of the Services Provided Under the Management Agreement
As part of their review, the Trustees considered the nature, extent and quality of the services to be provided by the Investment Adviser. In this regard, the Trustees considered both the investment advisory services, and the non-advisory services that would be provided to the Funds by the Investment Adviser and its affiliates. The Trustees also considered information about each Fund’s structure, investment objective, strategies and other characteristics. In particular, they noted that the Funds would employ a “manager of managers” structure, whereby the Investment Adviser would be responsible for selecting Sub-Advisers (subject to Board approval), allocating the Funds’ assets among them, and overseeing the Sub-Advisers’ day-to-day management of Fund assets. The Trustees noted the experience and capabilities of the Investment Adviser’s portfolio management team, and other key personnel that would be providing services to the Funds.
The Trustees concluded that the Investment Adviser would be able to commit substantial financial and other resources to the Funds. In this regard, the Trustees noted that, the Funds would be offered to the Investment Adviser’s institutional clients as part of an investment model whereby the Funds would act as core “building blocks” with which the client and the Investment Adviser would form an investment strategy for the client’s portfolio. The Trustees considered the Investment Adviser’s representations that its clients would benefit from this approach with increased liquidity, increased investment oversight, access to new investment strategies, economies of scale, and reduced complexity in managing client portfolios. They also considered that although the Funds were new (and therefore had no performance data to evaluate), the Investment Adviser had experience managing other funds that employ a “manager of managers” structure (including another series of the Trust), and has a team dedicated to sub-adviser oversight. They also noted the significant resources that the Investment Adviser devotes to risk management and the control environment in which the Fund will operate, as well as the Investment Adviser’s commitment to maintaining high quality systems. The Trustees also reviewed the sub-adviser oversight process that the Investment Adviser had employed and was expected to employ going forward, which included areas such as investment analytics, risk management and compliance. The Trustees concluded that the Investment Adviser’s management of the Funds would likely benefit the Funds and their shareholders.
81
GOLDMAN SACHS STRATEGIC MULTI-ASSET CLASS FUNDS
Statement Regarding Basis for Approval of Management Agreement and Sub-Advisory Agreements (Unaudited) (continued)
Costs of Services to be Provided and Profitability
The Trustees considered the contractual fee rates payable by the Funds under the Management Agreement, payable by the Investment Adviser under each Sub-Advisory Agreement, and the net amount expected to be retained by the Investment Adviser. In this regard, the Trustees considered information on the services to be rendered by the Investment Adviser to the Funds, which include both advisory and administrative services that were directed to the needs and operations of the Funds as registered mutual funds. The Trustees also reviewed each Fund’s projected total operating expense ratios (both gross and net of expense limitations). They compared each Fund’s projected fees and expenses to similar information for comparable mutual funds advised by other, unaffiliated investment management firms, as well as the peer group and category medians. The comparisons of the Funds’ fee rates and total operating expense ratios were prepared by a third-party provider of mutual fund data. The Trustees believed that this information was useful in evaluating the reasonableness of the management fees and total expenses expected to be paid by the Funds. The Trustees also considered information regarding fees paid to the Investment Adviser by other funds and accounts with comparable investment strategies.
In addition, the Trustees considered the Investment Adviser’s undertaking to waive a specified portion of the fee payable under the Management Agreement. In this regard, the Trustees noted that each Fund would be offered an arrangement whereby clients would pay a single management fee for the Investment Adviser’s management of their accounts, and that fund-level management fees would be waived in order to avoid charging two layers of management fees. The Trustees recognized that there was not yet profitability data to evaluate for the Funds, but considered the Investment Adviser’s representations that (i) such data would be provided after the Funds commenced operations, and (ii) the Funds were not expected to be profitable to the Investment Adviser and its affiliates initially.
Economies of Scale
The Trustees considered the proposed breakpoints in the fee rate payable under the Management Agreement for each of the Funds at the following annual percentage rates of the average daily net assets of the Funds:
| | | | | | | | |
Average Daily Net Assets | | Multi-Manager
Global Equity Fund | | | Multi-Manager Real
Assets Strategy Fund | |
| First $1 billion | | | 1.03 | % | | | 1.00 | % |
| Next $1 billion | | | 0.93 | % | | | 0.90 | % |
| Next $3 billion | | | 0.89 | % | | | 0.86 | % |
| Next $3 billion | | | 0.87 | % | | | 0.84 | % |
| Over $8 billion | | | 0.84 | % | | | 0.82 | % |
The Trustees noted that the breakpoints were meant to share potential economies of scale, if any, with the Fund and its shareholders as assets under management reach those asset levels. The Trustees considered the Funds’ projected asset levels and information comparing fee rates charged by the Investment Adviser with fee rates charged to other funds in the peer group, as well as the Investment Adviser’s undertakings to waive certain fees and to limit certain expenses of each Fund that exceed a specified level. The Independent Trustees also considered the relationship between the advisory and sub-advisory fee rate schedules, including the blended sub-advisory fee rates paid to all Sub-Advisers for each respective Fund, and noted that the Investment Adviser had agreed to implement a waiver which had the effect of limiting each Fund’s management fees to the actual amount of fees paid by the Investment Adviser to the respective Sub-Advisers. Upon reviewing these matters, the Trustees concluded that the fee breakpoints represented a means of assuring that benefits of scalability, if any, would be passed along to shareholders at the specified asset levels.
Other Benefits to the Investment Adviser and Its Affiliates
The Trustees also considered the other benefits expected to be derived by the Investment Adviser and its affiliates from their relationships with the Funds, including: (a) transfer agency fees received by Goldman, Sachs & Co. (“Goldman Sachs”); (b) the Investment Adviser’s ability to leverage the infrastructure designed to service the Funds on behalf of its other clients; (c) the Investment Adviser’s ability to cross-market other products and services to Fund shareholders; (d) Goldman Sachs’ retention of certain fees as Fund Distributor; (e) the Investment Adviser’s ability to negotiate better pricing with custodians on behalf of its other clients, as a result of the relationship with the Funds; and (f) the possibility that the working relationship between the Investment Adviser and the Funds’ third party service providers (including the Sub-Advisers) may cause those service providers to be open to doing business with other areas of Goldman Sachs.
82
GOLDMAN SACHS STRATEGIC MULTI-ASSET CLASS FUNDS
Statement Regarding Basis for Approval of Management Agreement and Sub-Advisory Agreements (Unaudited) (continued)
Other Benefits to the Funds and Their Shareholders
The Trustees also noted that each Fund is expected to receive certain potential benefits as a result of its relationship with the Investment Adviser, including: (a) improved servicing and pricing from vendors because of the volume of business generated by the Investment Adviser and its affiliates; (b) the Investment Adviser’s ability to hire and retain qualified personnel, along with certain Sub-Advisers, to provide services to the Fund because of the reputation of the Goldman Sachs organization; and (c) the Fund’s access to certain affiliated distribution channels.
Conclusion
In connection with their consideration of the Management Agreement for each Fund, the Trustees gave weight to various factors, but did not identify any particular factor as controlling their decision. After deliberation and consideration of the information provided, including the factors described above, the Trustees concluded, in the exercise of their business judgment, that the investment management fees that would be payable by each Fund were reasonable in light of the services to be provided to it by the Investment Adviser, the Investment Adviser’s anticipated costs and the Fund’s reasonably anticipated asset levels. The Trustees unanimously concluded that the Investment Adviser’s management would likely benefit the Funds and their shareholders and that the Management Agreement with respect to each Fund should be approved for a period of two years.
Sub-Advisory Agreements on behalf of the Goldman Sachs Multi-Manager Global Equity Fund
Nature, Extent and Quality of the Services Provided Under the Sub-Advisory Agreements
The Trustees, including all of the Independent Trustees, concluded that Sub-Advisory Agreements between the Investment Adviser and each of Causeway Capital Management LLC, Epoch Investment Partners, Inc., Fisher Asset Management, LLC, GW&K Investment Management, LLC, Parametric Portfolio Associates LLC, Robeco Investment Management, Inc. d/b/a Boston Partners, Russell Implementation Services Inc., Scharf Investments, LLC, Vulcan Value Partners, LLC, and WCM Investment Management (each a “Sub-Adviser”) with respect to the Goldman Sachs Multi-Manager Global Equity Fund should be approved. In reaching this determination, they relied on the information provided by the Investment Adviser and each Sub-Adviser. In evaluating the nature, extent and quality of services to be provided by each Sub-Adviser, the Trustees considered information on the respective services provided to the Fund by the Investment Adviser and each Sub-Adviser, including information about each Sub-Adviser’s (a) personnel and compensation structure; (b) track record in managing funds or accounts with comparable investment strategies; (c) policies and procedures in place to address potential conflicts of interest; and (d) compliance program and code of ethics. In this regard, they considered assessments provided by the Investment Adviser of each Sub-Adviser, its investment strategies and personnel and its compliance program. While the Fund had not yet commenced operations, and therefore there was no Fund-related performance information to consider, the Trustees considered the performance of funds and/or accounts managed by each Sub-Adviser with comparable investment strategies to those to be used in managing its respective sleeve of the Fund.
Costs of Services to be Provided
The Trustees reviewed the terms of the Sub-Advisory Agreements and the proposed fee schedules for each Sub-Adviser, including any breakpoints, as well as those of any comparable funds or accounts managed by the Sub-Adviser. They noted that the compensation paid to each Sub-Adviser would be paid by the Investment Adviser, not by the Fund. They also noted that the terms of the Sub-Advisory Agreements were the result of arms’ length negotiations between the Investment Adviser and each Sub-Adviser. The Trustees reviewed the anticipated blended average of all sub-advisory fees to be paid by the Investment Adviser, after giving effect to the hiring of the Sub-Advisers, and the amount of the management fee retained by the Investment Adviser.
Conclusion
In connection with their consideration of each Sub-Advisory Agreement at the Meeting, the Trustees gave weight to various factors, but did not identify any particular factor as controlling their decision. After deliberation and consideration of the information provided, including the factors described above, the Trustees unanimously concluded that each Sub-Adviser’s management of a sleeve of the Fund would likely benefit the Fund and its shareholders and that the Sub-Advisory Agreements should be approved with respect to the Fund for a period of two years.
83
GOLDMAN SACHS STRATEGIC MULTI-ASSET CLASS FUNDS
Statement Regarding Basis for Approval of Management Agreement and Sub-Advisory Agreements (Unaudited) (continued)
Sub-Advisory Agreements on behalf of the Goldman Sachs Real Assets Strategy Fund
Nature, Extent and Quality of the Services Provided Under the Sub-Advisory Agreements
The Trustees, including all of the Independent Trustees, concluded that the Sub-Advisory Agreements between the Investment Adviser and each of Gresham Investment Management, Inc. (“Gresham”), Prudential Investment Management, Inc. on behalf of its Prudential Real Estate Investors business unit (“Prudential”), and RREEF America L.L.C. (“RREEF”) (each, also a “Sub-Adviser”) should be approved. The Sub-Advisory Agreements with Prudential and RREEF are with respect to the Goldman Sachs Multi-Manager Real Assets Strategy Fund (the “Fund”), and the Sub-Advisory Agreement with Gresham is with respect to the Goldman Sachs Cayman Commodity – MMRA Fund Ltd., a wholly-owned subsidiary of the Fund. In reaching this determination, they relied on the information provided by the Investment Adviser and each Sub-Adviser. In evaluating the nature, extent and quality of services to be provided by each Sub-Adviser, the Trustees considered information on the services provided to the Fund by the Sub-Advisers, including information about each Sub-Adviser’s (a) personnel and compensation structure; (b) track record in managing accounts with comparable investment strategies to those to be employed pursuant to the Sub-Advisory Agreements; (c) policies and procedures in place to address potential conflicts of interest; and (d) compliance program and code of ethics. In this regard, they considered assessments provided by the Investment Adviser of the Sub-Advisers, their investment strategies and personnel and their compliance programs. The Trustees considered that Prudential and RREEF currently manage other assets for the Investment Adviser’s clients. While the Fund was new, and therefore there was no Fund-related performance information to consider, the Trustees considered the performance of composites of separate accounts or other mutual funds managed by each Sub-Adviser with comparable investment strategies to those to be used pursuant to the Sub-Advisory Agreements.
Costs of Services to be Provided
The Trustees reviewed the terms of the Sub-Advisory Agreements and the proposed fee schedules for the Sub-Advisers, including any breakpoints, as well as those of any comparable funds or accounts managed by the Sub-Adviser. They noted that the compensation paid to each Sub-Adviser would be paid by the Investment Adviser, not by the Fund. They also noted that the terms of the Sub-Advisory Agreements were the result of arms’ length negotiations between the Investment Adviser and each Sub-Adviser. The Trustees reviewed the anticipated blended average of all sub-advisory fees to be paid by the Investment Adviser, after giving effect to the hiring of the Sub-Advisers, and the amount of the management fee retained by the Investment Adviser.
Conclusion
In connection with their consideration of the Sub-Advisory Agreements at the Meetings, the Trustees gave weight to various factors, but did not identify any particular factor as controlling their decision. After deliberation and consideration of the information provided, the Independent Trustees unanimously concluded that each Sub-Adviser’s management services would likely benefit the Fund and its shareholders and that each Sub-Advisory Agreement should be approved for a period of two years.
84
GOLDMAN SACHS STRATEGIC MULTI-ASSET CLASS FUNDS
Statement Regarding Basis for Approval of Sub-Advisory Agreement on behalf of the
Goldman Sachs Multi-Manager Non-Core Fixed Income Fund (Unaudited)
Background
The Goldman Sachs Multi-Manager Non-Core Fixed Income Fund (the “Fund”) is an investment portfolio of Goldman Sachs Trust II that commenced investment operations on March 31, 2015. The Fund employs a “manager of managers” structure, whereby Goldman Sachs Asset Management, L.P. (the “Investment Adviser”) is responsible for selecting sub-advisers (subject to Board approval), allocating the Fund’s assets among them, and overseeing their day-to-day management of Fund assets. Upon the recommendation of the Investment Adviser, at a meeting held on August 5, 2015 (the “Meeting”) the Trustees, including all of the Trustees present who are not parties to the Fund’s investment management agreement or any sub-advisory agreement or “interested persons” (as defined in the Investment Company Act of 1940, as amended) of any party thereto (the “Independent Trustees”) approved the sub-advisory agreement (the “Sub-Advisory Agreement”) between the Investment Adviser and Lazard Asset Management LLC (“Lazard”).
In connection with the Meeting, the Trustees received written materials and oral presentations on the topics covered, and were advised by their independent legal counsel. In addition, Lazard provided information in response to a request from the Investment Adviser.
Nature, Extent and Quality of the Services Provided Under the Sub-Advisory Agreement
The Trustees, including all of the Independent Trustees, unanimously concluded that the Sub-Advisory Agreement between the Investment Adviser and Lazard with respect to the Fund should be approved. In reaching this determination, they relied on the information provided by the Investment Adviser and Lazard. In evaluating the nature, extent and quality of services to be provided by Lazard, the Trustees considered information on the services provided to the Fund by Lazard, including information about Lazard’s (a) personnel and compensation structure; (b) track record in managing accounts with comparable investment strategies; (c) policies and procedures in place to address potential conflicts of interest; and (d) compliance program and code of ethics. In this regard, they considered assessments provided by the Investment Adviser of Lazard, Lazard’s investment strategies and personnel and its compliance program. The Trustees considered that Lazard currently manages other assets for the Investment Adviser’s clients. They reviewed performance information for Lazard’s Emerging Markets Debt Blend strategy (the “EMD Blend Strategy”), which Lazard would use in managing its respective sleeve of the Fund. They noted that, because Lazard had not previously provided services to the Fund, there was no performance information to evaluate with respect to the Fund.
Costs of Services to be Provided
The Trustees reviewed the terms of the Sub-Advisory Agreement and the proposed fee schedule for Lazard, including breakpoints. They also considered the fees that Lazard charges to comparable funds or accounts that it manages using the EMD Blend Strategy. They noted that the compensation paid to Lazard would be paid by the Investment Adviser, not by the Fund. They also noted that the terms of the Sub-Advisory Agreement were the result of arms’ length negotiations between the Investment Adviser and Lazard. The Trustees reviewed the anticipated blended average of all sub-advisory fees to be paid by the Investment Adviser, after giving effect to the hiring of Lazard, and the amount of the management fee retained by the Investment Adviser.
Conclusion
In connection with their consideration of the Sub-Advisory Agreement at the Meeting, the Trustees gave weight to various factors, but did not identify any particular factor as controlling their decision. After deliberation and consideration of the information provided, the Independent Trustees unanimously concluded that Lazard’s management of a sleeve of the Fund would likely benefit the Fund and its shareholders and that the Sub-Advisory Agreement should be approved for a period of two years.
85
GOLDMAN SACHS STRATEGIC MULTI-ASSET CLASS FUNDS
Trustees and Officers (Unaudited)
Independent Trustees
| | | | | | | | | | |
Name,
Address and Age1 | | Position(s) Held with the Trust | | Term of Office and
Length of
Time Served2 | | Principal Occupation(s) During Past 5 Years | | Number of
Portfolios in
Fund Complex
Overseen by
Trustee3 | | Other Directorships Held by Trustee4 |
Ashok N. Bakhru Age: 73 | | Chairman of the Board of Trustees | | Since 1996 (Trustee since 1991) | | Mr. Bakhru is retired. He was formerly Director, Apollo Investment Corporation (a business development company) (2008-2013); President, ABN Associates (a management and financial consulting firm) (1994-1996 and 1998-2012); Trustee, Scholarship America (1998-2005); Trustee, Institute for Higher Education Policy (2003-2008); Director, Private Equity Investors — III and IV (1998-2007), and Equity-Linked Investors II (April 2002-2007). Chairman of the Board of Trustees — Goldman Sachs Fund Complex. | | 136 | | None |
Cheryl K. Beebe Age: 59 | | Trustee | | Since 2015 | | Ms. Beebe is retired. She is Director, Convergys Corporation (2015-Present); Director, Packaging Corporation of America (2008-Present); and was formerly Executive Vice President, (2010-2014); and Chief Financial Officer, Ingredion, Inc. (a global corn refining and manufacturing company) (2004-2014). Trustee — Goldman Sachs Fund Complex. | | 7 | | Convergys Corporation (a customer management company); Packaging Corporation of America (producer of container board) |
John P. Coblentz, Jr. Age: 74 | | Trustee | | Since 2003 | | Mr. Coblentz is retired. Formerly, he was Partner, Deloitte & Touche LLP (a professional services firm) (1975-2003); Director, Emerging Markets Group, Ltd. (2004-2006); and Director, Elderhostel, Inc. (2006-2012). Trustee — Goldman Sachs Fund Complex. | | 136 | | None |
John F. Killian Age: 60 | | Trustee | | Since 2015 | | Mr. Killian is retired. He is Director, Consolidated Edison, Inc. (2007-Present); Director, Houghton Mifflin Harcourt Publishing Company (2011-Present); and formerly held senior management positions with Verizon Communications, Inc., including Executive Vice President and Chief Financial Officer (2009-2010); President, Verizon Business, Verizon Communications, Inc. (2005-2009). Trustee — Goldman Sachs Fund Complex. | | 7 | | Consolidated Edison, Inc. (a utility holding company); Houghton Mifflin Harcourt Publishing Company |
Richard P. Strubel Age: 76 | | Trustee | | Since 1987 | | Mr. Strubel is retired. Formerly, he served as Chairman of the Board of Trustees, Northern Funds (a family of retail and institutional mutual funds managed by Northern Trust Investments, Inc.) (2008-2014) and Trustee (1982-2014); Director, Cardean Learning Group (provider of educational services via the internet) (2003-2008); and Director, Gildan Activewear Inc. (a clothing marketing and manufacturing company) (2000-2014). He serves as Trustee Emeritus, The University of Chicago (1987-Present). Trustee — Goldman Sachs Fund Complex. | | 136 | | None |
| | | | | | | | | | |
86
GOLDMAN SACHS STRATEGIC MULTI-ASSET CLASS FUNDS
Trustees and Officers (Unaudited) (continued)
Interested Trustee*
| | | | | | | | | | |
Name,
Address and Age1 | | Position(s) Held with the Trust | | Term of Office and
Length of
Time Served2 | | Principal Occupation(s) During Past 5 Years | | Number of
Portfolios in
Fund Complex
Overseen by
Trustee3 | | Other Directorships Held by Trustee4 |
James A. McNamara Age: 53 | | President and Trustee | | Since 2007 | | Managing Director, Goldman Sachs (December 1998-Present); Director of Institutional Fund Sales, GSAM (April 1998-December 2000); and Senior Vice President and Manager, Dreyfus Institutional Service Corporation (January 1993- April 1998). President — Goldman Sachs Fund Complex (November 2007-Present); Senior Vice President — Goldman Sachs Fund Complex (May 2007-November 2007); and Vice President — Goldman Sachs Fund Complex (2001-2007). Trustee — Goldman Sachs Fund Complex (November 2007-Present and December 2002-May 2004). | | 135 | | None |
| | | | | | | | | | |
| * | | Mr. McNamara is considered to be an “Interested Trustee” because he holds a position with Goldman Sachs and owns securities issued by The Goldman Sachs Group, Inc. He holds comparable positions with certain other companies of which Goldman Sachs, GSAM or an affiliate thereof is the investment adviser, administrator and/or distributor. |
| 1 | | Each Trustee may be contacted by writing to the Trustee, c/o Goldman Sachs, 200 West Street, New York, New York, 10282, Attn: Caroline Kraus. Information is provided as of October 31, 2015. |
| 2 | | Each Trustee holds office for an indefinite term until the earliest of: (a) the election of his or her successor; (b) the date the Trustee resigns or is removed by the Board of Trustees or shareholders, in accordance with the Trust’s Declaration of Trust; or (c) the termination of the Trust. |
| 3 | | With respect to Messrs. Bakhru, Coblentz, Strubel and McNamara, the Goldman Sachs Fund Complex includes the Trust, Goldman Sachs Trust (“GST”), Goldman Sachs Variable Insurance Trust (“GSVIT”), Goldman Sachs ETF Trust (“GSETF”) Goldman Sachs MLP Income Opportunities Fund (“GSMLP”) and Goldman Sachs MLP and Energy Renaissance Fund (“GSMER”). With respect to Messrs. Bakhru, Coblentz and Strubel, the Goldman Sachs Fund Complex also includes Goldman Sachs BDC, Inc. (“GSBDC”). With respect to Ms. Beebe and Mr. Killian, the Goldman Sachs Fund Complex only includes the Trust. As of October 31, 2015, the Trust consisted of seven portfolios (six of which offered shares to the public), GST consisted of 98 portfolios (91 of which offered shares to the public), GSVIT consisted of 14 portfolios, each of GSMLP, GSMER and GSBDC consisted of one portfolio and GSETF consisted of 14 portfolios (two of which offered shares to the public). |
| 4 | | This column includes only directorships of companies required to report to the Securities and Exchange Commission under the Securities Exchange Act of 1934 (i.e., “public companies”) or other investment companies registered under the Act. |
Additional information about the Trustees is available in the Funds’ Statement of Additional Information, which can be obtained from Goldman Sachs free of charge by calling this toll-free number (in the United States of America): 1-800-526-7384.
87
GOLDMAN SACHS STRATEGIC MULTI-ASSET CLASS FUNDS
Trustees and Officers (Unaudited) (continued)
Officers of the Trust*
| | | | | | |
Name, Address and Age1 | | Position(s) Held With the Trust | | Term of
Office and
Length of
Time Served2 | | Principal Occupation(s) During Past 5 Years |
James A. McNamara 200 West Street New York, NY 10282 Age: 53 | | President and Trustee | | Since 2007 | | Managing Director, Goldman Sachs (December 1998-Present); Director of Institutional Fund Sales, GSAM (April 1998-December 2000); and Senior Vice President and Manager, Dreyfus Institutional Service Corporation (January 1993-April 1998). President — Goldman Sachs Fund Complex (November 2007-Present); Senior Vice President — Goldman Sachs Fund Complex (May 2007-November 2007); and Vice President — Goldman Sachs Fund Complex (2001-2007). Trustee — Goldman Sachs Fund Complex (November 2007-Present and December 2002-May 2004). |
Caroline L. Kraus 200 West Street New York, NY 10282 Age: 38 | | Secretary | | Since 2012 | | Vice President, Goldman Sachs (August 2006-Present); Associate General Counsel, Goldman Sachs (2012-Present); Assistant General Counsel, Goldman Sachs (August 2006-December 2011); and Associate, Weil, Gotshal & Manges, LLP (2002-2006). Secretary — Goldman Sachs Fund Complex (August 2012-Present); and Assistant Secretary — Goldman Sachs Fund Complex (June 2012-August 2012). |
Scott M. McHugh 200 West Street New York, NY 10282 Age: 44 | | Principal Financial Officer, Senior Vice President and Treasurer | | Since 2009 (Principal Financial Officer since 2013) | | Vice President, Goldman Sachs (February 2007-Present); Assistant Treasurer of certain mutual funds administered by DWS Scudder (2005-2007); and Director (2005-2007), Vice President (2000-2005), and Assistant Vice President (1998-2000), Deutsche Asset Management or its predecessor (1998-2007). Principal Financial Officer — Goldman Sachs Fund Complex (November 2013-Present); Treasurer — Goldman Sachs Fund Complex (October 2009-Present); Senior Vice President — Goldman Sachs Fund Complex (November 2009-Present); and Assistant Treasurer — Goldman Sachs Fund Complex (May 2007-October 2009). |
| | | | | | |
| * | | Represents a partial list of officers of the Trust. Additional information about all the officers is available in the Funds’ Statement of Additional Information, which can be obtained from Goldman Sachs free of charge by calling this toll-free number (in the United States): 1-800-526-7384. |
| 1 | | Information is provided as of October 31, 2015. |
| 2 | | Officers hold office at the pleasure of the Board of Trustees or until their successors are duly elected and qualified. Each officer holds comparable positions with certain other companies of which Goldman Sachs, GSAM or an affiliate thereof is the investment adviser, administrator and/or distributor. |
88
FUNDS PROFILE
Goldman Sachs Funds

Goldman Sachs is a premier financial services firm, known since 1869 for creating thoughtful and customized investment solutions in complex global markets.
Today, the Investment Management Division of Goldman Sachs serves a diverse set of clients worldwide, including private institutions, public entities and individuals. With approximately $1.02 trillion in assets under supervision as of September 30, 2015, Goldman Sachs Asset Management (“GSAM”) has portfolio management teams located around the world and our investment professionals bring firsthand knowledge of local markets to every investment decision. Assets under supervision includes assets under management and other client assets for which Goldman Sachs does not have full discretion. GSAM leverages the resources of Goldman, Sachs & Co. subject to legal, internal and regulatory restrictions.

Money Market1
Financial Square FundsSM
| n | | Financial Square Tax-Exempt Funds |
| n | | Financial Square Tax-Free Money Market Fund |
| n | | Financial Square Treasury Solutions Fund2 |
| n | | Financial Square Government Fund |
| n | | Financial Square Money Market Fund |
| n | | Financial Square Prime Obligations Fund |
| n | | Financial Square Treasury Instruments Fund |
| n | | Financial Square Treasury Obligations Fund |
| n | | Financial Square Federal Instruments Fund |
Fixed Income
Short Duration and Government
| n | | High Quality Floating Rate Fund |
| n | | Limited Maturity Obligations Fund |
| n | | Short Duration Government Fund |
| n | | Short Duration Income Fund |
| n | | Inflation Protected Securities Fund |
Multi-Sector
Municipal and Tax-Free
| n | | High Yield Municipal Fund |
| n | | Dynamic Municipal Income Fund3 |
| n | | Short Duration Tax-Free Fund |
Single Sector
| n | | Investment Grade Credit Fund |
| n | | High Yield Floating Rate Fund |
| n | | Emerging Markets Debt Fund |
| n | | Local Emerging Markets Debt Fund |
| n | | Dynamic Emerging Markets Debt Fund |
Fixed Income Alternatives
| n | | Long Short Credit Strategies Fund |
| n | | Fixed Income Macro Strategies Fund |
Fundamental Equity
| n | | Small/Mid Cap Value Fund |
| n | | Small/Mid Cap Growth Fund |
| n | | Flexible Cap Growth Fund |
| n | | Concentrated Growth Fund |
| n | | Technology Opportunities Fund4 |
| n | | Growth Opportunities Fund |
| n | | Rising Dividend Growth Fund |
| n | | Dynamic U.S. Equity Fund5 |
Tax-Advantaged Equity
| n | | U.S. Tax-Managed Equity Fund |
| n | | International Tax-Managed Equity Fund |
| n | | U.S. Equity Dividend and Premium Fund |
| n | | International Equity Dividend and Premium Fund |
Equity Insights
| n | | Small Cap Equity Insights Fund |
| n | | U.S. Equity Insights Fund |
| n | | Small Cap Growth Insights Fund |
| n | | Large Cap Growth Insights Fund |
| n | | Large Cap Value Insights Fund |
| n | | Small Cap Value Insights Fund |
| n | | International Small Cap Insights Fund |
| n | | International Equity Insights Fund |
| n | | Emerging Markets Equity Insights Fund |
Fundamental Equity International
| n | | Strategic International Equity Fund |
| n | | Focused International Equity Fund |
| n | | International Small Cap Fund |
| n | | Emerging Markets Equity Fund6 |
Select Satellite7
| n | | Real Estate Securities Fund |
| n | | International Real Estate Securities Fund |
| n | | Global Real Estate Securities Fund |
| n | | Commodity Strategy Fund |
| n | | Dynamic Commodity Strategy Fund |
| n | | Dynamic Allocation Fund |
| n | | Absolute Return Tracker Fund |
| n | | Managed Futures Strategy Fund |
| n | | MLP Energy Infrastructure Fund |
| n | | Multi-Manager Alternatives Fund |
| n | | Multi-Asset Real Return Fund |
| n | | Retirement Portfolio Completion Fund |
| n | | Absolute Return Multi-Asset Fund |
Total Portfolio Solutions7
| n | | Global Managed Beta Fund |
| n | | Multi-Manager Non-Core Fixed Income Fund |
| n | | Multi-Manager U.S. Dynamic Equity Fund |
| n | | Multi-Manager Global Equity Fund |
| n | | Multi-Manager International Equity Fund |
| n | | Tactical Tilt Implementation Fund |
| n | | Balanced Strategy Portfolio |
| n | | Multi-Manager Real Assets Strategy Fund |
| n | | Growth and Income Strategy Portfolio |
| n | | Growth Strategy Portfolio |
| n | | Equity Growth Strategy Portfolio |
| n | | Satellite Strategies Portfolio |
| n | | Enhanced Dividend Global Equity Portfolio |
| n | | Tax Advantaged Global Equity Portfolio |
| 1 | | An investment in a money market fund is neither insured nor guaranteed by the Federal Deposit Insurance Corporation (“FDIC”) or any other government agency. Although the Funds seek to preserve the value of your investment at $1.00 per share, it is possible to lose money by investing in the Funds. |
| 2 | | Effective on September 30, 2015, the Goldman Sachs Financial Square Federal Fund was renamed the Goldman Sachs Financial Square Treasury Solutions Fund. |
| 3 | | Effective on December 18, 2014, the Goldman Sachs Municipal Income Fund was renamed the Goldman Sachs Dynamic Municipal Income Fund. |
| 4 | | Effective on July 31, 2015, the Goldman Sachs Technology Tollkeeper Fund was renamed the Goldman Sachs Technology Opportunities Fund. |
| 5 | | Effective on April 30, 2015, the Goldman Sachs U.S. Equity Fund was renamed the Goldman Sachs Dynamic U.S. Equity Fund. |
| 6 | | Effective at the close of business on October 23, 2015, the Goldman Sachs BRIC Fund (Brazil, Russia, India, China) was reorganized with and into the Goldman Sachs Emerging Markets Equity Fund. |
| 7 | | Individual Funds within the Total Portfolio Solutions and Select Satellite categories will have various placement on the risk/return spectrum and may have greater or lesser risk than that indicated by the placement of the general Total Portfolio Solutions or Select Satellite category. |
Financial Square FundsSM is a registered service mark of Goldman, Sachs & Co.
*This list covers open-end funds only. Please visit our website at www.GSAMFUNDS.com to learn about our closed-end funds and exchange-traded funds.
| | |
TRUSTEES Ashok N. Bakhru, Chairman Cheryl K. Beebe John P. Coblentz, Jr. John F. Killian James A. McNamara Richard P. Strubel | | OFFICERS James A. McNamara, President Scott M. McHugh, Principal Financial Officer and Treasurer Caroline L. Kraus, Secretary |
| |
GOLDMAN, SACHS & CO. Distributor and Transfer Agent | | GOLDMAN SACHS ASSET MANAGEMENT, L.P. Investment Adviser |
Visit our web site at www.GSAMFUNDS.com to obtain the most recent month-end returns.
Goldman Sachs Asset Management, L.P., 200 West Street, New York, New York 10282
The reports concerning the Funds included in this shareholder report may contain certain forward-looking statements about the factors that may affect the performance of the Funds in the future. These statements are based on Fund management’s predictions and expectations concerning certain future events and their expected impact on the Funds, such as performance of the economy as a whole and of specific industry sectors, changes in the levels of interest rates, the impact of developing world events, and other factors that may influence the future performance of the Funds. Management believes these forward-looking statements to be reasonable, although they are inherently uncertain and difficult to predict. Actual events may cause adjustments in portfolio management strategies from those currently expected to be employed.
A description of the policies and procedures that the Funds use to determine how to vote proxies relating to portfolio securities and information regarding how a Fund voted proxies relating to portfolio securities during the most recent 12-month period ended June 30 is available (I) without charge, upon request by calling 1-800-621-2550; and (II) on the Securities and Exchange Commission (’’SEC’’) web site at http://www.sec.gov.
The Funds file their complete schedule of portfolio holdings with the SEC for the first and third quarters of each fiscal year on Form N-Q. The Funds’ Form N-Qs are available on the SEC’s web site at http://www.sec.gov within 60 days after the Funds’ first and third fiscal quarters. The Funds’ Forms N-Qs may be reviewed and copied at the SEC’s Public Reference Room in Washington, D.C., and information on the operation of the Public Reference Room may also be obtained by calling 1-800-SEC-0330. Forms N-Q may be obtained upon request and without charge by calling 1-800-621-2550.
Fund holdings and allocations shown are as of October 31, 2015 and may not be representative of future investments. Fund holdings should not be relied on in making investment decisions and should not be construed as research or investment advice regarding particular securities. Current and future holdings are subject to risk.
Economic and market forecasts presented herein reflect our judgment as of the date of this presentation and are subject to change without notice. These forecasts do not take into account the specific investment objectives, restrictions, tax and financial situation or other needs of any specific client. Actual data will vary and may not be reflected here. These forecasts are subject to high levels of uncertainty that may affect actual performance. Accordingly, these forecasts should be viewed as merely representative of a broad range of possible outcomes. These forecasts are estimated, based on assumptions, and are subject to significant revision and may change materially as economic and market conditions change. Goldman Sachs has no obligation to provide updates or changes to these forecasts. Case studies and examples are for illustrative purposes only.
The portfolio risk management process includes an effort to monitor and manage risk, but does not imply low risk. Diversification does not protect an investor from market risk and does not ensure a profit. Past correlations are not indicative of future correlations, which may vary.
This material is not authorized for distribution to prospective investors unless preceded or accompanied by a current Prospectus or summary prospectus, if applicable. Investors should consider a Fund’s objective, risks, and charges and expenses, and read the summary prospectus, if available, and/or the Prospectus carefully before investing or sending money. The summary prospectus, if available, and the Prospectus contain this and other information about a Fund and may be obtained from your authorized dealer or from Goldman, Sachs & Co. by calling (institutional – 1-800-621-2550).
© 2015 Goldman Sachs. All rights reserved. 21877-TEMPL-12/2015 SMACAR-15/95
(a) As of the end of the period covered by this report, the registrant has adopted a code of ethics that applies to the registrant’s principal executive officer, principal financial officer, principal accounting officer or controller, or persons performing similar functions, regardless of whether these individuals are employed by the registrant or a third party (the “Code of Ethics”).
(b) During the period covered by this report, no amendments were made to the provisions of the Code of Ethics.
(c) During the period covered by this report, the registrant did not grant any waivers, including an implicit waiver, from any provision of the Code of Ethics.
(d) A copy of the Code of Ethics is available as provided in Item 12(a)(1) of this report.
| ITEM 3. | AUDIT COMMITTEE FINANCIAL EXPERT. |
The registrant’s board of trustees has determined that the registrant has at least one “audit committee financial expert” (as defined in Item 3 of Form N-CSR) serving on its audit committee. John P. Coblentz, Jr. is the “audit committee financial expert” and is “independent” (as each term is defined in Item 3 of Form N-CSR).
| ITEM 4. | PRINCIPAL ACCOUNTANT FEES AND SERVICES. |
Table 1 — Items 4(a) - 4(d). The accountant fees below reflect the aggregate fees billed by the Fund of the Goldman Sachs Trust II to which this certified shareholder report relates.
| | | | | | | | | | | | |
| | | 2015 | | 2014 | | Description of Services Rendered |
| | | | | | | | | | | | |
| | | |
Audit Fees: | | | | | | | | | | | | |
| | | |
• PricewaterhouseCoopers LLP
(“PwC”) | | | $ | 58,926 | | | | $ | 57,709 | | | Financial Statement audits. |
| | | |
Audit-Related Fees: | | | | | | | | | | | | |
| | | |
• PwC | | | $ | 0 | | | | $ | 0 | | | |
| | | |
Tax Fees: | | | | | | | | | | | | |
| | | |
• PwC | | | $ | 9,204 | | | | $ | 9,204 | | | |
Table 2 — Items 4(b)(c) & (d). Non-Audit Services to the Goldman Sachs Trust II’s service affiliates * that were pre-approved by the Audit Committee of the Goldman Sachs Trust II pursuant to Rule 2-01(c)(7)(ii) of Regulation S-X.
| | | | | | | | | | | | |
| | | 2015 | | 2014 | | Description of Services Rendered |
| | | | | | | | | | | | |
| | | |
Audit-Related Fees: | | | | | | | | | | | | |
| | | |
• PwC | | | $ | 1,658,616 | | | | $ | 1,486,420 | | | Internal control review performed in accordance with Statement on Standards for Attestation Engagements No. 16 and semi annual updates relating to withholding tax accrual for non-US jurisdictions. These fees are borne by the Fund’s Adviser. |
| * | These include the advisor (excluding sub-advisors) and any entity controlling, controlled by or under common control with the advisor that provides ongoing services to the registrant (hereinafter referred to as “service affiliates”). |
Item 4(e)(1) — Audit Committee Pre-Approval Policies and Procedures
Pre-Approval of Audit and Non-Audit Services Provided to the Funds of the Goldman Sachs Trust II. The Audit and Non-Audit Services Pre-Approval Policy (the “Policy”) adopted by the Audit Committee of Goldman Sachs Trust II (“GST II”) sets forth the procedures and the conditions pursuant to which services performed by an independent auditor for GST II may be pre-approved. Services may be pre-approved specifically by the Audit Committee as a whole or, in certain circumstances, by the Audit Committee Chairman or the person designated as the Audit Committee Financial Expert. In addition, subject to specified cost limitations, certain services may be pre-approved under the provisions of the Policy. The Policy provides that the Audit Committee will consider whether the services provided by an independent auditor are consistent with the Securities and Exchange Commission’s rules on auditor independence. The Policy provides for periodic review and pre-approval by the Audit Committee of the services that may be provided by the independent auditor.
De Minimis Waiver. The pre-approval requirements of the Policy may be waived with respect to the provision of non-audit services that are permissible for an independent auditor to perform, provided (1) the aggregate amount of all such services provided constitutes no more than five percent of the total amount of revenues subject to pre-approval that was paid to the independent auditors during the fiscal year in which the services are provided; (2) such services were not recognized by GST II at the time of the engagement to be non-audit services; and (3) such services are promptly brought to the attention of the Audit Committee and approved prior to the completion of the audit by the Audit Committee or by one or more members of the Audit Committee to whom authority to grant such approvals has been delegated by the Audit Committee, pursuant to the pre-approval provisions of the Policy.
Pre-Approval of Non-Audit Services Provided to GST’s Investment Advisers. The Policy provides that, in addition to requiring pre-approval of audit and non-audit services provided to GST II, the Audit Committee will pre-approve those non-audit services provided to GST II’s investment advisers (and entities controlling, controlled by or under common control with the investment advisers that provide ongoing services to GST II) where the engagement relates directly to the operations or financial reporting of GST II.
Item 4(e)(2) – 0% of the audit-related fees, tax fees and other fees listed in Table 1 were approved by GST II’s Audit Committee pursuant to the “de minimis” exception of Rule 2-01(c)(7)(i)(C) of Regulation S-X. In addition, 0% of the non-audit services to the GST II’s service affiliates listed in Table 2 were approved by GST II’s Audit Committee pursuant to the “de minimis” exception of Rule 2-01(c)(7)(i)(C) of Regulation S-X.
Item 4(f) – Not applicable.
Item 4(g) Aggregate Non-Audit Fees Disclosure
The aggregate non-audit fees billed to GST II by PwC for the twelve months ended October 31, 2015 and October 31, 2014 were $9,204 and $9,204 respectively. The aggregate non-audit fees billed to GST II’s adviser and service affiliates by PwC for the twelve months ended October 31, 2015 and October 31, 2014 were approximately $10.2 million and $9.8 million respectively. With regard to the aggregate non-audit fees billed to GST II’s adviser and service affiliates, the 2015 amounts include fees for non-audit services required to be pre-approved [see Table 2] and fees for non-audit services that did not require pre-approval since they did not directly relate to GST II’s operations or financial reporting.
Item 4(h) — GST II’s Audit Committee has considered whether the provision of non-audit services to GST II’s investment adviser and service affiliates that did not require pre-approval pursuant to paragraph (c)(7)(ii) of Rule 2-01 of Regulation S-X is compatible with maintaining the auditors’ independence.
| ITEM 5. | AUDIT COMMITTEE OF LISTED REGISTRANTS. |
| ITEM 6. | SCHEDULE OF INVESTMENTS. |
| | Schedule of Investments is included as part of the Report to Stockholders filed under Item 1. |
| ITEM 7. | DISCLOSURE OF PROXY VOTING POLICIES AND PROCEDURES FOR CLOSED-END MANAGEMENT INVESTMENT COMPANIES. |
| ITEM 8. | PORTFOLIO MANAGERS OF CLOSED-END MANAGEMENT INVESTMENT COMPANIES. |
| ITEM 9. | PURCHASES OF EQUITY SECURITIES BY CLOSED-END MANAGEMENT INVESTMENT COMPANY AND AFFILIATED PURCHASERS. |
| ITEM 10. | SUBMISSION OF MATTERS TO A VOTE OF SECURITY HOLDERS. |
| | There have been no material changes to the procedures by which shareholders may recommend nominees to the registrant’s board of trustees. |
| ITEM 11. | CONTROLS AND PROCEDURES. |
| | (a) | The registrant’s principal executive and principal financial officers, or persons performing similar functions have concluded that the registrant’s disclosure controls and procedures (as defined in Rule 30a-3(c) under the Investment Company Act of 1940, as amended (the “1940 Act”)) are effective as of a date within 90 days of the filing of this report that includes the disclosure required by this paragraph, based on the evaluation of these controls and procedures required by Rule 30a-3(b) under the 1940 Act and 15d-15(b) under the Securities Exchange Act of 1934, as amended. |
| | (b) | There were no changes in the registrant’s internal control over financial reporting (as defined in Rule 30a-3(d) under the 1940 Act) that occurred during the registrant’s most recent fiscal quarter of the period covered by this report that have materially affected, or are reasonably likely to materially affect, the registrant’s internal control over financial reporting. |
| | | | |
| (a)(1) | | Goldman Sachs Trust II’s Code of Ethics for Principal Executive and Senior Financial Officers is incorporated by reference to Exhibit 12(a)(1) of the registrant’s Form N-CSR filed on July 8, 2015 for its Multi-Manager Non-Core Fixed Income Fund. |
| | |
| (a)(2) | | Exhibit 99.CERT | | Certifications pursuant to Section 302 of the Sarbanes-Oxley Act of 2002 filed herewith. |
| | |
| (b) | | Exhibit 99.906CERT | | Certifications pursuant to Section 906 of the Sarbanes-Oxley Act of 2002 filed herewith. |
SIGNATURES
Pursuant to the requirements of the Securities Exchange Act of 1934 and the Investment Company Act of 1940, the registrant has duly caused this report to be signed on its behalf by the undersigned, thereunto duly authorized.
| | | | |
| | | | Goldman Sachs Trust II |
| | |
| By: | | | | /s/ James A. McNamara |
| | | | James A. McNamara |
| | | | President/Chief Executive Officer |
| | | | Goldman Sachs Trust II |
| | |
| Date: | | | | January 8, 2016 |
Pursuant to the requirements of the Securities Exchange Act of 1934 and the Investment Company Act of 1940, this report has been signed below by the following persons on behalf of the registrant and in the capacities and on the dates indicated.
| | | | |
| By: | | | | /s/ James A. McNamara |
| | | | James A. McNamara |
| | | | President/Chief Executive Officer |
| | | | Goldman Sachs Trust II |
| | |
| Date: | | | | January 8, 2016 |
| | |
| By: | | | | /s/ Scott McHugh |
| | | | Scott McHugh |
| | | | Principal Financial Officer |
| | | | Goldman Sachs Trust II |
| | |
| Date: | | | | January 8, 2016 |