UNITED STATES
SECURITIES AND EXCHANGE COMMISSION
Washington, D.C. 20549
FORM N-CSR
CERTIFIED SHAREHOLDER REPORT OF REGISTERED
MANAGEMENT INVESTMENT COMPANIES
Investment Company Act file number 811-22781
Goldman Sachs Trust II
(Exact name of registrant as specified in charter)
71 South Wacker Drive,
Chicago, Illinois 60606
(Address of principal executive offices) (Zip code)
| | |
Copies to: |
Caroline Kraus | | Geoffrey R.T. Kenyon, Esq. |
Goldman, Sachs & Co. | | Dechert LLP |
200 West Street | | 100 Oliver Street |
New York, New York 10282 | | 40th Floor |
| | Boston, MA 02110-2605 |
(Name and address of agents for service)
Registrant’s telephone number, including area code: (312) 655-4400
Date of fiscal year end: December 31
Date of reporting period: December 31, 2014
| ITEM 1. | REPORTS TO STOCKHOLDERS. |
| | The Annual Report to Stockholders is filed herewith. |
Goldman Sachs Funds

| | | | |
| | |
| Annual Report | | | | December 31, 2014 |
| | |
| | | | Multi-Manager Alternatives Fund |

Goldman Sachs Multi-Manager Alternatives Fund
| | | | |
TABLE OF CONTENTS | | | | |
| |
Principal Investment Strategies and Risks | | | 1 | |
| |
Portfolio Management Discussion and Performance Summaries | | | 4 | |
| |
Schedules of Investments | | | 13 | |
| |
Financial Statements | | | 47 | |
| |
Financial Highlights | | | 50 | |
| |
Notes to Financial Statements | | | 52 | |
| |
Report of Independent Registered Public Accounting Firm | | | 72 | |
| |
Other Information | | | 73 | |
| | | | |
| | | |
| NOT FDIC-INSURED | | May Lose Value | | No Bank Guarantee |
GOLDMAN SACHS MULTI-MANAGER ALTERNATIVES FUND
Principal Investment Strategies and Risks
This is not a complete list of risks that may affect the Fund. For additional information concerning the risks applicable to the Fund, please see the Fund’s Prospectus.
The Goldman Sachs Multi-Manager Alternatives Fund The Goldman Sachs Multi-Manager Alternatives Fund allocates its assets among multiple investment managers (“Underlying Managers”) who are unaffiliated with the Investment Adviser and who employ one or more non-traditional and alternative investment strategies. A strategy implemented by an Underlying Manager and/ or the use of quantitative models to implement that strategy may fail to produce the intended results. Different investment styles (e.g., “alternative”) tend to shift in and out of favor, and at times the Fund may underperform other funds that invest in similar asset classes. These strategies involve risks that may not be present in more traditional (e.g., equity or fixed income) mutual funds.
The Fund’s equity investments are subject to market risk, which means that the value of the securities in which it invests may go up or down in response to the prospects of individual companies, particular sectors and/or general economic conditions. The securities of mid- and small-capitalization companies involve greater risks than those associated with larger, more established companies and may be subject to more abrupt or erratic price movements. The Fund’s investments in fixed income securities and loans are subject to the risks associated with debt securities generally, including credit, interest rate, liquidity, call and extension risk. Foreign and emerging market investments may be more volatile and less liquid than investments in U.S. securities and will be subject to the risks of currency fluctuations and adverse economic or political developments.
Derivative instruments may involve a high degree of financial risk. These risks include the risk that a small movement in the price of the underlying security or benchmark may result in a disproportionately large movement, unfavorable or favorable, in the price of the derivative instrument; risks of default by a counterparty; and liquidity risk. Over-the-counter transactions are subject to less government regulation and supervision.” At times, the Fund may be unable to sell certain of its illiquid investments without a substantial drop in price, if at all.
The Fund may have a high rate of portfolio turnover, which involves correspondingly greater expenses which must be borne by the Fund, and is also likely to result in short-term capital gains taxable to shareholders. The Fund’s investments in other pooled investment vehicles subject it to additional expenses. The Fund is “non-diversified” and may invest more of its assets in fewer issuers than “diversified” funds. Accordingly, the Fund may be more susceptible to adverse developments affecting any single issuer held in its portfolio and to greater losses resulting from these developments.
The Investment Adviser’s Alternative Investments & Manager Selection (“AIMS”) Group is responsible for making recommendations with respect to hiring, terminating, or replacing the Fund’s Underlying Managers, as well as the Fund’s asset allocations. With respect to the Fund, the AIMS Group applies a multifaceted process with respect to manager due diligence, portfolio construction, and risk management. The AIMS Group also manages additional pooled vehicles which have similar investment strategies to those of the Fund that are not offered to retail investors and are not registered under the Investment Company Act of 1940, as amended (the “Act”). Because these vehicles are not registered under the Act, they are subject to fewer regulatory restraints than the Fund (e.g., fewer trading constraints) and (i) may invest with managers other than the Fund’s Underlying Managers, (ii) may employ strategies that are not subject to the same constraints as the Fund, and (iii) may perform differently than the Fund despite their similar strategies.
There may be additional risks that the Fund does not currently foresee or consider material.
1
GOLDMAN SACHS MULTI-MANAGER ALTERNATIVES FUND
The investment program of the Fund is speculative, entails substantial risks and includes alternative investment techniques not employed by traditional mutual funds. The Fund should not be relied upon as a complete investment program. The Fund’s investment techniques (if they do not perform as designed) may increase the volatility of performance and the risk of investment loss, including the loss of the entire amount that is invested, and there can be no assurance that the investment objective of the Fund will be achieved.
2
GOLDMAN SACHS MULTI-MANAGER ALTERNATIVES FUND
What Differentiates Goldman Sachs’ Multi-Manager
Alternatives Fund Investment Process?
The Goldman Sachs Multi-Manager Alternatives Fund seeks long-term growth of capital by allocating its assets to underlying managers who employ a range of alternative and non-traditional investment strategies. The Fund benefits from the dedicated expertise of GSAM’s alternative investment team that has a legacy dating back to 19691 and a team of over 300 people located in 8 offices globally.2

| n | | We have over 135 alternative investment professionals2 dedicated to manager selection |
| n | | We employ a rigorous due diligence process to evaluate manager’s skill, strategy, and team and continually monitor managers after an investment is made |
| n | | Our Investment Committee process includes an independent “Devil’s advocate” to promote fluid debate and intense examination of each manager |

| n | | We combine “top down” market and economic environment considerations with “bottom up” manager-specific factors |
| n | | We incorporate judgment and quantitative tools to determine the appropriate investment size in each manager |
| n | | The process is continual with ongoing re-balancing and active management to optimize diversification |

| n | | We have over 50 professionals2 focused on alternative investment risk management and operational diligence |
| n | | We consider risk management an all-encompassing and real time discipline |
| n | | Our dedicated strategists leverage our proprietary risk management systems to continually monitor risk |
| 1 | | In June 1997, The Goldman Sachs Group, Inc. (GSG, Inc.) acquired the assets and business of Commodities Corporation, which GSG, Inc. subsequently renamed Goldman Sachs Hedge Fund Strategies LLC in December 2004. |
The portfolio risk management process includes an effort to monitor and manage risk, but does not imply low risk. Diversification does not protect an investor from market risk and does not ensure a profit.
3
PORTFOLIO RESULTS
Goldman Sachs Multi-Manager Alternatives Fund
Investment Objective
The Fund seeks long-term growth of capital.
Portfolio Management Discussion and Analysis
Below, the Goldman Sachs Alternative Investments & Manager Selection (“AIMS”) Group discusses the Goldman Sachs Multi-Manager Alternatives Fund’s (the “Fund”) performance and positioning for the 12-month period ended December 31, 2014 (the “Reporting Period”).
| Q | | How did the Fund perform during the Reporting Period? |
| A | | During the Reporting Period, the Fund’s Class A, Class C, Institutional, Class IR and Class R Shares generated average annual total returns of 2.61%, 1.84%, 3.00%, 2.85% and 2.30%, respectively. These returns compare to the 0.03% average annual total return of the Fund’s primary benchmark, the Bank of America Merrill Lynch Three-Month U.S. Treasury Bill Index (the “Index”) during the same time period. The HFRX Global Hedge Fund Index, a broad proxy for hedge fund performance and the Fund’s secondary benchmark, returned -0.58% during the Reporting Period. |
| | To compare, the MSCI World Index, not the Fund’s benchmark but designed to measure the equity market performance of developed markets, had an average annual total return of 4.94% during the Reporting Period. Similarly not benchmarks of the Fund, the Barclays Global Aggregate Bond Index, designed to measure the broad global investment grade fixed income market, and the Barclays U.S. Corporate High Yield Bond Index, designed to measure the U.S. non-investment grade fixed-rate debt market, had average annual total returns of 0.59% and 2.45%, respectively, during the Reporting Period. |
| | References to the Fund’s benchmarks and to other indices mentioned herein are for informational purposes only, and unless otherwise noted, are not an indication of how the Fund is managed. The use of the Index as the Fund’s primary benchmark does not imply the Fund is being managed like cash and does not imply low risk or low volatility. |
| | Notably, during the Reporting Period, the Fund had a realized beta to the MSCI World Index of 0.50. (Beta is a measure of the sensitivity of an asset’s returns to broad market returns.) The Fund’s overall annualized volatility was 4.9% during the Reporting Period, while the overall annualized volatility of the global equity markets, as measured by the MSCI World Index, during the same time period was 8.2%. |
| Q | | What economic and market factors most influenced the financial markets as a whole during the Reporting Period? |
| A | | Global stock markets delivered strong returns in 2014, with U.S., European, Japanese and emerging market equity markets posting positive returns (in local currency terms) during the Reporting Period. U.S. equity markets, as represented by the S&P 500 Index, rose to record levels during the Reporting Period. The U.S. equity market was driven by an improving job market and low interest rates, which bolstered investor confidence despite a dramatic fall in oil prices during the second half of 2014 (which particularly weighed on energy stocks) and fears of a prolonged period of slow economic growth in Europe and China. European and Asian equity markets also managed gains (in local currency terms) for the calendar year 2014 even as geopolitical issues like elections in Brazil and Russia’s annexation of Crimea provided momentary headwinds to equity markets. |
| | The U.S. fixed income market exhibited exceptional resilience during the Reporting Period considering that expectations at the beginning of 2014 were for bond yields to rise as the Federal Reserve (the “Fed”) ended its quantitative easing program and perhaps might raise interest rates. The first half of 2014 in the fixed income market could largely be defined by investors looking for investment income in higher yielding but lower credit quality securities. However, the latter half of the year saw investors exit these higher yielding instruments on the back of lower inflation expectations predicated on lower global economic growth. The yield on the frequently-referenced 10-year U.S. Treasury note stood at 2.17% at the end of the Reporting Period, a significant decline from 3.03% at the start of 2014. Both high yield and leveraged loans, represented by the Barclays U.S. |
4
PORTFOLIO RESULTS
| | Corporate High Yield Bond Index and the S&P/LSTA Leveraged Loan Index, respectively, had positive returns for the year, although both slightly trailed the Barclays Global Aggregate Bond Index. |
| | The U.S. dollar strengthened versus all major currencies during the Reporting Period. The Japanese yen and the euro depreciated versus the U.S. dollar due to fears of sustained slow domestic economic growth. The Australian dollar and the New Zealand dollar weakened versus the U.S. dollar due to lower commodity demand and a slowing Chinese economy. |
| Q | | What key factors were responsible for the Fund’s performance during the Reporting Period? |
| A | | The Fund’s performance during the Reporting Period can be attributed to the performance of the Fund’s Underlying Managers, who are unaffiliated investment managers that employ one or more non-traditional and alternative investment strategies. During the Reporting Period, the Fund allocated capital to nine Underlying Managers — Ares Management LLC (“Ares”); Brigade Capital Management, L.P.1 (“Brigade”); First Pacific Advisors, LLC (“FPA”); GAM International Management Limited (“GAM”); Graham Capital Management, L.P. (“Graham”); Halcyon Liquid Strategies IC Management LP (“Halcyon”); Lateef Investment Management (“Lateef”); Polaris Capital Management, LLC (“Polaris”) and Sirios Capital Management, L.P. (“Sirios”). These nine Underlying Managers represented five strategies — dynamic equity (Lateef and Polaris); equity long/short (FPA and Sirios); event driven and credit (Ares, Brigade and Halcyon); tactical trading (Graham); and opportunistic fixed income (GAM). |
| | Three Underlying Managers were added during the Reporting Period — Sirios, Polaris and Corsair Capital Management, L.P. (“Corsair”). Sirios utilizes an equity long/short strategy investing in a concentrated long portfolio with select alpha shorts composed of highly liquid, large cap companies and some exchange traded fund shorts as appropriate. The Fund’s Board approved Sirios in April 2014, and we allocated capital to the eighth Underlying Manager during the third quarter of 2014. Polaris utilizes a dynamic equity strategy focused on global and international equity value investing. The Fund’s Board approved Polaris in August 2014 and we allocated capital to the ninth Underlying Manager during the fourth quarter of 2014. Corsair utilizes an equity long/short strategy that employs a catalyst driven, research intensive approach focusing on companies going through strategic and/or structural change. The Fund’s Board approved Corsair in November 2014, and we expect to allocate capital to the Underlying Manager during the first quarter of 2015. |
| | Of the nine Underlying Managers with allocated capital during the Reporting Period, four generated positive returns and five generated negative returns. |
| Q | | Which strategies most significantly affected Fund performance? |
| A | | Of the five strategies employed across the Underlying Managers during the Reporting Period, four generated positive returns and one posted a negative return. |
| | The Fund’s tactical trading strategy generated the strongest positive performance during the Reporting Period, with long-dated interest rate futures, equity and currency exposures contributing to gains. Tactical trading strategies seek to produce total return by long and short investing across global fixed income, currency, equity and commodity markets. Tactical trading managers may employ various investment styles. Tactical trading managers that employ a global macro style may select their investments based upon fundamental analysis, or determining an asset’s value based upon factors that directly affect its value. Tactical trading managers that employ a managed futures investing style may use quantitative modeling techniques, i.e., determining an asset’s value based upon an analysis of price history, price momentum and the asset’s value relative to that of other assets, among other factors. Some tactical trading managers may employ both fundamental analysis and quantitative modeling techniques. Tactical trading managers typically have no bias to be long, short or neutral. |
| | The Fund’s equity long/short strategy generated the second-strongest positive performance during the Reporting Period, attributable primarily to long positions in the consumer discretionary and information technology sectors. Equity long/short strategies generally involve long and short investing, based on fundamental evaluations, research and various analytical measurements, in equity and equity-related investments. Equity long/short managers may, for example, buy stocks they expect to outperform or they believe are undervalued, and may also sell short stocks they believe will underperform or they believe are overvalued. Long positions benefit from an increase in the price of the underlying instrument or asset class, while short positions benefit from a decrease in that price. |
| 1 | | Effective July 1, 2014, Brigade Capital Management, LLC converted from a limited liability company to a limited partnership; its legal name is now Brigade Capital Management, L.P. |
5
PORTFOLIO RESULTS
| | The dynamic equity strategy used in the Fund posted positive performance during the Reporting Period, driven primarily by equity market exposure and stock selection, with positions in the health care and industrial sectors representing the top contributors. Dynamic equity strategies generally involve investing in equity instruments, often with a long-term view. Dynamic equity strategies are less likely to track a benchmark than traditional long-only strategies, and dynamic equity managers are less constrained than traditional long-only managers with respect to factors such as position concentration, sector and country weights, style and market capitalization. |
| | The Fund’s event driven and credit strategies posted modestly positive performance, aided by positions in select corporate high yield bonds and bank loans, although equity holdings in the energy sector detracted. Event driven and credit strategies seek to achieve gains from market movements in security prices caused by specific corporate events or changes in perceived relative value. These strategies may include, among others, merger arbitrage, distressed credit, opportunistic credit and value with a catalyst investing styles. |
| | The Fund’s opportunistic fixed income strategy posted modestly negative returns during the Reporting Period, struggling due to unanticipated volatility in emerging market interest rates and a decline in the price of high yield bonds in their portfolio. More specifically, the strategy’s weak performance was due to its developed market rate positioning as yield curves in the U.K. and U.S. flattened, meaning the yield differential between longer-term and shorter-term maturities narrowed. Opportunistic fixed income strategies seek to deliver positive absolute returns in excess of cash investments regardless of economic cycle (i.e., downturns and upswings) or cyclical credit availability. Opportunistic fixed income managers seek to maintain diversified exposure across various fixed income and floating rate market segments, with a focus on more liquid markets, assessing the relative value across sectors and adjusting portfolio weightings based on opportunity. |
| Q | | How did the Fund use derivatives and similar instruments during the Reporting Period? |
| A | | The Underlying Managers of the Fund employ derivatives and similar instruments as part of their underlying strategies to hedge market exposure and/or to gain implicit leverage, subject to the constraints of the Investment Company Act of 1940, as amended. During the Reporting Period, credit default swaps, options on credit default swaps, equity futures, interest rate futures, interest rate swaps, options on interest rate futures, interest rate swaptions, bond futures, options on bond futures, forward foreign exchange contracts and foreign exchange options were used in the Fund. |
| Q | | Were there any notable changes in the Fund’s allocations during the Reporting Period? |
| A | | During the Reporting Period, shifts to the Fund’s asset allocation were made in response to the market environment and as a result of allocation to two new Underlying Managers, (i.e., Sirios and Polaris). More specifically, we increased the Fund’s allocations to equity long/short and event driven and credit strategies and reduced its allocations to dynamic equity, opportunistic fixed income and tactical trading strategies in recognition of historically high equity market valuations and to seek to take advantage of equity strategies that have the ability to participate in investment opportunities with a more asymmetrical risk/return profile. The Fund’s allocation to cash also decreased during the Reporting Period. |
| Q | | What is the Fund’s tactical view and strategy for the months ahead? |
| A | | We intend to continue to closely monitor global economic recovery, monetary policy and market volatility, while using active portfolio management and alternative investment strategies to position the Fund as we aim to deliver positive absolute returns across a variety of market environments. We believe the flexibility to allocate tactically across these alternative strategies may enable us to provide investors with positive absolute returns in a variety of market conditions and with significant diversification benefits. We intend to continue to actively explore adding new Underlying Managers with what we consider to be unique alternative capabilities as market conditions warrant. |
6
PORTFOLIO RESULTS
Index Definitions:
The Bank of America Merrill Lynch Three-Month U.S. Treasury Bill Index measures total return on cash, including price and interest income, based on short-term government Treasury Bills of about 90-day maturity, as reported by BofA Merrill Lynch.
The HFRX Global Hedge Fund Index is designed to be representative of the overall composition of the hedge fund universe. The HFRX Global Hedge Fund Index is a trademark of Hedge Fund Research, Inc. (“HFR”). HFR has not participated in the formation of the Fund. HFR does not endorse or approve the Fund or make any recommendation with respect to investing in the Fund. (Source: Hedgefundresearch.com)
The Barclays Global Aggregate Bond Index is an unmanaged index, provides a broad-based measure of the global investment-grade fixed-rate debt markets and covers the most liquid portion of the global investment grade fixed-rate bond market, including government, credit and collateralized securities.
The Barclays U.S. Corporate High Yield Bond Index covers the universe of U.S. dollar denominated, nonconvertible, fixed rate, non-investment grade debt. Index holdings must have at least one year to final maturity, at least $150 million par amount outstanding, and be publicly issued with a rating of Ba1 or lower.
The MSCI World Index captures large and mid cap representation across the following 23 Developed Markets countries: Australia, Austria, Belgium, Canada, Denmark, Finland, France, Germany, Hong Kong, Ireland, Israel, Italy, Japan, Netherlands, New Zealand, Norway, Portugal, Singapore, Spain, Sweden, Switzerland, the UK and the US.
The S&P/LSTA U.S. Leveraged Loan Index provides an overview of the Senior Secured, Floating Rate Leveraged Loan market as well as an expansive review of the S&P Leveraged Loan Index (LLI) and sub-indexes including daily pricing on the S&P/LSTA LLI 100.
The S&P 500 Index is the Standard & Poor’s 500 Composite Index of 500 stocks, an unmanaged index of common stock prices. The Index figures do not reflect any deduction for fees, expenses or taxes. It is not possible to invest directly in an index.
All index figures do not reflect any deduction for fees, expenses or taxes. It is not possible to invest directly in an unmanaged index.
7
FUND BASICS
Multi-Manager Alternatives Fund
as of December 31, 2014
| | | | | | | | | | | | | | |
| | PERFORMANCE REVIEW | |
| | | January 1, 2014– December 31, 2014 | | Fund Total Return
(based on NAV)1 | | | Bank of America Merrill Lynch Three-
Month U.S. Treasury Bill Index2 | | | HFRX Global Hedge
Fund Index3 | |
| | Class A | | | 2.61 | % | | | 0.03 | % | | | -0.58 | % |
| | Class C | | | 1.84 | | | | 0.03 | | | | -0.58 | |
| | Institutional | | | 3.00 | | | | 0.03 | | | | -0.58 | |
| | Class IR | | | 2.85 | | | | 0.03 | | | | -0.58 | |
| | | Class R | | | 2.30 | | | | 0.03 | | | | -0.58 | |
| | 1 | | The net asset value (“NAV”) represents the net assets of the class of the Fund (ex-dividend) divided by the total number of shares of the class outstanding. The Fund’s performance reflects the reinvestment of dividends and other distributions. The Fund’s performance does not reflect the deduction of any applicable sales charges. |
| | 2 | | The Bank of America Merrill Lynch Three-Month U.S. Treasury Bill Index is comprised of a single issue purchased at the beginning of the month and held for a full month. At the end of the month that issue is sold and rolled into a newly selected issue. The issue selected at each month-end rebalancing is the outstanding Treasury Bill that matures closest to, but not beyond, three months from the rebalancing date. To qualify for selection, an issue must have settled on or before the month-end rebalancing date. While the index will often hold the Treasury Bill issued at the most recent 3-month auction, it is also possible for a seasoned 6-month Bill to be selected. |
| | 3 | | The HFRX Global Hedge Fund Index is designed to be representative of the overall composition of the hedge fund universe. It is comprised of all eligible hedge fund strategies; including but not limited to convertible arbitrage, distressed securities, equity hedge, equity market neutral, event driven, macro, merger arbitrage, and relative value arbitrage. The strategies are asset weighted based on the distribution of assets in the hedge fund industry. |
| | | | HFRI and HFRX and related indices are trademarks and service marks of Hedge Fund Research, Inc. (“HFR”) which has no affiliation with GSAM. Information regarding HFR indices was obtained from HFR’s website and other public sources and is provided for comparison purposes only. HFR does not endorse or approve any of the statements made herein. |
| | | | | | | | | | | | |
| | STANDARDIZED TOTAL RETURNS4 |
| | | For the period ended 12/31/14 | | One Year | | | Since Inception | | | Inception Date |
| | Class A | | | -3.05 | % | | | 1.21 | % | | 4/30/13 |
| | Class C | | | -0.17 | | | | 3.85 | | | 4/30/13 |
| | Institutional | | | 3.00 | | | | 5.03 | | | 4/30/13 |
| | Class IR | | | 2.85 | | | | 4.94 | | | 4/30/13 |
| | | Class R | | | 2.30 | | | | 4.36 | | | 4/30/13 |
| | 4 | | The Standardized Average Annual Total Returns are average annual total returns as of the most recent calendar quarter-end. They assume reinvestment of all distributions at NAV. These returns reflect a maximum initial sales charge of 5.50% for Class A Shares and the assumed contingent deferred sales charge for Class C Shares (1% if redeemed within 12 months of purchase). Because Institutional, Class IR and Class R Shares do not involve a sales charge, such a charge is not applied to their Standardized Total Returns. |
The returns set forth in the tables above represent past performance. Past performance does not guarantee future results. The Fund’s investment return and principal value will fluctuate so that an investor’s shares, when redeemed, may be worth more or less than their original cost. Current performance may be lower or higher than the performance quoted above. Please visit our web site at www.GSAMFUNDS.com to obtain the most recent month-end returns. Performance reflects applicable fee waivers and/or expense limitations in effect during the periods shown. In their absence, performance would be reduced. Returns do not reflect the deduction of taxes that a shareholder would pay on Fund distributions or the redemption of Fund shares.
8
FUND BASICS
| | | | | | | | | | |
| | EXPENSE RATIOS5 | |
| | | | | Net Expense Ratio (Current) | | | Gross Expense Ratio (Before Waivers) | |
| | Class A | | | 2.68 | % | | | 4.12 | % |
| | Class C | | | 3.43 | | | | 4.87 | |
| | Institutional | | | 2.28 | | | | 3.72 | |
| | Class IR | | | 2.43 | | | | 3.87 | |
| | | Class R | | | 2.92 | | | | 4.36 | |
| | 5 | | The expense ratios of the Fund, both current (net of applicable fee waivers and/or expense limitations) and before waivers (gross of applicable fee waivers and/or expense limitations) are as set forth above according to the most recent publicly available Prospectus for the Fund and may differ from the expense ratios disclosed in the Financial Highlights in this report. The Fund’s waivers and/or expense limitations will remain in place through at least April 30, 2015, and prior to such date the Investment Adviser may not terminate the arrangements without the approval of the Fund’s Board of Trustees. If these arrangements are discontinued in the future, the expense ratios may change without shareholder approval. |
| | |
| FUND COMPOSITION (%) |
| As of December 31, 2014 | | |
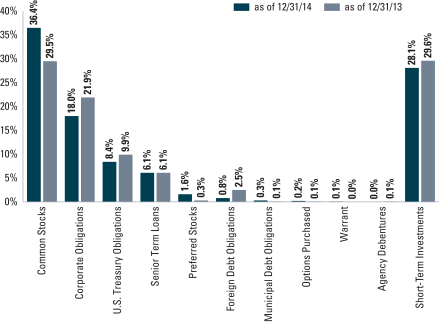
| | | | The percentage shown for each investment category reflects the value of investments in that category as a percentage of the Fund’s market value. The graph depicts the Fund’s investments but may not represent the Fund’s market exposure due to the exclusion of certain derivatives, if any, as listed in the Additional Investment Information section of the Schedule of Investments. Short-term investments represent investment companies and repurchase agreements. |
9
FUND BASICS
| | | | | | | | |
| | TOP TEN EQUITY HOLDINGS AS OF 12/31/146 |
| | | Holding | | % of Net Assets | | | Line of Business |
| | Northstar Realty Finance Corp. | | | 1.0 | % | | Real Estate Investment Trusts |
| | CVS Health Corp. | | | 0.9 | | | Food & Staples Retailing |
| | Oracle Corp. | | | 0.8 | | | Software |
| | Aon PLC | | | 0.8 | | | Insurance |
| | American International Group, Inc. | | | 0.7 | | | Insurance |
| | NextEra Energy, Inc. | | | 0.7 | | | Electric Utilities |
| | Ally Financial, Inc. | | | 0.7 | | | Consumer Finance |
| | Cedar Fair L.P. | | | 0.7 | | | Hotels, Restaurants & Leisure |
| | Ashland, Inc. | | | 0.6 | | | Chemicals |
| | | Microsoft Corp. | | | 0.6 | | | Software |
| | 6 | | The top 10 holdings may not be representative of the Fund’s future investments. |
| | | | | | |
| | UNDERLYING MANAGER ALLOCATION (%)7 | |
| | | As of December 31, 2014 | | | |
| | Ares Capital Management, LLC | | | 13.8 | |
| | Halcyon Liquid IC Strategies Management, L.P. | | | 16.4 | |
| | Brigade Capital Management, L.P. | | | 12.2 | |
| | Sirios Capital Management, L.P. | | | 8.8 | |
| | First Pacific Advisors, LLC | | | 16.3 | |
| | Lateef Investment Management, L.P. | | | 3.2 | |
| | Polaris Capital Management, LLC | | | 5.5 | |
| | GAM International Management Ltd | | | 8.2 | |
| | | Graham Capital Management, L.P. | | | 15.8 | |
| | 7 | | The charts above only represent capital allocated to the Underlying Managers, as a percentage of net assets, and as such the weightings may not sum to 100%. |
10
FUND BASICS
| | | | |
| | STRATEGY ALLOCATION (%)8 |
| | | As of December 31, 2014 | | |
| |
| | |  |
| | | | Equity Long/Short Strategies generally involve long and short investing, based on fundamental evaluations, research and various analytical measurements, in equity and equity-related investments. Dynamic Equity Strategies generally are long-biased strategies that are less constrained than traditional long-only managers with respect to factors such as position concentration, sector and country weights, style, and market capitalization. Event Driven and Credit Strategies typically seek to take advantage of corporate events and company-specific catalysts such as bankruptcies, mergers or takeovers. Opportunistic Fixed Income Strategies seek to maintain diversified exposure across various fixed income and floating rate market segments, including, among others, global emerging markets, investment grade and high yield debt markets, convertible bonds, and bank loans. Tactical Trading Strategies seek to produce total return by long and short investing across global fixed income, currency, equity, and commodity markets. Tactical Trading managers typically have no bias to be long, short, or neutral. |
| | 8 | | The chart above only represents capital allocated to the Underlying Managers, as a percentage of net assets, and as such the weightings may not sum to 100%. |
11
GOLDMAN SACHS MULTI-MANAGER ALTERNATIVES FUND
Performance Summary
December 31, 2014
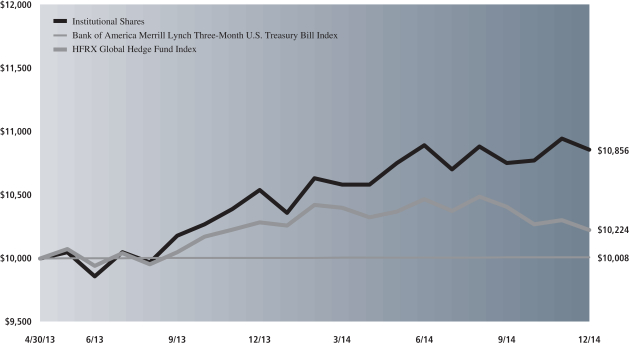
The following graph shows the value, as of December 31, 2014, of a $10,000 investment made on April 30, 2013 (commencement of operations) in Institutional Shares at NAV. For comparative purposes, the performance of the Fund’s current benchmarks, the Bank of America Merrill Lynch Three-Month U.S. Treasury Bill Index and the HFRX Global Hedge Fund Index, are shown. This performance data represents past performance and should not be considered indicative of future performance, which will fluctuate with changes in market conditions. These performance fluctuations will cause an investor’s shares, when redeemed, to be worth more or less than their original cost. Performance reflects applicable fee waivers and/or expense limitations in effect during the periods shown and in their absence, performance would be reduced. Returns do not reflect the deduction of taxes that a shareholder would pay on Fund distributions or the redemption of Fund shares. Performance of Class A, Class C, Class IR and Class R Shares will vary from Institutional Shares due to differences in class specific fees and any applicable sales charges. In addition to the Investment Adviser’s decisions regarding issuer/industry investment selection and allocation, other factors may affect Fund performance. These factors include, but are not limited to, Fund operating fees and expenses, portfolio turnover and subscription and redemption cash flows affecting the Fund.
|
| Multi-Manager Alternatives Fund’s Lifetime Performance |
Performance of a $10,000 Investment, with distributions reinvested, from April 30, 2013 through December 31, 2014.
| | | | | | |
| Average Annual Total Return through December 31, 2014 | | | One Year | | | Since Inception |
Class A (Commenced April 30, 2013) | | | | | | |
Excluding sales charges | | | 2.61% | | | 4.67% |
Including sales charges | | | -3.05% | | | 1.21% |
| | | | | | |
Class C (Commenced April 30, 2013) | | | | | | |
Excluding contingent deferred sales charges | | | 1.84% | | | 3.85% |
Including contingent deferred sales charges | | | -0.17% | | | 3.85% |
| | | | | | |
Institutional (Commenced April 30, 2013) | | | 3.00% | | | 5.03% |
| | | | | | |
Class IR (Commenced April 30, 2013) | | | 2.85% | | | 4.94% |
| | | | | | |
Class R (Commenced April 30, 2013) | | | 2.30% | | | 4.36% |
| | | | | | |
12
GOLDMAN SACHS MULTI-MANAGER ALTERNATIVES FUND
Schedule of Investments
December 31, 2014
| | | | | | | | |
| Shares | | | Description | | Value | |
| | | | | | | | |
| | Common Stocks – 38.9% | |
| | Aerospace & Defense – 0.9% | |
| | 62,332 | | | Airbus Group NV | | $ | 3,081,569 | |
| | 202,400 | | | Meggitt PLC | | | 1,628,155 | |
| | 4,432 | | | Precision Castparts Corp.(a) | | | 1,067,580 | |
| | 12,800 | | | United Technologies Corp. | | | 1,472,000 | |
| | | | | | | | |
| | | | | | | 7,249,304 | |
| | |
| | Auto Components – 0.1% | |
| | 9,400 | | | Cie Generale des Etablissements Michelin | | | 848,507 | |
| | |
| | Beverages – 1.2% | | | | |
| | 25,000 | | | Anheuser Busch InBev NV ADR | | | 2,808,000 | |
| | 26,600 | | | Asahi Group Holdings Ltd. | | | 822,932 | |
| | 16,300 | | | Carlsberg A/S Class B | | | 1,251,838 | |
| | 53,572 | | | Constellation Brands, Inc. Class A*(a) | | | 5,259,163 | |
| | | | | | | | |
| | | | | | | 10,141,933 | |
| | |
| | Biotechnology* – 0.6% | |
| | 13,898 | | | Celgene Corp. | | | 1,554,630 | |
| | 13,110 | | | Cubist Pharmaceuticals, Inc. | | | 1,319,522 | |
| | 20,320 | | | Gilead Sciences, Inc.(a) | | | 1,915,363 | |
| | | | | | | | |
| | | | | | | 4,789,515 | |
| | |
| | Capital Markets – 0.4% | |
| | 813 | | | Affiliated Managers Group, Inc.* | | | 172,551 | |
| | 76,612 | | | NorthStar Asset Management Group, Inc.(a) | | | 1,729,133 | |
| | 15,567 | | | T. Rowe Price Group, Inc. | | | 1,336,583 | |
| | | | | | | | |
| | | | | | | 3,238,267 | |
| | |
| | Chemicals – 1.9% | |
| | 44,366 | | | Ashland, Inc.(a) | | | 5,313,272 | |
| | 9,900 | | | BASF SE | | | 830,421 | |
| | 18,000 | | | LANXESS AG | | | 833,621 | |
| | 14,600 | | | Methanex Corp. | | | 670,685 | |
| | 39,984 | | | Rockwood Holdings, Inc.(a) | | | 3,150,739 | |
| | 569,000 | | | Showa Denko KK | | | 700,444 | |
| | 6,400 | | | Solvay SA | | | 866,016 | |
| | 15,500 | | | Symrise AG | | | 933,799 | |
| | 4,031 | | | The Sherwin-Williams Co.(a) | | | 1,060,314 | |
| | 21,700 | | | Yara International ASA | | | 966,353 | |
| | | | | | | | |
| | | | | | | 15,325,664 | |
| | |
| | Commercial Banks – 2.1% | |
| | 265,098 | | | Bank of America Corp.(a) | | | 4,742,603 | |
| | 23,000 | | | CIT Group, Inc. | | | 1,100,090 | |
| | 51,600 | | | Citigroup, Inc. | | | 2,792,076 | |
| | 50,541 | | | Comerica, Inc.(a) | | | 2,367,340 | |
| | 47,400 | | | DNB ASA | | | 699,180 | |
| | 10,573 | | | JPMorgan Chase & Co. | | | 661,658 | |
| | 112,100 | | | Sberbank of Russia ADR | | | 452,895 | |
| | 20,814 | | | Signature Bank*(a) | | | 2,621,731 | |
| | 95,600 | | | SpareBank 1 SR Bank ASA | | | 673,420 | |
| | 50,700 | | | Standard Chartered PLC | | | 758,264 | |
| | 18,300 | | | Svenska Handelsbanken AB | | | 856,218 | |
| | | | | | | | |
| | | | | | | 17,725,475 | |
| | |
| | | | | | | | |
| | Common Stocks – (continued) | |
| | Commercial Services & Supplies – 0.3% | |
| | 54,500 | | | Caverion Corp. | | $ | 436,896 | |
| | 31,800 | | | Loomis AB Class B | | | 918,626 | |
| | 23,968 | | | Tyco International PLC | | | 1,051,236 | |
| | | | | | | | |
| | | | | | | 2,406,758 | |
| | |
| | Communications Equipment – 0.8% | |
| | 38,600 | | | ARRIS Group, Inc.* | | | 1,165,334 | |
| | 128,800 | | | Cisco Systems, Inc. | | | 3,582,572 | |
| | 25,200 | | | QUALCOMM, Inc. | | | 1,873,116 | |
| | | | | | | | |
| | | | | | | 6,621,022 | |
| | |
| | Computers & Peripherals – 0.2% | |
| | 749 | | | Samsung Electronics Co. Ltd. | | | 900,481 | |
| | 17,400 | | | Wincor Nixdorf AG | | | 840,283 | |
| | | | | | | | |
| | | | | | | 1,740,764 | |
| | |
| | Construction & Engineering – 0.2% | |
| | 276,220 | | | Trevi Finanziaria Industriale SpA | | | 940,017 | |
| | 65,400 | | | YIT OYJ | | | 338,451 | |
| | | | | | | | |
| | | | | | | 1,278,468 | |
| | |
| | Construction Materials – 0.2% | |
| | 35,600 | | | CRH PLC | | | 856,019 | |
| | 12,200 | | | Imerys SA | | | 897,565 | |
| | | | | | | | |
| | | | | | | 1,753,584 | |
| | |
| | Consumer Finance(a) – 0.7% | |
| | 81,655 | | | Ally Financial, Inc.* | | | 1,928,691 | |
| | 61,715 | | | Discover Financial Services | | | 4,041,715 | |
| | | | | | | | |
| | | | | | | 5,970,406 | |
| | |
| | Containers & Packaging – 0.9% | |
| | 147,547 | | | Berry Plastics Group, Inc.*(a) | | | 4,655,108 | |
| | 73,900 | | | Owens-Illinois, Inc.* | | | 1,994,561 | |
| | 114,400 | | | Rexam PLC | | | 805,375 | |
| | | | | | | | |
| | | | | | | 7,455,044 | |
| | |
| | Diversified Consumer Services(a) – 0.1% | |
| | 33,311 | | | Service Corp. | | | 756,160 | |
| | |
| | Diversified Financial Services – 0.7% | |
| | 177,526 | | | FNFV Group* | | | 2,794,259 | |
| | 28,100 | | | Groupe Bruxelles Lambert SA | | | 2,397,499 | |
| | 25,400 | | | Investor AB | | | 923,488 | |
| | | | | | | | |
| | | | | | | 6,115,246 | |
| | |
| | Diversified Telecommunication Services – 0.3% | |
| | 51,200 | | | Deutsche Telekom AG | | | 819,217 | |
| | 29,422 | | | Verizon Communications, Inc.(a) | | | 1,376,361 | |
| | | | | | | | |
| | | | | | | 2,195,578 | |
| | |
| | Electric Utilities(a) – 0.7% | |
| | 56,035 | | | NextEra Energy, Inc. | | | 5,955,960 | |
| | |
| | |
| The accompanying notes are an integral part of these financial statements. | | 13 |
GOLDMAN SACHS MULTI-MANAGER ALTERNATIVES FUND
Schedule of Investments (continued)
December 31, 2014
| | | | | | | | |
| Shares | | | Description | | Value | |
| | | | | | | | |
| | Common Stocks – (continued) | |
| | Electrical Equipment – 0.4% | |
| | 15,292 | | | Acuity Brands, Inc.(a) | | $ | 2,141,950 | |
| | 29,822 | | | AMETEK, Inc. | | | 1,569,532 | |
| | | | | | | | |
| | | | | | | 3,711,482 | |
| | |
| | Electronic Equipment, Instruments & Components – 0.5% | |
| | 44,100 | | | TE Connectivity Ltd. | | | 2,789,325 | |
| | 37,442 | | | Trimble Navigation Ltd.* | | | 993,711 | |
| | | | | | | | |
| | | | | | | 3,783,036 | |
| | |
| | Energy Equipment & Services(a) – 0.2% | |
| | 3,976 | | | Dresser-Rand Group, Inc.* | | | 325,237 | |
| | 24,767 | | | Halliburton Co. | | | 974,086 | |
| | | | | | | | |
| | | | | | | 1,299,323 | |
| | |
| | Food & Staples Retailing – 1.2% | |
| | 77,400 | | | CVS Health Corp. | | | 7,454,394 | |
| | 29,200 | | | Walgreens Boots Alliance, Inc. | | | 2,225,040 | |
| | | | | | | | |
| | | | | | | 9,679,434 | |
| | |
| | Food Products – 0.5% | |
| | 191,600 | | | Greencore Group PLC | | | 851,062 | |
| | 9,800 | | | MEIJI Holdings Co. Ltd. | | | 891,596 | |
| | 152,700 | | | Orkla ASA | | | 1,039,500 | |
| | 33,900 | | | Unilever NV | | | 1,326,090 | |
| | | | | | | | |
| | | | | | | 4,108,248 | |
| | |
| | Health Care Equipment & Supplies(a) – 0.8% | |
| | 16,178 | | | Becton Dickinson & Co. | | | 2,251,330 | |
| | 39,453 | | | Covidien PLC | | | 4,035,253 | |
| | | | | | | | |
| | | | | | | 6,286,583 | |
| | |
| | Health Care Providers & Services – 1.4% | |
| | 126,635 | | | Brookdale Senior Living, Inc.*(a) | | | 4,643,705 | |
| | 29,100 | | | Express Scripts Holding Co.* | | | 2,463,897 | |
| | 6,158 | | | HCA Holdings, Inc.* | | | 451,935 | |
| | 81,641 | | | Synergy Health PLC | | | 2,647,490 | |
| | 9,480 | | | Universal Health Services, Inc. Class B(a) | | | 1,054,745 | |
| | | | | | | | |
| | | | | | | 11,261,772 | |
| | |
| | Hotels, Restaurants & Leisure – 2.1% | |
| | 177,816 | | | Amaya, Inc.* | | | 4,369,639 | |
| | 15,439 | | | Carnival Corp. | | | 699,850 | |
| | 122,970 | | | Cedar Fair LP(a) | | | 5,881,655 | |
| | 462,100 | | | Genting Malaysia Bhd | | | 536,600 | |
| | 46,800 | | | Lottomatica SpA | | | 1,044,989 | |
| | 166,981 | | | Morgans Hotel Group Co.*(a) | | | 1,309,131 | |
| | 8,262 | | | Restaurant Brands International, Inc.*(a) | | | 322,553 | |
| | 2,904,882 | | | REXLot Holdings Ltd. | | | 233,777 | |
| | 9,871 | | | The Habit Restaurants, Inc. Class A* | | | 319,327 | |
| | 165,853 | | | The Intertain Group Ltd. | | | 1,885,796 | |
| | 7,695 | | | Wynn Resorts Ltd. | | | 1,144,708 | |
| | | | | | | | |
| | | | | | | 17,748,025 | |
| | |
| | | | | | | | |
| | Common Stocks – (continued) | |
| | Household Durables – 0.7% | |
| | 132,245 | | | Barratt Developments PLC | | $ | 962,495 | |
| | 31,300 | | | Bellway PLC | | | 938,739 | |
| | 54,500 | | | Duni AB | | | 807,177 | |
| | 38,400 | | | Persimmon PLC* | | | 937,877 | |
| | 460,100 | | | Taylor Wimpey PLC | | | 981,584 | |
| | 6,435 | | | Whirlpool Corp.(a) | | | 1,246,717 | |
| | | | | | | | |
| | | | | | | 5,874,589 | |
| | |
| | Household Products – 0.2% | |
| | 13,000 | | | Henkel AG & Co. KGaA | | | 1,259,290 | |
| | |
| | Independent Power Producers & Energy Traders(a) – 0.1% | |
| | 34,767 | | | TerraForm Power, Inc. Class A | | | 1,073,605 | |
| | |
| | Industrial Conglomerates – 0.3% | |
| | 19,431 | | | Danaher Corp. | | | 1,665,431 | |
| | 18,200 | | | Jardine Matheson Holdings Ltd. | | | 720,666 | |
| | 700 | | | Jardine Strategic Holdings Ltd. | | | 23,681 | |
| | | | | | | | |
| | | | | | | 2,409,778 | |
| | |
| | Insurance – 2.1% | |
| | 2,970 | | | Alleghany Corp.* | | | 1,376,595 | |
| | 108,855 | | | American International Group, Inc. | | | 6,096,969 | |
| | 67,908 | | | Aon PLC | | | 6,439,716 | |
| | 10,500 | | | Hannover Rueck SE | | | 947,219 | |
| | 4,400 | | | Muenchener Rueckversicherungs AG | | | 876,204 | |
| | 49,322 | | | The Progressive Corp. | | | 1,331,201 | |
| | | | | | | | |
| | | | | | | 17,067,904 | |
| | |
| | Internet & Catalog Retail*(a) – 0.5% | |
| | 136,653 | | | Liberty Interactive Corp. Class A | | | 4,020,331 | |
| | |
| | Internet Software & Services* – 0.9% | |
| | 3,857 | | | Google, Inc. Class A(a) | | | 2,046,756 | |
| | 2,059 | | | Google, Inc. Class C | | | 1,083,857 | |
| | 89,670 | | | Yahoo!, Inc.(a) | | | 4,529,232 | |
| | | | | | | | |
| | | | | | | 7,659,845 | |
| | |
| | IT Services – 0.2% | |
| | 13,289 | | | Accenture PLC Class A | | | 1,186,841 | |
| | 26,000 | | | Infosys Ltd. ADR | | | 817,960 | |
| | | | | | | | |
| | | | | | | 2,004,801 | |
| | |
| | Life Sciences Tools & Services – 0.4% | |
| | 29,400 | | | Thermo Fisher Scientific, Inc. | | | 3,683,526 | |
| | |
| | Machinery – 1.4% | |
| | 52,627 | | | EnPro Industries, Inc.*(a) | | | 3,302,871 | |
| | 20,500 | | | Joy Global, Inc. | | | 953,660 | |
| | 20,300 | | | Kone Oyj Class B | | | 924,213 | |
| | 29,200 | | | Konecranes Oyj | | | 834,979 | |
| | 24,064 | | | SPX Corp.(a) | | | 2,067,579 | |
| | 13,164 | | | Stanley Black & Decker, Inc. | | | 1,264,797 | |
| | 10,400 | | | Sulzer AG | | | 1,112,500 | |
| | 14,601 | | | Wabtec Corp. | | | 1,268,681 | |
| | | | | | | | |
| | | | | | | 11,729,280 | |
| | |
| | |
| 14 | | The accompanying notes are an integral part of these financial statements. |
GOLDMAN SACHS MULTI-MANAGER ALTERNATIVES FUND
| | | | | | | | |
| Shares | | | Description | | Value | |
| | | | | | | | |
| | Common Stocks – (continued) | |
| | Media – 2.3% | |
| | 39,649 | | | DISH Network Corp. Class A* | | $ | 2,890,015 | |
| | 22,400 | | | IPSOS | | | 642,798 | |
| | 27,467 | | | Liberty Global PLC Series C*(a) | | | 1,326,931 | |
| | 17,140 | | | Naspers Ltd. | | | 2,217,147 | |
| | 13,277 | | | Scripps Networks Interactive Class A | | | 999,360 | |
| | 112,100 | | | The Interpublic Group of Cos., Inc. | | | 2,328,317 | |
| | 36,950 | | | Time Warner, Inc.(a) | | | 3,156,269 | |
| | 36,079 | | | Twenty-First Century Fox, Inc. Class A | | | 1,385,614 | |
| | 21,783 | | | Viacom, Inc. Class B(a) | | | 1,639,171 | |
| | 118,400 | | | WPP PLC | | | 2,461,733 | |
| | | | | | | | |
| | | | | | | 19,047,355 | |
| | |
| | Metals & Mining – 0.6% | |
| | 201,600 | | | Alcoa, Inc. | | | 3,183,264 | |
| | 18,800 | | | BHP Billiton PLC ADR | | | 808,400 | |
| | 23,400 | | | MMC Norilsk Nickel OJSC ADR | | | 332,748 | |
| | 163,650 | | | Norsk Hydro ASA | | | 921,846 | |
| | | | | | | | |
| | | | | | | 5,246,258 | |
| | |
| | Multiline Retail – 0.3% | |
| | 124,951 | | | Hudson’s Bay Co. | | | 2,641,415 | |
| | |
| | Oil, Gas & Consumable Fuels – 1.4% | |
| | 7,700 | | | California Resources Corp.* | | | 42,427 | |
| | 63,300 | | | Canadian Natural Resources Ltd. | | | 1,954,704 | |
| | 65,900 | | | Etablissements Maurel et Prom* | | | 615,892 | |
| | 87,300 | | | Gazprom OAO ADR | | | 395,469 | |
| | 10,200 | | | Lukoil OAO ADR | | | 401,009 | |
| | 30,200 | | | Occidental Petroleum Corp. | | | 2,434,422 | |
| | 36,400 | | | Rosneft OAO GDR | | | 127,764 | |
| | 17,500 | | | Sasol Ltd. | | | 653,150 | |
| | 19,740 | | | SemGroup Corp. Class A(a) | | | 1,350,019 | |
| | 713,600 | | | Thai Oil PCL | | | 908,049 | |
| | 44,146 | | | The Williams Cos., Inc.(a) | | | 1,983,921 | |
| | 126,100 | | | Tullow Oil PLC | | | 812,633 | |
| | | | | | | | |
| | | | | | | 11,679,459 | |
| | |
| | Pharmaceuticals – 1.0% | |
| | 23,649 | | | Hospira, Inc.* | | | 1,448,501 | |
| | 14,102 | | | Merck & Co., Inc.(a) | | | 800,852 | |
| | 9,400 | | | Novartis AG | | | 871,789 | |
| | 15,800 | | | Teva Pharmaceutical Industries Ltd. ADR | | | 908,658 | |
| | 19,555 | | | Valeant Pharmaceuticals International, Inc.* | | | 2,798,516 | |
| | 31,220 | | | Zoetis, Inc. | | | 1,343,397 | |
| | | | | | | | |
| | | | | | | 8,171,713 | |
| | |
| | Professional Services – 0.5% | |
| | 21,909 | | | Nielsen Holdings NV | | | 979,990 | |
| | 21,754 | | | Robert Half International, Inc. | | | 1,269,998 | |
| | 15,198 | | | Towers Watson & Co. Class A | | | 1,719,958 | |
| | | | | | | | |
| | | | | | | 3,969,946 | |
| | |
| | | | | | | | |
| | Common Stocks – (continued) | |
| | Real Estate Investment Trusts – 2.9% | |
| | 45,766 | | | Colony Financial, Inc.(a) | | $ | 1,090,146 | |
| | 764,337 | | | Gramercy Property Trust, Inc. | | | 5,273,925 | |
| | 84,659 | | | iStar Financial, Inc. Series D | | | 2,116,475 | |
| | 92,314 | | | iStar Financial, Inc. Series E | | | 2,280,156 | |
| | 93,122 | | | Lamar Advertising Co. Class A(a) | | | 4,995,064 | |
| | 454,547 | | | Northstar Realty Finance Corp.(a) | | | 7,990,936 | |
| | | | | | | | |
| | | | | | | 23,746,702 | |
| | |
| | Real Estate Management & Development – 0.1% | |
| | 6,992 | | | Jones Lang LaSalle, Inc. | | | 1,048,311 | |
| | |
| | Road & Rail – 0.6% | |
| | 15,064 | | | Hertz Global Holdings, Inc.* | | | 375,696 | |
| | 3,446 | | | J.B. Hunt Transport Services, Inc. | | | 290,326 | |
| | 2,842 | | | Kansas City Southern | | | 346,809 | |
| | 21,229 | | | Old Dominion Freight Line, Inc.*(a) | | | 1,648,220 | |
| | 16,101 | | | Saia, Inc.*(a) | | | 891,351 | |
| | 13,175 | | | Union Pacific Corp.(a) | | | 1,569,538 | |
| | | | | | | | |
| | | | | | | 5,121,940 | |
| | |
| | Semiconductors & Semiconductor Equipment – 0.6% | |
| | 44,900 | | | Analog Devices, Inc. | | | 2,492,848 | |
| | 37,300 | | | Intel Corp. | | | 1,353,617 | |
| | 2,843 | | | MModal, Inc. | | | 22,798 | |
| | 50,159 | | | SunEdison, Inc.*(a) | | | 978,602 | |
| | | | | | | | |
| | | | | | | 4,847,865 | |
| | |
| | Software – 1.4% | |
| | 113,800 | | | Microsoft Corp. | | | 5,286,010 | |
| | 143,500 | | | Oracle Corp. | | | 6,453,195 | |
| | | | | | | | |
| | | | | | | 11,739,205 | |
| | |
| | Specialty Retail(a) – 0.1% | |
| | 21,755 | | | Penske Automotive Group, Inc. | | | 1,067,518 | |
| | |
| | Textiles, Apparel & Luxury Goods – 0.1% | |
| | 4,900 | | | Christian Dior SA | | | 838,576 | |
| | 276 | | | Hermes International | | | 98,279 | |
| | | | | | | | |
| | | | | | | 936,855 | |
| | |
| | Transportation Infrastructure – 0.1% | |
| | 103,618 | | | BBA Aviation PLC | | | 579,079 | |
| | |
| | Water Utilities – 0.1% | |
| | 438,000 | | | Guangdong Investment Ltd. | | | 570,471 | |
| | |
| | Wireless Telecommunication Services – 0.6% | |
| | 29,000 | | | Freenet AG | | | 824,536 | |
| | 13,500 | | | KDDI Corp. | | | 848,124 | |
| | 83,354 | | | T-Mobile US, Inc.*(a) | | | 2,245,557 | |
| | 29,200 | | | Vodafone Group PLC ADR | | | 997,764 | |
| | | | | | | | |
| | | | | | | 4,915,981 | |
| | |
| | TOTAL COMMON STOCKS | |
| | (Cost $303,289,644) | | $ | 321,558,580 | |
| | |
| | |
| The accompanying notes are an integral part of these financial statements. | | 15 |
GOLDMAN SACHS MULTI-MANAGER ALTERNATIVES FUND
Schedule of Investments (continued)
December 31, 2014
| | | | | | | | | | | | | | |
Principal Amount | | | Interest
Rate | | | Maturity
Date | | | Value | |
| | | | | | | | | | | | | | |
| | Corporate Obligations – 19.2% | |
| | Aerospace & Defense – 0.3% | |
| Alliant Techsystems, Inc.(b)(c) | |
| $ | 200,000 | | | | 5.250 | % | | | 10/01/21 | | | $ | 197,500 | |
| Bombardier, Inc.(b) | |
| | 500,000 | | | | 4.750 | | | | 04/15/19 | | | | 495,625 | |
| | 500,000 | | | | 6.000 | (c) | | | 10/15/22 | | | | 505,000 | |
| Moog, Inc.(b)(c) | |
| | 273,000 | | | | 5.250 | | | | 12/01/22 | | | | 276,413 | |
| Oshkosh Corp.(c) | |
| | 300,000 | | | | 5.375 | | | | 03/01/22 | | | | 305,250 | |
| Spirit AeroSystems, Inc.(c) | |
| | 510,000 | | | | 5.250 | | | | 03/15/22 | | | | 515,737 | |
| TransDigm, Inc.(c) | |
| | 320,000 | | | | 6.000 | | | | 07/15/22 | | | | 320,000 | |
| | | | | | | | | | | | | | |
| | | | | | | | | | | | | 2,615,525 | |
| | |
| | Airlines(b) – 0.0% | |
| Air Canada | |
| | 335,000 | | | | 7.750 | | | | 04/15/21 | | | | 349,656 | |
| | |
| | Automotive – 0.2% | |
| Affinia Group, Inc.(c) | |
| | 85,000 | | | | 7.750 | | | | 05/01/21 | | | | 87,337 | |
| Faurecia | |
| EUR | 297,500 | | | | 3.250 | | | | 01/01/18 | | | | 117,969 | |
| General Motors Co. | |
| $ | 80,000 | | | | 3.500 | | | | 10/02/18 | | | | 81,600 | |
| Gestamp Funding Luxembourg SA(b)(c) | |
| | 250,000 | | | | 5.625 | | | | 05/31/20 | | | | 252,500 | |
| Schaeffler Finance BV(b)(c) | |
| | 221,000 | | | | 4.250 | | | | 05/15/21 | | | | 217,685 | |
| Schaeffler Holding Finance BV(b)(c)(d) | |
| | 625,000 | | | | 6.750 | | | | 11/15/22 | | | | 653,125 | |
| | | | | | | | | | | | | | |
| | | | | | | | | | | | | 1,410,216 | |
| | |
| | Banks – 1.7% | |
| AmBank M Bhd | |
| | 200,000 | | | | 3.125 | | | | 07/03/19 | | | | 200,490 | |
| Bangkok Bank PCL | |
| | 200,000 | | | | 3.300 | | | | 10/03/18 | | | | 204,623 | |
| CaixaBank SA | |
| EUR | 100,000 | | | | 4.500 | | | | 11/22/16 | | | | 109,122 | |
| Citigroup, Inc.(e) | |
| $ | 700,000 | | | | 0.933 | | | | 11/24/17 | | | | 700,174 | |
| Credit Suisse New York | |
| | 500,000 | | | | 3.000 | | | | 10/29/21 | | | | 497,676 | |
| | 1,000,000 | | | | 3.625 | | | | 09/09/24 | | | | 1,018,086 | |
| HSBC USA, Inc.(e) | |
| | 800,000 | | | | 0.843 | | | | 11/13/19 | | | | 799,978 | |
| ING Bank NV(b) | |
| | 200,000 | | | | 1.375 | | | | 03/07/16 | | | | 200,719 | |
| | 800,000 | | | | 0.925 | (e) | | | 10/01/19 | | | | 801,112 | |
| JPMorgan Chase & Co. | |
| | 500,000 | | | | 2.200 | | | | 10/22/19 | | | | 494,893 | |
| JPMorgan Chase Bank NA(c)(e) | |
| EUR | 600,000 | | | | 0.784 | | | | 05/31/17 | | | | 724,434 | |
| JPMorgan Chase Capital XXI(c)(e) | |
| $ | 320,000 | | | | 1.182 | | | | 02/02/37 | | | | 262,400 | |
| | |
| | | | | | | | | | | | | | |
| | Corporate Obligations – (continued) | |
| | Banks – (continued) | |
| JPMorgan Chase Capital XXIII(c)(e) | |
| $ | 110,000 | | | | 1.232 | % | | | 05/15/47 | | | $ | 89,100 | |
| Lloyds Bank PLC(c)(e) | |
| | 90,000 | | | | 0.600 | | | | 06/29/49 | | | | 59,580 | |
| | 270,000 | | | | 0.438 | | | | 11/29/49 | | | | 178,740 | |
| Lloyds Banking Group PLC(b)(c)(e) | |
| | 245,000 | | | | 6.657 | | | | 05/21/49 | | | | 261,538 | |
| | 100,000 | | | | 6.413 | | | | 10/01/49 | | | | 106,500 | |
| Lloyds TSB Bank PLC | |
| | 300,000 | | | | 6.375 | | | | 01/21/21 | | | | 359,465 | |
| Macquarie Bank Ltd. | |
| | 461,000 | | | | 5.000 | | | | 02/22/17 | | | | 491,705 | |
| | 300,000 | | | | 1.045 | (b)(e) | | | 03/24/17 | | | | 301,301 | |
| Royal Bank of Canada | |
| | 110,000 | | | | 1.200 | | | | 09/19/17 | | | | 109,322 | |
| Royal Bank of Scotland PLC | |
| | 250,000 | | | | 2.550 | | | | 09/18/15 | | | | 252,503 | |
| | 340,000 | | | | 7.648 | (c)(e) | | | 08/29/49 | | | | 396,100 | |
| Santander International Debt SA | |
| GBP | 200,000 | | | | 3.160 | | | | 12/01/15 | | | | 316,337 | |
| Standard Chartered PLC(b) | |
| $ | 150,000 | | | | 3.850 | | | | 04/27/15 | | | | 151,432 | |
| State Street Capital Trust IV(c)(e) | |
| | 40,000 | | | | 1.241 | | | | 06/01/77 | | | | 33,200 | |
| UBS AG(e) | |
| | 750,000 | | | | 0.873 | | | | 08/14/19 | | | | 752,351 | |
| Wachovia Capital Trust III(c)(e) | |
| | 170,000 | | | | 5.570 | | | | 03/29/49 | | | | 164,135 | |
| Washington Mutual Bank(f) | |
| | 10,000,000 | | | | 0.000 | | | | 11/06/09 | | | | 2,750,000 | |
| | 3,000,000 | | | | 0.000 | | | | 06/16/10 | | | | 825,000 | |
| | | | | | | | | | | | | | |
| | | | | | | | | | | | | 13,612,016 | |
| | |
| | Brokerage – 0.2% | |
| Morgan Stanley, Inc. | |
| | 800,000 | | | | 0.975 | (e) | | | 01/05/18 | | | | 800,203 | |
| | 400,000 | | | | 3.875 | | | | 04/29/24 | | | | 410,428 | |
| | 500,000 | | | | 3.700 | | | | 10/23/24 | | | | 506,404 | |
| The Bear Stearns Cos. LLC(e) | |
| | 200,000 | | | | 0.621 | | | | 11/21/16 | | | | 199,511 | |
| | | | | | | | | | | | | | |
| | | | | | | | | | | | | 1,916,546 | |
| | |
| | Building Materials – 0.1% | |
| Cemex SAB de CV(b)(c) | |
| | 200,000 | | | | 7.250 | | | | 01/15/21 | | | | 211,000 | |
| Gibraltar Industries, Inc.(c) | |
| | 600,000 | | | | 6.250 | | | | 02/01/21 | | | | 612,000 | |
| Norbord, Inc.(b) | |
| | 300,000 | | | | 5.375 | | | | 12/01/20 | | | | 292,246 | |
| | | | | | | | | | | | | | |
| | | | | | | | | | | | | 1,115,246 | |
| | |
| | Chemicals – 0.2% | | | | | | | | | | | | | |
| Cornerstone Chemical Co.(b)(c) | |
| | 465,000 | | | | 9.375 | | | | 03/15/18 | | | | 474,300 | |
| Momentive Performance Materials, Inc.(c) | |
| | 750,000 | | | | 3.880 | | | | 10/24/21 | | | | 633,750 | |
| | |
| | |
| 16 | | The accompanying notes are an integral part of these financial statements. |
GOLDMAN SACHS MULTI-MANAGER ALTERNATIVES FUND
| | | | | | | | | | | | | | |
Principal Amount | | | Interest
Rate | | | Maturity
Date | | | Value | |
| | | | | | | | | | | | | | |
| | Corporate Obligations – (continued) | |
| | Chemicals – (continued) | |
| MPM Escrow LLC | |
| $ | 750,000 | | | | 8.875 | % | | | 10/15/20 | | | $ | — | |
| Rain CII Carbon LLC/CII Carbon Corp.(b)(c) | |
| | 770,000 | | | | 8.250 | | | | 01/15/21 | | | | 787,325 | |
| SPCM SA(b)(c) | |
| | 49,000 | | | | 6.000 | | | | 01/15/22 | | | | 50,960 | |
| | | | | | | | | | | | | | |
| | | | | | | | | | | | | 1,946,335 | |
| | |
| | Commercial Services – 0.0% | |
| RAG-Stiftung(g) | |
| EUR | 100,000 | | | | 0.000 | | | | 12/31/18 | | | | 121,187 | |
| Total System Services, Inc.(c) | |
| $ | 100,000 | | | | 3.750 | | | | 06/01/23 | | | | 97,709 | |
| | | | | | | | | | | | | | |
| | | | | | | | | | | | | 218,896 | |
| | |
| | Consumer Cyclical Services – 0.8% | |
| APX Group, Inc.(c) | |
| | 65,000 | | | | 6.375 | | | | 12/01/19 | | | | 61,912 | |
| | 30,000 | | | | 8.750 | (b) | | | 12/01/20 | | | | 25,575 | |
| | 1,340,000 | | | | 8.750 | | | | 12/01/20 | | | | 1,142,350 | |
| Aramark Services, Inc.(c) | |
| | 1,000,000 | | | | 5.750 | | | | 03/15/20 | | | | 1,032,500 | |
| Ashtead Capital, Inc.(b)(c) | |
| | 115,000 | | | | 6.500 | | | | 07/15/22 | | | | 123,050 | |
| Ceridian HCM Holding, Inc.(b)(c) | |
| | 250,000 | | | | 11.000 | | | | 03/15/21 | | | | 272,500 | |
| First Data Corp.(b)(c) | |
| | 860,000 | | | | 6.750 | | | | 11/01/20 | | | | 922,350 | |
| Iron Mountain, Inc.(c) | |
| | 989,000 | | | | 5.750 | | | | 08/15/24 | | | | 989,000 | |
| Monitronics International, Inc.(c) | |
| | 870,000 | | | | 9.125 | | | | 04/01/20 | | | | 824,325 | |
| Multi-Color Corp.(b)(c) | |
| | 1,000,000 | | | | 6.125 | | | | 12/01/22 | | | | 997,500 | |
| The ADT Corp. | |
| | 160,000 | | | | 6.250 | | | | 10/15/21 | | | | 164,800 | |
| United Rentals North America, Inc.(c) | |
| | 90,000 | | | | 7.375 | | | | 05/15/20 | | | | 97,200 | |
| | | | | | | | | | | | | | |
| | | | | | | | | | | | | 6,653,062 | |
| | |
| | Consumer Noncyclical – 0.1% | |
| BAT International Finance PLC | |
| | 200,000 | | | | 1.125 | | | | 03/29/16 | | | | 200,147 | |
| NeuStar, Inc.(c) | |
| | 291,000 | | | | 4.500 | | | | 01/15/23 | | | | 250,988 | |
| | | | | | | | | | | | | | |
| | | | | | | | | | | | | 451,135 | |
| | |
| | Consumer Products – Household & Leisure(c) – 0.2% | |
| Albea Beauty Holdings SA(b) | |
| | 400,000 | | | | 8.375 | | | | 11/01/19 | | | | 416,000 | |
| American Achievement Corp.(b) | |
| | 890,000 | | | | 10.875 | | | | 04/15/16 | | | | 853,287 | |
| Elizabeth Arden, Inc. | |
| | 713,000 | | | | 7.375 | | | | 03/15/21 | | | | 648,830 | |
| | | | | | | | | | | | | | |
| | | | | | | | | | | | | 1,918,117 | |
| | |
| | | | | | | | | | | | | | |
| | Corporate Obligations – (continued) | |
| | Consumer Products – Non Durable(c) – 0.0% | |
| Sally Holdings LLC | |
| $ | 100,000 | | | | 6.875 | % | | | 11/15/19 | | | $ | 106,250 | |
| | |
| | Diversified Financial Services – 0.5% | |
| Alphabet Holding Co., Inc.(c)(d) | |
| | 907,000 | | | | 7.750 | | | | 11/01/17 | | | | 768,682 | |
| Bankrate, Inc.(b)(c) | |
| | 1,500,000 | | | | 6.125 | | | | 08/15/18 | | | | 1,402,500 | |
| Henderson UK Finance PLC | |
| GBP | 100,000 | | | | 7.250 | | | | 03/24/16 | | | | 163,048 | |
| LCR Finance PLC | |
| | 200,000 | | | | 4.500 | | | | 12/07/28 | | | | 390,190 | |
| Magyar Nemzeti Vagyonkezelo Zrt | |
| EUR | 100,000 | | | | 3.375 | | | | 04/02/19 | | | | 122,215 | |
| OHL Investments SA | |
| | 100,000 | | | | 4.000 | | | | 04/25/18 | | | | 113,896 | |
| OneMain Financial Holdings, Inc.(b)(c) | |
| $ | 460,000 | | | | 7.250 | | | | 12/15/21 | | | | 471,500 | |
| Volkswagen International Finance NV | |
| EUR | 200,000 | | | | 5.500 | | | | 11/09/15 | | | | 269,043 | |
| | | | | | | | | | | | | | |
| | | | | | | | | | | | | 3,701,074 | |
| | |
| | Energy – 0.3% | |
| American Energy-Permian Basin LLC/AEPB Finance Corp.(b)(c) | |
| $ | 750,000 | | | | 7.125 | | | | 11/01/20 | | | | 555,000 | |
| Basic Energy Services, Inc.(c) | |
| | 100,000 | | | | 7.750 | | | | 02/15/19 | | | | 77,000 | |
| Blue Racer Midstream LLC/Blue Racer Finance Corp.(b)(c) | |
| | 295,000 | | | | 6.125 | | | | 11/15/22 | | | | 283,938 | |
| Chesapeake Energy Corp.(c)(e) | |
| | 100,000 | | | | 3.481 | | | | 04/15/19 | | | | 98,000 | |
| CITGO Petroleum Corp.(b)(c) | |
| | 133,000 | | | | 6.250 | | | | 08/15/22 | | | | 134,995 | |
| EXCO Resources, Inc.(c) | |
| | 665,000 | | | | 8.500 | | | | 04/15/22 | | | | 487,112 | |
| FTS International, Inc.(b)(c) | |
| | 170,000 | | | | 6.250 | | | | 05/01/22 | | | | 122,400 | |
| Pacific Drilling SA(b)(c) | |
| | 70,000 | | | | 5.375 | | | | 06/01/20 | | | | 56,000 | |
| Petrobras International Finance Co. | |
| | 144,000 | | | | 5.375 | | | | 01/27/21 | | | | 133,128 | |
| Seventy Seven Energy, Inc.(c) | |
| | 600,000 | | | | 6.500 | | | | 07/15/22 | | | | 354,000 | |
| Southern Star Central Corp.(b)(c) | |
| | 180,000 | | | | 5.125 | | | | 07/15/22 | | | | 181,800 | |
| Technip SA | |
| EUR | 111,600 | | | | 0.500 | | | | 01/01/16 | | | | 111,990 | |
| YPF SA(b) | |
| $ | 230,000 | | | | 8.750 | | | | 04/04/24 | | | | 228,850 | |
| | | | | | | | | | | | | | |
| | | | | | | | | | | | | 2,824,213 | |
| | |
| | Energy – Exploration & Production – 0.8% | |
| Aabar Investments PJSC | |
| EUR | 200,000 | | | | 4.000 | | | | 05/27/16 | | | | 286,491 | |
| Alpha Natural Resources, Inc. | |
| | 100,000 | | | | 3.750 | | | | 12/15/17 | | | | 49,938 | |
| | 825,000 | | | | 6.000 | (c) | | | 06/01/19 | | | | 261,937 | |
| | |
| | |
| The accompanying notes are an integral part of these financial statements. | | 17 |
GOLDMAN SACHS MULTI-MANAGER ALTERNATIVES FUND
Schedule of Investments (continued)
December 31, 2014
| | | | | | | | | | | | | | |
Principal Amount | | | Interest
Rate | | | Maturity
Date | | | Value | |
| | | | | | | | | | | | | | |
| | Corporate Obligations – (continued) | |
| | Energy – Exploration & Production – (continued) | |
| CONSOL Energy, Inc.(c) | |
| EUR | 100,000 | | | | 8.250 | % | | | 04/01/20 | | | $ | 104,250 | |
| ENI SpA | |
| | 200,000 | | | | 0.250 | | | | 11/30/15 | | | | 241,115 | |
| EnQuest PLC(b)(c) | |
| $ | 370,000 | | | | 7.000 | | | | 04/15/22 | | | | 215,525 | |
| Halcon Resources Corp.(c) | |
| | 350,000 | | | | 9.750 | | | | 07/15/20 | | | | 264,250 | |
| | 803,000 | | | | 8.875 | | | | 05/15/21 | | | | 604,257 | |
| Harvest Operations Corp. | |
| | 400,000 | | | | 2.125 | | | | 05/14/18 | | | | 397,155 | |
| Ithaca Energy, Inc.(b)(c) | |
| | 200,000 | | | | 8.125 | | | | 07/01/19 | | | | 151,000 | |
| Jupiter Resources, Inc.(b)(c) | |
| | 45,000 | | | | 8.500 | | | | 10/01/22 | | | | 33,750 | |
| Linn Energy LLC/Linn Energy Finance Corp.(c) | |
| | 800,000 | | | | 7.250 | | | | 11/01/19 | | | | 676,000 | |
| MEG Energy Corp.(b)(c) | |
| | 55,000 | | | | 7.000 | | | | 03/31/24 | | | | 50,325 | |
| Memorial Production Partners LP/Memorial Production Finance
Corp.(c) |
|
| | 829,000 | | | | 7.625 | | | | 05/01/21 | | | | 663,200 | |
| | 265,000 | | | | 6.875 | (b) | | | 08/01/22 | | | | 199,412 | |
| Midstates Petroleum Co., Inc./Midstates Petroleum Co. LLC(c) | |
| | 1,243,000 | | | | 10.750 | | | | 10/01/20 | | | | 665,005 | |
| | 100,000 | | | | 9.250 | | | | 06/01/21 | | | | 51,000 | |
| Peabody Energy Corp. | |
| | 350,000 | | | | 6.000 | | | | 11/15/18 | | | | 318,500 | |
| | 300,000 | | | | 6.250 | | | | 11/15/21 | | | | 258,000 | |
| Penn Virginia Resource Partners LP/Penn Virginia Resource
Finance Corp.(c) |
|
| | 200,000 | | | | 6.500 | | | | 05/15/21 | | | | 202,000 | |
| Plains Exploration & Production Co.(c) | |
| | 146,000 | | | | 6.875 | | | | 02/15/23 | | | | 162,425 | |
| SandRidge Energy, Inc.(c) | |
| | 1,095,000 | | | | 7.500 | | | | 02/15/23 | | | | 689,850 | |
| SM Energy Co.(b)(c) | |
| | 117,000 | | | | 6.125 | | | | 11/15/22 | | | | 110,273 | |
| Walter Energy, Inc.(c) | |
| | 40,000 | | | | 9.875 | | | | 12/15/20 | | | | 8,500 | |
| | 125,000 | | | | 8.500 | | | | 04/15/21 | | | | 24,688 | |
| | | | | | | | | | | | | | |
| | | | | | | | | | | | | 6,688,846 | |
| | |
| | Energy – Services(b)(c) – 0.1% | |
| Hiland Partners LP/Hiland Partners Finance Corp. | |
| | 400,000 | | | | 7.250 | | | | 10/01/20 | | | | 380,000 | |
| | 625,000 | | | | 5.500 | | | | 05/15/22 | | | | 531,250 | |
| Trinidad Drilling Ltd. | |
| | 100,000 | | | | 7.875 | | | | 01/15/19 | | | | 92,000 | |
| | | | | | | | | | | | | | |
| | | | | | | | | | | | | 1,003,250 | |
| | |
| | Entertainment & Leisure(c) – 0.5% | |
| AMC Entertainment, Inc. | |
| | 500,000 | | | | 5.875 | | | | 02/15/22 | | | | 508,750 | |
| | |
| | | | | | | | | | | | | | |
| | Corporate Obligations – (continued) | |
| | Entertainment & Leisure(c) – (continued) | |
| Cedar Fair LP/Canada’s Wonderland Co./Magnum Management
Corp. |
|
| $ | 150,000 | | | | 5.250 | % | | | 03/15/21 | | | $ | 152,625 | |
| | 830,000 | | | | 5.375 | (b) | | | 06/01/24 | | | | 825,850 | |
| Cinemark USA, Inc. | |
| | 1,000,000 | | | | 4.875 | | | | 06/01/23 | | | | 950,000 | |
| Guitar Center, Inc.(b) | |
| | 115,000 | | | | 6.500 | | | | 04/15/19 | | | | 99,763 | |
| | 1,285,000 | | | | 9.625 | | | | 04/15/20 | | | | 857,737 | |
| Regal Entertainment Group | |
| | 400,000 | | | | 5.750 | | | | 03/15/22 | | | | 382,000 | |
| Six Flags Entertainment Corp.(b) | |
| | 500,000 | | | | 5.250 | | | | 01/15/21 | | | | 500,000 | |
| | | | | | | | | | | | | | |
| | | | | | | | | | | | | 4,276,725 | |
| | |
| | Environmental(c) – 0.1% | |
| Clean Harbors, Inc. | |
| | 510,000 | | | | 5.125 | | | | 06/01/21 | | | | 507,450 | |
| | |
| | Finance – 1.1% | |
| Ally Financial, Inc. | |
| | 200,000 | | | | 3.500 | | | | 01/27/19 | | | | 197,500 | |
| | 263,000 | | | | 7.500 | | | | 09/15/20 | | | | 308,368 | |
| CIT Group, Inc.(b) | |
| | 100,000 | | | | 5.500 | | | | 02/15/19 | | | | 105,500 | |
| Escrow Lehman Brother Holdings | |
| | 25,000,000 | | | | 1.000 | | | | 09/26/14 | | | | 3,687,500 | |
| | 7,000,000 | | | | 1.000 | | | | 12/30/16 | | | | 1,006,250 | |
| | 60,000 | | | | 10.750 | (f) | | | 08/15/20 | | | | — | |
| | 8,000,000 | | | | 1.000 | | | | 12/31/49 | | | | 1,150,000 | |
| Harland Clarke Holdings Corp.(b)(c) | |
| | 960,000 | | | | 9.250 | | | | 03/01/21 | | | | 916,800 | |
| Icahn Enterprises LP/Icahn Enterprises Finance Corp.(c) | |
| | 360,000 | | | | 4.875 | | | | 03/15/19 | | | | 359,100 | |
| | 300,000 | | | | 5.875 | | | | 02/01/22 | | | | 301,313 | |
| Nomura Holdings, Inc. | |
| | 500,000 | | | | 2.000 | | | | 09/13/16 | | | | 502,682 | |
| Opal Acquisition, Inc.(b)(c) | |
| | 320,000 | | | | 8.875 | | | | 12/15/21 | | | | 324,800 | |
| The NASDAQ OMX Group, Inc. | |
| | 140,000 | | | | 5.550 | | | | 01/15/20 | | | | 153,788 | |
| | 100,000 | | | | 4.250 | (c) | | | 06/01/24 | | | | 101,720 | |
| USB Realty Corp.(b)(c)(e) | |
| | 100,000 | | | | 1.378 | | | | 01/15/49 | | | | 90,000 | |
| Walter Investment Management Corp.(c) | |
| | 312,000 | | | | 7.875 | | | | 12/15/21 | | | | 282,360 | |
| | | | | | | | | | | | | | |
| | | | | | | | | | | | | 9,487,681 | |
| | |
| | Food & Beverage – 0.2% | |
| B&G Foods, Inc.(c) | |
| | 700,000 | | | | 4.625 | | | | 06/01/21 | | | | 682,500 | |
| Carlsberg Breweries A/S | |
| GBP | 200,000 | | | | 7.250 | | | | 11/28/16 | | | | 344,019 | |
| CP Foods Holdings Ltd. | |
| $ | 200,000 | | | | 0.500 | | | | 01/15/19 | | | | 201,500 | |
| | |
| | |
| 18 | | The accompanying notes are an integral part of these financial statements. |
GOLDMAN SACHS MULTI-MANAGER ALTERNATIVES FUND
| | | | | | | | | | | | | | |
Principal Amount | | | Interest
Rate | | | Maturity
Date | | | Value | |
| | | | | | | | | | | | | | |
| | Corporate Obligations – (continued) | |
| | Food & Beverage – (continued) | |
| Heineken NV | |
| GBP | 70,000 | | | | 7.250 | % | | | 03/10/15 | | | $ | 110,294 | |
| | | | | | | | | | | | | | |
| | | | | | | | | | | | | 1,338,313 | |
| | |
| | Gaming – 1.0% | |
| Ameristar Casinos, Inc.(c) | |
| $ | 300,000 | | | | 7.500 | | | | 04/15/21 | | | | 312,750 | |
| Caesars Entertainment Operating Co., Inc.(c) | |
| | 2,015,000 | | | | 9.000 | | | | 02/15/20 | | | | 1,481,025 | |
| Chester Downs & Marina LLC(b)(c) | |
| | 1,150,000 | | | | 9.250 | | | | 02/01/20 | | | | 833,750 | |
| Graton Economic Development Authority(b)(c) | |
| | 1,055,000 | | | | 9.625 | | | | 09/01/19 | | | | 1,149,950 | |
| MGM Resorts International | |
| | 1,013,000 | | | | 6.625 | | | | 12/15/21 | | | | 1,061,117 | |
| Mohegan Tribal Gaming Authority(c) | |
| | 780,000 | | | | 9.750 | | | | 09/01/21 | | | | 797,550 | |
| MTR Gaming Group, Inc.(c)(d) | |
| | 240,000 | | | | 11.500 | | | | 08/01/19 | | | | 258,000 | |
| Scientific Games International, Inc.(b)(c) | |
| | 405,000 | | | | 7.000 | | | | 01/01/22 | | | | 410,063 | |
| | 200,000 | | | | 10.000 | | | | 12/01/22 | | | | 183,500 | |
| Seminole Hard Rock Entertainment, Inc.(b)(c) | |
| | 1,000,000 | | | | 5.875 | | | | 05/15/21 | | | | 990,000 | |
| Shingle Springs Tribal Gaming Authority(b)(c) | |
| | 945,000 | | | | 9.750 | | | | 09/01/21 | | | | 1,060,762 | |
| | | | | | | | | | | | | | |
| | | | | | | | | | | | | 8,538,467 | |
| | |
| | Health Care – Medical Products(c) – 0.5% | |
| Biomet, Inc. | |
| | 1,000,000 | | | | 6.500 | | | | 08/01/20 | | | | 1,065,000 | |
| Fresenius Medical Care US Finance II, Inc.(b) | |
| | 750,000 | | | | 4.125 | | | | 10/15/20 | | | | 753,750 | |
| | 600,000 | | | | 4.750 | | | | 10/15/24 | | | | 606,000 | |
| Grifols Worldwide Operations Ltd.(b) | |
| | 500,000 | | | | 5.250 | | | | 04/01/22 | | | | 511,250 | |
| Halyard Health, Inc.(b) | |
| | 1,000,000 | | | | 6.250 | | | | 10/15/22 | | | | 1,020,000 | |
| Immucor, Inc. | |
| | 440,000 | | | | 11.125 | | | | 08/15/19 | | | | 475,200 | |
| | | | | | | | | | | | | | |
| | | | | | | | | | | | | 4,431,200 | |
| | |
| | Health Care – Pharmaceuticals – 0.3% | | | | | |
| Forest Laboratories, Inc.(b) | |
| | 160,000 | | | | 4.375 | | | | 02/01/19 | | | | 169,019 | |
| Lantheus Medical Imaging, Inc.(c) | |
| | 430,000 | | | | 9.750 | | | | 05/15/17 | | | | 412,800 | |
| Mallinckrodt International Finance SA/Mallinckrodt CB LLC(b)(c) | |
| | 425,000 | | | | 5.750 | | | | 08/01/22 | | | | 435,625 | |
| Roche Holdings, Inc.(b)(e) | |
| | 500,000 | | | | 0.597 | | | | 09/30/19 | | | | 499,272 | |
| Valeant Pharmaceuticals International, Inc.(b)(c) | |
| | 500,000 | | | | 6.750 | | | | 08/15/18 | | | | 531,250 | |
| | 53,000 | | | | 6.875 | | | | 12/01/18 | | | | 54,855 | |
| | | | | | | | | | | | | | |
| | | | | | | | | | | | | 2,102,821 | |
| | |
| | | | | | | | | | | | | | |
| | Corporate Obligations – (continued) | |
| | Health Care – Services – 0.6% | |
| Acadia Healthcare Co., Inc.(c) | |
| $ | 980,000 | | | | 5.125 | % | | | 07/01/22 | | | $ | 965,300 | |
| Amsurg Corp.(b)(c) | |
| | 104,000 | | | | 5.625 | | | | 07/15/22 | | | | 106,600 | |
| CHS/Community Health Systems, Inc.(c) | |
| | 150,000 | | | | 8.000 | | | | 11/15/19 | | | | 160,125 | |
| | 500,000 | | | | 5.125 | | | | 08/01/21 | | | | 521,250 | |
| DaVita HealthCare Partners, Inc.(c) | |
| | 500,000 | | | | 5.125 | | | | 07/15/24 | | | | 511,250 | |
| | HCA, Inc. | | | | | | | | | | | | | |
| | 115,000 | | | | 3.750 | | | | 03/15/19 | | | | 115,288 | |
| | 500,000 | | | | 6.500 | | | | 02/15/20 | | | | 559,375 | |
| Kindred Escrow Corp. II(b) | |
| | 795,000 | | | | 8.000 | | | | 01/15/20 | | | | 844,687 | |
| | 140,000 | | | | 8.750 | (c) | | | 01/15/23 | | | | 150,675 | |
| Kindred Healthcare, Inc.(b)(c) | |
| | 890,000 | | | | 6.375 | | | | 04/15/22 | | | | 847,725 | |
| Tenet Healthcare Corp. | |
| | 100,000 | | | | 4.750 | | | | 06/01/20 | | | | 101,250 | |
| | 75,000 | | | | 6.000 | | | | 10/01/20 | | | | 80,625 | |
| WellPoint, Inc. | |
| | 200,000 | | | | 2.750 | | | | 10/15/42 | | | | 344,250 | |
| | | | | | | | | | | | | | |
| | | | | | | | | | | | | 5,308,400 | |
| | |
| | Home Construction – 0.1% | |
| D.R. Horton, Inc.(c) | |
| | 100,000 | | | | 3.750 | | | | 03/01/19 | | | | 98,750 | |
| ServiceMaster Co. | |
| | 255,000 | | | | 7.450 | | | | 08/15/27 | | | | 241,613 | |
| | 100,000 | | | | 7.250 | | | | 03/01/38 | | | | 90,750 | |
| Toll Brothers Finance Corp.(c) | |
| | 150,000 | | | | 4.000 | | | | 12/31/18 | | | | 150,750 | |
| | | | | | | | | | | | | | |
| | | | | | | | | | | | | 581,863 | |
| | |
| | Hotels, Restaurants & Leisure(b)(c) – 0.0% | |
| Wok Acquisition Corp. | |
| | 160,000 | | | | 10.250 | | | | 06/30/20 | | | | 159,600 | |
| | |
| | Life Insurance – 0.1% | |
| Genworth Holdings, Inc. | |
| | 90,000 | | | | 7.200 | | | | 02/15/21 | | | | 87,685 | |
| | 200,000 | | | | 7.625 | | | | 09/24/21 | | | | 195,378 | |
| | 230,000 | | | | 6.500 | | | | 06/15/34 | | | | 191,740 | |
| | | | | | | | | | | | | | |
| | | | | | | | | | | | | 474,803 | |
| | |
| | Lodging(c) – 0.1% | |
| Eldorado Resorts LLC/Eldorado Capital Corp.(b) | |
| | 240,000 | | | | 8.625 | | | | 06/15/19 | | | | 250,800 | |
| Wyndham Worldwide Corp. | |
| | 120,000 | | | | 4.250 | | | | 03/01/22 | | | | 122,569 | |
| | | | | | | | | | | | | | |
| | | | | | | | | | | | | 373,369 | |
| | |
| | Machinery – 0.3% | |
| Amsted Industries, Inc.(b)(c) | |
| | 500,000 | | | | 5.000 | | | | 03/15/22 | | | | 491,250 | |
| | |
| | |
| The accompanying notes are an integral part of these financial statements. | | 19 |
GOLDMAN SACHS MULTI-MANAGER ALTERNATIVES FUND
Schedule of Investments (continued)
December 31, 2014
| | | | | | | | | | | | | | |
Principal Amount | | | Interest
Rate | | | Maturity
Date | | | Value | |
| | | | | | | | | | | | | | |
| | Corporate Obligations – (continued) | |
| | Machinery – (continued) | |
| Boart Longyear Management Pty Ltd.(b) | |
| $ | 300,000 | | | | 10.000 | % | | | 10/01/18 | | | $ | 312,000 | |
| | 325,000 | | | | 7.000 | (c) | | | 04/01/21 | | | | 240,500 | |
| Doosan Infracore Co. Ltd.(c)(e) | |
| | 300,000 | | | | 3.250 | | | | 10/05/42 | | | | 300,417 | |
| Dresser-Rand Group, Inc.(c) | |
| | 345,000 | | | | 6.500 | | | | 05/01/21 | | | | 370,013 | |
| Siemens Financieringsmaatschappij NV | |
| | 250,000 | | | | 1.050 | | | | 08/16/17 | | | | 272,750 | |
| Tyco Electronics Group SA(c) | |
| | 215,000 | | | | 2.375 | | | | 12/17/18 | | | | 216,344 | |
| | | | | | | | | | | | | | |
| | | | | | | | | | | | | 2,203,274 | |
| | |
| | Media – Broadcasting & Radio(c) – 0.8% | |
| iHeartCommunications, Inc.(d) | |
| | 226,000 | | | | 14.000 | | | | 02/01/21 | | | | 185,320 | |
| LIN Television Corp.(b) | |
| | 750,000 | | | | 5.875 | | | | 11/15/22 | | | | 744,375 | |
| Nexstar Broadcasting, Inc. | |
| | 580,000 | | | | 6.875 | | | | 11/15/20 | | | | 603,200 | |
| Sinclair Television Group, Inc. | |
| | 600,000 | | | | 5.375 | | | | 04/01/21 | | | | 592,500 | |
| | 750,000 | | | | 5.625 | (b) | | | 08/01/24 | | | | 725,625 | |
| Sirius XM Radio, Inc.(b) | |
| | 540,000 | | | | 4.250 | | | | 05/15/20 | | | | 531,900 | |
| | 100,000 | | | | 5.250 | | | | 08/15/22 | | | | 105,000 | |
| | 250,000 | | | | 4.625 | | | | 05/15/23 | | | | 234,375 | |
| | 1,000,000 | | | | 6.000 | | | | 07/15/24 | | | | 1,022,500 | |
| Univision Communications, Inc.(b) | |
| | 1,400,000 | | | | 8.500 | | | | 05/15/21 | | | | 1,491,000 | |
| | | | | | | | | | | | | | |
| | | | | | | | | | | | | 6,235,795 | |
| | |
| | Media – Cable – 0.7% | |
| Cablevision Systems Corp. | |
| | 250,000 | | | | 7.750 | | | | 04/15/18 | | | | 275,000 | |
| CCO Holdings LLC/CCO Holdings Capital Corp.(c) | |
| | 600,000 | | | | 5.125 | | | | 02/15/23 | | | | 585,000 | |
| Cequel Communications Holdings I LLC/Cequel Capital
Corp.(b)(c) |
|
| | 1,100,000 | | | | 6.375 | | | | 09/15/20 | | | | 1,144,000 | |
| CSC Holdings LLC | |
| | 220,000 | | | | 8.625 | | | | 02/15/19 | | | | 256,300 | |
| | 425,000 | | | | 6.750 | | | | 11/15/21 | | | | 468,562 | |
| DISH DBS Corp. | |
| | 55,000 | | | | 5.000 | | | | 03/15/23 | | | | 53,213 | |
| | 730,000 | | | | 5.875 | (b) | | | 11/15/24 | | | | 733,650 | |
| Midcontinent Communications & Midcontinent Finance Corp.(b)(c) | |
| | 200,000 | | | | 6.250 | | | | 08/01/21 | | | | 202,000 | |
| Numericable Group SA(b)(c) | |
| | 800,000 | | | | 6.000 | | | | 05/15/22 | | | | 808,000 | |
| | 200,000 | | | | 6.250 | | | | 05/15/24 | | | | 201,500 | |
| Videotron Ltd. | |
| | 500,000 | | | | 5.000 | | | | 07/15/22 | | | | 508,750 | |
| Virgin Media Secured Finance PLC(b)(c) | |
| | 500,000 | | | | 5.375 | | | | 04/15/21 | | | | 518,750 | |
| | | | | | | | | | | | | | |
| | | | | | | | | | | | | 5,754,725 | |
| | |
| | | | | | | | | | | | | | |
| | Corporate Obligations – (continued) | |
| | Media – Non Cable – 0.8% | |
| Affinion Group, Inc.(c) | |
| $ | 400,000 | | | | 7.875 | % | | | 12/15/18 | | | $ | 284,000 | |
| CBS Outdoor Americas Capital LLC/CBS Outdoor Americas
Capital Corp.(b)(c) |
|
| | 500,000 | | | | 5.250 | | | | 02/15/22 | | | | 506,875 | |
| Gannett Co., Inc.(c) | |
| | 200,000 | | | | 5.125 | | | | 10/15/19 | | | | 205,000 | |
| | 1,000,000 | | | | 4.875 | (b) | | | 09/15/21 | | | | 990,000 | |
| Lee Enterprises, Inc.(b)(c) | |
| | 300,000 | | | | 9.500 | | | | 03/15/22 | | | | 307,875 | |
| Liberty Interactive LLC | |
| | 345,000 | | | | 8.250 | | | | 02/01/30 | | | | 373,462 | |
| | 1,683,617 | | | | 3.750 | (c) | | | 02/15/30 | | | | 1,064,888 | |
| Nielsen Finance LLC/Nielsen Finance Co.(c) | |
| | 100,000 | | | | 4.500 | | | | 10/01/20 | | | | 100,375 | |
| | 980,000 | | | | 5.000 | (b) | | | 04/15/22 | | | | 982,450 | |
| Priceline.com, Inc. | |
| | 81,000 | | | | 1.000 | | | | 03/15/18 | | | | 107,629 | |
| Radio One, Inc.(b)(c) | |
| | 130,000 | | | | 9.250 | | | | 02/15/20 | | | | 114,400 | |
| Reed Elsevier Investments PLC | |
| GBP | 350,000 | | | | 5.625 | | | | 10/20/16 | | | | 586,644 | |
| VeriSign, Inc.(c) | |
| $ | 500,000 | | | | 4.625 | | | | 05/01/23 | | | | 488,750 | |
| WPP PLC | |
| GBP | 370,000 | | | | 6.000 | | | | 04/04/17 | | | | 633,632 | |
| | | | | | | | | | | | | | |
| | | | | | | | | | | | | 6,745,980 | |
| | |
| | Metals & Mining – 0.3% | |
| AK Steel Corp.(c) | |
| $ | 190,000 | | | | 7.625 | | | | 10/01/21 | | | | 174,800 | |
| FMG Resources (August 2006) Pty Ltd.(b)(c) | |
| | 100,000 | | | | 8.250 | | | | 11/01/19 | | | | 91,000 | |
| Glencore Funding LLC(e) | |
| | 750,000 | | | | 1.396 | | | | 05/27/16 | | | | 751,935 | |
| Hecla Mining Co.(c) | |
| | 615,000 | | | | 6.875 | | | | 05/01/21 | | | | 548,888 | |
| IAMGOLD Corp.(b)(c) | |
| | 995,000 | | | | 6.750 | | | | 10/01/20 | | | | 748,936 | |
| New Gold, Inc.(b)(c) | |
| | 285,000 | | | | 6.250 | | | | 11/15/22 | | | | 279,300 | |
| | | | | | | | | | | | | | |
| | | | | | | | | | | | | 2,594,859 | |
| | |
| | Packaging – 0.2% | |
| Ball Corp. | |
| | 100,000 | | | | 5.000 | | | | 03/15/22 | | | | 103,000 | |
| Iron/Steel Signode Industrial Group Lux SA/Signode Industrial
Group U.S., Inc.(b)(c) |
|
| | 955,000 | | | | 6.375 | | | | 05/01/22 | | | | 921,575 | |
| Reynolds Group Issuer, Inc.(c) | |
| | 400,000 | | | | 5.750 | | | | 10/15/20 | | | | 410,000 | |
| | | | | | | | | | | | | | |
| | | | | | | | | | | | | 1,434,575 | |
| | |
| | Paper(b)(c) – 0.0% | |
| Sappi Papier Holding GmbH | |
| | 50,000 | | | | 7.750 | | | | 07/15/17 | | | | 54,179 | |
| | |
| | |
| 20 | | The accompanying notes are an integral part of these financial statements. |
GOLDMAN SACHS MULTI-MANAGER ALTERNATIVES FUND
| | | | | | | | | | | | | | |
Principal Amount | | | Interest
Rate | | | Maturity
Date | | | Value | |
| | | | | | | | | | | | | | |
| | Corporate Obligations – (continued) | |
| | Pipelines – 1.0% | |
| Atlas Pipeline Partners LP/Atlas Pipeline Finance Corp.(c) | |
| $ | 1,500,000 | | | | 4.750 | % | | | 11/15/21 | | | $ | 1,425,000 | |
| Energy Transfer Equity LP | |
| | 430,000 | | | | 5.875 | | | | 01/15/24 | | | | 436,450 | |
| Gibson Energy, Inc.(b)(c) | |
| | 84,000 | | | | 6.750 | | | | 07/15/21 | | | | 84,454 | |
| Kinder Morgan Energy Partners LP(c) | |
| | 210,000 | | | | 3.500 | | | | 09/01/23 | | | | 199,495 | |
| Kinder Morgan, Inc.(b)(c) | |
| | 300,000 | | | | 5.000 | | | | 02/15/21 | | | | 312,244 | |
| Regency Energy Partners LP(c) | |
| | 500,000 | | | | 5.875 | | | | 03/01/22 | | | | 491,250 | |
| Rockies Express Pipeline LLC(b) | |
| | 245,000 | | | | 6.000 | | | | 01/15/19 | | | | 245,000 | |
| | 745,000 | | | | 5.625 | | | | 04/15/20 | | | | 730,100 | |
| Rose Rock Midstream LP/Rose Rock Finance Corp.(c) | |
| | 173,000 | | | | 5.625 | | | | 07/15/22 | | | | 158,295 | |
| Sabine Pass Liquefaction LLC | |
| | 1,400,000 | | | | 5.625 | (c) | | | 02/01/21 | | | | 1,375,500 | |
| | 1,620,000 | | | | 5.625 | | | | 04/15/23 | | | | 1,595,700 | |
| SemGroup Corp.(c) | |
| | 95,000 | | | | 7.500 | | | | 06/15/21 | | | | 95,000 | |
| Summit Midstream Holdings LLC/Summit Midstream Finance
Corp.(c) |
|
| | 800,000 | | | | 5.500 | | | | 08/15/22 | | | | 736,000 | |
| Tesoro Logistics LP/Tesoro Logistics Finance Corp.(b)(c) | |
| | 45,000 | | | | 5.500 | | | | 10/15/19 | | | | 44,775 | |
| | 55,000 | | | | 6.250 | | | | 10/15/22 | | | | 55,825 | |
| | | | | | | | | | | | | | |
| | | | | | | | | | | | | 7,985,088 | |
| | |
| | Property Insurance(b)(c) – 0.2% | |
| A-S Co.-Issuer Subsidiary, Inc./A-S Merger Sub LLC | |
| | 639,000 | | | | 7.875 | | | | 12/15/20 | | | | 651,780 | |
| Hockey Merger Sub 2, Inc. | |
| | 800,000 | | | | 7.875 | | | | 10/01/21 | | | | 796,000 | |
| Hub Holdings LLC/Hub Holdings Finance, Inc.(d) | |
| | 120,000 | | | | 8.125 | | | | 07/15/19 | | | | 117,600 | |
| | | | | | | | | | | | | | |
| | | | | | | | | | | | | 1,565,380 | |
| | |
| | Real Estate – 0.5% | |
| ARC Properties Operating Partnership LP(c) | |
| | 210,000 | | | | 3.000 | | | | 02/06/19 | | | | 190,575 | |
| Carrington Holding Co., LLC(c)(d) | |
| | 530,273 | | | | 1.000 | | | | 01/15/26 | | | | 192,171 | |
| Country Garden Holdings Co., Ltd.(c) | |
| | 200,000 | | | | 11.125 | | | | 02/23/18 | | | | 212,500 | |
| Digital Realty Trust LP | |
| | 140,000 | | | | 5.875 | | | | 02/01/20 | | | | 156,351 | |
| | 120,000 | | | | 3.625 | (c) | | | 10/01/22 | | | | 118,407 | |
| EPR Properties(c) | |
| | 220,000 | | | | 5.750 | | | | 08/15/22 | | | | 239,404 | |
| Great Portland Estates Capital Jersey Ltd. | |
| GBP | 100,000 | | | | 1.000 | | | | 09/10/18 | | | | 172,771 | |
| Host Hotels & Resorts LP(c) | |
| | 110,000 | | | | 5.250 | | | | 03/15/22 | | | | 120,045 | |
| | 100,000 | | | | 3.750 | | | | 10/15/23 | | | | 99,671 | |
| | |
| | | | | | | | | | | | | | |
| | Corporate Obligations – (continued) | |
| | Real Estate – (continued) | |
| IMMOFINANZ AG | |
| EUR | 540,400 | | | | 4.250 | % | | | 03/08/18 | | | $ | 26,496 | |
| Intu Properties PLC | |
| GBP | 100,000 | | | | 2.500 | | | | 10/04/18 | | | | 169,186 | |
| Kennedy-Wilson, Inc.(c) | |
| $ | 605,000 | | | | 5.875 | | | | 04/01/24 | | | | 606,512 | |
| Keystone Financing PLC(b)(c) | |
| GBP | 345,000 | | | | 9.500 | | | | 10/15/19 | | | | 521,855 | |
| RHP Hotel Properties LP/RHP Finance Corp.(c) | |
| $ | 600,000 | | | | 1.000 | | | | 04/15/21 | | | | 597,000 | |
| Swiss Prime Site AG | |
| CHF | 225,000 | | | | 1.875 | | | | 01/20/15 | | | | 226,652 | |
| | Tesco PLC | | | | | | | | | | | | | |
| | 70,000 | | | | 6.000 | | | | 12/14/29 | | | | 118,572 | |
| | 50,000 | | | | 5.200 | | | | 03/05/57 | | | | 71,828 | |
| | | | | | | | | | | | | | |
| | | | | | | | | | | | | 3,839,996 | |
| | |
| | Retailers – 1.0% | |
| Albertsons Holdings LLC/Saturn Acquisition Merger Sub,
Inc.(b)(c) |
|
| $ | 560,000 | | | | 7.750 | | | | 10/15/22 | | | | 572,600 | |
| AutoNation, Inc. | |
| | 160,000 | | | | 6.750 | | | | 04/15/18 | | | | 179,000 | |
| | 100,000 | | | | 5.500 | | | | 02/01/20 | | | | 108,250 | |
| Bed Bath & Beyond, Inc.(c) | |
| | 190,000 | | | | 3.749 | | | | 08/01/24 | | | | 191,869 | |
| Best Buy Co., Inc. | |
| | 100,000 | | | | 5.000 | | | | 08/01/18 | | | | 104,000 | |
| Ferrellgas LP/Ferrellgas Finance Corp.(c) | |
| | 200,000 | | | | 6.500 | | | | 05/01/21 | | | | 196,000 | |
| | 865,000 | | | | 6.750 | | | | 01/15/22 | | | | 852,025 | |
| FF Group Finance Luxembourg | |
| EUR | 100,000 | | | | 1.750 | | | | 07/03/19 | | | | 109,207 | |
�� | JC Penney Corp., Inc. | |
| $ | 955,000 | | | | 5.650 | | | | 06/01/20 | | | | 744,900 | |
| | L Brands, Inc. | | | | | | | | | | | | | |
| | 100,000 | | | | 5.625 | | | | 02/15/22 | | | | 108,000 | |
| New Albertsons, Inc. | |
| | 105,000 | | | | 7.750 | | | | 06/15/26 | | | | 94,763 | |
| | 215,000 | | | | 7.450 | | | | 08/01/29 | | | | 191,888 | |
| | 465,000 | | | | 8.700 | | | | 05/01/30 | | | | 447,562 | |
| | 1,355,000 | | | | 8.000 | | | | 05/01/31 | | | | 1,236,437 | |
| Next PLC | |
| GBP | 200,000 | | | | 5.875 | | | | 10/12/16 | | | | 336,308 | |
| Rent-A-Center, Inc.(c) | |
| $ | 150,000 | | | | 4.750 | | | | 05/01/21 | | | | 129,375 | |
| Roundy’s Supermarkets, Inc.(b)(c) | |
| | 55,000 | | | | 10.250 | | | | 12/15/20 | | | | 47,850 | |
| Sears Holdings Corp. | |
| | 421,000 | | | | 6.625 | | | | 10/15/18 | | | | 385,215 | |
| Supervalu, Inc.(c) | |
| | 555,000 | | | | 6.750 | | | | 06/01/21 | | | | 543,900 | |
| The Bon-Ton Department Stores, Inc.(c) | |
| | 285,000 | | | | 8.000 | | | | 06/15/21 | | | | 236,550 | |
| The Pantry, Inc.(c) | |
| | 215,000 | | | | 8.375 | | | | 08/01/20 | | | | 235,425 | |
| | |
| | |
| The accompanying notes are an integral part of these financial statements. | | 21 |
GOLDMAN SACHS MULTI-MANAGER ALTERNATIVES FUND
Schedule of Investments (continued)
December 31, 2014
| | | | | | | | | | | | | | |
Principal Amount | | | Interest
Rate | | | Maturity
Date | | | Value | |
| | | | | | | | | | | | | | |
| | Corporate Obligations – (continued) | |
| | Retailers – (continued) | |
| Toys R US, Inc. | |
| $ | 1,425,000 | | | | 10.375 | %(c) | | | 08/15/17 | | | $ | 1,147,125 | |
| | 475,000 | | | | 7.375 | | | | 10/15/18 | | | | 326,563 | |
| | | | | | | | | | | | | | |
| | | | | | | | | | | | | 8,524,812 | |
| | |
| | Technology – Hardware – 0.5% | |
| Advanced Micro Devices, Inc. | |
| | 200,000 | | | | 7.750 | (c) | | | 08/01/20 | | | | 185,000 | |
| | 185,000 | | | | 7.500 | | | | 08/15/22 | | | | 166,500 | |
| | 425,000 | | | | 7.000 | (c) | | | 07/01/24 | | | | 363,375 | |
| Amkor Technology, Inc.(c) | |
| | 190,000 | | | | 6.375 | | | | 10/01/22 | | | | 183,825 | |
| CommScope, Inc.(b)(c) | |
| | 1,085,000 | | | | 5.000 | | | | 06/15/21 | | | | 1,074,150 | |
| | 200,000 | | | | 5.500 | | | | 06/15/24 | | | | 197,000 | |
| Flextronics International Ltd. | |
| | 500,000 | | | | 5.000 | | | | 02/15/23 | | | | 505,255 | |
| IAC/InterActiveCorp(c) | |
| | 220,000 | | | | 4.875 | | | | 11/30/18 | | | | 224,950 | |
| Intel Corp. | |
| | 97,000 | | | | 3.250 | | | | 08/01/39 | | | | 168,659 | |
| NXP BV/NXP Funding LLC(b)(c) | |
| | 500,000 | | | | 5.750 | | | | 02/15/21 | | | | 525,000 | |
| | SanDisk Corp. | | | | | | | | | | | | | |
| | 124,000 | | | | 0.500 | | | | 10/15/20 | | | | 148,955 | |
| Seagate HDD Cayman(b) | |
| | 125,000 | | | | 3.750 | | | | 11/15/18 | | | | 128,437 | |
| Zebra Technologies Corp.(b)(c) | |
| | 565,000 | | | | 7.250 | | | | 10/15/22 | | | | 597,487 | |
| | | | | | | | | | | | | | |
| | | | | | | | | | | | | 4,468,593 | |
| | |
| | Technology – Software/Services – 0.6% | |
| Audatex North America, Inc.(b)(c) | |
| | 1,080,000 | | | | 6.125 | | | | 11/01/23 | | | | 1,117,800 | |
| BMC Software Finance, Inc.(b)(c) | |
| | 1,490,000 | | | | 8.125 | | | | 07/15/21 | | | | 1,400,600 | |
| Electronic Arts, Inc. | |
| | 75,000 | | | | 0.750 | | | | 07/15/16 | | | | 112,969 | |
| Equinix, Inc.(c) | |
| | 50,000 | | | | 4.875 | | | | 04/01/20 | | | | 49,750 | |
| | 1,000,000 | | | | 5.750 | | | | 01/01/25 | | | | 1,010,000 | |
| Global A&T Electronics Ltd.(b)(c) | |
| | 300,000 | | | | 10.000 | | | | 02/01/19 | | | | 268,500 | |
| Syniverse Holdings, Inc.(c) | |
| | 500,000 | | | | 9.125 | | | | 01/15/19 | | | | 522,500 | |
| Tech Data Corp. | |
| | 100,000 | | | | 3.750 | | | | 09/21/17 | | | | 103,343 | |
| Workday, Inc. | |
| | 36,000 | | | | 0.750 | | | | 07/15/18 | | | | 42,682 | |
| | | | | | | | | | | | | | |
| | | | | | | | | | | | | 4,628,144 | |
| | |
| | Telecommunications – Cellular(c) – 0.1% | |
| Sable International Finance Ltd.(b) | |
| | 100,000 | | | | 8.750 | | | | 02/01/20 | | | | 108,500 | |
| | |
| | | | | | | | | | | | | | |
| | Corporate Obligations – (continued) | |
| | Telecommunications – Cellular(c) – (continued) | |
| T-Mobile USA, Inc. | |
| $ | 1,000,000 | | | | 6.000 | % | | | 03/01/23 | | | $ | 1,007,500 | |
| | | | | | | | | | | | | | |
| | | | | | | | | | | | | 1,116,000 | |
| | |
| | Telecommunications – Satellites(c) – 0.1% | |
| CCOH Safari LLC | |
| | 610,000 | | | | 5.750 | | | | 12/01/24 | | | | 616,862 | |
| Intelsat Luxembourg SA | |
| | 275,000 | | | | 7.750 | | | | 06/01/21 | | | | 275,688 | |
| | | | | | | | | | | | | | |
| | | | | | | | | | | | | 892,550 | |
| | |
| | Textile & Apparel – 0.1% | |
| Levi Strauss & Co.(c) | |
| | 100,000 | | | | 7.625 | | | | 05/15/20 | | | | 105,000 | |
| Nine West Holdings, Inc.(b) | |
| | 360,000 | | | | 8.250 | | | | 03/15/19 | | | | 300,600 | |
| The William Carter Co.(c) | |
| | 185,000 | | | | 5.250 | | | | 08/15/21 | | | | 190,550 | |
| | | | | | | | | | | | | | |
| | | | | | | | | | | | | 596,150 | |
| | |
| | Transportation – 0.2% | |
| Bluewater Holding BV(b)(c) | |
| | 200,000 | | | | 10.000 | | | | 12/10/19 | | | | 190,750 | |
| Geo Debt Finance SCA(c) | |
| EUR | 100,000 | | | | 7.500 | | | | 08/01/18 | | | | 99,224 | |
| Kansas City Southern de Mexico SA de CV(c) | |
| $ | 240,000 | | | | 2.350 | | | | 05/15/20 | | | | 230,402 | |
| Syncreon Group BV/Syncreon Global Finance US, Inc.(b)(c) | |
| | 200,000 | | | | 8.625 | | | | 11/01/21 | | | | 188,000 | |
| Transnet SOC Ltd. | |
| | 200,000 | | | | 4.500 | | | | 02/10/16 | | | | 205,000 | |
| Watco Cos LLC/Watco Finance Corp.(b)(c) | |
| | 600,000 | | | | 6.375 | | | | 04/01/23 | | | | 599,250 | |
| | | | | | | | | | | | | | |
| | | | | | | | | | | | | 1,512,626 | |
| | |
| | Utilities – Distribution – 0.1% | |
| AmeriGas Finance LLC/AmeriGas Finance Corp.(c) | |
| | 300,000 | | | | 6.750 | | | | 05/20/20 | | | | 309,000 | |
| Sabine Pass LNG LP | |
| | 100,000 | | | | 7.500 | | | | 11/30/16 | | | | 104,500 | |
| Suburban Propane Partners LP/Suburban Energy Finance Corp.(c) | |
| | 105,000 | | | | 7.375 | | | | 03/15/20 | | | | 108,938 | |
| | | | | | | | | | | | | | |
| | | | | | | | | | | | | 522,438 | |
| | |
| | Utilities – Electric – 0.4% | |
| Dynegy Finance I, Inc./Dynegy Finance II, Inc.(b)(c) | |
| | 300,000 | | | | 7.375 | | | | 11/01/22 | | | | 305,250 | |
| | 275,000 | | | | 7.625 | | | | 11/01/24 | | | | 280,500 | |
| Electricite de France(b) | |
| | 500,000 | | | | 1.150 | | | | 01/20/17 | | | | 499,689 | |
| Eskom Holdings SOC Ltd. | |
| | 221,000 | | | | 5.750 | | | | 01/26/21 | | | | 221,552 | |
| GenOn Americas Generation LLC | |
| | 190,000 | | | | 8.500 | | | | 10/01/21 | | | | 162,450 | |
| | 405,000 | | | | 9.125 | | | | 05/01/31 | | | | 346,275 | |
| Illinois Power Generating Co. | |
| | 750,000 | | | | 6.300 | | | | 04/01/20 | | | | 626,250 | |
| | |
| | |
| 22 | | The accompanying notes are an integral part of these financial statements. |
GOLDMAN SACHS MULTI-MANAGER ALTERNATIVES FUND
| | | | | | | | | | | | | | |
Principal Amount | | | Interest
Rate | | | Maturity
Date | | | Value | |
| | | | | | | | | | | | | | |
| | Corporate Obligations – (continued) | |
| | Utilities – Electric – (continued) | |
| Meiya Power Co., Ltd. | |
| $ | 200,000 | | | | 4.000 | % | | | 08/19/18 | | | $ | 206,143 | |
| NGG Finance PLC(c)(e) | |
| EUR | 300,000 | | | | 4.250 | | | | 06/18/76 | | | | 393,320 | |
| RJS Power Holdings LLC(b)(c) | |
| $ | 450,000 | | | | 5.125 | | | | 07/15/19 | | | | 444,375 | |
| | | | | | | | | | | | | | |
| | | | | | | | | | | | | 3,485,804 | |
| | |
| | Wireless Telecommunications – 0.9% | |
| Altice Financing SA(b)(c) | |
| | 700,000 | | | | 6.500 | | | | 01/15/22 | | | | 680,750 | |
| Altice SA(b)(c) | |
| | 500,000 | | | | 7.750 | | | | 05/15/22 | | | | 500,000 | |
| Digicel Group Ltd.(b)(c) | |
| | 200,000 | | | | 8.250 | | | | 09/30/20 | | | | 194,000 | |
| DigitalGlobe, Inc.(b)(c) | |
| | 800,000 | | | | 5.250 | | | | 02/01/21 | | | | 762,000 | |
| Hughes Satellite Systems Corp. | |
| | 500,000 | | | | 7.625 | | | | 06/15/21 | | | | 551,250 | |
| Inmarsat Finance PLC(b)(c) | |
| | 600,000 | | | | 4.875 | | | | 05/15/22 | | | | 592,500 | |
| Sprint Capital Corp. | |
| | 600,000 | | | | 6.900 | | | | 05/01/19 | | | | 612,000 | |
| | 325,000 | | | | 6.875 | | | | 11/15/28 | | | | 286,000 | |
| | 205,000 | | | | 8.750 | | | | 03/15/32 | | | | 200,900 | |
| Sprint Communications, Inc. | |
| | 120,000 | | | | 7.000 | | | | 08/15/20 | | | | 119,400 | |
| Sprint Corp. | |
| | 1,470,000 | | | | 7.875 | | | | 09/15/23 | | | | 1,451,625 | |
| | 605,000 | | | | 7.125 | | | | 06/15/24 | | | | 564,163 | |
| Wind Acquisition Finance SA(b)(c) | |
| | 930,000 | | | | 4.750 | | | | 07/15/20 | | | | 882,337 | |
| | 135,000 | | | | 7.375 | | | | 04/23/21 | | | | 126,647 | |
| | | | | | | | | | | | | | |
| | | | | | | | | | | | | 7,523,572 | |
| | |
| | Wirelines Telecommunications – 0.3% | |
| Anixter, Inc. | |
| | 1,142,000 | | | | 5.125 | | | | 10/01/21 | | | | 1,147,710 | |
| British Telecommunications PLC | |
| | 250,000 | | | | 1.250 | | | | 02/14/17 | | | | 248,445 | |
| CenturyLink, Inc. | |
| | 100,000 | | | | 5.625 | | | | 04/01/20 | | | | 104,000 | |
| Cincinnati Bell, Inc.(c) | |
| | 1,024,000 | | | | 8.750 | | | | 03/15/18 | | | | 1,052,160 | |
| Verizon Communications, Inc. | |
| | 102,000 | | | | 5.150 | | | | 09/15/23 | | | | 112,726 | |
| | | | | | | | | | | | | | |
| | | | | | | | | | | | | 2,665,041 | |
| | |
| | TOTAL CORPORATE OBLIGATIONS | | | | | |
| | (Cost $165,253,258) | | | | | | | $ | 158,460,656 | |
| | |
| | | | | | | | | | | | | | |
| | Agency Debenture(h) – 0.0% | |
| | FNMA | | | | | | | | | | | | | |
| $ | 100,000 | | | | 3.150 | % | | | 12/27/27 | | | $ | 98,423 | |
| | (Cost $90,946) | | | | | | | | | | | | | |
| | |
| | | | | | | | | | | | | | |
| | Foreign Debt Obligations – 0.8% | |
| | Sovereign – 0.8% | |
| Brazil Letras do Tesouro Nacional(g) | |
| BRL | 2,894,000 | | | | 0.000 | % | | | 07/01/18 | | | $ | 714,606 | |
| Brazil Notas do Tesouro Nacional | |
| | 2,000,000 | | | | 10.000 | | | | 01/01/17 | | | | 716,298 | |
| | 2,505,282 | | | | 6.000 | | | | 08/15/22 | | | | 937,077 | |
| Hungary Government Bond | |
| $ | 50,000 | | | | 4.125 | | | | 02/19/18 | | | | 51,625 | |
| Ireland Government Bond | |
| EUR | 147,000 | | | | 2.400 | | | | 05/15/30 | | | | 191,384 | |
| Perusahaan Penerbit SBSN | |
| $ | 200,000 | | | | 6.125 | | | | 03/15/19 | | | | 221,250 | |
| Ras Al Khaimah United Arab Emirates | |
| | 200,000 | | | | 3.297 | | | | 10/21/18 | | | | 206,644 | |
| Republic of Bulgaria | |
| EUR | 253,000 | | | | 2.950 | | | | 09/03/24 | | | | 306,908 | |
| Republic of Chile | |
CLP
|
49,254,200 |
| | | 3.000 | | | | 07/01/17 | | | | 83,959 | |
| Republic of Ireland | |
| | 250,000 | | | | 3.400 | | | | 03/18/24 | | | | 358,429 | |
| | 290,000 | | | | 5.400 | | | | 03/13/25 | | | | 483,513 | |
| Republic of Italy | |
| | 150,000 | | | | 4.500 | | | | 07/15/15 | | | | 185,364 | |
| | 420,000 | | | | 4.750 | | | | 05/01/17 | | | | 556,873 | |
| | 252,963 | | | | 1.700 | | | | 09/15/18 | | | | 317,637 | |
| Republic of Namibia | |
| $ | 200,000 | | | | 5.500 | | | | 11/03/21 | | | | 210,000 | |
| Republic of South Africa | |
| ZAR | 8,000,000 | | | | 8.000 | | | | 12/21/18 | | | | 710,564 | |
| United Kingdom Treasury | |
| GBP | 163,000 | | | | 3.250 | | | | 01/22/44 | | | | 293,091 | |
| United Mexican States | |
| EUR | 140,000 | | | | 2.375 | | | | 04/09/21 | | | | 176,022 | |
| | |
| | TOTAL FOREIGN DEBT OBLIGATIONS | |
| | (Cost $7,211,907) | | | | | | | $ | 6,721,244 | |
| | |
| | | | | | | | | | | | | | |
| | Municipal Debt Obligations – 0.4% | |
| | California – 0.1% | |
| Golden State Tobacco Securitization Corp. RB Series 2007 A2 | |
| $ | 455,000 | | | | 5.300 | % | | | 06/01/37 | | | $ | 370,766 | |
| | |
| | New Jersey – 0.1% | |
| Tobacco Settlement Financing Corp. RB Series 1A | |
| | 220,000 | | | | 4.750 | | | | 06/01/34 | | | | 164,287 | |
| | 635,000 | | | | 5.000 | | | | 06/01/41 | | | | 477,514 | |
| | | | | | | | | | | | | | |
| | | | | | | | | | | | | 641,801 | |
| | |
| | Puerto Rico – 0.1% | |
| Puerto Rico Commonwealth GO Bonds Refunding for Public
Improvement Series 2012 A |
|
| | 25,000 | | | | 5.000 | | | | 07/01/41 | | | | 17,084 | |
| Puerto Rico Commonwealth GO Bonds Series 2014 A | |
| | 970,000 | | | | 8.000 | | | | 07/01/35 | | | | 845,180 | |
| | | | | | | | | | | | | | |
| | | | | | | | | | | | | 862,264 | |
| | |
| | |
| The accompanying notes are an integral part of these financial statements. | | 23 |
GOLDMAN SACHS MULTI-MANAGER ALTERNATIVES FUND
Schedule of Investments (continued)
December 31, 2014
| | | | | | | | | | | | | | |
Principal Amount | | | Interest
Rate | | | Maturity
Date | | | Value | |
| | | | | | | | | | | | | | |
| | Municipal Debt Obligations – (continued) | |
| | Texas – 0.1% | |
| Texas State Public Finance Authority RB (Taxable Windstrom
Insurance) Series 2014 |
|
| $ | 1,185,000 | | | | 8.250 | % | | | 07/01/24 | | | $ | 1,187,595 | |
| | |
| | TOTAL MUNICIPAL DEBT OBLIGATIONS | |
| | (Cost $3,088,001) | | | | | | | $ | 3,062,426 | |
| | |
| | | | | | | | | | | | | | |
| | U.S. Treasury Obligations – 9.0% | |
| United States Treasury Bonds | |
| $ | 1,000,000 | | | | 6.750 | % | | | 08/15/26 | | | $ | 1,459,840 | |
| | 2,000,000 | | | | 5.500 | | | | 08/15/28 | | | | 2,732,740 | |
| United States Treasury Inflation Protected Securities | |
| | 248,712 | | | | 1.625 | | | | 01/15/15 | | | | 248,284 | |
| | 596,442 | | | | 0.625 | | | | 02/15/43 | | | | 563,172 | |
| United States Treasury Notes | |
| | 5,000,000 | | | | 0.250 | (a) | | | 01/15/15 | | | | 4,999,750 | |
| | 5,000,000 | | | | 2.250 | (a) | | | 01/31/15 | | | | 5,008,350 | |
| | 5,000,000 | | | | 0.250 | (a) | | | 02/15/15 | | | | 5,000,850 | |
| | 7,000,000 | | | | 2.375 | (a)(i) | | | 02/28/15 | | | | 7,024,991 | |
| | 5,000,000 | | | | 0.375 | (a) | | | 03/15/15 | | | | 5,003,100 | |
| | 5,000,000 | | | | 0.250 | (a) | | | 03/31/15 | | | | 5,001,900 | |
| | 5,000,000 | | | | 0.375 | (a) | | | 04/15/15 | | | | 5,004,499 | |
| | 5,000,000 | | | | 2.500 | (a) | | | 04/30/15 | | | | 5,039,300 | |
| | 5,000,000 | | | | 0.250 | (a) | | | 05/15/15 | | | | 5,003,301 | |
| | 5,000,000 | | | | 2.125 | (a) | | | 05/31/15 | | | | 5,041,000 | |
| | 200,000 | | | | 2.000 | | | | 04/30/16 | | | | 204,138 | |
| | 350,000 | | | | 4.250 | | | | 11/15/17 | | | | 381,500 | |
| | 2,000,000 | | | | 2.375 | | | | 06/30/18 | | | | 2,072,660 | |
| | 250,000 | | | | 1.250 | | | | 10/31/18 | | | | 248,388 | |
| | 1,500,000 | | | | 1.500 | | | | 02/28/19 | | | | 1,500,825 | |
| | 2,500,000 | | | | 1.875 | | | | 06/30/20 | | | | 2,516,700 | |
| | 750,000 | | | | 3.625 | | | | 02/15/21 | | | | 825,908 | |
| | 3,000,000 | | | | 2.000 | | | | 11/15/21 | | | | 3,009,960 | |
| | 1,500,000 | | | | 1.750 | | | | 05/15/22 | | | | 1,474,215 | |
| | 1,500,000 | | | | 1.625 | | | | 08/15/22 | | | | 1,457,820 | |
| | 1,830,000 | | | | 1.750 | | | | 05/15/23 | | | | 1,780,462 | |
| | 1,500,000 | | | | 2.500 | | | | 08/15/23 | | | | 1,547,175 | |
| | |
| | TOTAL U.S. TREASURY OBLIGATIONS | |
| | (Cost $73,382,809) | | | | | | | $ | 74,150,828 | |
| | |
| | | | | | | | | | | | | | |
| | Senior Term Loans(j) – 6.5% | |
| | Aerospace & Defense – 0.0% | |
| TASC, Inc. | |
| $ | 400,000 | | | | 6.500 | % | | | 05/23/20 | | | $ | 389,400 | |
| | |
| | Automotive – Parts – 0.1% | |
| Allison Transmission, Inc. | |
| | 30,592 | | | | 3.750 | | | | 08/23/19 | | | | 30,199 | |
| Evergreen Skills Lux S.a.r.l. | |
| | 383,994 | | | | 9.250 | | | | 04/28/22 | | | | 360,313 | |
| INA Beteiligungsgesellschaft mbH | |
| | 300,000 | | | | 4.250 | | | | 05/15/20 | | | | 299,550 | |
| | | | | | | | | | | | | | |
| | | | | | | | | | | | | 690,062 | |
| | |
| | | | | | | | | | | | | | |
| | Senior Term Loans(j) – (continued) | |
| | Building Materials – 0.3% | |
| Jeld-Wen, Inc. | |
| $ | 964,432 | | | | 5.250 | % | | | 10/15/21 | | | $ | 953,582 | |
| Preferred Proppants LLC | |
| | 693,263 | | | | 6.750 | | | | 07/27/20 | | | | 617,004 | |
| Wilsonart LLC | |
| | 794,186 | | | | 4.000 | | | | 10/31/19 | | | | 769,368 | |
| | | | | | | | | | | | | | |
| | | | | | | | | | | | | 2,339,954 | |
| | |
| | Chemicals – 0.2% | |
| Albaugh LLC | |
| | 292,500 | | | | 6.000 | | | | 05/30/21 | | | | 285,188 | |
| Gemini HDPE LLC | |
| | 124,613 | | | | 4.750 | | | | 08/07/21 | | | | 119,628 | |
| OCI Beaumont LLC | |
| | 375,698 | | | | 5.000 | | | | 08/20/19 | | | | 371,002 | |
| Styrolution US Holding LLC | |
| | 715,000 | | | | 6.500 | | | | 11/07/19 | | | | 691,762 | |
| | | | | | | | | | | | | | |
| | | | | | | | | | | | | 1,467,580 | |
| | |
| | Consumer Products – Household & Leisure – 0.3% | |
| Merlin Entertainments North American LLC | |
| | 71,168 | | | | 3.250 | | | | 07/03/19 | | | | 70,968 | |
| Serta Simmons Holdings LLC | |
| | 767,527 | | | | 4.250 | | | | 10/01/19 | | | | 754,096 | |
| SGMS Escrow Corp. | |
| | 545,000 | | | | 6.000 | | | | 10/01/21 | | | | 536,373 | |
| Visant Corp. | |
| | 738,150 | | | | 7.000 | | | | 09/23/21 | | | | 716,005 | |
| | | | | | | | | | | | | | |
| | | | | | | | | | | | | 2,077,442 | |
| | |
| | Consumer Products – Industrial – 0.0% | |
| Harbor Freight Tools USA, Inc. | |
| | 148,125 | | | | 4.750 | | | | 07/26/19 | | | | 147,532 | |
| Minimax GmbH & Co. | |
| | 197,015 | | | | 4.250 | | | | 08/14/20 | | | | 194,060 | |
| | | | | | | | | | | | | | |
| | | | | | | | | | | | | 341,592 | |
| | |
| | Diversified Manufacturing – 0.1% | |
| Manitowoc Co., Inc. | |
| | 168,500 | | | | 3.250 | | | | 01/03/21 | | | | 166,254 | |
| Rexnord LLC | |
| | 1,007,649 | | | | 4.000 | | | | 08/21/20 | | | | 985,481 | |
| | | | | | | | | | | | | | |
| | | | | | | | | | | | | 1,151,735 | |
| | |
| | Energy – 0.2% | |
| Adria Topco B.V. | |
| EUR | 100,000 | | | | 9.000 | | | | 06/19/19 | | | | 120,500 | |
| Atlas Energy LP | |
| $ | 29,625 | | | | 6.500 | | | | 07/31/19 | | | | 28,736 | |
| Bennu Oil & Gas LLC | |
| | 254,655 | | | | 8.750 | | | | 11/01/18 | | | | 189,399 | |
| Chief Exploration & Development LLC | |
| | 150,000 | | | | 7.500 | | | | 05/12/21 | | | | 134,000 | |
| Crestwood Holdings LLC | |
| | 534,702 | | | | 7.000 | | | | 06/19/19 | | | | 502,957 | |
| Drillships Ocean Ventures Inc. | |
| | 119,700 | | | | 5.500 | | | | 07/25/21 | | | | 95,760 | |
| | |
| | |
| 24 | | The accompanying notes are an integral part of these financial statements. |
GOLDMAN SACHS MULTI-MANAGER ALTERNATIVES FUND
| | | | | | | | | | | | | | |
Principal Amount | | | Interest
Rate | | | Maturity
Date | | | Value | |
| | | | | | | | | | | | | | |
| | Senior Term Loans(j) – (continued) | |
| | Energy – (continued) | |
| EFS Cogen Holdings I LLC | |
| $ | 252,360 | | | | 3.750 | % | | | 12/17/20 | | | $ | 248,419 | |
| Seadrill Partners Finco LLC | |
| | 328,631 | | | | 4.000 | | | | 02/21/21 | | | | 254,196 | |
| Stallion Oilfield Services Ltd. | |
| | 130,172 | | | | 8.000 | | | | 06/19/18 | | | | 109,995 | |
| Templar Energy LLC | |
| | 300,000 | | | | 8.500 | | | | 11/25/20 | | | | 214,800 | |
| | | | | | | | | | | | | | |
| | | | | | | | | | | | | 1,898,762 | |
| | |
| | Energy – Exploration & Production – 0.1% | |
| Energy & Exploration Partners, Inc. | |
| | 982,233 | | | | 7.750 | | | | 01/15/19 | | | | 697,385 | |
| | |
| | Finance – 0.3% | |
| CeramTec Acquisition Corp. | |
| | 894,466 | | | | 4.250 | | | | 08/30/20 | | | | 881,048 | |
| Opal Acquisition, Inc. | |
| | 647,115 | | | | 5.000 | | | | 11/27/20 | | | | 639,026 | |
| Sears Holding Corp. | |
| | 726,927 | | | | 5.500 | | | | 06/30/18 | | | | 697,850 | |
| | | | | | | | | | | | | | |
| | | | | | | | | | | | | 2,217,924 | |
| | |
| | Finance Insurance – 0.1% | |
| Hub International Ltd. | |
| | 647,372 | | | | 4.250 | | | | 10/02/20 | | | | 625,523 | |
| | |
| | Food & Beverages – 0.0% | |
| Pinnacle Foods Finance LLC | |
| | 98,189 | | | | 3.000 | | | | 04/29/20 | | | | 94,998 | |
| Roundys Supermarkets, Inc. | |
| | 145,011 | | | | 5.750 | | | | 03/03/21 | | | | 135,705 | |
| | | | | | | | | | | | | | |
| | | | | | | | | | | | | 230,703 | |
| | |
| | Gaming – 0.3% | |
| 1011778 B.C. Unlimited | |
| | 950,000 | | | | 4.500 | | | | 10/27/21 | | | | 945,924 | |
| AMF Bowling Centers, Inc. | |
| | 548,625 | | | | 7.250 | | | | 09/18/21 | | | | 537,653 | |
| Boyd Gaming Corp. | |
| | 186,833 | | | | 4.000 | | | | 08/14/20 | | | | 182,951 | |
| Mashantucket (Western) Pequot Tribe | |
| | 942,966 | | | | 9.375 | | | | 06/30/20 | | | | 790,715 | |
| Mohegan Tribal Gaming Authority | |
| | 269,776 | | | | 5.500 | | | | 11/19/19 | | | | 258,745 | |
| Shingle Springs Tribal Gaming Authority | |
| | 86,625 | | | | 6.250 | | | | 08/29/19 | | | | 86,625 | |
| | | | | | | | | | | | | | |
| | | | | | | | | | | | | 2,802,613 | |
| | |
| | Health Care – Medical Products – 0.1% | |
| Carestream Health, Inc. | |
| | 475,000 | | | | 9.500 | | | | 12/07/19 | | | | 470,844 | |
| | |
| | Health Care – Services – 0.6% | |
| Air Medical Group Holdings, Inc. | |
| | 250,000 | | | | 7.625 | | | | 05/31/18 | | | | 246,250 | |
| American Renal Holdings, Inc. | |
| | 977,630 | | | | 4.500 | | | | 09/22/19 | | | | 965,410 | |
| | |
| | | | | | | | | | | | | | |
| | Senior Term Loans(j) – (continued) | |
| | Health Care – Services – (continued) | |
| Community Health Systems, Inc. | |
| $ | 198,000 | | | | 4.250 | % | | | 01/27/21 | | | $ | 197,299 | |
| Curo Health Services LLC | |
| | 318,400 | | | | 5.750 | | | | 06/08/20 | | | | 316,808 | |
| Envision Healthcare Corp. | |
| | 497,421 | | | | 4.000 | | | | 05/25/18 | | | | 493,691 | |
| Kindred Healthcare, Inc. | |
| | 308,450 | | | | 4.250 | | | | 04/09/21 | | | | 297,910 | |
| MedAssets, Inc. | |
| | 324,089 | | | | 4.000 | | | | 12/13/19 | | | | 322,200 | |
| Medpace Holdings, Inc. | |
| | 223,915 | | | | 4.750 | | | | 04/01/21 | | | | 221,116 | |
| Millennium Laboratories, Inc. | |
| | 1,065,249 | | | | 5.250 | | | | 04/16/21 | | | | 1,058,143 | |
| MPH Acquisition Holdings LLC | |
| | 318,182 | | | | 3.750 | | | | 03/31/21 | | | | 308,795 | |
| STHI Holding Corp. | |
| | 798,000 | | | | 4.500 | | | | 08/06/21 | | | | 790,682 | |
| Surgery Center Holdings, Inc. | |
| | 30,000 | | | | 5.250 | | | | 11/03/20 | | | | 29,175 | |
| | 85,000 | | | | 8.500 | | | | 11/03/21 | | | | 81,813 | |
| | | | | | | | | | | | | | |
| | | | | | | | | | | | | 5,329,292 | |
| | |
| | Lodging – 0.0% | |
| Four Seasons Holdings, Inc. | |
| | 296,250 | | | | 3.500 | | | | 06/27/20 | | | | 289,584 | |
| | |
| | Media – Broadcasting & Radio – 0.4% | |
| AP NMT Acquisition BV | |
| | 748,125 | | | | 6.750 | | | | 08/13/21 | | | | 733,163 | |
| | 129,675 | | | | 7.000 | | | | 08/13/21 | | | | 153,252 | |
| Entravision Communications Corp. | |
| | 90,750 | | | | 3.500 | | | | 05/31/20 | | | | 87,801 | |
| Gray Television, Inc. | |
| | 62,321 | | | | 3.750 | | | | 06/10/21 | | | | 61,230 | |
| iHeart Communications, Inc. | |
| | 2,311,074 | | | | 6.919 | | | | 01/30/19 | | | | 2,174,051 | |
| | | | | | | | | | | | | | |
| | | | | | | | | | | | | 3,209,497 | |
| | |
| | Media – Cable – 0.1% | |
| Midcontinent Communications | |
| | 49,250 | | | | 5.000 | | | | 07/30/20 | | | | 48,840 | |
| Ziggo N.V. | |
| | 300,013 | | | | 3.500 | | | | 01/15/22 | | | | 291,252 | |
| | 193,360 | | | | 3.500 | | | | 02/01/22 | | | | 187,714 | |
| | | | | | | | | | | | | | |
| | | | | | | | | | | | | 527,806 | |
| | |
| | Media – Non Cable – 0.4% | |
| Advantage Sales & Marketing, Inc. | |
| | 868,790 | | | | 4.250 | | | | 07/23/21 | | | | 858,113 | |
| | 28,960 | | | | 4.250 | | | | 07/25/21 | | | | 28,604 | |
| Affinion Group, Inc. | |
| | 994,463 | | | | 6.750 | | | | 04/30/18 | | | | 929,405 | |
| Cengage Learning Acquisitions, Inc. | |
| | 258,050 | | | | 7.000 | | | | 03/31/20 | | | | 255,147 | |
| Interactive Data Corp. | |
| | 500,000 | | | | 4.750 | | | | 05/02/21 | | | | 495,625 | |
| | |
| | |
| The accompanying notes are an integral part of these financial statements. | | 25 |
GOLDMAN SACHS MULTI-MANAGER ALTERNATIVES FUND
Schedule of Investments (continued)
December 31, 2014
| | | | | | | | | | | | | | |
Principal Amount | | | Interest
Rate | | | Maturity
Date | | | Value | |
| | | | | | | | | | | | | | |
| | Senior Term Loans(j) – (continued) | |
| | Media – Non Cable – (continued) | |
| Media General, Inc. | |
| $ | 90,698 | | | | 4.250 | % | | | 07/31/20 | | | $ | 89,592 | |
| Tyrol Acquisition 2 SAS(k) | |
| EUR | 265,625 | | | | 0.000 | | | | 01/29/16 | | | | 316,553 | |
| William Morris Endeavor Entertainment LLC | |
| $ | 174,125 | | | | 5.250 | | | | 05/06/21 | | | | 167,923 | |
| | | | | | | | | | | | | | |
| | | | | | | | | | | | | 3,140,962 | |
| | |
| | Metals & Mining – 0.1% | |
| NN, Inc. | |
| | 547,071 | | | | 6.000 | | | | 08/27/21 | | | | 544,336 | |
| | |
| | Packaging – 0.1% | |
| Ardagh Holdings USA, Inc. | |
| | 297,750 | | | | 4.000 | | | | 12/17/19 | | | | 291,423 | |
| Berry Plastics Holding Group, Inc. | |
| | 962,055 | | | | 3.750 | | | | 01/06/21 | | | | 934,569 | |
| | | | | | | | | | | | | | |
| | | | | | | | | | | | | 1,225,992 | |
| | |
| | Paper – 0.0% | |
| Hoffmaster Group, Inc. | |
| | 139,300 | | | | 5.250 | | | | 05/09/20 | | | | 137,443 | |
| | |
| | Pharmaceuticals – 0.0% | |
| Aquilex Holdings LLC | |
| | 332,146 | | | | 5.000 | | | | 12/31/20 | | | | 323,842 | |
| Salix Pharmaceuticals Ltd. | |
| | 41,111 | | | | 4.250 | | | | 01/02/20 | | | | 40,507 | |
| | | | | | | | | | | | | | |
| | | | | | | | | | | | | 364,349 | |
| | |
| | Real Estate – 0.2% | |
| Empire Generating Co. LLC | |
| | 620,618 | | | | 5.250 | | | | 03/14/21 | | | | 608,206 | |
| GTCR Valor Cos., Inc. | |
| | 673,035 | | | | 6.000 | | | | 05/30/21 | | | | 653,685 | |
| Rhp Hotel Properties LP | |
| | 527,350 | | | | 3.750 | | | | 01/15/21 | | | | 525,594 | |
| Starwood Property Trust, Inc. | |
| | 143,178 | | | | 3.500 | | | | 04/19/20 | | | | 139,599 | |
| | | | | | | | | | | | | | |
| | | | | | | | | | | | | 1,927,084 | |
| | |
| | Restaurants – 0.1% | |
| Red Lobster Management LLC | |
| | 558,600 | | | | 6.250 | | | | 07/28/21 | | | | 554,410 | |
| | |
| | Retailers – 0.5% | |
| Albertson’s Holdings LLC | |
| | 975,000 | | | | 4.500 | | | | 08/25/21 | | | | 973,986 | |
| Albertsons LLC | |
| | 165,000 | | | | 4.750 | | | | 03/21/19 | | | | 163,763 | |
| JC Penney Corp., Inc. | |
| | 351,432 | | | | 6.000 | | | | 05/22/18 | | | | 344,112 | |
| Leslies Poolmart, Inc. | |
| | 197,475 | | | | 4.250 | | | | 10/16/19 | | | | 191,798 | |
| Maxeda DIY BV | |
| | 33,423 | | | | 4.501 | | | | 06/29/17 | | | | 37,180 | |
| | 11,576 | | | | 4.522 | | | | 06/29/17 | | | | 12,877 | |
| | |
| | | | | | | | | | | | | | |
| | Senior Term Loans(j) – (continued) | |
| | Retailers – (continued) | |
| Spencer Gifts LLC | |
| $ | 558,600 | | | | 5.500 | % | | | 07/03/21 | | | $ | 551,618 | |
| The Talbots, Inc. | |
| | 282,863 | | | | 4.750 | | | | 03/19/20 | | | | 272,962 | |
| | 155,000 | | | | 8.250 | | | | 03/17/21 | | | | 148,800 | |
| Toys R US - Delaware, Inc. | |
| | 750,000 | | | | 9.750 | | | | 04/24/20 | | | | 688,357 | |
| True Religion Apparel, Inc. | |
| | 96,750 | | | | 5.875 | | | | 07/30/19 | | | | 88,284 | |
| Wilton Brands LLC | |
| | 563,103 | | | | 7.500 | | | | 08/30/18 | | | | 523,686 | |
| | | | | | | | | | | | | | |
| | | | | | | | | | | | | 3,997,423 | |
| | |
| | Services Cyclical – Business Services – 0.2% | |
| Brickman Group Ltd. | |
| | 247,503 | | | | 4.000 | | | | 12/18/20 | | | | 239,845 | |
| Koosharem LLC | |
| | 213,925 | | | | 7.500 | | | | 05/16/20 | | | | 209,824 | |
| Language Line LLC | |
| | 138,951 | | | | 6.250 | | | | 06/20/16 | | | | 137,145 | |
| Redtop Acquisition Ltd. | |
| | 99,250 | | | | 4.500 | | | | 12/03/20 | | | | 98,506 | |
| Tribune Co. | |
| | 577,688 | | | | 5.750 | | | | 07/07/21 | | | | 569,022 | |
| Vantiv, LLC | |
| | 139,300 | | | | 3.750 | | | | 06/13/21 | | | | 137,472 | |
| WCA Waste Systems, Inc. | |
| | 53,012 | | | | 4.000 | | | | 03/23/18 | | | | 52,017 | |
| Weight Watchers International, Inc. | |
| | 311,263 | | | | 4.000 | | | | 04/02/20 | | | | 238,894 | |
| | | | | | | | | | | | | | |
| | | | | | | | | | | | | 1,682,725 | |
| | |
| | Technology – Hardware – 0.0% | |
| Freescale Semiconductor Corp. | |
| | 98,750 | | | | 5.000 | | | | 01/15/21 | | | | 98,355 | |
| Photonis Technologies SAS | |
| | 193,534 | | | | 8.500 | | | | 09/18/19 | | | | 185,793 | |
| | | | | | | | | | | | | | |
| | | | | | | | | | | | | 284,148 | |
| | |
| | Technology – Software – 0.2% | |
| Aricent Technologies Ltd. | |
| | 920,375 | | | | 5.500 | | | | 04/14/21 | | | | 917,310 | |
| BMC Software, Inc. | |
| | 334,850 | | | | 5.000 | | | | 09/10/20 | | | | 325,016 | |
| | | | | | | | | | | | | | |
| | | | | | | | | | | | | 1,242,326 | |
| | |
| | Technology – Software/Services – 0.4% | |
| Applied Systems, Inc. | |
| | 986,772 | | | | 4.250 | | | | 01/23/21 | | | | 968,892 | |
| | 100,000 | | | | 7.500 | | | | 01/23/22 | | | | 97,333 | |
| Dealertrack Technologies, Inc. | |
| | 572,413 | | | | 3.250 | | | | 02/28/21 | | | | 560,249 | |
| Dell, Inc. | |
| | 1,089,383 | | | | 4.500 | | | | 04/29/20 | | | | 1,086,115 | |
| | |
| | |
| 26 | | The accompanying notes are an integral part of these financial statements. |
GOLDMAN SACHS MULTI-MANAGER ALTERNATIVES FUND
| | | | | | | | | | | | | | |
Principal Amount | | | Interest
Rate | | | Maturity
Date | | | Value | |
| | | | | | | | | | | | | | |
| | Senior Term Loans(j) – (continued) | |
| | Technology – Software/Services – (continued) | |
| Ion Trading Technologies S.a.r.l. | |
| $ | 19,418 | | | | 4.250 | % | | | 06/10/21 | | | $ | 19,127 | |
| | 155,000 | | | | 7.250 | | | | 06/10/22 | | | | 146,475 | |
| MModal Inc. | |
| | 120,088 | | | | 9.000 | | | | 01/31/20 | | | | 116,635 | |
| Zayo Group LLC | |
| | 296,707 | | | | 4.000 | | | | 07/02/19 | | | | 293,117 | |
| | | | | | | | | | | | | | |
| | | | | | | | | | | | | 3,287,943 | |
| | |
| | Telecommunications – Internet & Data – 0.4% | |
| Asurion LLC | |
| | 989,965 | | | | 5.000 | | | | 05/24/19 | | | | 975,650 | |
| | 497,475 | | | | 4.250 | | | | 07/08/20 | | | | 480,063 | |
| | 500,000 | | | | 8.500 | | | | 03/03/21 | | | | 495,415 | |
| Fibertech Networks LLC | |
| | 494,963 | | | | 4.000 | | | | 12/18/19 | | | | 489,484 | |
| Level 3 Financing, Inc. | |
| | 650,000 | | | | 4.000 | | | | 01/15/20 | | | | 644,312 | |
| Vince Intermediate Holding LLC | |
| | 54,286 | | | | 5.750 | | | | 11/27/19 | | | | 53,811 | |
| | | | | | | | | | | | | | |
| | | | | | | | | | | | | 3,138,735 | |
| | |
| | Textiles – 0.1% | |
| Indra Holdings Corp. | |
| | 154,225 | | | | 5.250 | | | | 05/01/21 | | | | 151,911 | |
| Nine West Holdings, Inc. | |
| | 545,000 | | | | 6.250 | | | | 01/08/20 | | | | 485,960 | |
| Phillips-Van Heusen Corp. | |
| | 225,540 | | | | 3.250 | | | | 02/13/20 | | | | 225,376 | |
| | | | | | | | | | | | | | |
| | | | | | | | | | | | | 863,247 | |
| | |
| | Transportation – 0.2% | |
| OSG Bulk Ships, Inc | |
| | 567,150 | | | | 5.250 | | | | 08/05/19 | | | | 551,553 | |
| OSG International, Inc. | |
| | 567,150 | | | | 5.750 | | | | 08/05/19 | | | | 550,136 | |
| Syncreon Group Holdings BV | |
| | 248,120 | | | | 5.250 | | | | 10/28/20 | | | | 240,677 | |
| | | | | | | | | | | | | | |
| | | | | | | | | | | | | 1,342,366 | |
| | |
| | Utilities – 0.4% | |
| Energy Future Intermediate Holding Co. LLC | |
| | 615,000 | | | | 4.250 | | | | 06/19/16 | | | | 614,619 | |
| Texas Competitive Electric Holdings Co. | |
| | 3,185,585 | | | | 4.648 | | | | 10/10/15 | | | | 2,036,130 | |
| | 488,028 | | | | 4.648 | | | | 10/10/17 | | | | 314,983 | |
| | | | | | | | | | | | | | |
| | | | | | | | | | | | | 2,965,732 | |
| | |
| | TOTAL SENIOR TERM LOANS | | | | | |
| | (Cost $56,055,592) | | | | | | | $ | 53,456,919 | |
| | |
| | | | | | | | | | |
| Shares | | Description | | Rate | | | Value | |
| | | | | | | | | | |
| Preferred Stocks – 1.7% | |
| Banks(e) – 0.0% | |
HSBC USA, Inc. | |
| 4,625 | | | | | 4.000 | % | | $ | 107,531 | |
U.S. Bancorp | |
| 5,200 | | | | | 3.500 | | | | 115,232 | |
| | | | | | | | | | |
| | | | | | | | | 222,763 | |
| |
| Consumer Finance – 1.7% | |
Ally Financial, Inc. | |
| 2,200 | | | | | 7.000 | (b)(e) | | | 2,199,106 | |
| 219,325 | | | | | 8.500 | | | | 5,895,456 | |
RBS Capital Funding Trust V | |
| 126,812 | | | | | 5.900 | | | | 3,081,532 | |
RBS Capital Funding Trust VII | |
| 121,979 | | | | | 6.080 | | | | 2,975,068 | |
| | | | | | | | | | |
| | | | | | | | | 14,151,162 | |
| |
| TOTAL PREFERRED STOCKS — 1.7% | |
| (Cost $14,156,023) | | | $ | 14,373,925 | |
| |
| | | | | | | | | | | | | | |
Notional
Amount | | | Exercise
Rate | | | Expiration
Date | | | Value | |
| | | | | | | | | | | | | | |
| | Options Purchased – 0.2% | |
| | Credit Default Swaps Index Options | |
| JPMorgan Chase Bank (London) Put – CDS North America High
Yield Index 23 |
|
| $ | 11,000,000 | | | | 102.000 | % | | | 03/18/15 | | | $ | 82,084 | |
| JPMorgan Chase Bank (London) Put – CDS North America High
Yield Index 23 |
|
| | 5,000,000 | | | | 103.000 | | | | 03/18/15 | | | | 47,046 | |
| JPMorgan Chase Bank (London) Put – CDS North America High
Yield Index 23 |
|
| | 3,000,000 | | | | 104.000 | | | | 03/18/15 | | | | 35,881 | |
| | |
| | Cross Currency Options | |
| Barclays Bank PLC | | | | | |
| | Put NOK 7,740,824 | | | | | | | | | | | | | |
| | Call GBP 728,000 | | | | 10.633 | | | | 04/21/15 | | | | 104,269 | |
| Barclays Bank PLC | | | | | |
| | Put GBP 728,000 | | | | | | | | | | | | | |
| | Call NOK 7,740,824 | | | | 10.633 | | | | 04/21/15 | | | | 2,974 | |
| Barclays Bank PLC | | | | | |
| | Put JPY 81,738,450 | | | | | | | | | | | | | |
| | Call GBP 475,500 | | | | 171.900 | | | | 01/22/15 | | | | 59,205 | |
| Barclays Bank PLC | | | | | |
| | Put GBP 475,500 | | | | | | | | | | | | | |
| | Call JPY 81,738,450 | | | | 171.900 | | | | 01/22/15 | | | | 72 | |
| Barclays Bank PLC | | | | | |
| | Put NOK 5,158,438 | | | | | | | | | | | | | |
| | Call GBP 485,500 | | | | 10.625 | | | | 01/22/15 | | | | 67,031 | |
| Barclays Bank PLC | | | | | |
| | Put GBP 485,500 | | | | | | | | | | | | | |
| | Call NOK 5,158,438 | | | | 10.625 | | | | 01/22/15 | | | | 44 | |
| Deutsche Bank AG (London) | | | | | |
| | Put EUR 21,000 | | | | | | | | | | | | | |
| | Call SEK 194,009 | | | | 9.239 | | | | 04/01/15 | | | | — | |
| | |
| | |
| The accompanying notes are an integral part of these financial statements. | | 27 |
GOLDMAN SACHS MULTI-MANAGER ALTERNATIVES FUND
Schedule of Investments (continued)
December 31, 2014
| | | | | | | | | | | | | | |
Notional
Amount | | | Exercise
Rate | | | Expiration
Date | | | Value | |
| | | | | | | | | | | | | | |
| | Options Purchased – (continued) | |
| | Cross Currency Options – (continued) | |
| JPMorgan Chase Bank (London) | | | | | |
| | Put JPY 79,421,875 | | | | | | | | | | | | | |
| | Call AUD 812,500 | | | | 97.750 | % | | | 02/03/15 | | | $ | 8,468 | |
| JPMorgan Chase Bank (London) | | | | | |
| | Put AUD 812,500 | | | | | | | | | | | | | |
| | Call JPY 79,421,875 | | | | 97.750 | | | | 02/03/15 | | | | 8,769 | |
| | |
| | Currency Options | |
| Barclays Bank PLC | | | | | |
| | Put USD 1,542,840 | | | | | | | | | | | | | |
| | Call EUR 1,032,000 | | | | 1.495 | | | | 04/22/15 | | | | 7 | |
| Barclays Bank PLC | | | | | |
| | Put AUD 937,000 | | | | | | | | | | | | | |
| | Call USD 843,300 | | | | 0.900 | | | | 06/29/15 | | | | 88,182 | |
| Credit Suisse International (London) | | | | | |
| | Put USD 716,500 | | | | | | | | | | | | | |
| | Call JPY 79,853,925 | | | | 111.450 | | | | 02/03/15 | | | | 320 | |
| Credit Suisse International (London) | | | | | |
| | Put JPY 79,853,925 | | | | | | | | | | | | | |
| | Call USD 716,500 | | | | 111.450 | | | | 02/03/15 | | | | 50,253 | |
| Deutsche Bank AG (London) | | | | | |
| | Put USD 761,000 | | | | | | | | | | | | | |
| | Call JPY 81,427,000 | | | | 107.000 | | | | 01/22/15 | | | | 11 | |
| Deutsche Bank AG (London) | | | | | |
| | Put JPY 81,427,000 | | | | | | | | | | | | | |
| | Call USD 761,000 | | | | 107.000 | | | | 01/22/15 | | | | 81,387 | |
| JPMorgan Chase Bank (London) | | | | | |
| | Put AUD 937,000 | | | | | | | | | | | | | |
| | Call USD 805,820 | | | | 0.860 | | | | 06/29/15 | | | | 54,878 | |
| | |
| | Interest Rate Swaptions | | | | | |
| Barclays Bank PLC Call – OTC – EUR 6 month EURO Strike
Price 2.250% |
|
| $ | 459,000 | | | | 2.250 | | | | 08/20/15 | | | | 1,404 | |
| Barclays Bank PLC Call – OTC – GBP 6 month GBP Strike
Price 3.500% |
|
| | 451,000 | | | | 3.500 | | | | 02/09/15 | | | | 3 | |
| Barclays Bank PLC Call – OTC – GBP 6 month GBP Strike
Price 3.818% |
|
| | 729,500 | | | | 3.818 | | | | 09/26/28 | | | | 48,002 | |
| Credit Suisse International (London) Call – OTC – USD 3 month
LIBOR Strike Price 4.500% |
|
| | 182,500 | | | | 4.500 | | | | 09/25/23 | | | | 7,621 | |
| Credit Suisse International (London) Put – OTC – JPY 6 month
JYOR Strike Price 2.202% |
|
| | 62,052,500 | | | | 2.202 | | | | 09/02/24 | | | | 42,742 | |
| Credit Suisse International (London) Put – OTC – USD 3 month
LIBOR Strike Price 1.250% |
|
| | 2,020,500 | | | | 1.250 | | | | 08/17/15 | | | | 6,116 | |
| Deutsche Bank AG (Frankfurt) Call – OTC – EUR 6 month
EURO Strike Price 2.080% |
|
| | 470,500 | | | | 2.080 | | | | 04/01/15 | | | | 5 | |
| Deutsche Bank AG (Frankfurt) Call – OTC – EUR 6 month
EURO Strike Price 2.750% |
|
| | 677,000 | | | | 2.750 | | | | 05/30/34 | | | | 43,186 | |
| | |
| | | | | | | | | | | | | | |
| | Options Purchased – (continued) | |
| | Interest Rate Swaptions – (continued) | | | | | |
| Deutsche Bank AG (Frankfurt) Call – OTC – GBP 6 month GBP
Strike Price 2.100% |
|
| $ | 1,152,000 | | | | 2.100 | % | | | 06/15/15 | | | $ | 158 | |
| Deutsche Bank AG (Frankfurt) Call – OTC – GBP 6 month GBP
Strike Price 3.630% |
|
| | 1,100,000 | | | | 3.630 | | | | 11/21/16 | | | | 10,089 | |
| Deutsche Bank AG (Frankfurt) Call – OTC – GBP 6 month GBP
Strike Price 3.600% |
|
| | 338,500 | | | | 3.600 | | | | 08/07/19 | | | | 11,232 | |
| Deutsche Bank AG (Frankfurt) Call – OTC – GBP 6 month GBP
Strike Price 3.795% |
|
| | 182,500 | | | | 3.795 | | | | 09/26/28 | | | | 12,148 | |
| Deutsche Bank AG (London) Call – OTC – GBP 6 month GBP
Strike Price 3.795% |
|
| | 547,000 | | | | 3.795 | | | | 09/26/28 | | | | 36,410 | |
| Deutsche Bank AG Call – OTC – USD 3 month LIBOR Strike
Price 4.300% |
|
| | 235,000 | | | | 4.300 | | | | 03/27/17 | | | | 3,383 | |
| Deutsche Bank AG Call – OTC – USD 3 month LIBOR Strike
Price 4.600% |
|
| | 864,000 | | | | 4.600 | | | | 03/05/19 | | | | 22,770 | |
| JPMorgan Chase Bank (London) Call – OTC – EUR 6 month
EURO Strike Price 2.078% |
|
| | 474,000 | | | | 2.078 | | | | 04/02/15 | | | | 6 | |
| JPMorgan Chase Bank (London) Call – OTC – GBP 6 month
GBP Strike Price 3.650% |
|
| | 691,000 | | | | 3.65 | % | | | 06/16/17 | | | | 9,807 | |
| JPMorgan Chase Bank (London) Put – OTC – GBP 6 month GBP
Strike Price 2.000% |
|
| | 2,256,000 | | | | 2.000 | | | | 05/31/16 | | | | 49,409 | |
| JPMorgan Chase Bank (London) Put – OTC – GBP 6 month GBP
Strike Price 3.000% |
|
| | 478,500 | | | | 3.000 | | | | 10/30/17 | | | | 130,364 | |
| JPMorgan Chase Bank (London) Put – OTC – USD 3 month
LIBOR Strike Price 1.250% |
|
| | 4,061,000 | | | | 1.250 | | | | 08/14/15 | | | | 12,333 | |
| Morgan Stanley & Co. International PLC Call – OTC – GBP
6 month GBP Strike Price 3.650% |
|
| | 460,500 | | | | 3.650 | | | | 06/16/17 | | | | 6,536 | |
| Morgan Stanley & Co. International PLC Call – OTC – USD
3 month LIBOR Strike Price 5.000% |
|
| | 707,000 | | | | 5.000 | | | | 03/11/24 | | | | 22,491 | |
| Morgan Stanley & Co. International PLC Call – OTC – USD
3 month LIBOR Strike Price 5.420% |
|
| | 243,500 | | | | 5.420 | | | | 11/19/20 | | | | 4,949 | |
| Morgan Stanley & Co. International PLC Put – OTC – GBP
6 month GBP Strike Price 2.000% |
|
| | 2,256,000 | | | | 2.000 | | | | 06/02/16 | | | | 49,345 | |
| Morgan Stanley & Co. International PLC Put – OTC – GBP
6 month GBP Strike Price 3.000% |
|
| | 957,000 | | | | 3.000 | | | | 10/30/17 | | | | 260,729 | |
| | |
| | Options on Equities/Equity Indicies | | | | | |
| Deutsche Bank AG Put – S&P 500 Index Strike Price 1,850 | |
| | 77 | | | | 1,850.000 | | | | 03/20/15 | | | | 148,610 | |
| | |
| | |
| 28 | | The accompanying notes are an integral part of these financial statements. |
GOLDMAN SACHS MULTI-MANAGER ALTERNATIVES FUND
| | | | | | | | | | | | | | |
Notional
Amount | | | Exercise
Rate | | | Expiration
Date | | | Value | |
| | | | | | | | | | | | | | |
| | Options Purchased – (continued) | |
| | Options on Equities/Equity Indicies – (continued) | | | | | |
| Deutsche Bank AG Put – Ishares U.S. Real Estate ETF Strike
Price 68 |
|
| $ | 1,537 | | | | 68.000 | % | | | 03/20/15 | | | $ | 58,406 | |
| Deutsche Bank AG Call – Hertz Global Holdings, Inc. Strike
Price 20 |
|
| | 300 | | | | 20.000 | | | | 03/20/15 | | | | 168,000 | |
| Deutsche Bank AG Call – Hertz Global Holdings, Inc. Strike
Price 23 |
|
| | 500 | | | | 23.000 | | | | 03/20/15 | | | | 160,000 | |
| | |
| | TOTAL OPTIONS PURCHASED | |
| | (Cost $2,100,688) | | | $ | 2,017,135 | |
| | |
| | | | | | |
Shares | | Description | | Value | |
| | | | | | |
| Right* – 0.0% | | | | |
| Hotels, Restaurants & Leisure – 0.0% | |
| 46,800 | | GTECH SPA (Expires 01/09/15) | | $ | — | |
| (Cost $—) | | | | |
| |
| | | | | | | | |
Shares | | Description | | Expiration Date | | Value | |
| | | | | | | | |
| Warrant* – 0.1% | | | | | | |
| Commercial Banks – 0.1% | |
| 24,951 | | JPMorgan Chase & Co. | | 10/28/18 | | $ | 518,981 | |
| (Cost $491,580) | | | | | | |
| |
| | | | | | | | | | | | |
Principal
Amount | | Interest
Rate | | | Maturity
Date | | | Value | |
| | | | | | | | | | | | |
| Short-term Investment(l) – 30.0% | |
| Repurchase Agreement – 30.0% | |
Joint Repurchase Agreement Account II | |
| $247,800,000 | | | 0.082 | % | | | 01/02/15 | | | $ | 247,800,000 | |
| (Cost $247,800,000) | | | | | |
| |
TOTAL INVESTMENTS BEFORE
SHORT POSITIONS — 106.8% | |
| (Cost $872,920,448) | | | $ | 882,219,117 | |
| |
| | | | | | | | |
Shares | | | Description | | Value | |
| | | | | | | | |
| | Common Stocks Sold Short – (3.8)% | |
| | Aerospace & Defense – (0.2)% | |
| | 9,521 | | | The Boeing Co. | | $ | (1,237,540 | ) |
| | |
| | Auto Components – (0.1)% | |
| | 31,209 | | | Remy International, Inc. | | | (652,892 | ) |
| | |
| | Beverages – (0.2)% | |
| | 11,649 | | | Anheuser Busch InBev NV ADR | | | (1,308,416 | ) |
| | |
| | | | | | | | |
| | Common Stocks Sold Short – (continued) | |
| | Chemicals – (0.1)% | |
| | 19,232 | | | Albemarle Corp. | | $ | (1,156,420 | ) |
| | |
| | Commercial Services & Supplies – (0.0)% | |
| | 6,900 | | | Pitney Bowes, Inc. | | | (168,153 | ) |
| | |
| | Consumer Finance – (0.1)% | |
| | 48,689 | | | Santander Consumer USA Holdings, Inc. | | | (954,791 | ) |
| | |
| | Diversified Telecommunication Services – (0.3)% | |
| | 76,698 | | | AT&T, Inc. | | | (2,576,286 | ) |
| | |
| | Electric Utilities – (0.7)% | |
| | 32,553 | | | American Electric Power Co., Inc. | | | (1,976,618 | ) |
| | 23,301 | | | Duke Energy Corp. | | | (1,946,566 | ) |
| | 39,512 | | | The Southern Co. | | | (1,940,434 | ) |
| | | | | | | | |
| | | | | | | (5,863,618 | ) |
| | |
| | Energy Equipment & Services – (0.2)% | |
| | 22,114 | | | Baker Hughes, Inc. | | | (1,239,932 | ) |
| | |
| | Food & Staples Retailing – (0.1)% | |
| | 8,179 | | | Wal-Mart Stores, Inc. | | | (702,413 | ) |
| | |
| | Health Care Equipment & Supplies – (0.4)% | |
| | 17,468 | | | Medtronic, Inc. | | | (1,261,189 | ) |
| | 35,436 | | | STERIS Corp. | | | (2,298,025 | ) |
| | | | | | | | |
| | | | | | | (3,559,214 | ) |
| | |
| | Health Care Providers & Services – (0.0)% | |
| | 6,300 | | | PharMerica Corp. | | | (130,473 | ) |
| | |
| | Industrial Conglomerates – (0.1)% | |
| | 39,053 | | | General Electric Co. | | | (986,869 | ) |
| | |
| | Internet Software & Services – (0.7)% | |
| | 35,679 | | | Alibaba Group Holding Ltd. ADR | | | (3,708,475 | ) |
| | 136,200 | | | Tencent Holdings Ltd. | | | (1,970,667 | ) |
| | | | | | | | |
| | | | | | | (5,679,142 | ) |
| | |
| | IT Services – (0.1)% | |
| | 3,444 | | | FleetCor Technologies, Inc. | | | (512,157 | ) |
| | |
| | Machinery – (0.1)% | |
| | 12,054 | | | Caterpillar, Inc. | | | (1,103,303 | ) |
| | |
| | Metals & Mining – (0.0)% | |
| | 17,584 | | | Newmont Mining Corp. | | | (332,338 | ) |
| | |
| | Oil, Gas & Consumable Fuels – (0.2)% | |
| | 32,190 | | | Kinder Morgan, Inc. | | | (1,361,959 | ) |
| | |
| | Real Estate Investment Trusts – (0.2)% | |
| | 4,201 | | | Equity Residential | | | (301,800 | ) |
| | 6,533 | | | HCP, Inc. | | | (287,648 | ) |
| | 4,172 | | | Health Care REIT, Inc. | | | (315,695 | ) |
| | 7,349 | | | ProLogis, Inc. | | | (316,228 | ) |
| | 1,657 | | | Public Storage | | | (306,296 | ) |
| | | | | | | | |
| | | | | | | (1,527,667 | ) |
| | |
| | |
| The accompanying notes are an integral part of these financial statements. | | 29 |
GOLDMAN SACHS MULTI-MANAGER ALTERNATIVES FUND
Schedule of Investments (continued)
December 31, 2014
| | | | | | | | |
Shares | | | Description | | Value | |
| | | | | | | | |
| | Common Stocks Sold Short – (continued) | |
| | Trading Companies & Distributors – (0.0)% | |
| | 600 | | | W.W. Grainger, Inc. | | $ | (152,934 | ) |
| | |
| | TOTAL COMMON STOCKS SOLD SHORT | |
| | (Cost $(30,715,868)) | | $ | (31,206,517 | ) |
| | |
| | | | | | | | |
| | Exchange Traded Funds Sold Short – (5.7)% | |
| | 15,417 | | | Consumer Discretionary Select Sector SPDR Fund | | $ | (1,112,337 | ) |
| | 53,039 | | | Financial Select Sector SPDR Fund | | | (1,311,654 | ) |
| | 10,573 | | | Health Care Select Sector SPDR Fund | | | (722,982 | ) |
| | 17,300 | | | iShares Russell 3000 Growth Index Fund | | | (1,355,282 | ) |
| | 42,004 | | | iShares US Real Estate ETF | | | (3,227,587 | ) |
| | 177,318 | | | SPDR S&P 500 ETF Trust | | | (36,438,849 | ) |
| | 1,300 | | | SPDR S&P Oil & Gas Exploration & Production Fund ETF | | | (62,218 | ) |
| | 27,402 | | | SPDR S&P Regional Banking ETF | | | (1,115,261 | ) |
| | 8,594 | | | Technology Select Sector SPDR Fund | | | (355,362 | ) |
| | 2,500 | | | The Energy Select Sector SPDR Fund | | | (197,900 | ) |
| | 27,168 | | | Utilities Select Sector SPDR Fund | | | (1,282,873 | ) |
| | |
| | TOTAL EXCHANGE TRADED FUNDS SOLD SHORT | |
| | (Cost $(44,837,121)) | | $ | (47,182,305 | ) |
| | |
| | TOTAL SECURITIES SOLD SHORT – (9.5)% | | | | |
| | (Cost $(75,552,989)) | | $ | (78,388,822 | ) |
| | |
| OTHER ASSETS IN EXCESS OF OTHER
LIABILITIES – 2.7% | | | 22,291,347 | |
| | |
| | NET ASSETS – 100.0% | | $ | 826,121,642 | |
| | |
| | |
| The percentage shown for each investment category reflects the value of investments in that category as a percentage of net assets. |
* | | Non-income producing security. |
(a) | | All or portion of security is pledged as collateral for short sales. Total market value of securities pledged as collateral on short sales amounts to $110,152,032, which represents approximately 13.3% of net assets as of December 31, 2014. |
(b) | | Exempt from registration under Rule 144A of the Securities Act of 1933. Under procedures approved by the Board of Trustees, such securities have been determined to be liquid by the investment adviser and may be resold, normally to qualified institutional buyers in transactions exempt from registration. Total market value of Rule 144A securities amounts to $ 63,532,626, which represents approximately 7.7% of net assets as of December 31, 2014. |
(c) | | Security with “Call” features with resetting interest rates. Maturity dates disclosed are the final maturity dates. |
(d) | | Pay-in-kind securities. |
(e) | | Variable rate security. Interest rate or distribution rate disclosed is that which is in effect at December 31, 2014. |
(f) | | Security is currently in default and/or non-income producing. |
(g) | | Issued with a zero coupon. Income is recognized through the accretion of discount. |
(h) | | Coupon changes periodically based upon a predetermined schedule. Interest rate disclosed is that which is in effect at December 31, 2014. |
(i) | | A portion of this security is pledged as collateral for initial margin requirements on centrally cleared swap transactions. Total market value pledged as collateral amounts to $1,001,728, which represents approximately 0.1% of net assets as of December 31, 2014. |
(j) | | Senior Term Loans often require prepayments from excess cash flows or permit the borrower to repay at its election. The degree to which borrowers repay, whether as a contractual requirement or at their election, cannot be predicted with accuracy. As a result, the actual remaining maturity may be substantially less than the stated maturities shown. The stated interest rate represents the weighted average interest rate of all contracts within the senior loan facility at December 31, 2014. Senior Term Loans typically have rates of interest which are predetermined either daily, monthly, quarterly or semi-annually by reference to a base lending rate, plus a premium. These base lending rates are primarily the London-Interbank Offered Rate (“LIBOR”), and secondarily the prime rate offered by one or more major United States banks (the “Prime Rate”) and the certificate of deposit (“CD”) rate or other base lending rates used by commercial lenders. |
(k) | | This position represents an unsettled loan commitment at period end. Certain details associated with this purchase are not known prior to the settlement date, including coupon rate. |
(l) | | Joint repurchase agreement was entered into on December 31, 2014. Additional information appears on page 46. |
| | |
| 30 | | The accompanying notes are an integral part of these financial statements. |
GOLDMAN SACHS MULTI-MANAGER ALTERNATIVES FUND
| | |
|
Currency Abbreviations: |
AUD | | —Australian Dollar |
BRL | | —Brazilian Real |
CAD | | —Canadian Dollar |
CHF | | —Swiss Franc |
CLP | | —Chilean Peso |
EUR | | —Euro |
GBP | | —British Pound |
HKD | | —Hong Kong Dollar |
HUF | | —Hungarian Forint |
INR | | —Indian Rupee |
JPY | | —Japanese Yen |
KRW | | —South Korean Won |
MXN | | —Mexican Peso |
NOK | | —Norwegian Krone |
NZD | | —New Zealand Dollar |
PLN | | —Polish Zloty |
SEK | | —Swedish Krona |
THB | | —Thai Baht |
TRY | | —Turkish Lira |
USD | | —U.S. Dollar |
ZAR | | —South African Rand |
| | |
Investment Abbreviations: |
ADR | | —American Depositary Receipt |
CDOR | | —Canadian Dollar Offered Rate |
CHFOR | | —Swiss Franc Offered Rate |
CP | | —Commercial Paper |
ETF | | —Exchange Traded Fund |
EURO | | —Euro Offered Rate |
FNMA | | —Federal National Mortgage Association |
GDR | | —Global Depository Receipt |
GO | | —General Obligation |
JIBAR | | —Johannesburg Interbank Agreed Rate |
JYOR | | —Japanese Yen Offered Rate |
LIBOR | | —London Interbank Offered Rate |
LP | | —Limited Partnership |
NIBOR | | —Norwegian Interbank Offered Rate |
NZDOR | | —New Zealand Dollar Offered Rate |
OTC | | —Over the Counter |
RB | | —Revenue Bond |
REIT | | —Real Estate Investment Trust |
SPA | | —Stand-by Purchase Agreement |
STIBOR | | —Stockholm Interbank Offered Rate |
TIIE | | —La Tasa de Interbank Equilibrium Interest Rate |
|
| | |
| The accompanying notes are an integral part of these financial statements. | | 31 |
GOLDMAN SACHS MULTI-MANAGER ALTERNATIVES FUND
Schedule of Investments (continued)
December 31, 2014
|
| ADDITIONAL INVESTMENT INFORMATION |
FORWARD FOREIGN CURRENCY EXCHANGE CONTRACTS — At December 31, 2014, the Fund had the following forward foreign currency exchange contracts:
FORWARD FOREIGN CURRENCY EXCHANGE CONTRACTS WITH UNREALIZED GAIN
| | | | | | | | | | | | | | |
| Counterparty | | Contracts to
Buy/Sell | | Settlement
Date | | | Current Value | | | Unrealized Gain | |
Barclays Bank PLC | | EUR/NOK | | | 02/13/15 | | | $ | 133,642 | | | $ | 8,600 | |
| | SEK/EUR | | | 01/26/15 | | | | 146,821 | | | | 1,370 | |
| | SEK/NOK | | | 02/13/15 | | | | 175,551 | | | | 6,948 | |
| | USD/EUR | | | 01/16/15 | | | | 393,336 | | | | 14,663 | |
| | USD/EUR | | | 02/17/15 | | | | 193,697 | | | | 6,500 | |
| | USD/EUR | | | 03/03/15 | | | | 1,769,516 | | | | 62,489 | |
| | USD/EUR | | | 03/13/15 | | | | 2,571 | | | | 67 | |
| | USD/EUR | | | 03/16/15 | | | | 445,610 | | | | 7,608 | |
| | USD/EUR | | | 02/20/19 | | | | 229,595 | | | | 24,816 | |
| | USD/GBP | | | 02/13/15 | | | | 15,581 | | | | 104 | |
| | USD/GBP | | | 03/16/15 | | | | 529,598 | | | | 4,333 | |
| | USD/KRW | | | 01/23/15 | | | | 113,486 | | | | 4,014 | |
| | USD/ZAR | | | 01/16/15 | | | | 729,632 | | | | 7,474 | |
Credit Suisse International (London) | | EUR/HUF | | | 03/02/15 | | | | 25,573 | | | | 821 | |
| | EUR/NOK | | | 02/13/15 | | | | 133,181 | | | | 9,061 | |
| | EUR/PLN | | | 03/02/15 | | | | 29,059 | | | | 362 | |
| | GBP/EUR | | | 02/13/15 | | | | 142,242 | | | | 4,394 | |
| | SEK/EUR | | | 01/26/15 | | | | 440,827 | | | | 4,164 | |
| | USD/AUD | | | 03/02/15 | | | | 12,770 | | | | 830 | |
| | USD/BRL | | | 03/12/15 | | | | 35,774 | | | | 4,029 | |
| | USD/BRL | | | 03/20/15 | | | | 330,151 | | | | 18,055 | |
| | USD/CHF | | | 01/08/15 | | | | 178,056 | | | | 11,065 | |
| | USD/CLP | | | 03/02/15 | | | | 30,184 | | | | 516 | |
| | USD/EUR | | | 01/08/15 | | | | 1,508,460 | | | | 99,170 | |
| | USD/EUR | | | 02/03/15 | | | | 320,171 | | | | 17,237 | |
| | USD/EUR | | | 02/05/15 | | | | 10,894 | | | | 591 | |
| | USD/EUR | | | 03/02/15 | | | | 55,815 | | | | 1,752 | |
| | USD/EUR | | | 03/03/15 | | | | 178,586 | | | | 6,478 | |
| | USD/EUR | | | 04/01/15 | | | | 1,298,865 | | | | 5,091 | |
| | USD/GBP | | | 01/08/15 | | | | 2,429,701 | | | | 122,357 | |
| | USD/GBP | | | 01/16/15 | | | | 540,764 | | | | 13,318 | |
| | USD/GBP | | | 03/13/15 | | | | 206,393 | | | | 1,152 | |
| | USD/GBP | | | 04/01/15 | | | | 2,371,964 | | | | 852 | |
| | USD/MXN | | | 03/02/15 | | | | 35,460 | | | | 3,040 | |
| | USD/NZD | | | 03/02/15 | | | | 11,373 | | | | 127 | |
| | USD/TRY | | | 03/02/15 | | | | 29,736 | | | | 1,164 | |
| | USD/ZAR | | | 03/02/15 | | | | 24,877 | | | | 823 | |
Deutsche Bank AG (London) | | CAD/EUR | | | 02/25/19 | | | | 240,017 | | | | 14,592 | |
| | CAD/EUR | | | 03/12/19 | | | | 139,869 | | | | 11,782 | |
| | CAD/JPY | | | 01/26/15 | | | | 448,126 | | | | 11,242 | |
| | EUR/NOK | | | 02/13/15 | | | | 68,518 | | | | 4,116 | |
| | GBP/EUR | | | 02/13/15 | | | | 142,242 | | | | 4,201 | |
| | GBP/EUR | | | 03/12/19 | | | | 279,739 | | | | 20,262 | |
| | GBP/EUR | | | 03/14/19 | | | | 292,078 | | | | 22,320 | |
| | USD/AUD | | | 02/05/15 | | | | 389,228 | | | | 11,583 | |
| | USD/CLP | | | 01/16/15 | | | | 82,161 | | | | 602 | |
| | USD/EUR | | | 01/15/15 | | | | 5,079,420 | | | | 266,560 | |
| | USD/EUR | | | 02/25/15 | | | | 100,486 | | | | 3,029 | |
| | USD/JPY | | | 01/23/15 | | | | 895,074 | | | | 104,926 | |
| | |
| 32 | | The accompanying notes are an integral part of these financial statements. |
GOLDMAN SACHS MULTI-MANAGER ALTERNATIVES FUND
|
| ADDITIONAL INVESTMENT INFORMATION (continued) |
FORWARD FOREIGN CURRENCY EXCHANGE CONTRACTS WITH UNREALIZED GAIN (continued)
| | | | | | | | | | | | | | |
| Counterparty | | Contracts to
Buy/Sell | | Settlement
Date | | | Current Value | | | Unrealized Gain | |
Deutsche Bank AG (London) (continued) | | USD/KRW | | | 01/26/15 | | | $ | 113,588 | | | $ | 3,912 | |
JPMorgan Chase Bank (London) | | EUR/NOK | | | 02/13/15 | | | | 202,166 | | | | 12,710 | |
| | GBP/EUR | | | 02/13/15 | | | | 142,242 | | | | 3,482 | |
| | USD/JPY | | | 01/23/15 | | | | 895,247 | | | | 104,753 | |
| | USD/KRW | | | 01/26/15 | | | | 113,159 | | | | 4,341 | |
| | USD/MXN | | | 01/23/15 | | | | 257,306 | | | | 24,694 | |
| | USD/MXN | | | 01/26/15 | | | | 85,700 | | | | 8,300 | |
Merrill Lynch & Co., Inc. | | AUD/USD | | | 03/20/15 | | | | 943,105 | | | | 4,043 | |
| | GBP/USD | | | 03/20/15 | | | | 632,379 | | | | 1,209 | |
| | JPY/USD | | | 03/20/15 | | | | 316,330 | | | | 1,687 | |
| | MXN/USD | | | 03/20/15 | | | | 5,665 | | | | 12 | |
| | NZD/USD | | | 03/20/15 | | | | 1,694,144 | | | | 10,381 | |
| | USD/AUD | | | 03/20/15 | | | | 17,277,812 | | | | 136,479 | |
| | USD/CAD | | | 03/20/15 | | | | 22,005,224 | | | | 115,888 | |
| | USD/CHF | | | 03/20/15 | | | | 23,952,492 | | | | 564,556 | |
| | USD/EUR | | | 03/20/15 | | | | 15,286,909 | | | | 320,664 | |
| | USD/GBP | | | 03/20/15 | | | | 25,496,099 | | | | 153,286 | |
| | USD/JPY | | | 03/20/15 | | | | 4,582,423 | | | | 23,324 | |
| | USD/MXN | | | 03/20/15 | | | | 3,751,420 | | | | 10,457 | |
| | USD/NZD | | | 03/20/15 | | | | 2,284,656 | | | | 3,233 | |
Morgan Stanley & Co. International PLC | | CZK/EUR | | | 02/13/15 | | | | 429,751 | | | | 1,162 | |
| | EUR/BRL | | | 01/30/15 | | | | 831,408 | | | | 15,907 | |
| | USD/BRL | | | 02/03/15 | | | | 1,446,798 | | | | 74,753 | |
| | USD/BRL | | | 03/03/15 | | | | 14,724 | | | | 176 | |
| | USD/CHF | | | 02/05/15 | | | | 231,981 | | | | 9,028 | |
| | USD/EUR | | | 02/05/15 | | | | 1,823,006 | | | | 74,649 | |
| | USD/GBP | | | 02/05/15 | | | | 337,342 | | | | 8,830 | |
| | USD/GBP | | | 02/13/15 | | | | 270,325 | | | | 4,480 | |
| | USD/INR | | | 03/02/15 | | | | 58,556 | | | | 1,144 | |
| | USD/KRW | | | 01/23/15 | | | | 113,465 | | | | 4,035 | |
| | USD/KRW | | | 01/30/15 | | | | 135,646 | | | | 5,354 | |
State Street Bank and Trust | | USD/JPY | | | 01/05/15 | | | | 9,644 | | | | 8 | |
| | | USD/SEK | | | 01/05/15 | | | | 55,931 | | | | 154 | |
| TOTAL | | | | | | | | | | | | $ | 2,657,741 | |
FORWARD FOREIGN CURRENCY EXCHANGE CONTRACTS WITH UNREALIZED LOSS
| | | | | | | | | | | | | | |
| Counterparty | | Contracts to
Buy/Sell | | Settlement
Date | | | Current Value | | | Unrealized Loss | |
Barclays Bank PLC | | AUD/USD | | | 02/05/15 | | | $ | 194,614 | | | $ | (1,432 | ) |
| | BRL/USD | | | 03/12/15 | | | | 35,774 | | | | (5,354 | ) |
| | BRL/USD | | | 03/20/15 | | | | 330,151 | | | | (49,550 | ) |
| | EUR/CAD | | | 02/13/15 | | | | 293,866 | | | | (3,330 | ) |
| | EUR/GBP | | | 01/26/15 | | | | 296,267 | | | | (6,861 | ) |
| | EUR/USD | | | 03/03/15 | | | | 174,348 | | | | (4,854 | ) |
| | EUR/USD | | | 02/20/19 | | | | 229,595 | | | | (8,788 | ) |
| | NOK/EUR | | | 02/13/15 | | | | 284,484 | | | | (16,546 | ) |
| | USD/NZD | | | 01/30/15 | | | | 94,575 | | | | (575 | ) |
Credit Suisse International (London) | | CHF/USD | | | 01/08/15 | | | | 184,092 | | | | (3,686 | ) |
| | EUR/USD | | | 01/08/15 | | | | 1,508,460 | | | | (12,854 | ) |
| | GBP/USD | | | 01/08/15 | | | | 2,429,701 | | | | (889 | ) |
| | |
| The accompanying notes are an integral part of these financial statements. | | 33 |
GOLDMAN SACHS MULTI-MANAGER ALTERNATIVES FUND
Schedule of Investments (continued)
December 31, 2014
|
| ADDITIONAL INVESTMENT INFORMATION (continued) |
FORWARD FOREIGN CURRENCY EXCHANGE CONTRACTS WITH UNREALIZED LOSS (continued)
| | | | | | | | | | | | | | |
| Counterparty | | Contracts to
Buy/Sell | | Settlement
Date | | | Current Value | | | Unrealized Loss | |
Credit Suisse International (London) (continued) | | JPY/USD | | | 01/16/15 | | | $ | 903,199 | | | $ | (96,801 | ) |
| | KRW/USD | | | 01/26/15 | | | | 114,875 | | | | (2,625 | ) |
| | MXN/USD | | | 01/23/15 | | | | 86,560 | | | | (7,440 | ) |
Deutsche Bank AG (London) | | EUR/GBP | | | 01/26/15 | | | | 305,279 | | | | (7,037 | ) |
| | EUR/GBP | | | 02/13/15 | | | | 434,301 | | | | (7,576 | ) |
| | EUR/GBP | | | 03/12/19 | | | | 288,401 | | | | (8,662 | ) |
| | EUR/GBP | | | 03/14/19 | | | | 301,552 | | | | (9,474 | ) |
| | EUR/USD | | | 01/15/15 | | | | 1,972,708 | | | | (99,305 | ) |
| | EUR/USD | | | 01/16/15 | | | | 151,888 | | | | (6,005 | ) |
| | JPY/CAD | | | 01/26/15 | | | | 292,481 | | | | (8,601 | ) |
| | KRW/USD | | | 01/26/15 | | | | 114,875 | | | | (2,625 | ) |
| | MXN/USD | | | 01/23/15 | | | | 86,690 | | | | (7,310 | ) |
| | NOK/EUR | | | 02/13/15 | | | | 142,242 | | | | (8,313 | ) |
JPMorgan Chase Bank (London) | | JPY/CAD | | | 01/26/15 | | | | 166,886 | | | | (6,447 | ) |
| | JPY/USD | | | 01/23/15 | | | | 1,805,757 | | | | (194,243 | ) |
| | KRW/USD | | | 01/23/15 | | | | 114,515 | | | | (2,985 | ) |
| | MXN/USD | | | 01/23/15 | | | | 86,489 | | | | (7,511 | ) |
| | MXN/USD | | | 01/26/15 | | | | 86,691 | | | | (7,309 | ) |
| | NOK/EUR | | | 02/13/15 | | | | 145,268 | | | | (6,089 | ) |
| | NOK/SEK | | | 02/13/15 | | | | 65,880 | | | | (1,556 | ) |
| | NZD/USD | | | 01/30/15 | | | | 93,460 | | | | (540 | ) |
Merrill Lynch & Co., Inc. | | AUD/USD | | | 03/20/15 | | | | 1,302,654 | | | | (4,425 | ) |
| | CHF/USD | | | 03/20/15 | | | | 4,262,228 | | | | (47,743 | ) |
| | EUR/USD | | | 03/20/15 | | | | 1,730,434 | | | | (12,577 | ) |
| | GBP/USD | | | 03/20/15 | | | | 7,738,079 | | | | (37,507 | ) |
| | JPY/USD | | | 03/20/15 | | | | 15,469,062 | | | | (176,628 | ) |
| | MXN/USD | | | 03/20/15 | | | | 2,085,246 | | | | (18,729 | ) |
| | NZD/USD | | | 03/20/15 | | | | 1,936,385 | | | | (7,927 | ) |
| | USD/AUD | | | 03/20/15 | | | | 2,581,770 | | | | (10,986 | ) |
| | USD/CAD | | | 03/20/15 | | | | 6,526,558 | | | | (7,531 | ) |
| | USD/GBP | | | 03/20/15 | | | | 9,303,451 | | | | (18,008 | ) |
| | USD/JPY | | | 03/20/15 | | | | 1,373,239 | | | | (6,814 | ) |
| | USD/MXN | | | 03/20/15 | | | | 1,341,652 | | | | (1,578 | ) |
| | USD/NZD | | | 03/20/15 | | | | 4,902,879 | | | | (17,638 | ) |
Morgan Stanley & Co. International PLC | | AUD/USD | | | 02/05/15 | | | | 194,614 | | | | (1,456 | ) |
| | CLP/USD | | | 02/13/15 | | | | 134,354 | | | | (3,646 | ) |
| | EUR/USD | | | 02/05/15 | | | | 199,732 | | | | (3,489 | ) |
| | KRW/USD | | | 01/23/15 | | | | 114,837 | | | | (2,663 | ) |
| | KRW/USD | | | 01/30/15 | | | | 138,567 | | | | (2,433 | ) |
| | NOK/SEK | | | 02/13/15 | | | | 114,314 | | | | (3,087 | ) |
| | | USD/KRW | | | 03/02/15 | | | | 37,828 | | | | (229 | ) |
| TOTAL | | | | | | | | | | | | $ | (998,267 | ) |
FUTURES CONTRACTS — At December 31, 2014, the Fund had the following futures contracts:
| | | | | | | | | | | | | | |
| Type | | Number of
Contracts
Long (Short) | | | Expiration Date | | Current Value | | | Unrealized
Gain (Loss) | |
Australian 10 Year Government Bonds | | | 229 | | | March 2015 | | $ | 23,957,423 | | | $ | 378,280 | |
CAC40 Index | | | 38 | | | January 2015 | | | 1,966,646 | | | | (7,940 | ) |
Canada 10 Year Government Bonds | | | 57 | | | March 2015 | | | 6,796,041 | | | | 1,526 | |
| | |
| 34 | | The accompanying notes are an integral part of these financial statements. |
GOLDMAN SACHS MULTI-MANAGER ALTERNATIVES FUND
|
| ADDITIONAL INVESTMENT INFORMATION (continued) |
FUTURES CONTRACTS (continued)
| | | | | | | | | | | | | | |
| Type | | Number of
Contracts
Long (Short) | | | Expiration Date | | Current Value | | | Unrealized
Gain (Loss) | |
DAX Index | | | 9 | | | March 2015 | | $ | 2,680,004 | | | $ | (12,259 | ) |
DJIA E-Mini Index | | | 147 | | | March 2015 | | | 13,047,720 | | | | 138,434 | |
Eurodollars | | | 1,566 | | | June 2016 | | | 385,901,550 | | | | (521,911 | ) |
Euro Stoxx 50 Index | | | 101 | | | March 2015 | | | 3,828,998 | | | | 103,708 | |
FTSE 100 Index | | | (38 | ) | | March 2015 | | | (3,863,071 | ) | | | (60,210 | ) |
Italian 10 Year Government Bonds | | | (4 | ) | | March 2015 | | | (656,331 | ) | | | (6,810 | ) |
Japan 10 Year Government Bonds | | | (1 | ) | | March 2015 | | | (1,233,845 | ) | | | (7,104 | ) |
Nasdaq 100 E-Mini Index | | | 162 | | | March 2015 | | | 13,714,110 | | | | 34,967 | |
Nikkei 225 Index | | | 196 | | | March 2015 | | | 14,219,736 | | | | (346,529 | ) |
Russell 2000 Mini Index | | | 79 | | | March 2015 | | | 9,485,530 | | | | 219,615 | |
S&P 500 E-Mini Index | | | 183 | | | March 2015 | | | 18,779,460 | | | | 58,915 | |
Topix Index | | | 101 | | | March 2015 | | | 11,868,217 | | | | (237,117 | ) |
Ultra Long U.S. Treasury Bonds | | | (5 | ) | | March 2015 | | | (825,937 | ) | | | (29,856 | ) |
3 Month Euribor Interest Rate | | | 14 | | | December 2015 | | | 4,232,846 | | | | 9,707 | |
3 Month Euribor Interest Rate | | | 782 | | | June 2016 | | | 236,375,561 | | | | 155,431 | |
3 Month Euribor Interest Rate | | | (14 | ) | | December 2016 | | | (4,229,670 | ) | | | (18,034 | ) |
3 Month Sterling Interest Rate | | | 1,174 | | | June 2016 | | | 226,254,479 | | | | 298,751 | |
5 Year German Euro-Bobl | | | (11 | ) | | March 2015 | | | (1,734,099 | ) | | | (12,937 | ) |
10 Year German Euro-Bund | | | (7 | ) | | March 2015 | | | (1,320,274 | ) | | | (23,528 | ) |
10 Year Mini Japanese Government Bonds | | | 371 | | | March 2015 | | | 45,791,150 | | | | 253,079 | |
10 Year U.K. Long Gilt | | | 88 | | | March 2015 | | | 16,394,363 | | | | 168,545 | |
2 Year U.S. Treasury Notes | | | (36 | ) | | March 2015 | | | (7,869,375 | ) | | | 13,406 | |
5 Year U.S. Treasury Notes | | | (38 | ) | | March 2015 | | | (4,519,328 | ) | | | 7,569 | |
10 Year U.S. Treasury Notes | | | (30 | ) | | March 2015 | | | (3,803,906 | ) | | | (4,132 | ) |
20 Year U.S. Treasury Bonds | | | 414 | | | March 2015 | | | 59,848,875 | | | | 1,312,194 | |
| TOTAL | | | | | | | | | | | | $ | 1,865,760 | |
SWAP CONTRACTS — At December 31, 2014, the Fund had the following swap contracts:
OVER THE COUNTER INTEREST RATE SWAP CONTRACTS
| | | | | | | | | | | | | | | | | | | | | | | | |
| | | | | | | | | | | | Rates Exchanged | | Market Value | |
| Counterparty | | Notional Amount (000s) | | | Termination
Date | | | Payments Received | | Payments Made | | Upfront
Payments
Made (Received) | | | Unrealized
Gain (Loss) | |
Bank of America Securities LLC | | | CAD | | | | 259 | (a) | | | 10/18/23 | | | 3.940% | | 6 month CDOR | | $ | — | | | $ | 13,412 | |
| | | | | | | 244 | (a) | | | 10/23/23 | | | 3.853 | | 6 month CDOR | | | — | | | | 11,782 | |
| | | | | | | 400 | (a) | | | 10/29/23 | | | 3.845 | | 6 month CDOR | | | (12,424 | ) | | | 31,572 | |
Barclays Bank PLC | | | MXN | | | | 2,218 | (a) | | | 11/06/17 | | | 5.900 | | Mexico Interbank TIIE
28 Days | | | — | | | | 2,329 | |
| | | ZAR | | | | 2,352 | (a) | | | 01/29/18 | | | 8.595 | | 3 month JIBAR | | | — | | | | 4,117 | |
| | | SEK | | | | 8,904 | (a) | | | 06/16/18 | | | 3 month STIBOR | | 1.605% | | | — | | | | (23,942 | ) |
| | | ZAR | | | | 5,540 | (a) | | | 09/30/19 | | | 7.825 | | 3 month JIBAR | | | — | | | | 9,208 | |
| | | CHF | | | | 1,652 | (a) | | | 09/04/21 | | | 1.100 | | 6 month CHFOR | | | — | | | | 15,508 | |
| | | NOK | | | | 785 | (a) | | | 09/25/23 | | | 6 month NIBOR | | 4.270 | | | — | | | | (9,749 | ) |
| | | SEK | | | | 828 | (a) | | | 09/25/23 | | | 3.625 | | 3 month STIBOR | | | — | | | | 9,945 | |
| | | ZAR | | | | 7,500 | (a) | | | 09/30/23 | | | 9.295 | | 3 month JIBAR | | | — | | | | 16,201 | |
| | | NOK | | | | 794 | (a) | | | 11/11/23 | | | 6 month NIBOR | | 4.141 | | | — | | | | (9,083 | ) |
| | | | | | | 2,439 | (a) | | | 11/13/23 | | | 6 month NIBOR | | 4.152 | | | — | | | | (28,034 | ) |
| | |
| The accompanying notes are an integral part of these financial statements. | | 35 |
GOLDMAN SACHS MULTI-MANAGER ALTERNATIVES FUND
Schedule of Investments (continued)
December 31, 2014
|
| ADDITIONAL INVESTMENT INFORMATION (continued) |
OVER THE COUNTER INTEREST RATE SWAP CONTRACTS (continued)
| | | | | | | | | | | | | | | | | | | | | | | | |
| | | | | | | | | | | | Rates Exchanged | | Market Value | |
| Counterparty | | Notional Amount (000s) | | | Termination
Date | | | Payments Received | | Payments Made | | Upfront
Payments
Made (Received) | | | Unrealized
Gain (Loss) | |
Barclays Bank PLC (continued) | | | ZAR | | | | 2,188 | (a) | | | 11/19/23 | | | 9.400% | | 3 month JIBAR | | $ | — | | | $ | 5,068 | |
| | | | | | | 763 | (a) | | | 11/20/23 | | | 9.430 | | 3 month JIBAR | | | — | | | | 1,826 | |
| | | NOK | | | | 3,224 | (a) | | | 06/10/24 | | | 6 month NIBOR | | 3.655% | | | — | | | | (24,631 | ) |
| | | CHF | | | | 1,128 | (a) | | | 09/04/24 | | | 6 month CHFOR | | 1.615 | | | — | | | | (18,651 | ) |
| | | ZAR | | | | 3,000 | (a) | | | 11/25/28 | | | 10.650 | | 3 month JIBAR | | | — | | | | 4,467 | |
| | | | | | | 3,400 | (a) | | | 01/23/29 | | | 10.850 | | 3 month JIBAR | | | — | | | | 5,952 | |
| | | | | | | 771 | (a) | | | 11/14/33 | | | 3 month JIBAR | | 10.160 | | | — | | | | (917 | ) |
| | | CHF | | | | 248 | (a) | | | 06/02/34 | | | 2.330 | | 6 month CHFOR | | | — | | | | 20,442 | |
Credit Suisse International (London) | | | | | | | 824 | (a) | | | 01/23/23 | | | 2.360 | | 6 month CHFOR | | | — | | | | 74,294 | |
| | | SEK | | | | 3,542 | (a) | | | 06/10/24 | | | 3.036 | | 3 month STIBOR | | | — | | | | 26,174 | |
| | | | | | | 3,610 | (a) | | | 06/10/24 | | | 3.025 | | 3 month STIBOR | | | — | | | | 26,431 | |
| | | CHF | | | | 124 | (a) | | | 05/27/34 | | | 2.360 | | 6 month CHFOR | | | — | | | | 10,605 | |
| | | | | | | 248 | (a) | | | 06/03/34 | | | 2.328 | | 6 month CHFOR | | | — | | | | 20,395 | |
| | | | | | | 125 | (a) | | | 07/03/34 | | | 2.352 | | 6 month CHFOR | | | — | | | | 10,534 | |
| | | | | | | 107 | (a) | | | 08/07/44 | | | 2.040 | | 6 month CHFOR | | | — | | | | 6,968 | |
Deustche Bank AG | | | CAD | | | | 600 | (a) | | | 04/03/24 | | | 3.830 | | 6 month CDOR | | | — | | | | 26,174 | |
| | | NZD | | | | 870 | (a) | | | 04/08/24 | | | 3 month NZDOR | | 5.615 | | | — | | | | (34,841 | ) |
| | | CAD | | | | 620 | (a) | | | 04/29/24 | | | 3.705 | | 6 month CDOR | | | — | | | | 23,707 | |
Deutsche Bank AG (Frankfurt) | | | NZD | | | | 3,940 | (a) | | | 03/19/16 | | | 4.545 | | 3 month NZDOR | | | — | | | | 23,474 | |
| | | | | | | 1,447 | (a) | | | 06/22/16 | | | 4.538 | | 3 month NZDOR | | | — | | | | 8,030 | |
| | | | | | | 3,374 | (a) | | | 06/22/16 | | | 4.425 | | 3 month NZDOR | | | — | | | | 15,886 | |
| | | | | | | 2,517 | (a) | | | 09/01/16 | | | 4.240 | | 3 month NZDOR | | | — | | | | 7,788 | |
| | | EUR | | | | 510 | | | | 03/25/17 | | | 6 month EURO | | 0.968 | | | — | | | | (15,570 | ) |
| | | NZD | | | | 1,336 | (a) | | | 04/13/17 | | | 4.700 | | 3 month NZDOR | | | — | | | | 17,039 | |
| | | | | | | 697 | (a) | | | 03/19/18 | | | 3 month NZDOR | | 4.775 | | | — | | | | (13,366 | ) |
| | | | | | | 697 | (a) | | | 03/19/18 | | | 3 month NZDOR | | 4.757 | | | — | | | | (13,095 | ) |
| | | CAD | | | | 1,207 | (a) | | | 06/13/18 | | | 2.208 | | 6 month CDOR | | | — | | | | 8,391 | |
| | | NZD | | | | 581 | (a) | | | 06/22/18 | | | 3 month NZDOR | | 4.733 | | | — | | | | (10,116 | ) |
| | | | | | | 1,352 | (a) | | | 06/22/18 | | | 3 month NZDOR | | 4.635 | | | — | | | | (20,692 | ) |
| | | | | | | 1,008 | (a) | | | 09/01/18 | | | 3 month NZDOR | | 4.430 | | | — | | | | (10,404 | ) |
| | | | | | | 477 | (a) | | | 10/25/23 | | | 3 month NZDOR | | 5.598 | | | — | | | | (19,424 | ) |
| | | | | | | 765 | (a) | | | 05/01/24 | | | 3 month NZDOR | | 5.403 | | | — | | | | (25,731 | ) |
| | | | | | | 365 | (a) | | | 04/13/25 | | | 3 month NZDOR | | 5.238 | | | — | | | | (25,574 | ) |
Deutsche Bank AG (London) | | | MXN | | | | 6,000 | (a) | | | 09/24/19 | | | 6.120 | | Mexico Interbank TIIE
28 Days | | | — | | | | 14,575 | |
| | | | | | | 1,066 | (a) | | | 02/17/22 | | | 7.585 | | Mexico Interbank TIIE
28 Days | | | — | | | | 2,981 | |
| | | | | | | 210 | (a) | | | 02/18/22 | | | 7.550 | | Mexico Interbank TIIE
28 Days | | | — | | | | 566 | |
| | | | | | | 450 | (a) | | | 02/21/22 | | | 7.568 | | Mexico Interbank TIIE
28 Days | | | — | | | | 1,231 | |
| | | | | | | 371 | (a) | | | 02/24/22 | | | 7.465 | | Mexico Interbank TIIE
28 Days | | | — | | | | 905 | |
| | | | | | | 7,570 | (a) | | | 09/19/23 | | | 8.275 | | Mexico Interbank TIIE
28 Days | | | — | | | | 26,783 | |
| | | | | | | 918 | (a) | | | 11/22/23 | | | 8.747 | | Mexico Interbank TIIE
28 Days | | | — | | | | 4,279 | |
| | | | | | | 1,296 | (a) | | | 11/23/23 | | | 8.753 | | Mexico Interbank TIIE
28 Days | | | — | | | | 6,059 | |
| | |
| 36 | | The accompanying notes are an integral part of these financial statements. |
GOLDMAN SACHS MULTI-MANAGER ALTERNATIVES FUND
|
| ADDITIONAL INVESTMENT INFORMATION (continued) |
OVER THE COUNTER INTEREST RATE SWAP CONTRACTS (continued)
| | | | | | | | | | | | | | | | | | | | | | | | |
| | | | | | | | | | | | Rates Exchanged | | Market Value | |
| Counterparty | | Notional Amount (000s) | | | Termination
Date | | | Payments Received | | Payments Made | | Upfront
Payments
Made (Received) | | | Unrealized
Gain (Loss) | |
Deutsche Bank AG (London) (continued) | | | MXN | | | | 2,259 | (a) | | | 11/28/23 | | | 8.460% | | Mexico Interbank TIIE
28 Days | | $ | — | | | $ | 8,853 | |
| | | | | | | 286 | (a) | | | 11/29/23 | | | 8.598 | | Mexico Interbank TIIE
28 Days | | | — | | | | 1,221 | |
| | | | | | | 202 | (a) | | | 12/01/23 | | | 8.600 | | Mexico Interbank TIIE
28 Days | | | — | | | | 863 | |
| | | | | | | 274 | (a) | | | 09/20/28 | | | 9.810 | | Mexico Interbank TIIE
28 Days | | | — | | | | 1,055 | |
| | | ZAR | | | | 1,156 | (a) | | | 01/24/29 | | | 10.910 | | 3 month JIBAR | | | — | | | | 2,137 | |
| | | | | | | 370 | (a) | | | 11/15/33 | | | 3 month JIBAR | | 10.160% | | | — | | | | (560 | ) |
JP Morgan Chase Bank (London) | | | BRL | | | | 1,172 | | | | 01/02/17 | | | 12.210 | | 1 month Brazilian
Interbank Deposit
Average | | | — | | | | (3,315 | ) |
| | | | NOK | | | | 3,363 | (a) | | | 06/10/24 | | | 6 month NIBOR | | 3.665 | | | — | | | | (25,889 | ) |
| TOTAL | | | | | | | | | | | | | | | | | | $ | (12,424 | ) | | $ | 195,643 | |
| | (a) | | Represents forward starting interest rate swaps whose effective dates of commencement of accruals and cash flows occur subsequent to December 31, 2014. |
CENTRALLY CLEARED INTEREST RATE SWAP CONTRACTS
| | | | | | | | | | | | |
Notional Amount (000s) | | | Termination Date | | Payments Received | | Payments Made | | Unrealized
Gain (Loss)* | |
| | | | | | | | | | | | |
| $ | 1,767 | (a) | | 07/07/16 | | 3 month LIBOR | | 0.725% | | $ | (6,873 | ) |
| | 1,738 | (a) | | 07/22/16 | | 3 month LIBOR | | 0.660 | | | (3,720 | ) |
| | 1,738 | (a) | | 07/22/16 | | 3 month LIBOR | | 0.676 | | | (4,275 | ) |
| EUR | 5,854 | (a) | | 04/11/18 | | 1.312% | | 6 month EURO | | | 68,134 | |
| GBP | 1,187 | (a) | | 08/05/18 | | 6 month GBP | | 2.605 | | | (37,586 | ) |
| $ | 1,173 | (a) | | 08/08/18 | | 2.402 | | 3 month LIBOR | | | 6,978 | |
| GBP | 1,182 | (a) | | 08/11/18 | | 6 month GBP | | 2.542 | | | (34,993 | ) |
| $ | 1,758 | (a) | | 08/15/18 | | 2.342 | | 3 month LIBOR | | | 8,080 | |
| GBP | 1,175 | (a) | | 08/15/18 | | 6 month GBP | | 2.398 | | | (29,416 | ) |
| $ | 1,775 | (a) | | 08/18/18 | | 2.255 | | 3 month LIBOR | | | 4,983 | |
| | 884 | (a) | | 12/19/18 | | 2.930 | | 3 month LIBOR | | | 11,436 | |
| | 567 | (a) | | 12/23/18 | | 3.125 | | 3 month LIBOR | | | 9,420 | |
| | 609 | | | 03/09/19 | | 3 month LIBOR | | 1.728 | | | (5,859 | ) |
| GBP | 294 | (a) | | 06/16/19 | | 2.968 | | 6 month GBP | | | 10,237 | |
| $ | 1,022 | (a) | | 07/07/19 | | 2.022 | | 3 month LIBOR | | | 24,880 | |
| | 1,000 | | | 07/22/19 | | 1.895 | | 3 month LIBOR | | | 17,243 | |
| | 1,000 | (a) | | 07/22/19 | | 1.926 | | 3 month LIBOR | | | 18,740 | |
| | 1,205 | (a) | | 08/14/19 | | 2.843 | | 3 month LIBOR | | | 8,921 | |
| | 1,194 | (a) | | 08/21/19 | | 2.750 | | 3 month LIBOR | | | 6,632 | |
| EUR | 3,292 | (a) | | 04/11/20 | | 6 month EURO | | 1.725 | | | (143,876 | ) |
| GBP | 596 | (a) | | 05/14/20 | | 3.025 | | 6 month GBP | | | 30,694 | |
| | 1,191 | (a) | | 05/15/20 | | 3.050 | | 6 month GBP | | | 62,731 | |
| | 618 | (a) | | 05/21/20 | | 3.130 | | 6 month GBP | | | 21,103 | |
| | 1,239 | (a) | | 05/22/20 | | 3.150 | | 6 month GBP | | | 43,011 | |
| | 591 | (a) | | 05/29/20 | | 3.030 | | 6 month GBP | | | 18,365 | |
| EUR | 955 | (a) | | 06/05/20 | | 6 month EURO | | 1.049 | | | (36,839 | ) |
| | |
| The accompanying notes are an integral part of these financial statements. | | 37 |
GOLDMAN SACHS MULTI-MANAGER ALTERNATIVES FUND
Schedule of Investments (continued)
December 31, 2014
|
| ADDITIONAL INVESTMENT INFORMATION (continued) |
CENTRALLY CLEARED INTEREST RATE SWAP CONTRACTS (continued)
| | | | | | | | | | | | |
Notional Amount (000s) | | | Termination Date | | Payments Received | | Payments Made | | Unrealized
Gain (Loss)* | |
| | | | | | | | | | | | |
| EUR | 473 | (a) | | 06/09/20 | | 6 month EURO | | 1.052% | | $ | (18,304 | ) |
| GBP | 309 | (a) | | 06/14/20 | | 3.200% | | 6 month GBP | | | 11,107 | |
| | 698 | (a) | | 06/18/20 | | 3.173 | | 6 month GBP | | | 24,464 | |
| | 303 | (a) | | 06/20/20 | | 3.215 | | 6 month GBP | | | 10,997 | |
| | 512 | (a) | | 06/25/20 | | 3.149 | | 6 month GBP | | | 17,513 | |
| | 381 | (a) | | 06/27/20 | | 3.075 | | 6 month GBP | | | 12,230 | |
| | 251 | (a) | | 07/09/20 | | 3.103 | | 6 month GBP | | | 8,192 | |
| | 376 | (a) | | 07/10/20 | | 3.045 | | 6 month GBP | | | 11,630 | |
| | 481 | (a) | | 08/05/20 | | 2.576 | | 6 month GBP | | | 35,061 | |
| | 474 | (a) | | 08/05/20 | | 2.576 | | 6 month GBP | | | 34,560 | |
| $ | 660 | (a) | | 08/20/20 | | 2.296 | | 3 month LIBOR | | | 6,829 | |
| | 660 | (a) | | 08/21/20 | | 2.291 | | 3 month LIBOR | | | 6,642 | |
| | 1,332 | (a) | | 11/26/20 | | 4.090 | | 3 month LIBOR | | | 34,807 | |
| | 653 | (a) | | 11/27/20 | | 4.060 | | 3 month LIBOR | | | 16,682 | |
| | 599 | (a) | | 11/27/20 | | 4.061 | | 3 month LIBOR | | | 15,314 | |
| | 910 | (a) | | 11/27/20 | | 4.110 | | 3 month LIBOR | | | 24,086 | |
| | 597 | (a) | | 11/29/20 | | 4.057 | | 3 month LIBOR | | | 15,216 | |
| | 597 | (a) | | 11/29/20 | | 4.062 | | 3 month LIBOR | | | 15,271 | |
| | 597 | (a) | | 11/29/20 | | 4.108 | | 3 month LIBOR | | | 15,772 | |
| | 1,982 | | | 05/15/21 | | 3 month LIBOR | | 2.159 | | | (26,044 | ) |
| JPY | 231,917 | (a) | | 05/20/21 | | 0.880 | | 6 month JYOR | | | 14,555 | |
| | 232,114 | (a) | | 08/19/21 | | 0.693 | | 6 month JYOR | | | 6,001 | |
| EUR | 1,407 | (a) | | 09/04/21 | | 6 month EURO | | 1.418 | | | (17,659 | ) |
| $ | 13,725 | | | 09/22/21 | | 3 month LIBOR | | 2.506 | | | (524,349 | ) |
| EUR | 1,690 | (a) | | 03/26/22 | | 6 month EURO | | 2.522 | | | (97,910 | ) |
| GBP | 2,740 | (a) | | 05/13/22 | | 6 month GBP | | 3.512 | | | (103,936 | ) |
| | 1,366 | (a) | | 05/14/22 | | 6 month GBP | | 3.497 | | | (51,345 | ) |
| | 229 | (a) | | 10/07/22 | | 3.546 | | 6 month GBP | | | 24,879 | |
| $ | 250 | (a) | | 12/11/22 | | 4.165 | | 3 month LIBOR | | | 16,669 | |
| | 375 | (a) | | 12/12/22 | | 4.141 | | 3 month LIBOR | | | 24,593 | |
| EUR | 555 | (a) | | 01/23/23 | | 6 month EURO | | 2.935 | | | (68,147 | ) |
| | 125 | | | 02/10/23 | | 6 month EURO | | 1.791 | | | (16,224 | ) |
| JPY | 470,151 | (a) | | 05/20/23 | | 6 month JYOR | | 1.310 | | | (39,043 | ) |
| GBP | 361 | (a) | | 05/21/23 | | 3.314 | | 6 month GBP | | | 31,071 | |
| | 274 | (a) | | 06/05/23 | | 3.380 | | 6 month GBP | | | 24,734 | |
| JPY | 469,167 | (a) | | 08/19/23 | | 6 month JYOR | | 1.113 | | | (20,947 | ) |
| GBP | 137 | (a) | | 10/18/23 | | 6 month GBP | | 3.768 | | | (15,763 | ) |
| | 109 | (a) | | 10/29/23 | | 6 month GBP | | 3.955 | | | (13,917 | ) |
| | 109 | (a) | | 10/29/23 | | 6 month GBP | | 3.959 | | | (13,948 | ) |
| $ | 1,583 | (a) | | 11/26/23 | | 3 month LIBOR | | 4.671 | | | (47,850 | ) |
| | 163 | | | 02/29/24 | | 3 month LIBOR | | 2.882 | | | (10,416 | ) |
| | 631 | | | 03/09/24 | | 3 month LIBOR | | 3.030 | | | (48,145 | ) |
| EUR | 1,083 | (a) | | 03/28/24 | | 6 month EURO | | 2.695 | | | (101,126 | ) |
| | 591 | (a) | | 04/11/24 | | 2.334 | | 6 month EURO | | | 69,393 | |
| GBP | 1,397 | (a) | | 05/22/24 | | 6 month GBP | | 3.703 | | | (53,074 | ) |
| | 700 | (a) | | 05/22/24 | | 6 month GBP | | 3.703 | | | (26,575 | ) |
| | 348 | (a) | | 05/23/24 | | 6 month GBP | | 3.690 | | | (13,101 | ) |
| | 700 | (a) | | 05/23/24 | | 6 month GBP | | 3.693 | | | (26,415 | ) |
| | 348 | (a) | | 05/31/24 | | 6 month GBP | | 3.583 | | | (12,042 | ) |
| | 556 | (a) | | 05/31/24 | | 6 month GBP | | 3.587 | | | (19,340 | ) |
| | 641 | (a) | | 05/31/24 | | 6 month GBP | | 3.600 | | | (22,505 | ) |
| | |
| 38 | | The accompanying notes are an integral part of these financial statements. |
GOLDMAN SACHS MULTI-MANAGER ALTERNATIVES FUND
|
| ADDITIONAL INVESTMENT INFORMATION (continued) |
CENTRALLY CLEARED INTEREST RATE SWAP CONTRACTS (continued)
| | | | | | | | | | | | |
Notional Amount (000s) | | | Termination Date | | Payments Received | | Payments Made | | Unrealized
Gain (Loss)* | |
| | | | | | | | | | | | |
| GBP | 697 | (a) | | 06/03/24 | | 6 month GBP | | 3.685% | | $ | (26,112 | ) |
| EUR | 648 | (a) | | 06/06/24 | | 2.825% | | 6 month EURO | | | 20,355 | |
| GBP | 415 | (a) | | 06/13/24 | | 6 month GBP | | 3.650 | | | (15,099 | ) |
| | 576 | (a) | | 06/13/24 | | 6 month GBP | | 3.680 | | | (21,441 | ) |
| | 285 | (a) | | 06/16/24 | | 6 month GBP | | 3.655 | | | (10,410 | ) |
| EUR | 389 | (a) | | 06/17/24 | | 2.914 | | 6 month EURO | | | 12,963 | |
| GBP | 1,186 | (a) | | 06/18/24 | | 6 month GBP | | 3.696 | | | (44,556 | ) |
| EUR | 634 | (a) | | 06/20/24 | | 2.884 | | 6 month EURO | | | 20,687 | |
| GBP | 384 | (a) | | 06/20/24 | | 6 month GBP | | 3.625 | | | (13,687 | ) |
| | 708 | (a) | | 06/20/24 | | 6 month GBP | | 3.661 | | | (25,977 | ) |
| | 515 | (a) | | 06/20/24 | | 6 month GBP | | 3.710 | | | (19,570 | ) |
| EUR | 379 | (a) | | 06/23/24 | | 2.806 | | 6 month EURO | | | 11,674 | |
| GBP | 431 | (a) | | 06/27/24 | | 6 month GBP | | 3.590 | | | (14,927 | ) |
| | 207 | (a) | | 06/27/24 | | 6 month GBP | | 3.595 | | | (7,189 | ) |
| | 578 | (a) | | 06/27/24 | | 6 month GBP | | 3.648 | | | (20,949 | ) |
| | 289 | (a) | | 06/27/24 | | 6 month GBP | | 3.663 | | | (10,603 | ) |
| $ | 395 | (a) | | 07/07/24 | | 3 month LIBOR | | 3.000 | | | (31,212 | ) |
| GBP | 632 | (a) | | 07/11/24 | | 6 month GBP | | 3.520 | | | (20,631 | ) |
| | 424 | (a) | | 07/11/24 | | 6 month GBP | | 3.606 | | | (14,847 | ) |
| $ | 387 | | | 07/22/24 | | 3 month LIBOR | | 2.867 | | | (25,397 | ) |
| | 387 | (a) | | 07/22/24 | | 3 month LIBOR | | 2.869 | | | (25,469 | ) |
| GBP | 415 | (a) | | 08/08/24 | | 6 month GBP | | 3.356 | | | (11,591 | ) |
| | 416 | (a) | | 08/08/24 | | 6 month GBP | | 3.380 | | | (11,894 | ) |
| $ | 618 | (a) | | 08/13/24 | | 3 month LIBOR | | 3.520 | | | (18,073 | ) |
| | 611 | (a) | | 08/20/24 | | 3 month LIBOR | | 3.416 | | | (15,049 | ) |
| EUR | 982 | (a) | | 09/04/24 | | 2.069 | | 6 month EURO | | | 21,961 | |
| $ | 448 | (a) | | 10/27/24 | | 3.237 | | 3 month LIBOR | | | 7,295 | |
| | 428 | (a) | | 10/27/24 | | 3.237 | | 3 month LIBOR | | | 6,947 | |
| | 3,986 | (a) | | 10/27/24 | | 3.350 | | 3 month LIBOR | | | 43,353 | |
| | 445 | (a) | | 10/31/24 | | 3.292 | | 3 month LIBOR | | | 8,356 | |
| | 445 | (a) | | 10/31/24 | | 3.300 | | 3 month LIBOR | | | 8,500 | |
| | 1,244 | (a) | | 11/03/24 | | 3.320 | | 3 month LIBOR | | | 12,552 | |
| | 2,528 | (a) | | 11/03/24 | | 3.320 | | 3 month LIBOR | | | 25,512 | |
| | 646 | (a) | | 11/04/24 | | 3.250 | | 3 month LIBOR | | | 10,818 | |
| | 1,253 | (a) | | 11/04/24 | | 3.390 | | 3 month LIBOR | | | 14,850 | |
| | 465 | (a) | | 11/05/24 | | 3.300 | | 3 month LIBOR | | | 8,785 | |
| GBP | 308 | (a) | | 08/05/25 | | 6 month GBP | | 2.956 | | | (45,158 | ) |
| | 303 | (a) | | 08/05/25 | | 6 month GBP | | 2.956 | | | (44,352 | ) |
| | 253 | (a) | | 08/18/25 | | 6 month GBP | | 2.798 | | | (30,954 | ) |
| | 252 | (a) | | 08/19/25 | | 6 month GBP | | 2.776 | | | (30,099 | ) |
| $ | 378 | (a) | | 02/07/26 | | 4.520 | | 3 month LIBOR | | | 19,495 | |
| EUR | 1,532 | (a) | | 03/26/26 | | 2.918 | | 6 month EURO | | | 202,831 | |
| JPY | 161,981 | (a) | | 05/22/26 | | 1.819 | | 6 month JYOR | | | 25,347 | |
| $ | 414 | (a) | | 06/20/26 | | 3.475 | | 3 month LIBOR | | | 29,828 | |
| JPY | 160,729 | (a) | | 08/21/26 | | 1.621 | | 6 month JYOR | | | 15,921 | |
| $ | 9,261 | (a) | | 10/28/26 | | 3 month LIBOR | | 3.530 | | | (70,923 | ) |
| | 6,331 | (a) | | 11/04/26 | | 3 month LIBOR | | 3.481 | | | (43,542 | ) |
| | 3,114 | (a) | | 11/04/26 | | 3 month LIBOR | | 3.485 | | | (21,572 | ) |
| | 3,133 | (a) | | 11/04/26 | | 3 month LIBOR | | 3.567 | | | (25,773 | ) |
| | 223 | (a) | | 12/19/26 | | 3 month LIBOR | | 4.229 | | | (29,026 | ) |
| | 148 | (a) | | 12/23/26 | | 3 month LIBOR | | 4.303 | | | (20,114 | ) |
| | |
| The accompanying notes are an integral part of these financial statements. | | 39 |
GOLDMAN SACHS MULTI-MANAGER ALTERNATIVES FUND
Schedule of Investments (continued)
December 31, 2014
|
| ADDITIONAL INVESTMENT INFORMATION (continued) |
CENTRALLY CLEARED INTEREST RATE SWAP CONTRACTS (continued)
| | | | | | | | | | | | |
Notional Amount (000s) | | | Termination Date | | Payments Received | | Payments Made | | Unrealized
Gain (Loss)* | |
| | | | | | | | | | | | |
| GBP | 555 | (a) | | 08/05/27 | | 6 month GBP | | 3.506% | | $ | (38,866 | ) |
| | 600 | (a) | | 08/08/27 | | 6 month GBP | | 3.481 | | | (40,968 | ) |
| | 456 | (a) | | 10/09/28 | | 6 month GBP | | 4.025 | | | (44,399 | ) |
| $ | 169 | (a) | | 11/27/28 | | 3 month LIBOR | | 4.550 | | | (23,053 | ) |
| | 153 | (a) | | 11/27/28 | | 3 month LIBOR | | 4.559 | | | (20,985 | ) |
| | 232 | (a) | | 11/27/28 | | 3 month LIBOR | | 4.597 | | | (32,553 | ) |
| | 155 | (a) | | 11/29/28 | | 3 month LIBOR | | 4.549 | | | (21,069 | ) |
| | 155 | (a) | | 11/29/28 | | 3 month LIBOR | | 4.553 | | | (21,124 | ) |
| | 155 | (a) | | 11/29/28 | | 3 month LIBOR | | 4.588 | | | (21,567 | ) |
| | 1,959 | (a) | | 02/09/29 | | 3 month LIBOR | | 4.581 | | | (66,351 | ) |
| | 2,379 | (a) | | 03/06/29 | | 3 month LIBOR | | 4.516 | | | (76,899 | ) |
| EUR | 560 | (a) | | 03/26/29 | | 6 month EURO | | 3.119 | | | (101,786 | ) |
| $ | 3,314 | (a) | | 04/27/29 | | 3 month LIBOR | | 4.250 | | | (86,965 | ) |
| GBP | 632 | (a) | | 05/20/29 | | 6 month GBP | | 3.790 | | | (49,910 | ) |
| | 324 | (a) | | 06/05/29 | | 6 month GBP | | 3.840 | | | (26,564 | ) |
| | 136 | (a) | | 06/05/29 | | 6 month GBP | | 3.843 | | | (11,131 | ) |
| $ | 606 | (a) | | 10/27/29 | | 3 month LIBOR | | 3.542 | | | (10,975 | ) |
| | 659 | (a) | | 10/27/29 | | 3 month LIBOR | | 3.558 | | | (12,337 | ) |
| | 1,673 | | | 10/27/29 | | 3.560% | | 3 month LIBOR | | | 17,849 | |
| | 284 | (a) | | 10/28/29 | | 3 month LIBOR | | 3.561 | | | (3,033 | ) |
| | 657 | (a) | | 10/31/29 | | 3 month LIBOR | | 3.569 | | | (12,612 | ) |
| | 1,315 | (a) | | 10/31/29 | | 3 month LIBOR | | 3.597 | | | (26,650 | ) |
| | 923 | (a) | | 11/04/29 | | 3 month LIBOR | | 3.522 | | | (16,012 | ) |
| | 687 | (a) | | 11/05/29 | | 3 month LIBOR | | 3.582 | | | (13,448 | ) |
| | 204 | (a) | | 12/11/33 | | 3 month LIBOR | | 4.721 | | | (24,498 | ) |
| | 307 | (a) | | 12/12/33 | | 3 month LIBOR | | 4.702 | | | (36,432 | ) |
| | 982 | (a) | | 02/07/34 | | 4.410 | | 3 month LIBOR | | | 43,641 | |
| | 3,394 | (a) | | 03/06/34 | | 4.347 | | 3 month LIBOR | | | 143,452 | |
| EUR | 113 | (a) | | 05/27/34 | | 6 month EURO | | 3.014 | | | (13,419 | ) |
| | 220 | (a) | | 05/30/34 | | 6 month EURO | | 2.980 | | | (25,391 | ) |
| | 219 | (a) | | 05/30/34 | | 6 month EURO | | 2.985 | | | (25,449 | ) |
| GBP | 197 | (a) | | 08/05/34 | | 3.443 | | 6 month GBP | | | 36,988 | |
| | 213 | (a) | | 08/06/34 | | 3.415 | | 6 month GBP | | | 38,767 | |
| $ | 357 | (a) | | 10/24/34 | | 3 month LIBOR | | 3.518 | | | (11,273 | ) |
| | 391 | (a) | | 10/29/34 | | 3.539 | | 3 month LIBOR | | | 5,940 | |
| | 938 | (a) | | 10/31/34 | | 3.590 | | 3 month LIBOR | | | 15,885 | |
| | 3,149 | (a) | | 11/05/34 | | 3.479 | | 3 month LIBOR | | | 41,562 | |
| | 1,538 | (a) | | 11/05/34 | | 3.484 | | 3 month LIBOR | | | 20,552 | |
| | 1,555 | (a) | | 11/05/34 | | 3.570 | | 3 month LIBOR | | | 25,144 | |
| | 2,089 | (a) | | 03/06/39 | | 3 month LIBOR | | 4.147 | | | (69,949 | ) |
| | 3,102 | (a) | | 04/27/39 | | 4.089 | | 3 month LIBOR | | | 272,604 | |
| | 231 | (a) | | 10/30/39 | | 3 month LIBOR | | 3.428 | | | (2,938 | ) |
| | 1,344 | (a) | | 11/03/39 | | 3 month LIBOR | | 3.390 | | | (15,632 | ) |
| | 2,791 | (a) | | 11/03/39 | | 3 month LIBOR | | 3.390 | | | (32,461 | ) |
| | 1,368 | (a) | | 11/06/39 | | 3 month LIBOR | | 3.455 | | | (18,460 | ) |
| GBP | 92 | | | 01/22/44 | | 6 month GBP | | 3.316 | | | (35,703 | ) |
| | 50 | | | 01/22/44 | | 6 month GBP | | 3.348 | | | (20,617 | ) |
| $ | 1,719 | (a) | | 04/27/44 | | 3 month LIBOR | | 4.020 | | | (188,768 | ) |
| EUR | 86 | (a) | | 08/07/44 | | 6 month EURO | | 2.465 | | | (7,036 | ) |
| | |
| 40 | | The accompanying notes are an integral part of these financial statements. |
GOLDMAN SACHS MULTI-MANAGER ALTERNATIVES FUND
|
| ADDITIONAL INVESTMENT INFORMATION (continued) |
CENTRALLY CLEARED INTEREST RATE SWAP CONTRACTS (continued)
| | | | | | | | | | | | |
Notional Amount (000s) | | | Termination Date | | Payments Received | | Payments Made | | Unrealized
Gain (Loss)* | |
| | | | | | | | | | | | |
| $ | 500 | (a) | | 10/24/44 | | 3.363% | | 3 month LIBOR | | $ | 10,904 | |
| | 211 | (a) | | 06/20/46 | | 3 month LIBOR | | 3.721% | | | (37,386 | ) |
| | TOTAL | | | | | | | | | $ | (1,721,253 | ) |
| | (a) | | Represents forward starting interest rate swaps whose effective dates of commencement of accruals and cash flows occur subsequent to December 31, 2014. |
| | * | | There are no upfront payments on the swap contracts (s), therefore the unrealized gain (loss) on the swap contracts is equal to their market value. |
OVER THE COUNTER CREDIT DEFAULT SWAP CONTRACTS
| | | | | | | | | | | | | | | | | | | | | | | | | | |
| | | | | | | | | | | | | | | | | Market Value | |
| Counterparty | | Referenced Obligation | | Notional Amount (000s) | | | Rates Received (Paid) | | | Termination Date | | | Credit Spread at December 31,
2014(b) | | | Upfront
Payments
Made (Received) | | | Unrealized
Gain (Loss) | |
Protection Purchased: | | | | | | | | | | | | | | | | | | | | | | | | | | |
Barclays Bank PLC | | Federal Republic of Brazil, 12.250%, 03/06/30 | | $ | 200 | | | | (1.000 | )% | | | 12/20/16 | | | | 1.177 | % | | $ | 2,211 | | | $ | (1,573 | ) |
| | Darden Restaurants, Inc., 6.000%, 08/15/35 | | | 80 | | | | (1.000 | ) | | | 06/20/17 | | | | 0.509 | | | | (783 | ) | | | (207 | ) |
| | Renault SA, 5.625%, 03/22/17 | | EUR | 200 | | | | (1.000 | ) | | | 03/20/18 | | | | 0.562 | | | | (172 | ) | | | (3,304 | ) |
| | Safeway, Inc., 7.250%, 02/01/31 | | $ | 150 | | | | (1.000 | ) | | | 03/20/18 | | | | 1.637 | | | | 1,104 | | | | 1,842 | |
| | Intesa Sanpaolo SPA, 4.750%, 06/15/17 | | EUR | 150 | | | | (3.000 | ) | | | 12/20/18 | | | | 0.733 | | | | (5,926 | ) | | | (10,420 | ) |
| | Ford Motor Credit Co. LLC, 5.000%, 05/15/18 | | $ | 70 | | | | (5.000 | ) | | | 03/20/19 | | | | 0.644 | | | | (10,698 | ) | | | (1,847 | ) |
| | Reed Elsevier Investment, 5.625%, 10/20/16 | | EUR | 150 | | | | (1.000 | ) | | | 03/20/19 | | | | 0.322 | | | | (4,168 | ) | | | (1,082 | ) |
| | Republic of South Africa, 5.500%, 03/09/20 | | $ | 500 | | | | (1.000 | ) | | | 03/20/19 | | | | 1.581 | | | | 26,871 | | | | (15,276 | ) |
| | Ford Motor Credit Co. LLC, 5.000%, 05/15/18 | | | 70 | | | | (5.000 | ) | | | 06/20/19 | | | | 0.699 | | | | (12,322 | ) | | | (731 | ) |
| | Republic of Korea, 4.875%, 09/22/14 | | | 500 | | | | (1.000 | ) | | | 09/20/19 | | | | 0.477 | | | | (9,727 | ) | | | (2,399 | ) |
Citibank NA (London) | | Radio Shack Corp., 6.750%, 05/15/19 | | | 20 | | | | (5.000 | ) | | | 06/20/16 | | | | 253.841 | | | | 9,082 | | | | 5,955 | |
| | Royal Bank of Scotland PLC, 6.934%, 04/09/18 | | EUR | 110 | | | | (5.000 | ) | | | 09/20/19 | | | | 0.718 | | | | (24,948 | ) | | | (1,931 | ) |
Credit Suisse International (London) | | Kingfisher PLC, 5.625%, 12/15/14 | | | 150 | | | | (1.000 | ) | | | 12/20/18 | | | | 0.484 | | | | (1,007 | ) | | | (2,758 | ) |
Deutsche Bank AG (London) | | Radio Shack Corp., 6.750%, 05/15/19 | | | 130 | | | | (5.000 | ) | | | 09/20/16 | | | | 236.709 | | | | 62,949 | | | | 35,666 | |
| | Astaldi Spa, 7.125%, 12/01/20 | | EUR | 260 | | | | (1.000 | ) | | | 09/20/16 | | | | 2.678 | | | | 2,750 | | | | 6,145 | |
| | Unisys, Corp., 6.250%, 08/15/17 | | $ | 100 | | | | (5.000 | ) | | | 09/20/17 | | | | 1.159 | | | | (8,758 | ) | | | (1,671 | ) |
| | |
| The accompanying notes are an integral part of these financial statements. | | 41 |
GOLDMAN SACHS MULTI-MANAGER ALTERNATIVES FUND
Schedule of Investments (continued)
December 31, 2014
|
| ADDITIONAL INVESTMENT INFORMATION (continued) |
OVER THE COUNTER CREDIT DEFAULT SWAP CONTRACTS (continued)
| | | | | | | | | | | | | | | | | | | | | | | | | | |
| | | | | | | | | | | | | | | | | Market Value | |
| Counterparty | | Referenced Obligation | | Notional Amount (000s) | | | Rates Received (Paid) | | | Termination Date | | | Credit Spread at December 31,
2014(b) | | | Upfront
Payments
Made (Received) | | | Unrealized
Gain (Loss) | |
Deutsche Bank AG (London) (continued) | | Sainsbury (J) PLC, 4.250%, 07/16/14 | | EUR | 500 | | | | (1.000 | )% | | | 03/20/18 | | | | 1.093 | % | | $ | (1,102 | ) | | $ | 2,728 | |
| | Staples, Inc., 2.750%, 01/12/18 | | $ | 210 | | | | (1.000 | ) | | | 09/20/18 | | | | 0.976 | | | | 4,397 | | | | (4,635 | ) |
| | Rite Aid Corp., 7.700%, 02/15/27 | | | 25 | | | | (5.000 | ) | | | 12/20/18 | | | | 2.058 | | | | (2,025 | ) | | | (801 | ) |
| | Republic of Korea, 4.875%, 09/22/14 | | | 50 | | | | (1.000 | ) | | | 12/20/18 | | | | 0.368 | | | | (532 | ) | | | (714 | ) |
| | JC Penney Corp., Inc., 6.375%, 10/15/36 | | | 25 | | | | (5.000 | ) | | | 03/20/19 | | | | 9.337 | | | | 4,988 | | | | (1,501 | ) |
| | Reed Elsevier Investment, 5.625%, 10/20/16 | | EUR | 150 | | | | (1.000 | ) | | | 03/20/19 | | | | 0.322 | | | | (4,163 | ) | | | (1,086 | ) |
| | Normura Holdings, Inc., 6.700%, 03/04/20 | | JPY | 40,000 | | | | (1.000 | ) | | | 03/20/19 | | | | 0.775 | | | | (330 | ) | | | (2,909 | ) |
| | Royal Bank of Scotland PLC, 6.934%, 04/09/18 | | EUR | 100 | | | | (5.000 | ) | | | 09/20/19 | | | | 0.718 | | | | (23,145 | ) | | | (1,291 | ) |
| | Lloyds Bank PLC, 5.750%, 07/09/25 | | | 200 | | | | (5.000 | ) | | | 09/20/19 | | | | 0.695 | | | | (49,609 | ) | | | 430 | |
JPMorgan Chase Bank (London) | | HCA, Inc., 8.000%, 10/01/18 | | $ | 115 | | | | (5.000 | ) | | | 06/20/19 | | | | 1.863 | | | | (14,445 | ) | | | (981 | ) |
Protection Sold: | | | | | | | | | | | | | | | | | | | | | | | | | | |
Barclays Bank PLC | | Safeway, Inc., 7.250%, 02/01/31 | | | 150 | | | | 1.000 | | | | 03/20/19 | | | | 2.487 | | | | (4,162 | ) | | | (4,625 | ) |
| | Darden Restaurants, Inc., 6.000%, 08/15/35 | | | 80 | | | | 1.000 | | | | 06/20/19 | | | | 1.236 | | | | (1,264 | ) | | | 475 | |
| | General Motors Co., 6.250%, 10/02/43 | | | 70 | | | | 5.000 | | | | 06/20/19 | | | | 1.376 | | | | 10,110 | | | | 753 | |
| | Darden Restaurants, Inc., 6.000%, 08/15/35 | | | 20 | | | | 1.000 | | | | 09/20/19 | | | | 1.357 | | | | (704 | ) | | | 388 | |
| | Renault SA, 5.625%, 03/22/17 | | EUR | 200 | | | | 1.000 | | | | 12/20/20 | | | | 1.211 | | | | (9,139 | ) | | | 6,256 | |
Citibank NA (London) | | Radio Shack Corp., 6.750%, 05/15/19 | | $ | 20 | | | | 5.000 | | | | 06/20/15 | | | | 420.129 | | | | (5,417 | ) | | | (8,555 | ) |
Deutsche Bank AG (London) | | Radio Shack Corp., 6.750%, 05/15/19 | | | 130 | | | | 5.000 | | | | 06/20/15 | | | | 420.129 | | | | (37,756 | ) | | | (53,059 | ) |
| | Sainsbury (J) PLC, 4.250%, 07/16/14 | | EUR | 500 | | | | 1.000 | | | | 03/20/19 | | | | 1.387 | | | | (4,504 | ) | | | (4,967 | ) |
| | Astaldi Spa, 7.125%, 12/01/20 | | | 260 | | | | 1.000 | | | | 09/20/19 | | | | 5.848 | | | | (30,699 | ) | | | (30,768 | ) |
| | Staples, Inc., 2.750%, 01/12/18 | | $ | 210 | | | | 1.000 | | | | 09/20/19 | | | | 1.423 | | | | (10,785 | ) | | | 6,850 | |
| | |
| 42 | | The accompanying notes are an integral part of these financial statements. |
GOLDMAN SACHS MULTI-MANAGER ALTERNATIVES FUND
|
| ADDITIONAL INVESTMENT INFORMATION (continued) |
OVER THE COUNTER CREDIT DEFAULT SWAP CONTRACTS (continued)
| | | | | | | | | | | | | | | | | | | | | | | | | | |
| | | | | | | | | | | | | | | | | Market Value | |
| Counterparty | | Referenced Obligation | | Notional Amount (000s) | | | Rates Received (Paid) | | | Termination Date | | | Credit Spread at December 31,
2014(b) | | | Upfront
Payments
Made (Received) | | | Unrealized
Gain (Loss) | |
Protection Sold: (continued) | | | | | | | | | | | | | | | | | | | | | | | | | | |
Deutsche Bank AG (London) (continued) | | Unisys, Corp., 6.250%, 08/15/17 | | $ | 100 | | | | 5.000 | % | | | 09/20/19 | | | | 2.233 | % | | $ | 8,836 | | | $ | 3,452 | |
JPMorgan Chase Bank (London) | | Darden Restaurants, Inc., 6.000%, 08/15/35 | | | 40 | | | | 1.000 | | | | 09/20/19 | | | | 1.357 | | | | (1,474 | ) | | | 843 | |
| TOTAL | | | | | | | | | | | | | | | | | | | | $ | (146,466 | ) | | $ | (87,308 | ) |
| | (b) | | Credit spread on the Referenced Obligation, together with the term of the swap contract, are indicators of payment/performance risk. The likelihood of a credit event occurring which would require a fund or counterparty to make or receive a payment or otherwise be required to perform under the swap contract is generally greater as the credit spread and the term of the swap contract increase. |
CENTRALLY CLEARED CREDIT DEFAULT SWAP CONTRACT
| | | | | | | | | | | | | | | | | | | | | | |
| | | | | | | | | | | | | | Market Value | |
| Referenced Obligation | | Notional
Amount
(000s) | | Rates Received
(Paid) | | | Termination
Date | | | Credit Spread at
December 31,
2014(b) | | | Upfront
Payments
Made (Received) | | | Unrealized
Gain (Loss) | |
Protection Purchased: | | | | | | | | | | | | | | | | | | | | | | |
Tranches of Commercial Mortgages-Backed Index BBB Series 6 | | $100 | | | (3.000 | )% | | | 06/20/63 | | | | 3.200 | % | | $ | 9,065 | | | $ | (9,477 | ) |
| | (b) | | Credit spread on the Referenced Obligation, together with the term of the swap contract, are indicators of payment/performance risk. The likelihood of a credit event occurring which would require a fund or counterparty to make or receive a payment or otherwise be required to perform under the swap contract is generally greater as the credit spread and the term of the swap contract increase. |
WRITTEN OPTIONS CONTRACTS — At December 31, 2014, the Fund had the following written options:
WRITTEN OPTION CURRENCY CONTRACTS
| | | | | | | | | | | | | | | | | | | | |
| Counterparty | | Description | | Notional Amount (000s) | | | Expiration Date | | Strike Price | | | Value | |
Barclays Bank PLC | | Put NOK/Call SEK Strike Price 1.096% | | | NOK | | | | 4,854 | | | 01/22/15 | | | 1.096 | % | | $ | (34,236 | ) |
| | Call NOK/Put SEK Strike Price 1.096% | | | | | | | 4,854 | | | 01/22/15 | | | 1.096 | | | | (707 | ) |
| | Put USD/Call JPY Strike Price 107.0% | | | $ | | | | 761 | | | 01/22/15 | | | 107.0 | | | | (11 | ) |
| | Call USD/Put JPY Strike Price 107.0% | | | | | | | 761 | | | 01/22/15 | | | 107.0 | | | | (81,387 | ) |
| | Put EUR/Call NOK Strike Price 8.419% | | | EUR | | | | 923 | | | 04/21/15 | | | 8.419 | | | | (3,964 | ) |
| | Call EUR/Put NOK Strike Price 8.419% | | | | | | | 923 | | | 04/21/15 | | | 8.419 | | | | (85,521 | ) |
| | Put AUD/Call USD Strike Price 0.860% | | | AUD | | | | 936 | | | 06/29/15 | | | 0.860 | | | | (54,878 | ) |
| | Call EUR/Put USD Strike Price 1.450% | | | EUR | | | | 515 | | | 04/22/15 | | | 1.450 | | | | (12 | ) |
Credit Suisse International (London) | | Put AUD/Call JPY Strike Price 97.75% | | | AUD | | | | 813 | | | 02/03/15 | | | 97.75 | | | | (8,769 | ) |
| | Call AUD/Put JPY Strike Price 97.75% | | | | | | | 813 | | | 02/03/15 | | | 97.75 | | | | (8,468 | ) |
Deutsche Bank AG (London) | | Put GBP/Call JPY Strike Price 171.9% | | | GBP | | | | 476 | | | 01/22/15 | | | 171.9 | | | | (72 | ) |
| | Call GBP/Put JPY Strike Price 171.9% | | | | | | | 476 | | | 01/22/15 | | | 171.9 | | | | (59,205 | ) |
JPMorgan Chase Bank (London) | | Put USD/Call JPY Strike Price 111.5% | | | $ | | | | 717 | | | 02/03/15 | | | 111.5 | | | | (320 | ) |
| | Call USD/Put JPY Strike Price 111.5% | | | | | | | 717 | | | 02/03/15 | | | 111.5 | | | | (50,253 | ) |
| | | Put AUD/Call USD Strike Price 0.900% | | | AUD | | | | 936 | | | 06/29/15 | | | 0.900 | | | | (88,182 | ) |
| TOTAL (Premiums Received $235,952) | | | | | 19,475 | | | | | | | | | $ | (475,985 | ) |
| | |
| The accompanying notes are an integral part of these financial statements. | | 43 |
GOLDMAN SACHS MULTI-MANAGER ALTERNATIVES FUND
Schedule of Investments (continued)
December 31, 2014
|
| ADDITIONAL INVESTMENT INFORMATION (continued) |
For the fiscal year ended December 31, 2014, the Fund had the following written option currency activities:
| | | | | | | | |
| | | Notional
Amount
(000s) | | | Premiums
Received | |
Contracts Outstanding December 31, 2013 | | | 3,660 | | | $ | 53,503 | |
Contracts Written | | | 94,460 | | | | 894,144 | |
Contracts Bought to Close | | | (42,354 | ) | | | (311,278 | ) |
Contracts Expired | | | (36,291 | ) | | | (400,417 | ) |
Contracts Outstanding December 31, 2014 | | | 19,475 | | | $ | 235,952 | |
INTEREST RATE SWAPTION CONTRACTS
| | | | | | | | | | | | | | | | | | | | |
| Counterparty | | Description | | Notional
Amount
(000s) | | | Expiration
Date | | Strike
Price | | | Value | |
Barclays Bank PLC | | Call - OTC EUR 6 month EURO Strike Price 2.750% | | | EUR | | | | 459 | | | 08/20/15 | | | 2.750 | % | | $ | (584 | ) |
Credit Suisse International (London) | | Put - USD 3 month LIBOR Strike Price 2.588% | | | $ | | | | 449 | | | 08/17/15 | | | 2.588 | | | | (12,536 | ) |
| | Call - OTC USD 3 month LIBOR Strike Price 4.500% | | | | | | | 183 | | | 09/25/15 | | | 4.500 | | | | (161 | ) |
Deutsche Bank AG | | Call - OTC USD 3 month LIBOR Strike Price 4.415% | | | | | | | 918 | | | 03/27/17 | | | 4.415 | | | | (3,770 | ) |
| | Call - OTC USD 3 month LIBOR Strike Price 5.135% | | | | | | | 3,308 | | | 03/05/19 | | | 5.135 | | | | (22,501 | ) |
Deutsche Bank AG (Frankfurt) | | Call - OTC EUR 6 month EURO Strike Price 0.750% | | | EUR | | | | 3,174 | | | 04/01/15 | | | 0.750 | | | | (5 | ) |
| | Call - OTC GBP 6 month GBP Strike Price 2.575% | | | GBP | | | | 2,303 | | | 06/15/15 | | | 2.575 | | | | (34 | ) |
| | Call - OTC GBP 6 month GBP Strike Price 3.100% | | | | | | | 339 | | | 08/07/15 | | | 3.100 | | | | (605 | ) |
| | Call - OTC GBP 6 month GBP Strike Price 4.000% | | | | | | | 183 | | | 09/26/17 | | | 4.000 | | | | (1,319 | ) |
Deutsche Bank AG (London) | | Call - OTC GBP 6 month GBP Strike Price 4.000% | | | | | | | 730 | | | 09/26/17 | | | 4.000 | | | | (5,271 | ) |
| | Put - OTC EUR 6 month EURO Strike Price 1.910% | | | EUR | | | | 478 | | | 09/02/24 | | | 1.910 | | | | (41,748 | ) |
JPMorgan Chase Bank (London) | | Call - OTC EUR 6 month EURO Strike Price 0.750% | | | | | | | 3,198 | | | 04/02/15 | | | 0.750 | | | | (6 | ) |
| | Call - OTC GBP 6 month GBP Strike Price 3.250% | | | GBP | | | | 461 | | | 06/16/15 | | | 3.250 | | | | (121 | ) |
| | Call - OTC GBP 6 month GBP Strike Price 3.250% | | | | | | | 691 | | | 06/16/15 | | | 3.250 | | | | (181 | ) |
| | Put - OTC USD 3 month LIBOR Strike Price 2.631% | | | $ | | | | 883 | | | 08/14/15 | | | 2.631 | | | | (26,731 | ) |
| | Put - OTC GBP 6 month GBP Strike Price 2.933% | | | GBP | | | | 501 | | | 05/31/16 | | | 2.933 | | | | (66,889 | ) |
| | Put - OTC GBP 6 month GBP Strike Price 2.400% | | | | | | | 479 | | | 10/30/17 | | | 2.400 | | | | (73,152 | ) |
| | Put - OTC GBP 6 month GBP Strike Price 2.600% | | | | | | | 479 | | | 10/30/17 | | | 2.600 | | | | (89,939 | ) |
| | |
| 44 | | The accompanying notes are an integral part of these financial statements. |
GOLDMAN SACHS MULTI-MANAGER ALTERNATIVES FUND
|
| ADDITIONAL INVESTMENT INFORMATION (continued) |
INTEREST RATE SWAPTION CONTRACTS (continued)
| | | | | | | | | | | | | | | | | | | | |
| Counterparty | | Description | | Notional
Amount
(000s) | | | Expiration
Date | | Strike
Price | | | Value | |
Morgan Stanley & Co. International PLC | | Call - OTC GBP 6 month GBP Strike Price 3.900% | | | GBP | | | | 451 | | | 02/09/15 | | | 3.900 | % | | $ | — | |
| | Call - OTC USD 3 month LIBOR Strike Price 5.035% | | | $ | | | | 244 | | | 11/19/15 | | | 5.035 | | | | (37 | ) |
| | Put - OTC GBP 6 month GBP Strike Price 2.928% | | | GBP | | | | 501 | | | 06/02/16 | | | 2.928 | | | | (66,576 | ) |
| | Put - OTC GBP 6 month GBP Strike Price 2.600% | | | | | | | 957 | | | 10/30/17 | | | 2.600 | | | | (179,877 | ) |
| | Put - OTC GBP 6 month GBP Strike Price 2.400% | | | | | | | 956 | | | 10/30/17 | | | 2.400 | | | | (146,305 | ) |
| | | Call - OTC USD 3 month LIBOR Strike Price 5.000% | | | $ | | | | 707 | | | 03/12/18 | | | 5.000 | | | | (7,268 | ) |
| TOTAL (Premium Received $585,049) | | | | | | | | | 23,032 | | | | | | | | | $ | (745,616 | ) |
For the fiscal year ended December 31, 2014, the Fund had the following interest rate swaptions activities:
| | | | | | | | |
| | | Notional
Amount
(000s) | | | Premiums
Received | |
Contracts Outstanding December 31, 2013 | | | 13,882 | | | $ | 193,768 | |
Contracts Written | | | 81,143 | | | | 883,491 | |
Contracts Bought to Close | | | (51,540 | ) | | | (384,340 | ) |
Contracts Expired | | | (20,453 | ) | | | (107,870 | ) |
Contracts Outstanding December 31, 2014 | | | 23,032 | | | $ | 585,049 | |
For the fiscal year ended December 31, 2014, the Fund had the following written equity options activities:
OPTIONS ON EQUITIES CONTRACTS
| | | | | | | | |
| | | Contracts | | | Premiums
Received | |
Contracts Outstanding December 31, 2013 | | | — | | | $ | — | |
Contracts Written | | | 1,578 | | | | 124,784 | |
Contracts Bought to Close | | | (1,156 | ) | | | (94,381 | ) |
Contracts Expired | | | (186 | ) | | | (11,276 | ) |
Contracts Assigned | | | (236 | ) | | | (19,127 | ) |
Contracts Outstanding December 31, 2014 | | | — | | | $ | — | |
| | |
| The accompanying notes are an integral part of these financial statements. | | 45 |
GOLDMAN SACHS MULTI-MANAGER ALTERNATIVES FUND
Schedule of Investments (continued)
December 31, 2014
|
| ADDITIONAL INVESTMENT INFORMATION (continued) |
For the fiscal year ended December 31, 2014, the Fund had the following written futures options activities:
OPTIONS ON FUTURES CONTRACTS
| | | | | | | | |
| | | Contracts | | | Premiums
Received | |
Contracts Outstanding December 31, 2013 | | | 35 | | | $ | 13,881 | |
Contracts Written | | | 946 | | | | 233,628 | |
Contracts Bought to Close | | | (543 | ) | | | (143,500 | ) |
Contracts Expired | | | (438 | ) | | | (104,009 | ) |
Contracts Outstanding December 31, 2014 | | | — | | | $ | — | |
JOINT REPURCHASE AGREEMENT ACCOUNT II — At December 31, 2014, the Fund had undivided interests in the Joint Repurchase Agreement Account II, with a maturity date of January 2, 2015, as follows:
| | | | |
| Principal Amount | | Maturity Value | | Collateral Allocation Value |
$ 247,800,000 | | $ 247,801,122 | | $ 253,538,769 |
REPURCHASE AGREEMENTS — At December 31, 2014, the Principal Amount of the Fund’s interest in the Joint Repurchase Agreement Account II was as follows:
| | | | | | | | |
| Counterparty | | Interest Rate | | | Principal
Amounts | |
BNP Paribas Securities Co. | | | 0.070 | % | | $ | 18,887,195 | |
Citigroup Global Markets, Inc. | | | 0.080 | | | | 151,097,561 | |
Merrill Lynch & Co., Inc. | | | 0.080 | | | | 21,153,659 | |
TD Securities (USA) LLC | | | 0.090 | | | | 56,661,585 | |
| TOTAL | | | | | | $ | 247,800,000 | |
At December 31, 2014, the Joint Repurchase Agreement Account II was fully collateralized by:
| | | | | | | | |
| Issuer | | Interest Rates | | | Maturity Dates | |
Federal Farm Credit Bank | | | 0.220% to 3.200 | % | | | 07/09/15 to 12/26/24 | |
Federal Home Loan Mortgage Corp. | | | 3.500 | | | | 10/01/25 | |
Federal National Mortgage Association | | | 0.875 to 5.500 | | | | 10/26/17 to 12/01/44 | |
Government National Mortgage Association | | | 3.000 to 3.500 | | | | 11/20/42 | |
Tennessee Valley Authority | | | 2.875 | | | | 09/15/24 | |
United States Treasury Notes | | | 1.625 to 2.625 | | | | 04/30/19 to 11/15/20 | |
| | |
| 46 | | The accompanying notes are an integral part of these financial statements. |
GOLDMAN SACHS MULTI-MANAGER ALTERNATIVES FUND
Statement of Assets and Liabilities
December 31, 2014
| | | | | | |
| | | | | | |
| | Assets: | |
| | Investments, at value (cost $625,120,448) | | $ | 634,419,117 | |
| | Repurchase agreement, at value which equals cost | | | 247,800,000 | |
| | Foreign currencies, at value (cost $204,547) | | | 201,177 | |
| | Unrealized gain on forward foreign currency exchange contracts | | | 2,657,741 | |
| | Unrealized gain on swap contracts | | | 601,010 | |
| | Receivables: | | | | |
| | Collateral on certain derivative contracts(a) | | | 22,238,500 | |
| | Investments sold | | | 6,966,297 | |
| | Investments sold on an extended settlement basis | | | 269,944 | |
| | Dividends and interest | | | 3,538,263 | |
| | Fund shares sold | | | 2,505,608 | |
| | Reimbursement from investment adviser | | | 732,064 | |
| | Due from broker | | | 518,370 | |
| | Variation margin on certain derivative contracts | | | 241,512 | |
| | Upfront payments made on swap contracts | | | 133,298 | |
| | Foreign tax reclaims | | | 19,725 | |
| | Other assets | | | 228,855 | |
| | Total assets | | | 923,071,481 | |
| | | | | | |
| | Liabilities: | | | | |
| | Due to custodian | | | 3,420,261 | |
| | Securities sold short, at value (proceeds received $75,552,989) | | | 78,388,822 | |
| | Written option contracts, at value (premium received $821,001) | | | 1,221,601 | |
| | Unrealized loss on forward foreign currency exchange contracts | | | 998,267 | |
| | Unrealized loss on swap contracts | | | 492,675 | |
| | Payables: | | | | |
| | Investments purchased | | | 3,391,003 | |
| | Investments purchased on an extended settlement basis | | | 2,062,257 | |
| | Fund shares redeemed | | | 3,061,680 | |
| | Management fees | | | 1,375,691 | |
| | Due to broker | | | 660,060 | |
| | Collateral on certain derivative contracts | | | 310,000 | |
| | Upfront payments received on swap contracts | | | 292,189 | |
| | Dividend expense payable on securities sold short | | | 230,191 | |
| | Distribution and Service fees and Transfer Agent fee | | | 107,676 | |
| | Accrued expenses | | | 937,466 | |
| | Total liabilities | | | 96,949,839 | |
| | | | | | |
| | Net Assets: | | | | |
| | Paid-in capital | | | 817,523,962 | |
| | Distributions in excess of net investment loss | | | (724,059 | ) |
| | Accumulated net realized gain | | | 1,357,485 | |
| | Net unrealized gain | | | 7,964,254 | |
| | | NET ASSETS | | $ | 826,121,642 | |
| | | Net Assets: | | | | |
| | | Class A | | $ | 116,593,384 | |
| | | Class C | | | 38,206,517 | |
| | | Institutional | | | 628,397,374 | |
| | | Class IR | | | 42,894,498 | |
| | | Class R | | | 29,869 | |
| | | Total Net Assets | | $ | 826,121,642 | |
| | | Shares Outstanding $0.001 par value (unlimited number of shares authorized): | | | | |
| | | Class A | | | 11,024,611 | |
| | | Class C | | | 3,649,428 | |
| | | Institutional | | | 59,208,493 | |
| | | Class IR | | | 4,047,863 | |
| | | Class R | | | 2,828 | |
| | | Net asset value, offering and redemption price per share:(b) | | | | |
| | | Class A | | | $10.58 | |
| | | Class C | | | 10.47 | |
| | | Institutional | | | 10.61 | |
| | | Class IR | | | 10.60 | |
| | | Class R | | | 10.56 | |
| | (a) | | Includes segregated cash of $8,309,256, $1,540,000, and $12,389,234 relating to initial margin requirements on futures, forwards, and short sales transactions. |
| | (b) | | Maximum public offering price per share for Class A Shares is $11.20. At redemption, Class C Shares may be subject to a contingent deferred sales charge, assessed on the amount equal to the lesser of the current net asset value or the original purchase price of the shares. |
| | |
| The accompanying notes are an integral part of these financial statements. | | 47 |
GOLDMAN SACHS MULTI-MANAGER ALTERNATIVES FUND
Statement of Operations
For the Fiscal Year Ended December 31, 2014
| | | | | | |
| | | | | | |
| | Investment income: | |
| | Interest | | $ | 8,391,469 | |
| | Dividends (net of foreign withholding taxes of $71,610) | | | 4,003,856 | |
| | Total investment income | | | 12,395,325 | |
| | | | | | |
| | Expenses: | | | | |
| | Management fees | | | 10,606,839 | |
| | Custody, accounting and administrative services | | | 997,479 | |
| | Dividend expense for securities sold short | | | 896,179 | |
| | Professional fees | | | 760,220 | |
| | Prime broker fees | | | 647,154 | |
| | Distribution and Service fees(a) | | | 415,704 | |
| | Transfer Agent fees(a) | | | 397,907 | |
| | Amortization of offering costs | | | 317,988 | |
| | Registration fees | | | 218,582 | |
| | Printing and mailing costs | | | 122,411 | |
| | Trustee fees | | | 75,718 | |
| | Other | | | 149,181 | |
| | Total expenses | | | 15,605,362 | |
| | Less — expense reductions | | | (2,009,234 | ) |
| | Net expenses | | | 13,596,128 | |
| | NET INVESTMENT LOSS | | | (1,200,803 | ) |
| | | | | | |
| | Realized and unrealized gain (loss): | |
| | Net realized gain (loss) from: | | | | |
| | Investments | | | 822,003 | |
| | Investments sold short | | | (3,137,718 | ) |
| | Futures contracts | | | 13,806,903 | |
| | Written options | | | 837,518 | |
| | Swap contracts | | | (209,905 | ) |
| | Forward foreign currency exchange contracts | | | 2,333,516 | |
| | Foreign currency transactions | | | 244,931 | |
| | Net change in unrealized gain (loss) on: | | | | |
| | Investments | | | 3,579,806 | |
| | Investments sold short | | | (2,835,833 | ) |
| | Futures contracts | | | 1,236,273 | |
| | Written options | | | (358,637 | ) |
| | Swap contracts | | | (1,572,894 | ) |
| | Forward foreign currency exchange contracts | | | 1,552,422 | |
| | Foreign currency transactions | | | (5,229 | ) |
| | Net realized and unrealized gain | | | 16,293,156 | |
| | NET INCREASE IN NET ASSETS RESULTING FROM OPERATIONS | | $ | 15,092,353 | |
| | (a) | | Class specific Distribution and Service, and Transfer Agent fees were as follows: |
| | | | | | | | | | | | | | | | | | | | | | | | | | | | | | |
| Distribution and Service Fees | | | Transfer Agent Fees | |
Class A | | | Class C | | | Class R | | | Class A | | | Class C | | | Institutional | | | Class IR | | | Class R | |
| $ | 214,743 | | | $ | 200,823 | | | $ | 138 | | | $ | 163,205 | | | $ | 38,156 | | | $ | 162,598 | | | $ | 33,895 | | | $ | 53 | |
| | |
| 48 | | The accompanying notes are an integral part of these financial statements. |
GOLDMAN SACHS MULTI-MANAGER ALTERNATIVES FUND
Statements of Changes in Net Assets
| | | | | | | | | | |
| | | | | For the
Fiscal Year Ended
December 31, 2014 | | | For the
Period Ended
December 31, 2013(a) | |
| | From operations: | | | | | | | | |
| | Net investment loss | | $ | (1,200,803 | ) | | $ | (143,235 | ) |
| | Net realized gain | | | 14,697,248 | | | | 1,274,851 | |
| | Net change in unrealized gain | | | 1,595,908 | | | | 6,368,346 | |
| | Net increase in net assets resulting from operations | | | 15,092,353 | | | | 7,499,962 | |
| | | | | | | | | | |
| | Distributions to shareholders: | | | | | | | | |
| | From net investment income | | | | | | | | |
| | Class A Shares | | | (394,559 | ) | | | — | |
| | Class C Shares | | | (17,831 | ) | | | — | |
| | Institutional Shares | | | (3,996,787 | ) | | | — | |
| | Class IR Shares | | | (251,033 | ) | | | — | |
| | Class R Shares | | | (9 | ) | | | — | |
| | From net realized gains | | | | | | | | |
| | Class A Shares | | | (1,229,026 | ) | | | (115,948 | ) |
| | Class C Shares | | | (408,632 | ) | | | (5,511 | ) |
| | Institutional Shares | | | (6,672,737 | ) | | | (731,502 | ) |
| | Class IR Shares | | | (324,476 | ) | | | (37,110 | ) |
| | Class R Shares | | | (326 | ) | | | (147 | ) |
| | Total distributions to shareholders | | | (13,295,416 | ) | | | (890,218 | ) |
| | | | | | | | | | |
| | From share transactions: | | | | | | | | |
| | Proceeds from sales of shares | | | 814,465,224 | | | | 189,767,210 | |
| | Reinvestment of distributions | | | 13,076,031 | | | | 835,259 | |
| | Cost of shares redeemed | | | (193,873,429 | ) | | | (6,655,334 | ) |
| | Net increase in net assets resulting from share transactions | | | 633,667,826 | | | | 183,947,135 | |
| | TOTAL INCREASE | | | 635,464,763 | | | | 190,556,879 | |
| | | | | | | | | | |
| | Net assets: | | | | | | | | |
| | Beginning of year | | | 190,656,879 | | | | 100,000 | |
| | End of year | | $ | 826,121,642 | | | $ | 190,656,879 | |
| | Distributions in excess of net investment income (loss) | | $ | (724,059 | ) | | $ | 199,876 | |
| | (a) | | Commenced operations on April 30, 2013. |
| | |
| The accompanying notes are an integral part of these financial statements. | | 49 |
GOLDMAN SACHS MULTI-MANAGER ALTERNATIVES FUND
Financial Highlights
Selected Data for a Share Outstanding Throughout Each Period
| | | | | | | | | | | | | | | | | | | | | | | | | | | | | | |
| | | | | | | | From
investment operations | | | Distributions
to shareholders | |
| | | Year - Share Class | | Net asset
value,
beginning
of period | | | Net
investment
loss(a) | | | Net realized
and unrealized
gain | | | Total from
investment
operations | | | From net
investment
income | | | From net
realized
gains | | | Total
distributions | |
| | FOR THE FISCAL YEAR ENDED DECEMBER 31, | |
| | 2014 - A | | $ | 10.46 | | | $ | (0.06 | ) | | $ | 0.33 | | | $ | 0.27 | | | $ | (0.03 | ) | | $ | (0.12 | ) | | $ | (0.15 | ) |
| | 2014 - C | | | 10.40 | | | | (0.14 | ) | | | 0.33 | | | | 0.19 | | | | — | (d) | | | (0.12 | ) | | | (0.12 | ) |
| | 2014 - Institutional | | | 10.49 | | | | (0.01 | ) | | | 0.31 | | | | 0.30 | | | | (0.06 | ) | | | (0.12 | ) | | | (0.18 | ) |
| | 2014 - IR | | | 10.48 | | | | (0.03 | ) | | | 0.33 | | | | 0.30 | | | | (0.06 | ) | | | (0.12 | ) | | | (0.18 | ) |
| | 2014 - R | | | 10.44 | | | | (0.07 | ) | | | 0.31 | | | | 0.24 | | | | — | (d) | | | (0.12 | ) | | | (0.12 | ) |
| | | | | | | | | | | | | | | | | | | | | | | | | | | | | | |
| | FOR THE PERIOD ENDED DECEMBER 31, | |
| | 2013 - A (Commenced April 30, 2013) | | | 10.00 | | | | (0.03 | ) | | | 0.55 | | | | 0.52 | | | | — | | | | (0.06 | ) | | | (0.06 | ) |
| | 2013 - C (Commenced April 30, 2013) | | | 10.00 | | | | (0.08 | ) | | | 0.54 | | | | 0.46 | | | | — | | | | (0.06 | ) | | | (0.06 | ) |
| | 2013 - Institutional (Commenced April 30, 2013) | | | 10.00 | | | | (0.01 | ) | | | 0.56 | | | | 0.55 | | | | — | | | | (0.06 | ) | | | (0.06 | ) |
| | 2013 - IR (Commenced April 30, 2013) | | | 10.00 | | | | (0.01 | ) | | | 0.55 | | | | 0.54 | | | | — | | | | (0.06 | ) | | | (0.06 | ) |
| | 2013 - R (Commenced April 30, 2013) | | | 10.00 | | | | (0.06 | ) | | | 0.56 | | | | 0.50 | | | | — | | | | (0.06 | ) | | | (0.06 | ) |
| | (a) | | Calculated based on the average shares outstanding methodology. |
| | (b) | | Assumes investment at the net asset value at the beginning of the period, reinvestment of all dividends and distributions, a complete redemption of the investment at the net asset value at the end of the period and no sales or redemption charges. Total returns would be reduced if a sales or redemption charge was taken into account. Returns do not reflect the deduction of taxes that a shareholder would pay on Fund distributions or the redemption of Fund shares. Total returns for periods less than one full year are not annualized. |
| | (c) | | The Fund’s portfolio turnover rate is calculated in accordance with regulatory requirements, without regard to transactions involving short term investments and certain derivatives. If such transactions were included, the Fund’s portfolio turnover rate may be higher. |
| | (d) | | Amount is less than $0.005 per share. |
| | |
| 50 | | The accompanying notes are an integral part of these financial statements. |
GOLDMAN SACHS MULTI-MANAGER ALTERNATIVES FUND
| | | | | | | | | | | | | | | | | | | | | | | | | | | | | | | | | | | | | | | | | | | | | | | | | | | | |
| | | | | | | | | | | | | | | | | | | | | | | | | | | | | | | | | | | | | | | | | | | | |
| | | Net asset
value, end
of period | | | | | Total
return(b) | | | | | Net assets,
end of
period
(in 000s) | | | | | Ratio of
net expenses
to average
net assets
(including
dividend
expenses for
securities
sold short) | | | | | Ratio of
net expenses
to average
net assets
(excluding
dividend
expenses for
securities
sold short) | | | | | Ratio of
total expenses
to average
net assets
(including
dividend
expenses for
securities
sold short) | | | | | Ratio of
total expenses
to average
net assets
(excluding
dividend
expenses for
securities
sold short) | | | | | Ratio of
net investment
loss
to average
net assets | | | | | Portfolio
turnover
rate(c) | |
| | | | | | | | | | | | | | | | | | | | | | | | | | | | | | | | | | | | | | | | | | | | | | | | | | | | |
| | $ | 10.58 | | | | | | 2.61 | % | | | | $ | 116,593 | | | | | | 2.85 | % | | | | | 2.68 | % | | | | | 3.23 | % | | | | | 3.06 | % | | | | | (0.53 | )% | | | | | 144 | % |
| | | 10.47 | | | | | | 1.84 | | | | | | 38,207 | | | | | | 3.64 | | | | | | 3.45 | | | | | | 3.99 | | | | | | 3.80 | | | | | | (1.33 | ) | | | | | 144 | |
| | | 10.61 | | | | | | 3.00 | | | | | | 628,397 | | | | | | 2.45 | | | | | | 2.28 | | | | | | 2.82 | | | | | | 2.65 | | | | | | (0.11 | ) | | | | | 144 | |
| | | 10.60 | | | | | | 2.85 | | | | | | 42,894 | | | | | | 2.62 | | | | | | 2.44 | | | | | | 3.06 | | | | | | 2.86 | | | | | | (0.27 | ) | | | | | 144 | |
| | | 10.56 | | | | | | 2.30 | | | | | | 30 | | | | | | 3.05 | | | | | | 2.91 | | | | | | 3.46 | | | | | | 3.32 | | | | | | (0.69 | ) | | | | | 144 | |
| | | | | | | | | | | | | | | | | | | | | | | | | | | | | | | | | | | | | | | | | | | | | | | | | | | | |
| | | | | | | | | | | | | | | | | | | | | | | | | | | | | | | | | | | | | | | | | | | | | | | | | | | | |
| | | 10.46 | | | | | | 5.20 | | | | | | 25,304 | | | | | | 2.55 | (e) | | | | | 2.55 | (e) | | | | | 3.88 | (e) | | | | | 3.88 | (e) | | | | | (0.42 | )(e) | | | | | 102 | |
| | | 10.40 | | | | | | 4.60 | | | | | | 1,427 | | | | | | 3.30 | (e) | | | | | 3.30 | (e) | | | | | 4.72 | (e) | | | | | 4.72 | (e) | | | | | (1.19 | )(e) | | | | | 102 | |
| | | 10.49 | | | | | | 5.40 | | | | | | 156,849 | | | | | | 2.15 | (e) | | | | | 2.15 | (e) | | | | | 3.64 | (e) | | | | | 3.64 | (e) | | | | | (0.17 | )(e) | | | | | 102 | |
| | | 10.48 | | | | | | 5.40 | | | | | | 7,051 | | | | | | 2.30 | (e) | | | | | 2.30 | (e) | | | | | 3.62 | (e) | | | | | 3.62 | (e) | | | | | (0.19 | )(e) | | | | | 102 | |
| | | 10.44 | | | | | | 5.00 | | | | | | 26 | | | | | | 2.79 | (e) | | | | | 2.79 | (e) | | | | | 4.36 | (e) | | | | | 4.36 | (e) | | | | | (0.90 | )(e) | | | | | 102 | |
| | |
| The accompanying notes are an integral part of these financial statements. | | 51 |
GOLDMAN SACHS MULTI-MANAGER ALTERNATIVES FUND
Notes to Financial Statements
December 31, 2014
Goldman Sachs Trust II (the “Trust”) is a Delaware statutory trust registered under the Investment Company Act of 1940, as amended (the “Act”), as an open-end management investment company. The Trust includes the Goldman Sachs Multi-Manager Alternatives Fund (the “Fund”). The Fund is a non-diversified portfolio and currently offers five classes of shares: Class A, Class C, Institutional, Class IR and Class R Shares. The Fund commenced operations on April 30, 2013.
Class A Shares are sold with a front-end sales charge of up to 5.50%. Class C Shares are sold with a contingent deferred sales charge (“CDSC”) of 1.00%, which is imposed on redemptions made within 12 months of purchase. Institutional, Class IR and Class R Shares are not subject to a sales charge.
Goldman Sachs Asset Management, L.P. (“GSAM”), an affiliate of Goldman, Sachs & Co. (“Goldman Sachs”), serves as investment adviser to the Fund pursuant to a management agreement (the “Agreement”) with the Trust. As of December 31, 2014, GSAM had sub-advisory agreements (the “Sub-Advisory Agreements”) for the Fund with Ares Capital Management II, LLC (“Ares”), Brigade Capital Management, L.P. (“Brigade”), Corsair Capital Management, L.P. (“Corsair”), First Pacific Advisors, LLC (“FPA”), GAM International Management Limited (“GAM”), Graham Capital Management, L.P. (“GCM”), Halcyon Liquid Strategies IC Management LP (“Halcyon”), Lateef Investment Management, L.P. (“Lateef”), Polaris Capital Management, LLC (“Polaris”) and Sirios Capital Management, L.P. (“Sirios”) (the “Underlying Managers”). Pursuant to the terms of the Sub-Advisory Agreements, the Underlying Managers are responsible for making investment decisions and managing the investments of the Fund. GSAM compensates the Underlying Managers directly in accordance with the terms of the Sub-Advisory Agreements. The Fund is not charged any separate or additional investment advisory fees by the Underlying Managers.
|
| 2. SIGNIFICANT ACCOUNTING POLICIES |
The financial statements have been prepared in accordance with accounting principles generally accepted in the United States of America (“GAAP”) and require management to make estimates and assumptions that may affect the reported amounts and disclosures. Actual results may differ from those estimates and assumptions.
A. Investment Valuation — The Fund’s valuation policy is to value investments at fair value.
B. Investment Income and Investments — Investment income includes interest income and dividend income, net of any foreign withholding taxes, less any amounts reclaimable. Interest income is accrued daily and adjusted for amortization of premiums and accretion of discounts. Dividend income is recognized on ex-dividend date or, for certain foreign securities, as soon as such information is obtained subsequent to the ex-dividend date. Investment transactions are reflected on trade date. Realized gains and losses are calculated using identified cost. Investment transactions are recorded on the following business day for daily net asset value (“NAV”) calculations. Any foreign capital gains tax is accrued daily based upon net unrealized gains, and is payable upon sale of such investments. Distributions received from the Funds’ investments in United States (“U.S.”) real estate investment trusts (“REITs”) may be characterized as ordinary income, net capital gain or a return of capital. A return of capital is recorded by the Funds as a reduction to the cost basis of the REIT.
52
GOLDMAN SACHS MULTI-MANAGER ALTERNATIVES FUND
|
| 2. SIGNIFICANT ACCOUNTING POLICIES (continued) |
For derivative contracts, realized gains and losses are recorded upon settlement of the contract. Upfront payments are made or received upon entering into a swap agreement and are reflected in the Statement of Assets and Liabilities. Upfront payments are recognized over the contract’s term/event as realized gains or losses, with the exception of forward starting interest rate swaps whose realized gains or losses are recognized from the effective start date. For securities with paydown provisions, principal payments received are treated as a proportionate reduction to the cost basis of the securities, and excess or shortfall amounts are recorded as income. For treasury inflation protected securities (“TIPS”), adjustments to principal due to inflation/deflation are reflected as increases/decreases to interest income with a corresponding adjustment to cost.
C. Class Allocations and Expenses — Investment income, realized and unrealized gain (loss), and non-class specific expenses of the Fund are allocated daily based upon the proportion of net assets of each class. Class specific expenses, where applicable, are borne by the respective share classes and include Distribution and Service, Transfer Agent and Service and Shareholder Administration fees. Non-class specific expenses directly incurred by the Fund are charged to the Fund, while such expenses incurred by the Trust are allocated across the Fund on a straight-line and/or pro-rata basis depending upon the nature of the expenses.
D. Offering Costs — Offering costs paid in connection with the offering of shares of the Fund were amortized on a straight-line basis over 12 months from the date of commencement of operations.
E. Federal Taxes and Distributions to Shareholders — It is the Fund’s policy to comply with the requirements of the Internal Revenue Code of 1986, as amended (the “Code”), applicable to regulated investment companies (mutual funds) and to distribute each year substantially all of its investment company taxable income and capital gains to its shareholders. Accordingly, the Fund is not required to make any provisions for the payment of federal income tax. Distributions to shareholders are recorded on the ex-dividend date. Income and capital gains distributions, if any, are declared and paid annually.
Net capital losses are carried forward to future fiscal years and may be used to the extent allowed by the Code to offset any future capital gains. Losses that are carried forward will retain their character as either short-term or long-term capital losses. Utilization of capital loss carryforwards will reduce the requirement of future capital gains distributions.
The characterization of distributions to shareholders for financial reporting purposes is determined in accordance with federal income tax rules, which may differ from GAAP. The source of the Fund’s distributions may be shown in the accompanying financial statements as either from net investment income, net realized gain or capital. Certain components of the Fund’s net assets on the Statement of Assets and Liabilities reflect permanent GAAP/tax differences based on the appropriate tax character.
F. Foreign Currency Translation — The accounting records and reporting currency of the Fund are maintained in U.S. dollars. Assets and liabilities denominated in foreign currencies are translated into U.S. dollars using the current exchange rates at the close of each business day. The effect of changes in foreign currency exchange rates on investments is included within net realized and unrealized gain (loss) on investments. Changes in the value of other assets and liabilities as a result of fluctuations in foreign exchange rates are included in the Statement of Operations within net change in unrealized gain (loss) on foreign currency transactions. Transactions denominated in foreign currencies are translated into U.S. dollars on the date the transaction occurred, the effects of which are included within net realized gain (loss) on foreign currency transactions.
53
GOLDMAN SACHS MULTI-MANAGER ALTERNATIVES FUND
Notes to Financial Statements (continued)
December 31, 2014
|
| 3. INVESTMENTS AND FAIR VALUE MEASUREMENTS |
The fair value of a financial instrument is the amount that would be received to sell an asset or paid to transfer a liability in an orderly transaction between market participants at the measurement date (i.e., the exit price). GAAP establishes a fair value hierarchy that prioritizes the inputs to valuation techniques used to measure fair value. The hierarchy gives the highest priority to unadjusted quoted prices in active markets for identical assets or liabilities (Level 1 measurements) and the lowest priority to unobservable inputs (Level 3 measurements). The levels used for classifying investments are not necessarily an indication of the risk associated with investing in these investments. The three levels of the fair value hierarchy are described below:
Level 1 — Unadjusted quoted prices in active markets that are accessible at the measurement date for identical, unrestricted assets or liabilities;
Level 2 — Quoted prices in markets that are not active or financial instruments for which significant inputs are observable (including, but not limited to, quoted prices for similar investments, interest rates, foreign exchange rates, volatility and credit spreads), either directly or indirectly;
Level 3 — Prices or valuations that require significant unobservable inputs (including GSAM’s assumptions in determining fair value measurement).
The Trustees have adopted Valuation Procedures that govern the valuation of the portfolio investments held by the Fund, including investments for which market quotations are not readily available. The Trustees have delegated to GSAM day-to-day responsibility for implementing and maintaining internal controls and procedures related to the valuation of the Fund’s portfolio investments. To assess the continuing appropriateness of pricing sources and methodologies, GSAM regularly performs price verification procedures and issues challenges as necessary to third party pricing vendors or brokers, and any differences are reviewed in accordance with the Valuation Procedures.
A. Level 1 and Level 2 Fair Value Investments — The valuation techniques and significant inputs used in determining the fair values for investments classified as Level 1 and Level 2 are as follows:
Equity Securities — Equity securities and investment companies traded on a U.S. securities exchange or the NASDAQ system, or those located on certain foreign exchanges, including but not limited to the Americas, are valued daily at their last sale price or official closing price on the principal exchange or system on which they are traded. If no sale occurs, equity securities and exchange traded investment companies are valued at the last bid price for long positions and at the last ask price for short positions. Investments in investment companies (other than those that are exchange traded) are valued at the NAV on the valuation date. To the extent these investments are actively traded, they are classified as Level 1 of the fair value hierarchy, otherwise they are generally classified as Level 2.
54
GOLDMAN SACHS MULTI-MANAGER ALTERNATIVES FUND
|
| 3. INVESTMENTS AND FAIR VALUE MEASUREMENTS (continued) |
Unlisted equity securities for which market quotations are available are valued at the last sale price on the valuation date, or if no sale occurs, at the last bid price. Securities traded on certain foreign securities exchanges are valued daily at fair value determined by an independent fair value service (if available) under Valuation Procedures approved by the Trustees and consistent with applicable regulatory guidance. The independent fair value service takes into account multiple factors including, but not limited to, movements in the securities markets, certain depositary receipts, futures contracts and foreign currency exchange rates that have occurred subsequent to the close of the foreign securities exchange. These investments are generally classified as Level 2 of the fair value hierarchy.
Debt Securities — Debt securities for which market quotations are readily available are valued daily on the basis of quotations supplied by dealers or an independent pricing service approved by the Trustees. The pricing services may use valuation models or matrix pricing, which consider: (i) yield or price with respect to bonds that are considered comparable in characteristics such as rating, interest rate and maturity date or (ii) quotations from securities dealers to determine current value. Short-term debt obligations that mature in sixty days or less and that do not exhibit signs of credit deterioration are valued at amortized cost, which approximates fair value. With the exception of treasury securities of G8 countries (not held in money market funds), which are generally classified as Level 1, these investments are generally classified as Level 2 of the fair value hierarchy.
i. Senior Term Loans — Senior term loans (“Loans”) are interests in amounts owed by corporate, governmental, or other borrowers to lenders or lending syndicates. Loans are arranged through private negotiations between the borrower and one or more financial institutions (“Lenders”). The Fund’s investments in Loans are in the form of either participations in Loans (“Participations”) or assignments of all or a portion of Loans from third parties (“Assignments”). With respect to Participations, the Fund has the right to receive payments of principal, interest and any fees to which it is entitled from the Lender selling the Participations and only upon receipt by the Lender of the payments from the borrower. The Fund generally has no right to enforce compliance by the borrower with the terms of the loan agreement with respect to Participations. Conversely, Assignments result in the Fund having a direct contractual relationship with the borrower, and the Fund may enforce compliance by the borrower with the terms of the loan agreement.
ii. Treasury Inflation Protected Securities — TIPS are treasury securities in which the principal amount is adjusted daily to keep pace with inflation, as measured by the U.S. Consumer Pricing Index for Urban Consumers. The repayment of the original bond principal upon maturity is guaranteed by the full faith and credit of the U.S. Government.
Securities Sold Short — Securities sold short are those securities which the Fund has sold but which it does not own. When the Fund sells a security it does not own, it must borrow the position that was sold and deliver it to the broker through which it made the short sale. In addition, cash and certain investments in securities may be used to collateralize the securities sold short. Each day the securities sold short transaction is open, the liability to replace the borrowed security is marked to market and an unrealized gain or loss is recorded. While the transaction remains open, the Fund may also incur expenses for any dividends or interest which will be paid to the lender of the securities as well as a fee to borrow the delivered security. During the term of the short sale, the value of the securities pledged as collateral on short sales is required to exceed the value of the securities sold short.
55
GOLDMAN SACHS MULTI-MANAGER ALTERNATIVES FUND
Notes to Financial Statements (continued)
December 31, 2014
|
| 3. INVESTMENTS AND FAIR VALUE MEASUREMENTS (continued) |
The following table sets forth the Fund’s net exposure for short securities that are subject to enforceable master netting arrangements or similar agreements as of December 31, 2014.
| | | | | | | | | | | | |
| Counterparty | | Securities
Sold Short(1) | | | Collateral Pledged(2) | | | Net Amount(3) | |
Deutsche Bank AG (4) | | $ | 12,920,518 | | | $ | (12,920,518 | ) | | $ | — | |
Deutsche Bank AG (4) | | | 33,808,293 | | | | (33,808,293 | ) | | | — | |
JP Morgan Chase Bank | | | 31,660,011 | | | | (31,660,011 | ) | | | — | |
Total | | $ | 78,388,822 | | | $ | (78,388,822 | ) | | $ | — | |
| (1) | | Gross amounts available for offset but not netted in the Statement of Assets and Liabilities. |
| (2) | | At December 31, 2014 the value of securities received pledged exceeded the value of the related securities sold short. |
| (3) | | Net amount represents the net amount due (to) from counterparty in the event of a default based on the contractual set-off rights under the agreement. Net amount excludes any over-collateralized amounts. |
| (4) | | Securities sold short were executed through separate Underlying Managers. |
Derivative Contracts — A derivative is an instrument whose value is derived from underlying assets, indices, reference rates or a combination of these factors. The Fund enters into derivative transactions to hedge against changes in interest rates, securities prices, and/or currency exchange rates, to increase total return, or to gain access to certain markets or attain exposure to other underliers.
Exchange-traded derivatives, including futures contracts, typically fall within Level 1 of the fair value hierarchy. Over-the-counter (“OTC”) and centrally cleared derivatives are valued using market transactions and other market evidence, including market-based inputs to models, calibration to market-clearing transactions, broker or dealer quotations, or other alternative pricing sources. Where models are used, the selection of a particular model to value OTC and centrally cleared derivatives depends upon the contractual terms of, and specific risks inherent in, the instrument, as well as the availability of pricing information in the market. Valuation models require a variety of inputs, including contractual terms, market prices, yield curves, credit curves, measures of volatility, voluntary and involuntary prepayment rates, loss severity rates and correlations of such inputs. For OTC and centrally cleared derivatives that trade in liquid markets, model inputs can generally be verified and model selection does not involve significant management judgment. OTC and centrally cleared derivatives are classified within Level 2 of the fair value hierarchy when significant inputs are corroborated by market evidence.
i. Forward Contracts — A forward contract is a contract between two parties to buy or sell an asset at a specified price on a future date. A forward contract settlement can occur on a cash or delivery basis. Forward contracts are marked-to-market daily using independent vendor prices, and the change in value, if any, is recorded as an unrealized gain or loss.
A forward foreign currency contract is a forward contract in which the Fund agrees to receive or deliver a fixed quantity of one currency for another, at a pre-determined price at a future date. All forward foreign currency exchange contracts are marked-to-market daily at the applicable forward rate. Non-deliverable forward foreign currency exchange contracts are settled with the counterparty in cash without the delivery of foreign currency.
ii. Futures Contracts — Futures contracts are contracts to buy or sell a standardized quantity of a specified commodity or security and are valued based on exchanged settlement prices or independent market quotes. Futures contracts are valued at the last settlement price, or in the absence of a sale, the last bid price for long positions and at the last ask price for short positions, at the end of each day on the board of trade or exchange upon which they are traded. Upon entering into a futures contract, the Fund deposits cash or securities in an account on behalf of the broker in an amount sufficient to meet the initial margin requirement. Subsequent payments are made or received by a Fund equal to the daily change in the contract value and are recorded as variation margin receivable or payable with a corresponding offset to unrealized gains or losses.
56
GOLDMAN SACHS MULTI-MANAGER ALTERNATIVES FUND
|
| 3. INVESTMENTS AND FAIR VALUE MEASUREMENTS (continued) |
iii. Options — When the Fund writes call or put options, an amount equal to the premium received is recorded as a liability and is subsequently marked-to-market to reflect the current value of the option written. Swaptions are options on interest rate swap contracts.
Upon the purchase of a call option or a put option by the Fund, the premium paid is recorded as an investment and subsequently marked-to-market to reflect the current value of the option. Certain options may be purchased with premiums to be determined on a future date. The premiums for these options are based upon implied volatility parameters at specified terms.
iv. Swap Contracts — Bilateral swap contracts are agreements in which the Fund and a counterparty agree to exchange periodic payments on a specified notional amount or make a net payment upon termination. Bilateral swap transactions are privately negotiated in the OTC market and payments are settled through direct payments between the Fund and the counterparty. By contrast, certain swap transactions are subject to mandatory central clearing. These swaps are executed through a derivatives clearing member (“DCM”), acting in an agency capacity, and submitted to a central counterparty (“CCP”) (“centrally cleared swaps”), in which case all payments are settled with the CCP through the DCM. Swaps are marked-to-market daily using pricing vendor quotations, counterparty or clearinghouse prices or model prices, and the change in value, if any, is recorded as an unrealized gain or loss. Upon entering into a swap contract, the Fund is required to satisfy an initial margin requirement by delivering cash or securities to the counterparty (or in some cases, segregated in a tri-party account on behalf of the counterparty), which can be adjusted by any mark-to-market gains or losses pursuant to bilateral or centrally cleared arrangements. For centrally cleared swaps the daily change in valuation, if any, is recorded as a receivable or payable for variation margin.
An interest rate swap is an agreement that obligates two parties to exchange a series of cash flows at specified intervals, based upon or calculated by reference to changes in interest rates on a specified notional principal amount. The payment flows are usually netted against each other, with the difference being paid by one party to the other.
A credit default swap is an agreement that involves one party (the buyer of protection) making a stream of payments to another party (the seller of protection) in exchange for the right to receive protection on a reference security or obligation, including a group of assets or exposure to the performance of an index. The Fund’s investment in credit default swaps may involve greater risks than if the Fund had invested in the referenced obligation directly. Credit events are contract specific but may include bankruptcy, failure to pay, restructuring and obligation acceleration. If the Fund buys protection through a credit default swap and no credit event occurs, its payments are limited to the periodic payments previously made to the counterparty. Upon the occurrence of a specified credit event, the Fund, as a buyer of credit protection, is entitled to receive an amount equal to the notional amount of the swap and deliver to the seller the defaulted reference obligation in a physically settled trade. The Fund may also receive a net settlement amount in the form of cash or securities equal to the notional amount of the swap reduced by the recovery value of the reference obligation in cash settled trade.
57
GOLDMAN SACHS MULTI-MANAGER ALTERNATIVES FUND
Notes to Financial Statements (continued)
December 31, 2014
|
| 3. INVESTMENTS AND FAIR VALUE MEASUREMENTS (continued) |
As a seller of protection, the Fund generally receives a payment stream throughout the term of the swap, provided that there is no credit event. In addition, if the Fund sells protection through a credit default swap, the Fund could suffer a loss because the value of the referenced obligation and the premium payments received may be less than the notional amount of the swap paid to the buyer of protection. Upon the occurrence of a specified credit event, the Fund, as a seller of credit protection, may be required to take possession of the defaulted reference obligation and pay the buyer an amount equal to the notional amount of the swap in a physically settled trade. The Fund may also pay a net settlement amount in the form of cash or securities equal to the notional amount of the swap reduced by the recovery value of the reference obligation in cash settled trade. Recovery values are at times established through the credit event auction process in which market participants are ensured that a transparent price has been set for the defaulted security or obligation. In addition, the Fund is entitled to a return of any assets, which have been pledged as collateral to the counterparty.
The maximum potential amount of future payments (undiscounted) that the Fund as seller of protection could be required to make under a credit default swap would be an amount equal to the notional amount of the agreement. These potential amounts would be partially offset by any recovery values of the respective referenced obligations or net amounts received from a settlement of a credit default swap for the same reference security or obligation where the Fund bought credit protection.
Short Term Investments — Short-term investments having a maturity of 60 days or less are generally valued at amortized cost which approximates fair market value. These investments are classified as Level 2 of the fair value hierarchy.
i. Repurchase Agreements — Repurchase agreements involve the purchase of securities subject to the seller’s agreement to repurchase the securities at a mutually agreed upon date and price, under the terms of a Master Repurchase Agreement (“MRA”). During the term of a repurchase agreement, the value of the underlying securities held as collateral on behalf of the Fund, including accrued interest is required to exceed the value of the repurchase agreement, including accrued interest. The gross value of repurchase agreements is included in the Statements of Assets and Liabilities for financial reporting purposes. The underlying securities for all repurchase agreements are held at the Fund’s custodian or designated sub-custodians under tri-party repurchase agreements.
An MRA governs transactions between the Fund and select counterparties. An MRA contains provisions for, among other things, initiation, income payments, events of default and maintenance of securities for repurchase agreements. An MRA also permits offsetting with collateral to create one single net payment in the event of default or similar events, including the bankruptcy or insolvency of a counterparty.
If the seller defaults, the Fund could suffer a loss to the extent that the proceeds from the sale of the underlying securities and other collateral held by the Fund are less than the repurchase price and the Fund’s costs associated with delay and enforcement of the repurchase agreement. In addition, in the event of default or insolvency of the seller, a court could determine that the Fund’s interest in the collateral is not enforceable, resulting in additional losses to the Fund.
58
GOLDMAN SACHS MULTI-MANAGER ALTERNATIVES FUND
|
| 3. INVESTMENTS AND FAIR VALUE MEASUREMENTS (continued) |
Pursuant to exemptive relief granted by the Securities and Exchange Commission (“SEC”) and terms and conditions contained therein, the Fund, together with other funds of the Trust and registered investment companies having management agreements with GSAM or its affiliates, may transfer uninvested cash into joint accounts, the daily aggregate balance of which is invested in one or more repurchase agreements. Under these joint accounts, the Fund maintains pro-rata credit exposure to the underlying repurchase agreements’ counterparties. With the exception of certain transaction fees, the Fund is not subject to any expenses in relation to these investments.
B. Level 3 Fair Value Investments — To the extent that the aforementioned significant inputs are unobservable, or if quotations are not readily available, or if GSAM believes that such quotations do not accurately reflect fair value, the fair value of the Fund’s investments may be determined under Valuation Procedures approved by the Trustees. GSAM, consistent with its procedures and applicable regulatory guidance, may make an adjustment to the most recent valuation prices of either domestic or foreign securities in light of significant events to reflect what it believes to be the fair value of the securities at the time of determining the Fund’s NAV. Significant events which could affect a large number of securities in a particular market may include, but are not limited to: significant fluctuations in U.S. or foreign markets; market dislocations; market disruptions; or unscheduled market closings. Significant events which could also affect a single issuer may include, but are not limited to: corporate actions such as reorganizations, mergers and buy-outs; ratings downgrades; and bankruptcies.
To the extent investments are valued using single source broker quotations obtained directly from the broker or passed through from third party pricing vendors, such investments are classified as Level 3 investments.
C. Fair Value Hierarchy — The following is a summary of the Fund’s investments and derivatives classified in the fair value hierarchy as of December 31, 2014:
| | | | | | | | | | | | |
| | | |
| Investment Type | | Level 1 | | | Level 2 | | | Level 3 | |
| Assets | | | | | | | | | | | | |
Common Stocks(a) | | | | | | | | | | | | |
Africa | | $ | — | | | $ | 2,870,297 | | | $ | — | |
Asia | | | 2,332,980 | | | | 6,550,459 | | | | — | |
Australia and Oceania | | | 808,400 | | | | — | | | | — | |
Europe | | | 21,708,800 | | | | 50,144,281 | | | | — | |
North America | | | 237,120,565 | | | | 22,798 | | | | — | |
Preferred Stocks | | | — | | | | 14,373,925 | | | | — | |
Fixed Income | | | | | | | | | | | | |
Corporate Obligations | | | — | | | | 158,268,485 | | | | 192,171 | |
U.S. Treasury Obligations and/or Other U.S. Government Agencies | | | 74,150,828 | | | | 98,423 | | | | — | |
Foreign Debt Obligations | | | 1,352,965 | | | | 5,368,279 | | | | — | |
Municipal Debt Obligations | | | — | | | | 3,062,426 | | | | — | |
Senior Term Loans | | | — | | | | 48,187,312 | | | | 5,269,607 | |
Warrants | | | — | | | | 518,981 | | | | — | |
Short-term Investments | | | — | | | | 247,800,000 | | | | — | |
| Total | | $ | 337,474,538 | | | $ | 537,265,666 | | | $ | 5,461,778 | |
59
GOLDMAN SACHS MULTI-MANAGER ALTERNATIVES FUND
Notes to Financial Statements (continued)
December 31, 2014
|
| 3. INVESTMENTS AND FAIR VALUE MEASUREMENTS (continued) |
| | | | | | | | | | | | |
| | | |
| Investment Type | | Level 1 | | | Level 2 | | | Level 3 | |
| Liabilities | | | | | | | | | | | | |
Common Stocks Sold Short and/or Other Equity Investments(a) | | | | | | | | | | | | |
Asia | | $ | (3,708,475 | ) | | $ | (1,970,667 | ) | | $ | — | |
Europe | | | (1,308,416 | ) | | | — | | | | — | |
North America | | | (71,401,264 | ) | | | — | | | | — | |
| Total | | $ | (76,418,155 | ) | | $ | (1,970,667 | ) | | $ | — | |
| | | |
| Derivative Type | | Level 1 | | | Level 2 | | | Level 3 | |
| Assets | | | | | | | | | | | | |
Options Purchased | | $ | 535,016 | | | $ | 1,482,119 | | | $ | — | |
Forward Foreign Currency Exchange Contracts(b) | | | — | | | | 2,657,741 | | | | — | |
Futures Contracts(b) | | | 3,154,127 | | | | — | | | | — | |
Interest Rate Swap Contracts(b) | | | — | | | | 2,630,401 | | | | — | |
Credit Default Swap Contracts(b) | | | — | | | | 71,783 | | | | — | |
| Total | | $ | 3,689,143 | | | $ | 6,842,044 | | | $ | — | |
| Liabilities | | | | | | | | | | | | |
Forward Foreign Currency Exchange Contracts(b) | | $ | — | | | $ | (998,267 | ) | | $ | — | |
Futures Contracts(b) | | | (1,288,367 | ) | | | — | | | | — | |
Interest Rate Swap Contracts(b) | | | — | | | | (4,156,011 | ) | | | — | |
Credit Default Swap Contracts(b) | | | — | | | | (168,568 | ) | | | — | |
Written Options Contracts | | | — | | | | (1,221,601 | ) | | | — | |
| Total | | $ | (1,288,367 | ) | | $ | (6,544,447 | ) | | $ | — | |
| (a) | | Amounts are disclosed by continent to highlight the impact of time zone differences between local market close and the calculation of net asset value. Security valuations are based on the principle exchange or system on which they are traded, which may differ from country of domicile. The Fund utilizes fair value model prices provided by an independent fair value service for international equities, resulting in a Level 2 classification. |
| (b) | | Amount shown represents unrealized gain (loss) at period end. |
For further information regarding security characteristics, see the Schedule of Investments.
60
GOLDMAN SACHS MULTI-MANAGER ALTERNATIVES FUND
|
| 4. INVESTMENTS IN DERIVATIVES |
The following table sets forth, by certain risk types, the gross value of derivative contracts as of December 31, 2014. These instruments were used to meet the Fund’s investment objectives and to obtain and/or manage exposure related to the risks below. The values in the table below exclude the effects of cash collateral received or posted pursuant to these derivative contracts, and therefore are not representative of the Fund’s net exposure.
| | | | | | | | | | | | |
| Risk | | Statement of Assets
and Liabilities | | Assets | | | Statement of Assets
and Liabilities | | Liabilities | |
Interest Rate | | Receivable for unrealized gain on swap
contracts; Variation margin on certain
derivative contracts; Investments,
at value | | $ | 6,020,127 | (a) | | Payable for unrealized loss on swap
contracts; Variation margin on certain
derivative contracts; Written options,
at value | | $ | (5,525,939) | (a)(b) |
Credit | | Receivable for unrealized gain on swap
contracts; Investments, at value | | | 236,794 | | | Payable for unrealized loss on swap
contracts; Variation margin on certain derivative contracts | | | (168,568) | (b) |
Currency | | Receivable for unrealized gain on forward
foreign currency exchange contracts;
Investments, at value | | | 3,183,611 | | | Payable for unrealized loss on forward
foreign currency exchange contracts;
Written options, at value | | | (1,474,252) | |
Equity | | Variation margin on certain derivative
contracts; Investments, at value | | | 1,090,655 | (a) | | Variation margin on certain derivative
contracts | | | (664,055) | (a) |
| Total | | | | $ | 10,531,187 | | | | | $ | (7,832,814) | |
| (a) | | Includes unrealized gain (loss) on futures contracts and centrally cleared swaps described in the Additional Investment Information sections of the Schedule of Investments. Only current day’s variation margin is reported within the Statement of Assets and Liabilities. |
| (b) | | Aggregate of amounts include $492,675, which represents the payments to be made pursuant to bilateral agreements should counterparties exercise their “right to terminate” provisions based on, among others, the Fund’s performance, its failure to pay on its obligations or failure to pledge collateral. The amount does not include incremental charges directly associated with the close-out of the agreements. It also does not reflect the fair value of any assets pledged as collateral which, through the daily margining process, substantially offsets the aforementioned amounts and for which the Fund is entitled to a full return. |
61
GOLDMAN SACHS MULTI-MANAGER ALTERNATIVES FUND
Notes to Financial Statements (continued)
December 31, 2014
|
| 4. INVESTMENTS IN DERIVATIVES (continued) |
The following table sets forth, by certain risk types, the Fund’s gains (losses) related to these derivatives and their indicative volumes For the fiscal year ended December 31, 2014. These gains (losses) should be considered in the context that these derivative contracts may have been executed to create investment opportunities and/or economically hedge certain investments, and accordingly, certain gains (losses) on such derivative contracts may offset certain (losses) gains attributable to investments. These gains (losses) are included in “Net realized gain (loss)” or “Net change in unrealized gain (loss)” on the Statements of Operations:
| | | | | | | | | | | | | | |
| Risk | | Statements of Operations | | Net
Realized
Gain (Loss) | | | Net Change in
Unrealized
Gain (Loss) | | | Average
Number of
Contracts(a) | |
| Interest rate | | Net realized gain (loss) from investments, futures contracts, swap contracts and written options/Net change in unrealized gain (loss) on investments, futures contracts, swap contracts and written options | | $ | 8,471,652 | | | $ | 247,856 | | | | 3,525 | |
| Credit | | Net realized gain (loss) from investments and swap contracts/Net change in unrealized gain (loss) on investments and swap contracts | | | (179,357 | ) | | | (69,671 | ) | | | 38 | |
| Currency | | Net realized gain (loss) from investments, forward foreign currency exchange contracts and written options/ Net change in unrealized gain (loss) on investments, forward foreign currency exchange contracts and written options | | | 2,435,815 | | | | 1,519,668 | | | | 717 | |
| Equity | | Net realized gain (loss) from investments, futures contracts and written options/ Net change in unrealized gain (loss) on investment and futures contracts | | | 5,401,763 | | | | (995,302 | ) | | | 971 | |
| Total | | | | $ | 16,129,873 | | | $ | 702,551 | | | | 5,251 | |
| (a) | | Average number of contracts is based on the average of month end balances for the fiscal year ended December 31, 2014. |
In order to better define its contractual rights and to secure rights that will help the Fund mitigate its counterparty risk, the Fund may enter into an International Swaps and Derivatives Association, Inc. Master Agreement (“ISDA Master Agreement”) or similar agreement with its derivatives’ counterparties. An ISDA Master Agreement is a bilateral agreement between the Fund and a counterparty that governs OTC derivatives, including foreign exchange contracts, and typically contains, among other things, collateral posting terms and netting provisions in the event of a default and/or termination event. The provisions of the ISDA Master Agreement typically permit a single net payment in the event of a default (close-out netting) or similar event, including the bankruptcy or insolvency of the counterparty.
62
GOLDMAN SACHS MULTI-MANAGER ALTERNATIVES FUND
|
| 4. INVESTMENTS IN DERIVATIVES (continued) |
Collateral and margin requirements differ between exchange traded derivatives and OTC derivatives. Margin requirements are established by the broker or clearing house for exchange-traded and centrally cleared derivatives (financial futures contracts, options and centrally cleared swaps) pursuant to governing agreements for those instrument types. Brokers can ask for margin in excess of the minimum in certain circumstances. Collateral terms are contract-specific for OTC derivatives (foreign currency exchange contracts, and certain options and swaps). For derivatives traded under an ISDA Master Agreement, the collateral requirements are typically calculated by netting the marked to market amount for each transaction under such agreement and comparing that amount to the value of any collateral currently pledged by the Fund and the counterparty. Additionally, the Fund may be required to post initial margin to the counterparty, the terms of which would be outlined in the confirmation of the OTC transaction.
For financial reporting purposes, cash collateral that has been pledged to cover obligations of the Fund and cash collateral received from the counterparty, if any, is reported separately on the Statement of Assets and Liabilities as receivables/payables for collateral on certain derivative contracts. Non-cash collateral pledged by the Fund, if any, is noted in the Schedule of Investments. Generally, the amount of collateral due from or to a counterparty must exceed a minimum transfer amount threshold before a transfer is required to be made. To the extent amounts due to the Fund from its counterparties are not fully collateralized, contractually or otherwise, the Fund bears the risk of loss from counterparty nonperformance. The Fund attempts to mitigate counterparty risk by only entering into agreements with counterparties that it believes to be of good standing and by monitoring the financial stability of those counterparties.
Additionally, the netting of assets and liabilities and the offsetting of collateral pledged or received are based on contractual netting/set-off provisions in the ISDA Master Agreement or similar agreements. However, in the event of a default or insolvency of a counterparty, a court could determine that such rights are not enforceable due the restrictions or prohibitions against the right of setoff that may be imposed due to a particular jurisdiction’s bankruptcy or insolvency laws.
63
GOLDMAN SACHS MULTI-MANAGER ALTERNATIVES FUND
Notes to Financial Statements (continued)
December 31, 2014
|
| 4. INVESTMENTS IN DERIVATIVES (continued) |
The following table sets forth the Fund’s net exposure for derivative instruments that are subject to enforceable master netting arrangements or similar agreements as of December 31, 2014:
| | | | | | | | | | | | | | | | | | | | | | | | | | | | | | | | | | | | | | | | | | | | |
| | | Derivative Assets(1) | | | Derivative Liabilities(1) | | | | |
| Counterparty | | Options
Purchased | | | Swaps | | | Forward
Currency
Contracts | | | Total | | | Swaps | | | Forward
Currency
Contracts | | | Options Written | | | Total | | | Net Derivative
Asset
(Liabilities) | | | Collateral
(Received)
Pledged(1) | | | Net
Amount(2) | |
Bank of America Securities LLC | | $ | — | | | $ | 56,766 | | | $ | — | | | $ | 56,766 | | | $ | — | | | $ | — | | | $ | — | | | $ | — | | | $ | 56,766 | | | $ | — | | | $ | 56,766 | |
Barclays Bank PLC | | | 371,193 | | | | 104,777 | | | | 148,986 | | | | 624,956 | | | | (156,471 | ) | | | (97,290 | ) | | | (261,300 | ) | | | (515,061 | ) | | | 109,895 | | | | — | | | | 109,895 | |
Citibank NA (London) | | | — | | | | 5,955 | | | | — | | | | 5,955 | | | | (10,486 | ) | | | — | | | | — | | | | (10,486 | ) | | | (4,531 | ) | | | — | | | | (4,531 | ) |
Credit Suisse International (London) | | | 107,052 | | | | 175,401 | | | | 326,449 | | | | 608,902 | | | | (2,758 | ) | | | (124,295 | ) | | | (29,934 | ) | | | (156,987 | ) | | | 451,915 | | | | — | | | | 451,915 | |
Deutsche Bank AG | | | 26,153 | | | | 49,881 | | | | — | | | | 76,034 | | | | (34,841 | ) | | | — | | | | (26,271 | ) | | | (61,112 | ) | | | 14,922 | | | | (14,922 | ) | | | — | |
Deutsche Bank AG (Frankfurt) | | | 76,818 | | | | 80,608 | | | | — | | | | 157,426 | | | | (153,972 | ) | | | — | | | | (1,963 | ) | | | (155,935 | ) | | | 1,491 | | | | — | | | | 1,491 | |
Deutsche Bank AG (London)(3) | | | 117,808 | | | | 126,779 | | | | 212,567 | | | | 457,154 | | | | (103,962 | ) | | | (65,603 | ) | | | (106,296 | ) | | | (275,861 | ) | | | 181,293 | | | | — | | | | 181,293 | |
Deutsche Bank AG (London)(3) | | | — | | | | — | | | | 266,560 | | | | 266,560 | | | | — | | | | (99,305 | ) | | | — | | | | (99,305 | ) | | | 167,255 | | | | — | | | | 167,255 | |
JPMorgan Chase Bank (London) | | | 439,045 | | | | 843 | | | | 158,280 | | | | 598,168 | | | | (30,185 | ) | | | (226,680 | ) | | | (395,774 | ) | | | (652,639 | ) | | | (54,471 | ) | | | — | | | | (54,471 | ) |
Merrill Lynch & Co., Inc. | | | — | | | | — | | | | 1,345,219 | | | | 1,345,219 | | | | — | | | | (368,091 | ) | | | — | | | | (368,091 | ) | | | 977,128 | | | | — | | | | 977,128 | |
Morgan Stanley & Co. International PLC | | | 344,050 | | | | — | | | | 199,518 | | | | 543,568 | | | | — | | | | (17,003 | ) | | | (400,063 | ) | | | (417,066 | ) | | | 126,502 | | | | — | | | | 126,502 | |
State Street Bank and Trust | | | — | | | | — | | | | 162 | | | | 162 | | | | — | | | | — | | | | — | | | | — | | | | 162 | | | | — | | | | 162 | |
Total | | $ | 1,482,119 | | | $ | 601,010 | | | $ | 2,657,741 | | | $ | 4,740,870 | | | $ | (492,675 | ) | | $ | (998,267 | ) | | $ | (1,221,601 | ) | | $ | (2,712,543 | ) | | $ | 2,028,327 | | | $ | (14,922 | ) | | $ | 2,013,405 | |
| (1) | | Gross amounts available for offset but not netted in the Statement of Assets and Liabilities. |
| (2) | | Net amount represents the net amount due (to) from counterparty in the event of a default based on the contractual set-off rights under the agreement. Net amount excludes any over-collateralized amounts. |
| (3) | | Derivative contracts were executed through separate Underlying Managers. |
64
GOLDMAN SACHS MULTI-MANAGER ALTERNATIVES FUND
|
| 5. AGREEMENTS AND AFFILIATED TRANSACTIONS |
A. Management Agreement — Under the Agreement, GSAM manages the Fund, subject to the general supervision of the Trustees.
As compensation for the services rendered pursuant to the Agreement, the assumption of the expenses related thereto and administration of the Fund’s business affairs, including providing facilities, GSAM is entitled to a management fee, accrued daily and paid monthly, equal to an annual percentage rate of the Fund’s average daily net assets.
For the fiscal year ended December 31, 2014, the contractual and effective net management fee with GSAM were at the following rates:
| | | | | | | | | | | | | | | | | | |
| Contractual Management Rate | |
First
$2 billion | | | Next
$3 billion | | | Next
$3 billion | | | Over
$8 billion | | | Effective
Management
Rate | |
| | 2.00% | | | | 1.80% | | | | 1.71% | | | | 1.68% | | | | 2.00% | |
B. Distribution and Service Plans — The Trust, on behalf of the Fund, has adopted Distribution and Service Plans (the “Plans”). Under the Plans, Goldman Sachs, which serves as distributor (the “Distributor”), is entitled to a fee accrued daily and paid monthly, for distribution services and personal and account maintenance services, which may then be paid by Goldman Sachs to authorized dealers, at the following annual rates calculated on the Fund’s average daily net assets of each respective share class:
| | | | | | | | | | | | |
| | | Distribution and Service Plan Rates | |
| | | Class A* | | | Class C | | | Class R* | |
Distribution Plan | | | 0.25 | % | | | 0.75 | % | | | 0.50 | % |
Service Plan | | | — | | | | 0.25 | | | | — | |
| * | | With respect to Class A and Class R Shares, the Distributor at its discretion may use compensation for distribution services paid under the Distribution Plan to compensate service organizations for personal and account maintenance services and expenses as long as such total compensation does not exceed the maximum cap on “service fees” imposed by the Financial Industry Regulatory Authority. |
C. Distribution Agreement — Goldman Sachs, as Distributor of the shares of the Fund pursuant to a Distribution Agreement, may retain a portion of the Class A front end sales charge and Class C Shares’ CDSC. During the fiscal year ended December 31, 2014, Goldman Sachs advised that it retained $54,176 of Class A Shares and $297 of Class C Shares.
D. Transfer Agency Agreement — Goldman Sachs also serves as the transfer agent of the Fund for a fee pursuant to the Transfer Agency Agreement. The fees charged for such transfer agency services are accrued daily and paid monthly at annual rates as follows: 0.19% of the average daily net assets of Class A, Class C, Class IR and Class R Shares and 0.04% of the average daily net assets of Institutional Shares.
65
GOLDMAN SACHS MULTI-MANAGER ALTERNATIVES FUND
Notes to Financial Statements (continued)
December 31, 2014
|
| 5. AGREEMENTS AND AFFILIATED TRANSACTIONS (continued) |
E. Other Expense Agreements and Affiliated Transactions — GSAM has agreed to limit certain “Other Expenses” of the Fund (excluding transfer agency fees and expenses, service fees and shareholder administration fees (as applicable), taxes, dividend and interest payments on securities sold short, brokerage fees, shareholder meeting, litigation, indemnification and extraordinary expenses) to the extent such expenses exceed, on an annual basis, a percentage rate of the average daily net assets of the Fund. Such Other Expense reimbursements, if any, are accrued daily and paid monthly. In addition, the Fund is not obligated to reimburse GSAM for prior fiscal year expense reimbursements, if any. The Other Expense limitations as an annual percentage rate of average daily net assets for the Fund are 0.114% and the total annual operating expenses (excluding acquired fund fees and expenses, taxes, dividend and interest payments on securities sold short, interest, brokerage fees, shareholder meeting, litigation, indemnification and extraordinary expenses) of Class A, Class R, Institutional, Class IR and Class R Shares are limited to 2.55%, 3.30%, 2.15%, 2.30% and 2.80%, respectively. The Other Expense limitations and the total operating expense limitation agreement will remain in place through at least April 30, 2015, and prior to such date GSAM may not terminate the arrangements without the approval of the Trustees. In addition, the Fund has entered into certain offset arrangements with the custodian and the transfer agent, which may result in a reduction of the Fund’s expenses and are received irrespective of the application of the “Other Expense” limitations described above. Such Other Expense reimbursements, if any, are accrued daily and paid monthly and are disclosed in the Statement of Operations.
F. Other Transactions with Affiliates — For the fiscal year ended December 31, 2014, Goldman Sachs earned $539 in brokerage commissions from portfolio transactions.
As of December 31, 2014, the Goldman Sachs Group (“GSG”), Inc. was the beneficial owner of approximately 90% of Class R Shares of the Fund.
G. Line of Credit Facility — As of December 31, 2014, the Fund participated in a $1,080,000,000 committed, unsecured revolving line of credit facility (the “facility”) together with other funds of the Trust and registered investment companies having management agreements with GSAM or its affiliates (“Other Borrowers”). Pursuant to the terms of the facility, the Fund and Other Borrowers could increase the credit amount by an additional $120,000,000, for a total of up to $1,200,000,000. This facility is to be used solely for temporary or emergency purposes, which may include the funding of redemptions. The interest rate on borrowings is based on the federal funds rate. The facility also requires a fee to be paid by the Fund based on the amount of the commitment that has not been utilized. For the fiscal year ended December 31, 2014, the Fund did not have any borrowings under the facility.
|
| 6. PORTFOLIO SECURITIES TRANSACTIONS |
The cost of purchases and proceeds from sales and maturities of long-term securities for the fiscal year ended December 31, 2014, were $963,744,416 and $540,234,298, respectively. Included in these amounts are the cost of purchases and proceeds from sales and maturities of U.S. Government and agency obligations in the amount of $21,618,897 and $2,580,854, respectively.
66
GOLDMAN SACHS MULTI-MANAGER ALTERNATIVES FUND
The tax character of distributions paid during the fiscal year ended December 31, 2014 was as follows:
| | | | |
Distributions paid from: | | | | |
Ordinary income | | $ | 8,291,430 | |
Net long-term capital gains | | | 5,003,986 | |
Total taxable distributions | | $ | 13,295,416 | |
The tax character of distributions paid during the period ended December 31, 2013 was as follows:
| | | | |
Distributions paid from: | | | | |
Ordinary income | | $ | 820,693 | |
Net long-term capital gains | | | 69,525 | |
Total taxable distributions | | $ | 890,218 | |
As of December 31, 2014, the components of accumulated earnings (losses) on a tax basis were as follows:
| | | | |
Undistributed ordinary income — net | | $ | 6,445,879 | |
Undistributed long-term capital gains | | | 1,980,246 | |
Total undistributed earnings | | $ | 8,426,125 | |
Timing Differences (Straddle Loss Deferral) | | | (1,772,286 | ) |
Unrealized gains — net | | | 1,943,841 | |
Total accumulated earnings — net | | $ | 8,597,680 | |
67
GOLDMAN SACHS MULTI-MANAGER ALTERNATIVES FUND
Notes to Financial Statements (continued)
December 31, 2014
|
| 7. TAX INFORMATION (continued) |
As of December 31, 2014, the Fund’s aggregate security unrealized gains and losses based on cost for U.S. federal income tax purposes were as follows:
| | | | |
Tax Cost | | $ | 875,769,529 | |
Gross unrealized gain | | | 30,963,711 | |
Gross unrealized loss | | | (24,514,123 | ) |
Net unrealized gain | | $ | 6,449,588 | |
Net unrealized loss on other investments | | | (4,505,747 | ) |
Net unrealized security gain | | $ | 1,943,841 | |
The difference between GAAP-basis and tax-basis unrealized gains (losses) is attributable primarily to wash sales, net mark to market gains (losses) on regulated futures contracts, options contracts, foreign currency contracts and differences in the tax treatment of partnership investments and passive foreign investment company investments.
In order to present certain components of the Fund’s capital accounts on a tax-basis, certain reclassifications have been recorded to the Fund’s accounts. These reclassifications have no impact on the net asset value of the Fund and result primarily from certain non-deductible expenses, and differences in the tax treatment of foreign currency transactions and passive foreign investment company investments.
| | | | | | | | | | |
| Paid-in-Capital | | | Accumulated
Net Realized
Gain (Loss) | | | Undistributed
Net Investment
Income (Loss) | |
| $ | (167,886 | ) | | $ | (4,769,201 | ) | | $ | 4,937,087 | |
GSAM has reviewed the Fund’s tax positions for all open tax years (the current and prior year, as applicable) and has concluded that no provision for income tax is required in the Fund’s financial statements. Such open tax years remain subject to examination and adjustment by tax authorities.
The Fund’s risks include, but are not limited to, the following:
Foreign Custody Risk — A Fund that invests in foreign securities may hold such securities and foreign currency with foreign banks, agents, and securities depositories appointed by the Fund’s custodian (each a “Foreign Custodian”). Some foreign custodians may be recently organized or new to the foreign custody business. In some countries, Foreign Custodians may be subject to little or no regulatory oversight or independent evaluation of their operations. Further, the laws of certain countries may place limitations on a Fund’s ability to recover its assets if a Foreign Custodian enters bankruptcy. Investments in emerging markets may be subject to greater custody risks than investments in more developed markets. Custody services in emerging market countries are very often undeveloped and may be considerably less well regulated than in more developed countries, and thus may not afford the same level of investor protection as would apply in developed countries.
68
GOLDMAN SACHS MULTI-MANAGER ALTERNATIVES FUND
|
| 8. OTHER RISKS (continued) |
Investments in Other Investment Companies — As a shareholder of another investment company, including an exchange traded fund (“ETF”), a Fund will directly bear its proportionate share of any net management fees and other expenses paid by such other investment companies, in addition to the fees and expenses regularly borne by the Fund. ETFs are subject to risks that do not apply to conventional mutual funds, including but not limited to the following: (i) the market price of the ETF’s shares may trade at a premium or a discount to their NAV; and (ii) an active trading market for an ETF’s shares may not develop or be maintained.
Large Shareholder Transactions Risk — The Fund may experience adverse effects when certain large shareholders, such as other funds, institutional investors (including those trading by use of non-discretionary mathematical formulas), financial intermediaries (who may make investment decisions on behalf of underlying clients and/or include the Fund in their investment model), individuals, accounts and Goldman Sachs affiliates, purchase or redeem large amounts of shares of the Fund. Such large shareholder redemptions may cause the Fund to sell portfolio securities at times when it would not otherwise do so, which may negatively impact the Fund’s NAV and liquidity. Similarly, large Fund share purchases may adversely affect the Fund’s performance to the extent that the Fund is delayed in investing new cash and is required to maintain a larger cash position than it ordinarily would. These transactions may also accelerate the realization of taxable income to shareholders if such sales of investments resulted in gains, and may also increase transaction costs. In addition, a large redemption could result in the Fund’s current expenses being allocated over a smaller asset base, leading to an increase in the Fund’s expense ratio.
Liquidity Risk — The Fund may make investments that are illiquid or that may become less liquid in response to market developments or adverse investor perceptions. Illiquid investments may be more difficult to value. Liquidity risk may also refer to the risk that a Fund will not be able to pay redemption proceeds within the allowable time period because of unusual market conditions, an unusually high volume of redemption requests, or other reasons. To meet redemption requests, a Fund may be forced to sell investments at an unfavorable time and/or under unfavorable conditions. Liquidity risk may be the result of, among other things, the reduced number and capacity of traditional market participants to make a market in fixed income securities or the lack of an active market. The potential for liquidity risk may be magnified by a rising interest rate environment or other circumstances where investor redemptions from fixed income mutual funds may be higher than normal, potentially causing increased supply in the market due to selling activity.
Market and Credit Risks — In the normal course of business, the Fund trades financial instruments and enters into financial transactions where risk of potential loss exists due to changes in the market (market risk). Additionally, the Fund may also be exposed to credit risk in the event that an issuer fails to perform or that an institution or entity with which the Fund has unsettled or open transactions defaults.
Investing in foreign markets may involve special risks and considerations not typically associated with investing in the U.S. Foreign securities may be subject to risk of loss because of more or less foreign government regulation, less public information and less economic, political and social stability in the countries in which the Funds invest. Loss may also result from the imposition of exchange controls, confiscations and other government restrictions by the United States or other governments, or from problems in registration, settlement or custody. Foreign risk also involves the risk of negative foreign currency rate fluctuations, which may cause the value of securities denominated in such foreign currency (or other instruments through which the Funds have exposure to foreign currencies) to decline in value. Currency exchange rates may fluctuate significantly over short periods of time. To the extent that the Funds also invest in securities of issuers located in emerging markets, these risks may be more pronounced.
69
GOLDMAN SACHS MULTI-MANAGER ALTERNATIVES FUND
Notes to Financial Statements (continued)
December 31, 2014
|
| 8. OTHER RISKS (continued) |
Multi-Manager Approach Risk — The Fund’s performance depends on the ability of the Investment Adviser in selecting, overseeing, and allocating Fund assets to the Underlying Managers. The Underlying Managers’ investment styles may not always be complementary. The Fund’s multi-manager approach may result in the Fund investing a significant percentage of its assets in certain types of investments, which could be beneficial or detrimental to the Fund’s performance depending on the performance of those investments and the overall market environment. The Fund’s Underlying Managers may underperform the market generally or underperform other investment managers that could have been selected for the Fund. Because the Fund’s Underlying Managers may trade with counterparties, prime brokers, clearing brokers or futures commission merchants on terms that are different than those on which the Investment Adviser would trade, and because each Underlying Manager applies its own risk analysis in evaluating potential counterparties for the Fund, the Fund may be subject to greater counterparty risk than if it were managed directly by the Investment Adviser.
Non-Diversification Risk — The Fund is non-diversified, meaning that it is permitted to invest a larger percentage of its assets in fewer issuers than diversified mutual funds. Thus, the Fund may be more susceptible to adverse developments affecting any single issuer held in its portfolio, and may be more susceptible to greater losses because of these developments.
Short Position Risk — The Fund may enter into a short position through a futures contract, an option or swap agreement or through short sales of any instrument that the Fund may purchase for investment. Taking short positions involves leverage of the Fund’s assets and presents various risks. If the value of the underlying instrument or market in which the Fund has taken a short position increases, then the Fund will incur a loss equal to the increase in value from the time that the short position was entered into plus any related dividend payments or other fees. Taking short positions involves the risk that losses may be disproportionate, may exceed the amount invested, and may be unlimited.
Under the Trust’s organizational documents, its Trustees, officers, employees and agents are indemnified, to the extent permitted by the Act and state law, against certain liabilities that may arise out of performance of their duties to the Fund. Additionally, in the course of business, the Fund enters into contracts that contain a variety of indemnification clauses. The Fund’s maximum exposure under these arrangements is unknown, as this would involve future claims that may be made against the Fund that have not yet occurred. However, GSAM believes the risk of loss under these arrangements to be remote.
Change in Fiscal Year End — On December 18, 2014, the Board of Trustees approved a change of the Fund’s fiscal year end from December 31 to October 31, effective October 1, 2015.
Subsequent events after the Statement of Assets and Liabilities date have been evaluated through the date the financial statements were issued. GSAM has concluded that there is no impact requiring adjustment or disclosure in the financial statements.
70
GOLDMAN SACHS MULTI-MANAGER ALTERNATIVES FUND
|
| 12. SUMMARY OF SHARE TRANSACTIONS |
Share activity is as follows:
| | | | | | | | | | | | | | | | |
| | | For the
Fiscal Year Ended
December 31, 2014 | | | For the
Period Ended
December 31, 2013(a) | |
| | | Shares | | | Dollars | | | Shares | | | Dollars | |
| | | | |
| Class A Shares | | | | | | | | | | | | | | | | |
Shares sold | | | 13,799,884 | | | $ | 145,642,660 | | | | 2,574,479 | | | $ | 26,146,713 | |
Reinvestment of distributions | | | 152,647 | | | | 1,623,453 | | | | 11,345 | | | | 115,948 | |
Shares redeemed | | | (5,347,199 | ) | | | (57,009,892 | ) | | | (166,545 | ) | | | (1,675,241 | ) |
| | | | 8,605,332 | | | | 90,256,221 | | | | 2,419,279 | | | | 24,587,420 | |
| Class C Shares | | | | | | | | | | | | | | | | |
Shares sold | | | 3,684,774 | | | | 38,725,099 | | | | 137,252 | | | | 1,398,013 | |
Reinvestment of distributions | | | 40,521 | | | | 426,232 | | | | 542 | | | | 5,510 | |
Shares redeemed | | | (213,013 | ) | | | (2,241,283 | ) | | | (648 | ) | | | (6,542 | ) |
| | | | 3,512,282 | | | | 36,910,048 | | | | 137,146 | | | | 1,396,981 | |
| Institutional Shares | | | | | | | | | | | | | | | | |
Shares sold | | | 55,682,719 | | | | 592,272,239 | | | | 15,329,295 | | | | 154,985,312 | |
Reinvestment of distributions | | | 978,521 | | | | 10,450,502 | | | | 66,069 | | | | 676,544 | |
Shares redeemed | | | (12,411,833 | ) | | | (131,983,495 | ) | | | (446,278 | ) | | | (4,519,402 | ) |
| | | | 44,249,407 | | | | 470,739,246 | | | | 14,949,086 | | | | 151,142,454 | |
| Class IR Shares | | | | | | | | | | | | | | | | |
Shares sold | | | 3,568,379 | | | | 37,822,254 | | | | 713,636 | | | | 7,212,162 | |
Reinvestment of distributions | | | 54,013 | | | | 575,509 | | | | 3,628 | | | | 37,110 | |
Shares redeemed | | | (247,339 | ) | | | (2,638,759 | ) | | | (44,454 | ) | | | (454,139 | ) |
| | | | 3,375,053 | | | | 35,759,004 | | | | 672,810 | | | | 6,795,133 | |
| Class R Shares | | | | | | | | | | | | | | | | |
Shares sold | | | 282 | | | | 2,972 | | | | 2,501 | | | | 25,010 | |
Reinvestment of distributions | | | 32 | | | | 335 | | | | 14 | | | | 147 | |
Shares redeemed | | | — | | | | — | | | | (1 | ) | | | (10 | ) |
| | | | 314 | | | | 3,307 | | | | 2,514 | | | | 25,147 | |
NET INCREASE | | | 59,742,388 | | | $ | 633,667,826 | | | | 18,180,835 | | | $ | 183,947,135 | |
| (a) | | Commenced operations on April 30, 2013. |
71
Report of Independent Registered Public
Accounting Firm
To the Board of Trustees and Shareholders of
Goldman Sachs Trust II — Goldman Sachs Multi-Manager Alternatives Fund:
In our opinion, the accompanying statement of assets and liabilities, including the schedule of investments, and the related statements of operations and of changes in net assets and the financial highlights present fairly, in all material respects, the financial position of Goldman Sachs Multi-Manager Alternatives Fund (the “Fund”), a portfolio of Goldman Sachs Trust II, at December 31, 2014, the results of its operations, the changes in its net assets and the financial highlights for each of the periods indicated, in conformity with accounting principles generally accepted in the United States of America. These financial statements and financial highlights (hereafter referred to as “financial statements”) are the responsibility of the Fund’s management. Our responsibility is to express an opinion on these financial statements based on our audits. We conducted our audits of these financial statements in accordance with the standards of the Public Company Accounting Oversight Board (United States). Those standards require that we plan and perform the audit to obtain reasonable assurance about whether the financial statements are free of material misstatement. An audit includes examining, on a test basis, evidence supporting the amounts and disclosures in the financial statements, assessing the accounting principles used and significant estimates made by management, and evaluating the overall financial statement presentation. We believe that our audits, which included confirmation of securities at December 31, 2014, by correspondence with the custodian, brokers, and the application of alternative auditing procedures where securities purchased confirmations had not been received, provides a reasonable basis for our opinion.
PricewaterhouseCoopers LLP
Boston, Massachusetts
February 26, 2015
72
GOLDMAN SACHS MULTI-MANAGER ALTERNATIVES FUND
| | |
Fund Expenses — Six Month Period Ended December 31, 2014 (Unaudited) | | |
As a shareholder of Class A, Class C, Institutional, Class IR or Class R Shares of the Fund, you incur two types of costs: (1) transaction costs, including sales charges on purchase payments (with respect to Class A Shares), contingent deferred sales charges on redemptions (with respect to Class C Shares), and (2) ongoing costs, including management fees; distribution and service (12b-1) fees (with respect to Class A, Class C and Class R Shares); and other Fund expenses. This Example is intended to help you understand your ongoing costs (in dollars) of investing in Class A, Class C, Institutional, Class IR or Class R Shares of the Fund and to compare these costs with the ongoing costs of investing in other mutual funds.
The Example is based on an investment of $1,000 invested at the beginning of the period and held for the entire period from July 1, 2014 through December 31, 2014.
Actual Expenses — The first line under each share class in the table below provides information about actual account values and actual expenses. You may use the information in this line, together with the amount you invested, to estimate the expenses that you paid over the period. Simply divide your account value by $1,000 (for example, an $8,600 account value divided by $1,000=8.6), then multiply the result by the number in the first line under the heading entitled “Expenses Paid” to estimate the expenses you paid on your account during this period.
Hypothetical Example for Comparison Purposes — The second line under each share class in the table below provides information about hypothetical account values and hypothetical expenses based on the Fund’s actual net expense ratios and an assumed rate of return of 5% per year before expenses, which is not the Fund’s actual return. The hypothetical account values and expenses may not be used to estimate the actual ending account balance or expenses you paid for the period. You may use this information to compare the ongoing costs of investing in the Fund and other funds. To do so, compare this 5% hypothetical example with the 5% hypothetical examples that appear in the shareholder reports of the other funds.
Please note that the expenses shown in the table are meant to highlight your ongoing costs only and do not reflect any transactional costs, such as sales charges, redemption fees, or exchange fees. Therefore, the second line of the table is useful in comparing ongoing costs only, and will not help you determine the relative total costs of owning different funds. In addition, if these transactional costs were included, your costs would have been higher.
| | | | | | | | | | | | |
| | | Multi-Manager Alternatives Fund | |
| Share Class | | Beginning
Account Value
7/1/14 | | | Ending
Account Value
12/31/14 | | | Expenses Paid for the
6 months ended
12/31/14* | |
| Class A | | | | | | | | | | | | |
Actual | | $ | 1,000.00 | | | $ | 994.70 | | | $ | 14.63 | |
Hypothetical 5% return | | | 1,000.00 | | | | 1,010.54 | + | | | 14.75 | |
| Class C | | | | | | | | | | | | |
Actual | | | 1,000.00 | | | | 990.80 | | | | 18.42 | |
Hypothetical 5% return | | | 1,000.00 | | | | 1,006.70 | + | | | 18.56 | |
| Institutional | | | | | | | | | | | | |
Actual | | | 1,000.00 | | | | 996.70 | | | | 12.68 | |
Hypothetical 5% return | | | 1,000.00 | | | | 1,012.50 | + | | | 12.78 | |
| Class IR | | | | | | | | | | | | |
Actual | | | 1,000.00 | | | | 996.20 | | | | 13.53 | |
Hypothetical 5% return | | | 1,000.00 | | | | 1,011.64 | + | | | 13.64 | |
| Class R | | | | | | | | | | | | |
Actual | | | 1,000.00 | | | | 993.50 | | | | 15.78 | |
Hypothetical 5% return | | | 1,000.00 | | | | 1,009.38 | + | | | 15.90 | |
| | * | | Expenses for each share class are calculated using the Fund’s annualized net expense ratio for each class, which represents the ongoing expenses as a percentage of net assets for the six months ended December 31, 2014. Expenses are calculated by multiplying the annualized net expense ratio by the average account value for the period; then multiplying the result by the number of days in the most recent fiscal half year; and then dividing that result by the number of days in the fiscal year. The annualized net expense ratios for the period were as follows: | |
| | | | | | | | | | | | | | | | | | | | |
| Fund | | Class A | | | Class C | | | Institutional | | | Class IR | | | Class R | |
Multi-Manager Alternatives | | | 2.91 | % | | | 3.67 | % | | | 2.52 | % | | | 2.69 | % | | | 3.14 | % |
| | + | | Hypothetical expenses are based on the Fund’s actual annualized net expense ratios and an assumed rate of return of 5% per year before expenses. | |
73
GOLDMAN SACHS MULTI-MANAGER ALTERNATIVES FUND
Statement Regarding Basis for Approval of Management Agreement and Sub-Advisory Agreements (Unaudited)
Background
The Goldman Sachs Multi-Manager Alternatives Fund (the “Fund”) is an investment portfolio of Goldman Sachs Trust II (the “Trust”). The Board of Trustees (the “Board” or the “Trustees”) oversees the management of the Trust and reviews the investment performance and expenses of the Fund at regularly scheduled meetings held during the year. The Fund employs a “manager of managers” structure, whereby Goldman Sachs Asset Management, L.P. (the “Investment Adviser”) is responsible for selecting sub-advisers (subject to Board approval), allocating the Fund’s assets among them, and overseeing their day-to-day management of Fund assets The Board determines annually whether to approve the continuance of the Trust’s investment management agreement with the Investment Adviser (the “Management Agreement”) on behalf of the Fund.
The Management Agreement was most recently approved for continuation until August 30, 2015 by the Board, including the “Independent Trustees, at a meeting held on August 6, 2014 (the “Annual Meeting”). At the Annual Meeting, the Board also considered the sub-advisory agreements between the Investment Adviser, on behalf of the Fund, and each of Ares Capital Management II LLC (“Ares”), Brigade Capital Management, LP (“Brigade”), Graham Capital Management, L.P. (“Graham”), and Lateef Investment Management L.P. (“Lateef”) (collectively, the “Designated Sub-Advisers” and together with all sub-advisers serving from time to time, the Sub-Advisers).
The review process undertaken by the Trustees spans the course of the year. To assist the Trustees in their deliberations, the Trustees have established a Contract Review Committee (the “Committee”), comprised of the Independent Trustees. The Committee held two meetings over the course of the year since the Management Agreement was last approved. At those Committee meetings, regularly scheduled Board or other committee meetings and/or the Annual Meeting, the Board, or the Independent Trustees, as applicable, considered matters relating to the Management Agreement, including:
| | (a) | | the nature and quality of the advisory, administrative and other services provided to the Fund by the Investment Adviser and its affiliates, including information about: |
| | (i) | | the structure, staff and capabilities of the Investment Adviser and the portfolio management team managing the Fund; |
| | (ii) | | the groups within the Investment Adviser and its affiliates that support the portfolio management team or provide other types of necessary services, including fund services groups (e.g., accounting and financial reporting, tax, shareholder services and operations), controls and risk management groups (e.g., legal, compliance, valuation oversight, credit risk management, internal audit, compliance testing, market risk analysis, finance and strategy and central funding), sales and distribution support groups and others (e.g., information technology and training); |
| | (iii) | | trends in headcount; |
74
GOLDMAN SACHS MULTI-MANAGER ALTERNATIVES FUND
Statement Regarding Basis for Approval of Management Agreement and Sub-Advisory Agreements (Unaudited) (continued)
| | (iv) | | the Investment Adviser’s financial resources and ability to hire and retain talented personnel and strengthen its operations; and |
| | (v) | | the parent company’s support of the Investment Adviser and its mutual fund business, as expressed by the firm’s senior management; |
| | (b) | | information on the investment performance of the Fund, including comparisons to the performance of similar mutual funds, as provided by a third party mutual fund data provider engaged as part of the contract review process (the “Outside Data Provider”), and a benchmark performance index, and general investment outlooks in the markets in which the Fund invests; |
| | (c) | | the terms of the Management Agreement and agreements with affiliated service providers entered into by the Trust on behalf of the Fund; |
| | (d) | | expense information for the Fund, including the relative management fee and expense levels of the Fund as compared to those of comparable funds managed by other advisers, as provided by the Outside Data Provider; |
| | (e) | | with respect to the extensive investment performance and expense comparison data provided by the Outside Data Provider, its processes in producing that data for the Fund; |
| | (f) | | the undertaking of the Investment Adviser to limit certain expenses of the Fund that exceed a specified level; |
| | (g) | | information relating to the profitability of the Management Agreement and the transfer agency and distribution and service arrangements of the Fund and the Trust as a whole to the Investment Adviser and its affiliates; |
| | (h) | | whether the Fund’s existing management fee schedule adequately addressed any economies of scale; |
| | (i) | | a summary of the “fall-out” benefits derived by the Investment Adviser and its affiliates from their relationships with the Fund, including the fees received by the Investment Adviser’s affiliates from the Fund for transfer agency, portfolio trading, distribution and other services; |
| | (j) | | a summary of potential benefits derived by the Fund as a result of its relationship with the Investment Adviser; |
| | (k) | | information regarding commissions paid by the Fund and broker oversight, and other information regarding portfolio trading and how the Investment Adviser carries out its duty to seek best execution; |
| | (l) | | portfolio manager ownership of Fund shares; the manner in which portfolio manager compensation is determined; and the number and types of accounts managed by the portfolio managers; |
75
GOLDMAN SACHS MULTI-MANAGER ALTERNATIVES FUND
Statement Regarding Basis for Approval of Management Agreement and Sub-Advisory Agreements (Unaudited) (continued)
| | (m) | | the nature and quality of the services provided to the Fund by service providers that are not affiliated with Goldman, Sachs & Co. (“Goldman Sachs”) (including the Sub-Advisers), and the Investment Adviser’s general oversight and evaluation (including reports on due diligence) of those service providers as part of the administration services provided under the Management Agreement; and |
| | (n) | | the Investment Adviser’s processes and policies addressing various types of potential conflicts of interest; its approach to risk management; the annual review of the effectiveness of the Fund’s compliance program; and periodic compliance reports. |
The Trustees also received an overview of the Fund’s distribution arrangements. They received information regarding the Fund’s assets, share purchase and redemption activity and the payment of Rule 12b-1 distribution and service fees by the Fund. Information was also provided to the Trustees relating to revenue sharing payments made by and services provided by the Investment Adviser and its affiliates to intermediaries that promote the sale, distribution and/or servicing of Fund shares.
In evaluating the Management Agreement at the Annual Meeting, the Trustees relied upon their knowledge, resulting from their meetings and other interactions throughout the year, of the Investment Adviser, its affiliates, their services, the Fund, and the other investment companies for which the Trustees have responsibility. In conjunction with these meetings, the Trustees received written materials and oral presentations on the topics covered, and were advised by their independent legal counsel regarding their responsibilities and other regulatory requirements related to the approval and continuation of mutual fund investment management agreements under applicable law. In addition, the Investment Adviser and its affiliates provided the Independent Trustees with a written response to a formal request for information sent on behalf of the Independent Trustees by their independent legal counsel. During the course of their deliberations, the Independent Trustees met in executive sessions with their independent legal counsel, without representatives of the Investment Adviser or its affiliates present. The Independent Trustees also discussed the broad range of other investment choices that are available to Fund investors, including the availability of comparable funds managed by other advisers.
Nature, Extent and Quality of the Services Provided Under the Management Agreement
With regard to the nature, extent, and quality of the services provided by the Investment Adviser, the Trustees considered both the investment advisory services and non-advisory services that are provided to the Fund by the Investment Adviser and its affiliates. The Trustees noted that the Fund employs a “manager of managers” structure, whereby the Investment Adviser is responsible for selecting sub-advisers (subject to Board approval), allocating the Fund’s assets among them, and overseeing the sub-advisers’ day-to-day management of the Fund’s assets. They noted the experience and capabilities of the Investment Adviser’s portfolio management team dedicated to sub-adviser oversight. They also noted the significant resources that the Investment Adviser devotes to risk management. The Trustees concluded that the Investment Adviser continued to commit substantial financial and operational resources to the Fund and expressed confidence that the Investment Adviser would continue to do so in the future. The Trustees also recognized that the Investment Adviser had made significant commitments to address regulatory compliance requirements applicable to the Fund and the Investment Adviser. The Trustees also reviewed the sub-adviser oversight process that the Investment Adviser had employed, which included areas such as investment analytics, risk management and compliance. The Trustees concluded that the Investment Adviser’s management of the Fund likely would benefit the Fund and its shareholders.
76
GOLDMAN SACHS MULTI-MANAGER ALTERNATIVES FUND
Statement Regarding Basis for Approval of Management Agreement and Sub-Advisory Agreements (Unaudited) (continued)
Investment Performance
The Trustees considered the investment performance of the Fund.1 In this regard, they compared the investment performance of the Fund to the performance of other comparable funds registered with the U.S. Securities and Exchange Commission and/or to rankings and ratings issued by the Outside Data Provider as of December 31, 2013, and updated performance information as of June 30, 2014 prepared by the Investment Adviser using a peer group selected by the Outside Data Provider. The Trustees also reviewed the investment performance of the Fund relative to its performance benchmarks. The information on the Fund’s investment performance was provided for the one-year period ending on December 31, 2013. They noted that the Fund had placed in the first quartile of its peer group for the one-year period, and had outperformed its benchmark indices for the one-year period ended June 30, 2014.
Costs of Services Provided and Competitive Information
The Trustees considered the contractual terms of the Management Agreement, the fee rates payable by the Fund thereunder and the net amount retained by the Investment Adviser after payment of sub-advisory fees. In this regard, the Trustees considered information on the services rendered by the Investment Adviser to the Fund, which included both advisory and administrative services that were directed to the needs and operations of the Fund as a registered mutual fund. In particular, the Trustees referred to the analysis prepared by the Outside Data Provider regarding the expense rankings of the Fund, including: (i) a comparison of the Fund’s management fees and breakpoints to a relevant peer group and category universe; (ii) an expense analysis which compared the Fund’s expenses to a peer group and a category universe; and (iii) a history comparing the Fund’s expenses to a peer and category average since the Fund commenced operations. The analysis also compared the Fund’s transfer agency fees, custody fees, distribution fees, other expenses and fee waivers/reimbursements to those of the peer group and category medians. The Trustees concluded that the comparisons provided by the Outside Data Provider were useful in evaluating the reasonableness of the management fees and total expenses paid by the Fund.
The Trustees considered the Investment Adviser’s undertaking to limit certain expenses of the Fund to a specified level. They considered information provided by the Investment Adviser showing the impact of fee breakpoints, fee reductions, and expense limitations on the Investment Adviser’s revenues. The Trustees also considered comparative fee information for services provided by the Investment Adviser to collective investment vehicles having investment objectives and policies similar to those of the Fund. The Trustees noted that these collective investment vehicles have a compensation structure which include performance fees, and also pay additional asset-based fees and performance fees to the managers of underlying hedge funds. The Trustees also considered that services provided to the Fund differed in various significant respects from the services provided to these collective investment vehicles, which generally operated under less stringent regulatory and financial reporting requirements. In addition, the Trustees noted that shareholders are able to redeem their Fund shares at any time if shareholders believe that Fund fees and expenses are too high or if they are dissatisfied with the performance of the Fund.
| 1 | | The Independent Trustees reviewed the performance of Class A and Class I Shares. References herein are to the Class A Shares. |
77
GOLDMAN SACHS MULTI-MANAGER ALTERNATIVES FUND
Statement Regarding Basis for Approval of Management Agreement and Sub-Advisory Agreements (Unaudited) (continued)
Profitability
The Trustees referred to the information regarding the Investment Adviser’s revenues and pre-tax profit margins with respect to the Fund. In this regard the Trustees noted that they had received, among other things, a profitability analysis and summary, revenue and expense schedule by function (i.e., investment management, transfer agency, and distribution and service), and information on the Investment Adviser’s expense allocation methodology. They observed that the profitability and expense figures are substantially similar to those used by the Investment Adviser for many internal purposes, including compensation decisions among various business groups, and are thus subject to a vigorous internal debate about how certain profits and expenses should be allocated. The Trustees also noted that the internal audit group within the Goldman Sachs organization had audited the expense allocation methodology and was satisfied with the reasonableness, consistency, and accuracy of the Investment Adviser’s expense allocation methodology and profitability analysis calculations. Profitability data for the Fund were provided for 2013, and the Trustees considered this information in relation to the Investment Adviser’s overall profitability.
Economies of Scale
The Trustees considered the information that had previously been provided regarding the Investment Adviser’s profitability. The Trustees considered information pertaining to the amounts of assets in the Fund, the Fund’s recent share purchase and redemption activity, the costs of the services provided by the Investment Adviser and its affiliates and their realized profits, the comparison of fee rates charged by the Investment Adviser with fee rates charged to other funds in the peer groups, and the Investment Adviser’s undertakings to waive certain fees and limit certain expenses of the Fund that exceed specified levels. The Trustees considered the breakpoints in the fee rate payable under the Management Agreement at the following annual percentage rates of the average daily net assets of the Fund:
| | | | |
Average Daily Net Assets | | Management Fee Annual Rate | |
| First $2 billion | | | 2.00 | % |
| Next $3 billion | | | 1.80 | % |
| Next $3 billion | | | 1.71 | % |
| Over $8 billion | | | 1.68 | % |
The Trustees noted that the breakpoints in the fee rate payable under the Management Agreement for the Fund were meant to share potential economies of scale, if any, with the shareholders as assets under management reach those asset levels. The Independent Trustees also considered the relationship between the advisory and sub-advisory fee rate schedules. The Trustees concluded that the fee breakpoints represented a means of assuring that benefits of scalability, if any, would be passed along to shareholders at the specified asset levels.
78
GOLDMAN SACHS MULTI-MANAGER ALTERNATIVES FUND
Statement Regarding Basis for Approval of Management Agreement and Sub-Advisory Agreements (Unaudited) (continued)
Other Benefits to the Investment Adviser and Its Affiliates
The Trustees also considered the other benefits derived by the Investment Adviser and its affiliates from their relationships with the Fund, including: (a) transfer agency fees received by Goldman Sachs; (b) the Investment Adviser’s ability to leverage the infrastructure designed to service the Fund on behalf of its other clients; (c) the Investment Adviser’s ability to cross-market other products and services to Fund shareholders; (d) Goldman Sachs’ retention of certain fees as the Fund’s distributor; (e) the Investment Adviser’s ability to negotiate better pricing with custodians on behalf of its other clients, as a result of the relationship with the Fund; and (f) the possibility that the working relationship between the Investment Adviser and the Fund’s third party service providers (including the Sub-Advisers) may cause those service providers to be open to doing business with other areas of Goldman Sachs. In considering these benefits to the Investment Adviser and its affiliates, the Trustees reviewed the “Summary of Fall-Out Benefits” memorandum included previously in the Board materials.
Other Benefits to the Fund and Its Shareholders
The Trustees observed that the Fund receives certain other potential benefits as a result of their relationship with the Investment Adviser, including: (a) improved servicing and pricing from vendors because of the volume of business generated by the Investment Adviser and its affiliates; (b) the Investment Adviser’s ability to hire and retain qualified personnel, along with certain sub-advisers, to provide services to the Fund because of the reputation of the Goldman Sachs organization; and (c) the Fund’s access to certain affiliated distribution channels.
Conclusion
In connection with their consideration of the Management Agreement, the Trustees gave weight to each of the factors described above, but did not identify any one particular factor as controlling their decision. After deliberation and consideration of all of the information provided, the Trustees concluded, in the exercise of their business judgment, that the management fees paid by the Fund were reasonable in light of the services provided to it by the Investment Adviser, its costs, and the Fund’s current and reasonably foreseeable asset levels, and that the Management Agreement should be approved and continued with respect to the Fund until August 30, 2015. Following discussion of the continuation of the Management Agreement, the consensus of the Trustees was that continued management by the Investment Adviser would likely benefit the Fund and that the Management Agreement should be continued.
Designated Sub-Advisory Agreements
Nature, Extent and Quality of the Services Provided Under the Sub-Advisory Agreements and Performance
In evaluating the Designated Sub-Advisory Agreements, the Trustees relied upon materials furnished and presentations made by the Investment Adviser and the Designated Sub-Advisers. In evaluating the nature, extent and quality of services provided by
79
GOLDMAN SACHS MULTI-MANAGER ALTERNATIVES FUND
Statement Regarding Basis for Approval of Management Agreement and Sub-Advisory Agreements (Unaudited) (continued)
each Designated Sub-Adviser, the Trustees considered information on the services provided to the Fund by each Designated Sub-Adviser, including information about each Designated Sub-Adviser’s (a) personnel and compensation structure; (b) track record in managing accounts with investment strategies similar to those employed on behalf of the Fund; (c) policies and procedures in place to address potential conflicts of interest; and (d) compliance program. The Trustees noted that Ares, Brigade, and Lateef had provided services to the Fund since its inception, and reviewed the Fund’s operations and investment performance since its inception with respect to the management of their respective sleeves of the Fund. The Trustees also noted that Graham had provided services to the Fund since August 2013, and reviewed the Fund’s operations and investment performance since August 2013 with respect to the management of its respective sleeve of the Fund.
Costs of Services Provided
The Trustees reviewed the terms of each Designated Sub-Advisory Agreement, including the fee schedules for the Designated Sub-Advisers. They considered the breakpoints (if applicable) in the sub-advisory fee rate payable under each Designated Sub-Advisory Agreement. The Trustees noted that the compensation paid to each Designated Sub-Adviser would be paid by the Investment Adviser, not by the Fund. The Trustees reviewed the anticipated blended average of all sub-advisory fees to be paid by the Investment Adviser in light of the overall management fee to be paid by the Fund.
Conclusion
After deliberation and consideration of the information provided, the Trustees concluded that the sub-advisory fees to be paid by the Investment Adviser to the Designated Sub-Advisers is reasonable in light of the services to be provided by the Designated Sub-Advisers and the Fund’s reasonably foreseeable asset levels, and that each Designated Sub-Advisory Agreement should be approved and continued until August 30, 2015.
New Sub-Advisory Agreements
In addition to the action taken by the Trustees at the Annual Meeting, upon the recommendation of the Investment Adviser, at meetings held on August 6, 2014 and November 11, 2014, the Trustees, including all of the Trustees present who are not parties to the Fund’s investment management agreement or any sub-advisory agreement or “interested persons” (as defined in the Investment Company Act of 1940, as amended) of any party thereto (the “Independent Trustees”) approved the respective sub-advisory agreements (each, a “New Sub-Advisory Agreement”) between the Investment Adviser and each of Polaris Capital Management, LLC and Corsair Capital Management, L.P. (each, a “New Sub-Adviser” and, together, the “New Sub-Advisers”).
In connection with these meetings, the Trustees received written materials and oral presentations on the topics covered, and were advised by their independent legal counsel. In addition, each New Sub-Adviser provided information in response to a request from the Investment Adviser.
80
GOLDMAN SACHS MULTI-MANAGER ALTERNATIVES FUND
Statement Regarding Basis for Approval of Management Agreement and Sub-Advisory Agreements (Unaudited) (continued)
Nature, Extent and Quality of the Services Provided Under the New Sub-Advisory Agreements and Performance
In evaluating the New Sub-Advisory Agreements, the Trustees relied upon materials furnished and presentations made by the Investment Adviser and the New Sub-Advisers. In evaluating the nature, extent and quality of services to be provided by the New Sub-Advisers, the Trustees considered information on the services provided to the Fund by the New Sub-Advisers, including information about the New Sub-Adviser’s (a) personnel and compensation structure; (b) track record in managing accounts with investment strategies similar to those to be employed on behalf of the Fund; (c) policies and procedures in place to address potential conflicts of interest; and (d) compliance program. In this regard, they considered assessments provided by the Investment Adviser of each New Sub-Adviser, its investment strategies and personnel and its compliance program. The Trustees considered that Corsair currently manages other assets for the Investment Adviser’s clients, and they reviewed performance information for an unregistered fund managed by Corsair and composite of funds managed by Polaris with investment objectives and strategies similar to those to be employed on behalf of the Fund. They noted that, because the New Sub-Advisers had not previously provided services to the Fund, there was no performance information to evaluate with respect to the Fund.
Costs of Services to be Provided
The Trustees reviewed the terms of each New Sub-Advisory Agreement, including the proposed fee schedule for each New Sub-Adviser. They also considered the fees that Polaris charges to funds and accounts and an unregistered fund managed by Corsair with investment objectives and strategies similar to those to be employed on behalf of the Fund. They noted that the compensation paid to each New Sub-Adviser would be paid by the Investment Adviser, not by the Fund. They also noted that the terms of each New Sub-Advisory Agreement were the result of arms’ length negotiations between the Investment Adviser and each New Sub-Adviser. The Trustees reviewed the anticipated blended average of all sub-advisory fees to be paid by the Investment Adviser and how it would change upon hiring each New Sub-Adviser. They also considered this information in light of the overall management fee to be paid by the Fund.
In connection with their consideration of each New Sub-Advisory Agreement at the Meeting, the Trustees gave weight to various factors, but did not identify any particular factor as controlling their decision. After deliberation and consideration of the information provided, the Independent Trustees unanimously concluded that each New Sub-Adviser’s management of a sleeve of the Fund would likely benefit the Fund and its shareholders, and that each New Sub-Advisory Agreement should be approved.
81
GOLDMAN SACHS MULTI-MANAGER ALTERNATIVES FUND
Trustees and Officers (Unaudited)
Independent Trustees
| | | | | | | | | | |
Name,
Address and Age1 | | Position(s) Held with the Trust | | Term of Office and
Length of
Time Served2 | | Principal Occupation(s)
During Past 5 Years | | Number of
Portfolios in
Fund Complex
Overseen by
Trustee3 | | Other
Directorships Held by Trustee4 |
Ashok N. Bakhru Age: 72 | | Chairman of the Board of Trustees | | Since 2012 | | Mr. Bakhru is retired. He was formerly Director, Apollo Investment Corporation (a business development company) (2008-2013); President, ABN Associates (a management and financial consulting firm) (1994-1996 and 1998-2012); Trustee, Scholarship America (1998-2005); Trustee, Institute for Higher Education Policy (2003-2008); Director, Private Equity Investors — III and IV (1998-2007), and Equity-Linked Investors II (April 2002-2007). Chairman of the Board of Trustees — Goldman Sachs Fund Complex. | | 128 | | None |
John P. Coblentz, Jr. Age: 73 | | Trustee | | Since 2012 | | Mr. Coblentz is retired. Formerly, he was Partner, Deloitte & Touche LLP (1975-2003); Director, Emerging Markets Group, Ltd. (2004-2006); and Director, Elderhostel, Inc. (2006-2012). Trustee — Goldman Sachs Fund Complex. | | 128 | | None |
Richard P. Strubel Age: 75 | | Trustee | | Since 2012 | | Mr. Strubel is retired. Formerly, he was Director, Cardean Learning Group (provider of educational services via the internet) (2003-2008); and Director, Gildan Activewear Inc. (a clothing marketing and manufacturing company) (2000-2014). He serves as Trustee, Emeritus, The University of Chicago (1987-Present). Trustee — Goldman Sachs Fund Complex. | | 128 | | The Northern Trust Mutual Fund Complex (56 Portfolios) (Chairman of the Board of Trustees) |
| | | | | | | | | | |
82
GOLDMAN SACHS MULTI-MANAGER ALTERNATIVES FUND
Trustees and Officers (Unaudited) (continued)
Interested Trustee*
| | | | | | | | | | |
Name,
Address and Age1 | | Position(s) Held with the Trust | | Term of Office and
Length of
Time Served2 | | Principal Occupation(s) During Past 5 Years | | Number of
Portfolios in
Fund Complex
Overseen by
Trustee3 | | Other Directorships Held by Trustee4 |
James A. McNamara Age: 52 | | President and Trustee | | Since 2012 | | Managing Director, Goldman Sachs (December 1998-Present); Director of Institutional Fund Sales, GSAM (April 1998-December 2000); and Senior Vice President and Manager, Dreyfus Institutional Service Corporation (January 1993- April 1998). President — Goldman Sachs Fund Complex (November 2007-Present); Senior Vice President — Goldman Sachs Fund Complex (May 2007-November 2007); and Vice President — Goldman Sachs Fund Complex (2001-2007). Trustee — Goldman Sachs Fund Complex (November 2007-Present and December 2002-May 2004). | | 127 | | None |
| | | | | | | | | | |
| * | | Mr. McNamara is considered to be an “Interested Trustee” because he holds a position with Goldman Sachs and owns securities issued by The Goldman Sachs Group, Inc. Mr. McNamara holds comparable positions with certain other companies of which Goldman Sachs, GSAM or an affiliate thereof is the investment adviser, administrator and/or distributor. |
| 1 | | Each Trustee may be contacted by writing to the Trustee, c/o Goldman Sachs, 200 West Street, New York, New York, 10282, Attn: Caroline Kraus. Information is provided as of December 31, 2014. |
| 2 | | Each Trustee holds office for an indefinite term until the earliest of: (a) the election of his or her successor; (b) the date the Trustee resigns, retires, or is removed by the Board of Trustees or shareholders, in accordance with the Trust’s Declaration of Trust; or (c) the termination of the Trust. |
| 3 | | The Goldman Sachs Fund Complex includes the Trust, Goldman Sachs Trust (“GST”), Goldman Sachs Variable Insurance Trust (“GSVIT”), Goldman Sachs MLP Income Opportunities Fund (“GSMLP”), Goldman Sachs MLP and Energy Renaissance Fund (“GSMER”), and Goldman Sachs ETF Trust (“GSETF”). As of December 31, 2014, the Trust consisted of six portfolios (one of which offered shares to the public), GST consisted of 94 portfolios (88 of which offered shares to the public), GSVIT consisted of 14 portfolios, each of GSMLP and GSMER consisted of one portfolio, and GSETF consisted of 11 portfolios (none of which offered shares to the public). The Goldman Sachs Fund Complex also includes, with respect to Messrs. Bakhru, Coblentz and Strubel, Goldman Sachs BDC, Inc. (“GSBDC”). As of December 31, 2014, GSBDC had not offered shares to the public. |
| 4 | | This column includes only directorships of companies required to report to the Securities and Exchange Commission under the Securities Exchange Act of 1934 (i.e., “public companies”) or other investment companies registered under the Act. |
Additional information about the Trustees is available in the Fund’s Statement of Additional Information, which can be obtained from Goldman Sachs free of charge by calling this toll-free number (in the United States of America): 1-800-292-4726.
83
GOLDMAN SACHS MULTI-MANAGER ALTERNATIVES FUND
Trustees and Officers (Unaudited) (continued)
Officers of the Trust*
| | | | | | |
Name, Address and Age1 | | Position(s) Held With the Trust | | Term of Office and
Length of
Time Served2 | | Principal Occupation(s) During Past 5 Years |
James A. McNamara 200 West Street New York, NY 10282 Age: 52 | | President and Trustee | | Since 2012 | | Managing Director, Goldman Sachs (December 1998-Present); Director of Institutional Fund Sales, GSAM (April 1998-December 2000); and Senior Vice President and Manager, Dreyfus Institutional Service Corporation (January 1993-April 1998). President — Goldman Sachs Fund Complex (November 2007-Present); Senior Vice President — Goldman Sachs Fund Complex (May 2007-November 2007); and Vice President — Goldman Sachs Fund Complex (2001-2007). Trustee — Goldman Sachs Fund Complex (November 2007-Present and December 2002-May 2004). |
Caroline L. Kraus 200 West Street New York, NY 10282 Age: 37 | | Secretary | | Since 2012 | | Vice President, Goldman Sachs (August 2006-Present); Associate General Counsel, Goldman Sachs (2012-Present); Assistant General Counsel, Goldman Sachs (August 2006-December 2011) and Associate, Weil, Gotshal & Manges, LLP (2002-2006). Secretary — Goldman Sachs Fund Complex (August 2012-Present); and Assistant Secretary — Goldman Sachs Fund Complex (June 2012-August 2012). |
Scott M. McHugh 200 West Street New York, NY 10282 Age: 43 | | Principal Financial Officer, Senior Vice President and Treasurer | | Since 2012 (Principal Financial Officer since 2013) | | Vice President, Goldman Sachs (February 2007-Present); Assistant Treasurer of certain mutual funds administered by DWS Scudder (2005-2007); and Director (2005-2007), Vice President (2000-2005) and Assistant Vice President (1998-2000), Deutsche Asset Management or its predecessor (1998-2007). Principal Financial Officer — Goldman Sachs Fund Complex (November 2013-Present); Treasurer — Goldman Sachs Fund Complex (October 2009-Present); Senior Vice President — Goldman Sachs Fund Complex (November 2009-Present); and Assistant Treasurer — Goldman Sachs Fund Complex (May 2007-October 2009). |
| | | | | | |
| * | | Represents a partial list of officers of the Trust. Additional information about all the officers is available in the Fund‘s Statement of Additional Information, which can be obtained from Goldman Sachs free of charge by calling this toll-free number (in the United States): 1-800-292-4726. |
| 1 | | Information is provided as of December 31, 2014. |
| 2 | | Officers hold office at the pleasure of the Board of Trustees or until their successors are duly elected and qualified. Each officer holds comparable positions with certain other companies of which Goldman Sachs, GSAM or an affiliate thereof is the investment adviser, administrator and/or distributor. |
Goldman Sachs Trust — Multi-Manager Alternatives Fund — Tax Information (Unaudited)
For the fiscal year ended December 31, 2014, 14.03% of the dividends paid from net investment company taxable income by the Multi-Manager Alternatives Fund qualify for the dividends received deduction available to corporations.
For the fiscal year ended December 31, 2014, 35.21% of the dividends paid from net investment company taxable income by the Multi-Manager Alternatives Fund qualify for the reduced tax rate under the Jobs and Growth Tax Relief and Reconciliation Act of 2003.
Pursuant to Section 852 of the Internal Revenue Code, the Multi-Manager Alternatives Fund designates $5,003,986, if different, the maximum amount allowable, as capital gain dividends paid during the fiscal year ended December 31, 2014.
During the fiscal year ended December 31, 2014, the Multi-Manager Alternatives Fund designates $3,631,211 as short-term capital gain dividends pursuant to Section 871(k) of the Internal Revenue Code.
84
FUNDS PROFILE
Goldman Sachs Funds

Goldman Sachs is a premier financial services firm, known since 1869 for creating thoughtful and customized investment solutions in complex global markets.
Today, the Investment Management Division of Goldman Sachs serves a diverse set of clients worldwide, including private institutions, public entities and individuals. With approximately $1.02 trillion in assets under supervision as of December 31, 2014, Goldman Sachs Asset Management (“GSAM”) has portfolio management teams located around the world and our investment professionals bring firsthand knowledge of local markets to every investment decision. Assets under supervision includes assets under management and other client assets for which Goldman Sachs does not have full discretion. GSAM leverages the resources of Goldman, Sachs & Co. subject to legal, internal and regulatory restrictions.

Money Market1
Financial Square FundsSM
| n | | Financial Square Tax-Exempt Funds |
| n | | Financial Square Federal Fund |
| n | | Financial Square Government Fund |
| n | | Financial Square Money Market Fund |
| n | | Financial Square Prime Obligations Fund |
| n | | Financial Square Treasury Instruments Fund |
| n | | Financial Square Treasury Obligations Fund |
Fixed Income
Short Duration and Government
| n | | High Quality Floating Rate Fund |
| n | | Limited Maturity Obligations Fund |
| n | | Short Duration Government Fund |
| n | | Short Duration Income Fund |
| n | | Inflation Protected Securities Fund |
Multi-Sector
Municipal and Tax-Free
| n | | High Yield Municipal Fund |
| n | | Short Duration Tax-Free Fund |
Single Sector
| n | | Investment Grade Credit Fund |
| n | | High Yield Floating Rate Fund |
| n | | Emerging Markets Debt Fund |
| n | | Local Emerging Markets Debt Fund |
| n | | Dynamic Emerging Markets Debt Fund |
Fixed Income Alternatives
| n | | Long Short Credit Strategies Fund3 |
| n | | Fixed Income Macro Strategies Fund |
Fundamental Equity
| n | | Small/Mid Cap Value Fund |
| n | | Small/Mid Cap Growth Fund |
| n | | Flexible Cap Growth Fund |
| n | | Concentrated Growth Fund |
| n | | Technology Tollkeeper Fund |
| n | | Growth Opportunities Fund |
| n | | Rising Dividend Growth Fund |
Tax-Advantaged Equity
| n | | U.S. Tax-Managed Equity Fund4 |
| n | | International Tax-Managed Equity Fund4 |
| n | | U.S. Equity Dividend and Premium Fund |
| n | | International Equity Dividend and Premium Fund |
Equity Insights
| n | | Small Cap Equity Insights Fund |
| n | | U.S. Equity Insights Fund |
| n | | Small Cap Growth Insights Fund |
| n | | Large Cap Growth Insights Fund |
| n | | Large Cap Value Insights Fund |
| n | | Small Cap Value Insights Fund |
| n | | International Small Cap Insights Fund |
| n | | International Equity Insights Fund |
| n | | Emerging Markets Equity Insights Fund |
Fundamental Equity International
| n | | Strategic International Equity Fund |
| n | | Focused International Equity Fund5 |
| n | | International Small Cap Fund |
| n | | Emerging Markets Equity Fund |
| n | | BRIC Fund (Brazil, Russia, India, China) |
Select Satellite6
| n | | Real Estate Securities Fund |
| n | | International Real Estate Securities Fund |
| n | | Commodity Strategy Fund |
| n | | Dynamic Commodity Strategy Fund |
| n | | Dynamic Allocation Fund |
| n | | Absolute Return Tracker Fund |
| n | | Managed Futures Strategy Fund |
| n | | MLP Energy Infrastructure Fund |
| n | | Multi-Manager Alternatives Fund |
| n | | Multi-Asset Real Return Fund |
| n | | Retirement Portfolio Completion Fund |
| n | | Tactical Tilt Implementation Fund |
Total Portfolio Solutions6
| n | | Balanced Strategy Portfolio |
| n | | Growth and Income Strategy Portfolio |
| n | | Growth Strategy Portfolio |
| n | | Equity Growth Strategy Portfolio |
| n | | Satellite Strategies Portfolio |
| n | | Enhanced Dividend Global Equity Portfolio |
| n | | Tax Advantaged Global Equity Portfolio |
| 1 | | An investment in a money market fund is neither insured nor guaranteed by the Federal Deposit Insurance Corporation (“FDIC”) or any other government agency. Although the Funds seek to preserve the value of your investment at $1.00 per share, it is possible to lose money by investing in the Funds. |
| 2 | | Effective on October 1, 2014, the Goldman Sachs Core Plus Fixed Income Fund was renamed the Goldman Sachs Bond Fund. |
| 3 | | Effective at the close of business on March 21, 2014, the Goldman Sachs Credit Strategies Fund was reorganized with and into the Goldman Sachs Long Short Credit Strategies Fund. |
| 4 | | Effective on April 30, 2014, the Goldman Sachs Structured Tax-Managed Equity and Structured International Tax-Managed Equity Funds were renamed the Goldman Sachs U.S. Tax-Managed Equity and International Tax-Managed Equity Funds, respectively. |
| 5 | | Effective at the close of business on February 28, 2014, the Goldman Sachs Concentrated International Equity Fund was renamed the Goldman Sachs Focused International Equity Fund. |
| 6 | | Individual Funds within the Total Portfolio Solutions and Select Satellite categories will have various placement on the risk/return spectrum and may have greater or lesser risk than that indicated by the placement of the general Total Portfolio Solutions or Select Satellite category. |
Financial Square FundsSM is a registered service mark of Goldman, Sachs & Co.
*This list covers open-end funds only. Please visit our website at www.GSAMFUNDS.com to learn about our closed-end funds.
| | |
TRUSTEES Ashok N. Bakhru, Chairman John P. Coblentz, Jr. James A. McNamara Richard P. Strubel | | OFFICERS James A. McNamara, President Scott M. McHugh, Principal Financial Officer and Treasurer Caroline L. Kraus, Secretary |
| |
GOLDMAN, SACHS & CO. Distributor and Transfer Agent | | GOLDMAN SACHS ASSET MANAGEMENT, L.P. Investment Adviser |
Visit our web site at www.GSAMFUNDS.com to obtain the most recent month-end returns.
Goldman Sachs Asset Management, L.P. 200 West Street, New York, New York 10282
The reports concerning the Fund included in this shareholder report may contain certain forward-looking statements about the factors that may affect the performance of the Fund in the future. These statements are based on Fund management’s predictions and expectations concerning certain future events and their expected impact on the Fund, such as performance of the economy as a whole and of specific industry sectors, changes in the levels of interest rates, the impact of developing world events, and other factors that may influence the future performance of the Fund. Management believes these forward-looking statements to be reasonable, although they are inherently uncertain and difficult to predict. Actual events may cause adjustments in portfolio management strategies from those currently expected to be employed.
A description of the policies and procedures that the Fund uses to determine how to vote proxies relating to portfolio securities and information regarding how a Fund voted proxies relating to portfolio securities during the most recent 12-month period ended June 30 is available (I) without charge, upon request by calling 1-800-526-7384 (for Retail Shareholders) or 1-800-621-2550 (for Institutional Shareholders); and (II) on the Securities and Exchange Commission (“SEC”) web site at http://www.sec.gov.
The Fund files its complete schedule of portfolio holdings with the SEC for the first and third quarters of each fiscal year on Form N-Q. The Fund’s Forms N-Q are available on the SEC’s web site at http://www.sec.gov within 60 days after the Fund’s first and third fiscal quarters. The Fund’s Forms N-Q may be reviewed and copied at the SEC’s Public Reference Room in Washington, D.C., and information on the operation of the Public Reference Room may also be obtained by calling 1-800-SEC-0330. Form N-Q may be obtained upon request and without charge by calling 1-800-526-7384 (for Retail Shareholders) or 1-800-621-2550 (for Institutional Shareholders).
Holdings and allocations shown are as of December 31, 2014 and may not be representative of future investments. Fund holdings should not be relied on in making investment decisions and should not be construed as research or investment advice regarding particular securities. Current and future holdings are subject to risk. Economic and market forecasts presented herein reflect our judgment as of the date of this presentation and are subject to change without notice. These forecasts do not take into account the specific investment objectives, restrictions, tax and financial situation or other needs of any specific client. Actual data will vary and may not be reflected here. These forecasts are subject to high levels of uncertainty that may affect actual performance. Accordingly, these forecasts should be viewed as merely representative of a broad range of possible outcomes. These forecasts are estimated, based on assumptions, and are subject to significant revision and may change materially as economic and market conditions change. Goldman Sachs has no obligation to provide updates or changes to these forecasts. Case studies and examples are for illustrative purposes only.
The portfolio risk management process includes an effort to monitor and manage risk, but does not imply low risk.
This material is not authorized for distribution to prospective investors unless preceded or accompanied by a current Prospectus or summary prospectus, if applicable. Investors should consider a Fund’s objective, risks, and charges and expenses, and read the summary prospectus, if available, and/or the Prospectus carefully before investing or sending money. The summary prospectus, if available, and the Prospectus contain this and other information about a Fund and may be obtained from your authorized dealer or from Goldman, Sachs & Co. by calling (retail – 1-800-526-7384) (institutional – 1-800-621-2550).
© 2015 Goldman Sachs. All rights reserved. 154840.MF.MED.TMPL /2/2015 MMALTAR-15 / 7k
(a) As of the end of the period covered by this report, the registrant has adopted a code of ethics that applies to the registrant’s principal executive officer, principal financial officer, principal accounting officer or controller, or persons performing similar functions, regardless of whether these individuals are employed by the registrant or a third party (the “Code of Ethics”).
(b) During the period covered by this report, no amendments were made to the provisions of the Code of Ethics.
(c) During the period covered by this report, the registrant did not grant any waivers, including an implicit waiver, from any provision of the Code of Ethics.
(d) A copy of the Code of Ethics is available as provided in Item 12(a)(1) of this report.
| ITEM 3. | AUDIT COMMITTEE FINANCIAL EXPERT. |
The registrant’s board of trustees has determined that the registrant has at least one “audit committee financial expert” (as defined in Item 3 of Form N-CSR) serving on its audit committee. John P. Coblentz, Jr. is the “audit committee financial expert” and is “independent” (as each term is defined in Item 3 of Form N-CSR).
| ITEM 4. | PRINCIPAL ACCOUNTANT FEES AND SERVICES. |
Table 1 — Items 4(a) - 4(d). The accountant fees below reflect the aggregate fees billed by the Fund of the Goldman Sachs Trust II to which this certified shareholder report relates.
| | | | | | | | | | | | |
| | | 2014 | | 2013 | | Description of Services Rendered |
| | | | | | | | | | | | |
| | | |
Audit Fees: | | | | | | | | | | | | |
| | | |
• PricewaterhouseCoopers LLP
(“PwC”) | | | $ | 57,709 | | | | $ | 10,000 | | | Financial Statement audits. |
| | | |
Audit-Related Fees: | | | | | | | | | | | | |
| | | |
• PwC | | | $ | 0 | | | | $ | 0 | | | |
| | | |
Tax Fees: | | | | | | | | | | | | |
| | | |
• PwC | | | $ | 9,204 | | | | $ | 0 | | | |
Table 2 — Items 4(b)(c) & (d). Non-Audit Services to the Goldman Sachs Trust II’s service affiliates * that were pre-approved by the Audit Committee of the Goldman Sachs Trust II pursuant to Rule 2-01(c)(7)(ii) of Regulation S-X.
| | | | | | | | | | | | |
| | | 2014 | | 2013 | | Description of Services Rendered |
| | | | | | | | | | | | |
| | | |
Audit-Related Fees: | | | | | | | | | | | | |
| | | |
• PwC | | | $ | 1,486,420 | | | | $ | 1,486,420 | | | Internal control review performed in accordance with Statement on Standards for Attestation Engagements No. 16. These fees are borne by the Fund’s Adviser. |
| * | These include the advisor (excluding sub-advisors) and any entity controlling, controlled by or under common control with the advisor that provides ongoing services to the registrant (hereinafter referred to as “service affiliates”). |
Item 4(e)(1) — Audit Committee Pre-Approval Policies and Procedures
Pre-Approval of Audit and Non-Audit Services Provided to the Funds of the Goldman Sachs Trust II. The Audit and Non-Audit Services Pre-Approval Policy (the “Policy”) adopted by the Audit Committee of Goldman Sachs Trust (“GST II”) sets forth the procedures and the conditions pursuant to which services performed by an independent auditor for GST II may be pre-approved. Services may be pre-approved specifically by the Audit Committee as a whole or, in certain circumstances, by the Audit Committee Chairman or the person designated as the Audit Committee Financial Expert. In addition, subject to specified cost limitations, certain services may be pre-approved under the provisions of the Policy. The Policy provides that the Audit Committee will consider whether the services provided by an independent auditor are consistent with the Securities and Exchange Commission’s rules on auditor independence. The Policy provides for periodic review and pre-approval by the Audit Committee of the services that may be provided by the independent auditor.
De Minimis Waiver. The pre-approval requirements of the Policy may be waived with respect to the provision of non-audit services that are permissible for an independent auditor to perform, provided (1) the aggregate amount of all such services provided constitutes no more than five percent of the total amount of revenues subject to pre-approval that was paid to the independent auditors during the fiscal year in which the services are provided; (2) such services were not recognized by GST II at the time of the engagement to be non-audit services; and (3) such services are promptly brought to the attention of the Audit Committee and approved prior to the completion of the audit by the Audit Committee or by one or more members of the Audit Committee to whom authority to grant such approvals has been delegated by the Audit Committee, pursuant to the pre-approval provisions of the Policy.
Pre-Approval of Non-Audit Services Provided to GST’s Investment Advisers. The Policy provides that, in addition to requiring pre-approval of audit and non-audit services provided to GST II, the Audit Committee will pre-approve those non-audit services provided to GST II’s investment advisers (and entities controlling, controlled by or under common control with the investment advisers that provide ongoing services to GST II) where the engagement relates directly to the operations or financial reporting of GST II.
Item 4(e)(2) – 0% of the audit-related fees, tax fees and other fees listed in Table 1 were approved by GST II’s Audit Committee pursuant to the “de minimis” exception of Rule 2-01(c)(7)(i)(C) of Regulation S-X. In addition, 0% of the non-audit services to the GST II’s service affiliates listed in Table 2 were approved by GST II’s Audit Committee pursuant to the “de minimis” exception of Rule 2-01(c)(7)(i)(C) of Regulation S-X.
Item 4(f) – Not applicable.
Item 4(g) Aggregate Non-Audit Fees Disclosure
The aggregate non-audit fees billed to GST II by PwC for the twelve months ended December 31, 2014 and December 31, 2013 were $9,204 and none respectively. The aggregate non-audit fees billed to GST II’s adviser and service affiliates by PwC for non-audit services for the twelve months ended December 31, 2013 were approximately $9.8 million. The figures for these entities are not yet available for twelve months ended December 31, 2014. With regard to the aggregate non-audit fees billed to GST II’s adviser and service affiliates, the 2013 amounts include fees for non-audit services required to be pre-approved [see Table 2] and fees for non-audit services that did not require pre-approval since they did not directly relate to GST II’s operations or financial reporting.
Item 4(h) — GST II’s Audit Committee has considered whether the provision of non-audit services to GST II’s investment adviser and service affiliates that did not require pre-approval pursuant to paragraph (c)(7)(ii) of Rule 2-01 of Regulation S-X is compatible with maintaining the auditors’ independence.
| ITEM 5. | AUDIT COMMITTEE OF LISTED REGISTRANTS. |
| ITEM 6. | SCHEDULE OF INVESTMENTS. |
| | Schedule of Investments is included as part of the Report to Stockholders filed under Item 1. |
| ITEM 7. | DISCLOSURE OF PROXY VOTING POLICIES AND PROCEDURES FOR CLOSED-END MANAGEMENT INVESTMENT COMPANIES. |
| ITEM 8. | PORTFOLIO MANAGERS OF CLOSED-END MANAGEMENT INVESTMENT COMPANIES. |
| ITEM 9. | PURCHASES OF EQUITY SECURITIES BY CLOSED-END MANAGEMENT INVESTMENT COMPANY AND AFFILIATED PURCHASERS. |
| ITEM 10. | SUBMISSION OF MATTERS TO A VOTE OF SECURITY HOLDERS. |
| | There have been no material changes to the procedures by which shareholders may recommend nominees to the registrant’s board of trustees. |
| ITEM 11. | CONTROLS AND PROCEDURES. |
| | (a) | The registrant’s principal executive and principal financial officers, or persons performing similar functions have concluded that the registrant’s disclosure controls and procedures (as defined in Rule 30a-3(c) under the Investment Company Act of 1940, as amended (the “1940 Act”)) are effective as of a date within 90 days of the filing of this report that includes the disclosure required by this paragraph, based on the evaluation of these controls and procedures required by Rule 30a-3(b) under the 1940 Act and 15d-15(b) under the Securities Exchange Act of 1934, as amended. |
| | (b) | There were no changes in the registrant’s internal control over financial reporting (as defined in Rule 30a-3(d) under the 1940 Act) that occurred during the registrant’s second fiscal quarter of the period covered by this report that have materially affected, or are reasonably likely to materially affect, the registrant’s internal control over financial reporting. |
| | | | |
| (a)(1) | | Goldman Sachs Trust II’s Code of Ethics for Principal Executive and Senior Financial Officers is incorporated by reference to Exhibit 12(a)(1) of the registrant’s amended Form N-CSR filed on March 9, 2015. |
| | |
| (a)(2) | | Exhibit 99.CERT | | Certifications pursuant to Section 302 of the Sarbanes-Oxley Act of 2002 filed herewith. |
| | |
| (b) | | Exhibit 99.906CERT | | Certifications pursuant to Section 906 of the Sarbanes-Oxley Act of 2002 filed herewith. |
SIGNATURES
Pursuant to the requirements of the Securities Exchange Act of 1934 and the Investment Company Act of 1940, the registrant has duly caused this report to be signed on its behalf by the undersigned, thereunto duly authorized.
| | | | |
| | | | Goldman Sachs Trust II |
| | |
| By: | | | | /s/ James A. McNamara |
| | | | James A. McNamara |
| | | | President/Principal Executive Officer |
| | | | Goldman Sachs Trust II |
| | |
| Date: | | | | March 9, 2015 |
Pursuant to the requirements of the Securities Exchange Act of 1934 and the Investment Company Act of 1940, this report has been signed below by the following persons on behalf of the registrant and in the capacities and on the dates indicated.
| | | | |
| By: | | | | /s/ James A. McNamara |
| | | | James A. McNamara |
| | | | President/Principal Executive Officer |
| | | | Goldman Sachs Trust II |
| | |
| Date: | | | | March 9, 2015 |
| | |
| By: | | | | /s/ Scott McHugh |
| | | | Scott McHugh |
| | | | Principal Financial Officer |
| | | | Goldman Sachs Trust II |
| | |
| Date: | | | | March 9, 2015 |