UNITED STATES
SECURITIES AND EXCHANGE COMMISSION
Washington, D.C. 20549
FORM N-CSR
CERTIFIED SHAREHOLDER REPORT OF REGISTERED
MANAGEMENT INVESTMENT COMPANIES
Investment Company Act file number 811-22781
Goldman Sachs Trust II
(Exact name of registrant as specified in charter)
200 West Street
15th Floor
New York, New York 10282
(Address of principal executive offices) (Zip code)
| | |
Copies to: |
Caroline Kraus | | Geoffrey R.T. Kenyon, Esq. |
Goldman, Sachs & Co. | | Dechert LLP |
200 West Street | | 100 Oliver Street |
New York, New York 10282 | | 40th Floor |
| | Boston, MA 02110-2605 |
(Name and address of agents for service)
Registrant’s telephone number, including area code: (212) 902-1000
Date of fiscal year end: October 31
Date of reporting period: October 31, 2016
| ITEM 1. | REPORTS TO STOCKHOLDERS. |
| | The Annual Report to Shareholders is filed herewith. |
Goldman Sachs Funds

| | | | |
| | |
| Annual Report | | | | October 31, 2016 |
| | |
| | | | Active Equity Multi-Manager Funds |
| | | | Multi-Manager International Equity |
| | | | Multi-Manager U.S. Dynamic Equity |
| | | | Multi-Manager U.S. Small Cap Equity |

Active Equity Multi-Manager Funds
| n | | MULTI-MANAGER INTERNATIONAL EQUITY |
| n | | MULTI-MANAGER U.S. DYNAMIC EQUITY |
| n | | MULTI-MANAGER U.S. SMALL CAP EQUITY |
| | | | |
TABLE OF CONTENTS | | | | |
| |
Market Review | | | 1 | |
| |
Portfolio Management Discussions and Performance Summaries | | | 3 | |
| |
Schedules of Investments | | | 20 | |
| |
Financial Statements | | | 32 | |
| |
Financial Highlights | | | 36 | |
| |
Notes to the Financial Statements | | | 42 | |
| |
Report of Independent Registered Public Accounting Firm | | | 54 | |
| |
Other Information | | | 55 | |
| | | | |
| | | |
| NOT FDIC-INSURED | | May Lose Value | | No Bank Guarantee |
MARKET REVIEW
Active Equity Multi-Manager Funds
Market Review
The 12 months ended October 31, 2016 (the “Reporting Period”) were marked by spans of uncertainty and volatility, beginning with the Federal Reserve’s (the “Fed”) first interest rate increase in nearly a decade in December 2015. Shortly thereafter, the People’s Bank of China took the step of devaluing its currency, the renminbi, setting off a sharp worldwide sell-off in risk assets, as investors sought what they perceived to be relative safety in the uncertainty surrounding the scale and impact of Chinese monetary policy. This “risk off” sentiment persisted into the middle of February 2016, then subsided until uncertainty around the U.K.’s June 2016 referendum on whether to remain a member of the European Union led to significant price action in U.K. assets. The U.K.’s unexpected decision to leave the European Union, popularly known as “Brexit”, set off another sharp sell-off in equity and currency markets in late June 2016. The British pound dropped precipitously versus the U.S. dollar and the euro, hitting levels not seen since the 1980s.
Equities generally recovered from the Brexit shock over the summer of 2016, as markets turned their attention to the then-upcoming U.S. election. Meanwhile, the Fed expressed an unexpectedly dovish outlook following the volatility of early 2016, reducing the number of potential 2016 interest rate hikes from four to two. (Dovish commentary tends to suggest lower interest rates.) Accommodative monetary policy persisted globally. The European Central Bank left its interest rates unchanged. The Bank of Japan left its interest rates steady while announcing a plan to target its yield curve, or spectrum of maturities, and adjusting its inflation goal to exceed 2%.
Global equity markets ended the Reporting Period broadly positive despite the Reporting Period’s volatility. In the U.S., equities gained strength in the information technology sector and showed strong performance from higher yielding, traditionally defensive sectors, such as utilities, telecommunication services and consumer staples. Quantitative easing on a worldwide scale drove investors to search elsewhere for yield, boosting traditionally defensive equity sectors as well as corporate credit. On the other hand, health care companies underperformed the broader U.S. equity market, as election year rhetoric increased worries about downward pressure on drug pricing and increased regulatory scrutiny. Financials, facing margin pressure from low interest rates and regulatory spending, also underperformed. Low volatility stocks outperformed in the defensive sector rally, and oil prices rebounded from early 2016 lows, boosting the energy sector and certain commodity-linked businesses.
Credit markets ended the Reporting Period in largely positive territory, as accommodative monetary policy drove yield-hungry investors into the corporate credit markets. Credit spreads, or yield differentials to government bonds, tightened from their January 2016 highs, with commodity-exposed and energy-related industries, particularly within the high yield corporate bond sector, leading gains. In the U.S., issuers took advantage of low interest rates and strong foreign demand to drive new offerings. Abroad, emerging market credit, offering comparatively more attractive yields and less sovereign leverage, rallied. Money market reform in the U.S. led to significant outflows from prime money market funds into government money market funds, leading to an increase in the three-month LIBOR rate and implications of the coupon rates of floating rate credit.
Public real estate markets were similarly driven during the Reporting Period by investors’ search for yield within a low interest rate environment. While global real estate markets finished the Reporting Period in positive territory, there was significant dispersion in performance between higher yielding and lower yielding securities, with higher yielding
1
MARKET REVIEW
securities significantly outperforming. The markets experienced notable volatility during the Reporting Period, with a sell-off in U.S. office real estate investment trusts (“REITs”) at the beginning of 2016, a notable rally in Japanese REITs in the first quarter of 2016 despite concerns around quality and valuation following the Bank of Japan’s move to negative interest rates, and a sharp decline and subsequent rebound in U.K. real estate immediately following the European Union referendum vote in June 2016. In the third quarter of 2016 and in October 2016, we saw a rotation in the markets, as pockets that had previously outperformed took a pause, while renewed flows into areas of the market that have previously been stressed, including Hong Kong, stood out to the upside.
By the end of the Reporting Period, the market-implied probability of an interest rate hike by the Fed by December 2016 was 70%. Global central banks, while maintaining policies of quantitative easing, had begun to discuss the limitations of further easing and the broader implications of continued easing in the market. At the end of the Reporting Period, it appeared that political uncertainty in the U.S. surrounding the November 8 election and its aftermath as well as concerns about the effect of a potential “hard Brexit” in March 2017 were likely to be drivers of near-term market volatility. (“Hard Brexit” is one of the ways the U.K. could separate itself from the European Union; opposite of “soft Brexit.” Both terms refer to the closeness or distance of the U.K.’s relationship with the European Union after the separation has been completed.)
2
PORTFOLIO RESULTS
Multi-Manager International Equity Fund
Investment Objective and Principal Strategy
The Fund seeks to provide long-term capital growth.
Portfolio Management Discussion and Analysis
Below, the Goldman Sachs Alternative Investments & Manager Selection (“AIMS”) Group discusses the Multi-Manager International Equity Fund’s (the “Fund”) performance and positioning for the 12-month period ended October 31, 2016 (the “Reporting Period”).
| Q | | How did the Fund perform during the Reporting Period? |
| A | | During the Reporting Period, the Fund’s Institutional Shares generated an average annual total return of -0.82%. This return compares to the -3.22% average annual total return of the Fund’s benchmark, the MSCI® EAFE® Index (Net, USD, Unhedged) (the “Index”) during the same time period. |
| Q | | What key factors were responsible for the Fund’s performance during the Reporting Period? |
| A | | The Fund’s performance during the Reporting Period can be attributed to the performance of the Fund’s Underlying Managers, who are unaffiliated investment managers that employ an international equity investment strategy. During the Reporting Period, the Fund allocated capital to three Underlying Managers as part of its top-level strategy allocation — Causeway Capital Management LLC (“Causeway”), Massachusetts Financial Services Company doing business as MFS Investment Management (“MFS”) and WCM Investment Management (“WCM”). |
| | Of the three Underlying Managers with allocated capital during the Reporting Period, one generated positive absolute returns and two posted negative absolute returns. Still, the Fund outperformed the Index on a relative basis, driven primarily by the performance of growth-oriented Underlying Manager WCM. |
| Q | | Which international equity strategies most significantly affected Fund performance? |
| A | | The Fund’s relative outperformance was driven by growth-oriented manager WCM, which posted positive absolute returns and outperformed the Index, benefiting from strong stock selection in financials, effective allocation positioning in health care, and both effective allocation positioning and stock selection in information technology. Core-oriented manager MFS posted negative absolute returns but outperformed the Index due to effective allocation positioning and stock selection in information technology and positive stock selection in industrials. MFS’ outperformance was somewhat dampened by weak stock selection in materials, which detracted from performance. Value-oriented manager Causeway also posted negative absolute returns but underperformed the Index during the Reporting Period due to poor stock selection in the financials, industrials and materials sectors. Strong stock selection in consumer discretionary and an overweight to telecommunication services partially mitigated Causeway’s underperformance. |
| Q | | How did the Fund use derivatives and similar instruments during the Reporting Period? |
| A | | The Fund used forward foreign currency exchange contracts to take positions in select non-U.S. markets. The use of these derivatives did not have a material impact on the Fund’s results during the Reporting Period. |
| Q | | Were there any notable changes in the Fund’s allocations during the Reporting Period? |
| A | | There were no changes to the Fund’s allocations of assets to Underlying Managers during the Reporting Period. As of October 31, 2016, the Fund’s assets were allocated approximately 44% to Causeway, 19% to MFS and 36% to WCM. The remainder of the Fund’s assets were invested in cash and cash equivalents. |
| Q | | Were there any changes to the Fund’s management team during the Reporting Period? |
| A | | Effective August 19, 2016, Jason Gottlieb was removed as a portfolio manager of the Fund. Kent Clark and Tom Murray were added as portfolio managers of the Fund, joining Betsy Gorton. |
3
PORTFOLIO RESULTS
| Q | | What is the Fund’s tactical view and strategy for the months ahead? |
| A | | At the end of the Reporting Period, the Fund was more defensively positioned than the Index. Compared to the Index, the Fund was overweight to information technology and health care, while underweight to financials, real estate, industrials and utilities at the end of the Reporting Period. The Fund held an approximately 5% position in cash at the end of October 2016. On a regional basis, the Fund was slightly underweight relative to the Index in the U.K. and significantly underweight Japan and developed Asia. The Fund also maintained out-of-Index exposure to emerging markets and North America. From a market capitalization perspective, the Fund was overweight at the end of the Reporting Period in mega cap stocks, while maintaining an underweight position relative to the Index in mid-cap companies. |
| | We intend to continue to position the Fund in alignment with our longer-term strategic views within the international equity complex. We further intend to continue to monitor allocations and Underlying Manager performance as we seek to generate long-term capital growth. |
4
FUND BASICS
Multi-Manager International Equity Fund
as of October 31, 2016
| | | | | | | | | | |
| | PERFORMANCE REVIEW | |
| | | November 1, 2015–October 31, 2016 | | Fund Total Return
(based on NAV)1 | | | MSCI® EAFE® Index
(Net, USD, Unhedged)2 | |
| | | Institutional | | | -0.82 | % | | | -3.22 | % |
| | 1 | | The net asset value (“NAV”) represents the net assets of the class of the Fund (ex-dividend) divided by the total number of shares of the class outstanding. The Fund’s performance assumes the reinvestment of dividends and other distributions. |
| | 2 | | The MSCI® EAFE® Index is a stock market index that is designed to measure the equity market performance of developed markets in Europe, Australasia and the Far East, excluding the U.S. and Canada. The Index figures do not reflect any deductions for fees, expenses or taxes. It is not possible to invest directly in an index. |
| | | | | | | | | | | | |
| | STANDARDIZED TOTAL RETURNS3 |
| | | For the period ended 9/30/16 | | One Year | | | Since Inception | | | Inception Date |
| | | Institutional | | | 8.03 | % | | | -2.54 | % | | 7/31/15 |
| | 3 | | The Standardized Total Returns are average annual total returns or cumulative total returns (only if the performance period is one year or less) as of the most recent calendar quarter-end. They assume reinvestment of all distributions at NAV. Because Institutional Shares do not involve a sales charge, such a charge is not applied to their Standardized Total Returns. |
The returns set forth in the tables above represent past performance. Past performance does not guarantee future results. The Fund’s investment return and principal value will fluctuate so that an investor’s shares, when redeemed, may be worth more or less than their original cost. Current performance may be lower or higher than the performance quoted above. Please visit our web site at www.GSAMFUNDS.com to obtain the most recent month-end returns. Performance reflects applicable fee waivers and/or expense limitations in effect during the periods shown. In their absence, performance would be reduced. Returns do not reflect the deduction of taxes that a shareholder would pay on Fund distributions or the redemption of Fund shares.
| | | | | | | | | | |
| | EXPENSE RATIOS4 | |
| | | | | Net Expense Ratio (Current) | | | Gross Expense Ratio (Before Waivers) | |
| | | Institutional | | | 0.57 | % | | | 1.03 | % |
| | 4 | | The expense ratios of the Fund, both current (net of applicable fee waivers and/or expense limitations) and before waivers (gross of applicable fee waivers and/or expense limitations) are as set forth above according to the most recent publicly available Prospectus for the Fund and may differ from the expense ratios disclosed in the Financial Highlights in this report. Pursuant to a contractual arrangement, the Fund’s waivers and/or expense limitations will remain in place through at least February 28, 2017, and prior to such date the investment adviser may not terminate the arrangements without the approval of the Fund’s Board of Trustees. If these arrangements are discontinued in the future, the expense ratios may change without shareholder approval. |
5
FUND BASICS
| | | | | | | | |
| | TOP TEN EQUITY HOLDINGS AS OF 10/31/165 |
| | | Holding | | % of Net Assets | | | Line of Business |
| | Taiwan Semiconductor Manufacturing Co. Ltd. ADR | | | 2.2 | % | | Semiconductors & Semiconductor
Equipment |
| | Nestle SA | | | 2.2 | | | Food Products |
| | Reckitt Benckiser Group PLC | | | 2.1 | | | Household Products |
| | Akzo Nobel NV | | | 1.8 | | | Chemicals |
| | Schneider Electric SE | | | 1.7 | | | Electrical Equipment |
| | Volkswagen AG | | | 1.7 | | | Automobiles |
| | Roche Holding AG | | | 1.6 | | | Pharmaceuticals |
| | Compass Group PLC | | | 1.6 | | | Hotels, Restaurants & Leisure |
| | Chubb Ltd. | | | 1.6 | | | Insurance |
| | | Novartis AG | | | 1.6 | | | Pharmaceuticals |
| | 5 | | The top 10 holdings may not be representative of the Fund’s future investments. |
|
| FUND VS. BENCHMARK SECTOR ALLOCATIONS (%)6 |
| As of October 31, 2016 |
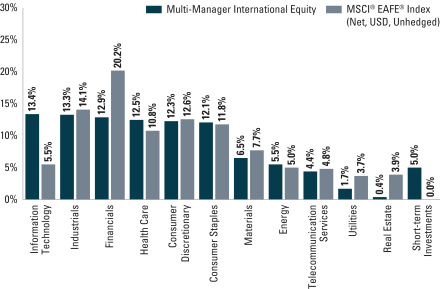
| | 6 | | The Fund is actively managed and, as such, its composition may differ over time. Consequently, the Fund’s overall sector allocations may differ from the percentages contained in the graph above. The graph categorizes investments using the Global Industry Classification Standard (“GICS”), however, the sector classifications used by the portfolio management team may differ from GICS. The percentage shown for each investment category reflects the value of investments in that category as a percentage of market value. Short-term investments represent repurchase agreements. The graph depicts the Fund’s investments but may not represent the Fund’s market exposure due to the exclusion of certain derivatives, if any, as listed in the Additional Investment Information section of the Schedule of Investments. |
6
MULTI-MANAGER INTERNATIONAL EQUITY FUND
Performance Summary
October 31, 2016
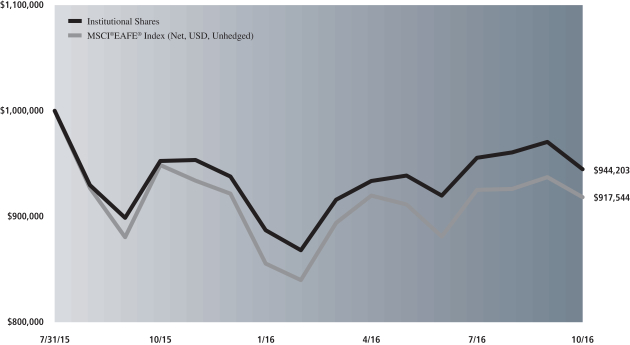
The following graph shows the value, as of October 31, 2016, of a $1,000,000 investment made on July 31, 2015 (commencement of operations) in Institutional Shares at NAV. For comparative purposes, the performance of the Fund’s benchmark, the MSCI® EAFE® Index (Net, USD, Unhedged) is shown. This performance data represents past performance and should not be considered indicative of future performance, which will fluctuate with changes in market conditions. These performance fluctuations may cause an investor’s shares, when redeemed, to be worth more or less than their original cost. Performance reflects applicable fee waivers and/or expense limitations in effect during the periods shown and in their absence, performance would be reduced. Returns do not reflect the deduction of taxes that a shareholder would pay on Fund distributions or the redemption of Fund shares. In addition to the Underlying Managers’ decisions regarding issuer/industry investment selection and allocation, other factors may affect Fund performance. These factors include, but are not limited to, Fund operating fees and expenses, portfolio turnover and subscription and redemption cash flows affecting the Fund.
|
| Multi-Manager International Equity Fund’s Lifetime Performance |
Performance of a $1,000,000 Investment, with distributions reinvested, from July 31, 2015 through October 31, 2016.
| | | | |
| Average Annual Total Return through October 31, 2016 | | One Year | | Since Inception |
|
Institutional (Commenced July 31, 2015) | | -0.82% | | -4.46% |
|
7
PORTFOLIO RESULTS
Multi-Manager U.S. Dynamic Equity Fund
Investment Objective and Principal Strategy
The Fund seeks to provide long-term capital growth.
Portfolio Management Discussion and Analysis
Below, the Goldman Sachs Alternative Investments & Manager Selection (“AIMS”) Group discusses the Multi-Manager U.S. Dynamic Equity Fund’s (the “Fund”) performance and positioning for the 12-month period ended October 31, 2016 (the “Reporting Period”).
| Q | | How did the Fund perform during the Reporting Period? |
| A | | During the Reporting Period, the Fund’s Institutional Shares generated an average annual total return of -3.54%. This return compares to the 4.50% average annual total return of the Fund’s benchmark, the S&P 500® Total Return Index (the “Index”) during the same time period. |
| Q | | What key factors were responsible for the Fund’s performance during the Reporting Period? |
| A | | The Fund’s performance during the Reporting Period can be attributed to the performance of the Fund’s Underlying Managers, who are unaffiliated investment managers that employ a dynamic equity investment strategy. During the Reporting Period, the Fund allocated capital to four Underlying Managers as part of its top-level strategy allocation — Sirios Capital Management, L.P. (“Sirios”), Smead Capital Management, Inc. (“Smead”), Weitz Investment Management, Inc. (“Weitz”) and Lazard Asset Management LLC (“Lazard”). Lazard was added as an Underlying Manager and funded in September 2016. |
| | Of the four Underlying Managers with allocated capital during the Reporting Period, all four generated negative absolute returns. While all four Underlying Managers also underperformed the Index on a relative basis, Sirios and Smead experienced the most notable underperformance. |
| Q | | Which dynamic equity strategies most significantly affected Fund performance? |
| A | | The Fund’s relative underperformance was driven most by core-oriented manager Smead and growth-oriented manager Sirios. Smead lagged the Index due primarily to stock selection within and an overweight to consumer discretionary, partially offset by its underweight to energy, which contributed positively. Stock selection in health care and financials detracted most from Sirios’ relative results, only partially offset by effective positioning in information technology and consumer staples. Stock selection in consumer discretionary and health care negatively impacted performance for Weitz, partially mitigated by favorable stock selection in energy and industrials. Lazard marginally contributed to the Fund’s underperformance since funding in September 2016 due to weak stock selection in information technology and consumer discretionary. |
| Q | | How did the Fund use derivatives and similar instruments during the Reporting Period? |
| A | | The Fund used forward foreign currency exchange contracts to take positions in select non-U.S. markets. The use of these derivatives did not have a material impact on the Fund’s results during the Reporting Period. |
| Q | | Were there any notable changes in the Fund’s allocations during the Reporting Period? |
| A | | Allocations to Weitz were halted in November 2015 and thereafter cash flows into the Fund were allocated to Sirios and Smead and Weitz’s allocation was reduced. In April 2016, we revised the target Underlying Manager allocations from 33% each to 35.5% to Sirios, 35.5% to Smead and 28% to Weitz with the remainder of the Fund’s assets invested in cash and cash equivalents. Weitz’s allocation was further reduced to 18% in September 2016 in order to fund Lazard at 10%. |
| | As of October 31, 2016, the Fund’s assets were allocated approximately 35.5% to Sirios, 35.5% to Smead, 18% to Weitz and 10% to Lazard. |
8
PORTFOLIO RESULTS
| Q | | Were there any changes to the Fund’s management team during the Reporting Period? |
| A | | Effective August 19, 2016, Jason Gottlieb was removed as a portfolio manager of the Fund. Kent Clark and Yvonne Woo were added as portfolio managers of the Fund, joining Betsy Gorton. |
| Q | | What is the Fund’s tactical view and strategy for the months ahead? |
| A | | The addition of Lazard as an Underlying Manager in September 2016 moderately reduced the Fund’s overweight to consumer discretionary and, within financials, to banks, and added more exposure to the information technology and consumer staples sectors in the Fund. That said, compared to the Index, the Fund was still overweight to consumer discretionary at the end of the Reporting Period, primarily concentrated in media. The Fund was underweight to information technology, consumer staples and industrials at the end of the Reporting Period and had no exposure to utilities, which had been a drag on relative results year-to-date through October 31, 2016. The Fund held an approximately 4% position in cash at the end of October 2016. In terms of market capitalization, the Fund maintained a significant underweight to mega caps and an overweight relative to the Index in small/mid cap stocks. Regionally, the Fund was primarily invested in North American equities, but also had modest exposure to companies domiciled in Europe and the U.K. |
| | We intend to continue to position the Fund in alignment with our longer-term strategic views within the U.S. equity complex. We further intend to continue to monitor allocations and Underlying Manager performance as we seek to generate long-term capital growth. |
9
FUND BASICS
Multi-Manager U.S. Dynamic Equity Fund
as of October 31, 2016
| | | | | | | | | | |
| | PERFORMANCE REVIEW | |
| | | November 1, 2015–October 31, 2016 | | Fund Total Return
(based on NAV)1 | | | S&P 500®
Total Return Index2 | |
| | | Institutional | | | -3.54 | % | | | 4.50 | % |
| | 1 | | The net asset value (“NAV”) represents the net assets of the class of the Fund (ex-dividend) divided by the total number of shares of the class outstanding. The Fund’s performance assumes the reinvestment of dividends and other distributions. |
| | 2 | | The S&P 500® Total Return Index is the Standard & Poor’s 500 Composite Index of 500 stocks, an unmanaged index of common stock prices. The Index figures do not reflect any deductions for fees, expenses or taxes. It is not possible to invest directly in an index. |
| | | | | | | | | | | | | | |
| | STANDARDIZED TOTAL RETURNS3 | |
| | | For the period ended 9/30/16 | | One Year | | | Since Inception | | | Inception Date | |
| | | Institutional | | | 4.69 | % | | | -4.94 | % | | | 7/31/15 | |
| | 3 | | The Standardized Total Returns are average annual total returns or cumulative total returns (only if the performance period is one year or less) as of the most recent calendar quarter-end. They assume reinvestment of all distributions at NAV. Because Institutional Shares do not involve a sales charge, such a charge is not applied to their Standardized Total Returns. |
The returns set forth in the tables above represent past performance. Past performance does not guarantee future results. The Fund’s investment return and principal value will fluctuate so that an investor’s shares, when redeemed, may be worth more or less than their original cost. Current performance may be lower or higher than the performance quoted above. Please visit our web site at www.GSAMFUNDS.com to obtain the most recent month-end returns. Performance reflects applicable fee waivers and/or expense limitations in effect during the periods shown. In their absence, performance would be reduced. Returns do not reflect the deduction of taxes that a shareholder would pay on Fund distributions or the redemption of Fund shares.
| | | | | | | | | | |
| | EXPENSE RATIOS4 | |
| | | | | Net Expense Ratio (Current) | | | Gross Expense Ratio (Before Waivers) | |
| | | Institutional | | | 0.79 | % | | | 1.44 | % |
| | 4 | | The expense ratios of the Fund, both current (net of applicable fee waivers and/or expense limitations) and before waivers (gross of applicable fee waivers and/or expense limitations) are as set forth above according to the most recent publicly available Prospectus for the Fund and may differ from the expense ratios disclosed in the Financial Highlights in this report. Pursuant to a contractual arrangement, the Fund’s waivers and/or expense limitations will remain in place through at least February 28, 2017, and prior to such date the investment adviser may not terminate the arrangements without the approval of the Fund’s Board of Trustees. If these arrangements are discontinued in the future, the expense ratios may change without shareholder approval. |
10
FUND BASICS
| | | | | | | | |
| | TOP TEN EQUITY HOLDINGS AS OF 10/31/165 |
| | | Holding | | % of Net Assets | | | Line of Business |
| | Berkshire Hathaway, Inc. Class B | | | 3.5 | % | | Diversified Financial Services |
| | Allergan PLC | | | 3.4 | | | Pharmaceuticals |
| | Bank of America Corp. | | | 3.3 | | | Banks |
| | eBay, Inc. | | | 2.3 | | | Internet Software & Services |
| | NVR, Inc. | | | 2.1 | | | Household Durables |
| | Time Warner, Inc. | | | 2.1 | | | Media |
| | Wells Fargo & Co. | | | 2.1 | | | Banks |
| | Constellation Brands, Inc. Class A | | | 2.1 | | | Beverages |
| | Amgen, Inc. | | | 2.0 | | | Biotechnology |
| | | Aflac, Inc. | | | 1.8 | | | Insurance |
| | 5 | | The top 10 holdings may not be representative of the Fund’s future investments. |
|
| FUND VS. BENCHMARK SECTOR ALLOCATIONS (%)6 |
| As of October 31, 2016 |
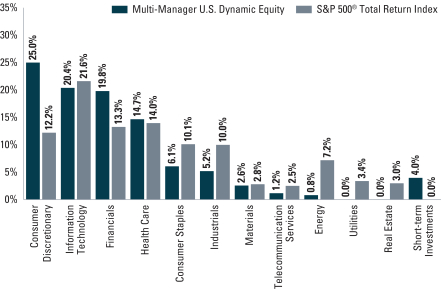
| | 6 | | The Fund is actively managed and, as such, its composition may differ over time. Consequently, the Fund’s overall sector allocations may differ from the percentages contained in the graph above. The graph categorizes investments using the Global Industry Classification Standard (“GICS”), however, the sector classifications used by the portfolio management team may differ from GICS. The percentage shown for each investment category reflects the value of investments in that category as a percentage of market value. Short-term investments represent repurchase agreements. The graph depicts the Fund’s investments but may not represent the Fund’s market exposure due to the exclusion of certain derivatives, if any, as listed in the Additional Investment Information section of the Schedule of Investments. |
11
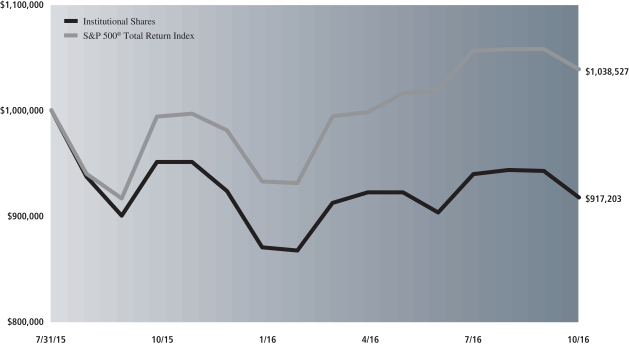
MULTI-MANAGER U.S. DYNAMIC EQUITY FUND
Performance Summary
October 31, 2016
The following graph shows the value, as of October 31, 2016, of a $1,000,000 investment made on July 31, 2015 (commencement of operations) in Institutional Shares at NAV. For comparative purposes, the performance of the Fund’s benchmark, the S&P 500® Total Return Index is shown. This performance data represents past performance and should not be considered indicative of future performance, which will fluctuate with changes in market conditions. These performance fluctuations may cause an investor’s shares, when redeemed, to be worth more or less than their original cost. Performance reflects applicable fee waivers and/or expense limitations in effect during the periods shown and in their absence, performance would be reduced. Returns do not reflect the deduction of taxes that a shareholder would pay on Fund distributions or the redemption of Fund shares. In addition to the Underlying Managers’ decisions regarding issuer/industry investment selection and allocation, other factors may affect Fund performance. These factors include, but are not limited to, Fund operating fees and expenses, portfolio turnover and subscription and redemption cash flows affecting the Fund.
|
| Multi-Manager U.S. Dynamic Equity Fund’s Lifetime Performance |
Performance of a $1,000,000 Investment, with distributions reinvested, from July 31, 2015 through October 31, 2016.
| | | | |
| Average Annual Total Return through October 31, 2016 | | One Year | | Since Inception |
|
Institutional (Commenced July 31, 2015) | | -3.54% | | -6.64% |
|
12
PORTFOLIO RESULTS
Multi-Manager U.S. Small Cap Equity Fund
Investment Objective and Principal Strategy
The Fund seeks to provide long-term capital growth.
Portfolio Management Discussion and Analysis
The Multi-Manager U.S. Small Cap Equity Fund (the “Fund”) commenced operations on April 29, 2016. Below, the Goldman Sachs Alternative Investments & Manager Selection (“AIMS”) Group discusses the Fund’s performance and positioning for the period from its inception on April 29, 2016 through October 31, 2016 (the “Reporting Period”).
| Q | | How did the Fund perform during the Reporting Period? |
| A | | During the Reporting Period, the Fund’s Institutional Shares generated a cumulative total return of 5.20%. This return compares to the 6.13% cumulative total return of the Fund’s benchmark, the Russell 2000® Total Return Index (the “Index”) during the same time period. |
| Q | | What key factors were responsible for the Fund’s performance during the Reporting Period? |
| A | | While the Fund posted solid positive absolute returns, it underperformed the Index during the Reporting Period. The Fund’s performance during the Reporting Period can be attributed to the performance of the Fund’s Underlying Managers, who are unaffiliated investment managers that employ a small-cap equity investment strategy. During the Reporting Period, the Fund allocated capital to three Underlying Managers as part of its top-level strategy allocation — Brown Advisory LLC (“Brown Advisory”), PNC Capital Advisors, LLC (“PNC”) and Robeco Investment Management, Inc., doing business as Boston Partners (“Boston Partners”). |
| | Of the three Underlying Managers with allocated capital during the Reporting Period, all three generated positive absolute returns. However, on a relative basis, two of the Underlying Managers outperformed their respective benchmark index, while one underperformed its benchmark index during the Reporting Period. |
| Q | | Which dynamic equity strategies most significantly affected Fund performance? |
| A | | The Fund’s relative underperformance was driven most by core-oriented manager PNC and value-oriented manager Boston Partners. PNC underperformed the Index due to weak stock selection in financials and information technology, partially offset by stock selection in materials, which contributed positively. Boston Partners underperformed the Russell 2000® Value Index due to positioning in materials, health care and information technology. Boston Partners’ underperformance was somewhat mitigated by favorable positioning in consumer discretionary. Growth-oriented manager Brown Advisory outperformed the Russell 2000® Growth Index due to effective stock selection and allocation positioning within consumer discretionary, strong stock selection in information technology, and a favorable underweight to and stock selection in health care. Brown Advisory’s relative results were dampened somewhat by positioning in consumer staples and energy, which detracted from performance. |
| Q | | How did the Fund use derivatives and similar instruments during the Reporting Period? |
| A | | The Fund did not use derivatives or similar instruments during the Reporting Period. |
| Q | | Were there any notable changes in the Fund’s allocations during the Reporting Period? |
| A | | As the Fund was launched on April 29, 2016, it was not a matter of making changes during the Reporting Period but of building the Fund’s portfolios. As of October 31, 2016, the Fund’s assets were allocated approximately 44% to Boston Partners, 30% to Brown Advisory and 25% to PNC. |
| Q | | Were there any changes to the Fund’s management team during the Reporting Period? |
| A | | Effective August 19, 2016, Jason Gottlieb was removed as a portfolio manager of the Fund. Kent Clark and Yvonne Woo |
13
PORTFOLIO RESULTS
| | were added as portfolio managers of the Fund, joining Betsy Gorton. |
| Q | | What is the Fund’s tactical view and strategy for the months ahead? |
| A | | Compared to the Index, the Fund did not have significantly overweighted or underweighted sector allocations at the end of the Reporting Period but was moderately overweight to industrials and financials and modestly underweight to real estate, utilities and health care. The Fund held an approximately 5% position in cash at the end of October 2016. In terms of market capitalization, the Fund maintained a slight small-mid cap bias, driven predominantly by Underlying Manager Brown Advisory. |
| | We intend to continue to position the Fund in alignment with our longer-term strategic views within the U.S. small-cap equity complex. We further intend to continue to monitor allocations and Underlying Manager performance as we seek to generate long-term capital growth. |
14
FUND BASICS
Multi-Manager U.S. Small Cap Equity Fund
as of October 31, 2016
| | | | | | | | | | |
| | PERFORMANCE REVIEW | |
| | | April 29, 2016–October 31, 2016 | | Fund Total Return
(based on NAV)1 | | | Russell 2000®
Total Return Index2 | |
| | | Institutional | | | 5.20 | % | | | 6.13 | % |
| | 1 | | The net asset value (“NAV”) represents the net assets of the class of the Fund (ex-dividend) divided by the total number of shares of the class outstanding. The Fund’s performance assumes the reinvestment of dividends and other distributions. |
| | 2 | | The Russell 2000® Total Return Index is an unmanaged index of common stock prices that measures the performance of the 2000 smallest companies in the Russell 3000® Index. The Index is constructed to provide a comprehensive and unbiased small-cap barometer and is completely reconstituted annually to ensure larger stocks do not distort the performance and characteristics of the true small-cap opportunity set. |
| | | | | | | | | | |
| | STANDARDIZED TOTAL RETURNS3 | |
| | | For the period ended 9/30/16 | | Since Inception | | | Inception Date | |
| | | Institutional | | | 9.90 | % | | | 4/29/16 | |
| | 3 | | The Standardized Total Returns are average annual total returns or cumulative total returns (only if the performance period is one year or less) as of the most recent calendar quarter-end. They assume reinvestment of all distributions at NAV. Because Institutional Shares do not involve a sales charge, such a charge is not applied to their Standardized Total Returns. |
The returns set forth in the tables above represent past performance. Past performance does not guarantee future results. The Fund’s investment return and principal value will fluctuate so that an investor’s shares, when redeemed, may be worth more or less than their original cost. Current performance may be lower or higher than the performance quoted above. Please visit our web site at www.GSAMFUNDS.com to obtain the most recent month-end returns. Performance reflects applicable fee waivers and/or expense limitations in effect during the periods shown. In their absence, performance would be reduced. Returns do not reflect the deduction of taxes that a shareholder would pay on Fund distributions or the redemption of Fund shares.
| | | | | | | | | | |
| | EXPENSE RATIOS4 | |
| | | | | Net Expense Ratio (Current) | | | Gross Expense Ratio (Before Waivers) | |
| | | Institutional | | | 0.80 | % | | | 2.19 | % |
| | 4 | | The expense ratios of the Fund, both current (net of applicable fee waivers and/or expense limitations) and before waivers (gross of applicable fee waivers and/or expense limitations) are as set forth above according to the most recent publicly available Prospectus for the Fund and may differ from the expense ratios disclosed in the Financial Highlights in this report. Pursuant to a contractual arrangement, the Fund’s waivers and/or expense limitations will remain in place through at least March 31, 2017, and prior to such date the investment adviser may not terminate the arrangements without the approval of the Fund’s Board of Trustees. If these arrangements are discontinued in the future, the expense ratios may change without shareholder approval. |
15
FUND BASICS
| | | | | | | | |
| | TOP TEN EQUITY HOLDINGS AS OF 10/31/165 |
| | | Holding | | % of Net Assets | | | Line of Business |
| | Drew Industries, Inc. | | | 1.7 | % | | Auto Components |
| | EnerSys | | | 1.5 | | | Electrical Equipment |
| | HEICO Corp. | | | 1.3 | | | Aerospace & Defense |
| | World Fuel Services Corp. | | | 1.3 | | | Oil, Gas & Consumable Fuels |
| | Waste Connections, Inc. | | | 1.2 | | | Commercial Services & Supplies |
| | Lithia Motors, Inc. Class A | | | 1.2 | | | Specialty Retail |
| | PAREXEL International Corp. | | | 1.2 | | | Life Sciences Tools & Services |
| | Cogent Communications Holdings, Inc. | | | 1.0 | | | Diversified Telecommunication
Services |
| | Air Lease Corp. | | | 1.0 | | | Trading Companies & Distributors |
| | | PRA Group, Inc. | | | 1.0 | | | Consumer Finance |
| | 5 | | The top 10 holdings may not be representative of the Fund’s future investments. |
16
FUND BASICS
|
| FUND VS. BENCHMARK SECTOR ALLOCATIONS (%)6 |
| As of October 31, 2016 |
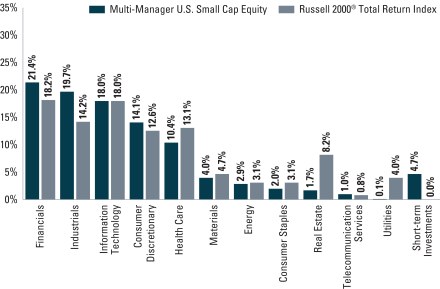
| | 6 | | The Fund is actively managed and, as such, its composition may differ over time. Consequently, the Fund’s overall sector allocations may differ from the percentages contained in the graph above. The graph categorizes investments using the Global Industry Classification Standard (“GICS”), however, the sector classifications used by the portfolio management team may differ from GICS. The percentage shown for each investment category reflects the value of investments in that category as a percentage of market value. Short-term investments represent repurchase agreements. The graph depicts the Fund’s investments but may not represent the Fund’s market exposure due to the exclusion of certain derivatives, if any, as listed in the Additional Investment Information section of the Schedule of Investments. |
17
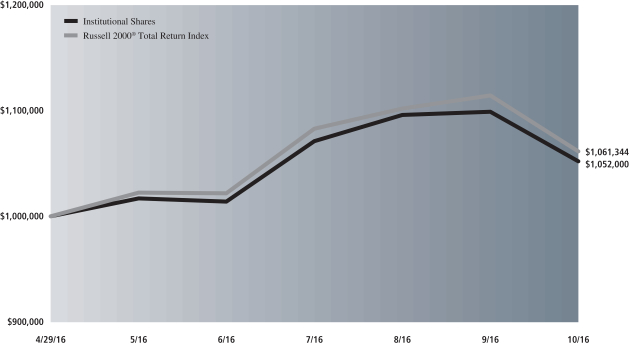
MULTI-MANAGER U.S. SMALL CAP EQUITY
Performance Summary
October 31, 2016
The following graph shows the value, as of October 31, 2016, of a $1,000,000 investment made on April 29, 2016 (commencement of operations) in Institutional Shares at NAV. For comparative purposes, the performance of the Fund’s benchmark, the Russell 2000® Total Return Index is shown. This performance data represents past performance and should not be considered indicative of future performance, which will fluctuate with changes in market conditions. These performance fluctuations may cause an investor’s shares, when redeemed, to be worth more or less than their original cost. Performance reflects applicable fee waivers and/or expense limitations in effect during the periods shown and in their absence, performance would be reduced. Returns do not reflect the deduction of taxes that a shareholder would pay on Fund distributions or the redemption of Fund shares. In addition to the Underlying Managers’ decisions regarding issuer/industry investment selection and allocation, other factors may affect Fund performance. These factors include, but are not limited to, Fund operating fees and expenses, portfolio turnover and subscription and redemption cash flows affecting the Fund.
|
| Multi-Manager U.S. Small Cap Equity Fund’s Lifetime Performance |
Performance of a $1,000,000 Investment, with distributions reinvested, from April 29, 2016 through October 31, 2016.
| | |
| Average Annual Total Return through October 31, 2016 | | Since Inception |
|
Institutional (Commenced April 29, 2016) | | 5.20%* |
|
| * | | Total return for periods of less than one year represents cumulative total return. |
18
PORTFOLIO RESULTS
Index Definitions
The Russell 2000® Growth Index measures the performance of the small-cap growth stocks of the U.S. equity universe.
The Russell 2000® Value Index measures the performance of the small-cap value stocks of the U.S. equity universe.
19
MULTI-MANAGER INTERNATIONAL EQUITY FUND
Schedule of Investments
October 31, 2016
| | | | | | | | |
Shares | | | Description | | Value | |
| | Common Stocks – 93.2% | |
| | Australia – 2.0% | |
| | 56,135 | | | CSL Ltd. (Biotechnology) | | $ | 4,283,412 | |
| | 24,868 | | | Orica Ltd. (Chemicals) | | | 307,229 | |
| | 187,307 | | | Westfield Corp. (Equity Real Estate Investment Trusts (REITs)) | | | 1,265,797 | |
| | | | | | | | |
| | | | | | | 5,856,438 | |
| | |
| | Belgium* – 0.2% | |
| | 9,662 | | | KBC Group NV (Banks) | | | 589,006 | |
| | |
| | Brazil – 0.9% | |
| | 439,723 | | | Ambev SA ADR (Beverages) | | | 2,594,366 | |
| | |
| | Canada – 3.7% | |
| | 14,231 | | | Canadian National Railway Co. (Road & Rail) | | | 894,703 | |
| | 29,042 | | | Canadian Pacific Railway Ltd. (Road & Rail) | | | 4,151,844 | |
| | 6,455 | | | Constellation Software, Inc. (Software) | | | 3,023,931 | |
| | 4,664 | | | ECN Capital Corp.* (Diversified Financial Services) | | | 10,188 | |
| | 37,861 | | | Element Fleet Management Corp. (Diversified Financial Services) | | | 368,928 | |
| | 104,600 | | | Encana Corp. (Oil, Gas & Consumable Fuels) | | | 997,416 | |
| | 3,444 | | | Loblaw Cos. Ltd. (Food & Staples Retailing) | | | 169,928 | |
| | 24,300 | | | Manulife Financial Corp. (Insurance) | | | 352,009 | |
| | 29,361 | | | Suncor Energy, Inc. (Oil, Gas & Consumable Fuels) | | | 881,071 | |
| | | | | | | | |
| | | | | | | 10,850,018 | |
| | |
| | China – 4.3% | |
| | 4,803 | | | Alibaba Group Holding Ltd. ADR* (Internet Software & Services) | | | 488,417 | |
| | 13,100 | | | Baidu, Inc. ADR* (Internet Software & Services) | | | 2,316,866 | |
| | 2,095,000 | | | CNOOC Ltd. (Oil, Gas & Consumable Fuels) | | | 2,636,084 | |
| | 72,890 | | | Ctrip.com International Ltd. ADR* (Internet & Direct Marketing Retail) | | | 3,218,094 | |
| | 153,840 | | | Tencent Holdings Ltd. (Internet Software & Services) | | | 4,077,117 | |
| | | | | | | | |
| | | | | | | 12,736,578 | |
| | |
| | Denmark – 3.9% | |
| | 4,264 | | | Carlsberg A/S Class B (Beverages) | | | 384,162 | |
| | 44,065 | | | Chr Hansen Holding A/S (Chemicals) | | | 2,638,959 | |
| | 43,697 | | | Coloplast A/S Class B (Health Care Equipment & Supplies) | | | 3,044,050 | |
| | 78,577 | | | Novo Nordisk A/S ADR (Pharmaceuticals) | | | 2,792,627 | |
| | 67,659 | | | Novozymes A/S (Chemicals) | | | 2,509,932 | |
| | | | | | | | |
| | | | | | | 11,369,730 | |
| | |
| | Common Stocks – (continued) | |
| | France – 11.1% | |
| | 12,735 | | | Air Liquide SA (Chemicals) | | $ | 1,294,037 | |
| | 33,913 | | | BNP Paribas SA (Banks) | | | 1,966,386 | |
| | 15,681 | | | Bureau Veritas SA (Professional Services) | | | 296,169 | |
| | 18,376 | | | Danone SA (Food Products) | | | 1,274,529 | |
| | 5,529 | | | Dassault Systemes (Software) | | | 437,635 | |
| | 223,632 | | | Engie SA (Multi-Utilities) | | | 3,225,157 | |
| | 23,671 | | | Essilor International SA (Health Care Equipment & Supplies) | | | 2,659,992 | |
| | 6,019 | | | Hermes International (Textiles, Apparel & Luxury Goods) | | | 2,438,330 | |
| | 3,166 | | | L’Oreal SA (Personal Products) | | | 567,218 | |
| | 29,810 | | | Legrand SA (Electrical Equipment) | | | 1,684,170 | |
| | 22,549 | | | LVMH Moet Hennessy Louis Vuitton SE (Textiles, Apparel & Luxury Goods) | | | 4,105,296 | |
| | 11,267 | | | Pernod Ricard SA (Beverages) | | | 1,339,909 | |
| | 30,393 | | | Sanofi (Pharmaceuticals) | | | 2,365,146 | |
| | 74,901 | | | Schneider Electric SE (Electrical Equipment) | | | 5,037,098 | |
| | 80,921 | | | TOTAL SA (Oil, Gas & Consumable Fuels) | | | 3,876,512 | |
| | | | | | | | |
| | | | | | | 32,567,584 | |
| | |
| | Germany – 5.0% | |
| | 14,285 | | | adidas AG (Textiles, Apparel & Luxury Goods) | | | 2,346,940 | |
| | 22,997 | | | BASF SE (Chemicals) | | | 2,030,128 | |
| | 17,752 | | | Bayer AG (Pharmaceuticals) | | | 1,762,589 | |
| | 12,198 | | | Beiersdorf AG (Personal Products) | | | 1,075,372 | |
| | 13,543 | | | Linde AG (Chemicals) | | | 2,236,851 | |
| | 6,692 | | | Merck KGaA (Pharmaceuticals) | | | 688,808 | |
| | 2,916 | | | MTU Aero Engines AG (Aerospace & Defense) | | | 304,500 | |
| | 10,254 | | | ProSiebenSat.1 Media SE (Media) | | | 441,929 | |
| | 42,162 | | | SAP SE (Software) | | | 3,714,448 | |
| | | | | | | | |
| | | | | | | 14,601,565 | |
| | |
| | Hong Kong – 2.1% | |
| | 235,600 | | | AIA Group Ltd. (Insurance) | | | 1,482,160 | |
| | 339,563 | | | China Merchants Holdings International Co. Ltd. (Transportation Infrastructure) | | | 877,914 | |
| | 322,000 | | | China Mobile Ltd. (Wireless Telecommunication Services) | | | 3,688,958 | |
| | 1,038,000 | | | Global Brands Group Holding Ltd.* (Textiles, Apparel & Luxury Goods) | | | 117,570 | |
| | 274,000 | | | Li & Fung Ltd. (Textiles, Apparel & Luxury Goods) | | | 134,692 | |
| | | | | | | | |
| | | | | | | 6,301,294 | |
| | |
| | India – 1.6% | |
| | 48,686 | | | HDFC Bank Ltd. ADR (Banks) | | | 3,445,995 | |
| | 33,412 | | | Housing Development Finance Corp. Ltd. (Thrifts & Mortgage Finance) | | | 690,022 | |
| | |
| | |
| 20 | | The accompanying notes are an integral part of these financial statements. |
MULTI-MANAGER INTERNATIONAL EQUITY FUND
| | | | | | | | |
Shares | | | Description | | Value | |
| | Common Stocks – (continued) | |
| | India – (continued) | |
| | 18,219 | | | Tata Consultancy Services Ltd. (IT Services) | | $ | 652,426 | |
| | | | | | | | |
| | | | | | | 4,788,443 | |
| | |
| | Ireland – 1.9% | |
| | 27,364 | | | Accenture PLC Class A (IT Services) | | | 3,180,791 | |
| | 29,325 | | | ICON PLC* (Life Sciences Tools & Services) | | | 2,354,211 | |
| | | | | | | | |
| | | | | | | 5,535,002 | |
| | |
| | Israel* – 0.2% | |
| | 7,352 | | | Check Point Software Technologies Ltd. (Software) | | | 621,685 | |
| | |
| | Italy – 0.3% | |
| | 32,019 | | | Eni SpA (Oil, Gas & Consumable Fuels) | | | 464,668 | |
| | 7,033 | | | Luxottica Group SpA (Textiles, Apparel & Luxury Goods) | | | 350,190 | |
| | | | | | | | |
| | | | | | | 814,858 | |
| | |
| | Japan – 11.7% | |
| | 25,500 | | | Asahi Group Holdings Ltd. (Beverages) | | | 909,609 | |
| | 5,500 | | | Daikin Industries Ltd. (Building Products) | | | 527,063 | |
| | 24,000 | | | Denso Corp. (Auto Components) | | | 1,044,360 | |
| | 42,900 | | | East Japan Railway Co. (Road & Rail) | | | 3,776,420 | |
| | 2,800 | | | FANUC Corp. (Machinery) | | | 512,645 | |
| | 674,000 | | | Hitachi Ltd. (Electronic Equipment, Instruments & Components) | | | 3,593,021 | |
| | 38,300 | | | Hoya Corp. (Health Care Equipment & Supplies) | | | 1,598,029 | |
| | 1,100 | | | Inpex Corp. (Oil, Gas & Consumable Fuels) | | | 10,262 | |
| | 88,800 | | | Japan Airlines Co. Ltd. (Airlines) | | | 2,620,647 | |
| | 23,200 | | | Japan Tobacco, Inc. (Tobacco) | | | 882,067 | |
| | 131,300 | | | KDDI Corp. (Wireless Telecommunication Services) | | | 3,990,621 | |
| | 5,150 | | | Keyence Corp. (Electronic Equipment, Instruments & Components) | | | 3,775,421 | |
| | 102,100 | | | Komatsu Ltd. (Machinery) | | | 2,272,654 | |
| | 32,500 | | | Kubota Corp. (Machinery) | | | 523,846 | |
| | 14,300 | | | Kyocera Corp. (Electronic Equipment, Instruments & Components) | | | 694,822 | |
| | 69,500 | | | Nikon Corp. (Household Durables) | | | 1,050,347 | |
| | 5,000 | | | Shin-Etsu Chemical Co. Ltd. (Chemicals) | | | 379,107 | |
| | 73,700 | | | Sumitomo Mitsui Financial Group, Inc. (Banks) | | | 2,555,301 | |
| | 37,495 | | | Sysmex Corp. (Health Care Equipment & Supplies) | | | 2,598,481 | |
| | 30,700 | | | TERUMO Corp. (Health Care Equipment & Supplies) | | | 1,187,223 | |
| | | | | | | | |
| | | | | | | 34,501,946 | |
| | |
| | Common Stocks – (continued) | |
| | Luxembourg* – 0.3% | |
| | 141,928 | | | ArcelorMittal (Metals & Mining) | | $ | 959,001 | |
| | |
| | Mexico – 0.5% | |
| | 742,665 | | | Wal-Mart de Mexico SAB de CV (Food & Staples Retailing) | | | 1,571,302 | |
| | |
| | Netherlands – 5.4% | |
| | 83,942 | | | Akzo Nobel NV (Chemicals) | | | 5,423,580 | |
| | 29,598 | | | Core Laboratories NV (Energy Equipment & Services) | | | 2,870,118 | |
| | 902 | | | Heineken NV (Beverages) | | | 74,296 | |
| | 153,468 | | | ING Groep NV (Banks) | | | 2,014,576 | |
| | 212,842 | | | PostNL NV* (Air Freight & Logistics) | | | 1,002,414 | |
| | 20,252 | | | Randstad Holding NV (Professional Services) | | | 1,041,618 | |
| | 76,346 | | | RELX NV (Professional Services) | | | 1,287,387 | |
| | 113,362 | | | Yandex NV Class A* (Internet Software & Services) | | | 2,232,098 | |
| | | | | | | | |
| | | | | | | 15,946,087 | |
| | |
| | Singapore – 0.4% | |
| | 75,400 | | | DBS Group Holdings Ltd. (Banks) | | | 812,714 | |
| | 105,100 | | | Singapore Telecommunications Ltd. (Diversified Telecommunication Services) | | | 292,906 | |
| | | | | | | | |
| | | | | | | 1,105,620 | |
| | |
| | South Africa – 1.0% | |
| | 190,748 | | | Shoprite Holdings Ltd. (Food & Staples Retailing) | | | 2,814,950 | |
| | |
| | South Korea – 2.3% | |
| | 8,606 | | | KT&G Corp. (Tobacco) | | | 848,811 | |
| | 4,392 | | | Samsung Electronics Co. Ltd. GDR (Technology Hardware, Storage & Peripherals) | | | 3,098,556 | |
| | 131,100 | | | SK Telecom Co. Ltd. ADR (Wireless Telecommunication Services) | | | 2,864,535 | |
| | | | | | | | |
| | | | | | | 6,811,902 | |
| | |
| | Spain – 1.4% | |
| | 13,490 | | | Amadeus IT Group SA (IT Services) | | | 634,891 | |
| | 592,202 | | | CaixaBank SA (Banks) | | | 1,786,903 | |
| | 46,384 | | | Industria de Diseno Textil SA (Specialty Retail) | | | 1,618,450 | |
| | | | | | | | |
| | | | | | | 4,040,244 | |
| | |
| | Sweden – 0.6% | |
| | 62,865 | | | Alfa Laval AB (Machinery) | | | 901,903 | |
| | 26,408 | | | Hennes & Mauritz AB (Specialty Retail) | | | 742,663 | |
| | | | | | | | |
| | | | | | | 1,644,566 | |
| | |
| | Switzerland – 12.5% | |
| | 91,476 | | | ABB Ltd.* (Electrical Equipment) | | | 1,887,188 | |
| | 47,382 | | | Aryzta AG* (Food Products) | | | 2,082,034 | |
| | 36,985 | | | Chubb Ltd. (Insurance) | | | 4,697,095 | |
| | |
| | |
| The accompanying notes are an integral part of these financial statements. | | 21 |
MULTI-MANAGER INTERNATIONAL EQUITY FUND
Schedule of Investments (continued)
October 31, 2016
| | | | | | | | |
Shares | | | Description | | Value | |
| | Common Stocks – (continued) | |
| | Switzerland – (continued) | |
| | 37,059 | | | Cie Financiere Richemont SA (Textiles, Apparel & Luxury Goods) | | $ | 2,382,518 | |
| | 37,638 | | | Clariant AG* (Chemicals) | | | 623,265 | |
| | 1,986 | | | Kuehne & Nagel International AG (Marine) | | | 269,187 | |
| | 87,172 | | | Nestle SA (Food Products) | | | 6,321,179 | |
| | 65,690 | | | Novartis AG (Pharmaceuticals) | | | 4,661,860 | |
| | 20,647 | | | Roche Holding AG (Pharmaceuticals) | | | 4,742,235 | |
| | 1,434 | | | SGS SA (Professional Services) | | | 2,902,549 | |
| | 1,953 | | | Sonova Holding AG (Health Care Equipment & Supplies) | | | 261,922 | |
| | 152,805 | | | UBS Group AG (Capital Markets) | | | 2,160,305 | |
| | 13,914 | | | Zurich Insurance Group AG* (Insurance) | | | 3,642,080 | |
| | | | | | | | |
| | | | | | | 36,633,417 | |
| | |
| | Taiwan – 2.3% | |
| | 29,466 | | | Hon Hai Precision Industry Co. Ltd. GDR (Electronic Equipment, Instruments & Components) | | | 159,409 | |
| | 212,275 | | | Taiwan Semiconductor Manufacturing Co. Ltd. ADR (Semiconductors & Semiconductor Equipment) | | | 6,601,752 | |
| | | | | | | | |
| | | | | | | 6,761,161 | |
| | |
| | United Kingdom – 17.3% | |
| | 587,220 | | | Aviva PLC (Insurance) | | | 3,182,013 | |
| | 411,169 | | | Balfour Beatty PLC (Construction & Engineering) | | | 1,363,233 | |
| | 1,336,548 | | | Barclays PLC (Banks) | | | 3,096,524 | |
| | 61,751 | | | British American Tobacco PLC (Tobacco) | | | 3,539,131 | |
| | 57,724 | | | Carnival PLC (Hotels, Restaurants & Leisure) | | | 2,784,195 | |
| | 402,472 | | | Cobham PLC (Aerospace & Defense) | | | 702,212 | |
| | 260,234 | | | Compass Group PLC (Hotels, Restaurants & Leisure) | | | 4,708,746 | |
| | 4,571 | | | Delphi Automotive PLC (Auto Components) | | | 297,435 | |
| | 107,251 | | | Diageo PLC (Beverages) | | | 2,854,650 | |
| | 175,576 | | | Experian PLC (Professional Services) | | | 3,375,367 | |
| | 89,732 | | | GlaxoSmithKline PLC (Pharmaceuticals) | | | 1,772,595 | |
| | 3,076,011 | | | Lloyds Banking Group PLC (Banks) | | | 2,148,049 | |
| | 172,092 | | | Prudential PLC (Insurance) | | | 2,808,347 | |
| | 68,579 | | | Reckitt Benckiser Group PLC (Household Products) | | | 6,135,112 | |
| | 15,403 | | | Rio Tinto PLC (Metals & Mining) | | | 535,644 | |
| | 2,142,685 | | | Rolls-Royce Holdings PLC* (Aerospace & Defense) | | | 414,610 | |
| | 168,209 | | | Royal Dutch Shell PLC Class B (Oil, Gas & Consumable Fuels) | | | 4,338,531 | |
| | 63,604 | | | Sky PLC (Media) | | | 635,865 | |
| | 21,233 | | | Smiths Group PLC (Industrial Conglomerates) | | | 367,929 | |
| | 98,659 | | | SSE PLC (Electric Utilities) | | | 1,918,231 | |
| | |
| | Common Stocks – (continued) | |
| | United Kingdom – (continued) | |
| | 721,580 | | | Vodafone Group PLC (Wireless Telecommunication Services) | | $ | 1,981,693 | |
| | 80,261 | | | WPP PLC (Media) | | | 1,742,711 | |
| | | | | | | | |
| | | | | | | 50,702,823 | |
| | |
| | United States – 0.3% | |
| | 11,297 | | | Yum! Brands, Inc. (Hotels, Restaurants & Leisure) | | | 974,705 | |
| | |
| | TOTAL COMMON STOCKS | | | | |
| | (Cost $273,338,702) | | $ | 273,694,291 | |
| | |
| | | | | | | | |
| | Preferred Stock – 1.7% | |
| | Germany – 1.7% | |
| | 36,368 | | | Volkswagen AG (Automobiles) | | | | |
| | (Cost $5,195,168) | | $ | 5,014,257 | |
| | |
| | | | | | | | | | | | | | |
Principal Amount | | | Interest
Rate | | | Maturity
Date | | | Value | |
| | Short-term Investment(a) – 5.0% | |
| | Repurchase Agreements – 5.0% | |
| Joint Repurchase Agreement Account II | |
| $ | 14,600,000 | | | | 0.338 | % | | | 11/01/16 | | | $ | 14,600,000 | |
| | (Cost $14,600,000) | | | | | |
| | |
| | TOTAL INVESTMENTS – 99.9% | |
| | (Cost $293,133,870) | | | $ | 293,308,548 | |
| | |
| OTHER ASSETS IN EXCESS OF
LIABILITIES – 0.1% |
| | | 311,627 | |
| | |
| | NET ASSETS – 100.0% | | | $ | 293,620,175 | |
| | |
| | |
| The percentage shown for each investment category reflects the value of investments in that category as a percentage of net assets. |
* | | Non-income producing security. |
(a) | | Joint repurchase agreement was entered into on October 31, 2016. Additional information appears on page 31. |
| | |
|
Investment Abbreviations: |
ADR | | —American Depositary Receipt |
GDR | | —Global Depository Receipt |
PLC | | —Public Limited Company |
|
| | |
| 22 | | The accompanying notes are an integral part of these financial statements. |
MULTI-MANAGER U.S. DYNAMIC EQUITY FUND
Schedule of Investments
October 31, 2016
| | | | | | | | |
Shares | | | Description | | Value | |
| | Common Stocks – 94.2% | |
| | Aerospace & Defense – 1.1% | |
| | 12,214 | | | Airbus Group SE | | $ | 725,266 | |
| | 2,590 | | | TransDigm Group, Inc. | | | 705,671 | |
| | | | | | | | |
| | | | | | | 1,430,937 | |
| | |
| | Air Freight & Logistics – 1.8% | |
| | 14,054 | | | FedEx Corp. | | | 2,449,893 | |
| | |
| | Airlines – 0.6% | |
| | 11,814 | | | Alaska Air Group, Inc. | | | 853,207 | |
| | |
| | Auto Components – 0.2% | |
| | 4,215 | | | Delphi Automotive PLC | | | 274,270 | |
| | |
| | Banks – 8.5% | |
| | 272,057 | | | Bank of America Corp. | | | 4,488,940 | |
| | 32,800 | | | Bank of the Ozarks, Inc. | | | 1,212,288 | |
| | 35,057 | | | JPMorgan Chase & Co. | | | 2,428,048 | |
| | 61,991 | | | Wells Fargo & Co. | | | 2,852,206 | |
| | 17,110 | | | Western Alliance Bancorp* | | | 639,230 | |
| | | | | | | | |
| | | | | | | 11,620,712 | |
| | |
| | Beverages – 2.6% | |
| | 16,716 | | | Constellation Brands, Inc. Class A | | | 2,793,578 | |
| | 6,835 | | | Molson Coors Brewing Co. Class B | | | 709,541 | |
| | | | | | | | |
| | | | | | | 3,503,119 | |
| | |
| | Biotechnology – 2.0% | |
| | 19,452 | | | Amgen, Inc. | | | 2,745,844 | |
| | |
| | Capital Markets – 2.6% | |
| | 17,276 | | | Affiliated Managers Group, Inc.* | | | 2,291,834 | |
| | 2,493 | | | Intercontinental Exchange, Inc. | | | 674,082 | |
| | 43,639 | | | OM Asset Management PLC | | | 614,001 | |
| | | | | | | | |
| | | | | | | 3,579,917 | |
| | |
| | Chemicals – 2.0% | |
| | 9,869 | | | The Sherwin-Williams Co. | | | 2,416,523 | |
| | 14,901 | | | Valvoline, Inc.* | | | 303,981 | |
| | | | | | | | |
| | | | | | | 2,720,504 | |
| | |
| | Commercial Services & Supplies* – 0.5% | |
| | 12,925 | | | Copart, Inc. | | | 678,175 | |
| | |
| | Communications Equipment – 2.1% | |
| | 34,900 | | | Cisco Systems, Inc. | | | 1,070,732 | |
| | 18,953 | | | Juniper Networks, Inc. | | | 499,222 | |
| | 11,025 | | | Motorola Solutions, Inc. | | | 800,195 | |
| | 30,891 | | | Radware Ltd.* | | | 417,337 | |
| | | | | | | | |
| | | | | | | 2,787,486 | |
| | |
| | Consumer Finance – 1.8% | |
| | 36,142 | | | American Express Co. | | | 2,400,552 | |
| | |
| | Containers & Packaging* – 0.6% | |
| | 14,040 | | | Crown Holdings, Inc. | | | 761,670 | |
| | |
| | Diversified Financial Services* – 3.5% | |
| | 33,063 | | | Berkshire Hathaway, Inc. Class B | | | 4,770,991 | |
| | |
| | Common Stocks – (continued) | |
| | Diversified Telecommunication Services(a) – 0.9% | |
| | 34,642 | | | Cellnex Telecom SAU | | $ | 568,094 | |
| | 10,455 | | | Sunrise Communications Group AG* | | | 714,341 | |
| | | | | | | | |
| | | | | | | 1,282,435 | |
| | |
| | Electronic Equipment, Instruments & Components – 0.4% | |
| | 17,135 | | | FLIR Systems, Inc. | | | 564,084 | |
| | |
| | Food & Staples Retailing – 1.7% | |
| | 27,180 | | | Walgreens Boots Alliance, Inc. | | | 2,248,601 | |
| | |
| | Food Products – 1.0% | |
| | 18,414 | | | Nestle SA | | | 1,335,270 | |
| | |
| | Health Care Equipment & Supplies – 0.9% | |
| | 7,426 | | | Becton Dickinson & Co. | | | 1,246,900 | |
| | |
| | Health Care Providers & Services – 3.4% | |
| | 8,037 | | | Acadia Healthcare Co., Inc.* | | | 289,010 | |
| | 28,702 | | | Express Scripts Holding Co.* | | | 1,934,515 | |
| | 7,655 | | | HCA Holdings, Inc.* | | | 585,837 | |
| | 8,700 | | | Laboratory Corp. of America Holdings* | | | 1,090,458 | |
| | 5,963 | | | Universal Health Services, Inc. Class B | | | 719,794 | |
| | | | | | | | |
| | | | | | | 4,619,614 | |
| | |
| | Hotels, Restaurants & Leisure – 2.1% | |
| | 42,205 | | | ILG, Inc. | | | 691,318 | |
| | 14,842 | | | McDonald’s Corp. | | | 1,670,764 | |
| | 10,036 | | | Starbucks Corp. | | | 532,610 | |
| | | | | | | | |
| | | | | | | 2,894,692 | |
| | |
| | Household Durables – 2.8% | |
| | 22,555 | | | Lennar Corp. Class A | | | 940,318 | |
| | 1,892 | | | NVR, Inc.* | | | 2,881,516 | |
| | | | | | | | |
| | | | | | | 3,821,834 | |
| | |
| | Household Products – 0.5% | |
| | 8,360 | | | The Procter & Gamble Co. | | | 725,648 | |
| | |
| | Insurance – 2.4% | |
| | 35,686 | | | Aflac, Inc. | | | 2,457,695 | |
| | 4,500 | | | Aon PLC | | | 498,735 | |
| | 2,645 | | | Willis Towers Watson PLC | | | 333,005 | |
| | | | | | | | |
| | | | | | | 3,289,435 | |
| | |
| | Internet & Direct Marketing Retail* – 0.7% | |
| | 53,300 | | | Liberty Interactive Corp. QVC Group Class A | | | 985,517 | |
| | |
| | Internet Software & Services* – 4.0% | |
| | 1,570 | | | Alphabet, Inc. Class A | | | 1,271,543 | |
| | 1,290 | | | Alphabet, Inc. Class C | | | 1,012,057 | |
| | 111,107 | | | eBay, Inc. | | | 3,167,660 | |
| | | | | | | | |
| | | | | | | 5,451,260 | |
| | |
| | IT Services – 3.9% | |
| | 12,894 | | | Accenture PLC Class A | | | 1,498,799 | |
| | 21,258 | | | CSRA, Inc. | | | 533,363 | |
| | |
| | |
| The accompanying notes are an integral part of these financial statements. | | 23 |
MULTI-MANAGER U.S. DYNAMIC EQUITY FUND
Schedule of Investments (continued)
October 31, 2016
| | | | | | | | |
Shares | | | Description | | Value | |
| | Common Stocks – (continued) | |
| | IT Services – (continued) | |
| | 10,375 | | | MasterCard, Inc. Class A | | $ | 1,110,332 | |
| | 53,415 | | | PayPal Holdings, Inc.* | | | 2,225,269 | |
| | | | | | | | |
| | | | | | | 5,367,763 | |
| | |
| | Machinery – 1.2% | |
| | 19,455 | | | Allison Transmission Holdings, Inc. | | | 569,837 | |
| | 31,385 | | | Colfax Corp.* | | | 997,729 | |
| | | | | | | | |
| | | | | | | 1,567,566 | |
| | |
| | Media – 14.8% | |
| | 25,069 | | | Comcast Corp. Class A | | | 1,549,766 | |
| | 30,067 | | | Discovery Communications, Inc. Class A* | | | 785,049 | |
| | 14,000 | | | Discovery Communications, Inc. Class C* | | | 351,540 | |
| | 34,866 | | | DISH Network Corp. Class A* | | | 2,041,753 | |
| | 96,726 | | | Gannett Co., Inc. | | | 751,561 | |
| | 29,303 | | | JCDecaux SA | | | 896,146 | |
| | 25,000 | | | Liberty Broadband Corp. Class C* | | | 1,666,250 | |
| | 10,200 | | | Liberty Global PLC LiLAC Class C* | | | 281,928 | |
| | 46,000 | | | Liberty Global PLC Series C* | | | 1,462,800 | |
| | 29,600 | | | Liberty Media Corp.-Liberty SiriusXM Class C* | | | 982,424 | |
| | 37,584 | | | News Corp. Class A | | | 455,518 | |
| | 8,039 | | | Scripps Networks Interactive, Inc. Class A | | | 517,390 | |
| | 110,538 | | | TEGNA, Inc. | | | 2,168,755 | |
| | 2,520 | | | The Madison Square Garden Co. Class A* | | | 417,035 | |
| | 18,759 | | | The Walt Disney Co. | | | 1,738,772 | |
| | 32,236 | | | Time Warner, Inc. | | | 2,868,682 | |
| | 46,000 | | | Twenty-First Century Fox, Inc. Class A | | | 1,208,420 | |
| | | | | | | | |
| | | | | | | 20,143,789 | |
| | |
| | Mortgage Real Estate Investment Trusts (REITs) – 0.6% | |
| | 54,500 | | | Redwood Trust, Inc. | | | 766,270 | |
| | |
| | Multiline Retail – 0.9% | |
| | 8,000 | | | J.C. Penney Co., Inc.* | | | 68,720 | |
| | 21,013 | | | Nordstrom, Inc. | | | 1,092,676 | |
| | | | | | | | |
| | | | | | | 1,161,396 | |
| | |
| | Oil, Gas & Consumable Fuels – 0.8% | |
| | 2,600 | | | Pioneer Natural Resources Co. | | | 465,452 | |
| | 18,000 | | | Range Resources Corp. | | | 608,220 | |
| | | | | | | | |
| | | | | | | 1,073,672 | |
| | |
| | Personal Products – 0.3% | |
| | 54,310 | | | Avon Products, Inc. | | | 355,731 | |
| | |
| | Pharmaceuticals – 8.1% | |
| | 22,197 | | | Allergan PLC* | | | 4,637,841 | |
| | 6,691 | | | Bristol-Myers Squibb Co. | | | 340,639 | |
| | 8,594 | | | Johnson & Johnson | | | 996,818 | |
| | 1,125 | | | Mallinckrodt PLC* | | | 66,668 | |
| | 30,659 | | | Merck & Co., Inc. | | | 1,800,296 | |
| | |
| | Common Stocks – (continued) | |
| | Pharmaceuticals – (continued) | |
| | 74,266 | | | Pfizer, Inc. | | $ | 2,354,975 | |
| | 16,375 | | | Zoetis, Inc. | | | 782,725 | |
| | | | | | | | |
| | | | | | | 10,979,962 | |
| | |
| | Semiconductors & Semiconductor Equipment – 1.4% | |
| | 8,573 | | | Mellanox Technologies Ltd.* | | | 372,068 | |
| | 8,820 | | | Skyworks Solutions, Inc. | | | 678,611 | |
| | 2,881 | | | Synaptics, Inc.* | | | 150,158 | |
| | 9,500 | | | Texas Instruments, Inc. | | | 673,075 | |
| | | | | | | | |
| | | | | | | 1,873,912 | |
| | |
| | Software – 4.8% | |
| | 442 | | | CommVault Systems, Inc.* | | | 23,647 | |
| | 62,348 | | | Oracle Corp. | | | 2,395,410 | |
| | 36,220 | | | PTC, Inc.* | | | 1,718,277 | |
| | 30,227 | | | Verint System, Inc.* | | | 1,088,172 | |
| | 17,379 | | | VMware, Inc. Class A* | | | 1,365,989 | |
| | | | | | | | |
| | | | | | | 6,591,495 | |
| | |
| | Specialty Retail – 2.5% | |
| | 4,235 | | | Advance Auto Parts, Inc. | | | 593,239 | |
| | 19,587 | | | Cabela’s, Inc.* | | | 1,206,755 | |
| | 13,569 | | | The Home Depot, Inc. | | | 1,655,554 | |
| | | | | | | | |
| | | | | | | 3,455,548 | |
| | |
| | Technology Hardware, Storage & Peripherals – 3.4% | |
| | 70,651 | | | NetApp, Inc. | | | 2,397,895 | |
| | 37,692 | | | Western Digital Corp. | | | 2,202,721 | |
| | | | | | | | |
| | | | | | | 4,600,616 | |
| | |
| | Textiles, Apparel & Luxury Goods* – 0.5% | |
| | 4,475 | | | Deckers Outdoor Corp. | | | 233,550 | |
| | 16,870 | | | Fossil Group, Inc. | | | 460,045 | |
| | | | | | | | |
| | | | | | | 693,595 | |
| | |
| | Wireless Telecommunication Services – 0.3% | |
| | 113,760 | | | VimpelCom Ltd. ADR | | | 379,958 | |
| | |
| | TOTAL COMMON STOCKS | | | | |
| | (Cost $122,797,496) | | $ | 128,053,840 | |
| | |
| | | | | | | | | | | | | | |
Principal Amount | | | Interest
Rate | | | Maturity
Date | | | Value | |
| | Short-term Investment(b) – 4.0% | |
| | Repurchase Agreements – 4.0% | |
| Joint Repurchase Agreement Account II | |
| $ | 5,500,000 | | | | 0.338 | % | | | 11/01/16 | | | $ | 5,500,000 | |
| | (Cost $5,500,000) | | | | | |
| | |
| | TOTAL INVESTMENTS – 98.2% | | | | | |
| | (Cost $128,297,496) | | | $ | 133,553,840 | |
| | |
| OTHER ASSETS IN EXCESS OF
LIABILITIES – 1.8% |
| | | 2,441,794 | |
| | |
| | NET ASSETS – 100.0% | | | $ | 135,995,634 | |
| | |
| | |
| 24 | | The accompanying notes are an integral part of these financial statements. |
MULTI-MANAGER U.S. DYNAMIC EQUITY FUND
| | |
| The percentage shown for each investment category reflects the value of investments in that category as a percentage of net assets. |
* | | Non-income producing security. |
(a) | | Exempt from registration under Rule 144A of the Securities Act of 1933. Such securities have been deemed liquid by an Underlying Manager and may be resold, normally to qualified institutional buyers in transactions exempt from registration. Total market value of Rule 144A securities amounts to $1,282,435, which represents approximately 0.9% of net assets as of October 31, 2016. |
(b) | | Joint repurchase agreement was entered into on October 31, 2016. Additional information appears on page 31. |
| | |
|
Currency Abbreviations: |
CHF | | —Swiss Franc |
EUR | | —Euro |
USD | | —U.S. Dollar |
| | |
Investment Abbreviations: |
ADR | | —American Depositary Receipt |
PLC | | —Public Limited Company |
|
| | |
| The accompanying notes are an integral part of these financial statements. | | 25 |
MULTI-MANAGER U.S. DYNAMIC EQUITY FUND
Schedule of Investments (continued)
October 31, 2016
|
| ADDITIONAL INVESTMENT INFORMATION |
FORWARD FOREIGN CURRENCY EXCHANGE CONTRACTS — At October 31, 2016, the Fund had the following forward foreign currency exchange contracts:
FORWARD FOREIGN CURRENCY EXCHANGE CONTRACTS WITH UNREALIZED GAIN
| | | | | | | | | | | | | | | | | | | | | | | | | | |
| Counterparty | | Currency
Purchased | | | Currency
Sold | | | Current
Value | | | Settlement
Date | | | Unrealized
Gain | |
Morgan Stanley & Co. | | USD | | | 857,064 | | | | CHF | | | | 840,000 | | | $ | 849,591 | | | | 11/17/16 | | | $ | 7,473 | |
| | | USD | | | 3,137,656 | | | | EUR | | | | 2,819,000 | | | | 3,096,653 | | | | 11/17/16 | | | | 41,002 | |
| TOTAL | | | | | | | $ | 48,475 | |
FORWARD FOREIGN CURRENCY EXCHANGE CONTRACTS WITH UNREALIZED LOSS
| | | | | | | | | | | | | | | | | | | | | | | | | | |
| Counterparty | | Currency
Purchased | | | Currency
Sold | | | Current
Value | | | Settlement
Date | | | Unrealized
Loss | |
Morgan Stanley & Co. | | CHF | | | 135,000 | | | | USD | | | | 138,703 | | | $ | 136,541 | | | | 11/17/16 | | | | (2,162 | ) |
| | EUR | | | 1,362,000 | | | | USD | | | | 1,518,633 | | | | 1,496,150 | | | | 11/17/16 | | | | (22,484 | ) |
| | | USD | | | 588,942 | | | | EUR | | | | 538,000 | | | | 590,990 | | | | 11/17/16 | | | | (2,047 | ) |
| TOTAL | | | | | | | $ | (26,693 | ) |
| | |
| 26 | | The accompanying notes are an integral part of these financial statements. |
MULTI-MANAGER U.S. SMALL CAP EQUITY FUND
Schedule of Investments
October 31, 2016
| | | | | | | | |
Shares | | | Description | | Value | |
| | Common Stocks – 94.9% | |
| | Aerospace & Defense – 4.4% | |
| | 20,491 | | | Astronics Corp.* | | $ | 758,577 | |
| | 3,049 | | | Astronics Corp. Class B* | | | 112,798 | |
| | 7,068 | | | BE Aerospace, Inc. | | | 420,687 | |
| | 6,096 | | | Cubic Corp. | | | 260,299 | |
| | 3,386 | | | Curtiss-Wright Corp. | | | 303,453 | |
| | 12,732 | | | DigitalGlobe, Inc.* | | | 319,573 | |
| | 24,280 | | | HEICO Corp. | | | 1,640,357 | |
| | 19,846 | | | Hexcel Corp. | | | 902,795 | |
| | 10,551 | | | KLX, Inc.* | | | 363,166 | |
| | 2,414 | | | The KEYW Holding Corp.* | | | 25,323 | |
| | 48,264 | | | Wesco Aircraft Holdings, Inc.* | | | 620,192 | |
| | | | | | | | |
| | | | | | | 5,727,220 | |
| | |
| | Auto Components – 2.8% | |
| | 23,654 | | | American Axle & Manufacturing Holdings, Inc.* | | | 423,880 | |
| | 15,458 | | | Dorman Products, Inc.* | | | 993,022 | |
| | 23,899 | | | Drew Industries, Inc. | | | 2,140,155 | |
| | | | | | | | |
| | | | | | | 3,557,057 | |
| | |
| | Automobiles – 0.2% | |
| | 3,739 | | | Thor Industries, Inc. | | | 296,540 | |
| | |
| | Banks – 5.3% | |
| | 24,761 | | | Banc of California, Inc. | | | 329,321 | |
| | 29,730 | | | Bank of the Ozarks, Inc. | | | 1,098,821 | |
| | 14,189 | | | Columbia Banking System, Inc. | | | 468,521 | |
| | 21,878 | | | ConnectOne Bancorp, Inc. | | | 401,461 | |
| | 23,374 | | | Eagle Bancorp, Inc.* | | | 1,148,832 | |
| | 10,592 | | | FCB Financial Holdings, Inc. Class A* | | | 395,082 | |
| | 1,937 | | | First Citizens BancShares, Inc. Class A | | | 563,667 | |
| | 11,229 | | | Hanmi Financial Corp. | | | 280,725 | |
| | 31,769 | | | Home BancShares, Inc. | | | 683,351 | |
| | 27,963 | | | LegacyTexas Financial Group, Inc. | | | 956,614 | |
| | 8,613 | | | Prosperity Bancshares, Inc. | | | 477,763 | |
| | | | | | | | |
| | | | | | | 6,804,158 | |
| | |
| | Beverages* – 0.2% | |
| | 1,237 | | | The Boston Beer Co., Inc. Class A | | | 192,044 | |
| | |
| | Biotechnology* – 1.4% | |
| | 8,031 | | | Acceleron Pharma, Inc. | | | 225,109 | |
| | 10,503 | | | Alder Biopharmaceuticals, Inc. | | | 254,698 | |
| | 7,246 | | | BeiGene Ltd. ADR | | | 240,857 | |
| | 10,217 | | | Coherus Biosciences, Inc. | | | 279,435 | |
| | 7,673 | | | Neurocrine Biosciences, Inc. | | | 335,847 | |
| | 7,421 | | | Ultragenyx Pharmaceutical, Inc. | | | 437,765 | |
| | | | | | | | |
| | | | | | | 1,773,711 | |
| | |
| | Building Products* – 0.5% | |
| | 13,971 | | | Builders FirstSource, Inc. | | | 135,100 | |
| | 9,358 | | | Patrick Industries, Inc. | | | 536,681 | |
| | | | | | | | |
| | | | | | | 671,781 | |
| | |
| | Common Stocks – (continued) | |
| | Capital Markets – 0.8% | |
| | 1,688 | | | Diamond Hill Investment Group, Inc. | | $ | 307,233 | |
| | 19,283 | | | Stifel Financial Corp.* | | | 754,736 | |
| | | | | | | | |
| | | | | | | 1,061,969 | |
| | |
| | Chemicals – 1.5% | |
| | 9,843 | | | Balchem Corp. | | | 747,084 | |
| | 3,341 | | | Cabot Corp. | | | 174,200 | |
| | 11,204 | | | Ferro Corp.* | | | 145,204 | |
| | 7,703 | | | Minerals Technologies, Inc. | | | 517,641 | |
| | 15,304 | | | Olin Corp. | | | 335,617 | |
| | | | | | | | |
| | | | | | | 1,919,746 | |
| | |
| | Commercial Services & Supplies – 3.5% | |
| | 15,835 | | | ABM Industries, Inc. | | | 618,832 | |
| | 5,220 | | | G&K Services, Inc. Class A | | | 494,334 | |
| | 18,172 | | | Healthcare Services Group, Inc. | | | 671,819 | |
| | 13,304 | | | KAR Auction Services, Inc. | | | 566,484 | |
| | 15,982 | | | Tetra Tech, Inc. | | | 614,508 | |
| | 20,581 | | | Waste Connections, Inc. | | | 1,547,897 | |
| | | | | | | | |
| | | | | | | 4,513,874 | |
| | |
| | Communications Equipment* – 0.4% | |
| | 9,410 | | | NETGEAR, Inc. | | | 475,205 | |
| | |
| | Construction & Engineering – 1.0% | |
| | 21,741 | | | Aegion Corp.* | | | 402,426 | |
| | 13,063 | | | Granite Construction, Inc. | | | 642,177 | |
| | 12,973 | | | Tutor Perini Corp.* | | | 247,136 | |
| | | | | | | | |
| | | | | | | 1,291,739 | |
| | |
| | Consumer Finance – 3.8% | |
| | 5,050 | | | Credit Acceptance Corp.* | | | 929,705 | |
| | 8,921 | | | FirstCash, Inc. | | | 421,071 | |
| | 36,625 | | | Navient Corp. | | | 468,067 | |
| | 18,981 | | | Nelnet, Inc. Class A | | | 743,676 | |
| | 39,440 | | | PRA Group, Inc.* | | | 1,258,136 | |
| | 144,971 | | | SLM Corp.* | | | 1,022,046 | |
| | | | | | | | |
| | | | | | | 4,842,701 | |
| | |
| | Containers & Packaging – 1.0% | |
| | 88,576 | | | Graphic Packaging Holding Co. | | | 1,107,200 | |
| | 14,012 | | | Multi Packaging Solutions International Ltd.* | | | 189,302 | |
| | | | | | | | |
| | | | | | | 1,296,502 | |
| | |
| | Distributors – 0.3% | |
| | 9,615 | | | Core-Mark Holding Co., Inc. | | | 339,890 | |
| | |
| | Diversified Consumer Services* – 0.8% | |
| | 15,939 | | | Bright Horizons Family Solutions, Inc. | | | 1,066,478 | |
| | |
| | Diversified Telecommunication Services – 1.0% | |
| | 35,920 | | | Cogent Communications Holdings, Inc. | | | 1,325,448 | |
| | |
| | Electric Utilities – 0.1% | |
| | 5,579 | | | PNM Resources, Inc. | | | 183,270 | |
| | |
| | |
| The accompanying notes are an integral part of these financial statements. | | 27 |
MULTI-MANAGER U.S. SMALL CAP EQUITY FUND
Schedule of Investments (continued)
October 31, 2016
| | | | | | | | |
Shares | | | Description | | Value | |
| | Common Stocks – (continued) | |
| | Electrical Equipment – 1.5% | |
| | 28,677 | | | EnerSys | | $ | 1,867,733 | |
| | |
| | Electronic Equipment, Instruments & Components – 2.2% | |
| | 4,824 | | | Anixter International, Inc.* | | | 317,178 | |
| | 12,693 | | | Belden, Inc. | | | 822,633 | |
| | 4,620 | | | Coherent, Inc.* | | | 481,035 | |
| | 15,370 | | | Insight Enterprises, Inc.* | | | 442,502 | |
| | 6,023 | | | OSI Systems, Inc.* | | | 422,393 | |
| | 3,920 | | | SYNNEX Corp. | | | 401,957 | |
| | | | | | | | |
| | | | | | | 2,887,698 | |
| | |
| | Energy Equipment & Services – 0.4% | |
| | 22,597 | | | Bristow Group, Inc. | | | 226,196 | |
| | 5,360 | | | Dril-Quip, Inc.* | | | 254,600 | |
| | | | | | | | |
| | | | | | | 480,796 | |
| | |
| | Equity Real Estate Investment Trusts (REITs) – 0.8% | |
| | 13,380 | | | American Homes 4 Rent Class A | | | 282,452 | |
| | 17,945 | | | Chatham Lodging Trust | | | 317,626 | |
| | 11,045 | | | LaSalle Hotel Properties | | | 262,319 | |
| | 12,954 | | | Silver Bay Realty Trust Corp. | | | 216,980 | |
| | | | | | | | |
| | | | | | | 1,079,377 | |
| | |
| | Food & Staples Retailing – 0.3% | |
| | 4,146 | | | PriceSmart, Inc. | | | 377,079 | |
| | |
| | Food Products* – 0.8% | |
| | 12,050 | | | TreeHouse Foods, Inc. | | | 1,054,134 | |
| | |
| | Health Care Equipment & Supplies* – 2.2% | |
| | 5,638 | | | IDEXX Laboratories, Inc. | | | 604,055 | |
| | 9,129 | | | Integra LifeSciences Holdings Corp. | | | 725,847 | |
| | 19,476 | | | Neogen Corp. | | | 1,026,190 | |
| | 13,188 | | | Novadaq Technologies, Inc. | | | 146,519 | |
| | 7,035 | | | Vascular Solutions, Inc. | | | 320,796 | |
| | | | | | | | |
| | | | | | | 2,823,407 | |
| | |
| | Health Care Providers & Services – 3.6% | |
| | 7,959 | | | Amsurg Corp.* | | | 475,550 | |
| | 5,174 | | | Chemed Corp. | | | 731,707 | |
| | 5,406 | | | CorVel Corp.* | | | 186,777 | |
| | 12,083 | | | Diplomat Pharmacy, Inc.* | | | 279,963 | |
| | 3,638 | | | Henry Schein, Inc.* | | | 542,790 | |
| | 26,451 | | | Kindred Healthcare, Inc. | | | 260,542 | |
| | 9,686 | | | LifePoint Health, Inc.* | | | 579,707 | |
| | 15,472 | | | Owens & Minor, Inc. | | | 502,067 | |
| | 15,436 | | | PharMerica Corp.* | | | 367,377 | |
| | 28,368 | | | Select Medical Holdings Corp.* | | | 368,784 | |
| | 22,275 | | | Teladoc, Inc.* | | | 361,969 | |
| | | | | | | | |
| | | | | | | 4,657,233 | |
| | |
| | Health Care Technology* – 0.8% | |
| | 17,449 | | | Cotiviti Holdings, Inc. | | | 538,650 | |
| | 10,130 | | | Medidata Solutions, Inc. | | | 486,139 | |
| | | | | | | | |
| | | | | | | 1,024,789 | |
| | |
| | Common Stocks – (continued) | |
| | Hotels, Restaurants & Leisure – 1.6% | |
| | 23,880 | | | Carrols Restaurant Group, Inc.* | | $ | 298,500 | |
| | 61,385 | | | ClubCorp Holdings, Inc. | | | 708,997 | |
| | 37,690 | | | Lindblad Expeditions Holdings, Inc.* | | | 308,681 | |
| | 10,233 | | | Papa John’s International, Inc. | | | 772,080 | |
| | | | | | | | |
| | | | | | | 2,088,258 | |
| | |
| | Household Durables* – 0.5% | |
| | 5,629 | | | Helen of Troy Ltd. | | | 458,763 | |
| | 3,313 | | | Tempur Sealy International, Inc. | | | 179,134 | |
| | | | | | | | |
| | | | | | | 637,897 | |
| | |
| | Insurance – 5.8% | |
| | 8,044 | | | AMERISAFE, Inc. | | | 447,246 | |
| | 46,861 | | | AmTrust Financial Services, Inc. | | | 1,236,662 | |
| | 25,636 | | | Assured Guaranty Ltd. | | | 766,260 | |
| | 23,728 | | | First American Financial Corp. | | | 926,816 | |
| | 10,119 | | | Global Indemnity PLC* | | | 303,975 | |
| | 3,635 | | | Infinity Property & Casualty Corp. | | | 297,888 | |
| | 49,426 | | | Maiden Holdings Ltd. | | | 674,665 | |
| | 43,172 | | | National General Holdings Corp. | | | 887,185 | |
| | 14,386 | | | RLI Corp. | | | 801,876 | |
| | 3,029 | | | Safety Insurance Group, Inc. | | | 205,063 | |
| | 8,506 | | | The Hanover Insurance Group, Inc. | | | 648,072 | |
| | 2,616 | | | The Navigators Group, Inc. | | | 243,811 | |
| | | | | | | | |
| | | | | | | 7,439,519 | |
| | |
| | Internet & Direct Marketing Retail – 1.7% | |
| | 3,206 | | | Expedia, Inc. | | | 414,311 | |
| | 12,797 | | | FTD Cos., Inc.* | | | 257,476 | |
| | 11,280 | | | HSN, Inc. | | | 425,256 | |
| | 51,321 | | | Liberty TripAdvisor Holdings, Inc. Class A* | | | 1,139,326 | |
| | | | | | | | |
| | | | | | | 2,236,369 | |
| | |
| | Internet Software & Services* – 1.3% | |
| | 13,565 | | | 2U, Inc. | | | 472,876 | |
| | 14,676 | | | Envestnet, Inc. | | | 518,797 | |
| | 1,163 | | | Nutanix, Inc. Class A | | | 28,493 | |
| | 11,163 | | | SPS Commerce, Inc. | | | 696,348 | |
| | | | | | | | |
| | | | | | | 1,716,514 | |
| | |
| | IT Services – 5.0% | |
| | 14,296 | | | Booz Allen Hamilton Holding Corp. | | | 435,599 | |
| | 13,040 | | | Broadridge Financial Solutions, Inc. | | | 843,166 | |
| | 8,021 | | | Convergys Corp. | | | 234,213 | |
| | 18,011 | | | CoreLogic, Inc.* | | | 766,548 | |
| | 32,648 | | | Genpact Ltd.* | | | 750,578 | |
| | 22,651 | | | MAXIMUS, Inc. | | | 1,179,211 | |
| | 26,451 | | | Sykes Enterprises, Inc.* | | | 707,300 | |
| | 19,733 | | | TeleTech Holdings, Inc. | | | 554,497 | |
| | 9,434 | | | WEX, Inc.* | | | 1,029,250 | |
| | | | | | | | |
| | | | | | | 6,500,362 | |
| | |
| | Leisure Products* – 0.1% | |
| | 32,980 | | | Black Diamond, Inc. | | | 163,251 | |
| | |
| | |
| 28 | | The accompanying notes are an integral part of these financial statements. |
MULTI-MANAGER U.S. SMALL CAP EQUITY FUND
| | | | | | | | |
Shares | | | Description | | Value | |
| | Common Stocks – (continued) | |
| | Life Sciences Tools & Services* – 2.4% | |
| | 11,853 | | | Charles River Laboratories International, Inc. | | $ | 899,406 | |
| | 8,216 | | | ICON PLC | | | 659,580 | |
| | 25,575 | | | PAREXEL International Corp. | | | 1,490,000 | |
| | | | | | | | |
| | | | | | | 3,048,986 | |
| | |
| | Machinery – 2.0% | |
| | 8,375 | | | Colfax Corp.* | | | 266,241 | |
| | 15,871 | | | ESCO Technologies, Inc. | | | 707,053 | |
| | 9,193 | | | Hillenbrand, Inc. | | | 279,008 | |
| | 5,823 | | | IDEX Corp. | | | 503,340 | |
| | 13,988 | | | Woodward, Inc. | | | 825,012 | |
| | | | | | | | |
| | | | | | | 2,580,654 | |
| | |
| | Media – 1.7% | |
| | 49,612 | | | Global Eagle Entertainment, Inc.* | | | 399,377 | |
| | 21,495 | | | Liberty Media Corp.-Liberty Media Class A* | | | 598,206 | |
| | 6,250 | | | Live Nation Entertainment, Inc.* | | | 172,937 | |
| | 6,814 | | | Scholastic Corp. | | | 260,635 | |
| | 4,181 | | | The Madison Square Garden Co. Class A* | | | 691,914 | |
| | | | | | | | |
| | | | | | | 2,123,069 | |
| | |
| | Metals & Mining – 0.6% | |
| | 52,699 | | | Ferroglobe PLC | | | 487,466 | |
| | 11,850 | | | Steel Dynamics, Inc. | | | 325,401 | |
| | | | | | | | |
| | | | | | | 812,867 | |
| | |
| | Mortgage Real Estate Investment Trusts (REITs) – 3.0% | |
| | 39,449 | | | Anworth Mortgage Asset Corp. | | | 193,694 | |
| | 33,224 | | | Ares Commercial Real Estate Corp. | | | 435,899 | |
| | 13,875 | | | Blackstone Mortgage Trust, Inc. Class A | | | 419,025 | |
| | 7,093 | | | Colony Capital, Inc. Class A | | | 134,838 | |
| | 94,752 | | | CYS Investments, Inc. | | | 816,762 | |
| | 88,528 | | | MFA Financial, Inc. | | | 647,140 | |
| | 9,053 | | | MTGE Investment Corp. | | | 154,354 | |
| | 18,183 | | | Starwood Property Trust, Inc. | | | 404,390 | |
| | 80,940 | | | Two Harbors Investment Corp. | | | 674,230 | |
| | | | | | | | |
| | | | | | | 3,880,332 | |
| | |
| | Oil, Gas & Consumable Fuels – 2.5% | |
| | 10,666 | | | Gulfport Energy Corp.* | | | 257,157 | |
| | 4,877 | | | Parsley Energy, Inc. Class A* | | | 160,453 | |
| | 21,080 | | | RSP Permian, Inc.* | | | 760,988 | |
| | 14,635 | | | Western Refining, Inc. | | | 422,220 | |
| | 40,531 | | | World Fuel Services Corp. | | | 1,631,373 | |
| | | | | | | | |
| | | | | | | 3,232,191 | |
| | |
| | Paper & Forest Products – 0.8% | |
| | 8,027 | | | Neenah Paper, Inc. | | | 641,357 | |
| | 10,914 | | | Schweitzer-Mauduit International, Inc. | | | 402,836 | |
| | | | | | | | |
| | | | | | | 1,044,193 | |
| | |
| | Personal Products – 0.4% | |
| | 8,524 | | | Nu Skin Enterprises, Inc. Class A | | | 525,505 | |
| | |
| | Common Stocks – (continued) | |
| | Professional Services – 3.8% | |
| | 5,720 | | | CEB, Inc. | | $ | 278,278 | |
| | 7,636 | | | Exponent, Inc. | | | 437,161 | |
| | 10,912 | | | FTI Consulting, Inc.* | | | 425,132 | |
| | 12,291 | | | GP Strategies Corp.* | | | 317,722 | |
| | 12,482 | | | Heidrick & Struggles International, Inc. | | | 230,917 | |
| | 9,752 | | | Korn/Ferry International | | | 198,843 | |
| | 38,476 | | | Navigant Consulting, Inc.* | | | 900,339 | |
| | 18,822 | | | On Assignment, Inc.* | | | 647,665 | |
| | 32,070 | | | RPX Corp.* | | | 313,003 | |
| | 11,291 | | | The Advisory Board Co.* | | | 449,382 | |
| | 10,699 | | | WageWorks, Inc.* | | | 630,706 | |
| | | | | | | | |
| | | | | | | 4,829,148 | |
| | |
| | Real Estate Management & Development – 0.9% | |
| | 12,360 | | | Colliers International Group, Inc. | | | 430,128 | |
| | 16,368 | | | FirstService Corp. | | | 663,886 | |
| | | | | | | | |
| | | | | | | 1,094,014 | |
| | |
| | Road & Rail – 0.7% | |
| | 4,222 | | | Genesee & Wyoming, Inc. Class A* | | | 286,843 | |
| | 21,273 | | | Knight Transportation, Inc. | | | 622,235 | |
| | | | | | | | |
| | | | | | | 909,078 | |
| | |
| | Semiconductors & Semiconductor Equipment – 2.1% | |
| | 33,505 | | | Brooks Automation, Inc. | | | 436,570 | |
| | 16,489 | | | Cavium, Inc.* | | | 930,804 | |
| | 4,915 | | | First Solar, Inc.* | | | 199,008 | |
| | 20,711 | | | MACOM Technology Solutions Holdings, Inc.* | | | 761,337 | |
| | 17,482 | | | Teradyne, Inc. | | | 407,156 | |
| | | | | | | | |
| | | | | | | 2,734,875 | |
| | |
| | Software – 6.6% | |
| | 12,419 | | | Aspen Technology, Inc.* | | | 611,512 | |
| | 11,581 | | | Blackbaud, Inc. | | | 711,073 | |
| | 29,733 | | | BroadSoft, Inc.* | | | 1,235,406 | |
| | 3,664 | | | Fair Isaac Corp. | | | 442,172 | |
| | 6,042 | | | Guidewire Software, Inc.* | | | 347,113 | |
| | 16,356 | | | Interactive Intelligence Group, Inc.* | | | 988,720 | |
| | 20,743 | | | Manhattan Associates, Inc.* | | | 1,050,425 | |
| | 17,629 | | | Monotype Imaging Holdings, Inc. | | | 336,714 | |
| | 7,703 | | | Open Text Corp. | | | 478,202 | |
| | 1,318 | | | Paylocity Holding Corp.* | | | 57,320 | |
| | 2,376 | | | Pegasystems, Inc. | | | 73,418 | |
| | 2,127 | | | Proofpoint, Inc.* | | | 166,714 | |
| | 11,276 | | | Synchronoss Technologies, Inc.* | | | 413,942 | |
| | 3,614 | | | The Ultimate Software Group, Inc.* | | | 762,518 | |
| | 5,117 | | | Tyler Technologies, Inc.* | | | 820,767 | |
| | | | | | | | |
| | | | | | | 8,496,016 | |
| | |
| | Specialty Retail – 3.5% | |
| | 39,365 | | | American Eagle Outfitters, Inc. | | | 670,780 | |
| | 4,191 | | | Asbury Automotive Group, Inc.* | | | 213,532 | |
| | 2,785 | | | Group 1 Automotive, Inc. | | | 167,852 | |
| | 17,422 | | | Lithia Motors, Inc. Class A | | | 1,494,459 | |
| | 7,828 | | | Monro Muffler Brake, Inc. | | | 430,540 | |
| | |
| | |
| The accompanying notes are an integral part of these financial statements. | | 29 |
MULTI-MANAGER U.S. SMALL CAP EQUITY FUND
Schedule of Investments (continued)
October 31, 2016
| | | | | | | | |
Shares | | | Description | | Value | |
| | Common Stocks – (continued) | |
| | Specialty Retail – (continued) | |
| | 112,729 | | | Office Depot, Inc. | | $ | 355,096 | |
| | 31,518 | | | Tailored Brands, Inc. | | | 497,984 | |
| | 32,985 | | | The Finish Line, Inc. Class A | | | 649,475 | |
| | | | | | | | |
| | | | | | | 4,479,718 | |
| | |
| | Technology Hardware, Storage & Peripherals* – 0.2% | |
| | 6,881 | | | Electronics for Imaging, Inc. | | | 292,649 | |
| | |
| | Textiles, Apparel & Luxury Goods* – 0.8% | |
| | 24,219 | | | Skechers U.S.A., Inc. Class A | | | 509,325 | |
| | 17,422 | | | Steven Madden Ltd. | | | 581,895 | |
| | | | | | | | |
| | | | | | | 1,091,220 | |
| | |
| | Thrifts & Mortgage Finance – 2.7% | |
| | 33,431 | | | Essent Group Ltd.* | | | 883,916 | |
| | 24,432 | | | Nationstar Mortgage Holdings, Inc.* | | | 369,167 | |
| | 60,567 | | | Radian Group, Inc. | | | 823,106 | |
| | 28,789 | | | Walker & Dunlop, Inc.* | | | 692,951 | |
| | 23,661 | | | Washington Federal, Inc. | | | 644,762 | |
| | | | | | | | |
| | | | | | | 3,413,902 | |
| | |
| | Tobacco – 0.3% | |
| | 6,680 | | | Universal Corp. | | | 362,056 | |
| | |
| | Trading Companies & Distributors – 2.3% | |
| | 42,657 | | | Air Lease Corp. | | | 1,290,801 | |
| | 22,269 | | | BMC Stock Holdings, Inc.* | | | 368,552 | |
| | 8,130 | | | SiteOne Landscape Supply, Inc.* | | | 253,493 | |
| | 18,496 | | | WESCO International, Inc.* | | | 1,002,483 | |
| | | | | | | | |
| | | | | | | 2,915,329 | |
| | |
| | TOTAL COMMON STOCKS | | | | |
| | (Cost $117,467,255) | | $ | 122,239,551 | |
| | |
| | | | | | | | | | | | | | |
Principal Amount | | | Interest Rate | | | Maturity Date | | | Value | |
| | | | | | | | | | | | | | |
| | Short-term Investment(a) – 4.7% | |
| | Repurchase Agreements – 4.7% | |
| Joint Repurchase Agreement Account II | |
| $ | 6,000,000 | | | | 0.338 | % | | | 11/01/16 | | | $ | 6,000,000 | |
| | (Cost $6,000,000) | |
| | |
| | TOTAL INVESTMENTS – 99.6% | | | | | |
| | (Cost $123,467,255) | | | $ | 128,239,551 | |
| | |
| OTHER ASSETS IN EXCESS OF
LIABILITIES – 0.4% |
| | | 535,789 | |
| | |
| | NET ASSETS – 100.0% | | | $ | 128,775,340 | |
| | |
| | |
| The percentage shown for each investment category reflects the value of investments in that category as a percentage of net assets. |
* | | Non-income producing security. |
(a) | | Joint repurchase agreement was entered into on October 31, 2016. Additional information appears on page 31. |
| | |
|
Investment Abbreviations: |
ADR | | —American Depositary Receipt |
GP | | —General Partnership |
PLC | | —Public Limited Company |
|
| | |
| 30 | | The accompanying notes are an integral part of these financial statements. |
ACTIVE EQUITY MULTI-MANAGER FUNDS
|
| ADDITIONAL INVESTMENT INFORMATION |
JOINT REPURCHASE AGREEMENT ACCOUNT II — At October 31, 2016, the Funds had undivided interests in the Joint Repurchase Agreement Account II, with a maturity date of November 1, 2016, as follows:
| | | | | | | | | | | | |
| Fund | | Principal Amount | | | Maturity Value | | | Collateral Allocation Value | |
Multi-Manager International Equity | | $ | 14,600,000 | | | $ | 14,600,157 | | | $ | 14,892,000 | |
Multi-Manager U.S. Dynamic Equity | | | 5,500,000 | | | | 5,500,059 | | | | 5,610,000 | |
Multi-Manager U.S. Small Cap Equity | | | 6,000,000 | | | | 6,000,065 | | | | 6,120,000 | |
REPURCHASE AGREEMENTS — At October 31, 2016, the Principal Amount of the Funds’ interest in the Joint Repurchase Agreement Account II was as follows:
| | | | | | | | | | | | | | | | |
| Counterparty | | Interest Rate | | | Multi-Manager International Equity | | | Multi-Manager U.S. Dynamic Equity | | | Multi-Manager U.S. Small Cap Equity | |
BNP Paribas Securities Co. | | | 0.340 | % | | $ | 44,629 | | | $ | 16,812 | | | $ | 18,341 | |
Citigroup Global Markets, Inc. | | | 0.340 | | | | 2,639,476 | | | | 994,323 | | | | 1,084,716 | |
Merrill Lynch & Co., Inc. | | | 0.340 | | | | 10,562,154 | | | | 3,978,894 | | | | 4,340,611 | |
Merrill Lynch & Co., Inc. | | | 0.320 | | | | 1,353,741 | | | | 509,971 | | | | 556,332 | |
| TOTAL | | | | | | $ | 14,600,000 | | | $ | 5,500,000 | | | $ | 6,000,000 | |
At October 31, 2016, the Joint Repurchase Agreement Account II was fully collateralized by:
| | | | | | | | |
| Issuer | | Interest Rates | | | Maturity Dates | |
Federal Home Loan Mortgage Corp. | | | 3.500% to 8.000 | % | | | 01/01/17 to 08/01/46 | |
Federal National Mortgage Association | | | 2.500 to 9.000 | | | | 02/01/17 to 10/01/46 | |
Government National Mortgage Association | | | 2.500 to 7.500 | | | | 02/15/25 to 10/20/46 | |
United States Treasury Inflation Protected Securities | | | 0.750 | | | | 02/15/42 | |
U.S. Treasury Bonds | | | 3.125 to 8.750 | | | | 08/15/20 to 05/15/44 | |
U.S. Treasury Notes | | | 0.875 to 4.250 | | | | 11/15/17 to 07/31/23 | |
United States Treasury Stripped Securities | | | 0.000 | | | | 02/15/29 | |
| | |
| The accompanying notes are an integral part of these financial statements. | | 31 |
ACTIVE EQUITY MULTI-MANAGER FUNDS
Statements of Assets and Liabilities
October 31, 2016
| | | | | | | | | | | | | | |
| | | | | Multi-Manager
International
Equity Fund | | | Multi-Manager
U.S. Dynamic
Equity Fund | | | Multi-Manager
U.S. Small Cap
Equity Fund | |
| | Assets: | |
| | Investments, at value (cost $293,133,870, $128,297,496 and $123,467,255) | | $ | 293,308,548 | | | $ | 133,553,840 | | | $ | 128,239,551 | |
| | Foreign currencies, at value (cost $696,454, $0 and $0, respectively) | | | 696,684 | | | | — | | | | — | |
| | Cash | | | 185,586 | | | | 179,182 | | | | 214,698 | |
| | Unrealized gain on forward foreign currency exchange contracts | | | — | | | | 48,475 | | | | — | |
| | Deferred offering costs | | | — | | | | — | | | | 85,463 | |
| | Receivables: | | | | | | | | | | | | |
| | Investments sold | | | 814,519 | | | | 2,709,940 | | | | 640,807 | |
| | Reimbursement from investment adviser | | | 306,218 | | | | — | | | | 134,271 | |
| | Dividends and interest | | | 430,116 | | | | 104,781 | | | | 24,839 | |
| | Foreign tax reclaims | | | 199,752 | | | | 6,696 | | | | — | |
| | Fund shares sold | | | 50,000 | | | | 50,000 | | | | 30,000 | |
| | Collateral on certain derivative contracts(a) | | | — | | | | 180,000 | | | | — | |
| | Other assets | | | 3,616 | | | | 2,225 | | | | — | |
| | Total assets | | | 295,995,039 | | | | 136,835,139 | | | | 129,369,629 | |
| | | | | | | | | | | | | | |
| | Liabilities: | |
| | Unrealized loss on forward foreign currency exchange contracts | | | — | | | | 26,693 | | | | — | |
| | Payables: | | | | | | | | | | | | |
| | Investments purchased | | | 1,637,855 | | | | 467,562 | | | | 253,299 | |
| | Management fees | | | 449,624 | | | | 78,494 | | | | 120,518 | |
| | Transfer agency fees | | | 4,996 | | | | 2,366 | | | | 2,219 | |
| | Offering costs | | | — | | | | — | | | | 48,653 | |
| | Payable to investment adviser | | | — | | | | 68,273 | | | | — | |
| | Accrued expenses | | | 282,389 | | | | 196,117 | | | | 169,600 | |
| | Total liabilities | | | 2,374,864 | | | | 839,505 | | | | 594,289 | |
| | | | | | | | | | | | | | |
| | Net Assets: | |
| | Paid-in capital | | | 295,413,341 | | | | 140,973,926 | | | | 122,752,425 | |
| | Undistributed net investment income | | | 4,257,060 | | | | 599,740 | | | | 178,755 | |
| | Accumulated net realized gain (loss) | | | (6,209,213 | ) | | | (10,855,916 | ) | | | 1,071,864 | |
| | Net unrealized gain | | | 158,987 | | | | 5,277,884 | | | | 4,772,296 | |
| | NET ASSETS | | $ | 293,620,175 | | | $ | 135,995,634 | | | $ | 128,775,340 | |
| | Shares Outstanding $0.001 par value (unlimited number of shares authorized): | | | 31,198,637 | | | | 14,901,880 | | | | 12,237,627 | |
| | Net asset value, offering and redemption price per share: | | | $9.41 | | | | $9.13 | | | | $10.52 | |
| | (a) | | Segregated for collateral on forward foreign currency exchange contracts transactions. |
| | |
| 32 | | The accompanying notes are an integral part of these financial statements. |
ACTIVE EQUITY MULTI-MANAGER FUNDS
Statements of Operations
For the Fiscal Year Ended October 31, 2016
| | | | | | | | | | | | | | |
| | | | | Multi-Manager
International
Equity Fund | | | Multi-Manager
U.S. Dynamic
Equity Fund | | | Multi-Manager
U.S. Small Cap
Equity Fund(a) | |
| | Investment income: | |
| | Dividends (net of foreign withholding taxes of $553,837, $9,819 and $1,953) | | $ | 5,839,677 | | | $ | 2,152,885 | | | $ | 648,912 | |
| | Interest | | | 32,506 | | | | 26,719 | | | | 9,656 | |
| | Total investment income | | | 5,872,183 | | | | 2,179,604 | | | | 658,568 | |
| | | | | | | | | | | | | | |
| | Expenses: | |
| | Management fees | | | 1,480,862 | | | | 1,168,762 | | | | 465,768 | |
| | Custody, accounting and administrative services | | | 432,842 | | | | 256,591 | | | | 105,986 | |
| | Professional fees | | | 216,932 | | | | 214,559 | | | | 75,069 | |
| | Amortization of offering costs | | | 30,642 | | | | 37,723 | | | | 87,837 | |
| | Trustee fees | | | 111,991 | | | | 96,216 | | | | 50,906 | |
| | Registration fees | | | 74,876 | | | | 48,064 | | | | 12,944 | |
| | Transfer Agency fees | | | 49,362 | | | | 29,219 | | | | 12,420 | |
| | Printing and mailing costs | | | 30,256 | | | | 12,208 | | | | 20,000 | |
| | Organization costs | | | — | | | | — | | | | 12,000 | |
| | Other | | | 65,466 | | | | 52,736 | | | | 20,681 | |
| | Total expenses | | | 2,493,229 | | | | 1,916,078 | | | | 863,611 | |
| | Less — expense reductions | | | (1,077,155 | ) | | | (752,670 | ) | | | (366,792 | ) |
| | Net expenses | | | 1,416,074 | | | | 1,163,408 | | | | 496,819 | |
| | NET INVESTMENT INCOME | | | 4,456,109 | | | | 1,016,196 | | | | 161,749 | |
| | | | | | | | | | | | | | |
| | Realized and unrealized gain (loss): | |
| | Net realized gain (loss) from: | | | | | | | | | | | | |
| | Investments | | | (5,545,181 | ) | | | (8,958,834 | ) | | | 1,071,864 | |
| | Forward foreign currency exchange contracts | | | (9,384 | ) | | | (5,403 | ) | | | — | |
| | Foreign currency transactions | | | (327 | ) | | | (5,285 | ) | | | — | |
| | Net change in unrealized gain (loss) on: | | | | | | | | | | | | |
| | Investments | | | 3,188,087 | | | | 4,897,238 | | | | 4,772,296 | |
| | Forward foreign currency exchange contracts | | | — | | | | (10,988 | ) | | | — | |
| | Foreign currency translation | | | (14,161 | ) | | | (242 | ) | | | — | |
| | Net realized and unrealized gain (loss) | | | (2,380,966 | ) | | | (4,083,514 | ) | | | 5,844,160 | |
| | NET INCREASE (DECREASE) IN NET ASSETS RESULTING FROM OPERATIONS | | $ | 2,075,143 | | | $ | (3,067,318 | ) | | $ | 6,005,909 | |
| | (a) | | Commenced operations on April 29, 2016. |
| | |
| The accompanying notes are an integral part of these financial statements. | | 33 |
ACTIVE EQUITY MULTI-MANAGER FUNDS
Statements of Changes in Net Assets
| | | | | | | | | | |
| | | | | Multi-Manager
International Equity Fund | |
| | | | | For the Fiscal
Year Ended
October 31, 2016 | | | For the
Period Ended
October 31, 2015(a) | |
| | From operations: | |
| | Net investment income | | $ | 4,456,109 | | | $ | 489,198 | |
| | Net realized loss | | | (5,554,892 | ) | | | (712,318 | ) |
| | Net change in unrealized gain (loss) | | | 3,173,926 | | | | (3,014,939 | ) |
| | Net increase (decrease) in net assets resulting from operations | | | 2,075,143 | | | | (3,238,059 | ) |
| | | | | | | | | | |
| | Distributions to shareholders: | |
| | From net investment income | | | (662,291 | ) | | | — | |
| | | | | | | | | | |
| | From share transactions: | |
| | Proceeds from sales of shares | | | 128,804,010 | | | | 196,158,215 | |
| | Reinvestment of distributions | | | 662,291 | | | | — | |
| | Cost of shares redeemed | | | (22,314,124 | ) | | | (7,865,010 | ) |
| | Net increase in net assets resulting from share transactions | | | 107,152,177 | | | | 188,293,205 | |
| | TOTAL INCREASE | | | 108,565,029 | | | | 185,055,146 | |
| | | | | | | | | | |
| | Net assets: | |
| | Beginning of year | | | 185,055,146 | | | | — | |
| | End of year | | $ | 293,620,175 | | | $ | 185,055,146 | |
| | Undistributed net investment income | | $ | 4,257,060 | | | $ | 393,221 | |
| | (a) | | Commenced operations on July 31, 2015. |
| | |
| 34 | | The accompanying notes are an integral part of these financial statements. |
ACTIVE EQUITY MULTI-MANAGER FUNDS
Statements of Changes in Net Assets
| | | | | | | | | | | | | | |
| | | | | Multi-Manager
U.S. Dynamic Equity Fund | | | Multi-Manager
U.S. Small Cap Equity Fund | |
| | | | | For the Fiscal
Year Ended
October 31, 2016 | | | For the
Period Ended
October 31, 2015(a) | | | For the Period Ended
October 31, 2016(b) | |
| | From operations: | |
| | Net investment income | | $ | 1,016,196 | | | $ | 158,832 | | | $ | 161,749 | |
| | Net realized gain (loss) | | | (8,969,522 | ) | | | (1,910,474 | ) | | | 1,071,864 | |
| | Net change in unrealized gain | | | 4,886,008 | | | | 391,876 | | | | 4,772,296 | |
| | Net increase (decrease) in net assets resulting from operations | | | (3,067,318 | ) | | | (1,359,766 | ) | | | 6,005,909 | |
| | | | | | | | | | | | | | |
| | Distributions to shareholders: | |
| | From net investment income | | | (599,786 | ) | | | — | | | | — | |
| | | | | | | | | | | | | | |
| | From share transactions: | |
| | Proceeds from sales of shares | | | 58,640,000 | | | | 134,047,310 | | | | 132,504,436 | |
| | Reinvestment of distributions | | | 599,786 | | | | — | | | | — | |
| | Cost of shares redeemed | | | (51,508,582 | ) | | | (756,010 | ) | | | (9,735,005 | ) |
| | Net increase in net assets resulting from share transactions | | | 7,731,204 | | | | 133,291,300 | | | | 122,769,431 | |
| | TOTAL INCREASE | | | 4,064,100 | | | | 131,931,534 | | | | 128,775,340 | |
| | | | | | | | | | | | | | |
| | Net assets: | |
| | Beginning of year | | | 131,931,534 | | | | — | | | | — | |
| | End of year | | $ | 135,995,634 | | | $ | 131,931,534 | | | $ | 128,775,340 | |
| | Undistributed net investment income | | $ | 599,740 | | | $ | 157,593 | | | $ | 178,755 | |
| | (a) | | Commenced operations on July 31, 2015. |
| | (b) | | Commenced operations on April 29, 2016. |
| | |
| The accompanying notes are an integral part of these financial statements. | | 35 |
MULTI-MANAGER INTERNATIONAL EQUITY FUND
Financial Highlights
Selected Data for a Share Outstanding Throughout Each Year
| | | | | | | | | | | | | | | | | | | | | | |
| | | | | | | | Income (loss) from
investment operations | | | | |
| | | Year - Share Class | | Net asset
value,
beginning
of year | | | Net
investment
income(a) | | | Net realized
and unrealized
gain (loss) | | | Total from
investment
operations | | | Distributions
to shareholders
from net
investment
income | |
| | FOR THE FISCAL YEAR ENDED OCTOBER 31, | |
| | 2016 - Institutional | | $ | 9.52 | | | $ | 0.17 | | | $ | (0.25 | ) | | $ | (0.08 | ) | | $ | (0.03 | ) |
| | | | | | | | | | | | | | | | | | | | | | |
| | FOR THE PERIOD ENDED OCTOBER 31, | |
| | 2015 - Institutional (Commenced July 31, 2015) | | | 10.00 | | | | 0.03 | | | | (0.51 | ) | | | (0.48 | ) | | | — | |
| | (a) | | Calculated based on the average shares outstanding methodology. |
| | (b) | | Assumes investment at the net asset value (“NAV”) at the beginning of the period, reinvestment of all dividends and distributions, a complete redemption of the investment at the NAV at the end of the period and no sales or redemption charges. Total returns would be reduced if a sales or redemption charge was taken into account. Returns do not reflect the impact of taxes to shareholders relating to Fund distributions or the redemption of Fund shares. Total returns for periods less than one full year are not annualized. |
| | (c) | | The Fund’s portfolio turnover rate is calculated in accordance with regulatory requirements, without regard to transactions involving short term investments and certain derivatives. If such transactions were included, the Fund’s portfolio turnover rate may be higher. |
| | |
| 36 | | The accompanying notes are an integral part of these financial statements. |
MULTI-MANAGER INTERNATIONAL EQUITY FUND
| | | | | | | | | | | | | | | | | | | | | | | | | | | | | | | | | | | | | | | | |
| | | | | | | | | | | | | | | | | | | | | | | | | | | | | | | | | | |
| | | Net asset
value, end
of year | | | | | Total
return(b) | | | | | Net assets,
end of
year
(in 000s) | | | | | Ratio of
net expenses
to average
net assets | | | | | Ratio of
total expenses
to average
net assets | | | | | Ratio of
net investment
income
to average
net assets | | | | | Portfolio
turnover
rate(c) | |
| | | | | | | | | | | | | | | | | | | | | | | | | | | | | | | | | | | | | | | | |
| | $ | 9.41 | | | | | | (0.82 | )% | | | | $ | 293,620 | | | | | | 0.57 | % | | | | | 1.01 | % | | | | | 1.81 | % | | | | | 25 | % |
| | | | | | | | | | | | | | | | | | | | | | | | | | | | | | | | | | | | | | | | |
| | | | | | | | | | | | | | | | | | | | | | | | | | | | | | | | | | | | | | | | |
| | | 9.52 | | | | | | (4.80 | ) | | | | | 185,055 | | | | | | 0.57 | (d) | | | | | 1.07 | (d) | | | | | 1.31 | (d) | | | | | 6 | |
| | |
| The accompanying notes are an integral part of these financial statements. | | 37 |
MULTI-MANAGER U.S. DYNAMIC EQUITY FUND
Financial Highlights
Selected Data for a Share Outstanding Throughout Each Year
| | | | | | | | | | | | | | | | | | | | | | |
| | | | | | | | Income (loss) from
Investment Operations | | | | |
| | | Year - Share Class | | Net asset
value,
beginning
of year | | | Net
investment
income(a) | | | Net realized
and unrealized
gain (loss) | | | Total from
investment
operations | | | Distributions
to shareholders
from net
investment
income | |
| | FOR THE FISCAL YEAR ENDED OCTOBER 31, | | | | | | | | | | | | | | | | | | | | |
| | 2016 - Institutional | | $ | 9.51 | | | $ | 0.06 | (d) | | $ | (0.40 | ) | | $ | (0.34 | ) | | $ | (0.04 | ) |
| | | | | | | | | | | | | | | | | | | | | | |
| | FOR THE PERIOD ENDED OCTOBER 31, | | | | | | | | | | | | | | | | | | | | |
| | 2015 - Institutional (Commenced July 31, 2015) | | | 10.00 | | | | 0.02 | | | | (0.51 | ) | | | (0.49 | ) | | | — | |
| | (a) | | Calculated based on the average shares outstanding methodology. |
| | (b) | | Assumes investment at the NAV at the beginning of the period, reinvestment of all dividends and distributions, a complete redemption of the investment at the NAV at the end of the period and no sales or redemption charges. Total returns would be reduced if a sales or redemption charge was taken into account. Returns do not reflect the impact of taxes to shareholders relating to Fund distributions or the redemption of Fund shares. Total returns for periods less than one full year are not annualized. |
| | (c) | | The Fund’s portfolio turnover rate is calculated in accordance with regulatory requirements, without regard to transactions involving short term investments and certain derivatives. If such transactions were included, the Fund’s portfolio turnover rate may be higher. |
| | (d) | | Reflects income recognized from a special dividend which amounted to $0.01 per share and 0.17% of average net assets. |
| | |
| 38 | | The accompanying notes are an integral part of these financial statements. |
MULTI-MANAGER U.S. DYNAMIC EQUITY FUND
| | | | | | | | | | | | | | | | | | | | | | | | | | | | | | | | | | | | | | | | |
| | | | | | | | | | | | | | | | | | | | | | | | | | | | | | | | | | |
| | | Net asset
value, end
of year | | | | | Total
return(b) | | | | | Net assets,
end of
year
(in 000s) | | | | | Ratio of
net expenses
to average
net assets | | | | | Ratio of
total expenses
to average
net assets | | | | | Ratio of
net investment
income
to average
net assets | | | | | Portfolio
turnover
rate(c) | |
| | | | | | | | | | | | | | | | | | | | | | | | | | | | | | | | | | | | | | | | |
| | $ | 9.13 | | | | | | (3.54 | )% | | | | $ | 135,996 | | | | | | 0.80 | % | | | | | 1.31 | % | | | | | 0.70 | %(d) | | | | | 112 | % |
| | | | | | | | | | | | | | | | | | | | | | | | | | | | | | | | | | | | | | | | |
| | | | | | | | | | | | | | | | | | | | | | | | | | | | | | | | | | | | | | | | |
| | | 9.51 | | | | | | (4.90 | ) | | | | | 131,932 | | | | | | 0.79 | (e) | | | | | 1.51 | (e) | | | | | 0.70 | (e) | | | | | 14 | |
| | |
| The accompanying notes are an integral part of these financial statements. | | 39 |
MULTI-MANAGER U.S. SMALL CAP EQUITY FUND
Financial Highlights
Selected Data for a Share Outstanding Throughout the Period
| | | | | | | | | | | | | | | | | | |
| | | | | | | | Income from
Investment Operations | |
| | | Year - Share Class | | Net asset
value,
beginning
of period | | | Net
investment
income(a) | | | Net realized
and unrealized
gain | | | Total from
investment
operations | |
| | FOR THE PERIOD ENDED OCTOBER 31, | | | | | | | | | | | | | | | | |
| | 2016 - Institutional (Commenced April 29, 2016) | | $ | 10.00 | | | $ | 0.01 | | | $ | 0.51 | | | $ | 0.52 | |
| | (a) | | Calculated based on the average shares outstanding methodology. |
| | (b) | | Assumes investment at the NAV at the beginning of the period, reinvestment of all dividends and distributions, a complete redemption of the investment at the NAV at the end of the period and no sales or redemption charges. Total returns would be reduced if a sales or redemption charge was taken into account. Returns do not reflect the impact of taxes to shareholders relating to Fund distributions or the redemption of Fund shares. Total returns for periods less than one full year are not annualized. |
| | (d) | | The Fund’s portfolio turnover rate is calculated in accordance with regulatory requirements, without regard to transactions involving short term investments. If such transactions were included, the Fund’s portfolio turnover rate may be higher. |
| | |
| 40 | | The accompanying notes are an integral part of these financial statements. |
MULTI-MANAGER U.S. SMALL CAP EQUITY FUND
| | | | | | | | | | | | | | | | | | | | | | | | | | | | | | | | | | | | | | |
| | | | | | | | | | | | | | | | | | | | | | | | | | | | | | | | | |
| | | Net asset
value, end
of period | | | | Total
return(b) | | | | | Net assets,
end of
period
(in 000s) | | | | | Ratio of
net expenses
to average
net assets(c) | | | | | Ratio of
total expenses
to average
net assets(c) | | | | | Ratio of
net investment
income
to average
net assets(c) | | | | | Portfolio
turnover
rate(d) | |
| | | | | | | | | | | | | | | | | | | | | | | | | | | | | | | | | | | | | | |
| | $10.52 | | | | | 5.20 | % | | | | $ | 128,775 | | | | | | 0.80 | % | | | | | 1.32 | % | | | | | 0.26 | % | | | | | 15 | % |
| | |
| The accompanying notes are an integral part of these financial statements. | | 41 |
ACTIVE EQUITY MULTI-MANAGER FUNDS
Notes to Financial Statements
October 31, 2016
Goldman Sachs Trust II (the “Trust”) is a Delaware statutory trust registered under the Investment Company Act of 1940, as amended (the “Act”), as an open-end management investment company. The following table lists those series of the Trust that are included in this report (collectively, the “Funds” or individually a “Fund”), along with their corresponding share classes and respective diversification status under the Act:
| | | | |
| Fund | | Share Classes Offered | | Diversified/
Non-diversified |
Multi-Manager International Equity | | Institutional | | Diversified |
Multi-Manager U.S. Dynamic Equity | | Institutional | | Non-diversified |
Multi-Manager U.S. Small Cap Equity (Commenced April 29, 2016) | | Institutional | | Diversified |
Goldman Sachs Asset Management, L.P. (“GSAM”), an affiliate of Goldman, Sachs & Co. (“Goldman Sachs”), serves as investment adviser to the Funds pursuant to a management agreement (the “Agreement”) with the Trust. As of October 31, 2016, GSAM had sub-advisory agreements (the “Sub-Advisory Agreements”) for the Multi-Manager International Equity Fund with Causeway Capital Management LLC, Massachusetts Financial Services Company, doing business as MFS Investment Management and WCM Investment Management; for the Multi-Manager U.S. Dynamic Equity Fund with Lazard Asset Management LLC, Sirios Capital Management, L.P., Smead Capital Management, Inc. and Weitz Investment Management, Inc.; and for the Multi-Manager U.S. Small Cap Equity Fund with Brown Advisory LLC, PNC Capital Advisors, LLC and Robeco Investment Management, Inc., doing business as Boston Partners (the “Underlying Managers”). Pursuant to the terms of the Sub-Advisory Agreements, the Underlying Managers are responsible for making investment decisions and managing the investments of the applicable Fund. GSAM compensates the Underlying Managers directly in accordance with the terms of the applicable Sub-Advisory Agreements. The Funds are not charged any separate or additional investment advisory fees by the Underlying Managers.
|
| 2. SIGNIFICANT ACCOUNTING POLICIES |
The financial statements have been prepared in accordance with accounting principles generally accepted in the United States of America (“GAAP”) and require management to make estimates and assumptions that may affect the reported amounts and disclosures. Actual results may differ from those estimates and assumptions.
A. Investment Valuation — The Funds’ valuation policy is to value investments at fair value.
B. Investment Income and Investments — Investment income includes interest income, dividend income, net of any foreign withholding taxes, less any amounts reclaimable, and securities lending income. Interest income is accrued daily and adjusted for amortization of premiums and accretion of discounts. Dividend income is recognized on ex-dividend date or, for certain foreign securities, as soon as such information is obtained subsequent to the ex-dividend date. Investment transactions are reflected on trade date. Realized gains and losses are calculated using identified cost. Investment transactions are recorded on the following business day for daily net asset value (“NAV”) calculations. Any foreign capital gains tax is accrued daily based upon net unrealized gains, and is payable upon sale of such investments. Distributions received from the Funds’ investments in U.S. real estate investment trusts (“REITs”) may be characterized as ordinary income, net capital gain or a return of capital. A return of capital is recorded by the Funds as a reduction to the cost basis of the REIT.
For derivative contracts, realized gains and losses are recorded upon settlement of the contract.
C. Expenses — Expenses incurred directly by a Fund are charged to the Fund, and certain expenses incurred by the Trust are allocated across the applicable Funds on a straight-line and/or pro-rata basis, depending upon the nature of the expenses, and are accrued daily.
42
ACTIVE EQUITY MULTI-MANAGER FUNDS
|
| 2. SIGNIFICANT ACCOUNTING POLICIES (continued) |
D. Offering and Organization Costs — Offering costs paid in connection with the offering of shares of the Multi-Manager International Equity Fund, Multi-Manager U.S. Dynamic Equity Fund and Multi-Manager U.S. Small Cap Equity Fund are being amortized on a straight-line basis over 12 months from the date of commencement of operations. Organization costs paid in connection with the organization of the Multi-Manager U.S. Small Cap Equity Fund were expensed on the first day of operations.
E. Federal Taxes and Distributions to Shareholders — It is each Fund’s policy to comply with the requirements of the Internal Revenue Code of 1986, as amended (the “Code”), applicable to regulated investment companies (mutual funds) and to distribute each year substantially all of its investment company taxable income and capital gains to its shareholders. Accordingly, the Funds are not required to make any provisions for the payment of federal income tax. Distributions to shareholders are recorded on the ex-dividend date. Income and capital gains distributions, if any, are declared and paid annually.
Net capital losses are carried forward to future fiscal years and may be used to the extent allowed by the Code to offset any future capital gains. Utilization of capital loss carryforwards will reduce the requirement of future capital gains distributions.
The characterization of distributions to shareholders for financial reporting purposes is determined in accordance with federal income tax rules, which may differ from GAAP. The source of each Fund’s distributions may be shown in the accompanying financial statements as either from net investment income, net realized gain or capital. Certain components of the Funds’ net assets on the Statements of Assets and Liabilities reflect permanent GAAP/tax differences based on the appropriate tax character.
F. Foreign Currency Translation — The accounting records and reporting currency of the Funds are maintained in U.S. dollars. Assets and liabilities denominated in foreign currencies are translated into U.S. dollars using the current exchange rates at the close of each business day. The effect of changes in foreign currency exchange rates on investments is included within net realized and unrealized gain (loss) on investments. Changes in the value of other assets and liabilities as a result of fluctuations in foreign exchange rates are included in the Statements of Operations within net change in unrealized gain (loss) on foreign currency translations. Transactions denominated in foreign currencies are translated into U.S. dollars on the date the transaction occurred, the effects of which are included within net realized gain (loss) on foreign currency transactions.
|
| 3. INVESTMENTS AND FAIR VALUE MEASUREMENTS |
The fair value of a financial instrument is the amount that would be received to sell an asset or paid to transfer a liability in an orderly transaction between market participants at the measurement date (i.e., the exit price). GAAP establishes a fair value hierarchy that prioritizes the inputs to valuation techniques used to measure fair value. The hierarchy gives the highest priority to unadjusted quoted prices in active markets for identical assets or liabilities (Level 1 measurements) and the lowest priority to unobservable inputs (Level 3 measurements). The levels used for classifying investments are not necessarily an indication of the risk associated with investing in these investments. The three levels of the fair value hierarchy are described below:
Level 1 — Unadjusted quoted prices in active markets that are accessible at the measurement date for identical, unrestricted assets or liabilities;
Level 2 — Quoted prices in markets that are not active or financial instruments for which significant inputs are observable (including, but not limited to, quoted prices for similar investments, interest rates, foreign exchange rates, volatility and credit spreads), either directly or indirectly;
Level 3 — Prices or valuations that require significant unobservable inputs (including GSAM’s assumptions in determining fair value measurement).
Changes in valuation techniques may result in transfers into or out of an assigned level within the hierarchy. In accordance with the Funds’ policy, transfers between different levels of the fair value hierarchy resulting from such changes are deemed to have occurred as of the beginning of the reporting period.
The Board of Trustees (“Trustees”) has approved Valuation Procedures that govern the valuation of the portfolio investments held by the Funds, including investments for which market quotations are not readily available. The Trustees have delegated to GSAM day-to-day responsibility for implementing and maintaining internal controls and procedures related to the valuation of the Funds’ portfolio investments. To assess the continuing appropriateness of pricing sources and methodologies, GSAM regularly
43
ACTIVE EQUITY MULTI-MANAGER FUNDS
Notes to Financial Statements (continued)
October 31, 2016
|
| 3. INVESTMENTS AND FAIR VALUE MEASUREMENTS (continued) |
performs price verification procedures and issues challenges as necessary to third party pricing vendors or brokers, and any differences are reviewed in accordance with the Valuation Procedures.
A. Level 1 and Level 2 Fair Value Investments — The valuation techniques and significant inputs used in determining the fair values for investments classified as Level 1 and Level 2 are as follows:
Equity Securities — Equity securities traded on a United States (“U.S.”) securities exchange or the NASDAQ system, or those located on certain foreign exchanges, including but not limited to the Americas, are valued daily at their last sale price or official closing price on the principal exchange or system on which they are traded. If there is no sale or official closing price or such price is believed by GSAM to not represent fair value, equity securities are valued at the last bid price for long positions and at the last ask price for short positions. To the extent these investments are actively traded, they are classified as Level 1 of the fair value hierarchy, otherwise they are generally classified as Level 2.
Unlisted equity securities for which market quotations are available are valued at the last sale price on the valuation date, or if no sale occurs, at the last bid price. Securities traded on certain foreign securities exchanges are valued daily at fair value determined by an independent fair value service (if available) under Valuation Procedures approved by the Trustees and consistent with applicable regulatory guidance. The independent fair value service takes into account multiple factors including, but not limited to, movements in the securities markets, certain depositary receipts, futures contracts and foreign currency exchange rates that have occurred subsequent to the close of the foreign securities exchange. These investments are generally classified as Level 2 of the fair value hierarchy.
Derivative Contracts — A derivative is an instrument whose value is derived from underlying assets, indices, reference rates or a combination of these factors. The Funds enter into derivative transactions to hedge against changes in interest rates, securities prices, and/or currency exchange rates, to increase total return, or to gain access to certain markets or attain exposure to other underliers.
Exchange-traded derivatives, including futures and options contracts, are valued at the last sale or settlement price and typically fall within Level 1 of the fair value hierarchy. Over-the-counter (“OTC”) and centrally cleared derivatives are valued using market transactions and other market evidence, including market-based inputs to models, calibration to market-clearing transactions, broker or dealer quotations, or other alternative pricing sources. Where models are used, the selection of a particular model to value OTC and centrally cleared derivatives depends upon the contractual terms of, and specific risks inherent in, the instrument, as well as the availability of pricing information in the market. Valuation models require a variety of inputs, including contractual terms, market prices, yield curves, credit curves, measures of volatility, voluntary and involuntary prepayment rates, loss severity rates and correlations of such inputs. For OTC and centrally cleared derivatives that trade in liquid markets, model inputs can generally be verified and model selection does not involve significant management judgment. OTC and centrally cleared derivatives are classified within Level 2 of the fair value hierarchy when significant inputs are corroborated by market evidence.
i. Forward Contracts — A forward contract is a contract between two parties to buy or sell an asset at a specified price on a future date. A forward contract settlement can occur on a cash or delivery basis. Forward contracts are marked-to-market daily using independent vendor prices, and the change in value, if any, is recorded as an unrealized gain or loss. Cash and certain investments may be used to collateralize forward contracts.
A forward foreign currency contract is a forward contract in which a Fund agrees to receive or deliver a fixed quantity of one currency for another, at a pre-determined price at a future date. All forward foreign currency exchange contracts are marked-to-market daily at the applicable forward rate. Non-deliverable forward foreign currency exchange contracts are settled with the counterparty in cash without the delivery of foreign currency.
Short Term Investments — As of the date of the financial statements, short-term investments having a maturity of 60 days or less are valued using available market quotations as provided by a third party pricing vendor or broker. Prior to October 11, 2016, such securities were valued at amortized cost. These investments are classified as Level 2 of the fair value hierarchy.
44
ACTIVE EQUITY MULTI-MANAGER FUNDS
|
| 3. INVESTMENTS AND FAIR VALUE MEASUREMENTS (continued) |
i. Repurchase Agreements — Repurchase agreements involve the purchase of securities subject to the seller’s agreement to repurchase the securities at a mutually agreed upon date and price, under the terms of a Master Repurchase Agreement (“MRA”). During the term of a repurchase agreement, the value of the underlying securities held as collateral on behalf of a Fund, including accrued interest, is required to exceed the value of the repurchase agreement, including accrued interest. The gross value of repurchase agreements is included in the Statements of Assets and Liabilities for financial reporting purposes. The underlying securities for all repurchase agreements are held at the Funds’ custodian or designated sub-custodians under tri-party repurchase agreements.
An MRA governs transactions between a Fund and select counterparties. An MRA contains provisions for, among other things, initiation of the transaction, income payments, events of default and maintenance of securities for repurchase agreements. An MRA also permits offsetting with collateral to create one single net payment in the event of default or similar events, including the bankruptcy or insolvency of a counterparty.
If the seller defaults, a Fund could suffer a loss to the extent that the proceeds from the sale of the underlying securities and other collateral held by the Fund are less than the repurchase price and the Fund’s costs associated with delay and enforcement of the repurchase agreement. In addition, in the event of default or insolvency of the seller, a court could determine that a Fund’s interest in the collateral is not enforceable, resulting in additional losses to the Fund.
Pursuant to exemptive relief granted by the Securities and Exchange Commission (“SEC”) and terms and conditions contained therein, the Funds, together with other funds of the Trust and registered investment companies having management agreements with GSAM or its affiliates, may transfer uninvested cash into joint accounts, the daily aggregate balance of which is invested in one or more repurchase agreements. Under these joint accounts, the Funds maintain pro-rata credit exposure to the underlying repurchase agreements’ counterparties. With the exception of certain transaction fees, the Funds are not subject to any expenses in relation to these investments.
B. Level 3 Fair Value Investments — To the extent that significant inputs to valuation models and other alternative pricing sources are unobservable, or if quotations are not readily available, or if GSAM believes that such quotations do not accurately reflect fair value, the fair value of the Funds’ investments may be determined under Valuation Procedures approved by the Trustees. GSAM, consistent with its procedures and applicable regulatory guidance, may make an adjustment to the most recent valuation prices of either domestic or foreign securities in light of significant events to reflect what it believes to be the fair value of the securities at the time of determining a Fund’s NAV. Significant events which could affect a large number of securities in a particular market may include, but are not limited to: significant fluctuations in U.S. or foreign markets; market dislocations; market disruptions; or unscheduled market closings. Significant events which could also affect a single issuer may include, but are not limited to: corporate actions such as reorganizations, mergers and buy-outs; ratings downgrades; and bankruptcies.
C. Fair Value Hierarchy — The following is a summary of the Funds’ investments and derivatives classified in the fair value hierarchy as of October 31, 2016:
| | | | | | | | | | | | |
| | | |
| MULTI-MANAGER INTERNATIONAL EQUITY | | | | | | | | | | | | |
| | | |
| Investment Type | | Level 1 | | | Level 2 | | | Level 3 | |
| Assets | | | | | | | | | | | | |
Common Stock and/or Other Equity Investments(a) | | | | | | | | | | | | |
Africa | | $ | — | | | $ | 2,814,950 | | | $ | — | |
Asia | | | 19,557,344 | | | | 54,071,285 | | | | — | |
Australia and Oceania | | | — | | | | 5,856,438 | | | | — | |
Europe | | | 18,424,375 | | | | 159,209,570 | | | | — | |
North America | | | 13,396,025 | | | | 2,784,195 | | | | — | |
South America | | | 2,594,366 | | | | — | | | | — | |
Short-term Investments | | | — | | | | 14,600,000 | | | | — | |
| Total | | $ | 53,972,110 | | | $ | 239,336,438 | | | $ | — | |
45
ACTIVE EQUITY MULTI-MANAGER FUNDS
Notes to Financial Statements (continued)
October 31, 2016
|
| 3. INVESTMENTS AND FAIR VALUE MEASUREMENTS (continued) |
| | | | | | | | | | | | |
| | | |
| MULTI-MANAGER U.S. DYNAMIC EQUITY | | | | | | | | | | | | |
| | | |
| Investment Type | | Level 1 | | | Level 2 | | | Level 3 | |
| Assets | | | | | | | | | | | | |
Common Stock and/or Other Equity Investments(a) | | | | | | | | | | | | |
Asia | | $ | 789,405 | | | $ | — | | | $ | — | |
Europe | | | 5,343,496 | | | | 4,239,117 | | | | — | |
North America | | | 117,681,822 | | | | — | | | | — | |
Short-term Investments | | | — | | | | 5,500,000 | | | | — | |
| Total | | $ | 123,814,723 | | | $ | 9,739,117 | | | $ | — | |
| | | |
| Derivative Type | | | | | | | | | |
| Assets(b) | | | | | | | | | | | | |
Forward Foreign Currency Exchange Contracts | | $ | — | | | $ | 48,475 | | | $ | — | |
| Liabilities(b) | | | | | | | | | | | | |
Forward Foreign Currency Exchange Contracts | | $ | — | | | $ | (26,693 | ) | | $ | — | |
| | | |
| MULTI-MANAGER U.S. SMALL CAP EQUITY | | | | | | | | | | | | |
| | | |
| Investment Type | | Level 1 | | | Level 2 | | | Level 3 | |
| Assets | | | | | | | | | | | | |
Common Stock and/or Other Equity Investments(a) | | | | | | | | | | | | |
Asia | | $ | 240,857 | | | $ | — | | | $ | — | |
Europe | | | 1,451,021 | | | | — | | | | — | |
North America | | | 120,547,673 | | | | — | | | | — | |
Short-term Investments | | | — | | | | 6,000,000 | | | | — | |
| Total | | $ | 122,239,551 | | | $ | 6,000,000 | | | $ | — | |
| (a) | | Amounts are disclosed by continent to highlight the impact of time zone differences between local market close and the calculation of NAV. Security valuations are based on the principal exchange or system on which they are traded, which may differ from country of domicile noted in the table. The Funds utilize fair value model prices provided by an independent fair value service for certain international equity securities, resulting in a Level 2 classification. |
| (b) | | Amount shown represents unrealized gain (loss) at period end. |
For further information regarding security characteristics, see the Schedules of Investments.
|
| 4. INVESTMENTS IN DERIVATIVES |
The following tables set forth, by certain risk types, the gross value of derivative contracts as of October 31, 2016. These instruments were used as part of the Funds’ investment strategies and to obtain and/or manage exposure related to the risks below. The values in the tables below exclude the effects of cash collateral received or posted pursuant to these derivative contracts, and therefore are not representative of the Funds’ net exposure.
46
ACTIVE EQUITY MULTI-MANAGER FUNDS
|
| 4. INVESTMENTS IN DERIVATIVES (continued) |
| | | | | | | | | | | | |
|
Multi-Manager U.S. Dynamic Equity Fund | |
| Risk | | Statements of Assets
and Liabilities | | Assets | | | Statements of Assets
and Liabilities | | Liabilities | |
Currency | | Receivable for unrealized gain on forward foreign currency exchange contracts | | $ | 48,475 | | | Payable for unrealized loss on forward foreign currency exchange contracts | | $ | (26,693) | |
The following tables set forth, by certain risk types, the Funds’ gains (losses) related to these derivatives and their indicative volumes for the fiscal year ended October 31, 2016. These gains (losses) should be considered in the context that these derivative contracts may have been executed to create investment opportunities and/or economically hedge certain investments, and accordingly, certain gains (losses) on such derivative contracts may offset certain (losses) gains attributable to investments. These gains (losses) are included in “Net realized gain (loss)” or “Net change in unrealized gain (loss)” on the Statements of Operations:
| | | | | | | | | | | | | | |
|
| Multi-Manager International Equity Fund | |
| Risk | | Statements of Operations | | Net Realized
Gain (Loss) | | | Net Change in
Unrealized
Gain (Loss) | | | Average
Number of
Contracts(a) | |
| Currency | | Net realized gain (loss) from forward foreign currency exchange contracts/Net unrealized gain (loss) on forward foreign currency exchange contracts | | $ | (9,384 | ) | | $ | — | | | | 1 | |
|
| Multi-Manager U.S. Dynamic Equity Fund | |
| Risk | | Statements of Operations | | Net Realized
Gain (Loss) | | | Net Change in
Unrealized
Gain (Loss) | | | Average
Number of
Contracts(a) | |
| Currency | | Net realized gain (loss) from forward foreign currency exchange contracts/Net unrealized gain (loss) on forward foreign currency exchange contracts | | $ | (5,403 | ) | | $ | (10,988 | ) | | | 15 | |
| (a) | | Average number of contracts is based on the average of month end balances for the fiscal year ended October 31, 2016. |
In order to better define its contractual rights and to secure rights that will help a Fund mitigate its counterparty risk, a Fund may enter into an International Swaps and Derivatives Association, Inc. Master Agreement (“ISDA Master Agreement”) or similar agreement with its derivatives counterparties. An ISDA Master Agreement is a bilateral agreement between a Fund and a counterparty that governs OTC derivatives (including forward foreign currency exchange contracts, and certain options and swaps), and typically contains, among other things, collateral posting terms and netting provisions in the event of a default and/or termination event. The provisions of the ISDA Master Agreement typically permit a single net payment in the event of a default (close-out netting) or similar event, including the bankruptcy or insolvency of the counterparty.
Collateral and margin requirements differ between exchange traded derivatives and OTC derivatives. Margin requirements are established by the broker or clearing house for exchange-traded and centrally cleared derivatives (financial futures contracts, options and centrally cleared swaps) pursuant to governing agreements for those instrument types. Brokers can ask for margin in excess of the minimum in certain circumstances. Collateral terms are contract-specific for OTC derivatives. For derivatives traded under an ISDA Master Agreement, the collateral requirements are typically calculated by netting the marked to market amount for each transaction under such agreement and comparing that amount to the value of any collateral currently pledged by a Fund and the counterparty. Additionally, a Fund may be required to post initial margin to the counterparty, the terms of which would be outlined in the confirmation of the OTC transaction.
For financial reporting purposes, cash collateral that has been pledged to cover obligations of a Fund and cash collateral received from the counterparty, if any, is reported separately on the Statements of Assets and Liabilities as receivables/payables for collateral on certain derivative contracts. Non-cash collateral pledged by a Fund, if any, is noted in the Schedules of Investments. Generally, the amount of collateral due from or to a counterparty must exceed a minimum transfer amount threshold before a transfer is required to be made. To the extent amounts due to a Fund from its counterparties are not fully collateralized,
47
ACTIVE EQUITY MULTI-MANAGER FUNDS
Notes to Financial Statements (continued)
October 31, 2016
|
| 4. INVESTMENTS IN DERIVATIVES (continued) |
contractually or otherwise, the Fund bears the risk of loss from counterparty nonperformance. A Fund attempts to mitigate counterparty risk by only entering into agreements with counterparties that the Underlying Managers believe to be of good standing and by monitoring the financial stability of those counterparties.
Additionally, the netting of assets and liabilities and the offsetting of collateral pledged or received are based on contractual netting/set-off provisions in the ISDA Master Agreement or similar agreements. However, in the event of a default or insolvency of a counterparty, a court could determine that such rights are not enforceable due to the restrictions or prohibitions against the right of setoff that may be imposed in accordance with a particular jurisdiction’s bankruptcy or insolvency laws.
|
| 5. AGREEMENTS AND AFFILIATED TRANSACTIONS |
A. Management Agreement — Under the Agreement, GSAM manages the Funds, subject to the general supervision of the Trustees.
As compensation for the services rendered pursuant to the Agreement, the assumption of the expenses related thereto and administration of the Funds’ business affairs, including providing facilities, GSAM is entitled to a management fee, accrued daily and paid monthly, equal to an annual percentage rate of each Fund’s average daily net assets.
For the fiscal year ended October 31, 2016, the contractual and effective net management fees with GSAM were at the following rates:
| | | | | | | | | | |
| | | | | Management Rate | |
| Fund | | | | Contractual
Management Fee
Annual Rate | | | Effective Net Management Rate* | |
Multi-Manager International Equity | | | | | 0.60 | % | | | 0.48 | % |
Multi-Manager U.S. Dynamic Equity | | | | | 0.80 | | | | 0.67 | |
Multi-Manager U.S. Small Cap Equity | | | | | 0.75 | | | | 0.68 | |
| * | | GSAM has agreed to waive a portion of its management fee for each Fund in order to achieve an effective net management fee rate that is equal to the actual cost of fees paid to the Fund’s Underlying Managers. This arrangement will remain in effect through at least February 28, 2017 for the Multi-Manager International Equity and Multi-Manager U.S. Dynamic Equity Funds and March 31, 2017 for the Multi-Manager U.S. Small Cap Equity Fund. Prior to such dates, GSAM may not terminate the applicable arrangement without the approval of the Trustees. |
B. Transfer Agency Agreement — Goldman Sachs also serves as the transfer agent of the Funds for a fee pursuant to the Transfer Agency Agreement. The fees charged for such transfer agency services are accrued daily and paid monthly at annual rates of 0.02% of the average daily net assets of Institutional Shares.
C. Other Expense Agreements and Affiliated Transactions — GSAM has agreed to limit certain Funds’ “Total Annual Operating Expenses” (excluding acquired fund fees and expenses, taxes, interest, brokerage fees, shareholder meeting, litigation, indemnification and extraordinary expenses) to the extent such expenses exceed, on an annual basis, a percentage rate of the average daily net assets of each Fund. Such reimbursements, if any, are accrued daily and paid monthly. In addition, the Funds are not obligated to reimburse GSAM for prior fiscal year expense reimbursements, if any. The limitations as an annual percentage rate of average daily net assets for the Multi-Manager International Equity, Multi-Manager U.S. Dynamic Equity and the Multi-Manager U.S. Small Cap Equity are 0.57%, 0.79% and 0.80% respectively. These limitations will remain in place through at least February 28, 2017 for the Multi-Manager International Equity and Multi-Manager U.S. Dynamic Equity Funds and March 31, 2017 for the Multi-Manager U.S. Small Cap Equity Fund, and prior to such dates GSAM may not terminate the arrangements without the approval of the Trustees. In addition, the Funds have entered into certain offset arrangements with the transfer agent, which may result in a reduction of the Funds’ expenses and are received irrespective of the application of the “Total Annual Operating Expense” limitations described above.
48
ACTIVE EQUITY MULTI-MANAGER FUNDS
|
| 5. AGREEMENTS AND AFFILIATED TRANSACTIONS (continued) |
For the fiscal year ended October 31, 2016, these expense reductions, including any fee waivers, were as follows:
| | | | | | | | | | | | | | |
| Fund | | | | Management
Fee Waiver | | | Other
Expense Reimbursements | | | Total Annual
Operating Expense
Reductions | |
Multi-Manager International Equity | | | | $ | 287,776 | | | $ | 969,732 | | | $ | 1,257,508 | |
Multi-Manager U.S. Dynamic Equity | | | | | 192,518 | | | | 733,424 | | | | 925,942 | |
Multi-Manager U.S. Small Cap Equity | | | | | 45,400 | | | | 321,392 | | | | 366,792 | |
D. Line of Credit Facility — As of October 31, 2016, the Funds participated in a $1,100,000,000 committed, unsecured revolving line of credit facility (the “facility”) together with other funds of the Trust and certain registered investment companies having management agreements with GSAM or its affiliates (“Other Borrowers”). This facility is to be used for temporary emergency purposes, or to allow for an orderly liquidation of securities to meet redemption requests. The interest rate on borrowings is based on the federal funds rate. The facility also requires a fee to be paid by the Funds based on the amount of the commitment that has not been utilized. For the fiscal year ended October 31, 2016, the Funds did not have any borrowings under the facility.
E. Other Transactions with Affiliates — For the fiscal year ended October 31, 2016, Goldman Sachs earned $35 and $510 in brokerage commissions from portfolio transactions on behalf of the Multi-Manager International Equity and the Multi-Manager U.S. Small Cap Equity Funds, respectively.
|
| 6. PORTFOLIO SECURITIES TRANSACTIONS |
The cost of purchases and proceeds from sales and maturities of long-term securities for the fiscal year ended October 31, 2016, were as follows:
| | | | | | | | | | |
| Fund | | | | Purchases | | | Sales and Maturities | |
Multi-Manager International Equity | | | | $ | 161,258,615 | | | $ | 59,133,635 | |
Multi-Manager U.S. Dynamic Equity | | | | | 166,114,136 | | | | 152,728,403 | |
Multi-Manager U.S. Small Cap Equity | | | | | 134,197,709 | | | | 17,755,304 | |
The tax character of distributions paid during the fiscal year ended October 31, 2016 was as follows:
| | | | | | | | | | | | |
| | | Multi-Manager
International Equity Fund | | | Multi-Manager
U.S. Dynamic Equity Fund | | | Multi-Manager
U.S. Small Cap Equity Fund | |
Distribution paid from: | | | | | | | | | | | | |
Ordinary income | | $ | 662,291 | | | $ | 599,786 | | | $ | — | |
49
ACTIVE EQUITY MULTI-MANAGER FUNDS
Notes to Financial Statements (continued)
October 31, 2016
|
| 7. TAX INFORMATION (continued) |
There were no distributions paid for the fiscal year ended October 31, 2015.
As of October 31, 2016, the components of accumulated earnings (losses) on a tax basis were as follows:
| | | | | | | | | | | | |
| | | Multi-Manager
International Equity Fund | | | Multi-Manager
U.S. Dynamic Equity Fund | | | Multi-Manager
U.S. Small Cap Equity Fund | |
Undistributed ordinary income—net | | $ | 4,284,756 | | | $ | 619,864 | | | $ | 1,366,938 | |
Undistributed long-term capital gains | | | — | | | | — | | | | 31,662 | |
Total undistributed earnings | | $ | 4,284,756 | | | $ | 619,864 | | | $ | 1,398,600 | |
Capital loss carryforwards: | | | | | | | | | | | | |
Perpetual Short-Term | | | (3,870,170 | ) | | | (6,299,772 | ) | | | — | |
Perpetual Long-Term | | | (1,007,714 | ) | | | (381,593 | ) | | | — | |
Total capital loss carryforwards | | $ | (4,877,884 | ) | | $ | (6,681,365 | ) | | $ | — | |
Unrealized gains (losses)—net | | | (1,200,038 | ) | | | 1,083,209 | | | | 4,624,315 | |
Total accumulated earnings (losses) net | | $ | (1,793,166 | ) | | $ | (4,978,292 | ) | | $ | 6,022,915 | |
As of October 31, 2016, the Funds’ aggregate security unrealized gains and losses based on cost for U.S. federal income tax purposes were as follows:
| | | | | | | | | | | | |
| | | Multi-Manager
International Equity Fund | | | Multi-Manager
U.S. Dynamic Equity Fund | | | Multi-Manager
U.S. Small Cap Equity Fund | |
Tax Cost | | $ | 294,492,895 | | | $ | 132,470,389 | | | $ | 123,615,236 | |
Gross unrealized gain | | | 16,466,244 | | | | 10,041,921 | | | | 9,176,786 | |
Gross unrealized loss | | | (17,650,591 | ) | | | (8,958,470 | ) | | | (4,552,471 | ) |
Net unrealized gains (losses) on securities | | $ | (1,184,347 | ) | | $ | 1,083,451 | | | $ | 4,624,315 | |
Net unrealized gain (loss) on other investments | | | (15,691 | ) | | | (242 | ) | | | — | |
Net unrealized gains (losses) | | $ | (1,200,038 | ) | | $ | 1,083,209 | | | $ | 4,624,315 | |
The difference between GAAP-basis and tax-basis unrealized gains (losses) is attributable primarily to wash sales, net mark to market gains/(losses) on foreign currency contracts, differences in tax treatment of underlying fund investments and passive foreign investment companies.
In order to present certain components of the Funds’ capital accounts on a tax-basis, certain reclassifications have been recorded to the Funds’ accounts. These reclassifications have no impact on the net asset value of the Funds and result primarily from differences in the tax treatment of foreign currency transactions, passive foreign investment company investments, underlying fund investments and certain non-deductible expenses.
| | | | | | | | | | | | | | |
| Fund | | | | Paid-in
Capital | | | Accumulated
Net Realized
Gain (Loss) | | | Undistributed
Net Investment
Income (Loss) | |
Multi-Manager International Equity Fund | | | | | (32,041 | ) | | | (37,980 | ) | | | 70,021 | |
Multi-Manager U.S. Dynamic Equity Fund | | | | | (39,278 | ) | | | 13,541 | | | | 25,737 | |
Multi-Manager U.S. Small Cap Equity Fund | | | | | (17,006 | ) | | | — | | | | 17,006 | |
50
ACTIVE EQUITY MULTI-MANAGER FUNDS
|
| 7. TAX INFORMATION (continued) |
GSAM has reviewed the Funds’ tax positions for all open tax years (the current year and prior year, as applicable) and has concluded that no provision for income tax is required in the Funds’ financial statements. Such open tax years remain subject to examination and adjustment by tax authorities.
The Funds’ risks include, but are not limited to, the following:
Derivatives Risk — Loss may result from the Funds’ investments in derivative instruments. These instruments may be illiquid, difficult to price and leveraged so that small changes in the value of the underlying instruments may produce disproportionate losses to the Funds. Derivatives are also subject to counterparty risk, which is the risk that the other party in the transaction will not fulfill its contractual obligation. Losses from investments in derivatives can also result from a lack of correlation between changes in the value of derivative instruments and the portfolio assets (if any) being hedged.
Foreign and Emerging Countries Risk — Investing in foreign markets may involve special risks and considerations not typically associated with investing in the United States. Foreign securities may be subject to risk of loss because of more or less foreign government regulation, less public information and less economic, political and social stability in the countries in which the Funds invest. Loss may also result from the imposition of exchange controls, confiscations and other government restrictions by the United States or other governments, or from problems in registration, settlement or custody. Foreign risk also involves the risk of negative foreign currency rate fluctuations, which may cause the value of securities denominated in such foreign currency (or other instruments through which the Funds have exposure to foreign currencies) to decline in value. Currency exchange rates may fluctuate significantly over short periods of time. To the extent that the Funds also invest in securities of issuers located in emerging markets, these risks may be more pronounced.
Foreign Custody Risk — A Fund that invests in foreign securities may hold such securities and cash with foreign banks, agents, and securities depositories appointed by the Fund’s custodian (each a “Foreign Custodian”). Some foreign custodians may be recently organized or new to the foreign custody business. In some countries, Foreign Custodians may be subject to little or no regulatory oversight over, or independent evaluation of, their operations. Further, the laws of certain countries may place limitations on a Fund’s ability to recover its assets if a Foreign Custodian enters bankruptcy. Investments in emerging markets may be subject to even greater custody risks than investments in more developed markets. Custody services in emerging market countries are very often undeveloped and may be considerably less well regulated than in more developed countries, and thus may not afford the same level of investor protection as would apply in developed countries.
Geographic and Sector Risk — As a result of the Funds’ ability to invest a large percentage of its assets in obligations of issuers within the same country, state, region, currency or economic sector, an adverse economic, business, political, environmental or other development may affect the value of the Funds’ investments more than if their investments were not so focused.
Large Shareholder Transactions Risk — A Fund may experience adverse effects when certain large shareholders purchase or redeem large amounts of shares of a Fund. Such large shareholder redemptions may cause a Fund to sell portfolio securities at times when it would not otherwise do so, which may negatively impact a Fund’s NAV and liquidity. Similarly, large Fund share purchases may adversely affect a Fund’s performance to the extent that the Fund is delayed in investing new cash and is required to maintain a larger cash position than it ordinarily would. These transactions may also accelerate the realization of taxable income to shareholders if such sales of investments resulted in gains, and may also increase transaction costs. In addition, a large redemption could result in a Fund’s current expenses being allocated over a smaller asset base, leading to an increase in the Fund’s expense ratio.
Leverage Risk — Leverage creates exposure to potential gains and losses in excess of the initial amount invested. Borrowing and the use of derivatives may result in leverage and may make a Fund more volatile. When a Fund uses leverage, the sum of that
51
ACTIVE EQUITY MULTI-MANAGER FUNDS
Notes to Financial Statements (continued)
October 31, 2016
|
| 8. OTHER RISKS (continued) |
Fund’s investment exposure may significantly exceed the amount of assets invested in the Fund, although these exposures may vary over time. Relatively small market movements may result in large changes in the value of a leveraged investment. A Fund will identify liquid assets on its books or otherwise cover transactions that may give rise to such risk, to the extent required by applicable law. The use of leverage may cause a Fund to liquidate portfolio positions to satisfy its obligations or to meet segregation requirements when it may not be advantageous to do so. The use of leverage by a Fund can substantially increase the adverse impact to which the Fund’s investment portfolio may be subject.
Liquidity Risk — The Funds may make investments that are illiquid or that may become less liquid in response to market developments or adverse investor perceptions. Illiquid investments may be more difficult to value. Liquidity risk may also refer to the risk that a Fund will not be able to pay redemption proceeds within the allowable time period because of unusual market conditions, an unusually high volume of redemption requests, or other reasons. To meet redemption requests, a Fund may be forced to sell investments at an unfavorable time and/or under unfavorable conditions.
Market and Credit Risks — In the normal course of business, the Funds trade financial instruments and enter into financial transactions where risk of potential loss exists due to changes in the market (market risk). Additionally, the Funds may also be exposed to credit risk in the event that an issuer or guarantor fails to perform or that an institution or entity with which the Funds have unsettled or open transactions defaults.
Multi-Manager Approach Risk — The Funds’ performance depends on the ability of the Investment Adviser in selecting, overseeing, and allocating Fund assets to the Underlying Managers. The Underlying Managers’ investment styles may not always be complementary. The Funds’ multi-manager approach may result in the Fund investing a significant percentage of its assets in certain types of investments, which could be beneficial or detrimental to the Funds’ performance depending on the performance of those investments and the overall market environment. The Funds’ Underlying Managers may underperform the market generally or underperform other investment managers that could have been selected for the Funds. Because the Funds’ Underlying Managers may trade with counterparties, prime brokers, clearing brokers or futures commission merchants on terms that are different than those on which the Investment Adviser would trade, and because each Underlying Manager applies its own risk analysis in evaluating potential counterparties for the Funds, the Funds may be subject to greater counterparty risk than if they were managed directly by the Investment Adviser.
Non-Diversification Risk — The Multi-Manager U.S. Dynamic Equity Fund is non-diversified, meaning that the Fund is permitted to invest a larger percentage of its assets in fewer issuers than diversified mutual funds. Thus, the Fund may be more susceptible to adverse developments affecting any single issuer held in its portfolio, and may be more susceptible to greater losses because of these developments.
Under the Trust’s organizational documents, its Trustees, officers, employees and agents are indemnified, to the extent permitted by the Act and state law, against certain liabilities that may arise out of performance of their duties to the Funds. Additionally, in the course of business, the Funds enter into contracts that contain a variety of indemnification clauses. The Funds’ maximum exposure under these arrangements is unknown, as this would involve future claims that may be made against the Funds that have not yet occurred. However, GSAM believes the risk of loss under these arrangements to be remote.
Subsequent events after the Statements of Assets and Liabilities date have been evaluated and GSAM has concluded that there is no impact requiring adjustment or disclosure in the financial statements.
52
ACTIVE EQUITY MULTI-MANAGER FUNDS
|
| 11. SUMMARY OF SHARE TRANSACTIONS |
Share activity is as follows:
| | | | | | | | | | | | | | | | |
| | | Multi-Manager International Equity Fund | |
| | | | |
| | | For the Fiscal Year Ended
October 31, 2016 | | | For the Period Ended
October 31, 2015(a) | |
| | | | |
| | | Shares | | | Dollars | | | Shares | | | Dollars | |
| | | | |
| Institutional Shares | | | | | | | | | | | | | | | | |
Shares sold | | | 14,091,399 | | | $ | 128,804,010 | | | | 20,284,525 | | | $ | 196,158,215 | |
Reinvestment of distributions | | | 70,232 | | | | 662,291 | | | | — | | | | — | |
Shares redeemed | | | (2,398,379 | ) | | | (22,314,124 | ) | | | (849,140 | ) | | | (7,865,010 | ) |
NET INCREASE | | | 11,763,252 | | | | 107,152,177 | | | | 19,435,385 | | | $ | 188,293,205 | |
| (a) | | Commenced operations July 31, 2015. |
| | | | | | | | | | | | | | | | |
| | | Multi-Manager U.S. Dynamic Equity Fund | |
| | | | |
| | | For the Fiscal Year Ended
October 31, 2016 | | | For the Period Ended
October 31, 2015(a) | |
| | | | |
| | | Shares | | | Dollars | | | Shares | | | Dollars | |
| | | | |
| Institutional Shares | | | | | | | | | | | | | | | | |
Shares sold | | | 6,537,771 | | | $ | 58,640,000 | | | | 13,953,668 | | | $ | 134,047,310 | |
Reinvestment of distributions | | | 64,982 | | | | 599,786 | | | | — | | | | — | |
Shares redeemed | | | (5,573,673 | ) | | | (51,508,582 | ) | | | (80,868 | ) | | | (756,010 | ) |
NET INCREASE | | | 1,029,080 | | | $ | 7,731,204 | | | | 13,872,800 | | | $ | 133,291,300 | |
| (a) | | Commenced operations July 31, 2015. |
| | | | | | | | | | | | | | | | |
| | | Multi-Manager U.S. Small Cap Equity Fund | |
| | | | |
| | | For the Period Ended
October 31, 2016(a) | | | | | | | |
| | | | | | | | | | | | |
| | | Shares | | | Dollars | | | | | | | |
| | | | | | | | | | | | |
| Institutional Shares | | | | | | | | | | | | | | | | |
Shares sold | | | 13,177,002 | | | $ | 132,504,436 | | | | | | | | | |
Shares redeemed | | | (939,375 | ) | | | (9,735,005 | ) | | | | | | | | |
NET INCREASE | | | 12,237,627 | | | $ | 122,769,431 | | | | | | | | | |
| (a) | | Commenced operations April 29, 2016. |
53
Report of Independent Registered Public
Accounting Firm
To the Board of Trustees of Goldman Sachs Trust II and
Shareholders of the Active Equity Multi-Manager Funds:
In our opinion, the accompanying statements of assets and liabilities, including the schedules of investments, and the related statements of operations and of changes in net assets and the financial highlights present fairly, in all material respects, the financial position of the Multi-Manager International Equity Fund, Multi-Manager U.S. Dynamic Equity Fund, and Multi-Manager U.S. Small Cap Equity Fund (collectively the “Funds”), funds of the Goldman Sachs Trust II, at October 31, 2016, and the results of each of their operations, the changes in each of their net assets and the financial highlights for each of the periods indicated, in conformity with accounting principles generally accepted in the United States of America. These financial statements and financial highlights (hereafter referred to as “financial statements”) are the responsibility of the Funds’ management. Our responsibility is to express an opinion on these financial statements based on our audits. We conducted our audits of these financial statements in accordance with the standards of the Public Company Accounting Oversight Board (United States). Those standards require that we plan and perform the audit to obtain reasonable assurance about whether the financial statements are free of material misstatement. An audit includes examining, on a test basis, evidence supporting the amounts and disclosures in the financial statements, assessing the accounting principles used and significant estimates made by management, and evaluating the overall financial statement presentation. We believe that our audits, which included confirmation of securities at October 31, 2016 by correspondence with the custodian, brokers and the application of alternative auditing procedures where securities purchased confirmations had not been received, provide a reasonable basis for our opinion.
PricewaterhouseCoopers LLP
Boston, Massachusetts
December 23, 2016
54
ACTIVE EQUITY MULTI-MANAGER FUNDS
| | |
Fund Expenses Period Ended October 31, 2016 (Unaudited) | | |
As a shareholder of Institutional Shares of the Funds, you incur ongoing costs, including management fees; and other Fund expenses. This Example is intended to help you understand your ongoing costs (in dollars) of investing in the Funds and to compare these costs with the ongoing costs of investing in other mutual funds.
The Example is based on an investment of $1,000 invested at the beginning of the period and held for the entire period from May 1, 2016 through October 31, 2016, which represents a period of 184 days in a 366 day year.
Actual Expenses — The first line under each share class in the table below provides information about actual account values and actual expenses. You may use the information in this line, together with the amount you invested, to estimate the expenses that you paid over the period. Simply divide your account value by $1,000 (for example, an $8,600 account value divided by $1,000=8.6), then multiply the result by the number in the first line under the heading entitled “Expenses Paid” to estimate the expenses you paid on your account during this period.
Hypothetical Example for Comparison Purposes — The second line under each share class in the table below provides information about hypothetical account values and hypothetical expenses based on the Funds’ actual net expense ratios and an assumed rate of return of 5% per year before expenses, which is not the Funds’ actual return. The hypothetical account values and expenses may not be used to estimate the actual ending account balance or expenses you paid for the period. You may use this information to compare the ongoing costs of investing in the Funds and other funds. To do so, compare this 5% hypothetical example with the 5% hypothetical examples that appear in the shareholder reports of the other funds.
Please note that the expenses shown in the table are meant to highlight your ongoing costs only and do not reflect any transactional costs, such as sales charges, redemption fees, or exchange fees. Therefore, the second line of the table is useful in comparing ongoing costs only, and will not help you determine the relative total costs of owning different funds. In addition, if these transactional costs were included, your costs would have been higher.
| | | | | | | | | | | | | | | | | | | | | | | | | | | | | | | | | | | | |
| | | Multi-Manager International Equity Fund | | | Multi-Manager U.S. Dynamic Equity Fund | | | Multi-Manager U.S. Small Cap Equity Fund(a) | |
| Share Class | | Beginning
Account
Value
5/1/16 | | | Ending
Account
Value
10/31/16 | | | Expenses
Paid for the
6 months
ended
10/31/16* | | | Beginning
Account
Value
5/1/16 | | | Ending
Account
Value
10/31/16 | | | Expenses
Paid for the
6 months
ended
10/31/16* | | | Beginning
Account
Value
5/1/16 | | | Ending
Account
Value
10/31/16 | | | Expenses
Paid for the
period
ended
10/31/16* | |
| Institutional | | | | | | | | | | | | | | | | | | | | | | | | | | | | | | | | | | | | |
Actual | | $ | 1,000.00 | | | $ | 1,011.80 | | | $ | 2.88 | | | $ | 1,000.00 | | | $ | 994.60 | | | $ | 3.96 | | | $ | 1,000.00 | | | $ | 1,052.00 | | | $ | 4.13 | |
Hypothetical 5% return | | | 1,000.00 | | | | 1,022.27 | + | | | 2.90 | | | | 1,000.00 | | | | 1,021.17 | + | | | 4.01 | | | | 1,000.00 | | | | 1,021.11 | + | | | 4.06 | |
| | * | | Expenses for each share class are calculated using each Fund’s annualized net expense ratio for each class, which represents the ongoing expenses as a percentage of net assets for the six months ended October 31, 2016. Expenses are calculated by multiplying the annualized net expense ratio by the average account value for the period; then multiplying the result by the number of days in the most recent fiscal half year; and then dividing that result by the number of days in the fiscal year. The annualized net expense ratios for the period were as follows: | |
| | | | |
| Fund | | Institutional | |
Multi-Manager International Equity | | | 0.57 | % |
Multi-Manager U.S. Dynamic Equity | | | 0.80 | |
Multi-Manager U.S. Small Cap Equity | | | 0.80 | |
| | (a) | | Commenced operations April 29, 2016. | |
| | + | | Hypothetical expenses are based on the Fund’s actual annualized net expense ratios and an assumed rate of return of 5% per year before expenses. | |
55
ACTIVE EQUITY MULTI-MANAGER FUNDS
Statement Regarding Basis for Approval of Management Agreement and Sub-Advisory Agreements (Unaudited)
Background
The Multi-Manager International Equity Fund, Multi-Manager U.S. Dynamic Equity Fund, and Multi-Manager U.S. Small Cap Equity Fund (the “Funds”) are investment portfolios of Goldman Sachs Trust II (the “Trust”). The Board of Trustees oversees the management of the Trust and reviews the investment performance and expenses of the Funds at regularly scheduled meetings held throughout the year. Each Fund employs a “manager of managers” structure, whereby Goldman Sachs Asset Management, L.P. and Goldman Sachs Asset Management International (collectively, the “Investment Adviser”) are responsible for selecting sub-advisers (subject to Board approval), allocating the Fund’s assets among them, and overseeing their day-to-day management of Fund assets. The Board of Trustees determines annually whether to approve the continuance of the Trust’s investment management agreement (the “Management Agreement”) with the Investment Adviser on behalf of the Funds.
The Management Agreement was most recently approved for continuation until August 31, 2017 by the Board of Trustees, including those Trustees who are not parties to the Management Agreement or “interested persons” (as defined in the Investment Company Act of 1940, as amended) (the “1940 Act”), of any party thereto (the “Independent Trustees”), at a meeting held on August 3, 2016 (the “Annual Meeting”). At the Annual Meeting, the Board also considered the sub-advisory agreements (each a “Designated Sub-Advisory Agreement”) between the Investment Adviser and (i) each of Causeway Capital Management LLC, Massachusetts Financial Services Company (d/b/a MFS Investment Management), and WCM Investment Management (on behalf of Multi-Manager International Equity Fund); (ii) each of Sirios Capital Management, L.P., Smead Capital Management, Inc., and Weitz Investment Management, Inc. (on behalf of Multi-Manager U.S. Dynamic Equity Fund); and (iii) Brown Advisory LLC, PNC Capital Advisors LLC, and Robeco Investment Management, Inc. d/b/a Boston Partners (on behalf of Multi-Manager U.S. Small Cap Equity Fund) (collectively, the “Designated Sub-Advisers” and together with all sub-advisers serving from time to time, the Sub-Advisers).
The review process undertaken by the Trustees spans the course of the year and culminates with the Annual Meeting. To assist the Trustees in their deliberations, the Trustees have established a Contract Review Committee (the “Committee”), comprised of the Independent Trustees. The Committee held four meetings over the course of the year since the Management Agreement was last approved. At those Committee meetings, regularly scheduled Board or other committee meetings, and/or the Annual Meeting, matters relevant to the renewal of the Management Agreement or the Designated Sub-Advisory Agreements were considered by the Board, or the Independent Trustees, as applicable. With respect to each Fund, such matters included:
| | (a) | | the nature and quality of the advisory, administrative, and other services provided to the Fund by the Investment Adviser and its affiliates, including information about: |
| | (i) | | the structure, staff, and capabilities of the Investment Adviser and its portfolio management teams; |
| | (ii) | | the groups within the Investment Adviser and its affiliates that support the portfolio management teams and the Sub-Advisers or provide other types of necessary services, including fund services groups (e.g., accounting and financial reporting, tax, shareholder services, and operations); controls and risk management groups (e.g., legal, compliance, valuation oversight, credit risk management, internal audit, compliance testing, market risk analysis, finance, and central funding); sales and distribution support groups, and others (e.g., information technology and training); |
| | (iii) | | trends in employee headcount; |
| | (iv) | | the Investment Adviser’s financial resources and ability to hire and retain talented personnel and strengthen its operations; and |
| | (v) | | the parent company’s support of the Investment Adviser and its mutual fund business, as expressed by the firm’s senior management; |
| | (b) | | information on the investment performance of the Fund, including comparisons to the performance of similar mutual funds, as provided by a third-party mutual fund data provider engaged as part of the contract review process (the “Outside Data Provider”), benchmark performance indices, commingled investment vehicles with comparable investment strategies managed by the Investment Adviser, and general investment outlooks in the markets in which the Fund invests; |
| | (c) | | information provided by the Investment Adviser indicating the Investment Adviser’s views on the degree to which the Fund’s peer group and/or benchmark index was relevant to the Fund’s particular investment strategy; |
| | (d) | | the terms of the Management Agreement and other agreements with affiliated service providers entered into by the Trust on behalf of the Fund; |
| | (e) | | fee and expense information for the Fund, including: |
| | (i) | | the relative management fee and expense level of the Fund as compared to those of comparable funds managed by other advisers, as provided by the Outside Data Provider; and |
56
ACTIVE EQUITY MULTI-MANAGER FUNDS
Statement Regarding Basis for Approval of Management Agreement and Sub-Advisory Agreements (Unaudited) (continued)
| | (ii) | | comparative information on the advisory fees charged and services provided by the Investment Adviser to certain collective investment vehicles that it manages with comparable investment strategies; |
| | (f) | | with respect to the investment performance and expense comparison data provided by the Outside Data Provider, its processes in producing that data for the Fund; |
| | (g) | | the undertakings of the Investment Adviser and its affiliates to implement fee waivers and/or expense limitations; |
| | (h) | | information relating to the profitability of the Management Agreement and the transfer agency of the Fund to the Investment Adviser and its affiliates; |
| | (i) | | whether the Fund’s existing management fee schedule adequately addressed any economies of scale; |
| | (j) | | a summary of the “fall-out” benefits derived by the Investment Adviser and its affiliates from their relationships with the Fund, including the fees received by the Investment Adviser’s affiliates from the Fund for transfer agency, distribution and other services; |
| | (k) | | a summary of potential benefits derived by the Fund as a result of its relationship with the Investment Adviser; |
| | (l) | | portfolio manager ownership of Fund shares; the manner in which portfolio manager compensation is determined; information on the Sub-Advisers’ compensation arrangements; and the number and types of accounts managed by the portfolio managers; |
| | (m) | | the nature and quality of the services provided to the Fund by its unaffiliated service providers (including the Sub-Advisers), and the Investment Adviser’s general oversight and evaluation (including reports on due diligence) of those service providers as part of the administrative services provided under the Management Agreement; and |
| | (n) | | the Investment Adviser’s processes and policies addressing various types of potential conflicts of interest; its approach to risk management; the annual review of the effectiveness of the Fund’s compliance program; and periodic compliance reports. |
The Trustees also received an overview of the Funds’ distribution arrangements. They received information regarding the Funds’ assets and share purchase and redemption activity.
The presentations made at the Board and Committee meetings and at the Annual Meeting encompassed the Funds and other mutual funds for which the Board of Trustees has responsibility. In evaluating the Management Agreement at the Annual Meeting, the Trustees relied upon their knowledge, resulting from their meetings and other interactions throughout the year, of the Investment Adviser and its affiliates, their services, and the Funds. In conjunction with these meetings, the Trustees received written materials and oral presentations on the topics covered, and the Investment Adviser addressed the questions and concerns of the Trustees, including concerns regarding the investment performance of certain of the funds they oversee. The Independent Trustees were advised by their independent legal counsel regarding their responsibilities and other regulatory requirements related to the approval and continuation of mutual fund investment management agreements under applicable law. In addition, the Investment Adviser and its affiliates provided the Independent Trustees with a written response to a formal request for information sent on behalf of the Independent Trustees by their independent legal counsel. During the course of their deliberations, the Independent Trustees met in executive sessions with their independent legal counsel, without representatives of the Investment Adviser or its affiliates present.
Nature, Extent, and Quality of the Services Provided Under the Management Agreement
As part of their review, the Trustees considered the nature, extent, and quality of the services provided to the Funds by the Investment Adviser. In this regard, the Trustees considered both the investment advisory services and non-advisory services that are provided by the Investment Adviser and its affiliates. The Trustees noted the transition in the leadership and changes in personnel of various of the Investment Adviser’s portfolio management teams that had occurred in recent periods, and the ongoing recruitment efforts aimed at bringing high quality investment talent to the Investment Adviser. They also noted the Investment Adviser’s commitment to maintaining high quality systems and expending substantial resources to respond to ongoing changes to the regulatory and control environment in which the Funds and their service providers operate, as well as the efforts of the Investment Adviser and its affiliates to combat cyber security risks. The Trustees concluded that the Investment Adviser continued to commit substantial financial and operational resources to the Funds and expressed confidence that the Investment Adviser would continue to do so in the future. The Trustees also recognized that the Investment Adviser had made significant commitments to address regulatory compliance requirements applicable to the Funds and the Investment Adviser and its affiliates. In addition, the Trustees reviewed the Sub-Adviser oversight process that the Investment Adviser had employed, which included areas such as investment analytics, risk management and compliance.
57
ACTIVE EQUITY MULTI-MANAGER FUNDS
Statement Regarding Basis for Approval of Management Agreement and Sub-Advisory Agreements (Unaudited) (continued)
Investment Performance
The Trustees also considered the investment performance of the Funds. In this regard, they compared the investment performance of each Fund to its peers using rankings and ratings compiled by the Outside Data Provider as of June 30, 2016 or by the Investment Adviser using the Outside Data Provider peer groups. The information on each Fund’s investment performance was provided for the one-year period ending on June 30, 2016, to the extent that each Fund had been in existence for that period. The Trustees also reviewed each Fund’s investment performance relative to its performance benchmark. The Trustees considered the Investment Adviser’s representations that each Fund had significant differences from its Outside Data Provider peer group and/or benchmark index that caused them to be imperfect bases for comparison. As part of this review, they considered the investment performance trends of the Funds over time, and reviewed the investment performance of each Fund in light of its investment objective and policies and market conditions. The Trustees also received information comparing the Funds’ performance to that of comparable unregistered funds for which the Investment Adviser also serves as investment adviser. They considered that the unregistered funds provide an imperfect performance comparison because they are not subject to the requirements of the 1940 Act.
In addition, the Trustees considered materials prepared and presentations made throughout the year by the Investment Adviser’s senior management and portfolio management personnel in which Fund performance was assessed. The Trustees also considered the Investment Adviser’s periodic reports with respect to the Funds’ risk profiles, and how the Investment Adviser’s approach to risk monitoring and management influences portfolio management.
Costs of Services Provided and Competitive Information
The Trustees considered the contractual terms of the Management Agreement, the fee rates payable by each Fund thereunder, and the net amount retained by the Investment Adviser after payment of sub-advisory fees. In this regard, the Trustees considered information on the services rendered by the Investment Adviser to the Funds, which included both advisory and administrative services that were directed to the needs and operations of the Funds as registered mutual funds.
In particular, the Trustees reviewed analyses prepared by the Outside Data Provider regarding the expense rankings of the Funds. The analyses provided a comparison of each Fund’s management fee to those of a relevant peer group and category universe; an expense analysis which compared each Fund’s overall net and gross expenses to a peer group and a category universe; and data comparing each Fund’s net expenses to the peer and category medians. The Trustees also considered comparative fee information for services provided by the Investment Adviser to collective investment vehicles having investment objectives and policies similar to those of each Fund. They considered information that indicated that services provided to the Funds differed in various significant respects from the services provided to other types of accounts which, in many cases, operated under less stringent legal and regulatory structures, required fewer services from the Investment Adviser to a smaller number of client contact points, and were less time-intensive. They also noted that certain of these types of accounts have a compensation structure which includes performance fees, and also pay additional asset-based fees and performance fees to the managers of underlying hedge funds. The analyses also compared each Fund’s transfer agency and custody fees, other expenses and fee waivers/reimbursements to those of the peer group and category medians. The Trustees concluded that the comparisons provided by the Outside Data Provider were useful in evaluating the reasonableness of the management fees and total expenses paid by the Funds.
In addition, the Trustees considered the Investment Adviser’s undertakings to implement fee waivers and/or expense limitations. They considered the Investment Adviser’s undertaking to waive a portion of the management fees payable by the Funds. In this regard, the Trustees noted that the Investment Adviser’s institutional clients that are invested in the Funds pay a single management fee for the Investment Adviser’s management of their accounts, and that the Investment Adviser waives a portion of the management fee with respect to each Fund in order to achieve an effective net management fee rate that is equal to the actual cost of fees paid to the Fund’s sub-advisers. The Trustees also considered the Investment Adviser’s undertaking to limit each Fund’s “other expenses” ratios (excluding certain expenses) to a specified level.
In addition, the Trustees noted that shareholders are able to redeem their Fund shares at any time if shareholders believe that the Fund fees and expenses are too high or if they are dissatisfied with the performance of the Fund.
Profitability
The Trustees reviewed the Investment Adviser’s revenues and pre-tax profit margins with respect to each of the Funds except Multi-Manager U.S. Small Cap Equity Fund, which had commenced operations in 2016. In this regard the Trustees noted that they had received, among other things, profitability analyses and summaries, revenue and expense schedules by Fund and by function (i.e., investment management and transfer agency), and information on the Investment Adviser’s expense allocation methodology. They observed that the profitability and expense figures are substantially similar to those used by the Investment Adviser for many internal purposes, including compensation decisions among various business groups, and are thus subject to a vigorous internal
58
ACTIVE EQUITY MULTI-MANAGER FUNDS
Statement Regarding Basis for Approval of Management Agreement and Sub-Advisory Agreements (Unaudited) (continued)
debate about how certain revenue and expenses should be allocated. The Trustees also noted that the internal audit group within the Goldman Sachs organization had audited the expense allocation methodology and was satisfied with the reasonableness, consistency, and accuracy of the Investment Adviser’s expense allocation methodology and profitability analysis calculations. The Trustees considered profitability information for each Fund except Multi-Manager U.S. Small Cap Equity Fund in relation to the Investment Adviser’s overall profitability.
Economies of Scale
The Trustees considered the information that had been provided regarding the Investment Adviser’s profitability. The Trustees noted that the Funds do not have management fee breakpoints. The Trustees considered the amounts of assets in the Funds; the Funds’ recent share purchase and redemption activity; the information provided by the Investment Adviser relating to the costs of the services provided by the Investment Adviser and its affiliates and their realized profits; information comparing fee rates charged by the Investment Adviser with fee rates charged to other funds in the peer groups; and the Investment Adviser’s undertakings to waive a portion of its management fee and to limit certain expenses of the Funds that exceed specified levels. The Independent Trustees also considered the relationship between the advisory and sub-advisory fee rate schedules.
Other Benefits to the Investment Adviser and Its Affiliates
The Trustees also considered the other benefits derived by the Investment Adviser and its affiliates from their relationships with the Funds as stated above, including: (a) transfer agency fees received by Goldman, Sachs & Co. (“Goldman Sachs”); (b) brokerage and futures commissions earned by Goldman Sachs for executing securities and futures transactions on behalf of the Funds; (c) the Investment Adviser’s ability to leverage the infrastructure designed to service the Funds on behalf of its other clients; (d) the Investment Adviser’s ability to cross-market other products and services to Fund shareholders; (e) Goldman Sachs’ retention of certain fees as Fund Distributor; (f) the Investment Adviser’s ability to negotiate better pricing with custodians on behalf of its other clients, as a result of the relationship with the Funds; and (g) the possibility that the working relationship between the Investment Adviser and the Funds’ third-party service providers (including the Sub-Advisers) may cause those service providers to be more likely to do business with other areas of Goldman Sachs. In the course of considering the foregoing, the Independent Trustees requested and received further information quantifying certain of these fall-out benefits.
Other Benefits to the Funds and Their Shareholders
The Trustees also noted that the Funds receive certain potential benefits as a result of their relationship with the Investment Adviser, including: (a) enhanced servicing from vendors because of the volume of business generated by the Investment Adviser and its affiliates; (b) the Investment Adviser’s knowledge and experience gained from managing other accounts and products; (c) the Investment Adviser’s ability to hire and retain qualified personnel to provide services to the Funds because of the reputation of the Goldman Sachs organization; (d) the Funds’ access, through the Investment Adviser, to certain firmwide resources (e.g., proprietary risk management systems and databases), subject to certain restrictions; and (e) the Funds’ access to certain affiliated distribution channels. In addition, the Trustees noted the competitive nature of the mutual fund marketplace, and considered that many of the Funds’ shareholders invested in the Funds in part because of the Funds’ relationship with the Investment Adviser and that those shareholders have a general expectation that the relationship will continue.
Conclusion
In connection with their consideration of the Management Agreement, the Trustees gave weight to each of the factors described above, but did not identify any particular factor as controlling their decision. After deliberation and consideration of all of the information provided, including the factors described above, the Trustees concluded, in the exercise of their business judgment, that the management fees paid by each of the Funds were reasonable in light of the services provided to it by the Investment Adviser, the Investment Adviser’s costs and each Fund’s current and reasonably foreseeable asset levels. The Trustees unanimously concluded that the Management Agreement should be approved and continued with respect to each Fund until August 31, 2017.
Designated Sub-Advisory Agreements
Nature, Extent, and Quality of the Services Provided Under the Designated Sub-Advisory Agreements and Performance
In evaluating the Designated Sub-Advisory Agreements, the Trustees relied upon materials furnished and presentations made by the Investment Adviser and the Designated Sub-Advisers. In evaluating the nature, extent, and quality of services provided by each Designated Sub-Adviser, the Trustees considered information on the services provided to the Funds by each Designated
59
ACTIVE EQUITY MULTI-MANAGER FUNDS
Statement Regarding Basis for Approval of Management Agreement and Sub-Advisory Agreements (Unaudited) (continued)
Sub-Adviser, including information about each Designated Sub-Adviser’s (a) personnel and organizational structure; (b) track record in managing funds and/or accounts with investment strategies similar to those employed on behalf of the Funds; (c) policies and procedures in place to address potential conflicts of interest; and (d) compliance program and code of ethics. The Trustees also reviewed the operations and investment performance of each Designated Sub-Adviser’s respective sleeve of each Fund since its inception. In considering each Designated Sub-Adviser’s investment performance, the Trustees reviewed a comparison of each Designated Sub-Adviser to relevant benchmark indices based on various metrics, including realized beta, excess return, alpha, and volatility. The Trustees also reviewed the services provided to each Fund under each Designated Sub-Advisory Agreement.
Costs of Services Provided
The Trustees reviewed the terms of each Designated Sub-Advisory Agreement, including the fee schedules for the Designated Sub-Advisers. They considered the breakpoints (if applicable) in the sub-advisory fee rate payable under each Designated Sub-Advisory Agreement. The Trustees noted that the compensation paid to each Designated Sub-Adviser would be paid by the Investment Adviser, not by the Funds. They noted that the Investment Adviser believes that the relationship between the management fees paid by the Funds and the sub-advisory fees paid by the Investment Adviser is appropriate given the level of services the Investment Adviser provides to the Funds and significant differences in cost drivers and risks associated with the respective services offered by the Investment Adviser and each Designated Sub-Adviser, as well as the management fee waivers and expense limitations that substantially reduce the fees retained by the Investment Adviser. In this regard, the Trustees considered that certain Designated Sub-Advisers had agreed to reduce their sub-advisory fee rate, which benefited shareholders of those Funds in light of the existing management fee waiver arrangements. The Trustees reviewed the anticipated blended average of all sub-advisory fees to be paid by the Investment Adviser with respect to each Fund in light of the overall management fee to be paid by each Fund.
Conclusion
In connection with their consideration of the Designated Sub-Advisory Agreements at the Meeting, the Trustees gave weight to various factors, but did not identify any particular factor as controlling their decision. After deliberation and consideration of the information provided, the Trustees present concluded that each Designated Sub-Advisory Agreement should be approved and continued until August 31, 2017.
Amendments to Designated Sub-Advisory Agreements
Upon the recommendation of the Investment Adviser, at a meeting held on September 14, 2016, the Trustees, including all of the Independent Trustees present, approved amendments to the Sub-Advisory Agreements with WCM Investment Management (“WCM”) (on behalf of Multi-Manager International Equity Fund) and Weitz Investment Management, Inc. (“Weitz”) (on behalf of Multi-Manager U.S. Dynamic Equity Fund). The Trustees considered that the amendments to both Sub-Advisory Agreements would reduce each Sub-Adviser’s sub-advisory fee after giving effect to breakpoints. They noted that the amended Sub-Advisory Agreements would benefit shareholders each Fund in light of the Funds’ existing management fee waiver arrangements.
New Sub-Advisory Agreement
In addition to the actions taken by the Trustees to approve the continuation of the Management Agreement and the Designated Sub-Advisory Agreements, upon the recommendation of the Investment Adviser, at a meeting held on August 3, 2016 the Trustees, including all of the Independent Trustees present, approved sub-advisory agreement (the “New Sub-Advisory Agreement”) between the Investment Adviser and Lazard Asset Management LLC (the “New Sub-Adviser”) on behalf of Goldman Sachs Multi-Manager U.S. Dynamic Equity Fund (the “Fund”). In connection with their evaluation of the New Sub-Advisory Agreement, the Trustees received written materials and oral presentations on the topics covered, and were advised by their independent legal counsel. In addition, the Trustees received information prepared by the New Sub-Adviser in a written response to a formal request from the Investment Adviser.
Nature, Extent, and Quality of the Services Provided Under the New Sub-Advisory Agreement
In evaluating the New Sub-Advisory Agreement, they relied on the information provided by the Investment Adviser and the New Sub-Adviser. In evaluating the nature, extent, and quality of services to be provided by the New Sub-Adviser, the Trustees considered information on the services to be provided to the Fund by the New Sub-Adviser, including information about the New Sub-Adviser’s (a) personnel and compensation structure; (b) track record in managing funds and/or accounts with investment strategies similar to those to be employed on behalf of the Fund; (c) policies and procedures in place to address potential conflicts
60
ACTIVE EQUITY MULTI-MANAGER FUNDS
Statement Regarding Basis for Approval of Management Agreement and Sub-Advisory Agreements (Unaudited) (continued)
of interest; and (d) compliance program and code of ethics. In this regard, they considered assessments provided by the Investment Adviser of the New Sub-Adviser, the New Sub-Adviser’s investment strategies and personnel and its compliance program. The Trustees considered that the New Sub-Adviser manages other assets for the Investment Adviser’s clients, including a sleeve of the Goldman Sachs Multi-Manager Non-Core Fixed Income Fund. They noted that, because the New Sub-Adviser had not previously provided services to the Fund, there was no performance information to evaluate with respect to the Fund.
Costs of Services to be Provided
The Trustees reviewed the terms of the New Sub-Advisory Agreement and the proposed fee schedules, including any breakpoints. They noted that the compensation paid to the New Sub-Adviser would be paid by the Investment Adviser, not by the Fund. They also noted that the terms of the New Sub-Advisory Agreement were the result of arms’ length negotiations between the Investment Adviser and the New Sub-Adviser. They considered GSAM’s undertaking to waive the portion of its management fee which is in excess of the weighted average of the Fund’s sub-advisory fees. The Trustees reviewed the anticipated blended average of all sub-advisory fees to be paid by the Investment Adviser and how it would change upon hiring the New Sub-Adviser. They considered this information in light of the overall management fee to be paid by the Fund.
Conclusion
In connection with their consideration of the New Sub-Advisory Agreement, the Trustees gave weight to various factors, but did not identify any particular factor as controlling their decision. After deliberation and consideration of the information provided, the Trustees present concluded that the New Sub-Advisory Agreement should be approved for a period of two years from the time of its approval.
61
ACTIVE EQUITY MULTI-MANAGER FUNDS
Trustees and Officers (Unaudited)
Independent Trustees
| | | | | | | | | | |
Name,
Address and Age1 | | Position(s) Held with the Trust | | Term of Office and
Length of
Time Served2 | | Principal Occupation(s) During Past 5 Years | | Number of
Portfolios in
Fund Complex
Overseen by
Trustee3 | | Other Directorships Held by Trustee4 |
Ashok N. Bakhru Age: 74 | | Chairman of the Board of Trustees | | Since 2012 | | Mr. Bakhru is retired. He was formerly Director, Apollo Investment Corporation (a business development company) (2008-2013); President, ABN Associates (a management and financial consulting firm) (1994-1996 and 1998-2012); Trustee, Scholarship America (1998-2005); Trustee, Institute for Higher Education Policy (2003-2008); Director, Private Equity Investors — III and IV (1998-2007), and Equity-Linked Investors II (April 2002-2007). Chairman of the Board of Trustees — Goldman Sachs Trust II; Goldman Sachs Trust; Goldman Sachs Variable Insurance Trust; Goldman Sachs BDC, Inc.; Goldman Sachs Private Middle Market Credit LLC; Goldman Sachs MLP Income Opportunities Fund; Goldman Sachs MLP and Energy Renaissance Fund; and Goldman Sachs ETF Trust. | | 142 | | None |
Cheryl K. Beebe Age: 60 | | Trustee | | Since 2015 | | Ms. Beebe is retired. She is Director, Convergys Corporation (2015-Present); Director, Packaging Corporation of America (2008-Present); and was formerly Executive Vice President, (2010-2014); and Chief Financial Officer, Ingredion, Inc. (a global corn refining and manufacturing company) (2004-2014). Trustee — Goldman Sachs Trust II. | | 17 | | Convergys Corporation (a customer management company); Packaging Corporation of America (producer of container board) |
John P. Coblentz, Jr. Age: 75 | | Trustee | | Since 2012 | | Mr. Coblentz is retired. Formerly, he was Partner, Deloitte & Touche LLP (a professional services firm) (1975-2003); Director, Emerging Markets Group, Ltd. (a consulting company) (2004-2006); and Director, Elderhostel, Inc. (a not-for profit organization) (2006-2012). Previously, Mr. Coblentz served as Trustee of Goldman Sachs Trust and Goldman Sachs Variable Insurance Trust (2003-2015). Trustee — Goldman Sachs Trust II; Goldman Sachs BDC, Inc.; Goldman Sachs Private Middle Market Credit LLC; Goldman Sachs MLP Income Opportunities Fund; Goldman Sachs MLP and Energy Renaissance Fund; and Goldman Sachs ETF Trust. | | 36 | | None |
Lawrence Hughes Age: 58 | | Trustee | | Since 2016 | | Mr. Hughes is retired. Formerly, he held senior management positions with BNY Mellon Wealth Management, a division of The Bank of New York Mellon Corporation (a financial services company) (1991-2015), most recently as Chief Executive Officer (2010-2015). He serves as Chairman of the Board of Directors, Ellis Memorial and Eldredge House (a not-for-profit organization) (2012-Present). Previously, Mr. Hughes served as an Advisory Board Member of Goldman Sachs Trust II (February 2016-April 2016). Trustee — Goldman Sachs Trust II. | | 17 | | None |
John F. Killian Age: 61 | | Trustee | | Since 2015 | | Mr. Killian is retired. He is Director, Consolidated Edison, Inc. (2007-Present); Director, Houghton Mifflin Harcourt Publishing Company (2011-Present); and formerly held senior management positions with Verizon Communications, Inc., including Executive Vice President and Chief Financial Officer (2009-2010); and President, Verizon Business, Verizon Communications, Inc. (2005-2009). Trustee — Goldman Sachs Trust II. | | 17 | | Consolidated Edison, Inc. (a utility holding company); Houghton Mifflin Harcourt Publishing Company |
| | | | | | | | | | |
62
ACTIVE EQUITY MULTI-MANAGER FUNDS
Trustees and Officers (Unaudited) (continued)
Independent Trustees
| | | | | | | | | | |
Name,
Address and Age1 | | Position(s) Held with the Trust | | Term of Office and
Length of
Time Served2 | | Principal Occupation(s) During Past 5 Years | | Number of
Portfolios in
Fund Complex
Overseen by
Trustee3 | | Other Directorships Held by Trustee4 |
Richard P. Strubel Age: 77 | | Trustee | | Since 2012 | | Mr. Strubel is retired. Formerly, he served as Chairman of the Board of Trustees, Northern Funds (a family of retail and institutional mutual funds managed by Northern Trust Investments, Inc.) (2008-2014) and Trustee (1982-2014); Director, Cardean Learning Group (provider of educational services via the internet) (2003-2008); and Director, Gildan Activewear Inc. (a clothing marketing and manufacturing company) (2000-2014). He serves as Trustee Emeritus, The University of Chicago (1987-Present). Previously, Mr. Strubel served as Trustee of Goldman Sachs Trust (1987-2015) and Goldman Sachs Variable Insurance Trust (1997-2015). Trustee — Goldman Sachs Trust II; Goldman Sachs BDC, Inc.; Goldman Sachs Private Middle Market Credit LLC; Goldman Sachs MLP Income Opportunities Fund; Goldman Sachs MLP and Energy Renaissance Fund; and Goldman Sachs ETF Trust. | | 36 | | None |
Westley V. Thompson Age: 61 | | Trustee | | Since 2016 | | Mr. Thompson is retired. Formerly, he was President, Sun Life Financial, Inc. (a financial services company) (2008-2014); and held senior management positions at various insurance companies including affiliates of Lincoln National Corporation (1998-2008), Cigna Corporation (1994-1997), and Aetna, Inc. (1979-1994). Previously, Mr. Thompson served as an Advisory Board Member of Goldman Sachs Trust II (February 2016-April 2016). Trustee — Goldman Sachs Trust II. | | 17 | | None |
James A. McNamara Age: 54 | | President and Trustee | | Since 2012 | | Managing Director, Goldman Sachs (December 1998-Present); Director of Institutional Fund Sales, GSAM (April 1998-December 2000); and Senior Vice President and Manager, Dreyfus Institutional Service Corporation (January 1993- April 1998). President and Trustee — Goldman Sachs Trust II; Goldman Sachs Trust; Goldman Sachs Variable Insurance Trust; Goldman Sachs MLP Income Opportunities Fund; Goldman Sachs MLP and Energy Renaissance Fund; and Goldman Sachs ETF Trust. | | 140 | | None |
| | | | | | | | | | |
| * | | Mr. McNamara is considered to be an “Interested Trustee” because he holds a position with Goldman Sachs and owns securities issued by The Goldman Sachs Group, Inc. He holds comparable positions with certain other companies of which Goldman Sachs, GSAM or an affiliate thereof is the investment adviser, administrator and/or distributor. |
| 1 | | Each Trustee may be contacted by writing to the Trustee, c/o Goldman Sachs, 200 West Street, New York, New York, 10282, Attn: Caroline Kraus. Information is provided as of October 31, 2016. |
| 2 | | Subject to such policies as may be adopted by the Board from time-to-time, each Trustee holds office for an indefinite term, until the earliest of: (a) the election of his or her successor; (b) the date the Trustee resigns or is removed by the Board or shareholders, in accordance with the Trust’s Declaration of Trust; or (c) the termination of the Trust. The Board has adopted policies which provide that (a) no Trustee shall hold office for more than 15 years and (b) a Trustee shall retire as of December 31st of the calendar year in which he or she reaches his or her 74th birthday, unless a waiver of such requirement shall have been adopted by a majority of the other Trustees. These policies may be changed by the Trustees without shareholder vote. |
| 3 | | The Goldman Sachs Fund Complex includes certain other companies listed above for each respective Trustee. As of October 31, 2016, Goldman Sachs Trust II consisted of 17 portfolios (15 of which offered shares to the public); Goldman Sachs Trust consisted of 92 portfolios (91 of which offered shares to the public); Goldman Sachs Variable Insurance Trust consisted of 14 portfolios; Goldman Sachs BDC, Inc., Goldman Sachs Private Middle Market Credit LLC, Goldman Sachs MLP Income Opportunities Fund, and Goldman Sachs MLP and Energy Renaissance Fund each consisted of one portfolio; and Goldman Sachs ETF Trust consisted of 15 portfolios (eight of which offered shares to the public). Goldman Sachs Private Middle Market Credit LLC does not offer shares to the public. |
| 4 | | This column includes only directorships of companies required to report to the Securities and Exchange Commission under the Securities Exchange Act of 1934 (i.e., “public companies”) or other investment companies registered under the Act. |
Additional information about the Trustees is available in the Funds’ Statement of Additional Information, which can be obtained from Goldman Sachs free of charge by calling this toll-free number (in the United States of America): 1-800-621-2550.
63
ACTIVE EQUITY MULTI-MANAGER FUNDS
Trustees and Officers (Unaudited) (continued)
Officers of the Trust*
| | | | | | |
Name, Address and Age1 | | Position(s) Held with the Trust | | Term of
Office and
Length of
Time Served2 | | Principal Occupation(s) During Past 5 Years |
James A. McNamara 200 West Street New York, NY 10282 Age: 54 | | President and Trustee | | Since 2012 | | Managing Director, Goldman Sachs (December 1998-Present); Director of Institutional Fund Sales, GSAM (April 1998-December 2000); and Senior Vice President and Manager, Dreyfus Institutional Service Corporation (January 1993-April 1998). President and Trustee — Goldman Sachs Trust II; Goldman Sachs Trust; Goldman Sachs Variable Insurance Trust; Goldman Sachs MLP Income Opportunities Fund; Goldman Sachs MLP and Energy Renaissance Fund; and Goldman Sachs ETF Trust. |
Caroline L. Kraus 200 West Street New York, NY 10282 Age: 39 | | Secretary | | Since 2012 | | Managing Director, Goldman Sachs (January 2016-Present); Vice President, Goldman Sachs (August 2006-December 2015); Associate General Counsel, Goldman Sachs (2012-Present); Assistant General Counsel, Goldman Sachs (August 2006-December 2011); and Associate, Weil, Gotshal & Manges, LLP (2002-2006). Secretary — Goldman Sachs Trust II; Goldman Sachs Trust (previously Assistant Secretary (2012)); Goldman Sachs Variable Insurance Trust (previously Assistant Secretary (2012)); Goldman Sachs BDC, Inc.; Goldman Sachs Private Middle Market Credit LLC; Goldman Sachs Middle Market Lending LLC; Goldman Sachs MLP Income Opportunities Fund; Goldman Sachs MLP and Energy Renaissance Fund; and Goldman Sachs ETF Trust. |
Scott M. McHugh 200 West Street New York, NY 10282 Age: 45 | | Treasurer, Senior Vice President and Principal Financial Officer | | Since 2012 (Principal Financial Officer since 2013) | | Managing Director, Goldman Sachs (January 2016-Present); Vice President, Goldman Sachs (February 2007-December 2015); Assistant Treasurer of certain mutual funds administered by DWS Scudder (2005-2007); and Director (2005-2007), Vice President (2000-2005), and Assistant Vice President (1998-2000), Deutsche Asset Management or its predecessor (1998-2007). Treasurer, Senior Vice President and Principal Financial Officer — Goldman Sachs Trust II; Goldman Sachs Trust; Goldman Sachs Variable Insurance Trust; Goldman Sachs MLP Income Opportunities Fund; Goldman Sachs MLP and Energy Renaissance Fund; and Goldman Sachs ETF Trust. |
| | | | | | |
| * | | Represents a partial list of officers of the Trust. Additional information about all the officers is available in the Funds’ Statement of Additional Information, which can be obtained from Goldman Sachs free of charge by calling this toll-free number (in the United States): 1-800-621-2550. |
| 1 | | Information is provided as of October 31, 2016. |
| 2 | | Officers hold office at the pleasure of the Board of Trustees or until their successors are duly elected and qualified. Each officer holds comparable positions with certain other companies of which Goldman Sachs, GSAM or an affiliate thereof is the investment adviser, administrator and/or distributor. |
Goldman Sachs Trust — Active Equity Multi-Manager Funds — Tax Information (Unaudited)
For the year ended October 31, 2016, 100% and 32.05% of the dividends paid from net investment company taxable income by the Multi-Manager U.S. Dynamic Equity and Multi-Manager U.S. Small Cap Equity Funds qualifies for the dividends received deduction available to corporations.
For the year ended October 31, 2016, 100% and 100% of the dividends paid from net investment company taxable income by the Multi-Manager U.S. Dynamic Equity and Multi-Manager U.S. Small Cap Equity Funds qualify for the reduced tax rate under the Jobs and Growth Tax Relief and Reconciliation Act of 2003.
From distributions paid during the year ended October 31, 2016, the total amount of income received by Multi-Manager International Equity Fund from sources within foreign countries and possessions of the United States was $0.0257 per share, all of which is attributable to qualified passive income. The percentage of net investment income dividends paid from foreign sources by the Multi-Manager International Equity Fund was 99.23%. The total amount of taxes paid by the Multi-Manager International Equity Fund was $0.0025 per share.
64
FUND PROFILE
Goldman Sachs Funds
Goldman Sachs is a premier financial services firm, known since 1869 for creating thoughtful and customized investment solutions in complex global markets.
Today, the Investment Management Division of Goldman Sachs serves a diverse set of clients worldwide, including private institutions, public entities and individuals. With approximately $1.15 trillion in assets under supervision as of September 30, 2016, Goldman Sachs Asset Management (“GSAM”) has portfolio management teams located around the world and our investment professionals bring firsthand knowledge of local markets to every investment decision. Assets under supervision includes assets under management and other client assets for which Goldman Sachs does not have full discretion. GSAM leverages the resources of Goldman, Sachs & Co. subject to legal, internal and regulatory restrictions.
Money Market
Financial Square FundsSM
| n | | Financial Square Treasury Solutions Fund1 |
| n | | Financial Square Government Fund1 |
| n | | Financial Square Money Market Fund2 |
| n | | Financial Square Prime Obligations Fund2 |
| n | | Financial Square Treasury Instruments Fund1 |
| n | | Financial Square Treasury Obligations Fund1 |
| n | | Financial Square Federal Instruments Fund1 |
| n | | Financial Square Tax-Exempt Money Market Fund2 |
Investor FundsSM
| n | | Investor Money Market Fund3 |
| n | | Investor Tax-Exempt Money Market Fund3,4 |
Fixed Income
Short Duration and Government
| n | | High Quality Floating Rate Fund |
| n | | Short-Term Conservative Income Fund5 |
| n | | Short Duration Government Fund |
| n | | Short Duration Income Fund |
| n | | Inflation Protected Securities Fund |
Multi-Sector
Municipal and Tax-Free
| n | | High Yield Municipal Fund |
| n | | Dynamic Municipal Income Fund |
| n | | Short Duration Tax-Free Fund |
Single Sector
| n | | Investment Grade Credit Fund |
| n | | High Yield Floating Rate Fund |
| n | | Emerging Markets Debt Fund |
| n | | Local Emerging Markets Debt Fund |
| n | | Dynamic Emerging Markets Debt Fund |
Fixed Income Alternatives
| n | | Long Short Credit Strategies Fund |
| n | | Fixed Income Macro Strategies Fund |
Fundamental Equity
| n | | Small/Mid Cap Value Fund |
| n | | Small/Mid Cap Growth Fund |
| n | | Flexible Cap Growth Fund |
| n | | Concentrated Growth Fund |
| n | | Technology Opportunities Fund |
| n | | Growth Opportunities Fund |
| n | | Rising Dividend Growth Fund |
| n | | Dynamic U.S. Equity Fund |
Tax-Advantaged Equity
| n | | U.S. Tax-Managed Equity Fund |
| n | | International Tax-Managed Equity Fund |
| n | | U.S. Equity Dividend and Premium Fund |
| n | | International Equity Dividend and Premium Fund |
Equity Insights
| n | | Small Cap Equity Insights Fund |
| n | | U.S. Equity Insights Fund |
| n | | Small Cap Growth Insights Fund |
| n | | Large Cap Growth Insights Fund |
| n | | Large Cap Value Insights Fund |
| n | | Small Cap Value Insights Fund |
| n | | International Small Cap Insights Fund6 |
| n | | International Equity Insights Fund |
| n | | Emerging Markets Equity Insights Fund |
Fundamental Equity International
| n | | Strategic International Equity Fund |
| n | | Focused International Equity Fund |
| n | | Emerging Markets Equity Fund |
Select Satellite
| n | | Real Estate Securities Fund |
| n | | International Real Estate Securities Fund |
| n | | Commodity Strategy Fund |
| n | | Global Real Estate Securities Fund |
| n | | Dynamic Commodity Strategy Fund |
| n | | Dynamic Allocation Fund |
| n | | Absolute Return Tracker Fund |
| n | | Managed Futures Strategy Fund |
| n | | MLP Energy Infrastructure Fund |
| n | | Multi-Manager Alternatives Fund |
| n | | Multi-Asset Real Return Fund |
| n | | Absolute Return Multi-Asset Fund |
| n | | Global Infrastructure Fund |
Total Portfolio Solutions
| n | | Global Managed Beta Fund |
| n | | Multi-Manager Non-Core Fixed Income Fund |
| n | | Multi-Manager U.S. Dynamic Equity Fund |
| n | | Multi-Manager Global Equity Fund |
| n | | Multi-Manager International Equity Fund |
| n | | Tactical Tilt Overlay Fund7 |
| n | | Balanced Strategy Portfolio |
| n | | Multi-Manager U.S. Small Cap Equity Fund |
| n | | Multi-Manager Real Assets Strategy Fund |
| n | | Growth and Income Strategy Portfolio |
| n | | Growth Strategy Portfolio |
| n | | Equity Growth Strategy Portfolio |
| n | | Satellite Strategies Portfolio |
| n | | Enhanced Dividend Global Equity Portfolio |
| n | | Tax-Advantaged Global Equity Portfolio |
| n | | Strategic Factor Allocation Fund |
| n | | Target Date 2020 Portfolio |
| n | | Target Date 2025 Portfolio |
| n | | Target Date 2030 Portfolio |
| n | | Target Date 2035 Portfolio |
| n | | Target Date 2040 Portfolio |
| n | | Target Date 2045 Portfolio |
| n | | Target Date 2050 Portfolio |
| n | | Target Date 2055 Portfolio |
| n | | GQG Partners International Opportunities Fund |
| 1 | | You could lose money by investing in the Fund. Although the Fund seeks to preserve the value of your investment at $1.00 per share, it cannot guarantee it will do so. An investment in the Fund is not a deposit of a bank and is not insured or guaranteed by the Federal Deposit Insurance Corporation or any other government agency. The Fund’s sponsor has no legal obligation to provide financial support to the Fund, and you should not expect that the sponsor will provide financial support to the Fund at any time. |
| 2 | | You could lose money by investing in the Fund. Because the share price of the Fund will fluctuate, when you sell your shares they may be worth more or less than what you originally paid for them. The Fund may impose a fee upon sale of your shares or may temporarily suspend your ability to sell shares if the Fund’s liquidity falls below required minimums because of market conditions or other factors. An investment in the Fund is not a deposit of a bank and is not insured or guaranteed by the Federal Deposit Insurance Corporation or any other government agency. The Fund’s sponsor has no legal obligation to provide financial support to the Fund, and you should not expect that the sponsor will provide financial support to the Fund at any time. |
| 3 | | You could lose money by investing in the Fund. Although the Fund seeks to preserve the value of your investment at $1.00 per share, it cannot guarantee it will do so. The Fund may impose a fee upon sale of your shares or may temporarily suspend your ability to sell shares if the Fund’s liquidity falls below required minimums because of market conditions or other factors. An investment in the Fund is not a deposit of a bank and is not insured or guaranteed by the Federal Deposit Insurance Corporation or any other government agency. The Fund’s sponsor has no legal obligation to provide financial support to the Fund, and you should not expect that the sponsor will provide financial support to the Fund at any time. |
| 4 | | Effective on March 31, 2016, the Goldman Sachs Financial Square Tax-Free Money Market Fund was renamed the Goldman Sachs Investor Tax-Exempt Money Market Fund. |
| 5 | | Effective on July 29, 2016, the Goldman Sachs Limited Maturity Obligations Fund was renamed the Goldman Sachs Short-Term Conservative Income Fund. |
| 6 | | Effective at the close of business on February 5, 2016, the Goldman Sachs International Small Cap Fund was reorganized with and into the Goldman Sachs International Small Cap Insights Fund. |
| 7 | | Effective on June 1, 2016, the Goldman Sachs Tactical Tilt Implementation Fund was renamed the Goldman Sachs Tactical Tilt Overlay Fund. |
Financial Square FundsSM and Investor FundsSM are registered service marks of Goldman, Sachs & Co.
| * | | This list covers open-end funds only. Please visit our website at www.GSAMFUNDS.com to learn about our closed-end funds and exchange-traded funds. |
| | |
TRUSTEES Ashok N. Bakhru, Chairman Cheryl K. Beebe John P. Coblentz, Jr. Lawrence Hughes John F. Killian James A. McNamara Richard P. Strubel Westley V. Thompson | | OFFICERS James A. McNamara, President Scott M. McHugh, Principal Financial Officer, Senior Vice President and Treasurer Caroline L. Kraus, Secretary |
| |
GOLDMAN, SACHS & CO. Distributor and Transfer Agent | | GOLDMAN SACHS ASSET MANAGEMENT, L.P. Investment Adviser |
Visit our Website at www.GSAMFUNDS.com to obtain the most recent month-end returns.
Goldman Sachs Asset Management, L.P. 200 West Street, New York, New York 10282
The reports concerning the Funds included in this shareholder report may contain certain forward-looking statements about the factors that may affect the performance of the Funds in the future. These statements are based on the Funds’ managements’ predictions and expectations concerning certain future events and their expected impact on the Funds, such as performance of the economy as a whole and of specific industry sectors, changes in the levels of interest rates, the impact of developing world events, and other factors that may influence the future performance of the Funds. Management believes these forward-looking statements to be reasonable, although they are inherently uncertain and difficult to predict. Actual events may cause adjustments in portfolio management strategies from those currently expected to be employed.
A description of the policies and procedures that the Funds use to determine how to vote proxies relating to portfolio securities and information regarding how the Fund voted proxies relating to portfolio securities for the most recent 12-month period ended June 30, are available (I) without charge, upon request by calling 1-800-621-2550; and (II) on the Securities and Exchange Commission (“SEC’’) web site at http://www.sec.gov.
The Funds file their complete schedules of portfolio holdings with the SEC for the first and third quarters of each fiscal year on Form N-Q. The Fund’s Forms N-Q are available on the SEC’s web site at http://www.sec.gov within 60 days after the Fund’s first and third fiscal quarters. The Fund’s Forms N-Q may be reviewed and copied at the SEC’s Public Reference Room in Washington, D.C. and information on the operation of the Public Reference Room may also be obtained by calling 1-800-SEC-0330. Form N-Q may be obtained upon request and without charge by calling 1-800-621-2550 (for Institutional Shareholders).
Fund holdings and allocations shown are as of October 31, 2016 and may not be representative of future investments. Fund holdings should not be relied on in making investment decisions and should not be construed as research or investment advice regarding particular securities. Current and future holdings are subject to risk.
The Global Industry Classification Standard (GICS) was developed by and is the exclusive property and a service mark of Morgan Stanley Capital International Inc. (MSCI) and Standard & Poor’s, a division of The McGraw-Hill Companies, Inc. (S&P) and is licensed for use by Goldman Sachs. Neither MSCI, S&P nor any other party involved in making or compiling the GICS or any GICS classifications makes any express or implied warranties or representations with respect to such standard or classification (or the results to be obtained by the use thereof), and all such parties hereby expressly disclaim all warranties of originality, accuracy, completeness, merchantability or fitness for a particular purpose with respect to any of such standard or classification. Without limiting any of the foregoing, in no event shall MSCI, S&P, any of their affiliates or any third party involved in making or compiling the GICS or any GICS classifications have any liability for any direct, indirect, special, punitive, consequential or any other damages (including lost profits) even if notified of the possibility of such damages.
The portfolio risk management process includes an effort to monitor and manage risk, but does not imply low risk.
This material is not authorized for distribution to prospective investors unless preceded or accompanied by a current Prospectus or summary prospectus, if applicable. Investors should consider a Fund’s objective, risks, and charges and expenses, and read the summary prospectus, if available, and/or the Prospectus carefully before investing or sending money. The summary prospectus, if available, and the Prospectus contain this and other information about a Fund and may be obtained from your authorized dealer or from Goldman, Sachs & Co. by calling 1-800-621-2550.
© 2016 Goldman Sachs. All rights reserved. 74712-TMPL-12/2016 MMGRFDSAR-16/165
Goldman Sachs Funds

| | | | |
| | |
| Annual Report | | | | October 31, 2016 |
| | |
| | | | Multi-Manager Alternatives Fund |

Goldman Sachs Multi-Manager Alternatives Fund
| | | | |
TABLE OF CONTENTS | | | | |
| |
Investment Process | | | 1 | |
| |
Portfolio Management Discussion and Performance Summaries | | | 2 | |
| |
Schedule of Investments | | | 12 | |
| |
Financial Statements | | | 49 | |
| |
Financial Highlights | | | 52 | |
| |
Notes to Financial Statements | | | 54 | |
| |
Report of Independent Registered Public Accounting Firm | | | 72 | |
| |
Other Information | | | 73 | |
| | | | |
| | | |
| NOT FDIC-INSURED | | May Lose Value | | No Bank Guarantee |
GOLDMAN SACHS MULTI-MANAGER ALTERNATIVES FUND
What Differentiates Goldman Sachs’ Multi-Manager Alternatives Fund Investment Process?
The Goldman Sachs Multi-Manager Alternatives Fund seeks long-term growth of capital by allocating its assets
to underlying managers who employ a range of alternative and non-traditional investment strategies. The Fund benefits from the dedicated expertise of GSAM’s alternative investment team that has a legacy dating back to
19691 and is located in 8 offices globally.2
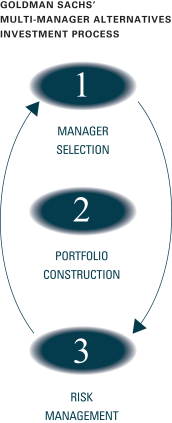

| n | | We have over 150 alternative investment professionals2 dedicated to manager selection |
| n | | We employ a rigorous due diligence process to evaluate each manager’s skill, strategy, and team and continually monitor managers after an investment is made |
| n | | Our Investment Committee process includes an independent “Devil’s advocate” to promote fluid debate and intense examination of each manager |

| n | | We combine “top down” market and economic environment considerations with “bottom up” manager-specific factors |
| n | | We incorporate judgment and quantitative tools to determine the appropriate investment size in each manager |
| n | | The process is continual with ongoing re-balancing and active management to optimize diversification |

| n | | We have over 50 professionals2 focused on alternative investment risk management and operational diligence |
| n | | We consider risk management an all-encompassing and real time discipline |
| n | | Our dedicated strategists leverage our proprietary risk management systems to continually monitor risk |
| 1In | | June 1997, The Goldman Sachs Group, Inc. (GSG, Inc.) acquired the assets and business of Commodities Corporation, which GSG, Inc. subsequently renamed Goldman Sachs Hedge Fund Strategies LLC in December 2004. |
| The | | portfolio risk management process includes an effort to monitor and manage risk, but does not |
| imply | | low risk. Diversification does not protect an investor from market risk and does not ensure a profit. |
1
PORTFOLIO RESULTS
Goldman Sachs Multi-Manager Alternatives Fund
Investment Objective
The Fund seeks long-term growth of capital.
Portfolio Management Discussion and Analysis
Below, the Goldman Sachs Alternative Investments & Manager Selection (“AIMS”) Group discusses the Goldman Sachs Multi-Manager Alternatives Fund’s (the “Fund”) performance and positioning for the 12-month period ended October 31, 2016 (the “Reporting Period”).
| Q | | How did the Fund perform during the Reporting Period? |
| A | | During the Reporting Period, the Fund’s Class A, C, Institutional, IR and R Shares generated average annual total returns, without sales charges, of -0.23%, -1.02%, 0.13%, -0.06% and -0.40%, respectively. These returns compare to the 0.31% average annual total return of the Fund’s primary benchmark, the Bank of America Merrill Lynch Three- Month U.S. Treasury Bill Index (the “BofA Index”) during the same time period. The HFRX Global Hedge Fund Index (net of management, administrative and performance/ incentive fees), a broad proxy for hedge fund performance and the Fund’s secondary benchmark, returned -1.30% during the Reporting Period. |
| | To compare, the MSCI® World Index (net), not the Fund’s benchmark but designed to measure the equity market performance of developed markets, had an average annual total return of 1.18% during the Reporting Period. Similarly not benchmarks of the Fund, the Bloomberg Barclays Global Aggregate Index, designed to measure the broad global investment grade fixed income market, and the Bloomberg Barclays U.S. Corporate High-Yield Index, designed to measure the U.S. non-investment grade fixed-rate debt market, had average annual total returns of 4.36% and 10.11%, respectively, during the Reporting Period. |
| | References to the Fund’s benchmarks and to other indices mentioned herein are for informational purposes only, and unless otherwise noted, are not an indication of how the Fund is managed. The use of the BofA Index as the Fund’s benchmark does not imply the Fund is being managed like cash and does not imply low risk or low volatility. |
| | Notably, during the Reporting Period, the Fund had a realized beta to the MSCI World Index (net) of 0.35. (Beta is a measure of the sensitivity of an asset’s returns to broad market returns.) The Fund’s overall annualized volatility was 4.25% during the Reporting Period, while the overall annualized volatility of the global equity markets, as measured by the MSCI World Index (net), during the same time period was 13.46%. |
| Q | | What economic and market factors most influenced the financial markets as a whole during the Reporting Period? |
| A | | The Reporting Period was marked by spans of uncertainty and volatility, beginning with the Federal Reserve’s (the “Fed”) first interest rate increase in nearly a decade in December 2015. Shortly thereafter, the People’s Bank of China took the step of devaluing its currency, the renminbi, setting off a sharp worldwide sell-off in risk assets, as investors sought perceived safe-haven assets in the uncertainty surrounding the scale and impact of Chinese monetary policy. This “risk off” sentiment persisted into the middle of February 2016, then subsided until uncertainty around the U.K.’s June 2016 referendum on whether to remain a member of the European Union led to significant volatility in U.K. assets. The U.K.’s unexpected decision to leave the European Union, popularly known as Brexit, set off another sharp sell-off in equity and currency markets in late June 2016. The British pound dropped precipitously versus the U.S. dollar and the euro, hitting levels not seen since the 1980s. |
| | Equities generally recovered from the Brexit shock over the summer of 2016, as markets turned their attention to the then-upcoming U.S. election. Meanwhile, the Fed expressed an unexpectedly dovish outlook following the volatility of early 2016, reducing the number of potential 2016 interest rate hikes from four to two. (Dovish commentary tends to suggest lower interest rates.) Accommodative monetary |
2
PORTFOLIO RESULTS
| | policy persisted globally. The European Central Bank left its interest rates unchanged. The Bank of Japan left its interest rates steady while announcing a plan to target its yield curve, or spectrum of maturities, and adjusting its inflation goal to exceed 2%. |
| | Global equity markets ended the Reporting Period broadly positive despite the Reporting Period’s volatility. In the U.S., equities gained on strength in the information technology sector and strong performance from higher yielding, traditionally defensive sectors, such as utilities, telecommunication services and consumer staples. Quantitative easing on a worldwide scale drove investors to search elsewhere for yield, boosting traditionally defensive equity sectors as well as corporate credit. On the other hand, health care companies underperformed the broader U.S. equity market, as election year rhetoric increased worries about downward pressure on drug pricing and increased regulatory scrutiny. Financials, facing margin pressure from low interest rates and regulatory spending, also underperformed. Low volatility stocks outperformed in the defensive sector rally, and oil prices rebounded from early 2016 lows, boosting the energy sector and certain commodity-linked businesses. |
| | Credit markets ended the Reporting Period in largely positive territory, as accommodative monetary policy drove yield-hungry investors into the corporate credit markets. Credit spreads, or yield differentials to government bonds, tightened from their January 2016 highs, with commodity-exposed and energy-related industries, particularly within the high yield corporate bond sector, leading gains. In the U.S., issuers took advantage of low interest rates and strong foreign demand to drive new offerings. Abroad, emerging market credit, offering comparatively more attractive yields and less sovereign leverage, rallied. Money market reform in the U.S. led to significant outflows from prime money market funds into government money market funds, leading to an increase in the three-month LIBOR rate and implications of the coupon rates of floating rate credit. |
| | By the end of the Reporting Period, the market-implied probability of a Fed rate hike by December 2016 was 70%, as measured by Fed funds futures prices. Global central banks, while maintaining policies of quantitative easing, had begun to discuss the limitations of further easing and the broader implications of continued easing in the market. At the end of the Reporting Period, it appeared that political uncertainty in the U.S. surrounding the November 8 election and its aftermath as well as concerns about the effect of a potential “hard Brexit” in March 2017 were likely to be drivers of near-term market volatility. (“Hard Brexit” is one of the ways the U.K. could separate itself from the European Union; opposite of “soft Brexit.” Both terms refer to the closeness or distance of the U.K.s relationship with the European Union after the separation has been completed.) |
| Q | | What key factors were responsible for the Fund’s performance during the Reporting Period? |
| A | | The Fund’s performance during the Reporting Period can be attributed to the performance of the Fund’s Underlying Managers, who are unaffiliated investment managers that employ one or more non-traditional and alternative investment strategies. At various points during the Reporting Period, the Fund primarily allocated capital to 12 Underlying Managers — Acadian Asset Management LLC (“Acadian”); Ares Capital Management II LLC (“Ares”); Atreaus Capital, LP (“Atreaus”); Brigade Capital Management, LP (“Brigade”); Corsair Capital Management, L.P. (“Corsair”); First Pacific Advisors, LLC (“FPA”); Graham Capital Management, L.P. (“GCM”); Lateef Investment Management, L.P. (“Lateef”); New Mountain Vantage Advisers, L.L.C. (“New Mountain Vantage”); Polaris Capital Management, LLC (“Polaris”); QMS Capital Management LP (“QMS”); and Sirios Capital Management, L.P. (“Sirios”). |
| | These 12 Underlying Managers represented five strategies — dynamic equity (Lateef and Polaris); equity long/short (Corsair, FPA and Sirios); event driven and credit (Ares, Brigade and New Mountain Vantage); tactical trading (Atreaus, GCM and QMS); and relative value (Acadian). |
| | Of the 12 Underlying Managers, five generated positive returns and seven generated negative returns during the Reporting Period. |
| | In addition, during the Reporting Period, Russell Investments Implementation Services, LLC (“RIIS”) was employed to manage a beta completion mandate designed to achieve a target beta exposure for the Fund overall. We consider RIIS a portfolio construction tool and did not use it to override any views and/or decisions taken by the Fund’s other Underlying Managers. During the Reporting Period, RIIS did not have a meaningful impact on the Fund’s performance. |
3
PORTFOLIO RESULTS
| Q | | Which strategies most significantly affected Fund performance? |
| A | | Of the five strategies employed across the Underlying Managers during the Reporting Period, two generated positive returns, one generated flat returns and two generated negative returns. The Fund did not have an allocation to the opportunistic fixed income strategy during the Reporting Period. |
| | The event driven and credit strategy generated the Fund’s strongest positive performance during the Reporting Period, mainly driven by positions in high yield corporate bonds and high yield loans. These results were offset somewhat by the negative performance of the strategy’s equities exposures, with positioning in the communications, consumer cyclical and consumer non-cyclical sectors detracting most from performance. Event driven and credit strategies seek to achieve gains from market movements in security prices caused by specific corporate events or changes in perceived relative value. These strategies may include, among others, merger arbitrage, distressed credit, opportunistic credit and value with a catalyst investing styles. |
| | The relative value strategy recorded the Fund’s second-strongest performance during the Reporting Period, with positions in the consumer non-cyclical, industrial and technology sectors among the top performers. Relative value strategies seek to identify and benefit from price discrepancies between related assets (assets that share a common financial factor, such as interest rates, an issuer, or an index). Relative value opportunities generally rely on arbitrage (the simultaneous purchase and sale of related assets) and may exist between two issuers or within the capital structure of a single issuer. These strategies attempt to exploit a source of return with low correlation to the market and include, among others, fixed income arbitrage, convertible arbitrage, volatility arbitrage, statistical arbitrage and equity market neutral strategies. |
| | The Fund’s dynamic equity strategy posted slightly negative performance during the Reporting Period. Exposure to the financials, consumer non-cyclical and basic materials sectors detracted from results, more than offsetting the gains from exposure to the energy, consumer cyclical and industrials sectors. Dynamic equity strategies generally involve investing in equity instruments, often with a long-term view. Dynamic equity strategies are less likely to track a benchmark than traditional long-only strategies, and dynamic equity managers are less constrained than traditional long-only managers with respect to factors such as position concentration, sector and country weights, style and market capitalization. Dynamic equity managers may hedge long positions and may also purchase, in addition to equity investments, bonds, options, preferred securities, and convertible securities, among others. |
| | The tactical trading strategy turned in the Fund’s second-weakest performance during the Reporting Period. Commodity trading detracted most, as losses in energy-related and agriculture-related futures trading wiped out most of the gains in foreign exchange and interest rate futures trading. The impact of the Fund’s significant exposure to gold was largely flat during the Reporting Period. In terms of energy-related futures trading, Underlying Managers were whipsawed by oil price movements and were also hurt by short positions in crude oil futures when oil prices rallied during the third quarter of 2016 and near the end of the Reporting Period. On the positive side, commodity futures trading mitigated the Fund’s downside risk during the equity market selloff in the first quarter of 2016 and amid volatility related to the Brexit vote, demonstrating its value as a portfolio diversifier. Underlying Managers also capitalized on some of the volatility in the euro after the Brexit vote through foreign currency trading and long positions in fixed income. The Fund’s equities trading contributed positively in the early part of the Reporting Period, but those gains were insufficient to offset losses from fixed income trading as longer-term yields rose on a strong U.S. employment report and hawkish commentary from the Fed in August 2016 (Hawkish language or action tends to suggest higher interest rates (opposite of dovish)). Tactical trading strategies seek to produce total return by long and short investing across global fixed income, currency, equity and commodity markets. Tactical trading managers may employ various investment styles of which the two major strategies are global macro and managed futures. Tactical trading managers that employ a global macro style may select their investments based upon fundamental and/ or technical analysis. Tactical trading managers that employ a managed futures investing style may use quantitative modeling techniques, e.g., determining an asset’s value based upon an analysis of price history, price momentum and the asset’s value relative to that of other assets, among other factors. Some tactical trading managers may employ both fundamental analysis and quantitative modeling techniques. Tactical trading managers typically have no bias to be long, short or neutral, but at any given time may have significant long or short exposures in a particular market or asset. |
4
PORTFOLIO RESULTS
| | The Fund’s equity long/short strategy hurt performance the most during the Reporting Period, attributable primarily to positions in the consumer and communications sectors. Equity long/short strategies generally involve long and short investing, based on fundamental evaluations, research and various analytical measurements, in equity and equity-related investments. Equity long/short managers may, for example, buy stocks they expect to outperform or they believe are undervalued, and may also sell short stocks they believe will underperform or they believe are overvalued. Long positions benefit from an increase in the price of the underlying instrument or asset class, while short positions benefit from a decrease in that price. |
| Q | | How did the Fund use derivatives and similar instruments during the Reporting Period? |
| A | | The Underlying Managers of the Fund employ derivatives and similar instruments as part of their underlying strategies to hedge market exposure and/or to gain implicit leverage, subject to the constraints of the Investment Company Act of 1940. During the Reporting Period, credit default swaps, total return swaps, equity futures, equity options, interest rate swaps, interest rate swap futures, interest rate swaptions, bond futures, options on bond futures, commodity futures, commodity swaps, inflation swaps, forward foreign exchange contracts, written option currency contracts, foreign exchange options, foreign exchange futures and cross currency swaps were used by the Underlying Managers of the Fund. Overall, the use of derivatives and similar instruments by the Underlying Managers had a negative impact on the Fund’s performance during the Reporting Period. |
| Q | | Were there any notable changes in the Fund’s allocations and Underlying Managers during the Reporting Period? |
| A | | During the Reporting Period, shifts to the Fund’s asset allocation were made in response to the market environment and were also the result of changes in allocations to the Fund’s various strategies. More specifically, we eliminated the Fund’s allocation to the dynamic equity strategy to reduce the Fund’s directional exposure as a reflection of our more neutral outlook on beta within equities but continued positive outlook on alpha opportunities. (Alpha opportunities refer to the prospect of potentially outperforming a benchmark index.) We also decreased the Fund’s allocation overall to the equity long/short strategy and added an allocation to the relative value strategy. In the process, we completely redeemed assets from Underlying Manager Lateef, and as of January 4, 2016, Lateef no longer served as an Underlying Manager of the Fund. We also steadily redeemed assets from Underlying Manager Polaris and by June 30, 2016, Polaris no longer served as an Underlying Manager of the Fund. We added a new Underlying Manager — Acadian. Acadian, approved by the Fund’s Board in February 2016, was first allocated capital in June 2016 and became the first Underlying Manager to represent the Fund’s relative value strategy. |
| | During the Reporting Period, we increased the Fund’s allocation to the event driven and credit strategy, reflecting the addition of Underlying Manager New Mountain Vantage. New Mountain Vantage, approved by the Fund’s Board in November 2015, was first allocated capital during December 2015. The addition was an expression of our view that the environment for strategic transactions and other corporate activity continued to be robust, driven by high confidence by chief executive officers and a large amount of cash on balance sheets. In late January 2016, we further increased the Fund’s allocation to the event driven and credit strategy because of the opportunities we believed were created by widening credit spreads during the fourth quarter of 2015. Spreads then sharply narrowed, particularly during March 2016, benefiting the Fund. During July 2016, we added to the Fund’s allocation to the event driven and credit strategy, largely because of our preference at that time for credit over equities. |
| | Furthermore, during the Reporting Period, we increased the Fund’s allocation to the tactical trading strategy as a result of our positive view of uncorrelated strategies. In addition, we held a positive view on the Fund’s Underlying Managers representing the tactical trading strategy because of their generally flexible and broader mandates, which allowed them to perform well in times of market volatility during the Reporting Period. These Underlying Managers posted positive performance during the market sell-off in the first quarter of 2016 as well as in the market turbulence that surrounded Brexit during the summer of 2016. |
| | During the Reporting Period, we added six new Underlying Managers. As mentioned previously, Acadian became the first Underlying Manager to represent the Fund’s relative value strategy, and New Mountain Vantage became an Underlying Manager within the Fund’s event driven and credit strategy, joining Ares and Brigade. QMS, approved in February 2016, became an Underlying Manager within the tactical trading strategy, joining GCM and Atreaus. In addition, Wellington Capital Management Company LLP |
5
PORTFOLIO RESULTS
| | (“Wellington”) and Algert Global LLC (“Algert”) were added as Underlying Managers, but we did not allocate assets to them during the Reporting Period. Wellington, approved by the board in May 2016, will be an Underlying Manager within the equity long/short strategy, joining Corsair, FPA and Sirios. Algert, approved by the board in September 2016, will be an Underlying Manager within the relative value strategy, joining Acadian. |
| | As mentioned previously, RIIS was approved as an Underlying Manager during the Reporting Period to manage a beta completion mandate designed to achieve a target beta exposure for the Fund overall. Importantly, we do not intend to use RIIS to override any views and/or decisions taken by the Fund’s other Underlying Managers. |
| Q | | Were there any changes to the Fund’s portfolio management team during the Reporting Period? |
| A | | During the Reporting Period, Kent Clark was added as a portfolio manager for the Fund, effective February 26, 2016. Kent Clark is Co-Chief Investment Officer of the AIMS Group and Head of the AIMS Hedge Fund Investment Team. He also serves as Chairman of the AIMS Hedge Funds and Public Equity Investment Committee, Co-Chairman of the AIMS Credit Strategies Investment Committee and member of the AIMS Imprint Environmental, Social and Governance Investment Committee. As of August 19, 2016, Jason Gottlieb no longer served as a portfolio manager for the Fund. By design, all investment decisions (i.e., allocation) for the Fund are performed within a co-lead or team structure, with multiple subject matter experts. This strategic decision making has been the cornerstone of our approach and ensures continuity in the Fund. The other portfolio managers for the Fund are Ryan Roderick and Betsy Gorton. |
| Q | | What is the Fund’s tactical view and strategy for the months ahead? |
| A | | We intend to continue to closely monitor global economic growth, monetary policy and market volatility, while using active portfolio management and alternative investment strategies to position the Fund as we aim to deliver positive absolute returns across a variety of market environments. We believe the flexibility to allocate tactically across these alternative strategies may enable us to provide investors with positive absolute returns in a variety of market conditions and with significant diversification benefits. We intend to continue to actively explore adding new managers with what we consider to be unique alternative capabilities as market conditions warrant. |
6
PORTFOLIO RESULTS
Index Definitions
The Bloomberg Barclays Global Aggregate Index, an unmanaged index, provides a broad-based measure of the global investment grade fixed-rate debt markets and covers the most liquid portion of the global investment grade fixed-rate bond market, including government, credit and collateralized securities. It is not possible to invest in an unmanaged index.
The Bloomberg Barclays U.S. Corporate High-Yield Index covers the universe of U.S. dollar denominated, nonconvertible, fixed rate, non-investment grade debt. Index holdings must have at least one year to final maturity, at least $150 million par amount outstanding, and be publicly issued with a rating of Ba1 or lower. It is not possible to invest in an unmanaged index.
The MSCI® World Index represents large- and mid-cap equity performance across 23 developed markets countries, covering approximately 85% of the free float-adjusted market capitalization in each. This index offers a broad global equity benchmark, without emerging markets exposure. It is not possible to invest in an unmanaged index.
7
FUND BASICS
Multi-Manager Alternatives Fund
as of October 31, 2016
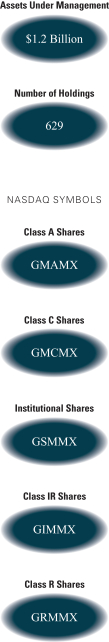
| | | | | | | | | | | | | | |
| | PERFORMANCE REVIEW | |
| | | November 1, 2015–October 31, 2016 | | Fund Total Return
(based on NAV)1 | | | Bank of America Merrill
Lynch Three-Month U.S.
Treasury Bill Index2 | | | HFRX Global
Hedge Fund Index3 | |
| | Class A | | | -0.23 | % | | | 0.31 | % | | | -1.30 | % |
| | Class C | | | -1.02 | | | | 0.31 | | | | -1.30 | |
| | Institutional | | | 0.13 | | | | 0.31 | | | | -1.30 | |
| | Class IR | | | -0.06 | | | | 0.31 | | | | -1.30 | |
| | | Class R | | | -0.40 | | | | 0.31 | | | | -1.30 | |
| | 1 | | The net asset value (“NAV”) represents the net assets of the class of the Fund (ex-dividend) divided by the total number of shares of the class outstanding. The Fund’s performance reflects the reinvestment of dividends and other distributions. The Fund’s performance does not reflect the deduction of any applicable sales charges. |
| | 2 | | The Bank of America Merrill Lynch Three-Month U.S. Treasury Bill Index is comprised of a single issue purchased at the beginning of the month and held for a full month. At the end of the month that issue is sold and rolled into a newly selected issue. The issue selected at each month-end rebalancing is the outstanding Treasury Bill that matures closest to, but not beyond, three months from the rebalancing date. To qualify for selection, an issue must have settled on or before the month-end rebalancing date. While the index will often hold the Treasury Bill issued at the most recent 3-month auction, it is also possible for a seasoned 6-month Bill to be selected. |
| | 3 | | The HFRX Global Hedge Fund Index is designed to be representative of the overall composition of the hedge fund universe. It is comprised of all eligible hedge fund strategies; including but not limited to convertible arbitrage, distressed securities, equity hedge, equity market neutral, event driven, macro, merger arbitrage, and relative value arbitrage. The strategies are asset weighted based on the distribution of assets in the hedge fund industry. The index is investable through products managed by HFR Asset Management, LLC that track HFRX Indices. The HFRX Global Hedge Fund Index is a trademark of HFR. HFR has not participated in the formation of the Fund. HFR does not endorse or approve the Fund or make any recommendation with respect to investing in the Fund. |
| | | | HFRI and HFRX and related indices are trademarks and service marks of Hedge Fund Research, Inc. (“HFR”) which has no affiliation with GSAM. Information regarding HFR indices was obtained from HFR’s website and other public sources and is provided for comparison purposes only. HFR does not endorse or approve any of the statements made herein. |
| | | | | | | | | | | | |
| | STANDARDIZED TOTAL RETURNS4 |
| | | For the period ended 9/30/16 | | One Year | | | Since Inception | | | Inception Date |
| | Class A | | | -4.11 | % | | | -0.10 | % | | 4/30/13 |
| | Class C | | | -0.25 | | | | 0.82 | | | 4/30/13 |
| | Institutional | | | 1.79 | | | | 1.96 | | | 4/30/13 |
| | Class IR | | | 1.69 | | | | 1.83 | | | 4/30/13 |
| | | Class R | | | 1.16 | | | | 1.31 | | | 4/30/13 |
| | 4 | | The Standardized Total Returns are average annual total returns as of the most recent calendar quarter-end. They assume reinvestment of all distributions at NAV. These returns reflect a maximum initial sales charge of 5.50% for Class A Shares and the assumed contingent deferred sales charge for Class C Shares (1% if redeemed within 12 months of purchase). Because Institutional, Class IR and Class R Shares do not involve a sales charge, such a charge is not applied to their Standardized Total Returns. |
The returns set forth in the tables above represent past performance. Past performance does not guarantee future results. The Fund’s investment return and principal value will fluctuate so that an investor’s shares, when redeemed, may be worth more or less than their original cost. Current performance may be lower or higher than the performance quoted above. Please visit our web site at www.GSAMFUNDS.com to obtain the most recent month-end returns. Performance reflects applicable fee waivers and/or expense limitations in effect during the periods shown. In their absence, performance would be reduced. Returns do not reflect the deduction of taxes that a shareholder would pay on Fund distributions or the redemption of Fund shares.
8
FUND BASICS
| | | | | | | | | | |
| | EXPENSE RATIOS5 | |
| | | | | Net Expense Ratio (Current) | | | Gross Expense Ratio (Before Waivers) | |
| | Class A | | | 2.73 | % | | | 2.91 | % |
| | Class C | | | 3.48 | | | | 3.66 | |
| | Institutional | | | 2.33 | | | | 2.51 | |
| | Class IR | | | 2.48 | | | | 2.66 | |
| | | Class R | | | 2.98 | | | | 3.18 | |
| | 5 | | The expense ratios of the Fund, both current (net of applicable fee waivers and/or expense limitations) and before waivers (gross of applicable fee waivers and/or expense limitations) are as set forth above according to the most recent publicly available Prospectus for the Fund, as supplemented, and may differ from the expense ratios disclosed in the Financial Highlights in this report. Pursuant to a contractual arrangement, the Fund’s waivers and/or expense limitations will remain in place through at least February 28, 2017, and prior to such date the Investment Adviser may not terminate the arrangements without the approval of the Fund’s Board of Trustees. If these arrangements are discontinued in the future, the expense ratios may change without shareholder approval. |
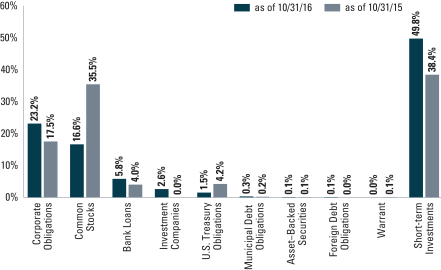
| | 6 | | The percentage shown for each investment category reflects the value of investments in that category as a percentage of the Fund’s market value, excluding cash and the allocation to Russell Investments Implementation Services, LLC which manages a beta completion mandate. The graph depicts the Fund’s investments but may not represent the Fund’s market exposure due to the exclusion of certain derivatives, if any, as listed in the Additional Investment Information section of the Schedule of Investments. Short-term investments represent repurchase agreements. |
9
FUND BASICS
| | | | | | | | |
| | TOP TEN EQUITY HOLDINGS AS OF 10/31/167 |
| | | Holding | | % of Net Assets | | | Line of Business |
| | Goldman Sachs Financial Square Government Fund | | | 1.3 | % | | Investment Companies |
| | Allergan PLC | | | 0.4 | | | Pharmaceuticals |
| | Aon PLC | | | 0.4 | | | Property Insurance |
| | American International Group, Inc. | | | 0.4 | | | Property Insurance |
| | Bank of America Corp. | | | 0.4 | | | Banks |
| | Oracle Corp. | | | 0.3 | | | Software |
| | Aramark | | | 0.3 | | | Commercial Services |
| | Valeant Pharmaceuticals International, Inc. | | | 0.3 | | | Health Care – Pharmaceuticals |
| | Citigroup, Inc. | | | 0.2 | | | Banks |
| | | NorthStar Asset Management Group, Inc. | | | 0.2 | | | Diversified Financial Services |
| | 7 | | The top 10 equity holdings may not be representative of the Fund’s future investments. |
| | | | | | |
| | UNDERLYING MANAGER ALLOCATION (%)8 | |
| | | As of October 31, 2016 | | | |
| | Acadian Asset Management LLC | | | 16.3 | % |
| | Brigade Capital Management, LP | | | 16.0 | |
| | Ares Capital Management II LLC | | | 13.4 | |
| | Atreaus Capital, LP | | | 13.0 | |
| | QMS Capital Management LP | | | 10.9 | |
| | Graham Capital Management, L.P. | | | 9.8 | |
| | Corsair Capital Management, L.P. | | | 5.2 | |
| | New Mountain Vantage Advisers, L.L.C. | | | 5.2 | |
| | Sirios Capital Management, L.P. | | | 5.1 | |
| | | First Pacific Advisors, LLC | | | 5.0 | |
| | 8 | | The chart above represents capital allocated to the Underlying Managers, as a percentage of net assets, excluding cash and the allocation to Russell Investments Implementation Services, LLC, which manages a beta completion mandate for the Fund, and as such the weightings may not sum to 100%. |
| | | | | | |
| | STRATEGY ALLOCATION (%)9 |
| | | As of October 31, 2016 |
| |
| | | 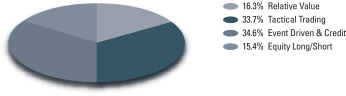 |
| | 9 | | Equity Long/Short Strategies generally involve long and short investing, based on fundamental evaluations, research and various analytical measurements, in equity and equity-related investments. Relative Value Strategies typically seek to exploit the mispricing of related assets and/or price convergence, often with the additional use of leverage. Event Driven and Credit typically seek to take advantage of corporate events and company-specific catalysts such as bankruptcies, mergers or takeovers. Tactical Trading Strategies seek to produce total return by long and short investing across global fixed income, currency, equity, and commodity markets. Tactical Trading managers typically have no bias to be long, short, or neutral. The percentages above exclude cash and the allocation to Russell Investments Implementation Services, LLC, who manages a beta completion mandate for the Fund. |
10
GOLDMAN SACHS MULTI-MANAGER ALTERNATIVES FUND
Performance Summary
October 31, 2016
The following graph shows the value, as of October 31, 2016, of a $1,000,000 investment made on April 30, 2013 (commencement of operations) in Institutional Shares at NAV. For comparative purposes, the performance of the Fund’s current benchmarks, the Bank of America Merrill Lynch Three-Month U.S. Treasury Bill Index and the HFRX Global Hedge Fund Index, are shown. This performance data represents past performance and should not be considered indicative of future performance, which will fluctuate with changes in market conditions. These performance fluctuations will cause an investor’s shares, when redeemed, to be worth more or less than their original cost. Performance reflects applicable fee waivers and/or expense limitations in effect during the periods shown and in their absence, performance would be reduced. Returns do not reflect the deduction of taxes that a shareholder would pay on Fund distributions or the redemption of Fund shares. Performance of Class A, Class C, Class IR and Class R Shares will vary from Institutional Shares due to differences in class specific fees and any applicable sales charges. In addition to the Underlying Managers’ decisions regarding issuer/industry investment selection and allocation, other factors may affect Fund performance. These factors include, but are not limited to, Fund operating fees and expenses, portfolio turnover and subscription and redemption cash flows affecting the Fund.
|
| Multi-Manager Alternatives Fund’s Lifetime Performance |
Performance of a $1,000,000 Investment, with distributions reinvested, from April 30, 2013 through October 31, 2016.
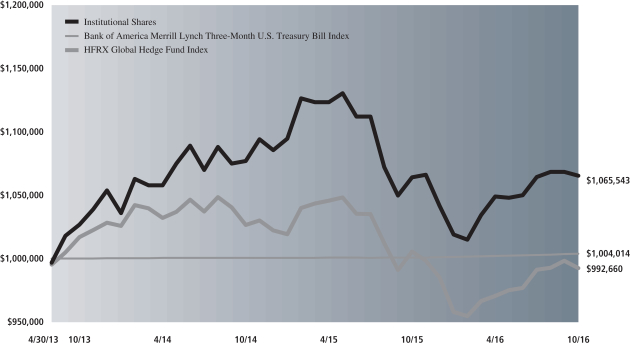
| | | | | | | | |
| Average Annual Total Return through October 31, 2016 | | | One Year | | | | Since Inception | |
Class A (Commenced April 30, 2013) | | | | | | | | |
Excluding sales charges | | | -0.23% | | | | 1.44% | |
Including sales charges | | | -5.69% | | | | -0.18% | |
| |
Class C (Commenced April 30, 2013) | | | | | | | | |
Excluding contingent deferred sales charges | | | -1.02% | | | | 0.68% | |
Including contingent deferred sales charges | | | -2.01% | | | | 0.68% | |
| |
Institutional (Commenced April 30, 2013) | | | 0.13% | | | | 1.83% | |
| |
Class IR (Commenced April 30, 2013) | | | -0.06% | | | | 1.70% | |
| |
Class R (Commenced April 30, 2013) | | | -0.40% | | | | 1.19% | |
| |
11
GOLDMAN SACHS MULTI-MANAGER ALTERNATIVES FUND
Consolidated Schedule of Investments
October 31, 2016
| | | | | | | | | | | | | | |
Principal Amount | | | Interest
Rate | | | Maturity
Date | | | Value | |
| | Corporate Obligations – 20.8% | |
| | Aerospace & Defense – 0.1% | |
| Bombardier, Inc.(a) | |
| $ | 277,000 | | | | 7.750 | % | | | 03/15/20 | | | $ | 281,502 | |
| | 100,000 | | | | 5.750 | | | | 03/15/22 | | | | 88,500 | |
| | 100,000 | | | | 6.000 | (b) | | | 10/15/22 | | | | 88,875 | |
| | 200,000 | | | | 6.125 | | | | 01/15/23 | | | | 173,500 | |
| | 650,000 | | | | 7.500 | (b) | | | 03/15/25 | | | | 580,125 | |
| Moog, Inc.(a)(b) | |
| | 273,000 | | | | 5.250 | | | | 12/01/22 | | | | 280,166 | |
| Orbital ATK, Inc.(b) | |
| | 200,000 | | | | 5.250 | | | | 10/01/21 | | | | 208,000 | |
| Oshkosh Corp.(b) | |
| | 27,000 | | | | 5.375 | | | | 03/01/25 | | | | 28,181 | |
| | | | | | | | | | | | | | |
| | | | | | | | | | | | | 1,728,849 | |
| | |
| | Automotive(a)(b) – 0.1% | |
| Deck Chassis Acquisition, Inc. | |
| | 905,000 | | | | 10.000 | | | | 06/15/23 | | | | 928,756 | |
| | |
| | Banks(b)(c) – 0.3% | |
| Citigroup, Inc. | |
| | 575,000 | | | | 5.950 | | | | 05/15/49 | | | | 587,219 | |
| | 315,000 | | | | 6.250 | | | | 08/15/49 | | | | 339,019 | |
| JPMorgan Chase & Co. | |
| | 1,690,000 | | | | 5.150 | | | | 05/01/49 | | | | 1,685,775 | |
| | 1,135,000 | | | | 6.000 | | | | 08/01/49 | | | | 1,183,237 | |
| | | | | | | | | | | | | | |
| | | | | | | | | | | | | 3,795,250 | |
| | |
| | Building Materials(b) – 0.2% | |
| Builders FirstSource, Inc.(a) | |
| | 885,000 | | | | 5.625 | | | | 09/01/24 | | | | 893,850 | |
| Gibraltar Industries, Inc. | |
| | 1,600,000 | | | | 6.250 | | | | 02/01/21 | | | | 1,656,000 | |
| | | | | | | | | | | | | | |
| | | | | | | | | | | | | 2,549,850 | |
| | |
| | Chemicals(b) – 0.8% | |
| Aruba Investments, Inc.(a) | |
| | 855,000 | | | | 8.750 | | | | 02/15/23 | | | | 872,100 | |
| Blue Cube Spinco, Inc. | |
| | 1,455,000 | | | | 9.750 | | | | 10/15/23 | | | | 1,709,625 | |
| | 195,000 | | | | 10.000 | | | | 10/15/25 | | | | 234,000 | |
| Cornerstone Chemical Co.(a) | |
| | 2,450,000 | | | | 9.375 | | | | 03/15/18 | | | | 2,443,875 | |
| Hexion, Inc. | |
| | 645,000 | | | | 10.000 | | | | 04/15/20 | | | | 632,906 | |
| Rain CII Carbon LLC/CII Carbon Corp.(a) | |
| | 1,820,000 | | | | 8.000 | | | | 12/01/18 | | | | 1,785,875 | |
| | 1,105,000 | | | | 8.250 | | | | 01/15/21 | | | | 1,078,756 | |
| | 125,000 | | | | 8.500 | | | | 01/15/21 | | | | 131,044 | |
| TPC Group, Inc.(a) | |
| | 785,000 | | | | 8.750 | | | | 12/15/20 | | | | 645,663 | |
| | | | | | | | | | | | | | |
| | | | | | | | | | | | | 9,533,844 | |
| | |
| | Commercial Services(a)(b) – 0.2% | |
| AMN Healthcare, Inc. | |
| | 625,000 | | | | 5.125 | | | | 10/01/24 | | | | 634,375 | |
| LSC Communications, Inc. | |
| | 135,000 | | | | 8.750 | | | | 10/15/23 | | | | 133,481 | |
| | |
| | Corporate Obligations – (continued) | |
| | Commercial Services(a)(b) – (continued) | |
| Prime Security Services Borrower LLC/Prime Finance, Inc. | |
| $ | 2,030,000 | | | | 9.250 | % | | | 05/15/23 | | | $ | 2,156,875 | |
| | | | | | | | | | | | | | |
| | | | | | | | | | | | | 2,924,731 | |
| | |
| | Consumer Cyclical Services(b) – 0.7% | |
| APX Group, Inc. | |
| | 1,880,000 | | | | 8.750 | | | | 12/01/20 | | | | 1,825,950 | |
| CEB, Inc.(a) | |
| | 120,000 | | | | 5.625 | | | | 06/15/23 | | | | 116,850 | |
| Cenveo Corp.(a) | |
| | 1,065,000 | | | | 6.000 | | | | 08/01/19 | | | | 937,200 | |
| | 1,865,000 | | | | 8.500 | | | | 09/15/22 | | | | 1,314,825 | |
| Ceridian HCM Holding, Inc.(a) | |
| | 35,000 | | | | 11.000 | | | | 03/15/21 | | | | 36,881 | |
| First Data Corp.(a) | |
| | 600,000 | | | | 5.000 | | | | 01/15/24 | | | | 607,500 | |
| Monitronics International, Inc. | |
| | 2,440,000 | | | | 9.125 | | | | 04/01/20 | | | | 2,314,950 | |
| Multi-Color Corp.(a) | |
| | 1,000,000 | | | | 6.125 | | | | 12/01/22 | | | | 1,045,000 | |
| United Rentals North America, Inc. | |
| | 535,000 | | | | 4.625 | | | | 07/15/23 | | | | 552,388 | |
| | 120,000 | | | | 5.500 | | | | 05/15/27 | | | | 120,000 | |
| | | | | | | | | | | | | | |
| | | | | | | | | | | | | 8,871,544 | |
| | |
| | Consumer Noncyclical(b) – 0.1% | |
| NeuStar, Inc. | |
| | 1,445,000 | | | | 4.500 | | | | 01/15/23 | | | | 1,347,463 | |
| | |
| | Diversified Financial Services(b) – 0.2% | |
| Bankrate, Inc.(a) | |
| | 1,500,000 | | | | 6.125 | | | | 08/15/18 | | | | 1,507,500 | |
| Credit Acceptance Corp. | |
| | 1,030,000 | | | | 6.125 | | | | 02/15/21 | | | | 1,037,725 | |
| | 245,000 | | | | 7.375 | | | | 03/15/23 | | | | 253,881 | |
| | | | | | | | | | | | | | |
| | | | | | | | | | | | | 2,799,106 | |
| | |
| | Energy – 0.8% | |
| Basic Energy Services, Inc.(b)(d) | |
| | 350,000 | | | | 7.750 | | | | 10/15/22 | | | | 154,000 | |
| Blue Racer Midstream LLC/Blue Racer Finance Corp.(a)(b) | |
| | 2,500,000 | | | | 6.125 | | | | 11/15/22 | | | | 2,459,375 | |
| Chesapeake Energy Corp.(a)(b) | |
| | 570,000 | | | | 8.000 | | | | 12/15/22 | | | | 578,550 | |
| CITGO Petroleum Corp.(a)(b) | |
| | 2,000,000 | | | | 6.250 | | | | 08/15/22 | | | | 2,017,500 | |
| Energy Transfer Equity LP(b) | |
| | 940,000 | | | | 5.875 | | | | 01/15/24 | | | | 954,100 | |
| Parker Drilling Co.(b) | |
| | 2,475,000 | | | | 6.750 | | | | 07/15/22 | | | | 1,955,250 | |
| Seventy Seven Energy, Inc.(b)(d) | |
| | 205,000 | | | | 6.500 | | | | 07/15/22 | | | | — | |
| Southern Star Central Corp.(a)(b) | |
| | 180,000 | | | | 5.125 | | | | 07/15/22 | | | | 183,600 | |
| Weatherford International Ltd. | |
| | 725,000 | | | | 6.750 | | | | 09/15/40 | | | | 572,750 | |
| | 785,000 | | | | 5.950 | (b) | | | 04/15/42 | | | | 602,487 | |
| | |
| | |
| 12 | | The accompanying notes are an integral part of these financial statements. |
GOLDMAN SACHS MULTI-MANAGER ALTERNATIVES FUND
| | | | | | | | | | | | | | |
Principal Amount | | | Interest
Rate | | | Maturity
Date | | | Value | |
| | Corporate Obligations – (continued) | |
| | Energy – (continued) | |
| Western Refining Logistics LP/WNRL Finance Corp.(b) | |
| $ | 285,000 | | | | 7.500 | % | | | 02/15/23 | | | $ | 298,538 | |
| Western Refining, Inc.(b) | |
| | 333,000 | | | | 6.250 | | | | 04/01/21 | | | | 333,000 | |
| | | | | | | | | | | | | | |
| | | | | | | | | | | | | 10,109,150 | |
| | |
| | Energy – Exploration & Production – 1.6% | |
| California Resources Corp.(b) | |
| | 7,500 | | | | 5.000 | | | | 01/15/20 | | | | 4,575 | |
| | 24,000 | | | | 5.500 | | | | 09/15/21 | | | | 14,160 | |
| | 1,185,000 | | | | 8.000 | (a) | | | 12/15/22 | | | | 805,800 | |
| | 7,500 | | | | 6.000 | | | | 11/15/24 | | | | 4,200 | |
| CONSOL Energy, Inc.(b) | |
| | 1,300,000 | | | | 5.875 | | | | 04/15/22 | | | | 1,202,500 | |
| | 600,000 | | | | 8.000 | | | | 04/01/23 | | | | 597,750 | |
| Continental Resources, Inc.(b) | |
| | 190,000 | | | | 5.000 | | | | 09/15/22 | | | | 186,675 | |
| | 466,000 | | | | 4.500 | | | | 04/15/23 | | | | 447,360 | |
| Diamondback Energy, Inc.(a)(b) | |
| | 185,000 | | | | 4.750 | | | | 11/01/24 | | | | 185,000 | |
| Extraction Oil & Gas Holdings LLC/Extraction Finance Corp.(a)(b) | |
| | 920,000 | | | | 7.875 | | | | 07/15/21 | | | | 968,300 | |
| Gulfport Energy Corp.(a)(b) | |
| | 250,000 | | | | 6.000 | | | | 10/15/24 | | | | 255,000 | |
| Halcon Resources Corp.(a)(b) | |
| | 1,000,000 | | | | 8.625 | | | | 02/01/20 | | | | 1,010,000 | |
| Jupiter Resources, Inc.(a)(b) | |
| | 1,745,000 | | | | 8.500 | | | | 10/01/22 | | | | 1,439,625 | |
| Kosmos Energy Ltd.(a)(b) | |
| | 1,405,000 | | | | 7.875 | | | | 08/01/21 | | | | 1,349,450 | |
| Linn Energy LLC/Linn Energy Finance Corp.(b)(d) | |
| | 2,660,000 | | | | 6.250 | | | | 11/01/19 | | | | 884,450 | |
| MEG Energy Corp.(a)(b) | |
| | 600,000 | | | | 6.500 | | | | 03/15/21 | | | | 516,000 | |
| | 450,000 | | | | 6.375 | | | | 01/30/23 | | | | 369,000 | |
| | 1,875,000 | | | | 7.000 | | | | 03/31/24 | | | | 1,537,500 | |
| Memorial Production Partners LP/Memorial Production Finance
Corp.(b) |
|
| | 745,000 | | | | 7.625 | | | | 05/01/21 | | | | 305,450 | |
| | 1,765,000 | | | | 6.875 | | | | 08/01/22 | | | | 697,175 | |
| Midstates Petroleum Co., Inc./Midstates Petroleum Co. LLC(b)(d) | |
| | 100,000 | | | | 10.000 | | | | 06/01/20 | | | | — | |
| | 951,000 | | | | 10.750 | | | | 10/01/20 | | | | 9,510 | |
| | 245,000 | | | | 9.250 | | | | 06/01/21 | | | | 2,450 | |
| Murray Energy Corp.(a)(b) | |
| | 575,000 | | | | 11.250 | | | | 04/15/21 | | | | 441,312 | |
| Newfield Exploration Co.(b) | |
| | 1,400,000 | | | | 5.375 | | | | 01/01/26 | | | | 1,435,000 | |
| PDC Energy, Inc.(b) | |
| | 1,500,000 | | | | 7.750 | | | | 10/15/22 | | | | 1,593,750 | |
| Peabody Energy Corp.(d) | |
| | 95,000 | | | | 6.250 | | | | 11/15/21 | | | | 42,038 | |
| Rice Energy, Inc.(b) | |
| | 150,000 | | | | 6.250 | | | | 05/01/22 | | | | 153,000 | |
| | 365,000 | | | | 7.250 | | | | 05/01/23 | | | | 386,900 | |
| | |
| | Corporate Obligations – (continued) | |
| | Energy – Exploration & Production – (continued) | |
| SandRidge Energy, Inc.(b)(d) | |
| $ | 885,000 | | | | 7.500 | % | | | 02/15/23 | | | $ | — | |
| Southwestern Energy Co.(b) | |
| | 480,000 | | | | 6.700 | | | | 01/23/25 | | | | 458,400 | |
| Tullow Oil PLC(a)(b) | |
| | 70,000 | | | | 6.000 | | | | 11/01/20 | | | | 64,777 | |
| | 140,000 | | | | 6.250 | | | | 04/15/22 | | | | 127,225 | |
| Whiting Petroleum Corp.(b) | |
| | 300,000 | | | | 6.500 | | | | 10/01/18 | | | | 295,500 | |
| | 1,300,000 | | | | 6.250 | | | | 04/01/23 | | | | 1,196,000 | |
| WPX Energy, Inc.(b) | |
| | 410,000 | | | | 6.000 | | | | 01/15/22 | | | | 407,950 | |
| | | | | | | | | | | | | | |
| | | | | | | | | | | | | 19,393,782 | |
| | |
| | Energy – Services(b) – 0.2% | |
| Basic Energy Services, Inc.(d) | |
| | 1,625,000 | | | | 7.750 | | | | 02/15/19 | | | | 747,500 | |
| Hiland Partners Holdings LLC/Hiland Partners Finance Corp.(a) | |
| | 1,434,000 | | | | 5.500 | | | | 05/15/22 | | | | 1,487,151 | |
| Transocean, Inc. | |
| | 750,000 | | | | 5.550 | | | | 10/15/22 | | | | 641,250 | |
| | | | | | | | | | | | | | |
| | | | | | | | | | | | | 2,875,901 | |
| | |
| | Entertainment & Leisure(b) – 0.7% | |
| AMC Entertainment, Inc. | |
| | 500,000 | | | | 5.875 | | | | 02/15/22 | | | | 519,375 | |
| Cedar Fair LP/Canada’s Wonderland Co./Magnum Management
Corp. |
|
| | 1,130,000 | | | | 5.375 | | | | 06/01/24 | | | | 1,192,150 | |
| Cinemark USA, Inc. | |
| | 1,211,000 | | | | 4.875 | | | | 06/01/23 | | | | 1,204,945 | |
| ClubCorp Club Operations, Inc.(a) | |
| | 750,000 | | | | 8.250 | | | | 12/15/23 | | | | 800,625 | |
| Guitar Center, Inc.(a) | |
| | 1,745,000 | | | | 6.500 | | | | 04/15/19 | | | | 1,563,956 | |
| | 2,229,000 | | | | 9.625 | | | | 04/15/20 | | | | 1,638,315 | |
| Regal Entertainment Group | |
| | 400,000 | | | | 5.750 | | | | 03/15/22 | | | | 416,000 | |
| Six Flags Entertainment Corp.(a) | |
| | 500,000 | | | | 4.875 | | | | 07/31/24 | | | | 500,625 | |
| WMG Acquisition Corp.(a) | |
| | 180,000 | | | | 5.000 | | | | 08/01/23 | | | | 182,700 | |
| | | | | | | | | | | | | | |
| | | | | | | | | | | | | 8,018,691 | |
| | |
| | Finance – 0.7% | |
| Ally Financial, Inc. | |
| | 2,415,000 | | | | 5.125 | | | | 09/30/24 | | | | 2,538,769 | |
| | 750,000 | | | | 5.750 | (b) | | | 11/20/25 | | | | 770,625 | |
| Harland Clarke Holdings Corp.(a)(b) | |
| | 1,965,000 | | | | 9.250 | | | | 03/01/21 | | | | 1,680,075 | |
| Icahn Enterprises LP/Icahn Enterprises Finance Corp.(b) | |
| | 360,000 | | | | 4.875 | | | | 03/15/19 | | | | 358,380 | |
| MGM Growth Properties Operating Partnership LP/MGP Finance
Co-Issuer, Inc.(a)(b) |
|
| | 290,000 | | | | 5.625 | | | | 05/01/24 | | | | 308,850 | |
| | |
| | |
| The accompanying notes are an integral part of these financial statements. | | 13 |
GOLDMAN SACHS MULTI-MANAGER ALTERNATIVES FUND
Consolidated Schedule of Investments (continued)
October 31, 2016
| | | | | | | | | | | | | | |
Principal Amount | | | Interest
Rate | | | Maturity
Date | | | Value | |
| | Corporate Obligations – (continued) | |
| | Finance – (continued) | |
| Navient Corp. | |
| $ | 785,000 | | | | 6.625 | % | | | 07/26/21 | | | $ | 792,976 | |
| | 600,000 | | | | 7.250 | | | | 09/25/23 | | | | 599,621 | |
| Walter Investment Management Corp. | |
| | 467,000 | | | | 4.500 | | | | 11/01/19 | | | | 326,900 | |
| | 450,000 | | | | 7.875 | (b) | | | 12/15/21 | | | | 351,000 | |
| | | | | | | | | | | | | | |
| | | | | | | | | | | | | 7,727,196 | |
| | |
| | Gaming(b) – 0.5% | |
| Chester Downs & Marina LLC(a) | |
| | 1,475,000 | | | | 9.250 | | | | 02/01/20 | | | | 1,438,125 | |
| Codere Finance 2 Luxembourg SA(a)(e) | |
| | 1,038,283 | | | | 9.000 | | | | 06/30/21 | | | | 1,062,942 | |
| Inn of the Mountain Gods Resort & Casino(a)(f) | |
| | 275,000 | | | | 9.250 | | | | 11/30/20 | | | | 250,250 | |
| Scientific Games International, Inc. | |
| | 1,595,000 | | | | 10.000 | | | | 12/01/22 | | | | 1,483,350 | |
| Seminole Hard Rock Entertainment, Inc./Seminole Hard Rock
International LLC(a) |
|
| | 1,231,000 | | | | 5.875 | | | | 05/15/21 | | | | 1,218,690 | |
| | | | | | | | | | | | | | |
| | | | | | | | | | | | | 5,453,357 | |
| | |
| | Health Care – Medical Products(b) – 0.4% | |
| Fresenius Medical Care US Finance II, Inc.(a) | |
| | 1,300,000 | | | | 4.750 | | | | 10/15/24 | | | | 1,355,250 | |
| Grifols Worldwide Operations Ltd. | |
| | 2,100,000 | | | | 5.250 | | | | 04/01/22 | | | | 2,194,500 | |
| Halyard Health, Inc. | |
| | 1,000,000 | | | | 6.250 | | | | 10/15/22 | | | | 1,025,000 | |
| Ortho-Clinical Diagnostics, Inc./Ortho-Clinical Diagnostics SA(a) | |
| | 580,000 | | | | 6.625 | | | | 05/15/22 | | | | 500,250 | |
| | | | | | | | | | | | | | |
| | | | | | | | | | | | | 5,075,000 | |
| | |
| | Health Care – Pharmaceuticals – 0.5% | |
| Mallinckrodt International Finance SA | |
| | 1,000,000 | | | | 4.750 | | | | 04/15/23 | | | | 862,500 | |
| Mallinckrodt International Finance SA/Mallinckrodt CB LLC(a)(b) | |
| | 500,000 | | | | 5.500 | | | | 04/15/25 | | | | 462,500 | |
| Quintiles IMS, Inc.(a)(b) | |
| | 1,600,000 | | | | 4.875 | | | | 05/15/23 | | | | 1,650,000 | |
| Valeant Pharmaceuticals International, Inc.(a)(b) | |
| | 3,490,000 | | | | 7.500 | | | | 07/15/21 | | | | 3,106,100 | |
| | 305,000 | | | | 6.125 | | | | 04/15/25 | | | | 240,950 | |
| | | | | | | | | | | | | | |
| | | | | | | | | | | | | 6,322,050 | |
| | |
| | Health Care – Services – 1.1% | |
| Acadia Healthcare Co., Inc.(b) | |
| | 980,000 | | | | 5.125 | | | | 07/01/22 | | | | 967,750 | |
| Amsurg Corp.(b) | |
| | 1,104,000 | | | | 5.625 | | | | 07/15/22 | | | | 1,128,840 | |
| BioScrip, Inc.(b) | |
| | 625,000 | | | | 8.875 | | | | 02/15/21 | | | | 578,125 | |
| Centene Corp.(b) | |
| | 1,590,000 | | | | 4.750 | | | | 01/15/25 | | | | 1,586,025 | |
| DaVita, Inc.(b) | |
| | 2,308,000 | | | | 5.000 | | | | 05/01/25 | | | | 2,238,760 | |
| | |
| | Corporate Obligations – (continued) | |
| | Health Care – Services – (continued) | |
| HCA, Inc. | |
| $ | 1,730,000 | | | | 5.875 | % | | | 05/01/23 | | | $ | 1,833,800 | |
| | 171,000 | | | | 5.375 | | | | 02/01/25 | | | | 174,847 | |
| | 190,000 | | | | 7.690 | | | | 06/15/25 | | | | 212,800 | |
| IASIS Healthcare LLC/IASIS Capital Corp.(b) | |
| | 200,000 | | | | 8.375 | | | | 05/15/19 | | | | 193,500 | |
| Kindred Healthcare, Inc. | |
| | 755,000 | | | | 8.000 | | | | 01/15/20 | | | | 762,550 | |
| | 1,760,000 | | | | 6.375 | (b) | | | 04/15/22 | | | | 1,636,800 | |
| Select Medical Corp.(b) | |
| | 1,225,000 | | | | 6.375 | | | | 06/01/21 | | | | 1,218,875 | |
| | | | | | | | | | | | | | |
| | | | | | | | | | | | | 12,532,672 | |
| | |
| | Health Care Products(a)(b) – 0.0% | |
| DJO Finco, Inc./DJO Finance LLC/DJO Finance Corp. | |
| | 60,000 | | | | 8.125 | | | | 06/15/21 | | | | 55,800 | |
| Greatbatch Ltd. | |
| | 480,000 | | | | 9.125 | | | | 11/01/23 | | | | 460,800 | |
| | | | | | | | | | | | | | |
| | | | | | | | | | | | | 516,600 | |
| | |
| | Home Construction(a)(b) – 0.0% | |
| Masonite International Corp. | |
| | 215,000 | | | | 5.625 | | | | 03/15/23 | | | | 223,600 | |
| | |
| | Internet(b) – 0.0% | |
| Zayo Group LLC/Zayo Capital, Inc. | |
| | 500,000 | | | | 6.375 | | | | 05/15/25 | | | | 525,625 | |
| | |
| | Lodging(b) – 0.1% | |
| Interval Acquisition Corp. | |
| | 1,000,000 | | | | 5.625 | | | | 04/15/23 | | | | 1,031,250 | |
| | |
| | Machinery(a) – 0.2% | |
| Boart Longyear Management Pty Ltd. | |
| | 1,400,000 | | | | 10.000 | | | | 10/01/18 | | | | 988,750 | |
| | 325,000 | | | | 7.000 | (b) | | | 04/01/21 | | | | 60,531 | |
| Xerium Technologies, Inc.(b) | |
| | 1,345,000 | | | | 9.500 | | | | 08/15/21 | | | | 1,361,813 | |
| | | | | | | | | | | | | | |
| | | | | | | | | | | | | 2,411,094 | |
| | |
| | Media – Broadcasting & Radio(b) – 1.0% | |
| Cumulus Media Holdings, Inc. | |
| | 2,410,000 | | | | 7.750 | | | | 05/01/19 | | | | 1,012,200 | |
| Gray Television, Inc.(a) | |
| | 350,000 | | | | 5.125 | | | | 10/15/24 | | | | 340,375 | |
| iHeartCommunications, Inc. | |
| | 1,575,000 | | | | 9.000 | | | | 12/15/19 | | | | 1,195,031 | |
| | 1,316,481 | | | | 14.000 | (e) | | | 02/01/21 | | | | 503,554 | |
| | 1,080,000 | | | | 9.000 | | | | 03/01/21 | | | | 774,900 | |
| LIN Television Corp. | |
| | 750,000 | | | | 5.875 | | | | 11/15/22 | | | | 784,688 | |
| Nexstar Broadcasting, Inc.(a) | |
| | 500,000 | | | | 6.125 | | | | 02/15/22 | | | | 515,000 | |
| Sinclair Television Group, Inc.(a) | |
| | 1,850,000 | | | | 5.625 | | | | 08/01/24 | | | | 1,877,750 | |
| | |
| | |
| 14 | | The accompanying notes are an integral part of these financial statements. |
GOLDMAN SACHS MULTI-MANAGER ALTERNATIVES FUND
| | | | | | | | | | | | | | |
Principal Amount | | | Interest
Rate | | | Maturity
Date | | | Value | |
| | Corporate Obligations – (continued) | |
| | Media – Broadcasting & Radio(b) – (continued) | |
| Sirius XM Radio, Inc.(a) | |
| $ | 1,000,000 | | | | 4.625 | % | | | 05/15/23 | | | $ | 1,005,000 | |
| | 1,000,000 | | | | 6.000 | | | | 07/15/24 | | | | 1,062,500 | |
| | 750,000 | | | | 5.375 | | | | 04/15/25 | | | | 762,188 | |
| Townsquare Media, Inc.(a) | |
| | 830,000 | | | | 6.500 | | | | 04/01/23 | | | | 831,037 | |
| Univision Communications, Inc.(a) | |
| | 1,500,000 | | | | 5.125 | | | | 02/15/25 | | | | 1,503,750 | |
| | | | | | | | | | | | | | |
| | | | | | | | | | | | | 12,167,973 | |
| | |
| | Media – Cable – 1.7% | |
| Altice US Finance I Corp.(a)(b) | |
| | 1,582,000 | | | | 5.375 | | | | 07/15/23 | | | | 1,621,550 | |
| Cable One, Inc.(a)(b) | |
| | 1,667,000 | | | | 5.750 | | | | 06/15/22 | | | | 1,760,769 | |
| CCO Holdings LLC/CCO Holdings Capital Corp.(b) | |
| | 1,130,000 | | | | 5.125 | | | | 02/15/23 | | | | 1,169,550 | |
| CSC Holdings LLC | |
| | 1,325,000 | | | | 6.750 | | | | 11/15/21 | | | | 1,394,563 | |
| | 1,925,000 | | | | 10.125 | (a)(b) | | | 01/15/23 | | | | 2,170,437 | |
| | 200,000 | | | | 5.250 | | | | 06/01/24 | | | | 187,000 | |
| | 375,000 | | | | 6.625 | (a)(b) | | | 10/15/25 | | | | 406,875 | |
| | 910,000 | | | | 10.875 | (a)(b) | | | 10/15/25 | | | | 1,046,500 | |
| DISH DBS Corp. | |
| | 1,570,000 | | | | 5.000 | | | | 03/15/23 | | | | 1,546,450 | |
| | 400,000 | | | | 5.875 | | | | 11/15/24 | | | | 404,000 | |
| Midcontinent Communications/Midcontinent Finance Corp.(a)(b) | |
| | 200,000 | | | | 6.250 | | | | 08/01/21 | | | | 209,000 | |
| SFR Group SA(a)(b) | |
| | 1,300,000 | | | | 6.000 | | | | 05/15/22 | | | | 1,329,250 | |
| | 700,000 | | | | 6.250 | | | | 05/15/24 | | | | 706,125 | |
| Time Warner Cable LLC | |
| | 625,000 | | | | 6.750 | | | | 06/15/39 | | | | 749,236 | |
| Videotron Ltd. | |
| | 500,000 | | | | 5.000 | | | | 07/15/22 | | | | 521,875 | |
| | 1,247,000 | | | | 5.375 | (a)(b) | | | 06/15/24 | | | | 1,303,115 | |
| Virgin Media Secured Finance PLC(a)(b) | |
| | 2,150,000 | | | | 5.250 | | | | 01/15/26 | | | | 2,131,187 | |
| Ziggo Secured Finance BV(a)(b) | |
| | 1,140,000 | | | | 5.500 | | | | 01/15/27 | | | | 1,131,450 | |
| | | | | | | | | | | | | | |
| | | | | | | | | | | | | 19,788,932 | |
| | |
| | Media – Non Cable(b) – 1.0% | |
| Lee Enterprises, Inc.(a) | |
| | 170,000 | | | | 9.500 | | | | 03/15/22 | | | | 174,675 | |
| Liberty Interactive LLC | |
| | 3,174,955 | | | | 4.000 | | | | 11/15/29 | | | | 1,964,503 | |
| | 1,163,894 | | | | 3.750 | | | | 02/15/30 | | | | 699,792 | |
| Outfront Media Capital LLC/Outfront Media Capital Corp. | |
| | 2,180,000 | | | | 5.875 | | | | 03/15/25 | | | | 2,267,200 | |
| Radio One, Inc.(a) | |
| | 1,615,000 | | | | 9.250 | | | | 02/15/20 | | | | 1,453,500 | |
| | 1,315,000 | | | | 7.375 | | | | 04/15/22 | | | | 1,318,287 | |
| TEGNA, Inc. | |
| | 500,000 | | | | 6.375 | | | | 10/15/23 | | | | 531,875 | |
| | |
| | Corporate Obligations – (continued) | |
| | Media – Non Cable(b) – (continued) | |
| The McClatchy Co. | |
| $ | 1,205,000 | | | | 9.000 | % | | | 12/15/22 | | | $ | 1,256,213 | |
| VeriSign, Inc. | |
| | 1,000,000 | | | | 4.625 | | | | 05/01/23 | | | | 1,025,000 | |
| | 1,500,000 | | | | 5.250 | | | | 04/01/25 | | | | 1,590,000 | |
| | | | | | | | | | | | | | |
| | | | | | | | | | | | | 12,281,045 | |
| | |
| | Metal Fabricate/Hardware(a)(b) – 0.1% | |
| Optimas OE Solutions Holding LLC/Optimas OE Solutions, Inc. | |
| | 895,000 | | | | 8.625 | | | | 06/01/21 | | | | 690,269 | |
| The Hillman Group, Inc. | |
| | 830,000 | | | | 6.375 | | | | 07/15/22 | | | | 773,975 | |
| | | | | | | | | | | | | | |
| | | | | | | | | | | | | 1,464,244 | |
| | |
| | Metals(a)(b) – 0.0% | |
| Constellium NV | |
| | 100,000 | | | | 5.750 | | | | 05/15/24 | | | | 90,250 | |
| | |
| | Metals & Mining – 0.6% | |
| Allegheny Technologies, Inc. | |
| | 465,000 | | | | 9.375 | | | | 06/01/19 | | | | 492,900 | |
| | 720,000 | | | | 7.875 | (b) | | | 08/15/23 | | | | 703,800 | |
| First Quantum Minerals Ltd.(a)(b) | |
| | 1,270,000 | | | | 6.750 | | | | 02/15/20 | | | | 1,220,787 | |
| | 809,000 | | | | 7.000 | | | | 02/15/21 | | | | 767,539 | |
| Freeport-McMoRan, Inc.(b) | |
| | 244,000 | | | | 3.875 | | | | 03/15/23 | | | | 220,820 | |
| | 380,000 | | | | 5.400 | | | | 11/14/34 | | | | 327,275 | |
| | 1,930,000 | | | | 5.450 | | | | 03/15/43 | | | | 1,582,600 | |
| Glencore Funding LLC(a) | |
| | 100,000 | | | | 2.875 | | | | 04/16/20 | | | | 100,500 | |
| Hecla Mining Co.(b) | |
| | 721,000 | | | | 6.875 | | | | 05/01/21 | | | | 739,025 | |
| New Gold, Inc.(a)(b) | |
| | 1,220,000 | | | | 6.250 | | | | 11/15/22 | | | | 1,238,300 | |
| | | | | | | | | | | | | | |
| | | | | | | | | | | | | 7,393,546 | |
| | |
| | Packaging(a) – 0.1% | |
| Ardagh Packaging Finance PLC/Ardagh Holdings USA, Inc.(b) | |
| | 550,000 | | | | 7.250 | | | | 05/15/24 | | | | 580,250 | |
| Owens-Brockway Glass Container, Inc. | |
| | 350,000 | | | | 5.875 | | | | 08/15/23 | | | | 371,875 | |
| | | | | | | | | | | | | | |
| | | | | | | | | | | | | 952,125 | |
| | |
| | Pipelines – 0.8% | |
| Energy Transfer Partners LP(b) | |
| | 440,000 | | | | 6.125 | | | | 12/15/45 | | | | 458,725 | |
| Genesis Energy LP/Genesis Energy Finance Corp.(b) | |
| | 888,000 | | | | 6.000 | | | | 05/15/23 | | | | 892,440 | |
| | 800,000 | | | | 5.625 | | | | 06/15/24 | | | | 792,000 | |
| MPLX LP(b) | |
| | 1,100,000 | | | | 4.875 | | | | 12/01/24 | | | | 1,150,437 | |
| ONEOK, Inc.(b) | |
| | 750,000 | | | | 7.500 | | | | 09/01/23 | | | | 859,688 | |
| | |
| | |
| The accompanying notes are an integral part of these financial statements. | | 15 |
GOLDMAN SACHS MULTI-MANAGER ALTERNATIVES FUND
Consolidated Schedule of Investments (continued)
October 31, 2016
| | | | | | | | | | | | | | |
Principal Amount | | | Interest
Rate | | | Maturity
Date | | | Value | |
| | Corporate Obligations – (continued) | |
| | Pipelines – (continued) | |
| Sabine Pass Liquefaction LLC(b) | |
| $ | 100,000 | | | | 5.625 | % | | | 02/01/21 | | | $ | 105,250 | |
| | 540,000 | | | | 5.625 | | | | 04/15/23 | | | | 573,750 | |
| | 740,000 | | | | 5.750 | | | | 05/15/24 | | | | 782,550 | |
| | 1,000,000 | | | | 5.625 | | | | 03/01/25 | | | | 1,057,500 | |
| SemGroup Corp.(b) | |
| | 95,000 | | | | 7.500 | | | | 06/15/21 | | | | 97,375 | |
| Summit Midstream Holdings LLC/Summit Midstream Finance
Corp.(b) |
|
| | 1,381,000 | | | | 5.500 | | | | 08/15/22 | | | | 1,339,570 | |
| Targa Resources Partners LP/Targa Resources Partners Finance
Corp.(b) |
|
| | 1,250,000 | | | | 5.250 | | | | 05/01/23 | | | | 1,243,750 | |
| Williams Partners LP | |
| | 255,000 | | | | 6.300 | | | | 04/15/40 | | | | 273,411 | |
| | 140,000 | | | | 5.400 | (b) | | | 03/04/44 | | | | 139,203 | |
| Williams Partners LP/ACMP Finance Corp.(b) | |
| | 100,000 | | | | 4.875 | | | | 03/15/24 | | | | 101,250 | |
| | | | | | | | | | | | | | |
| | | | | | | | | | | | | 9,866,899 | |
| | |
| | Property Insurance(a)(b) – 0.1% | |
| HUB International Ltd. | |
| | 700,000 | | | | 7.875 | | | | 10/01/21 | | | | 715,750 | |
| | |
| | Real Estate(b) – 0.2% | |
| Care Capital Properties LP(a) | |
| | 735,000 | | | | 5.125 | | | | 08/15/26 | | | | 728,838 | |
| Communications Sales & Leasing, Inc./CSL Capital LLC(a) | |
| | 350,000 | | | | 6.000 | | | | 04/15/23 | | | | 363,125 | |
| RHP Hotel Properties LP/RHP Finance Corp. | |
| | 675,000 | | | | 5.000 | | | | 04/15/23 | | | | 686,812 | |
| The GEO Group, Inc. | |
| | 361,000 | | | | 6.000 | | | | 04/15/26 | | | | 312,265 | |
| | | | | | | | | | | | | | |
| | | | | | | | | | | | | 2,091,040 | |
| | |
| | Retailers – 1.2% | |
| Claire’s Stores, Inc.(b) | |
| | 338,000 | | | | 8.875 | | | | 03/15/19 | | | | 60,840 | |
| Ferrellgas LP/Ferrellgas Finance Corp.(b) | |
| | 865,000 | | | | 6.750 | | | | 01/15/22 | | | | 808,775 | |
| GameStop Corp.(a)(b) | |
| | 1,400,000 | | | | 5.500 | | | | 10/01/19 | | | | 1,442,000 | |
| Hema Bondco I BV(a)(b) | |
| | 700,000 | | | | 5.250 | (c) | | | 06/15/19 | | | | 624,422 | |
| | 180,000 | | | | 6.250 | | | | 06/15/19 | | | | 166,266 | |
| JC Penney Corp., Inc.(a)(b) | |
| | 248,000 | | | | 5.875 | | | | 07/01/23 | | | | 255,440 | |
| L Brands, Inc. | |
| | 650,000 | | | | 6.875 | | | | 11/01/35 | | | | 689,000 | |
| | 515,000 | | | | 6.750 | | | | 07/01/36 | | | | 543,325 | |
| New Albertsons, Inc. | |
| | 460,000 | | | | 7.750 | | | | 06/15/26 | | | | 453,675 | |
| | 1,565,000 | | | | 7.450 | | | | 08/01/29 | | | | 1,512,181 | |
| | 515,000 | | | | 8.700 | | | | 05/01/30 | | | | 520,794 | |
| | 1,765,000 | | | | 8.000 | | | | 05/01/31 | | | | 1,709,844 | |
| | |
| | Corporate Obligations – (continued) | |
| | Retailers – (continued) | |
| Rite Aid Corp. | |
| $ | 430,000 | | | | 6.125 | %(a)(b) | | | 04/01/23 | | | $ | 453,650 | |
| | 340,000 | | | | 7.700 | | | | 02/15/27 | | | | 421,600 | |
| | 490,000 | | | | 6.875 | (a) | | | 12/15/28 | | | | 588,000 | |
| Supervalu, Inc.(b) | |
| | 855,000 | | | | 6.750 | | | | 06/01/21 | | | | 849,656 | |
| The Bon-Ton Department Stores, Inc.(b) | |
| | 1,980,000 | | | | 8.000 | | | | 06/15/21 | | | | 1,009,800 | |
| TRU Taj LLC/TRU Taj Finance, Inc.(a)(b) | |
| | 919,000 | | | | 12.000 | | | | 08/15/21 | | | | 939,678 | |
| Yum! Brands, Inc. | |
| | 950,000 | | | | 6.875 | | | | 11/15/37 | | | | 969,000 | |
| | | | | | | | | | | | | | |
| | | | | | | | | | | | | 14,017,946 | |
| | |
| | Technology – Hardware – 0.7% | |
| Advanced Micro Devices, Inc. | |
| | 430,000 | | | | 2.125 | | | | 09/01/26 | | | | 484,556 | |
| CDW LLC/CDW Finance Corp.(b) | |
| | 500,000 | | | | 5.000 | | | | 09/01/23 | | | | 515,000 | |
| Diamond 1 Finance Corp./Diamond 2 Finance Corp.(a)(b) | |
| | 545,000 | | | | 7.125 | | | | 06/15/24 | | | | 595,413 | |
| | 166,000 | | | | 6.020 | | | | 06/15/26 | | | | 180,949 | |
| | 1,430,000 | | | | 8.100 | | | | 07/15/36 | | | | 1,707,077 | |
| | 1,130,000 | | | | 8.350 | | | | 07/15/46 | | | | 1,369,211 | |
| Micron Technology, Inc.(a)(b) | |
| | 1,055,000 | | | | 5.250 | | | | 08/01/23 | | | | 1,033,900 | |
| Plantronics, Inc.(a)(b) | |
| | 1,040,000 | | | | 5.500 | | | | 05/31/23 | | | | 1,060,800 | |
| Sensata Technologies BV(a) | |
| | 1,250,000 | | | | 5.000 | | | | 10/01/25 | | | | 1,287,500 | |
| | | | | | | | | | | | | | |
| | | | | | | | | | | | | 8,234,406 | |
| | |
| | Technology – Software/Services(b) – 1.0% | |
| BMC Software Finance, Inc.(a) | |
| | 1,030,000 | | | | 8.125 | | | | 07/15/21 | | | | 942,450 | |
| Boxer Parent Co., Inc.(a)(e) | |
| | 1,535,000 | | | | 9.000 | | | | 10/15/19 | | | | 1,427,550 | |
| Cengage Learning, Inc.(a) | |
| | 1,070,000 | | | | 9.500 | | | | 06/15/24 | | | | 1,000,450 | |
| Equinix, Inc. | |
| | 1,700,000 | | | | 5.750 | | | | 01/01/25 | | | | 1,802,000 | |
| Global A&T Electronics Ltd.(a) | |
| | 2,410,000 | | | | 10.000 | | | | 02/01/19 | | | | 1,903,900 | |
| Inception Merger Sub, Inc./Rackspace Hosting, Inc.(a) | |
| | 935,000 | | | | 8.625 | | | | 11/15/24 | | | | 935,000 | |
| MSCI, Inc.(a) | |
| | 1,601,750 | | | | 5.250 | | | | 11/15/24 | | | | 1,681,837 | |
| Open Text Corp.(a) | |
| | 605,000 | | | | 5.875 | | | | 06/01/26 | | | | 644,325 | |
| Syniverse Holdings, Inc. | |
| | 310,000 | | | | 9.125 | | | | 01/15/19 | | | | 250,325 | |
| Western Digital Corp.(a) | |
| | 114,000 | | | | 7.375 | | | | 04/01/23 | | | | 124,688 | |
| | 880,000 | | | | 10.500 | | | | 04/01/24 | | | | 1,017,500 | |
| | | | | | | | | | | | | | |
| | | | | | | | | | | | | 11,730,025 | |
| | |
| | |
| 16 | | The accompanying notes are an integral part of these financial statements. |
GOLDMAN SACHS MULTI-MANAGER ALTERNATIVES FUND
| | | | | | | | | | | | | | |
Principal Amount | | | Interest
Rate | | | Maturity
Date | | | Value | |
| | Corporate Obligations – (continued) | |
| | Telecommunications – Cellular(b) – 0.3% | |
| Altice Finco SA(a) | |
| $ | 680,000 | | | | 8.125 | % | | | 01/15/24 | | | $ | 697,000 | |
| | 180,000 | | | | 7.625 | | | | 02/15/25 | | | | 180,675 | |
| SoftBank Group Corp. | |
| | 1,600,000 | | | | 6.000 | | | | 07/30/25 | | | | 1,722,000 | |
| T-Mobile USA, Inc. | |
| | 720,000 | | | | 6.000 | | | | 04/15/24 | | | | 764,100 | |
| | 150,000 | | | | 6.375 | | | | 03/01/25 | | | | 160,875 | |
| | | | | | | | | | | | | | |
| | | | | | | | | | | | | 3,524,650 | |
| | |
| | Telecommunications – Satellites(b) – 0.2% | |
| Intelsat Jackson Holdings SA | |
| | 775,000 | | | | 7.250 | | | | 10/15/20 | | | | 587,062 | |
| | 120,000 | | | | 7.500 | | | | 04/01/21 | | | | 89,400 | |
| | 380,000 | | | | 8.000 | (a) | | | 02/15/24 | | | | 384,750 | |
| Intelsat Luxembourg SA | |
| | 1,810,000 | | | | 7.750 | | | | 06/01/21 | | | | 597,300 | |
| Unitymedia Hessen GmbH & Co. KG/Unitymedia NRW GmbH(a) | |
| | 500,000 | | | | 5.000 | | | | 01/15/25 | | | | 509,375 | |
| | | | | | | | | | | | | | |
| | | | | | | | | | | | | 2,167,887 | |
| | |
| | Textile & Apparel(a) – 0.1% | |
| Nine West Holdings, Inc. | |
| | 3,420,000 | | | | 8.250 | | | | 03/15/19 | | | | 547,200 | |
| | |
| | Transportation – 0.3% | |
| Air Medical Group Holdings, Inc.(a)(b) | |
| | 470,000 | | | | 6.375 | | | | 05/15/23 | | | | 453,550 | |
| Algeco Scotsman Global Finance PLC(a)(b) | |
| | 1,390,000 | | | | 8.500 | | | | 10/15/18 | | | | 1,261,425 | |
| | 110,000 | | | | 9.000 | | | | 10/15/18 | | | | 109,607 | |
| Navistar International Corp. | |
| | 210,000 | | | | 4.500 | | | | 10/15/18 | | | | 198,056 | |
| | 320,500 | | | | 4.750 | | | | 04/15/19 | | | | 296,062 | |
| | 1,200,000 | | | | 8.250 | (b) | | | 11/01/21 | | | | 1,173,000 | |
| | | | | | | | | | | | | | |
| | | | | | | | | | | | | 3,491,700 | |
| | |
| | Utilities – Electric – 0.3% | |
| Dynegy, Inc.(b) | |
| | 620,000 | | | | 7.625 | | | | 11/01/24 | | | | 595,200 | |
| GenOn Americas Generation LLC | |
| | 1,155,000 | | | | 8.500 | | | | 10/01/21 | | | | 999,075 | |
| | 495,000 | | | | 9.125 | | | | 05/01/31 | | | | 418,275 | |
| Illinois Power Generating Co. | |
| | 500,000 | | | | 6.300 | | | | 04/01/20 | | | | 196,250 | |
| NRG Energy, Inc.(b) | |
| | 570,000 | | | | 6.250 | | | | 05/01/24 | | | | 551,475 | |
| Talen Energy Supply LLC(a)(b) | |
| | 600,000 | | | | 4.625 | | | | 07/15/19 | | | | 571,500 | |
| Texas Competitive Electric Holdings Co. LLC/TCEH Finance,
Inc.(a)(b)(d) |
|
| | 3,500,000 | | | | 11.500 | | | | 10/01/20 | | | | — | |
| | | | | | | | | | | | | | |
| | | | | | | | | | | | | 3,331,775 | |
| | |
| | Wireless Telecommunications – 1.3% | |
| Aegis Merger Sub, Inc.(a)(b) | |
| | 1,290,000 | | | | 10.250 | | | | 02/15/23 | | | | 1,393,200 | |
| | |
| | Corporate Obligations – (continued) | |
| | Wireless Telecommunications – (continued) | |
| Altice Financing SA(a)(b) | |
| $ | 600,000 | | | | 6.500 | % | | | 01/15/22 | | | $ | 627,000 | |
| | 700,000 | | | | 7.500 | | | | 05/15/26 | | | | 721,000 | |
| Altice Luxembourg SA(a)(b) | |
| | 675,000 | | | | 7.750 | | | | 05/15/22 | | | | 707,063 | |
| | 300,000 | | | | 7.625 | | | | 02/15/25 | | | | 311,625 | |
| Digicel Group Ltd.(a)(b) | |
| | 500,000 | | | | 8.250 | | | | 09/30/20 | | | | 441,500 | |
| Digicel Ltd.(a)(b) | |
| | 1,565,000 | | | | 6.000 | | | | 04/15/21 | | | | 1,396,293 | |
| | 770,000 | | | | 6.750 | | | | 03/01/23 | | | | 687,225 | |
| DigitalGlobe, Inc.(a)(b) | |
| | 1,900,000 | | | | 5.250 | | | | 02/01/21 | | | | 1,909,500 | |
| Hughes Satellite Systems Corp. | |
| | 1,065,000 | | | | 7.625 | | | | 06/15/21 | | | | 1,166,175 | |
| | 65,000 | | | | 5.250 | (a) | | | 08/01/26 | | | | 64,025 | |
| Inmarsat Finance PLC(a)(b) | |
| | 2,157,000 | | | | 4.875 | | | | 05/15/22 | | | | 2,051,846 | |
| Sprint Corp. | |
| | 2,110,000 | | | | 7.875 | | | | 09/15/23 | | | | 2,088,900 | |
| | 605,000 | | | | 7.125 | | | | 06/15/24 | | | | 570,213 | |
| | 1,125,000 | | | | 7.625 | (b) | | | 02/15/25 | | | | 1,094,062 | |
| Wind Acquisition Finance SA(a)(b) | |
| | 244,000 | | | | 4.750 | | | | 07/15/20 | | | | 246,135 | |
| | | | | | | | | | | | | | |
| | | | | | | | | | | | | 15,475,762 | |
| | |
| | Wirelines Telecommunications – 0.3% | |
| Anixter, Inc. | |
| | 1,142,000 | | | | 5.125 | | | | 10/01/21 | | | | 1,194,817 | |
| CommScope Technologies Finance LLC(a)(b) | |
| | 600,000 | | | | 6.000 | | | | 06/15/25 | | | | 630,000 | |
| Frontier Communications Corp. | |
| | 355,000 | | | | 8.875 | (b) | | | 09/15/20 | | | | 377,188 | |
| | 255,000 | | | | 7.125 | | | | 01/15/23 | | | | 229,819 | |
| | 805,000 | | | | 11.000 | (b) | | | 09/15/25 | | | | 823,112 | |
| | | | | | | | | | | | | | |
| | | | | | | | | | | | | 3,254,936 | |
| | |
| | TOTAL CORPORATE OBLIGATIONS | |
| | (Cost $252,354,264) | | | $ | 249,283,452 | |
| | |
| | | | | | | | |
Shares | | | Description | | Value | |
| | Common Stocks – 15.2% | |
| | Aerospace & Defense – 0.9% | | | | |
| | 14,798 | | | Airbus Group SE | | $ | 878,703 | |
| | 72,663 | | | Alcoa, Inc. | | | 2,086,881 | |
| | 21,785 | | | BWX Technologies, Inc. | | | 854,408 | |
| | 14,950 | | | Esterline Technologies Corp.* | | | 1,098,078 | |
| | 202,600 | | | Meggitt PLC | | | 1,077,823 | |
| | 27,459 | | | Orbital ATK, Inc.(g) | | | 2,041,851 | |
| | 23,960 | | | United Technologies Corp. | | | 2,448,712 | |
| | | | | | | | |
| | | | | | | 10,486,456 | |
| | |
| | |
| The accompanying notes are an integral part of these financial statements. | | 17 |
GOLDMAN SACHS MULTI-MANAGER ALTERNATIVES FUND
Consolidated Schedule of Investments (continued)
October 31, 2016
| | | | | | | | |
Shares | | | Description | | Value | |
| | Common Stocks – (continued) | |
| | Air Freight & Logistics(g) – 0.2% | | | | |
| | 12,068 | | | FedEx Corp. | | $ | 2,103,694 | |
| | |
| | Automobiles – 0.0% | | | | |
| | 8,577 | | | Fiat Chrysler Automobiles NV | | | 62,784 | |
| | 566 | | | General Motors Co. | | | 17,885 | |
| | | | | | | | |
| | | | | | | 80,669 | |
| | |
| | Banks – 1.1% | | | | |
| | 283,251 | | | Bank of America Corp.(g) | | | 4,673,642 | |
| | 27,984 | | | Bank of the Ozarks, Inc.(g) | | | 1,034,289 | |
| | 57,280 | | | CIT Group, Inc.(g) | | | 2,080,982 | |
| | 62,681 | | | Citigroup, Inc. | | | 3,080,771 | |
| | 71,099 | | | Citizens Financial Group, Inc. | | | 1,872,748 | |
| | 14,954 | | | Western Alliance Bancorp* | | | 558,681 | |
| | | | | | | | |
| | | | | | | 13,301,113 | |
| | |
| | Beverages(g) – 0.2% | | | | |
| | 15,741 | | | Constellation Brands, Inc. Class A | | | 2,630,636 | |
| | |
| | Biotechnology – 0.2% | | | | |
| | 13,750 | | | Shire PLC ADR | | | 2,318,800 | |
| | |
| | Capital Markets – 0.9% | | | | |
| | 15,548 | | | Affiliated Managers Group, Inc.*(g) | | | 2,062,598 | |
| | 78,615 | | | Apollo Global Management LLC Class A | | | 1,437,082 | |
| | 7,988 | | | Intercontinental Exchange, Inc. | | | 2,159,875 | |
| | 17,510 | | | Legg Mason, Inc. | | | 502,887 | |
| | 19,880 | | | LPL Financial Holdings, Inc. | | | 615,485 | |
| | 210,626 | | | NorthStar Asset Management Group, Inc. | | | 2,885,576 | |
| | 37,137 | | | OM Asset Management PLC | | | 522,518 | |
| | 5,887 | | | State Street Corp. | | | 413,326 | |
| | | | | | | | |
| | | | | | | 10,599,347 | |
| | |
| | Chemicals – 0.4% | | | | |
| | 62,500 | | | Axalta Coating Systems Ltd.*(g) | | | 1,570,000 | |
| | 368 | | | LyondellBasell Industries NV Class A | | | 29,275 | |
| | 40,098 | | | Olin Corp.(g) | | | 879,349 | |
| | 8,984 | | | The Sherwin-Williams Co.(g) | | | 2,199,822 | |
| | 12,768 | | | Valvoline, Inc.* | | | 260,467 | |
| | | | | | | | |
| | | | | | | 4,938,913 | |
| | |
| | Commercial Services & Supplies(g) – 0.1% | | | | |
| | 28,244 | | | KAR Auction Services, Inc. | | | 1,202,629 | |
| | |
| | Communications Equipment – 0.3% | | | | |
| | 61,720 | | | Cisco Systems, Inc.(g) | | | 1,893,569 | |
| | 30,659 | | | CommScope Holding Co., Inc.* | | | 936,632 | |
| | 22,817 | | | Juniper Networks, Inc. | | | 601,000 | |
| | 25,360 | | | Radware Ltd.* | | | 342,614 | |
| | | | | | | | |
| | | | | | | 3,773,815 | |
| | |
| | Construction & Engineering* – 0.1% | | | | |
| | 58,785 | | | AECOM | | | 1,637,162 | |
| | |
| | Common Stocks – (continued) | |
| | Consumer Finance – 0.5% | | | | |
| | 136,321 | | | Ally Financial, Inc.(g) | | $ | 2,463,320 | |
| | 21,930 | | | American Express Co. | | | 1,456,591 | |
| | 1,970 | | | Capital One Financial Corp. | | | 145,859 | |
| | 7,516 | | | Discover Financial Services | | | 423,376 | |
| | 2,140 | | | Encore Capital Group, Inc.* | | | 42,479 | |
| | 33,696 | | | Synchrony Financial | | | 963,369 | |
| | | | | | | | |
| | | | | | | 5,494,994 | |
| | |
| | Containers & Packaging – 0.1% | | | | |
| | 61,719 | | | Orora Ltd. | | | 136,002 | |
| | 42,530 | | | Owens-Illinois, Inc.*(g) | | | 820,829 | |
| | | | | | | | |
| | | | | | | 956,831 | |
| | |
| | Diversified Financial Services – 0.5% | | | | |
| | 4,926 | | | Berkshire Hathaway, Inc. Class B* | | | 710,822 | |
| | 89,046 | | | ECN Capital Corp.* | | | 194,516 | |
| | 90,976 | | | Element Fleet Management Corp. | | | 886,495 | |
| | 13,600 | | | Groupe Bruxelles Lambert SA | | | 1,169,150 | |
| | 85,110 | | | Leucadia National Corp. | | | 1,589,004 | |
| | 53,521 | | | Voya Financial, Inc.(g) | | | 1,635,067 | |
| | | | | | | | |
| | | | | | | 6,185,054 | |
| | |
| | Diversified Telecommunication Services(a) – 0.1% | | | | |
| | 41,509 | | | Cellnex Telecom SAU | | | 680,706 | |
| | 9,911 | | | Sunrise Communications Group AG | | | 677,172 | |
| | | | | | | | |
| | | | | | | 1,357,878 | |
| | |
| | Electric Utilities* – 0.3% | | | | |
| | 198,402 | | | TCEH Corp. | | | 3,015,710 | |
| | |
| | Electronic Equipment, Instruments & Components – 0.3% | |
| | 34,936 | | | CDW Corp. | | | 1,568,976 | |
| | 24,970 | | | TE Connectivity Ltd. | | | 1,569,864 | |
| | | | | | | | |
| | | | | | | 3,138,840 | |
| | |
| | Energy Equipment & Services – 0.1% | | | | |
| | 13,880 | | | Halliburton Co. | | | 638,480 | |
| | 325 | | | Seventy Seven Energy, Inc.* | | | 7,800 | |
| | 52,022 | | | Te Holdcorp LLC/Te Holdcorp | | | 559,233 | |
| | | | | | | | |
| | | | | | | 1,205,513 | |
| | |
| | Equity Real Estate Investment Trusts (REITs) – 0.3% | | | | |
| | 40,779 | | | Equity Commonwealth* | | | 1,231,934 | |
| | 31,743 | | | NorthStar Realty Finance Corp. | | | 460,908 | |
| | 26,267 | | | Ryman Hospitality Properties, Inc.(g) | | | 1,324,382 | |
| | 15,356 | | | Xenia Hotels & Resorts, Inc. | | | 239,707 | |
| | | | | | | | |
| | | | | | | 3,256,931 | |
| | |
| | Food & Staples Retailing – 0.1% | | | | |
| | 4,738 | | | CVS Health Corp. | | | 398,466 | |
| | 38,910 | | | Lenta Ltd.*(a) | | | 281,842 | |
| | 8,259 | | | Walgreens Boots Alliance, Inc. | | | 683,267 | |
| | | | | | | | |
| | | | | | | 1,363,575 | |
| | |
| | Food Products – 0.1% | | | | |
| | 22,154 | | | Nestle SA | | | 1,606,472 | |
| | |
| | |
| 18 | | The accompanying notes are an integral part of these financial statements. |
GOLDMAN SACHS MULTI-MANAGER ALTERNATIVES FUND
| | | | | | | | |
Shares | | | Description | | Value | |
| | Common Stocks – (continued) | |
| | Health Care Equipment & Supplies(g) – 0.1% | | | | |
| | 6,296 | | | Becton Dickinson & Co. | | $ | 1,057,161 | |
| | |
| | Health Care Providers & Services – 0.8% | | | | |
| | 9,678 | | | Acadia Healthcare Co., Inc.* | | | 348,021 | |
| | 19,482 | | | Aetna, Inc.(h) | | | 2,091,393 | |
| | 110,479 | | | Brookdale Senior Living, Inc.* | | | 1,594,212 | |
| | 32,746 | | | HCA Holdings, Inc.*(g)(h) | | | 2,506,051 | |
| | 2,287 | | | Humana, Inc. | | | 392,289 | |
| | 5,645 | | | McKesson Corp.(h) | | | 717,875 | |
| | 5,365 | | | Millennium Health LLC | | | 9,389 | |
| | 16,971 | | | Universal Health Services, Inc. Class B(g)(h) | | | 2,048,569 | |
| | | | | | | | |
| | | | | | | 9,707,799 | |
| | |
| | Hotels, Restaurants & Leisure – 0.5% | | | | |
| | 104,704 | | | Aramark(g)(h) | | | 3,898,130 | |
| | 2,613 | | | Marriott International, Inc. Class A | | | 179,513 | |
| | 13,145 | | | McDonald’s Corp.(g) | | | 1,479,733 | |
| | 12,153 | | | Six Flags Entertainment Corp. | | | 676,314 | |
| | | | | | | | |
| | | | | | | 6,233,690 | |
| | |
| | Independent Power and Renewable Electricity Producers* – 0.1% | |
| | 88,362 | | | Calpine Corp. | | | 1,051,508 | |
| | |
| | Industrial Conglomerates – 0.1% | | | | |
| | 35,370 | | | General Electric Co.(g) | | | 1,029,267 | |
| | 12,790 | | | Jardine Strategic Holdings Ltd. | | | 448,767 | |
| | | | | | | | |
| | | | | | | 1,478,034 | |
| | |
| | Insurance – 1.0% | |
| | 732 | | | Alleghany Corp.* | | | 377,866 | |
| | 78,300 | | | American International Group, Inc.(h) | | | 4,831,110 | |
| | 7,432 | | | AmTrust Financial Services, Inc. | | | 196,131 | |
| | 43,810 | | | Aon PLC(g) | | | 4,855,462 | |
| | 2,919 | | | Endurance Specialty Holdings Ltd. | | | 268,402 | |
| | 1,606 | | | Loews Corp. | | | 69,106 | |
| | 4,092 | | | MetLife, Inc. | | | 192,160 | |
| | 6,924 | | | Willis Towers Watson PLC | | | 871,732 | |
| | | | | | | | |
| | | | | | | 11,661,969 | |
| | |
| | Internet & Direct Marketing Retail* – 0.2% | |
| | 51,014 | | | Liberty Interactive Corp. QVC Group Class A(g) | | | 943,249 | |
| | 6,481 | | | Liberty Ventures Series A | | | 258,592 | |
| | 533 | | | The Priceline Group, Inc. | | | 785,764 | |
| | | | | | | | |
| | | | | | | 1,987,605 | |
| | |
| | Internet Software & Services – 0.5% | |
| | 3,452 | | | Alphabet, Inc. Class A*(h) | | | 2,795,775 | |
| | 1,054 | | | Alphabet, Inc. Class C* | | | 826,905 | |
| | 3,410 | | | Baidu, Inc. ADR* | | | 603,093 | |
| | 647 | | | CommerceHub, Inc. Class A* | | | 9,718 | |
| | 1,295 | | | CommerceHub, Inc. Class C* | | | 19,490 | |
| | 35,133 | | | IAC/InterActiveCorp.(g) | | | 2,263,970 | |
| | | | | | | | |
| | | | | | | 6,518,951 | |
| | |
| | Common Stocks – (continued) | |
| | IT Services – 0.1% | |
| | 17,109 | | | Cognizant Technology Solutions Corp. Class A* | | $ | 878,547 | |
| | 18,248 | | | CSRA, Inc. | | | 457,842 | |
| | | | | | | | |
| | | | | | | 1,336,389 | |
| | |
| | Life Sciences Tools & Services – 0.4% | |
| | 38,442 | | | Quintiles IMS Holdings, Inc.*(g) | | | 2,757,829 | |
| | 5,750 | | | Thermo Fisher Scientific, Inc. | | | 845,423 | |
| | 35,302 | | | VWR Corp.* | | | 971,158 | |
| | | | | | | | |
| | | | | | | 4,574,410 | |
| | |
| | Machinery – 0.1% | |
| | 1,669 | | | Fortive Corp. | | | 85,203 | |
| | 2,988 | | | Joy Global, Inc. | | | 82,080 | |
| | 12,948 | | | Pentair PLC | | | 713,823 | |
| | | | | | | | |
| | | | | | | 881,106 | |
| | |
| | Media – 2.0% | |
| | 5,025 | | | Charter Communications, Inc. Class A* | | | 1,255,697 | |
| | 26,118 | | | Discovery Communications, Inc. Class A*(g) | | | 681,941 | |
| | 30,473 | | | DISH Network Corp. Class A*(g) | | | 1,784,499 | |
| | 35,501 | | | JCDecaux SA | | | 1,085,693 | |
| | 25,735 | | | Liberty Global PLC Class A* | | | 838,961 | |
| | 51,986 | | | Liberty Global PLC LiLAC Class A* | | | 1,436,893 | |
| | 7,833 | | | Liberty Global PLC LiLAC Class C* | | | 216,504 | |
| | 53,976 | | | Liberty Global PLC Series C* | | | 1,716,437 | |
| | 31,761 | | | Liberty Media Corp.-Liberty Media Class A* | | | 883,909 | |
| | 54,673 | | | Liberty Media Corp.-Liberty SiriusXM Class A* | | | 1,818,971 | |
| | 15,598 | | | Naspers Ltd. | | | 2,612,357 | |
| | 75,412 | | | News Corp. Class A | | | 913,993 | |
| | 997 | | | Quebecor, Inc. Class B | | | 27,978 | |
| | 46,955 | | | Regal Entertainment Group Class A | | | 1,010,002 | |
| | 36,572 | | | Sinclair Broadcast Group, Inc. Class A | | | 917,957 | |
| | 6,037 | | | The Madison Square Garden Co. Class A* | | | 999,063 | |
| | 30,141 | | | Time Warner, Inc.(g) | | | 2,682,248 | |
| | 64,111 | | | Twenty-First Century Fox, Inc. Class A | | | 1,684,196 | |
| | 49,570 | | | WPP PLC | | | 1,076,316 | |
| | | | | | | | |
| | | | | | | 23,643,615 | |
| | |
| | Metals & Mining – 0.1% | |
| | 56,328 | | | Ferroglobe PLC | | | 521,034 | |
| | 20,890 | | | MMC Norilsk Nickel PJSC ADR | | | 316,170 | |
| | | | | | | | |
| | | | | | | 837,204 | |
| | |
| | Mortgage Real Estate Investment Trusts (REITs) – 0.0% | |
| | 7,697 | | | Colony Capital, Inc. Class A | | | 146,320 | |
| | |
| | Oil, Gas & Consumable Fuels – 0.2% | |
| | 7,382 | | | CONSOL Energy, Inc. | | | 125,125 | |
| | 118 | | | Energy & Exploration Partners, Inc.* | | | 41,300 | |
| | |
| | |
| The accompanying notes are an integral part of these financial statements. | | 19 |
GOLDMAN SACHS MULTI-MANAGER ALTERNATIVES FUND
Consolidated Schedule of Investments (continued)
October 31, 2016
| | | | | | | | |
Shares | | | Description | | Value | |
| | Common Stocks – (continued) | |
| | Oil, Gas & Consumable Fuels – (continued) | |
| | 60,550 | | | Gazprom PJSC ADR | | $ | 262,181 | |
| | 6,940 | | | LUKOIL PJSC ADR | | | 337,578 | |
| | 3,850 | | | Midstates Petroleum Co., Inc.* | | | 72,265 | |
| | 2,960 | | | Occidental Petroleum Corp. | | | 215,814 | |
| | 930 | | | Phillips 66 | | | 75,470 | |
| | 27,250 | | | Rosneft PJSC GDR | | | 148,512 | |
| | 2,009 | | | SandRidge Energy, Inc.* | | | 46,267 | |
| | 187,630 | | | Surgutneftegas OJSC | | | 85,075 | |
| | 23,744 | | | TransCanada, Corp. | | | 1,075,128 | |
| | | | | | | | |
| | | | | | | 2,484,715 | |
| | |
| | Paper & Forest Products* – 0.0% | |
| | 4,546 | | | Clearwater Paper Corp. | | | 241,393 | |
| | |
| | Personal Products – 0.0% | |
| | 8,380 | | | Unilever NV | | | 350,502 | |
| | |
| | Pharmaceuticals – 0.5% | |
| | 24,164 | | | Allergan PLC*(h) | | | 5,048,826 | |
| | 7,635 | | | Bristol-Myers Squibb Co.(g) | | | 388,698 | |
| | | | | | | | |
| | | | | | | 5,437,524 | |
| | |
| | Real Estate Management & Development – 0.0% | |
| | 29,313 | | | Countrywide PLC | | | 64,322 | |
| | |
| | Semiconductors & Semiconductor Equipment – 0.2% | | | | |
| | 17,810 | | | Analog Devices, Inc. | | | 1,141,621 | |
| | 8,401 | | | Mellanox Technologies Ltd.* | | | 364,604 | |
| | 1,646 | | | MModal, Inc. | | | 26,328 | |
| | 8,660 | | | QUALCOMM, Inc. | | | 595,115 | |
| | 3,491 | | | Synaptics, Inc.* | | | 181,951 | |
| | | | | | | | |
| | | | | | | 2,309,619 | |
| | |
| | Software – 0.8% | | | | |
| | 536 | | | CommVault Systems, Inc.* | | | 28,676 | |
| | 30,190 | | | Microsoft Corp.(g) | | | 1,808,985 | |
| | 111,630 | | | Oracle Corp.(g) | | | 4,288,824 | |
| | 33,378 | | | PTC, Inc.*(g) | | | 1,583,452 | |
| | 26,321 | | | Verint System, Inc.*(g) | | | 947,556 | |
| | 16,233 | | | VMware, Inc. Class A*(g) | | | 1,275,914 | |
| | | | | | | | |
| | | | | | | 9,933,407 | |
| | |
| | Technology Hardware, Storage & Peripherals – 0.3% | | | | |
| | 3,216 | | | Diebold, Inc. | | | 70,109 | |
| | 62,306 | | | NetApp, Inc.(g) | | | 2,114,666 | |
| | 33,637 | | | Western Digital Corp.(g) | | | 1,965,746 | |
| | | | | | | | |
| | | | | | | 4,150,521 | |
| | |
| | Trading Companies & Distributors* – 0.2% | | | | |
| | 2,091 | | | AerCap Holdings NV | | | 85,961 | |
| | 64,473 | | | HD Supply Holdings, Inc.(g) | | | 2,127,609 | |
| | | | | | | | |
| | | | | | | 2,213,570 | |
| | |
| | Transportation Infrastructure – 0.2% | | | | |
| | 22,848 | | | Macquarie Infrastructure Corp. | | | 1,869,195 | |
| | |
| | Common Stocks – (continued) | |
| | Wireless Telecommunication Services – 0.0% | | | | |
| | 108,409 | | | VimpelCom Ltd. ADR | | $ | 362,086 | |
| | |
| | TOTAL COMMON STOCKS | |
| | (Cost $163,866,869) | | $ | 181,187,647 | |
| | |
| | | | | | | | | | | | | | |
Principal
Amount | | | Interest
Rate | | | Maturity
Date | | | Value | |
| | Bank Loans(i) – 5.0% | |
| | Automotive – Parts – 0.1% | |
| Evergreen Skills Lux S.a.r.l. | |
| $ | 1,233,268 | | | | 5.837 | % | | | 04/28/21 | | | $ | 1,096,585 | |
| Gates Global LLC | |
| | 97,217 | | | | 4.250 | | | | 07/06/21 | | | | 95,768 | |
| | | | | | | | | | | | | | |
| | | | | | | | | | | | | 1,192,353 | |
| | |
| | Building Materials – 0.3% | |
| Engility Corp. | |
| | 395,294 | | | | 5.750 | | | | 08/12/23 | | | | 399,907 | |
| Headwaters, Inc. | |
| | 148,125 | | | | 4.000 | | | | 03/24/22 | | | | 148,820 | |
| Jeld-Wen, Inc. | |
| | 1,762,274 | | | | 5.250 | | | | 10/15/21 | | | | 1,774,398 | |
| MX Holdings US, Inc. | |
| | 195,050 | | | | 4.000 | | | | 08/14/20 | | | | 195,904 | |
| Preferred Proppants LLC | |
| | 833,270 | | | | 8.750 | | | | 07/27/20 | | | | 666,616 | |
| Wilsonart LLC | |
| | 693,251 | | | | 4.000 | | | | 10/31/19 | | | | 693,036 | |
| | | | | | | | | | | | | | |
| | | | | | | | | | | | | 3,878,681 | |
| | |
| | Chemicals – 0.0% | |
| SK Spice S.a.r.l. | |
| EUR | 167,886 | | | | 6.750 | | | | 06/12/21 | | | | 185,218 | |
| | |
| | Commercial Services & Supplies – 0.1% | |
| Fort Dearborn Co. | |
| $ | 764,877 | | | | 5.000 | | | | 10/19/23 | | | | 768,227 | |
| | |
| | Consumer Cyclical Services – 0.1% | |
| Monitronics International, Inc. | |
| | 899,647 | | | | 6.500 | | | | 09/30/22 | | | | 893,179 | |
| | |
| | Consumer Products – Household & Leisure – 0.1% | |
| Calceus Acquisition, Inc. | |
| | 432,973 | | | | 5.000 | | | | 01/31/20 | | | | 386,429 | |
| Serta Simmons Holdings LLC | |
| | 741,947 | | | | 4.250 | | | | 10/01/19 | | | | 739,691 | |
| | | | | | | | | | | | | | |
| | | | | | | | | | | | | 1,126,120 | |
| | |
| | Consumer Products – Industrial – 0.0% | |
| Harbor Freight Tools USA, Inc. | |
| | 129,426 | | | | 4.137 | | | | 08/19/23 | | | | 130,275 | |
| | |
| | Diversified Manufacturing – 0.0% | |
| Emerald US Inc. | |
| | 131,826 | | | | 5.000 | | | | 05/09/21 | | | | 119,303 | |
| | |
| | |
| 20 | | The accompanying notes are an integral part of these financial statements. |
GOLDMAN SACHS MULTI-MANAGER ALTERNATIVES FUND
| | | | | | | | | | | | | | |
Principal
Amount | | | Interest
Rate | | | Maturity
Date | | | Value | |
| | Bank Loans(i) – (continued) | |
| | Diversified Manufacturing – (continued) | |
| KP Germany Erste GmbH | |
| $ | 183,639 | | | | 5.000 | % | | | 04/28/20 | | | $ | 184,337 | |
| | | | | | | | | | | | | | |
| | | | | | | | | | | | | 303,640 | |
| | |
| | Energy – 0.2% | |
| Chief Exploration & Development LLC | |
| | 138,129 | | | | 7.753 | | | | 05/16/21 | | | | 132,000 | |
| Drillships Ocean Ventures, Inc. | |
| | 1,000,563 | | | | 5.500 | | | | 07/25/21 | | | | 709,329 | |
| Energy Transfer Equity LP | |
| | 165,796 | | | | 4.042 | | | | 12/02/19 | | | | 165,826 | |
| Gulf Finance LLC | |
| | 254,508 | | | | 6.250 | | | | 08/25/23 | | | | 248,464 | |
| KCA Deutag US Finance LLC | |
| | 1,265,579 | | | | 6.250 | | | | 05/15/20 | | | | 1,120,038 | |
| Seadrill Partners Finco LLC | |
| | 1,034,549 | | | | 4.000 | | | | 02/21/21 | | | | 574,826 | |
| | | | | | | | | | | | | | |
| | | | | | | | | | | | | 2,950,483 | |
| | |
| | Energy – Exploration & Production – 0.0% | |
| Energy & Exploration Partners, Inc. | |
| | 82,084 | | | | 13.000 | | | | 11/12/21 | | | | 77,159 | |
| | 45,763 | | | | 5.000 | | | | 05/13/22 | | | | 20,593 | |
| Murray Energy Corp. | |
| | 514,305 | | | | 8.250 | | | | 04/16/20 | | | | 470,106 | |
| | | | | | | | | | | | | | |
| | | | | | | | | | | | | 567,858 | |
| | |
| | Finance – 0.2% | |
| CeramTec Acquisition Corp. | |
| | 974,852 | | | | 4.250 | | | | 08/30/20 | | | | 979,317 | |
| New Millennium Holdco, Inc. | |
| | 675,101 | | | | 7.500 | | | | 12/21/20 | | | | 424,186 | |
| Quality Care Properties, Inc. | |
| | 902,215 | | | | 6.250 | | | | 09/12/22 | | | | 899,211 | |
| | | | | | | | | | | | | | |
| | | | | | | | | | | | | 2,302,714 | |
| | |
| | Gaming – 0.4% | |
| Affinity Gaming LLC | |
| | 599,954 | | | | 9.250 | | | | 09/14/24 | | | | 587,205 | |
| Boyd Gaming Corp. | |
| | 60,889 | | | | 4.000 | | | | 08/14/20 | | | | 61,346 | |
| | 67,500 | | | | 3.534 | | | | 09/15/23 | | | | 67,968 | |
| Cowlitz Tribal Gaming Authority | |
| | 1,145,386 | | | | 11.500 | | | | 12/04/21 | | | | 1,214,109 | |
| Mashantucket (Western) Pequot Tribe | |
| | 415,622 | | | | 5.000 | | | | 07/01/18 | | | | 375,099 | |
| | 2,481,341 | | | | 9.375 | | | | 06/30/20 | | | | 2,179,437 | |
| | | | | | | | | | | | | | |
| | | | | | | | | | | | | 4,485,164 | |
| | |
| | Health Care – Medical Products – 0.3% | |
| Carestream Health, Inc. | |
| | 614,343 | | | | 5.000 | | | | 06/07/19 | | | | 569,612 | |
| | 2,459,465 | | | | 9.500 | | | | 12/07/19 | | | | 2,180,734 | |
| | |
| | Bank Loans(i) – (continued) | |
| | Health Care – Medical Products – (continued) | |
| Endo Luxembourg Finance Co. I S.A.R.L. | |
| $ | 957,427 | | | | 3.750 | % | | | 09/26/22 | | | $ | 955,876 | |
| | | | | | | | | | | | | | |
| | | | | | | | | | | | | 3,706,222 | |
| | |
| | Health Care – Services – 0.6% | |
| Air Medical Group Holdings, Inc. | |
| | 865,055 | | | | 4.250 | | | | 04/28/22 | | | | 856,949 | |
| American Renal Holdings, Inc. | |
| | 1,450,599 | | | | 4.750 | | | | 09/20/19 | | | | 1,432,467 | |
| BioClinica, Inc. | |
| | 445,056 | | | | 5.250 | | | | 10/20/23 | | | | 444,224 | |
| BPA Laboratories, Inc. | |
| | 160,673 | | | | 2.500 | | | | 07/01/17 | | | | 124,521 | |
| Community Health Systems, Inc. | |
| | 912,092 | | | | 4.000 | | | | 01/27/21 | | | | 860,331 | |
| Envision Healthcare Corp. | |
| | 488,396 | | | | 4.250 | | | | 05/25/18 | | | | 488,830 | |
| Ortho-Clinical Diagnostics, Inc. | |
| | 1,731,604 | | | | 4.750 | | | | 06/30/21 | | | | 1,689,751 | |
| U.S. Renal Care, Inc. | |
| | 1,711,243 | | | | 5.250 | | | | 12/31/22 | | | | 1,636,907 | |
| | | | | | | | | | | | | | |
| | | | | | | | | | | | | 7,533,980 | |
| | |
| | Media – Broadcasting & Radio – 0.2% | |
| AP NMT Acquisition BV | |
| | 453,264 | | | | 6.750 | | | | 08/13/21 | | | | 413,889 | |
| Cumulus Media Holdings, Inc. | |
| | 1,411,602 | | | | 4.250 | | | | 12/23/20 | | | | 970,476 | |
| EIG Investors Corp. | |
| | 574,980 | | | | 6.480 | | | | 11/09/19 | | | | 558,449 | |
| iHeart Communications, Inc. | |
| | 234,313 | | | | 7.284 | | | | 01/30/19 | | | | 177,012 | |
| | | | | | | | | | | | | | |
| | | | | | | | | | | | | 2,119,826 | |
| | |
| | Media – Non Cable – 0.1% | |
| Affinion Group, Inc. | |
| | 850,481 | | | | 6.750 | | | | 04/30/18 | | | | 827,629 | |
| | 210,000 | | | | 8.500 | | | | 10/31/18 | | | | 191,976 | |
| Media General, Inc. | |
| | 58,634 | | | | 4.000 | | | | 07/31/20 | | | | 58,621 | |
| | | | | | | | | | | | | | |
| | | | | | | | | | | | | 1,078,226 | |
| | |
| | Packaging – 0.1% | |
| Ardagh Holdings USA, Inc. | |
| | 277,539 | | | | 4.000 | | | | 12/17/21 | | | | 280,053 | |
| Expera Specialty Solutions LLC | |
| | 908,885 | | | | 5.000 | | | | 10/27/23 | | | | 899,795 | |
| Klockner-Pentaplast of America, Inc. | |
| | 429,715 | | | | 5.000 | | | | 04/28/20 | | | | 431,348 | |
| | | | | | | | | | | | | | |
| | | | | | | | | | | | | 1,611,196 | |
| | |
| | Pharmaceuticals – 0.1% | |
| Lantheus Medical Imaging, Inc. | |
| | 908,021 | | | | 7.000 | | | | 06/30/22 | | | | 889,860 | |
| | |
| | |
| The accompanying notes are an integral part of these financial statements. | | 21 |
GOLDMAN SACHS MULTI-MANAGER ALTERNATIVES FUND
Consolidated Schedule of Investments (continued)
October 31, 2016
| | | | | | | | | | | | | | |
Principal
Amount | | | Interest
Rate | | | Maturity
Date | | | Value | |
| | Bank Loans(i) – (continued) | |
| | Pharmaceuticals – (continued) | |
| Valeant Pharmaceuticals International, Inc. | |
| $ | 642,316 | | | | 5.500 | % | | | 04/01/22 | | | $ | 639,908 | |
| | | | | | | | | | | | | | |
| | | | | | | | | | | | | 1,529,768 | |
| | |
| | Property/Casualty Insurance – 0.1% | |
| York Risk Services Holding Corp. | |
| | 905,005 | | | | 4.750 | | | | 10/01/21 | | | | 837,699 | |
| | |
| | Real Estate – 0.1% | |
| Empire Generating Co. LLC | |
| | 1,394,605 | | | | 5.250 | | | | 03/14/21 | | | | 1,276,064 | |
| | |
| | Restaurants – 0.1% | |
| Red Lobster Management LLC | |
| | 763,203 | | | | 6.250 | | | | 07/28/21 | | | | 766,065 | |
| | |
| | Retailers – 0.2% | |
| Academy Ltd. | |
| | 374,252 | | | | 5.000 | | | | 07/01/22 | | | | 362,672 | |
| Claire’s Stores, Inc. | |
| | 782,800 | | | | 9.000 | | | | 08/12/21 | | | | 490,870 | |
| Container Store, Inc. | |
| | 300,061 | | | | 4.250 | | | | 04/06/19 | | | | 258,052 | |
| Dollar Tree, Inc. | |
| | 82,307 | | | | 4.250 | | | | 07/06/22 | | | | 83,371 | |
| Gymboree Corp. | |
| | 2,323,729 | | | | 5.000 | | | | 02/23/18 | | | | 1,461,044 | |
| The Talbots, Inc. | |
| | 154,900 | | | | 9.500 | | | | 03/19/21 | | | | 143,024 | |
| True Religion Apparel, Inc. | |
| | 96,500 | | | | 5.875 | | | | 07/30/19 | | | | 24,814 | |
| | | | | | | | | | | | | | |
| | | | | | | | | | | | | 2,823,847 | |
| | |
| | Services Cyclical – Business Services – 0.2% | |
| Koosharem LLC | |
| | 1,156,424 | | | | 7.500 | | | | 05/16/20 | | | | 1,026,326 | |
| Redtop Acquisition Ltd. | |
| | 97,252 | | | | 4.500 | | | | 12/03/20 | | | | 96,887 | |
| Tribune Publishing Co. | |
| | 1,273,857 | | | | 5.750 | | | | 07/07/21 | | | | 1,238,826 | |
| Weight Watchers International, Inc. | |
| | 229,641 | | | | 4.000 | | | | 04/02/20 | | | | 174,298 | |
| | | | | | | | | | | | | | |
| | | | | | | | | | | | | 2,536,337 | |
| | |
| | Technology – Hardware – 0.2% | |
| Diebold, Inc. | |
| | 515,000 | | | | 5.250 | | | | 11/06/23 | | | | 520,366 | |
| MKS Instruments, Inc. | |
| | 299,735 | | | | 4.250 | | | | 05/01/23 | | | | 301,857 | |
| ON Semiconductor Corp. | |
| | 1,036,000 | | | | 3.777 | | | | 03/31/23 | | | | 1,041,698 | |
| | | | | | | | | | | | | | |
| | | | | | | | | | | | | 1,863,921 | |
| | |
| | Technology – Software – 0.1% | |
| Aricent Technologies Ltd. | |
| | 732,964 | | | | 5.500 | | | | 04/14/21 | | | | 682,441 | |
| | |
| | Bank Loans(i) – (continued) | |
| | Technology – Software/Services – 0.5% | |
| Applied Systems, Inc. | |
| $ | 905,591 | | | | 4.000 | % | | | 01/25/21 | | | $ | 906,950 | |
| BMC Software, Inc. | |
| | 802,518 | | | | 5.000 | | | | 09/10/20 | | | | 789,725 | |
| Ion Trading Finance Ltd. | |
| | 369,250 | | | | 4.250 | | | | 08/11/23 | | | | 368,788 | |
| MModal Inc. | |
| | 2,087,785 | | | | 9.000 | | | | 01/31/20 | | | | 1,945,127 | |
| Syniverse Holdings, Inc. | |
| | 1,672,439 | | | | 4.000 | | | | 04/23/19 | | | | 1,538,587 | |
| Western Digital Corp. | |
| | 215,460 | | | | 4.500 | | | | 04/29/23 | | | | 217,768 | |
| | | | | | | | | | | | | | |
| | | | | | | | | | | | | 5,766,945 | |
| | |
| | Telecommunications – Internet & Data – 0.2% | |
| Asurion LLC | |
| | 438,467 | | | | 5.000 | | | | 05/24/19 | | | | 438,546 | |
| | 482,955 | | | | 4.338 | | | | 07/08/20 | | | | 483,158 | |
| | 1,575,000 | | | | 8.500 | | | | 03/03/21 | | | | 1,586,151 | |
| | | | | | | | | | | | | | |
| | | | | | | | | | | | | 2,507,855 | |
| | |
| | Textiles – 0.1% | |
| Indra Holdings Corp. | |
| | 635,308 | | | | 5.250 | | | | 05/01/21 | | | | 508,247 | |
| Nine West Holdings, Inc. | |
| | 478,876 | | | | 4.750 | | | | 10/08/19 | | | | 274,554 | |
| | | | | | | | | | | | | | |
| | | | | | | | | | | | | 782,801 | |
| | |
| | Transportation – 0.1% | |
| Syncreon Group Holdings B.V. | |
| | 737,389 | | | | 5.250 | | | | 10/28/20 | | | | 659,042 | |
| | |
| | Utilities – 0.2% | |
| Longview Power LLC | |
| | 1,362,750 | | | | 7.000 | | | | 04/13/21 | | | | 1,175,372 | |
| TEX Operations Co. LLC | |
| | 1,334,702 | | | | 5.000 | | | | 08/04/23 | | | | 1,346,381 | |
| | | | | | | | | | | | | | |
| | | | | | | | | | | | | 2,521,753 | |
| | |
| | Wireless Telecommunications – 0.0% | |
| Intelsat Jackson Holdings SA | |
| | 400,000 | | | | 3.750 | | | | 06/30/19 | | | | 382,044 | |
| | |
| | TOTAL BANK LOANS | |
| | (Cost $66,749,619) | | | $ | 59,769,944 | |
| | |
| | | | | | | | | | | | | | |
| | Asset-Backed Securities(a)(c) – 0.1% | |
| | Collateralized Loan Obligations – 0.1% | |
| Battalion CLO IX Ltd. Series 15-9A, Class D | |
| $ | 255,000 | | | | 4.780 | % | | | 07/15/28 | | | $ | 236,401 | |
| TICP CLO II Ltd. Series 14-2A, Class C | |
| | 540,000 | | | | 4.181 | | | | 07/20/26 | | | | 499,641 | |
| | | | | | | | | | | | | | |
| | | | | | | | | | | | | 736,042 | |
| | |
| | |
| 22 | | The accompanying notes are an integral part of these financial statements. |
GOLDMAN SACHS MULTI-MANAGER ALTERNATIVES FUND
| | | | | | | | | | | | | | |
Principal
Amount | | | Interest
Rate | | | Maturity
Date | | | Value | |
| | Asset-Backed Securities(a)(c) – (continued) | |
| | Home Equity – 0.0% | |
| ALM XIV Ltd. Series 14-14A, Class D | |
| $ | 625,000 | | | | 5.740 | % | | | 07/28/26 | | | $ | 553,707 | |
| | |
| | TOTAL ASSET-BACKED SECURITIES | |
| | (Cost $1,296,530) | | | $ | 1,289,749 | |
| | |
| | | | | | | | | | | | | | |
| | Foreign Debt Obligation(a) – 0.1% | |
| Provincia de Buenos Aires | |
| $ | 855,000 | | | | 9.125 | % | | | 03/16/24 | | | $ | 945,745 | |
| | (Cost $844,827) | | | | | |
| | |
| | | | | | | | | | | | | | |
| | Municipal Debt Obligations(b) – 0.3% | |
| | Puerto Rico(d) – 0.1% | |
| Puerto Rico Commonwealth GO Bonds (Unrefunded) (Balance-
Public Improvement) Series A |
|
| $ | 115,000 | | | | 5.000 | % | | | 07/01/33 | | | $ | 73,456 | |
| Puerto Rico Commonwealth GO Bonds Refunding for Public
Improvement Series 2011 A |
|
| | 5,000 | | | | 6.500 | | | | 07/01/40 | | | | 3,287 | |
| Puerto Rico Commonwealth GO Bonds Refunding for Public
Improvement Series 2012 A |
|
| | 420,000 | | | | 5.750 | | | | 07/01/28 | | | | 271,425 | |
| | 70,000 | | | | 5.125 | | | | 07/01/37 | | | | 44,450 | |
| | 245,000 | | | | 5.500 | | | | 07/01/39 | | | | 157,412 | |
| | 20,000 | | | | 5.000 | | | | 07/01/41 | | | | 12,500 | |
| Puerto Rico Commonwealth GO Bonds Series 2007 A | |
| | 5,000 | | | | 5.250 | | | | 07/01/29 | | | | 3,188 | |
| | 5,000 | | | | 5.250 | | | | 07/01/33 | | | | 3,188 | |
| | 85,000 | | | | 5.250 | | | | 07/01/37 | | | | 54,187 | |
| Puerto Rico Commonwealth GO Bonds Series 2014 A | |
| | 1,075,000 | | | | 8.000 | | | | 07/01/35 | | | | 731,000 | |
| | | | | | | | | | | | | | |
| | | | | | | | | | | | | 1,354,093 | |
| | |
| | Texas – 0.2% | |
| Texas State Public Finance Authority RB (Taxable Windstrom
Insurance) Series 2014 |
|
| | 1,670,000 | | | | 8.250 | | | | 07/01/24 | | | | 1,735,965 | |
| | |
| | TOTAL MUNICIPAL DEBT OBLIGATIONS | |
| | (Cost $3,188,939) | | | $ | 3,090,058 | |
| | |
| | | | | | | | | | | | | | |
| | U.S. Treasury Obligation(g) – 1.3% | |
| United States Treasury Note | |
| $ | 15,900,000 | | | | 0.500 | % | | | 11/30/16 | | | $ | 15,902,544 | |
| | (Cost $15,902,355) | | | | | |
| | |
| | | | | | | | |
Shares | | Rate | | | Value | |
| Preferred Stock – 0.0% | |
| Energy Equipment & Services – 0.0% | |
Te Holdcorp LLC/Te Holdcorp | |
| 35,662 | | | 0.000 | % | | $ | 213,974 | |
| (Cost $707,758) | | | | | |
| |
| | | | | | | | |
Units | | Expiration
Date | | | Value | |
| Rights* – 0.0% | |
| Energy – 0.0% | |
TCEH Corp.(j) | |
| 138,462 | | | | | | $ | 242,309 | |
| |
| Hotels, Restaurants & Leisure – 0.0% | | | | | |
Caesars Entertainment Operating Co., Inc. | |
| 225,290 | | | 03/30/16 | | | | — | |
| |
| TOTAL RIGHTS | |
| (Cost $206,894) | | | $ | 242,309 | |
| |
| | | | | | | | |
| Warrants* – 0.0% | |
| Energy Equipment & Services – 0.0% | |
Seventy Seven Energy, Inc. | |
| 1,768 | | | 08/01/21 | | | $ | 11,382 | |
| |
| Oil, Gas & Consumable Fuels – 0.0% | |
SandRidge Energy, Inc. | |
| 1,740 | | | 10/04/22 | | | | 8,439 | |
SandRidge Energy, Inc. | |
| 732 | | | 10/04/22 | | | | 3,331 | |
| | | | | | | | |
| | | | | | | 11,770 | |
| |
| Semiconductors & Semiconductor Equipment – 0.0% | |
MModal, Inc. Warrant A | |
| 516 | | | 07/31/17 | | | | 129 | |
MModal, Inc. Warrant B | |
| 681 | | | 07/31/17 | | | | 43 | |
| | | | | | | | |
| | | | | | | 172 | |
| |
| TOTAL WARRANTS | |
| (Cost $74,993) | | | $ | 23,324 | |
| |
| | | | | | | | |
| Shares | | Distribution
Rate | | | Value | |
| Investment Company(k) – 2.4% | |
Goldman Sachs Financial Square Government Fund – Institutional Shares | |
| 28,130,434 | | | 0.300 | % | | $ | 28,130,434 | |
| (Cost $28,130,434) | | | | | |
| |
| | |
| The accompanying notes are an integral part of these financial statements. | | 23 |
GOLDMAN SACHS MULTI-MANAGER ALTERNATIVES FUND
Consolidated Schedule of Investments (continued)
October 31, 2016
| | | | | | | | | | | | | | |
Principal
Amount | | | Interest
Rate | | | Maturity
Date | | | Value | |
| | Short-term Investment(l) – 44.8% | |
| | Repurchase Agreements – 44.8% | |
| Joint Repurchase Agreement Account II | |
| $ | 536,500,000 | | | | 0.338 | % | | | 11/01/16 | | | $ | 536,500,000 | |
| | (Cost $536,500,000) | | | | | |
| | |
| TOTAL INVESTMENTS BEFORE SHORT
POSITIONS – 90.0% |
|
| | (Cost $1,069,823,482) | | | $ | 1,076,579,180 | |
| | |
| | | | | | | | |
| Shares | | | Description | | Value | |
| | Common Stocks Sold Short – (0.6)% | |
| | Aerospace & Defense – (0.0)% | |
| | 2,047 | | | The Boeing Co. | | $ | (291,554 | ) |
| | |
| | Air Freight & Logistics – (0.1)% | |
| | 6,821 | | | United Parcel Service, Inc. Class B | | | (735,031 | ) |
| | |
| | Automobiles – (0.0)% | |
| | 2,384 | | | Ford Motor Co. | | | (27,988 | ) |
| | |
| | Chemicals – (0.0)% | |
| | 2,043 | | | The Dow Chemical Co. | | | (109,934 | ) |
| | |
| | Commercial Services & Supplies – (0.0)% | |
| | 1,940 | | | Pitney Bowes, Inc. | | | (34,610 | ) |
| | |
| | Diversified Telecommunication Services – (0.0)% | |
| | 4,256 | | | AT&T, Inc. | | | (156,578 | ) |
| | 1,670 | | | Verizon Communications, Inc. | | | (80,327 | ) |
| | | | | | | | |
| | | | | | | (236,905 | ) |
| | |
| | Electronic Equipment, Instruments & Components – (0.0)% | |
| | 2,444 | | | Amphenol Corp. Class A | | | (161,133 | ) |
| | 1,230 | | | Belden, Inc. | | | (79,716 | ) |
| | | | | | | | |
| | | | | | | (240,849 | ) |
| | |
| | Equity Real Estate Investment Trusts (REITs) – (0.0)% | |
| | 7,887 | | | DiamondRock Hospitality Co. | | | (72,166 | ) |
| | 4,576 | | | Host Hotels & Resorts, Inc. | | | (70,837 | ) |
| | 5,979 | | | LaSalle Hotel Properties | | | (142,001 | ) |
| | 11,680 | | | Sunstone Hotel Investors, Inc. | | | (146,701 | ) |
| | | | | | | | |
| | | | | | | (431,705 | ) |
| | |
| | Food & Staples Retailing – (0.1)% | |
| | 10,377 | | | Wal-Mart Stores, Inc. | | | (726,597 | ) |
| | |
| | Insurance – (0.0)% | |
| | 1,688 | | | CNA Financial Corp. | | | (61,730 | ) |
| | |
| | Internet & Direct Marketing Retail – (0.0)% | |
| | 1,542 | | | Expedia, Inc. | | | (199,273 | ) |
| | |
| | Common Stocks Sold Short – (continued) | |
| | Internet Software & Services – (0.3)% | |
| | 114,000 | | | Tencent Holdings Ltd. | | $ | (3,021,265 | ) |
| | |
| | Machinery – (0.1)% | |
| | 7,171 | | | Caterpillar, Inc. | | | (598,492 | ) |
| | 2,988 | | | Joy Global, Inc. | | | (82,080 | ) |
| | | | | | | | |
| | | | | | | (680,572 | ) |
| | |
| | Marine* – (0.0)% | |
| | 844 | | | Kirby Corp. | | | (49,754 | ) |
| | |
| | Media – (0.0)% | |
| | 1,588 | | | Meredith Corp. | | | (72,016 | ) |
| | 20,809 | | | Sirius XM Holdings, Inc.* | | | (86,773 | ) |
| | | | | | | | |
| | | | | | | (158,789 | ) |
| | |
| | Trading Companies & Distributors – (0.0)% | |
| | 138 | | | W.W. Grainger, Inc. | | | (28,720 | ) |
| | |
| | TOTAL COMMON STOCKS SOLD SHORT | |
| | (Cost $(6,788,687)) | | $ | (7,035,276 | ) |
| | |
| | | | | | | | |
| | Exchange Traded Funds Sold Short – (2.1)% | |
| | 13,234 | | | Consumer Discretionary Select Sector SPDR Fund | | $ | (1,033,575 | ) |
| | 6,646 | | | Health Care Select Sector SPDR Fund | | | (447,675 | ) |
| | 20,988 | | | Industrial Select Sector SPDR Fund | | | (1,200,723 | ) |
| | 10,520 | | | iShares Core Russell U.S. Growth ETF | | | (436,159 | ) |
| | 15,289 | | | iShares Russell 2000 ETF | | | (1,811,747 | ) |
| | 2,650 | | | iShares US Real Estate ETF | | | (203,096 | ) |
| | 12,826 | | | Materials Select Sector SPDR Fund | | | (599,616 | ) |
| | 76,391 | | | SPDR S&P 500 ETF Trust | | | (16,236,907 | ) |
| | 21,921 | | | SPDR S&P Regional Banking ETF | | | (959,921 | ) |
| | 46,232 | | | Technology Select Sector SPDR Fund | | | (2,192,321 | ) |
| | |
| | TOTAL EXCHANGE TRADED FUNDS SOLD SHORT | |
| | (Cost $(25,060,164)) | | $ | (25,121,740 | ) |
| | |
| | TOTAL SECURITIES SOLD SHORT – (2.7)% | |
| | (Cost $(31,848,851)) | | $ | (32,157,016 | ) |
| | |
| OTHER ASSETS IN EXCESS OF
LIABILITIES – 12.7% | | | 152,609,886 | |
| | |
| | NET ASSETS – 100.0% | | $ | 1,197,032,050 | |
| | |
| | |
| 24 | | The accompanying notes are an integral part of these financial statements. |
GOLDMAN SACHS MULTI-MANAGER ALTERNATIVES FUND
| | |
| The percentage shown for each investment category reflects the value of investments in that category as a percentage of net assets. |
* | | Non-income producing security. |
(a) | | Exempt from registration under Rule 144A of the Securities Act of 1933. Such securities may be deemed liquid by an Underlying Manager and may be resold, normally to qualified institutional buyers in transactions exempt from registration. Total market value of Rule 144A securities amounts to $129,130,228, which represents approximately 10.8% of net assets as of October 31, 2016. |
(b) | | Security with “Call” features with resetting interest rates. Maturity dates disclosed are the final maturity dates. |
(c) | | Variable rate security. Interest rate or distribution rate disclosed is that which is in effect on October 31, 2016. |
(d) | | Security is currently in default. |
(e) | | Pay-in-kind securities. |
(f) | | Coupon changes periodically based upon a predetermined schedule. Interest rate disclosed is that which is in effect on October 31, 2016. |
(g) | | All or portion of security is pledged as collateral for short sales. Total market value of securities pledged as collateral on short sales amounts to $33,554,874, which represents approximately 2.8% of net assets as of October 31, 2016. |
(h) | | A portion of this security is pledged as collateral for initial margin requirements on over the counter swap transactions. Total market value pledged as collateral amounts to $12,014,873, which represents approximately 1.0% of net assets as of October 31, 2016. |
(i) | | Bank Loans often require prepayments from excess cash flows or permit the borrower to repay at its election. The degree to which borrowers repay, whether as a contractual requirement or at their election, cannot be predicted with accuracy. As a result, the actual remaining maturity may be substantially less than the stated maturities shown. The stated interest rate represents the weighted average interest rate of all contracts within the bank loan facility on October 31, 2016. Bank Loans typically have rates of interest which are predetermined either daily, monthly, quarterly or semi-annually by reference to a base lending rate, plus a premium. These base lending rates are primarily the London-Interbank Offered Rate (“LIBOR”), and secondarily the prime rate offered by one or more major United States banks (the “Prime Rate”) and the certificate of deposit (“CD”) rate or other base lending rates used by commercial lenders. |
(j) | | Expiration date occurs on payment date. |
(k) | | Represents an affiliated fund. |
(l) | | Joint repurchase agreement was entered into on October 31, 2016. Additional information appears on page 48. |
| | |
|
Currency Abbreviations: |
AUD | | —Australian Dollar |
BRL | | —Brazilian Real |
CAD | | —Canadian Dollar |
CHF | | —Swiss Franc |
CNY | | —Chinese Yuan Renminbi |
EUR | | —Euro |
GBP | | —British Pound |
INR | | —Indian Rupee |
JPY | | —Japanese Yen |
MXN | | —Mexican Peso |
NOK | | —Norwegian Krone |
NZD | | —New Zealand Dollar |
RUB | | —Russian Ruble |
SEK | | —Swedish Krona |
USD | | —U.S. Dollar |
| | |
Investment Abbreviations: |
ADR | | —American Depositary Receipt |
CLO | | —Collateralized Loan Obligation |
ETF | | —Exchange Traded Fund |
GDR | | —Global Depository Receipt |
GO | | —General Obligation |
GP | | —General Partnership |
LLC | | —Limited Liability Company |
LP | | —Limited Partnership |
PLC | | —Public Limited Company |
RB | | —Revenue Bond |
SpA | | —Stand-by Purchase Agreement |
|
| | |
| The accompanying notes are an integral part of these financial statements. | | 25 |
GOLDMAN SACHS MULTI-MANAGER ALTERNATIVES FUND
Consolidated Schedule of Investments (continued)
October 31, 2016
|
| ADDITIONAL INVESTMENT INFORMATION |
UNFUNDED LOAN COMMITMENTS — At October 31, 2016 the Fund had unfunded loan commitments which could be extended at the option of the borrowers, pursuant to the following loan agreements:
| | | | | | | | | | | | |
| Borrower | | Principal
Amount | | | Current
Value | | | Unrealized
Gain (Loss) | |
Energy & Exploration Partners, Inc. | | $ | 31,571 | | | $ | 29,677 | | | $ | (1,894 | ) |
FORWARD FOREIGN CURRENCY EXCHANGE CONTRACTS — At October 31, 2016, the Fund had the following forward foreign currency exchange contracts:
FORWARD FOREIGN CURRENCY EXCHANGE CONTRACTS WITH UNREALIZED GAIN
| | | | | | | | | | | | | | | | | | | | | | | | |
| Counterparty | | Currency Purchased | | | Currency Sold | | | Current Value | | | Settlement Date | | | Unrealized Gain | |
Bank of America Securities LLC | | AUD | | | 10,870,000 | | | USD | | | 8,115,495 | | | $ | 8,257,451 | | | | 12/23/16 | | | $ | 141,956 | |
| | EUR | | | 1,849,000 | | | USD | | | 2,025,329 | | | | 2,034,887 | | | | 12/23/16 | | | | 9,559 | |
| | GBP | | | 1,884,000 | | | USD | | | 2,300,250 | | | | 2,309,131 | | | | 12/23/16 | | | | 8,884 | |
| | JPY | | | 24,325,000 | | | USD | | | 232,163 | | | | 232,483 | | | | 12/22/16 | | | | 320 | |
| | MXN | | | 5,032,000 | | | USD | | | 260,704 | | | | 264,653 | | | | 12/23/16 | | | | 3,948 | |
| | NZD | | | 69,000 | | | USD | | | 49,154 | | | | 49,243 | | | | 12/23/16 | | | | 89 | |
| | USD | | | 98,825 | | | AUD | | | 130,000 | | | | 98,755 | | | | 12/23/16 | | | | 70 | |
| | USD | | | 27,892,033 | | | CAD | | | 36,726,000 | | | | 27,392,630 | | | | 12/23/16 | | | | 499,405 | |
| | USD | | | 19,577,331 | | | CHF | | | 18,972,000 | | | | 19,234,292 | | | | 12/23/16 | | | | 343,039 | |
| | USD | | | 43,741,840 | | | EUR | | | 39,550,000 | | | | 43,526,119 | | | | 12/23/16 | | | | 215,722 | |
| | USD | | | 22,596,382 | | | GBP | | | 17,220,000 | | | | 21,105,753 | | | | 12/23/16 | | | | 1,490,631 | |
| | USD | | | 7,837,403 | | | JPY | | | 805,896,000 | | | | 7,702,245 | | | | 12/22/16 | | | | 135,157 | |
| | USD | | | 37,445 | | | MXN | | | 700,000 | | | | 36,816 | | | | 12/23/16 | | | | 629 | |
| | USD | | | 53,629 | | | NZD | | | 74,000 | | | | 52,811 | | | | 12/23/16 | | | | 818 | |
Barclays Bank PLC | | USD | | | 1,147,245 | | | EUR | | | 1,020,000 | | | | 1,122,025 | | | | 12/15/16 | | | | 25,220 | |
JPMorgan Securities, Inc. | | AUD | | | 25,110,712 | | | USD | | | 18,879,617 | | | | 19,076,449 | | | | 12/21/16 | | | | 196,836 | |
| | EUR | | | 15,298,235 | | | USD | | | 16,685,838 | | | | 16,834,281 | | | | 12/21/16 | | | | 148,442 | |
| | GBP | | | 2,340,190 | | | USD | | | 2,842,711 | | | | 2,868,070 | | | | 12/21/16 | | | | 25,360 | |
| | JPY | | | 508,478,064 | | | USD | | | 4,837,981 | | | | 4,859,424 | | | | 12/21/16 | | | | 21,443 | |
| | NOK | | | 37,834,554 | | | USD | | | 4,566,464 | | | | 4,579,650 | | | | 12/21/16 | | | | 13,189 | |
| | NZD | | | 13,142,792 | | | USD | | | 9,322,532 | | | | 9,380,123 | | | | 12/21/16 | | | | 57,594 | |
| | USD | | | 23,352,886 | | | AUD | | | 30,462,429 | | | | 23,142,114 | | | | 12/21/16 | | | | 210,770 | |
| | USD | | | 16,615,316 | | | CAD | | | 21,948,590 | | | | 16,370,348 | | | | 12/21/16 | | | | 244,973 | |
| | USD | | | 50,157,708 | | | EUR | | | 44,930,712 | | | | 49,442,054 | | | | 12/21/16 | | | | 715,656 | |
| | USD | | | 8,101,655 | | | GBP | | | 6,342,560 | | | | 7,773,260 | | | | 12/21/16 | | | | 328,395 | |
| | USD | | | 19,055,740 | | | JPY | | | 1,955,481,813 | | | | 18,688,154 | | | | 12/21/16 | | | | 367,585 | |
| | USD | | | 25,362,420 | | | NOK | | | 209,367,675 | | | | 25,342,739 | | | | 12/21/16 | | | | 19,681 | |
| | USD | | | 8,365,034 | | | NZD | | | 11,690,218 | | | | 8,343,410 | | | | 12/21/16 | | | | 21,624 | |
| | USD | | | 31,995,385 | | | SEK | | | 273,858,979 | | | | 30,401,854 | | | | 12/21/16 | | | | 1,593,527 | |
Morgan Stanley & Co. International PLC | | USD | | | 1,036,481 | | | CHF | | | 1,017,000 | | | | 1,028,611 | | | | 11/17/16 | | | | 7,870 | |
| | USD | | | 4,551,010 | | | EUR | | | 4,090,000 | | | | 4,492,839 | | | | 11/17/16 | | | | 58,172 | |
UBS AG (London) | | CNY | | | 177,026,477 | | | USD | | | 26,063,969 | | | | 26,065,888 | | | | 11/30/16 | | | | 1,919 | |
| | INR | | | 58,115,249 | | | USD | | | 867,972 | | | | 870,204 | | | | 11/01/16 | | | | 2,231 | |
| | USD | | | 289,847 | | | BRL | | | 917,597 | | | | 284,791 | | | | 11/30/16 | | | | 5,055 | |
| | | USD | | | 1,074,953 | | | RUB | | | 68,130,521 | | | | 1,066,456 | | | | 11/30/16 | | | | 8,496 | |
| TOTAL | | | | | | | | | | | | | | | | | | | | | | $ | 6,924,265 | |
| | |
| 26 | | The accompanying notes are an integral part of these financial statements. |
GOLDMAN SACHS MULTI-MANAGER ALTERNATIVES FUND
|
| ADDITIONAL INVESTMENT INFORMATION (continued) |
FORWARD FOREIGN CURRENCY EXCHANGE CONTRACTS WITH UNREALIZED LOSS
| | | | | | | | | | | | | | | | | | | | | | | | |
| Counterparty | | Currency Purchased | | | Currency Sold | | | Current Value | | | Settlement Date | | | Unrealized Loss | |
Bank of America Securities LLC | | AUD | | | 17,408,000 | | | USD | | | 13,320,448 | | | $ | 13,224,075 | | | | 12/23/16 | | | $ | (96,373 | ) |
| | CAD | | | 7,702,000 | | | USD | | | 5,839,801 | | | | 5,744,651 | | | | 12/23/16 | | | | (95,150 | ) |
| | CHF | | | 3,967,000 | | | USD | | | 4,099,916 | | | | 4,021,845 | | | | 12/23/16 | | | | (78,072 | ) |
| | EUR | | | 19,201,000 | | | USD | | | 21,601,468 | | | | 21,131,353 | | | | 12/23/16 | | | | (470,115 | ) |
| | GBP | | | 4,216,000 | | | USD | | | 5,354,329 | | | | 5,167,355 | | | | 12/23/16 | | | | (186,976 | ) |
| | JPY | | | 2,719,323,000 | | | USD | | | 26,640,357 | | | | 25,989,569 | | | | 12/22/16 | | | | (650,788 | ) |
| | NZD | | | 12,527,000 | | | USD | | | 9,104,303 | | | | 8,940,020 | | | | 12/23/16 | | | | (164,283 | ) |
| | USD | | | 5,635,460 | | | AUD | | | 7,550,000 | | | | 5,735,395 | | | | 12/23/16 | | | | (99,935 | ) |
| | USD | | | 88,813 | | | CHF | | | 88,000 | | | | 89,217 | | | | 12/23/16 | | | | (403 | ) |
| | USD | | | 7,750,128 | | | EUR | | | 7,090,000 | | | | 7,802,787 | | | | 12/23/16 | | | | (52,659 | ) |
| | USD | | | 2,729,644 | | | GBP | | | 2,233,000 | | | | 2,736,884 | | | | 12/23/16 | | | | (7,241 | ) |
| | USD | | | 310,439 | | | JPY | | | 32,641,000 | | | | 311,962 | | | | 12/22/16 | | | | (1,523 | ) |
| | USD | | | 6,466,216 | | | MXN | | | 125,364,000 | | | | 6,593,391 | | | | 12/23/16 | | | | (127,176 | ) |
| | USD | | | 304,523 | | | NZD | | | 428,000 | | | | 305,446 | | | | 12/23/16 | | | | (925 | ) |
Barclays Bank PLC | | USD | | | 99,138 | | | EUR | | | 91,000 | | | | 100,102 | | | | 12/15/16 | | | | (964 | ) |
JPMorgan Securities, Inc. | | AUD | | | 3,422,015 | | | USD | | | 2,611,490 | | | | 2,599,684 | | | | 12/21/16 | | | | (11,807 | ) |
| | CAD | | | 101,812,988 | | | USD | | | 77,089,624 | | | | 75,937,181 | | | | 12/21/16 | | | | (1,152,461 | ) |
| | EUR | | | 8,168,405 | | | USD | | | 9,183,590 | | | | 8,988,566 | | | | 12/21/16 | | | | (195,023 | ) |
| | GBP | | | 14,262,722 | | | USD | | | 18,264,455 | | | | 17,479,984 | | | | 12/21/16 | | | | (784,468 | ) |
| | JPY | | | 4,249,483,862 | | | USD | | | 41,344,891 | | | | 40,611,481 | | | | 12/21/16 | | | | (733,411 | ) |
| | NOK | | | 126,023,451 | | | USD | | | 15,363,207 | | | | 15,254,403 | | | | 12/21/16 | | | | (108,801 | ) |
| | NZD | | | 36,471,146 | | | USD | | | 26,431,260 | | | | 26,029,776 | | | | 12/21/16 | | | | (401,484 | ) |
| | USD | | | 5,263,083 | | | AUD | | | 6,994,466 | | | | 5,313,652 | | | | 12/21/16 | | | | (50,569 | ) |
| | USD | | | 11,279,037 | | | EUR | | | 10,278,965 | | | | 11,311,039 | | | | 12/21/16 | | | | (32,005 | ) |
| | USD | | | 3,583,052 | | | GBP | | | 2,931,150 | | | | 3,592,333 | | | | 12/21/16 | | | | (9,282 | ) |
| | USD | | | 49,867 | | | JPY | | | 5,226,456 | | | | 49,948 | | | | 12/21/16 | | | | (81 | ) |
| | USD | | | 5,725,012 | | | NZD | | | 8,027,245 | | | | 5,729,114 | | | | 12/21/16 | | | | (4,103 | ) |
Morgan Stanley & Co. International PLC | | CHF | | | 348,000 | | | USD | | | 355,052 | | | | 351,973 | | | | 11/17/16 | | | | (3,078 | ) |
| | EUR | | | 2,325,000 | | | USD | | | 2,587,976 | | | | 2,553,998 | | | | 11/17/16 | | | | (33,976 | ) |
| | USD | | | 713,733 | | | EUR | | | 652,000 | | | | 716,218 | | | | 11/17/16 | | | | (2,485 | ) |
UBS AG (London) | | USD | | | 70,164,107 | | | CNY | | | 476,659,858 | | | | 70,184,769 | | | | 11/30/16 | | | | (20,662 | ) |
| | USD | | | 868,796 | | | INR | | | 58,115,248 | | | | 870,205 | | | | 11/01/16 | | | | (1,409 | ) |
| | | USD | | | 567,344 | | | RUB | | | 36,247,608 | | | | 567,388 | | | | 11/30/16 | | | | (44 | ) |
| TOTAL | | | | | | | | | | | | | | | | | | | | | | $ | (5,577,732 | ) |
FUTURES CONTRACTS – At October 31, 2016, the Fund had the following futures contracts:
| | | | | | | | | | | | | | |
| Type | | Number of
Contracts
Long (Short) | | | Expiration Date | | Current Value | | | Unrealized
Gain (Loss) | |
Amsterdam Exchanges Index | | | 21 | | | November 2016 | | $ | 2,080,281 | | | $ | (5,126 | ) |
Australian Dollar | | | (1 | ) | | December 2016 | | | (75,920 | ) | | | (10 | ) |
Australian 3 Year Government Bonds | | | 551 | | | December 2016 | | | 47,177,377 | | | | (265,616 | ) |
Australian 10 Year Government Bonds | | | (647 | ) | | December 2016 | | | (65,273,140 | ) | | | 639,955 | |
Brent Crude | | | 42 | | | November 2016 | | | 2,041,620 | | | | (204,173 | ) |
British Pound | | | 35 | | | December 2016 | | | 2,680,563 | | | | 16,325 | |
CAC40 Index | | | (11 | ) | | November 2016 | | | (544,171 | ) | | | 210 | |
CAC40 Index | | | 73 | | | November 2016 | | | 3,611,318 | | | | (15,918 | ) |
Canada 10 Year Government Bonds | | | 213 | | | December 2016 | | | 22,965,824 | | | | (244,871 | ) |
| | |
| The accompanying notes are an integral part of these financial statements. | | 27 |
GOLDMAN SACHS MULTI-MANAGER ALTERNATIVES FUND
Consolidated Schedule of Investments (continued)
October 31, 2016
|
| ADDITIONAL INVESTMENT INFORMATION (continued) |
FUTURES CONTRACTS (continued)
| | | | | | | | | | | | | | |
| Type | | Number of
Contracts
Long (Short) | | | Expiration Date | | Current Value | | | Unrealized
Gain (Loss) | |
Canadian 3-Month Bankers Acceptance | | | (115 | ) | | March 2017 | | $ | (21,247,950 | ) | | $ | (7,931 | ) |
Canadian Dollar | | | (22 | ) | | December 2016 | | | (1,639,550 | ) | | | 476 | |
Cocoa | | | 81 | | | December 2016 | | | 2,242,639 | | | | (115,490 | ) |
Coffee | | | 33 | | | March 2017 | | | 2,073,431 | | | | (8,157 | ) |
Copper | | | 75 | | | December 2016 | | | 8,232,575 | | | | 95,681 | |
Copper | | | (134 | ) | | December 2016 | | | (16,244,150 | ) | | | (590,885 | ) |
Corn | | | (158 | ) | | December 2016 | | | (2,802,525 | ) | | | (159,476 | ) |
Cotton No. 2 | | | 29 | | | March 2017 | | | 1,005,865 | | | | (4,672 | ) |
Crude Oil | | | (83 | ) | | November 2016 | | | (3,889,380 | ) | | | 263,290 | |
DAX Index | | | 70 | | | December 2016 | | | 20,511,189 | | | | 139,554 | |
DJIA E-Mini Index | | | (83 | ) | | December 2016 | | | (7,495,730 | ) | | | 26,350 | |
Euro FX | | | (57 | ) | | December 2016 | | | (7,828,237 | ) | | | (28,834 | ) |
Euro Stoxx 50 Index | | | 29 | | | December 2016 | | | 971,915 | | | | (1,759 | ) |
Euro Stoxx 50 Index | | | (151 | ) | | December 2016 | | | (5,060,662 | ) | | | (22,233 | ) |
Eurodollars | | | (1,336 | ) | | September 2017 | | | (330,376,100 | ) | | | 114,558 | |
Eurodollars | | | (646 | ) | | December 2017 | | | (159,658,900 | ) | | | 66,957 | |
FTSE 100 Index | | | 382 | | | December 2016 | | | 32,397,805 | | | | (68,114 | ) |
FTSE/MIB Index | | | (74 | ) | | December 2016 | | | (6,948,715 | ) | | | (211,543 | ) |
Gasoline RBOB | | | 39 | | | November 2016 | | | 2,325,141 | | | | (97,410 | ) |
Gold 100 Oz | | | 36 | | | December 2016 | | | 4,583,160 | | | | (2,779 | ) |
Gold 100 oz | | | (73 | ) | | December 2016 | | | (9,293,630 | ) | | | (69,111 | ) |
Hard Red Winter Wheat | | | (62 | ) | | December 2016 | | | (1,285,725 | ) | | | 68,375 | |
Japan 10 Year Government Bonds | | | 14 | | | December 2016 | | | 20,253,075 | | | | 59,664 | |
Japan 10 Year Government Bonds | | | (21 | ) | | December 2016 | | | (30,379,613 | ) | | | 21,580 | |
Japanese Yen | | | 16 | | | December 2016 | | | 1,909,100 | | | | 5,595 | |
Low Sulphur Gas Oil | | | 35 | | | December 2016 | | | 1,544,375 | | | | (94,436 | ) |
MSCI Singapore Index | | | (87 | ) | | November 2016 | | | (1,927,288 | ) | | | 18,652 | |
NASDAQ 100 E-Mini Index | | | 266 | | | December 2016 | | | 25,518,710 | | | | (195,162 | ) |
Natural Gas | | | 146 | | | November 2016 | | | 4,417,960 | | | | (360,639 | ) |
Nikkei 225 Index | | | 6 | | | December 2016 | | | 997,807 | | | | 14,864 | |
Nikkei 225 Index | | | (28 | ) | | December 2016 | | | (4,656,432 | ) | | | (51,783 | ) |
NY Harbor ULSD | | | 6 | | | November 2016 | | | 378,983 | | | | (16,659 | ) |
OMXS 30 Index | | | 560 | | | November 2016 | | | 8,957,557 | | | | (40,238 | ) |
Primary Aluminum | | | 161 | | | December 2016 | | | 6,977,338 | | | | 167,304 | |
Primary Aluminum | | | (65 | ) | | December 2016 | | | (2,816,937 | ) | | | (159,485 | ) |
Russell 2000 Mini Index | | | 100 | | | December 2016 | | | 11,893,000 | | | | (448,489 | ) |
S&P 500 E-Mini Index | | | (300 | ) | | December 2016 | | | (31,801,500 | ) | | | 343,262 | |
S&P Toronto Stock Exchange 60 Index | | | 51 | | | December 2016 | | | 6,589,354 | | | | (4,693 | ) |
SPI 200 Index | | | (150 | ) | | December 2016 | | | (15,090,383 | ) | | | 356,653 | |
Sugar No. 11 | | | 81 | | | February 2017 | | | 1,956,830 | | | | 116,808 | |
Swiss Market Index | | | (49 | ) | | December 2016 | | | (1,548,890 | ) | | | (42,509 | ) |
Topix Index | | | 139 | | | December 2016 | | | 18,490,035 | | | | 453,063 | |
Topix Index | | | (13 | ) | | December 2016 | | | (1,729,284 | ) | | | (103,835 | ) |
U.S. Dollar Index Future | | | 62 | | | December 2016 | | | 6,102,164 | | | | 95,768 | |
Wheat | | | (83 | ) | | December 2016 | | | (1,727,437 | ) | | | 106,020 | |
Zinc | | | 109 | | | December 2016 | | | 6,698,050 | | | | 416,982 | |
Zinc | | | (44 | ) | | December 2016 | | | (2,703,800 | ) | | | (155,852 | ) |
30 Day Federal Funds Futures | | | (75 | ) | | December 2016 | | | (31,096,237 | ) | | | (2,859 | ) |
3 Month Bank Bills | | | 74 | | | March 2017 | | | 56,054,056 | | | | (4,853 | ) |
| | |
| 28 | | The accompanying notes are an integral part of these financial statements. |
GOLDMAN SACHS MULTI-MANAGER ALTERNATIVES FUND
|
| ADDITIONAL INVESTMENT INFORMATION (continued) |
FUTURES CONTRACTS (continued)
| | | | | | | | | | | | | | | | |
| Type | | Number of
Contracts
Long (Short) | | | Expiration Date | | | Current Value | | | Unrealized
Gain (Loss) | |
3 Month Euribor Interest Rate | | | (233 | ) | | | September 2017 | | | $ | (64,119,799 | ) | | $ | 44,494 | |
3 Month Euribor Interest Rate | | | 322 | | | | December 2017 | | | | 88,607,493 | | | | (54,416 | ) |
3 Month Euroswiss | | | (20 | ) | | | March 2017 | | | | (5,091,708 | ) | | | 2,175 | |
3 Month Euroyen Future | | | (5 | ) | | | March 2017 | | | | (1,191,416 | ) | | | 887 | |
3 Month Sterling Interest Rate | | | 15 | | | | September 2017 | | | | 2,284,444 | | | | (689 | ) |
3 Month Sterling Interest Rate | | | 484 | | | | December 2017 | | | | 73,689,187 | | | | (125,207 | ) |
5 Year German Euro-Bobl | | | 338 | | | | December 2016 | | | | 48,647,001 | | | | (185,816 | ) |
5 Year German Euro-Bobl | | | (567 | ) | | | December 2016 | | | | (81,606,064 | ) | | | 277,781 | |
10 Year German Euro-Bund | | | 122 | | | | December 2016 | | | | 21,718,704 | | | | (192,942 | ) |
10 Year German Euro-Bund | | | (148 | ) | | | December 2016 | | | | (26,347,280 | ) | | | 272,617 | |
2 Year German Euro-Schatz | | | 338 | | | | December 2016 | | | | 41,549,013 | | | | (17,489 | ) |
2 Year German Euro-Schatz | | | (178 | ) | | | December 2016 | | | | (21,880,841 | ) | | | 11,308 | |
10 Year Mini Japanese Government Bonds | | | 12 | | | | December 2016 | | | | 1,735,749 | | | | 424 | |
10 Year U.K. Long Gilt | | | 280 | | | | December 2016 | | | | 42,956,549 | | | | (983,231 | ) |
10 Year U.K. Long Gilt | | | (100 | ) | | | December 2016 | | | | (15,341,625 | ) | | | 2,209 | |
2 Year U.S. Treasury Notes | | | (741 | ) | | | December 2016 | | | | (161,642,204 | ) | | | 46,212 | |
5 Year U.S. Treasury Notes | | | 368 | | | | December 2016 | | | | 44,453,250 | | | | (968 | ) |
5 Year U.S. Treasury Notes | | | (419 | ) | | | December 2016 | | | | (50,613,891 | ) | | | (8,739 | ) |
10 Year U.S. Treasury Notes | | | 1,236 | | | | December 2016 | | | | 160,216,500 | | | | (921,030 | ) |
20 Year U.S. Treasury Bonds | | | 219 | | | | December 2016 | | | | 35,635,406 | | | | (508,115 | ) |
| TOTAL | | | | | | | | | | | | | | $ | (2,538,189 | ) |
SWAP CONTRACTS — At October 31, 2016, the Fund had the following swap contracts:
OVER THE COUNTER CREDIT DEFAULT SWAP CONTRACTS
| | | | | | | | | | | | | | | | | | | | | | | | | | |
| | | | | | | | | | | | | | | | | Market Value | |
| Counterparty | | Referenced
Obligation(a) | | Notional
Amount
(000s) | | | Rates Received
(Paid) | | | Termination
Date | | | Credit
Spread at
October 31,
2016(a) | | | Upfront
Payments
Made (Received) | | | Unrealized
Gain (Loss) | |
Protection Purchased: | | | | | | | | | | | | | | | | | | | | | | | | | | |
Bank of America Securities LLC | | Macy’s, Inc., 7.450%, 07/15/17 | | $ | 95 | | | | (1.000 | )% | | | 06/20/21 | | | | 2.170 | % | | $ | 6,054 | | | $ | (3,185 | ) |
Barclays Bank PLC | | BHP Billiton, Ltd., 6.500%, 04/01/19 | | | 625 | | | | (1.000 | ) | | | 12/20/20 | | | | 0.853 | | | | 25,634 | | | | (30,042 | ) |
| | Nordstrom, Inc., 6.950%, 03/15/28 | | | 1,318 | | | | (1.000 | ) | | | 12/20/20 | | | | 1.154 | | | | 16,437 | | | | (9,843 | ) |
| | Nordstrom, Inc., 6.950%, 03/15/28 | | | 47 | | | | (1.000 | ) | | | 12/20/20 | | | | 1.154 | | | | 1,136 | | | | (902 | ) |
| | Macy’s, Inc., 7.450%, 07/15/17 | | | 55 | | | | (1.000 | ) | | | 06/20/21 | | | | 1.714 | | | | 3,558 | | | | (1,897 | ) |
JPMorgan Securities, Inc. | | Macy’s, Inc., 7.450%, 07/15/17 | | | 1,285 | | | | (1.000 | ) | | | 12/20/20 | | | | 1.457 | | | | 68,397 | | | | (46,600 | ) |
| | Nordstrom, Inc., 6.950%, 03/15/28 | | | 555 | | | | (1.000 | ) | | | 12/20/20 | | | | 1.154 | | | | 11,547 | | | | (8,770 | ) |
| | Nordstrom, Inc., 6.950%, 03/15/28 | | | 265 | | | | (1.000 | ) | | | 06/20/21 | | | | 1.382 | | | | 7,907 | | | | (3,730 | ) |
| | Macy’s, Inc., 7.450%, 07/15/17 | | | 60 | | | | (1.000 | ) | | | 06/20/21 | | | | 1.714 | | | | 3,360 | | | | (1,548 | ) |
| | Rio Tinto Ltd., 6.500%, 07/15/18 | | | 290 | | | | (1.000 | ) | | | 06/20/21 | | | | 1.080 | | | | 10,419 | | | | (9,726 | ) |
| | Rio Tinto Ltd., 6.500%, 07/15/18 | | | 1,200 | | | | (1.000 | ) | | | 06/20/21 | | | | 1.080 | | | | 53,250 | | | | (50,382 | ) |
| | | BHP Billiton, Ltd., 6.500%, 04/01/19 | | | 850 | | | | (1.000 | ) | | | 06/20/21 | | | | 0.980 | | | | 30,638 | | | | (32,400 | ) |
| TOTAL | | | | | | | | | | | | | | | | | | | | $ | 238,337 | | | $ | (199,025 | ) |
| | (a) | | Credit spread on the Referenced Obligation, together with the term of the swap contract, are indicators of payment/performance risk. The likelihood of a credit event occurring which would require the Fund or its counterparty to make a payment or otherwise be required to perform under the swap contract is generally greater as the credit spread and the term of the swap contract increase. |
| | |
| The accompanying notes are an integral part of these financial statements. | | 29 |
GOLDMAN SACHS MULTI-MANAGER ALTERNATIVES FUND
Consolidated Schedule of Investments (continued)
October 31, 2016
|
| ADDITIONAL INVESTMENT INFORMATION (continued) |
OVER THE COUNTER TOTAL RETURN SWAPS#
| | | | | | | | | | | | | | | | |
| | | | | | | | | | Market Value | |
| Counterparty | | Notional
Amount
(000s) | | | Reference Security | | Termination Date | | Upfront Payments Made (Received) | | | Unrealized
Gain (Loss) | |
JPMorgan Securities, Inc. | | $ | 4 | | | 3M Co | | 7/6/2018 - 8/9/2018 | | $ | — | | | $ | (16,367 | ) |
| | | 1 | | | ABC-Mart Inc | | 8/20/2018 - 9/18/2018 | | | — | | | | (1,150 | ) |
| | | 106 | | | Abertis Infraestructuras SA | | 7/2/2018 - 10/9/2018 | | | — | | | | (23,591 | ) |
| | | 16 | | | ABIOMED Inc | | 6/29/2018 - 8/9/2018 | | | — | | | | (366,185 | ) |
| | | 4 | | | Acacia Communications Inc | | 8/20/2018 - 10/31/2018 | | | — | | | | 73,160 | |
| | | 39 | | | Acadia Healthcare Co Inc | | 7/2/2018 - 10/31/2018 | | | — | | | | 312,073 | |
| | | 16 | | | ACADIA Pharmaceuticals Inc | | 6/29/2018 - 10/19/2018 | | | — | | | | 37,323 | |
| | | 3 | | | Acciona SA | | 10/9/2018 | | | — | | | | 5,368 | |
| | | 241 | | | Acom Co Ltd | | 7/27/2018 - 10/11/2018 | | | — | | | | (39,624 | ) |
| | | 54 | | | ACS Actividades de Construccion y Servicios SA | | 7/6/2018 - 7/27/2018 | | | — | | | | 59,356 | |
| | | 48 | | | Activision Blizzard Inc | | 6/29/2018 - 8/9/2018 | | | — | | | | 7,783 | |
| | | 5 | | | Acuity Brands Inc | | 7/2/2018 - 10/31/2018 | | | — | | | | 112,717 | |
| | | 50 | | | Admiral Group PLC | | 6/29/2018 - 10/31/2018 | | | — | | | | 47,511 | |
| | | 9 | | | Advance Auto Parts Inc | | 9/14/2018 - 10/31/2018 | | | — | | | | 64,457 | |
| | | 48 | | | Advanced Micro Devices Inc | | 6/29/2018 - 8/17/2018 | | | — | | | | 28,452 | |
| | | 8 | | | AerCap Holdings NV | | 9/14/2018 - 10/9/2018 | | | — | | | | 4,509 | |
| | | 27 | | | AGCO Corp | | 6/29/2018 - 9/4/2018 | | | — | | | | (25,355 | ) |
| | | 1 | | | Ageas | | 10/19/2018 | | | — | | | | 28 | |
| | | 7 | | | Agilent Technologies Inc | | 6/29/2018 - 10/9/2018 | | | — | | | | 12,493 | |
| | | 57 | | | AGL Energy Ltd | | 8/7/2018 - 9/14/2018 | | | — | | | | 11,062 | |
| | | 10 | | | Airbus Group SE | | 9/27/2018 | | | — | | | | (15,710 | ) |
| | | 15 | | | Ajinomoto Co Inc | | 11/1/2018 - 11/1/2018 | | | — | | | | (2,594 | ) |
| | | 11 | | | Akamai Technologies Inc | | 9/4/2018 | | | — | | | | 171,242 | |
| | | 68 | | | Akorn Inc | | 6/29/2018 - 9/4/2018 | | | — | | | | (205,388 | ) |
| | | 20 | | | Akzo Nobel NV | | 6/29/2018 - 7/26/2018 | | | — | | | | (31,962 | ) |
| | | 5 | | | Albemarle Corp | | 9/27/2018 | | | — | | | | (12,683 | ) |
| | | 16 | | | Alfresa Holdings Corp | | 7/27/2018 - 9/4/2018 | | | — | | | | 6,758 | |
| | | 7 | | | Align Technology Inc | | 6/29/2018 - 8/9/2018 | | | — | | | | (30,981 | ) |
| | | 7 | | | Alimentation Couche-Tard Inc | | 10/9/2018 | | | — | | | | (8,122 | ) |
| | | 66 | | | Ally Financial Inc | | 9/4/2018 - 10/19/2018 | | | — | | | | (92,372 | ) |
| | | 1 | | | Alphabet Inc | | 8/9/2018 | | | — | | | | 1,377 | |
| | | 10 | | | Altria Group Inc | | 6/29/2018 - 8/9/2018 | | | — | | | | 34,918 | |
| | | 1,152 | | | Alumina Ltd | | 7/16/2018 - 9/14/2018 | | | — | | | | (122,350 | ) |
| | | — | * | | Amazon.com Inc | | 10/31/2018 | | | — | | | | (7,707 | ) |
| | | 13 | | | AMC Entertainment Holdings Inc | | 10/31/2018 | | | — | | | | (5,708 | ) |
| | | 158 | | | Amcor Ltd/Australia | | 9/4/2018 - 10/31/2018 | | | — | | | | 49,168 | |
| | | 2 | | | AMERCO | | 9/4/2018 - 9/14/2018 | | | — | | | | 24,399 | |
| | | 110 | | | American Eagle Outfitters Inc | | 7/16/2018 - 8/9/2018 | | | — | | | | (74,244 | ) |
| | | 3 | | | Amphenol Corp | | 10/31/2018 | | | — | | | | (1,180 | ) |
| | | 10 | | | ANDRITZ AG | | 6/29/2018 - 7/16/2018 | | | — | | | | 10,604 | |
| | | 28 | | | Anglo American PLC | | 6/29/2018 - 10/31/2018 | | | — | | | | (61,587 | ) |
| | | 267 | | | Antofagasta PLC | | 6/29/2018 - 10/31/2018 | | | — | | | | (25,387 | ) |
| | | 10 | | | AO Smith Corp | | 10/9/2018 - 10/31/2018 | | | — | | | | (42,241 | ) |
| | | 6 | | | Aon PLC | | 9/4/2018 - 9/14/2018 | | | — | | | | (2,676 | ) |
| | | — | * | | AP Moller - Maersk A/S | | 10/19/2018 | | | — | | | | (26,703 | ) |
| | | 16 | | | Apache Corp | | 9/4/2018 - 9/27/2018 | | | — | | | | 47,580 | |
| | | 6 | | | APERAM SA | | 8/6/2018 - 10/19/2018 | | | — | | | | 1,980 | |
| | | 3 | | | Apple Inc | | 8/9/2018 | | | — | | | | 10,253 | |
| | |
| 30 | | The accompanying notes are an integral part of these financial statements. |
GOLDMAN SACHS MULTI-MANAGER ALTERNATIVES FUND
|
| ADDITIONAL INVESTMENT INFORMATION (continued) |
OVER THE COUNTER TOTAL RETURN SWAPS (continued)#
| | | | | | | | | | | | | | | | |
| | | | | | | | | | Market Value | |
| Counterparty | | Notional
Amount
(000s) | | | Reference Security | | Termination Date | | Upfront Payments Made (Received) | | | Unrealized
Gain (Loss) | |
JPMorgan Securities, Inc. (continued) | | $ | 43 | | | Aqua America Inc | | 10/9/2018 - 10/19/2018 | | $ | — | | | $ | (47,477 | ) |
| | | 119 | | | ArcelorMittal | | 6/29/2018 - 10/19/2018 | | | — | | | | (66,628 | ) |
| | | 41 | | | Aristocrat Leisure Ltd | | 6/29/2018 - 7/26/2018 | | | — | | | | (11,045 | ) |
| | | 4 | | | Arkema SA | | 6/29/2018 - 7/26/2018 | | | — | | | | 14,848 | |
| | | 198 | | | Asahi Glass Co Ltd | | 7/2/2018 - 10/22/2018 | | | — | | | | 119,381 | |
| | | 30 | | | Ashtead Group PLC | | 9/14/2018 - 10/19/2018 | | | — | | | | 17,188 | |
| | | 14 | | | Asics Corp | | 7/2/2018 - 10/11/2018 | | | — | | | | (13,814 | ) |
| | | 43 | | | Aspen Technology Inc | | 9/4/2018 | | | — | | | | 134,805 | |
| | | 98 | | | Assa Abloy AB | | 6/29/2018 - 10/31/2018 | | | — | | | | 147,427 | |
| | | 27 | | | Associated British Foods PLC | | 10/19/2018 | | | — | | | | 4,006 | |
| | | 123 | | | Astellas Pharma Inc | | 7/2/2018 - 9/6/2018 | | | — | | | | 2,586 | |
| | | 15 | | | AT&T Inc | | 6/29/2018 - 8/9/2018 | | | — | | | | (31,324 | ) |
| | | 18 | | | Atco Ltd/Canada | | 10/9/2018 | | | — | | | | 6,981 | |
| | | 24 | | | Atlas Copco AB | | 6/29/2018 - 8/9/2018 | | | — | | | | 24,518 | |
| | | 39 | | | Atlassian Corp PLC | | 6/29/2018 - 9/27/2018 | | | — | | | | (44,952 | ) |
| | | 2 | | | Atos SE | | 6/29/2018 - 7/26/2018 | | | — | | | | (2,012 | ) |
| | | 80 | | | Aurizon Holdings Ltd | | 10/9/2018 | | | — | | | | 10,113 | |
| | | 18 | | | Avery Dennison Corp | | 7/26/2018 - 10/19/2018 | | | — | | | | (117,641 | ) |
| | | 28 | | | Avis Budget Group Inc | | 8/17/2018 - 10/9/2018 | | | — | | | | 2,167 | |
| | | 103 | | | Aviva PLC | | 6/29/2018 - 7/26/2018 | | | — | | | | 9,035 | |
| | | 15 | | | B&G Foods Inc | | 7/16/2018 - 10/9/2018 | | | — | | | | 80,245 | |
| | | 79 | | | Banco Bilbao Vizcaya Argentaria SA | | 10/19/2018 | | | — | | | | (72,314 | ) |
| | | 754 | | | Banco Popular Espanol SA | | 8/10/2018 - 10/19/2018 | | | — | | | | 80,414 | |
| | | 56 | | | Banco Santander SA | | 7/2/2018 | | | — | | | | (27,992 | ) |
| | | 56 | | | Banco Santander SA | | 10/22/2018 | | | — | | | | (3,105 | ) |
| | | 23 | | | Bandai Namco Holdings Inc | | 8/13/2018 - 9/28/2018 | | | — | | | | 11,831 | |
| | | 330 | | | Bank Leumi Le-Israel BM | | 6/29/2018 - 7/27/2018 | | | — | | | | (15,171 | ) |
| | | 10 | | | Bank of Montreal | | 7/6/2018 - 8/9/2018 | | | — | | | | 9,363 | |
| | | 27 | | | Bank of New York Mellon Corp/The | | 6/29/2018 - 7/26/2018 | | | — | | | | 88,716 | |
| | | 17 | | | Bank of the Ozarks Inc | | 10/9/2018 | | | — | | | | 25,085 | |
| | | 17 | | | Barrick Gold Corp | | 10/31/2018 | | | — | | | | 16,819 | |
| | | 405 | | | BBA Aviation PLC | | 10/9/2018 - 10/19/2018 | | | — | | | | (17,586 | ) |
| | | 14 | | | BCE Inc | | 6/29/2018 - 8/9/2018 | | | — | | | | 16,092 | |
| | | 13 | | | Bed Bath & Beyond Inc | | 6/29/2018 - 10/9/2018 | | | — | | | | (23,870 | ) |
| | | 26 | | | Bellway PLC | | 10/9/2018 - 10/31/2018 | | | — | | | | 18,085 | |
| | | 41 | | | Berkeley Group Holdings PLC | | 7/26/2018 - 10/31/2018 | | | — | | | | 25,205 | |
| | | 3 | | | Berkshire Hathaway Inc | | 7/6/2018 - 8/9/2018 | | | — | | | | (2,159 | ) |
| | | 18 | | | Best Buy Co Inc | | 6/29/2018 - 7/26/2018 | | | — | | | | (15,609 | ) |
| | | 239 | | | Bezeq The Israeli Telecommunication Corp Ltd | | 8/10/2018 | | | — | | | | (5,974 | ) |
| | | 101 | | | BHP Billiton Ltd | | 6/29/2018 - 10/31/2018 | | | — | | | | (37,136 | ) |
| | | 12 | | | BillerudKorsnas AB | | 9/14/2018 - 9/27/2018 | | | — | | | | (9,930 | ) |
| | | 2 | | | Biogen Inc | | 6/29/2018 - 9/27/2018 | | | — | | | | (22,691 | ) |
| | | 22 | | | Black Hills Corp | | 7/16/2018 - 9/4/2018 | | | — | | | | (88,333 | ) |
| | | 20 | | | Blackbaud Inc | | 6/29/2018 - 10/19/2018 | | | — | | | | 52,691 | |
| | | 18 | | | BLACKBERRY LTD | | 7/2/2018 - 7/16/2018 | | | — | | | | 9,774 | |
| | | 20 | | | BOK Financial Corp | | 6/29/2018 - 7/26/2018 | | | — | | | | (22,014 | ) |
| | |
| The accompanying notes are an integral part of these financial statements. | | 31 |
GOLDMAN SACHS MULTI-MANAGER ALTERNATIVES FUND
Consolidated Schedule of Investments (continued)
October 31, 2016
|
| ADDITIONAL INVESTMENT INFORMATION (continued) |
OVER THE COUNTER TOTAL RETURN SWAPS (continued)#
| | | | | | | | | | | | | | | | |
| | | | | | | | | | Market Value | |
| Counterparty | | Notional
Amount
(000s) | | | Reference Security | | Termination Date | | Upfront Payments Made (Received) | | | Unrealized
Gain (Loss) | |
JPMorgan Securities, Inc. (continued) | | $ | 50 | | | Boliden AB | | 6/29/2018 - 9/27/2018 | | $ | — | | | $ | (5,845 | ) |
| | | 1,407 | | | Bombardier Inc | | 7/5/2018 - 10/19/2018 | | | — | | | | 7,715 | |
| | | 396 | | | Booker Group PLC | | 7/26/2018 - 8/6/2018 | | | — | | | | 22,304 | |
| | | 10 | | | Boskalis Westminster | | 6/29/2018 - 7/26/2018 | | | — | | | | (23,339 | ) |
| | | — | * | | bpost SA | | 7/5/2018 | | | — | | | | (104 | ) |
| | | 135 | | | Brambles Ltd | | 7/26/2018 - 9/14/2018 | | | — | | | | (37,441 | ) |
| | | 3 | | | Brembo SpA | | 7/5/2018 | | | — | | | | 14,933 | |
| | | 17 | | | Bristol-Myers Squibb Co | | 6/29/2018 - 7/26/2018 | | | — | | | | (21,638 | ) |
| | | 10 | | | British American Tobacco PLC | | 7/27/2018 - 9/4/2018 | | | — | | | | 22,804 | |
| | | 12 | | | Broadcom Ltd | | 6/29/2018 - 8/9/2018 | | | — | | | | 2,339 | |
| | | 7 | | | Brookfield Asset Management Inc | | 10/31/2018 | | | — | | | | 2,548 | |
| | | 86 | | | Bruker Corp | | 7/6/2018 - 9/27/2018 | | | — | | | | (40,976 | ) |
| | | 8 | | | Brunswick Corp/DE | | 10/31/2018 | | | — | | | | (27,516 | ) |
| | | 69 | | | BT Group PLC | | 8/9/2018 | | | — | | | | (7,161 | ) |
| | | 183 | | | BTG PLC | | 6/29/2018 - 8/17/2018 | | | — | | | | (59,759 | ) |
| | | 42 | | | Bunzl PLC | | 7/16/2018 - 10/9/2018 | | | — | | | | 60,531 | |
| | | 36 | | | Burberry Group PLC | | 7/5/2018 - 9/14/2018 | | | — | | | | (10,519 | ) |
| | | 22 | | | Buzzi Unicem SpA | | 6/29/2018 - 7/16/2018 | | | — | | | | 1,275 | |
| | | 16 | | | BWX Technologies Inc | | 7/26/2018 - 10/31/2018 | | | — | | | | 18,975 | |
| | | 1 | | | Cable One Inc | | 7/16/2018 - 9/4/2018 | | | — | | | | (7,114 | ) |
| | | 37 | | | Cabot Corp | | 8/6/2018 - 10/31/2018 | | | — | | | | 32,287 | |
| | | 30 | | | Cadence Design Systems Inc | | 6/29/2018 - 7/16/2018 | | | — | | | | (5,358 | ) |
| | | 76 | | | CAE Inc | | 10/31/2018 | | | — | | | | 12,982 | |
| | | 237 | | | CaixaBank SA | | 7/2/2018 - 8/10/2018 | | | — | | | | (101,960 | ) |
| | | 23 | | | Calbee Inc | | 11/1/2018 | | | — | | | | 16,762 | |
| | | 4 | | | Cameco Corp | | 7/6/2018 | | | — | | | | 127 | |
| | | 6 | | | Canadian Imperial Bank of Commerce/Canada | | 6/29/2018 - 8/9/2018 | | | — | | | | 8,752 | |
| | | 11 | | | Canadian Pacific Railway Ltd | | 6/29/2018 - 10/31/2018 | | | — | | | | 81,177 | |
| | | 23 | | | Canon Inc | | 7/6/2018 - 8/10/2018 | | | — | | | | (3,749 | ) |
| | | 222 | | | Capita PLC | | 7/16/2018 - 10/19/2018 | | | — | | | | (53,700 | ) |
| | | 10 | | | Cargotec Oyj | | 8/17/2018 | | | — | | | | (46,527 | ) |
| | | 36 | | | CarMax Inc | | 6/29/2018 - 10/19/2018 | | | — | | | | 57,125 | |
| | | 38 | | | Casio Computer Co Ltd | | 9/4/2018 - 10/22/2018 | | | — | | | | 6,650 | |
| | | 7 | | | CCL Industries Inc | | 9/4/2018 - 10/31/2018 | | | — | | | | 38,698 | |
| | | 26 | | | CenterPoint Energy Inc | | 6/29/2018 - 10/19/2018 | | | — | | | | 11,919 | |
| | | 10 | | | Central Japan Railway Co | | 7/2/2018 - 10/22/2018 | | | — | | | | 50,176 | |
| | | 497 | | | Centrica PLC | | 6/29/2018 - 10/19/2018 | | | — | | | | 56,047 | |
| | | 31 | | | CenturyLink Inc | | 6/29/2018 - 10/19/2018 | | | — | | | | (30,149 | ) |
| | | 10 | | | Cerner Corp | | 9/4/2018 | | | — | | | | (24,220 | ) |
| | | 62 | | | CF Industries Holdings Inc | | 7/2/2018 - 10/31/2018 | | | — | | | | (55,234 | ) |
| | | 34 | | | CGI Group Inc | | 6/29/2018 - 10/19/2018 | | | — | | | | 25,668 | |
| | | 41 | | | Challenger Ltd/Australia | | 10/31/2018 | | | — | | | | 8,674 | |
| | | 14 | | | Charles River Laboratories International Inc | | 6/29/2018 - 7/26/2018 | | | — | | | | (66,997 | ) |
| | | 8 | | | Charter Communications Inc | | 6/29/2018 - 8/9/2018 | | | — | | | | 56,130 | |
| | | 29 | | | Chemical Financial Corp | | 9/14/2018 - 10/9/2018 | | | — | | | | 41,064 | |
| | | 46 | | | Cheniere Energy Inc | | 6/29/2018 - 10/31/2018 | | | — | | | | 180,907 | |
| | |
| 32 | | The accompanying notes are an integral part of these financial statements. |
GOLDMAN SACHS MULTI-MANAGER ALTERNATIVES FUND
|
| ADDITIONAL INVESTMENT INFORMATION (continued) |
OVER THE COUNTER TOTAL RETURN SWAPS (continued)#
| | | | | | | | | | | | | | | | |
| | | | | | | | | | Market Value | |
| Counterparty | | Notional
Amount
(000s) | | | Reference Security | | Termination Date | | Upfront Payments Made (Received) | | | Unrealized
Gain (Loss) | |
JPMorgan Securities, Inc. (continued) | | $ | 135 | | | Chesapeake Energy Corp | | 7/26/2018 | | $ | — | | | $ | (105,803 | ) |
| | | 6 | | | Chevron Corp | | 7/6/2018 - 10/19/2018 | | | — | | | | 17,830 | |
| | | 34 | | | Chicago Bridge & Iron Co NV | | 7/2/2018 - 8/17/2018 | | | — | | | | (139,906 | ) |
| | | 3 | | | Chipotle Mexican Grill Inc | | 7/26/2018 - 8/17/2018 | | | — | | | | 185,814 | |
| | | — | * | | Chocoladefabriken Lindt & Spruengli AG | | 6/29/2018 - 10/31/2018 | | | — | | | | 47,283 | |
| | | 16 | | | Chr Hansen Holding A/S | | 6/29/2018 - 9/4/2018 | | | — | | | | (35,066 | ) |
| | | 7 | | | Christian Dior SE | | 7/26/2018 - 9/27/2018 | | | — | | | | 44,346 | |
| | | 87 | | | Chubu Electric Power Co Inc | | 7/27/2018 - 10/11/2018 | | | — | | | | 79,014 | |
| | | 28 | | | Chugai Pharmaceutical Co Ltd | | 8/8/2018 - 11/1/2018 | | | — | | | | 28,907 | |
| | | 106 | | | Chugoku Electric Power Co Inc/The | | 7/2/2018 - 8/8/2018 | | | — | | | | (13,346 | ) |
| | | 22 | | | Cie Financiere Richemont SA | | 6/29/2018 - 7/26/2018 | | | — | | | | 30,056 | |
| | | — | * | | CIMIC Group Ltd | | 10/31/2018 | | | — | | | | (80 | ) |
| | | 3 | | | Cinemark Holdings Inc | | 10/31/2018 | | | — | | | | (258 | ) |
| | | 55 | | | Citizens Financial Group Inc | | 6/29/2018 - 7/26/2018 | | | — | | | | 65,458 | |
| | | 23 | | | Citrix Systems Inc | | 6/29/2018 - 8/9/2018 | | | — | | | | 32,526 | |
| | | 3 | | | Clorox Co/The | | 10/9/2018 | | | — | | | | 3,400 | |
| | | 26 | | | CLP Holdings Ltd | | 6/29/2018 | | | — | | | | 7,924 | |
| | | 15 | | | CNA Financial Corp | | 10/9/2018 | | | — | | | | 12,477 | |
| | | 29 | | | CNH Industrial NV | | 7/5/2018 | | | — | | | | (11,911 | ) |
| | | 532 | | | Cobham PLC | | 8/6/2018 - 10/9/2018 | | | — | | | | 143,656 | |
| | | 206 | | | Coca-Cola Amatil Ltd | | 7/16/2018 - 10/9/2018 | | | — | | | | (38,385 | ) |
| | | 15 | | | Coca-Cola Co/The | | 6/29/2018 - 8/9/2018 | | | — | | | | 8,926 | |
| | | 34 | | | Coca-Cola European Partners PLC | | 7/26/2018 | | | — | | | | (17,646 | ) |
| | | 59 | | | Coca-Cola HBC AG | | 6/29/2018 - 7/26/2018 | | | — | | | | (37,051 | ) |
| | | 47 | | | Coca-Cola West Co Ltd | | 7/2/2018 - 7/27/2018 | | | — | | | | 69,133 | |
| | | 9 | | | Cochlear Ltd | | 7/16/2018 - 9/27/2018 | | | — | | | | (55,722 | ) |
| | | 12 | | | Coloplast A/S | | 6/29/2018 - 10/19/2018 | | | — | | | | (17,980 | ) |
| | | 20 | | | Colruyt SA | | 7/16/2018 - 7/26/2018 | | | — | | | | 18,813 | |
| | | 9 | | | Comcast Corp | | 6/29/2018 - 9/27/2018 | | | — | | | | (28,788 | ) |
| | | 11 | | | Commonwealth Bank of Australia | | 8/9/2018 | | | — | | | | (3,589 | ) |
| | | 2 | | | Concho Resources Inc | | 7/26/2018 | | | — | | | | 25,781 | |
| | | 4 | | | Constellation Software Inc/Canada | | 6/29/2018 - 10/31/2018 | | | — | | | | 84,941 | |
| | | 12 | | | Core Laboratories NV | | 6/29/2018 - 10/31/2018 | | | — | | | | 168,767 | |
| | | — | * | | Costco Wholesale Corp | | 6/29/2018 | | | — | | | | (325 | ) |
| | | 3 | | | Cotiviti Holdings Inc | | 9/14/2018 | | | — | | | | (9,642 | ) |
| | | 80 | | | Coty Inc | | 10/19/2018 - 10/31/2018 | | | — | | | | 25,870 | |
| | | 3 | | | Crane Co | | 10/31/2018 | | | — | | | | 1,449 | |
| | | 6 | | | Credit Acceptance Corp | | 6/29/2018 - 10/19/2018 | | | — | | | | 45,778 | |
| | | 11 | | | Credit Saison Co Ltd | | 8/22/2018 | | | — | | | | (6,409 | ) |
| | | 93 | | | Crescent Point Energy Corp | | 6/29/2018 - 10/31/2018 | | | — | | | | (96,089 | ) |
| | | 67 | | | Crown Resorts Ltd | | 10/31/2018 | | | — | | | | 14,243 | |
| | | 2 | | | CSL Ltd | | 7/5/2018 | | | — | | | | (6,208 | ) |
| | | 33 | | | CSRA Inc | | 7/2/2018 - 7/26/2018 | | | — | | | | 28,099 | |
| | | 20 | | | Curtiss-Wright Corp | | 6/29/2018 - 10/19/2018 | | | — | | | | 49,472 | |
| | |
| The accompanying notes are an integral part of these financial statements. | | 33 |
GOLDMAN SACHS MULTI-MANAGER ALTERNATIVES FUND
Consolidated Schedule of Investments (continued)
October 31, 2016
|
| ADDITIONAL INVESTMENT INFORMATION (continued) |
OVER THE COUNTER TOTAL RETURN SWAPS (continued)#
| | | | | | | | | | | | | | | | |
| | | | | | | | | | Market Value | |
| Counterparty | | Notional
Amount
(000s) | | | Reference Security | | Termination Date | | Upfront Payments Made (Received) | | | Unrealized
Gain (Loss) | |
JPMorgan Securities, Inc. (continued) | | $ | 56 | | | CyberAgent Inc | | 7/2/2018 - 10/3/2018 | | $ | — | | | $ | 12,407 | |
| | | 41 | | | Cypress Semiconductor Corp | | 7/27/2018 - 8/9/2018 | | | — | | | | 38,585 | |
| | | 126 | | | Dai Nippon Printing Co Ltd | | 8/8/2018 - 10/11/2018 | | | — | | | | 64,568 | |
| | | 21 | | | Darden Restaurants Inc | | 6/29/2018 - 9/4/2018 | | | — | | | | 53,424 | |
| | | — | * | | Dassault Aviation SA | | 10/31/2018 | | | — | | | | (5,850 | ) |
| | | 17 | | | Davide Campari-Milano SpA | | 6/29/2018 - 7/16/2018 | | | — | | | | 6,725 | |
| | | 10 | | | DaVita HealthCare Partners Inc | | 7/26/2018 - 9/27/2018 | | | — | | | | (41,231 | ) |
| | | 1 | | | DexCom Inc | | 10/19/2018 | | | — | | | | (4,141 | ) |
| | | 8 | | | DiaSorin SpA | | 7/5/2018 - 7/16/2018 | | | — | | | | (20,043 | ) |
| | | 23 | | | Dick’s Sporting Goods Inc | | 6/29/2018 - 10/31/2018 | | | — | | | | (27,179 | ) |
| | | 148 | | | Direct Line Insurance Group PLC | | 7/16/2018 - 7/26/2018 | | | — | | | | (20,990 | ) |
| | | 206 | | | Distribuidora Internacional de Alimentacion SA | | 7/2/2018 - 8/8/2018 | | | — | | | | 161,344 | |
| | | 5 | | | DKSH Holding AG | | 7/26/2018 - 8/6/2018 | | | — | | | | 6,445 | |
| | | 14 | | | Dolby Laboratories Inc | | 6/29/2018 - 8/17/2018 | | | — | | | | (70,195 | ) |
| | | 18 | | | Dollar General Corp | | 10/31/2018 | | | — | | | | (12,603 | ) |
| | | 2 | | | Dollarama Inc | | 6/29/2018 - 8/9/2018 | | | — | | | | (1,847 | ) |
| | | 24 | | | Domino’s Pizza Enterprises Ltd | | 6/29/2018 - 10/19/2018 | | | — | | | | 54,388 | |
| | | 1 | | | dorma+kaba Holding AG | | 9/14/2018 - 10/19/2018 | | | — | | | | (7,683 | ) |
| | | 8 | | | DST Systems Inc | | 10/31/2018 | | | — | | | | (24,978 | ) |
| | | 27 | | | DSV A/S | | 6/29/2018 - 10/19/2018 | | | — | | | | (21,226 | ) |
| | | 21 | | | Dunkin’ Brands Group Inc | | 6/29/2018 - 7/26/2018 | | | — | | | | 61,150 | |
| | | 46 | | | E*TRADE Financial Corp | | 6/29/2018 - 10/31/2018 | | | — | | | | (21,132 | ) |
| | | 93 | | | easyJet PLC | | 8/9/2018 - 10/31/2018 | | | — | | | | (54,247 | ) |
| | | 6 | | | EchoStar Corp | | 7/26/2018 - 8/6/2018 | | | — | | | | 6,758 | |
| | | 56 | | | Edenred | | 6/29/2018 - 10/19/2018 | | | — | | | | (26,713 | ) |
| | | 8 | | | Edgewell Personal Care Co | | 8/9/2018 | | | — | | | | 17,863 | |
| | | 108 | | | EDP - Energias de Portugal SA | | 7/16/2018 - 7/26/2018 | | | — | | | | 12,984 | |
| | | 55 | | | Electrolux AB | | 7/26/2018 - 10/31/2018 | | | — | | | | (33,015 | ) |
| | | 235 | | | Element Financial Corp | | 6/29/2018 - 10/19/2018 | | | — | | | | 25,584 | |
| | | 4 | | | Eli Lilly & Co | | 7/26/2018 | | | — | | | | 25,966 | |
| | | 13 | | | Ellie Mae Inc | | 10/9/2018 - 10/19/2018 | | | — | | | | (71,404 | ) |
| | | 23 | | | EMCOR Group Inc | | 7/16/2018 - 10/31/2018 | | | — | | | | 65,222 | |
| | | 65 | | | Empire Co Ltd | | 7/16/2018 - 7/26/2018 | | | — | | | | 19,714 | |
| | | 2 | | | EMS-Chemie Holding AG | | 6/29/2018 - 7/26/2018 | | | — | | | | 21,832 | |
| | | 18 | | | Enagas SA | | 7/2/2018 - 9/17/2018 | | | — | | | | (9,956 | ) |
| | | 55 | | | Encana Corp | | 7/6/2018 - 8/9/2018 | | | — | | | | 78,573 | |
| | | 36 | | | Endo International PLC | | 10/19/2018 | | | — | | | | (48,280 | ) |
| | | 51 | | | Enel SpA | | 7/26/2018 - 7/26/2018 | | | — | | | | 7,320 | |
| | | 19 | | | Energen Corp | | 9/27/2018 - 10/19/2018 | | | — | | | | (155,219 | ) |
| | | 10 | | | Energizer Holdings Inc | | 7/26/2018 - 10/31/2018 | | | — | | | | (17,567 | ) |
| | | 7 | | | EnerSys | | 8/17/2018 - 9/4/2018 | | | — | | | | (16,237 | ) |
| | | 28 | | | EPAM Systems Inc | | 7/2/2018 - 10/31/2018 | | | — | | | | 8,205 | |
| | | 10 | | | Equifax Inc | | 6/29/2018 - 10/19/2018 | | | — | | | | 59,996 | |
| | | 33 | | | Erste Group Bank AG | | 6/29/2018 - 7/26/2018 | | | — | | | | 68,083 | |
| | | 21 | | | Eurazeo SA | | 9/27/2018 - 10/9/2018 | | | — | | | | (36,582 | ) |
| | | — | * | | Eurofins Scientific SE | | 9/27/2018 | | | — | | | | 203 | |
| | | 37 | | | Exelixis Inc | | 9/27/2018 | | | — | | | | (49,570 | ) |
| | |
| 34 | | The accompanying notes are an integral part of these financial statements. |
GOLDMAN SACHS MULTI-MANAGER ALTERNATIVES FUND
|
| ADDITIONAL INVESTMENT INFORMATION (continued) |
OVER THE COUNTER TOTAL RETURN SWAPS (continued)#
| | | | | | | | | | | | | | | | |
| | | | | | | | | | Market Value | |
| Counterparty | | Notional
Amount
(000s) | | | Reference Security | | Termination Date | | Upfront Payments Made (Received) | | | Unrealized
Gain (Loss) | |
JPMorgan Securities, Inc. (continued) | | $ | 7 | | | Exxon Mobil Corp | | 7/6/2018 - 8/9/2018 | | $ | — | | | $ | (28,605 | ) |
| | | 16 | | | F5 Networks Inc | | 6/29/2018 - 10/19/2018 | | | — | | | | 330,523 | |
| | | 5 | | | FactSet Research Systems Inc | | 10/19/2018 - 10/31/2018 | | | — | | | | 1,606 | |
| | | 14 | | | Fair Isaac Corp | | 8/6/2018 - 10/31/2018 | | | — | | | | (2,092 | ) |
| | | 8 | | | FANUC Corp | | 7/2/2018 - 8/20/2018 | | | — | | | | (45,368 | ) |
| | | 17 | | | Fastenal Co | | 10/9/2018 - 10/31/2018 | | | — | | | | (7,011 | ) |
| | | 10 | | | Federated Investors Inc | | 10/9/2018 | | | — | | | | (10,988 | ) |
| | | 96 | | | Ferrovial SA | | 7/2/2018 - 10/19/2018 | | | — | | | | 44,097 | |
| | | 96 | | | FERROVIAL SA | | 11/2/2018 | | | — | | | | (40,925 | ) |
| | | 49 | | | Fingerprint Cards AB | | 6/29/2018 - 10/31/2018 | | | — | | | | (17,187 | ) |
| | | 26 | | | Finisar Corp | | 9/27/2018 - 10/9/2018 | | | — | | | | (64,971 | ) |
| | | 78 | | | Finning International Inc | | 9/14/2018 - 10/31/2018 | | | — | | | | (38,499 | ) |
| | | 4 | | | First Citizens BancShares Inc/NC | | 10/9/2018 - 10/19/2018 | | | — | | | | (14,773 | ) |
| | | 44 | | | First Data Corp | | 7/2/2018 - 10/9/2018 | | | — | | | | (28,844 | ) |
| | | 14 | | | First Solar Inc | | 9/27/2018 | | | — | | | | (30,607 | ) |
| | | 19 | | | Fisher & Paykel Healthcare Corp Ltd | | 6/29/2018 | | | — | | | | (9,061 | ) |
| | | 8 | | | FleetCor Technologies Inc | | 6/29/2018 - 8/6/2018 | | | — | | | | (27,937 | ) |
| | | 17 | | | Fletcher Building Ltd | | 6/29/2018 | | | — | | | | 563 | |
| | | 94 | | | Flex Ltd | | 9/4/2018 - 9/14/2018 | | | — | | | | 33,500 | |
| | | 82 | | | Flowers Foods Inc | | 10/31/2018 | | | — | | | | (8,073 | ) |
| | | — | * | | Flughafen Zuerich AG | | 7/5/2018 | | | — | | | | (502 | ) |
| | | 4 | | | FMC Corp | | 7/2/2018 - 8/9/2018 | | | — | | | | (2,335 | ) |
| | | 9 | | | Foot Locker Inc | | 7/6/2018 - 8/9/2018 | | | — | | | | (17,268 | ) |
| | | 172 | | | Fortescue Metals Group Ltd | | 9/4/2018 - 10/9/2018 | | | — | | | | 84,426 | |
| | | 13 | | | Fortive Corp | | 7/5/2018 - 8/9/2018 | | | — | | | | 26,998 | |
| | | 79 | | | Fortum OYJ | | 7/26/2018 - 9/4/2018 | | | — | | | | (47,843 | ) |
| | | 9 | | | Franco-Nevada Corp | | 7/6/2018 - 10/19/2018 | | | — | | | | (17,544 | ) |
| | | 11 | | | Frank’s International NV | | 7/6/2018 - 7/26/2018 | | | — | | | | (17,800 | ) |
| | | 44 | | | Freeport-McMoRan Inc | | 6/29/2018 - 10/19/2018 | | | — | | | | (53,294 | ) |
| | | 182 | | | Frontier Communications Corp | | 6/29/2018 - 10/31/2018 | | | — | | | | 3,117 | |
| | | 191 | | | Fuji Electric Co Ltd | | 7/17/2018 - 9/28/2018 | | | — | | | | 51,410 | |
| | | 268 | | | Fujitsu Ltd | | 7/2/2018 - 7/27/2018 | | | — | | | | 166,454 | |
| | | 2 | | | Galenica AG | | 7/16/2018 - 8/20/2018 | | | — | | | | (40,182 | ) |
| | | 33 | | | Gap Inc/The | | 6/29/2018 - 9/27/2018 | | | — | | | | 31,269 | |
| | | 1 | | | Garmin Ltd | | 8/17/2018 - 10/9/2018 | | | — | | | | 114 | |
| | | 1 | | | Geberit AG | | 6/29/2018 - 10/9/2018 | | | — | | | | 4,561 | |
| | | 23 | | | General Electric Co | | 7/6/2018 - 10/19/2018 | | | — | | | | 6,075 | |
| | | 2 | | | Genmab A/S | | 8/20/2018 | | | — | | | | 1,733 | |
| | | 1 | | | Georg Fischer AG | | 6/29/2018 - 8/17/2018 | | | — | | | | 17,543 | |
| | | 13 | | | George Weston Ltd | | 6/29/2018 - 10/31/2018 | | | — | | | | (5,649 | ) |
| | | 18 | | | Gildan Activewear Inc | | 9/14/2018 - 10/9/2018 | | | — | | | | 31,353 | |
| | | 68 | | | Gjensidige Forsikring ASA | | 6/29/2018 - 8/17/2018 | | | — | | | | 49,965 | |
| | | 35 | | | GlaxoSmithKline PLC | | 7/5/2018 - 10/31/2018 | | | — | | | | 32,235 | |
| | | 76 | | | Glencore PLC | | 7/5/2018 | | | — | | | | (18,162 | ) |
| | | 26 | | | Global Payments Inc | | 8/9/2018 - 10/31/2018 | | | — | | | | 34,061 | |
| | | 74 | | | GN Store Nord A/S | | 8/17/2018 - 10/31/2018 | | | — | | | | (66,132 | ) |
| | | 15 | | | Groupon Inc | | 8/9/2018 - 10/31/2018 | | | — | | | | (37,079 | ) |
| | | 45 | | | GrubHub Inc | | 8/6/2018 - 10/19/2018 | | | — | | | | 101,945 | |
| | |
| The accompanying notes are an integral part of these financial statements. | | 35 |
GOLDMAN SACHS MULTI-MANAGER ALTERNATIVES FUND
Consolidated Schedule of Investments (continued)
October 31, 2016
|
| ADDITIONAL INVESTMENT INFORMATION (continued) |
OVER THE COUNTER TOTAL RETURN SWAPS (continued)#
| | | | | | | | | | | | | | | | |
| | | | | | | | | | Market Value | |
| Counterparty | | Notional
Amount
(000s) | | | Reference Security | | Termination Date | | Upfront Payments Made (Received) | | | Unrealized
Gain (Loss) | |
JPMorgan Securities, Inc. (continued) | | $ | 1 | | | Guidewire Software Inc | | 6/29/2018 - 7/16/2018 | | $ | — | | | $ | 896 | |
| | | 69 | | | GungHo Online Entertainment Inc | | 7/19/2018 | | | — | | | | 16,598 | |
| | | 14 | | | H Lundbeck A/S | | 6/29/2018 - 10/31/2018 | | | — | | | | 183 | |
| | | 11 | | | Hain Celestial Group Inc/The | | 10/31/2018 | | | — | | | | 7,128 | |
| | | 68 | | | Halma PLC | | 6/29/2018 - 10/31/2018 | | | — | | | | 39,282 | |
| | | 44 | | | Hamamatsu Photonics KK | | 7/2/2018 - 7/27/2018 | | | — | | | | (6,755 | ) |
| | | 54 | | | Hanesbrands Inc | | 6/29/2018 - 10/31/2018 | | | — | | | | (29,933 | ) |
| | | 90 | | | Hargreaves Lansdown PLC | | 7/26/2018 - 10/31/2018 | | | — | | | | 35,591 | |
| | | 16 | | | Harman International Industries Inc | | 10/19/2018 - 10/31/2018 | | | — | | | | (13,401 | ) |
| | | 12 | | | Hartford Financial Services Group Inc/The | | 6/29/2018 - 9/14/2018 | | | — | | | | 8,503 | |
| | | 6 | | | Harvey Norman Holdings Ltd | | 10/19/2018 | | | — | | | | (381 | ) |
| | | 9 | | | Hawaiian Electric Industries Inc | | 10/31/2018 | | | — | | | | 4,938 | |
| | | 538 | | | Healthscope Ltd | | 6/29/2018 - 9/27/2018 | | | — | | | | 295,113 | |
| | | 31 | | | HealthSouth Corp | | 6/29/2018 - 9/27/2018 | | | — | | | | (4,133 | ) |
| | | 19 | | | HEICO Corp | | 8/6/2018 - 10/19/2018 | | | — | | | | (19,838 | ) |
| | | 6 | | | Heineken Holding NV | | 7/5/2018 - 10/31/2018 | | | — | | | | (8,998 | ) |
| | | 18 | | | Heineken NV | | 6/29/2018 - 8/9/2018 | | | — | | | | (55,554 | ) |
| | | 7 | | | Helmerich & Payne Inc | | 10/19/2018 | | | — | | | | 42,594 | |
| | | — | * | | Helvetia Holding AG | | 7/16/2018 | | | — | | | | (860 | ) |
| | | 22 | | | Hennes & Mauritz AB | | 6/29/2018 - 8/9/2018 | | | — | | | | (10,835 | ) |
| | | 30 | | | Herbalife Ltd | | 6/29/2018 - 10/31/2018 | | | — | | | | 61 | |
| | | 1 | | | Hermes International | | 10/19/2018 | | | — | | | | 2,712 | |
| | | — | * | | Hirose Electric Co Ltd | | 7/27/2018 | | | — | | | | (2,199 | ) |
| | | 3 | | | Hisamitsu Pharmaceutical Co Inc | | 7/2/2018 - 8/10/2018 | | | — | | | | 17,646 | |
| | | 58 | | | Hitachi Chemical Co Ltd | | 7/2/2018 - 8/8/2018 | | | — | | | | 18,919 | |
| | | 28 | | | Hitachi Construction Machinery Co Ltd | | 9/28/2018 - 10/22/2018 | | | — | | | | 25,051 | |
| | | 181 | | | Hitachi Ltd | | 7/2/2018 - 10/12/2018 | | | — | | | | 65,254 | |
| | | 47 | | | Home BancShares Inc/AR | | 8/17/2018 - 9/4/2018 | | | — | | | | (50,336 | ) |
| | | 14 | | | Hoshizaki Electric Co Ltd | | 7/2/2018 - 8/20/2018 | | | — | | | | (28,326 | ) |
| | | 16 | | | Hoya Corp | | 8/10/2018 - 9/6/2018 | | | — | | | | 37,872 | |
| | | 7 | | | Huntington Ingalls Industries Inc | | 6/29/2018 - 9/27/2018 | | | — | | | | 34,932 | |
| | | 7 | | | Huntsman Corp | | 10/31/2018 | | | — | | | | 3,347 | |
| | | 6 | | | Husky Energy Inc | | 9/14/2018 | | | — | | | | 7,624 | |
| | | 33 | | | Husqvarna AB | | 7/26/2018 - 9/14/2018 | | | — | | | | (21,886 | ) |
| | | 8 | | | IAC/InterActiveCorp | | 9/4/2018 | | | — | | | | 18,957 | |
| | | 4,640 | | | iBoxx USD Liquid High Yield Index^ | | 09/20/2016 | | | — | | | | (74,809 | ) |
| | | 4,079 | | | iBoxx USD Liquid High Yield Index^ | | 12/20/2016 | | | — | | | | (63,985 | ) |
| | | 2,290 | | | iBoxx USD Liquid High Yield Index^ | | 03/20/2017 | | | — | | | | (5,365 | ) |
| | | 7 | | | ICON PLC | | 10/31/2018 | | | — | | | | (10,574 | ) |
| | | 6 | | | IDEXX Laboratories Inc | | 7/6/2018 - 9/27/2018 | | | — | | | | (29,441 | ) |
| | | 131 | | | IHI Corp | | 8/8/2018 - 9/18/2018 | | | — | | | | (24,133 | ) |
| | | 1 | | | Iliad SA | | 6/29/2018 | | | — | | | | (9,242 | ) |
| | |
| 36 | | The accompanying notes are an integral part of these financial statements. |
GOLDMAN SACHS MULTI-MANAGER ALTERNATIVES FUND
|
| ADDITIONAL INVESTMENT INFORMATION (continued) |
OVER THE COUNTER TOTAL RETURN SWAPS (continued)#
| | | | | | | | | | | | | | | | |
| | | | | | | | | | Market Value | |
| Counterparty | | Notional
Amount
(000s) | | | Reference Security | | Termination Date | | Upfront Payments Made (Received) | | | Unrealized
Gain (Loss) | |
JPMorgan Securities, Inc. (continued) | | $ | — | * | | Illinois Tool Works Inc | | 7/6/2018 | | $ | — | | | $ | (1,352 | ) |
| | | 4 | | | Illumina Inc | | 6/29/2018 - 10/19/2018 | | | — | | | | (997 | ) |
| | | 48 | | | Inchcape PLC | | 7/16/2018 - 7/26/2018 | | | — | | | | (12,225 | ) |
| | | 454 | | | Incitec Pivot Ltd | | 6/29/2018 - 9/27/2018 | | | — | | | | (27,300 | ) |
| | | 7 | | | Incyte Corp | | 6/29/2018 - 8/20/2018 | | | — | | | | (20,465 | ) |
| | | 4 | | | Industria de Diseno Textil SA | | 7/6/2018 | | | — | | | | (912 | ) |
| | | 12 | | | Industrial Alliance Insurance & Financial Services Inc | | 7/16/2018 - 9/27/2018 | | | — | | | | 15,341 | |
| | | 10 | | | Ingredion Inc | | 6/29/2018 - 8/6/2018 | | | — | | | | (25,668 | ) |
| | | 7 | | | Interactive Brokers Group Inc | | 10/19/2018 | | | — | | | | 19,049 | |
| | | 12 | | | International Consolidated Airlines Group SA | | 7/5/2018 | | | — | | | | (9,486 | ) |
| | | 61 | | | International Game Technology PLC | | 7/26/2018 - 8/6/2018 | | | — | | | | 135,901 | |
| | | 56 | | | Interpublic Group of Cos Inc/The | | 7/16/2018 - 10/9/2018 | | | — | | | | (13,872 | ) |
| | | 6 | | | Intuit Inc | | 6/29/2018 - 8/9/2018 | | | — | | | | 8,963 | |
| | | 123 | | | Investec PLC | | 6/29/2018 - 7/26/2018 | | | — | | | | 58,018 | |
| | | 7 | | | Ipsen SA | | 7/16/2018 | | | — | | | | (4,099 | ) |
| | | 40 | | | Israel Chemicals Ltd | | 8/10/2018 | | | — | | | | 7,546 | |
| | | 34 | | | ISS A/S | | 6/29/2018 - 7/26/2018 | | | — | | | | (10,213 | ) |
| | | 32 | | | Isuzu Motors Ltd | | 7/17/2018 - 9/4/2018 | | | — | | | | (41,459 | ) |
| | | 16 | | | Itochu Techno-Solutions Corp | | 10/22/2018 - 11/1/2018 | | | — | | | | (13,884 | ) |
| | | 40 | | | ITV PLC | | 8/9/2018 | | | — | | | | (220 | ) |
| | | 13 | | | Izumi Co Ltd | | 7/17/2018 - 8/20/2018 | | | — | | | | (51,041 | ) |
| | | 46 | | | Japan Airlines Co Ltd | | 7/2/2018 - 10/22/2018 | | | — | | | | 52,377 | |
| | | 33 | | | Japan Airport Terminal Co Ltd | | 7/17/2018 - 10/22/2018 | | | — | | | | (78,526 | ) |
| | | 18 | | | Japan Exchange Group Inc | | 10/22/2018 | | | — | | | | (3,927 | ) |
| | | 52 | | | Japan Post Bank Co Ltd | | 11/1/2018 | | | — | | | | 3,890 | |
| | | 12 | | | Japan Tobacco Inc | | 10/22/2018 | | | — | | | | (16,969 | ) |
| | | 4 | | | Jardine Strategic Holdings Ltd | | 7/2/2018 - 7/5/2018 | | | — | | | | 5,505 | |
| | | 16 | | | Jazz Pharmaceuticals PLC | | 6/29/2018 - 10/31/2018 | | | — | | | | (177,142 | ) |
| | | 43 | | | JCDecaux SA | | 8/6/2018 - 10/31/2018 | | | — | | | | (23,627 | ) |
| | | 23 | | | JD Sports Fashion PLC | | 10/9/2018 | | | — | | | | (18,719 | ) |
| | | 113 | | | Jeronimo Martins SGPS SA | | 6/29/2018 - 10/31/2018 | | | — | | | | (24,634 | ) |
| | | 104 | | | JetBlue Airways Corp | | 6/29/2018 - 10/31/2018 | | | — | | | | (26,292 | ) |
| | | 36 | | | John Wiley & Sons Inc | | 7/16/2018 - 10/9/2018 | | | — | | | | 18,443 | |
| | | 26 | | | John Wood Group PLC | | 10/31/2018 | | | — | | | | (4,449 | ) |
| | | 11 | | | Johnson & Johnson | | 6/29/2018 - 10/31/2018 | | | — | | | | 21,124 | |
| | | 31 | | | Johnson Matthey PLC | | 6/29/2018 - 7/26/2018 | | | — | | | | (27,773 | ) |
| | | 48 | | | JTEKT Corp | | 7/2/2018 - 9/18/2018 | | | — | | | | (4,497 | ) |
| | | 31 | | | Julius Baer Group Ltd | | 8/6/2018 - 10/9/2018 | | | — | | | | 11,310 | |
| | | 293 | | | Just Eat PLC | | 6/29/2018 - 10/31/2018 | | | — | | | | (83,087 | ) |
| | | 32 | | | Kakaku.com Inc | | 9/6/2018 - 11/1/2018 | | | — | | | | (1,653 | ) |
| | | 12 | | | Kaken Pharmaceutical Co Ltd | | 7/2/2018 - 11/1/2018 | | | — | | | | 21,534 | |
| | | 8 | | | Kao Corp | | 11/1/2018 | | | — | | | | (27,879 | ) |
| | | 210 | | | Keihan Holdings Co Ltd | | 7/2/2018 - 11/1/2018 | | | — | | | | (4,765 | ) |
| | | 128 | | | Keikyu Corp | | 7/2/2018 - 8/8/2018 | | | — | | | | (3,388 | ) |
| | | 28 | | | Keio Corp | | 7/27/2018 - 9/18/2018 | | | — | | | | 158 | |
| | | 105 | | | Keppel Corp Ltd | | 7/2/2018 - 7/9/2018 | | | — | | | | 8,724 | |
| | |
| The accompanying notes are an integral part of these financial statements. | | 37 |
GOLDMAN SACHS MULTI-MANAGER ALTERNATIVES FUND
Consolidated Schedule of Investments (continued)
October 31, 2016
|
| ADDITIONAL INVESTMENT INFORMATION (continued) |
OVER THE COUNTER TOTAL RETURN SWAPS (continued)#
| | | | | | | | | | | | | | | | |
| | | | | | | | | | Market Value | |
| Counterparty | | Notional
Amount
(000s) | | | Reference Security | | Termination Date | | Upfront Payments Made (Received) | | | Unrealized
Gain (Loss) | |
JPMorgan Securities, Inc. (continued) | | $ | 29 | | | Kesko OYJ | | 6/29/2018 - 9/4/2018 | | $ | — | | | $ | (78,017 | ) |
| | | 26 | | | Kewpie Corp | | 11/1/2018 | | | — | | | | 6,321 | |
| | | 3 | | | Keyence Corp | | 7/2/2018 - 8/10/2018 | | | — | | | | 6,194 | |
| | | 39 | | | Keyera Corp | | 6/29/2018 - 10/19/2018 | | | — | | | | 33,420 | |
| | | 24 | | | Kinder Morgan Inc/DE | | 8/9/2018 | | | — | | | | 4,634 | |
| | | 292 | | | Kingfisher PLC | | 7/16/2018 - 7/26/2018 | | | — | | | | 1,609 | |
| | | 77 | | | Kirin Holdings Co Ltd | | 7/27/2018 - 9/4/2018 | | | — | | | | 71,702 | |
| | | 42 | | | Kohl’s Corp | | 8/17/2018 - 10/9/2018 | | | — | | | | (94,134 | ) |
| | | 14 | | | Koito Manufacturing Co Ltd | | 7/27/2018 - 9/4/2018 | | | — | | | | (33,791 | ) |
| | | 16 | | | Komatsu Ltd | | 9/28/2018 | | | — | | | | (6,192 | ) |
| | | 23 | | | Konami Holdings Corp | | 7/2/2018 - 7/27/2018 | | | — | | | | 25,079 | |
| | | 13 | | | Kone OYJ | | 6/29/2018 - 8/9/2018 | | | — | | | | (33,471 | ) |
| | | 7 | | | Koninklijke Philips NV | | 6/29/2018 - 8/17/2018 | | | — | | | | 8,499 | |
| | | 14 | | | Koninklijke Vopak NV | | 10/31/2018 | | | — | | | | 3,568 | |
| | | 32 | | | Kubota Corp | | 7/2/2018 - 8/10/2018 | | | — | | | | (35,996 | ) |
| | | 3 | | | Kuehne + Nagel International AG | | 8/6/2018 | | | — | | | | (7,866 | ) |
| | | 2 | | | L Brands Inc | | 6/29/2018 - 8/9/2018 | | | — | | | | 1,652 | |
| | | 12 | | | LafargeHolcim Ltd | | 6/29/2018 - 8/9/2018 | | | — | | | | (38,200 | ) |
| | | 13 | | | Lancaster Colony Corp | | 6/29/2018 - 9/27/2018 | | | — | | | | (42,230 | ) |
| | | 14 | | | Las Vegas Sands Corp | | 7/26/2018 - 10/19/2018 | | | — | | | | 10,018 | |
| | | 9 | | | Lear Corp | | 6/29/2018 - 8/9/2018 | | | — | | | | 30,983 | |
| | | 452 | | | Li & Fung Ltd | | 6/29/2018 - 7/5/2018 | | | — | | | | 28 | |
| | | 31 | | | Liberty Broadband Corp | | 6/29/2018 - 8/9/2018 | | | — | | | | 38,120 | |
| | | 66 | | | Liberty Global Plc LiLAC | | 6/29/2018 - 10/19/2018 | | | — | | | | 27,384 | |
| | | 30 | | | Liberty Interactive Corp QVC Group | | 8/9/2018 - 9/4/2018 | | | — | | | | 10,596 | |
| | | 29 | | | LINE Corp | | 8/6/2018 | | | — | | | | 160,774 | |
| | | 11 | | | Linear Technology Corp | | 6/29/2018 - 8/9/2018 | | | — | | | | 13,626 | |
| | | 128 | | | Lion Corp | | 7/2/2018 - 9/4/2018 | | | — | | | | 62,698 | |
| | | 27 | | | Lions Gate Entertainment Corp | | 6/29/2018 - 8/17/2018 | | | — | | | | (30,505 | ) |
| | | 45 | | | Live Nation Entertainment Inc | | 9/14/2018 - 10/9/2018 | | | — | | | | 9,931 | |
| | | 36 | | | LKQ Corp | | 7/16/2018 - 10/31/2018 | | | — | | | | 36,246 | |
| | | 3 | | | Lockheed Martin Corp | | 7/6/2018 - 8/9/2018 | | | — | | | | 36,000 | |
| | | 31 | | | Logitech International SA | | 8/9/2018 - 10/31/2018 | | | — | | | | 56,040 | |
| | | 6 | | | Lonza Group AG | | 6/29/2018 - 10/31/2018 | | | — | | | | 52,038 | |
| | | 5 | | | LSC Communications Inc | | 10/9/2018 | | | — | | | | 632 | |
| | | 13 | | | Lundin Mining Corp | | 8/7/2018 | | | — | | | | (215 | ) |
| | | 37 | | | M3 Inc | | 7/2/2018 - 11/1/2018 | | | — | | | | 119,230 | |
| | | 20 | | | Mabuchi Motor Co Ltd | | 8/20/2018 - 10/22/2018 | | | — | | | | (26,653 | ) |
| | | 2 | | | Magellan Financial Group Ltd | | 9/4/2018 - 9/4/2018 | | | — | | | | 173 | |
| | | 11 | | | Magna International Inc | | 6/29/2018 - 7/16/2018 | | | — | | | | (17,086 | ) |
| | | 28 | | | Mallinckrodt PLC | | 6/29/2018 - 10/31/2018 | | | — | | | | (189,879 | ) |
| | | 11 | | | Manhattan Associates Inc | | 6/29/2018 - 8/9/2018 | | | — | | | | (65,619 | ) |
| | | 18 | | | ManpowerGroup Inc | | 9/4/2018 - 10/19/2018 | | | — | | | | 79,375 | |
| | | 22 | | | Marathon Oil Corp | | 7/2/2018 - 8/9/2018 | | | — | | | | 39,360 | |
| | | 1 | | | Markel Corp | | 9/27/2018 - 10/9/2018 | | | — | | | | 62,082 | |
| | | 8 | | | MarketAxess Holdings Inc | | 9/4/2018 - 10/19/2018 | | | — | | | | 50,481 | |
| | | 15 | | | Marks & Spencer Group PLC | | 10/19/2018 | | | — | | | | 3,330 | |
| | |
| 38 | | The accompanying notes are an integral part of these financial statements. |
GOLDMAN SACHS MULTI-MANAGER ALTERNATIVES FUND
|
| ADDITIONAL INVESTMENT INFORMATION (continued) |
OVER THE COUNTER TOTAL RETURN SWAPS (continued)#
| | | | | | | | | | | | | | | | |
| | | | | | | | | | Market Value | |
| Counterparty | | Notional
Amount
(000s) | | | Reference Security | | Termination Date | | Upfront Payments Made (Received) | | | Unrealized
Gain (Loss) | |
JPMorgan Securities, Inc. (continued) | | $ | 4 | | | Martin Marietta Materials Inc | | 10/19/2018 | | $ | — | | | $ | (47,368 | ) |
| | | 124 | | | Marui Group Co Ltd | | 7/2/2018 - 10/22/2018 | | | — | | | | (102,918 | ) |
| | | 40 | | | Maruichi Steel Tube Ltd | | 7/2/2018 - 10/22/2018 | | | — | | | | (23,369 | ) |
| | | 45 | | | Marvell Technology Group Ltd | | 8/9/2018 - 9/27/2018 | | | — | | | | (6,731 | ) |
| | | 14 | | | Maxim Integrated Products Inc | | 7/6/2018 - 9/27/2018 | | | — | | | | 23,751 | |
| | | 6 | | | McDonald’s Corp | | 7/6/2018 - 8/9/2018 | | | — | | | | (12,095 | ) |
| | | 44 | | | McDonald’s Holdings Co Japan Ltd | | 9/18/2018 - 11/1/2018 | | | — | | | | (5,382 | ) |
| | | 24 | | | MDU Resources Group Inc | | 6/29/2018 - 7/16/2018 | | | — | | | | 32,588 | |
| | | 169 | | | Mediaset Espana Comunicacion SA | | 7/2/2018 - 8/10/2018 | | | — | | | | (10,342 | ) |
| | | 232 | | | Mediaset SpA | | 6/29/2018 - 8/6/2018 | | | — | | | | (4,901 | ) |
| | | 15 | | | Mediclinic International PLC | | 6/29/2018 - 9/27/2018 | | | — | | | | (4,057 | ) |
| | | 11 | | | Medidata Solutions Inc | | 9/4/2018 - 10/19/2018 | | | — | | | | (50,589 | ) |
| | | 16 | | | Mediobanca SpA | | 6/29/2018 | | | — | | | | (10,256 | ) |
| | | 30 | | | Medipal Holdings Corp | | 7/2/2018 - 7/27/2018 | | | — | | | | 8,397 | |
| | | 1 | | | MEDNAX Inc | | 10/31/2018 | | | — | | | | 2,175 | |
| | | 3 | | | MEIJI Holdings Co Ltd | | 8/10/2018 | | | — | | | | 10,429 | |
| | | 45 | | | Mentor Graphics Corp | | 10/19/2018 | | | — | | | | 60,640 | |
| | | 8 | | | MercadoLibre Inc | | 10/19/2018 - 10/31/2018 | | | — | | | | (9,181 | ) |
| | | 20 | | | Merck & Co Inc | | 6/29/2018 - 10/19/2018 | | | — | | | | 72,884 | |
| | | 16 | | | Methanex Corp | | 10/19/2018 - 10/31/2018 | | | — | | | | 10,061 | |
| | | 2 | | | Mettler-Toledo International Inc | | 6/29/2018 - 8/9/2018 | | | — | | | | (10,368 | ) |
| | | 30 | | | Micron Technology Inc | | 7/16/2018 - 8/9/2018 | | | — | | | | (11,560 | ) |
| | | 18 | | | Middleby Corp/The | | 6/29/2018 - 10/31/2018 | | | — | | | | 94,183 | |
| | | 11 | | | MISUMI Group Inc | | 10/22/2018 - 11/1/2018 | | | — | | | | 6,965 | |
| | | 191 | | | Mitsubishi Chemical Holdings Corp | | 7/2/2018 - 7/27/2018 | | | — | | | | 80,808 | |
| | | 141 | | | Mitsubishi Electric Corp | | 7/2/2018 - 8/10/2018 | | | — | | | | 143,454 | |
| | | 41 | | | Mitsubishi Gas Chemical Co Inc | | 9/4/2018 - 10/11/2018 | | | — | | | | 45,624 | |
| | | 100 | | | Mitsubishi UFJ Lease & Finance Co Ltd | | 7/2/2018 - 7/19/2018 | | | — | | | | 32,148 | |
| | | 71 | | | Mitsui Chemicals Inc | | 7/17/2018 - 10/22/2018 | | | — | | | | 22,360 | |
| | | 34 | | | Mobileye NV | | 9/4/2018 - 10/31/2018 | | | — | | | | 29,434 | |
| | | 31 | | | Mondi PLC | | 9/4/2018 | | | — | | | | (102 | ) |
| | | 53 | | | MonotaRO Co Ltd | | 7/6/2018 - 11/1/2018 | | | — | | | | 113,115 | |
| | | 9 | | | Monster Beverage Corp | | 6/29/2018 - 10/19/2018 | | | — | | | | 7,373 | |
| | | 13 | | | Murphy USA Inc | | 7/26/2018 | | | — | | | | (18,886 | ) |
| | | 46 | | | Nankai Electric Railway Co Ltd | | 7/2/2018 | | | — | | | | 3,920 | |
| | | 9 | | | National Australia Bank Ltd | | 6/29/2018 | | | — | | | | (2,299 | ) |
| | | 17 | | | Neste Oyj | | 8/9/2018 | | | — | | | | 5,031 | |
| | | 8 | | | Nestle SA | | 6/29/2018 - 8/9/2018 | | | — | | | | (22,844 | ) |
| | | 38 | | | NetApp Inc | | 7/26/2018 - 10/19/2018 | | | — | | | | 9,584 | |
| | | 22 | | | Netflix Inc | | 6/29/2018 - 8/9/2018 | | | — | | | | (536,561 | ) |
| | | 24 | | | New Jersey Resources Corp | | 6/29/2018 - 8/17/2018 | | | — | | | | (53,565 | ) |
| | | 89 | | | New York Community Bancorp Inc | | 6/29/2018 - 10/9/2018 | | | — | | | | (27,540 | ) |
| | | 24 | | | Newcrest Mining Ltd | | 8/9/2018 | | | — | | | | 26,738 | |
| | |
| The accompanying notes are an integral part of these financial statements. | | 39 |
GOLDMAN SACHS MULTI-MANAGER ALTERNATIVES FUND
Consolidated Schedule of Investments (continued)
October 31, 2016
|
| ADDITIONAL INVESTMENT INFORMATION (continued) |
OVER THE COUNTER TOTAL RETURN SWAPS (continued)#
| | | | | | | | | | | | | | | | |
| | | | | | | | | | Market Value | |
| Counterparty | | Notional
Amount
(000s) | | | Reference Security | | Termination Date | | Upfront Payments Made (Received) | | | Unrealized
Gain (Loss) | |
JPMorgan Securities, Inc. (continued) | | $ | 53 | | | News Corp | | 9/27/2018 - 10/31/2018 | | $ | — | | | $ | (69,682 | ) |
| | | 53 | | | Nexon Co Ltd | | 7/2/2018 - 9/18/2018 | | | — | | | | 88,843 | |
| | | 21 | | | Next PLC | | 10/9/2018 | | | — | | | | (61,033 | ) |
| | | 36 | | | NGK Spark Plug Co Ltd | | 7/6/2018 - 11/1/2018 | | | — | | | | (46,691 | ) |
| | | 57 | | | Nibe Industrier AB | | 10/31/2018 | | | — | | | | (3,067 | ) |
| | | 7 | | | Nice Ltd | | 7/16/2018 - 9/4/2018 | | | — | | | | 1,303 | |
| | | 22 | | | Nikon Corp | | 9/28/2018 | | | — | | | | 994 | |
| | | 2 | | | Nintendo Co Ltd | | 8/10/2018 - 9/18/2018 | | | — | | | | 12,214 | |
| | | 38 | | | Nippon Paint Holdings Co Ltd | | 7/2/2018 - 9/6/2018 | | | — | | | | (9,085 | ) |
| | | 13 | | | Nippon Shinyaku Co Ltd | | 7/2/2018 - 8/8/2018 | | | — | | | | 11,035 | |
| | | 21 | | | Nippon Telegraph & Telephone Corp | | 7/27/2018 | | | — | | | | 10,694 | |
| | | 40 | | | Nissan Chemical Industries Ltd | | 7/2/2018 - 10/22/2018 | | | — | | | | (134,127 | ) |
| | | 4 | | | Nissin Foods Holdings Co Ltd | | 8/8/2018 - 9/18/2018 | | | — | | | | 313 | |
| | | 6 | | | Nitori Holdings Co Ltd | | 7/2/2018 - 8/10/2018 | | | — | | | | 28,456 | |
| | | 38 | | | Nokian Renkaat OYJ | | 6/29/2018 - 10/31/2018 | | | — | | | | (7,531 | ) |
| | | 75 | | | Nordea Bank AB | | 8/9/2018 | | | — | | | | (40,186 | ) |
| | | 15 | | | Nordstrom Inc | | 6/29/2018 - 8/9/2018 | | | — | | | | (37,128 | ) |
| | | 274 | | | Norsk Hydro ASA | | 7/16/2018 - 10/9/2018 | | | — | | | | 67,138 | |
| | | 7 | | | Northern Trust Corp | | 6/29/2018 - 7/26/2018 | | | — | | | | 9,053 | |
| | | 72 | | | Northland Power Inc | | 7/26/2018 - 10/19/2018 | | | — | | | | (42,705 | ) |
| | | 49 | | | Norwegian Cruise Line Holdings Ltd | | 8/9/2018 - 10/31/2018 | | | — | | | | (41,652 | ) |
| | | 19 | | | Novartis AG | | 6/29/2018 - 10/31/2018 | | | — | | | | 72,700 | |
| | | 15 | | | Novo Nordisk A/S | | 6/29/2018 - 10/19/2018 | | | — | | | | (55,514 | ) |
| | | 26 | | | NSK Ltd | | 9/28/2018 | | | — | | | | 22,154 | |
| | | 26 | | | NTT Data Corp | | 7/2/2018 - 7/27/2018 | | | — | | | | 68,216 | |
| | | 11 | | | NTT DOCOMO Inc | | 10/22/2018 | | | — | | | | 8,902 | |
| | | 32 | | | Nu Skin Enterprises Inc | | 8/20/2018 - 10/31/2018 | | | — | | | | (99,130 | ) |
| | | 12 | | | Nucor Corp | | 8/9/2018 | | | — | | | | 25,287 | |
| | | 48 | | | Numericable-SFR SA | | 10/19/2018 | | | — | | | | (33,115 | ) |
| | | 54 | | | Obayashi Corp | | 10/22/2018 | | | — | | | | 11,831 | |
| | | 24 | | | Obic Co Ltd | | 7/2/2018 - 9/28/2018 | | | — | | | | (31,494 | ) |
| | | 15 | | | OC Oerlikon Corp AG | | 6/29/2018 - 7/26/2018 | | | — | | | | 5,854 | |
| | | 64 | | | OCI NV | | 10/9/2018 | | | — | | | | (22,357 | ) |
| | | 59 | | | Odakyu Electric Railway Co Ltd | | 7/2/2018 - 10/22/2018 | | | — | | | | 44,080 | |
| | | 4 | | | OMV AG | | 10/31/2018 | | | — | | | | 454 | |
| | | 21 | | | ONE Gas Inc | | 6/29/2018 - 10/19/2018 | | | — | | | | 72,807 | |
| | | 50 | | | Ono Pharmaceutical Co Ltd | | 7/2/2018 - 10/22/2018 | | | — | | | | 70,674 | |
| | | 18 | | | Open Text Corp | | 6/29/2018 - 7/26/2018 | | | — | | | | (28,059 | ) |
| | | 71 | | | Orica Ltd | | 9/4/2018 - 9/14/2018 | | | — | | | | (24,215 | ) |
| | | 192 | | | Origin Energy Ltd | | 9/14/2018 - 10/31/2018 | | | — | | | | (10,445 | ) |
| | | 8 | | | Orion Oyj | | 6/29/2018 | | | — | | | | 37,346 | |
| | | 51 | | | Orkla ASA | | 7/16/2018 - 10/31/2018 | | | — | | | | 15,147 | |
| | | 9 | | | Orpea | | 6/29/2018 - 7/16/2018 | | | — | | | | 21,819 | |
| | | 14 | | | Oshkosh Corp | | 10/9/2018 - 10/19/2018 | | | — | | | | 329 | |
| | | 1 | | | Otsuka Corp | | 10/22/2018 | | | — | | | | (5 | ) |
| | | 26 | | | Oversea-Chinese Banking Corp Ltd | | 10/22/2018 | | | — | | | | 1,258 | |
| | |
| 40 | | The accompanying notes are an integral part of these financial statements. |
GOLDMAN SACHS MULTI-MANAGER ALTERNATIVES FUND
|
| ADDITIONAL INVESTMENT INFORMATION (continued) |
OVER THE COUNTER TOTAL RETURN SWAPS (continued)#
| | | | | | | | | | | | | | | | |
| | | | | | | | | | Market Value | |
| Counterparty | | Notional
Amount
(000s) | | | Reference Security | | Termination Date | | Upfront Payments Made (Received) | | | Unrealized
Gain (Loss) | |
JPMorgan Securities, Inc. (continued) | | $ | 14 | | | Owens Corning | | 7/16/2018 - 7/26/2018 | | $ | — | | | $ | (54,537 | ) |
| | | 9 | | | Palo Alto Networks Inc | | 6/29/2018 - 8/17/2018 | | | — | | | | 3,717 | |
| | | 134 | | | Pandora Media Inc | | 9/4/2018 - 10/19/2018 | | | — | | | | 266,188 | |
| | | 4 | | | Panera Bread Co | | 10/9/2018 - 10/19/2018 | | | — | | | | (2,348 | ) |
| | | 7 | | | PAREXEL International Corp | | 10/19/2018 - 10/31/2018 | | | — | | | | (52,450 | ) |
| | | 12 | | | Pargesa Holding SA | | 7/26/2018 | | | — | | | | 13,277 | |
| | | 21 | | | Park24 Co Ltd | | 7/6/2018 - 8/10/2018 | | | — | | | | 2,448 | |
| | | 67 | | | Parsley Energy Inc | | 7/2/2018 - 8/9/2018 | | | — | | | | 227,169 | |
| | | 3 | | | Partners Group Holding AG | | 6/29/2018 - 7/26/2018 | | | — | | | | (21,881 | ) |
| | | 3 | | | Patheon NV | | 10/19/2018 | | | — | | | | (6,877 | ) |
| | | 25 | | | Paycom Software Inc | | 10/31/2018 | | | — | | | | (400 | ) |
| | | 8 | | | PayPal Holdings Inc | | 8/9/2018 | | | — | | | | (17,184 | ) |
| | | 9 | | | Pembina Pipeline Corp | | 10/19/2018 | | | — | | | | (3,515 | ) |
| | | 8 | | | Pentair PLC | | 10/19/2018 | | | — | | | | 26,427 | |
| | | 6 | | | PepsiCo Inc | | 6/29/2018 - 8/9/2018 | | | — | | | | 6,521 | |
| | | 8 | | | PerkinElmer Inc | | 8/9/2018 - 8/20/2018 | | | — | | | | (16,020 | ) |
| | | 6 | | | Perrigo Co PLC | | 9/4/2018 | | | — | | | | 29,711 | |
| | | 8 | | | Persimmon PLC | | 7/16/2018 | | | — | | | | (2,701 | ) |
| | | 89 | | | Peugeot SA | | 6/29/2018 - 10/19/2018 | | | — | | | | 64,324 | |
| | | 40 | | | Pfizer Inc | | 6/29/2018 - 10/31/2018 | | | — | | | | 52,110 | |
| | | 7 | | | Philip Morris International Inc | | 6/29/2018 - 8/9/2018 | | | — | | | | 2,073 | |
| | | 8 | | | Pigeon Corp | | 11/1/2018 | | | — | | | | 6,481 | |
| | | 12 | | | Pilgrim’s Pride Corp | | 7/16/2018 - 8/9/2018 | | | — | | | | 11,054 | |
| | | 2 | | | Pioneer Natural Resources Co | | 10/31/2018 | | | — | | | | 4,656 | |
| | | 87 | | | Plains GP Holdings LP | | 7/16/2018 - 10/9/2018 | | | — | | | | (79,886 | ) |
| | | 2 | | | Playtech Plc | | 8/9/2018 | | | — | | | | (6,561 | ) |
| | | 77 | | | Potash Corp of Saskatchewan Inc | | 7/5/2018 - 8/9/2018 | | | — | | | | (30,080 | ) |
| | | 25 | | | PRA Health Sciences Inc | | 9/4/2018 | | | — | | | | (48,154 | ) |
| | | 98 | | | PrairieSky Royalty Ltd | | 6/29/2018 - 8/9/2018 | | | — | | | | (37,665 | ) |
| | | 42 | | | Premier Inc | | 6/29/2018 - 9/4/2018 | | | — | | | | 18,926 | |
| | | 8 | | | Procter & Gamble Co/The | | 6/29/2018 - 8/9/2018 | | | — | | | | (8,584 | ) |
| | | 45 | | | Provident Financial PLC | | 6/29/2018 - 10/31/2018 | | | — | | | | 38,646 | |
| | | 24 | | | Prysmian SpA | | 6/29/2018 - 7/16/2018 | | | — | | | | (776 | ) |
| | | 13 | | | PulteGroup Inc | | 6/29/2018 - 7/6/2018 | | | — | | | | 15,176 | |
| | | 12 | | | PVH Corp | | 10/31/2018 | | | — | | | | 13,754 | |
| | | 286 | | | Qantas Airways Ltd | | 6/29/2018 - 10/31/2018 | | | — | | | | (11,617 | ) |
| | | 33 | | | QBE Insurance Group Ltd | | 10/19/2018 | | | — | | | | (1,500 | ) |
| | | 69 | | | Quanta Services Inc | | 6/29/2018 - 10/31/2018 | | | — | | | | 46,417 | |
| | | 93 | | | Qube Holdings Ltd | | 8/17/2018 | | | — | | | | 2,566 | |
| | | 50 | | | Quebecor Inc | | 6/29/2018 - 10/31/2018 | | | — | | | | (27,397 | ) |
| | | 8 | | | Quintiles Transnational Holdings Inc | | 6/29/2018 - 8/9/2018 | | | — | | | | (35,326 | ) |
| | | 3 | | | Raiffeisen Bank International AG | | 6/29/2018 | | | — | | | | 3,399 | |
| | | 51 | | | Rakuten Inc | | 7/6/2018 - 8/20/2018 | | | — | | | | 52,445 | |
| | | 13 | | | Ralph Lauren Corp | | 10/19/2018 - 10/31/2018 | | | — | | | | (6,343 | ) |
| | | 1 | | | Ramsay Health Care Ltd | | 7/16/2018 | | | — | | | | (2,349 | ) |
| | | 5 | | | Randgold Resources Ltd | | 7/6/2018 - 9/4/2018 | | | — | | | | (20,660 | ) |
| | | 1 | | | Randgold Resources Ltd | | 10/9/2018 | | | — | | | | (2,257 | ) |
| | | 2 | | | Randstad Holding NV | | 10/19/2018 | | | — | | | | 7,190 | |
| | |
| The accompanying notes are an integral part of these financial statements. | | 41 |
GOLDMAN SACHS MULTI-MANAGER ALTERNATIVES FUND
Consolidated Schedule of Investments (continued)
October 31, 2016
|
| ADDITIONAL INVESTMENT INFORMATION (continued) |
OVER THE COUNTER TOTAL RETURN SWAPS (continued)#
| | | | | | | | | | | | | | | | |
| | | | | | | | | | Market Value | |
| Counterparty | | Notional
Amount
(000s) | | | Reference Security | | Termination Date | | Upfront Payments Made (Received) | | | Unrealized
Gain (Loss) | |
JPMorgan Securities, Inc. (continued) | | $ | 13 | | | REA Group Ltd | | 6/29/2018 - 9/27/2018 | | $ | — | | | $ | 30,961 | |
| | | 3 | | | Reckitt Benckiser Group PLC | | 8/9/2018 | | | — | | | | 399 | |
| | | 42 | | | Recordati SpA | | 6/29/2018 - 10/31/2018 | | | — | | | | (68,735 | ) |
| | | 2 | | | Recruit Holdings Co Ltd | | 9/4/2018 | | | — | | | | 806 | |
| | | 17 | | | Regal Entertainment Group | | 8/9/2018 | | | — | | | | (13,979 | ) |
| | | 132 | | | Regions Financial Corp | | 6/29/2018 - 7/26/2018 | | | — | | | | 61,519 | |
| | | 27 | | | Reliance Steel & Aluminum Co | | 6/29/2018 - 10/19/2018 | | | — | | | | (29,917 | ) |
| | | 37 | | | RELX NV | | 6/29/2018 - 8/9/2018 | | | — | | | | 6,051 | |
| | | 35 | | | RELX PLC | | 8/9/2018 - 8/9/2018 | | | — | | | | (4,254 | ) |
| | | 8 | | | Remy Cointreau SA | | 6/29/2018 - 10/19/2018 | | | — | | | | 7,980 | |
| | | 29 | | | Restaurant Brands International Inc | | 6/29/2018 - 8/7/2018 | | | — | | | | (14,186 | ) |
| | | 32 | | | Rexel SA | | 8/17/2018 - 9/14/2018 | | | — | | | | 2,505 | |
| | | 38 | | | Rightmove PLC | | 6/29/2018 - 10/19/2018 | | | — | | | | (80,435 | ) |
| | | 9 | | | Rinnai Corp | | 7/27/2018 - 8/20/2018 | | | — | | | | (64,580 | ) |
| | | 51 | | | Rio Tinto Ltd | | 7/16/2018 - 10/19/2018 | | | — | | | | (123,630 | ) |
| | | 8 | | | Rio Tinto PLC | | 10/19/2018 | | | — | | | | 23,721 | |
| | | 45 | | | Ritchie Bros Auctioneers Inc | | 6/29/2018 - 8/17/2018 | | | — | | | | 50,893 | |
| | | 18 | | | RLI Corp | | 7/26/2018 - 10/19/2018 | | | — | | | | 241,036 | |
| | | 6 | | | Roche Holding AG | | 6/29/2018 - 10/31/2018 | | | — | | | | 35,253 | |
| | | 9 | | | Rogers Communications Inc | | 8/9/2018 | | | — | | | | (7,198 | ) |
| | | 2 | | | Rohm Co Ltd | | 10/22/2018 | | | — | | | | 1,757 | |
| | | 4 | | | Roper Technologies Inc | | 9/14/2018 - 9/27/2018 | | | — | | | | 11,538 | |
| | | 26 | | | Royal Bank of Canada | | 7/6/2018 - 8/9/2018 | | | — | | | | 30,191 | |
| | | 284 | | | Royal Bank of Scotland Group PLC | | 8/9/2018 - 10/19/2018 | | | — | | | | (65,005 | ) |
| | | 9 | | | Royal Caribbean Cruises Ltd | | 9/14/2018 - 10/19/2018 | | | — | | | | (50,436 | ) |
| | | 29 | | | Royal Dutch Shell PLC | | 6/29/2018 - 10/31/2018 | | | — | | | | (5,116 | ) |
| | | 6 | | | Royal Gold Inc | | 9/4/2018 | | | — | | | | (16,164 | ) |
| | | 161 | | | RPC Group PLC | | 6/29/2018 - 8/9/2018 | | | — | | | | 77,632 | |
| | | 26 | | | RPC Inc | | 7/26/2018 - 10/19/2018 | | | — | | | | 25,082 | |
| | | 14 | | | RR Donnelley & Sons Co | | 6/29/2018 - 7/2/2018 | | | — | | | | (35,530 | ) |
| | | 36 | | | Saab AB | | 7/26/2018 - 10/31/2018 | | | — | | | | 20,890 | |
| | | 30 | | | Salmar ASA | | 6/29/2018 - 10/9/2018 | | | — | | | | 57,216 | |
| | | 13 | | | Sampo Oyj | | 7/26/2018 - 9/4/2018 | | | — | | | | (10,299 | ) |
| | | 32 | | | Saputo Inc | | 6/29/2018 - 10/31/2018 | | | — | | | | 25,238 | |
| | | 5 | | | Sarepta Therapeutics Inc | | 10/9/2018 | | | — | | | | 69,377 | |
| | | 63 | | | SATS Ltd | | 7/16/2018 - 8/20/2018 | | | — | | | | 1,727 | |
| | | 11 | | | SBA Communications Corp | | 6/29/2018 - 9/4/2018 | | | — | | | | (31,533 | ) |
| | | 11 | | | SBM Offshore NV | | 8/20/2018 - 10/9/2018 | | | — | | | | 3,652 | |
| | | 5 | | | Schroders PLC | | 7/16/2018 - 10/9/2018 | | | — | | | | 5,663 | |
| | | 2 | | | SCREEN Holdings Co Ltd | | 11/1/2018 | | | — | | | | 11,369 | |
| | | 17 | | | Seagate Technology PLC | | 10/19/2018 | | | — | | | | (19,197 | ) |
| | | 8 | | | SEEK Ltd | | 10/31/2018 | | | — | | | | (2,443 | ) |
| | | 71 | | | Seibu Holdings Inc | | 8/8/2018 - 10/22/2018 | | | — | | | | (55,947 | ) |
| | | 107 | | | Sembcorp Industries Ltd | | 7/2/2018 - 11/1/2018 | | | — | | | | 683 | |
| | | 30 | | | Sensata Technologies Holding NV | | 7/2/2018 - 9/14/2018 | | | — | | | | 66,553 | |
| | | 3 | | | Seria Co Ltd | | 11/1/2018 | | | — | | | | (3,240 | ) |
| | |
| 42 | | The accompanying notes are an integral part of these financial statements. |
GOLDMAN SACHS MULTI-MANAGER ALTERNATIVES FUND
|
| ADDITIONAL INVESTMENT INFORMATION (continued) |
OVER THE COUNTER TOTAL RETURN SWAPS (continued)#
| | | | | | | | | | | | | | | | |
| | | | | | | | | | Market Value | |
| Counterparty | | Notional
Amount
(000s) | | | Reference Security | | Termination Date | | Upfront Payments Made (Received) | | | Unrealized
Gain (Loss) | |
JPMorgan Securities, Inc. (continued) | | $ | 38 | | | ServiceMaster Global Holdings Inc | | 8/17/2018 - 10/19/2018 | | $ | — | | | $ | (83,935 | ) |
| | | 17 | | | ServiceNow Inc | | 9/4/2018 - 10/19/2018 | | | — | | | | (212,470 | ) |
| | | 61 | | | SES SA | | 6/29/2018 - 10/31/2018 | | | — | | | | (20,660 | ) |
| | | 13 | | | Seven & i Holdings Co Ltd | | 10/11/2018 - 10/22/2018 | | | — | | | | (12,657 | ) |
| | | 406 | | | Seven Bank Ltd | | 7/2/2018 - 10/22/2018 | | | — | | | | (19,095 | ) |
| | | 65 | | | Shaw Communications Inc | | 6/29/2018 - 10/31/2018 | | | — | | | | 7,251 | |
| | | 8 | | | Shimamura Co Ltd | | 7/17/2018 - 10/11/2018 | | | — | | | | 41,761 | |
| | | 8 | | | Shimano Inc | | 7/2/2018 - 8/20/2018 | | | — | | | | (121,417 | ) |
| | | 9 | | | Shizuoka Bank Ltd/The | | 7/17/2018 - 7/27/2018 | | | — | | | | (10,412 | ) |
| | | 16 | | | Signet Jewelers Ltd | | 9/14/2018 - 10/31/2018 | | | — | | | | (6,374 | ) |
| | | — | * | | Sika AG | | 6/29/2018 - 7/2/2018 | | | — | | | | 3,091 | |
| | | 63 | | | Silver Wheaton Corp | | 6/29/2018 - 10/19/2018 | | | — | | | | (68,367 | ) |
| | | 44 | | | Singapore Exchange Ltd | | 7/2/2018 - 7/16/2018 | | | — | | | | (6,064 | ) |
| | | 105 | | | Singapore Telecommunications Ltd | | 10/22/2018 | | | — | | | | 1,229 | |
| | | 25 | | | Six Flags Entertainment Corp | | 8/17/2018 - 9/14/2018 | | | — | | | | (113,804 | ) |
| | | 158 | | | Skandinaviska Enskilda Banken AB | | 6/29/2018 - 9/27/2018 | | | — | | | | (13,058 | ) |
| | | 53 | | | Skechers U.S.A. Inc | | 10/31/2018 | | | — | | | | (44,749 | ) |
| | | 89 | | | Sky PLC | | 6/29/2018 - 10/19/2018 | | | — | | | | (11,824 | ) |
| | | 1 | | | SMC Corp/Japan | | 7/27/2018 - 8/10/2018 | | | — | | | | (7,877 | ) |
| | | 68 | | | Snam SpA | | 7/26/2018 | | | — | | | | (8,433 | ) |
| | | 3 | | | Sodexo SA | | 9/4/2018 - 9/27/2018 | | | — | | | | 12,449 | |
| | | 25 | | | Sohgo Security Services Co Ltd | | 7/2/2018 - 11/1/2018 | | | — | | | | 125,156 | |
| | | 80 | | | Sojitz Corp | | 7/27/2018 | | | — | | | | 8,928 | |
| | | 1 | | | Sony Corp | | 7/6/2018 - 8/10/2018 | | | — | | | | (714 | ) |
| | | 14 | | | Sony Financial Holdings Inc | | 7/2/2018 - 7/27/2018 | | | — | | | | (10,422 | ) |
| | | 2 | | | Sosei Group Corp | | 9/18/2018 | | | — | | | | 19,618 | |
| | | 605 | | | South32 Ltd | | 6/29/2018 - 9/27/2018 | | | — | | | | 79,830 | |
| | | — | * | | Southern Co/The | | 6/29/2018 | | | — | | | | 149 | |
| | | 14 | | | Southwest Gas Corp | | 6/29/2018 - 9/27/2018 | | | — | | | | 92,511 | |
| | | 71 | | | Southwestern Energy Co | | 6/29/2018 - 10/19/2018 | | | — | | | | (202,555 | ) |
| | | 52 | | | Spark New Zealand Ltd | | 6/29/2018 | | | — | | | | 8,913 | |
| | | 9 | | | Spectrum Brands Holdings Inc | | 10/9/2018 | | | — | | | | 15,817 | |
| | | 22 | | | Spirit Airlines Inc | | 6/29/2018 - 10/31/2018 | | | — | | | | (61,847 | ) |
| | | 95 | | | Sprint Corp | | 10/31/2018 | | | — | | | | (21,277 | ) |
| | | 63 | | | SS&C Technologies Holdings Inc | | 7/6/2018 - 8/9/2018 | | | — | | | | 26,499 | |
| | | 37 | | | SSE PLC | | 7/16/2018 | | | — | | | | 30,118 | |
| | | 28 | | | Stanley Electric Co Ltd | | 8/20/2018 - 10/22/2018 | | | — | | | | (13,593 | ) |
| | | 26 | | | Star Entertainment Grp Ltd/The | | 9/14/2018 | | | — | | | | (15,333 | ) |
| | | 66 | | | StarHub Ltd | | 7/2/2018 - 10/11/2018 | | | — | | | | (930 | ) |
| | | 38 | | | Start Today Co Ltd | | 7/2/2018 - 10/3/2018 | | | — | | | | 28,549 | |
| | | 4 | | | State Street Corp | | 9/27/2018 | | | — | | | | (235 | ) |
| | | 51 | | | Steel Dynamics Inc | | 6/29/2018 - 10/9/2018 | | | — | | | | 163,395 | |
| | | 25 | | | Stericycle Inc | | 6/29/2018 - 10/19/2018 | | | — | | | | (123,113 | ) |
| | | 19 | | | STERIS PLC | | 7/16/2018 - 7/26/2018 | | | — | | | | 55,173 | |
| | | 170 | | | STMicroelectronics NV | | 6/29/2018 - 7/26/2018 | | | — | | | | 282,052 | |
| | | 88 | | | Stora Enso OYJ | | 6/29/2018 - 10/19/2018 | | | — | | | | 50,076 | |
| | |
| The accompanying notes are an integral part of these financial statements. | | 43 |
GOLDMAN SACHS MULTI-MANAGER ALTERNATIVES FUND
Consolidated Schedule of Investments (continued)
October 31, 2016
|
| ADDITIONAL INVESTMENT INFORMATION (continued) |
OVER THE COUNTER TOTAL RETURN SWAPS (continued)#
| | | | | | | | | | | | | | | | |
| | | | | | | | | | Market Value | |
| Counterparty | | Notional
Amount
(000s) | | | Reference Security | | Termination Date | | Upfront Payments Made (Received) | | | Unrealized
Gain (Loss) | |
JPMorgan Securities, Inc. (continued) | | $ | — | * | | Straumann Holding AG | | 7/5/2018 | | $ | — | | | $ | (9,144 | ) |
| | | 9 | | | Stryker Corp | | 8/6/2018 - 9/4/2018 | | | — | | | | (16,627 | ) |
| | | 103 | | | Subsea 7 SA | | 7/16/2018 - 9/27/2018 | | | — | | | | 7,252 | |
| | | 23 | | | Sugi Holdings Co Ltd | | 7/2/2018 - 11/1/2018 | | | — | | | | (6,175 | ) |
| | | 283 | | | Sumitomo Chemical Co Ltd | | 7/17/2018 - 8/8/2018 | | | — | | | | 49,479 | |
| | | 71 | | | Sumitomo Dainippon Pharma Co Ltd | | 9/4/2018 - 11/1/2018 | | | — | | | | (65,423 | ) |
| | | 47 | | | Sumitomo Heavy Industries Ltd | | 10/22/2018 | | | — | | | | 18,267 | |
| | | 113 | | | Sumitomo Metal Mining Co Ltd | | 8/20/2018 - 9/28/2018 | | | — | | | | (56,051 | ) |
| | | 48 | | | Suncorp Group Ltd | | 10/19/2018 | | | — | | | | (14,133 | ) |
| | | 25 | | | Suruga Bank Ltd | | 7/2/2018 - 8/8/2018 | | | — | | | | (27,739 | ) |
| | | 39 | | | Suzuken Co Ltd/Aichi Japan | | 7/2/2018 - 9/18/2018 | | | — | | | | 15,046 | |
| | | 5 | | | Svenska Handelsbanken AB | | 10/19/2018 | | | — | | | | 237 | |
| | | 4 | | | Swatch Group AG/The | | 8/6/2018 - 9/14/2018 | | | — | | | | 32,930 | |
| | | 22 | | | Swedish Match AB | | 6/29/2018 - 10/31/2018 | | | — | | | | 6,038 | |
| | | 5 | | | Swiss Life Holding AG | | 7/16/2018 - 10/31/2018 | | | — | | | | 42,987 | |
| | | 1 | | | Swisscom AG | | 9/14/2018 | | | — | | | | (2,136 | ) |
| | | 90 | | | Symantec Corp | | 6/29/2018 - 8/9/2018 | | | — | | | | 7,273 | |
| | | 1 | | | Synchrony Financial | | 8/9/2018 | | | — | | | | 1,624 | |
| | | 16 | | | SYNNEX Corp | | 6/29/2018 - 8/9/2018 | | | — | | | | (61,926 | ) |
| | | 23 | | | Synopsys Inc | | 6/29/2018 - 7/26/2018 | | | — | | | | (11,021 | ) |
| | | 3 | | | T-Mobile US Inc | | 10/9/2018 | | | — | | | | 12,604 | |
| | | 9 | | | Targa Resources Corp | | 7/6/2018 - 10/19/2018 | | | — | | | | 30,424 | |
| | | 9 | | | Taro Pharmaceutical Industries Ltd | | 6/29/2018 - 7/26/2018 | | | — | | | | (42,922 | ) |
| | | 53 | | | Tate & Lyle PLC | | 7/26/2018 | | | — | | | | (9,080 | ) |
| | | 34 | | | Team Health Holdings Inc | | 7/2/2018 - 7/26/2018 | | | — | | | | (154,351 | ) |
| | | 49 | | | Teck Resources Ltd | | 6/29/2018 - 7/26/2018 | | | — | | | | 143,994 | |
| | | 151 | | | Tele2 AB | | 6/29/2018 - 8/6/2018 | | | — | | | | 24,757 | |
| | | 151 | | | Tele2 AB | | 11/2/2018 | | | — | | | | (45,244 | ) |
| | | 30 | | | Telecom Italia SpA/Milano | | 10/9/2018 | | | — | | | | 3,052 | |
| | | 2 | | | Teleflex Inc | | 8/9/2018 - 10/9/2018 | | | — | | | | (48,704 | ) |
| | | 232 | | | Telefonaktiebolaget LM Ericsson | | 6/29/2018 - 10/19/2018 | | | — | | | | (145,717 | ) |
| | | 22 | | | Telefonica SA | | 9/17/2018 | | | — | | | | (11,036 | ) |
| | | 28 | | | Telenet Group Holding NV | | 6/29/2018 - 7/26/2018 | | | — | | | | (41,110 | ) |
| | | 43 | | | Telephone & Data Systems Inc | | 6/29/2018 - 8/17/2018 | | | — | | | | (46,660 | ) |
| | | 24 | | | Telstra Corp Ltd | | 7/5/2018 | | | — | | | | (580 | ) |
| | | 17 | | | Temenos Group AG | | 6/29/2018 - 9/27/2018 | | | — | | | | (75,476 | ) |
| | | 22 | | | Tenneco Inc | | 8/6/2018 - 10/31/2018 | | | — | | | | (47,918 | ) |
| | | 62 | | | Teradata Corp | | 6/29/2018 - 10/9/2018 | | | — | | | | (191,236 | ) |
| | | 85 | | | Teradyne Inc | | 6/29/2018 - 10/19/2018 | | | — | | | | 176,299 | |
| | | 6 | | | Tesla Motors Inc | | 10/31/2018 | | | — | | | | 23,896 | |
| | | 29 | | | Texas Roadhouse Inc | | 6/29/2018 - 9/27/2018 | | | — | | | | 61,898 | |
| | | 8 | | | Thermo Fisher Scientific Inc | | 6/29/2018 - 9/4/2018 | | | — | | | | 56,260 | |
| | | 4 | | | Thomson Reuters Corp | | 10/19/2018 | | | — | | | | (2,374 | ) |
| | | 171 | | | Toho Gas Co Ltd | | 7/2/2018 - 8/20/2018 | | | — | | | | 74,781 | |
| | | 321 | | | Tokyo Electric Power Co Holdings Inc | | 7/2/2018 - 7/27/2018 | | | — | | | | (27,905 | ) |
| | | 174 | | | Tokyo Gas Co Ltd | | 9/18/2018 - 10/11/2018 | | | — | | | | 30,344 | |
| | |
| 44 | | The accompanying notes are an integral part of these financial statements. |
GOLDMAN SACHS MULTI-MANAGER ALTERNATIVES FUND
|
| ADDITIONAL INVESTMENT INFORMATION (continued) |
OVER THE COUNTER TOTAL RETURN SWAPS (continued)#
| | | | | | | | | | | | | | | | |
| | | | | | | | | | Market Value | |
| Counterparty | | Notional
Amount
(000s) | | | Reference Security | | Termination Date | | Upfront Payments Made (Received) | | | Unrealized
Gain (Loss) | |
JPMorgan Securities, Inc. (continued) | | $ | 38 | | | Toppan Printing Co Ltd | | 10/22/2018 | | $ | — | | | $ | 11,889 | |
| | | 4 | | | Toro Co/The | | 10/19/2018 | | | — | | | | 2,204 | |
| | | 15 | | | Toronto-Dominion Bank/The | | 7/6/2018 - 8/9/2018 | | | — | | | | 32,028 | |
| | | 195 | | | Tosoh Corp | | 7/2/2018 - 10/22/2018 | | | — | | | | 47,402 | |
| | | 39 | | | Total System Services Inc | | 10/31/2018 | | | — | | | | 45,403 | |
| | | 18 | | | Toyo Seikan Group Holdings Ltd | | 8/20/2018 | | | — | | | | 19,794 | |
| | | 7 | | | Toyota Motor Corp | | 7/2/2018 - 8/10/2018 | | | — | | | | (7,346 | ) |
| | | 173 | | | TPG Telecom Ltd | | 6/29/2018 - 10/31/2018 | | | — | | | | (31,277 | ) |
| | | 7 | | | Tractor Supply Co | | 10/31/2018 | | | — | | | | 3,886 | |
| | | 5 | | | TransDigm Group Inc | | 6/29/2018 - 7/26/2018 | | | — | | | | (88,986 | ) |
| | | 35 | | | Travis Perkins PLC | | 10/31/2018 | | | — | | | | (2,255 | ) |
| | | 5 | | | Treasury Wine Estates Ltd | | 10/9/2018 | | | — | | | | 2,001 | |
| | | 53 | | | Trinity Industries Inc | | 7/26/2018 - 10/31/2018 | | | — | | | | (96,010 | ) |
| | | 70 | | | Tryg A/S | | 6/29/2018 - 7/26/2018 | | | — | | | | 35,219 | |
| | | 41 | | | Tullow Oil PLC | | 7/5/2018 | | | — | | | | 165 | |
| | | 12 | | | Twitter Inc | | 6/29/2018 | | | — | | | | 1,175 | |
| | | 12 | | | Tyler Technologies Inc | | 6/29/2018 - 8/17/2018 | | | — | | | | 116,667 | |
| | | 6 | | | Ultimate Software Group Inc/The | | 6/29/2018 - 9/4/2018 | | | — | | | | (45,916 | ) |
| | | 6 | | | United Parcel Service Inc | | 6/29/2018 - 8/9/2018 | | | — | | | | (5,691 | ) |
| | | 17 | | | United Rentals Inc | | 7/6/2018 - 10/31/2018 | | | — | | | | (73,470 | ) |
| | | 5 | | | United Therapeutics Corp | | 6/29/2018 - 8/9/2018 | | | — | | | | 12,718 | |
| | | 69 | | | United Utilities Group PLC | | 7/26/2018 - 10/19/2018 | | | — | | | | (1,140 | ) |
| | | 8 | | | Universal Display Corp | | 6/29/2018 - 7/16/2018 | | | — | | | | (18,934 | ) |
| | | 16 | | | Universal Health Services Inc | | 6/29/2018 - 9/4/2018 | | | — | | | | (19,073 | ) |
| | | 51 | | | UPM-Kymmene OYJ | | 7/26/2018 | | | — | | | | 133,671 | |
| | | 55 | | | Urban Outfitters Inc | | 6/29/2018 - 10/31/2018 | | | — | | | | (133,766 | ) |
| | | 2 | | | Vail Resorts Inc | | 10/31/2018 | | | — | | | | 7,667 | |
| | | 40 | | | Valeant Pharmaceuticals International Inc | | 9/27/2018 - 10/31/2018 | | | — | | | | (181,459 | ) |
| | | 24 | | | VeriSign Inc | | 7/6/2018 - 9/14/2018 | | | — | | | | 182,354 | |
| | | 8 | | | Verisk Analytics Inc | | 10/19/2018 | | | — | | | | (15,900 | ) |
| | | 13 | | | Vermilion Energy Inc | | 9/27/2018 - 10/31/2018 | | | — | | | | 12,366 | |
| | | — | * | | Vestas Wind Systems A/S | | 9/4/2018 | | | — | | | | 1,054 | |
| | | 14 | | | ViaSat Inc | | 7/16/2018 - 10/19/2018 | | | — | | | | 26,601 | |
| | | 9 | | | VMware Inc | | 6/29/2018 - 8/9/2018 | | | — | | | | 49,633 | |
| | | 212 | | | Vodafone Group PLC | | 7/5/2018 - 8/9/2018 | | | — | | | | (3,140 | ) |
| | | 10 | | | voestalpine AG | | 7/26/2018 - 10/19/2018 | | | — | | | | 10,049 | |
| | | 43 | | | Voya Financial Inc | | 6/29/2018 - 10/9/2018 | | | — | | | | (16,077 | ) |
| | | 11 | | | Vulcan Materials Co | | 6/29/2018 - 9/27/2018 | | | — | | | | (65,641 | ) |
| | | 28 | | | VWR Corp | | 7/6/2018 - 8/17/2018 | | | — | | | | (1,721 | ) |
| | | 9 | | | Wal-Mart Stores Inc | | 7/6/2018 - 8/9/2018 | | | — | | | | 22,647 | |
| | | 7 | | | Walt Disney Co/The | | 6/29/2018 - 8/9/2018 | | | — | | | | 8,453 | |
| | | 10 | | | Waste Management Inc | | 7/6/2018 - 8/9/2018 | | | — | | | | 27,884 | |
| | | 4 | | | Waters Corp | | 6/29/2018 - 8/9/2018 | | | — | | | | (69,066 | ) |
| | | 65 | | | Weatherford International PLC | | 7/2/2018 - 8/9/2018 | | | — | | | | 75,079 | |
| | | 61 | | | Weir Group PLC/The | | 9/14/2018 - 11/5/2018 | | | — | | | | 9,356 | |
| | | 18 | | | WellCare Health Plans Inc | | 6/29/2018 - 8/9/2018 | | | — | | | | (41,416 | ) |
| | | 9 | | | Wesfarmers Ltd | | 6/29/2018 | | | — | | | | (25,146 | ) |
| | | 4 | | | West Japan Railway Co | | 7/2/2018 - 7/17/2018 | | | — | | | | 11,346 | |
| | |
| The accompanying notes are an integral part of these financial statements. | | 45 |
GOLDMAN SACHS MULTI-MANAGER ALTERNATIVES FUND
Consolidated Schedule of Investments (continued)
October 31, 2016
|
| ADDITIONAL INVESTMENT INFORMATION (continued) |
OVER THE COUNTER TOTAL RETURN SWAPS (continued)#
| | | | | | | | | | | | | | | | |
| | | | | | | | | | Market Value | |
| Counterparty | | Notional
Amount
(000s) | | | Reference Security | | Termination Date | | Upfront Payments Made (Received) | | | Unrealized
Gain (Loss) | |
JPMorgan Securities, Inc. (continued) | | $ | 1 | | | West Pharmaceutical Services Inc | | 10/31/2018 | | $ | — | | | $ | (6,312 | ) |
| | | 1 | | | Western Union Co/The | | 7/6/2018 | | | — | | | | 3 | |
| | | — | * | | White Mountains Insurance Group Ltd | | 9/27/2018 | | | — | | | | (54 | ) |
| | | 3 | | | Whitecap Resources Inc | | 9/14/2018 | | | — | | | | (1,532 | ) |
| | | 68 | | | William Demant Holding A/S | | 6/29/2018 - 10/31/2018 | | | — | | | | 79,240 | |
| | | 96 | | | William Hill PLC | | 9/27/2018 - 10/9/2018 | | | — | | | | 1,438 | |
| | | 12 | | | Williams-Sonoma Inc | | 6/29/2018 - 8/9/2018 | | | — | | | | (27,673 | ) |
| | | 10 | | | Willis Towers Watson PLC | | 6/29/2018 - 8/20/2018 | | | — | | | | 33,814 | |
| | | 21 | | | Woodward Inc | | 6/29/2018 - 10/31/2018 | | | — | | | | (7,862 | ) |
| | | 47 | | | Woolworths Ltd | | 9/27/2018 | | | — | | | | (12,158 | ) |
| | | 7 | | | Workday Inc | | 7/2/2018 - 8/17/2018 | | | — | | | | 7,063 | |
| | | 29 | | | World Fuel Services Corp | | 6/29/2018 - 9/4/2018 | | | — | | | | (163,948 | ) |
| | | 8 | | | Worthington Industries Inc | | 10/9/2018 | | | — | | | | (11,984 | ) |
| | | 39 | | | WPP PLC | | 7/26/2018 | | | — | | | | (5,487 | ) |
| | | 57 | | | WPX Energy Inc | | 10/9/2018 | | | — | | | | (85,637 | ) |
| | | 11 | | | Wynn Resorts Ltd | | 6/29/2018 - 7/26/2018 | | | — | | | | 21,357 | |
| | | 131 | | | Xerox Corp | | 6/29/2018 - 7/26/2018 | | | — | | | | 5,743 | |
| | | 13 | | | XL Group Ltd | | 7/25/2018 | | | — | | | | 6,294 | |
| | | 12 | | | XPO Logistics Inc | | 9/4/2018 - 10/19/2018 | | | — | | | | 39,331 | |
| | | 152 | | | Yahoo Japan Corp | | 7/2/2018 - 10/22/2018 | | | — | | | | 12,168 | |
| | | 36 | | | Yamaha Motor Co Ltd | | 7/5/2018 - 10/22/2018 | | | — | | | | (51,097 | ) |
| | | 13 | | | Yamazaki Baking Co Ltd | | 10/11/2018 | | | — | | | | (19,215 | ) |
| | | 38 | | | Yara International ASA | | 6/29/2018 - 10/9/2018 | | | — | | | | 128,388 | |
| | | 27 | | | Yue Yuen Industrial Holdings Ltd | | 6/29/2018 | | | — | | | | 1,057 | |
| | | 41 | | | Zayo Group Holdings Inc | | 6/29/2018 - 10/19/2018 | | | — | | | | (42,977 | ) |
| | | 8 | | | Zimmer Biomet Holdings Inc | | 6/29/2018 - 7/26/2018 | | | — | | | | 161,935 | |
| | | 46 | | | Zions Bancorporation | | 6/29/2018 - 7/26/2018 | | | — | | | | 45,290 | |
| | | 3 | | | Zurich Insurance Group AG | | 10/19/2018 | | | — | | | | (15,304 | ) |
Morgan Stanley & Co. | | | 321 | | | Advanced Drainage Systems, Inc. | | 12/18/17 | | | (2,529 | ) | | | 64,736 | |
| | | 379 | | | Align Technology, Inc. | | 12/18/17 | | | (491 | ) | | | (44,121 | ) |
| | | 442 | | | Banco Santander SA | | 12/18/17 | | | (1,918 | ) | | | 10,138 | |
| | | 226 | | | C.H. Robinson Worldwide, Inc. | | 12/18/17 | | | (136 | ) | | | 9,911 | |
| | | 723 | | | Cardtronics, Inc. | | 12/18/17 | | | (1,418 | ) | | | (235,949 | ) |
| | | 423 | | | CGI Group Inc. — Class A | | 12/18/17 | | | (4,037 | ) | | | (975 | ) |
| | | 393 | | | Credit Acceptance Corp. | | 12/18/17 | | | (2,362 | ) | | | 8,719 | |
| | | 319 | | | Cullen/Frost Bankers, Inc. | | 12/18/17 | | | (2,063 | ) | | | (38,174 | ) |
| | | 314 | | | Dean Foods Co. | | 12/18/17 | | | (10,487 | ) | | | 8,110 | |
| | | 734 | | | Deere & Co. | | 12/18/17 | | | — | | | | (47,384 | ) |
| | | 556 | | | Dollarama, Inc. | | 12/18/17 | | | (15,339 | ) | | | (72,473 | ) |
| | | 508 | | | Edgewell Personal Care Co. | | 12/18/17 | | | (2,434 | ) | | | 38,282 | |
| | | 271 | | | Financial Engine, Inc. | | 12/18/17 | | | — | | | | (4,606 | ) |
| | | 215 | | | Gogo, Inc. | | 12/18/17 | | | (3,094 | ) | | | 37,319 | |
| | | 273 | | | HA CFD | | 12/18/17 | | | — | | | | 18,133 | |
| | | 856 | | | Healthcare Services Group | | 12/18/17 | | | (45,677 | ) | | | (41,613 | ) |
| | | 484 | | | Hormel Foods, Corp. | | 12/18/17 | | | (34,457 | ) | | | 30,960 | |
| | | 240 | | | Idexx Laboratories, Inc. | | 12/15/17 | | | (1,312 | ) | | | (27,547 | ) |
| | |
| 46 | | The accompanying notes are an integral part of these financial statements. |
GOLDMAN SACHS MULTI-MANAGER ALTERNATIVES FUND
|
| ADDITIONAL INVESTMENT INFORMATION (continued) |
OVER THE COUNTER TOTAL RETURN SWAPS (continued)#
| | | | | | | | | | | | | | | | |
| | | | | | | | | | Market Value | |
| Counterparty | | Notional
Amount
(000s) | | | Reference Security | | Termination Date | | Upfront Payments Made (Received) | | | Unrealized
Gain (Loss) | |
Morgan Stanley & Co. (continued) | | $ | 297 | | | Investors Real Estate Trust | | 12/18/17 | | $ | (2,750 | ) | | $ | 7,285 | |
| | | 568 | | | iShares China Large Cap ETF | | 12/18/17 | | | — | | | | (108,267 | ) |
| | | 1,166 | | | iShares MSCI Eurozone ETF | | 12/18/17 | | | (10,585 | ) | | | (84,743 | ) |
| | | 758 | | | iShares Nasdaq Biotechnology | | 12/18/17 | | | — | | | | 72,286 | |
| | | 1,817 | | | iShares Russell 2000 | | 12/18/17 | | | (11,130 | ) | | | (52,896 | ) |
| | | 213 | | | Kilroy Realty Corp. | | 12/18/17 | | | — | | | | (7,711 | ) |
| | | 573 | | | Lincoln Electric Holdings | | 12/18/17 | | | (5,944 | ) | | | (147,960 | ) |
| | | 575 | | | Now, Inc. | | 12/18/17 | | | (33,185 | ) | | | (107,332 | ) |
| | | 664 | | | Petmed Express, Inc. | | 12/18/17 | | | (680 | ) | | | (91,143 | ) |
| | | 638 | | | Primerica, Inc. | | 12/18/17 | | | (167 | ) | | | 11,142 | |
| | | 326 | | | Ritchie Bros Auctioneers | | 12/18/17 | | | (48 | ) | | | (43,669 | ) |
| | | 684 | | | Sirius Xm Radio, Inc. | | 12/18/17 | | | (395 | ) | | | (62,233 | ) |
| | | 448 | | | Smith (A.O.) Corp. | | 12/18/17 | | | (13,597 | ) | | | (31,673 | ) |
| | | 479 | | | SPDR S&P Regional Banking | | 12/18/17 | | | (40,104 | ) | | | (60,485 | ) |
| | | 177 | | | Trupanion, Inc. | | 12/18/17 | | | (430 | ) | | | (7,246 | ) |
| | | 499 | | | United Parcel Service — Class B | | 12/18/17 | | | (2,720 | ) | | | (26,479 | ) |
| | | 472 | | | Western Union Co. | | 12/18/17 | | | (608 | ) | | | (7,602 | ) |
| | | | 169 | | | World Wrestling Entertainment —
Class A | | 12/18/17 | | | (4,499 | ) | | | 17,347 | |
| TOTAL | | | | | | | | | | $ | (254,596 | ) | | $ | 489,397 | |
| | * | | Rounds to less than 1,000. |
| | # | | The Fund receives annual coupon payments in accordance with the swap contract(s). On the termination date of the swap contract(s), the Fund will either receive from or pay to the counterparty an amount equal to the net of the accrued financing fees and the value of the reference security subtracted from the original notional cost (notional multiplied by the price change of the reference security, converted to U.S. Dollars). |
| | ^ | | Contracts subject to $0.857 financing fee. |
| | |
| The accompanying notes are an integral part of these financial statements. | | 47 |
GOLDMAN SACHS MULTI-MANAGER ALTERNATIVES FUND
Consolidated Schedule of Investments (continued)
October 31, 2016
|
| ADDITIONAL INVESTMENT INFORMATION (continued) |
JOINT REPURCHASE AGREEMENT ACCOUNT II — At October 31, 2016, the Fund had undivided interests in the Joint Repurchase Agreement Account II, with a maturity date of November 1, 2016, as follows:
| | | | |
| Principal Amount | | Maturity Value | | Collateral Allocation Value |
| $ 536,500,000 | | $536,505,785 | | $ 547,230,010 |
REPURCHASE AGREEMENTS — At October 31, 2016, the Principal Amount of the Fund’s interest in the Joint Repurchase Agreement Account II was as follows:
| | | | | | | | |
| Counterparty | | Interest Rate | | | Principal Amounts | |
BNP Paribas Securities Co. | | | 0.340 | % | | $ | 1,639,956 | |
Citigroup Global Markets, Inc. | | | 0.340 | | | | 96,991,703 | |
Merrill Lynch & Co., Inc. | | | 0.340 | | | | 388,123,000 | |
Merrill Lynch & Co., Inc. | | | 0.320 | | | | 49,745,341 | |
| TOTAL | | | | | | $ | 536,500,000 | |
At October 31, 2016, the Joint Repurchase Agreement Account II was fully collateralized by:
| | | | | | | | |
| Issuer | | Interest Rates | | | Maturity Dates | |
Federal Home Loan Mortgage Corp. | | | 3.500% to 8.000 | % | | | 01/01/17 to 08/01/46 | |
Federal National Mortgage Association | | | 2.500 to 9.000 | | | | 02/01/17 to 10/01/46 | |
Government National Mortgage Association | | | 2.500 to 7.500 | | | | 02/15/25 to 10/20/46 | |
United States Treasury Inflation Protected Securities | | | 0.750 | | | | 02/15/42 | |
U.S. Treasury Bonds | | | 3.125 to 8.750 | | | | 08/15/20 to 05/15/44 | |
U.S. Treasury Notes | | | 0.875 to 4.250 | | | | 11/15/17 to 07/31/23 | |
United States Treasury Stripped Securities | | | 0.000 | | | | 02/15/29 | |
| | |
| 48 | | The accompanying notes are an integral part of these financial statements. |
GOLDMAN SACHS MULTI-MANAGER ALTERNATIVES FUND
Consolidated Statement of Assets and Liabilities(a)
October 31, 2016
| | | | | | |
| | Assets: | | | | |
| | Investments, at value (cost $505,193,048) | | $ | 511,948,746 | |
| | Investments of affiliated issuers, at value (cost $28,130,434) | | | 28,130,434 | |
| | Repurchase agreement, at value which equals cost | | | 536,500,000 | |
| | Cash | | | 11,224,121 | |
| | Foreign currencies, at value (cost $123,457) | | | 118,199 | |
| | Unrealized gain on swap contracts | | | 15,197,409 | |
| | Unrealized gain on forward foreign currency exchange contracts | | | 6,924,265 | |
| | Variation margin on certain derivative contracts | | | 1,528,233 | |
| | Receivables: | | | | |
| | Collateral on certain derivative contracts(b) | | | 143,592,147 | |
| | Dividends and interest | | | 5,311,854 | |
| | Investments sold | | | 4,497,321 | |
| | Investments sold on an extended settlement basis | | | 1,676,066 | |
| | Fund shares sold | | | 1,547,955 | |
| | Reimbursement from investment adviser | | | 545,111 | |
| | Upfront payments made on swap contracts | | | 238,337 | |
| | Foreign tax reclaims | | | 87,680 | |
| | Other assets | | | 208,228 | |
| | Total assets | | | 1,269,276,106 | |
| | | | | | |
| | Liabilities: | | | | |
| | Securities sold short, at value (proceeds received $31,848,851) | | | 32,157,016 | |
| | Unrealized loss on swap contracts | | | 14,907,037 | |
| | Unrealized loss on forward foreign currency exchange contracts | | | 5,577,732 | |
| | Variation margin on certain derivative contracts | | | 396,056 | |
| | Unrealized loss on unfunded loan commitment | | | 1,894 | |
| | Payables: | | | | |
| | Investments purchased on an extended settlement basis | | | 7,940,804 | |
| | Fund shares redeemed | | | 4,448,128 | |
| | Investments purchased | | | 2,807,983 | |
| | Management fees | | | 1,878,691 | |
| | Due to broker — upfront payment | | | 332,385 | |
| | Upfront payments received on swap contracts | | | 254,596 | |
| | Distribution and service fees and transfer agency fees | | | 150,828 | |
| | Dividend expense payable on securities sold short | | | 51,542 | |
| | Accrued expenses and other liabilities | | | 1,339,364 | |
| | Total liabilities | | | 72,244,056 | |
| | | | | | |
| | Net Assets: | | | | |
| | Paid-in capital | | | 1,263,888,533 | |
| | Undistributed net investment income | | | 17,379,101 | |
| | Accumulated net realized loss | | | (89,770,405 | ) |
| | Net unrealized gain | | | 5,534,821 | |
| | | NET ASSETS | | $ | 1,197,032,050 | |
| | | Net Assets: | | | | |
| | | Class A | | $ | 134,843,470 | |
| | | Class C | | | 49,333,685 | |
| | | Institutional | | | 903,811,890 | |
| | | Class IR | | | 108,924,086 | |
| | | Class R | | | 118,919 | |
| | | Total Net Assets | | $ | 1,197,032,050 | |
| | | Shares Outstanding $0.001 par value (unlimited number of shares authorized): | | | | |
| | | Class A | | | 13,156,840 | |
| | | Class C | | | 4,925,478 | |
| | | Institutional | | | 87,466,991 | |
| | | Class IR | | | 10,576,616 | |
| | | Class R | | | 11,686 | |
| | | Net asset value, offering and redemption price per share:(c) | | | | |
| | | Class A | | | $10.25 | |
| | | Class C | | | 10.02 | |
| | | Institutional | | | 10.33 | |
| | | Class IR | | | 10.30 | |
| | | Class R | | | 10.18 | |
| | (a) | | Statement of Assets and Liabilities for the Fund is consolidated and includes the balances of two wholly-owned subsidiaries, Cayman Commodity — MMA, Ltd. and Cayman Commodity — MMA II, Ltd. Accordingly, all interfund balances and transactions have been eliminated. |
| | (b) | | Includes segregated cash of $22,050,416, $10,583,256, $ 98,270,000, and $12,688,475 relating to initial margin requirements and/or collateral on futures, forwards, swaps, and short sales transactions, respectively. |
| | (c) | | Maximum public offering price per share for Class A Shares is $10.85. At redemption, Class C Shares may be subject to a contingent deferred sales charge, assessed on the amount equal to the lesser of the current net asset value or the original purchase price of the shares. |
| | |
| The accompanying notes are an integral part of these financial statements. | | 49 |
GOLDMAN SACHS MULTI-MANAGER ALTERNATIVES FUND
Consolidated Statement of Operations(a)
For the Fiscal Year Ended October 31, 2016
| | | | | | |
| | Investment income: | |
| | Interest | | $ | 35,642,369 | |
| | Dividends — unaffiliated issuers (net of foreign withholding taxes of $132,405) | | | 7,294,642 | |
| | Dividends — affiliated issuers | | | 232 | |
| | Total investment income | | | 42,937,243 | |
| | | | | | |
| | Expenses: | |
| | Management fees | | | 26,794,403 | |
| | Dividend expense for securities sold short | | | 2,015,023 | |
| | Custody, accounting and administrative services | | | 1,342,978 | |
| | Transfer Agency fees(b) | | | 1,077,011 | |
| | Distribution and Service fees(b) | | | 1,066,354 | |
| | Prime broker fees | | | 1,353,423 | |
| | Professional fees | | | 879,726 | |
| | Printing and mailing costs | | | 452,949 | |
| | Registration fees | | | 272,906 | |
| | Trustee fees | | | 201,733 | |
| | Other | | | 537,227 | |
| | Total expenses | | | 35,993,733 | |
| | Less — expense reductions | | | (2,856,696 | ) |
| | Net expenses | | | 33,137,037 | |
| | NET INVESTMENT INCOME | | | 9,800,206 | |
| | | | | | |
| | Realized and unrealized gain (loss): | |
| | Net realized gain (loss) from: | | | | |
| | Investments | | | (45,633,663 | ) |
| | Securities short sales | | | (593,570 | ) |
| | Futures contracts | | | (5,228,568 | ) |
| | Swap contracts | | | (899,367 | ) |
| | Forward foreign currency exchange contracts | | | (990,921 | ) |
| | Foreign currency transactions | | | 276,739 | |
| | Net change in unrealized gain (loss) on: | | | | |
| | Investments (including the effects of the net change in the foreign capital gains tax liability of $11,187) | | | 30,280,532 | |
| | Securities short sales | | | 496,119 | |
| | Unfunded loan commitments | | | (1,894 | ) |
| | Futures contracts | | | (5,250,814 | ) |
| | Swap contracts | | | 355,591 | |
| | Forward foreign currency exchange contracts | | | 7,287,778 | |
| | Foreign currency translation | | | (49,149 | ) |
| | Net realized and unrealized loss | | | (19,951,187 | ) |
| | NET DECREASE IN NET ASSETS RESULTING FROM OPERATIONS | | $ | (10,150,981 | ) |
| | (a) | | Statement of Operations for the Fund is consolidated and includes the balances of two wholly-owned subsidiaries, Cayman Commodity — MMA, Ltd. and Cayman Commodity — MMA II, Ltd. Accordingly, all interfund balances and transactions have been eliminated. |
| | (b) | | Class specific Distribution and Service, and Transfer Agency fees were as follows: |
| | | | | | | | | | | | | | | | | | | | | | | | | | | | | | |
| Distribution and Service Fees | | | Transfer Agent Fees | |
Class A | | | Class C | | | Class R | | | Class A | | | Class C | | | Institutional | | | Class IR | | | Class R | |
| $ | 431,815 | | | $ | 633,672 | | | $ | 867 | | | $ | 328,179 | | | $ | 120,398 | | | $ | 423,692 | | | $ | 204,412 | | | $ | 330 | |
| | |
| 50 | | The accompanying notes are an integral part of these financial statements. |
GOLDMAN SACHS MULTI-MANAGER ALTERNATIVES FUND
Consolidated Statements of Changes in Net Assets(a)
| | | | | | | | | | | | | | |
| | | | | For the Fiscal
Year Ended
October 31, 2016 | | | For the Period January 1, 2015 - October 31, 2015(b) | | | For the Fiscal
Year Ended
December 31, 2014 | |
| | From operations: | | | | | | | | | | | | |
| | Net investment income (loss) | | $ | 9,800,206 | | | $ | (11,038 | ) | | $ | (1,200,803 | ) |
| | Net realized gain (loss) | | | (53,069,350 | ) | | | (28,985,594 | ) | | | 14,697,248 | |
| | Net change in unrealized gain (loss) | | | 33,118,163 | | | | (35,547,596 | ) | | | 1,595,908 | |
| | Net increase (decrease) in net assets resulting from operations | | | (10,150,981 | ) | | | (64,544,228 | ) | | | 15,092,353 | |
| | | | | | | | | | | | | | |
| | Distributions to shareholders: | | | | | | | | | | | | |
| | From net investment income | | | | | | | | | | | | |
| | Class A Shares | | | (204,033 | ) | | | — | | | | (394,559 | ) |
| | Class C Shares | | | — | | | | — | | | | (17,831 | ) |
| | Institutional Shares | | | (4,424,446 | ) | | | — | | | | (3,996,787 | ) |
| | Class IR Shares | | | (288,398 | ) | | | — | | | | (251,033 | ) |
| | Class R Shares | | | (639 | ) | | | — | | | | (9 | ) |
| | From net realized gains | | | | | | | | | | | | |
| | Class A Shares | | | (934,629 | ) | | | — | | | | (1,229,026 | ) |
| | Class C Shares | | | (351,627 | ) | | | — | | | | (408,632 | ) |
| | Institutional Shares | | | (5,388,275 | ) | | | — | | | | (6,672,737 | ) |
| | Class IR Shares | | | (511,792 | ) | | | — | | | | (324,476 | ) |
| | Class R Shares | | | (1,298 | ) | | | — | | | | (326 | ) |
| | Total distributions to shareholders | | | (12,105,137 | ) | | | — | | | | (13,295,416 | ) |
| | | | | | | | | | | | | | |
| | From share transactions: | | | | | | | | | | | | |
| | Proceeds from sales of shares | | | 557,864,388 | | | | 1,468,001,874 | | | | 814,465,224 | |
| | Reinvestment of distributions | | | 11,328,743 | | | | — | | | | 13,076,031 | |
| | Cost of shares redeemed | | | (1,003,351,675 | ) | | | (576,132,576 | ) | | | (193,873,429 | ) |
| | Net increase (decrease) in net assets resulting from share transactions | | | (434,158,544 | ) | | | 891,869,298 | | | | 633,667,826 | |
| | TOTAL INCREASE (DECREASE) | | | (456,414,662 | ) | | | 827,325,070 | | | | 635,464,763 | |
| | | | | | | | | | | | | | |
| | Net assets: | | | | | | | | | | | | |
| | Beginning of year | | | 1,653,446,712 | | | | 826,121,642 | | | | 190,656,879 | |
| | End of year | | $ | 1,197,032,050 | | | $ | 1,653,446,712 | | | $ | 826,121,642 | |
| | Undistributed (distributions in excess of) net investment income (loss) | | $ | 17,379,101 | | | $ | 9,653,507 | | | $ | (724,059 | ) |
| | (a) | | Statements of Changes in Net Assets for the Fund is consolidated and includes the balances of two wholly-owned subsidiaries, Cayman Commodity — MMA, Ltd. and Cayman Commodity — MMA II, Ltd. Accordingly, all interfund balances and transactions have been eliminated. |
| | (b) | | The Fund changed its fiscal year end from December 31 to October 31. |
| | |
| The accompanying notes are an integral part of these financial statements. | | 51 |
GOLDMAN SACHS MULTI-MANAGER ALTERNATIVES FUND
Consolidated Financial Highlights
Selected Data for a Share Outstanding Throughout Each Period
| | | | | | | | | | | | | | | | | | | | | | | | | | | | | | |
| | | | | | | | Income (loss) from
investment operations | | | Distributions
to shareholders | |
| | | Year - Share Class | | Net asset
value,
beginning
of year | | | Net
investment
income (loss)(a) | | | Net realized
and unrealized
gain (loss) | | | Total from
investment
operations | | | From net
investment
income | | | From net
realized
gains | | | Total
distributions | |
| | FOR THE FISCAL YEAR ENDED OCTOBER 31, | |
| | 2016 - A | | $ | 10.33 | | | $ | 0.04 | | | $ | (0.06 | ) | | $ | (0.02 | ) | | $ | (0.01 | ) | | $ | (0.05 | ) | | $ | (0.06 | ) |
| | 2016 - C | | | 10.16 | | | | (0.04 | ) | | | (0.05 | ) | | | (0.09 | ) | | | — | | | | (0.05 | ) | | | (0.05 | ) |
| | 2016 - Institutional | | | 10.40 | | | | 0.08 | | | | (0.07 | ) | | | 0.01 | | | | (0.03 | ) | | | (0.05 | ) | | | (0.08 | ) |
| | 2016 - IR | | | 10.37 | | | | 0.07 | | | | (0.07 | ) | | | — | | | | (0.02 | ) | | | (0.05 | ) | | | (0.07 | ) |
| | 2016 - R | | | 10.29 | | | | 0.01 | | | | (0.05 | ) | | | (0.04 | ) | | | (0.02 | ) | | | (0.05 | ) | | | (0.07 | ) |
| | | | | | | | | | | | | | | | | | | | | | | | | | | | | | |
| | FOR THE PERIOD JANUARY 1 , 2015 - OCTOBER 31, | |
| | 2015 - A | | | 10.58 | | | | (0.03 | ) | | | (0.22 | ) | | | (0.25 | ) | | | — | | | | — | | | | — | |
| | 2015 - C | | | 10.47 | | | | (0.09 | ) | | | (0.22 | ) | | | (0.31 | ) | | | — | | | | — | | | | — | |
| | 2015 - Institutional | | | 10.61 | | | | 0.01 | | | | (0.22 | ) | | | (0.21 | ) | | | — | | | | — | | | | — | |
| | 2015 - IR | | | 10.60 | | | | — | (e) | | | (0.23 | ) | | | (0.23 | ) | | | — | | | | — | | | | — | |
| | 2015 - R | | | 10.56 | | | | (0.04 | ) | | | (0.23 | ) | | | (0.27 | ) | | | — | | | | — | | | | — | |
| | | | | | | | | | | | | | | | | | | | | | | | | | | | | | |
| | FOR THE FISCAL YEAR ENDED DECEMBER 31, | |
| | 2014 - A | | | 10.46 | | | | (0.06 | ) | | | 0.33 | | | | 0.27 | | | | (0.03 | ) | | | (0.12 | ) | | | (0.15 | ) |
| | 2014 - C | | | 10.40 | | | | (0.14 | ) | | | 0.33 | | | | 0.19 | | | | — | (e) | | | (0.12 | ) | | | (0.12 | ) |
| | 2014 - Institutional | | | 10.49 | | | | (0.01 | ) | | | 0.31 | | | | 0.30 | | | | (0.06 | ) | | | (0.12 | ) | | | (0.18 | ) |
| | 2014 - IR | | | 10.48 | | | | (0.03 | ) | | | 0.33 | | | | 0.30 | | | | (0.06 | ) | | | (0.12 | ) | | | (0.18 | ) |
| | 2014 - R | | | 10.44 | | | | (0.07 | ) | | | 0.31 | | | | 0.24 | | | | — | (e) | | | (0.12 | ) | | | (0.12 | ) |
| | | | | | | | | | | | | | | | | | | | | | | | | | | | | | |
| | FOR THE PERIOD ENDED DECEMBER 31, | |
| | 2013 - A (Commenced April 30, 2013) | | | 10.00 | | | | (0.03 | ) | | | 0.55 | | | | 0.52 | | | | — | | | | (0.06 | ) | | | (0.06 | ) |
| | 2013 - C (Commenced April 30, 2013) | | | 10.00 | | | | (0.08 | ) | | | 0.54 | | | | 0.46 | | | | — | | | | (0.06 | ) | | | (0.06 | ) |
| | 2013 - Institutional (Commenced April 30, 2013) | | | 10.00 | | | | (0.01 | ) | | | 0.56 | | | | 0.55 | | | | — | | | | (0.06 | ) | | | (0.06 | ) |
| | 2013 - IR (Commenced April 30, 2013) | | | 10.00 | | | | (0.01 | ) | | | 0.55 | | | | 0.54 | | | | — | | | | (0.06 | ) | | | (0.06 | ) |
| | 2013 - R (Commenced April 30, 2013) | | | 10.00 | | | | (0.06 | ) | | | 0.56 | | | | 0.50 | | | | — | | | | (0.06 | ) | | | (0.06 | ) |
| | (a) | | Calculated based on the average shares outstanding methodology. |
| | (b) | | Assumes investment at the NAV at the beginning of the period, reinvestment of all dividends and distributions, a complete redemption of the investment at the NAV at the end of the period and no sales or redemption charges. Total returns would be reduced if a sales or redemption charge was taken into account. Returns do not reflect the of impact of taxes to shareholders relating to Fund distributions or the redemption of Fund shares. Total returns for periods less than one full year are not annualized. |
| | (c) | | The Fund’s portfolio turnover rate is calculated in accordance with regulatory requirements, without regard to transactions involving short term investments and certain derivatives. If such transactions were included, the Fund’s portfolio turnover rate may be higher. |
| | (e) | | Amount is less than $0.005 per share. |
| | |
| 52 | | The accompanying notes are an integral part of these financial statements. |
GOLDMAN SACHS MULTI-MANAGER ALTERNATIVES FUND
| | | | | | | | | | | | | | | | | | | | | | | | | | | | | | | | | | | | | | | | | | | | | | | | | | | | | | | | |
| | | | | | | | | | | | | | | | | |
| | | Net asset
value, end
of year | | | | | Total
return(b) | | | | | Net assets,
end of
year
(in 000s) | | | | | Ratio of
net expenses
to average
net assets
(including
dividend
expenses for
securities
sold short) | | | | | Ratio of
net expenses
to average
net assets
(excluding
dividend
expenses for
securities
sold short) | | | | | Ratio of
total expenses
to average
net assets
(including
dividend
expenses for
securities
sold short) | | | | | Ratio of
total expenses
(excluding
dividend
expenses for
securities
sold short) | | | | | | Ratio of
net investment
income (loss)
to average
net assets | | | | | | Portfolio
turnover
rate(c) | |
| | | | | | | | | | | | | | | | | | | | | | | | | | | | | | | | | | | | | | | | | | | | | | | | | | | | | | | | |
| | $ | 10.25 | | | | | | (0.23 | )% | | | | $ | 134,843 | | | | | | 2.65 | % | | | | | 2.51 | % | | | | | 2.85 | % | | | | | 2.70 | % | | | | | | | 0.39 | % | | | | | | | 73 | % |
| | | 10.02 | | | | | | (1.02 | ) | | | | | 49,334 | | | | | | 3.40 | | | | | | 3.26 | | | | | | 3.60 | | | | | | 3.46 | | | | | | | | (0.35 | ) | | | | | | | 73 | |
| | | 10.33 | | | | | | 0.13 | | | | | | 903,812 | | | | | | 2.25 | | | | | | 2.11 | | | | | | 2.45 | | | | | | 2.31 | | | | | | | | 0.81 | | | | | | | | 73 | |
| | | 10.30 | | | | | | (0.06 | ) | | | | | 108,924 | | | | | | 2.39 | | | | | | 2.25 | | | | | | 2.61 | | | | | | 2.47 | | | | | | | | 0.70 | | | | | | | | 73 | |
| | | 10.18 | | | | | | (0.40 | ) | | | | | 119 | | | | | | 2.91 | | | | | | 2.76 | | | | | | 3.11 | | | | | | 2.95 | | | | | | | | 0.07 | | | | | | | | 73 | |
| | | | | | | | | | | | | | | | | | | | | | | | | | | | | | | | | | | | | | | | | | | | | | | | | | | | | | | | |
| | | | | | | | | | | | | | | | | | | | | | | | | | | | | | | | | | | | | | | | | | | | | | | | | | | | | | | | |
| | | 10.33 | | | | | | (2.36 | ) | | | | | 217,307 | | | | | | 2.89 | (d) | | | | | 2.71 | (d) | | | | | 2.97 | (d) | | | | | 2.78 | (d) | | | | | | | (0.29 | )(d) | | | | | | | 130 | |
| | | 10.16 | | | | | | (2.87 | ) | | | | | 79,891 | | | | | | 3.64 | (d) | | | | | 3.46 | (d) | | | | | 3.72 | (d) | | | | | 3.53 | (d) | | | | | | | (1.04 | )(d) | | | | | | | 130 | |
| | | 10.40 | | | | | | (1.98 | ) | | | | | 1,236,592 | | | | | | 2.49 | (d) | | | | | 2.31 | (d) | | | | | 2.57 | (d) | | | | | 2.39 | (d) | | | | | | | 0.11 | (d) | | | | | | | 130 | |
| | | 10.37 | | | | | | (2.08 | ) | | | | | 119,570 | | | | | | 2.64 | (d) | | | | | 2.46 | (d) | | | | | 2.72 | (d) | | | | | 2.53 | (d) | | | | | | | (0.02 | )(d) | | | | | | | 130 | |
| | | 10.29 | | | | | | (2.56 | ) | | | | | 87 | | | | | | 3.14 | (d) | | | | | 2.96 | (d) | | | | | 3.24 | (d) | | | | | 3.05 | (d) | | | | | | | (0.49 | )(d) | | | | | | | 130 | |
| | | | | | | | | | | | | | | | | | | | | | | | | | | | | | | | | | | | | | | | | | | | | | | | | | | | | | | | |
| | | | | | | | | | | | | | | | | | | | | | | | | | | | | | | | | | | | | | | | | | | | | | | | | | | | | | | | |
| | | 10.58 | | | | | | 2.61 | | | | | | 116,593 | | | | | | 2.85 | | | | | | 2.68 | | | | | | 3.23 | | | | | | 3.06 | | | | | | | | (0.53 | ) | | | | | | | 144 | |
| | | 10.47 | | | | | | 1.84 | | | | | | 38,207 | | | | | | 3.64 | | | | | | 3.45 | | | | | | 3.99 | | | | | | 3.80 | | | | | | | | (1.33 | ) | | | | | | | 144 | |
| | | 10.61 | | | | | | 3.00 | | | | | | 628,397 | | | | | | 2.45 | | | | | | 2.28 | | | | | | 2.82 | | | | | | 2.65 | | | | | | | | (0.11 | ) | | | | | | | 144 | |
| | | 10.60 | | | | | | 2.85 | | | | | | 42,894 | | | | | | 2.62 | | | | | | 2.44 | | | | | | 3.06 | | | | | | 2.86 | | | | | | | | (0.27 | ) | | | | | | | 144 | |
| | | 10.56 | | | | | | 2.30 | | | | | | 30 | | | | | | 3.05 | | | | | | 2.91 | | | | | | 3.46 | | | | | | 3.32 | | | | | | | | (0.69 | ) | | | | | | | 144 | |
| | | | | | | | | | | | | | | | | | | | | | | | | | | | | | | | | | | | | | | | | | | | | | | | | | | | | | | | |
| | | | | | | | | | | | | | | | | | | | | | | | | | | | | | | | | | | | | | | | | | | | | | | | | | | | | | | | |
| | | 10.46 | | | | | | 5.20 | | | | | | 25,304 | | | | | | 2.55 | (d) | | | | | 2.55 | (d) | | | | | 3.88 | (d) | | | | | 3.88 | (d) | | | | | | | (0.42 | )(d) | | | | | | | 102 | |
| | | 10.40 | | | | | | 4.60 | | | | | | 1,427 | | | | | | 3.30 | (d) | | | | | 3.30 | (d) | | | | | 4.72 | (d) | | | | | 4.72 | (d) | | | | | | | (1.19 | )(d) | | | | | | | 102 | |
| | | 10.49 | | | | | | 5.40 | | | | | | 156,849 | | | | | | 2.15 | (d) | | | | | 2.15 | (d) | | | | | 3.64 | (d) | | | | | 3.64 | (d) | | | | | | | (0.17 | )(d) | | | | | | | 102 | |
| | | 10.48 | | | | | | 5.40 | | | | | | 7,051 | | | | | | 2.30 | (d) | | | | | 2.30 | (d) | | | | | 3.62 | (d) | | | | | 3.62 | (d) | | | | | | | (0.19 | )(d) | | | | | | | 102 | |
| | | 10.44 | | | | | | 5.00 | | | | | | 26 | | | | | | 2.79 | (d) | | | | | 2.79 | (d) | | | | | 4.36 | (d) | | | | | 4.36 | (d) | | | | | | | (0.90 | )(d) | | | | | | | 102 | |
| | |
| The accompanying notes are an integral part of these financial statements. | | 53 |
GOLDMAN SACHS MULTI-MANAGER ALTERNATIVES FUND
Notes to Financial Statements
October 31, 2016
Goldman Sachs Trust II (the “Trust”) is a Delaware statutory trust registered under the Investment Company Act of 1940, as amended (the “Act”), as an open-end management investment company. The Trust includes the Goldman Sachs Multi-Manager Alternatives Fund (the “Fund”). The Fund is a non-diversified portfolio and currently offers five classes of shares: Class A, Class C, Institutional, Class IR, and Class R Shares. The Fund commenced operations on April 30, 2013.
Class A Shares are sold with a front-end sales charge of up to 5.50%. Class C Shares are sold with a contingent deferred sales charge (“CDSC”) of 1.00%, which is imposed on redemptions made within 12 months of purchase. Institutional, Class IR and Class R Shares are not subject to a sales charge.
Goldman Sachs Asset Management, L.P. (“GSAM”), an affiliate of Goldman, Sachs & Co. (“Goldman Sachs”), serves as investment adviser to the Fund pursuant to a management agreement (the “Agreement”) with the Trust. As of October 31, 2016, GSAM had sub-advisory agreements (the “Sub-Advisory Agreements”) for the Fund with Acadian Asset Management LLC (“Acadian”), Algert Global LLC (“Algert”), Ares Capital Management II LLC (“Ares”), Atreaus Capital, LP (“Atreaus”), Brigade Capital Management, LP (“Brigade”), Corsair Capital Management, L.P. (“Corsair”), First Pacific Advisors, LLC (“FPA”), Graham Capital Management, L.P. (“GCM”), New Mountain Vantage Advisers, L.L.C. (“New Mountain Vantage”), QMS Capital Management LP (“QMS”), Russell Implementation Services, LLC (“RIIS”), Sirios Capital Management, L.P. (“Sirios”) and Wellington Management Company LLP (“Wellington”) (the “Underlying Managers”). Each of Atreaus and GCM also serves as an Underlying Manager for a Subsidiary (as defined below). Pursuant to the terms of the Sub-Advisory Agreements, the Underlying Managers are responsible for making investment decisions and managing the investments of the Fund. GSAM compensates the Underlying Managers directly in accordance with the terms of the Sub-Advisory Agreements. The Fund is not charged any separate or additional investment advisory fees by the Underlying Managers. As of January 4, 2016, Lateef Investment Management, L.P. (“Lateef”) no longer served as an Underlying Manager of the Fund. As of June 24, 2016, Polaris Capital Management, LLC (“Polaris”) no longer served as an Underlying Manager of the Fund.
|
| 2. SIGNIFICANT ACCOUNTING POLICIES |
The financial statements have been prepared in accordance with accounting principles generally accepted in the United States of America (“GAAP”) and require management to make estimates and assumptions that may affect the reported amounts and disclosures. Actual results may differ from those estimates and assumptions.
A. Basis of Consolidation for the Goldman Sachs Multi-Manager Alternatives Fund — The Cayman Commodity — MMA, Ltd. and the Cayman Commodity — MMA II, Ltd. (each a “Subsidiary” and together the “Subsidiaries”), Cayman Islands exempted companies, were incorporated on January 14, 2014 and March 2, 2016, respectively, and are wholly-owned subsidiaries of the Fund. The Subsidiaries act as investment vehicles for the Fund to enable the Fund to gain exposure to certain types of commodity-linked derivative instruments. The Fund is the sole shareholder of the Subsidiaries pursuant to subscription agreements dated as of September 3, 2015 and July 19, 2016, respectively, and it is intended that the Fund will remain the sole shareholder and will continue to control the Subsidiaries. Under the Memorandum and Articles of Association of each Subsidiary, shares issued by the Subsidiary confer upon a shareholder the right to vote at general meetings of the Subsidiary and certain rights in connection with any winding-up or repayment of capital, as well as the right to participate in the profits or assets of the Subsidiary. All inter-fund balances and transactions have been eliminated in consolidation. As of October 31, 2016, the Fund’s net assets were $1,197,032,050, of which, $28,447,957, or 2.4%, represented the Cayman Commodity — MMA, Ltd.’s net assets and $8,346,776, or 0.7%, represented the Cayman Commodity — MMA II, Ltd.’s net assets.
B. Investment Valuation — The Fund’s valuation policy is to value investments at fair value.
C. Investment Income and Investments — Investment income includes interest income, dividend income, net of any foreign withholding taxes, less any amounts reclaimable, and securities lending income. Interest income is accrued daily and adjusted for amortization of premiums and accretion of discounts. Dividend income is recognized on ex-dividend date or, for certain foreign securities, as soon as such information is obtained subsequent to the ex-dividend date. Investment transactions are reflected on trade date. Realized gains and losses are calculated using identified cost. Investment transactions are recorded on the following
54
GOLDMAN SACHS MULTI-MANAGER ALTERNATIVES FUND
|
| 2. SIGNIFICANT ACCOUNTING POLICIES (continued) |
business day for daily net asset value (“NAV”) calculations. Any foreign capital gains tax is accrued daily based upon net unrealized gains, and is payable upon sale of such investments. Distributions received from the Fund’s investments in U.S. real estate investment trusts (“REITs”) may be characterized as ordinary income, net capital gain or a return of capital. A return of capital is recorded by the Fund as a reduction to the cost basis of the REIT.
For derivative contracts, realized gains and losses are recorded upon settlement of the contract. Upfront payments, if any, are made or received upon entering into a swap agreement and are reflected in the Consolidated Statement of Assets and Liabilities. Upfront payments are recognized over the contract’s term/event as realized gains or losses, with the exception of forward starting interest rate swaps whose realized gains or losses are recognized from the effective start date.
For securities with paydown provisions, principal payments received are treated as a proportionate reduction to the cost basis of the securities, and excess or shortfall amounts are recorded as income. For treasury inflation protected securities (“TIPS”), adjustments to principal due to inflation/deflation are reflected as increases/decreases to interest income with a corresponding adjustment to cost.
D. Class Allocations and Expenses — Investment income, realized and unrealized gain (loss), and non-class specific expenses of the Fund are allocated daily based upon the proportion of net assets of each class. Non-class specific expenses directly incurred by the Fund are charged to the Fund, while such expenses incurred by the Trust are allocated across the Fund on a straight-line and/or pro-rata basis depending upon the nature of the expenses. Class specific expenses, where applicable, are borne by the respective share classes and include Distribution and Service, Transfer Agency and Service and Shareholder Administration fees.
E. Federal Taxes and Distributions to Shareholders — It is the Fund’s policy to comply with the requirements of the Internal Revenue Code of 1986, as amended (the “Code”), applicable to regulated investment companies (mutual funds) and to distribute each year substantially all of its investment company taxable income and capital gains to its shareholders. Accordingly, the Fund is not required to make any provisions for the payment of federal income tax. Distributions to shareholders are recorded on the ex-dividend date. Income and capital gains distributions, if any, are declared and paid annually.
Net capital losses are carried forward to future fiscal years and may be used to the extent allowed by the Code to offset any future capital gains. Losses that are carried forward will retain their character as either short-term or long-term capital losses. Utilization of capital loss carryforwards will reduce the requirement of future capital gains distributions.
The characterization of distributions to shareholders for financial reporting purposes is determined in accordance with federal income tax rules, which may differ from GAAP. The source of the Fund’s distributions may be shown in the accompanying financial statements as either from net investment income, net realized gain or capital. Certain components of the Fund’s net assets on the Consolidated Statement of Assets and Liabilities reflect permanent GAAP/tax differences based on the appropriate tax character.
F. Foreign Currency Translation — The accounting records and reporting currency of the Fund are maintained in U.S. dollars. Assets and liabilities denominated in foreign currencies are translated into U.S. dollars using the current exchange rates at the close of each business day. The effect of changes in foreign currency exchange rates on investments is included within net realized and unrealized gain (loss) on investments. Changes in the value of other assets and liabilities as a result of fluctuations in foreign exchange rates are included in the Consolidated Statement of Operations within net change in unrealized gain (loss) on foreign currency translations. Transactions denominated in foreign currencies are translated into U.S. dollars on the date the transaction occurred, the effects of which are included within net realized gain (loss) on foreign currency transactions.
|
| 3. INVESTMENTS AND FAIR VALUE MEASUREMENTS |
The fair value of a financial instrument is the amount that would be received to sell an asset or paid to transfer a liability in an orderly transaction between market participants at the measurement date (i.e., the exit price). GAAP establishes a fair value hierarchy that prioritizes the inputs to valuation techniques used to measure fair value. The hierarchy gives the highest priority to unadjusted quoted prices in active markets for identical assets or liabilities (Level 1 measurements) and the lowest priority to
55
GOLDMAN SACHS MULTI-MANAGER ALTERNATIVES FUND
Notes to Financial Statements (continued)
October 31, 2016
|
| 3. INVESTMENTS AND FAIR VALUE MEASUREMENTS (continued) |
unobservable inputs (Level 3 measurements). The levels used for classifying investments are not necessarily an indication of the risk associated with investing in these investments. The three levels of the fair value hierarchy are described below:
Level 1 — Unadjusted quoted prices in active markets that are accessible at the measurement date for identical, unrestricted assets or liabilities;
Level 2 — Quoted prices in markets that are not active or financial instruments for which significant inputs are observable (including, but not limited to, quoted prices for similar investments, interest rates, foreign exchange rates, volatility and credit spreads), either directly or indirectly;
Level 3 — Prices or valuations that require significant unobservable inputs (including GSAM’s assumptions in determining fair value measurement).
Changes in valuation techniques may result in transfers into or out of an assigned level within the hierarchy. In accordance with the Fund’s policy, transfers between different levels of the fair value hierarchy resulting from such changes are deemed to have occurred as of the beginning of the reporting period.
The Board of Trustees (“Trustees”) has approved Valuation Procedures that govern the valuation of the portfolio investments held by the Fund, including investments for which market quotations are not readily available. The Trustees have delegated to GSAM day-to-day responsibility for implementing and maintaining internal controls and procedures related to the valuation of the Fund’s portfolio investments. To assess the continuing appropriateness of pricing sources and methodologies, GSAM regularly performs price verification procedures and issues challenges as necessary to third party pricing vendors or brokers, and any differences are reviewed in accordance with the Valuation Procedures.
A. Level 1 and Level 2 Fair Value Investments — The valuation techniques and significant inputs used in determining the fair values for investments classified as Level 1 and Level 2 are as follows:
Equity Securities — Equity securities traded on a United States (“U.S.”) securities exchange or the NASDAQ system, or those located on certain foreign exchanges, including but not limited to the Americas, are valued daily at their last sale price or official closing price on the principal exchange or system on which they are traded. If there is no sale or official closing price or such price is believed by GSAM to not represent fair value, equity securities are valued at the last bid price for long positions and at the last ask price for short positions. To the extent these investments are actively traded, they are classified as Level 1 of the fair value hierarchy, otherwise they are generally classified as Level 2.
Unlisted equity securities for which market quotations are available are valued at the last sale price on the valuation date, or if no sale occurs, at the last bid price. Securities traded on certain foreign securities exchanges are valued daily at fair value determined by an independent fair value service (if available) under Valuation Procedures approved by the Trustees and consistent with applicable regulatory guidance. The independent fair value service takes into account multiple factors including, but not limited to, movements in the securities markets, certain depositary receipts, futures contracts and foreign currency exchange rates that have occurred subsequent to the close of the foreign securities exchange. These investments are generally classified as Level 2 of the fair value hierarchy.
Underlying Funds (including Money Market Funds) — Underlying Funds (“Underlying Funds”) include other investment companies and exchange-traded funds (“ETFs”). Investments in the Underlying Funds (except ETFs) are valued at the NAV per share of the Institutional Share class on the day of valuation. ETFs are valued daily at the last sale price or official closing price on the principal exchange or system on which the investment is traded. Because the Fund invests in Underlying Funds that fluctuate in value, the Fund’s shares will correspondingly fluctuate in value. To the extent these investments are actively traded, they are classified as Level 1 of the fair value hierarchy, otherwise they are generally classified as Level 2. For information regarding an Underlying Fund’s accounting policies and investment holdings, please see the Underlying Fund’s shareholder report.
Debt Securities — Debt securities for which market quotations are readily available are valued daily on the basis of quotations supplied by dealers or an independent pricing service approved by the Trustees. The pricing services may use valuation models or matrix pricing, which consider: (i) yield or price with respect to bonds that are considered comparable in characteristics such as rating, interest rate and maturity date or (ii) quotations from securities dealers to determine current value. Short-term debt
56
GOLDMAN SACHS MULTI-MANAGER ALTERNATIVES FUND
|
| 3. INVESTMENTS AND FAIR VALUE MEASUREMENTS (continued) |
obligations that mature in sixty days or less and that do not exhibit signs of credit deterioration are valued using available market quotations as provided by a third party pricing vendor or broker. Prior to October 11, 2016, such securities were valued at amortized cost. With the exception of treasury securities of G8 countries (not held in money market funds), which are generally classified as Level 1, these investments are generally classified as Level 2 of the fair value hierarchy.
i. Bank Loans — Bank loans (“Loans”) are interests in amounts owed by corporate, governmental, or other borrowers to lenders or lending syndicates. Loans are arranged through private negotiations between the borrower and one or more financial institutions (“Lenders”). The Fund’s investments in Loans are in the form of either participations in Loans (“Participations”) or assignments of all or a portion of Loans from third parties (“Assignments”). With respect to Participations, the Fund has the right to receive payments of principal, interest and any fees to which it is entitled from the Lender selling the Participations and only upon receipt by the Lender of the payments from the borrower. The Fund generally has no right to enforce compliance by the borrower with the terms of the loan agreement with respect to Participations. Conversely, Assignments result in the Fund having a direct contractual relationship with the borrower, and the Fund may be permitted to enforce compliance by the borrower with the terms of the loan agreement.
ii. Mortgage-Backed and Asset-Backed Securities — Mortgage-backed securities represent direct or indirect participations in, or are collateralized by and payable from, mortgage loans secured by residential and/or commercial real estate property. Asset-backed securities include securities whose principal and interest payments are collateralized by pools of other assets or receivables. The value of certain mortgage-backed and asset-backed securities (including adjustable rate mortgage loans) may be particularly sensitive to changes in prevailing interest rates. The value of these securities may also fluctuate in response to the market’s perception of the creditworthiness of the issuers.
Asset-backed securities may present credit risks that are not presented by mortgage-backed securities because they generally do not have the benefit of a security interest in collateral that is comparable to mortgage assets. Some asset-backed securities may only have a subordinated claim on collateral.
Stripped mortgage-backed securities are usually structured with two different classes: one that receives substantially all interest payments (interest-only, or “IO” and/or high coupon rate with relatively low principal amount, or “IOette”), and the other that receives substantially all principal payments (principal-only, or “PO”) from a pool of mortgage loans. Little to no principal will be received at the maturity of an IO; as a result, periodic adjustments are recorded to reduce the cost of the security until maturity. These adjustments are included in interest income.
Securities Sold Short — Securities sold short are those securities which a Fund has sold but which it does not own. When a Fund sells a security it does not own, it must borrow the position that was sold and deliver it to the broker through which it made the short sale. In addition, cash and certain investments in securities may be used to collateralize the securities sold short. Each day the securities sold short transaction is open, the liability to replace the borrowed security is marked to market and an unrealized gain or loss is recorded. While the transaction remains open, a Fund may also incur expenses for any dividends or interest which will be paid to the lender of the securities as well as a fee to borrow the delivered security. During the term of the short sale, the value of the securities pledged as collateral on short sales is required to exceed the value of the securities sold short. The market value of securities pledged as collateral is included in the Consolidated Schedule of Investments.
Derivative Contracts — A derivative is an instrument whose value is derived from underlying assets, indices, reference rates or a combination of these factors. The Fund enters into derivative transactions to hedge against changes in interest rates, securities prices, and/or currency exchange rates, to increase total return, or to gain access to certain markets or attain exposure to other underliers.
Exchange-traded derivatives, including futures and options contracts, are valued at the last sale or settlement price and typically fall within Level 1 of the fair value hierarchy. Over-the-counter (“OTC”) and centrally cleared derivatives are valued using market transactions and other market evidence, including market-based inputs to models, calibration to market-clearing transactions, broker or dealer quotations, or other alternative pricing sources. Where models are used, the selection of a particular model to value OTC and centrally cleared derivatives depends upon the contractual terms of, and specific risks inherent in, the instrument, as well as the availability of pricing information in the market. Valuation models require a variety of inputs, including
57
GOLDMAN SACHS MULTI-MANAGER ALTERNATIVES FUND
Notes to Financial Statements (continued)
October 31, 2016
|
| 3. INVESTMENTS AND FAIR VALUE MEASUREMENTS (continued) |
contractual terms, market prices, yield curves, credit curves, measures of volatility, voluntary and involuntary prepayment rates, loss severity rates and correlations of such inputs. For OTC and centrally cleared derivatives that trade in liquid markets, model inputs can generally be verified and model selection does not involve significant management judgment. OTC and centrally cleared derivatives are classified within Level 2 of the fair value hierarchy when significant inputs are corroborated by market evidence.
i. Forward Contracts — A forward contract is a contract between two parties to buy or sell an asset at a specified price on a future date. A forward contract settlement can occur on a cash or delivery basis. Forward contracts are marked-to-market daily using independent vendor prices, and the change in value, if any, is recorded as an unrealized gain or loss. Cash and certain investments may be used to collateralize forward contracts.
A forward foreign currency contract is a forward contract in which the Fund agrees to receive or deliver a fixed quantity of one currency for another, at a pre-determined price at a future date. All forward foreign currency exchange contracts are marked-to-market daily at the applicable forward rate. Non-deliverable forward foreign currency exchange contracts are settled with the counterparty in cash without the delivery of foreign currency.
ii. Futures Contracts — Futures contracts are contracts to buy or sell a standardized quantity of a specified commodity or security and are valued based on exchanged settlement prices or independent market quotes. Futures contracts are valued at the last settlement price, or in the absence of a sale, the last bid price for long positions and at the last ask price for short positions, at the end of each day on the board of trade or exchange upon which they are traded. Upon entering into a futures contract, the Fund deposits cash or securities in an account on behalf of the broker in an amount sufficient to meet the initial margin requirement. Subsequent payments are made or received by the Fund equal to the daily change in the contract value and are recorded as variation margin receivable or payable with a corresponding offset to unrealized gains or losses.
iii. Swap Contracts — Bilateral swap contracts are agreements in which a Fund and a counterparty agree to exchange periodic payments on a specified notional amount or make a net payment upon termination. Bilateral swap transactions are privately negotiated in the OTC market and payments are settled through direct payments between a Fund and the counterparty. By contrast, certain swap transactions are subject to mandatory central clearing. These swaps are executed through a derivatives clearing member (“DCM”), acting in an agency capacity, and submitted to a central counterparty (“CCP”) (“centrally cleared swaps”), in which case all payments are settled with the CCP through the DCM. Swaps are marked-to-market daily using pricing vendor quotations, counterparty or clearinghouse prices or model prices, and the change in value, if any, is recorded as an unrealized gain or loss. Upon entering into a swap contract, a Fund is required to satisfy an initial margin requirement by delivering cash or securities to the counterparty (or in some cases, segregated in a triparty account on behalf of the counterparty), which can be adjusted by any mark-to-market gains or losses pursuant to bilateral or centrally cleared arrangements. For centrally cleared swaps the daily change in valuation, if any, is recorded as a receivable or payable for variation margin.
A credit default swap is an agreement that involves one party (the buyer of protection) making a stream of payments to another party (the seller of protection) in exchange for the right to receive protection on a reference security or obligation, including a group of assets or exposure to the performance of an index. The Fund’s investment in credit default swaps may involve greater risks than if the Fund had invested in the referenced obligation directly. Credit events are contract specific but may include bankruptcy, failure to pay, restructuring and obligation acceleration. If the Fund buys protection through a credit default swap and no credit event occurs, its payments are limited to the periodic payments previously made to the counterparty. Upon the occurrence of a specified credit event, the Fund, as a buyer of credit protection, is entitled to receive an amount equal to the notional amount of the swap and deliver to the seller the defaulted reference obligation in a physically settled trade. The Fund may also receive a net settlement amount in the form of cash or securities equal to the notional amount of the swap reduced by the recovery value of the reference obligation in a cash settled trade.
As a seller of protection, the Fund generally receives a payment stream throughout the term of the swap, provided that there is no credit event. In addition, if the Fund sells protection through a credit default swap, the Fund could suffer a loss because the value of the referenced obligation and the premium payments received may be less than the notional amount of the swap paid to the buyer of protection. Upon the occurrence of a specified credit event, the Fund, as a seller of credit
58
GOLDMAN SACHS MULTI-MANAGER ALTERNATIVES FUND
|
| 3. INVESTMENTS AND FAIR VALUE MEASUREMENTS (continued) |
protection, may be required to take possession of the defaulted reference obligation and pay the buyer an amount equal to the notional amount of the swap in a physically settled trade. The Fund may also pay a net settlement amount in the form of cash or securities equal to the notional amount of the swap reduced by the recovery value of the reference obligation in a cash settled trade. Recovery values are at times established through the credit event auction process in which market participants are ensured that a transparent price has been set for the defaulted security or obligation. In addition, the Fund is entitled to a return of any assets, which have been pledged as collateral to the counterparty upon settlement.
The maximum potential amount of future payments (undiscounted) that the Fund as seller of protection could be required to make under a credit default swap would be an amount equal to the notional amount of the agreement. These potential amounts would be partially offset by any recovery values of the respective referenced obligations or net amounts received from a settlement of a credit default swap for the same reference security or obligation where the Fund bought credit protection.
A total return swap is an agreement that gives the Fund the right to receive the appreciation in the value of a specified security, index or other instrument in return for a fee paid to the counterparty, which will typically be an agreed upon interest rate. If the underlying asset declines in value over the term of the swap, the Fund may also be required to pay the dollar value of that decline to the counterparty.
Short Term Investments — As of the date of the financial statements, short-term investments having a maturity of 60 days or less are valued using available market quotations as provided by a third party pricing vendor or broker. Prior to October 11, 2016, such securities were valued at amortized cost. These investments are classified as Level 2 of the fair value hierarchy.
i. Repurchase Agreements — Repurchase agreements involve the purchase of securities subject to the seller’s agreement to repurchase the securities at a mutually agreed upon date and price, under the terms of a Master Repurchase Agreement (“MRA”). During the term of a repurchase agreement, the value of the underlying securities held as collateral on behalf of the Fund, including accrued interest is required to exceed the value of the repurchase agreement, including accrued interest. The gross value of repurchase agreements is included in the Consolidated Statement of Assets and Liabilities for financial reporting purposes. The underlying securities for all repurchase agreements are held at the Fund’s custodian or designated sub-custodians under tri-party repurchase agreements.
An MRA governs transactions between the Fund and select counterparties. An MRA contains provisions for, among other things, initiation of the transaction, income payments, events of default and maintenance of securities for repurchase agreements. An MRA also permits offsetting with collateral to create one single net payment in the event of default or similar events, including the bankruptcy or insolvency of a counterparty.
If the seller defaults, the Fund could suffer a loss to the extent that the proceeds from the sale of the underlying securities and other collateral held by the Fund are less than the repurchase price and the Fund’s costs associated with delay and enforcement of the repurchase agreement. In addition, in the event of default or insolvency of the seller, a court could determine that the Fund’s interest in the collateral is not enforceable, resulting in additional losses to the Fund.
Pursuant to exemptive relief granted by the Securities and Exchange Commission (“SEC”) and terms and conditions contained therein, the Fund, together with other funds of the Trust and registered investment companies having management agreements with GSAM or its affiliates, may transfer uninvested cash into joint accounts, the daily aggregate balance of which is invested in one or more repurchase agreements. Under these joint accounts, the Fund maintains pro-rata credit exposure to the underlying repurchase agreements’ counterparties. With the exception of certain transaction fees, the Fund is not subject to any expenses in relation to these investments.
B. Level 3 Fair Value Investments — To the extent that significant inputs to valuation models and other alternative pricing sources are unobservable, or if quotations are not readily available, or if GSAM believes that such quotations do not accurately reflect fair value, the fair value of the Fund’s investments may be determined under Valuation Procedures approved by the Trustees. GSAM, consistent with its procedures and applicable regulatory guidance, may make an adjustment to the most recent valuation prices of either domestic or foreign securities in light of significant events to reflect what it believes to be the fair value of the securities at the time of determining the Fund’s NAV. Significant events which could affect a large number of securities in a
59
GOLDMAN SACHS MULTI-MANAGER ALTERNATIVES FUND
Notes to Financial Statements (continued)
October 31, 2016
|
| 3. INVESTMENTS AND FAIR VALUE MEASUREMENTS (continued) |
particular market may include, but are not limited to: significant fluctuations in U.S. or foreign markets; market dislocations; market disruptions; or unscheduled market closings. Significant events which could also affect a single issuer may include, but are not limited to: corporate actions such as reorganizations, mergers and buy-outs; ratings downgrades; and bankruptcies.
To the extent investments are valued using single source broker quotations obtained directly from the broker or passed through from third party pricing vendors, such investments are classified as Level 3 investments. GSAM did not develop the unobservable inputs (examples include but are not limited to single source broker quotations, third party pricing, etc.) for the valuation of Level 3 Assets and Liabilities.
C. Fair Value Hierarchy — The following is a summary of the Fund’s investments and derivatives classified in the fair value hierarchy as of October 31, 2016:
| | | | | | | | | | | | |
| | | |
| MULTI-MANAGER ALTERNATIVES | | | | | | | | | | | | |
| | | |
| Investment Type | | Level 1 | | | Level 2 | | | Level 3 | |
| Assets | | | | | | | | | | | | |
Fixed Income | | | | | | | | | | | | |
Corporate Obligations | | $ | — | | | $ | 249,283,452 | | | $ | — | |
Bank Loans | | | — | | | | 54,465,146 | | | | 5,304,798 | |
Asset-Backed Securities | | | — | | | | 1,289,749 | | | | — | |
Foreign Debt Obligation | | | — | | | | 945,745 | | | | — | |
Municipal Debt Obligations | | | — | | | | 3,090,058 | | | | — | |
U.S. Treasury Obligations | | | 15,902,544 | | | | — | | | | — | |
Common Stock and/or Other Equity Investments(a) | | | | | | | | | | | | |
Africa | | | — | | | | 2,612,357 | | | | — | |
Asia | | | 1,310,311 | | | | 448,767 | | | | — | |
Australia and Oceania | | | — | | | | 136,002 | | | | — | |
Europe | | | 16,953,052 | | | | 9,238,024 | | | | — | |
North America | | | 149,862,273 | | | | 822,687 | | | | 283,781 | |
Investment Company | | | 28,130,434 | | | | — | | | | — | |
Short-term Investments | | | — | | | | 536,500,000 | | | | — | |
| Total | | $ | 212,158,614 | | | $ | 858,831,987 | | | $ | 5,588,579 | |
| Liabilities | | | | | | | | | | | | |
Common Stock and/or Other Equity Investments(a) | | | | | | | | | | | | |
Asia | | $ | — | | | $ | (3,021,265 | ) | | $ | — | |
North America | | | (29,135,751 | ) | | | — | | | | — | |
| Total | | $ | (29,135,751 | ) | | $ | (3,021,265 | ) | | $ | — | |
60
GOLDMAN SACHS MULTI-MANAGER ALTERNATIVES FUND
|
| 3. INVESTMENTS AND FAIR VALUE MEASUREMENTS (continued) |
| | | | | | | | | | | | |
| | | |
| MULTI-MANAGER ALTERNATIVES (continued) | | | | | | | | | | | | |
| | | |
| Derivative Type | | Level 1 | | | Level 2 | | | Level 3 | |
| Assets(b) | | | | | | | | | | | | |
Forward Foreign Currency Exchange Contracts | | $ | — | | | $ | 6,924,265 | | | $ | — | |
Futures Contracts | | | 4,266,053 | | | | — | | | | — | |
Total Return Swap Contracts | | | — | | | | 15,197,409 | | | | — | |
| Total | | $ | 4,266,053 | | | $ | 22,121,674 | | | $ | — | |
| Liabilities(b) | | | | | | | | | | | | |
Forward Foreign Currency Exchange Contracts | | $ | — | | | $ | (5,577,732 | ) | | $ | — | |
Futures Contracts | | | (6,804,242 | ) | | | — | | | | — | |
Credit Default Swap Contracts | | | — | | | | (199,025 | ) | | | — | |
Total Return Swap Contracts | | | — | | | | (14,708,012 | ) | | | — | |
| Total | | $ | (6,804,242 | ) | | $ | (20,484,769 | ) | | $ | — | |
| (a) | | Amounts are disclosed by continent to highlight the impact of time zone differences between local market close and the calculation of net asset value. Security valuations are based on the principle exchange or system on which they are traded, which may differ from country of domicile noted in table. The Funds utilize fair value model prices provided by an independent fair value service for international equities, resulting in a Level 2 classification. |
| (b) | | Amount shown represents unrealized gain (loss) at period end. |
For further information regarding security characteristics, see the Consolidated Schedule of Investments.
| | |
| 4. INVESTMENTS IN DERIVATIVES | | |
The following table sets forth, by certain risk types, the gross value of derivative contracts as of October 31, 2016. These instruments were used as part of the Fund’s investment strategies and to obtain and/or manage exposure related to the risks below. The values in the table below exclude the effects of cash collateral received or posted pursuant to these derivative contracts, and therefore are not representative of the Fund’s net exposure.
| | | | | | | | | | | | |
| Risk | | Consolidated Statement of Assets and Liabilities | | Assets | | | Consolidated Statement of Assets and Liabilities | | Liabilities | |
Interest rate | | Variation margin on certain derivative contracts | | $ | 1,560,821 | (a) | | Variation margin on certain derivative contracts | | $ | (3,516,841) | (a) |
Credit | | — | | | — | | | Payable for unrealized loss on swap contracts | | | (199,025) | (b) |
Equity | | Receivable for unrealized gain on swap contracts; Variation margin on certain derivative contracts | | | 16,645,785 | (a) | | Payable for unrealized loss on swap contracts; Variation margin on certain derivative contracts | | | (15,927,345) | (a) |
Currency | | Receivable for unrealized gain on forward foreign currency exchange contracts; Variation margin on certain derivative contracts | | | 6,946,661 | (a) | | Payable for unrealized loss on forward foreign currency exchange contracts; Variation margin on certain derivative contracts | | | (5,606,576) | |
61
GOLDMAN SACHS MULTI-MANAGER ALTERNATIVES FUND
Notes to Financial Statements (continued)
October 31, 2016
|
| 4. INVESTMENTS IN DERIVATIVES (continued) |
| | | | | | | | | | | | |
| Risk | | Consolidated Statement of Assets and Liabilities | | Assets | | | Consolidated Statement of Assets and Liabilities | | Liabilities | |
Commodity | | Variation margin on certain derivative contracts | | $ | 1,234,460 | (a) | | Variation margin on certain derivative contracts | | $ | (2,039,224) | (a) |
| Total | | | | $ | 26,387,727 | | | | | $ | (27,289,011) | |
| (a) | | Includes unrealized gain (loss) on futures contracts described in the Additional Investment Information sections of the Consolidated Schedule of Investments. Only current day’s variation margin is reported within the Consolidated Statement of Assets and Liabilities. |
| (b) | | Aggregate of amounts include $14,628,783, which represents the payments to be made pursuant to bilateral agreements should counterparties exercise their “right to terminate” provisions based on, among others, the Fund’s performance, their failure to pay on their obligations or failure to pledge collateral. Such amount does not include incremental charges directly associated with the close-out of the agreements. It also does not reflect the fair value of any assets pledged as collateral which, through the daily margining process, substantially offsets the aforementioned amounts and for which the Fund is entitled to a full return. |
The following table sets forth, by certain risk types, the Fund’s gains (losses) related to these derivatives and their indicative volumes for the fiscal year ended October 31, 2016. These gains (losses) should be considered in the context that these derivative contracts may have been executed to create investment opportunities and/or economically hedge certain investments, and accordingly, certain gains (losses) on such derivative contracts may offset certain (losses) gains attributable to investments. These gains (losses) are included in “Net realized gain (loss)” or “Net change in unrealized gain (loss)” on the Consolidated Statement of Operations:
| | | | | | | | | | | | | | |
| Risk | | Consolidated Statement of Operations | | Net Realized
Gain (Loss) | | | Net Change in
Unrealized
Gain (Loss) | | | Average
Number of
Contracts(a) | |
| Interest rate | | Net realized gain (loss) from investments and futures contracts/Net change in unrealized gain (loss) on futures contracts and swap contracts | | $ | 2,909,766 | | | $ | (2,688,396 | ) | | | 6,487 | |
| Credit | | Net realized gain (loss) from swap contracts/Net change in unrealized gain (loss) on swap contracts | | | (144,978 | ) | | | (199,025 | ) | | | 11 | |
| Currency | | Net realized gain (loss) from forward foreign currency exchange contracts and futures contracts/Net change in unrealized gain (loss) on forward foreign currency exchange contracts and futures contracts | | | 1,314,732 | | | | 7,037,589 | | | | 1,069 | |
| Equity | | Net realized gain (loss) from futures contracts and swap contracts/Net change in unrealized gain (loss) on futures contracts and swap contracts | | | (1,488,738 | ) | | | (896,671 | ) | | | 1,924 | |
| Commodity | | Net realized gain (loss) from futures contracts/Net change in unrealized gain (loss) on futures contracts | | | (9,752,716 | ) | | | (860,942 | ) | | | 225 | |
| Total | | | | $ | (7,161,934 | ) | | $ | 2,392,555 | | | | 9,716 | |
| (a) | | Average number of contracts is based on the average of month end balances for the period end October 31, 2016. |
In order to better define its contractual rights and to secure rights that will help the Fund mitigate its counterparty risk, the Fund may enter into an International Swaps and Derivatives Association, Inc. Master Agreement (“ISDA Master Agreement”) or similar agreement with its derivatives’ counterparties. An ISDA Master Agreement is a bilateral agreement between the Fund and a counterparty that governs OTC derivatives (including forward foreign currency exchange contracts, and certain options and swaps) and typically contains, among other things, collateral posting terms and netting provisions in the event of a default and/or termination event. The provisions of the ISDA Master Agreement typically permit a single net payment in the event of a default (close-out netting) or similar event, including the bankruptcy or insolvency of the counterparty.
Collateral and margin requirements differ between exchange traded derivatives and OTC derivatives. Margin requirements are established by the broker or clearing house for exchange-traded and centrally cleared derivatives (financial futures contracts, options and centrally cleared swaps) pursuant to governing agreements for those instrument types. Brokers can ask for margin in
62
GOLDMAN SACHS MULTI-MANAGER ALTERNATIVES FUND
|
| 4. INVESTMENTS IN DERIVATIVES (continued) |
excess of the minimum in certain circumstances. Collateral terms are contract-specific for OTC derivatives. For derivatives traded under an ISDA Master Agreement, the collateral requirements are typically calculated by netting the marked to market amount for each transaction under such agreement and comparing that amount to the value of any collateral currently pledged by the Fund and the counterparty. Additionally, the Fund may be required to post initial margin to the counterparty, the terms of which would be outlined in the confirmation of the OTC transaction.
For financial reporting purposes, cash collateral that has been pledged to cover obligations of the Fund and cash collateral received from the counterparty, if any, is reported separately on the Consolidated Statement of Assets and Liabilities as receivables/payables for collateral on certain derivative contracts. Non-cash collateral pledged by the Fund, if any, is noted in the Consolidated Schedule of Investments. Generally, the amount of collateral due from or to a counterparty must exceed a minimum transfer amount threshold before a transfer is required to be made. To the extent amounts due to the Fund from its counterparties are not fully collateralized, contractually or otherwise, the Fund bears the risk of loss from counterparty nonperformance. The Fund attempts to mitigate counterparty risk by only entering into agreements with counterparties that the Underlying Managers believe to be of good standing and by monitoring the financial stability of those counterparties.
Additionally, the netting of assets and liabilities and the offsetting of collateral pledged or received are based on contractual netting/set-off provisions in the ISDA Master Agreement or similar agreements. However, in the event of a default or insolvency of a counterparty, a court could determine that such rights are not enforceable due to the restrictions or prohibitions against the right of setoff that may be imposed in accordance with a particular jurisdiction’s bankruptcy or insolvency laws.
The following table sets forth the Fund’s net exposure for derivative instruments that are subject to enforceable master netting arrangements or similar agreements as of October 31, 2016:
| | | | | | | | | | | | | | | | | | | | | | | | | | | | | | | | | | | | | | |
| | | | | Derivative Assets(1) | | | Derivative Liabilities(1) | | | | | | | | | | |
| Counterparty | | | | Swaps | | | Forward
Currency
Contracts | | | Total | | | Swaps | | | Forward Currency
Contracts | | | Total | | | Net Derivative Asset
(Liabilities) | | | Collateral
(Received) Pledged(1) | | | Net Amount(2) | |
Bank of America Securities LLC | | | | $ | — | | | $ | 2,850,227 | | | $ | 2,850,227 | | | $ | (3,185 | ) | | $ | (2,031,619 | ) | | $ | (2,034,804 | ) | | $ | 815,423 | | | $ | — | | | $ | 815,423 | |
Barclays Bank PLC | | | | | — | | | | 25,220 | | | | 25,220 | | | | (42,684 | ) | | | (964 | ) | | | (43,648 | ) | | | (18,428 | ) | | | — | | | | (18,428 | ) |
JPMorgan Securities, Inc. | | | | | 14,863,041 | | | | 3,965,075 | | | | 18,828,116 | | | | (13,508,887 | ) | | | (3,483,495 | ) | | | (16,992,382 | ) | | | 1,835,734 | | | | — | | | | 1,835,734 | |
Morgan Stanley & Co. | | | | | 334,368 | | | | — | | | | 334,368 | | | | (1,352,281 | ) | | | — | | | | (1,352,281 | ) | | | (1,017,913 | ) | | | 1,017,913 | | | | — | |
Morgan Stanley & Co. International PLC | | | | | — | | | | 66,042 | | | | 66,042 | | | | — | | | | (39,539 | ) | | | (39,539 | ) | | | 26,503 | | | | — | | | | 26,503 | |
UBS AG (London) | | | | | — | | | | 17,701 | | | | 17,701 | | | | — | | | | (22,115 | ) | | | (22,115 | ) | | | (4,414 | ) | | | 4,414 | | | | — | |
Total | | | | $ | 15,197,409 | | | $ | 6,924,265 | | | $ | 22,121,674 | | | $ | (14,907,037 | ) | | $ | (5,577,732 | ) | | $ | (20,484,769 | ) | | $ | 1,636,905 | | | $ | 1,022,327 | | | $ | 2,659,232 | |
| (1) | | Gross amounts available for offset but not netted in the Consolidated Statement of Assets and Liabilities. |
| (2) | | Net amount represents the net amount due (to) from counterparty in the event of a default based on the contractual set-off rights under the agreement. Net amount excludes any over-collateralized amounts. |
63
GOLDMAN SACHS MULTI-MANAGER ALTERNATIVES FUND
Notes to Financial Statements (continued)
October 31, 2016
|
| 5. AGREEMENTS AND AFFILIATED TRANSACTIONS |
A. Management Agreement — Under the Agreement, GSAM manages the Fund, subject to the general supervision of the Trustees.
As compensation for the services rendered pursuant to the Agreement, the assumption of the expenses related thereto and administration of the Fund’s business affairs, including providing facilities, GSAM is entitled to a management fee, accrued daily and paid monthly, equal to an annual percentage rate of the Fund’s average daily net assets.
For the fiscal year ended October 31, 2016, the contractual and effective net management fee with GSAM were at the following rates:
| | | | | | | | | | | | | | | | | | | | | | |
| Contractual Management Rate | | | Effective Net
Management
Rate*^(b) | |
First $2 billion(a) | | | Next $3 billion | | | Next $3 billion | | | Over $8 billion | | | Effective Rate | | |
| | 1.90% | | | | 1.80% | | | | 1.71% | | | | 1.68% | | | | 1.92% | | | | 1.85% | |
| * | | GSAM has agreed to waive a portion of its management fee in order to achieve net management rates, as defined in the Fund’s most recent prospectus. This arrangement will be effective through at least February 28, 2017, and prior to such date GSAM may not terminate the arrangement without the approval of the Trustees. |
| ^ | | Effective Net Management Rate includes the impact of management fee waivers of affiliated underlying funds, if any. |
| (a) | | Prior to December 1, 2015, the Fund’s contractual management fee rate was 2.00% on the first $2 billion of average daily net assets. |
| (b) | | Reflects combined management fees paid to GSAM under the Agreement and the Subsidiary Agreements as defined below after waivers. |
GSAM also provides management services to the Subsidiaries pursuant to the Subsidiary Management Agreements (the “Subsidiary Agreements”) and is entitled to a management fee accrued daily and paid monthly, equal to an annual percentage rate of 0.42% of each Subsidiary’s average daily net assets. In consideration of the Subsidiaries’ management fee, and for as long as the Subsidiary Agreements remain in effect, GSAM has contractually agreed to waive irrevocably a portion of the Fund’s management fee in an amount equal to the management fee accrued and paid to GSAM by the Subsidiaries under the Subsidiary Agreements. For the fiscal year ended October 31, 2016 GSAM waived $197,504 of the Fund’s management fee. This waiver represents an inter-fund transaction and, accordingly, has been eliminated in consolidation.
B. Distribution and Service Plans — The Trust, on behalf of the Fund, has adopted Distribution and Service Plans (the “Plans”). Under the Plans, Goldman Sachs, which serves as distributor (the “Distributor”), is entitled to a fee accrued daily and paid monthly, for distribution services and personal and account maintenance services, which may then be paid by Goldman Sachs to authorized dealers, at the following annual rates calculated on the Fund’s average daily net assets of each respective share class:
| | | | | | | | | | | | |
| | | Distribution and Service Plan Rates | |
| | | Class A* | | | Class C | | | Class R* | |
Distribution Plan | | | 0.25 | % | | | 0.75 | % | | | 0.50 | % |
Service Plan | | | — | | | | 0.25 | | | | — | |
| * | | With respect to Class A and Class R Shares, the Distributor at its discretion may use compensation for distribution services paid under the Distribution Plan to compensate service organizations for personal and account maintenance services and expenses as long as such total compensation does not exceed the maximum cap on “service fees” imposed by the Financial Industry Regulatory Authority. |
C. Distribution Agreement — Goldman Sachs, as Distributor of the Shares of the Fund pursuant to a Distribution Agreement, may retain a portion of the Class A Shares’ front end sales charge and Class C Shares’ CDSC. During the fiscal year ended October 31, 2016, Goldman Sachs advised that it retained $10,740 and $0, respectively.
D. Transfer Agency Agreement — Goldman Sachs also serves as the transfer agent of the Fund for a fee pursuant to the Transfer Agency Agreement. The fees charged for such transfer agency services are accrued daily and paid monthly at annual rates as follows: 0.19% of the average daily net assets of Class A, Class C, Class IR and Class R Shares; and 0.04% of the average daily net assets of Institutional Shares.
64
GOLDMAN SACHS MULTI-MANAGER ALTERNATIVES FUND
|
| 5. AGREEMENTS AND AFFILIATED TRANSACTIONS (continued) |
E. Other Expense Agreements and Affiliated Transactions — GSAM has agreed to limit certain “Other Expenses” of the Fund (excluding acquired fund fees and expenses, dividend and interest payments on securities sold short, transfer agency fees and expenses, service fees and shareholder administration fees (as applicable), taxes, interest, brokerage fees, shareholder meeting, litigation, indemnification and extraordinary expenses) to the extent such expenses exceed, on an annual basis, a percentage rate of the average daily net assets of the Fund. Such Other Expense reimbursements, if any, are accrued daily and paid monthly. In addition, the Fund is not obligated to reimburse GSAM for prior fiscal year expense reimbursements, if any. The Other Expense limitations as an annual percentage rate of average daily net assets for the Fund are 0.114% and the total annual operating expenses (excluding acquired fund fees and expenses, taxes, dividend and interest payments on securities sold short, interest, brokerage fees, shareholder meeting, litigation, indemnification and extraordinary expenses) of Class A, Class C, Institutional Class, Class IR, and Class R Shares are limited to 2.38%, 3.13%, 1.98%, 2.13% and 2.63%, respectively. The Other Expense limitations and the total operating expense limitation agreement will remain in place through at least February 28, 2017, and prior to such date GSAM may not terminate the arrangements without the approval of the Trustees. In addition, the Fund may enter into certain offset arrangements with the transfer agent, which may result in a reduction of the Fund’s expenses and are received irrespective of the application of the Other Expense limitations described above. For the fiscal year ended October 31, 2016 these expense reductions, including any fee waivers and Other Expense reimbursements, were as follows:
| | | | | | | | | | |
Management Fee Waiver | | | Other Expense Reimbursements | | | Total Expense Reductions | |
| $ | 887,219 | | | $ | 1,969,477 | | | $ | 2,856,696 | |
F. Line of Credit Facility — As of October 31, 2016, the Fund participated in a $1,100,000,000 committed, unsecured revolving line of credit facility (the “facility”) together with other funds of the Trust and certain registered investment companies having management agreements with GSAM or its affiliates (“Other Borrowers”). This facility is to be used for temporary emergency purposes, or to allow for an orderly liquidation of securities to meet redemption requests. The interest rate on borrowings is based on the federal funds rate. The facility also requires a fee to be paid by the Fund based on the amount of the commitment that has not been utilized. For the fiscal year ended October 31, 2016, the Fund did not have any borrowings under the facility.
G. Other Transactions with Affiliates — For the fiscal year ended October 31, 2016, Goldman Sachs earned $1,014, in brokerage commissions from portfolio transactions. As of October 31, 2016, The Goldman Sachs Group, Inc. was the beneficial owner of approximately 22% of Class R Shares of the Fund.
The table below shows the transaction in and earnings from investments in the Underlying Fund for the fiscal year ended October 31, 2016:
| | | | | | | | | | | | | | | | | | | | |
Underlying Fund | | Market
Value
10/31/2015 | | | Purchases
at Cost | | | Proceeds
from Sales | | | Market Value
10/31/2016 | | | Dividend
Income | |
Goldman Sachs Financial Square Government Fund — Institutional Shares | | $ | — | | | $ | 28,130,534 | | | $ | (100 | ) | | $ | 28,130,434 | | | $ | 232 | |
65
GOLDMAN SACHS MULTI-MANAGER ALTERNATIVES FUND
Notes to Financial Statements (continued)
October 31, 2016
|
| 6. PORTFOLIO SECURITIES TRANSACTIONS |
The cost of purchases and proceeds from sales and maturities of long-term securities for the fiscal year ended October 31, 2016, were $522,666,436 and $917,134,008, respectively.
The following table sets forth the Fund’s net exposure for short securities that are subject to enforceable master netting arrangements or similar agreements as of October 31, 2016:
| | | | | | | | | | | | | | |
| Counterparty | | | | Securities Sold Short(1) | | | Collateral
Pledged(2) | | | Net
Amount(3) | |
Deutsche Bank AG (4) | | | | $ | 14,803,363 | | | $ | (14,803,363 | ) | | $ | — | |
JPMorgan Chase Bank | | | | | 13,339,169 | | | | (13,339,169 | ) | | | — | |
State Street Bank & Trust | | | | | 4,014,484 | | | | (4,014,484 | ) | | | — | |
Total | | | | $ | 32,157,016 | | | $ | (32,157,016 | ) | | $ | — | |
| (1) | | Gross amounts available for offset but not netted in the Consolidated Statement of Assets and Liabilities. |
| (2) | | At October 31, 2016, the value of securities received pledged exceeded the value of the related securities sold short. |
| (3) | | Net amount represents the net amount due (to) from counterparty in the event of a default based on the contractual set-off rights under the agreement. Net amount excludes any over-collateralized amounts. |
| (4) | | Securities sold short were executed through separate Underlying Managers. |
The tax character of distributions paid during the fiscal year ended October 31, 2016 was as follows:
| | | | |
Distribution paid from: | | | | |
Ordinary income | | $ | 10,147,452 | |
Net long-term capital gains | | | 1,957,685 | |
Total taxable distributions | | $ | 12,105,137 | |
As of October 31, 2016, the components of accumulated earnings (losses) on a tax basis were as follows:
| | | | |
Undistributed ordinary income — net | | $ | 20,812,376 | |
Total undistributed earnings | | $ | 20,812,376 | |
Capital loss carryforwards: | | | | |
Perpetual Short-Term | | | (62,516,733 | ) |
Perpetual Long-Term | | | (18,357,246 | ) |
Total capital loss carryforwards | | $ | (80,873,979 | ) |
Timing differences (Straddle Loss Deferral) | | $ | (2,558,430 | ) |
Unrealized gains (losses) — net | | | (4,236,450 | ) |
Total accumulated earnings (losses) net | | $ | (66,856,483 | ) |
66
GOLDMAN SACHS MULTI-MANAGER ALTERNATIVES FUND
|
| 7. TAX INFORMATION (continued) |
As of October 31, 2016, the Fund’s aggregate security unrealized gains and losses based on cost for U.S. federal income tax purposes were as follows:
| | | | |
Tax Cost | | $ | 1,080,637,320 | |
Gross unrealized gain | | | 33,859,465 | |
Gross unrealized loss | | | (37,823,581 | ) |
Net unrealized gains (losses) on securities | | $ | (3,964,116 | ) |
Net unrealized gain (loss) on other investments | | | (272,334 | ) |
Net unrealized gains (losses) | | $ | (4,236,450 | ) |
The difference between GAAP-basis and tax basis unrealized gains (losses) is attributable primarily to wash sales, net mark to market gains/(losses) on regulated futures, net mark to market gains/(losses) on foreign currency contracts, and differences in the tax treatment of partnership investments, passive foreign investment company investments, swap transactions, material modification of debt securities and the recognition of income and gains/losses of certain bonds.
In order to present certain components of the Fund’s capital accounts on a tax-basis, certain reclassifications have been recorded to the Fund’s accounts. These reclassifications have no impact on the net asset value of the Fund and result primarily from differences in the tax treatment of swap transactions, foreign currency transactions, passive foreign investment company investments, underlying fund investments, material modification of debt securities and Short Sales.
| | | | | | | | | | |
Accumulated Net Realized Gain (Loss) | | | Undistributed Net Investment Income (Loss) | | | Paid in Capital | |
| $ | 7,872,836 | | | $ | 2,842,904 | | | $ | (10,715,740 | ) |
GSAM has reviewed the Fund’s tax positions for all open tax years (the current and 2 prior years, as applicable) and has concluded that no provision for income tax is required in the Fund’s financial statements. Such open tax years remain subject to examination and adjustment by tax authorities.
The Fund’s risks include, but are not limited to, the following:
Derivatives Risk — Loss may result from the Fund’s investments in derivative instruments. These instruments may be illiquid, difficult to price and leveraged so that small changes in the value of the underlying instruments may produce disproportionate losses to the Fund. Derivatives are also subject to counterparty risk, which is the risk that the other party in the transaction will not fulfill its contractual obligation. Losses from investments in derivatives can also result from a lack of correlation between changes in the value of derivative instruments and the portfolio assets (if any) being hedged.
Foreign Custody Risk — The Fund that invests in foreign securities may hold such securities and cash with foreign banks, agents, and securities depositories appointed by the Fund’s custodian (each a “Foreign Custodian”). Some foreign custodians may be recently organized or new to the foreign custody business. In some countries, Foreign Custodians may be subject to little or no regulatory oversight over, or independent evaluation of, their operations. Further, the laws of certain countries may place limitations on the Fund’s ability to recover its assets if a Foreign Custodian enters bankruptcy. Investments in emerging markets may be subject to even greater custody risks than investments in more developed markets. Custody services in emerging market countries are very often undeveloped and may be considerably less well regulated than in more developed countries, and thus may not afford the same level of investor protection as would apply in developed countries.
67
GOLDMAN SACHS MULTI-MANAGER ALTERNATIVES FUND
Notes to Financial Statements (continued)
October 31, 2016
|
| 8. OTHER RISKS (continued) |
Foreign and Emerging Countries Risk — Investing in foreign markets may involve special risks and considerations not typically associated with investing in the United States. Foreign securities may be subject to risk of loss because of more or less foreign government regulation, less public information and less economic, political and social stability in the countries in which the Fund invests. Loss may also result from the imposition of exchange controls, confiscations and other government restrictions by the United States or other governments, or from problems in registration, settlement or custody. Foreign risk also involves the risk of negative foreign currency rate fluctuations, which may cause the value of securities denominated in such foreign currency (or other instruments through which the Fund has exposure to foreign currencies) to decline in value. Currency exchange rates may fluctuate significantly over short periods of time. To the extent that the Fund also invests in securities of issuers located in emerging markets, these risks may be more pronounced.
Interest Rate Risk — When interest rates increase, fixed income securities or instruments held by the Fund will generally decline in value. Long-term fixed income securities or instruments will normally have more price volatility because of this risk than short-term fixed income securities or instruments. The risks associated with increasing rates are heightened given that interest rates are near historic lows, but may be expected to increase in the future with unpredictable effects on the markets and the Fund’s investments.
Investments in Other Investment Companies — As a shareholder of another investment company, including an exchange-traded fund (“ETF”), the Fund will indirectly bear its proportionate share of any net management fees and other expenses paid by such other investment companies, in addition to the fees and expenses regularly borne by the Fund. ETFs are subject to risks that do not apply to conventional mutual funds, including but not limited to the following: (i) the market price of the ETF’s shares may trade at a premium or a discount to their NAV; and (ii) an active trading market for an ETF’s shares may not develop or be maintained.
Large Shareholder Transactions Risk — The Fund may experience adverse effects when certain large shareholders, such as other funds, institutional investors (including those trading by use of non-discretionary mathematical formulas), financial intermediaries (who may make investment decisions on behalf of underlying clients and/or include the Fund in their investment model), individuals, accounts and Goldman Sachs affiliates, purchase or redeem large amounts of shares of the Fund. Such large shareholder redemptions may cause the Fund to sell portfolio securities at times when it would not otherwise do so, which may negatively impact the Fund’s NAV and liquidity. These transactions may also accelerate the realization of taxable income to shareholders if such sales of investments resulted in gains, and may also increase transaction costs. In addition, a large redemption could result in the Fund’s current expenses being allocated over a smaller asset base, leading to an increase in the Fund’s expense ratio. Similarly, large Fund share purchases may adversely affect the Fund’s performance to the extent that the Fund is delayed in investing new cash and is required to maintain a larger cash position than it ordinarily would.
Liquidity Risk — The Fund may make investments that are illiquid or that may become less liquid in response to market developments or adverse investor perceptions. Illiquid investments may be more difficult to value. Liquidity risk may also refer to the risk that the Fund will not be able to pay redemption proceeds within the allowable time period because of unusual market conditions, an unusually high volume of redemption requests, or other reasons. To meet redemption requests, the Fund may be forced to sell investments at an unfavorable time and/or under unfavorable conditions. Liquidity risk may be the result of, among other things, the reduced number and capacity of traditional market participants to make a market in fixed income securities or the lack of an active market. The potential for liquidity risk may be magnified by a rising interest rate environment or other circumstances where investor redemptions from fixed income mutual funds may be higher than normal, potentially causing increased supply in the market due to selling activity.
Loan-Related Investments Risk — In addition to risks generally associated with debt investments, loan-related investments such as loan participations and assignments are subject to other risks. Although a loan obligation may be fully collateralized at the time of acquisition, the collateral may decline in value, be relatively illiquid, or lose all or substantially all of its value subsequent to investment. Many loan investments are subject to legal or contractual restrictions on resale and may be relatively illiquid and difficult to value. There is less readily available, reliable information about most loan investments than is the case for many other
68
GOLDMAN SACHS MULTI-MANAGER ALTERNATIVES FUND
|
| 8. OTHER RISKS (continued) |
types of securities. Substantial increases in interest rates may cause an increase in loan obligation defaults. With respect to loan participations, the Fund may not always have direct recourse against a borrower if the borrower fails to pay scheduled principal and/or interest; may be subject to greater delays, expenses and risks than if the Fund had purchased a direct obligation of the borrower; and may be regarded as the creditor of the agent lender (rather than the borrower), subjecting the Fund to the creditworthiness of that lender as well. Investors in loans, such as the Fund, may not be entitled to rely on the anti-fraud protections of the federal securities laws, although they may be entitled to certain contractual remedies. The market for loan obligations may be subject to irregular trading activity, wide bid/ask spreads and extended trade settlement periods. Because transactions in many loans are subject to extended trade settlement periods, the Fund may not receive the proceeds from the sale of a loan for a period after the sale. As a result, sale proceeds related to the sale of loans may not be available to make additional investments or to meet the Fund’s redemption obligations for a period after the sale of the loans, and, as a result, the Fund may have to sell other investments or engage in borrowing transactions, such as borrowing from its credit facility, if necessary to raise cash to meet its obligations.
Senior Loans hold the most senior position in the capital structure of a business entity, and are typically secured with specific collateral, but are nevertheless usually rated below investment grade. Because Second Lien Loans are subordinated or unsecured and thus lower in priority of payment to Senior Loans, they are subject to the additional risk that the cash flow of the borrower and property securing the loan or debt, if any, may be insufficient to meet scheduled payments after giving effect to the senior secured obligations of the borrower. Second Lien Loans generally have greater price volatility than Senior Loans and may be less liquid.
Market and Credit Risks — In the normal course of business, the Fund trades financial instruments and enters into financial transactions where risk of potential loss exists due to changes in the market (market risk). Additionally, the Fund may also be exposed to credit risk in the event that an issuer or guarantor fails to perform or that an institution or entity with which the Fund has unsettled or open transactions defaults.
Multi-Manager Approach Risk — The Fund’s performance depends on the ability of the Investment Adviser in selecting, overseeing, and allocating Fund assets to the Underlying Managers. The Underlying Managers’ investment styles may not always be complementary. The Fund’s multi-manager approach may result in the Fund investing a significant percentage of its assets in certain types of investments, which could be beneficial or detrimental to the Fund’s performance depending on the performance of those investments and the overall market environment. The Fund’s Underlying Managers may underperform the market generally or underperform other investment managers that could have been selected for the Fund. Because the Fund’s Underlying Managers may trade with counterparties, prime brokers, clearing brokers or futures commission merchants on terms that are different than those on which the Investment Adviser would trade, and because each Underlying Manager applies its own risk analysis in evaluating potential counterparties for the Fund, the Fund may be subject to greater counterparty risk than if it were managed directly by the Investment Adviser.
Short Position Risk — The Fund may enter into a short position through a futures contract, an option or swap agreement or through short sales of any instrument that the Fund may purchase for investment. Taking short positions involves leverage of the Fund’s assets and presents various risks. If the value of the underlying instrument or market in which the Fund has taken a short position increases, then the Fund will incur a loss equal to the increase in value from the time that the short position was entered into plus any related interest payments or other fees. Taking short positions involves the risk that losses may be disproportionate, may exceed the amount invested, and may be unlimited.
Tax Risk — The Fund will seek to gain exposure to the commodity markets primarily through investments in the Subsidiaries and/or commodity index-linked structured notes, as applicable. Historically, the Internal Revenue Service (“IRS”) issued private letter rulings (“PLRs”) in which the IRS specifically concluded that income and gains from investments in commodity index-linked structured notes or a wholly-owned foreign subsidiary that invests in commodity-linked instruments are “qualifying income” for purposes of compliance with Subchapter M of the Code. However, the Fund has not received a PLR, and is not able to rely on PLRs issued to other taxpayers. Additionally, the IRS has suspended the granting of such PLR, pending review of its position on this matter. The IRS also recently issued proposed regulations that, if finalized, would generally treat the Fund’s income inclusion with respect to a subsidiary as qualifying income only if there is a distribution out of the earnings and profits of a subsidiary that
69
GOLDMAN SACHS MULTI-MANAGER ALTERNATIVES FUND
Notes to Financial Statements (continued)
October 31, 2016
|
| 8. OTHER RISKS (continued) |
are attributable to such income inclusion. The proposed regulations, if adopted, would apply to taxable years beginning on or after 90 days after the regulations are published as final.
The IRS also recently issued a revenue procedure, which states that the IRS will not in the future issue PLRs that would require a determination of whether an asset (such as a commodity index-linked note) is a “security” under the Investment Company Act of 1940. In light of this, the Fund has obtained an opinion of counsel that the Fund’s income from such investments should constitute “qualifying income.” However, no assurances can be provided that the IRS would not be able to successfully assert that the Fund’s income from such investments was not “qualifying income”, in which case the Fund would fail to qualify as regulated investment company (“RIC”) under Subchapter M of the Code if over 10% of its gross income were derived from these investments. If the Fund failed to qualify as a RIC, it would be subject to federal and state income tax on all of its taxable income at regular corporate tax rates. This would significantly adversely affect the returns to, and could cause substantial losses for, Fund shareholders.
Under the Trust’s organizational documents, its Trustees, officers, employees and agents are indemnified, to the extent permitted by the Act and state law, against certain liabilities that may arise out of performance of their duties to the Fund. Additionally, in the course of business, the Fund enters into contracts that contain a variety of indemnification clauses. The Fund’s maximum exposure under these arrangements is unknown, as this would involve future claims that may be made against the Fund that have not yet occurred. However, GSAM believes the risk of loss under these arrangements to be remote.
Subsequent events after the Consolidated Statement of Assets and Liabilities date have been evaluated through the date the financial statement were issued. On November 3, 2016, the Trustees approved One River Asset Management, LLC (“One River”) and YG Partners, LLC (“YG Partners”) as Underlying Managers of the Fund. One River will utilize a tactical trading strategy, and YG Partners will utilize an equity/long short strategy.
Other than the above, GSAM has concluded that there is no impact requiring adjustment or disclosure in the financial statements.
70
GOLDMAN SACHS MULTI-MANAGER ALTERNATIVES FUND
|
| 11. SUMMARY OF SHARE TRANSACTIONS |
Share activity is as follows:
| | | | | | | | | | | | | | | | | | | | | | | | |
| | | For the Fiscal Year Ended
October 31, 2016 | | | For the Period
January 1, 2015-October 31, 2015(a) | | | For the Fiscal Year Ended
December 31, 2014 | |
| | | Shares | | | Dollars | | | Shares | | | Dollars | | | Shares | | | Dollars | |
| | | | |
| Class A Shares | | | | | | | | | | | | | | | | | | | | | | | | |
Shares sold | | | 6,466,263 | | | $ | 64,825,296 | | | | 14,534,458 | | | $ | 156,399,827 | | | | 13,799,884 | | | $ | 145,642,660 | |
Reinvestment of distributions | | | 111,867 | | | | 1,130,892 | | | | — | | | | — | | | | 152,647 | | | | 1,623,453 | |
Shares redeemed | | | (14,454,630 | ) | | | (144,922,875 | ) | | | (4,525,729 | ) | | | (48,066,121 | ) | | | (5,347,199 | ) | | | (57,009,892 | ) |
| | | | (7,876,500 | ) | | | (78,966,687 | ) | | | 10,008,729 | | | | 108,333,706 | | | | 8,605,332 | | | | 90,256,221 | |
| Class C Shares | | | | | | | | | | | | | | | | | | | | | | | | |
Shares sold | | | 855,964 | | | | 8,456,479 | | | | 4,843,529 | | | | 51,853,444 | | | | 3,684,774 | | | | 38,725,099 | |
Reinvestment of distributions | | | 32,783 | | | | 326,190 | | | | — | | | | — | | | | 40,521 | | | | 426,232 | |
Shares redeemed | | | (3,823,802 | ) | | | (37,726,174 | ) | | | (632,424 | ) | | | (6,614,972 | ) | | | (213,013 | ) | | | (2,241,283 | ) |
| | | | (2,935,055 | ) | | | (28,943,505 | ) | | | 4,211,105 | | | | 45,238,472 | | | | 3,512,282 | | | | 36,910,048 | |
| Institutional Shares | | | | | | | | | | | | | | | | | | | | | | | | |
Shares sold | | | 39,736,722 | | | | 402,931,900 | | | | 106,511,467 | | | | 1,158,260,742 | | | | 55,682,719 | | | | 592,272,239 | |
Reinvestment of distributions | | | 893,194 | | | | 9,069,534 | | | | — | | | | — | | | | 978,521 | | | | 10,450,502 | |
Shares redeemed | | | (72,045,143 | ) | | | (728,652,554 | ) | | | (46,837,742 | ) | | | (501,232,560 | ) | | | (12,411,833 | ) | | | (131,983,495 | ) |
| | | | (31,415,227 | ) | | | (316,651,120 | ) | | | 59,673,725 | | | | 657,028,182 | | | | 44,249,407 | | | | 470,739,246 | |
| Class IR Shares | | | | | | | | | | | | | | | | | | | | | | | | |
Shares sold | | | 8,068,352 | | | | 81,443,001 | | | | 9,391,066 | | | | 101,423,885 | | | | 3,568,379 | | | | 37,822,254 | |
Reinvestment of distributions | | | 78,956 | | | | 800,190 | | | | — | | | | — | | | | 54,013 | | | | 575,509 | |
Shares redeemed | | | (9,097,182 | ) | | | (91,879,976 | ) | | | (1,912,439 | ) | | | (20,215,231 | ) | | | (247,339 | ) | | | (2,638,759 | ) |
| | | | (949,874 | ) | | | (9,636,785 | ) | | | 7,478,627 | | | | 81,208,654 | | | | 3,375,053 | | | | 35,759,004 | |
| Class R Shares | | | | | | | | | | | | | | | | | | | | | | | | |
Shares sold | | | 20,159 | | | | 207,712 | | | | 6,001 | | | | 63,976 | | | | 282 | | | | 2,972 | |
Reinvestment of distributions | | | 193 | | | | 1,937 | | | | — | | | | — | | | | 32 | | | | 335 | |
Shares redeemed | | | (17,158 | ) | | | (170,096 | ) | | | (337 | ) | | | (3,692 | ) | | | — | | | | — | |
| | | | 3,194 | | | | 39,553 | | | | 5,664 | | | | 60,284 | | | | 314 | | | | 3,307 | |
NET INCREASE (DECREASE) | | | (43,173,462 | ) | | $ | (434,158,544 | ) | | | 81,377,850 | | | $ | 891,869,298 | | | | 59,742,388 | | | $ | 633,667,826 | |
| (a) | | The Fund changed its fiscal year end from December 31 to October 31. |
71
Report of Independent Registered Public
Accounting Firm
To the Board of Trustees of Goldman Sachs Trust II and Shareholders of
the Goldman Sachs Multi-Manager Alternatives Fund:
In our opinion, the accompanying consolidated statement of assets and liabilities, including the consolidated schedule of investments, and the related consolidated statements of operations and of changes in net assets and the consolidated financial highlights present fairly, in all material respects, the financial position of the Goldman Sachs Multi-Manager Alternatives Fund (the “Fund”), a fund of the Goldman Sachs Trust II, at October 31, 2016, and the results of its operations, the changes in its net assets and the financial highlights for each of the periods indicated, in conformity with accounting principles generally accepted in the United States of America. These consolidated financial statements and financial highlights (hereafter referred to as “financial statements”) are the responsibility of the Fund’s management. Our responsibility is to express an opinion on these financial statements based on our audits. We conducted our audits of these financial statements in accordance with the standards of the Public Company Accounting Oversight Board (United States). Those standards require that we plan and perform the audit to obtain reasonable assurance about whether the financial statements are free of material misstatement. An audit includes examining, on a test basis, evidence supporting the amounts and disclosures in the financial statements, assessing the accounting principles used and significant estimates made by management, and evaluating the overall financial statement presentation. We believe that our audits, which included confirmation of securities at October 31, 2016 by correspondence with the custodian, brokers, transfer agent of the underlying funds and the application of alternative auditing procedures where securities purchased confirmations had not been received, provide a reasonable basis for our opinion.
PricewaterhouseCoopers LLP
Boston, Massachusetts
December 23, 2016
72
GOLDMAN SACHS MULTI-MANAGER ALTERNATIVES FUND
| | |
Fund Expenses — Six Month Period Ended October 31, 2016 (Unaudited) | | |
As a shareholder of Class A, Class C, Institutional, Service, Class IR or Class R Shares of a Fund, you incur two types of costs: (1) transaction costs, including sales charges on purchase payments (with respect to Class A Shares), contingent deferred sales charges on redemptions (with respect to Class C Shares), and (2) ongoing costs, including management fees; distribution and/or service (12b-1) fees (with respect to Class A, Class C and Class R Shares); and other Fund expenses. This Example is intended to help you understand your ongoing costs (in dollars) of investing in Class A, Class C, Institutional, Service, Class IR or Class R Shares of the Funds and to compare these costs with the ongoing costs of investing in other mutual funds.
The Example is based on an investment of $1,000 invested at the beginning of the period and held for the entire period from May 1, 2016 through October 31, 2016, which represents a period of 184 days of a 366 day year.
Actual Expenses — The first line under each share class in the table below provides information about actual account values and actual expenses. You may use the information in this line, together with the amount you invested, to estimate the expenses that you paid over the period. Simply divide your account value by $1,000 (for example, an $8,600 account value divided by $1,000=8.6), then multiply the result by the number in the first line under the heading entitled “Expenses Paid” to estimate the expenses you paid on your account during this period.
Hypothetical Example for Comparison Purposes — The second line under each share class in the table below provides information about hypothetical account values and hypothetical expenses based on the Funds’ actual net expense ratios and an assumed rate of return of 5% per year before expenses, which is not the Funds’ actual return. The hypothetical account values and expenses may not be used to estimate the actual ending account balance or expenses you paid for the period. You may use this information to compare the ongoing costs of investing in the Funds and other funds. To do so, compare this 5% hypothetical example with the 5% hypothetical examples that appear in the shareholder reports of the other funds.
Please note that the expenses shown in the table are meant to highlight your ongoing costs only and do not reflect any transactional costs, such as sales charges, redemption fees, or exchange fees. Therefore, the second line of the table is useful in comparing ongoing costs only, and will not help you determine the relative total costs of owning different funds. In addition, if these transactional costs were included, your costs would have been higher.
| | | | | | | | | | | | |
| | | Multi Manager Alternatives Fund | |
| Share Class | | Beginning
Account Value
5/1/16 | | | Ending
Account Value
10/31/16 | | | Expenses Paid for the
6 months ended
10/31/16* | |
| Class A | | | | | | | | | | | | |
Actual | | $ | 1,000.00 | | | $ | 1,014.90 | | | $ | 12.21 | |
Hypothetical 5% return | | | 1,000.00 | | | | 1,013.02 | + | | | 12.19 | |
| Class C | | | | | | | | | | | | |
Actual | | | 1,000.00 | | | | 1,011.10 | | | | 16.03 | |
Hypothetical 5% return | | | 1,000.00 | | | | 1,009.20 | + | | | 16.01 | |
| Institutional | | | | | | | | | | | | |
Actual | | | 1,000.00 | | | | 1,015.70 | | | | 10.29 | |
Hypothetical 5% return | | | 1,000.00 | | | | 1,014.93 | + | | | 10.28 | |
| Class IR | | | | | | | | | | | | |
Actual | | | 1,000.00 | | | | 1,015.80 | | | | 11.25 | |
Hypothetical 5% return | | | 1,000.00 | | | | 1,013.98 | + | | | 11.24 | |
| Class R | | | | | | | | | | | | |
Actual | | | 1,000.00 | | | | 1,013.90 | | | | 16.25 | |
Hypothetical 5% return | | | 1,000.00 | | | | 1,009.00 | + | | | 16.21 | |
| | * | | Expenses for each share class are calculated using each Fund’s annualized net expense ratio for each class, which represents the ongoing expenses as a percentage of net assets for the six months ended October 31, 2016. Expenses are calculated by multiplying the annualized net expense ratio by the average account value for the period; then multiplying the result by the number of days in the most recent fiscal half year; and then dividing that result by the number of days in the fiscal year. The annualized net expense ratios for the period were as follows: | |
| | | | | | | | | | | | | | | | | | | | |
| Fund | | Class A | | | Class C | | | Institutional | | | Class IR | | | Class R | |
Multi Manager Alternatives | | | 2.41 | % | | | 3.17 | % | | | 2.03 | % | | | 2.22 | % | | | 3.21 | % |
| | + | | Hypothetical expenses are based on each Fund’s actual annualized net expense ratios and an assumed rate of return of 5% per year before expenses. | |
73
GOLDMAN SACHS MULTI-MANAGER ALTERNATIVES FUND
Statement Regarding Basis for Approval of Management Agreement and Sub-Advisory Agreements (Unaudited)
Background
The Goldman Sachs Multi-Manager Alternatives Fund (the “Fund”) is an investment portfolio of Goldman Sachs Trust II (the “Trust”). The Board of Trustees oversees the management of the Trust and reviews the investment performance and expenses of the Fund at regularly scheduled meetings held throughout the year. The Fund employs a “manager of managers” structure, whereby Goldman Sachs Asset Management, L.P. and Goldman Sachs Asset Management International (collectively, the “Investment Adviser”) are responsible for selecting sub-advisers (subject to Board approval), allocating the Fund’s assets among them, and overseeing their day-to-day management of Fund assets. The Board of Trustees determines annually whether to approve the continuance of the Trust’s investment management agreement (the “Management Agreement”) with the Investment Adviser on behalf of the Fund.
The Management Agreement was most recently approved for continuation until August 31, 2017 by the Board of Trustees, including those Trustees who are not parties to the Management Agreement or “interested persons” (as defined in the Investment Company Act of 1940, as amended) (the “1940 Act”), of any party thereto (the “Independent Trustees”), at a meeting held on August 3, 2016 (the “Annual Meeting”). At the Annual Meeting, the Board also considered the sub-advisory agreements (each a “Designated Sub-Advisory Agreement”) between the Investment Adviser and each of Ares Capital Management II LLC, Atreaus Capital, LP, Brigade Capital Management, LP, Corsair Capital Management, L.P., First Pacific Advisors, LLC, Graham Capital Management, L.P., New Mountain Vantage, L.L.C., Russell Investment Implementation Services, LLC, and Sirios Capital Management, L.P. (collectively, the “Designated Sub-Advisers” and together with all sub-advisers serving from time to time, the Sub-Advisers).
The review process undertaken by the Trustees spans the course of the year and culminates with the Annual Meeting. To assist the Trustees in their deliberations, the Trustees have established a Contract Review Committee (the “Committee”), comprised of the Independent Trustees. The Committee held four meetings over the course of the year since the Management Agreement was last approved. At those Committee meetings, regularly scheduled Board or other committee meetings, and/or the Annual Meeting, matters relevant to the renewal of the Management Agreement or the Designated Sub-Advisory Agreements were considered by the Board, or the Independent Trustees, as applicable. With respect to the Fund, such matters included:
| | (a) | | the nature and quality of the advisory, administrative, and other services provided to the Fund by the Investment Adviser and its affiliates, including information about: |
| | (i) | | the structure, staff, and capabilities of the Investment Adviser and its portfolio management teams; |
| | (ii) | | the groups within the Investment Adviser and its affiliates that support the portfolio management teams and the Sub-Advisers or provide other types of necessary services, including fund services groups (e.g., accounting and financial reporting, tax, shareholder services, and operations); controls and risk management groups (e.g., legal, compliance, valuation oversight, credit risk management, internal audit, compliance testing, market risk analysis, finance, and central funding); sales and distribution support groups, and others (e.g., information technology and training); |
| | (iii) | | trends in employee headcount; |
| | (iv) | | the Investment Adviser’s financial resources and ability to hire and retain talented personnel and strengthen its operations; and |
| | (v) | | the parent company’s support of the Investment Adviser and its mutual fund business, as expressed by the firm’s senior management; |
| | (b) | | information on the investment performance of the Fund, including comparisons to the performance of similar mutual funds, as provided by a third-party mutual fund data provider engaged as part of the contract review process (the “Outside Data Provider”), benchmark performance indices, commingled investment vehicles with comparable investment strategies managed by the Investment Adviser, and general investment outlooks in the markets in which the Fund invests; |
| | (c) | | information provided by the Investment Adviser indicating the Investment Adviser’s views on the degree to which the Fund’s peer group and/or benchmark index was relevant to the Fund’s particular investment strategy; |
| | (d) | | the terms of the Management Agreement and other agreements with affiliated service providers entered into by the Trust on behalf of the Fund; |
| | (e) | | fee and expense information for the Fund, including: |
| | (i) | | the relative management fee and expense level of the Fund as compared to those of comparable funds managed by other advisers, as provided by the Outside Data Provider; and |
| | (ii) | | comparative information on the advisory fees charged and services provided by the Investment Adviser to certain collective investment vehicles that it manages with comparable investment strategies; |
74
GOLDMAN SACHS MULTI-MANAGER ALTERNATIVES FUND
Statement Regarding Basis for Approval of Management Agreement and Sub-Advisory Agreements (Unaudited) (continued)
| | (f) | | with respect to the investment performance and expense comparison data provided by the Outside Data Provider, its processes in producing that data for the Fund; |
| | (g) | | the undertakings of the Investment Adviser and its affiliates to implement fee waivers and/or expense limitations; |
| | (h) | | information relating to the profitability of the Management Agreement and the transfer agency and distribution and service arrangements of the Fund to the Investment Adviser and its affiliates; |
| | (i) | | whether the Fund’s existing management fee schedule adequately addressed any economies of scale; |
| | (j) | | a summary of the “fall-out” benefits derived by the Investment Adviser and its affiliates from their relationships with the Fund, including the fees received by the Investment Adviser’s affiliates from the Fund for transfer agency, distribution and other services; |
| | (k) | | a summary of potential benefits derived by the Fund as a result of its relationship with the Investment Adviser; |
| | (l) | | portfolio manager ownership of Fund shares; the manner in which portfolio manager compensation is determined; information on the Sub-Advisers’ compensation arrangements; and the number and types of accounts managed by the portfolio managers; |
| | (m) | | the nature and quality of the services provided to the Fund by its unaffiliated service providers (including the Sub-Advisers), and the Investment Adviser’s general oversight and evaluation (including reports on due diligence) of those service providers as part of the administrative services provided under the Management Agreement; and |
| | (n) | | the Investment Adviser’s processes and policies addressing various types of potential conflicts of interest; its approach to risk management; the annual review of the effectiveness of the Fund’s compliance program; and periodic compliance reports. |
The Trustees also received an overview of the Fund’s distribution arrangements. They received information regarding the Fund’s assets, share purchase and redemption activity, and payment of distribution and service fees. Information was also provided to the Trustees relating to revenue sharing payments made by and services provided by the Investment Adviser and its affiliates to intermediaries that promote the sale, distribution, and/or servicing of Fund shares.
The presentations made at the Board and Committee meetings and at the Annual Meeting encompassed the Fund and other mutual funds for which the Board of Trustees has responsibility. In evaluating the Management Agreement at the Annual Meeting, the Trustees relied upon their knowledge, resulting from their meetings and other interactions throughout the year, of the Investment Adviser and its affiliates, their services, and the Fund. In conjunction with these meetings, the Trustees received written materials and oral presentations on the topics covered, and the Investment Adviser addressed the questions and concerns of the Trustees, including concerns regarding the investment performance of certain of the funds they oversee. The Independent Trustees were advised by their independent legal counsel regarding their responsibilities and other regulatory requirements related to the approval and continuation of mutual fund investment management agreements under applicable law. In addition, the Investment Adviser and its affiliates provided the Independent Trustees with a written response to a formal request for information sent on behalf of the Independent Trustees by their independent legal counsel. During the course of their deliberations, the Independent Trustees met in executive sessions with their independent legal counsel, without representatives of the Investment Adviser or its affiliates present.
Nature, Extent, and Quality of the Services Provided Under the Management Agreement
As part of their review, the Trustees considered the nature, extent, and quality of the services provided to the Fund by the Investment Adviser. In this regard, the Trustees considered both the investment advisory services and non-advisory services that are provided by the Investment Adviser and its affiliates. The Trustees noted the transition in the leadership and changes in personnel of various of the Investment Adviser’s portfolio management teams that had occurred in recent periods, and the ongoing recruitment efforts aimed at bringing high quality investment talent to the Investment Adviser. They also noted the Investment Adviser’s commitment to maintaining high quality systems and expending substantial resources to respond to ongoing changes to the regulatory and control environment in which the Fund and its service providers operate, as well as the efforts of the Investment Adviser and its affiliates to combat cyber security risks. The Trustees concluded that the Investment Adviser continued to commit substantial financial and operational resources to the Fund and expressed confidence that the Investment Adviser would continue to do so in the future. The Trustees also recognized that the Investment Adviser had made significant commitments to address regulatory compliance requirements applicable to the Fund and the Investment Adviser and its affiliates. In addition, the Trustees reviewed the Sub-Adviser oversight process that the Investment Adviser had employed, which included areas such as investment analytics, risk management and compliance.
75
GOLDMAN SACHS MULTI-MANAGER ALTERNATIVES FUND
Statement Regarding Basis for Approval of Management Agreement and Sub-Advisory Agreements (Unaudited) (continued)
Investment Performance
The Trustees also considered the investment performance of the Fund. In this regard, they compared the investment performance of the Fund to its peers using rankings and ratings compiled by the Outside Data Provider as of June 30, 2016 or by the Investment Adviser using the Outside Data Provider peer groups. The information on the Fund’s investment performance was provided for the one-year period ending on June 30, 2016. The Trustees also reviewed the Fund’s investment performance relative to its performance benchmark. The Trustees considered the Investment Adviser’s representations that the Fund had significant differences from its Outside Data Provider peer group and/or benchmark index that caused them to be imperfect bases for comparison. As part of this review, they considered the investment performance trends of the Fund over time, and reviewed the investment performance of the Fund in light of its investment objective and policies and market conditions. The Trustees also received information comparing the Fund’s performance to that of comparable unregistered funds for which the Investment Adviser also serves as investment adviser. They considered that the unregistered funds provide an imperfect performance comparison because they are not subject to the requirements of the 1940 Act.
In addition, the Trustees considered materials prepared and presentations made throughout the year by the Investment Adviser’s senior management and portfolio management personnel in which Fund performance was assessed. The Trustees also considered the Investment Adviser’s periodic reports with respect to the Fund’s risk profile, and how the Investment Adviser’s approach to risk monitoring and management influences portfolio management.
The Trustees noted that the Fund’s Class A Shares and Institutional Shares had placed in the third quartile of the Fund’s performance peer group, and had outperformed the Fund’s primary benchmark index.
Costs of Services Provided and Competitive Information
The Trustees considered the contractual terms of the Management Agreement, the fee rates payable by the Fund thereunder, and the net amount retained by the Investment Adviser after payment of sub-advisory fees. In this regard, the Trustees considered information on the services rendered by the Investment Adviser to the Fund, which included both advisory and administrative services that were directed to the needs and operations of the Fund as a registered mutual fund.
In particular, the Trustees reviewed analyses prepared by the Outside Data Provider regarding the expense rankings of the Fund. The analyses provided a comparison of the Fund’s management fee and breakpoints to those of a relevant peer group and category universe; an expense analysis which compared the Fund’s overall net and gross expenses to a peer group and a category universe; and data comparing the Fund’s net expenses to the peer and category medians. The Trustees also considered comparative fee information for services provided by the Investment Adviser to collective investment vehicles having investment objectives and policies similar to those of the Fund. They considered information that indicated that services provided to the Fund differed in various significant respects from the services provided to other types of accounts which, in many cases, operated under less stringent legal and regulatory structures, required fewer services from the Investment Adviser to a smaller number of client contact points, and were less time-intensive. They also noted that certain of these types of accounts have a compensation structure which includes performance fees, and also pay additional asset-based fees and performance fees to the managers of underlying hedge funds. The analyses also compared the Fund’s transfer agency, custody and distribution fees, other expenses and fee waivers/reimbursements to those of the peer group and category medians. The Trustees concluded that the comparisons provided by the Outside Data Provider were useful in evaluating the reasonableness of the management fees and total expenses paid by the Fund.
In addition, the Trustees considered the Investment Adviser’s undertakings to implement fee waivers and/or expense limitations. The Trustees noted that the Investment Adviser had agreed to waive a portion of its management fee in an amount equal to the aggregate management fees paid to the Investment Adviser as the investment adviser to the Fund’s wholly-owned subsidiaries. They also considered the Investment Adviser’s undertaking to waive a portion of the management fees payable by the Fund that exceed a specified level. The Trustees also considered the Investment Adviser’s undertaking to limit the Fund’s “other expenses” ratios (excluding certain expenses) to a specified level.
In addition, the Trustees noted that shareholders are able to redeem their Fund shares at any time if shareholders believe that the Fund fees and expenses are too high or if they are dissatisfied with the performance of the Fund.
Profitability
The Trustees reviewed the Investment Adviser’s revenues and pre-tax profit margins with respect to the Fund. In this regard the Trustees noted that they had received, among other things, profitability analyses and summaries, revenue and expense schedules by Fund and by function (i.e., investment management, transfer agency and distribution and service), and information on the Investment Adviser’s expense allocation methodology. They observed that the profitability and expense figures are substantially similar to those used by the Investment Adviser for many internal purposes, including compensation decisions among
76
GOLDMAN SACHS MULTI-MANAGER ALTERNATIVES FUND
Statement Regarding Basis for Approval of Management Agreement and Sub-Advisory Agreements (Unaudited) (continued)
various business groups, and are thus subject to a vigorous internal debate about how certain revenue and expenses should be allocated. The Trustees also noted that the internal audit group within the Goldman Sachs organization had audited the expense allocation methodology and was satisfied with the reasonableness, consistency, and accuracy of the Investment Adviser’s expense allocation methodology and profitability analysis calculations. The Trustees considered profitability information for the Fund in relation to the Investment Adviser’s overall profitability.
Economies of Scale
The Trustees considered the information that had been provided regarding the Investment Adviser’s profitability. The Trustees also considered the breakpoints in the fee rate payable under the Management Agreement for the Fund at the following annual percentage rates of the average daily net assets of the Fund:
| | | | |
First $2 billion | | | 1.90 | % |
Next $3 billion | | | 1.80 | |
Next $3 billion | | | 1.71 | |
Over $8 billion | | | 1.68 | |
The Trustees noted that the breakpoints were designed to share potential economies of scale, if any, with the Fund and its shareholders as assets under management reach those asset levels. The Trustees considered the amounts of assets in the Fund; the Fund’s recent share purchase and redemption activity; the information provided by the Investment Adviser relating to the costs of the services provided by the Investment Adviser and its affiliates and their realized profits; information comparing fee rates charged by the Investment Adviser with fee rates charged to other funds in the peer group; and the Investment Adviser’s undertaking to waive a portion of its management fee and to limit certain expenses of the Fund that exceed specified levels. Upon reviewing these matters at the Annual Meeting, the Trustees concluded that the fee breakpoints represented a means of assuring that benefits of scalability, if any, would be passed along to shareholders at the specified asset levels. The Independent Trustees also considered the relationship between the advisory and sub-advisory fee rate schedules.
Other Benefits to the Investment Adviser and Its Affiliates
The Trustees also considered the other benefits derived by the Investment Adviser and its affiliates from their relationships with the Fund as stated above, including: (a) transfer agency fees received by Goldman, Sachs & Co. (“Goldman Sachs”); (b) brokerage and futures commissions earned by Goldman Sachs for executing securities and futures transactions on behalf of the Fund; (c) the Investment Adviser’s ability to leverage the infrastructure designed to service the Fund on behalf of its other clients; (d) the Investment Adviser’s ability to cross-market other products and services to Fund shareholders; (e) Goldman Sachs’ retention of certain fees as Fund Distributor; (f) the Investment Adviser’s ability to negotiate better pricing with custodians on behalf of its other clients, as a result of the relationship with the Fund; and (g) the possibility that the working relationship between the Investment Adviser and the Fund’s third-party service providers (including the Sub-Advisers) may cause those service providers to be more likely to do business with other areas of Goldman Sachs. In the course of considering the foregoing, the Independent Trustees requested and received further information quantifying certain of these fall-out benefits.
Other Benefits to the Fund and Its Shareholders
The Trustees also noted that the Fund receives certain potential benefits as a result of its relationship with the Investment Adviser, including: (a) enhanced servicing from vendors because of the volume of business generated by the Investment Adviser and its affiliates; (b) the Investment Adviser’s knowledge and experience gained from managing other accounts and products; (c) the Investment Adviser’s ability to hire and retain qualified personnel to provide services to the Fund because of the reputation of the Goldman Sachs organization; (d) the Fund’s access, through the Investment Adviser, to certain firmwide resources (e.g., proprietary risk management systems and databases), subject to certain restrictions; and (e) the Fund’s access to certain affiliated distribution channels. In addition, the Trustees noted the competitive nature of the mutual fund marketplace, and considered that many of the Fund’s shareholders invested in the Fund in part because of the Fund’s relationship with the Investment Adviser and that those shareholders have a general expectation that the relationship will continue.
Conclusion
In connection with their consideration of the Management Agreement, the Trustees gave weight to each of the factors described above, but did not identify any particular factor as controlling their decision. After deliberation and consideration of all of the information provided, including the factors described above, the Trustees concluded, in the exercise of their business
77
GOLDMAN SACHS MULTI-MANAGER ALTERNATIVES FUND
Statement Regarding Basis for Approval of Management Agreement and Sub-Advisory Agreements (Unaudited) (continued)
judgment, that the management fees paid by the Fund were reasonable in light of the services provided to it by the Investment Adviser, the Investment Adviser’s costs and the Fund’s current and reasonably foreseeable asset levels. The Trustees unanimously concluded that the Management Agreement should be approved and continued with respect to the Fund until August 31, 2017.
Designated Sub-Advisory Agreements
Nature, Extent, and Quality of the Services Provided Under the Designated Sub-Advisory Agreements and Performance
In evaluating the Designated Sub-Advisory Agreements, the Trustees relied upon materials furnished and presentations made by the Investment Adviser and the Designated Sub-Advisers. In evaluating the nature, extent, and quality of services provided by each Designated Sub-Adviser, the Trustees considered information on the services provided to the Fund by each Designated Sub-Adviser, including information about each Designated Sub-Adviser’s (a) personnel and organizational structure; (b) track record in managing funds and/or accounts with investment strategies similar to those employed on behalf of the Fund; (c) policies and procedures in place to address potential conflicts of interest; and (d) compliance program and code of ethics. The Trustees also reviewed the operations and investment performance of each Designated Sub-Adviser’s respective sleeve of the Fund since its inception. In considering each Designated Sub-Adviser’s investment performance, the Trustees reviewed a comparison of each Designated Sub-Adviser to relevant benchmark indices based on various metrics, including realized beta, excess return, alpha, and volatility. The Trustees also reviewed the services provided to the Fund under each Designated Sub-Advisory Agreement.
Costs of Services Provided
The Trustees reviewed the terms of each Designated Sub-Advisory Agreement, including the fee schedules for the Designated Sub-Advisers. They considered the breakpoints (if applicable) in the sub-advisory fee rate payable under each Designated Sub-Advisory Agreement. The Trustees noted that the compensation paid to each Designated Sub-Adviser would be paid by the Investment Adviser, not by the Fund, and the retention of the Designated Sub-Advisers does not increase the fees incurred by the Fund for advisory services. They noted that the Investment Adviser believes that the relationship between the management fees paid by the Fund and the sub-advisory fees paid by the Investment Adviser is appropriate given the level of services the Investment Adviser provides to the Fund and significant differences in cost drivers and risks associated with the respective services offered by the Investment Adviser and each Designated Sub-Adviser, as well as the management fee waivers and expense limitations that substantially reduce the fees retained by the Investment Adviser. In this regard, the Trustees considered that certain Designated Sub-Advisers had agreed to reduce their sub-advisory fee rate, which benefited shareholders of the Fund in light of the existing management fee waiver arrangements. The Trustees reviewed the anticipated blended average of all sub-advisory fees to be paid by the Investment Adviser with respect to the Fund in light of the overall management fee to be paid by the Fund.
Conclusion
In connection with their consideration of the Designated Sub-Advisory Agreements at the Meeting, the Trustees gave weight to various factors, but did not identify any particular factor as controlling their decision. After deliberation and consideration of the information provided, the Trustees present concluded that each Designated Sub-Advisory Agreement should be approved and continued until August 31, 2017.
New Sub-Advisory Agreements
In addition to the actions taken by the Trustees to approve the continuation of the Management Agreement and the Designated Sub-Advisory Agreements, upon the recommendation of the Investment Adviser, at meetings held on May 4, 2016 and September 14, 2016, the Trustees, including all of the Independent Trustees present, approved sub-advisory agreements (each, a “New Sub-Advisory Agreement”) between the Investment Adviser and Algert Global LLC and Wellington Management Company LLP (each, a “New Sub-Adviser” and, collectively, the “New Sub-Advisers”). In connection with their evaluation of the New Sub-Advisory Agreements, the Trustees received written materials and oral presentations on the topics covered, and were advised by their independent legal counsel. In addition, the Trustees received information prepared by each New Sub-Adviser in a written response to a formal request from the Investment Adviser.
Nature, Extent, and Quality of the Services Provided Under the New Sub-Advisory Agreements
In evaluating the New Sub-Advisory Agreements, they relied on the information provided by the Investment Adviser and each New Sub-Adviser. In evaluating the nature, extent, and quality of services to be provided by each New Sub-Adviser, the Trustees considered information on the services to be provided to the Fund by the New Sub-Adviser, including information about the New
78
GOLDMAN SACHS MULTI-MANAGER ALTERNATIVES FUND
Statement Regarding Basis for Approval of Management Agreement and Sub-Advisory Agreements (Unaudited) (continued)
Sub-Adviser’s (a) personnel and compensation structure; (b) track record in managing funds and/or accounts with investment strategies similar to those to be employed on behalf of the Fund; (c) policies and procedures in place to address potential conflicts of interest; and (d) compliance program and code of ethics. In this regard, they considered assessments provided by the Investment Adviser of each New Sub-Adviser, the New Sub-Adviser’s investment strategies and personnel and its compliance program. The Trustees considered that that certain of the New Sub-Advisers manage other assets for the Investment Adviser’s clients. They noted that, because none of the New Sub-Advisers had previously provided services to the Fund, there was no performance information to evaluate with respect to the Fund.
Costs of Services to be Provided
The Trustees reviewed the terms of the New Sub-Advisory Agreements and the proposed fee schedules, including any breakpoints. They noted that the compensation paid to the New Sub-Advisers would be paid by the Investment Adviser, not by the Fund. They also noted that the terms of the New Sub-Advisory Agreements were the result of arms’ length negotiations between the Investment Adviser and the applicable New Sub-Adviser. The Trustees reviewed the anticipated blended average of all sub-advisory fees to be paid by the Investment Adviser and how it would change upon hiring the New Sub-Advisers. They considered this information in light of the overall management fee to be paid by the Fund.
Conclusion
In connection with their consideration of the New Sub-Advisory Agreements, the Trustees gave weight to various factors, but did not identify any particular factor as controlling their decision. After deliberation and consideration of the information provided, the Trustees present concluded that each New Sub-Advisory Agreement should be approved for a period of two years from the time of its approval.
79
GOLDMAN SACHS MULTI-MANAGER ALTERNATIVES FUND
Trustees and Officers (Unaudited)
Independent Trustees
| | | | | | | | | | |
Name,
Address and Age1 | | Position(s) Held with the Trust | | Term of Office and
Length of
Time Served2 | | Principal Occupation(s) During Past 5 Years | | Number of
Portfolios in
Fund Complex
Overseen by
Trustee3 | | Other Directorships Held by Trustee4 |
Ashok N. Bakhru Age: 74 | | Chairman of the Board of Trustees | | Since 2012 | | Mr. Bakhru is retired. He was formerly Director, Apollo Investment Corporation (a business development company) (2008-2013); President, ABN Associates (a management and financial consulting firm) (1994-1996 and 1998-2012); Trustee, Scholarship America (1998-2005); Trustee, Institute for Higher Education Policy (2003-2008); Director, Private Equity Investors — III and IV (1998-2007), and Equity-Linked Investors II (April 2002-2007). Chairman of the Board of Trustees — Goldman Sachs Trust II; Goldman Sachs Trust; Goldman Sachs Variable Insurance Trust; Goldman Sachs BDC, Inc.; Goldman Sachs Private Middle Market Credit LLC; Goldman Sachs MLP Income Opportunities Fund; Goldman Sachs MLP and Energy Renaissance Fund; and Goldman Sachs ETF Trust. | | 142 | | None |
Cheryl K. Beebe Age: 60 | | Trustee | | Since 2015 | | Ms. Beebe is retired. She is Director, Convergys Corporation (2015-Present); Director, Packaging Corporation of America (2008-Present); and was formerly Executive Vice President, (2010-2014); and Chief Financial Officer, Ingredion, Inc. (a global corn refining and manufacturing company) (2004-2014). Trustee — Goldman Sachs Trust II. | | 17 | | Convergys Corporation (a customer management company); Packaging Corporation of America (producer of container board) |
John P. Coblentz, Jr. Age: 75 | | Trustee | | Since 2012 | | Mr. Coblentz is retired. Formerly, he was Partner, Deloitte & Touche LLP (a professional services firm) (1975-2003); Director, Emerging Markets Group, Ltd. (a consulting company) (2004-2006); and Director, Elderhostel, Inc. (a not-for profit organization) (2006-2012). Previously, Mr. Coblentz served as Trustee of Goldman Sachs Trust and Goldman Sachs Variable Insurance Trust (2003-2015). Trustee — Goldman Sachs Trust II; Goldman Sachs BDC, Inc.; Goldman Sachs Private Middle Market Credit LLC; Goldman Sachs MLP Income Opportunities Fund; Goldman Sachs MLP and Energy Renaissance Fund; and Goldman Sachs ETF Trust. | | 36 | | None |
Lawrence Hughes Age: 58 | | Trustee | | Since 2016 | | Mr. Hughes is retired. Formerly, he held senior management positions with BNY Mellon Wealth Management, a division of The Bank of New York Mellon Corporation (a financial services company) (1991-2015), most recently as Chief Executive Officer (2010-2015). He serves as Chairman of the Board of Directors, Ellis Memorial and Eldredge House (a not-for-profit organization) (2012-Present). Previously, Mr. Hughes served as an Advisory Board Member of Goldman Sachs Trust II (February 2016-April 2016). Trustee — Goldman Sachs Trust II. | | 17 | | None |
John F. Killian Age: 61 | | Trustee | | Since 2015 | | Mr. Killian is retired. He is Director, Consolidated Edison, Inc. (2007-Present); Director, Houghton Mifflin Harcourt Publishing Company (2011-Present); and formerly held senior management positions with Verizon Communications, Inc., including Executive Vice President and Chief Financial Officer (2009-2010); and President, Verizon Business, Verizon Communications, Inc. (2005-2009). Trustee — Goldman Sachs Trust II. | | 17 | | Consolidated Edison, Inc. (a utility holding company); Houghton Mifflin Harcourt Publishing Company |
| | | | | | | | | | |
80
GOLDMAN SACHS MULTI-MANAGER ALTERNATIVES FUND
Trustees and Officers (Unaudited) (continued)
Independent Trustees
| | | | | | | | | | |
Name,
Address and Age1 | | Position(s) Held with the Trust | | Term of Office and
Length of
Time Served2 | | Principal Occupation(s) During Past 5 Years | | Number of
Portfolios in
Fund Complex
Overseen by
Trustee3 | | Other Directorships Held by Trustee4 |
Richard P. Strubel Age: 77 | | Trustee | | Since 2012 | | Mr. Strubel is retired. Formerly, he served as Chairman of the Board of Trustees, Northern Funds (a family of retail and institutional mutual funds managed by Northern Trust Investments, Inc.) (2008-2014) and Trustee (1982-2014); Director, Cardean Learning Group (provider of educational services via the internet) (2003-2008); and Director, Gildan Activewear Inc. (a clothing marketing and manufacturing company) (2000-2014). He serves as Trustee Emeritus, The University of Chicago (1987-Present). Previously, Mr. Strubel served as Trustee of Goldman Sachs Trust (1987-2015) and Goldman Sachs Variable Insurance Trust (1997-2015). Trustee — Goldman Sachs Trust II; Goldman Sachs BDC, Inc.; Goldman Sachs Private Middle Market Credit LLC; Goldman Sachs MLP Income Opportunities Fund; Goldman Sachs MLP and Energy Renaissance Fund; and Goldman Sachs ETF Trust. | | 36 | | None |
Westley V. Thompson Age: 61 | | Trustee | | Since 2016 | | Mr. Thompson is retired. Formerly, he was President, Sun Life Financial, Inc. (a financial services company) (2008-2014); and held senior management positions at various insurance companies including affiliates of Lincoln National Corporation (1998-2008), Cigna Corporation (1994-1997), and Aetna, Inc. (1979-1994). Previously, Mr. Thompson served as an Advisory Board Member of Goldman Sachs Trust II (February 2016-April 2016). Trustee — Goldman Sachs Trust II. | | 17 | | None |
| | | | | | | | | | |
81
GOLDMAN SACHS MULTI-MANAGER ALTERNATIVES FUND
Trustees and Officers (Unaudited) (continued)
Interested Trustee*
| | | | | | | | | | |
Name,
Address and Age1 | | Position(s) Held with the Trust | | Term of Office and
Length of
Time Served2 | | Principal Occupation(s) During Past 5 Years | | Number of
Portfolios in
Fund Complex
Overseen by
Trustee3 | | Other Directorships Held by Trustee4 |
James A. McNamara Age: 54 | | President and Trustee | | Since 2012 | | Managing Director, Goldman Sachs (December 1998-Present); Director of Institutional Fund Sales, GSAM (April 1998-December 2000); and Senior Vice President and Manager, Dreyfus Institutional Service Corporation (January 1993- April 1998). President and Trustee — Goldman Sachs Trust II; Goldman Sachs Trust; Goldman Sachs Variable Insurance Trust; Goldman Sachs MLP Income Opportunities Fund; Goldman Sachs MLP and Energy Renaissance Fund; and Goldman Sachs ETF Trust. | | 140 | | None |
| | | | | | | | | | |
| * | | Mr. McNamara is considered to be an “Interested Trustee” because he holds a position with Goldman Sachs and owns securities issued by The Goldman Sachs Group, Inc. He holds comparable positions with certain other companies of which Goldman Sachs, GSAM or an affiliate thereof is the investment adviser, administrator and/or distributor. |
| 1 | | Each Trustee may be contacted by writing to the Trustee, c/o Goldman Sachs, 200 West Street, New York, New York, 10282, Attn: Caroline Kraus. Information is provided as of October 31, 2016. |
| 2 | | Subject to such policies as may be adopted by the Board from time-to-time, each Trustee holds office for an indefinite term, until the earliest of: (a) the election of his or her successor; (b) the date the Trustee resigns or is removed by the Board or shareholders, in accordance with the Trust’s Declaration of Trust; or (c) the termination of the Trust. The Board has adopted policies which provide that (a) no Trustee shall hold office for more than 15 years and (b) a Trustee shall retire as of December 31st of the calendar year in which he or she reaches his or her 74th birthday, unless a waiver of such requirement shall have been adopted by a majority of the other Trustees. These policies may be changed by the Trustees without shareholder vote. |
| 3 | | The Goldman Sachs Fund Complex includes certain other companies listed above for each respective Trustee. As of October 31, 2016, Goldman Sachs Trust II consisted of 17 portfolios (15 of which offered shares to the public); Goldman Sachs Trust consisted of 92 portfolios (91 of which offered shares to the public); Goldman Sachs Variable Insurance Trust consisted of 14 portfolios; Goldman Sachs BDC, Inc., Goldman Sachs Private Middle Market Credit LLC, Goldman Sachs MLP Income Opportunities Fund, and Goldman Sachs MLP and Energy Renaissance Fund each consisted of one portfolio; and Goldman Sachs ETF Trust consisted of 15 portfolios (eight of which offered shares to the public). Goldman Sachs Private Middle Market Credit LLC does not offer shares to the public. |
| 4 | | This column includes only directorships of companies required to report to the Securities and Exchange Commission under the Securities Exchange Act of 1934 (i.e., “public companies”) or other investment companies registered under the Act. |
Additional information about the Trustees is available in the Fund’s Statement of Additional Information, which can be obtained from Goldman Sachs free of charge by calling this toll-free number (in the United States of America): 1-800-526-7384.
82
GOLDMAN SACHS MULTI-MANAGER ALTERNATIVES FUND
Trustees and Officers (Unaudited) (continued)
Officers of the Trust*
| | | | | | |
Name, Address and Age1 | | Position(s) Held with the Trust | | Term of
Office and
Length of
Time Served2 | | Principal Occupation(s) During Past 5 Years |
James A. McNamara 200 West Street New York, NY 10282 Age: 54 | | President and Trustee | | Since 2012 | | Managing Director, Goldman Sachs (December 1998-Present); Director of Institutional Fund Sales, GSAM (April 1998-December 2000); and Senior Vice President and Manager, Dreyfus Institutional Service Corporation (January 1993-April 1998). President and Trustee — Goldman Sachs Trust II; Goldman Sachs Trust; Goldman Sachs Variable Insurance Trust; Goldman Sachs MLP Income Opportunities Fund; Goldman Sachs MLP and Energy Renaissance Fund; and Goldman Sachs ETF Trust. |
Caroline L. Kraus 200 West Street New York, NY 10282 Age: 39 | | Secretary | | Since 2012 | | Managing Director, Goldman Sachs (January 2016-Present); Vice President, Goldman Sachs (August 2006-December 2015); Associate General Counsel, Goldman Sachs (2012-Present); Assistant General Counsel, Goldman Sachs (August 2006-December 2011); and Associate, Weil, Gotshal & Manges, LLP (2002-2006). Secretary — Goldman Sachs Trust II; Goldman Sachs Trust (previously Assistant Secretary (2012)); Goldman Sachs Variable Insurance Trust (previously Assistant Secretary (2012)); Goldman Sachs BDC, Inc; Goldman Sachs Private Middle Market Credit LLC; Goldman Sachs Middle Market Lending LLC; Goldman Sachs MLP Income Opportunities Fund; Goldman Sachs MLP and Energy Renaissance Fund; and Goldman Sachs ETF Trust. |
Scott M. McHugh 200 West Street New York, NY 10282 Age: 45 | | Treasurer, Senior Vice President and Principal Financial Officer | | Since 2012 (Principal Financial Officer since 2013) | | Managing Director, Goldman Sachs (January 2016-Present); Vice President, Goldman Sachs (February 2007-December 2015); Assistant Treasurer of certain mutual funds administered by DWS Scudder (2005-2007); and Director (2005-2007), Vice President (2000-2005), and Assistant Vice President (1998-2000), Deutsche Asset Management or its predecessor (1998-2007). Treasurer, Senior Vice President and Principal Financial Officer — Goldman Sachs Trust II; Goldman Sachs Trust; Goldman Sachs Variable Insurance Trust; Goldman Sachs MLP Income Opportunities Fund; Goldman Sachs MLP and Energy Renaissance Fund; and Goldman Sachs ETF Trust. |
| | | | | | |
| * | | Represents a partial list of officers of the Trust. Additional information about all the officers is available in the Fund’s Statement of Additional Information, which can be obtained from Goldman Sachs free of charge by calling this toll-free number (in the United States): 1-800-526-7384. |
| 1 | | Information is provided as of October 31, 2016. |
| 2 | | Officers hold office at the pleasure of the Board of Trustees or until their successors are duly elected and qualified. Each officer holds comparable positions with certain other companies of which Goldman Sachs, GSAM or an affiliate thereof is the investment adviser, administrator and/or distributor. |
83
GOLDMAN SACHS MULTI-MANAGER ALTERNATIVES FUND
Goldman Sachs Trust II — Goldman Multi-Manager Alternatives Fund — Tax Information (Unaudited)
For the year ended October 31, 2016, 92.07% of the dividends paid from net investment company taxable income by the Multi-Manager Alternatives Fund, qualify for the dividends received deduction available to corporations.
For the year ended October 31, 2016, 65.24%, of the dividends paid from net investment company taxable income by the Multi-Manager Alternatives Fund, qualify for the reduced tax rate under the Jobs and Growth Tax Relief and Reconciliation Act of 2003.
84
FUNDS PROFILE
Goldman Sachs Funds
Goldman Sachs is a premier financial services firm, known since 1869 for creating thoughtful and customized investment solutions in complex global markets.
Today, the Investment Management Division of Goldman Sachs serves a diverse set of clients worldwide, including private institutions, public entities and individuals. With approximately $1.15 trillion in assets under supervision as of September 30, 2016, Goldman Sachs Asset Management (“GSAM”) has portfolio management teams located around the world and our investment professionals bring firsthand knowledge of local markets to every investment decision. Assets under supervision includes assets under management and other client assets for which Goldman Sachs does not have full discretion. GSAM leverages the resources of Goldman, Sachs & Co. subject to legal, internal and regulatory restrictions.
Money Market
Financial Square FundsSM
| n | | Financial Square Treasury Solutions Fund1 |
| n | | Financial Square Government Fund1 |
| n | | Financial Square Money Market Fund2 |
| n | | Financial Square Prime Obligations Fund2 |
| n | | Financial Square Treasury Instruments Fund1 |
| n | | Financial Square Treasury Obligations Fund1 |
| n | | Financial Square Federal Instruments Fund1 |
| n | | Financial Square Tax-Exempt Money Market Fund2 |
Investor FundsSM
| n | | Investor Money Market Fund3 |
| n | | Investor Tax-Exempt Money Market Fund3,4 |
Fixed Income
Short Duration and Government
| n | | High Quality Floating Rate Fund |
| n | | Short-Term Conservative Income Fund5 |
| n | | Short Duration Government Fund |
| n | | Short Duration Income Fund |
| n | | Inflation Protected Securities Fund |
Multi-Sector
Municipal and Tax-Free
| n | | High Yield Municipal Fund |
| n | | Dynamic Municipal Income Fund |
| n | | Short Duration Tax-Free Fund |
Single Sector
| n | | Investment Grade Credit Fund |
| n | | High Yield Floating Rate Fund |
| n | | Emerging Markets Debt Fund |
| n | | Local Emerging Markets Debt Fund |
| n | | Dynamic Emerging Markets Debt Fund |
Fixed Income Alternatives
| n | | Long Short Credit Strategies Fund |
| n | | Fixed Income Macro Strategies Fund |
Fundamental Equity
| n | | Small/Mid Cap Value Fund |
| n | | Small/Mid Cap Growth Fund |
| n | | Flexible Cap Growth Fund |
| n | | Concentrated Growth Fund |
| n | | Technology Opportunities Fund |
| n | | Growth Opportunities Fund |
| n | | Rising Dividend Growth Fund |
| n | | Dynamic U.S. Equity Fund |
Tax-Advantaged Equity
| n | | U.S. Tax-Managed Equity Fund |
| n | | International Tax-Managed Equity Fund |
| n | | U.S. Equity Dividend and Premium Fund |
| n | | International Equity Dividend and Premium Fund |
Equity Insights
| n | | Small Cap Equity Insights Fund |
| n | | U.S. Equity Insights Fund |
| n | | Small Cap Growth Insights Fund |
| n | | Large Cap Growth Insights Fund |
| n | | Large Cap Value Insights Fund |
| n | | Small Cap Value Insights Fund |
| n | | International Small Cap Insights Fund6 |
| n | | International Equity Insights Fund |
| n | | Emerging Markets Equity Insights Fund |
Fundamental Equity International
| n | | Strategic International Equity Fund |
| n | | Focused International Equity Fund |
| n | | Emerging Markets Equity Fund |
Select Satellite
| n | | Real Estate Securities Fund |
| n | | International Real Estate Securities Fund |
| n | | Commodity Strategy Fund |
| n | | Global Real Estate Securities Fund |
| n | | Dynamic Commodity Strategy Fund |
| n | | Dynamic Allocation Fund |
| n | | Absolute Return Tracker Fund |
| n | | Managed Futures Strategy Fund |
| n | | MLP Energy Infrastructure Fund |
| n | | Multi-Manager Alternatives Fund |
| n | | Multi-Asset Real Return Fund |
| n | | Absolute Return Multi-Asset Fund |
| n | | Global Infrastructure Fund |
Total Portfolio Solutions
| n | | Global Managed Beta Fund |
| n | | Multi-Manager Non-Core Fixed Income Fund |
| n | | Multi-Manager U.S. Dynamic Equity Fund |
| n | | Multi-Manager Global Equity Fund |
| n | | Multi-Manager International Equity Fund |
| n | | Tactical Tilt Overlay Fund7 |
| n | | Balanced Strategy Portfolio |
| n | | Multi-Manager U.S. Small Cap Equity Fund |
| n | | Multi-Manager Real Assets Strategy Fund |
| n | | Growth and Income Strategy Portfolio |
| n | | Growth Strategy Portfolio |
| n | | Equity Growth Strategy Portfolio |
| n | | Satellite Strategies Portfolio |
| n | | Enhanced Dividend Global Equity Portfolio |
| n | | Tax-Advantaged Global Equity Portfolio |
| n | | Strategic Factor Allocation Fund |
| n | | Target Date 2020 Portfolio |
| n | | Target Date 2025 Portfolio |
| n | | Target Date 2030 Portfolio |
| n | | Target Date 2035 Portfolio |
| n | | Target Date 2040 Portfolio |
| n | | Target Date 2045 Portfolio |
| n | | Target Date 2050 Portfolio |
| n | | Target Date 2055 Portfolio |
| n | | GQG Partners International Opportunities Fund |
| 1 | | You could lose money by investing in the Fund. Although the Fund seeks to preserve the value of your investment at $1.00 per share, it cannot guarantee it will do so. An investment in the Fund is not a deposit of a bank and is not insured or guaranteed by the Federal Deposit Insurance Corporation or any other government agency. The Fund’s sponsor has no legal obligation to provide financial support to the Fund, and you should not expect that the sponsor will provide financial support to the Fund at any time. |
| 2 | | You could lose money by investing in the Fund. Because the share price of the Fund will fluctuate, when you sell your shares they may be worth more or less than what you originally paid for them. The Fund may impose a fee upon sale of your shares or may temporarily suspend your ability to sell shares if the Fund’s liquidity falls below required minimums because of market conditions or other factors. An investment in the Fund is not a deposit of a bank and is not insured or guaranteed by the Federal Deposit Insurance Corporation or any other government agency. The Fund’s sponsor has no legal obligation to provide financial support to the Fund, and you should not expect that the sponsor will provide financial support to the Fund at any time. |
| 3 | | You could lose money by investing in the Fund. Although the Fund seeks to preserve the value of your investment at $1.00 per share, it cannot guarantee it will do so. The Fund may impose a fee upon sale of your shares or may temporarily suspend your ability to sell shares if the Fund’s liquidity falls below required minimums because of market conditions or other factors. An investment in the Fund is not a deposit of a bank and is not insured or guaranteed by the Federal Deposit Insurance Corporation or any other government agency. The Fund’s sponsor has no legal obligation to provide financial support to the Fund, and you should not expect that the sponsor will provide financial support to the Fund at any time. |
| 4 | | Effective on March 31, 2016, the Goldman Sachs Financial Square Tax-Free Money Market Fund was renamed the Goldman Sachs Investor Tax-Exempt Money Market Fund. |
| 5 | | Effective on July 29, 2016, the Goldman Sachs Limited Maturity Obligations Fund was renamed the Goldman Sachs Short-Term Conservative Income Fund. |
| 6 | | Effective at the close of business on February 5, 2016, the Goldman Sachs International Small Cap Fund was reorganized with and into the Goldman Sachs International Small Cap Insights Fund. |
| 7 | | Effective on June 1, 2016, the Goldman Sachs Tactical Tilt Implementation Fund was renamed the Goldman Sachs Tactical Tilt Overlay Fund. |
Financial Square FundsSM and Investor FundsSM are registered service marks of Goldman, Sachs & Co.
| * | | This list covers open-end funds only. Please visit our website at www.GSAMFUNDS.com to learn about our closed-end funds and exchange-traded funds. |
| | |
TRUSTEES Ashok N. Bakhru, Chairman Cheryl K. Beebe John P. Coblentz, Jr. Lawrence Hughes John F. Killian James A. McNamara Richard P. Strubel Westley V. Thompson | | OFFICERS James A. McNamara, President Scott M. McHugh, Principal Financial Officer,
Senior Vice President and Treasurer Caroline L. Kraus, Secretary |
| |
GOLDMAN, SACHS & CO. Distributor and Transfer Agent | | GOLDMAN SACHS ASSET MANAGEMENT, L.P. Investment Adviser |
Visit our web site at www.GSAMFUNDS.com to obtain the most recent month-end returns.
Goldman Sachs Asset Management, L.P. 200 West Street, New York, New York 10282
The reports concerning the Fund included in this shareholder report may contain certain forward-looking statements about the factors that may affect the performance of the Fund in the future. These statements are based on Fund management’s predictions and expectations concerning certain future events and their expected impact on the Fund, such as performance of the economy as a whole and of specific industry sectors, changes in the levels of interest rates, the impact of developing world events, and other factors that may influence the future performance of the Fund. Management believes these forward-looking statements to be reasonable, although they are inherently uncertain and difficult to predict. Actual events may cause adjustments in portfolio management strategies from those currently expected to be employed.
A description of the policies and procedures that the Fund uses to determine how to vote proxies relating to portfolio securities and information regarding how the Fund voted proxies relating to portfolio securities during the most recent 12-month period ended June 30 is available (I) without charge, upon request by calling 1-800-526-7384 (for Retail Shareholders) or 1-800-621-2550 (for Institutional Shareholders); and (II) on the Securities and Exchange Commission (“SEC”) web site at http://www.sec.gov.
The Fund files its complete schedule of portfolio holdings with the SEC for the first and third quarters of each fiscal year on Form N-Q. The Fund’s Forms N-Q are available on the SEC’s web site at http://www.sec.gov within 60 days after the Fund’s first and third fiscal quarters. The Fund’s Forms N-Q may be reviewed and copied at the SEC’s Public Reference Room in Washington, D.C., and information on the operation of the Public Reference Room may also be obtained by calling 1-800-SEC-0330. Form N-Q may be obtained upon request and without charge by calling 1-800-526-7384 (for Retail Shareholders) or 1-800-621-2550 (for Institutional Shareholders).
Fund holdings and allocations shown are as of October 31, 2016 and may not be representative of future investments. Fund holdings should not be relied on in making investment decisions and should not be construed as research or investment advice regarding particular securities. Current and future holdings are subject to risk.
Economic and market forecasts presented herein reflect our judgment as of the date of this presentation and are subject to change without notice. These forecasts do not take into account the specific investment objectives, restrictions, tax and financial situation or other needs of any specific client. Actual data will vary and may not be reflected here. These forecasts are subject to high levels of uncertainty that may affect actual performance. Accordingly, these forecasts should be viewed as merely representative of a broad range of possible outcomes. These forecasts are estimated, based on assumptions, and are subject to significant revision and may change materially as economic and market conditions change. Goldman Sachs has no obligation to provide updates or changes to these forecasts. Case studies and examples are for illustrative purposes only.
The portfolio risk management process includes an effort to monitor and manage risk, but does not imply low risk. Past correlations are not indicative of future correlations, which may vary.
This material is not authorized for distribution to prospective investors unless preceded or accompanied by a current Prospectus or summary prospectus, if applicable. Investors should consider a Fund’s objective, risks, and charges and expenses, and read the summary prospectus, if available, and/or the Prospectus carefully before investing or sending money. The summary prospectus, if available, and the Prospectus contain this and other information about the Fund and may be obtained from your authorized dealer or from Goldman, Sachs & Co. by calling (retail – 1-800-526-7384) (institutional – 1-800-621-2550).
© 2016 Goldman Sachs. All rights reserved. 74863-TMPL-12/2016 MMALTAR-16/12k
Goldman Sachs Funds

| | | | |
| | |
| Annual Report | | | | October 31, 2016 |
| | |
| | | | Strategic Multi-Asset Class Funds |
| | | | Multi-Manager Global Equity |
| | | | Multi-Manager Non-Core Fixed Income |
| | | | Multi-Manager Real Assets Strategy |

Goldman Sachs Strategic
Multi-Asset Class Funds
| ∎ | | MULTI-MANAGER GLOBAL EQUITY |
| ∎ | | MULTI-MANAGER NON-CORE FIXED INCOME |
| ∎ | | MULTI-MANAGER REAL ASSETS STRATEGY |
| | | | |
TABLE OF CONTENTS | |
| |
Market Review | | | 1 | |
| |
Portfolio Management Discussion and Performance Summaries | | | 4 | |
| |
Schedules of Investments | | | 24 | |
| |
Financial Statements | | | 68 | |
| |
Financial Highlights | | | 72 | |
| |
Notes to Financial Statements | | | 78 | |
| |
Report of Independent Registered Public Accounting Firm | | | 96 | |
| |
Other Information | | | 97 | |
| | | | |
| | | |
| NOT FDIC-INSURED | | May Lose Value | | No Bank Guarantee |
MARKET REVIEW
Goldman Sachs Strategic Multi-Asset Class Funds
Market Review
The 12 months ended October 31, 2016 (the “Reporting Period”) were marked by spans of uncertainty and market volatility, beginning with the Federal Reserve’s (the “Fed”) first interest rate increase in nearly a decade in December 2015. Shortly thereafter, the People’s Bank of China took the step of devaluing its currency, the renminbi, setting off a sharp worldwide sell-off in risk assets, as investors sought relative safety in the uncertainty surrounding the scale and impact of Chinese monetary policy. This “risk off” sentiment persisted into the middle of February 2016, then subsided until uncertainty around the U.K.’s June 2016 referendum on whether to remain a member of the European Union led to significant price action in U.K. assets. The U.K.’s unexpected decision to leave the European Union, popularly known as “Brexit”, set off another sharp sell-off in equity and currency markets in late June 2016. The British pound dropped precipitously versus the U.S. dollar and the euro, hitting levels not seen since the 1980s.
Equities generally recovered from the Brexit shock over the summer of 2016, as markets turned their attention to the then-upcoming U.S. election. Meanwhile, the Fed expressed an unexpectedly dovish outlook following the volatility of early 2016, reducing the number of potential 2016 interest rate hikes from four to two. (Dovish commentary tends to suggest lower interest rates.) Accommodative monetary policy persisted globally. The European Central Bank left its interest rates unchanged. The Bank of Japan left its interest rates steady while announcing a plan to target its yield curve, or spectrum of maturities, and adjusting its inflation goal to exceed 2%.
Global equity markets ended the Reporting Period broadly positive despite the Reporting Period’s volatility. In the U.S., equities gained strength in the information technology sector and showed strong performance from higher yielding, traditionally defensive sectors, such as utilities, telecommunication services and consumer staples. Quantitative easing on a worldwide scale drove investors to search elsewhere for yield, boosting traditionally defensive equity sectors as well as corporate credit. On the other hand, health care companies underperformed the broader U.S. equity market, as election year rhetoric increased worries about downward pressure on drug pricing and increased regulatory scrutiny. Financials, facing margin pressure from low interest rates and regulatory spending, also underperformed. Low volatility stocks outperformed in the defensive sector rally, and oil prices rebounded from early 2016 lows, boosting the energy sector and certain commodity-linked businesses.
Credit markets ended the Reporting Period in largely positive territory, as accommodative monetary policy drove yield-hungry investors into the corporate credit markets. Credit spreads, or yield differentials to government bonds, tightened from their January 2016 highs, with commodity-exposed and energy-related industries, particularly within the high yield corporate bond sector, leading gains. In the U.S., issuers took advantage of low interest rates and strong foreign demand to drive new offerings. Abroad, emerging market credit, offering comparatively more attractive yields and less sovereign leverage, rallied. Money market reform in the U.S. led to significant outflows from prime money market funds into government money market funds, leading to an increase in the three-month LIBOR rate and implications of the coupon rates of floating rate credit.
Public real estate markets were similarly driven during the Reporting Period by investors’ search for yield within a low interest rate environment. While global real estate markets finished the Reporting Period in positive territory, there was significant dispersion in performance between higher yielding and lower yielding securities, with higher yielding
1
MARKET REVIEW
securities significantly outperforming. The markets experienced notable volatility during the Reporting Period, with a sell-off in U.S. office real estate investment trusts (“REITs”) at the beginning of 2016, a notable rally in Japanese REITs in the first quarter of 2016 despite concerns around quality and valuation following the Bank of Japan’s move to negative interest rates, and a sharp decline and subsequent rebound in U.K. real estate immediately following the European Union referendum vote in June 2016. In the third quarter of 2016 and in October 2016, we saw a rotation in the markets, as pockets that had previously outperformed took a pause while renewed flows into areas of the market that have previously been stressed, including Hong Kong, stood out to the upside.
By the end of the Reporting Period, the market-implied probability of an interest rate hike by the Fed by December 2016 was 70%. Global central banks, while maintaining policies of quantitative easing, had begun to discuss the limitations of further easing and the broader implications of continued easing in the market. At the end of the Reporting Period, it appeared that political uncertainty in the U.S. surrounding the November 8 election and its aftermath as well as concerns about the effect of a potential “hard Brexit” in March 2017 were likely to be drivers of near-term market volatility. (“Hard Brexit” is one of the ways the U.K. could separate itself from the European Union; opposite of “soft Brexit.” Both terms refer to the closeness or distance of the U.K.’s relationship with the European Union after the separation has been completed.)
Looking Ahead
At the end of the Reporting Period, we remained more constructive on equities than on credit and on credit relative to interest rates and increasingly on emerging markets over developed markets. While the economy appeared to us to be in the late stages of recovery, we maintained our belief that absent external shocks, the economy still has room to grow. As such, we remained cautiously supportive of risk assets at the end of the Reporting Period.
Equities
At the end of the Reporting Period, we believed continued economic expansion should be supportive for equities, and strategically, we favored the asset class. We expected a large part of the mis-valuation between asset classes to be resolved through higher bond yields rather than through a substantial rally in equities, and therefore expected muted, but positive, equity returns. However, in our view, the risks are to the upside. If bond yields stay around levels seen at the end of the Reporting Period, against our expectations, then we believe a substantial rally would be needed in equities to bring the pricing of equities in line with the bond market.
Emerging versus Developed Markets
Generally, we became more constructive on emerging markets versus developed markets from a cyclical perspective during the Reporting Period, as during the past five years, we think sufficient progress has been made on various fronts, including valuation, macro imbalances, dissipating challenges to growth, and improving perception of emerging markets. In the medium term, we believe this sets the scene for renewed emerging market outperformance, while in the near term, we are also positive but see the risk/reward balance as closer to balanced, due to the risk of temporary headwinds from a rise in bond yields in developed markets. We also remained concerned at the end of the Reporting Period about downside risks from China, but its renewed policy support has made those risks smaller for the time being, in our view.
2
MARKET REVIEW
Fixed Income
At the end of the Reporting Period, we saw U.S. corporate credit spreads, or yield differentials to U.S. Treasuries, as roughly in line with the current macro environment. We expected spreads to be largely range-bound, with a small drift higher, as the economic expansion matures. We were bearish on government bonds, as we believed the market was underpricing the short-term end of the yield curve and the pace of future interest rate hikes, while a potential curve sell-off at the long-term end could occur either due to a reassessment of the future path of interest rate hikes or due to the evolution of central bank policies in the U.S. and abroad. (If investors expect upward price movement in a particular market, the sentiment is said to be bullish. On the contrary, if the market sentiment is bearish, most investors expect downward price movement.)
With a focus on developed markets but acknowledging broader market implications, we would note policy disappointment as a core risk to markets, particularly given elevated expectations. Our models suggest the Fed is behind the curve, partially due to external drivers and partially because the need for further easing is limited, as supported by a tightening labor market and building inflationary pressures. In Japan and the periphery of Europe, inflation is low, but in these countries, debt levels are already high, making it hard to ease further. As such the bar for easing surprises, in our view, is high. In the U.S., markets were pricing in less than a 15% chance of more than two rate hikes by the end of 2017. On the fiscal side, the removal of past tightening has already supported economic growth and an even larger impact would require, we believe, an accelerating expansion of deficits.
On balance, we believe equities performing better than bonds may well be driven more by higher bond yields, rather than strong equity performance. In turn, we expect a more range-bound environment in equities but maintain conviction in a European recovery, with performance driven by improving economic growth, fundamentals, accommodative monetary policy, tailwinds from a weaker euro and thawing credit markets. We maintain that the U.S. economy is likely to be resilient, although U.S. equity returns are likely to be muted. Across emerging markets equity, we were, at the end of the Reporting Period, marginally constructive, as better economic data, dovish global central banks and a stabilizing U.S. dollar helped reverse sentiment across the emerging market complex toward the end of the Reporting Period.
From a longer-term strategic asset allocation perspective, we intend to finalize shifts within the Funds in line with our Global Portfolio Solutions (“GPS”) investment process.
3
PORTFOLIO RESULTS
Goldman Sachs Multi-Manager
Global Equity Fund
Investment Objective
The Fund seeks to provide long-term capital growth.
Portfolio Management Discussion and Analysis
Below, the Goldman Sachs Global Portfolio Solutions (“GPS”) and Alternative Investments & Manager Selection (“AIMS”) Groups discuss the Goldman Sachs Multi-Manager Global Equity Fund’s (the “Fund”) performance and positioning for the 12-month period ended October 31, 2016 (the “Reporting Period”).
| Q | | How did the Fund perform during the Reporting Period? |
| A | | During the Reporting Period, the Fund’s Institutional Shares generated an average annual total return of 0.74%. This return compares to the 2.72% average annual total return of the Fund’s benchmark, the MSCI All Country World Index Investable Market Index (“ACWI IMI”) (Net, USD, 50% Non-U.S. Developed Hedged to USD) (the “Index”), during the same time period. |
| Q | | What key factors were responsible for the Fund’s performance during the Reporting Period? |
| A | | The Fund posted positive absolute returns but underperformed the Index during the Reporting Period. The Fund’s performance during the Reporting Period can be attributed to the performance of the Fund’s Underlying Managers, who are unaffiliated investment managers that employ a global equity investment strategy. During the Reporting Period, the Fund allocated capital to ten Underlying Managers — Causeway Capital Management LLC (“Causeway”), Epoch Investment Partners, Inc. (“Epoch”), Fisher Asset Management, LLC (“Fisher”), GW&K Investment Management, LLC (“GW&K”), Parametric Portfolio Associates LLC (“Parametric”), Principal Global Investors, LLC (“Principal”), Robeco Investment Management, Inc. doing business as Boston Partners (“Boston Partners”), Scharf Investments, LLC (“Scharf”), Vulcan Value Partners, LLC (“Vulcan”) and WCM Investment Management (“WCM”). Parametric and Principal were each initially allocated assets during the Reporting Period, and each was added to replace positions held in passive exchange-traded funds (“ETFs”) that were redeemed earlier in the Reporting Period. |
| | The ten Underlying Managers with assets allocated to them during the Reporting Period represented five asset classes across global equity as part of the Fund’s top-level strategy allocation — U.S. large cap (Scharf and Vulcan), Europe, Australasia and Far East (“EAFE”) large cap (Causeway and WCM), U.S. small cap (GW&K and Boston Partners), EAFE small cap (Epoch and Principal) and emerging markets (Fisher and Parametric). Of the ten Underlying Managers with allocated capital during the Reporting Period, three generated negative absolute returns and seven generated positive absolute returns. On a relative basis, seven Underlying Managers underperformed their respective strategy benchmark, while three outperformed their respective strategy benchmark. |
| | The Fund additionally uses Russell Investments Implementation Services, LLC (“Russell”) for a currency overlay program given the hedged nature of the Fund’s benchmark. |
| | The Fund’s performance relative to the Index was mainly driven by manager selection, which overall detracted during the Reporting Period. The largest contribution to underperformance came from U.S. large cap Underlying Managers Vulcan and Scharf, who underperformed the S&P 500 Index, the index to which we compare these Underlying Managers. On the positive side, the strongest relative performance came from international growth-oriented Underlying Manager WCM, who outperformed the MSCI ACWI ex-U.S. Index, the index to which we compare this Underlying Manager. |
4
PORTFOLIO RESULTS
| | | Strategic asset allocation, which reflects a longer-term perspective to diversify and invest across global equity markets, contributed positively to the Fund’s results during the Reporting Period. Strategic asset allocation performance relative to the Index benefited the Fund during the Reporting Period, driven by multiple factors but notably by allocation and timing of shifts within emerging and certain developed commodity-sensitive equity markets. Currency hedges also helped due to the strength of the U.S. dollar against non-U.S. developed market currencies. |
| Q | | Which global equity asset classes most significantly affected Fund performance? |
| A | | In U.S. large cap, which we measure relative to the S&P 500 Index, both Underlying Managers produced negative absolute returns and underperformed the benchmark index. Vulcan was negatively impacted by stock selection in consumer discretionary, financials and information technology, which was partially offset by effective stock selection in industrials. Scharf underperformed the S&P 500 Index during the Reporting Period due to stock selection in health care and information technology. Stock selection in financials partially offset Scharf’s underperformance. Both Underlying Managers were also negatively affected by underweights to yield-oriented sectors — particularly consumer staples and utilities — as well as to energy, which rallied during the Reporting Period. |
| | | In U.S. small cap, performance was mixed, as one Underlying Manager outperformed and the other underperformed their respective benchmarks. GW&K outperformed the Russell 2000 Index due to positive stock selection within consumer discretionary. Stock selection within materials partially offset GW&K’s outperformance. Boston Partners, the value-oriented Underlying Manager, underperformed the Russell 2000 Value Index due to stock selection within materials and information technology. Positive stock selection within industrials slightly offset Boston Partners’ underperformance. |
| | | Performance was also mixed in EAFE large cap, with one Underlying Manager outperforming and the other underperforming their respective benchmarks. WCM, who we compare to the MSCI ACWI ex-U.S. Index, significantly outperformed due to stock selection in information technology and financials. WCM’s outperformance was partially offset by positioning in energy and materials. Causeway, who we compare to the MSCI EAFE Index, lagged during the Reporting Period due to poor stock selection in the financials, industrials and materials sectors. Strong stock selection in telecommunication services and consumer discretionary partially mitigated Causeway’s underperformance. |
| | In EAFE small cap, both Epoch and Principal significantly underperformed the MSCI World ex-U.S. Small Cap Index during the Reporting Period. Epoch’s underperformance can be attributed to stock selection within financials and consumer discretionary. Principal underperformed due to stock selection within consumer discretionary and information technology, slightly offset by positive stock selection within financials. |
| | In emerging markets, Fisher underperformed the MSCI Emerging Markets Index. Fisher’s underperformance can be attributed to its overweight to and stock selection within health care as well as to its underweights to materials and consumer staples, slightly offset by positive stock selection within information technology. Parametric posted positive absolute returns and outperformed the MSCI Emerging Markets Index during the Reporting Period due to its more diversified sector and country exposure and specifically to its significant underweight to China. |
| Q | | How did the Fund use derivatives and similar instruments during the Reporting Period? |
| A | | Russell manages a currency overlay allocation that seeks to minimize unintended currency exposures that either reduce performance or increase risk of the Fund’s portfolio. Russell uses currency forwards as part of this strategy. Outside of Russell, the Fund did not use derivatives during the Reporting Period. |
| Q | | Were there any notable changes in the Fund’s allocations during the Reporting Period? |
| A | | There were no changes made in the Fund’s allocations during the Reporting Period. Throughout the Reporting Period, the Fund’s assets were allocated 33% to U.S. large cap, 28% to EAFE large cap, 9% to U.S. small cap, 17% to EAFE small cap and 11% to emerging markets. |
| Q | | Were there any changes to the Fund’s management team during the Reporting Period? |
| A | | Effective August 19, 2016, Jason Gottlieb was removed as a portfolio manager to the Fund, and Kent Clark and Tom Murray were added as portfolio managers, joining Neill Nuttall, Kate El-Hillow and Betsy Gorton. |
5
PORTFOLIO RESULTS
| Q | | What is the Fund’s tactical view and strategy for the months ahead? |
| A | | Overall, we intend to continue to position the Fund in alignment with our longer-term strategic views within the equity complex as a complement to additional strategic market exposures. We further intend to continue to monitor allocations and Underlying Manager performance as we seek to generate long-term capital growth. |
6
PORTFOLIO RESULTS
Index Definitions
The Fund’s benchmark index is the MSCI ACWI IMI (Net, USD, 50% Non-U.S. Developed Hedged to USD). This custom index comprises the MSCI ACWI IMI (which covers approximately 14,000 securities and includes large, mid, small and micro cap size segments for all developed markets countries in the index together with large, mid and small cap size segments for the emerging markets countries) and a currency hedge on 50% of the non-U.S. developed markets exposures back to U.S. dollars.
The S&P 500® Index is an American stock market index based on the market capitalizations of 500 large companies listed on the NYSE or NASDAQ.
The Russell 2000® Index is an unmanaged index of common stock prices that measures the performance of the 2000 smallest companies in the Russell 3000® Index. The Index is constructed to provide a comprehensive and unbiased small-cap barometer and is completely reconstituted annually to ensure larger stocks do not distort the performance and characteristics of the true small-cap opportunity set.
The MSCI® EAFE® Index is a stock market index that is designed to measure the equity market performance of developed markets in Europe, Australasia and the Far East, excluding the U.S. and Canada.
The MSCI Emerging Markets Index (Net, USD, Unhedged) is a free float-adjusted market capitalization index that is designed to measure equity market performance of emerging markets. As of April 30, 2016 the MSCI Emerging Markets Index (Net, USD, Unhedged) consisted of the following 21 emerging market country indices: Brazil, Chile, China, Colombia, Czech Republic, Egypt, Greece, Hungary, India, Indonesia, Korea, Malaysia, Mexico, Peru, Philippines, Poland, Russia, South Africa, Taiwan, Thailand and Turkey.
The MSCI ACWI ex-U.S. Index is a market-capitalization weighted index maintained by MSCI and designed to provide a broad measure of stock performance throughout the world, with the exception of U.S.-based companies. It includes both developed and emerging markets. It holds 23 countries classified as developed markets and 23 classified as emerging markets.
The MSCI World ex-U.S. Small Cap Index is an unmanaged index maintained by MSCI and considered representative of small-cap stocks of global developed markets, excluding those of the U.S.
7
FUND BASICS
Multi-Manager Global Equity Fund
as of October 31, 2016
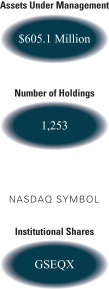
| | | | | | | | | | |
| | PERFORMANCE REVIEW | |
| | | November 1, 2015– October 31, 2016 | | Fund Total Return
(based on NAV)1 | | | MSCI ACWI IMI (Net, USD, 50% Non-U.S. Developed Hedged to USD)2 | |
| | | Institutional | | | 0.74 | % | | | 2.72 | % |
| | 1 | | The net asset value (“NAV”) represents the net assets of the class of the Fund (ex-dividend) divided by the total number of shares of the class outstanding. The Fund’s performance reflects the reinvestment of dividends and other distributions. The Fund’s performance does not reflect the deduction of any applicable sales charges. |
| | 2 | | The MSCI ACWI IMI (Net, USD, 50% Non-U.S. Developed Hedged to USD) captures large, mid and small cap representation across 23 developed markets and 23 emerging markets. With 8,575 constituents, the MSCI ACWI IMI is comprehensive, covering approximately 99% of the global equity investment opportunity set. As of April 30, 2016, the 23 developed markets in the MSCI ACWI IMI include Australia, Austria, Belgium, Canada, Denmark, Finland, France, Germany, Hong Kong, Ireland, Israel, Italy, Japan, Netherlands, New Zealand, Norway, Portugal, Singapore, Spain, Sweden, Switzerland, the U.K. and the U.S. The 23 emerging markets include Brazil, Chile, China, Colombia, Czech Republic, Egypt, Greece, Hungary, India, Indonesia, South Korea, Malaysia, Mexico, Peru, Philippines, Poland, Russia, Qatar, South Africa, Taiwan, Thailand, Turkey and United Arab Emirates. The Index figures do not reflect any deductions for fees, expenses or taxes. It is not possible to invest directly in an index. |
| | | | | | | | | | | | |
| | STANDARDIZED TOTAL RETURNS3 |
| | | For the period ended 9/30/16 | | One Year | | | Since Inception | | | Inception Date |
| | | Institutional | | | 9.31 | % | | | -2.69 | % | | 6/24/2015 |
| | 3 | | The Standardized Total Returns are average annual total returns as of the most recent calendar quarter-end. They assume reinvestment of all distributions at NAV. Because Institutional Shares do not involve a sales charge, such a charge is not applied to their Standardized Total Returns. |
The returns set forth in the tables above represent past performance. Past performance does not guarantee future results. The Fund’s investment return and principal value will fluctuate so that an investor’s shares, when redeemed, may be worth more or less than their original cost. Current performance may be lower or higher than the performance quoted above. Please visit our web site at www.GSAMFUNDS.com to obtain the most recent month-end returns. Performance reflects applicable fee waivers and/or expense limitations in effect during the periods shown. In their absence, performance would be reduced. Returns do not reflect the deduction of taxes that a shareholder would pay on Fund distributions or the redemption of Fund shares.
| | | | | | | | | | |
| | EXPENSE RATIOS4 | |
| | | | | Net Expense Ratio (Current) | | | Gross Expense Ratio (Before Waivers) | |
| | | Institutional | | | 0.88 | % | | | 1.38 | % |
| | 4 | | The expense ratios of the Fund, both current (net of applicable fee waivers and/or expense limitations) and before waivers (gross of applicable fee waivers and/or expense limitations) are as set forth above according to the most recent publicly available Prospectus for the Fund and may differ from the expense ratios disclosed in the Financial Highlights in this report. Pursuant to a contractual arrangement, the Fund’s waivers and/or expense limitations will remain in place through at least February 28, 2017, and prior to such date the investment adviser may not terminate the arrangements without the approval of the Fund’s Board of Trustees. If these arrangements are discontinued in the future, the expense ratios may change without shareholder approval. |
8
FUND BASICS
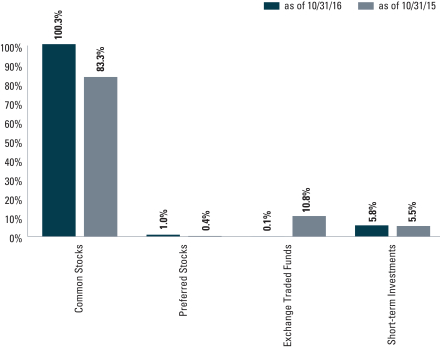
| | 5 | | The percentage shown for each investment category reflects the value of investments in that category as a percentage of net assets. Short-term investments represent repurchase agreements. Figures in the graph may not sum to 100% due to the exclusion of other assets and liabilities. The graph depicts the Fund’s investments but may not represent the Fund’s market exposure due to the exclusion of certain derivatives, if any, as listed in the Additional Investment Information section of the Schedule of Investments. |
9
GOLDMAN SACHS MULTI-MANAGER GLOBAL EQUITY FUND
Performance Summary
October 31, 2016
The following graph shows the value, as of October 31, 2016, of a $1,000,000 investment made on June 24, 2015 (commencement of operations) in Institutional Shares at NAV. For comparative purposes, the performance of the Fund’s benchmark, the MSCI All Country World Index Investable Market Index (Net, USD, 50% Non-US Developed Hedged to USD) is shown. This performance data represents past performance and should not be considered indicative of future performance, which will fluctuate with changes in market conditions. These performance fluctuations may cause an investor’s shares, when redeemed, to be worth more or less than their original cost. Performance reflects applicable fee waivers and/or expense limitations in effect during the periods shown and in their absence, performance would be reduced. Returns do not reflect the deduction of taxes that a shareholder would pay on Fund distributions or the redemption of Fund shares. In addition to the Underlying Managers’ decisions regarding issuer/industry investment selection and allocation, other factors may affect Fund performance. These factors include, but are not limited to, Fund operating fees and expenses, portfolio turnover and subscription and redemption cash flows affecting the Fund.
|
| Goldman Sachs Multi-Manager Global Equity Fund’s Lifetime Performance |
Performance of a $1,000,000 Investment, with distributions reinvested, from June 24, 2015 through October 31, 2016.
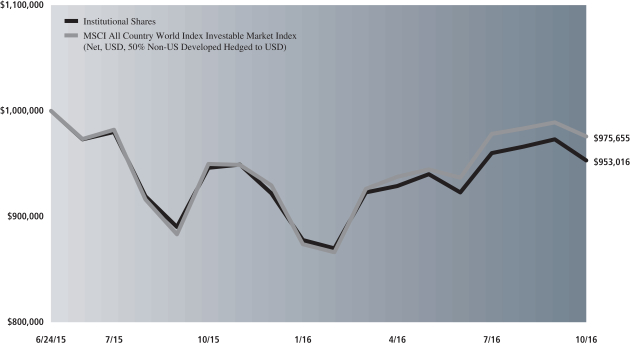
| | | | |
| Average Annual Total Return through October 31, 2016 | | One Year | | Since Inception |
| | | | |
Institutional (Commenced June 24, 2015) | | 0.74% | | -3.48% |
| | | | |
10
PORTFOLIO RESULTS
Goldman Sachs Multi-Manager Non-Core
Fixed Income Fund
Investment Objective
The Fund seeks a total return consisting of income and capital appreciation.
Portfolio Management Discussion and Analysis
Below, the Goldman Sachs Global Portfolio Solutions (“GPS”) and Alternative Investments & Manager Selection (“AIMS”) Groups discuss the Goldman Sachs Multi-Manager Non-Core Fixed Income Fund’s (the “Fund”)
performance and positioning for the 12-month period ended October 31, 2016 (the “Reporting Period”).
| Q | | How did the Fund perform during the Reporting Period? |
| A | | During the Reporting Period, the Fund’s Institutional Shares generated an average annual total return of 7.54%. This return compares to the 9.94% average annual total return of the Fund’s benchmark, the Multi-Manager Non-Core Fixed Income Composite Index (the “Index”), during the same time period. |
| | | The Index is composed 40% of the Bloomberg Barclays U.S. High-Yield 2% Issuer Capped Bond Index (Gross, USD, Unhedged); 20% of the Credit Suisse Leveraged Loan Index (Gross, USD, Unhedged); 20% of the JP Morgan Emerging Market Bond Index (EMBISM) Global Diversified Index (Gross, USD, Unhedged); and 20% of the JP Morgan Government Bond Index-Emerging Markets (GBI-EMSM) Global Diversified Index (Gross, USD, Unhedged), which returned 10.13%, 6.28%, 11.67% and 11.01%, respectively, during the Reporting Period. |
| Q | | What key factors were responsible for the Fund’s performance during the Reporting Period? |
| A | | The Fund posted positive absolute returns but underperformed the Index during the Reporting Period. The Fund’s performance during the Reporting Period can be attributed to the performance of the Fund’s Underlying Managers, who are unaffiliated investment managers that employ a non-core fixed income investment strategy. During the Reporting Period, the Fund allocated capital to four Underlying Managers — Ares Capital Management II LLC (“Ares”), BlueBay Asset Management LLP (“BlueBay”), Lazard Asset Management LLC (“Lazard”) and Symphony Asset Management LLC (“Symphony”). These four Underlying Managers represented four sectors across non-core fixed income as part of the Fund’s top-level strategy allocation — high yield (Ares), bank loans (Symphony), external emerging market debt (BlueBay and Lazard) and local emerging market debt (BlueBay and Lazard). Of the four Underlying Managers with allocated capital during the Reporting Period, all four generated positive absolute returns but all four underperformed their respective strategy benchmark on a relative basis. |
| | Similarly, of the four sectors of the non-core fixed income market to which the Fund had exposure via Underlying Manager strategies during the Reporting Period, all four generated positive absolute returns but underperformed their respective strategy benchmark on a relative basis. |
| | Performance relative to the Index was mainly driven by manager selection, which detracted during the Reporting Period. Underperformance relative to the Index primarily came from high yield Underlying Manager Ares, who underperformed the Bloomberg Barclays U.S. High-Yield 2% Issuer Capped Bond Index. Symphony, the bank loans Underlying Manager, underperformed the Credit Suisse Leveraged Loan Index during the Reporting Period. Emerging market debt Underlying Managers BlueBay and Lazard each underperformed their custom benchmark (67% JP Morgan GBI EM Diversified/33% JP Morgan EMBI Global Diversified Index (the “EM Blended Index”)). |
| | Strategic asset allocation, which reflects a longer-term perspective to diversify and invest in non-core fixed income sectors, also detracted from the Fund’s results, albeit more modestly. Strategic asset allocation detracted mainly driven by an underweight to emerging market hard currency debt relative to the Index. Such underperformance was partially offset by the overweight to emerging market local debt relative to the Index, which contributed positively. U.S. dollar-denominated debt, as measured by the JP Morgan |
11
PORTFOLIO RESULTS
| | EMBI Global Diversified Index, returned more than 11% during the Reporting Period and outperformed the other asset classes in the Fund. |
| Q | | Which non-core fixed income sectors most significantly affected Fund performance? |
| A | | Ares, the high yield Underlying Manager, underperformed the Bloomberg Barclays U.S. High-Yield 2% Issuer Capped Bond Index during the Reporting Period, with its underperformance during the strong leveraged credit rebound from March through September 2016 more than offsetting outperformance in the prior months of the Reporting Period. The strategy’s defensive positioning, specifically an underweight to CCC-rated high yield bonds and an out-of-benchmark allocation to bank loans, added value during the Reporting Period through the beginning of February 2016, but was subsequently a drag on relative performance during the second half of February 2016 through October 2016 when lower-rated credit rallied. |
| | | Symphony, the bank loans Underlying Manager, underperformed the Credit Suisse Leveraged Loan Index during the Reporting Period. Symphony’s relative underperformance was due to security selection in the media/telecom and gaming/leisure industries and due to an overweight to transportation. Defensive cash spending also hurt Symphony’s results. |
| | | BlueBay, one of the emerging market debt Underlying Managers, underperformed the EM Blended Index during the Reporting Period due to country selection, specifically an underweighted allocation to Malaysia and positioning in Turkey, which was impacted by a coup earlier in the year. |
| | | Lazard, the other emerging market debt Underlying Manager, also underperformed the EM Blended Index during the Reporting Period. Its underperformance was driven by the portfolio’s overweight to the Mexican peso, which detracted most. Partially offsetting the underperformance was the portfolio’s overweighted positioning in Argentina and Brazil, which contributed positively. The portfolio’s asset allocation between hard currency and local currency debt was roughly neutral during the Reporting Period. |
| Q | | How did the Fund use derivatives and similar instruments during the Reporting Period? |
| A | | The Fund’s Underlying Managers used currency forwards, bond futures, cross currency swaps and interest rate swaps during the Reporting Period to implement their strategies. |
| Q | | Were there any notable changes in the Fund’s allocations during the Reporting Period? |
| A | | There were no changes made in the Fund’s allocations during the Reporting Period. Throughout the Reporting Period, the Fund’s assets were allocated 25% to local emerging market debt, 14% to external emerging market debt, 21% to bank loans and 39% to high yield. |
| Q | | Were there any changes to the Fund’s management team during the Reporting Period? |
| A | | Effective August 19, 2016, Jason Gottlieb was removed as a portfolio manager to the Fund, and Kent Clark and Tom Murray were added as portfolio managers, joining Neill Nuttall, Kate El-Hillow and Betsy Gorton. |
| Q | | What is the Fund’s tactical view and strategy for the months ahead? |
| A | | Overall, we intend to continue to position the Fund in alignment with our longer-term strategic views on the non-core fixed income market as a complement to additional strategic market exposures. We further intend to continue to monitor allocations and Underlying Manager performance as we seek to generate total return consisting of income and capital appreciation. |
12
PORTFOLIO RESULTS
Index Definitions
The Bloomberg Barclays U.S. High-Yield 2% Issuer Capped Bond Index (Gross, USD, Unhedged) is an issuer-constrained version of the U.S. Corporate High-Yield Index that measures the market of USD-denominated, non-investment grade, fixed-rate, taxable corporate bonds. The index follows the same rules as the uncapped index but limits the exposure of each issuer to 2% of the total market value and redistributes any excess market value index-wide on a pro-rata basis.
The Credit Suisse Leveraged Loan Index (Gross, USD, Unhedged) is designed to mirror the investable universe of the U.S. dollar-denominated leveraged loan market.
The J.P. Morgan EMBISM Global Diversified Index (Gross, USD, Unhedged) tracks total returns for U.S. dollar-denominated debt instruments issued by emerging market sovereign and quasi-sovereign entities.
The J.P. Morgan GBI-EMSM Global Diversified Index (Gross, USD, Unhedged) is a comprehensive local emerging markets index, consisting of regularly traded, fixed-rate, local currency government bonds.
13
FUND BASICS
Non-Core Fixed Income Fund
as of October 31, 2016
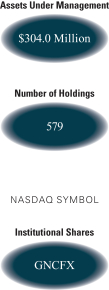
| | | | | | | | | | | | | | | | | | | | | | | | | | |
| | PERFORMANCE REVIEW | |
| | | November 1, 2015– October 31, 2016 | | Fund Total
Return
(based on
NAV)1 | | | Multi- Manager Non-Core Fixed Income Composite Index2 | | | Bloomberg Barclays U.S. High-Yield 2% Issuer Capped Bond Index (Gross, USD, Unhedged) | | | Credit Suisse Leveraged Loan Index (Gross, USD, Unhedged) | | | JP Morgan EMBISM Global Diversified Index (Gross, USD, Unhedged) | | | JP Morgan GBI-EMSM Global Diversified Index (Gross, USD, Unhedged) | |
| | | Institutional | | | 7.54 | % | | | 9.94 | % | | | 10.13 | % | | | 6.28 | % | | | 11.67 | % | | | 11.01 | % |
| | 1 | | The net asset value (“NAV”) represents the net assets of the class of the Fund (ex-dividend) divided by the total number of shares of the class outstanding. The Fund’s performance reflects the reinvestment of dividends and other distributions. The Fund’s performance does not reflect the deduction of any applicable sales charges. |
| | 2 | | The Multi Manager Non-Core Fixed Income Composite Index is comprised of the Bloomberg Barclays U.S. High-Yield 2% Issuer Capped Bond (Gross, USD, Unhedged) Index (40%), the Credit Suisse Leveraged Loan (Gross, USD, Unhedged) Index (20%), the J.P. Morgan EMBISM Global Diversified (Gross, USD, Unhedged) Index (20%), and the J.P. Morgan GBI-EMSM Global Diversified (Gross, USD, Unhedged) Index (20%). The index figures do not reflect any deductions for fees, expenses or taxes. It is not possible to invest directly in an index. |
| | | | | | | | | | | | | | |
| | STANDARDIZED TOTAL RETURNS3 | |
| | | For the period ended 9/30/16 | | One Year | | | Since Inception | | | Inception Date | |
| | | Institutional | | | 10.21 | % | | | 3.57 | % | | | 3/31/2015 | |
| | 3 | | The Standardized Total Returns are average annual total returns as of the most recent calendar quarter-end. They assume reinvestment of all distributions at NAV. Because Institutional Shares do not involve a sales charge, such a charge is not applied to their Standardized Total Returns. |
The returns set forth in the tables above represent past performance. Past performance does not guarantee future results. The Fund’s investment return and principal value will fluctuate so that an investor’s shares, when redeemed, may be worth more or less than their original cost. Current performance may be lower or higher than the performance quoted above. Please visit our web site at www.GSAMFUNDS.com to obtain the most recent month-end returns. Performance reflects applicable fee waivers and/or expense limitations in effect during the periods shown. In their absence, performance would be reduced. Returns do not reflect the deduction of taxes that a shareholder would pay on Fund distributions or the redemption of Fund shares.
| | | | | | | | | | |
| | EXPENSE RATIOS4 | |
| | | | | Net Expense Ratio (Current) | | | Gross Expense Ratio (Before Waivers) | |
| | | Institutional | | | 0.71 | % | | | 1.20 | % |
| | 4 | | The expense ratios of the Fund, both current (net of applicable fee waivers and/or expense limitations) and before waivers (gross of applicable fee waivers and/or expense limitations) are as set forth above according to the most recent publicly available Prospectus for the Fund and may differ from the expense ratios disclosed in the Financial Highlights in this report. Pursuant to a contractual arrangement, the Fund’s waivers and/or expense limitations will remain in place through at least February 28, 2017, and prior to such date the Investment Adviser may not terminate the arrangements without the approval of the Fund’s Board of Trustees. If these arrangements are discontinued in the future, the expense ratios may change without shareholder approval. |
14
FUND BASICS
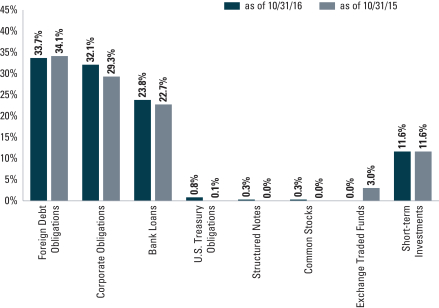
| | 5 | | The percentage shown for each investment category reflects the value of investments in that category as a percentage of net assets. Short-term investments represent repurchase agreements. Figures in the graph may not sum to 100% due to the exclusion of other assets and liabilities. The graph depicts the Fund’s investments but may not represent the Fund’s market exposure due to the exclusion of certain derivatives, if any, as listed in the Additional Investment Information section of the Schedule of Investments. |
15
GOLDMAN SACHS MULTI-MANAGER NON-CORE FIXED INCOME FUND
Performance Summary
October 31, 2016
The following graph shows the value, as of October 31, 2016, of a $1,000,000 investment made on March 31, 2015 (commencement of operations) in Institutional Shares at NAV. For comparative purposes, the performance of the Fund’s benchmark, Multi Manager Non-Core Fixed Income Composite Index, which is comprised of the Bloomberg Barclays U.S. High-Yield 2% Issuer Capped Bond (Gross, USD, Unhedged) Index (40%), the Credit Suisse Leveraged Loan (Gross, USD, Unhedged) Index (20%), the J.P. Morgan EMBISM Global Diversified (Gross, USD, Unhedged) Index (20%), and the J.P. Morgan GBI-EMSM Global Diversified (Gross, USD, Unhedged) Index (20%), is shown. This performance data represents past performance and should not be considered indicative of future performance, which will fluctuate with changes in market conditions. These performance fluctuations may cause an investor’s shares, when redeemed, to be worth more or less than their original cost. Performance reflects applicable fee waivers and/or expense limitations in effect during the periods shown and in their absence, performance would be reduced. Returns do not reflect the deduction of taxes that a shareholder would pay on Fund distributions or the redemption of Fund shares. In addition to the Underlying Managers’ decisions regarding issuer/industry investment selection and allocation, other factors may affect Fund performance. These factors include, but are not limited to, Fund operating fees and expenses, portfolio turnover and subscription and redemption cash flows affecting the Fund.
|
| Goldman Sachs Non-Core Fixed Income Fund’s Lifetime Performance |
Performance of a $1,000,000 Investment, with distributions reinvested, from March 31, 2015 through October 31, 2016.
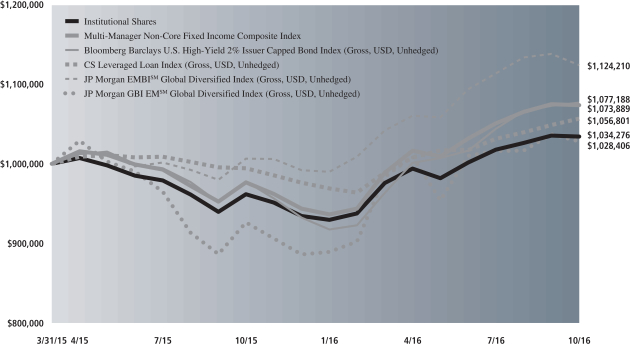
| | | | |
| Average Annual Total Return through October 31, 2016 | | One year | | Since Inception |
| | | | |
Institutional (Commenced March 31, 2015) | | 7.54% | | 2.14% |
| | | | |
16
PORTFOLIO RESULTS
Goldman Sachs Multi-Manager
Real Assets Strategy Fund
Investment Objective
The Fund seeks to provide long-term capital growth through investments related to real assets.
Portfolio Management Discussion and Analysis
Below, the Goldman Sachs Global Portfolio Solutions (“GPS”) and Alternative Investments & Manager Selection (“AIMS”) Groups discuss the Goldman Sachs Multi-Manager Real Assets Strategy Fund’s (the “Fund”) performance and positioning for the 12-month period ended October 31, 2016 (the “Reporting Period”).
| Q | | How did the Fund perform during the Reporting Period? |
| A | | During the Reporting Period, the Fund’s Institutional Shares generated an average annual total return of -2.14%. This return compares to the 1.28% average annual total return of the Fund’s benchmark, the Multi-Manager Real Assets Strategy Composite Index (the “Index”), during the same time period. |
| | | Effective December 31, 2015, commodities, as represented by the S&P GSCI (Net, USD, Unhedged), were removed from the Index. As of December 31, 2015, the Index is composed 50% of the FTSE EPRA/NAREIT Developed Index (Net, USD, Unhedged) and 50% of the Dow Jones Brookfield Global Infrastructure Index (Net, USD, Unhedged), which returned 2.64% and 4.97%, respectively, during the Reporting Period. The S&P GSCI (Net, USD, Unhedged), which until December 31, 2015, comprised 20% of the Index, returned -13.69% during the Reporting Period. |
| Q | | What key factors were responsible for the Fund’s performance during the Reporting Period? |
| A | | The Fund posted negative absolute returns that underperformed the Index on a relative basis. The Fund’s performance during the Reporting Period can be attributed to the performance of the Fund’s Underlying Managers, who are unaffiliated investment managers that employ a real assets investment strategy. Real assets are defined broadly by the Fund and include any assets that have physical properties or inflation sensitive characteristics, such as energy, real estate, infrastructure, commodities and inflation linked or floating rate fixed income securities. Inflation is a sustained increase in prices that erodes the purchasing power of money. Assets with inflation sensitive characteristics are assets that benefit from rising real cash flows in times of rising inflation. |
| | | In November and December 2015, the Fund (or its subsidiary) allocated capital to three Underlying Managers — PGIM Real Estate (formerly named Prudential Real Estate Investors), a business unit of PGIM, Inc. (“PRE”); RREEF America L.L.C. (“RREEF”) and Gresham Investment Management LLC (“Gresham”). These three Underlying Managers represented three asset classes across real assets as part of the Fund’s top-level strategy allocation — commodities (Gresham), global infrastructure (RREEF) and global real estate (PRE). We redeemed from Gresham, the commodities Underlying Manager, in January 2016, as commodities were removed from the Index on December 31, 2015. The decision to remove commodities from the Index was driven by the Fund’s long-term strategic asset allocation (“SAA”) investment process. While we have historically allocated strategically to commodities to serve as a hedge in our return-generating portfolios, high volatility and modest returns of the asset class, as well as the increased opportunity cost of holding commodities, diminished hedging properties and higher correlation to equities, drove the decision to remove the asset class. In May 2016, RARE Infrastructure was approved as an Underlying Manager by the Fund’s Board to manage an infrastructure value strategy, and in September 2016, Presima Inc. was approved as an Underlying Manager by the Fund’s Board to manage a global real estate securities concentrated strategy. However, neither of these Underlying Managers had been funded as of October 31, 2016. |
| | Thus, as of October 31, 2016, the Fund allocated capital to two Underlying Managers representing two asset classes — real estate and global infrastructure. We maintain that commodities may be utilized for cycle-aware views in the future. |
| | Of the three Underlying Managers with allocated capital during the Reporting Period overall, two generated negative absolute returns, and one posted positive absolute returns. On a relative basis, one of the Underlying Managers |
17
PORTFOLIO RESULTS
| | outperformed their respective benchmark index and two underperformed their benchmark index during the Reporting Period. |
| | | Performance relative to the Index was driven by both strategic asset allocation, which reflects a longer-term perspective to diversify and invest across real assets, and manager selection. Strategic asset allocation detracted, heavily weighed down by residual exposure to commodities through mid-January 2016, when commodities were removed from the Fund’s allocation in line with long-term strategic views. |
| | | From a manager selection perspective, Fund underperformance relative to the Index was driven by PRE, the global real estate Underlying Manager, who underperformed the FTSE EPRA/NAREIT Developed Index (Net, USD, Unhedged) during the Reporting Period, followed by RREEF, the global infrastructure Underlying Manager, who underperformed the Dow Jones Brookfield Global Infrastructure Index during the Reporting Period. |
| Q | | Which real assets asset classes most significantly affected Fund performance? |
| A | | Gresham, the commodities Underlying Manager, posted negative absolute returns but modestly outperformed the S&P GSCI (Net, USD, Unhedged) from November 1, 2015 through the time of its removal from the Fund, due to a change in the Fund’s strategic asset allocation, on January 12, 2016. Gresham’s outperformance was driven by favorable curve positioning across a number of commodities, particularly West Texas Intermediate crude oil. |
| | | RREEF, the global infrastructure Underlying Manager, posted positive absolute returns but underperformed the Dow Jones Brookfield Global Infrastructure Index (Net, USD, Unhedged) during the Reporting Period due to stock selection and positioning within the energy infrastructure (gas distribution and pipelines), stock selection in diversified infrastructure and water, and stock selection in toll roads. Its defensive cash positioning detracted as well. |
| | PRE, the global real estate Underlying Manager, posted negative absolute returns and underperformed the FTSE EPRA/NAREIT Developed Index (Net, USD, Unhedged) during the Reporting Period due to an underweight to and stock selection within Asia and due to stock selection within the U.S. Within Asia, the majority of PRE’s underperformance came from Japan, while within the U.S., stock selection within the office REIT sector was the biggest detractor. An overweight to and positive stock selection within the U.S. residential REIT sector offset some of these losses. |
| Q | | How did the Fund use derivatives and similar instruments during the Reporting Period? |
| A | | Gresham used commodity futures to implement its strategy in November and December 2015, which materially detracted from the Fund’s performance before being redeemed from the Fund in January 2016. |
| Q | | Were there any notable changes in the Fund’s allocations during the Reporting Period? |
| A | | As mentioned earlier, commodities were removed from the Index as of December 31, 2015 and Gresham was redeemed from the Fund as of January 12, 2016. |
| | | At the beginning of the Reporting Period, the Fund’s assets were allocated 23% to commodities, 30% to global real estate and 46% to global infrastructure. As of October 31, 2016, the Fund’s assets were allocated 0% to commodities, 44% to global real estate and 54% to global infrastructure with the remainder in cash and cash equivalents. |
| Q | | Were there any changes to the Fund’s management team during the Reporting Period? |
| A | | Effective August 19, 2016, Jason Gottlieb was removed as a portfolio manager to the Fund, and Kent Clark and Yvonne Woo were added as portfolio managers, joining Neill Nuttall, Kate El-Hillow and Betsy Gorton. |
| Q | | What is the Fund’s tactical view and strategy for the months ahead? |
| A | | Overall, we intend to continue to position the Fund in alignment with our longer-term strategic views on the real assets complex as a complement to additional strategic market exposures. We further intend to continue to monitor allocations and Underlying Manager performance as we seek to generate long-term capital growth through investments related to real assets. |
18
PORTFOLIO RESULTS
Index Definitions:
The S&P GSCI is a broad-based, production weighted index of global commodity market beta. The index consists of 24 commodity futures on physical commodities across five sectors: energy, agriculture, livestock, industrial metals, and precious metals. Each commodity in the index is weighted by world production, which is calculated as the average quantity produced over the last five years of available data.
The FTSE EPRA/NAREIT Developed Index is designed to track the performance of listed real estate companies and REITS worldwide. The index incorporates REITs and Real Estate Holding & Development companies.
The Dow Jones Brookfield Global Infrastructure Index intends to measure the stock performance of pure-play infrastructure companies domiciled globally. The index covers all sectors of the infrastructure market. Components are required to have more than 70% of cash flows derived from infrastructure lines of business.
19
FUND BASICS
Multi-Manager Real Assets Strategy Fund
as of October 31, 2016
| | | | | | | | | | | | | | | | | | | | | | |
| | PERFORMANCE REVIEW | |
| | | November 1, 2015– October 31, 2016 | | Fund Total Return (based on NAV)1 | | | Multi-Manager Real Assets Strategy Composite Index2 | | | FTSE EPRA/ NAREIT Developed Index
(Net, USD,
Unhedged) | | | Dow Jones Brookfield Global Infrastructure Index
(Net, USD,
Unhedged) | | | S&P GSCI®
(Net, USD,
Unhedged) | |
| | | Institutional | | | -2.14 | % | | | 1.28 | % | | | 2.64 | % | | | 4.97 | % | | | -13.69 | % |
| | 1 | | The net asset value (“NAV”) represents the net assets of the class of the Fund (ex-dividend) divided by the total number of shares of the class outstanding. The Fund’s performance reflects the reinvestment of dividends and other distributions. The Fund’s performance does not reflect the deduction of any applicable sales charges. |
| | 2 | | The Fund’s benchmark index is the Multi-Manager Real Assets Strategy Composite Index, which is composed of the FTSE EPRA/NAREIT Developed Index (50%) (Net, USD, Unhedged) and the Dow Jones Brookfield Global Infrastructure Index (50%) (Net, USD, Unhedged). Until December 31, 2015, the S&P GSCI® (Net, USD, Unhedged) comprised 20% of the Index (with each other index comprising 40% of the Index.). The index figures do not reflect any deductions for fees, expenses or taxes. It is not possible to invest directly in an index. |
| | | | | | | | | | | | | | |
| | STANDARDIZED TOTAL RETURNS3 | |
| | | For the period ended 9/30/16 | | One Year | | | Since Inception | | | Inception Date | |
| | | Institutional | | | 5.97 | % | | | -2.06 | % | | | 6/30/2015 | |
| | 3 | | The Standardized Total Returns are average annual total returns as of the most recent calendar quarter-end. They assume reinvestment of all distributions at NAV. Because Institutional Shares do not involve a sales charge, such a charge is not applied to their Standardized Total Returns. |
The returns set forth in the tables above represent past performance. Past performance does not guarantee future results. The Fund’s investment return and principal value will fluctuate so that an investor’s shares, when redeemed, may be worth more or less than their original cost. Current performance may be lower or higher than the performance quoted above. Please visit our web site at www.GSAMFUNDS.com to obtain the most recent month-end returns. Performance reflects applicable fee waivers and/or expense limitations in effect during the periods shown. In their absence, performance would be reduced. Returns do not reflect the deduction of taxes that a shareholder would pay on Fund distributions or the redemption of Fund shares.
20
FUND BASICS
| | | | | | | | | | |
| | EXPENSE RATIOS4 | |
| | | | | Net Expense Ratio (Current) | | | Gross Expense Ratio (Before Waivers) | |
| | | Institutional | | | 0.90 | % | | | 1.27 | % |
| | 4 | | The expense ratios of the Fund, both current (net of applicable fee waivers and/or expense limitations) and before waivers (gross of applicable fee waivers and/or expense limitations) are as set forth above according to the most recent publicly available Prospectus for the Fund and may differ from the expense ratios disclosed in the Financial Highlights in this report. Pursuant to a contractual arrangement, the Fund’s waivers and/or expense limitations will remain in place through at least February 28, 2017, and prior to such date the investment adviser may not terminate the arrangements without the approval of the Fund’s Board of Trustees. If these arrangements are discontinued in the future, the expense ratios may change without shareholder approval. |
| | | | | | | | |
| | TOP TEN EQUITY HOLDINGS AS OF 10/31/165 |
| | | Holding | | % of Net Assets | | | Line of Business |
| | National Grid PLC | | | 3.8 | % | | Multi-Utilities |
| | American Tower Corp. | | | 2.8 | | | Equity Real Estate Investment Trusts
(REITs) |
| | Crown Castle International Corp. | | | 2.7 | | | Equity Real Estate Investment Trusts
(REITs) |
| | Eversource Energy | | | 2.3 | | | Electric Utilities |
| | Sempra Energy | | | 2.2 | | | Multi-Utilities |
| | PG&E Corp. | | | 2.1 | | | Electric Utilities |
| | Kinder Morgan, Inc. | | | 2.1 | | | Oil, Gas & Consumable Fuels |
| | TransCanada Corp. | | | 1.9 | | | Oil, Gas & Consumable Fuels |
| | Transurban Group | | | 1.8 | | | Transportation Infrastructure |
| | | Pembina Pipeline Corp. | | | 1.7 | | | Oil, Gas & Consumable Fuels |
| | 5 | | The top 10 holdings may not be representative of the Fund’s future investments. |
21
FUND BASICS
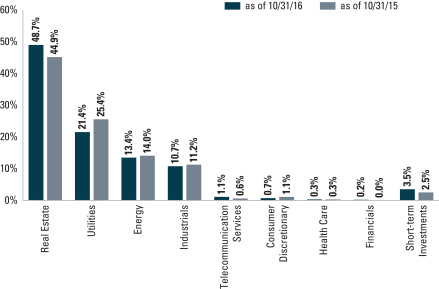
| | 6 | | The Fund is actively managed and, as such, its composition may differ over time. Consequently, the Fund’s overall sector allocations may differ from the percentages contained in the graph above. The graph categorizes investments using the Global Industry Classification Standard (“GICS”), however, the sector classifications used by the portfolio management team may differ from GICS. The percentage shown for each investment category reflects the value of investments in that category as a percentage of market value. Short-term investments represent repurchase agreements. The graph depicts the Fund’s investments but may not represent the Fund’s market exposure due to the exclusion of certain derivatives, if any, as listed in the Additional Investment Information section of the Schedule of Investments. |
22
GOLDMAN SACHS MULTI-MANAGER REAL ASSETS STRATEGY FUND
Performance Summary
October 31, 2016
The following graph shows the value, as of October 31, 2016, of a $1,000,000 investment made on June 30, 2015 (commencement of operations) in Institutional Shares at NAV. For comparative purposes, the performance of the Fund’s benchmark, the Multi-Manager Real Assets Strategy Composite Index, which is comprised of the FTSE EPRA/NAREIT Developed Index (50%) (Net, USD, Unhedged) and the Dow Jones Brookfield Global Infrastructure Index (50%) (Net, USD, Unhedged), is shown. Until December 31, 2015, the S&P GSCI® Commodity Index (Net, USD, Unhedged) comprised 20% of the Index (with each other index comprising 40% of the Index.). This performance data represents past performance and should not be considered indicative of future performance, which will fluctuate with changes in market conditions. These performance fluctuations may cause an investor’s shares, when redeemed, to be worth more or less than their original cost. Performance reflects applicable fee waivers and/or expense limitations in effect during the periods shown and in their absence, performance would be reduced. Returns do not reflect the deduction of taxes that a shareholder would pay on Fund distributions or the redemption of Fund shares. In addition to the Underlying Managers’ decisions regarding issuer/industry investment selection and allocation, other factors may affect Fund performance. These factors include, but are not limited to, Fund operating fees and expenses, portfolio turnover and subscription and redemption cash flows affecting the Fund.
|
| Goldman Sachs Multi-Manager Real Asset Strategy Fund’s Lifetime Performance |
Performance of a $1,000,000 Investment, with distributions reinvested, from June 30, 2015 through October 31, 2016.
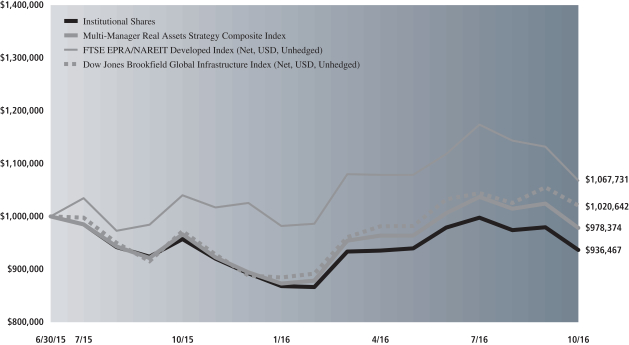
| | | | |
| Average Annual Total Return through October 31, 2016 | | One Year | | Since Inception |
| | | | |
Institutional (Commenced June 30, 2015) | | -2.14% | | -4.77% |
| | | | |
23
GOLDMAN SACHS MULTI-MANAGER GLOBAL EQUITY FUND
Schedule of Investments
October 31, 2016
| | | | | | | | |
Shares | | | Description | | Value | |
| | | | | | | | |
| | Common Stocks – 100.3% | |
| | Australia – 1.6% | |
| | 35,600 | | | Aristocrat Leisure Ltd. (Hotels, Restaurants & Leisure) | | $ | 414,485 | |
| | 178,500 | | | Asaleo Care Ltd. (Personal Products) | | | 197,774 | |
| | 58,037 | | | BlueScope Steel Ltd. (Metals & Mining) | | | 344,312 | |
| | 79,015 | | | Challenger Ltd. (Diversified Financial Services) | | | 645,040 | |
| | 48,615 | | | CSL Ltd. (Biotechnology) | | | 3,709,595 | |
| | 94,376 | | | Downer EDI Ltd. (Commercial Services & Supplies) | | | 417,132 | |
| | 73,773 | | | Independence Group NL (Metals & Mining) | | | 240,220 | |
| | 139,764 | | | Investa Office Fund (Equity Real Estate Investment Trusts (REITs)) | | | 450,167 | |
| | 209,193 | | | Nine Entertainment Co. Holdings Ltd. (Media) | | | 136,461 | |
| | 62,926 | | | Northern Star Resources Ltd. (Metals & Mining) | | | 203,530 | |
| | 192,800 | | | Orora Ltd. (Containers & Packaging) | | | 424,850 | |
| | 38,000 | | | Pact Group Holdings Ltd. (Containers & Packaging) | | | 189,428 | |
| | 195,100 | | | Spotless Group Holdings Ltd. (Commercial Services & Supplies) | | | 148,002 | |
| | 110,440 | | | St. Barbara Ltd.* (Metals & Mining) | | | 225,410 | |
| | 146,214 | | | The Star Entertainment Grp Ltd. (Hotels, Restaurants & Leisure) | | | 553,265 | |
| | 55,861 | | | Treasury Wine Estates Ltd. (Beverages) | | | 455,399 | |
| | 159,650 | | | Westfield Corp. (Equity Real Estate Investment Trusts (REITs)) | | | 1,078,894 | |
| | | | | | | | |
| | | | | | | 9,833,964 | |
| | |
| | Austria – 0.2% | |
| | 20,198 | | | BUWOG AG* (Real Estate Management & Development) | | | 488,182 | |
| | 3,274 | | | Lenzing AG (Chemicals) | | | 426,432 | |
| | | | | | | | |
| | | | | | | 914,614 | |
| | |
| | Belgium – 0.1% | |
| | 15,617 | | | Nyrstar NV* (Metals & Mining) | | | 80,232 | |
| | 6,500 | | | Ontex Group NV (Personal Products) | | | 196,613 | |
| | | | | | | | |
| | | | | | | 276,845 | |
| | |
| | Brazil – 0.8% | |
| | 413,810 | | | Ambev SA ADR (Beverages) | | | 2,441,479 | |
| | 5,990 | | | Banco Bradesco SA ADR (Banks) | | | 62,356 | |
| | 3,200 | | | Banco do Brasil SA (Banks) | | | 29,363 | |
| | 4,100 | | | BM&FBovespa SA – Bolsa de Valores Mercadorias e Futuros (Capital Markets) | | | 24,148 | |
| | 2,400 | | | BRF SA (Food Products) | | | 40,128 | |
| | 12,000 | | | CCR SA (Transportation Infrastructure) | | | 65,226 | |
| | 3,300 | | | Cia de Saneamento Basico do Estado de Sao Paulo ADR (Water Utilities) | | | 34,716 | |
| | 3,200 | | | Cia Hering (Specialty Retail) | | | 19,408 | |
| | 71,460 | | | Cielo SA (IT Services) | | | 725,346 | |
| | 5,227 | | | CPFL Energia SA (Electric Utilities) | | | 39,661 | |
| | 8,300 | | | Cyrela Brazil Realty SA Empreendimentos e Participacoes (Household Durables) | | | 27,953 | |
| | |
| | | | | | | | |
| | Common Stocks – (continued) | |
| | Brazil – (continued) | |
| | 3,700 | | | EDP – Energias do Brasil SA (Electric Utilities) | | $ | 17,793 | |
| | 2,300 | | | Embraer SA ADR (Aerospace & Defense) | | | 49,197 | |
| | 2,000 | | | Engie Brasil Energia SA (Independent Power and Renewable Electricity Producers) | | | 25,407 | |
| | 1,900 | | | Equatorial Energia SA (Electric Utilities) | | | 33,893 | |
| | 2,000 | | | Fibria Celulose SA ADR (Paper & Forest Products) | | | 15,960 | |
| | 3,100 | | | Hypermarcas SA (Personal Products) | | | 25,989 | |
| | 4,600 | | | JBS SA (Food Products) | | | 13,993 | |
| | 55,600 | | | JSL SA (Road & Rail) | | | 203,797 | |
| | 6,000 | | | Klabin SA (Containers & Packaging) | | | 30,921 | |
| | 12,100 | | | Kroton Educacional SA (Diversified Consumer Services) | | | 60,273 | |
| | 2,600 | | | Localiza Rent a Car SA (Road & Rail) | | | 32,280 | |
| | 4,300 | | | Lojas Renner SA (Multiline Retail) | | | 36,372 | |
| | 4,100 | | | MRV Engenharia e Participacoes SA (Household Durables) | | | 15,876 | |
| | 7,600 | | | Odontoprev SA (Health Care Providers & Services) | | | 28,571 | |
| | 19,789 | | | Petroleo Brasileiro SA ADR* (Oil, Gas & Consumable Fuels) | | | 230,938 | |
| | 6,400 | | | Qualicorp SA (Health Care Providers & Services) | | | 41,183 | |
| | 1,400 | | | Raia Drogasil SA (Food & Staples Retailing) | | | 31,079 | |
| | 9,800 | | | Telefonica Brasil SA ADR (Diversified Telecommunication Services) | | | 141,120 | |
| | 4,000 | | | Tim Participacoes SA ADR (Wireless Telecommunication Services) | | | 55,400 | |
| | 3,400 | | | TOTVS SA (Software) | | | 30,847 | |
| | 15,600 | | | Ultrapar Participacoes SA (Oil, Gas & Consumable Fuels) | | | 353,492 | |
| | 2,400 | | | Valid Solucoes e Servicos de Seguranca em Meios de Pagamento e Identificacao SA (Commercial Services & Supplies) | | | 22,489 | |
| | 9,700 | | | WEG SA (Machinery) | | | 53,484 | |
| | | | | | | | |
| | | | | | | 5,060,138 | |
| | |
| | British Virgin Islands* – 0.0% | |
| | 4,600 | | | Lenta Ltd. (Food & Staples Retailing) | | | 33,320 | |
| | 300 | | | Luxoft Holding, Inc. (IT Services) | | | 15,900 | |
| | 2,550 | | | Mail.Ru Group Ltd. GDR (Internet Software & Services) | | | 41,743 | |
| | | | | | | | |
| | | | | | | 90,963 | |
| | |
| | Cambodia – 0.0% | |
| | 444,000 | | | NagaCorp Ltd. (Hotels, Restaurants & Leisure) | | | 273,911 | |
| | |
| | Canada – 3.3% | |
| | 20,500 | | | Aecon Group, Inc. (Construction & Engineering) | | | 265,019 | |
| | |
| | |
| 24 | | The accompanying notes are an integral part of these financial statements. |
GOLDMAN SACHS MULTI-MANAGER GLOBAL EQUITY FUND
| | | | | | | | |
Shares | | | Description | | Value | |
| | | | | | | | |
| | Common Stocks – (continued) | |
| | Canada – (continued) | |
| | 35,300 | | | Algonquin Power & Utilities Corp. (Independent Power and Renewable Electricity Producers) | | $ | 311,865 | |
| | 10,100 | | | Allied Properties Real Estate Investment Trust (Equity Real Estate Investment Trusts (REITs)) | | | 271,532 | |
| | 36,692 | | | Birchcliff Energy Ltd.* (Oil, Gas & Consumable Fuels) | | | 233,616 | |
| | 41,270 | | | Canadian Pacific Railway Ltd. (Road & Rail) | | | 5,899,959 | |
| | 62,635 | | | Cardinal Energy Ltd. (Oil, Gas & Consumable Fuels) | | | 426,813 | |
| | 1,275 | | | CCL Industries, Inc. Class B (Containers & Packaging) | | | 226,749 | |
| | 2,352 | | | Colliers International Group, Inc. (Real Estate Management & Development) | | | 81,890 | |
| | 22,729 | | | Computer Modelling Group Ltd. (Software) | | | 168,099 | |
| | 5,600 | | | Constellation Software, Inc. (Software) | | | 2,623,395 | |
| | 46,000 | | | Corus Entertainment, Inc. Class B (Media) | | | 379,647 | |
| | 37,100 | | | Crew Energy, Inc.* (Oil, Gas & Consumable Fuels) | | | 182,278 | |
| | 19,800 | | | Detour Gold Corp.* (Metals & Mining) | | | 377,459 | |
| | 4,600 | | | Dollarama, Inc. (Multiline Retail) | | | 343,740 | |
| | 17,035 | | | Element Fleet Management Corp. (Diversified Financial Services) | | | 165,994 | |
| | 92,600 | | | Encana Corp. (Oil, Gas & Consumable Fuels) | | | 882,990 | |
| | 45,563 | | | HudBay Minerals, Inc. (Metals & Mining) | | | 191,927 | |
| | 9,700 | | | Kinaxis, Inc.* (Software) | | | 473,972 | |
| | 30,200 | | | Kirkland Lake Gold, Inc.* (Metals & Mining) | | | 209,394 | |
| | 228,308 | | | Lundin Mining Corp.* (Metals & Mining) | | | 893,623 | |
| | 21,400 | | | Manulife Financial Corp. (Insurance) | | | 309,999 | |
| | 18,300 | | | Milestone Apartments Real Estate Investment Trust (Equity Real Estate Investment Trusts (REITs)) | | | 246,128 | |
| | 14,117 | | | Mullen Group Ltd. (Energy Equipment & Services) | | | 195,657 | |
| | 18,900 | | | New Flyer Industries, Inc. (Machinery) | | | 528,405 | |
| | 89,500 | | | OceanaGold Corp. (Metals & Mining) | | | 273,578 | |
| | 6,000 | | | Open Text Corp. (Software) | | | 372,534 | |
| | 42,179 | | | Parex Resources, Inc.* (Oil, Gas & Consumable Fuels) | | | 485,217 | |
| | 7,209 | | | Pason Systems, Inc. (Energy Equipment & Services) | | | 81,963 | |
| | 48,300 | | | Pure Industrial Real Estate Trust (Equity Real Estate Investment Trusts (REITs)) | | | 193,733 | |
| | 48,400 | | | Raging River Exploration, Inc.* (Oil, Gas & Consumable Fuels) | | | 387,907 | |
| | 19,060 | | | Ritchie Bros. Auctioneers, Inc. (Commercial Services & Supplies) | | | 659,285 | |
| | |
| | | | | | | | |
| | Common Stocks – (continued) | |
| | Canada – (continued) | |
| | 16,400 | | | Seven Generations Energy Ltd. Class A* (Oil, Gas & Consumable Fuels) | | | 349,691 | |
| | 65,401 | | | Spartan Energy Corp.* (Oil, Gas & Consumable Fuels) | | | 152,129 | |
| | 158,800 | | | Surge Energy, Inc. (Oil, Gas & Consumable Fuels) | | | 324,396 | |
| | 53,087 | | | TORC Oil & Gas Ltd. (Oil, Gas & Consumable Fuels) | | | 300,403 | |
| | 90,854 | | | Whitecap Resources, Inc. (Oil, Gas & Consumable Fuels) | | | 726,128 | |
| | | | | | | | |
| | | | | | | 20,197,114 | |
| | |
| | Chile – 0.2% | |
| | 3,500 | | | AntarChile SA (Industrial Conglomerates) | | | 37,484 | |
| | 421,710 | | | Banco de Chile (Banks) | | | 50,194 | |
| | 529 | | | Banco de Credito e Inversiones (Banks) | | | 27,189 | |
| | 650,000 | | | Banco Santander Chile (Banks) | | | 36,376 | |
| | 25,900 | | | Banmedica SA (Health Care Providers & Services) | | | 54,316 | |
| | 13,982 | | | Cencosud SA (Food & Staples Retailing) | | | 45,581 | |
| | 2,500 | | | Cia Cervecerias Unidas SA (Beverages) | | | 26,852 | |
| | 83,230 | | | Colbun SA (Independent Power and Renewable Electricity Producers) | | | 18,160 | |
| | 27,172 | | | Empresa Nacional de Electricidad SA (Independent Power and Renewable Electricity Producers) | | | 18,744 | |
| | 7,000 | | | Empresa Nacional de Telecomunicaciones SA* (Wireless Telecommunication Services) | | | 75,067 | |
| | 24,443 | | | Empresas CMPC SA (Paper & Forest Products) | | | 52,948 | |
| | 12,577 | | | Empresas COPEC SA (Oil, Gas & Consumable Fuels) | | | 126,379 | |
| | 27,172 | | | Endesa Americas SA (Independent Power and Renewable Electricity Producers) | | | 12,644 | |
| | 3,200 | | | Enersis Americas SA ADR (Electric Utilities) | | | 27,744 | |
| | 3,200 | | | Enersis Chile SA ADR (Electric Utilities) | | | 15,904 | |
| | 2,470,000 | | | Itau CorpBanca (Banks) | | | 22,453 | |
| | 6,204 | | | Latam Airlines Group SA* (Airlines) | | | 59,546 | |
| | 12,000 | | | Quinenco SA (Industrial Conglomerates) | | | 29,393 | |
| | 17,220 | | | SACI Falabella (Multiline Retail) | | | 135,215 | |
| | 2,320 | | | Sociedad Quimica y Minera de Chile SA ADR (Chemicals) | | | 67,883 | |
| | 31,800 | | | SONDA SA (IT Services) | | | 65,721 | |
| | 13,500 | | | Vina Concha y Toro SA (Beverages) | | | 23,560 | |
| | | | | | | | |
| | | | | | | 1,029,353 | |
| | |
| | |
| The accompanying notes are an integral part of these financial statements. | | 25 |
GOLDMAN SACHS MULTI-MANAGER GLOBAL EQUITY FUND
Schedule of Investments (continued)
October 31, 2016
| | | | | | | | |
Shares | | | Description | | Value | |
| | | | | | | | |
| | Common Stocks – (continued) | |
| | China – 4.5% | |
| | 19,000 | | | 3SBio, Inc.*(a) (Biotechnology) | | $ | 18,961 | |
| | 6,122 | | | Alibaba Group Holding Ltd. ADR* (Internet Software & Services) | | | 622,546 | |
| | 92,000 | | | Aluminum Corp. of China Ltd. Class H* (Metals & Mining) | | | 34,171 | |
| | 11,000 | | | Anhui Conch Cement Co. Ltd. Class H (Construction Materials) | | | 30,403 | |
| | 14,496 | | | Baidu, Inc. ADR* (Internet Software & Services) | | | 2,563,763 | |
| | 71,000 | | | Bank of China Ltd. Class H (Banks) | | | 31,816 | |
| | 37,000 | | | Bank of Communications Co. Ltd. Class H (Banks) | | | 28,123 | |
| | 79,000 | | | BBMG Corp. Class H (Construction Materials) | | | 28,834 | |
| | 4,500 | | | Beijing Enterprises Holdings Ltd. (Industrial Conglomerates) | | | 22,490 | |
| | 40,000 | | | Beijing Enterprises Water Group Ltd.* (Water Utilities) | | | 28,934 | |
| | 37,000 | | | Belle International Holdings Ltd. (Textiles, Apparel & Luxury Goods) | | | 22,344 | |
| | 336,000 | | | Brilliance China Automotive Holdings Ltd. (Automobiles) | | | 399,674 | |
| | 5,000 | | | Byd Co. Ltd. Class H* (Automobiles) | | | 32,917 | |
| | 85,000 | | | CGN Power Co. Ltd. Class H(a) (Independent Power and Renewable Electricity Producers) | | | 24,816 | |
| | 200 | | | China Biologic Products, Inc.* (Biotechnology) | | | 23,622 | |
| | 26,000 | | | China Communications Construction Co. Ltd. Class H (Construction & Engineering) | | | 28,549 | |
| | 12,000 | | | China Conch Venture Holdings Ltd. (Machinery) | | | 22,402 | |
| | 456,000 | | | China Construction Bank Corp. Class H (Banks) | | | 332,993 | |
| | 18,000 | | | China Everbright International Ltd. (Commercial Services & Supplies) | | | 21,518 | |
| | 21,000 | | | China Hongqiao Group Ltd. (Metals & Mining) | | | 18,765 | |
| | 67,000 | | | China Huishan Dairy Holdings Co. Ltd. (Food Products) | | | 24,869 | |
| | 8,000 | | | China Life Insurance Co. Ltd. Class H (Insurance) | | | 19,806 | |
| | 34,000 | | | China Longyuan Power Group Corp. Ltd. Class H (Independent Power and Renewable Electricity Producers) | | | 25,923 | |
| | 19,000 | | | China Medical System Holdings Ltd. (Pharmaceuticals) | | | 29,670 | |
| | 20,000 | | | China Mengniu Dairy Co. Ltd. (Food Products) | | | 37,780 | |
| | 11,000 | | | China Merchants Bank Co. Ltd. Class H (Banks) | | | 26,749 | |
| | 319,264 | | | China Merchants Holdings International Co. Ltd. (Transportation Infrastructure) | | | 825,433 | |
| | 344,000 | | | China Mobile Ltd. (Wireless Telecommunication Services) | | | 3,940,999 | |
| | |
| | | | | | | | |
| | Common Stocks – (continued) | |
| | China – (continued) | |
| | 38,709 | | | China Mobile Ltd. ADR (Wireless Telecommunication Services) | | | 2,223,058 | |
| | 54,000 | | | China National Building Material Co. Ltd. Class H (Construction Materials) | | | 24,642 | |
| | 8,000 | | | China Overseas Land & Investment Ltd. (Real Estate Management & Development) | | | 24,559 | |
| | 103,600 | | | China Pacific Insurance Group Co. Ltd. Class H (Insurance) | | | 373,518 | |
| | 104,000 | | | China Petroleum & Chemical Corp. Class H (Oil, Gas & Consumable Fuels) | | | 75,213 | |
| | 48,000 | | | China Power International Development Ltd. (Independent Power and Renewable Electricity Producers) | | | 17,455 | |
| | 18,000 | | | China Railway Construction Corp. Ltd. Class H (Construction & Engineering) | | | 22,500 | |
| | 34,000 | | | China Railway Group Ltd. Class H (Construction & Engineering) | | | 26,209 | |
| | 14,000 | | | China Resources Beer Holdings Co. Ltd.* (Beverages) | | | 29,751 | |
| | 10,000 | | | China Resources Gas Group Ltd. (Gas Utilities) | | | 31,356 | |
| | 16,000 | | | China Resources Power Holdings Co. Ltd. (Independent Power and Renewable Electricity Producers) | | | 27,110 | |
| | 20,000 | | | China Shenhua Energy Co. Ltd. Class H (Oil, Gas & Consumable Fuels) | | | 41,464 | |
| | 14,000 | | | China State Construction International Holdings Ltd. (Construction & Engineering) | | | 20,424 | |
| | 56,000 | | | China Telecom Corp. Ltd. Class H (Diversified Telecommunication Services) | | | 28,872 | |
| | 22,000 | | | China Unicom Hong Kong Ltd. (Diversified Telecommunication Services) | | | 25,828 | |
| | 25,000 | | | CITIC Ltd. (Industrial Conglomerates) | | | 35,874 | |
| | 229,500 | | | CITIC Securities Co. Ltd. Class H (Capital Markets) | | | 507,555 | |
| | 1,926,000 | | | CNOOC Ltd. (Oil, Gas & Consumable Fuels) | | | 2,423,436 | |
| | 23,000 | | | CRRC Corp. Ltd. Class H (Machinery) | | | 20,825 | |
| | 24,000 | | | CSPC Pharmaceutical Group Ltd. (Pharmaceuticals) | | | 24,850 | |
| | 81,854 | | | Ctrip.com International Ltd. ADR* (Internet & Direct Marketing Retail) | | | 3,613,854 | |
| | 18,000 | | | Dongfeng Motor Group Co. Ltd. Class H (Automobiles) | | | 18,761 | |
| | 21,000 | | | Great Wall Motor Co. Ltd. Class H (Automobiles) | | | 20,495 | |
| | 24,000 | | | Guangdong Investment Ltd. (Water Utilities) | | | 36,186 | |
| | |
| | |
| 26 | | The accompanying notes are an integral part of these financial statements. |
GOLDMAN SACHS MULTI-MANAGER GLOBAL EQUITY FUND
| | | | | | | | |
Shares | | | Description | | Value | |
| | | | | | | | |
| | Common Stocks – (continued) | |
| | China – (continued) | |
| | 36,500 | | | Hengan International Group Co. Ltd. (Personal Products) | | $ | 289,982 | |
| | 34,000 | | | Huaneng Power International Inc. Class H (Independent Power and Renewable Electricity Producers) | | | 20,899 | |
| | 90,000 | | | Huaneng Renewables Corp. Ltd. Class H (Independent Power and Renewable Electricity Producers) | | | 30,157 | |
| | 503,000 | | | Industrial and Commercial Bank of China Ltd. Class H (Banks) | | | 301,920 | |
| | 25,254 | | | JD.com, Inc. ADR* (Internet & Direct Marketing Retail) | | | 655,341 | |
| | 23,000 | | | Jiangxi Copper Co. Ltd. Class H (Metals & Mining) | | | 27,151 | |
| | 30,000 | | | Kunlun Energy Co. Ltd. (Oil, Gas & Consumable Fuels) | | | 22,604 | |
| | 502,000 | | | Lenovo Group Ltd. (Technology Hardware, Storage & Peripherals) | | | 321,573 | |
| | 26,000 | | | Luye Pharma Group Ltd. (Pharmaceuticals) | | | 17,476 | |
| | 70 | | | NetEase, Inc. ADR (Internet Software & Services) | | | 17,989 | |
| | 800 | | | New Oriental Education & Technology Group, Inc. ADR* (Diversified Consumer Services) | | | 40,104 | |
| | 106,000 | | | PetroChina Co. Ltd. Class H (Oil, Gas & Consumable Fuels) | | | 72,529 | |
| | 140,500 | | | Ping An Insurance Group Co. of China Ltd. Class H (Insurance) | | | 739,524 | |
| | 6,200 | | | Qinqin Foodstuffs Group Cayman Co. Ltd.* (Food Products) | | | 2,138 | |
| | 300,000 | | | Shandong Weigao Group Medical Polymer Co. Ltd. Class H (Health Care Equipment & Supplies) | | | 195,314 | |
| | 9,000 | | | Shanghai Fosun Pharmaceutical Group Co. Ltd. Class H (Pharmaceuticals) | | | 27,637 | |
| | 462,000 | | | Shanghai Jin Jiang International Hotels Group Co. Ltd. Class H (Hotels, Restaurants & Leisure) | | | 134,967 | |
| | 7,300 | | | Shanghai Pharmaceuticals Holding Co. Ltd. Class H (Health Care Providers & Services) | | | 18,785 | |
| | 5,000 | | | Shenzhou International Group Holdings Ltd. (Textiles, Apparel & Luxury Goods) | | | 33,118 | |
| | 72,000 | | | Sinopec Shanghai Petrochemical Co. Ltd. Class H (Chemicals) | | | 36,702 | |
| | 11,200 | | | Sinopharm Group Co. Ltd. Class H (Health Care Providers & Services) | | | 54,387 | |
| | 186,275 | | | Tencent Holdings Ltd. (Internet Software & Services) | | | 4,936,720 | |
| | 18,000 | | | Tingyi Cayman Islands Holding Corp. (Food Products) | | | 19,404 | |
| | 6,000 | | | Tsingtao Brewery Co. Ltd. Class H (Beverages) | | | 23,936 | |
| | |
| | | | | | | | |
| | Common Stocks – (continued) | |
| | China – (continued) | |
| | 1,500 | | | Vipshop Holdings Ltd. ADR* (Internet & Direct Marketing Retail) | | | 20,505 | |
| | 52,000 | | | Want Want China Holdings Ltd. (Food Products) | | | 31,656 | |
| | 4,000 | | | Zhuzhou CRRC Times Electric Co. Ltd. (Electrical Equipment) | | | 19,341 | |
| | 102,000 | | | Zijin Mining Group Co. Ltd. Class H (Metals & Mining) | | | 32,417 | |
| | | | | | | | |
| | | | | | | 27,106,941 | |
| | |
| | Colombia – 0.1% | |
| | 6,452 | | | Almacenes Exito SA (Food & Staples Retailing) | | | 32,187 | |
| | 3,315 | | | Bancolombia SA (Banks) | | | 29,216 | |
| | 1,300 | | | Bancolombia SA ADR (Banks) | | | 49,764 | |
| | 3,184 | | | Cementos Argos SA (Construction Materials) | | | 12,601 | |
| | 6,900 | | | Ecopetrol SA ADR* (Oil, Gas & Consumable Fuels) | | | 59,961 | |
| | 48,898 | | | Empresa de Energia de Bogota SA ESP (Gas Utilities) | | | 30,899 | |
| | 71,482 | | | Empresa de Telecomunicaciones de Bogota (Diversified Telecommunication Services) | | | 14,003 | |
| | 5,718 | | | Grupo Argos SA (Construction Materials) | | | 37,083 | |
| | 2,765 | | | Grupo de Inversiones Suramericana SA (Diversified Financial Services) | | | 35,662 | |
| | 4,049 | | | Grupo Nutresa SA (Food Products) | | | 33,908 | |
| | 11,857 | | | Interconexion Electrica SA ESP (Electric Utilities) | | | 39,395 | |
| | | | | | | | |
| | | | | | | 374,679 | |
| | |
| | Czech Republic – 0.0% | |
| | 5,267 | | | CEZ AS (Electric Utilities) | | | 99,342 | |
| | 2,305 | | | Komercni banka AS (Banks) | | | 84,340 | |
| | | | | | | | |
| | | | | | | 183,682 | |
| | |
| | Denmark – 1.7% | |
| | 1,750 | | | ALK-Abello A/S (Pharmaceuticals) | | | 236,748 | |
| | 38,161 | | | Chr Hansen Holding A/S (Chemicals) | | | 2,285,381 | |
| | 37,843 | | | Coloplast A/S Class B (Health Care Equipment & Supplies) | | | 2,636,244 | |
| | 68,050 | | | Novo Nordisk A/S ADR (Pharmaceuticals) | | | 2,418,497 | |
| | 58,595 | | | Novozymes A/S (Chemicals) | | | 2,173,687 | |
| | 10,116 | | | Royal Unibrew A/S (Beverages) | | | 473,241 | |
| | | | | | | | |
| | | | | | | 10,223,798 | |
| | |
| | Finland – 0.2% | |
| | 4,892 | | | Cargotec Oyj Class B (Machinery) | | | 200,622 | |
| | 16,800 | | | Cramo OYJ (Trading Companies & Distributors) | | | 440,307 | |
| | 18,736 | | | Sanoma Oyj (Media) | | | 175,202 | |
| | 44,605 | | | Sponda OYJ (Real Estate Management & Development) | | | 211,180 | |
| | |
| | |
| The accompanying notes are an integral part of these financial statements. | | 27 |
GOLDMAN SACHS MULTI-MANAGER GLOBAL EQUITY FUND
Schedule of Investments (continued)
October 31, 2016
| | | | | | | | |
Shares | | | Description | | Value | |
| | | | | | | | |
| | Common Stocks – (continued) | |
| | Finland – (continued) | |
| | 9,592 | | | Tieto OYJ (IT Services) | | $ | 263,132 | |
| | | | | | | | |
| | | | | | | 1,290,443 | |
| | |
| | France – 4.8% | |
| | 4,955 | | | Alten SA (IT Services) | | | 354,031 | |
| | 58,400 | | | Altran Technologies SA* (IT Services) | | | 833,278 | |
| | 29,887 | | | BNP Paribas SA (Banks) | | | 1,732,946 | |
| | 7,736 | | | Eiffage SA (Construction & Engineering) | | | 572,731 | |
| | 29,300 | | | Elior Group(a) (Hotels, Restaurants & Leisure) | | | 658,206 | |
| | 152,990 | | | Engie SA (Multi-Utilities) | | | 2,206,379 | |
| | 20,500 | | | Essilor International SA (Health Care Equipment & Supplies) | | | 2,303,655 | |
| | 2,031 | | | Eurofins Scientific SE (Life Sciences Tools & Services) | | | 922,980 | |
| | 5,081 | | | Hermes International (Textiles, Apparel & Luxury Goods) | | | 2,058,341 | |
| | 5,300 | | | IPSOS (Media) | | | 173,101 | |
| | 18,161 | | | Legrand SA (Electrical Equipment) | | | 1,026,039 | |
| | 14,026 | | | LVMH Moet Hennessy Louis Vuitton SE (Textiles, Apparel & Luxury Goods) | | | 2,553,589 | |
| | 8,089 | | | Nexans SA* (Electrical Equipment) | | | 459,797 | |
| | 12,800 | | | Nexity SA* (Real Estate Management & Development) | | | 642,669 | |
| | 5,898 | | | Orpea (Health Care Providers & Services) | | | 490,879 | |
| | 10,119 | | | Plastic Omnium SA (Auto Components) | | | 329,977 | |
| | 8,265 | | | Rubis SCA (Gas Utilities) | | | 753,695 | |
| | 25,832 | | | Sanofi (Pharmaceuticals) | | | 2,010,215 | |
| | 48,118 | | | Schneider Electric SE (Electrical Equipment) | | | 3,235,939 | |
| | 12,555 | | | SCOR SE (Insurance) | | | 406,576 | |
| | 5,100 | | | Sopra Steria Group (IT Services) | | | 518,841 | |
| | 5,885 | | | Technip SA (Energy Equipment & Services) | | | 390,587 | |
| | 7,276 | | | Teleperformance (Professional Services) | | | 768,765 | |
| | 70,891 | | | TOTAL SA (Oil, Gas & Consumable Fuels) | | | 3,396,026 | |
| | | | | | | | |
| | | | | | | 28,799,242 | |
| | |
| | Germany – 2.6% | |
| | 15,398 | | | Aareal Bank AG (Thrifts & Mortgage Finance) | | | 556,948 | |
| | 12,371 | | | adidas AG (Textiles, Apparel & Luxury Goods) | | | 2,032,481 | |
| | 3,374 | | | ADVA Optical Networking SE* (Communications Equipment) | | | 26,887 | |
| | 6,058 | | | AURELIUS Equity Opportunities SE & Co. KGaA (Capital Markets) | | | 361,707 | |
| | 20,318 | | | BASF SE (Chemicals) | | | 1,793,632 | |
| | 2,148 | | | Bechtle AG (IT Services) | | | 225,907 | |
| | 1,520 | | | Bertrandt AG (Professional Services) | | | 161,668 | |
| | 6,790 | | | Carl Zeiss Meditec AG (Health Care Equipment & Supplies) | | | 244,421 | |
| | |
| | | | | | | | |
| | Common Stocks – (continued) | |
| | Germany – (continued) | |
| | 4,598 | | | Gerresheimer AG (Life Sciences Tools & Services) | | | 346,827 | |
| | 19,426 | | | KION Group AG (Machinery) | | | 1,173,724 | |
| | 8,752 | | | Linde AG (Chemicals) | | | 1,445,538 | |
| | 3,700 | | | MorphoSys AG* (Life Sciences Tools & Services) | | | 164,306 | |
| | 4,900 | | | ProSiebenSat.1 Media SE (Media) | | | 211,181 | |
| | 8,065 | | | Rheinmetall AG (Industrial Conglomerates) | | | 559,855 | |
| | 24,876 | | | SAP SE (Software) | | | 2,191,561 | |
| | 45,044 | | | SAP SE ADR (Software) | | | 3,956,665 | |
| | 5,000 | | | Stroeer SE & Co. KGaA (Media) | | | 228,754 | |
| | 13,536 | | | TLG Immobilien AG (Real Estate Management & Development) | | | 283,787 | |
| | | | | | | | |
| | | | | | | 15,965,849 | |
| | |
| | Greece – 0.1% | |
| | 2,925 | | | Aegean Airlines SA (Airlines) | | | 18,843 | |
| | 2,500 | | | Aegean Marine Petroleum Network, Inc. (Oil, Gas & Consumable Fuels) | | | 21,500 | |
| | 8,434 | | | Alpha Bank AE* (Banks) | | | 14,421 | |
| | 2,300 | | | Costamare, Inc. (Marine) | | | 14,950 | |
| | 6,000 | | | Diana Shipping, Inc.* (Marine) | | | 15,000 | |
| | 2,588 | | | Grivalia Properties REIC AE (Equity Real Estate Investment Trusts (REITs)) | | | 19,939 | |
| | 4,471 | | | Hellenic Exchanges – Athens Stock Exchange SA (Capital Markets) | | | 22,075 | |
| | 7,163 | | | Hellenic Telecommunications Organization SA (Diversified Telecommunication Services) | | | 65,686 | |
| | 2,923 | | | JUMBO SA (Specialty Retail) | | | 41,537 | |
| | 2,047 | | | Motor Oil Hellas Corinth Refineries SA (Oil, Gas & Consumable Fuels) | | | 24,511 | |
| | 5,313 | | | Mytilineos Holdings SA* (Industrial Conglomerates) | | | 30,318 | |
| | 6,090 | | | OPAP SA (Hotels, Restaurants & Leisure) | | | 51,942 | |
| | 16,027 | | | Public Power Corp. SA* (Electric Utilities) | | | 52,361 | |
| | 2,744 | | | Titan Cement Co. SA (Construction Materials) | | | 63,735 | |
| | 3,100 | | | Tsakos Energy Navigation Ltd. (Oil, Gas & Consumable Fuels) | | | 13,950 | |
| | | | | | | | |
| | | | | | | 470,768 | |
| | |
| | Hong Kong – 0.3% | |
| | 18,000 | | | China Gas Holdings Ltd. (Gas Utilities) | | | 27,398 | |
| | 344,000 | | | Dawnrays Pharmaceutical Holdings Ltd. (Pharmaceuticals) | | | 205,479 | |
| | 22,000 | | | Lee & Man Paper Manufacturing Ltd. (Paper & Forest Products) | | | 16,530 | |
| | 526,400 | | | Man Wah Holdings Ltd. (Household Durables) | | | 349,369 | |
| | 25,000 | | | Nine Dragons Paper Holdings Ltd. (Paper & Forest Products) | | | 20,325 | |
| | |
| | |
| 28 | | The accompanying notes are an integral part of these financial statements. |
GOLDMAN SACHS MULTI-MANAGER GLOBAL EQUITY FUND
| | | | | | | | |
Shares | | | Description | | Value | |
| | | | | | | | |
| | Common Stocks – (continued) | |
| | Hong Kong – (continued) | |
| | 122,800 | | | Sands China Ltd. (Hotels, Restaurants & Leisure) | | $ | 532,922 | |
| | 40,000 | | | Sino Biopharmaceutical Ltd (Pharmaceuticals) | | | 27,958 | |
| | 34,500 | | | Sun Art Retail Group Ltd. (Food & Staples Retailing) | | | 24,301 | |
| | 55,000 | | | WH Group Ltd.(a) (Food Products) | | | 44,544 | |
| | 438,000 | | | Xinyi Glass Holdings Ltd.* (Auto Components) | | | 376,609 | |
| | | | | | | | |
| | | | | | | 1,625,435 | |
| | |
| | Hungary – 0.0% | |
| | 15,273 | | | Magyar Telekom Telecommunications PLC (Diversified Telecommunication Services) | | | 25,252 | |
| | 1,110 | | | MOL Hungarian Oil & Gas PLC (Oil, Gas & Consumable Fuels) | | | 71,196 | |
| | 2,571 | | | OTP Bank PLC (Banks) | | | 72,050 | |
| | 3,485 | | | Richter Gedeon Nyrt (Pharmaceuticals) | | | 74,813 | |
| | | | | | | | |
| | | | | | | 243,311 | |
| | |
| | India – 1.5% | |
| | 7,018 | | | Adani Ports & Special Economic Zone Ltd. (Transportation Infrastructure) | | | 32,120 | |
| | 8,672 | | | Ambuja Cements Ltd. (Construction Materials) | | | 31,213 | |
| | 19,130 | | | Ashok Leyland Ltd. (Machinery) | | | 26,191 | |
| | 2,469 | | | Asian Paints Ltd. (Chemicals) | | | 39,773 | |
| | 2,041 | | | Aurobindo Pharma Ltd. (Pharmaceuticals) | | | 25,008 | |
| | 4,143 | | | Axis Bank Ltd. (Banks) | | | 30,306 | |
| | 373 | | | Bajaj Auto Ltd. (Automobiles) | | | 15,825 | |
| | 10,089 | | | Bharat Heavy Electricals Ltd. (Electrical Equipment) | | | 21,017 | |
| | 20,816 | | | Bharti Airtel Ltd (Wireless Telecommunication Services) | | | 99,407 | |
| | 8,610 | | | Bharti Infratel Ltd. (Diversified Telecommunication Services) | | | 44,846 | |
| | 45 | | | Bosch Ltd. (Auto Components) | | | 14,765 | |
| | 2,623 | | | Cipla Ltd. (Pharmaceuticals) | | | 22,750 | |
| | 48,224 | | | Cipla Ltd. GDR (Pharmaceuticals) | | | 418,268 | |
| | 6,313 | | | Coal India Ltd. (Oil, Gas & Consumable Fuels) | | | 30,793 | |
| | 753 | | | Container Corp. of India Ltd. (Road & Rail) | | | 15,492 | |
| | 6,148 | | | Dabur India Ltd. (Personal Products) | | | 26,902 | |
| | 14,550 | | | Dr. Reddy’s Laboratories Ltd. ADR (Pharmaceuticals) | | | 717,170 | |
| | 107 | | | Eicher Motors Ltd. (Machinery) | | | 38,501 | |
| | 5,337 | | | GAIL India Ltd. (Gas Utilities) | | | 34,514 | |
| | 1,947 | | | Glenmark Pharmaceuticals Ltd. (Pharmaceuticals) | | | 27,261 | |
| | 1,279 | | | Godrej Consumer Products Ltd. (Personal Products) | | | 30,722 | |
| | 1,974 | | | HCL Technologies Ltd. (IT Services) | | | 22,702 | |
| | 58,993 | | | HDFC Bank Ltd. ADR (Banks) | | | 4,175,525 | |
| | |
| | | | | | | | |
| | Common Stocks – (continued) | |
| | India – (continued) | |
| | 653 | | | Hero MotoCorp Ltd. (Automobiles) | | | 32,776 | |
| | 4,223 | | | Hindustan Unilever Ltd. (Household Products) | | | 53,078 | |
| | 2,532 | | | Housing Development Finance Corp. Ltd. (Thrifts & Mortgage Finance) | | | 52,291 | |
| | 20,439 | | | ICICI Bank Ltd. ADR (Banks) | | | 169,439 | |
| | 19,272 | | | Idea Cellular Ltd. (Wireless Telecommunication Services) | | | 22,187 | |
| | 3,920 | | | Indian Oil Corp. Ltd. (Oil, Gas & Consumable Fuels) | | | 19,024 | |
| | 61,232 | | | Infosys Ltd. ADR (IT Services) | | | 934,400 | |
| | 17,034 | | | ITC Ltd. (Tobacco) | | | 61,678 | |
| | 652 | | | JSW Steel Ltd. (Metals & Mining) | | | 16,203 | |
| | 2,616 | | | Kotak Mahindra Bank Ltd. (Banks) | | | 32,131 | |
| | 1,691 | | | Larsen & Toubro Ltd. (Construction & Engineering) | | | 37,394 | |
| | 1,064 | | | Lupin Ltd. (Pharmaceuticals) | | | 24,199 | |
| | 1,313 | | | Mahindra & Mahindra Ltd. (Automobiles) | | | 25,907 | |
| | 491 | | | Maruti Suzuki India Ltd. (Automobiles) | | | 43,405 | |
| | 29,291 | | | NTPC Ltd. (Independent Power and Renewable Electricity Producers) | | | 66,274 | |
| | 8,997 | | | Oil & Natural Gas Corp. Ltd. (Oil, Gas & Consumable Fuels) | | | 38,894 | |
| | 16,712 | | | Power Grid Corp. of India Ltd. (Electric Utilities) | | | 43,829 | |
| | 6,875 | | | Reliance Industries Ltd. (Oil, Gas & Consumable Fuels) | | | 108,199 | |
| | 3,486 | | | Reliance Infrastructure Ltd. (Electric Utilities) | | | 28,319 | |
| | 66 | | | Shree Cement Ltd. (Construction Materials) | | | 16,697 | |
| | 1,445 | | | Siemens Ltd. (Industrial Conglomerates) | | | 25,705 | |
| | 7,679 | | | State Bank of India (Banks) | | | 29,664 | |
| | 4,829 | | | Sun Pharmaceutical Industries Ltd. (Pharmaceuticals) | | | 54,138 | |
| | 1,352 | | | Tata Consultancy Services Ltd. (IT Services) | | | 48,415 | |
| | 95,091 | | | Tata Global Beverages Ltd. GDR (Food Products) | | | 198,638 | |
| | 17,023 | | | Tata Motors Ltd. ADR (Automobiles) | | | 670,876 | |
| | 13,736 | | | Tata Power Co. Ltd. (Electric Utilities) | | | 16,073 | |
| | 625 | | | UltraTech Cement Ltd. (Construction Materials) | | | 37,129 | |
| | 555 | | | United Spirits Ltd.* (Beverages) | | | 18,845 | |
| | 2,089 | | | UPL Ltd. (Chemicals) | | | 21,810 | |
| | 6,616 | | | Vedanta Ltd. (Metals & Mining) | | | 20,142 | |
| | 3,001 | | | Wipro Ltd. (IT Services) | | | 20,937 | |
| | 2,154 | | | Zee Entertainment Enterprises Ltd. (Media) | | | 16,727 | |
| | | | | | | | |
| | | | | | | 8,946,494 | |
| | |
| | Indonesia – 0.4% | |
| | 440,600 | | | Adaro Energy Tbk PT (Oil, Gas & Consumable Fuels) | | | 53,489 | |
| | |
| | |
| The accompanying notes are an integral part of these financial statements. | | 29 |
GOLDMAN SACHS MULTI-MANAGER GLOBAL EQUITY FUND
Schedule of Investments (continued)
October 31, 2016
| | | | | | | | |
Shares | | | Description | | Value | |
| | | | | | | | |
| | Common Stocks – (continued) | |
| | Indonesia – (continued) | |
| | 52,200 | | | AKR Corporindo Tbk PT (Trading Companies & Distributors) | | $ | 28,336 | |
| | 135,600 | | | Astra International Tbk PT (Automobiles) | | | 85,551 | |
| | 41,000 | | | Bank Central Asia Tbk PT (Banks) | | | 48,747 | |
| | 3,821 | | | Bank CIMB Niaga Tbk PT* (Banks) | | | 280 | |
| | 566,900 | | | Bank Mandiri Persero Tbk PT (Banks) | | | 499,353 | |
| | 209,200 | | | Bank Negara Indonesia Persero Tbk PT (Banks) | | | 89,310 | |
| | 622,600 | | | Bank Rakyat Indonesia Persero Tbk PT (Banks) | | | 581,365 | |
| | 54,000 | | | Charoen Pokphand Indonesia Tbk PT (Food Products) | | | 15,282 | |
| | 7,100 | | | Gudang Garam Tbk PT (Tobacco) | | | 36,941 | |
| | 2,855,000 | | | Hanson International Tbk PT* (Real Estate Management & Development) | | | 30,600 | |
| | 28,600 | | | Indocement Tunggal Prakarsa Tbk PT (Construction Materials) | | | 36,010 | |
| | 72,000 | | | Indofood Sukses Makmur Tbk PT (Food Products) | | | 46,813 | |
| | 36,900 | | | Jasa Marga Persero Tbk PT (Transportation Infrastructure) | | | 12,800 | |
| | 618,200 | | | Kalbe Farma Tbk PT (Pharmaceuticals) | | | 82,375 | |
| | 28,700 | | | Matahari Department Store Tbk PT (Multiline Retail) | | | 39,579 | |
| | 157,500 | | | Mitra Keluarga Karyasehat Tbk PT (Health Care Providers & Services) | | | 33,553 | |
| | 94,500 | | | Pembangunan Perumahan Persero Tbk PT (Construction & Engineering) | | | 29,804 | |
| | 305,700 | | | Perusahaan Gas Negara Persero Tbk (Gas Utilities) | | | 59,880 | |
| | 161,200 | | | Semen Indonesia Persero Tbk PT (Construction Materials) | | | 121,506 | |
| | 940,300 | | | Sugih Energy Tbk PT* (Oil, Gas & Consumable Fuels) | | | 8,215 | |
| | 28,500 | | | Tambang Batubara Bukit Asam Persero Tbk PT (Oil, Gas & Consumable Fuels) | | | 26,005 | |
| | 1,697,100 | | | Telekomunikasi Indonesia Persero Tbk PT (Diversified Telecommunication Services) | | | 547,949 | |
| | 46,100 | | | Tower Bersama Infrastructure Tbk PT (Wireless Telecommunication Services) | | | 21,104 | |
| | 7,600 | | | Unilever Indonesia Tbk PT (Household Products) | | | 25,899 | |
| | 34,400 | | | United Tractors Tbk PT (Oil, Gas & Consumable Fuels) | | | 56,906 | |
| | | | | | | | |
| | | | | | | 2,617,652 | |
| | |
| | Ireland – 1.2% | |
| | 23,698 | | | Accenture PLC Class A (IT Services) | | | 2,754,655 | |
| | 6,008 | | | DCC PLC (Industrial Conglomerates) | | | 488,808 | |
| | 3,445 | | | Global Indemnity PLC* (Insurance) | | | 103,488 | |
| | |
| | | | | | | | |
| | Common Stocks – (continued) | |
| | Ireland – (continued) | |
| | 192,968 | | | Hibernia REIT PLC (Equity Real Estate Investment Trusts (REITs)) | | | 271,779 | |
| | 28,084 | | | ICON PLC* (Life Sciences Tools & Services) | | | 2,254,584 | |
| | 3,400 | | | Kingspan Group PLC (Building Products) | | | 83,231 | |
| | 14,156 | | | Smurfit Kappa Group PLC (Containers & Packaging) | | | 310,615 | |
| | 98,674 | | | UDG Healthcare PLC (Health Care Providers & Services) | | | 788,577 | |
| | | | | | | | |
| | | | | | | 7,055,737 | |
| | |
| | Israel – 0.3% | |
| | 231,671 | | | Israel Discount Bank Class A* (Banks) | | | 425,494 | |
| | 15,628 | | | Orbotech Ltd.* (Electronic Equipment, Instruments & Components) | | | 428,207 | |
| | 35,138 | | | Plus500 Ltd. (Diversified Financial Services) | | | 266,010 | |
| | 14,920 | | | Tower Semiconductor Ltd.* (Semiconductors & Semiconductor Equipment) | | | 232,006 | |
| | 6,579 | | | Wix.com Ltd.* (Internet Software & Services) | | | 263,160 | |
| | | | | | | | |
| | | | | | | 1,614,877 | |
| | |
| | Italy – 0.9% | |
| | 57,357 | | | Amplifon SpA (Health Care Providers & Services) | | | 606,049 | |
| | 32,400 | | | Azimut Holding SpA (Capital Markets) | | | 520,069 | |
| | 10,700 | | | Banca Generali SpA (Capital Markets) | | | 237,932 | |
| | 27,872 | | | Banca Mediolanum SpA (Diversified Financial Services) | | | 192,709 | |
| | 24,167 | | | Banca Popolare dell’Emilia Romagna SC (Banks) | | | 113,562 | |
| | 56,200 | | | Banco Popolare SC (Banks) | | | 162,210 | |
| | 31,197 | | | Buzzi Unicem SpA (Construction Materials) | | | 606,710 | |
| | 4,690 | | | DiaSorin SpA (Health Care Equipment & Supplies) | | | 288,236 | |
| | 313,504 | | | Hera SpA (Multi-Utilities) | | | 801,333 | |
| | 76,326 | | | Infrastrutture Wireless Italiane SpA(a) (Diversified Telecommunication Services) | | | 360,830 | |
| | 199,082 | | | Iren SpA (Multi-Utilities) | | | 357,243 | |
| | 22,749 | | | Moncler SpA (Textiles, Apparel & Luxury Goods) | | | 378,724 | |
| | 28,400 | | | RAI Way SpA(a) (Media) | | | 111,126 | |
| | 19,267 | | | Recordati SpA (Pharmaceuticals) | | | 544,849 | |
| | 29,020 | | | Societa Iniziative Autostradali e Servizi SpA (Transportation Infrastructure) | | | 271,785 | |
| | | | | | | | |
| | | | | | | 5,553,367 | |
| | |
| | Japan – 9.4% | |
| | 14,000 | | | Air Water, Inc. (Chemicals) | | | 261,940 | |
| | 11,600 | | | Alps Electric Co. Ltd. (Electronic Equipment, Instruments & Components) | | | 278,257 | |
| | |
| | |
| 30 | | The accompanying notes are an integral part of these financial statements. |
GOLDMAN SACHS MULTI-MANAGER GLOBAL EQUITY FUND
| | | | | | | | |
Shares | | | Description | | Value | |
| | | | | | | | |
| | Common Stocks – (continued) | |
| | Japan – (continued) | |
| | 9,100 | | | Amano Corp. (Electronic Equipment, Instruments & Components) | | $ | 169,310 | |
| | 21,200 | | | Asahi Group Holdings Ltd. (Beverages) | | | 756,224 | |
| | 5,600 | | | Asahi Holdings, Inc. (Metals & Mining) | | | 100,851 | |
| | 104,130 | | | Ashikaga Holdings Co. Ltd. (Banks) | | | 370,573 | |
| | 37,000 | | | Calsonic Kansei Corp. (Auto Components) | | | 463,706 | |
| | 21,600 | | | Century Tokyo Leasing Corp. (Diversified Financial Services) | | | 761,115 | |
| | 13,600 | | | Coca-Cola West Holdings Co. Ltd. (Beverages) | | | 401,944 | |
| | 27,100 | | | Daifuku Co. Ltd. (Machinery) | | | 489,665 | |
| | 7,000 | | | Daiichikosho Co. Ltd. (Media) | | | 304,304 | |
| | 69,000 | | | Denka Co. Ltd (Chemicals) | | | 313,024 | |
| | 12,700 | | | DIC Corp. (Chemicals) | | | 384,706 | |
| | 8,600 | | | Doutor Nichires Holdings Co. Ltd. (Hotels, Restaurants & Leisure) | | | 172,135 | |
| | 17,100 | | | DTS Corp. (IT Services) | | | 378,834 | |
| | 37,800 | | | East Japan Railway Co. (Road & Rail) | | | 3,327,475 | |
| | 17,400 | | | Ebara Corp. (Machinery) | | | 516,553 | |
| | 4,800 | | | en-japan, Inc. (Professional Services) | | | 92,487 | |
| | 6,600 | | | Ezaki Glico Co. Ltd. (Food Products) | | | 375,183 | |
| | 85,000 | | | Fujikura Ltd. (Electrical Equipment) | | | 499,418 | |
| | 17,600 | | | GMO internet, Inc. (Internet Software & Services) | | | 234,948 | |
| | 61,000 | | | Gunze Ltd. (Textiles, Apparel & Luxury Goods) | | | 204,743 | |
| | 45,200 | | | Haseko Corp. (Household Durables) | | | 439,878 | |
| | 32,300 | | | Hazama Ando Corp. (Construction & Engineering) | | | 208,222 | |
| | 12,000 | | | HIS Co. Ltd. (Hotels, Restaurants & Leisure) | | | 327,515 | |
| | 8,300 | | | Hitachi High-Technologies Corp. (Electronic Equipment, Instruments & Components) | | | 346,160 | |
| | 18,900 | | | Hitachi Kokusai Electric, Inc. (Communications Equipment) | | | 377,509 | |
| | 621,000 | | | Hitachi Ltd. (Electronic Equipment, Instruments & Components) | | | 3,310,484 | |
| | 105,800 | | | Ichigo, Inc. (Real Estate Management & Development) | | | 458,706 | |
| | 78,700 | | | Japan Airlines Co. Ltd. (Airlines) | | | 2,322,578 | |
| | 506 | | | Japan Hotel REIT Investment Corp. (Equity Real Estate Investment Trusts (REITs)) | | | 341,383 | |
| | 24,700 | | | K’s Holdings Corp. (Specialty Retail) | | | 427,457 | |
| | 12,800 | | | Kaken Pharmaceutical Co. Ltd. (Pharmaceuticals) | | | 806,046 | |
| | 17,800 | | | Kanamoto Co. Ltd. (Trading Companies & Distributors) | | | 427,639 | |
| | 14,900 | | | Kansai Paint Co. Ltd. (Chemicals) | | | 320,202 | |
| | 117,800 | | | KDDI Corp. (Wireless Telecommunication Services) | | | 3,580,314 | |
| | 4,500 | | | Keyence Corp. (Electronic Equipment, Instruments & Components) | | | 3,298,911 | |
| | |
| | | | | | | | |
| | Common Stocks – (continued) | |
| | Japan – (continued) | |
| | 41,500 | | | Kinden Corp. (Construction & Engineering) | | | 499,789 | |
| | 90,700 | | | Komatsu Ltd. (Machinery) | | | 2,018,901 | |
| | 15,200 | | | Kyudenko Corp. (Construction & Engineering) | | | 489,694 | |
| | 57,200 | | | Leopalace21 Corp. (Real Estate Management & Development) | | | 371,902 | |
| | 41,000 | | | Lion Corp. (Household Products) | | | 670,555 | |
| | 45,000 | | | Maeda Corp. (Construction & Engineering) | | | 416,900 | |
| | 5,600 | | | Matsumotokiyoshi Holdings Co. Ltd. (Food & Staples Retailing) | | | 288,502 | |
| | 85 | | | MCUBS MidCity Investment Corp. (Equity Real Estate Investment Trusts (REITs)) | | | 276,399 | |
| | 12,800 | | | Megmilk Snow Brand Co. Ltd. (Food Products) | | | 445,284 | |
| | 23,700 | | | MISUMI Group, Inc. (Trading Companies & Distributors) | | | 432,239 | |
| | 52,000 | | | Nachi-Fujikoshi Corp. (Machinery) | | | 197,216 | |
| | 17,600 | | | Nexon Co. Ltd. (Software) | | | 299,605 | |
| | 29,000 | | | Nichias Corp. (Building Products) | | | 258,025 | |
| | 16,400 | | | Nichiha Corp. (Building Products) | | | 405,050 | |
| | 16,600 | | | Nichirei Corp. (Food Products) | | | 362,986 | |
| | 8,100 | | | Nifco, Inc. (Auto Components) | | | 466,493 | |
| | 69,700 | | | Nikon Corp. (Household Durables) | | | 1,053,370 | |
| | 7,000 | | | Nippon Shinyaku Co. Ltd. (Pharmaceuticals) | | | 355,339 | |
| | 6,100 | | | Nishio Rent All Co. Ltd. (Trading Companies & Distributors) | | | 184,184 | |
| | 9,500 | | | Obic Co. Ltd. (IT Services) | | | 493,510 | |
| | 18,600 | | | Okamura, Corp. (Commercial Services & Supplies) | | | 182,482 | |
| | 171 | | | Orix JREIT, Inc. (Equity Real Estate Investment Trusts (REITs)) | | | 292,925 | |
| | 41,000 | | | Osaki Electric Co. Ltd. (Electronic Equipment, Instruments & Components) | | | 393,503 | |
| | 13,100 | | | Paltac Corp. (Distributors) | | | 321,475 | |
| | 4,200 | | | Pola Orbis Holdings, Inc. (Personal Products) | | | 349,479 | |
| | 101,000 | | | Sankyu, Inc. (Road & Rail) | | | 594,764 | |
| | 7,400 | | | Sanyo Chemical Industries Ltd. (Chemicals) | | | 334,590 | |
| | 5,800 | | | Sawai Pharmaceutical Co. Ltd. (Pharmaceuticals) | | | 374,809 | |
| | 12,100 | | | SCSK Corp. (IT Services) | | | 451,365 | |
| | 35,100 | | | Seino Holdings Co. Ltd. (Road & Rail) | | | 388,932 | |
| | 2,400 | | | Shimamura Co. Ltd. (Specialty Retail) | | | 307,235 | |
| | 30,000 | | | Skylark Co. Ltd. (Hotels, Restaurants & Leisure) | | | 421,847 | |
| | 7,400 | | | St Marc Holdings Co. Ltd. (Hotels, Restaurants & Leisure) | | | 207,693 | |
| | 7,400 | | | Starts Corp., Inc. (Household Durables) | | | 137,242 | |
| | 69,400 | | | Sumitomo Mitsui Financial Group, Inc. (Banks) | | | 2,406,213 | |
| | |
| | |
| The accompanying notes are an integral part of these financial statements. | | 31 |
GOLDMAN SACHS MULTI-MANAGER GLOBAL EQUITY FUND
Schedule of Investments (continued)
October 31, 2016
| | | | | | | | |
Shares | | | Description | | Value | |
| | | | | | | | |
| | Common Stocks – (continued) | |
| | Japan – (continued) | |
| | 7,600 | | | Sundrug Co. Ltd. (Food & Staples Retailing) | | $ | 597,831 | |
| | 17,200 | | | Suruga Bank Ltd. (Banks) | | | 419,902 | |
| | 32,400 | | | Sysmex Corp. (Health Care Equipment & Supplies) | | | 2,245,387 | |
| | 10,300 | | | TechnoPro Holdings, Inc. (Professional Services) | | | 352,822 | |
| | 23,500 | | | Temp Holdings Co. Ltd. (Professional Services) | | | 398,553 | |
| | 2,000 | | | Tenma Corp. (Chemicals) | | | 34,641 | |
| | 106,000 | | | The 77 Bank Ltd. (Banks) | | | 478,834 | |
| | 12,200 | | | TIS, Inc. (IT Services) | | | 276,067 | |
| | 72,000 | | | Toda Corp. (Construction & Engineering) | | | 390,244 | |
| | 10,000 | | | Tokyo Ohka Kogyo Co. Ltd. (Chemicals) | | | 355,076 | |
| | 8,400 | | | Toridoll Holdings Corp. (Hotels, Restaurants & Leisure) | | | 194,614 | |
| | 13,100 | | | Toshiba Plant Systems & Services Corp. (Construction & Engineering) | | | 211,229 | |
| | 3,300 | | | Tosho Co. Ltd. (Hotels, Restaurants & Leisure) | | | 142,873 | |
| | 94,000 | | | Tosoh Corp. (Chemicals) | | | 613,867 | |
| | 2,300 | | | Towa Corp. (Semiconductors & Semiconductor Equipment) | | | 26,467 | |
| | 14,700 | | | Toyo Tire & Rubber Co. Ltd. (Auto Components) | | | 228,002 | |
| | 4,800 | | | Trusco Nakayama Corp. (Trading Companies & Distributors) | | | 248,166 | |
| | 19,600 | | | TS Tech Co. Ltd. (Auto Components) | | | 525,509 | |
| | 53,000 | | | Tsubakimoto Chain Co. (Machinery) | | | 419,838 | |
| | 3,000 | | | Tsuruha Holdings, Inc. (Food & Staples Retailing) | | | 346,149 | |
| | 17,100 | | | Ulvac, Inc. (Semiconductors & Semiconductor Equipment) | | | 539,915 | |
| | 21,900 | | | Unipres Corp. (Auto Components) | | | 422,635 | |
| | 19,000 | | | Valor Holdings Co. Ltd. (Food & Staples Retailing) | | | 538,924 | |
| | 74,900 | | | Yamada Denki Co. Ltd. (Specialty Retail) | | | 387,157 | |
| | 26,000 | | | Yokogawa Bridge Holdings Corp. (Construction & Engineering) | | | 285,652 | |
| | 22,000 | | | Zenkoku Hosho Co. Ltd. (Diversified Financial Services) | | | 945,886 | |
| | 20,100 | | | Zojirushi Corp. (Household Durables) | | | 277,121 | |
| | | | | | | | |
| | | | | | | 56,904,257 | |
| | |
| | Luxembourg – 0.2% | |
| | 9,039 | | | APERAM SA (Metals & Mining) | | | 411,083 | |
| | 125,079 | | | ArcelorMittal* (Metals & Mining) | | | 845,154 | |
| | 1,209 | | | Pegas Nonwovens SA (Textiles, Apparel & Luxury Goods) | | | 38,795 | |
| | | | | | | | |
| | | | | | | 1,295,032 | |
| | |
| | Malaysia – 0.3% | |
| | 303,200 | | | Astro Malaysia Holdings Bhd (Media) | | | 206,029 | |
| | |
| | | | | | | | |
| | Common Stocks – (continued) | |
| | Malaysia – (continued) | |
| | 26,100 | | | Axiata Group Bhd (Wireless Telecommunication Services) | | | 30,600 | |
| | 1,500 | | | British American Tobacco Malaysia Bhd (Tobacco) | | | 17,707 | |
| | 105,400 | | | Bumi Armada Bhd* (Energy Equipment & Services) | | | 17,673 | |
| | 198,000 | | | CIMB Group Holdings Bhd (Banks) | | | 237,198 | |
| | 26,200 | | | DiGi.Com Bhd (Wireless Telecommunication Services) | | | 31,415 | |
| | 96,800 | | | Genting Bhd (Hotels, Restaurants & Leisure) | | | 180,889 | |
| | 33,100 | | | Genting Malaysia Bhd (Hotels, Restaurants & Leisure) | | | 37,565 | |
| | 17,900 | | | Globetronics Technology Bhd (Semiconductors & Semiconductor Equipment) | | | 15,568 | |
| | 16,600 | | | Hartalega Holdings Bhd (Health Care Equipment & Supplies) | | | 19,390 | |
| | 33,300 | | | IHH Healthcare Bhd (Health Care Providers & Services) | | | 50,803 | |
| | 33,300 | | | IJM Corp. Bhd (Construction & Engineering) | | | 26,204 | |
| | 32,600 | | | IOI Corp. Bhd (Food Products) | | | 34,942 | |
| | 4,700 | | | Kuala Lumpur Kepong Bhd (Food Products) | | | 26,834 | |
| | 12,200 | | | Lafarge Malaysia Bhd (Construction Materials) | | | 23,557 | |
| | 89,200 | | | Malayan Banking Bhd (Banks) | | | 167,948 | |
| | 13,800 | | | MISC Bhd (Marine) | | | 24,738 | |
| | 39,200 | | | My EG Services Bhd (IT Services) | | | 22,759 | |
| | 42,800 | | | Petronas Chemicals Group Bhd (Chemicals) | | | 71,418 | |
| | 7,000 | | | Petronas Dagangan Bhd (Oil, Gas & Consumable Fuels) | | | 38,980 | |
| | 4,100 | | | Petronas Gas Bhd (Gas Utilities) | | | 21,502 | |
| | 4,100 | | | PPB Group Bhd (Food Products) | | | 15,755 | |
| | 7,800 | | | Public Bank Bhd (Banks) | | | 36,927 | |
| | 11,500 | | | RHB Bank Bhd (Banks) | | | 13,242 | |
| | 65,500 | | | SapuraKencana Petroleum Bhd* (Energy Equipment & Services) | | | 25,185 | |
| | 22,000 | | | Sime Darby Bhd (Industrial Conglomerates) | | | 42,963 | |
| | 17,100 | | | Telekom Malaysia Bhd (Diversified Telecommunication Services) | | | 26,659 | |
| | 17,300 | | | Tenaga Nasional Berhad (Electric Utilities) | | | 59,138 | |
| | 15,800 | | | Top Glove, Corp. Bhd (Health Care Equipment & Supplies) | | | 18,631 | |
| | 45,700 | | | Unisem M Bhd (Semiconductors & Semiconductor Equipment) | | | 27,746 | |
| | | | | | | | |
| | | | | | | 1,569,965 | |
| | |
| | Mexico – 0.9% | |
| | 53,200 | | | Alfa SAB de CV Class A (Industrial Conglomerates) | | | 80,668 | |
| | |
| | |
| 32 | | The accompanying notes are an integral part of these financial statements. |
GOLDMAN SACHS MULTI-MANAGER GLOBAL EQUITY FUND
| | | | | | | | |
Shares | | | Description | | Value | |
| | | | | | | | |
| | Common Stocks – (continued) | |
| | Mexico – (continued) | |
| | 7,900 | | | Alsea SAB de CV (Hotels, Restaurants & Leisure) | | $ | 29,483 | |
| | 48,097 | | | America Movil SAB de CV ADR Class L (Wireless Telecommunication Services) | | | 631,995 | |
| | 14,976 | | | Cemex SA de CV ADR* (Construction Materials) | | | 129,992 | |
| | 576,332 | | | Cemex SAB de CV* (Construction Materials) | | | 498,851 | |
| | 400 | | | Coca-Cola Femsa SAB de CV ADR (Beverages) | | | 30,004 | |
| | 11,900 | | | Concentradora Fibra Danhos SA de CV Class S (Equity Real Estate Investment Trusts (REITs)) | | | 21,790 | |
| | 2,700 | | | El Puerto de Liverpool SAB de CV Series C1 (Multiline Retail) | | | 28,301 | |
| | 21,000 | | | Fibra Uno Administracion SA de CV (Equity Real Estate Investment Trusts (REITs)) | | | 40,076 | |
| | 1,200 | | | Fomento Economico Mexicano SA de CV ADR (Beverages) | | | 114,804 | |
| | 27,000 | | | Fomento Economico Mexicano SAB de CV (Beverages) | | | 258,986 | |
| | 37,600 | | | Genomma Lab Internacional SAB de CV Class B* (Pharmaceuticals) | | | 44,978 | |
| | 13,200 | | | Gentera SAB de CV (Consumer Finance) | | | 26,049 | |
| | 1,800 | | | Gruma SAB de CV Class B (Food Products) | | | 24,975 | |
| | 6,000 | | | Grupo Aeroportuario del Pacifico SAB de CV Class B (Transportation Infrastructure) | | | 57,994 | |
| | 3,645 | | | Grupo Aeroportuario del Sureste SAB de CV Class B (Transportation Infrastructure) | | | 57,976 | |
| | 100,200 | | | Grupo Bimbo SAB de CV Series A (Food Products) | | | 269,890 | |
| | 7,900 | | | Grupo Carso SAB de CV Series A1 (Industrial Conglomerates) | | | 34,482 | |
| | 24,900 | | | Grupo Financiero Banorte SA de CV Class O (Banks) | | | 146,639 | |
| | 19,600 | | | Grupo Financiero Inbursa SAB de CV Class O (Banks) | | | 31,804 | |
| | 157,900 | | | Grupo Financiero Santander Mexico SAB de CV Class B (Banks) | | | 285,792 | |
| | 46,500 | | | Grupo Mexico SAB de CV Series B (Metals & Mining) | | | 114,571 | |
| | 25,654 | | | Grupo Televisa SAB ADR (Media) | | | 629,293 | |
| | 2,330 | | | Industrias Penoles SAB de CV (Metals & Mining) | | | 56,508 | |
| | 8,500 | | | Infraestructura Energetica Nova SAB de CV (Gas Utilities) | | | 37,632 | |
| | 10,600 | | | Kimberly-Clark de Mexico SAB de CV Class A (Household Products) | | | 22,859 | |
| | 6,100 | | | Megacable Holdings SAB de CV (Media) | | | 22,178 | |
| | |
| | | | | | | | |
| | Common Stocks – (continued) | |
| | Mexico – (continued) | |
| | 17,700 | | | Mexichem SAB de CV (Chemicals) | | | 42,328 | |
| | 33,600 | | | Nemak SAB de CV(a) (Auto Components) | | | 34,878 | |
| | 12,600 | | | PLA Administradora Industrial S de RL de CV* (Equity Real Estate Investment Trusts (REITs)) | | | 20,879 | |
| | 4,000 | | | Promotora y Operadora de Infraestructura SAB de CV (Transportation Infrastructure) | | | 44,717 | |
| | 852,070 | | | Wal-Mart de Mexico SAB de CV (Food & Staples Retailing) | | | 1,802,777 | |
| | | | | | | | |
| | | | | | | 5,674,149 | |
| | |
| | Netherlands – 2.3% | |
| | 26,485 | | | Aalberts Industries NV (Machinery) | | | 836,438 | |
| | 55,359 | | | Akzo Nobel NV (Chemicals) | | | 3,576,802 | |
| | 18,122 | | | BE Semiconductor Industries NV (Semiconductors & Semiconductor Equipment) | | | 590,358 | |
| | 25,633 | | | Core Laboratories NV (Energy Equipment & Services) | | | 2,485,632 | |
| | 9,114 | | | Euronext NV(a) (Capital Markets) | | | 364,976 | |
| | 65,834 | | | ING Groep NV (Banks) | | | 864,204 | |
| | 178,302 | | | PostNL NV* (Air Freight & Logistics) | | | 839,742 | |
| | 68,092 | | | RELX NV (Professional Services) | | | 1,148,204 | |
| | 7,892 | | | Steinhoff International Holdings NV (Household Durables) | | | 42,575 | |
| | 8,929 | | | Wereldhave NV (Equity Real Estate Investment Trusts (REITs)) | | | 399,668 | |
| | 19,347 | | | Wright Medical Group NV* (Health Care Equipment & Supplies) | | | 423,893 | |
| | 102,675 | | | Yandex NV Class A* (Internet Software & Services) | | | 2,021,671 | |
| | | | | | | | |
| | | | | | | 13,594,163 | |
| | |
| | Netherlands Antilles – 0.5% | |
| | 41,405 | | | Schlumberger Ltd. (Energy Equipment & Services) | | | 3,239,113 | |
| | |
| | New Zealand – 0.2% | |
| | 62,154 | | | Fisher & Paykel Healthcare Corp. Ltd. (Health Care Equipment & Supplies) | | | 393,524 | |
| | 71,000 | | | SKYCITY Entertainment Group Ltd. (Hotels, Restaurants & Leisure) | | | 197,936 | |
| | 193,997 | | | Spark New Zealand Ltd. (Diversified Telecommunication Services) | | | 507,377 | |
| | | | | | | | |
| | | | | | | 1,098,837 | |
| | |
| | Norway – 0.1% | |
| | 22,897 | | | Aker BP ASA* (Oil, Gas & Consumable Fuels) | | | 366,389 | |
| | 41,800 | | | SpareBank 1 SMN (Banks) | | | 307,340 | |
| | | | | | | | |
| | | | | | | 673,729 | |
| | |
| | Pakistan – 0.1% | |
| | 16,000 | | | DG Khan Cement Co. Ltd. (Construction Materials) | | | 26,190 | |
| | |
| | |
| The accompanying notes are an integral part of these financial statements. | | 33 |
GOLDMAN SACHS MULTI-MANAGER GLOBAL EQUITY FUND
Schedule of Investments (continued)
October 31, 2016
| | | | | | | | |
Shares | | | Description | | Value | |
| | | | | | | | |
| | Common Stocks – (continued) | |
| | Pakistan – (continued) | |
| | 8,500 | | | Engro Corp. Ltd. (Chemicals) | | $ | 22,635 | |
| | 25,400 | | | Fauji Fertilizer Co. Ltd. (Chemicals) | | | 25,141 | |
| | 19,700 | | | Habib Bank Ltd. (Banks) | | | 42,030 | |
| | 37,000 | | | Kot Addu Power Co. Ltd. (Independent Power and Renewable Electricity Producers) | | | 26,062 | |
| | 5,600 | | | Lucky Cement Ltd. (Construction Materials) | | | 35,851 | |
| | 20,100 | | | MCB Bank Ltd. (Banks) | | | 40,935 | |
| | 22,000 | | | Nishat Mills Ltd. (Textiles, Apparel & Luxury Goods) | | | 28,984 | |
| | 20,400 | | | Oil & Gas Development Co. Ltd. (Oil, Gas & Consumable Fuels) | | | 27,277 | |
| | 16,200 | | | Pakistan Petroleum Ltd. (Oil, Gas & Consumable Fuels) | | | 22,896 | |
| | 8,000 | | | Pakistan State Oil Co. Ltd. (Oil, Gas & Consumable Fuels) | | | 30,820 | |
| | 33,500 | | | The Hub Power Co. Ltd. (Independent Power and Renewable Electricity Producers) | | | 34,117 | |
| | 6,156 | | | The Searle Co. Ltd. (Pharmaceuticals) | | | 28,930 | |
| | 77,500 | | | TRG Pakistan* (Commercial Services & Supplies) | | | 28,582 | |
| | 15,900 | | | United Bank Ltd. (Banks) | | | 30,550 | |
| | | | | | | | |
| | | | | | | 451,000 | |
| | |
| | Panama – 0.0% | |
| | 1,107 | | | Intercorp Financial Services, Inc. (Banks) | | | 34,538 | |
| | |
| | Peru – 0.1% | |
| | 33,411 | | | Alicorp SAA (Food Products) | | | 77,480 | |
| | 3,700 | | | Cia de Minas Buenaventura SAA ADR* (Metals & Mining) | | | 49,173 | |
| | 26,722 | | | Cia Minera Milpo SAA (Metals & Mining) | | | 24,390 | |
| | 3,479 | | | Credicorp Ltd. (Banks) | | | 517,258 | |
| | 12,912 | | | Engie Energia Peru SA (Independent Power and Renewable Electricity Producers) | | | 36,546 | |
| | 66,027 | | | Ferreycorp SAA (Trading Companies & Distributors) | | | 32,783 | |
| | | | | | | | |
| | | | | | | 737,630 | |
| | |
| | Philippines – 0.2% | |
| | 25,840 | | | Aboitiz Equity Ventures, Inc. (Industrial Conglomerates) | | | 41,598 | |
| | 43,800 | | | Aboitiz Power Corp. (Independent Power and Renewable Electricity Producers) | | | 41,487 | |
| | 76,000 | | | Alliance Global Group, Inc. (Industrial Conglomerates) | | | 22,372 | |
| | 2,300 | | | Ayala Corp. (Diversified Financial Services) | | | 39,653 | |
| | 54,100 | | | Ayala Land, Inc. (Real Estate Management & Development) | | | 40,466 | |
| | 15,230 | | | Bank of the Philippine Islands (Banks) | | | 31,780 | |
| | 13,690 | | | BDO Unibank, Inc. (Banks) | | | 31,884 | |
| | |
| | | | | | | | |
| | Common Stocks – (continued) | |
| | Philippines – (continued) | |
| | 270,000 | | | Bloomberry Resorts Corp.* (Hotels, Restaurants & Leisure) | | | 32,954 | |
| | 170,400 | | | D&L Industries, Inc. (Chemicals) | | | 38,605 | |
| | 207,300 | | | Energy Development Corp. (Independent Power and Renewable Electricity Producers) | | | 25,246 | |
| | 770 | | | Globe Telecom, Inc. (Wireless Telecommunication Services) | | | 28,321 | |
| | 490 | | | GT Capital Holdings, Inc. (Diversified Financial Services) | | | 13,243 | |
| | 29,750 | | | JG Summit Holdings, Inc. (Industrial Conglomerates) | | | 46,607 | |
| | 11,670 | | | Jollibee Foods Corp. (Hotels, Restaurants & Leisure) | | | 57,312 | |
| | 6,560 | | | Manila Electric Co. (Electric Utilities) | | | 37,419 | |
| | 118,300 | | | Metro Pacific Investments Corp. (Diversified Financial Services) | | | 17,616 | |
| | 172,510 | | | Metropolitan Bank & Trust Co. (Banks) | | | 289,710 | |
| | 1,600 | | | PLDT, Inc. (Wireless Telecommunication Services) | | | 50,493 | |
| | 35,400 | | | Puregold Price Club, Inc. (Food & Staples Retailing) | | | 29,791 | |
| | 19,570 | | | Robinsons Retail Holdings, Inc. (Food & Staples Retailing) | | | 31,218 | |
| | 11,950 | | | Semirara Mining & Power Corp. (Oil, Gas & Consumable Fuels) | | | 31,070 | |
| | 26,060 | | | SM Investments Corp. (Industrial Conglomerates) | | | 361,247 | |
| | 104,400 | | | SM Prime Holdings, Inc. (Real Estate Management & Development) | | | 57,971 | |
| | 14,740 | | | Universal Robina Corp. (Food Products) | | | 55,390 | |
| | | | | | | | |
| | | | | | | 1,453,453 | |
| | |
| | Poland – 0.2% | |
| | 1,891 | | | Alior Bank SA* (Banks) | | | 22,766 | |
| | 3,994 | | | Asseco Poland SA (Software) | | | 53,385 | |
| | 7,292 | | | Bank Pekao SA (Banks) | | | 225,061 | |
| | 440 | | | Bank Zachodni WBK SA (Banks) | | | 35,553 | |
| | 619 | | | Budimex SA (Construction & Engineering) | | | 32,119 | |
| | 890 | | | CCC SA (Textiles, Apparel & Luxury Goods) | | | 45,163 | |
| | 1,470 | | | Ciech SA (Chemicals) | | | 23,975 | |
| | 7,726 | | | Cyfrowy Polsat SA* (Media) | | | 47,748 | |
| | 9,340 | | | Enea SA* (Electric Utilities) | | | 23,925 | |
| | 8,100 | | | Energa SA (Electric Utilities) | | | 16,610 | |
| | 4,088 | | | Eurocash SA (Food & Staples Retailing) | | | 41,402 | |
| | 1,168 | | | Grupa Azoty SA (Chemicals) | | | 18,607 | |
| | 497 | | | ING Bank Slaski SA (Banks) | | | 18,242 | |
| | 2,216 | | | Jastrzebska Spolka Weglowa SA* (Metals & Mining) | | | 41,097 | |
| | 2,970 | | | KGHM Polska Miedz SA (Metals & Mining) | | | 53,907 | |
| | 17 | | | LPP SA (Textiles, Apparel & Luxury Goods) | | | 25,533 | |
| | 180 | | | mBank SA* (Banks) | | | 16,254 | |
| | |
| | |
| 34 | | The accompanying notes are an integral part of these financial statements. |
GOLDMAN SACHS MULTI-MANAGER GLOBAL EQUITY FUND
| | | | | | | | |
Shares | | | Description | | Value | |
| | | | | | | | |
| | Common Stocks – (continued) | |
| | Poland – (continued) | |
| | 28,086 | | | Orange Polska SA (Diversified Telecommunication Services) | | $ | 40,099 | |
| | 23,308 | | | PGE Polska Grupa Energetyczna SA (Electric Utilities) | | | 61,069 | |
| | 5,652 | | | Polski Koncern Naftowy ORLEN SA (Oil, Gas & Consumable Fuels) | | | 111,979 | |
| | 27,500 | | | Polskie Gornictwo Naftowe i Gazownictwo SA (Oil, Gas & Consumable Fuels) | | | 35,206 | |
| | 42,007 | | | Powszechna Kasa Oszczednosci Bank Polski SA (Banks) | | | 294,269 | |
| | 6,300 | | | Powszechny Zaklad Ubezpieczen SA (Insurance) | | | 43,743 | |
| | 24,449 | | | Tauron Polska Energia SA* (Electric Utilities) | | | 16,521 | |
| | | | | | | | |
| | | | | | | 1,344,233 | |
| | |
| | Portugal – 0.1% | |
| | 119,900 | | | Mota-Engil SGPS SA (Construction & Engineering) | | | 234,084 | |
| | 29,200 | | | NOS SGPS SA (Media) | | | 194,042 | |
| | 374,992 | | | Sonae SGPS SA (Food & Staples Retailing) | | | 298,137 | |
| | | | | | | | |
| | | | | | | 726,263 | |
| | |
| | Russia – 0.3% | |
| | 38,600 | | | Aeroflot PJSC* (Airlines) | | | 79,079 | |
| | 37,500 | | | Alrosa PJSC (Metals & Mining) | | | 52,454 | |
| | 41,981 | | | Gazprom PJSC ADR (Oil, Gas & Consumable Fuels) | | | 181,017 | |
| | 3,123 | | | LUKOIL PJSC ADR (Oil, Gas & Consumable Fuels) | | | 151,910 | |
| | 1,100 | | | Magnit PJSC (Food & Staples Retailing) | | | 184,448 | |
| | 7,539 | | | Magnit PJSC GDR (Food & Staples Retailing) | | | 298,980 | |
| | 2,130 | | | MegaFon PJSC GDR (Wireless Telecommunication Services) | | | 20,286 | |
| | 7,474 | | | MMC Norilsk Nickel PJSC ADR (Metals & Mining) | | | 112,734 | |
| | 29,000 | | | Mobile TeleSystems PJSC (Wireless Telecommunication Services) | | | 102,313 | |
| | 22,100 | | | Moscow Exchange MICEX-RTS PJSC (Capital Markets) | | | 40,709 | |
| | 478 | | | Novatek OJSC GDR (Oil, Gas & Consumable Fuels) | | | 50,965 | |
| | 10,940 | | | PIK Group PJSC* (Household Durables) | | | 49,221 | |
| | 2,643 | | | Polymetal International PLC (Metals & Mining) | | | 28,817 | |
| | 6,887 | | | Rosneft PJSC GDR (Oil, Gas & Consumable Fuels) | | | 37,453 | |
| | 27,740 | | | Rostelecom PJSC (Diversified Telecommunication Services) | | | 34,611 | |
| | 3,705,000 | | | RusHydro PJSC (Electric Utilities) | | | 46,504 | |
| | 116,000 | | | Sberbank of Russia PJSC (Banks) | | | 270,007 | |
| | |
| | | | | | | | |
| | Common Stocks – (continued) | |
| | Russia – (continued) | |
| | 3,293 | | | Severstal PJSC GDR (Metals & Mining) | | | 46,435 | |
| | 123,000 | | | Sistema PJSC FC (Wireless Telecommunication Services) | | | 37,440 | |
| | 6,543 | | | Surgutneftegas OJSC ADR (Oil, Gas & Consumable Fuels) | | | 28,063 | |
| | 1,336 | | | Tatneft PJSC ADR (Oil, Gas & Consumable Fuels) | | | 44,592 | |
| | 673,000 | | | Unipro PJSC (Independent Power and Renewable Electricity Producers) | | | 30,955 | |
| | 2,256 | | | Uralkali PJSC GDR* (Chemicals) | | | 29,510 | |
| | 48,620,000 | | | VTB Bank PJSC (Banks) | | | 51,988 | |
| | 1,960 | | | X5 Retail Group NV* (Food & Staples Retailing) | | | 58,421 | |
| | | | | | | | |
| | | | | | | 2,068,912 | |
| | |
| | Singapore – 0.2% | |
| | 130,000 | | | First Resources Ltd. (Food Products) | | | 170,055 | |
| | 401,121 | | | Mapletree Commercial Trust (Equity Real Estate Investment Trusts (REITs)) | | | 441,125 | |
| | 46,800 | | | Sembcorp Industries Ltd. (Industrial Conglomerates) | | | 84,746 | |
| | 57,500 | | | Silverlake Axis Ltd. (Software) | | | 26,413 | |
| | 150,300 | | | Super Group Ltd. (Food Products) | | | 104,784 | |
| | 94,800 | | | UOL Group Ltd. (Real Estate Management & Development) | | | 385,569 | |
| | | | | | | | |
| | | | | | | 1,212,692 | |
| | |
| | South Africa – 0.8% | |
| | 3,994 | | | AngloGold Ashanti Ltd.* (Metals & Mining) | | | 54,381 | |
| | 17,205 | | | Aspen Pharmacare Holdings Ltd. (Pharmaceuticals) | | | 374,804 | |
| | 3,377 | | | AVI Ltd. (Food Products) | | | 23,733 | |
| | 3,175 | | | Barclays Africa Group Ltd. (Banks) | | | 36,844 | |
| | 7,250 | | | Barloworld Ltd. (Trading Companies & Distributors) | | | 46,829 | |
| | 4,863 | | | Bid Corp. Ltd. (Food & Staples Retailing) | | | 85,397 | |
| | 2,442 | | | Clicks Group Ltd. (Food & Staples Retailing) | | | 22,729 | |
| | 7,400 | | | DataTec Ltd. (Electronic Equipment, Instruments & Components) | | | 24,636 | |
| | 3,631 | | | Discovery Ltd. (Insurance) | | | 31,038 | |
| | 3,400 | | | EOH Holdings Ltd. (IT Services) | | | 40,320 | |
| | 13,188 | | | FirstRand Ltd. (Diversified Financial Services) | | | 47,289 | |
| | 11,027 | | | Gold Fields Ltd. (Metals & Mining) | | | 45,478 | |
| | 11,698 | | | Growthpoint Properties Ltd. (Equity Real Estate Investment Trusts (REITs)) | | | 21,814 | |
| | 5,594 | | | Impala Platinum Holdings Ltd.* (Metals & Mining) | | | 22,603 | |
| | 65,600 | | | KAP Industrial Holdings Ltd. (Industrial Conglomerates) | | | 37,705 | |
| | |
| The accompanying notes are an integral part of these financial statements. | | 35 |
GOLDMAN SACHS MULTI-MANAGER GLOBAL EQUITY FUND
Schedule of Investments (continued)
October 31, 2016
| | | | | | | | |
Shares | | | Description | | Value | |
| | | | | | | | |
| | Common Stocks – (continued) | |
| | South Africa – (continued) | |
| | 15,600 | | | Life Healthcare Group Holdings Ltd. (Health Care Providers & Services) | | $ | 41,677 | |
| | 1,691 | | | Mondi Ltd. (Paper & Forest Products) | | | 33,031 | |
| | 15,113 | | | MTN Group Ltd. (Wireless Telecommunication Services) | | | 130,536 | |
| | 12,002 | | | Nampak Ltd. (Containers & Packaging) | | | 16,738 | |
| | 1,126 | | | Naspers Ltd. (Media) | | | 188,583 | |
| | 18,094 | | | Netcare Ltd. (Health Care Providers & Services) | | | 46,467 | |
| | 2,826 | | | Pioneer Foods Group Ltd. (Food Products) | | | 34,114 | |
| | 1,812 | | | Remgro Ltd. (Diversified Financial Services) | | | 30,083 | |
| | 6,600 | | | Reunert Ltd. (Industrial Conglomerates) | | | 30,201 | |
| | 4,853 | | | Sanlam Ltd. (Insurance) | | | 23,506 | |
| | 7,098 | | | Sappi Ltd.* (Paper & Forest Products) | | | 39,495 | |
| | 7,522 | | | Sasol Ltd. (Oil, Gas & Consumable Fuels) | | | 207,720 | |
| | 170,493 | | | Shoprite Holdings Ltd. (Food & Staples Retailing) | | | 2,516,038 | |
| | 5,761 | | | Sibanye Gold Ltd. (Metals & Mining) | | | 16,026 | |
| | 4,890 | | | Standard Bank Group Ltd. (Banks) | | | 51,909 | |
| | 4,863 | | | The Bidvest Group Ltd. (Industrial Conglomerates) | | | 60,419 | |
| | 2,456 | | | The SPAR Group Ltd. (Food & Staples Retailing) | | | 34,790 | |
| | 2,593 | | | Tiger Brands Ltd. (Food Products) | | | 73,839 | |
| | 6,200 | | | Vodacom Group Ltd. (Wireless Telecommunication Services) | | | 66,891 | |
| | 4,673 | | | Woolworths Holdings Ltd. (Multiline Retail) | | | 27,064 | |
| | | | | | | | |
| | | | | | | 4,584,727 | |
| | |
| | South Korea – 2.4% | |
| | 118 | | | Amorepacific Corp. (Personal Products) | | | 36,969 | |
| | 251 | | | AMOREPACIFIC Group (Personal Products) | | | 32,401 | |
| | 3,609 | | | Celltrion, Inc.* (Biotechnology) | | | 334,357 | |
| | 208 | | | Coway Co. Ltd. (Household Durables) | | | 16,271 | |
| | 185 | | | E-MART, Inc. (Food & Staples Retailing) | | | 26,233 | |
| | 606 | | | GS Holdings Corp. (Oil, Gas & Consumable Fuels) | | | 26,960 | |
| | 1,061 | | | GS Home Shopping, Inc. (Internet & Direct Marketing Retail) | | | 162,925 | |
| | 1,486 | | | Hana Financial Group, Inc. (Banks) | | | 42,503 | |
| | 29 | | | Hanmi Pharm Co. Ltd. (Pharmaceuticals) | | | 9,156 | |
| | 151 | | | Hanmi Science Co. Ltd. (Pharmaceuticals) | | | 10,016 | |
| | 145 | | | Hyosung Corp. (Chemicals) | | | 16,938 | |
| | 190 | | | Hyundai Glovis Co. Ltd. (Air Freight & Logistics) | | | 28,760 | |
| | 2,290 | | | Hyundai Heavy Industries Co. Ltd.* (Machinery) | | | 290,419 | |
| | |
| | | | | | | | |
| | Common Stocks – (continued) | |
| | South Korea – (continued) | |
| | 154 | | | Hyundai Mobis Co. Ltd. (Auto Components) | | | 36,730 | |
| | 3,015 | | | Hyundai Motor Co. (Automobiles) | | | 368,100 | |
| | 412 | | | Hyundai Steel Co. (Metals & Mining) | | | 17,753 | |
| | 16,009 | | | Industrial Bank of Korea (Banks) | | | 184,281 | |
| | 1,820 | | | Innocean Worldwide, Inc. (Media) | | | 110,123 | |
| | 10,918 | | | Jusung Engineering Co. Ltd.* (Semiconductors & Semiconductor Equipment) | | | 90,013 | |
| | 927 | | | Kangwon Land, Inc. (Hotels, Restaurants & Leisure) | | | 30,722 | |
| | 1,220 | | | KB Financial Group, Inc. (Banks) | | | 45,160 | |
| | 11,399 | | | KB Financial Group, Inc. ADR (Banks) | | | 421,535 | |
| | 667 | | | Kia Motors Corp. (Automobiles) | | | 23,684 | |
| | 1,646 | | | KIWOOM Securities Co. Ltd. (Capital Markets) | | | 95,378 | |
| | 544 | | | Komipharm International Co. Ltd.* (Pharmaceuticals) | | | 18,378 | |
| | 455 | | | Korea Aerospace Industries Ltd. (Aerospace & Defense) | | | 25,699 | |
| | 2,770 | | | Korea Electric Power Corp. (Electric Utilities) | | | 119,832 | |
| | 79 | | | Korea Zinc Co. Ltd. (Metals & Mining) | | | 31,368 | |
| | 2,400 | | | KT Corp. ADR (Diversified Telecommunication Services) | | | 38,376 | |
| | 8,100 | | | KT&G Corp. (Tobacco) | | | 798,904 | |
| | 1,714 | | | LG Chem Ltd. (Chemicals) | | | 368,133 | |
| | 612 | | | LG Corp. (Industrial Conglomerates) | | | 32,727 | |
| | 371 | | | LG Electronics, Inc. (Household Durables) | | | 15,466 | |
| | 248 | | | LG Household & Health Care Ltd (Personal Products) | | | 177,404 | |
| | 77 | | | Lotte Chemical Corp. (Chemicals) | | | 19,346 | |
| | 76 | | | Medy-Tox, Inc. (Biotechnology) | | | 26,965 | |
| | 1,341 | | | NAVER Corp. (Internet Software & Services) | | | 1,003,290 | |
| | 31 | | | Orion Corp. (Food Products) | | | 19,348 | |
| | 13,226 | | | Paradise Co. Ltd. (Hotels, Restaurants & Leisure) | | | 149,975 | |
| | 317 | | | POSCO (Metals & Mining) | | | 65,959 | |
| | 474 | | | S-Oil Corp. (Oil, Gas & Consumable Fuels) | | | 32,392 | |
| | 390 | | | Samsung C&T Corp. (Industrial Conglomerates) | | | 54,972 | |
| | 113 | | | Samsung Electronics Co. Ltd. (Technology Hardware, Storage & Peripherals) | | | 161,627 | |
| | 6,033 | | | Samsung Electronics Co. Ltd. GDR | | | 4,252,913 | |
| | 130 | | | Samsung Fire & Marine Insurance Co. Ltd. (Insurance) | | | 33,072 | |
| | 332 | | | Samsung Life Insurance Co. Ltd. (Insurance) | | | 32,038 | |
| | 1,425 | | | Shinhan Financial Group Co. Ltd. (Banks) | | | 54,512 | |
| | 8,193 | | | Shinhan Financial Group Co. Ltd. ADR (Banks) | | | 316,578 | |
| | |
| | |
| 36 | | The accompanying notes are an integral part of these financial statements. |
GOLDMAN SACHS MULTI-MANAGER GLOBAL EQUITY FUND
| | | | | | | | |
Shares | | | Description | | Value | |
| | | | | | | | |
| | Common Stocks – (continued) | |
| | South Korea – (continued) | |
| | 159 | | | SK Holdings Co. Ltd. (Industrial Conglomerates) | | $ | 31,018 | |
| | 17,481 | | | SK Hynix, Inc. (Semiconductors & Semiconductor Equipment) | | | 625,236 | |
| | 2,518 | | | SK Innovation Co. Ltd. (Oil, Gas & Consumable Fuels) | | | 331,455 | |
| | 523 | | | SK Telecom Co. Ltd. (Wireless Telecommunication Services) | | | 102,525 | |
| | 129,500 | | | SK Telecom Co. Ltd. ADR (Wireless Telecommunication Services) | | | 2,829,575 | |
| | 208 | | | ViroMed Co. Ltd.* (Biotechnology) | | | 16,596 | |
| | 66 | | | Yuhan Corp. (Pharmaceuticals) | | | 12,101 | |
| | | | | | | | |
| | | | | | | 14,255,167 | |
| | |
| | Spain – 1.0% | |
| | 21,335 | | | Atlantica Yield PLC (Independent Power and Renewable Electricity Producers) | | | 383,603 | |
| | 504,359 | | | CaixaBank SA (Banks) | | | 1,521,847 | |
| | 19,957 | | | Ebro Foods SA (Food Products) | | | 430,340 | |
| | 29,984 | | | Gamesa Corp. Tecnologica SA (Electrical Equipment) | | | 692,283 | |
| | 40,170 | | | Industria de Diseno Textil SA (Specialty Retail) | | | 1,401,628 | |
| | 169,576 | | | Liberbank SA* (Banks) | | | 168,197 | |
| | 8,400 | | | Mediaset Espana Comunicacion SA (Media) | | | 93,737 | |
| | 38,600 | | | Melia Hotels International SA (Hotels, Restaurants & Leisure) | | | 476,591 | |
| | 53,300 | | | Merlin Properties Socimi SA (Equity Real Estate Investment Trusts (REITs)) | | | 598,014 | |
| | | | | | | | |
| | | | | | | 5,766,240 | |
| | |
| | Sweden – 0.6% | |
| | 48,345 | | | Alfa Laval AB (Machinery) | | | 693,590 | |
| | 27,413 | | | BillerudKorsnas AB (Containers & Packaging) | | | 450,161 | |
| | 19,197 | | | Boliden AB (Metals & Mining) | | | 444,918 | |
| | 44,566 | | | Castellum AB (Real Estate Management & Development) | | | 603,868 | |
| | 45,834 | | | Hemfosa Fastigheter AB (Real Estate Management & Development) | | | 430,946 | |
| | 18,118 | | | Loomis AB Class B (Commercial Services & Supplies) | | | 515,010 | |
| | 17,932 | | | Mycronic AB (Electronic Equipment, Instruments & Components) | | | 187,169 | |
| | 13,613 | | | NetEnt AB* (Internet Software & Services) | | | 107,269 | |
| | 23,690 | | | Scandic Hotels Group AB*(a) (Hotels, Restaurants & Leisure) | | | 206,644 | |
| | | | | | | | |
| | | | | | | 3,639,575 | |
| | |
| | Switzerland – 6.0% | |
| | 84,980 | | | ABB Ltd.* (Electrical Equipment) | | | 1,753,173 | |
| | 45,712 | | | Aryzta AG* (Food Products) | | | 2,008,652 | |
| | 4,680 | | | Cembra Money Bank AG* (Consumer Finance) | | | 357,705 | |
| | |
| | | | | | | | |
| | Common Stocks – (continued) | |
| | Switzerland – (continued) | |
| | 32,030 | | | Chubb Ltd. (Insurance) | | | 4,067,810 | |
| | 33,628 | | | Cie Financiere Richemont SA (Textiles, Apparel & Luxury Goods) | | | 2,161,940 | |
| | 33,537 | | | Clariant AG* (Chemicals) | | | 555,354 | |
| | 17,537 | | | EFG International AG* (Capital Markets) | | | 94,459 | |
| | 738 | | | Georg Fischer AG (Machinery) | | | 654,308 | |
| | 50,358 | | | Nestle SA (Food Products) | | | 3,651,653 | |
| | 44,375 | | | Novartis AG (Pharmaceuticals) | | | 3,149,186 | |
| | 24,559 | | | Novartis AG ADR (Pharmaceuticals) | | | 1,744,180 | |
| | 11,574 | | | Oriflame Holding AG* (Personal Products) | | | 425,222 | |
| | 12,052 | | | Roche Holding AG (Pharmaceuticals) | | | 2,768,122 | |
| | 1,242 | | | SGS SA (Professional Services) | | | 2,513,923 | |
| | 55,457 | | | Swiss Re AG (Insurance) | | | 5,147,059 | |
| | 2,353 | | | Tecan Group AG (Life Sciences Tools & Services) | | | 387,728 | |
| | 7,000 | | | Temenos Group AG* (Software) | | | 452,071 | |
| | 66,050 | | | UBS Group AG (Capital Markets) | | | 933,792 | |
| | 1,367 | | | Valora Holding AG (Specialty Retail) | | | 397,200 | |
| | 863 | | | Ypsomed Holding AG* (Health Care Equipment & Supplies) | | | 164,784 | |
| | 10,526 | | | Zurich Insurance Group AG* (Insurance) | | | 2,755,249 | |
| | | | | | | | |
| | | | | | | 36,143,570 | |
| | |
| | Taiwan – 1.5% | |
| | 70,196 | | | Advanced Semiconductor Engineering, Inc. ADR (Semiconductors & Semiconductor Equipment) | | | 410,647 | |
| | 18,000 | | | Asia Cement Corp. (Construction Materials) | | | 15,693 | |
| | 48,000 | | | AU Optronics Corp. (Electronic Equipment, Instruments & Components) | | | 18,231 | |
| | 3,000 | | | Catcher Technology Co. Ltd. (Technology Hardware, Storage & Peripherals) | | | 23,484 | |
| | 24,000 | | | Cathay Financial Holding Co. Ltd. (Insurance) | | | 31,060 | |
| | 12,000 | | | Cheng Shin Rubber Industry Co. Ltd. (Auto Components) | | | 24,415 | |
| | 90,000 | | | China Airlines Ltd. (Airlines) | | | 27,229 | |
| | 116,000 | | | China Development Financial Holding Corp. (Banks) | | | 29,027 | |
| | 46,000 | | | China Steel Corp. (Metals & Mining) | | | 33,224 | |
| | 28,000 | | | Chunghwa Telecom Co. Ltd. (Diversified Telecommunication Services) | | | 95,877 | |
| | 25,000 | | | Compal Electronics, Inc. (Technology Hardware, Storage & Peripherals) | | | 14,865 | |
| | 371,520 | | | CTBC Financial Holding Co. Ltd. (Banks) | | | 199,801 | |
| | 6,000 | | | Delta Electronics, Inc. (Electronic Equipment, Instruments & Components) | | | 31,587 | |
| | 55,000 | | | E.Sun Financial Holding Co. Ltd. (Banks) | | | 31,235 | |
| | |
| | |
| The accompanying notes are an integral part of these financial statements. | | 37 |
GOLDMAN SACHS MULTI-MANAGER GLOBAL EQUITY FUND
Schedule of Investments (continued)
October 31, 2016
| | | | | | | | |
Shares | | | Description | | Value | |
| | | | | | | | |
| | Common Stocks – (continued) | |
| | Taiwan – (continued) | |
| | 2,045 | | | Eclat Textile Co. Ltd. (Textiles, Apparel & Luxury Goods) | | $ | 23,172 | |
| | 63,000 | | | Eva Airways Corp. (Airlines) | | | 30,329 | |
| | 64,000 | | | Far Eastern New Century Corp. (Industrial Conglomerates) | | | 49,520 | |
| | 6,720 | | | Feng TAY Enterprise Co. Ltd. (Textiles, Apparel & Luxury Goods) | | | 28,030 | |
| | 42,925 | | | First Financial Holding Co. Ltd. (Banks) | | | 22,485 | |
| | 20,000 | | | Formosa Chemicals & Fibre Corp. (Chemicals) | | | 59,380 | |
| | 13,000 | | | Formosa Petrochemical Corp. (Oil, Gas & Consumable Fuels) | | | 43,405 | |
| | 19,000 | | | Formosa Plastic Corp. (Chemicals) | | | 51,345 | |
| | 20,000 | | | Fubon Financial Holding Co. Ltd. (Diversified Financial Services) | | | 28,298 | |
| | 5,000 | | | Giant Manufacturing Co. Ltd. (Leisure Products) | | | 35,366 | |
| | 2,000 | | | Ginko International Co. Ltd. (Health Care Equipment & Supplies) | | | 18,649 | |
| | 34,100 | | | Hon Hai Precision Industry Co. Ltd. (Electronic Equipment, Instruments & Components) | | | 92,110 | |
| | 93,667 | | | Hon Hai Precision Industry Co. Ltd. GDR (Electronic Equipment, Instruments & Components) | | | 506,738 | |
| | 4,000 | | | Hotai Motor Co. Ltd. (Specialty Retail) | | | 46,464 | |
| | 43,000 | | | Innolux Corp. (Electronic Equipment, Instruments & Components) | | | 14,475 | |
| | 2,000 | | | King Slide Works Co. Ltd. (Machinery) | | | 24,497 | |
| | 1,000 | | | Largan Precision Co. Ltd. (Electronic Equipment, Instruments & Components) | | | 117,975 | |
| | 21,000 | | | MediaTek, Inc. (Semiconductors & Semiconductor Equipment) | | | 159,178 | |
| | 484,788 | | | Mega Financial Holding Co. Ltd. (Banks) | | | 331,442 | |
| | 26,000 | | | Nan Ya Plastics Corp. (Chemicals) | | | 53,995 | |
| | 2,000 | | | OBI Pharma, Inc.* (Biotechnology) | | | 20,900 | |
| | 13,000 | | | Pegatron Corp. (Technology Hardware, Storage & Peripherals) | | | 35,006 | |
| | 32,000 | | | Pou Chen Corp. (Textiles, Apparel & Luxury Goods) | | | 43,177 | |
| | 5,000 | | | President Chain Store Corp. (Food & Staples Retailing) | | | 37,358 | |
| | 10,000 | | | Quanta Computer, Inc. (Technology Hardware, Storage & Peripherals) | | | 20,230 | |
| | 15,000 | | | Ruentex Industries Ltd. (Textiles, Apparel & Luxury Goods) | | | 24,147 | |
| | 10,000 | | | Siliconware Precision Industries Co. Ltd. (Semiconductors & Semiconductor Equipment) | | | 15,125 | |
| | 5,550 | | | Standard Foods Corp. (Food Products) | | | 13,716 | |
| | 19,000 | | | Taiwan Cement Corp. (Construction Materials) | | | 22,758 | |
| | 12,000 | | | Taiwan Fertilizer Co. Ltd. (Chemicals) | | | 16,053 | |
| | 15,000 | | | Taiwan Mobile Co. Ltd. (Wireless Telecommunication Services) | | | 52,483 | |
| | |
| | | | | | | | |
| | Common Stocks – (continued) | |
| | Taiwan – (continued) | |
| | 37,000 | | | Taiwan Semiconductor Manufacturing Co. Ltd. (Semiconductors & Semiconductor Equipment) | | | 222,050 | |
| | 183,182 | | | Taiwan Semiconductor Manufacturing Co. Ltd. ADR (Semiconductors & Semiconductor Equipment) | | | 5,696,960 | |
| | 40,000 | | | Teco Electric and Machinery Co. Ltd. (Electrical Equipment) | | | 35,462 | |
| | 4,000 | | | TTY Biopharm Co. Ltd. (Pharmaceuticals) | | | 15,040 | |
| | 35,000 | | | Uni-President Enterprises Corp. (Food Products) | | | 67,622 | |
| | 82,000 | | | United Microelectronics Corp. (Semiconductors & Semiconductor Equipment) | | | 30,521 | |
| | 80,000 | | | Yuanta Financial Holding Co. Ltd. (Capital Markets) | | | 29,861 | |
| | | | | | | | |
| | | | | | | 9,121,697 | |
| | |
| | Thailand – 0.3% | |
| | 10,300 | | | Advanced Info Service PCL (Wireless Telecommunication Services) | | | 45,145 | |
| | 42,485 | | | Advanced Info Service PCL ADR (Wireless Telecommunication Services) | | | 192,032 | |
| | 5,300 | | | Airports of Thailand PCL (Transportation Infrastructure) | | | 57,660 | |
| | 13,466 | | | Bangkok Bank PCL ADR (Banks) | | | 306,658 | |
| | 3,400 | | | Bangkok Bank PCL. (Banks) | | | 15,438 | |
| | 627,000 | | | Bangkok Dusit Medical Services PCL Class F (Health Care Providers & Services) | | | 408,395 | |
| | 33,500 | | | BEC World PCL (Media) | | | 19,615 | |
| | 117,900 | | | BTS Group Holdings PCL (Road & Rail) | | | 28,806 | |
| | 7,500 | | | Bumrungrad Hospital PCL (Health Care Providers & Services) | | | 39,180 | |
| | 15,300 | | | Charoen Pokphand Foods PCL (Food Products) | | | 13,760 | |
| | 27,700 | | | CP ALL PCL (Food & Staples Retailing) | | | 48,017 | |
| | 15,200 | | | Delta Electronics Thailand PCL (Electronic Equipment, Instruments & Components) | | | 34,044 | |
| | 7,300 | | | Electricity Generating PCL (Independent Power and Renewable Electricity Producers) | | | 40,629 | |
| | 13,900 | | | Glow Energy PCL (Independent Power and Renewable Electricity Producers) | | | 30,528 | |
| | 30,200 | | | Hana Microelectronics PCL (Electronic Equipment, Instruments & Components) | | | 27,580 | |
| | 98,200 | | | Home Product Center PCL (Specialty Retail) | | | 28,277 | |
| | 7,100 | | | Kasikornbank PCL (Banks) | | | 34,860 | |
| | 8,000 | | | KCE Electronics PCL (Electronic Equipment, Instruments & Components) | | | 25,607 | |
| | 32,000 | | | Minor International PCL (Hotels, Restaurants & Leisure) | | | 35,156 | |
| | |
| | |
| 38 | | The accompanying notes are an integral part of these financial statements. |
GOLDMAN SACHS MULTI-MANAGER GLOBAL EQUITY FUND
| | | | | | | | |
Shares | | | Description | | Value | |
| | | | | | | | |
| | Common Stocks – (continued) | |
| | Thailand – (continued) | |
| | 18,800 | | | PTT Exploration & Production PCL (Oil, Gas & Consumable Fuels) | | $ | 44,480 | |
| | 24,900 | | | PTT Global Chemical PCL (Chemicals) | | | 42,530 | |
| | 6,300 | | | PTT PCL (Oil, Gas & Consumable Fuels) | | | 62,032 | |
| | 12,500 | | | Ratchaburi Electricity Generating Holding PCL (Independent Power and Renewable Electricity Producers) | | | 17,860 | |
| | 39,500 | | | Thai Beverage PCL (Beverages) | | | 27,382 | |
| | 233,600 | | | Thaicom PCL (Diversified Telecommunication Services) | | | 138,659 | |
| | 3,400 | | | The Siam Cement PCL (Construction Materials) | | | 48,962 | |
| | 9,100 | | | The Siam Commercial Bank PCL (Banks) | | | 37,259 | |
| | 140,984 | | | True Corp. PCL (Diversified Telecommunication Services) | | | 27,163 | |
| | | | | | | | |
| | | | | | | 1,877,714 | |
| | |
| | Turkey – 0.2% | |
| | 21,000 | | | Akbank TAS (Banks) | | | 56,199 | |
| | 4,800 | | | Anadolu Efes Biracilik Ve Malt Sanayii AS (Beverages) | | | 29,338 | |
| | 7,668 | | | Arcelik AS (Household Durables) | | | 50,660 | |
| | 3,743 | | | Aygaz AS (Gas Utilities) | | | 13,227 | |
| | 3,796 | | | BIM Birlesik Magazalar AS (Food & Staples Retailing) | | | 61,883 | |
| | 2,912 | | | Cimsa Cimento Sanayi VE Ticaret AS (Construction Materials) | | | 14,474 | |
| | 16,053 | | | Emlak Konut Gayrimenkul Yatirim Ortakligi AS (Equity Real Estate Investment Trusts (REITs)) | | | 16,403 | |
| | 24,465 | | | Enka Insaat ve Sanayi AS (Industrial Conglomerates) | | | 37,366 | |
| | 49,600 | | | Eregli Demir ve Celik Fabrikalari TAS (Metals & Mining) | | | 67,441 | |
| | 2,085 | | | Ford Otomotiv Sanayi AS (Automobiles) | | | 21,301 | |
| | 13,100 | | | Haci Omer Sabanci Holding AS (Diversified Financial Services) | | | 39,611 | |
| | 8,363 | | | KOC Holding AS (Industrial Conglomerates) | | | 34,883 | |
| | 18,787 | | | Petkim Petrokimya Holding AS (Chemicals) | | | 25,527 | |
| | 2,161 | | | TAV Havalimanlari Holding AS (Transportation Infrastructure) | | | 8,884 | |
| | 4,800 | | | Tofas Turk Otomobil Fabrikasi AS (Automobiles) | | | 36,170 | |
| | 3,268 | | | Tupras Turkiye Petrol Rafinerileri AS (Oil, Gas & Consumable Fuels) | | | 66,647 | |
| | 12,500 | | | Turk Hava Yollari AO* (Airlines) | | | 21,990 | |
| | 27,090 | | | Turkcell Iletisim Hizmetleri AS* (Wireless Telecommunication Services) | | | 87,351 | |
| | 135,340 | | | Turkiye Garanti Bankasi A/S (Banks) | | | 368,279 | |
| | 8,400 | | | Turkiye Halk Bankasi AS (Banks) | | | 25,547 | |
| | |
| | | | | | | | |
| | Common Stocks – (continued) | |
| | Turkey – (continued) | |
| | 19,300 | | | Turkiye Is Bankasi Class C (Banks) | | | 31,339 | |
| | | | | | | | |
| | | | | | | 1,114,520 | |
| | |
| | United Arab Emirates – 0.0% | |
| | 96,000 | | | Air Arabia PJSC (Airlines) | | | 33,930 | |
| | 76,993 | | | Arabtec Holding PJSC* (Construction & Engineering) | | | 27,802 | |
| | 21,366 | | | DAMAC Properties Dubai Co. PJSC (Real Estate Management & Development) | | | 12,760 | |
| | 49,000 | | | Dubai Investments PJSC (Capital Markets) | | | 26,744 | |
| | 20,000 | | | Dubai Islamic Bank PJSC (Banks) | | | 28,492 | |
| | 85,000 | | | DXB Entertainments PJSC* (Hotels, Restaurants & Leisure) | | | 36,215 | |
| | 23,611 | | | Emaar Malls Group PJSC (Real Estate Management & Development) | | | 16,493 | |
| | 23,600 | | | Emaar Properties PJSC (Real Estate Management & Development) | | | 44,688 | |
| | | | | | | | |
| | | | | | | 227,124 | |
| | |
| | United Kingdom – 11.6% | |
| | 75,694 | | | 3i Group PLC (Capital Markets) | | | 620,479 | |
| | 36,891 | | | Abcam PLC (Biotechnology) | | | 392,860 | |
| | 39,808 | | | Aon PLC (Insurance) | | | 4,411,921 | |
| | 19,036 | | | Ashtead Group PLC (Trading Companies & Distributors) | | | 296,610 | |
| | 8,124 | | | ASOS PLC* (Internet & Direct Marketing Retail) | | | 521,509 | |
| | 530,060 | | | Aviva PLC (Insurance) | | | 2,872,276 | |
| | 21,600 | | | Babcock International Group PLC (Commercial Services & Supplies) | | | 261,097 | |
| | 344,729 | | | Balfour Beatty PLC (Construction & Engineering) | | | 1,142,951 | |
| | 1,021,446 | | | Barclays PLC (Banks) | | | 2,366,493 | |
| | 84,685 | | | Beazley PLC (Insurance) | | | 377,067 | |
| | 11,163 | | | Bellway PLC (Household Durables) | | | 323,037 | |
| | 180,145 | | | boohoo.com PLC* (Internet & Direct Marketing Retail) | | | 273,417 | |
| | 55,069 | | | British American Tobacco PLC (Tobacco) | | | 3,156,166 | |
| | 9,270 | | | Cardtronics PLC Class A* (IT Services) | | | 463,500 | |
| | 47,337 | | | Carnival PLC (Hotels, Restaurants & Leisure) | | | 2,283,200 | |
| | 362,388 | | | Cobham PLC (Aerospace & Defense) | | | 632,276 | |
| | 151,546 | | | Compass Group PLC (Hotels, Restaurants & Leisure) | | | 2,742,115 | |
| | 4,953 | | | Consort Medical PLC (Health Care Equipment & Supplies) | | | 69,252 | |
| | 67,439 | | | Diageo PLC (Beverages) | | | 1,794,993 | |
| | 2,020 | | | Direct Line Insurance Group PLC (Insurance) | | | 8,546 | |
| | 124,788 | | | Domino’s Pizza Group PLC (Hotels, Restaurants & Leisure) | | | 518,854 | |
| | 144,347 | | | Experian PLC (Professional Services) | | | 2,775,004 | |
| | |
| | |
| The accompanying notes are an integral part of these financial statements. | | 39 |
GOLDMAN SACHS MULTI-MANAGER GLOBAL EQUITY FUND
Schedule of Investments (continued)
October 31, 2016
| | | | | | | | |
Shares | | | Description | | Value | |
| | | | | | | | |
| | Common Stocks – (continued) | |
| | United Kingdom – (continued) | |
| | 17,993 | | | Ferroglobe PLC (Metals & Mining) | | $ | 166,435 | |
| | 22,154 | | | Fevertree Drinks PLC (Beverages) | | | 261,303 | |
| | 1,150,777 | | | GKN PLC (Auto Components) | | | 4,487,824 | |
| | 82,078 | | | GlaxoSmithKline PLC (Pharmaceuticals) | | | 1,621,396 | |
| | 61,423 | | | Greencore Group PLC (Food Products) | | | 247,866 | |
| | 88,289 | | | GVC Holdings PLC (Hotels, Restaurants & Leisure) | | | 752,678 | |
| | 8,407 | | | Hill & Smith Holdings PLC (Metals & Mining) | | | 103,429 | |
| | 34,826 | | | Hiscox. Ltd. (Insurance) | | | 434,866 | |
| | 40,902 | | | HomeServe PLC (Commercial Services & Supplies) | | | 305,141 | |
| | 65,903 | | | Inchcape PLC (Distributors) | | | 523,976 | |
| | 59,970 | | | Indivior PLC (Pharmaceuticals) | | | 230,326 | |
| | 76,280 | | | Informa PLC (Media) | | | 627,563 | |
| | 49,678 | | | InterContinental Hotels Group PLC ADR (Hotels, Restaurants & Leisure) | | | 1,959,797 | |
| | 138,640 | | | Intermediate Capital Group PLC (Capital Markets) | | | 1,026,926 | |
| | 18,030 | | | JD Sports Fashion PLC (Specialty Retail) | | | 335,220 | |
| | 104,408 | | | Just Eat PLC* (Internet Software & Services) | | | 717,211 | |
| | 251,600 | | | Ladbrokes PLC (Hotels, Restaurants & Leisure) | | | 410,776 | |
| | 8,332 | | | Lancashire Holdings Ltd. (Insurance) | | | 71,049 | |
| | 49,700 | | | Lavendon Group PLC (Trading Companies & Distributors) | | | 75,433 | |
| | 2,685,448 | | | Lloyds Banking Group PLC (Banks) | | | 1,875,310 | |
| | 4,491 | | | Mediclinic International PLC (Health Care Providers & Services) | | | 49,524 | |
| | 20,600 | | | Micro Focus International PLC (Software) | | | 539,422 | |
| | 106,398 | | | National Express Group PLC (Road & Rail) | | | 477,973 | |
| | 81,528 | | | Nielsen Holdings PLC (Professional Services) | | | 3,670,391 | |
| | 39,592 | | | Northgate PLC (Road & Rail) | | | 203,324 | |
| | 48,976 | | | Pagegroup PLC (Professional Services) | | | 216,864 | |
| | 10,293 | | | Petrofac Ltd. (Energy Equipment & Services) | | | 101,371 | |
| | 20,868 | | | Phoenix Group Holdings (Insurance) | | | 186,421 | |
| | 59,600 | | | Playtech PLC (Software) | | | 676,049 | |
| | 366,565 | | | Premier Oil PLC* (Oil, Gas & Consumable Fuels) | | | 295,169 | |
| | 134,673 | | | Prudential PLC (Insurance) | | | 2,197,711 | |
| | 46,849 | | | Reckitt Benckiser Group PLC (Household Products) | | | 4,191,135 | |
| | 40,086 | | | Redrow PLC (Household Durables) | | | 186,194 | |
| | 239,685 | | | Rentokil Initial PLC (Commercial Services & Supplies) | | | 668,559 | |
| | 9,645 | | | Rightmove PLC (Internet Software & Services) | | | 440,267 | |
| | |
| | | | | | | | |
| | Common Stocks – (continued) | |
| | United Kingdom – (continued) | |
| | 148,333 | | | Royal Dutch Shell PLC Class B (Oil, Gas & Consumable Fuels) | | | 3,825,879 | |
| | 51,997 | | | RPC Group PLC (Containers & Packaging) | | | 602,986 | |
| | 127,100 | | | Saga PLC (Insurance) | | | 308,293 | |
| | 21,500 | | | Savills PLC (Real Estate Management & Development) | | | 182,374 | |
| | 82,948 | | | SSE PLC (Electric Utilities) | | | 1,612,762 | |
| | 23,700 | | | SThree PLC (Professional Services) | | | 69,331 | |
| | 72,344 | | | Tullow Oil PLC* (Oil, Gas & Consumable Fuels) | | | 233,579 | |
| | 42,667 | | | UNITE Group PLC (Real Estate Management & Development) | | | 289,017 | |
| | 30,891 | | | Vedanta Resources PLC (Metals & Mining) | | | 269,912 | |
| | 33,000 | | | Vesuvius PLC (Machinery) | | | 147,295 | |
| | 596,405 | | | Vodafone Group PLC (Wireless Telecommunication Services) | | | 1,637,922 | |
| | 17,750 | | | Willis Towers Watson PLC (Insurance) | | | 2,234,725 | |
| | 98,820 | | | Worldpay Group PLC(a) (IT Services) | | | 343,442 | |
| | | | | | | | |
| | | | | | | 70,396,039 | |
| | |
| | United States – 36.0% | |
| | 5,220 | | | ABM Industries, Inc. (Commercial Services & Supplies) | | | 203,998 | |
| | 27,692 | | | Advance Auto Parts, Inc. (Specialty Retail) | | | 3,879,095 | |
| | 7,168 | | | Aegion Corp.* (Construction & Engineering) | | | 132,680 | |
| | 20,654 | | | Aetna, Inc. (Health Care Providers & Services) | | | 2,217,207 | |
| | 13,948 | | | Air Lease Corp. (Trading Companies & Distributors) | | | 422,066 | |
| | 3,225 | | | Alamo Group, Inc. (Machinery) | | | 209,367 | |
| | 17,489 | | | Allergan PLC* (Pharmaceuticals) | | | 3,654,152 | |
| | 10,085 | | | American Campus Communities, Inc. (Equity Real Estate Investment Trusts (REITs)) | | | 525,529 | |
| | 13,217 | | | American Eagle Outfitters, Inc. (Specialty Retail) | | | 225,218 | |
| | 4,481 | | | American Homes 4 Rent Class A (Equity Real Estate Investment Trusts (REITs)) | | | 94,594 | |
| | 71,100 | | | American International Group, Inc. (Insurance) | | | 4,386,870 | |
| | 11,655 | | | Ameris Bancorp (Banks) | | | 423,076 | |
| | 8,610 | | | AMERISAFE, Inc. (Insurance) | | | 478,716 | |
| | 28,258 | | | AmerisourceBergen Corp. (Health Care Providers & Services) | | | 1,987,103 | |
| | 15,265 | | | Amplify Snack Brands, Inc.* (Food Products) | | | 221,190 | |
| | 2,624 | | | Amsurg Corp.* (Health Care Providers & Services) | | | 156,784 | |
| | 4,460 | | | Analogic Corp. (Health Care Equipment & Supplies) | | | 365,051 | |
| | |
| | |
| 40 | | The accompanying notes are an integral part of these financial statements. |
GOLDMAN SACHS MULTI-MANAGER GLOBAL EQUITY FUND
| | | | | | | | |
Shares | | | Description | | Value | |
| | | | | | | | |
| | Common Stocks – (continued) | |
| | United States – (continued) | |
| | 1,590 | | | Anixter International, Inc.* (Electronic Equipment, Instruments & Components) | | $ | 104,543 | |
| | 34,951 | | | Anthem, Inc. (Health Care Providers & Services) | | | 4,259,129 | |
| | 13,007 | | | Anworth Mortgage Asset Corp. (Mortgage Real Estate Investment Trusts (REITs)) | | | 63,864 | |
| | 39,359 | | | Apple, Inc. (Technology Hardware, Storage & Peripherals) | | | 4,468,821 | |
| | 10,953 | | | Ares Commercial Real Estate Corp. (Mortgage Real Estate Investment Trusts (REITs)) | | | 143,703 | |
| | 8,750 | | | Assured Guaranty Ltd. (Insurance) | | | 261,537 | |
| | 76,371 | | | Axis Capital Holdings Ltd. (Insurance) | | | 4,350,856 | |
| | 6,160 | | | Balchem Corp. (Chemicals) | | | 467,544 | |
| | 8,375 | | | Banc of California, Inc. (Banks) | | | 111,388 | |
| | 4,185 | | | Belden, Inc. (Electronic Equipment, Instruments & Components) | | | 271,230 | |
| | 39,266 | | | Berkshire Hathaway, Inc. Class B* (Diversified Financial Services) | | | 5,666,084 | |
| | 8,250 | | | Blackbaud, Inc. (Software) | | | 506,550 | |
| | 4,660 | | | Blackstone Mortgage Trust, Inc. Class A (Mortgage Real Estate Investment Trusts (REITs)) | | | 140,732 | |
| | 7,389 | | | BMC Stock Holdings, Inc.* (Trading Companies & Distributors) | | | 122,288 | |
| | 4,713 | | | Booz Allen Hamilton Holding Corp. (IT Services) | | | 143,605 | |
| | 7,450 | | | Bristow Group, Inc. (Energy Equipment & Services) | | | 74,575 | |
| | 10,946 | | | Brooks Automation, Inc. (Semiconductors & Semiconductor Equipment) | | | 142,626 | |
| | 5,023 | | | Builders FirstSource, Inc.* (Building Products) | | | 48,572 | |
| | 1,111 | | | Cabot Corp. (Chemicals) | | | 57,928 | |
| | 13,814 | | | CalAtlantic Group, Inc. (Household Durables) | | | 446,468 | |
| | 18,940 | | | Callidus Software, Inc.* (Software) | | | 345,655 | |
| | 6,925 | | | Cantel Medical Corp. (Health Care Equipment & Supplies) | | | 493,268 | |
| | 17,120 | | | Catalent, Inc.* (Pharmaceuticals) | | | 390,507 | |
| | 19,320 | | | Cathay General Bancorp (Banks) | | | 578,634 | |
| | 8,400 | | | CEB, Inc. (Professional Services) | | | 408,660 | |
| | 46,710 | | | Cerner Corp.* (Health Care Technology) | | | 2,736,272 | |
| | 5,916 | | | Chatham Lodging Trust (Equity Real Estate Investment Trusts (REITs)) | | | 104,713 | |
| | 1,825 | | | Chemed Corp. (Health Care Providers & Services) | | | 258,091 | |
| | 74,155 | | | Cisco Systems, Inc. (Communications Equipment) | | | 2,275,075 | |
| | 10,190 | | | CLARCOR, Inc. (Machinery) | | | 633,920 | |
| | 20,589 | | | ClubCorp Holdings, Inc. (Hotels, Restaurants & Leisure) | | | 237,803 | |
| | 10,730 | | | Cognex Corp. (Electronic Equipment, Instruments & Components) | | | 553,668 | |
| | |
| | | | | | | | |
| | Common Stocks – (continued) | |
| | United States – (continued) | |
| | 32,850 | | | Cognizant Technology Solutions Corp. Class A* (IT Services) | | | 1,686,847 | |
| | 12,070 | | | Cohen & Steers, Inc. (Capital Markets) | | | 448,763 | |
| | 1,523 | | | Coherent, Inc.* (Electronic Equipment, Instruments & Components) | | | 158,575 | |
| | 2,339 | | | Colony Capital, Inc. Class A (Mortgage Real Estate Investment Trusts (REITs)) | | | 44,464 | |
| | 4,679 | | | Columbia Banking System, Inc. (Banks) | | | 154,501 | |
| | 69,140 | | | Comcast Corp. Class A (Media) | | | 4,274,235 | |
| | 4,075 | | | Compass Minerals International, Inc. (Metals & Mining) | | | 292,789 | |
| | 2,645 | | | Convergys Corp. (IT Services) | | | 77,234 | |
| | 2,041 | | | Cubic Corp. (Aerospace & Defense) | | | 87,151 | |
| | 1,126 | | | Curtiss-Wright Corp. (Aerospace & Defense) | | | 100,912 | |
| | 84,701 | | | CVS Health Corp. (Food & Staples Retailing) | | | 7,123,354 | |
| | 32,831 | | | CYS Investments, Inc. (Mortgage Real Estate Investment Trusts (REITs)) | | | 283,003 | |
| | 13,320 | | | Diplomat Pharmacy, Inc.* (Health Care Providers & Services) | | | 308,624 | |
| | 135,952 | | | Discovery Communications, Inc. Class C* (Media) | | | 3,413,755 | |
| | 43,389 | | | Dollar General Corp. (Multiline Retail) | | | 2,997,746 | |
| | 3,884 | | | Drew Industries, Inc. (Auto Components) | | | 347,812 | |
| | 6,890 | | | Dril-Quip, Inc.* (Energy Equipment & Services) | | | 327,275 | |
| | 14,285 | | | Education Realty Trust, Inc. (Equity Real Estate Investment Trusts (REITs)) | | | 608,398 | |
| | 4,992 | | | EnerSys (Electrical Equipment) | | | 325,129 | |
| | 6,620 | | | EPAM Systems, Inc.* (IT Services) | | | 426,129 | |
| | 11,023 | | | Essent Group Ltd.* (Thrifts & Mortgage Finance) | | | 291,448 | |
| | 4,639 | | | Everest Re Group Ltd. (Insurance) | | | 944,129 | |
| | 7,919 | | | ExlService Holdings, Inc.* (IT Services) | | | 348,674 | |
| | 3,546 | | | FCB Financial Holdings, Inc. Class A* (Banks) | | | 132,266 | |
| | 3,673 | | | Ferro Corp.* (Chemicals) | | | 47,602 | |
| | 8,884 | | | First American Financial Corp. (Insurance) | | | 347,009 | |
| | 639 | | | First Citizens BancShares, Inc. Class A (Banks) | | | 185,949 | |
| | 1,646 | | | First Solar, Inc.* (Semiconductors & Semiconductor Equipment) | | | 66,647 | |
| | 2,941 | | | FirstCash, Inc. (Consumer Finance) | | | 138,815 | |
| | 12,750 | | | Five Below, Inc.* (Specialty Retail) | | | 479,145 | |
| | 19,840 | | | Flotek Industries, Inc.* (Chemicals) | | | 233,715 | |
| | 17,770 | | | Forum Energy Technologies, Inc.* (Energy Equipment & Services) | | | 319,860 | |
| | 104,384 | | | Fossil Group, Inc.* (Textiles, Apparel & Luxury Goods) | | | 2,846,552 | |
| | 138,735 | | | Franklin Resources, Inc. (Capital Markets) | | | 4,669,820 | |
| | 4,219 | | | FTD Cos., Inc.* (Internet & Direct Marketing Retail) | | | 84,886 | |
| | |
| | |
| The accompanying notes are an integral part of these financial statements. | | 41 |
GOLDMAN SACHS MULTI-MANAGER GLOBAL EQUITY FUND
Schedule of Investments (continued)
October 31, 2016
| | | | | | | | |
Shares | | | Description | | Value | |
| | | | | | | | |
| | Common Stocks – (continued) | |
| | United States – (continued) | |
| | 3,598 | | | FTI Consulting, Inc.* (Professional Services) | | $ | 140,178 | |
| | 1,721 | | | G&K Services, Inc. Class A (Commercial Services & Supplies) | | | 162,979 | |
| | 120,111 | | | Gentex Corp. (Auto Components) | | | 2,031,077 | |
| | 10,580 | | | Glacier Bancorp, Inc. (Banks) | | | 298,991 | |
| | 23,395 | | | Globus Medical, Inc. Class A* (Health Care Equipment & Supplies) | | | 517,731 | |
| | 18,945 | | | Grand Canyon Education, Inc.* (Diversified Consumer Services) | | | 826,760 | |
| | 4,307 | | | Granite Construction, Inc. (Construction & Engineering) | | | 211,732 | |
| | 31,417 | | | Graphic Packaging Holding Co. (Containers & Packaging) | | | 392,712 | |
| | 933 | | | Group 1 Automotive, Inc. (Specialty Retail) | | | 56,232 | |
| | 3,582 | | | Gulfport Energy Corp.* (Oil, Gas & Consumable Fuels) | | | 86,362 | |
| | 4,023 | | | Hanmi Financial Corp. (Banks) | | | 100,575 | |
| | 14,600 | | | Healthcare Services Group, Inc. (Commercial Services & Supplies) | | | 539,762 | |
| | 25,565 | | | Heartland Express, Inc. (Road & Rail) | | | 470,396 | |
| | 7,405 | | | HEICO Corp. (Aerospace & Defense) | | | 500,282 | |
| | 5,570 | | | HEICO Corp. Class A (Aerospace & Defense) | | | 334,200 | |
| | 4,117 | | | Heidrick & Struggles International, Inc. (Professional Services) | | | 76,165 | |
| | 3,595 | | | Helen of Troy Ltd.* (Household Durables) | | | 292,992 | |
| | 9,370 | | | Hibbett Sports, Inc.* (Specialty Retail) | | | 364,024 | |
| | 3,030 | | | Hillenbrand, Inc. (Machinery) | | | 91,961 | |
| | 141,347 | | | Hilton Worldwide Holdings, Inc. (Hotels, Restaurants & Leisure) | | | 3,194,442 | |
| | 8,165 | | | HubSpot, Inc.* (Software) | | | 428,254 | |
| | 6,085 | | | IBERIABANK Corp. (Banks) | | | 399,480 | |
| | 6,230 | | | ICU Medical, Inc.* (Health Care Equipment & Supplies) | | | 867,839 | |
| | 6,423 | | | IDACORP, Inc. (Electric Utilities) | | | 503,499 | |
| | 12,105 | | | Impax Laboratories, Inc.* (Pharmaceuticals) | | | 243,310 | |
| | 13,655 | | | INC Research Holdings, Inc. Class A* (Life Sciences Tools & Services) | | | 624,033 | |
| | 1,198 | | | Infinity Property & Casualty Corp. (Insurance) | | | 98,176 | |
| | 5,067 | | | Insight Enterprises, Inc.* (Electronic Equipment, Instruments & Components) | | | 145,879 | |
| | 3,010 | | | Integra LifeSciences Holdings Corp.* (Health Care Equipment & Supplies) | | | 239,325 | |
| | 11,900 | | | Kansas City Southern (Road & Rail) | | | 1,044,344 | |
| | 16,145 | | | KapStone Paper and Packaging Corp. (Paper & Forest Products) | | | 292,870 | |
| | 4,472 | | | KAR Auction Services, Inc. (Commercial Services & Supplies) | | | 190,418 | |
| | 8,720 | | | Kindred Healthcare, Inc. (Health Care Providers & Services) | | | 85,892 | |
| | |
| | | | | | | | |
| | Common Stocks – (continued) | |
| | United States – (continued) | |
| | 3,215 | | | Korn/Ferry International (Professional Services) | | | 65,554 | |
| | 3,641 | | | LaSalle Hotel Properties (Equity Real Estate Investment Trusts (REITs)) | | | 86,474 | |
| | 3,256 | | | LifePoint Health, Inc.* (Health Care Providers & Services) | | | 194,872 | |
| | 9,603 | | | Lithia Motors, Inc. Class A (Specialty Retail) | | | 823,745 | |
| | 2,079 | | | Live Nation Entertainment, Inc.* (Media) | | | 57,526 | |
| | 10,760 | | | LogMeIn, Inc. (Internet Software & Services) | | | 1,022,200 | |
| | 11,245 | | | MACOM Technology Solutions Holdings, Inc.* (Semiconductors & Semiconductor Equipment) | | | 413,366 | |
| | 16,464 | | | Maiden Holdings Ltd. (Insurance) | | | 224,734 | |
| | 6,410 | | | MarketAxess Holdings, Inc. (Capital Markets) | | | 966,372 | |
| | 15,547 | | | Marriott International, Inc. Class A (Hotels, Restaurants & Leisure) | | | 1,068,079 | |
| | 43,251 | | | MasterCard, Inc. Class A (IT Services) | | | 4,628,722 | |
| | 27,378 | | | Matador Resources Co.* (Oil, Gas & Consumable Fuels) | | | 597,114 | |
| | 3,312 | | | MAXIMUS, Inc. (IT Services) | | | 172,423 | |
| | 57,685 | | | McKesson Corp. (Health Care Providers & Services) | | | 7,335,801 | |
| | 10,110 | | | Medidata Solutions, Inc.* (Health Care Technology) | | | 485,179 | |
| | 29,186 | | | MFA Financial, Inc. (Mortgage Real Estate Investment Trusts (REITs)) | | | 213,350 | |
| | 95,670 | | | Microsoft Corp. (Software) | | | 5,732,546 | |
| | 2,539 | | | Minerals Technologies, Inc. (Chemicals) | | | 170,621 | |
| | 10,445 | | | Mobile Mini, Inc. (Commercial Services & Supplies) | | | 264,781 | |
| | 4,300 | | | Monro Muffler Brake, Inc. (Specialty Retail) | | | 236,500 | |
| | 36,961 | | | Motorola Solutions, Inc. (Communications Equipment) | | | 2,682,629 | |
| | 2,985 | | | MTGE Investment Corp. (Mortgage Real Estate Investment Trusts (REITs)) | | | 50,894 | |
| | 4,619 | | | Multi Packaging Solutions International Ltd.* (Containers & Packaging) | | | 62,403 | |
| | 6,875 | | | National Health Investors, Inc. (Equity Real Estate Investment Trusts (REITs)) | | | 520,850 | |
| | 240,615 | | | National Oilwell Varco, Inc. (Energy Equipment & Services) | | | 7,723,741 | |
| | 8,056 | | | Nationstar Mortgage Holdings, Inc.* (Thrifts & Mortgage Finance) | | | 121,726 | |
| | 12,074 | | | Navient Corp. (Consumer Finance) | | | 154,306 | |
| | 12,851 | | | Navigant Consulting, Inc.* (Professional Services) | | | 300,713 | |
| | 6,694 | | | Nelnet, Inc. Class A (Consumer Finance) | | | 262,271 | |
| | 3,102 | | | NETGEAR, Inc.* (Communications Equipment) | | | 156,651 | |
| | |
| | |
| 42 | | The accompanying notes are an integral part of these financial statements. |
GOLDMAN SACHS MULTI-MANAGER GLOBAL EQUITY FUND
| | | | | | | | |
Shares | | | Description | | Value | |
| | | | | | | | |
| | Common Stocks – (continued) | |
| | United States – (continued) | |
| | 38,400 | | | NorthStar Realty Europe Corp. (Equity Real Estate Investment Trusts (REITs)) | | $ | 379,776 | |
| | 11,765 | | | NorthWestern Corp. (Multi-Utilities) | | | 677,076 | |
| | 2,810 | | | Nu Skin Enterprises, Inc. Class A (Personal Products) | | | 173,237 | |
| | 37,743 | | | Office Depot, Inc. (Specialty Retail) | | | 118,890 | |
| | 5,046 | | | Olin Corp. (Chemicals) | | | 110,659 | |
| | 385,069 | | | Oracle Corp. (Software) | | | 14,794,351 | |
| | 5,102 | | | Owens & Minor, Inc. (Health Care Providers & Services) | | | 165,560 | |
| | 6,210 | | | Oxford Industries, Inc. (Textiles, Apparel & Luxury Goods) | | | 389,491 | |
| | 3,666 | | | PAREXEL International Corp.* (Life Sciences Tools & Services) | | | 213,581 | |
| | 22,293 | | | Parker-Hannifin Corp. (Machinery) | | | 2,736,466 | |
| | 1,639 | | | Parsley Energy, Inc. Class A* (Oil, Gas & Consumable Fuels) | | | 53,923 | |
| | 10,975 | | | Pebblebrook Hotel Trust (Equity Real Estate Investment Trusts (REITs)) | | | 266,473 | |
| | 5,169 | | | PharMerica Corp.* (Health Care Providers & Services) | | | 123,022 | |
| | 1,869 | | | PNM Resources, Inc. (Electric Utilities) | | | 61,397 | |
| | 8,095 | | | Power Integrations, Inc. (Semiconductors & Semiconductor Equipment) | | | 521,723 | |
| | 8,944 | | | PRA Group, Inc.* (Consumer Finance) | | | 285,314 | |
| | 19,455 | | | Primoris Services Corp. (Construction & Engineering) | | | 389,684 | |
| | 9,370 | | | ProAssurance Corp. (Insurance) | | | 499,421 | |
| | 2,610 | | | Proofpoint, Inc.* (Software) | | | 204,572 | |
| | 2,981 | | | Proto Labs, Inc.* (Machinery) | | | 133,251 | |
| | 59,532 | | | Qorvo, Inc.* (Semiconductors & Semiconductor Equipment) | | | 3,312,956 | |
| | 21,602 | | | Radian Group, Inc. (Thrifts & Mortgage Finance) | | | 293,571 | |
| | 5,425 | | | RBC Bearings, Inc.* (Machinery) | | | 387,074 | |
| | 10,624 | | | RPX Corp.* (Professional Services) | | | 103,690 | |
| | 6,950 | | | RSP Permian, Inc.* (Oil, Gas & Consumable Fuels) | | | 250,895 | |
| | 78,946 | | | Sabre Corp. (IT Services) | | | 2,039,175 | |
| | 998 | | | Safety Insurance Group, Inc. (Insurance) | | | 67,565 | |
| | 2,537 | | | Scholastic Corp. (Media) | | | 97,040 | |
| | 3,598 | | | Schweitzer-Mauduit International, Inc. (Paper & Forest Products) | | | 132,802 | |
| | 9,353 | | | Select Medical Holdings Corp.* (Health Care Providers & Services) | | | 121,589 | |
| | 7,275 | | | Shire PLC ADR (Biotechnology) | | | 1,226,856 | |
| | 6,955 | | | Silgan Holdings, Inc. (Containers & Packaging) | | | 354,357 | |
| | 4,272 | | | Silver Bay Realty Trust Corp. (Equity Real Estate Investment Trusts (REITs)) | | | 71,556 | |
| | 8,131 | | | Skechers U.S.A., Inc. Class A* (Textiles, Apparel & Luxury Goods) | | | 170,995 | |
| | 57,823 | | | Skyworks Solutions, Inc. (Semiconductors & Semiconductor Equipment) | | | 4,448,902 | |
| | |
| | | | | | | | |
| | Common Stocks – (continued) | |
| | United States – (continued) | |
| | 53,064 | | | SLM Corp.* (Consumer Finance) | | | 374,101 | |
| | 3,400 | | | Southern Copper Corp. (Metals & Mining) | | | 96,526 | |
| | 21,035 | | | STAG Industrial, Inc. (Equity Real Estate Investment Trusts (REITs)) | | | 485,277 | |
| | 6,019 | | | Starwood Property Trust, Inc. (Mortgage Real Estate Investment Trusts (REITs)) | | | 133,863 | |
| | 59,481 | | | State Street Corp. (Capital Markets) | | | 4,176,161 | |
| | 3,984 | | | Steel Dynamics, Inc. (Metals & Mining) | | | 109,401 | |
| | 5,743 | | | Steven Madden Ltd.* (Textiles, Apparel & Luxury Goods) | | | 191,816 | |
| | 18,227 | | | Stifel Financial Corp.* (Capital Markets) | | | 713,405 | |
| | 6,945 | | | Sun Communities, Inc. (Equity Real Estate Investment Trusts (REITs)) | | | 534,279 | |
| | 8,720 | | | Sykes Enterprises, Inc.* (IT Services) | | | 233,173 | |
| | 1,313 | | | SYNNEX Corp. (Electronic Equipment, Instruments & Components) | | | 134,635 | |
| | 29,606 | | | T. Rowe Price Group, Inc. (Capital Markets) | | | 1,895,080 | |
| | 10,392 | | | Tailored Brands, Inc. (Specialty Retail) | | | 164,194 | |
| | 9,465 | | | Team Health Holdings, Inc.* (Health Care Providers & Services) | | | 405,575 | |
| | 6,588 | | | TeleTech Holdings, Inc. (IT Services) | | | 185,123 | |
| | 1,114 | | | Tempur Sealy International, Inc.* (Household Durables) | | | 60,234 | |
| | 5,764 | | | Teradyne, Inc. (Semiconductors & Semiconductor Equipment) | | | 134,244 | |
| | 5,270 | | | Tetra Tech, Inc. (Commercial Services & Supplies) | | | 202,631 | |
| | 9,370 | | | Texas Capital Bancshares, Inc.* (Banks) | | | 555,641 | |
| | 17,580 | | | Texas Roadhouse, Inc. (Hotels, Restaurants & Leisure) | | | 712,342 | |
| | 78,303 | | | The Bank of New York Mellon Corp. (Capital Markets) | | | 3,388,171 | |
| | 29,573 | | | The Boeing Co. (Aerospace & Defense) | | | 4,212,082 | |
| | 10,876 | | | The Finish Line, Inc. Class A (Specialty Retail) | | | 214,148 | |
| | 2,804 | | | The Hanover Insurance Group, Inc. (Insurance) | | | 213,637 | |
| | 862 | | | The Navigators Group, Inc. (Insurance) | | | 80,338 | |
| | 3,113 | | | The Priceline Group, Inc.* (Internet & Direct Marketing Retail) | | | 4,589,278 | |
| | 4,275 | | | The Sherwin-Williams Co. (Chemicals) | | | 1,046,776 | |
| | 9,730 | | | The Toro Co. (Machinery) | | | 465,872 | |
| | 22,196 | | | The Walt Disney Co. (Media) | | | 2,057,347 | |
| | 1,231 | | | Thor Industries, Inc. (Automobiles) | | | 97,631 | |
| | 18,825 | | | Time Warner, Inc. (Media) | | | 1,675,237 | |
| | 6,420 | | | Tupperware Brands Corp. (Household Durables) | | | 382,118 | |
| | 4,277 | | | Tutor Perini Corp.* (Construction & Engineering) | | | 81,477 | |
| | 26,683 | | | Two Harbors Investment Corp. (Mortgage Real Estate Investment Trusts (REITs)) | | | 222,269 | |
| | 5,070 | | | Tyler Technologies, Inc.* (Software) | | | 813,228 | |
| | |
| | |
| The accompanying notes are an integral part of these financial statements. | | 43 |
GOLDMAN SACHS MULTI-MANAGER GLOBAL EQUITY FUND
Schedule of Investments (continued)
October 31, 2016
| | | | | | | | |
Shares | | | Description | | Value | |
| | | | | | | | |
| | Common Stocks – (continued) | |
| | United States – (continued) | |
| | 10,793 | | | United Technologies Corp. (Aerospace & Defense) | | $ | 1,103,045 | |
| | 11,365 | | | UnitedHealth Group, Inc. (Health Care Providers & Services) | | | 1,606,215 | |
| | 2,493 | | | Universal Corp. (Tobacco) | | | 135,121 | |
| | 6,520 | | | Universal Forest Products, Inc. (Building Products) | | | 560,655 | |
| | 7,080 | | | US Ecology, Inc. (Commercial Services & Supplies) | | | 299,130 | |
| | 39,503 | | | Visa, Inc. Class A (IT Services) | | | 3,259,393 | |
| | 40,475 | | | Walgreens Boots Alliance, Inc. (Food & Staples Retailing) | | | 3,348,497 | |
| | 9,492 | | | Walker & Dunlop, Inc.* (Thrifts & Mortgage Finance) | | | 228,472 | |
| | 7,802 | | | Washington Federal, Inc. (Thrifts & Mortgage Finance) | | | 212,604 | |
| | 2,640 | | | WD-40 Co. (Household Products) | | | 281,490 | |
| | 12,270 | | | Webster Financial Corp. (Banks) | | | 495,708 | |
| | 6,098 | | | WESCO International, Inc.* (Trading Companies & Distributors) | | | 330,512 | |
| | 12,345 | | | West Pharmaceutical Services, Inc. (Health Care Equipment & Supplies) | | | 938,590 | |
| | 4,825 | | | Western Refining, Inc. (Oil, Gas & Consumable Fuels) | | | 139,201 | |
| | 15,285 | | | Wolverine World Wide, Inc. (Textiles, Apparel & Luxury Goods) | | | 326,335 | |
| | 11,431 | | | World Fuel Services Corp. (Oil, Gas & Consumable Fuels) | | | 460,098 | |
| | | | | | | | |
| | | | | | | 217,862,499 | |
| | |
| | TOTAL COMMON STOCKS | | | | |
| | (Cost $599,193,809) | | $ | 606,816,015 | |
| | |
| | | | | | | | |
| | Preferred Stocks – 1.0% | |
| | Brazil – 0.1% | |
| | 23,680 | | | Banco ABC Brasil SA (Banks) | | $ | 114,097 | |
| | 4,400 | | | Centrais Eletricas Brasileiras SA Class B* (Electric Utilities) | | | 37,701 | |
| | 7,800 | | | Cia Energetica de Minas Gerais (Electric Utilities) | | | 23,825 | |
| | 9,200 | | | Gerdau SA (Metals & Mining) | | | 31,762 | |
| | 6,820 | | | Itau Unibanco Holding SA (Banks) | | | 82,045 | |
| | 11,150 | | | Itausa – Investimentos Itau SA (Banks) | | | 32,975 | |
| | 9,600 | | | Lojas Americanas SA (Multiline Retail) | | | 62,256 | |
| | 35,300 | | | Petroleo Brasileiro SA* (Oil, Gas & Consumable Fuels) | | | 195,632 | |
| | 5,400 | | | Suzano Papel e Celulose SA Class A (Paper & Forest Products) | | | 19,049 | |
| | 79,100 | | | Usinas Siderurgicas de Minas Gerais SA Class A* (Metals & Mining) | | | 111,761 | |
| | 24,500 | | | Vale SA (Metals & Mining) | | | 158,344 | |
| | | | | | | | |
| | | | | | | 869,447 | |
| | |
| | | | | | | | |
| | Preferred Stocks – (continued) | |
| | Colombia – 0.0% | |
| | 2,928 | | | Grupo Argos SA (Construction Materials) | | | 17,918 | |
| | 62,552 | | | Grupo Aval Acciones y Valores SA (Banks) | | | 25,796 | |
| | 1,391 | | | Grupo de Inversiones Suramericana SA (Diversified Financial Services) | | | 17,580 | |
| | | | | | | | |
| | | | | | | 61,294 | |
| | |
| | Germany – 0.9% | |
| | 17,142 | | | Jungheinrich AG (Machinery) | | | 541,208 | |
| | 6,463 | | | Sartorius AG (Health Care Equipment & Supplies) | | | 508,745 | |
| | 32,021 | | | Volkswagen AG (Automobiles) | | | 4,414,912 | |
| | | | | | | | |
| | | | | | | 5,464,865 | |
| | |
| | Panama – 0.0% | |
| | 23,352 | | | Avianca Holdings SA (Airlines) | | | 18,640 | |
| | |
| | Russia – 0.0% | |
| | 67,200 | | | Surgutneftegas OJSC (Oil, Gas & Consumable Fuels) | | | 30,470 | |
| | 14 | | | Transneft PJSC (Oil, Gas & Consumable Fuels) | | | 33,526 | |
| | | | | | | | |
| | | | | | | 63,996 | |
| | |
| | TOTAL PREFERRED STOCKS – 1.0% | |
| | (Cost $6,419,697) | | $ | 6,478,242 | |
| | |
| | | | | | | | | | | | |
Units | | Description | | | Expiration Date | | | Value | |
| | | | | | | | | | | | |
| Right* – 0.0% | |
| United Kingdom – 0.0% | |
| 12,173 | |
| Phoenix Group Holdings
(Insurance) |
| | | 11/08/16 | | | $ | 33,077 | |
| (Cost $37,473) | |
| |
| | | | | | | | |
Shares | | | Description | | Value | |
| | Exchange Traded Fund – 0.1% | |
| | 18,600 | | | iShares MSCI Frontier 100 ETF | | $ | 460,722 | |
| | (Cost $465,694) | | | | |
| | |
| TOTAL INVESTMENTS BEFORE
SHORT-TERM INVESTMENT | | | | |
| | (Cost $606,116,673) | | $ | 613,788,056 | |
| | |
| | |
| 44 | | The accompanying notes are an integral part of these financial statements. |
GOLDMAN SACHS MULTI-MANAGER GLOBAL EQUITY FUND
| | | | | | | | | | | | |
Principal
Amount | | Interest
Rate | | | Maturity
Date | | | Value | |
| Short-term Investment(b) – 5.8% | |
| Repurchase Agreements – 5.8% | | | | | |
Joint Repurchase Agreement Account II | | | | | |
$35,100,000 | | | 0.338 | % | | | 11/01/16 | | | $ | 35,100,000 | |
| (Cost $35,100,000) | | | | | | | | | |
| |
| TOTAL INVESTMENTS – 107.2% | |
| (Cost $641,216,673) | | | $ | 648,888,056 | |
| |
LIABILITIES IN EXCESS OF
OTHER ASSETS – (7.2)% | | | | (43,835,214 | ) |
| |
| NET ASSETS – 100.0% | | | $ | 605,052,842 | |
| |
| | |
| The percentage shown for each investment category reflects the value of investments in that category as a percentage of net assets. |
* | | Non-income producing security. |
(a) | | Exempt from registration under Rule 144A of the Securities Act of 1933. Such securities may be deemed liquid by the investment adviser and may be resold, normally to qualified institutional buyers in transactions exempt from registration. Total market value of Rule 144A securities amounts to $2,168,423, which represents approximately 0.4% of net assets as of October 31, 2016. |
(b) | | Joint repurchase agreement was entered into on October 31, 2016. Additional information appears on pages 66-67. |
| | |
|
Currency Abbreviations: |
AUD | | —Australian Dollar |
CHF | | —Swiss Franc |
DKK | | —Danish Krone |
EUR | | —Euro |
GBP | | —British Pound |
HKD | | —Hong Kong Dollar |
ILS | | —Israeli Shekel |
JPY | | —Japanese Yen |
NOK | | —Norwegian Krone |
NZD | | —New Zealand Dollar |
SEK | | —Swedish Krona |
SGD | | —Singapore Dollar |
USD | | —U.S. Dollar |
| | |
Investment Abbreviations: |
ADR | | —American Depositary Receipt |
ETF | | —Exchange Traded Fund |
GDR | | —Global Depository Receipt |
PLC | | —Public Limited Company |
REIT | | —Real Estate Investment Trust |
|
| | |
| The accompanying notes are an integral part of these financial statements. | | 45 |
GOLDMAN SACHS MULTI-MANAGER GLOBAL EQUITY FUND
Schedule of Investments (continued)
October 31, 2016
|
| ADDITIONAL INVESTMENT INFORMATION |
FORWARD FOREIGN CURRENCY EXCHANGE CONTRACTS — At October 31, 2016, the Fund had the following forward foreign currency exchange contracts:
FORWARD FOREIGN CURRENCY EXCHANGE CONTRACTS WITH UNREALIZED GAIN
| | | | | | | | | | | | | | | | | | | | | | | | |
| Counterparty | | Currency
Purchased | | | Currency
Sold | | | Current
Value | | | Settlement
Date | | | Unrealized
Gain | |
Bank of America Securities LLC | | DKK | | | 894,890 | | | USD | | | 132,162 | | | $ | 132,398 | | | | 12/21/16 | | | $ | 237 | |
| | GBP | | | 391,540 | | | USD | | | 478,466 | | | | 479,860 | | | | 12/21/16 | | | | 1,394 | |
| | ILS | | | 1,725,770 | | | USD | | | 449,978 | | | | 450,418 | | | | 12/21/16 | | | | 441 | |
| | SGD | | | 92,770 | | | USD | | | 66,683 | | | | 66,703 | | | | 12/21/16 | | | | 20 | |
| | USD | | | 5,590,880 | | | AUD | | | 7,305,025 | | | | 5,549,582 | | | | 12/21/16 | | | | 41,298 | |
| | USD | | | 6,464,006 | | | CHF | | | 6,248,690 | | | | 6,334,138 | | | | 12/21/16 | | | | 129,869 | |
| | USD | | | 1,393,116 | | | DKK | | | 9,166,285 | | | | 1,356,145 | | | | 12/21/16 | | | | 36,971 | |
| | USD | | | 22,529,231 | | | EUR | | | 19,913,705 | | | | 21,913,172 | | | | 12/21/16 | | | | 616,059 | |
| | USD | | | 14,793,093 | | | GBP | | | 11,103,525 | | | | 13,608,164 | | | | 12/21/16 | | | | 1,184,930 | |
| | USD | | | 7,989,103 | | | HKD | | | 61,920,965 | | | | 7,986,870 | | | | 12/21/16 | | | | 2,232 | |
| | USD | | | 507,492 | | | ILS | | | 1,903,560 | | | | 496,821 | | | | 12/21/16 | | | | 10,672 | |
| | USD | | | 19,751,792 | | | JPY | | | 2,009,543,095 | | | | 19,204,806 | | | | 12/21/16 | | | | 546,986 | |
| | USD | | | 620,189 | | | NOK | | | 5,078,765 | | | | 614,755 | | | | 12/21/16 | | | | 5,434 | |
| | USD | | | 273,251 | | | NZD | | | 370,015 | | | | 264,083 | | | | 12/21/16 | | | | 9,168 | |
| | USD | | | 2,509,508 | | | SEK | | | 21,119,735 | | | | 2,344,561 | | | | 12/21/16 | | | | 164,947 | |
| | USD | | | 1,073,047 | | | SGD | | | 1,447,600 | | | | 1,040,839 | | | | 12/21/16 | | | | 32,208 | |
Commonwealth Bank of Australia | | USD | | | 5,555,057 | | | AUD | | | 7,261,645 | | | | 5,516,626 | | | | 12/21/16 | | | | 38,431 | |
| | USD | | | 6,470,666 | | | CHF | | | 6,248,690 | | | | 6,334,138 | | | | 12/21/16 | | | | 136,529 | |
| | USD | | | 1,393,815 | | | DKK | | | 9,166,285 | | | | 1,356,145 | | | | 12/21/16 | | | | 37,670 | |
| | USD | | | 22,525,587 | | | EUR | | | 19,913,705 | | | | 21,913,172 | | | | 12/21/16 | | | | 612,415 | |
| | USD | | | 14,652,926 | | | GBP | | | 11,000,695 | | | | 13,482,138 | | | | 12/21/16 | | | | 1,170,788 | |
| | USD | | | 7,572,376 | | | HKD | | | 58,676,525 | | | | 7,568,386 | | | | 12/21/16 | | | | 3,990 | |
| | USD | | | 508,461 | | | ILS | | | 1,903,560 | | | | 496,821 | | | | 12/21/16 | | | | 11,640 | |
| | USD | | | 18,842,271 | | | JPY | | | 1,916,447,385 | | | | 18,315,109 | | | | 12/21/16 | | | | 527,162 | |
| | USD | | | 580,751 | | | NOK | | | 4,748,525 | | | | 574,781 | | | | 12/21/16 | | | | 5,969 | |
| | USD | | | 273,097 | | | NZD | | | 370,015 | | | | 264,083 | | | | 12/21/16 | | | | 9,014 | |
| | USD | | | 2,428,276 | | | SEK | | | 20,398,705 | | | | 2,264,518 | | | | 12/21/16 | | | | 163,758 | |
| | USD | | | 1,029,380 | | | SGD | | | 1,387,300 | | | | 997,483 | | | | 12/21/16 | | | | 31,898 | |
State Street Bank and Trust | | JPY | | | 2,749,713 | | | USD | | | 26,193 | | | | 26,224 | | | | 11/04/16 | | | | 30 | |
| TOTAL | | | | | | | | | | | | | | | | | | | | | | $ | 5,532,160 | |
FORWARD FOREIGN CURRENCY EXCHANGE CONTRACTS WITH UNREALIZED LOSS
| | | | | | | | | | | | | | | | | | | | | | | | |
| Counterparty | | Currency
Purchased | | | Currency
Sold | | | Current
Value | | | Settlement
Date | | | Unrealized
Loss | |
Bank of America Securities LLC | | AUD | | | 533,570 | | | USD | | | 405,534 | | | | 405,350 | | | | 12/21/16 | | | | (184 | ) |
| | CHF | | | 457,430 | | | USD | | | 465,082 | | | | 463,685 | | | | 12/21/16 | | | | (1,396 | ) |
| | DKK | | | 738,200 | | | USD | | | 111,829 | | | | 109,216 | | | | 12/21/16 | | | | (2,613 | ) |
| | EUR | | | 118,120 | | | USD | | | 133,224 | | | | 129,980 | | | | 12/21/16 | | | | (3,244 | ) |
| | HKD | | | 4,157,520 | | | USD | | | 536,384 | | | | 536,257 | | | | 12/21/16 | | | | (126 | ) |
| | ILS | | | 125,440 | | | USD | | | 33,502 | | | | 32,739 | | | | 12/21/16 | | | | (763 | ) |
| | NZD | | | 73,810 | | | USD | | | 53,033 | | | | 52,679 | | | | 12/21/16 | | | | (354 | ) |
| | USD | | | 722,557 | | | EUR | | | 657,870 | | | | 723,924 | | | | 12/21/16 | | | | (1,367 | ) |
| | USD | | | 1,152,371 | | | JPY | | | 120,909,190 | | | | 1,155,505 | | | | 12/21/16 | | | | (3,134 | ) |
State Street Bank and Trust | | JPY | | | 12,308,727 | | | USD | | | 117,516 | | | | 117,375 | | | | 11/01/16 | | | | (143 | ) |
| | | USD | | | 24,768 | | | JPY | | | 2,601,609 | | | | 24,811 | | | | 11/04/16 | | | | (45 | ) |
| TOTAL | | | | | | | | | | | | | | | | | | | | | | $ | (13,369 | ) |
| | |
| 46 | | The accompanying notes are an integral part of these financial statements. |
GOLDMAN SACHS MULTI-MANAGER NON-CORE FIXED INCOME FUND
Schedule of Investments
October 31, 2016
| | | | | | | | | | | | | | |
Principal
Amount | | | Interest
Rate | | | Maturity
Date | | | Value | |
| | Foreign Debt Obligations – 33.7% | |
| | Sovereign – 33.7% | |
| Brazil Letras do Tesouro Nacional(a) | |
| BRL | 400,000 | | | | 0.000 | % | | | 01/01/18 | | | $ | 109,625 | |
| | 530,000 | | | | 0.000 | | | | 01/01/19 | | | | 131,263 | |
| | 2,700,000 | | | | 0.000 | | | | 01/01/20 | | | | 602,085 | |
| Brazil Notas do Tesouro Nacional | |
| | 6,555,000 | | | | 10.000 | | | | 01/01/21 | | | | 1,971,389 | |
| | 1,000,000 | | | | 10.000 | | | | 01/01/23 | | | | 295,844 | |
| | 7,110,000 | | | | 10.000 | | | | 01/01/25 | | | | 2,080,021 | |
| | 4,500,000 | | | | 10.000 | | | | 01/01/27 | | | | 1,298,864 | |
| | 529,246 | | | | 6.000 | | | | 05/15/35 | | | | 169,871 | |
| | 1,058,493 | | | | 6.000 | | | | 08/15/50 | | | | 344,172 | |
| Dominican Republic | |
| $ | 268,000 | | | | 5.875 | | | | 04/18/24 | | | | 278,050 | |
| | 390,000 | | | | 5.500 | | | | 01/27/25 | | | | 394,875 | |
| | 510,000 | | | | 6.875 | (b) | | | 01/29/26 | | | | 562,275 | |
| | 250,000 | | | | 6.875 | | | | 01/29/26 | | | | 275,625 | |
| | 630,000 | | | | 6.850 | | | | 01/27/45 | | | | 655,200 | |
| Ecuador Government International Bond | |
| | 220,000 | | | | 10.750 | (b) | | | 03/28/22 | | | | 232,650 | |
| | 850,000 | | | | 7.950 | | | | 06/20/24 | | | | 799,000 | |
| El Salvador Government International Bond | |
| | 10,000 | | | | 7.625 | | | | 02/01/41 | | | | 10,275 | |
| Federal Republic of Brazil | |
| | 100,000 | | | | 6.000 | | | | 04/07/26 | | | | 110,200 | |
| | 200,000 | | | | 10.125 | | | | 05/15/27 | | | | 293,500 | |
| | 160,000 | | | | 8.250 | | | | 01/20/34 | | | | 200,800 | |
| | 275,000 | | | | 5.000 | | | | 01/27/45 | | | | 242,687 | |
| | 400,000 | | | | 5.625 | | | | 02/21/47 | | | | 383,000 | |
| Government of Jamaica | |
| | 728,000 | | | | 8.000 | | | | 03/15/39 | | | | 849,030 | |
| Hungary Government Bond | |
| HUF | 136,490,000 | | | | 6.750 | | | | 02/24/17 | | | | 494,711 | |
| | 87,500,000 | | | | 6.750 | | | | 11/24/17 | | | | 331,775 | |
| | 9,640,000 | | | | 2.500 | | | | 06/22/18 | | | | 35,319 | |
| | 55,750,000 | | | | 3.500 | | | | 06/24/20 | | | | 212,403 | |
| | 162,710,000 | | | | 6.000 | | | | 11/24/23 | | | | 713,944 | |
| | 154,500,000 | | | | 3.000 | | | | 06/26/24 | | | | 561,483 | |
| | 242,190,000 | | | | 5.500 | | | | 06/24/25 | | | | 1,037,206 | |
| Indonesia Government Bond | |
| IDR | 2,718,000,000 | | | | 5.625 | | | | 05/15/23 | | | | 190,671 | |
| | 35,359,000,000 | | | | 8.375 | | | | 03/15/24 | | | | 2,879,287 | |
| | 6,601,000,000 | | | | 9.000 | | | | 03/15/29 | | | | 559,894 | |
| | 33,324,000,000 | | | | 8.750 | | | | 05/15/31 | | | | 2,804,139 | |
| | 2,807,000,000 | | | | 8.375 | | | | 03/15/34 | | | | 226,154 | |
| | 9,041,000,000 | | | | 8.250 | | | | 05/15/36 | | | | 724,084 | |
| Islamic Republic of Pakistan | |
| $ | 110,000 | | | | 8.250 | | | | 04/15/24 | | | | 123,718 | |
| Jordan Government International Bond(b) | |
| | 35,000 | | | | 6.125 | | | | 01/29/26 | | | | 36,663 | |
| | 415,000 | | | | 5.750 | | | | 01/31/27 | | | | 412,925 | |
| Malaysia Government Bond | |
| MYR | 365,000 | | | | 4.012 | | | | 09/15/17 | | | | 88,076 | |
| | 4,710,000 | | | | 3.654 | | | | 10/31/19 | | | | 1,136,809 | |
| | 1,760,000 | | | | 4.048 | | | | 09/30/21 | | | | 430,350 | |
| | 744,000 | | | | 3.800 | | | | 08/17/23 | | | | 179,699 | |
| | 9,794,000 | | | | 4.181 | | | | 07/15/24 | | | | 2,400,658 | |
| | |
| Foreign Debt Obligations – (continued) | |
| Sovereign – (continued) | |
| Malaysia Government Bond – (continued) | |
| MYR | 6,196,000 | | | | 3.955 | | | | 09/15/25 | | | | 1,497,305 | |
| | 194,000 | | | | 4.070 | | | | 09/30/26 | | | | 47,240 | |
| | 1,013,000 | | | | 4.245 | | | | 09/30/30 | | | | 243,651 | |
| | 790,000 | | | | 4.254 | | | | 05/31/35 | | | | 185,683 | |
| Malaysia Treasury Bill(a) | |
| | 455,000 | | | | 0.000 | | | | 03/10/17 | | | | 107,498 | |
| Mexican Udibonos | |
| MXN | 6,152,907 | | | | 4.000 | | | | 06/13/19 | | | | 339,259 | |
| Oman Government International Bond(b) | |
| $ | 140,000 | | | | 3.625 | | | | 06/15/21 | | | | 140,875 | |
| Perusahaan Penerbit SBSN | |
| | 160,000 | | | | 4.325 | | | | 05/28/25 | | | | 167,619 | |
| | 190,000 | | | | 4.550 | (b) | | | 03/29/26 | | | | 200,239 | |
| | 434,000 | | | | 4.550 | | | | 03/29/26 | | | | 457,388 | |
| Philippine Government Bond | |
| PHP | 6,780,000 | | | | 3.625 | | | | 09/09/25 | | | | 137,151 | |
| Poland Government Bond | |
| PLN | 2,928,000 | | | | 2.500 | | | | 07/25/18 | | | | 755,854 | |
| | 2,710,000 | | | | 5.500 | | | | 10/25/19 | | | | 759,311 | |
| | 80,000 | | | | 1.500 | | | | 04/25/20 | | | | 19,923 | |
| | 660,000 | | | | 5.250 | | | | 10/25/20 | | | | 186,911 | |
| | 5,390,000 | | | | 5.750 | | | | 09/23/22 | | | | 1,602,416 | |
| | 7,904,000 | | | | 3.250 | | | | 07/25/25 | | | | 2,048,825 | |
| | 3,056,000 | | | | 2.500 | | | | 07/25/26 | | | | 740,591 | |
| Provincia de Cordoba | |
| $ | 385,000 | | | | 7.125 | | | | 06/10/21 | | | | 397,512 | |
| Provincia del Chubut Argentina | |
| | 545,000 | | | | 7.750 | | | | 07/26/26 | | | | 550,450 | |
| Republic of Angola | |
| | 150,000 | | | | 9.500 | (b) | | | 11/12/25 | | | | 146,813 | |
| | 75,000 | | | | 9.500 | | | | 11/12/25 | | | | 73,406 | |
| Republic of Argentina | |
| | 160,000 | | | | 6.875 | (b) | | | 04/22/21 | | | | 172,800 | |
| | 430,000 | | | | 7.500 | (b) | | | 04/22/26 | | | | 469,775 | |
| | 150,000 | | | | 6.625 | (b) | | | 07/06/28 | | | | 153,900 | |
| EUR | 144,491 | | | | 7.820 | | | | 12/31/33 | | | | 170,511 | |
| $ | 551,001 | | | | 8.280 | | | | 12/31/33 | | | | 617,121 | |
| | 2,100,000 | | | | 0.000 | (c) | | | 12/15/35 | | | | 220,500 | |
| EUR | 475,000 | | | | 0.000 | (c) | | | 12/15/35 | | | | 53,447 | |
| $ | 681,000 | | | | 2.500 | (d) | | | 12/31/38 | | | | 463,080 | |
| | 85,000 | | | | 7.625 | (b) | | | 04/22/46 | | | | 92,650 | |
| Republic of Azerbaijan | |
| | 175,000 | | | | 4.750 | | | | 03/18/24 | | | | 180,863 | |
| Republic of Belize(d) | |
| | 150,000 | | | | 5.000 | | | | 02/20/38 | | | | 84,375 | |
| Republic of Chile | |
| CLP | 15,000,000 | | | | 5.500 | | | | 08/05/20 | | | | 24,356 | |
| Republic of Colombia | |
| COP | 1,539,000,000 | | | | 7.000 | | | | 05/04/22 | | | | 514,049 | |
| | 4,677,400,000 | | | | 10.000 | | | | 07/24/24 | | | | 1,823,028 | |
| $ | 225,000 | | | | 4.500 | (e) | | | 01/28/26 | | | | 240,187 | |
| COP | 769,200,000 | | | | 7.500 | | | | 08/26/26 | | | | 257,285 | |
| | 163,000,000 | | | | 9.850 | | | | 06/28/27 | | | | 64,607 | |
| | 3,968,300,000 | | | | 6.000 | | | | 04/28/28 | | | | 1,160,948 | |
| $ | 175,000 | | | | 7.375 | | | | 09/18/37 | | | | 224,000 | |
| | |
| | |
| The accompanying notes are an integral part of these financial statements. | | 47 |
GOLDMAN SACHS MULTI-MANAGER NON-CORE FIXED INCOME FUND
Schedule of Investments (continued)
October 31, 2016
| | | | | | | | | | | | | | |
Principal
Amount | | | Interest
Rate | | | Maturity
Date | | | Value | |
| Foreign Debt Obligations – (continued) | |
| Sovereign – (continued) | |
| Republic of Costa Rica | |
| $ | 225,000 | | | | 7.158 | % | | | 03/12/45 | | | $ | 236,250 | |
| Republic of Croatia | |
| | 225,000 | | | | 6.375 | | | | 03/24/21 | | | | 249,750 | |
| | 200,000 | | | | 5.500 | | | | 04/04/23 | | | | 218,000 | |
| | 200,000 | | | | 6.000 | | | | 01/26/24 | | | | 225,200 | |
| Republic of Ecuador | |
| | 960,000 | | | | 10.750 | | | | 03/28/22 | | | | 1,015,200 | |
| Republic of Egypt | |
| | 100,000 | | | | 5.750 | | | | 04/29/20 | | | | 102,125 | |
| | 250,000 | | | | 5.875 | | | | 06/11/25 | | | | 230,000 | |
| | 100,000 | | | | 6.875 | | | | 04/30/40 | | | | 91,000 | |
| Republic of El Salvador | |
| | 65,000 | | | | 7.375 | | | | 12/01/19 | | | | 68,494 | |
| | 100,000 | | | | 7.750 | | | | 01/24/23 | | | | 109,250 | |
| | 480,000 | | | | 5.875 | | | | 01/30/25 | | | | 475,800 | |
| | 100,000 | | | | 6.375 | | | | 01/18/27 | | | | 99,875 | |
| | 68,000 | | | | 7.650 | | | | 06/15/35 | | | | 70,550 | |
| Republic of Ghana | |
| | 600,000 | | | | 9.250 | | | | 09/15/22 | | | | 621,000 | |
| | 750,000 | | | | 8.125 | | | | 01/18/26 | | | | 718,125 | |
| Republic of Guatemala | |
| | 100,000 | | | | 4.500 | | | | 05/03/26 | | | | 101,625 | |
| Republic of Honduras | |
| | 200,000 | | | | 7.500 | | | | 03/15/24 | | | | 223,000 | |
| Republic of Indonesia | |
| | 100,000 | | | | 3.375 | | | | 04/15/23 | | | | 100,943 | |
| EUR | 120,000 | | | | 2.625 | | | | 06/14/23 | | | | 136,835 | |
| $ | 120,000 | | | | 5.875 | | | | 01/15/24 | | | | 139,190 | |
| | 165,000 | | | | 4.125 | | | | 01/15/25 | | | | 172,940 | |
| | 40,000 | | | | 4.750 | | | | 01/08/26 | | | | 43,600 | |
| IDR | 19,895,000,000 | | | | 8.375 | | | | 09/15/26 | | | | 1,638,265 | |
| EUR | 172,000 | | | | 3.750 | | | | 06/14/28 | | | | 202,738 | |
| $ | 295,000 | | | | 6.625 | | | | 02/17/37 | | | | 371,092 | |
| | 60,000 | | | | 7.750 | | | | 01/17/38 | | | | 84,149 | |
| | 225,000 | | | | 4.625 | | | | 04/15/43 | | | | 231,792 | |
| | 180,000 | | | | 5.125 | | | | 01/15/45 | | | | 195,982 | |
| Republic of Iraq(e) | |
| | 125,000 | | | | 5.800 | | | | 01/15/28 | | | | 100,625 | |
| Republic of Ivory Coast | |
| | 200,000 | | | | 6.375 | | | | 03/03/28 | | | | 208,700 | |
| | 1,187,010 | | | | 5.750 | (d)(e) | | | 12/31/32 | | | | 1,163,270 | |
| Republic of Kazakhstan | |
| | 300,000 | | | | 4.875 | | | | 10/14/44 | | | | 302,250 | |
| | 300,000 | | | | 6.500 | | | | 07/21/45 | | | | 358,500 | |
| Republic of Kenya | |
| | 400,000 | | | | 5.875 | | | | 06/24/19 | | | | 412,500 | |
| | 120,000 | | | | 6.875 | | | | 06/24/24 | | | | 119,550 | |
| Republic of Lebanon | |
| | 610,000 | | | | 6.650 | | | | 11/03/28 | | | | 592,462 | |
| Republic of Malaysia | |
| MYR | 1,321,000 | | | | 4.498 | | | | 04/15/30 | | | | 325,842 | |
| Republic of Mongolia | |
| $ | 35,000 | | | | 10.875 | | | | 04/06/21 | | | | 37,888 | |
| | 70,000 | | | | 5.125 | | | | 12/05/22 | | | | 61,584 | |
| | |
| Foreign Debt Obligations – (continued) | |
| Sovereign – (continued) | |
| Republic of Namibia(b) | |
| 55,000 | | | | 5.250 | | | | 10/29/25 | | | | 57,200 | |
| Republic of Panama | |
| | 107,000 | | | | 7.125 | | | | 01/29/26 | | | | 141,240 | |
| | 200,000 | | | | 8.875 | | | | 09/30/27 | | | | 294,250 | |
| Republic of Paraguay | |
| | 160,000 | | | | 5.000 | (b) | | | 04/15/26 | | | | 172,000 | |
| | 165,000 | | | | 6.100 | | | | 08/11/44 | | | | 181,706 | |
| Republic of Peru | |
| PEN | 679,000 | | | | 5.700 | | | | 08/12/24 | | | | 206,717 | |
| $ | 130,000 | | | | 4.125 | | | | 08/25/27 | | | | 144,463 | |
| PEN | 345,000 | | | | 6.350 | (b) | | | 08/12/28 | | | | 105,970 | |
| $ | 140,000 | | | | 8.750 | | | | 11/21/33 | | | | 220,150 | |
| PEN | 3,520,000 | | | | 6.900 | | | | 08/12/37 | | | | 1,127,342 | |
| Republic of Romania | |
| RON | 1,300,000 | | | | 5.950 | | | | 06/11/21 | | | | 367,396 | |
| | 2,505,000 | | | | 4.750 | | | | 02/24/25 | | | | 682,519 | |
| | 1,290,000 | | | | 5.800 | | | | 07/26/27 | | | | 379,834 | |
| $ | 34,000 | | | | 6.125 | | | | 01/22/44 | | | | 44,158 | |
| Republic of Senegall | |
| | 200,000 | | | | 8.750 | | | | 05/13/21 | | | | 225,000 | |
| Republic of Serbia | |
| | 250,000 | | | | 5.875 | | | | 12/03/18 | | | | 264,375 | |
| | 215,000 | | | | 7.250 | | | | 09/28/21 | | | | 246,712 | |
| Republic of Slovenia | |
| | 290,000 | | | | 4.125 | | | | 02/18/19 | | | | 303,397 | |
| | 450,000 | | | | 5.500 | | | | 10/26/22 | | | | 519,187 | |
| Republic of South Africa | |
| ZAR | 5,915,000 | | | | 8.250 | | | | 09/15/17 | | | | 441,036 | |
| | 12,808,602 | | | | 6.750 | | | | 03/31/21 | | | | 901,328 | |
| | 1,560,000 | | | | 7.750 | | | | 02/28/23 | | | | 112,039 | |
| $ | 165,000 | | | | 5.875 | | | | 09/16/25 | | | | 184,800 | |
| ZAR | 38,788,206 | | | | 10.500 | | | | 12/21/26 | | | | 3,216,038 | |
| $ | 190,000 | | | | 4.300 | | | | 10/12/28 | | | | 184,300 | |
| ZAR | 7,916,667 | | | | 8.000 | | | | 01/31/30 | | | | 537,012 | |
| | 4,943,538 | | | | 7.000 | | | | 02/28/31 | | | | 304,777 | |
| | 7,371,373 | | | | 8.250 | | | | 03/31/32 | | | | 503,492 | |
| | 8,499,916 | | | | 6.250 | | | | 03/31/36 | | | | 460,832 | |
| | 27,100,000 | | | | 6.500 | | | | 02/28/41 | | | | 1,464,307 | |
| | 5,190,000 | | | | 8.750 | | | | 02/28/48 | | | | 359,969 | |
| Republic of Sri Lanka | |
| $ | 100,000 | | | | 5.750 | (b) | | | 01/18/22 | | | | 101,625 | |
| | 105,000 | | | | 6.125 | | | | 06/03/25 | | | | 105,631 | |
| | 210,000 | | | | 6.850 | (b) | | | 11/03/25 | | | | 221,592 | |
| | 200,000 | | | | 6.825 | | | | 07/18/26 | | | | 210,969 | |
| Republic of Suriname(b) | |
| | 190,000 | | | | 9.250 | | | | 10/26/26 | | | | 198,550 | |
| Republic of Turkey | |
| TRY | 1,270,000 | | | | 0.000 | (a) | | | 12/14/16 | | | | 406,466 | |
| | 790,000 | | | | 9.000 | | | | 03/08/17 | | | | 255,379 | |
| | 4,400,000 | | | | 6.300 | | | | 02/14/18 | | | | 1,376,489 | |
| | 1,750,000 | | | | 8.500 | | | | 07/10/19 | | | | 555,102 | |
| | 920,000 | | | | 7.100 | | | | 03/08/23 | | | | 260,011 | |
| $ | 300,000 | | | | 5.750 | | | | 03/22/24 | | | | 318,750 | |
| | 160,000 | | | | 7.375 | | | | 02/05/25 | | | | 187,200 | |
| | 300,000 | | | | 4.250 | | | | 04/14/26 | | | | 287,625 | |
| | |
| | |
| 48 | | The accompanying notes are an integral part of these financial statements. |
GOLDMAN SACHS MULTI-MANAGER NON-CORE FIXED INCOME FUND
| | | | | | | | | | | | | | |
Principal
Amount | | | Interest
Rate | | | Maturity
Date | | | Value | |
| Foreign Debt Obligations – (continued) | |
| Sovereign – (continued) | |
| Republic of Turkey – (continued) | |
| $ | 330,000 | | | | 4.875 | % | | | 10/09/26 | | | $ | 328,762 | |
| | 100,000 | | | | 6.750 | | | | 05/30/40 | | | | 112,875 | |
| | 615,000 | | | | 4.875 | | | | 04/16/43 | | | | 545,812 | |
| | 620,000 | | | | 6.625 | | | | 02/17/45 | | | | 694,400 | |
| Republic of Uruguay | |
| | 140,000 | | | | 4.375 | | | | 10/27/27 | | | | 148,400 | |
| | 420,789 | | | | 5.100 | | | | 06/18/50 | | | | 418,685 | |
| Republic of Venezuela | |
| | 39,000 | | | | 7.000 | | | | 12/01/18 | | | | 23,644 | |
| | 260,000 | | | | 7.750 | | | | 10/13/19 | | | | 133,250 | |
| | 35,000 | | | | 6.000 | | | | 12/09/20 | | | | 15,750 | |
| | 45,000 | | | | 12.750 | | | | 08/23/22 | | | | 26,100 | |
| | 302,700 | | | | 9.000 | | | | 05/07/23 | | | | 137,350 | |
| | 105,000 | | | | 8.250 | | | | 10/13/24 | | | | 46,069 | |
| | 55,000 | | | | 7.650 | | | | 04/21/25 | | | | 23,513 | |
| | 100,000 | | | | 11.750 | | | | 10/21/26 | | | | 55,625 | |
| | 70,000 | | | | 9.250 | | | | 05/07/28 | | | | 32,288 | |
| | 125,000 | | | | 11.950 | | | | 08/05/31 | | | | 69,688 | |
| Republic of Zambia | |
| | 400,000 | | | | 8.500 | | | | 04/14/24 | | | | 389,000 | |
| Russian Federation Bond | |
| RUB | 41,160,000 | | | | 7.400 | | | | 06/14/17 | | | | 641,629 | |
| | 5,590,000 | | | | 7.500 | | | | 02/27/19 | | | | 86,262 | |
| | 20,887,000 | | | | 6.700 | | | | 05/15/19 | | | | 315,035 | |
| | 9,740,000 | | | | 7.600 | | | | 04/14/21 | | | | 147,964 | |
| $ | 200,000 | | | | 4.500 | | | | 04/04/22 | | | | 210,600 | |
| RUB | 39,550,000 | | | | 7.600 | | | | 07/20/22 | | | | 596,020 | |
| | 55,960,000 | | | | 7.000 | | | | 01/25/23 | | | | 817,450 | |
| | 84,443,000 | | | | 7.000 | | | | 08/16/23 | | | | 1,229,780 | |
| $ | 200,000 | | | | 4.750 | (b) | | | 05/27/26 | | | | 212,000 | |
| RUB | 19,771,000 | | | | 8.150 | | | | 02/03/27 | | | | 306,547 | |
| | 6,120,000 | | | | 7.050 | | | | 01/19/28 | | | | 86,975 | |
| $ | 136,425 | | | | 7.500 | (d) | | | 03/31/30 | | | | 165,074 | |
| | 400,000 | | | | 5.625 | | | | 04/04/42 | | | | 441,400 | |
| Socialist Republic of Vietnam | |
| | 80,000 | | | | 4.800 | | | | 11/19/24 | | | | 84,660 | |
| Thailand Government Bond | |
| THB | 11,890,000 | | | | 3.250 | | | | 06/16/17 | | | | 343,336 | |
| | 22,200,000 | | | | 3.875 | | | | 06/13/19 | | | | 669,729 | |
| | 18,680,000 | | | | 3.650 | | | | 12/17/21 | | | | 578,939 | |
| | 2,960,000 | | | | 3.625 | | | | 06/16/23 | | | | 92,676 | |
| | 23,330,000 | | | | 3.850 | | | | 12/12/25 | | | | 758,169 | |
| | 3,960,000 | | | | 3.580 | | | | 12/17/27 | | | | 126,974 | |
| | 11,989,000 | | | | 4.875 | | | | 06/22/29 | | | | 433,755 | |
| Turkey Government Bond | |
| TRY | 12,234,564 | | | | 8.000 | | | | 03/12/25 | | | | 3,542,913 | |
| Ukraine Government Bond | |
| $ | 685,000 | | | | 7.750 | | | | 09/01/19 | | | | 685,000 | |
| | 165,000 | | | | 7.750 | | | | 09/01/20 | | | | 163,350 | |
| | 45,000 | | | | 7.750 | (b) | | | 09/01/22 | | | | 44,044 | |
| | 155,000 | | | | 7.750 | | | | 09/01/23 | | | | 150,738 | |
| | 20,000 | | | | 7.750 | (b) | | | 09/01/25 | | | | 19,150 | |
| | 90,000 | | | | 7.750 | (b) | | | 09/01/26 | | | | 85,815 | |
| | 25,000 | | | | 7.750 | (b) | | | 09/01/27 | | | | 23,781 | |
| | 1,312,000 | | | | 0.000 | (c) | | | 05/31/40 | | | | 413,280 | |
| | |
| Foreign Debt Obligations – (continued) | |
| Sovereign – (continued) | |
| United Mexican States | |
| MXN | 25,462,000 | | | | 5.000 | | | | 12/11/19 | | | | 1,316,572 | |
| | 16,950,000 | | | | 6.500 | | | | 06/10/21 | | | | 916,527 | |
| $ | 334,000 | | | | 4.000 | | | | 10/02/23 | | | | 350,366 | |
| MXN | 5,750,000 | | | | 8.000 | | | | 12/07/23 | | | | 336,825 | |
| | 37,823,000 | | | | 10.000 | | | | 12/05/24 | | | | 2,482,120 | |
| | 3,500,000 | | | | 10.000 | | | | 12/05/24 | | | | 229,686 | |
| $ | 500,000 | | | | 3.600 | | | | 01/30/25 | | | | 508,750 | |
| MXN | 2,130,000 | | | | 5.750 | | | | 03/05/26 | | | | 108,431 | |
| | 4,250,000 | | | | 7.500 | | | | 06/03/27 | | | | 243,313 | |
| | 3,500,000 | | | | 8.500 | | | | 05/31/29 | | | | 215,863 | |
| | 6,080,000 | | | | 7.750 | | | | 05/29/31 | | | | 354,375 | |
| $ | 90,000 | | | | 8.300 | | | | 08/15/31 | | | | 142,650 | |
| MXN | 1,330,000 | | | | 7.750 | | | | 11/23/34 | | | | 77,700 | |
| | 11,760,000 | | | | 10.000 | | | | 11/20/36 | | | | 843,179 | |
| $ | 116,000 | | | | 6.050 | | | | 01/11/40 | | | | 137,750 | |
| MXN | 1,900,000 | | | | 7.750 | | | | 11/13/42 | | | | 112,175 | |
| $ | 280,000 | | | | 4.750 | | | | 03/08/44 | | | | 278,600 | |
| | 875,000 | | | | 4.350 | | | | 01/15/47 | | | | 827,750 | |
| | |
| | TOTAL FOREIGN DEBT OBLIGATIONS | |
| | (Cost $99,293,284) | | | $ | 102,515,435 | |
| | |
| | |
| | Corporate Obligations – 32.1% | |
| | Aerospace & Defense(b)(e) – 0.0% | |
| Bombardier, Inc. | |
| $ | 120,000 | | | | 6.000 | % | | | 10/15/22 | | | $ | 106,650 | |
| | |
| | Automotive(b)(e) – 0.2% | |
| Schaeffler Finance BV | |
| | 700,000 | | | | 4.250 | | | | 05/15/21 | | | | 717,500 | |
| | |
| | Banks – 0.2% | |
| Banco Nacional de Comercio Exterior SNC(b)(c)(e) | |
| | 140,000 | | | | 3.800 | | | | 08/11/26 | | | | 138,075 | |
| Banco Nacional de Costa Rica(b) | |
| | 120,000 | | | | 5.875 | | | | 04/25/21 | | | | 124,500 | |
| BGEO Group JSC | |
| | 125,000 | | | | 6.000 | | | | 07/26/23 | | | | 128,125 | |
| Oschadbank Via SSB #1 PLC(d) | |
| | 200,000 | | | | 9.375 | | | | 03/10/23 | | | | 194,500 | |
| | | | | | | | | | | | | | |
| | | | | | | | | | | | | 585,200 | |
| | |
| | Building Materials(e) – 0.8% | |
| American Builders & Contractors Supply Co., Inc.(b) | |
| | 640,000 | | | | 5.625 | | | | 04/15/21 | | | | 664,000 | |
| Gibraltar Industries, Inc. | |
| | 500,000 | | | | 6.250 | | | | 02/01/21 | | | | 517,500 | |
| Masonite International Corp.(b) | |
| | 1,000,000 | | | | 5.625 | | | | 03/15/23 | | | | 1,040,000 | |
| Mexico City Airport Trust(b) | |
| | 50,000 | | | | 4.250 | | | | 10/31/26 | | | | 50,750 | |
| | | | | | | | | | | | | | |
| | | | | | | | | | | | | 2,272,250 | |
| | |
| | |
| The accompanying notes are an integral part of these financial statements. | | 49 |
GOLDMAN SACHS MULTI-MANAGER NON-CORE FIXED INCOME FUND
Schedule of Investments (continued)
October 31, 2016
| | | | | | | | | | | | | | |
Principal
Amount | | | Interest
Rate | | | Maturity
Date | | | Value | |
| Corporate Obligations – (continued) | |
| | Chemicals – 0.1% | |
| OCP SA | |
| $ | 150,000 | | | | 5.625 | % | | | 04/25/24 | | | $ | 161,475 | |
| | |
| | Consumer Cyclical Services(e) – 0.7% | |
| CEB, Inc.(b) | |
| | 36,000 | | | | 5.625 | | | | 06/15/23 | | | | 35,055 | |
| Ceridian HCM Holding, Inc.(b) | |
| | 24,000 | | | | 11.000 | | | | 03/15/21 | | | | 25,290 | |
| First Data Corp.(b) | |
| | 800,000 | | | | 5.000 | | | | 01/15/24 | | | | 810,000 | |
| LSC Communications, Inc.(b) | |
| | 90,000 | | | | 8.750 | | | | 10/15/23 | | | | 88,988 | |
| Syniverse Holdings, Inc. | |
| | 245,000 | | | | 9.125 | | | | 01/15/19 | | | | 197,837 | |
| United Rentals North America, Inc. | |
| | 750,000 | | | | 5.875 | | | | 09/15/26 | | | | 774,375 | |
| | 86,000 | | | | 5.500 | | | | 05/15/27 | | | | 86,000 | |
| | | | | | | | | | | | | | |
| | | | | | | | | | | | | 2,017,545 | |
| | |
| | Consumer Noncyclical(e) – 0.2% | |
| NeuStar, Inc. | |
| | 775,000 | | | | 4.500 | | | | 01/15/23 | | | | 722,688 | |
| | |
| | Consumer Products – Household & Leisure(e) – 1.0% | |
| Newell Brands, Inc. | |
| | 667,000 | | | | 5.000 | | | | 11/15/23 | | | | 716,164 | |
| Spectrum Brands, Inc. | |
| | 1,015,000 | | | | 5.750 | | | | 07/15/25 | | | | 1,101,275 | |
| The Scotts Miracle-Gro Co.(b) | |
| | 1,200,000 | | | | 6.000 | | | | 10/15/23 | | | | 1,278,000 | |
| | | | | | | | | | | | | | |
| | | | | | | | | | | | | 3,095,439 | |
| | |
| | Diversified Financial Services – 0.4% | |
| Bankrate, Inc.(b)(e) | |
| | 700,000 | | | | 6.125 | | | | 08/15/18 | | | | 703,500 | |
| Ukreximbank Via Biz Finance PLC | |
| | 375,000 | | | | 9.625 | | | | 04/27/22 | | | | 369,375 | |
| | 200,000 | | | | 9.750 | | | | 01/22/25 | | | | 192,500 | |
| | | | | | | | | | | | | | |
| | | | | | | | | | | | | 1,265,375 | |
| | |
| | Energy – 1.8% | |
| Blue Racer Midstream LLC/Blue Racer Finance Corp.(b)(e) | |
| | 1,300,000 | | | | 6.125 | | | | 11/15/22 | | | | 1,278,875 | |
| California Resources Corp.(b)(e) | |
| | 301,000 | | | | 8.000 | | | | 12/15/22 | | | | 204,680 | |
| CITGO Petroleum Corp.(b)(e) | |
| | 500,000 | | | | 6.250 | | | | 08/15/22 | | | | 504,375 | |
| Pertamina Persero PT | |
| | 90,000 | | | | 4.875 | | | | 05/03/22 | | | | 95,951 | |
| | 145,000 | | | | 4.300 | | | | 05/20/23 | | | | 150,304 | |
| Petrobras Global Finance BV | |
| | 1,235,000 | | | | 8.375 | | | | 05/23/21 | | | | 1,366,280 | |
| Petroleos de Venezuela SA | |
| | 147,442 | | | | 9.000 | | | | 11/17/21 | | | | 72,984 | |
| | 792,975 | | | | 6.000 | | | | 05/16/24 | | | | 297,366 | |
| | 263,354 | | | | 6.000 | | | | 11/15/26 | | | | 96,901 | |
| | |
| Corporate Obligations – (continued) | |
| | Energy – (continued) | |
| Petroleos Mexicanos | |
| 85,000 | | | | 6.375 | | | | 02/04/21 | | | | 92,778 | |
| | 130,000 | | | | 4.625 | (b) | | | 09/21/23 | | | | 129,061 | |
| | 400,000 | | | | 6.875 | | | | 08/04/26 | | | | 445,760 | |
| | 56,000 | | | | 6.750 | (b) | | | 09/21/47 | | | | 55,440 | |
| Western Refining, Inc.(e) | |
| | 202,000 | | | | 6.250 | | | | 04/01/21 | | | | 202,000 | |
| Whiting Petroleum Corp.(e) | |
| | 395,000 | | | | 6.250 | | | | 04/01/23 | | | | 363,400 | |
| | | | | | | | | | | | | | |
| | | | | | | | | | | | | 5,356,155 | |
| | |
| | Energy – Exploration & Production – 1.6% | |
| Chesapeake Energy Corp.(b)(e) | |
| | 360,000 | | | | 8.000 | | | | 12/15/22 | | | | 365,400 | |
| Continental Resources, Inc.(e) | |
| | 115,000 | | | | 5.000 | | | | 09/15/22 | | | | 112,988 | |
| | 439,000 | | | | 4.500 | | | | 04/15/23 | | | | 421,440 | |
| Diamondback Energy, Inc.(b)(e) | |
| | 145,000 | | | | 4.750 | | | | 11/01/24 | | | | 145,000 | |
| Extraction Oil & Gas Holdings LLC/Extraction Finance Corp.(b)(e) | |
| | 565,000 | | | | 7.875 | | | | 07/15/21 | | | | 594,662 | |
| Gulfport Energy Corp.(b)(e) | |
| | 200,000 | | | | 6.000 | | | | 10/15/24 | | | | 204,000 | |
| Halcon Resources Corp.(b)(e) | |
| | 375,000 | | | | 8.625 | | | | 02/01/20 | | | | 378,750 | |
| KazMunayGas National Co. JSC | |
| | 190,000 | | | | 9.125 | | | | 07/02/18 | | | | 208,023 | |
| | 200,000 | | | | 7.000 | | | | 05/05/20 | | | | 222,000 | |
| | 275,000 | | | | 6.375 | | | | 04/09/21 | | | | 302,512 | |
| Linn Energy LLC/Linn Energy Finance Corp.(e)(f) | |
| | 955,000 | | | | 6.250 | | | | 11/01/19 | | | | 317,538 | |
| MEG Energy Corp.(b)(e) | |
| | 450,000 | | | | 6.375 | | | | 01/30/23 | | | | 369,000 | |
| | 150,000 | | | | 7.000 | | | | 03/31/24 | | | | 123,000 | |
| Memorial Production Partners LP/Memorial Production Finance
Corp.(e) |
|
| | 200,000 | | | | 7.625 | | | | 05/01/21 | | | | 82,000 | |
| Midstates Petroleum Co., Inc./Midstates Petroleum Co. LLC(e)(f) | |
| | 700,000 | | | | 10.000 | | | | 06/01/20 | | | | — | |
| | 72,000 | | | | 10.750 | | | | 10/01/20 | | | | 720 | |
| | 300,000 | | | | 9.250 | | | | 06/01/21 | | | | 3,000 | |
| Newfield Exploration Co.(e) | |
| | 380,000 | | | | 5.375 | | | | 01/01/26 | | | | 389,500 | |
| PDC Energy, Inc.(e) | |
| | 500,000 | | | | 7.750 | | | | 10/15/22 | | | | 531,250 | |
| | 63,000 | | | | 6.125 | (b) | | | 09/15/24 | | | | 65,205 | |
| Peabody Energy Corp.(f) | |
| | 40,000 | | | | 6.250 | | | | 11/15/21 | | | | 17,700 | |
| | | | | | | | | | | | | | |
| | | | | | | | | | | | | 4,853,688 | |
| | |
| | Energy – Services(b)(e) – 0.3% | |
| Hiland Partners Holdings LLC/Hiland Partners Finance Corp. | |
| | 757,000 | | | | 5.500 | | | | 05/15/22 | | | | 785,058 | |
| | |
| | Entertainment(b)(e) – 0.3% | |
| Six Flags Entertainment Corp. | |
| | 700,000 | | | | 4.875 | | | | 07/31/24 | | | | 700,875 | |
| | |
| | |
| 50 | | The accompanying notes are an integral part of these financial statements. |
GOLDMAN SACHS MULTI-MANAGER NON-CORE FIXED INCOME FUND
| | | | | | | | | | | | | | |
Principal
Amount | | | Interest
Rate | | | Maturity
Date | | | Value | |
| Corporate Obligations – (continued) | |
| | Entertainment(b)(e) – (continued) | |
| WMG Acquisition Corp. | |
| $ | 110,000 | | | | 5.000 | % | | | 08/01/23 | | | $ | 111,650 | |
| | | | | | | | | | | | | | |
| | | | | | | | | | | | | 812,525 | |
| | |
| | Entertainment & Leisure(e) – 1.0% | |
| AMC Entertainment, Inc. | |
| | 200,000 | | | | 5.875 | | | | 02/15/22 | | | | 207,750 | |
| | 294,000 | | | | 5.750 | | | | 06/15/25 | | | | 294,735 | |
| Cinemark USA, Inc. | |
| | 1,000,000 | | | | 4.875 | | | | 06/01/23 | | | | 995,000 | |
| ClubCorp Club Operations, Inc.(b) | |
| | 700,000 | | | | 8.250 | | | | 12/15/23 | | | | 747,250 | |
| Sabre GLBL, Inc.(b) | |
| | 800,000 | | | | 5.250 | | | | 11/15/23 | | | | 816,000 | |
| | | | | | | | | | | | | | |
| | | | | | | | | | | | | 3,060,735 | |
| | |
| | Finance – 0.8% | |
| Ally Financial, Inc. | |
| | 1,000,000 | | | | 4.125 | | | | 03/30/20 | | | | 1,011,250 | |
| CIT Group, Inc.(b) | |
| | 500,000 | | | | 5.500 | | | | 02/15/19 | | | | 526,250 | |
| Icahn Enterprises LP/Icahn Enterprises Finance Corp.(e) | |
| | 1,000,000 | | | | 5.875 | | | | 02/01/22 | | | | 951,250 | |
| | | | | | | | | | | | | | |
| | | | | | | | | | | | | 2,488,750 | |
| | |
| | Finance Insurance(b)(e) – 0.2% | |
| HUB International Ltd. | |
| | 200,000 | | | | 9.250 | | | | 02/15/21 | | | | 208,000 | |
| | 400,000 | | | | 7.875 | | | | 10/01/21 | | | | 409,000 | |
| | | | | | | | | | | | | | |
| | | | | | | | | | | | | 617,000 | |
| | |
| | Food & Beverage(e) – 0.2% | |
| B&G Foods, Inc. | |
| | 700,000 | | | | 4.625 | | | | 06/01/21 | | | | 721,000 | |
| | |
| | Gaming – 1.1% | |
| GLP Capital LP/GLP Financing II, Inc. | |
| | 250,000 | | | | 4.375 | | | | 04/15/21 | | | | 263,437 | |
| | 714,000 | | | | 5.375 | | | | 04/15/26 | | | | 760,410 | |
| MGM Growth Properties Operating Partnership LP/MGP Finance
Co-Issuer, Inc.(b)(e) |
|
| | 170,000 | | | | 5.625 | | | | 05/01/24 | | | | 181,050 | |
| MGM Resorts International | |
| | 1,000,000 | | | | 6.625 | | | | 12/15/21 | | | | 1,115,000 | |
| Seminole Hard Rock Entertainment, Inc./Seminole Hard Rock
International LLC(b)(e) |
|
| | 1,000,000 | | | | 5.875 | | | | 05/15/21 | | | | 990,000 | |
| | | | | | | | | | | | | | |
| | | | | | | | | | | | | 3,309,897 | |
| | |
| | Health Care – Medical Products – 0.8% | |
| DJO Finco, Inc./DJO Finance LLC/DJO Finance Corp.(b)(e) | |
| | 191,000 | | | | 8.125 | | | | 06/15/21 | | | | 177,630 | |
| Fresenius Medical Care US Finance II, Inc.(b) | |
| | 700,000 | | | | 5.875 | | | | 01/31/22 | | | | 793,625 | |
| Grifols Worldwide Operations Ltd.(e) | |
| | 965,000 | | | | 5.250 | | | | 04/01/22 | | | | 1,008,425 | |
| | |
| Corporate Obligations – (continued) | |
| | Health Care – Medical Products – (continued) | |
| Kinetic Concepts, Inc.(b)(e) | |
| 500,000 | | | | 7.875 | | | | 02/15/21 | | | | 541,250 | |
| | | | | | | | | | | | | | |
| | | | | | | | | | | | | 2,520,930 | |
| | |
| | Health Care – Pharmaceuticals – 0.7% | |
| Mallinckrodt International Finance SA | |
| | 678,000 | | | | 4.750 | | | | 04/15/23 | | | | 584,775 | |
| Mallinckrodt International Finance SA/Mallinckrodt CB LLC(b)(e) | |
| | 300,000 | | | | 5.500 | | | | 04/15/25 | | | | 277,500 | |
| Quintiles IMS, Inc.(b)(e) | |
| | 1,000,000 | | | | 4.875 | | | | 05/15/23 | | | | 1,031,250 | |
| Valeant Pharmaceuticals International, Inc.(b)(e) | |
| | 187,000 | | | | 6.125 | | | | 04/15/25 | | | | 147,730 | |
| | | | | | | | | | | | | | |
| | | | | | | | | | | | | 2,041,255 | |
| | |
| | Health Care – Services – 1.8% | |
| Acadia Healthcare Co., Inc.(e) | |
| | 330,000 | | | | 5.625 | | | | 02/15/23 | | | | 330,412 | |
| Amsurg Corp.(e) | |
| | 1,000,000 | | | | 5.625 | | | | 07/15/22 | | | | 1,022,500 | |
| BioScrip, Inc.(e) | |
| | 535,000 | | | | 8.875 | | | | 02/15/21 | | | | 494,875 | |
| Centene Corp.(e) | |
| | 235,000 | | | | 5.625 | | | | 02/15/21 | | | | 247,044 | |
| | 235,000 | | | | 6.125 | | | | 02/15/24 | | | | 249,688 | |
| | 380,000 | | | | 4.750 | | | | 01/15/25 | | | | 379,050 | |
| DaVita, Inc.(e) | |
| | 1,000,000 | | | | 5.125 | | | | 07/15/24 | | | | 972,500 | |
| | 210,000 | | | | 5.000 | | | | 05/01/25 | | | | 203,700 | |
| HCA, Inc. | |
| | 114,000 | | | | 5.375 | | | | 02/01/25 | | | | 116,565 | |
| | 900,000 | | | | 5.250 | | | | 04/15/25 | | | | 942,750 | |
| | 133,000 | | | | 7.690 | | | | 06/15/25 | | | | 148,960 | |
| IASIS Healthcare LLC/IASIS Capital Corp.(e) | |
| | 280,000 | | | | 8.375 | | | | 05/15/19 | | | | 270,900 | |
| | | | | | | | | | | | | | |
| | | | | | | | | | | | | 5,378,944 | |
| | |
| | Internet(e) – 0.5% | |
| Zayo Group LLC/Zayo Capital, Inc. | |
| | 1,500,000 | | | | 6.375 | | | | 05/15/25 | | | | 1,576,875 | |
| | |
| | Lodging(e) – 0.3% | |
| Interval Acquisition Corp. | |
| | 1,000,000 | | | | 5.625 | | | | 04/15/23 | | | | 1,031,250 | |
| | |
| | Machinery(b) – 0.1% | |
| Boart Longyear Management Pty Ltd. | |
| | 500,000 | | | | 10.000 | | | | 10/01/18 | | | | 353,125 | |
| | |
| | Media – Broadcasting & Radio(e) – 2.1% | |
| AMC Networks, Inc. | |
| | 1,000,000 | | | | 5.000 | | | | 04/01/24 | | | | 1,017,500 | |
| Gray Television, Inc.(b) | |
| | 250,000 | | | | 5.125 | | | | 10/15/24 | | | | 243,125 | |
| Nexstar Escrow Corp.(b) | |
| | 1,000,000 | | | | 5.625 | | | | 08/01/24 | | | | 992,500 | |
| | |
| | |
| The accompanying notes are an integral part of these financial statements. | | 51 |
GOLDMAN SACHS MULTI-MANAGER NON-CORE FIXED INCOME FUND
Schedule of Investments (continued)
October 31, 2016
| | | | | | | | | | | | | | |
Principal
Amount | | | Interest
Rate | | | Maturity
Date | | | Value | |
| Corporate Obligations – (continued) | |
| | Media – Broadcasting & Radio(e) – (continued) | |
| Sinclair Television Group, Inc.(b) | |
| $ | 1,000,000 | | | | 5.625 | % | | | 08/01/24 | | | $ | 1,015,000 | |
| | 240,000 | | | | 5.875 | | | | 03/15/26 | | | | 246,000 | |
| Sirius XM Radio, Inc.(b) | |
| | 1,200,000 | | | | 4.625 | | | | 05/15/23 | | | | 1,206,000 | |
| Townsquare Media, Inc.(b) | |
| | 442,000 | | | | 6.500 | | | | 04/01/23 | | | | 442,552 | |
| Univision Communications, Inc.(b) | |
| | 1,200,000 | | | | 5.125 | | | | 02/15/25 | | | | 1,203,000 | |
| | | | | | | | | | | | | | |
| | | | | | | | | | | | | 6,365,677 | |
| | |
| | Media – Cable – 2.2% | |
| Altice US Finance I Corp.(b)(e) | |
| | 900,000 | | | | 5.375 | | | | 07/15/23 | | | | 922,500 | |
| CCO Holdings LLC/CCO Holdings Capital Corp.(e) | |
| | 600,000 | | | | 5.125 | | | | 02/15/23 | | | | 621,000 | |
| Charter Communications Operating LLC/Charter
Communications Operating Capital(b)(e) |
|
| | 1,000,000 | | | | 4.908 | | | | 07/23/25 | | | | 1,078,551 | |
| CSC Holdings LLC | |
| | 1,100,000 | | | | 6.750 | | | | 11/15/21 | | | | 1,157,750 | |
| | 100,000 | | | | 5.250 | | | | 06/01/24 | | | | 93,500 | |
| SFR Group SA(b)(e) | |
| | 200,000 | | | | 6.000 | | | | 05/15/22 | | | | 204,500 | |
| | 1,000,000 | | | | 6.250 | | | | 05/15/24 | | | | 1,008,750 | |
| Videotron Ltd. | |
| | 600,000 | | | | 5.000 | | | | 07/15/22 | | | | 626,250 | |
| Virgin Media Secured Finance PLC(b)(e) | |
| | 1,100,000 | | | | 5.250 | | | | 01/15/26 | | | | 1,090,375 | |
| | | | | | | | | | | | | | |
| | | | | | | | | | | | | 6,803,176 | |
| | |
| | Media – Non Cable(e) – 1.4% | |
| Lee Enterprises, Inc.(b) | |
| | 230,000 | | | | 9.500 | | | | 03/15/22 | | | | 236,325 | |
| LIN Television Corp. | |
| | 800,000 | | | | 6.375 | | | | 01/15/21 | | | | 826,000 | |
| Nielsen Finance LLC/Nielsen Finance Co.(b) | |
| | 990,000 | | | | 5.000 | | | | 04/15/22 | | | | 1,004,850 | |
| Outfront Media Capital LLC/Outfront Media Capital Corp. | |
| | 1,090,000 | | | | 5.875 | | | | 03/15/25 | | | | 1,133,600 | |
| VeriSign, Inc. | |
| | 1,000,000 | | | | 4.625 | | | | 05/01/23 | | | | 1,025,000 | |
| | | | | | | | | | | | | | |
| | | | | | | | | | | | | 4,225,775 | |
| | |
| | Metals & Mining(e) – 0.8% | |
| Constellium NV(b) | |
| | 120,000 | | | | 5.750 | | | | 05/15/24 | | | | 108,300 | |
| First Quantum Minerals Ltd.(b) | |
| | 322,000 | | | | 7.000 | | | | 02/15/21 | | | | 305,498 | |
| Freeport-McMoRan, Inc. | |
| | 247,000 | | | | 3.875 | | | | 03/15/23 | | | | 223,535 | |
| | 240,000 | | | | 5.400 | | | | 11/14/34 | | | | 206,700 | |
| Hecla Mining Co. | |
| | 500,000 | | | | 6.875 | | | | 05/01/21 | | | | 512,500 | |
| New Gold, Inc.(b) | |
| | 645,000 | | | | 6.250 | | | | 11/15/22 | | | | 654,675 | |
| | |
| Corporate Obligations – (continued) | |
| | Metals & Mining(e) – (continued) | |
| Oshkosh Corp. | |
| 41,000 | | | | 5.375 | | | | 03/01/25 | | | | 42,794 | |
| The Hillman Group, Inc.(b) | |
| | 525,000 | | | | 6.375 | | | | 07/15/22 | | | | 489,562 | |
| | | | | | | | | | | | | | |
| | | | | | | | | | | | | 2,543,564 | |
| | |
| | Packaging – 0.9% | |
| Ardagh Packaging Finance PLC/Ardagh Holdings USA, Inc.(b)(e) | |
| | 350,000 | | | | 7.250 | | | | 05/15/24 | | | | 369,250 | |
| Ball Corp. | |
| | 775,000 | | | | 5.250 | | | | 07/01/25 | | | | 825,375 | |
| Owens-Brockway Glass Container, Inc.(b) | |
| | 500,000 | | | | 5.875 | | | | 08/15/23 | | | | 531,250 | |
| Sealed Air Corp.(b)(e) | |
| | 1,000,000 | | | | 5.125 | | | | 12/01/24 | | | | 1,065,000 | |
| | | | | | | | | | | | | | |
| | | | | | | | | | | | | 2,790,875 | |
| | |
| | Pipelines – 1.9% | |
| Genesis Energy LP/Genesis Energy Finance Corp.(e) | |
| | 283,000 | | | | 6.750 | | | | 08/01/22 | | | | 292,905 | |
| | 161,000 | | | | 6.000 | | | | 05/15/23 | | | | 161,805 | |
| | 500,000 | | | | 5.625 | | | | 06/15/24 | | | | 495,000 | |
| MPLX LP(e) | |
| | 500,000 | | | | 4.875 | | | | 12/01/24 | | | | 522,926 | |
| ONEOK, Inc.(e) | |
| | 375,000 | | | | 7.500 | | | | 09/01/23 | | | | 429,844 | |
| Regency Energy Partners LP/Regency Energy Finance Corp.(e) | |
| | 1,000,000 | | | | 5.000 | | | | 10/01/22 | | | | 1,073,130 | |
| Sabine Pass Liquefaction LLC(e) | |
| | 800,000 | | | | 5.625 | | | | 02/01/21 | | | | 842,000 | |
| | 300,000 | | | | 5.625 | | | | 03/01/25 | | | | 317,250 | |
| Southern Gas Corridor CJSC | |
| | 470,000 | | | | 6.875 | | | | 03/24/26 | | | | 528,750 | |
| Summit Midstream Holdings LLC/Summit Midstream Finance
Corp.(e) |
|
| | 742,000 | | | | 5.500 | | | | 08/15/22 | | | | 719,740 | |
| Targa Resources Partners LP/Targa Resources Partners Finance
Corp.(e) |
|
| | 500,000 | | | | 5.250 | | | | 05/01/23 | | | | 497,500 | |
| | | | | | | | | | | | | | |
| | | | | | | | | | | | | 5,880,850 | |
| | |
| | Real Estate(e) – 0.6% | |
| Communications Sales & Leasing, Inc./CSL Capital LLC(b) | |
| | 550,000 | | | | 6.000 | | | | 04/15/23 | | | | 570,625 | |
| RHP Hotel Properties LP/RHP Finance Corp. | |
| | 940,000 | | | | 5.000 | | | | 04/15/23 | | | | 956,450 | |
| The GEO Group, Inc. | |
| | 347,000 | | | | 6.000 | | | | 04/15/26 | | | | 300,155 | |
| | | | | | | | | | | | | | |
| | | | | | | | | | | | | 1,827,230 | |
| | |
| | Retailers – 1.0% | |
| Dollar Tree, Inc.(e) | |
| | 1,000,000 | | | | 5.750 | | | | 03/01/23 | | | | 1,065,000 | |
| GameStop Corp.(b)(e) | |
| | 600,000 | | | | 5.500 | | | | 10/01/19 | | | | 618,000 | |
| JC Penney Corp., Inc.(b)(e) | |
| | 200,000 | | | | 5.875 | | | | 07/01/23 | | | | 206,000 | |
| | |
| | |
| 52 | | The accompanying notes are an integral part of these financial statements. |
GOLDMAN SACHS MULTI-MANAGER NON-CORE FIXED INCOME FUND
| | | | | | | | | | | | | | |
Principal
Amount | | | Interest
Rate | | | Maturity
Date | | | Value | |
| Corporate Obligations – (continued) | |
| | Retailers – (continued) | |
| L Brands, Inc. | |
| $ | 341,000 | | | | 5.625 | % | | | 02/15/22 | | | $ | 375,100 | |
| | 795,000 | | | | 6.875 | | | | 11/01/35 | | | | 842,700 | |
| | | | | | | | | | | | | | |
| | | | | | | | | | | | | 3,106,800 | |
| | |
| | Technology – Hardware – 0.9% | |
| CommScope, Inc.(b)(e) | |
| | 390,000 | | | | 5.500 | | | | 06/15/24 | | | | 407,550 | |
| Diamond 1 Finance Corp./Diamond 2 Finance Corp.(b)(e) | |
| | 120,000 | | | | 6.020 | | | | 06/15/26 | | | | 130,807 | |
| NCR Corp.(e) | |
| | 1,000,000 | | | | 5.000 | | | | 07/15/22 | | | | 1,010,000 | |
| Sensata Technologies BV(b) | |
| | 1,080,000 | | | | 5.000 | | | | 10/01/25 | | | | 1,112,400 | |
| | | | | | | | | | | | | | |
| | | | | | | | | | | | | 2,660,757 | |
| | |
| | Technology – Software/Services(e) – 0.8% | |
| Equinix, Inc. | |
| | 100,000 | | | | 5.375 | | | | 04/01/23 | | | | 104,375 | |
| | 800,000 | | | | 5.750 | | | | 01/01/25 | | | | 848,000 | |
| MSCI, Inc.(b) | |
| | 1,000,000 | | | | 5.250 | | | | 11/15/24 | | | | 1,050,000 | |
| Open Text Corp.(b) | |
| | 370,000 | | | | 5.875 | | | | 06/01/26 | | | | 394,050 | |
| Western Digital Corp.(b) | |
| | 66,000 | | | | 7.375 | | | | 04/01/23 | | | | 72,187 | |
| | | | | | | | | | | | | | |
| | | | | | | | | | | | | 2,468,612 | |
| | |
| | Telecommunications – Cellular – 0.7% | |
| SoftBank Group Corp. | |
| | 600,000 | | | | 4.500 | (b) | | | 04/15/20 | | | | 618,750 | |
| | 400,000 | | | | 6.000 | (e) | | | 07/30/25 | | | | 430,500 | |
| T-Mobile USA, Inc.(e) | |
| | 500,000 | | | | 6.625 | | | | 04/01/23 | | | | 530,000 | |
| | 400,000 | | | | 6.375 | | | | 03/01/25 | | | | 429,000 | |
| | | | | | | | | | | | | | |
| | | | | | | | | | | | | 2,008,250 | |
| | |
| | Transportation – 0.1% | |
| Air Medical Group Holdings, Inc.(b)(e) | |
| | 240,000 | | | | 6.375 | | | | 05/15/23 | | | | 231,600 | |
| Pelabuhan Indonesia II PT | |
| | 200,000 | | | | 4.250 | | | | 05/05/25 | | | | 200,750 | |
| | | | | | | | | | | | | | |
| | | | | | | | | | | | | 432,350 | |
| | |
| | Utilities – Electric – 0.7% | |
| Comision Federal de Electricidad(b) | |
| | 80,000 | | | | 4.750 | | | | 02/23/27 | | | | 81,400 | |
| Eskom Holdings SOC Ltd. | |
| | 115,000 | | | | 6.750 | | | | 08/06/23 | | | | 118,737 | |
| Lamar Funding Ltd. | |
| | 200,000 | | | | 3.958 | | | | 05/07/25 | | | | 191,000 | |
| NRG Energy, Inc.(e) | |
| | 570,000 | | | | 6.250 | | | | 05/01/24 | | | | 551,475 | |
| NRG Yield Operating LLC(b)(e) | |
| | 500,000 | | | | 5.000 | | | | 09/15/26 | | | | 483,750 | |
| | |
| Corporate Obligations – (continued) | |
| | Utilities – Electric – (continued) | |
| Talen Energy Supply LLC(b)(e) | |
| 570,000 | | | | 5.125 | | | | 07/15/19 | | | | 542,925 | |
| | | | | | | | | | | | | | |
| | | | | | | | | | | | | 1,969,287 | |
| | |
| | Wireless Telecommunications – 2.0% | |
| Altice Financing SA(b)(e) | |
| | 600,000 | | | | 6.500 | | | | 01/15/22 | | | | 627,000 | |
| Altice Luxembourg SA(b)(e) | |
| | 500,000 | | | | 7.750 | | | | 05/15/22 | | | | 523,750 | |
| | 250,000 | | | | 7.625 | | | | 02/15/25 | | | | 259,688 | |
| Digicel Group Ltd.(b)(e) | |
| | 600,000 | | | | 8.250 | | | | 09/30/20 | | | | 529,800 | |
| Digicel Ltd.(b)(e) | |
| | 400,000 | | | | 6.000 | | | | 04/15/21 | | | | 356,880 | |
| DigitalGlobe, Inc.(b)(e) | |
| | 1,200,000 | | | | 5.250 | | | | 02/01/21 | | | | 1,206,000 | |
| Hughes Satellite Systems Corp. | |
| | 185,000 | | | | 7.625 | | | | 06/15/21 | | | | 202,575 | |
| | 165,000 | | | | 5.250 | (b) | | | 08/01/26 | | | | 162,525 | |
| Inmarsat Finance PLC(b)(e) | |
| | 1,129,000 | | | | 4.875 | | | | 05/15/22 | | | | 1,073,961 | |
| Intelsat Jackson Holdings SA(b)(e) | |
| | 240,000 | | | | 8.000 | | | | 02/15/24 | | | | 243,000 | |
| Sprint Corp. | |
| | 350,000 | | | | 7.875 | | | | 09/15/23 | | | | 346,500 | |
| | 500,000 | | | | 7.625 | (e) | | | 02/15/25 | | | | 486,250 | |
| Wind Acquisition Finance SA(b)(e) | |
| | 100,000 | | | | 4.750 | | | | 07/15/20 | | | | 100,875 | |
| | | | | | | | | | | | | | |
| | | | | | | | | | | | | 6,118,804 | |
| | |
| | Wirelines Telecommunications – 0.9% | |
| Anixter, Inc. | |
| | 500,000 | | | | 5.125 | | | | 10/01/21 | | | | 523,125 | |
| CenturyLink, Inc. | |
| | 483,000 | | | | 5.625 | | | | 04/01/20 | | | | 514,395 | |
| | 499,000 | | | | 5.625 | (e) | | | 04/01/25 | | | | 470,307 | |
| Frontier Communications Corp.(e) | |
| | 470,000 | | | | 11.000 | | | | 09/15/25 | | | | 480,575 | |
| Level 3 Financing, Inc.(e) | |
| | 100,000 | | | | 5.375 | | | | 05/01/25 | | | | 102,125 | |
| Ooredoo International Finance Ltd. | |
| | 150,000 | | | | 3.750 | | | | 06/22/26 | | | | 153,188 | |
| West Corp.(b)(e) | |
| | 460,000 | | | | 5.375 | | | | 07/15/22 | | | | 442,750 | |
| | | | | | | | | | | | | | |
| | | | | | | | | | | | | 2,686,465 | |
| | |
| | TOTAL CORPORATE OBLIGATIONS | |
| | (Cost $95,803,089) | | | $ | 97,739,781 | |
| | |
| | | | | | | | | | | | | | |
| | Bank Loans(g) – 23.8% | |
| | Aerospace & Defense – 0.4% | |
| BE Aerospace, Inc. | |
| $ | 400,000 | | | | 3.850 | % | | | 12/16/21 | | | $ | 402,252 | |
| Engility Corp. | |
| | 240,000 | | | | 5.750 | | | | 08/12/23 | | | | 242,801 | |
| | |
| | |
| The accompanying notes are an integral part of these financial statements. | | 53 |
GOLDMAN SACHS MULTI-MANAGER NON-CORE FIXED INCOME FUND
Schedule of Investments (continued)
October 31, 2016
| | | | | | | | | | | | | | |
Principal
Amount | | | Interest
Rate | | | Maturity
Date | | | Value | |
| Bank Loans(g) – (continued) | |
| | Aerospace & Defense – (continued) | |
| Sequa Corp. | |
| $ | 497,416 | | | | 5.250 | % | | | 06/19/17 | | | $ | 455,757 | |
| Transdigm, Inc. | |
| | 246,222 | | | | 3.750 | | | | 06/04/21 | | | | 245,668 | |
| | | | | | | | | | | | | | |
| | | | | | | | | | | | | 1,346,478 | |
| | |
| | Airlines – 0.9% | |
| American Airlines, Inc. | |
| | 987,500 | | | | 3.250 | | | | 06/27/20 | | | | 988,063 | |
| Delta Air Lines, Inc. | |
| | 742,288 | | | | 3.250 | | | | 10/18/18 | | | | 745,999 | |
| | 750,000 | | | | 4.750 | | | | 07/30/21 | | | | 751,043 | |
| US Airways Group, Inc. | |
| | 244,950 | | | | 3.500 | | | | 05/23/19 | | | | 245,153 | |
| | | | | | | | | | | | | | |
| | | | | | | | | | | | | 2,730,258 | |
| | |
| | Automotive – Parts – 0.9% | |
| Capital Automotive LP | |
| | 179,773 | | | | 4.000 | | | | 04/10/19 | | | | 181,235 | |
| Chrysler Group LLC | |
| | 1,019,026 | | | | 3.250 | | | | 12/31/18 | | | | 1,019,454 | |
| Evergreen Skills Lux S.a.r.l. | |
| | 658,331 | | | | 5.837 | | | | 04/28/21 | | | | 585,369 | |
| Gates Global LLC | |
| | 183,418 | | | | 4.250 | | | | 07/06/21 | | | | 180,685 | |
| Jaguar Holding Company II | |
| | 741,862 | | | | 4.250 | | | | 08/18/22 | | | | 740,668 | |
| | | | | | | | | | | | | | |
| | | | | | | | | | | | | 2,707,411 | |
| | |
| | Building Materials – 0.4% | |
| Jeld-Wen, Inc. | |
| | 990,000 | | | | 4.750 | | | | 07/01/22 | | | | 995,771 | |
| Wilsonart LLC | |
| | 308,808 | | | | 4.000 | | | | 10/31/19 | | | | 308,712 | |
| | | | | | | | | | | | | | |
| | | | | | | | | | | | | 1,304,483 | |
| | |
| | Chemicals – 0.7% | |
| Avantor Performance Materials Holdings, Inc. | |
| | 500,000 | | | | 6.000 | | | | 06/21/22 | | | | 503,125 | |
| Ineos US Finance LLC | |
| | 408,590 | | | | 3.750 | | | | 05/04/18 | | | | 409,215 | |
| | 246,248 | | | | 4.250 | | | | 03/31/22 | | | | 247,511 | |
| Univar, Inc. | |
| | 500,000 | | | | 4.250 | | | | 07/01/22 | | | | 500,625 | |
| Versum Materials, Inc. | |
| | 565,000 | | | | 3.340 | | | | 09/29/23 | | | | 567,588 | |
| | | | | | | | | | | | | | |
| | | | | | | | | | | | | 2,228,064 | |
| | |
| | Consumer Cyclical Services – 0.4% | |
| First Data Corp. | |
| | 1,000,000 | | | | 3.750 | | | | 07/08/22 | | | | 1,006,880 | |
| Monitronics International, Inc. | |
| | 350,000 | | | | 6.500 | | | | 09/30/22 | | | | 347,483 | |
| | | | | | | | | | | | | | |
| | | | | | | | | | | | | 1,354,363 | |
| | |
| Bank Loans(g) – (continued) | |
| | Consumer Products – Household & Leisure – 0.6% | |
| Affinion Group, Inc. | |
| 410,372 | | | | 6.750 | | | | 04/30/18 | | | | 399,345 | |
| | 130,000 | | | | 8.500 | | | | 10/31/18 | | | | 118,842 | |
| Life Time Fitness, Inc. | |
| | 946,093 | | | | 4.250 | | | | 06/10/22 | | | | 945,356 | |
| Revlon Consumer Products Corp. | |
| | 500,000 | | | | 4.250 | | | | 09/07/23 | | | | 500,885 | |
| | | | | | | | | | | | | | |
| | | | | | | | | | | | | 1,964,428 | |
| | |
| | Diversified Manufacturing – 0.3% | |
| Emerald US Inc. | |
| | 98,870 | | | | 5.000 | | | | 05/09/21 | | | | 89,477 | |
| Gardner Denver, Inc. | |
| | 498,715 | | | | 4.250 | | | | 07/30/20 | | | | 483,639 | |
| Rexnord LLC | |
| | 234,462 | | | | 4.000 | | | | 08/21/20 | | | | 234,990 | |
| | | | | | | | | | | | | | |
| | | | | | | | | | | | | 808,106 | |
| | |
| | Energy – 0.5% | |
| CJ Holding Co. | |
| | 495,000 | | | | 8.000 | | | | 03/23/20 | | | | 448,718 | |
| Dynegy Holdings, Inc. | |
| | 248,715 | | | | 4.000 | | | | 04/23/20 | | | | 248,754 | |
| Gulf Finance LLC | |
| | 159,068 | | | | 6.250 | | | | 08/25/23 | | | | 155,290 | |
| Seadrill Partners Finco LLC | |
| | 1,041,366 | | | | 4.000 | | | | 02/21/21 | | | | 578,614 | |
| | | | | | | | | | | | | | |
| | | | | | | | | | | | | 1,431,376 | |
| | |
| | Energy – Exploration & Production – 0.7% | |
| EP Energy LLC | |
| | 714,808 | | | | 9.750 | | | | 06/30/21 | | | | 730,891 | |
| Fieldwood Energy LLC | |
| | 554,514 | | | | 3.875 | | | | 10/01/18 | | | | 510,846 | |
| | 250,000 | | | | 8.000 | | | | 08/31/20 | | | | 216,250 | |
| Murray Energy Corp. | |
| | 627,194 | | | | 8.250 | | | | 04/16/20 | | | | 573,293 | |
| Seventy Seven Operating LLC | |
| | 250,000 | | | | 3.750 | | | | 06/25/20 | | | | 230,208 | |
| | | | | | | | | | | | | | |
| | | | | | | | | | | | | 2,261,488 | |
| | |
| | Entertainment – 0.2% | |
| Delta 2 (LUX) S.A.R.L. | |
| | 250,000 | | | | 7.750 | | | | 07/31/22 | | | | 251,667 | |
| Sabre, Inc. | |
| | 204,753 | | | | 4.500 | | | | 02/19/19 | | | | 205,435 | |
| | | | | | | | | | | | | | |
| | | | | | | | | | | | | 457,102 | |
| | |
| | Environmental – 0.1% | |
| Tervita Corp. | |
| | 201,023 | | | | 7.500 | | | | 05/15/18 | | | | 198,699 | |
| | |
| | Finance Insurance – 0.5% | |
| Alliant Holdings I, Inc. | |
| | 498,737 | | | | 4.753 | | | | 08/12/22 | | | | 498,428 | |
| | |
| | |
| 54 | | The accompanying notes are an integral part of these financial statements. |
GOLDMAN SACHS MULTI-MANAGER NON-CORE FIXED INCOME FUND
| | | | | | | | | | | | | | |
Principal
Amount | | | Interest
Rate | | | Maturity
Date | | | Value | |
| Bank Loans(g) – (continued) | |
| | Finance Insurance – (continued) | |
| Hub International Ltd. | |
| $ | 1,085,105 | | | | 4.000 | % | | | 10/02/20 | | | $ | 1,084,356 | |
| | | | | | | | | | | | | | |
| | | | | | | | | | | | | 1,582,784 | |
| | |
| | Financial Services – 0.4% | |
| New Millennium Holdco, Inc. | |
| | 160,118 | | | | 7.500 | | | | 12/21/20 | | | | 100,607 | |
| Sophia LP | |
| | 491,474 | | | | 4.750 | | | | 09/30/22 | | | | 491,937 | |
| Walter Investment Management Corp. | |
| | 601,816 | | | | 4.750 | | | | 12/19/20 | | | | 562,698 | |
| | | | | | | | | | | | | | |
| | | | | | | | | | | | | 1,155,242 | |
| | |
| | Food & Beverage – 0.7% | |
| NBTY, Inc. | |
| | 648,375 | | | | 5.000 | | | | 05/05/23 | | | | 650,145 | |
| US Foods, Inc. | |
| | 1,496,250 | | | | 4.000 | | | | 06/27/23 | | | | 1,505,063 | |
| | | | | | | | | | | | | | |
| | | | | | | | | | | | | 2,155,208 | |
| | |
| | Food & Drug Retailers – 0.1% | |
| Rite Aid Corp. | |
| | 250,000 | | | | 5.750 | | | | 08/21/20 | | | | 250,702 | |
| | |
| | Gaming – 0.3% | |
| Boyd Gaming Corp. | |
| | 81,694 | | | | 4.000 | | | | 08/14/20 | | | | 82,306 | |
| Scientific Games International, Inc. | |
| | 248,087 | | | | 6.000 | | | | 10/18/20 | | | | 249,404 | |
| | 724,612 | | | | 6.000 | | | | 10/01/21 | | | | 727,330 | |
| | | | | | | | | | | | | | |
| | | | | | | | | | | | | 1,059,040 | |
| | |
| | Health Care – Medical Products – 0.5% | |
| Carestream Health, Inc. | |
| | 229,452 | | | | 5.000 | | | | 06/07/19 | | | | 212,746 | |
| | 250,000 | | | | 9.500 | | | | 12/07/19 | | | | 221,667 | |
| Kinetic Concepts, Inc. | |
| | 996,247 | | | | 5.000 | | | | 11/04/20 | | | | 1,003,101 | |
| | | | | | | | | | | | | | |
| | | | | | | | | | | | | 1,437,514 | |
| | |
| | Health Care – Services – 1.9% | |
| Air Medical Group Holdings, Inc. | |
| | 798,641 | | | | 4.250 | | | | 04/28/22 | | | | 791,157 | |
| American Renal Holdings, Inc. | |
| | 645,636 | | | | 4.750 | | | | 09/20/19 | | | | 637,565 | |
| BPA Laboratories, Inc. | |
| | 80,336 | | | | 2.500 | | | | 07/01/17 | | | | 62,261 | |
| Community Health Systems, Inc. | |
| | 440,218 | | | | 4.083 | | | | 12/31/18 | | | | 429,213 | |
| | 239,975 | | | | 4.000 | | | | 01/27/21 | | | | 226,356 | |
| Iasis Healthcare LLC | |
| | 246,164 | | | | 4.500 | | | | 05/03/18 | | | | 244,318 | |
| inVentiv Health, Inc. | |
| | 750,000 | | | | 4.750 | | | | 09/28/23 | | | | 749,595 | |
| Kindred Healthcare, Inc. | |
| | 496,195 | | | | 4.250 | | | | 04/09/21 | | | | 495,783 | |
| | |
| Bank Loans(g) – (continued) | |
| | Health Care – Services – (continued) | |
| Quorum Health Corp. | |
| 640,660 | | | | 6.750 | | | | 04/29/22 | | | | 594,212 | |
| Select Medical Corp. | |
| | 493,248 | | | | 6.000 | | | | 06/01/18 | | | | 494,175 | |
| U.S. Renal Care, Inc. | |
| | 1,166,728 | | | | 5.250 | | | | 12/31/22 | | | | 1,116,045 | |
| | | | | | | | | | | | | | |
| | | | | | | | | | | | | 5,840,680 | |
| | |
| | Home Construction – 0.1% | |
| The ServiceMaster Co. | |
| | 246,231 | | | | 4.250 | | | | 07/01/21 | | | | 246,386 | |
| | |
| | Lodging – 0.2% | |
| Hilton Worldwide Finance LLC | |
| | 500,000 | | | | 3.500 | | | | 10/26/20 | | | | 501,875 | |
| | |
| | Media – Broadcasting & Radio – 1.1% | |
| Cumulus Media Holdings, Inc. | |
| | 800,000 | | | | 4.250 | | | | 12/23/20 | | | | 550,000 | |
| EIG Investors Corp. | |
| | 356,863 | | | | 6.480 | | | | 11/09/19 | | | | 346,603 | |
| iHeart Communications, Inc. | |
| | 1,500,000 | | | | 7.284 | | | | 01/30/19 | | | | 1,133,175 | |
| | 250,000 | | | | 8.034 | | | | 07/30/19 | | | | 188,332 | |
| Townsquare Media, Inc. | |
| | 93,252 | | | | 4.250 | | | | 04/01/22 | | | | 93,252 | |
| Tribune Media Co. | |
| | 987,500 | | | | 3.750 | | | | 12/27/20 | | | | 992,191 | |
| | | | | | | | | | | | | | |
| | | | | | | | | | | | | 3,303,553 | |
| | |
| | Media – Cable – 0.6% | |
| Charter Communications Operating LLC | |
| | 995,000 | | | | 3.500 | | | | 01/24/23 | | | | 1,000,662 | |
| Ziggo N.V. | |
| | 360,936 | | | | 3.500 | | | | 01/15/22 | | | | 360,637 | |
| | 295,655 | | | | 3.500 | | | | 01/15/22 | | | | 295,410 | |
| | 63,866 | | | | 3.500 | | | | 01/15/22 | | | | 63,813 | |
| | | | | | | | | | | | | | |
| | | | | | | | | | | | | 1,720,522 | |
| | |
| | Media – Non Cable – 0.5% | |
| Advantage Sales & Marketing, Inc. | |
| | 246,231 | | | | 4.250 | | | | 07/23/21 | | | | 243,665 | |
| | 203,488 | | | | 7.500 | | | | 07/25/22 | | | | 191,916 | |
| Cengage Learning Acquisitions, Inc. | |
| | 997,500 | | | | 5.250 | | | | 06/07/23 | | | | 974,019 | |
| | | | | | | | | | | | | | |
| | | | | | | | | | | | | 1,409,600 | |
| | |
| | Metals & Mining – 0.4% | |
| Fairmount Santrol, Inc. | |
| | 498,715 | | | | 4.500 | | | | 09/05/19 | | | | 472,223 | |
| FMG Resources (August 2006) Pty Ltd. | |
| | 730,765 | | | | 3.750 | | | | 06/30/19 | | | | 730,078 | |
| | | | | | | | | | | | | | |
| | | | | | | | | | | | | 1,202,301 | |
| | |
| | Packaging – 1.1% | |
| Ardagh Holdings USA, Inc. | |
| | 1,031,451 | | | | 4.000 | | | | 12/17/21 | | | | 1,040,796 | |
| | |
| | |
| The accompanying notes are an integral part of these financial statements. | | 55 |
GOLDMAN SACHS MULTI-MANAGER NON-CORE FIXED INCOME FUND
Schedule of Investments (continued)
October 31, 2016
| | | | | | | | | | | | | | |
Principal
Amount | | | Interest
Rate | | | Maturity
Date | | | Value | |
| Bank Loans(g) – (continued) | |
| | Packaging – (continued) | |
| BWAY Holding Co., Inc. | |
| $ | 395,175 | | | | 5.500 | % | | | 08/14/20 | | | $ | 397,562 | |
| Klockner-Pentaplast of America, Inc. | |
| | 700,360 | | | | 4.250 | | | | 04/28/20 | | | | 703,022 | |
| Reynolds Group Holdings, Inc. | |
| | 1,250,000 | | | | 4.250 | | | | 02/05/23 | | | | 1,252,788 | |
| | | | | | | | | | | | | | |
| | | | | | | | | | | | | 3,394,168 | |
| | |
| | Pharmaceutical – 0.6% | |
| Catalent Pharma Solutions, Inc. | |
| | 246,222 | | | | 4.250 | | | | 05/20/21 | | | | 247,385 | |
| DPx Holdings B.V. | |
| | 246,222 | | | | 4.250 | | | | 03/11/21 | | | | 246,325 | |
| PRA Holdings, Inc. | |
| | 241,247 | | | | 4.500 | | | | 09/23/20 | | | | 242,151 | |
| Valeant Pharmaceuticals International, Inc. | |
| | 956,897 | | | | 5.500 | | | | 04/01/22 | | | | 953,308 | |
| | | | | | | | | | | | | | |
| | | | | | | | | | | | | 1,689,169 | |
| | |
| | Property/Casualty Insurance – 0.2% | |
| York Risk Services Holding Corp. | |
| | 687,075 | | | | 4.750 | | | | 10/01/21 | | | | 635,977 | |
| | |
| | Real Estate – 0.2% | |
| Communications Sales & Leasing, Inc. | |
| | 500,000 | | | | 3.500 | | | | 10/24/22 | | | | 501,625 | |
| | |
| | Restaurants – 0.6% | |
| 1011778 B.C. Unlimited Liability Co. | |
| | 1,478,682 | | | | 3.750 | | | | 12/10/21 | | | | 1,484,848 | |
| Landry’s, Inc. | |
| | 200,000 | | | | 4.000 | | | | 10/04/23 | | | | 201,084 | |
| | | | | | | | | | | | | | |
| | | | | | | | | | | | | 1,685,932 | |
| | |
| | Retailers – 1.2% | |
| Academy Ltd. | |
| | 371,183 | | | | 5.000 | | | | 07/01/22 | | | | 359,699 | |
| Albertsons LLC | |
| | 1,142,857 | | | | 4.750 | | | | 06/22/23 | | | | 1,154,766 | |
| BJ’s Wholesale Club, Inc. | |
| | 240,914 | | | | 4.500 | | | | 09/26/19 | | | | 241,141 | |
| Gymboree Corp. | |
| | 500,000 | | | | 5.000 | | | | 02/23/18 | | | | 314,375 | |
| Microsemi Corp. | |
| | 458,356 | | | | 3.750 | | | | 01/15/23 | | | | 462,050 | |
| Rite Aid Corp. | |
| | 750,000 | | | | 4.875 | | | | 06/21/21 | | | | 752,190 | |
| Supervalu, Inc. | |
| | 461,601 | | | | 5.500 | | | | 03/21/19 | | | | 462,626 | |
| | | | | | | | | | | | | | |
| | | | | | | | | | | | | 3,746,847 | |
| | |
| | Services Cyclical – Business Services – 0.5% | |
| Ceridian LLC | |
| | 243,924 | | | | 4.500 | | | | 09/15/20 | | | | 239,045 | |
| TransUnion LLC | |
| | 392,912 | | | | 3.500 | | | | 04/09/21 | | | | 393,894 | |
| | |
| Bank Loans(g) – (continued) | |
| | Services Cyclical – Business Services – (continued) | |
| Travelport Finance S.A.R.L. | |
| 732,067 | | | | 5.000 | | | | 09/02/21 | | | | 736,093 | |
| | | | | | | | | | | | | | |
| | | | | | | | | | | | | 1,369,032 | |
| | |
| | Special Purpose – 0.1% | |
| KP Germany Erste GmbH | |
| | 299,299 | | | | 5.000 | | | | 04/28/20 | | | | 300,437 | |
| | |
| | Technology – Hardware – 0.4% | |
| Diebold, Inc. | |
| | 555,000 | | | | 5.250 | | | | 11/06/23 | | | | 560,783 | |
| Rackspace Hosting, Inc. | |
| | 750,000 | | | | 5.000 | | | | 10/26/23 | | | | 753,870 | |
| | | | | | | | | | | | | | |
| | | | | | | | | | | | | 1,314,653 | |
| | |
| | Technology – Software/Services – 2.8% | |
| Ancestry.com Operations, Inc. | |
| | 250,000 | | | | 5.250 | | | | 10/19/23 | | | | 250,390 | |
| Applied Systems, Inc. | |
| | 761,331 | | | | 4.000 | | | | 01/25/21 | | | | 762,473 | |
| BMC Software Finance, Inc. | |
| | 1,087,231 | | | | 5.000 | | | | 09/10/20 | | | | 1,069,900 | |
| Dell, Inc. | |
| | 250,000 | | | | 2.790 | | | | 09/07/21 | | | | 247,558 | |
| | 1,000,000 | | | | 4.000 | | | | 09/07/23 | | | | 1,006,830 | |
| Emdeon, Inc. | |
| | 246,174 | | | | 3.750 | | | | 11/02/18 | | | | 246,636 | |
| Infor (US), Inc. | |
| | 727,032 | | | | 3.750 | | | | 06/03/20 | | | | 724,698 | |
| Informatica Corp. | |
| | 742,500 | | | | 4.500 | | | | 08/05/22 | | | | 728,444 | |
| Ion Trading Finance Ltd. | |
| | 226,586 | | | | 4.250 | | | | 08/11/23 | | | | 226,303 | |
| Kronos, Inc. | |
| | 750,000 | | | | 5.000 | | | | 10/04/23 | | | | 752,985 | |
| Magic NewCo. LLC | |
| | 246,159 | | | | 6.500 | | | | 12/12/18 | | | | 247,759 | |
| MKS Instruments, Inc. | |
| | 177,009 | | | | 4.250 | | | | 05/01/23 | | | | 178,262 | |
| ON Semiconductor Corp. | |
| | 579,600 | | | | 3.777 | | | | 03/31/23 | | | | 582,788 | |
| Syniverse Holdings, Inc. | |
| | 695,401 | | | | 4.000 | | | | 04/23/19 | | | | 639,769 | |
| | 321,860 | | | | 4.000 | | | | 04/23/19 | | | | 295,911 | |
| Tibco Software, Inc. | |
| | 498,734 | | | | 6.500 | | | | 12/04/20 | | | | 498,734 | |
| Western Digital Corp. | |
| | 123,690 | | | | 4.500 | | | | 04/29/23 | | | | 125,015 | |
| | | | | | | | | | | | | | |
| | | | | | | | | | | | | 8,584,455 | |
| | |
| | Telecommunications – Internet & Data – 1.0% | |
| Asurion LLC | |
| | 451,128 | | | | 5.000 | | | | 05/24/19 | | | | 451,209 | |
| | 725,000 | | | | 8.500 | | | | 03/03/21 | | | | 730,133 | |
| | |
| | |
| 56 | | The accompanying notes are an integral part of these financial statements. |
GOLDMAN SACHS MULTI-MANAGER NON-CORE FIXED INCOME FUND
| | | | | | | | | | | | | | |
Principal
Amount | | | Interest
Rate | | | Maturity
Date | | | Value | |
| Bank Loans(g) – (continued) | |
| | Telecommunications – Internet & Data – (continued) | |
| Avaya, Inc. | |
| $ | 803,526 | | | | 5.390 | % | | | 10/26/17 | | | $ | 696,770 | |
| | 343,781 | | | | 6.250 | | | | 05/29/20 | | | | 281,285 | |
| Level 3 Financing, Inc. | |
| | 900,000 | | | | 4.000 | | | | 01/15/20 | | | | 904,050 | |
| | | | | | | | | | | | | | |
| | | | | | | | | | | | | 3,063,447 | |
| | |
| | Telecommunications – Satellites – 0.7% | |
| Intelsat Jackson Holdings SA | |
| | 2,277,083 | | | | 3.750 | | | | 06/30/19 | | | | 2,174,865 | |
| | |
| | Transportation – 0.4% | |
| CEVA Group PLC | |
| | 54,585 | | | | 6.500 | | | | 03/19/21 | | | | 43,430 | |
| CEVA Intercompany B.V. | |
| | 56,123 | | | | 6.500 | | | | 03/19/21 | | | | 44,653 | |
| Ceva Logistics Canada ULC | |
| | 9,676 | | | | 6.500 | | | | 03/19/21 | | | | 7,699 | |
| Ceva Logistics US Holdings, Inc. | |
| | 77,412 | | | | 6.500 | | | | 03/19/21 | | | | 61,591 | |
| Syncreon Group Holdings B.V. | |
| | 680,779 | | | | 5.250 | | | | 10/28/20 | | | | 608,447 | |
| Uber Technologies | |
| | 500,000 | | | | 5.000 | | | | 07/13/23 | | | | 503,440 | |
| | | | | | | | | | | | | | |
| | | | | | | | | | | | | 1,269,260 | |
| | |
| | Utilities – 0.6% | |
| TEX Operations Co. LLC | |
| | 669,258 | | | | 5.000 | | | | 08/04/23 | | | | 675,114 | |
| | 152,638 | | | | 5.000 | | | | 08/04/23 | | | | 153,973 | |
| Texas Competitive Electric Holdings Co. | |
| | 185,714 | | | | 5.000 | | | | 10/17/17 | | | | 187,070 | |
| | 814,286 | | | | 5.000 | | | | 10/17/17 | | | | 820,230 | |
| | | | | | | | | | | | | | |
| | | | | | | | | | | | | 1,836,387 | |
| | |
| | TOTAL BANK LOANS | |
| | (Cost $72,827,568) | | | $ | 72,223,917 | |
| | |
| | | | | | | | | | | | | | |
| | U.S. Treasury Obligation – 0.8% | |
| United States Treasury Note | |
| $ | 2,475,000 | | | | 0.625 | % | | | 06/30/18 | | | $ | 2,467,352 | |
| | (Cost $2,470,141) | | | | | |
| | |
| | | | | | | | | | | | | | |
| | Structured Notes(b) – 0.3% | |
| Republic of Indonesia (Issuer JPMorgan Chase Bank NA) | |
| IDR | 4,400,000,000 | | | | 8.750 | % | | | 05/19/31 | | | $ | 370,250 | |
| | 7,855,000,000 | | | | 8.375 | | | | 03/17/34 | | | | 632,861 | |
| | |
| | TOTAL STRUCTURED NOTES | |
| | (Cost $853,645) | | | $ | 1,003,111 | |
| | |
| | | | | | | | |
Shares | | | Description | | Value | |
| | Common Stocks – 0.3% | |
| | Electric Utilities – 0.1% | | | | |
| | 23,820 | | | Te Holdcorp LLC/Te Holdcorp | | $ | 256,066 | |
| | |
| | Health Care Services(f) – 0.0% | | | | |
| | 593 | | | Millennium Health LLC | | | 1,038 | |
| | |
| | Oil, Gas & Consumable Fuels(f) – 0.2% | | | | |
| | 26,950 | | | Midstates Petroleum Co., Inc. | | | 505,851 | |
| | |
| | TOTAL COMMON STOCKS | | | | |
| | (Cost $678,907) | | $ | 762,955 | |
| | |
| | | | | | | | |
| Shares | | | Description | | Value | |
| | | | | | | | |
| | Preferred Stock – 0.0% | |
| | Electric Utilities – 0.0% | | | | |
| Te Holdcorp LLC/Te Holdcorp | |
| $ | 16,329 | | | 0.000% | | $ | 97,976 | |
| | (Cost $278,797) | | | | |
| | |
| TOTAL INVESTMENTS BEFORE
SHORT-TERM INVESTMENT | | | | |
| | (Cost $272,205,431) | | $ | 276,810,527 | |
| | |
| | | | | | | | | | | | | | |
Principal
Amount | | | Interest
Rate | | | Maturity
Date | | | Value | |
| | Short-term Investment(h) – 11.7% | |
| | Repurchase Agreements – 11.7% | |
| Joint Repurchase Agreement Account II | |
| $ | 35,400,000 | | | | 0.338 | % | | | 11/01/16 | | | $ | 35,400,000 | |
| | (Cost $35,400,000) | |
| | |
| | TOTAL INVESTMENTS – 102.7% | |
| | (Cost $307,605,431) | | | $ | 312,210,527 | |
| | |
| LIABILITIES IN EXCESS OF
OTHER ASSETS – (2.7)% |
| | | (8,164,663 | ) |
| | |
| | NET ASSETS – 100.0% | | | $ | 304,045,864 | |
| | |
| | |
| The accompanying notes are an integral part of these financial statements. | | 57 |
GOLDMAN SACHS MULTI-MANAGER NON-CORE FIXED INCOME FUND
Schedule of Investments (continued)
October 31, 2016
| | |
| The percentage shown for each investment category reflects the value of investments in that category as a percentage of net assets. |
(a) | | Issued with a zero coupon. Income is recognized through the accretion of discount. |
(b) | | Exempt from registration under Rule 144A of the Securities Act of 1933. Under procedures approved by the Board of Trustees, such securities have been determined to be liquid by the investment adviser and may be resold, normally to qualified institutional buyers in transactions exempt from registration. Total market value of Rule 144A securities amounts to $50,327,238, which represents approximately 16.6% of net assets as of October 31, 2016. |
(c) | | Variable rate security. Interest rate or distribution rate disclosed is that which is in effect on October 31, 2016. |
(d) | | Coupon changes periodically based upon a predetermined schedule. Interest rate disclosed is that which is in effect on October 31, 2016. |
(e) | | Security with “Call” features with resetting interest rates. Maturity dates disclosed are the final maturity dates. |
(f) | | Security is currently in default and/or non-income producing. |
(g) | | Bank Loans often require prepayments from excess cash flows or permit the borrower to repay at its election. The degree to which borrowers repay, whether as a contractual requirement or at their election, cannot be predicted with accuracy. As a result, the actual remaining maturity may be substantially less than the stated maturities shown. The stated interest rate represents the weighted average interest rate of all contracts within the bank loan facility on October 31, 2016. Bank Loans typically have rates of interest which are predetermined either daily, monthly, quarterly or semi-annually by reference to a base lending rate, plus a premium. These base lending rates are primarily the London-Interbank Offered Rate (“LIBOR”), and secondarily the prime rate offered by one or more major United States banks (the “Prime Rate”) and the certificate of deposit (“CD”) rate or other base lending rates used by commercial lenders. |
(h) | | Joint repurchase agreement was entered into on October 31, 2016. Additional information appears on pages 66-67. |
| | |
|
Currency Abbreviations: |
BRL | | —Brazilian Real |
CLP | | —Chilean Peso |
CNY | | —Chinese Yuan Renminbi |
COP | | —Colombian Peso |
EUR | | —Euro |
HKD | | —Hong Kong Dollar |
HUF | | —Hungarian Forint |
IDR | | —Indonesian Rupiah |
INR | | —Indian Rupee |
MXN | | —Mexican Peso |
MYR | | —Malaysian Ringgit |
PEN | | —Peruvian Nuevo Sol |
PHP | | —Philippine Peso |
PLN | | —Polish Zloty |
RON | | —New Romanian Leu |
RUB | | —Russian Ruble |
THB | | —Thai Baht |
TRY | | —Turkish Lira |
USD | | —U.S. Dollar |
ZAR | | —South African Rand |
| | |
Investment Abbreviations: |
BUBOR | | —Budapest Interbank Offered Rate |
LIBOR | | —London Interbank Offered Rate |
LLC | | —Limited Liability Company |
LP | | —Limited Partnership |
PLC | | —Public Limited Company |
|
| | |
| 58 | | The accompanying notes are an integral part of these financial statements. |
GOLDMAN SACHS MULTI-MANAGER NON-CORE FIXED INCOME FUND
|
| ADDITIONAL INVESTMENT INFORMATION |
FORWARD FOREIGN CURRENCY EXCHANGE CONTRACTS — At October 31, 2016, the Fund had the following forward foreign currency exchange contracts:
FORWARD FOREIGN CURRENCY EXCHANGE CONTRACTS WITH UNREALIZED GAIN
| | | | | | | | | | | | | | | | | | | | | | | | |
| Counterparty | | Currency
Purchased | | | Currency
Sold | | | Current
Value | | | Settlement
Date | | | Unrealized
Gain | |
Citibank NA (London) | | BRL | | | 9,097,550 | | | USD | | | 2,782,125 | | | $ | 2,847,357 | | | | 11/03/16 | | | $ | 65,232 | |
| | CLP | | | 27,782,377 | | | USD | | | 42,062 | | | | 42,480 | | | | 11/16/16 | | | | 418 | |
| | EUR | | | 1,364,701 | | | HUF | | | 419,860,890 | | | | 1,499,054 | | | | 11/16/16 | | | | 6,225 | |
| | HUF | | | 71,439,753 | | | EUR | | | 231,000 | | | | 254,006 | | | | 11/16/16 | | | | 264 | |
| | IDR | | | 1,775,867,880 | | | USD | | | 135,407 | | | | 135,982 | | | | 11/16/16 | | | | 575 | |
| | MXN | | | 35,618,711 | | | USD | | | 1,808,089 | | | | 1,880,953 | | | | 11/16/16 | | | | 72,864 | |
| | PEN | | | 6,027,146 | | | USD | | | 1,784,499 | | | | 1,788,420 | | | | 11/16/16 | | | | 3,921 | |
| | PHP | | | 7,802,981 | | | USD | | | 160,654 | | | | 160,862 | | | | 11/16/16 | | | | 207 | |
| | PLN | | | 4,866,300 | | | EUR | | | 1,125,000 | | | | 1,239,879 | | | | 11/16/16 | | | | 4,124 | |
| | RON | | | 180,811 | | | USD | | | 44,000 | | | | 44,060 | | | | 11/16/16 | | | | 61 | |
| | RUB | | | 77,853,564 | | | USD | | | 1,203,716 | | | | 1,222,973 | | | | 11/16/16 | | | | 19,257 | |
| | THB | | | 24,921,270 | | | USD | | | 711,385 | | | | 711,818 | | | | 11/16/16 | | | | 433 | |
| | TRY | | | 524,846 | | | USD | | | 169,000 | | | | 169,046 | | | | 11/16/16 | | | | 46 | |
| | USD | | | 2,612,120 | | | BRL | | | 8,315,430 | | | | 2,602,569 | | | | 11/03/16 | | | | 9,552 | |
| | USD | | | 680,748 | | | BRL | | | 2,183,235 | | | | 677,186 | | | | 12/02/16 | | | | 3,562 | |
| | USD | | | 1,807,801 | | | CNY | | | 12,124,016 | | | | 1,787,674 | | | | 11/16/16 | | | | 20,126 | |
| | USD | | | 669,000 | | | COP | | | 1,981,102,462 | | | | 657,125 | | | | 11/16/16 | | | | 11,875 | |
| | USD | | | 869,632 | | | EUR | | | 776,000 | | | | 853,224 | | | | 12/07/16 | | | | 16,409 | |
| | USD | | | 539,622 | | | HKD | | | 4,182,593 | | | | 539,346 | | | | 11/16/16 | | | | 275 | |
| | USD | | | 183,464 | | | IDR | | | 2,385,027,672 | | | | 182,627 | | | | 11/16/16 | | | | 837 | |
| | USD | | | 1,102,000 | | | MXN | | | 20,657,048 | | | | 1,090,857 | | | | 11/16/16 | | | | 11,143 | �� |
| | USD | | | 817,714 | | | MYR | | | 3,389,943 | | | | 807,058 | | | | 11/16/16 | | | | 10,656 | |
| | USD | | | 174,898 | | | PLN | | | 669,617 | | | | 170,611 | | | | 11/16/16 | | | | 4,286 | |
| | USD | | | 924,000 | | | RUB | | | 58,419,221 | | | | 917,687 | | | | 11/16/16 | | | | 6,313 | |
| | USD | | | 62,000 | | | THB | | | 2,150,265 | | | | 61,417 | | | | 11/16/16 | | | | 583 | |
| | | ZAR | | | 11,582,568 | | | USD | | | 844,742 | | | | 856,285 | | | | 11/16/16 | | | | 11,543 | |
| TOTAL | | | | | | | | $ | 280,787 | |
FORWARD FOREIGN CURRENCY EXCHANGE CONTRACTS WITH UNREALIZED LOSS
| | | | | | | | | | | | | | | | | | | | | | | | |
| Counterparty | | Currency
Purchased | | | Currency
Sold | | | Current
Value | | | Settlement
Date | | | Unrealized
Loss | |
Citibank NA (London) | | BRL | | | 1,566,889 | | | USD | | | 492,036 | | | $ | 490,406 | | | | 11/03/16 | | | $ | (1,630 | ) |
| | BRL | | | 6,748,541 | | | USD | | | 2,100,321 | | | | 2,093,233 | | | | 12/02/16 | | | | (7,088 | ) |
| | COP | | | 6,932,364,285 | | | USD | | | 2,373,487 | | | | 2,299,440 | | | | 11/16/16 | | | | (74,047 | ) |
| | HUF | | | 309,123,197 | | | USD | | | 1,129,073 | | | | 1,099,098 | | | | 11/16/16 | | | | (29,976 | ) |
| | IDR | | | 4,570,125,000 | | | USD | | | 350,000 | | | | 349,945 | | | | 11/16/16 | | | | (54 | ) |
| | MXN | | | 16,756,970 | | | USD | | | 892,743 | | | | 884,903 | | | | 11/16/16 | | | | (7,842 | ) |
| | MYR | | | 5,820,179 | | | USD | | | 1,411,366 | | | | 1,385,635 | | | | 11/16/16 | | | | (25,731 | ) |
| | PLN | | | 7,677,010 | | | USD | | | 2,007,037 | | | | 1,956,017 | | | | 11/16/16 | | | | (51,022 | ) |
| | RON | | | 2,268,689 | | | USD | | | 572,361 | | | | 552,839 | | | | 11/16/16 | | | | (19,522 | ) |
| | THB | | | 69,022,236 | | | USD | | | 1,991,909 | | | | 1,971,458 | | | | 11/16/16 | | | | (20,451 | ) |
| | TRY | | | 3,559,816 | | | USD | | | 1,187,163 | | | | 1,146,572 | | | | 11/16/16 | | | | (40,593 | ) |
| | USD | | | 724,000 | | | BRL | | | 2,349,009 | | | | 735,195 | | | | 11/03/16 | | | | (11,195 | ) |
| | USD | | | 293,000 | | | BRL | | | 945,335 | | | | 293,220 | | | | 12/02/16 | | | | (220 | ) |
| | USD | | | 65,000 | | | HUF | | | 18,285,228 | | | | 65,014 | | | | 11/16/16 | | | | (14 | ) |
| | USD | | | 2,693,102 | | | IDR | | | 35,359,555,744 | | | | 2,707,560 | | | | 11/16/16 | | | | (14,459 | ) |
| | USD | | | 1,183,810 | | | INR | | | 79,444,310 | | | | 1,188,378 | | | | 11/16/16 | | | | (4,567 | ) |
| | |
| The accompanying notes are an integral part of these financial statements. | | 59 |
GOLDMAN SACHS MULTI-MANAGER NON-CORE FIXED INCOME FUND
Schedule of Investments (continued)
October 31, 2016
|
| ADDITIONAL INVESTMENT INFORMATION (continued) |
FORWARD FOREIGN CURRENCY EXCHANGE CONTRACTS WITH UNREALIZED LOSS (continued)
| | | | | | | | | | | | | | | | | | | | | | | | |
| Counterparty | | Currency
Purchased | | | Currency
Sold | | | Current
Value | | | Settlement
Date | | | Unrealized
Loss | |
Citibank NA (London) (continued) | | USD | | | 1,800,914 | | | MXN | | | 35,289,445 | | | $ | 1,863,566 | | | | 11/16/16 | | | $ | (62,651 | ) |
| | USD | | | 994,038 | | | PEN | | | 3,371,700 | | | | 1,000,476 | | | | 11/16/16 | | | | (6,438 | ) |
| | USD | | | 13,000 | | | THB | | | 455,195 | | | | 13,002 | | | | 11/16/16 | | | | (2 | ) |
| | | USD | | | 1,311,767 | | | ZAR | | | 18,117,219 | | | | 1,339,383 | | | | 11/16/16 | | | | (27,616 | ) |
| TOTAL | | | | | | | | | | | | | | | | | | | | | | $ | (405,118 | ) |
FUTURES CONTRACTS — At October 31, 2016, the Fund had the following futures contracts:
| | | | | | | | | | | | | | |
| Type | | Number of
Contracts
Long (Short) | | | Expiration
Date | | Current
Value | | | Unrealized
Gain (Loss) | |
Ultra Long U.S. Treasury Bonds | | | (2 | ) | | December 2016 | | $ | (351,875 | ) | | $ | 21,747 | |
10 Year German Euro-Bund | | | (3 | ) | | December 2016 | | | (534,066 | ) | | | 7,566 | |
10 Year U.S. Treasury Notes | | | (27 | ) | | December 2016 | | | (3,499,875 | ) | | | 2,713 | |
| TOTAL | | | | | | | | | | | | $ | 32,026 | |
SWAP CONTRACTS — At October 31, 2016, the Fund had the following swap contracts:
OVER THE COUNTER INTEREST RATE SWAP CONTRACTS
| | | | | | | | | | | | | | | | | | |
| | | | | | | | | | Rates Exchanged | | | |
| Counterparty | | Notional
Amount
(000s) | | | Termination
Date | | Payments
Received | | | Payments Made | | Unrealized
Gain (Loss)* | |
BNP Paribas SA | | BRL | | | 4,300 | | | 01/02/18 | | | 12.795 | % | | 1 month Brazilian Interbank Deposit Average | | $ | 3,987 | |
HSBC Bank PLC | | | | | 8,203 | | | 01/02/18 | | | 11.965 | | | 1 month Brazilian Interbank Deposit Average | | | (6,838 | ) |
| | | | | 6,852 | | | 01/02/18 | | | 12.625 | | | 1 month Brazilian Interbank Deposit Average | | | (486 | ) |
| | | | | | 8,583 | | | 01/02/18 | | | 12.730 | | | 1 month Brazilian Interbank Deposit Average | | | (1,080 | ) |
| TOTAL | | | | | | | | | | | | | | | | $ | (4,417 | ) |
| | * | | There are no upfront payments on the swap contracts (s), therefore the unrealized gain (loss) on the swap contracts is equal to their market value. |
| | |
| 60 | | The accompanying notes are an integral part of these financial statements. |
GOLDMAN SACHS MULTI-MANAGER NON-CORE FIXED INCOME FUND
|
| ADDITIONAL INVESTMENT INFORMATION (continued) |
CENTRALLY CLEARED INTEREST RATE SWAP CONTRACTS
| | | | | | | | | | | | | | | | | | |
| | | | | | | Rates Exchanged | | | | |
Notional
Amount
(000s) | | | Termination
Date | | | Payments
Received | | | Payments
Made | | | Unrealized
Gain (Loss)* | |
| | HUF 165,504 | | | | 11/02/21 | | | | 6 month BUBOR | | | | 1.220% | | | $ | (629 | ) |
| | 174,263 | | | | 11/03/21 | | | | 6 month BUBOR | | | | 1.230 | | | | — | |
| | TOTAL | | | | | | | | | | | | | | | $ | (629 | ) |
| | * | | There are no upfront payments on the swap contracts(s), therefore the unrealized gain (loss) on the swap contracts is equal to their market value. |
OVER THE COUNTER CREDIT DEFAULT SWAP CONTRACTS
| | | | | | | | | | | | | | | | | | | | | | | | | | |
| | | | | | | | | | | | | | | | | Market Value | |
| Counterparty | | Referenced
Obligation | | Notional
Amount
(000s) | | | Rates Received
(Paid) | | | Termination
Date
| | | Credit
Spread at
October 31,
2016(a) | | | Upfront
Payments
Made (Received) | | | Unrealized
Gain (Loss) | |
Protection Purchased: | | | | | | | | | | | | | | | | | | | | | | | | |
BNP Paribas SA | | People’s Republic of China, 7.500%, 10/28/27 | | $ | 1,960 | | | | (1.000 | )% | | | 12/20/21 | | | | 1.091 | % | | $ | 8,974 | | | $ | (2,581 | ) |
| | Republic of Colombia, 10.375%, 01/28/33 | | | 1,998 | | | | (1.000 | ) | | | 12/20/21 | | | | 1.735 | | | | 83,840 | | | | (14,986 | ) |
| | Republic of Peru,
8.750%, 11/21/33 | | | 1,100 | | | | (1.000 | ) | | | 12/20/21 | | | | 1.035 | | | | 12,521 | | | | (11,931 | ) |
| | Republic of South Africa, 5.500%, 03/09/20 | | | 950 | | | | (1.000 | ) | | | 12/20/21 | | | | 2.411 | | | | 67,411 | | | | (4,453 | ) |
| | Russian Federation, 7.500%, 03/31/30 | | | 1,180 | | | | (1.000 | ) | | | 12/20/21 | | | | 2.215 | | | | 72,283 | | | | (4,815 | ) |
| | State of Qatar,
9.750%, 06/15/30 | | | 990 | | | | (1.000 | ) | | | 12/20/21 | | | | 0.884 | | | | 483 | | | | (7,330 | ) |
Citibank NA | | Republic of Chile,
3.875%, 08/05/20 | | | 900 | | | | (1.000 | ) | | | 12/20/21 | | | | 0.868 | | | | (1,540 | ) | | | (5,401 | ) |
| | | Republic of Colombia, 10.375%, 01/28/33 | | | 900 | | | | (1.000 | ) | | | 12/20/21 | | | | 1.735 | | | | 32,349 | | | | (1,334 | ) |
| TOTAL | | | $ | 276,321 | | | $ | (52,831 | ) |
| | (a) | | Credit spread on the Referenced Obligation, together with the term of the swap contract, are indicators of payment/performance risk. The likelihood of a credit event occurring which would require a fund to make a payment or otherwise be required to perform under the swap contract is generally greater as the credit spread and the term of the swap contract increase. |
OVER THE COUNTER CROSS CURRENCY SWAP CONTRACTS
| | | | | | | | | | | | | | | | | | | | | | | | |
| | | | | | | | | | | | Rates Exchanged | | Market Value | |
| Counterparty | | Notional Amount
of Currency
Received | | | Notional Amount
of Currency
Delivered | | | Termination
Date(b) | | | Payments
Received | | Payments
Made | | Upfront
Payments
Made (Received) | | | Unrealized
Gain (Loss) | |
BNP Paribas SA | | TRY | 10,063,972 | | | $ | 3,271,612 | | | | 11/21/17 | | | 8.56% | | 3 month LIBOR | | $ | 5,167 | | | $ | (37,135 | ) |
| | | $ | 4,104,113 | | | RUB | 263,484,055 | | | | 01/11/18 | | | 3 month LIBOR | | 8.68% | | | (115,345 | ) | | | 78,275 | |
| TOTAL | | $ | (110,178 | ) | | $ | 41,140 | |
| | (b) | | At the termination date, the notional amount of the currency received will be exchanged back for the notional amount of the currency delivered. |
| | |
| The accompanying notes are an integral part of these financial statements. | | 61 |
GOLDMAN SACHS MULTI-MANAGER REAL ASSETS STRATEGY FUND
Consolidated Schedule of Investments
October 31, 2016
| | | | | | | | |
Shares | | | Description | | Value | |
| | Common Stocks – 96.2% | |
| | Australia – 4.9% | |
| | 161,085 | | | Dexus Property Group (Equity Real Estate Investment Trusts (REITs)) | | $ | 1,094,272 | |
| | 326,021 | | | Goodman Group (Equity Real Estate Investment Trusts (REITs)) | | | 1,680,481 | |
| | 476,104 | | | Mirvac Group (Equity Real Estate Investment Trusts (REITs)) | | | 755,260 | |
| | 508,814 | | | Stockland (Equity Real Estate Investment Trusts (REITs)) | | | 1,708,821 | |
| | 323,102 | | | Sydney Airport (Transportation Infrastructure) | | | 1,535,959 | |
| | 710,457 | | | Transurban Group (Transportation Infrastructure) | | | 5,605,875 | |
| | 426,544 | | | Vicinity Centres (Equity Real Estate Investment Trusts (REITs)) | | | 930,190 | |
| | 286,939 | | | Westfield Corp. (Equity Real Estate Investment Trusts (REITs)) | | | 1,939,097 | |
| | | | | | | | |
| | | | | | | 15,249,955 | |
| | |
| | Canada – 9.8% | |
| | 3,632 | | | Allied Properties Real Estate Investment Trust (Equity Real Estate Investment Trusts (REITs)) | | | 97,644 | |
| | 28,423 | | | Boardwalk Real Estate Investment Trust (Equity Real Estate Investment Trusts (REITs)) | | | 1,043,003 | |
| | 19,110 | | | Brookfield Canada Office Properties (Equity Real Estate Investment Trusts (REITs)) | | | 378,125 | |
| | 33,486 | | | Canadian Apartment Properties REIT (Equity Real Estate Investment Trusts (REITs)) | | | 731,983 | |
| | 27,300 | | | Canadian National Railway Co.
(Road & Rail) | | | 1,716,198 | |
| | 23,524 | | | Canadian Pacific Railway Ltd. (Road & Rail) | | | 3,362,991 | |
| | 94,069 | | | Chartwell Retirement Residences (Health Care Providers & Services) | | | 1,047,783 | |
| | 117,651 | | | Enbridge, Inc. (Oil, Gas & Consumable Fuels) | | | 5,080,404 | |
| | 233,925 | | | Inter Pipeline Ltd. (Oil, Gas & Consumable Fuels) | | | 4,850,111 | |
| | 27,200 | | | Keyera Corp. (Oil, Gas & Consumable Fuels) | | | 816,426 | |
| | 166,796 | | | Pembina Pipeline Corp. (Oil, Gas & Consumable Fuels) | | | 5,124,628 | |
| | 132,261 | | | TransCanada Corp. (Oil, Gas & Consumable Fuels) | | | 5,987,391 | |
| | | | | | | | |
| | | | | | | 30,236,687 | |
| | |
| | France – 3.5% | |
| | 8,419 | | | Aeroports de Paris (Transportation Infrastructure) | | | 850,378 | |
| | 82,300 | | | Eutelsat Communications SA (Media) | | | 1,724,582 | |
| | 5,209 | | | Fonciere Des Regions (Equity Real Estate Investment Trusts (REITs)) | | | 455,244 | |
| | |
| | Common Stocks – (continued) | |
| | France – (continued) | |
| | 333,414 | | | Groupe Eurotunnel SE (Transportation Infrastructure) | | $ | 3,120,536 | |
| | 1,667 | | | ICADE (Equity Real Estate Investment Trusts (REITs)) | | | 119,712 | |
| | 30,903 | | | Klepierre (Equity Real Estate Investment Trusts (REITs)) | | | 1,262,937 | |
| | 24,255 | | | Mercialys SA (Equity Real Estate Investment Trusts (REITs)) | | | 502,450 | |
| | 11,609 | | | Unibail-Rodamco SE (Real Estate Investment Trusts) | | | 2,755,570 | |
| | | | | | | | |
| | | | | | | 10,791,409 | |
| | |
| | Germany – 1.4% | |
| | 52,186 | | | alstria office REIT AG* (Equity Real Estate Investment Trusts (REITs)) | | | 673,159 | |
| | 42,823 | | | TLG Immobilien AG (Real Estate Management & Development) | | | 897,799 | |
| | 20,267 | | | VIB Vermoegen AG (Real Estate Management & Development) | | | 444,962 | |
| | 64,328 | | | Vonovia SE (Real Estate Management & Development) | | | 2,267,876 | |
| | | | | | | | |
| | | | | | | 4,283,796 | |
| | |
| | Hong Kong – 4.4% | |
| | 336,500 | | | Beijing Enterprises Holdings Ltd. (Industrial Conglomerates) | | | 1,681,770 | |
| | 262,900 | | | Henderson Land Development Co. Ltd. (Real Estate Management & Development) | | | 1,555,113 | |
| | 1,358,000 | | | Hong Kong & China Gas Co. Ltd. (Gas Utilities) | | | 2,652,799 | |
| | 229,000 | | | Link REIT (Equity Real Estate Investment Trusts (REITs)) | | | 1,629,091 | |
| | 611,000 | | | New World Development Co. Ltd. (Real Estate Management & Development) | | | 759,626 | |
| | 278,000 | | | Sun Hung Kai Properties Ltd. (Real Estate Management & Development) | | | 4,139,732 | |
| | 169,500 | | | The Wharf Holdings Ltd. (Real Estate Management & Development) | | | 1,270,861 | |
| | | | | | | | |
| | | | | | | 13,688,992 | |
| | |
| | Ireland – 0.7% | |
| | 416,201 | | | Green REIT PLC (Equity Real Estate Investment Trusts (REITs)) | | | 621,363 | |
| | 658,350 | | | Hibernia REIT PLC (Equity Real Estate Investment Trusts (REITs)) | | | 927,229 | |
| | 371,741 | | | Irish Residential Properties REIT PLC (Equity Real Estate Investment Trusts (REITs)) | | | 479,493 | |
| | | | | | | | |
| | | | | | | 2,028,085 | |
| | |
| | Japan – 5.3% | |
| | 236 | | | Activia Properties, Inc. (Equity Real Estate Investment Trusts (REITs)) | | | 1,145,170 | |
| | |
| | |
| 62 | | The accompanying notes are an integral part of these financial statements. |
GOLDMAN SACHS MULTI-MANAGER REAL ASSETS STRATEGY FUND
| | | | | | | | |
Shares | | | Description | | Value | |
| | Common Stocks – (continued) | |
| | Japan – (continued) | |
| | 21 | | | Frontier Real Estate Investment Corp. (Equity Real Estate Investment Trusts (REITs)) | | $ | 98,776 | |
| | 51 | | | GLP J-REIT (Equity Real Estate Investment Trusts (REITs)) | | | 63,909 | |
| | 40 | | | Hoshino Resorts REIT, Inc. (Equity Real Estate Investment Trusts (REITs)) | | | 234,518 | |
| | 734 | | | Invincible Investment Corp. (Equity Real Estate Investment Trusts (REITs)) | | | 355,835 | |
| | 205 | | | Japan Excellent, Inc. (Equity Real Estate Investment Trusts (REITs)) | | | 286,790 | |
| | 331 | | | Japan Hotel REIT Investment Corp. (Equity Real Estate Investment Trusts (REITs)) | | | 223,316 | |
| | 162 | | | Japan Real Estate Investment Corp. (Equity Real Estate Investment Trusts (REITs)) | | | 938,116 | |
| | 683 | | | Japan Retail Fund Investment Corp. (Equity Real Estate Investment Trusts (REITs)) | | | 1,553,822 | |
| | 509 | | | Kenedix Retail REIT Corp. (Equity Real Estate Investment Trusts (REITs)) | | | 1,228,593 | |
| | 903 | | | LaSalle Logiport REIT (Equity Real Estate Investment Trusts (REITs)) | | | 958,008 | |
| | 131,000 | | | Mitsubishi Estate Co. Ltd. (Real Estate Management & Development) | | | 2,603,602 | |
| | 60,000 | | | Mitsui Fudosan Co. Ltd. (Real Estate Management & Development) | | | 1,366,434 | |
| | 111 | | | Nippon Building Fund, Inc. (Equity Real Estate Investment Trusts (REITs)) | | | 659,588 | |
| | 75 | | | Nippon Prologis REIT, Inc. (Equity Real Estate Investment Trusts (REITs)) | | | 169,737 | |
| | 81,547 | | | Sumitomo Realty & Development Co. Ltd. (Real Estate Management & Development) | | | 2,143,529 | |
| | 479,400 | | | Tokyo Gas Co. Ltd. (Gas Utilities) | | | 2,175,262 | |
| | | | | | | | |
| | | | | | | 16,205,005 | |
| | |
| | Luxembourg(a) – 0.2% | |
| | 19,870 | | | Ado Properties SA (Real Estate Management & Development) | | | 726,310 | |
| | |
| | Mexico – 1.6% | |
| | 1,140,530 | | | Infraestructura Energetica Nova SAB de CV (Gas Utilities) | | | 5,049,444 | |
| | |
| | Netherlands – 0.5% | |
| | 14,067 | | | Eurocommercial Properties NV (Equity Real Estate Investment Trusts (REITs)) | | | 598,481 | |
| | |
| | Common Stocks – (continued) | |
| | Netherlands – (continued) | |
| | 20,181 | | | Koninklijke Vopak NV (Oil, Gas & Consumable Fuels) | | $ | 1,018,586 | |
| | | | | | | | |
| | | | | | | 1,617,067 | |
| | |
| | Singapore – 2.0% | |
| | 828,600 | | | Cache Logistics Trust (Equity Real Estate Investment Trusts (REITs)) | | | 494,744 | |
| | 522,537 | | | ENN Energy Holdings Ltd. (Gas Utilities) | | | 2,456,613 | |
| | 321,400 | | | Frasers Logistics & Industrial Trust* (Equity Real Estate Investment Trusts (REITs)) | | | 222,853 | |
| | 584,200 | | | Global Logistic Properties Ltd. (Real Estate Management & Development) | | | 743,366 | |
| | 1,315,400 | | | Keppel REIT (Equity Real Estate Investment Trusts (REITs)) | | | 1,031,705 | |
| | 894,000 | | | Suntec Real Estate Investment Trust (Equity Real Estate Investment Trusts (REITs)) | | | 1,079,775 | |
| | | | | | | | |
| | | | | | | 6,029,056 | |
| | |
| | Spain – 2.8% | |
| | 44,659 | | | Axiare Patrimonio SOCIMI SA (Equity Real Estate Investment Trusts (REITs)) | | | 634,481 | |
| | 117,400 | | | Enagas SA (Gas Utilities) | | | 3,365,265 | |
| | 245,222 | | | Ferrovial SA (Construction & Engineering) | | | 4,764,137 | |
| | | | | | | | |
| | | | | | | 8,763,883 | |
| | |
| | Sweden – 0.6% | |
| | 20,501 | | | Atrium Ljungberg AB (Real Estate Management & Development) | | | 318,904 | |
| | 25,964 | | | Fabege AB (Real Estate
Management & Development) | | | 438,517 | |
| | 29,919 | | | Hufvudstaden AB Class A (Real Estate Management & Development) | | | 463,070 | |
| | 56,049 | | | Kungsleden AB (Real Estate Management & Development) | | | 353,407 | |
| | 18,406 | | | Pandox AB (Hotels, Restaurants & Leisure) | | | 291,818 | |
| | | | | | | | |
| | | | | | | 1,865,716 | |
| | |
| | Switzerland – 1.1% | |
| | 13,500 | | | Flughafen Zuerich AG (Transportation Infrastructure) | | | 2,481,623 | |
| | 8,645 | | | PSP Swiss Property AG (Real Estate Management & Development) | | | 773,542 | |
| | | | | | | | |
| | | | | | | 3,255,165 | |
| | |
| | United Kingdom – 8.1% | |
| | 66,433 | | | Big Yellow Group PLC (Equity Real Estate Investment Trusts (REITs)) | | | 562,051 | |
| | 5,426 | | | Derwent London PLC (Equity Real Estate Investment Trusts (REITs)) | | | 160,464 | |
| | |
| | |
| The accompanying notes are an integral part of these financial statements. | | 63 |
GOLDMAN SACHS MULTI-MANAGER REAL ASSETS STRATEGY FUND
Consolidated Schedule of Investments (continued)
October 31, 2016
| | | | | | | | |
Shares | | | Description | | Value | |
| | Common Stocks – (continued) | |
| | United Kingdom – (continued) | |
| | 376,895 | | | Empiric Student Property PLC (Equity Real Estate Investment Trusts (REITs)) | | $ | 510,912 | |
| | 12,032 | | | Great Portland Estates PLC (Equity Real Estate Investment Trusts (REITs)) | | | 87,303 | |
| | 96,901 | | | Hammerson PLC (Equity Real Estate Investment Trusts (REITs)) | | | 651,904 | |
| | 52,423 | | | Kennedy Wilson Europe Real Estate PLC (Real Estate Investment Trusts) | | | 650,708 | |
| | 75,969 | | | Land Securities Group PLC (Equity Real Estate Investment Trusts (REITs)) | | | 927,627 | |
| | 906,506 | | | National Grid PLC (Multi-Utilities) | | | 11,791,627 | |
| | 69,930 | | | Segro PLC (Equity Real Estate Investment Trusts (REITs)) | | | 374,549 | |
| | 149,249 | | | Severn Trent PLC (Water Utilities) | | | 4,248,549 | |
| | 62,042 | | | Shaftesbury PLC (Equity Real Estate Investment Trusts (REITs)) | | | 696,026 | |
| | 79,143 | | | The British Land Co. PLC (Equity Real Estate Investment Trusts (REITs)) | | | 566,616 | |
| | 351,565 | | | Tritax Big Box REIT PLC (Equity Real Estate Investment Trusts (REITs)) | | | 584,369 | |
| | 271,032 | | | United Utilities Group PLC (Water Utilities) | | | 3,115,478 | |
| | | | | | | | |
| | | | | | | 24,928,183 | |
| | |
| | United States – 49.3% | |
| | 20,135 | | | Acadia Realty Trust (Equity Real Estate Investment Trusts (REITs)) | | | 678,348 | |
| | 22,493 | | | Alexandria Real Estate Equities, Inc. (Equity Real Estate Investment Trusts (REITs)) | | | 2,424,970 | |
| | 38,263 | | | American Campus Communities, Inc. (Equity Real Estate Investment Trusts (REITs)) | | | 1,993,885 | |
| | 73,700 | | | American Tower Corp. (Equity Real Estate Investment Trusts (REITs)) | | | 8,636,903 | |
| | 17,723 | | | Care Capital Properties, Inc. (Equity Real Estate Investment Trusts (REITs)) | | | 470,900 | |
| | 122,264 | | | Cheniere Energy, Inc.* (Oil, Gas & Consumable Fuels) | | | 4,609,353 | |
| | 43,959 | | | Chesapeake Lodging Trust (Equity Real Estate Investment Trusts (REITs)) | | | 954,350 | |
| | 30,250 | | | Community Healthcare Trust, Inc. (Equity Real Estate Investment Trusts (REITs)) | | | 676,995 | |
| | 22,900 | | | Consolidated Edison, Inc. (Multi-Utilities) | | | 1,730,095 | |
| | 9,523 | | | CoreSite Realty Corp. (Equity Real Estate Investment Trusts (REITs)) | | | 702,226 | |
| | 23,104 | | | Cousins Properties, Inc. (Equity Real Estate Investment Trusts (REITs)) | | | 179,518 | |
| | 90,002 | | | Crown Castle International Corp. (Equity Real Estate Investment Trusts (REITs)) | | | 8,189,282 | |
| | 28,285 | | | CSX Corp. (Road & Rail) | | | 862,975 | |
| | 52,784 | | | CubeSmart (Equity Real Estate Investment Trusts (REITs)) | | | 1,376,079 | |
| | |
| | Common Stocks – (continued) | |
| | United States – (continued) | |
| | 26,115 | | | CyrusOne, Inc. (Equity Real Estate Investment Trusts (REITs)) | | $ | 1,164,990 | |
| | 58,073 | | | DiamondRock Hospitality Co. (Equity Real Estate Investment Trusts (REITs)) | | | 531,368 | |
| | 826 | | | Digital Realty Trust, Inc. (Equity Real Estate Investment Trusts (REITs)) | | | 77,173 | |
| | 85,098 | | | Duke Realty Corp. (Equity Real Estate Investment Trusts (REITs)) | | | 2,225,313 | |
| | 53,235 | | | Empire State Realty Trust, Inc. Class A (Equity Real Estate Investment Trusts (REITs)) | | | 1,041,809 | |
| | 166,446 | | | Enbridge Energy Management LLC* (Oil, Gas & Consumable Fuels) | | | 4,064,611 | |
| | 26,693 | | | Equity LifeStyle Properties, Inc. (Equity Real Estate Investment Trusts (REITs)) | | | 2,024,397 | |
| | 55,346 | | | Equity One, Inc. (Equity Real Estate Investment Trusts (REITs)) | | | 1,577,361 | |
| | 54,106 | | | Equity Residential (Equity Real Estate Investment Trusts (REITs)) | | | 3,341,046 | |
| | 13,341 | | | Essex Property Trust, Inc. (Equity Real Estate Investment Trusts (REITs)) | | | 2,856,175 | |
| | 129,827 | | | Eversource Energy (Electric Utilities) | | | 7,148,275 | |
| | 37,096 | | | Extra Space Storage, Inc. (Equity Real Estate Investment Trusts (REITs)) | | | 2,713,572 | |
| | 21,114 | | | Federal Realty Investment Trust (Equity Real Estate Investment Trusts (REITs)) | | | 3,066,386 | |
| | 151,860 | | | First Potomac Realty Trust (Equity Real Estate Investment Trusts (REITs)) | | | 1,354,591 | |
| | 80,709 | | | Four Corners Property Trust, Inc. (Equity Real Estate Investment Trusts (REITs)) | | | 1,620,637 | |
| | 103,793 | | | General Growth Properties, Inc. (Equity Real Estate Investment Trusts (REITs)) | | | 2,589,635 | |
| | 9,498 | | | HCP, Inc. (Equity Real Estate Investment Trusts (REITs)) | | | 325,307 | |
| | 68,426 | | | Hudson Pacific Properties, Inc. (Equity Real Estate Investment Trusts (REITs)) | | | 2,300,482 | |
| | 14,733 | | | Kilroy Realty Corp. (Equity Real Estate Investment Trusts (REITs)) | | | 1,058,271 | |
| | 315,413 | | | Kinder Morgan, Inc. (Oil, Gas & Consumable Fuels) | | | 6,443,888 | |
| | 65,740 | | | MedEquities Realty Trust, Inc.* (Equity Real Estate Investment Trusts (REITs)) | | | 761,927 | |
| | 48,079 | | | MGM Growth Properties LLC Class A (Equity Real Estate Investment Trusts (REITs)) | | | 1,265,439 | |
| | 137,156 | | | Monogram Residential Trust, Inc. (Equity Real Estate Investment Trusts (REITs)) | | | 1,445,624 | |
| | 36,462 | | | National Retail Properties, Inc. (Equity Real Estate Investment Trusts (REITs)) | | | 1,663,397 | |
| | 158,541 | | | New York REIT, Inc. (Equity Real Estate Investment Trusts (REITs)) | | | 1,493,456 | |
| | 109,317 | | | NiSource, Inc. (Multi-Utilities) | | | 2,542,714 | |
| | 61,199 | | | NorthWestern Corp. (Multi-Utilities) | | | 3,522,003 | |
| | |
| | |
| 64 | | The accompanying notes are an integral part of these financial statements. |
GOLDMAN SACHS MULTI-MANAGER REAL ASSETS STRATEGY FUND
| | | | | | | | |
Shares | | | Description | | Value | |
| | Common Stocks – (continued) | |
| | United States – (continued) | |
| | 114,104 | | | Pattern Energy Group, Inc. (Independent Power and Renewable Electricity Producers) | | $ | 2,550,224 | |
| | 106,264 | | | PG&E Corp. (Electric Utilities) | | | 6,601,120 | |
| | 77,581 | | | Physicians Realty Trust (Equity Real Estate Investment Trusts (REITs)) | | | 1,533,776 | |
| | 30,829 | | | ProLogis, Inc. (Equity Real Estate Investment Trusts (REITs)) | | | 1,608,041 | |
| | 5,167 | | | Public Storage (Equity Real Estate Investment Trusts (REITs)) | | | 1,104,291 | |
| | 14,430 | | | Regency Centers Corp. (Equity Real Estate Investment Trusts (REITs)) | | | 1,039,970 | |
| | 35,900 | | | Republic Services, Inc. (Commercial Services & Supplies) | | | 1,889,417 | |
| | 134,895 | | | Retail Properties of America, Inc. Class A (Equity Real Estate Investment Trusts (REITs)) | | | 2,100,315 | |
| | 50,607 | | | Rexford Industrial Realty, Inc. (Equity Real Estate Investment Trusts (REITs)) | | | 1,065,784 | |
| | 30,913 | | | SBA Communications Corp. Class A* (Diversified Telecommunication Services) | | | 3,501,825 | |
| | 64,203 | | | Sempra Energy (Multi-Utilities) | | | 6,876,141 | |
| | 21,644 | | | Simon Property Group, Inc. (Equity Real Estate Investment Trusts (REITs)) | | | 4,024,918 | |
| | 4,731 | | | SL Green Realty Corp. (Equity Real Estate Investment Trusts (REITs)) | | | 464,679 | |
| | 56,048 | | | STORE Capital Corp. (Equity Real Estate Investment Trusts (REITs)) | | | 1,529,550 | |
| | 25,723 | | | Sun Communities, Inc. (Equity Real Estate Investment Trusts (REITs)) | | | 1,978,870 | |
| | 102,198 | | | Sunstone Hotel Investors, Inc. (Equity Real Estate Investment Trusts (REITs)) | | | 1,283,607 | |
| | 24,851 | | | Taubman Centers, Inc. (Equity Real Estate Investment Trusts (REITs)) | | | 1,800,704 | |
| | 25,735 | | | The Macerich Co. (Equity Real Estate Investment Trusts (REITs)) | | | 1,821,523 | |
| | 113,800 | | | The Williams Cos., Inc. (Oil, Gas & Consumable Fuels) | | | 3,322,960 | |
| | 55,280 | | | Union Pacific Corp. (Road & Rail) | | | 4,874,590 | |
| | 47,524 | | | Ventas, Inc. (Equity Real Estate Investment Trusts (REITs)) | | | 3,219,751 | |
| | 24,580 | | | Vornado Realty Trust (Equity Real Estate Investment Trusts (REITs)) | | | 2,280,532 | |
| | 26,683 | | | Welltower, Inc. (Equity Real Estate Investment Trusts (REITs)) | | | 1,828,586 | |
| | | | | | | | |
| | | | | | | 152,006,900 | |
| | |
| | TOTAL COMMON STOCKS | |
| | (Cost $285,697,312) | | $ | 296,725,653 | |
| | |
| | | | | | | | | | |
Units | | Description | | Expiration
Month | | | Value | |
| Rights* – 0.0% | |
| Spain – 0.0% | |
| 245,222 | | Ferrovial SA
(Construction &
Engineering) | | | 11/18/16 | | | $ | 104,985 | |
| |
| TOTAL RIGHTS | | | | | | | | |
| (Cost $109,900) | | | | | | $ | 104,985 | |
| |
| TOTAL INVESTMENTS BEFORE SHORT-TERM INVESTMENT | |
| (Cost $285,807,212) | | | | | | $ | 296,830,638 | |
| |
| | | | | | | | | | |
Shares | | Description | | Expiration
Month | | | Value | |
| Short-term Investment(b) – 3.5% | |
Joint Repurchase Agreement Account II | |
| $10,600,000 | | 0.338% | | | 11/01/16 | | | $ | 10,600,000 | |
| (Cost $10,600,000) | |
| |
| TOTAL INVESTMENTS — 99.7% | |
| (Cost $296,407,212) | | | $ | 307,430,638 | |
| |
OTHER ASSETS IN EXCESS OF
LIABILITIES — 0.3% | | | | 944,532 | |
| |
| NET ASSETS — 100.0% | | | $ | 308,375,170 | |
| |
| | |
| The percentage shown for each investment category reflects the value of investments in that category as a percentage of net assets. |
* | | Non-income producing security. |
(a) | | Securities are exempt from registration under Rule 144A of the Securities Act of 1933. Under procedures approved by the Board of Trustees, such securities have been determined to be liquid by the Investment Adviser and may be resold, normally to qualified institutional buyers in transactions exempt from registration. Total market value of Rule 144A securities amounts to $ 726,310, which represents approximately 0.2% of net assets as of October 31, 2016. |
(b) | | Joint repurchase agreement was entered into on October 31, 2016. Additional information appears on pages 66-67. |
| | |
| The accompanying notes are an integral part of these financial statements. | | 65 |
GOLDMAN SACHS STRATEGIC MULTI-ASSET CLASS FUNDS
Consolidated Schedule of Investments (continued)
October 31, 2016
|
| ADDITIONAL INVESTMENT INFORMATION |
JOINT REPURCHASE AGREEMENT ACCOUNT II — At October 31, 2016, the Funds had undivided interests in the Joint Repurchase Agreement Account II, with a maturity date of November 1, 2016, as follows:
| | | | | | | | | | | | |
| Fund | | Principal
Amount | | | Maturity
Value | | | Collateral
Allocation
Value | |
Multi-Manager Global Equity | | $ | 35,100,000 | | | $ | 35,100,378 | | | $ | 35,802,001 | |
Multi-Manager Non-Core Fixed Income | | | 35,400,000 | | | | 35,400,382 | | | | 36,108,001 | |
Multi-Manager Real Assets Strategy | | | 10,600,000 | | | | 10,600,114 | | | | 10,812,000 | |
REPURCHASE AGREEMENTS — At October 31, 2016, the Principal Amount of the Funds’ interest in the Joint Repurchase Agreement Account II was as follows:
| | | | | | | | | | | | | | | | |
| Counterparty | | Interest
Rate | | | Multi-Manager
Global Equity | | | Multi-Manager
Non-Core
Fixed Income | | | Multi-Manager
Real Assets
Strategy | |
BNP Paribas Securities Co. | | | 0.340 | % | | $ | 107,293 | | | $ | 108,210 | | | $ | 32,402 | |
Citigroup Global Markets, Inc. | | | 0.340 | | | | 6,345,590 | | | | 6,399,825 | | | | 1,916,332 | |
Merrill Lynch & Co., Inc. | | | 0.340 | | | | 25,392,576 | | | | 25,609,607 | | | | 7,668,413 | |
Merrill Lynch & Co., Inc. | | | 0.320 | | | | 3,254,541 | | | | 3,282,358 | | | | 982,853 | |
| TOTAL | | | $ | 35,100,000 | | | $ | 35,400,000 | | | $ | 10,600,000 | |
| | |
| 66 | | The accompanying notes are an integral part of these financial statements. |
GOLDMAN SACHS STRATEGIC MULTI-ASSET CLASS FUNDS
|
| ADDITIONAL INVESTMENT INFORMATION (continued) |
At October 31, 2016, the Joint Repurchase Agreement Account II was fully collateralized by:
| | | | | | | | |
| Issuer | | Interest Rates | | | Maturity Dates | |
Federal Home Loan Mortgage Corp. | | | 3.500% to 8.000 | % | | | 01/01/17 to 08/01/46 | |
Federal National Mortgage Association | | | 2.500 to 9.000 | | | | 02/01/17 to 10/01/46 | |
Government National Mortgage Association | | | 2.500 to 7.500 | | | | 02/15/25 to 10/20/46 | |
United States Treasury Inflation Protected Securities | | | 0.750 | | | | 02/15/42 | |
U.S. Treasury Bonds | | | 3.125 to 8.750 | | | | 08/15/20 to 05/15/44 | |
U.S. Treasury Notes | | | 0.875 to 4.250 | | | | 11/15/17 to 07/31/23 | |
United States Treasury Stripped Securities | | | 0.000 | | | | 02/15/29 | |
| | |
| The accompanying notes are an integral part of these financial statements. | | 67 |
GOLDMAN SACHS STRATEGIC MULTI-ASSET CLASS FUNDS
Statements of Assets and Liabilities
October 31, 2016
| | | | | | | | | | | | | | |
| | | | | Multi-Manager
Global Equity
Fund | | | Multi-Manager
Non-Core Fixed
Income Fund | | | Multi-Manager
Real Assets
Strategy Fund(a) | |
| | Assets: | |
| | Investments, at value (cost $606,116,673, $272,205,431 and $285,807,212) | | $ | 613,788,056 | | | $ | 276,810,527 | | | $ | 296,830,638 | |
| | Repurchase agreement, at value which equals cost | | | 35,100,000 | | | | 35,400,000 | | | | 10,600,000 | |
| | Cash | | | 699,014 | | | | — | | | | — | |
| | Foreign currencies, at value (cost $582,044, $666,110 and $90,159, respectively) | | | 581,006 | | | | 660,264 | | | | 89,689 | |
| | Unrealized gain on forward foreign currency exchange contracts | | | 5,532,160 | | | | 280,787 | | | | — | |
| | Variation margin on certain derivative contracts | | | — | | | | 201,707 | | | | — | |
| | Unrealized gain on swap contracts | | | — | | | | 82,262 | | | | — | |
| | Receivables: | | | | | | | | | | | | |
| | Investments sold | | | 4,285,283 | | | | 4,528,114 | | | | 2,725,723 | |
| | Dividends and interest | | | 665,411 | | | | 3,523,608 | | | | 444,309 | |
| | Foreign tax reclaims | | | 246,323 | | | | 26,592 | | | | 73,423 | |
| | Reimbursement from investment adviser | | | 135,075 | | | | 113,587 | | | | — | |
| | Investments sold on an extended-settlement basis | | | — | | | | 2,900,320 | | | | — | |
| | Due from broker — upfront payment | | | — | | | | 70,842 | | | | — | |
| | Collateral on certain derivative contracts(b) | | | — | | | | 120,031 | | | | — | |
| | Upfront payments made on swap contracts | | | — | | | | 283,028 | | | | — | |
| | Other assets | | | 5,923 | | | | 3,962 | | | | 4,224 | |
| | Total assets | | | 661,038,251 | | | | 325,005,631 | | | | 310,768,006 | |
| | | | | | | | | | | | | | |
| | Liabilities: | |
| | Due to custodian | | | — | | | | 2,599,083 | | | | 75,021 | |
| | Unrealized loss on forward foreign currency exchange contracts | | | 13,369 | | | | 405,118 | | | | — | |
| | Unrealized loss on swap contracts | | | — | | | | 98,370 | | | | — | |
| | Variation margin on certain derivative contracts | | | — | | | | 11,830 | | | | — | |
| | Payables: | | | | | | | | | | | | |
| | Fund shares redeemed | | | 50,514,921 | | | | 6,201,961 | | | | — | |
| | Investments purchased | | | 4,624,495 | | | | 1,780,195 | | | | 1,852,951 | |
| | Management fees | | | 320,969 | | | | 142,174 | | | | 157,831 | |
| | Due to investment advisor | | | — | | | | — | | | | 45,320 | |
| | Transfer agency fees | | | 11,279 | | | | 5,259 | | | | 5,283 | |
| | Collateral on certain derivative contracts | | | — | | | | 300,000 | | | | — | |
| | Investments purchased on an extended-settlement basis | | | — | | | | 8,958,771 | | | | — | |
| | Upfront payments received on swap contracts | | | — | | | | 116,885 | | | | — | |
| | Accrued expenses and other liabilities | | | 500,376 | | | | 340,121 | | | | 256,430 | |
| | Total liabilities | | | 55,985,409 | | | | 20,959,767 | | | | 2,392,836 | |
| | | | | | | | | | | | | | |
| | Net Assets: | |
| | Paid-in capital | | | 608,010,121 | | | | 304,565,450 | | | | 302,479,182 | |
| | Undistributed (distributions in excess of) net investment income | | | 2,856,628 | | | | (3,346,104 | ) | | | (98,606 | ) |
| | Accumulated net realized loss | | | (18,980,134 | ) | | | (1,556,546 | ) | | | (5,021,494 | ) |
| | Net unrealized gain | | | 13,166,227 | | | | 4,383,064 | | | | 11,016,088 | |
| | NET ASSETS | | $ | 605,052,842 | | | $ | 304,045,864 | | | $ | 308,375,170 | |
| | Shares Outstanding $0.001 par value (unlimited number of shares authorized): | | | 63,762,142 | | | | 31,685,607 | | | | 33,649,786 | |
| | Net asset value, offering and redemption price per share: | | | $9.49 | | | | $9.60 | | | | $9.17 | |
| | (a) | | Statement of Assets and Liabilities for the Multi-Manager Real Assets Strategy Fund is consolidated and includes the balances of a wholly-owned subsidiary, Cayman Commodity — MMRA, Ltd. Accordingly, all interfund balances and transactions have been eliminated. |
| | (b) | | Includes amounts segregated for initial margin and/or collateral on futures transactions and swaps transactions of $58,676, and $61,355, respectively, for Multi-Manager Non-Core Fixed Income Fund. |
| | |
| 68 | | The accompanying notes are an integral part of these financial statements. |
GOLDMAN SACHS STRATEGIC MULTI-ASSET CLASS FUNDS
Statements of Operations
For the Fiscal Year Ended October 31, 2016
| | | | | | | | | | | | | | |
| | | | | Multi-Manager
Global Equity
Fund | | | Multi-Manager
Non-Core Fixed
Income Fund | | | Multi-Manager
Real Assets
Strategy Fund(a) | |
| | Investment income: | |
| | Dividends (net of foreign withholding taxes of $856,130, $0 and $448,990) | | $ | 12,558,357 | | | $ | 108,102 | | | $ | 8,351,772 | |
| | Interest (net of foreign withholding taxes of $0, $199,738 and $0) | | | 118,299 | | | | 16,211,715 | | | | 40,493 | |
| | Total investment income | | | 12,676,656 | | | | 16,319,817 | | | | 8,392,265 | |
| | | | | | | | | | | | | | |
| | Expenses: | |
| | Management fees | | | 6,393,585 | | | | 2,469,231 | | | | 2,972,336 | |
| | Custody, accounting and administrative services | | | 994,235 | | | | 435,630 | | | | 388,284 | |
| | Professional fees | | | 269,005 | | | | 256,524 | | | | 290,843 | |
| | Trustee fees | | | 126,830 | | | | 109,513 | | | | 102,221 | |
| | Transfer Agency fees | | | 124,147 | | | | 58,100 | | | | 59,447 | |
| | Registration fees | | | 78,128 | | | | 57,675 | | | | 50,859 | |
| | Printing and mailing costs | | | 39,158 | | | | 14,533 | | | | 20,119 | |
| | Other | | | 106,197 | | | | 76,961 | | | | 66,345 | |
| | Total expenses | | | 8,131,285 | | | | 3,478,167 | | | | 3,950,454 | |
| | Less — expense reductions | | | (2,843,398 | ) | | | (1,433,576 | ) | | | (1,373,547 | ) |
| | Net expenses | | | 5,287,887 | | | | 2,044,591 | | | | 2,576,907 | |
| | NET INVESTMENT INCOME | | | 7,388,769 | | | | 14,275,226 | | | | 5,815,358 | |
| | | | | | | | | | | | | | |
| | Realized and unrealized gain (loss): | |
| | Net realized gain (loss) from: | | | | | | | | | | | | |
| | Investments | | | (17,619,579 | ) | | | (2,162,975 | ) | | | (1,494,060 | ) |
| | Futures contracts | | | — | | | | 62,663 | | | | (13,365,473 | ) |
| | Swap contracts | | | — | | | | (165,154 | ) | | | — | |
| | Forward foreign currency exchange contracts | | | (2,974,663 | ) | | | (808,614 | ) | | | (3 | ) |
| | Foreign currency transactions | | | (848,339 | ) | | | 67,368 | | | | (233,020 | ) |
| | Net change in unrealized gain (loss) on: | | | | | | | | | | | | |
| | Investments | | | 21,435,405 | | | | 10,652,141 | | | | 7,656,591 | |
| | Futures contracts | | | — | | | | 3,445 | | | | (85,229 | ) |
| | Swap contracts | | | — | | | | (83,135 | ) | | | — | |
| | Forward foreign currency exchange contracts | | | 5,153,952 | | | | 106,144 | | | | — | |
| | Foreign currency translation | | | (22,323 | ) | | | (31,429 | ) | | | (8,021 | ) |
| | Net realized and unrealized gain (loss) | | | 5,124,453 | | | | 7,640,454 | | | | (7,529,215 | ) |
| | NET INCREASE (DECREASE) IN NET ASSETS RESULTING FROM OPERATIONS | | $ | 12,513,222 | | | $ | 21,915,680 | | | $ | (1,713,857 | ) |
| | (a) | | Statement of Operations for the Multi-Manager Real Assets Strategy Fund is consolidated and includes the balances of a wholly-owned subsidiary, Cayman Commodity — MMRA, Ltd. Accordingly, all interfund balances and transactions have been eliminated. |
| | |
| The accompanying notes are an integral part of these financial statements. | | 69 |
GOLDMAN SACHS STRATEGIC MULTI-ASSET CLASS FUNDS
Statements of Changes in Net Assets
| | | | | | | | | | |
| | | | | Multi-Manager Global Equity Fund | |
| | | | | For the Fiscal
Year Ended
October 31, 2016 | | | For the Fiscal
Year Ended
October 31, 2015(a) | |
| | From operations: | |
| | Net investment income | | $ | 7,388,769 | | | $ | 959,728 | |
| | Net realized loss | | | (21,442,581 | ) | | | (404,386 | ) |
| | Net change in unrealized gain (loss) | | | 26,567,034 | | | | (13,400,807 | ) |
| | Net increase (decrease) in net assets resulting from operations | | | 12,513,222 | | | | (12,845,465 | ) |
| | | | | | | | | | |
| | Distributions to shareholders: | |
| | From net investment income | | | (2,625,036 | ) | | | — | |
| | Total distributions to shareholders | | | (2,625,036 | ) | | | — | |
| | | | | | | | | | |
| | From share transactions: | |
| | Proceeds from sales of shares | | | 232,750,015 | | | | 453,850,015 | |
| | Reinvestment of distributions | | | 2,625,036 | | | | — | |
| | Cost of shares redeemed | | | (79,364,935 | ) | | | (1,850,010 | ) |
| | Net increase in net assets resulting from share transactions | | | 156,010,116 | | | | 452,000,005 | |
| | TOTAL INCREASE | | | 165,898,302 | | | | 439,154,540 | |
| | | | | | | | | | |
| | Net assets: | |
| | Beginning of year | | | 439,154,540 | | | | — | |
| | End of year | | $ | 605,052,842 | | | $ | 439,154,540 | |
| | Undistributed net investment income | | $ | 2,856,628 | | | $ | 1,604,703 | |
| | (a) | | Commenced operations on June 24, 2015. |
| | |
| 70 | | The accompanying notes are an integral part of these financial statements. |
GOLDMAN SACHS STRATEGIC MULTI-ASSET CLASS FUNDS
| | | | | | | | | | | | | | | | | | |
| | | | | Multi-Manager Non-Core Fixed Income Fund | | | Multi-Manager Real Assets Strategy Fund(a) | |
| | | | | For the Fiscal
Year Ended
October 31, 2016 | | | For the Fiscal
Year Ended
October 31, 2015(b) | | | For the Fiscal
Year Ended
October 31, 2016 | | | For the Fiscal
Year Ended
October 31, 2015(c) | |
| | From operations: | |
| | Net investment income | | $ | 14,275,226 | | | $ | 4,681,847 | | | $ | 5,815,358 | | | $ | 322,872 | |
| | Net realized loss | | | (3,006,712 | ) | | | (3,180,605 | ) | | | (15,092,556 | ) | | | (7,646,597 | ) |
| | Net change in unrealized gain (loss) | | | 10,647,166 | | | | (6,264,102 | ) | | | 7,563,341 | | | | 3,452,747 | |
| | Net increase (decrease) in net assets resulting from operations | | | 21,915,680 | | | | (4,762,860 | ) | | | (1,713,857 | ) | | | (3,870,978 | ) |
| | | | | | | | | | | | | | | | | | |
| | Distributions to shareholders: | |
| | From net investment income | | | (13,242,128 | ) | | | (4,430,278 | ) | | | (6,496,622 | ) | | | — | |
| | From Capital | | | (938,032 | ) | | | (181,066 | ) | | | — | | | | — | |
| | Total distributions to shareholders | | | (14,180,160 | ) | | | (4,611,344 | ) | | | (6,496,622 | ) | | | — | |
| | | | | | | | | | | | | | | | | | |
| | From share transactions: | |
| | Proceeds from sales of shares | | | 21,565,005 | | | | 277,000,010 | | | | 117,600,015 | | | | 201,300,015 | |
| | Reinvestment of distributions | | | 14,180,160 | | | | 4,611,344 | | | | 6,496,622 | | | | — | |
| | Cost of shares redeemed | | | (10,121,966 | ) | | | (1,550,005 | ) | | | (4,940,015 | ) | | | (10 | ) |
| | Net increase in net assets resulting from share transactions | | | 25,623,199 | | | | 280,061,349 | | | | 119,156,622 | | | | 201,300,005 | |
| | TOTAL INCREASE | | | 33,358,719 | | | | 270,687,145 | | | | 110,946,143 | | | | 197,429,027 | |
| | | | | | | | | | | | | | | | | | |
| | Net assets: | |
| | Beginning of year | | | 270,687,145 | | | | — | | | | 197,429,027 | | | | — | |
| | End of year | | $ | 304,045,864 | | | $ | 270,687,145 | | | $ | 308,375,170 | | | $ | 197,429,027 | |
| | Undistributed (distributions in excess of) net investment income: | | $ | (3,346,104 | ) | | $ | (1,244,225 | ) | | $ | (98,606 | ) | | $ | 52,137 | |
| | (a) | | Statement of Changes in Net Assets for the Multi-Manager Real Assets Strategy Fund is consolidated and includes the balances of wholly-owned subsidiary, Cayman Commodity — MMRA, Ltd. Accordingly, all interfund balances and transactions have been eliminated. |
| | (b) | | Commenced operations March 31, 2015. |
| | (c) | | Commenced operations on June 30, 2015. |
| | |
| The accompanying notes are an integral part of these financial statements. | | 71 |
GOLDMAN SACHS MULTI-MANAGER GLOBAL EQUITY FUND
Financial Highlights
Selected Data for a Share Outstanding Throughout Each Year
| | | | | | | | | | | | | | | | | | | | | | |
| | | | | | Income from
investment operations | | | | |
| | | Year - Share Class | | Net asset
value,
beginning
of year | | | Net
investment
income(a) | | | Net realized
and unrealized
gain (loss) | | | Total from
investment
operations | | | Distribution
to shareholders
from net
investment
income | |
| | FOR THE FISCAL YEARS ENDED OCTOBER 31, | |
| | 2016 - Institutional | | $ | 9.46 | | | $ | 0.11 | | | $ | (0.04 | ) | | $ | 0.07 | | | $ | (0.04 | ) |
| | | | | | | | | | | | | | | | | | | | | | |
| | FOR THE PERIOD ENDED OCTOBER 31, 2015 | |
| | 2015 - Institutional (Commence June 24, 2015) | | | 10.00 | | | | 0.02 | | | | (0.56 | ) | | | (0.54 | ) | | | — | |
| | (a) | | Calculated based on the average shares outstanding methodology. |
| | (b) | | Assumes investment at the NAV at the beginning of the period, reinvestment of all dividends and distributions, a complete redemption of the investment at the NAV at the end of the period and no sales or redemption charges. Total returns would be reduced if a sales or redemption charge was taken into account. Returns do not reflect the impact of taxes to shareholders relating to Fund distributions or the redemption of Fund shares. Total returns for periods less than one full year are not annualized. |
| | (c) | | The Fund’s portfolio turnover rate is calculated in accordance with regulatory requirements, without regard to transactions involving short term investments and certain derivatives. If such transactions were included, the Fund’s portfolio turnover rate may be higher. |
| | |
| 72 | | The accompanying notes are an integral part of these financial statements. |
GOLDMAN SACHS MULTI-MANAGER GLOBAL EQUITY FUND
| | | | | | | | | | | | | | | | | | | | | | | | | | | | | | | | | | | | | | | | |
| | | | | | | | | | | | | | | | | | | | | | | | | | | | | | | | | | |
| | | Net asset value, end
of year | | | | | Total
return(b) | | | | | Net assets,
end of
year
(in 000s) | | | | | Ratio of
net expenses
to average
net assets | | | | | Ratio of
total expenses
to average
net assets | | | | | Ratio of
net investment
income
to average
net assets | | | | | Portfolio
turnover
rate(c) | |
| | | | | | | | | | | | | | | | | | | | | | | | | | | | | | | | | | | | | | | | |
| | $ | 9.49 | | | | | | 0.74 | % | | | | $ | 605,053 | | | | | | 0.85 | % | | | | | 1.31 | % | | | | | 1.19 | % | | | | | 47 | % |
| | | | | | | | | | | | | | | | | | | | | | | | | | | | | | | | | | | | | | | | |
| | | | | | | | | | | | | | | | | | | | | | | | | | | | | | | | | | | | | | | | |
| | | 9.46 | | | | | | (5.40 | ) | | | | | 439,155 | | | | | | 0.85 | (d) | | | | | 1.34 | (d) | | | | | 0.74 | (d) | | | | | 10 | |
| | |
| The accompanying notes are an integral part of these financial statements. | | 73 |
GOLDMAN SACHS MULTI-MANAGER NON-CORE FIXED INCOME FUND
Financial Highlights
Selected Data for a Share Outstanding Throughout Each Year
| | | | | | | | | | | | | | | | | | | | | | | | | | | | | | |
| | | | | | | | Income (loss) from
investment operations | | | Distributions
to shareholders | |
| | | Year - Share Class | | Net asset
value,
beginning
of year | | | Net
investment
income(a) | | | Net realized
and unrealized
gain (loss) | | | Total from
investment
operations | | | From net
investment
income | | | From
capital | | | Total
distributions | |
| | FOR THE FISCAL YEARS ENDED OCTOBER 31, | |
| | 2016 - Institutional | | $ | 9.37 | | | $ | 0.46 | | | $ | 0.23 | | | $ | 0.69 | | | $ | (0.43 | ) | | $ | (0.03 | ) | | $ | (0.46 | ) |
| | | | | | | | | | | | | | | | | | | | | | | | | | | | | | |
| | FOR THE PERIOD ENDED OCTOBER 31, | |
| | 2016 - Institutional (Commenced March 31, 2015) | | | 10.00 | | | | 0.25 | | | | (0.63 | ) | | | (0.38 | ) | | | (0.24 | ) | | | (0.01 | ) | | | (0.25 | ) |
| | (a) | | Calculated based on the average shares outstanding methodology. |
| | (b) | | Assumes investment at the NAV at the beginning of the period, reinvestment of all dividends and distributions, a complete redemption of the investment at the NAV at the end of the period and no sales or redemption charges. Total returns would be reduced if a sales or redemption charge was taken into account. Returns do not reflect the impact of taxes to shareholders relating to Fund distributions or the redemption of Fund shares. Total returns for periods less than one full year are not annualized. |
| | (c) | | The Fund’s portfolio turnover rate is calculated in accordance with regulatory requirements, without regard to transactions involving short term investments and certain derivatives. If such transactions were included, the Fund’s portfolio turnover rate may be higher. |
| | |
| 74 | | The accompanying notes are an integral part of these financial statements. |
GOLDMAN SACHS MULTI-MANAGER NON-CORE FIXED INCOME FUND
| | | | | | | | | | | | | | | | | | | | | | | | | | | | | | | | | | | | | | | | |
| | | | | | | | | | | | | | | | | | | | | | | | | | | | | | | | | | |
| | | Net asset
value, end
of year | | | | | Total
return(b) | | | | | Net assets,
end of
year
(in 000s) | | | | | Ratio of
net expenses
to average
net assets | | | | | Ratio of
total expenses
to average
net assets | | | | | Ratio of
net investment
income
to average
net assets | | | | | Portfolio
turnover
rate(c) | |
| | | | | | | | | | | | | | | | | | | | | | | | | | | | | | | | | | | | | | | | |
| | $ | 9.60 | | | | | | 7.54 | % | | | | $ | 304,046 | | | | | | 0.70 | % | | | | | 1.20 | % | | | | | 4.91 | % | | | | | 96 | % |
| | | | | | | | | | | | | | | | | | | | | | | | | | | | | | | | | | | | | | | | |
| | | | | | | | | | | | | | | | | | | | | | | | | | | | | | | | | | | | | | | | |
| | | 9.37 | | | | | | (3.84 | ) | | | | | 270,687 | | | | | | 0.70 | (d) | | | | | 1.19 | (d) | | | | | 4.45 | (d) | | | | | 82 | |
| | |
| The accompanying notes are an integral part of these financial statements. | | 75 |
GOLDMAN SACHS MULTI-MANAGER REAL ASSETS STRATEGY FUND
Consolidated Financial Highlights
Selected Data for a Share Outstanding Throughout Each Year
| | | | | | | | | | | | | | | | | | | | | | |
| | | | | | | | Income (loss) from
investment operations | | | | |
| | | Year - Share Class | | Net asset
value,
beginning
of year | | | Net
investment
income(a) | | | Net realized
and unrealized
gain (loss) | | | Total from
investment
operations | | | Distributions
to shareholders
from net
investment
income | |
| | FOR THE FISCAL YEAR ENDED OCTOBER 31, | |
| | 2016 - Institutional | | $ | 9.57 | | | $ | 0.18 | | | $ | (0.38 | ) | | $ | (0.20 | ) | | $ | (0.20 | ) |
| | | | | | | | | | | | | | | | | | | | | | |
| | FOR THE PERIOD ENDED OCTOBER 31, | |
| | 2015 - Institutional (Commenced June 30, 2015) | | | 10.00 | | | | 0.02 | | | | (0.45 | ) | | | (0.43 | ) | | | — | |
| | (a) | | Calculated based on the average shares outstanding methodology. |
| | (b) | | Assumes investment at the net asset value at the beginning of the period, reinvestment of all dividends and distributions, a complete redemption of the investment at the net asset value at the end of the period and no sales or redemption charges. Total returns would be reduced if a sales or redemption charge was taken into account. Returns do not reflect the impact of taxes to shareholders relating to Fund distributions or the redemption of Fund shares. Total returns for periods less than one full year are not annualized. |
| | (c) | | The Fund’s portfolio turnover rate is calculated in accordance with regulatory requirements, without regard to transactions involving short term investments and certain derivatives. If such transactions were included, the Fund’s portfolio turnover rate may be higher. |
| | |
| 76 | | The accompanying notes are an integral part of these financial statements. |
GOLDMAN SACHS MULTI-MANAGER REAL ASSETS STRATEGY FUND
| | | | | | | | | | | | | | | | | | | | | | | | | | | | | | | | | | | | | | | | |
| | | | | | | | | | | | | | | | | | | | | | | | | | | | | | | | | | |
| | | Net asset value, end of year | | | | | Total
return(b) | | | | | Net assets,
end of
year
(in 000s) | | | | | Ratio of
net expenses
to average
net assets | | | | | Ratio of
total expenses
to average
net assets | | | | | Ratio of
net investment
income
to average
net assets | | | | | Portfolio
turnover
rate(c) | |
| | | | | | | | | | | | | | | | | | | | | | | | | | | | | | | | | | | | | | | | |
| | $ | 9.17 | | | | | | (2.14 | )% | | | | $ | 308,375 | | | | | | 0.87 | % | | | | | 1.33 | % | | | | | 1.96 | % | | | | | 93 | % |
| | | | | | | | | | | | | | | | | | | | | | | | | | | | | | | | | | | | | | | | |
| | | | | | | | | | | | | | | | | | | | | | | | | | | | | | | | | | | | | | | | |
| | | 9.57 | | | | | | (4.30 | ) | | | | | 197,429 | | | | | | 0.90 | (d) | | | | | 1.42 | (d) | | | | | 0.67 | (d) | | | | | 35 | |
| | |
| The accompanying notes are an integral part of these financial statements. | | 77 |
GOLDMAN SACHS STRATEGIC MULTI-ASSET CLASS FUNDS
Notes to Financial Statements
October 31, 2016
Goldman Sachs Trust II (the “Trust”) is a Delaware statutory trust registered under the Investment Company Act of 1940, as amended (the “Act”), as an open-end management investment company. The following table lists those series of the Trust that are included in this report (collectively, the “Funds” or individually a “Fund”), along with their corresponding share classes and respective diversification status under the Act:
| | | | |
| Fund | | Share Classes Offered | | Diversified/ Non-diversified |
Multi-Manager Global Equity (Commenced June 24, 2015) | | Institutional | | Diversified |
Multi-Manager Non-Core Fixed Income (Commenced March 31, 2015) | | Institutional | | Non-diversified |
Mutli-Manager Real Assets Strategy (Commenced June 30, 2015) | | Institutional | | Diversified |
Goldman Sachs Asset Management, L.P. (“GSAM”), an affiliate of Goldman, Sachs & Co. (“Goldman Sachs”), serves as investment adviser to the Fund pursuant to a management agreement (the “Agreement”) with the Trust. As of October 31, 2016, GSAM had sub-advisory agreements (the “Sub-Advisory Agreements”) for the Multi-Manager Global Equity Fund with Causeway Capital Management LLC, Epoch Investment Partners, Inc., Fisher Asset Management, LLC, GW&K Investment Management, LLC, Legal & General Investment Management America, Inc, Parametric Portfolio Associates LLC, Principal Global Investors, LLC, Robeco Investment Management, Inc., doing business as Boston Partners, Russell Investments Implementation Services, LLC, Scharf Investments, LLC, Vulcan Value Partners, LLC and WCM Investment Management; for the Multi-Manager Non-Core Fixed Income Fund with Ares Capital Management II, LLC, BlueBay Asset Management, LLP, Lazard Asset Management LLC and Symphony Asset Management LLC; and for the Multi-Manager Real Assets Strategy Fund with PGIM Real Estate, a business unit of PGIM, Inc. Presima Inc., RARE Infrastructure (North America) Pty Limited and RREEF America L.L.C. (the “Underlying Managers”). Pursuant to the terms of the Sub-Advisory Agreements, the Underlying Managers are responsible for making investment decisions and managing the investments of the Fund. GSAM compensates the Underlying Managers directly in accordance with the terms of the Sub-Advisory Agreements. The Funds are not charged any separate or additional investment advisory fees by the Underlying Managers.
|
| 2. SIGNIFICANT ACCOUNTING POLICIES |
The financial statements have been prepared in accordance with accounting principles generally accepted in the United States of America (“GAAP”) and require management to make estimates and assumptions that may affect the reported amounts and disclosures. Actual results may differ from those estimates and assumptions.
A. Basis of Consolidation for Goldman Sachs Multi-Manager Real Assets Strategy Fund — The Cayman Commodity- MMRA, Ltd., (the “Subsidiary”), a Cayman Islands exempted company, was incorporated on June 30, 2015 and is currently a wholly-owned subsidiary of the Multi-Manager Real Assets Strategy Fund (the “Fund”). The Subsidiary acts as an investment vehicle for the Fund to enable the Fund to gain exposure to certain types of commodity-linked derivative instruments. The Fund is the sole shareholder of the Subsidiary pursuant to a subscription agreement dated as of June 30, 2015, and it is intended that the Fund will remain the sole shareholder and will continue to control the Subsidiary. Under the Memorandum and Articles of Association of the Subsidiary, shares issued by the Subsidiary confer upon a shareholder the right to vote at general meetings of the Subsidiary and certain rights in connection with any winding-up or repayment of capital, as well as the right to participate in the profits or assets of the Subsidiary. All inter-fund balances and transactions have been eliminated in consolidation. As of October 31, 2016, the Fund’s net assets were $308,375,170, of which, $0, or 0.0%, represented the Subsidiary’s net assets.
B. Investment Valuation — The Funds’ valuation policy is to value investments at fair value.
78
GOLDMAN SACHS STRATEGIC MULTI-ASSET CLASS FUNDS
|
| 2. SIGNIFICANT ACCOUNTING POLICIES (continued) |
C. Investment Income and Investments — Investment income includes interest income, dividend income, net of any foreign withholding taxes, less any amounts reclaimable, and securities lending income. Interest income is accrued daily and adjusted for amortization of premiums and accretion of discounts. Dividend income is recognized on ex-dividend date or, for certain foreign securities, as soon as such information is obtained subsequent to the ex-dividend date. Investment transactions are reflected on trade date. Realized gains and losses are calculated using identified cost. Investment transactions are recorded on the following business day for daily net asset value (“NAV”) calculations. Any foreign capital gains tax is accrued daily based upon net unrealized gains, and is payable upon sale of such investments. Distributions received from the Funds’ investments in U.S. real estate investment trusts (“REITs”) may be characterized as ordinary income, net capital gain or a return of capital. A return of capital is recorded by the Funds as a reduction to the cost basis of the REIT.
For derivative contracts, realized gains and losses are recorded upon settlement of the contract. Upfront payments, if any, are made or received upon entering into a swap agreement and are reflected in the Statements of Assets and Liabilities. Upfront payments are recognized over the contract’s term/event as realized gains or losses, with the exception of forward starting interest rate swaps whose realized gains or losses are recognized from the effective start date.
D. Expenses — Expenses incurred directly by a Fund are charged to the Fund, and certain expenses incurred by the Trust that may not solely relate to the Fund are allocated to the Fund and the other applicable funds of the Trust on a straight-line and/or pro-rata basis depending upon the nature of the expenses, and are accrued daily.
E. Federal Taxes and Distributions to Shareholders — It is each Fund’s policy to comply with the requirements of the Internal Revenue Code of 1986, as amended (the “Code”), applicable to regulated investment companies (mutual funds) and to distribute each year substantially all of its investment company taxable income and capital gains to its shareholders. Accordingly, the Funds are not required to make any provisions for the payment of federal income tax. Distributions to shareholders are recorded on the ex-dividend date. Income and capital gains distributions, if any, are declared and paid according to the following schedule:
| | | | | | |
| Fund | | | | Income Distributions Declared/Paid | | Capital Gains Distributions Declared/Paid |
Multi-Manager Global Equity | | | | Annually | | Annually |
Multi-Manager Non-Core Fixed Income | | | | Daily/Monthly | | Annually |
Multi-Manager Real Asset Strategies | | | | Quarterly | | Annually |
Net capital losses are carried forward to future fiscal years and may be used to the extent allowed by the Code to offset any future capital gains. Utilization of capital loss carryforwards will reduce the requirement of future capital gains distributions.
The characterization of distributions to shareholders for financial reporting purposes is determined in accordance with federal income tax rules, which may differ from GAAP. The source of each Fund’s distributions may be shown in the accompanying financial statements as either from net investment income, net realized gain or capital. Certain components of the Funds’ net assets on the Statements of Assets and Liabilities reflect permanent GAAP/tax differences based on the appropriate tax character.
F. Foreign Currency Translation — The accounting records and reporting currency of the Funds are maintained in U.S. dollars. Assets and liabilities denominated in foreign currencies are translated into U.S. dollars using the current exchange rates at the close of each business day. The effect of changes in foreign currency exchange rates on investments is included within net realized and unrealized gain (loss) on investments. Changes in the value of other assets and liabilities as a result of fluctuations in foreign exchange rates are included in the Statements of Operations within net change in unrealized gain (loss) on foreign currency translations. Transactions denominated in foreign currencies are translated into U.S. dollars on the date the transaction occurred, the effects of which are included within net realized gain (loss) on foreign currency transactions.
79
GOLDMAN SACHS STRATEGIC MULTI-ASSET CLASS FUNDS
Notes to Financial Statements (continued)
October 31, 2016
|
| 3. INVESTMENTS AND FAIR VALUE MEASUREMENTS |
The fair value of a financial instrument is the amount that would be received to sell an asset or paid to transfer a liability in an orderly transaction between market participants at the measurement date (i.e., the exit price). GAAP establishes a fair value hierarchy that prioritizes the inputs to valuation techniques used to measure fair value. The hierarchy gives the highest priority to unadjusted quoted prices in active markets for identical assets or liabilities (Level 1 measurements) and the lowest priority to unobservable inputs (Level 3 measurements). The levels used for classifying investments are not necessarily an indication of the risk associated with investing in these investments. The three levels of the fair value hierarchy are described below:
Level 1 — Unadjusted quoted prices in active markets that are accessible at the measurement date for identical, unrestricted assets or liabilities;
Level 2 — Quoted prices in markets that are not active or financial instruments for which significant inputs are observable (including, but not limited to, quoted prices for similar investments, interest rates, foreign exchange rates, volatility and credit spreads), either directly or indirectly;
Level 3 — Prices or valuations that require significant unobservable inputs (including GSAM’s assumptions in determining fair value measurement).
Changes in valuation techniques may result in transfers into or out of an assigned level within the hierarchy. In accordance with the Funds’ policy, transfers between different levels of the fair value hierarchy resulting from such changes are deemed to have occurred as of the beginning of the reporting period.
The Board of Trustees (“Trustees”) has approved Valuation Procedures that govern the valuation of the portfolio investments held by the Funds, including investments for which market quotations are not readily available. The Trustees have delegated to GSAM day-to-day responsibility for implementing and maintaining internal controls and procedures related to the valuation of the Funds’ portfolio investments. To assess the continuing appropriateness of pricing sources and methodologies, GSAM regularly performs price verification procedures and issues challenges as necessary to third party pricing vendors or brokers, and any differences are reviewed in accordance with the Valuation Procedures.
A. Level 1 and Level 2 Fair Value Investments — The valuation techniques and significant inputs used in determining the fair values for investments classified as Level 1 and Level 2 are as follows:
Equity Securities — Equity securities traded on a United States (“U.S.”) securities exchange or the NASDAQ system, or those located on certain foreign exchanges, including but not limited to the Americas, are valued daily at their last sale price or official closing price on the principal exchange or system on which they are traded. If there is no sale or official closing price or such price is believed by GSAM to not represent fair value, equity securities are valued at the last bid price for long positions and at the last ask price for short positions. To the extent these investments are actively traded, they are classified as Level 1 of the fair value hierarchy, otherwise they are generally classified as Level 2.
Unlisted equity securities for which market quotations are available are valued at the last sale price on the valuation date, or if no sale occurs, at the last bid price. Securities traded on certain foreign securities exchanges are valued daily at fair value determined by an independent fair value service (if available) under Valuation Procedures approved by the Trustees and consistent with applicable regulatory guidance. The independent fair value service takes into account multiple factors including, but not limited to, movements in the securities markets, certain depositary receipts, futures contracts and foreign currency exchange rates that have occurred subsequent to the close of the foreign securities exchange. These investments are generally classified as Level 2 of the fair value hierarchy.
Debt Securities — Debt securities for which market quotations are readily available are valued daily on the basis of quotations supplied by dealers or an independent pricing service approved by the Trustees. The pricing services may use valuation models or matrix pricing, which consider: (i) yield or price with respect to bonds that are considered comparable in characteristics such as rating, interest rate and maturity date or (ii) quotations from securities dealers to determine current value. As of the date of the financial statements, short-term debt obligations that mature in sixty days or less and did not exhibit signs of credit deterioration were valued using available market quotations as provided by a third party pricing vendor or broker. Prior to October 11, 2016,
80
GOLDMAN SACHS STRATEGIC MULTI-ASSET CLASS FUNDS
|
| 3. INVESTMENTS AND FAIR VALUE MEASUREMENTS (continued) |
such securities were valued at amortized cost. With the exception of treasury securities of G8 countries (not held in money market funds), which are generally classified as Level 1, these investments are generally classified as Level 2 of the fair value hierarchy.
i. Bank Loans — Bank loans (“Loans”) are interests in amounts owed by corporate, governmental, or other borrowers to lenders or lending syndicates. Loans are arranged through private negotiations between the borrower and one or more financial institutions (“Lenders”). A Fund’s investments in Loans are in the form of either participations in Loans (“Participations”) or assignments of all or a portion of Loans from third parties (“Assignments”). With respect to Participations, a Fund has the right to receive payments of principal, interest and any fees to which it is entitled from the Lender selling the Participations and only upon receipt by the Lender of the payments from the borrower. A Fund generally has no right to enforce compliance by the borrower with the terms of the loan agreement with respect to Participations. Conversely, Assignments result in a Fund having a direct contractual relationship with the borrower, and the Fund may be permitted to enforce compliance by the borrower with the terms of the loan agreement.
Derivative Contracts — A derivative is an instrument whose value is derived from underlying assets, indices, reference rates or a combination of these factors. The Funds enter into derivative transactions to hedge against changes in interest rates, securities prices, and/or currency exchange rates, to increase total return, or to gain access to certain markets or attain exposure to other underliers.
Exchange-traded derivatives, including futures and options contracts, are valued at the last sale or settlement price and typically fall within Level 1 of the fair value hierarchy. Over-the-counter (“OTC”) and centrally cleared derivatives are valued using market transactions and other market evidence, including market-based inputs to models, calibration to market-clearing transactions, broker or dealer quotations, or other alternative pricing sources. Where models are used, the selection of a particular model to value OTC and centrally cleared derivatives depends upon the contractual terms of, and specific risks inherent in, the instrument, as well as the availability of pricing information in the market. Valuation models require a variety of inputs, including contractual terms, market prices, yield curves, credit curves, measures of volatility, voluntary and involuntary prepayment rates, loss severity rates and correlations of such inputs. For OTC and centrally cleared derivatives that trade in liquid markets, model inputs can generally be verified and model selection does not involve significant management judgment. OTC and centrally cleared derivatives are classified within Level 2 of the fair value hierarchy when significant inputs are corroborated by market evidence.
i. Forward Contracts — A forward contract is a contract between two parties to buy or sell an asset at a specified price on a future date. A forward contract settlement can occur on a cash or delivery basis. Forward contracts are marked-to-market daily using independent vendor prices, and the change in value, if any, is recorded as an unrealized gain or loss. Cash and certain investments may be used to collateralize forward contracts.
A forward foreign currency contract is a forward contract in which a Fund agrees to receive or deliver a fixed quantity of one currency for another, at a pre-determined price at a future date. All forward foreign currency exchange contracts are marked-to-market daily at the applicable forward rate. Non-deliverable forward foreign currency exchange contracts are settled with the counterparty in cash without the delivery of foreign currency.
ii. Futures Contracts — Futures contracts are contracts to buy or sell a standardized quantity of a specified commodity or security and are valued based on exchanged settlement prices or independent market quotes. Futures contracts are valued at the last settlement price, or in the absence of a sale, the last bid price for long positions and at the last ask price for short positions, at the end of each day on the board of trade or exchange upon which they are traded. Upon entering into a futures contract, a Fund deposits cash or securities in an account on behalf of the broker in an amount sufficient to meet the initial margin requirement. Subsequent payments are made or received by a Fund equal to the daily change in the contract value and are recorded as variation margin receivable or payable with a corresponding offset to unrealized gains or losses.
iii. Option Contracts — When a Fund writes call or put option contracts, an amount equal to the premium received is recorded as a liability and is subsequently marked-to-market to reflect the current value of the option written. Swaptions are options on interest rate swap contracts.
81
GOLDMAN SACHS STRATEGIC MULTI-ASSET CLASS FUNDS
Notes to Financial Statements (continued)
October 31, 2016
|
| 3. INVESTMENTS AND FAIR VALUE MEASUREMENTS (continued) |
Upon the purchase of a call option or a put option by a Fund, the premium paid is recorded as an investment and subsequently marked-to-market to reflect the current value of the option. Certain options may be purchased with premiums to be determined on a future date. The premiums for these options are based upon implied volatility parameters at specified terms.
iv. Swap Contracts — Bilateral swap contracts are agreements in which a Fund and a counterparty agree to exchange periodic payments on a specified notional amount or make a net payment upon termination. Bilateral swap transactions are privately negotiated in the OTC market and payments are settled through direct payments between a Fund and the counterparty. By contrast, certain swap transactions are subject to mandatory central clearing. These swaps are executed through a derivatives clearing member (“DCM”), acting in an agency capacity, and submitted to a central counterparty (“CCP”) (“centrally cleared swaps”), in which case all payments are settled with the CCP through the DCM. Swaps are marked-to-market daily using pricing vendor quotations, counterparty or clearinghouse prices or model prices, and the change in value, if any, is recorded as an unrealized gain or loss. Upon entering into a swap contract, a Fund is required to satisfy an initial margin requirement by delivering cash or securities to the counterparty (or in some cases, segregated in a triparty account on behalf of the counterparty), which can be adjusted by any mark-to-market gains or losses pursuant to bilateral or centrally cleared arrangements. For centrally cleared swaps the daily change in valuation, if any, is recorded as a receivable or payable for variation margin.
An interest rate swap is an agreement that obligates two parties to exchange a series of cash flows at specified intervals, based upon or calculated by reference to changes in interest rates on a specified notional principal amount. The payment flows are usually netted against each other, with the difference being paid by one party to the other.
A credit default swap is an agreement that involves one party (the buyer of protection) making a stream of payments to another party (the seller of protection) in exchange for the right to receive protection on a reference security or obligation, including a group of assets or exposure to the performance of an index. A Fund’s investment in credit default swaps may involve greater risks than if the Fund had invested in the referenced obligation directly. Credit events are contract specific but may include bankruptcy, failure to pay, restructuring and obligation acceleration. If a Fund buys protection through a credit default swap and no credit event occurs, its payments are limited to the periodic payments previously made to the counterparty. Upon the occurrence of a specified credit event, a Fund, as a buyer of credit protection, is entitled to receive an amount equal to the notional amount of the swap and deliver to the seller the defaulted reference obligation in a physically settled trade. A Fund may also receive a net settlement amount in the form of cash or securities equal to the notional amount of the swap reduced by the recovery value of the reference obligation in a cash settled trade.
As a seller of protection, a Fund generally receives a payment stream throughout the term of the swap, provided that there is no credit event. In addition, if a Fund sells protection through a credit default swap, a Fund could suffer a loss because the value of the referenced obligation and the premium payments received may be less than the notional amount of the swap paid to the buyer of protection. Upon the occurrence of a specified credit event, a Fund, as a seller of credit protection, may be required to take possession of the defaulted reference obligation and pay the buyer an amount equal to the notional amount of the swap in a physically settled trade. A Fund may also pay a net settlement amount in the form of cash or securities equal to the notional amount of the swap reduced by the recovery value of the reference obligation in a cash settled trade. Recovery values are at times established through the credit event auction process in which market participants are ensured that a transparent price has been set for the defaulted security or obligation. In addition, a Fund is entitled to a return of any assets, which have been pledged as collateral to the counterparty upon settlement.
The maximum potential amount of future payments (undiscounted) that a Fund as seller of protection could be required to make under a credit default swap would be an amount equal to the notional amount of the agreement. These potential amounts would be partially offset by any recovery values of the respective referenced obligations or net amounts received from a settlement of a credit default swap for the same reference security or obligation where a Fund bought credit protection.
Short Term Investments — As of the date of the financial statements, short-term investments having a maturity of 60 days or less are valued using available market quotations as provided by a third party pricing vendor or broker. Prior to October 11, 2016, such securities were valued at amortized cost. These investments are classified as Level 2 of the fair value hierarchy.
82
GOLDMAN SACHS STRATEGIC MULTI-ASSET CLASS FUNDS
|
| 3. INVESTMENTS AND FAIR VALUE MEASUREMENTS (continued) |
i. Repurchase Agreements — Repurchase agreements involve the purchase of securities subject to the seller’s agreement to repurchase the securities at a mutually agreed upon date and price, under the terms of a Master Repurchase Agreement (“MRA”). During the term of a repurchase agreement, the value of the underlying securities held as collateral on behalf of a Fund, including accrued interest, is required to exceed the value of the repurchase agreement, including accrued interest. The gross value of repurchase agreements is included in the Statements of Assets and Liabilities for financial reporting purposes. The underlying securities for all repurchase agreements are held at the Funds’ custodian or designated sub-custodians under tri-party repurchase agreements.
An MRA governs transactions between a Fund and select counterparties. An MRA contains provisions for, among other things, initiation of the transaction, income payments, events of default and maintenance of securities for repurchase agreements. An MRA also permits offsetting with collateral to create one single net payment in the event of default or similar events, including the bankruptcy or insolvency of a counterparty.
If the seller defaults, a Fund could suffer a loss to the extent that the proceeds from the sale of the underlying securities and other collateral held by the Fund are less than the repurchase price and the Fund’s costs associated with delay and enforcement of the repurchase agreement. In addition, in the event of default or insolvency of the seller, a court could determine that a Fund’s interest in the collateral is not enforceable, resulting in additional losses to the Fund.
Pursuant to exemptive relief granted by the Securities and Exchange Commission (“SEC”) and terms and conditions contained therein, the Funds, together with other funds of the Trust and registered investment companies having management agreements with GSAM or its affiliates, may transfer uninvested cash into joint accounts, the daily aggregate balance of which is invested in one or more repurchase agreements. Under these joint accounts, the Funds maintain pro-rata credit exposure to the underlying repurchase agreements’ counterparties. With the exception of certain transaction fees, the Funds are not subject to any expenses in relation to these investments.
B. Level 3 Fair Value Investments — To the extent that significant inputs to valuation models and other alternative pricing sources are unobservable, or if quotations are not readily available, or if GSAM believes that such quotations do not accurately reflect fair value, the fair value of the Funds’ investments may be determined under Valuation Procedures approved by the Trustees. GSAM, consistent with its procedures and applicable regulatory guidance, may make an adjustment to the most recent valuation prices of either domestic or foreign securities in light of significant events to reflect what it believes to be the fair value of the securities at the time of determining a Fund’s NAV. Significant events which could affect a large number of securities in a particular market may include, but are not limited to: significant fluctuations in U.S. or foreign markets; market dislocations; market disruptions; or unscheduled market closings. Significant events which could also affect a single issuer may include, but are not limited to: corporate actions such as reorganizations, mergers and buy-outs; ratings downgrades; and bankruptcies.
83
GOLDMAN SACHS STRATEGIC MULTI-ASSET CLASS FUNDS
Notes to Financial Statements (continued)
October 31, 2016
|
| 3. INVESTMENTS AND FAIR VALUE MEASUREMENTS (continued) |
C. Fair Value Hierarchy — The following is a summary of the Funds’ investments and derivatives classified in the fair value hierarchy as of October 31, 2016:
| | | | | | | | | | | | |
| | | |
| MULTI-MANAGER GLOBAL EQUITY | | | | | | | | | | | | |
| | | |
| Investment Type | | Level 1 | | | Level 2 | | | Level 3 | |
| Assets | | | | | | | | | | | | |
Common Stock and/or Other Equity Investments(a) | | | | | | | | | | | | |
Africa | | $ | 248,228 | | | $ | 4,386,023 | | | $ | — | |
Asia | | | 28,611,114 | | | | 100,908,962 | | | | 8,215 | |
Australia and Oceania | | | 273,578 | | | | 10,932,801 | | | | — | |
Europe | | | 34,789,216 | | | | 171,895,724 | | | | — | |
North America | | | 250,273,162 | | | | 2,736,706 | | | | — | |
South America | | | 7,181,298 | | | | 1,082,307 | | | | — | |
Exchange Traded Fund | | | 460,722 | | | | — | | | | — | |
Short-term Investments | | | — | | | | 35,100,000 | | | | — | |
| Total | | $ | 321,837,318 | | | $ | 327,042,523 | | | $ | 8,215 | |
| | | |
| Derivative Type | | | | | | | | | |
| Assets(b) | | | | | | | | | | | | |
Forward Foreign Currency Exchange Contracts | | $ | — | | | $ | 5,532,160 | | | $ | — | |
| Liabilities(b) | | | | | | | | | | | | |
Forward Foreign Currency Exchange Contracts | | $ | — | | | $ | (13,369 | ) | | $ | — | |
| | | |
| MULTI-MANAGER NON-CORE FIXED INCOME | | | | | | | | | | | | |
| | | |
| Investment Type | | Level 1 | | | Level 2 | | | Level 3 | |
| Assets | | | | | | | | | | | | |
Fixed Income | | | | | | | | | | | | |
Foreign Debt Obligations | | $ | — | | | $ | 102,515,435 | | | $ | — | |
Corporate Obligations | | | — | | | | 97,739,781 | | | | — | |
Bank Loans | | | — | | | | 72,223,917 | | | | — | |
U.S. Treasury Obligations | | | 2,467,352 | | | | — | | | | — | |
Structured Notes | | | — | | | | 1,003,111 | | | | — | |
Common Stock and/or Other Equity Investments(a) | | | | | | | | | | | | |
North America | | | 506,889 | | | | 354,042 | | | | — | |
Short-term Investments | | | — | | | | 35,400,000 | | | | — | |
| Total | | $ | 2,974,241 | | | $ | 309,236,286 | | | $ | — | |
84
GOLDMAN SACHS STRATEGIC MULTI-ASSET CLASS FUNDS
|
| 3. INVESTMENTS AND FAIR VALUE MEASUREMENTS (continued) |
| | | | | | | | | | | | |
| | | |
| MULTI-MANAGER NON-CORE FIXED INCOME (continued) | | | | | | | | | | | | |
| | | |
| Derivative Type | | Level 1 | | | Level 2 | | | Level 3 | |
| Assets(b) | | | | | | | | | | | | |
Forward Foreign Currency Exchange Contracts | | $ | — | | | $ | 280,787 | | | $ | — | |
Futures Contracts | | | 32,026 | | | | — | | | | — | |
Interest Rate Swap Contracts | | | — | | | | 3,987 | | | | — | |
Cross Currency Swap Contracts | | | — | | | | 78,275 | | | | — | |
| Total | | $ | 32,026 | | | $ | 363,049 | | | $ | — | |
| Liabilities(b) | | | | | | | | | | | | |
Forward Foreign Currency Exchange Contracts | | $ | — | | | $ | (405,118 | ) | | $ | — | |
Interest Rate Swap Contracts | | | — | | | | (9,033 | ) | | | — | |
Credit Default Swap Contracts | | | — | | | | (52,831 | ) | | | — | |
Cross Currency Swap Contracts | | | — | | | | (37,135 | ) | | | — | |
| Total | | $ | — | | | $ | (504,117 | ) | | $ | — | |
| | | |
| MULTI-MANAGER REAL ASSET STRATEGY | | | | | | | | | | | | |
| | | |
| Investment Type | | Level 1 | | | Level 2 | | | Level 3 | |
| Assets | | | | | | | | | | | | |
Common Stock and/or Other Equity Investments(a) | | | | | | | | | | | | |
Asia | | $ | — | | | $ | 35,923,053 | | | $ | — | |
Australia and Oceania | | | — | | | | 15,249,955 | | | | — | |
Europe | | | 4,179,050 | | | | 54,080,564 | | | | — | |
North America | | | 187,293,031 | | | | 104,985 | | | | — | |
Short-term Investments | | | — | | | | 10,600,000 | | | | — | |
| Total | | $ | 191,472,081 | | | $ | 115,958,557 | | | $ | — | |
| (a) | | Amounts are disclosed by continent to highlight the impact of time zone differences between local market close and the calculation of NAV. Security valuations are based on the principal exchange or system on which they are traded, which may differ from country of domicile. The Funds utilize fair value model prices provided by an independent fair value service for certain international equity securities, resulting in a Level 2 classification. |
| (b) | | Amount shown represents unrealized gain (loss) at period end. |
For further information regarding security characteristics, see the Schedules of Investments.
85
GOLDMAN SACHS STRATEGIC MULTI-ASSET CLASS FUNDS
Notes to Financial Statements (continued)
October 31, 2016
|
| 4. INVESTMENTS IN DERIVATIVES |
The following tables set forth, by certain risk types, the gross value of derivative contracts as of October 31, 2016. These instruments were used as part of the Funds’ investment strategies and to obtain and/or manage exposure related to the risks below. The values in the tables below exclude the effects of cash collateral received or posted pursuant to these derivative contracts, and therefore are not representative of the Funds’ net exposure.
| | | | | | | | | | | | |
|
| Multi-Manager Global Equity | |
| Risk | | Statements of Assets and Liabilities | | Assets | | | Statements of Assets and Liabilities | | Liabilities | |
Currency | | Receivable for unrealized gain on forward foreign currency exchange contracts | | $ | 5,532,160 | | | Payable for unrealized loss on forward foreign currency exchange contracts | | $ | (13,369) | |
|
| Multi-Manager Non-Core Fixed Income | |
| Risk | | Statements of Assets and Liabilities | | Assets | | | Statements of Assets and Liabilities | | Liabilities | |
Interest rate | | Receivable for unrealized gain on swap contracts; Variation margin on certain derivative contracts | | $ | 36,013 | | | Receivable for unrealized loss on swap Contracts; Variation margin on certain derivative contracts | | $ | (9,033) | (a) |
Credit | | | | | — | | | Payable for unrealized loss on swap contracts | | | (52,831) | |
Currency | | Receivable for unrealized gain on forward foreign currency exchange contracts; Receivable for unrealized loss on swap contracts | | | 359,062 | | | Payable for unrealized loss on forward foreign currency exchange contracts; Payable for unrealized loss on swap contracts | | | (442,253) | |
| Total | | | | $ | 395,075 | | | | | $ | (504,117) | |
| (a) | | Includes unrealized gain (loss) on futures contracts and centrally cleared swaps described in the Additional Investment Information sections of the Schedules of Investments. Only current day’s variation margin is reported within the Statements of Assets and Liabilities. |
The following tables set forth, by certain risk types, the Funds’ gains (losses) related to these derivatives and their indicative volumes for the fiscal year ended October 31, 2016. These gains (losses) should be considered in the context that these derivative contracts may have been executed to create investment opportunities and/or economically hedge certain investments, and accordingly, certain gains (losses) on such derivative contracts may offset certain (losses) gains attributable to investments. These gains (losses) are included in “Net realized gain (loss)” or “Net change in unrealized gain (loss)” on the Statements of Operations:
| | | | | | | | | | | | | | |
| |
| Multi-Manager Global Equity | | | | | |
| Risk | | Statements of Operations | | Net Realized Gain (Loss) | | | Net Change in
Unrealized
Gain (Loss) | | | Average
Number of
Contracts(a) | |
Currency | | Net realized gain (loss) from forward foreign currency exchange contracts/Net change in unrealized gain (loss) on forward foreign currency exchange contracts | | $ | (2,974,663 | ) | | $ | 5,153,952 | | | | 61 | |
86
GOLDMAN SACHS STRATEGIC MULTI-ASSET CLASS FUNDS
|
| 4. INVESTMENTS IN DERIVATIVES (continued) |
| | | | | | | | | | | | | | |
| |
| Multi-Manager Non-Core Fixed Income | | | | | |
| Risk | | Statements of Operations | | Net Realized Gain (Loss) | | | Net Change in
Unrealized
Gain (Loss) | | | Average
Number of
Contracts(a) | |
| Interest rate | | Net realized gain (loss) from futures contracts and swap contracts/Net change in unrealized gain (loss) on futures contracts and swap contracts | | $ | 298,017 | | | $ | (81,110 | ) | | | 69 | |
| Credit | | Net realized gain (loss) from swap contracts/Net change in unrealized gain (loss) on swap contracts | | | (288,837 | ) | | | (39,720 | ) | | | 11 | |
| Currency | | Net realized gain (loss) from forward foreign currency exchange contracts and swap contracts/Net change in unrealized gain (loss) on forward foreign currency exchange contracts and swap contracts | | | (920,285 | ) | | | 147,284 | | | | 111 | |
| Total | | | | $ | (911,105 | ) | | $ | 26,454 | | | | 191 | |
| |
| Multi-Manager Real Assets Strategy | | | | | |
| Risk | | Statements of Operations | | Net Realized Gain (Loss) | | | Net Change in
Unrealized
Gain (Loss) | | | Average
Number of
Contracts(a) | |
| Commodity | | Net realized gain (loss) from futures contracts/Net unrealized gain (loss) on futures contracts | | $ | (13,365,473 | ) | | $ | (85,229 | ) | | | 348 | |
| Currency | | Net realized gain (loss) from forward foreign currency exchange contracts/Net change in unrealized gain (loss) on forward foreign currency exchange contracts | | | (3 | ) | | | — | | | | 1 | |
| Total | | | | $ | (13,365,476 | ) | | $ | (85,229 | ) | | | 349 | |
| (a) | | Average number of contracts is based on the average of month end balances for the fiscal year ended October 31, 2016. |
In order to better define its contractual rights and to secure rights that will help a Fund mitigate its counterparty risk, a Fund may enter into an International Swaps and Derivatives Association, Inc. Master Agreement (“ISDA Master Agreement”) or similar agreement with its derivatives counterparties. An ISDA Master Agreement is a bilateral agreement between a Fund and a counterparty that governs OTC derivatives (including forward foreign currency exchange contracts, and certain options and swaps), and typically contains, among other things, collateral posting terms and netting provisions in the event of a default and/or termination event. The provisions of the ISDA Master Agreement typically permit a single net payment in the event of a default (close-out netting) or similar event, including the bankruptcy or insolvency of the counterparty.
Collateral and margin requirements differ between exchange traded derivatives and OTC derivatives. Margin requirements are established by the broker or clearing house for exchange-traded and centrally cleared derivatives (financial futures contracts, options and centrally cleared swaps) pursuant to governing agreements for those instrument types. Brokers can ask for margin in excess of the minimum in certain circumstances. Collateral terms are contract-specific for OTC derivatives. For derivatives traded under an ISDA Master Agreement, the collateral requirements are typically calculated by netting the marked to market amount for each transaction under such agreement and comparing that amount to the value of any collateral currently pledged by a Fund and the counterparty. Additionally, a Fund may be required to post initial margin to the counterparty, the terms of which would be outlined in the confirmation of the OTC transaction.
For financial reporting purposes, cash collateral that has been pledged to cover obligations of a Fund and cash collateral received from the counterparty, if any, is reported separately on the Statements of Assets and Liabilities as receivables/payables for collateral on certain derivative contracts. Non-cash collateral pledged by a Fund, if any, is noted in the Schedules of Investments. Generally, the amount of collateral due from or to a counterparty must exceed a minimum transfer amount threshold before a transfer is required to be made. To the extent amounts due to a Fund from its counterparties are not fully collateralized,
87
GOLDMAN SACHS STRATEGIC MULTI-ASSET CLASS FUNDS
Notes to Financial Statements (continued)
October 31, 2016
|
| 4. INVESTMENTS IN DERIVATIVES (continued) |
contractually or otherwise, the Fund bears the risk of loss from counterparty nonperformance. A Fund attempts to mitigate counterparty risk by only entering into agreements with counterparties that the Investment Adviser believes to be of good standing and by monitoring the financial stability of those counterparties.
Additionally, the netting of assets and liabilities and the offsetting of collateral pledged or received are based on contractual netting/set-off provisions in the ISDA Master Agreement or similar agreements. However, in the event of a default or insolvency of a counterparty, a court could determine that such rights are not enforceable due to the restrictions or prohibitions against the right of setoff that may be imposed in accordance with a particular jurisdiction’s bankruptcy or insolvency laws.
|
| 5. AGREEMENTS AND AFFILIATED TRANSACTIONS |
A. Management Agreement — Under the Agreement, GSAM manages the Funds, subject to the general supervision of the Trustees.
As compensation for the services rendered pursuant to the Agreement, the assumption of the expenses related thereto and administration of the Funds’ business affairs, including providing facilities, GSAM is entitled to a management fee, accrued daily and paid monthly, equal to an annual percentage rate of each Fund’s average daily net assets.
For the fiscal year ended October 31, 2016, contractual and effective net management fees with GSAM were at the following rates:
| | | | | | | | | | | | | | | | | | | | | | | | | | | | | | |
| | | | | Contractual Management Rate | | | Effective Net
Management
Rate* | |
| Fund | | | | First
$1 billion | | | Next
$1 billion | | | Next
$3 billion | | | Next
$3 billion | | | Over
$8 billion | | | Effective
Rate | | |
Multi-Manager Global Equity | | | | | 1.03 | % | | | 0.93 | % | | | 0.89 | % | | | 0.87 | % | | | 0.84 | % | | | 1.03 | % | | | 0.59 | % |
Multi-Manager Non-Core Fixed Income | | | | | 0.85 | | | | 0.85 | | | | 0.77 | | | | 0.73 | | | | 0.71 | | | | 0.85 | | | | 0.54 | |
Multi-Manager Real Asset Strategy | | | | | 1.00 | | | | 0.90 | | | | 0.86 | | | | 0.84 | | | | 0.82 | | | | 1.00 | | | | 0.58 | ^ |
| * | | GSAM has agreed to waive a portion of its management fee for each Fund in order to achieve an effective net management fee rate that is equal to the actual cost of fees paid to the Fund’s Underlying Managers (including, with respect to the Multi-Manager Real Assets Strategy Fund, an Underlying Manager of the Subsidiary). These arrangements will remain in effect through at least February 28, 2017, and prior to such date GSAM may not terminate the arrangements without the approval of the Board of Trustees. |
| ^ | | Reflects combined management fees paid to GSAM under the Agreement and the Fund’s Subsidiary Agreement (as defined below) after the waivers. |
GSAM also provides management services to the Subsidiary of the Multi-Manager Real Assets Strategy Fund pursuant to a Subsidiary Management Agreement (the “Subsidiary Agreement”) and is entitled to a management fee accrued daily and paid monthly, equal to an annual percentage rate of 0.43% of the Subsidiary’s average daily net assets. In consideration of the Subsidiary’s management fee, and for as long as the Subsidiary Agreement remains in effect, GSAM has contractually agreed to waive irrevocably a portion of the Fund’s management fee in an amount equal to the management fee accrued and paid to GSAM by the Subsidiary under the Subsidiary Agreement. For the fiscal year ended October 31, 2016, GSAM waived $43,266 of the Fund’s management fee. This waiver represents an inter-fund transaction and, accordingly, has been eliminated in consolidation.
B. Transfer Agency Agreement — Goldman Sachs also serves as the transfer agent of the Funds for a fee pursuant to the Transfer Agency Agreement. The fees charged for such transfer agency services are accrued daily and paid monthly at annual rates of 0.02% of the average daily net assets of Institutional Shares.
C. Other Expense Agreements and Affiliated Transactions — GSAM has agreed to limit each Fund’s “Total Annual Operating Expenses” (excluding acquired fund fees and expenses, taxes, interest, brokerage fees, shareholder meeting, litigation, indemnification, and extraordinary expenses) to the extent such expenses exceed, on an annual basis, a percentage rate of the average daily net assets of each Fund. Such expense reimbursements, if any, are accrued daily and paid monthly. In addition, the Funds are not obligated to reimburse GSAM for prior fiscal year expense reimbursements, if any. The Expense limitations as an annual percentage rate of average daily net assets for the Multi-Manager Global Equity, Non Core Fixed Income and
88
GOLDMAN SACHS STRATEGIC MULTI-ASSET CLASS FUNDS
|
| 5. AGREEMENTS AND AFFILIATED TRANSACTIONS (continued) |
Multi-Manager Real Asset Strategy are 0.85%, 0.70%, and 0.90% respectively. These Expense limitations will remain in place through at least February 28, 2017, and prior to such dates GSAM may not terminate the arrangements without the approval of the Trustees. In addition, the Funds have entered into certain offset arrangements with the transfer agent, which may result in a reduction of the Funds’ expenses and are received irrespective of the application of the “Total Annual Operating” limitations described above.
For the fiscal year ended October 31, 2016, these expense reductions, including any fee waivers, were as follows:
| | | | | | | | | | | | | | |
| Fund | | | | Management
Fee Waiver | | | Other
Expense
Reimbursements | | | Total Annual
Operating
Expense
Reductions | |
Multi-Manager Global Equity | | | | $ | 2,708,324 | | | $ | 135,074 | | | $ | 2,843,398 | |
Multi-Manager Non-Core Fixed Income | | | | | 891,487 | | | | 542,089 | | | | 1,433,576 | |
Multi-Manager Real Asset Strategy | | | | | 1,253,208 | | | | 120,339 | | | | 1,373,547 | |
D. Other Transactions with Affiliates — For the fiscal year ended October 31, 2016, Goldman Sachs earned $1,336 and $516 in brokerage commissions from portfolio transactions, including futures transactions executed with Goldman Sachs as the Futures Commission Merchant, on behalf of Multi-Manager Global Equity and Multi-Manager Real Assets Strategy respectively.
E. Line of Credit Facility — As of October 31, 2016, the Funds participated in a $1,100,000,000 committed, unsecured revolving line of credit facility (the “facility”) together with other funds of the Trust and certain registered investment companies having management agreements with GSAM or its affiliates (“Other Borrowers”). This facility is to be used for temporary emergency purposes, or to allow for an orderly liquidation of securities to meet redemption requests. The interest rate on borrowings is based on the federal funds rate. The facility also requires a fee to be paid by the Funds based on the amount of the commitment that has not been utilized. For the fiscal year ended October 31, 2016, the Funds did not have any borrowings under the facility.
| | |
| 6. PORTFOLIO SECURITIES TRANSACTIONS | | |
The cost of purchases and proceeds from sales and maturities of long-term securities for the fiscal year ended October 31, 2016, were as follows:
| | | | | | | | | | | | | | | | | | |
| Fund | | | | Purchases of
Government
Securities | | | Purchases Excluding
Government
Securities | | | Sales of
Government
Securities | | | Sales Excluding
Government
Securities | |
Multi-Manager Global Equity | | | | $ | — | | | $ | 469,239,368 | | | $ | — | | | $ | 273,022,061 | |
Multi-Manager Non-Core Fixed Income | | | | | 16,030,931 | | | | 258,958,025 | | | | 13,852,592 | | | | 237,034,869 | |
Multi-Manager Real Assets Strategy | | | | | — | | | | 398,047,510 | | | | — | | | | 254,208,630 | |
89
GOLDMAN SACHS STRATEGIC MULTI-ASSET CLASS FUNDS
Notes to Financial Statements (continued)
October 31, 2016
The tax character of distributions paid during the fiscal year ended October 31, 2016 was as follows:
| | | | | | | | | | | | |
| | | Multi-Manager Global Equity Fund | | | Multi-Manager Non-Core
Fixed Income | | | Multi-Manager Real Assets
Strategy | |
Distribution paid from: | | | | | | | | | | | | |
Ordinary income | | $ | 2,625,036 | | | $ | 13,242,128 | | | $ | 6,496,622 | |
Tax return of capital | | $ | — | | | $ | 938,032 | | | $ | — | |
The tax character of distributions paid during the fiscal year ended October 31, 2015 was as follows:
| | | | | | | | | | | | |
| | | Multi-Manager Global Equity Fund | | | Multi-Manager Non-Core
Fixed Income | | | Multi-Manager Real Assets
Strategy | |
Distribution paid from: | | | | | | | | | | | | |
Ordinary income | | $ | — | | | $ | 4,430,286 | | | $ | — | |
Tax return of capital | | $ | — | | | $ | 181,058 | | | $ | — | |
As of October 31, 2016, the components of accumulated earnings (losses) on a tax basis were as follows:
| | | | | | | | | | | | |
| | | Multi-Manager Global Equity Fund | | | Multi-Manager Non-Core
Fixed Income | | | Multi-Manager Real Assets
Strategy | |
Undistributed ordinary income — net | | $ | 8,571,771 | | | $ | — | | | $ | 1,315,221 | |
Total undistributed earnings | | $ | 8,571,771 | | | $ | — | | | $ | 1,315,221 | |
Capital loss carryforwards(1) | | | | | | | | | | | | |
Perpetual Short-Term | | | (13,909,366 | ) | | | (750,532 | ) | | | (194,674 | ) |
Perpetual Long-Term | | | (3,494,098 | ) | | | (154,194 | ) | | | — | |
Total capital loss carryforwards | | $ | (17,403,464 | ) | | $ | (904,726 | ) | | $ | (194,674 | ) |
Timing differences (Straddle Deferrals) | | $ | (80,839 | ) | | $ | (2,196,843 | ) | | $ | — | |
Unrealized gains — net | | | 5,955,253 | | | | 2,581,983 | | | | 4,775,441 | |
Total accumulated earnings (losses) net | | $ | (2,957,279 | ) | | $ | (519,586 | ) | | $ | 5,895,988 | |
| (1) | | The Multi-Manager Non-Core Fixed Income and Multi-Manager Real Asset Strategy Funds utilized $295,473 and $1,547,113, respectively of capital losses in the current fiscal year. |
As of October 31, 2016, the Funds’ aggregate security unrealized gains and losses based on cost for U.S. federal income tax purposes were as follows:
| | | | | | | | | | | | |
| | | Multi-Manager Global Equity Fund | | | Multi-Manager Non-Core
Fixed Income | | | Multi-Manager Real Assets
Strategy | |
Tax Cost | �� | $ | 643,051,342 | | | $ | 309,433,951 | | | $ | 302,647,610 | |
Gross unrealized gain | | | 46,697,515 | | | | 9,241,063 | | | | 20,911,838 | |
Gross unrealized loss | | | (40,860,801 | ) | | | (6,464,487 | ) | | | (16,128,810 | ) |
Net unrealized gains on securities | | $ | 5,836,714 | | | $ | 2,776,576 | | | $ | 4,783,028 | |
Net unrealized gain (loss) on other investments | | | 118,539 | | | | (194,593 | ) | | | (7,587 | ) |
Net unrealized gains | | $ | 5,955,253 | | | $ | 2,581,983 | | | $ | 4,775,441 | |
90
GOLDMAN SACHS STRATEGIC MULTI-ASSET CLASS FUNDS
|
| 7. TAX INFORMATION (continued) |
The difference between GAAP-basis and tax basis unrealized gains (losses) is attributable primarily to wash sales, net mark to market gains/(losses) on regulated futures, net mark to market gains/(losses) on foreign currency contracts, and differences in the tax treatment of underlying fund investments, passive foreign investment company investments, and swap transactions.
In order to present certain Components of the Funds’ Capital accounts on a tax-basis, certain reclassifications have been recorded to the funds accounts. These reclassifications have no impact on the net asset value of the Funds and result primarily from differences in the tax treatment of foreign currency transactions, underlying fund investments, swap transactions and passive foreign investment company investments.
| | | | | | | | | | | | | | |
| Fund | | | | Paid-in
Capital | | | Accumulated
Net Realized
Gain (Loss) | | | Undistributed
Net Investment
Income (Loss) | |
Multi-Manager Global Equity Fund | | | | | — | | | | 3,511,808 | | | | (3,511,808 | ) |
Multi-Manager Non-Core Fixed Income | | | | | — | | | | 3,134,977 | | | | (3,134,977 | ) |
Multi-Manager Real Assets Strategy | | | | | (13,730,753 | ) | | | 13,200,232 | | | | 530,521 | |
GSAM has reviewed the Funds’ tax positions for all open tax years (the current and prior three years, as applicable) and has concluded that no provision for income tax is required in the Funds’ financial statements. Such open tax years remain subject to examination and adjustment by tax authorities.
The Funds’ risks include, but are not limited to, the following:
Derivatives Risk — Loss may result from the Funds’ investments in derivative instruments. These instruments may be illiquid, difficult to price and leveraged so that small changes in the value of the underlying instruments may produce disproportionate losses to the Funds. Derivatives are also subject to counterparty risk, which is the risk that the other party in the transaction will not fulfill its contractual obligation. Losses from investments in derivatives can also result from a lack of correlation between changes in the value of derivative instruments and the portfolio assets (if any) being hedged.
Foreign and Emerging Countries Risk — Investing in foreign markets may involve special risks and considerations not typically associated with investing in the United States. Foreign securities may be subject to risk of loss because of more or less foreign government regulation, less public information and less economic, political and social stability in the countries in which a Fund invests. Loss may also result from the imposition of exchange controls, confiscations and other government restrictions by the United States or other governments, or from problems in registration, settlement or custody. Foreign risk also involves the risk of negative foreign currency rate fluctuations, which may cause the value of securities denominated in such foreign currency (or other instruments through which a Fund has exposure to foreign currencies) to decline in value. Currency exchange rates may fluctuate significantly over short periods of time. To the extent that a Fund also invests in securities of issuers located in emerging markets, these risks may be more pronounced.
Foreign Custody Risk — A Fund that invests in foreign securities may hold such securities and cash with foreign banks, agents, and securities depositories appointed by the Fund’s custodian (each a “Foreign Custodian”). Some foreign custodians may be recently organized or new to the foreign custody business. In some countries, Foreign Custodians may be subject to little or no regulatory oversight over, or independent evaluation of, their operations. Further, the laws of certain countries may place limitations on a Fund’s ability to recover its assets if a Foreign Custodian enters bankruptcy.
Industry Concentration — The Multi-Manager Real Assets Strategy Fund concentrates its investments in the real estate group of industries, which has historically experienced substantial price volatility. This concentration subjects the Fund to greater risk of
91
GOLDMAN SACHS STRATEGIC MULTI-ASSET CLASS FUNDS
Notes to Financial Statements (continued)
October 31, 2016
|
| 8. OTHER RISKS (continued) |
loss as a result of adverse economic, business or other developments than if its investments were diversified across different industries.
Interest Rate Risk — When interest rates increase, fixed income securities or instruments held by the Fund will generally decline in value. Long-term fixed income securities or instruments will normally have more price volatility because of this risk than short-term fixed income securities or instruments. The risks associated with increasing rates are heightened given that interest rates are near historic lows, but may be expected to increase in the future with unpredictable effects on the markets and the Funds’ investments.
Investments in Other Investment Companies — As a shareholder of another investment company, including an exchange-traded fund (“ETF”), a Fund will indirectly bear its proportionate share of any net management fees and other expenses paid by such other investment companies, in addition to the fees and expenses regularly borne by the Fund. ETFs are subject to risks that do not apply to conventional mutual funds, including but not limited to the following: (i) the market price of the ETF’s shares may trade at a premium or a discount to their NAV; and (ii) an active trading market for an ETF’s shares may not develop or be maintained.
Large Shareholder Transactions Risk — A Fund may experience adverse effects when certain large shareholders, such as other funds, institutional investors (including those trading by use of non-discretionary mathematical formulas), financial intermediaries (who may make investment decisions on behalf of underlying clients and/or include a Fund in their investment model), individuals, accounts and Goldman Sachs affiliates, purchase or redeem large amounts of shares of a Fund. Such large shareholder redemptions may cause the Fund to sell portfolio securities at times when it would not otherwise do so, which may negatively impact a Fund’s NAV and liquidity. These transactions may also accelerate the realization of taxable income to shareholders if such sales of investments resulted in gains, and may also increase transaction costs. In addition, a large redemption could result in a Fund’s current expenses being allocated over a smaller asset base, leading to an increase in the Fund’s expense ratio. Similarly, large Fund share purchases may adversely affect a Fund’s performance to the extent that the Fund is delayed in investing new cash and is required to maintain a larger cash position than it ordinarily would.
Leverage Risk — Leverage creates exposure to potential gains and losses in excess of the initial amount invested. Borrowing and the use of derivatives may result in leverage and may make the Funds more volatile. When the Funds use leverage, the sum of each Fund’s investment exposure may significantly exceed the amount of assets invested in each Fund, although these exposures may vary over time. Relatively small market movements may result in large changes in the value of a leveraged investment. Each Fund will identify liquid assets on its books or otherwise cover transactions that may give rise to such risk, to the extent required by applicable law. The use of leverage may cause the Funds to liquidate portfolio positions to satisfy their obligations or to meet segregation requirements when it may not be advantageous to do so. The use of leverage by each Fund can substantially increase the adverse impact to which each Fund’s investment portfolio may be subject.
Liquidity Risk — The Funds may make investments that are illiquid or that may become less liquid in response to market developments or adverse investor perceptions. Illiquid investments may be more difficult to value. Liquidity risk may also refer to the risk that a Fund will not be able to pay redemption proceeds within the allowable time period because of unusual market conditions, an unusually high volume of redemption requests, or other reasons. To meet redemption requests, a Fund may be forced to sell investments at an unfavorable time and/or under unfavorable conditions. Liquidity risk may be the result of, among other things, the reduced number and capacity of traditional market participants to make a market in fixed income securities or the lack of an active market. The potential for liquidity risk may be magnified by a rising interest rate environment or other circumstances where investor redemptions from fixed income mutual funds may be higher than normal, potentially causing increased supply in the market due to selling activity.
Loan-Related Investments Risk — In addition to risks generally associated with debt investments, loan-related investments such as loan participations and assignments are subject to other risks. Although a loan obligation may be fully collateralized at the time of acquisition, the collateral may decline in value, be relatively illiquid, or lose all or substantially all of its value subsequent to investment. Many loan investments are subject to legal or contractual restrictions on resale and may be relatively illiquid and
92
GOLDMAN SACHS STRATEGIC MULTI-ASSET CLASS FUNDS
|
| 8. OTHER RISKS (continued) |
difficult to value. There is less readily available, reliable information about most loan investments than is the case for many other types of securities. Substantial increases in interest rates may cause an increase in loan obligation defaults. With respect to loan participations, the Fund may not always have direct recourse against a borrower if the borrower fails to pay scheduled principal and/or interest; may be subject to greater delays, expenses and risks than if the Fund had purchased a direct obligation of the borrower; and may be regarded as the creditor of the agent lender (rather than the borrower), subjecting the Fund to the creditworthiness of that lender as well. Investors in loans, such as the Fund, may not be entitled to rely on the anti-fraud protections of the federal securities laws, although they may be entitled to certain contractual remedies. The market for loan obligations may be subject to irregular trading activity, wide bid/ask spreads and extended trade settlement periods. Because transactions in many loans are subject to extended trade settlement periods, the Fund may not receive the proceeds from the sale of a loan for a period after the sale. As a result, sale proceeds related to the sale of loans may not be available to make additional investments or to meet the Fund’s redemption obligations for a period after the sale of the loans, and, as a result, the Fund may have to sell other investments or engage in borrowing transactions, such as borrowing from its credit facility, if necessary to raise cash to meet its obligations.
Senior Loans hold the most senior position in the capital structure of a business entity, and are typically secured with specific collateral, but are nevertheless usually rated below investment grade. Because Second Lien Loans are subordinated or unsecured and thus lower in priority of payment to Senior Loans, they are subject to the additional risk that the cash flow of the borrower and property securing the loan or debt, if any, may be insufficient to meet scheduled payments after giving effect to the senior secured obligations of the borrower. Second Lien Loans generally have greater price volatility than Senior Loans and may be less liquid.
Market and Credit Risks — In the normal course of business, the Funds trade financial instruments and enter into financial transactions where risk of potential loss exists due to changes in the market (market risk). Additionally, the Funds may also be exposed to credit risk in the event that an issuer or guarantor fails to perform or that an institution or entity with which the Funds have unsettled or open transactions defaults.
Multi-Manager Approach Risk — The Funds’ performance depends on the ability of the Investment Adviser in selecting, overseeing, and allocating Fund assets to the Underlying Managers. The Underlying Managers’ investment styles may not always be complementary. The Funds’ multi-manager approach may result in the Fund investing a significant percentage of its assets in certain types of investments, which could be beneficial or detrimental to the Funds’ performance depending on the performance of those investments and the overall market environment. The Funds’ Underlying Managers may underperform the market generally or underperform other investment managers that could have been selected for the Funds. Because the Funds’ Underlying Managers may trade with counterparties, prime brokers, clearing brokers or futures commission merchants on terms that are different than those on which the Investment Adviser would trade, and because each Underlying Manager applies its own risk analysis in evaluating potential counterparties for the Funds, the Funds may be subject to greater counterparty risk than if they were managed directly by the Investment Adviser.
Non-Diversification Risk — The Multi-Manager Non Core Fixed Income Fund is non-diversified, meaning that it is permitted to invest a larger percentage of its assets in fewer issuers than diversified mutual funds. Thus, the Fund may be more susceptible to adverse developments affecting any single issuer held in its portfolio, and may be more susceptible to greater losses because of these developments.
Tax Risk — The Multi-Manager Real Assets Strategy Fund may seek to gain exposure to the commodity markets through investments in the Subsidiary and/or commodity index-linked structured notes, as applicable. Historically, the Internal Revenue Service (“IRS”) issued private letter rulings (“PLRs”) in which the IRS specifically concluded that income and gains from investments in commodity index-linked structured notes or a wholly-owned foreign subsidiary that invests in commodity-linked instruments are “qualifying income” for purposes of compliance with Subchapter M of the Code. However, the Fund has not received a PLR, and is not able to rely on PLRs issued to other taxpayers. Additionally, the IRS has suspended the granting of such PLR, pending review of its position on this matter. The IRS also recently issued proposed regulations that, if finalized, would generally treat the Fund’s income inclusion with respect to a subsidiary as qualifying income only if there is a distribution out of
93
GOLDMAN SACHS STRATEGIC MULTI-ASSET CLASS FUNDS
Notes to Financial Statements (continued)
October 31, 2016
|
| 8. OTHER RISKS (continued) |
the earnings and profits of a subsidiary that are attributable to such income inclusion. The proposed regulations, if adopted, would apply to taxable years beginning on or after 90 days after the regulations are published as final.
The IRS also recently issued a revenue procedure, which states that the IRS will not in the future issue PLRs that would require a determination of whether an asset (such as a commodity index-linked note) is a “security” under the Investment Company Act of 1940. The Fund has obtained an opinion of counsel that the Funds’ income from such investments should constitute “qualifying income.” However, no assurances can be provided that the IRS would not be able to successfully assert that the Fund’s income from such investments was not “qualifying income”, in which case the Fund would fail to qualify as regulated investment company (“RIC”) under Subchapter M of the Code if over 10% of its gross income were derived from these investments. If the Fund failed to qualify as a RIC, it would be subject to federal and state income tax on all of its taxable income at regular corporate tax rates. This would significantly adversely affect the returns to, and could cause substantial losses for, Fund shareholders.
Under the Trust’s organizational documents, its Trustees, officers, employees and agents are indemnified, to the extent permitted by the Act and state law, against certain liabilities that may arise out of performance of their duties to the Funds. Additionally, in the course of business, the Funds enter into contracts that contain a variety of indemnification clauses. The Funds’ maximum exposure under these arrangements is unknown, as this would involve future claims that may be made against the Funds that have not yet occurred. However, GSAM believes the risk of loss under these arrangements to be remote.
Subsequent events after the Statements of Assets and Liabilities date have been evaluated through the date the financial statements were issued. Effective December 1, 2016, Epoch Investment Partners, Inc. is no longer an Underlying Manager for the Goldman Sachs Multi-Manager Global Equity Fund. GSAM has concluded that there is no impact requiring adjustment or disclosure in the financial statements.
94
GOLDMAN SACHS STRATEGIC MULTI-ASSET CLASS FUNDS
|
| 11. SUMMARY OF SHARE TRANSACTIONS |
Share activity is as follows:
| | | | | | | | | | | | | | | | |
| | | Multi-Manager Global Equity Fund | |
| | | | |
| | | For the Fiscal Year Ended
October 31, 2016 | | | For the Fiscal Year Ended
October 31, 2015(a) | |
| | | | |
| | | Shares | | | Dollars | | | Shares | | | Dollars |
| | | | |
| Institutional Shares | |
Shares sold | | | 25,427,589 | | | $ | 232,750,015 | | | | 46,612,176 | | | $ | 453,850,015 | |
Reinvestment of distributions | | | 284,095 | | | | 2,625,036 | | | | — | | | | — | |
Shares redeemed | | | (8,365,099 | ) | | | (79,364,935 | ) | | | (196,619 | ) | | | (1,850,010 | ) |
NET INCREASE | | | 17,346,585 | | | $ | 156,010,116 | | | | 46,415,557 | | | $ | 452,000,005 | |
| (a) | | Commenced operations on June 24, 2015. |
| | | | | | | | | | | | | | | | |
| | | Multi-Manager Non-Core Fixed Income Fund | |
| | | | |
| | | For the Fiscal Year Ended
October 31, 2016 | | | For the Fiscal Year Ended
October 31, 2015(a) | |
| | | | |
| | | Shares | | | Dollars | | | Shares | | | Dollars |
| | | | |
| Institutional Shares | |
Shares sold | | | 2,361,601 | | | $ | 21,565,005 | | | | 28,553,941 | | | $ | 277,000,010 | |
Reinvestment of distributions | | | 1,515,954 | | | | 14,180,160 | | | | 482,606 | | | | 4,611,344 | |
Shares redeemed | | | (1,066,293 | ) | | | (10,121,966 | ) | | | (162,202 | ) | | | (1,550,005 | ) |
NET INCREASE | | | 2,811,262 | | | $ | 25,623,199 | | | | 28,874,345 | | | $ | 280,061,349 | |
| (a) | | Commenced operations March 31, 2015. |
| | | | | | | | | | | | | | | | |
| | | Multi-Manager Real Assets Strategy Fund | |
| | | | |
| | | For the Fiscal Year Ended
October 31, 2016 | | | For the Fiscal Year Ended
October 31, 2015 | |
| | | | |
| | | Shares | | | Dollars | | | Shares | | | Dollars |
| | | | |
| Institutional Shares | |
Shares sold | | | 12,846,967 | | | $ | 117,600,015 | | | | 20,625,771 | | | $ | 201,300,015 | |
Reinvestment of distributions | | | 698,834 | | | | 6,496,622 | | | | — | | | | — | |
Shares redeemed | | | (521,785 | ) | | | (4,940,015 | ) | | | (1 | ) | | | (10 | ) |
NET INCREASE | | | 13,024,016 | | | $ | 119,156,622 | | | | 20,625,770 | | | $ | 201,300,005 | |
| (a) | | Commenced operations on June 30, 2015. |
95
Report of Independent Registered Public
Accounting Firm
To the Board of Trustees of Goldman Sachs Trust II and Shareholders of
the Goldman Sachs Strategic Multi-Asset Class Funds:
In our opinion, the accompanying statements of assets and liabilities, including the schedules of investments, and the related statements of operations and of changes in net assets and the financial highlights present fairly, in all material respects, the financial position of the Goldman Sachs Multi-Manager Global Equity Fund, Goldman Sachs Multi-Manager Non-Core Fixed Income Fund, and Goldman Sachs Multi-Manager Real Assets Strategy Fund (collectively the “Funds”), funds of the Goldman Sachs Trust II, at October 31, 2016, and the results of each of their operations, the changes in each of their net assets and the financial highlights for each of the periods indicated, in conformity with accounting principles generally accepted in the United States of America. These financial statements and financial highlights (consolidated financial statements and financial highlights for Goldman Sachs Multi-Manager Real Assets Strategy Fund) (hereafter referred to as “financial statements”) are the responsibility of the Funds’ management. Our responsibility is to express an opinion on these financial statements based on our audits. We conducted our audits of these financial statements in accordance with the standards of the Public Company Accounting Oversight Board (United States). Those standards require that we plan and perform the audit to obtain reasonable assurance about whether the financial statements are free of material misstatement. An audit includes examining, on a test basis, evidence supporting the amounts and disclosures in the financial statements, assessing the accounting principles used and significant estimates made by management, and evaluating the overall financial statement presentation. We believe that our audits, which included confirmation of securities at October 31, 2016 by correspondence with the custodian, brokers and the application of alternative auditing procedures where securities purchased confirmations had not been received, provide a reasonable basis for our opinion.
PricewaterhouseCoopers LLP
Boston, Massachusetts
December 23, 2016
96
GOLDMAN SACHS MULTI-MANAGER GLOBAL EQUITY FUND
Fund Expenses — Period Ended October 31, 2016 (Unaudited)
As a shareholder of Institutional Shares of the Funds, you incur two types of costs: (1) transaction costs, including sales charges on purchase payments, and (2) ongoing costs, including management fees; and other Fund expenses. This Example is intended to help you understand your ongoing costs (in dollars) of investing in the Funds and to compare these costs with the ongoing costs of investing in other mutual funds.
The Example is based on an investment of $1,000 invested at the beginning of the period and held for the entire period from May 1, 2016 through October 31, 2016, which represents a period of 184 days in a 366 day year.
Actual Expenses — The first line under each share class in the table below provides information about actual account values and actual expenses. You may use the information in this line, together with the amount you invested, to estimate the expenses that you paid over the period. Simply divide your account value by $1,000 (for example, an $8,600 account value divided by $1,000=8.6), then multiply the result by the number in the first line under the heading entitled “Expenses Paid” to estimate the expenses you paid on your account during this period.
Hypothetical Example for Comparison Purposes — The second line under each share class in the table below provides information about hypothetical account values and hypothetical expenses based on the Funds’ actual net expense ratios and an assumed rate of return of 5% per year before expenses, which is not the Funds’ actual return. The hypothetical account values and expenses may not be used to estimate the actual ending account balance or expenses you paid for the period. You may use this information to compare the ongoing costs of investing in the Funds and other funds. To do so, compare this 5% hypothetical example with the 5% hypothetical examples that appear in the shareholder reports of the other funds.
Please note that the expenses shown in the table are meant to highlight your ongoing costs only and do not reflect any transactional costs, such as sales charges, redemption fees, or exchange fees. Therefore, the second line of the table is useful in comparing ongoing costs only, and will not help you determine the relative total costs of owning different funds. In addition, if these transactional costs were included, your costs would have been higher.
| | | | | | | | | | | | | | | | | | | | | | | | | | | | | | | | | | | | |
| | | Multi-Manager Global Equity Fund | | | Multi-Manager Non-Core Fixed Income Fund | | | Multi-Manager Real Assets Strategy Fund | |
| Share Class | | Beginning
Account
Value
5/1/16 | | | Ending
Account
Value
10/31/16 | | | Expenses
Paid for the
6 months ended
10/31/16* | | | Beginning
Account
Value
5/1/16 | | | Ending
Account
Value
10/31/16 | | | Expenses
Paid for the
6 months ended
10/31/16* | | | Beginning
Account
Value
5/1/16 | | | Ending
Account
Value
10/31/16 | | | Expenses
Paid for the
6 months ended
10/31/16* | |
| Institutional | | | | | | | | | | | | | | | | | | | | | | | | | | | | | | | | | | | | |
Actual | | $ | 1,000.00 | | | $ | 1,025.90 | | | $ | 4.89 | | | $ | 1,000.00 | | | $ | 1,040.70 | | | $ | 3.59 | | | $ | 1,000.00 | | | $ | 1,001.30 | | | $ | 4.63 | |
Hypothetical 5% return | | | 1,000.00 | | | | 1,020.31 | | | | 4.88 | | | | 1,000.00 | | | | 1,021.62 | + | | | 3.56 | | | | 1,000.00 | | | | 1,020.51 | | | | 4.67 | |
| * | | Expenses for each share class are calculated using each Fund’s annualized net expense ratio for each class, which represents the ongoing expenses as a percentage of net assets for the six months ended October 31, 2016. Expenses are calculated by multiplying the annualized net expense ratio by the average account value for the period; then multiplying the result by the number of days in the most recent fiscal half year; and then dividing that result by the number of days in the fiscal year. The annualized net expense ratios for the period were as follows: |
| | | | |
| Fund | | Institutional | |
Multi-Manager Global Equity | | | 0.85 | % |
Multi-Manager Non-Core Fixed Income | | | 0.70 | |
Multi-Manager Real Assets Strategy | | | 0.85 | |
97
GOLDMAN SACHS STRATEGIC MULTI-ASSET CLASS FUNDS
Statement Regarding Basis for Approval of Management Agreement and Sub-Advisory Agreements (Unaudited)
Background
The Goldman Sachs Multi-Manager Non-Core Fixed Income Fund, Goldman Sachs Multi-Manager Global Equity Fund, and Goldman Sachs Multi-Manager Real Assets Strategy Fund (the “Funds”) are investment portfolios of Goldman Sachs Trust II (the “Trust”). The Board of Trustees oversees the management of the Trust and reviews the investment performance and expenses of the Funds at regularly scheduled meetings held throughout the year. Each Fund employs a “manager of managers” structure, whereby Goldman Sachs Asset Management, L.P. and Goldman Sachs Asset Management International (collectively, the “Investment Adviser”) are responsible for selecting sub-advisers (subject to Board approval), allocating the Fund’s assets among them, and overseeing their day-to-day management of Fund assets. The Board of Trustees determines annually whether to approve the continuance of the Trust’s investment management agreement (the “Management Agreement”) with the Investment Adviser on behalf of the Funds.
The Management Agreement was most recently approved for continuation until August 31, 2017 by the Board of Trustees, including those Trustees who are not parties to the Management Agreement or “interested persons” (as defined in the Investment Company Act of 1940, as amended) (the “1940 Act”), of any party thereto (the “Independent Trustees”), at a meeting held on August 3, 2016 (the “Annual Meeting”). At the Annual Meeting, the Board also considered the sub-advisory agreements (each a “Designated Sub-Advisory Agreement”) between the Investment Adviser and (i) each of Ares Capital Management II LLC, BlueBay Asset Management LLP, Lazard Asset Management LLC, and Symphony Asset Management LLC (on behalf of Goldman Sachs Multi-Manager Non-Core Fixed Income Fund); (ii) Causeway Capital Management LLC, Epoch Investment Partners, Inc., Fisher Asset Management, LLC, GW&K Investment Management, LLC, Parametric Portfolio Associates LLC, Principal Global Investors, LLC, Robeco Investment Management, Inc. d/b/a Boston Partners, Russell Investment Implementation Services, LLC, Scharf Investments, LLC, Vulcan Value Partners, LLC (“Vulcan”), and WCM Investment Management (on behalf of Goldman Sachs Multi-Manager Global Equity Fund); and (iii) PGIM Real Estate, a business unit of PGIM Inc. and RREEF America L.L.C. (on behalf of Goldman Sachs Multi-Manager Real Assets Strategy Fund) (collectively, the “Designated Sub-Advisers” and together with all sub-advisers serving from time to time, the Sub-Advisers).
The review process undertaken by the Trustees spans the course of the year and culminates with the Annual Meeting. To assist the Trustees in their deliberations, the Trustees have established a Contract Review Committee (the “Committee”), comprised of the Independent Trustees. The Committee held four meetings over the course of the year since the Management Agreement was last approved. At those Committee meetings, regularly scheduled Board or other committee meetings, and/or the Annual Meeting, matters relevant to the renewal of the Management Agreement or the Designated Sub-Advisory Agreements were considered by the Board, or the Independent Trustees, as applicable. With respect to each Fund, such matters included:
| | (a) | | the nature and quality of the advisory, administrative, and other services provided to the Fund by the Investment Adviser and its affiliates, including information about: |
| | (i) | | the structure, staff, and capabilities of the Investment Adviser and its portfolio management teams; |
| | (ii) | | the groups within the Investment Adviser and its affiliates that support the portfolio management teams and the Sub-Advisers or provide other types of necessary services, including fund services groups (e.g., accounting and financial reporting, tax, shareholder services, and operations); controls and risk management groups (e.g., legal, compliance, valuation oversight, credit risk management, internal audit, compliance testing, market risk analysis, finance, and central funding); sales and distribution support groups, and others (e.g., information technology and training); |
| | (iii) | | trends in employee headcount; |
| | (iv) | | the Investment Adviser’s financial resources and ability to hire and retain talented personnel and strengthen its operations; and |
| | (v) | | the parent company’s support of the Investment Adviser and its mutual fund business, as expressed by the firm’s senior management; |
| | (b) | | information on the investment performance of the Fund, including comparisons to the performance of similar mutual funds, as provided by a third-party mutual fund data provider engaged as part of the contract review process (the “Outside Data Provider”), benchmark performance indices, commingled investment vehicles with comparable investment strategies managed by the Investment Adviser, and general investment outlooks in the markets in which the Fund invests; |
| | (c) | | information provided by the Investment Adviser indicating the Investment Adviser’s views on the degree to which the Fund’s peer group and/or benchmark index was relevant to the Fund’s particular investment strategy; |
| | (d) | | the terms of the Management Agreement and other agreements with affiliated service providers entered into by the Trust on behalf of the Fund; |
98
GOLDMAN SACHS STRATEGIC MULTI-ASSET CLASS FUNDS
Statement Regarding Basis for Approval of Management Agreement and Sub-Advisory Agreements (Unaudited) (continued)
| | (e) | | fee and expense information for the Fund, including: |
| | (i) | | the relative management fee and expense level of the Fund as compared to those of comparable funds managed by other advisers, as provided by the Outside Data Provider; and |
| | (ii) | | comparative information on the advisory fees charged and services provided by the Investment Adviser to certain collective investment vehicles that it manages with comparable investment strategies; |
| | (f) | | with respect to the investment performance and expense comparison data provided by the Outside Data Provider, its processes in producing that data for the Fund; |
| | (g) | | the undertakings of the Investment Adviser and its affiliates to implement fee waivers and/or expense limitations; |
| | (h) | | information relating to the profitability of the Management Agreement and the transfer agency of the Fund to the Investment Adviser and its affiliates; |
| | (i) | | whether the Fund’s existing management fee schedule adequately addressed any economies of scale; |
| | (j) | | a summary of the “fall-out” benefits derived by the Investment Adviser and its affiliates from their relationships with the Fund, including the fees received by the Investment Adviser’s affiliates from the Fund for transfer agency, distribution and other services; |
| | (k) | | a summary of potential benefits derived by the Fund as a result of its relationship with the Investment Adviser; |
| | (l) | | portfolio manager ownership of Fund shares; the manner in which portfolio manager compensation is determined; information on the Sub-Advisers’ compensation arrangements; and the number and types of accounts managed by the portfolio managers; |
| | (m) | | the nature and quality of the services provided to the Fund by its unaffiliated service providers (including the Sub-Advisers), and the Investment Adviser’s general oversight and evaluation (including reports on due diligence) of those service providers as part of the administrative services provided under the Management Agreement; and |
| | (n) | | the Investment Adviser’s processes and policies addressing various types of potential conflicts of interest; its approach to risk management; the annual review of the effectiveness of the Fund’s compliance program; and periodic compliance reports. |
The Trustees also received an overview of the Funds’ distribution arrangements. They received information regarding the Funds’ assets and share purchase and redemption activity.
The presentations made at the Board and Committee meetings and at the Annual Meeting encompassed the Funds and other mutual funds for which the Board of Trustees has responsibility. In evaluating the Management Agreement at the Annual Meeting, the Trustees relied upon their knowledge, resulting from their meetings and other interactions throughout the year, of the Investment Adviser and its affiliates, their services, and the Funds. In conjunction with these meetings, the Trustees received written materials and oral presentations on the topics covered, and the Investment Adviser addressed the questions and concerns of the Trustees, including concerns regarding the investment performance of certain of the funds they oversee. The Independent Trustees were advised by their independent legal counsel regarding their responsibilities and other regulatory requirements related to the approval and continuation of mutual fund investment management agreements under applicable law. In addition, the Investment Adviser and its affiliates provided the Independent Trustees with a written response to a formal request for information sent on behalf of the Independent Trustees by their independent legal counsel. During the course of their deliberations, the Independent Trustees met in executive sessions with their independent legal counsel, without representatives of the Investment Adviser or its affiliates present.
Nature, Extent, and Quality of the Services Provided Under the Management Agreement
As part of their review, the Trustees considered the nature, extent, and quality of the services provided to the Funds by the Investment Adviser. In this regard, the Trustees considered both the investment advisory services and non-advisory services that are provided by the Investment Adviser and its affiliates. The Trustees noted the transition in the leadership and changes in personnel of various of the Investment Adviser’s portfolio management teams that had occurred in recent periods, and the ongoing recruitment efforts aimed at bringing high quality investment talent to the Investment Adviser. They also noted the Investment Adviser’s commitment to maintaining high quality systems and expending substantial resources to respond to ongoing changes to the regulatory and control environment in which the Funds and their service providers operate, as well as the efforts of the Investment Adviser and its affiliates to combat cyber security risks. The Trustees concluded that the Investment Adviser continued to commit substantial financial and operational resources to the Funds and expressed confidence that the Investment Adviser would continue to do so in the future. The Trustees also recognized that the Investment Adviser had made significant commitments to address regulatory compliance requirements applicable to the Funds and the Investment Adviser and its affiliates. In addition, the
99
GOLDMAN SACHS STRATEGIC MULTI-ASSET CLASS FUNDS
Statement Regarding Basis for Approval of Management Agreement and Sub-Advisory Agreements (Unaudited) (continued)
Trustees reviewed the Sub-Adviser oversight process that the Investment Adviser had employed, which included areas such as investment analytics, risk management and compliance.
Investment Performance
The Trustees also considered the investment performance of the Funds. In this regard, they compared the investment performance of each Fund to its peers using rankings and ratings compiled by the Outside Data Provider as of June 30, 2016 or by the Investment Adviser using the Outside Data Provider peer groups. The information on each Fund’s investment performance was provided for the one-year period ending on June 30, 2016, to the extent that each Fund had been in existence for that period. The Trustees also reviewed each Fund’s investment performance relative to its performance benchmark. The Trustees considered the Investment Adviser’s representations that each Fund had significant differences from its Outside Data Provider peer group and/or benchmark index that caused them to be imperfect bases for comparison. As part of this review, they considered the investment performance trends of the Funds over time, and reviewed the investment performance of each Fund in light of its investment objective and policies and market conditions. The Trustees also received information comparing the Funds’ performance to that of comparable unregistered funds for which the Investment Adviser also serves as investment adviser. They considered that the unregistered funds provide an imperfect performance comparison because they are not subject to the requirements of the 1940 Act.
In addition, the Trustees considered materials prepared and presentations made throughout the year by the Investment Adviser’s senior management and portfolio management personnel in which Fund performance was assessed. The Trustees also considered the Investment Adviser’s periodic reports with respect to the Funds’ risk profiles, and how the Investment Adviser’s approach to risk monitoring and management influences portfolio management.
The Trustees noted that Goldman Sachs Multi-Manager Non-Core Fixed Income Fund had placed in the second quartile of its performance peer group, and had underperformed its benchmark index. The Trustees noted that the Goldman Sachs Multi-Manager Global Equity Fund had placed in the second quartile of its performance peer group, and had underperformed its benchmark index. The Trustees noted that the Goldman Sachs Real Assets Strategy Fund had placed in the third quartile of its performance peer group, and had underperformed its benchmark index.
Costs of Services Provided and Competitive Information
The Trustees considered the contractual terms of the Management Agreement, the fee rates payable by each Fund thereunder, and the net amount retained by the Investment Adviser after payment of sub-advisory fees. In this regard, the Trustees considered information on the services rendered by the Investment Adviser to the Funds, which included both advisory and administrative services that were directed to the needs and operations of the Funds as registered mutual funds.
In particular, the Trustees reviewed analyses prepared by the Outside Data Provider regarding the expense rankings of the Funds. The analyses provided a comparison of each Fund’s management fee and breakpoints to those of a relevant peer group and category universe; an expense analysis which compared each Fund’s overall net and gross expenses to a peer group and a category universe; and data comparing each Fund’s net expenses to the peer and category medians. The Trustees also considered comparative fee information for services provided by the Investment Adviser to collective investment vehicles having investment objectives and policies similar to those of each Fund except Goldman Sachs Multi-Manager Real Assets Strategy Fund. They considered information that indicated that services provided to the Funds differed in various significant respects from the services provided to other types of accounts which, in many cases, operated under less stringent legal and regulatory structures, required fewer services from the Investment Adviser to a smaller number of client contact points, and were less time-intensive. They also noted that certain of these types of accounts have a compensation structure which includes performance fees, and also pay additional asset-based fees and performance fees to the managers of underlying hedge funds. The analyses also compared each Fund’s transfer agency and custody fees, other expenses and fee waivers/reimbursements to those of the peer group and category medians. The Trustees concluded that the comparisons provided by the Outside Data Provider were useful in evaluating the reasonableness of the management fees and total expenses paid by the Funds.
In addition, the Trustees considered the Investment Adviser’s undertakings to implement fee waivers and/or expense limitations. They considered the Investment Adviser’s undertaking to waive a portion of the management fees payable by the Funds. In this regard, the Trustees noted that the Investment Adviser’s institutional clients that are invested in the Funds pay a single management fee for the Investment Adviser’s management of their accounts, and that the Investment Adviser waives a portion of the management fee with respect to each Fund in order to achieve an effective net management fee rate that is equal to the actual cost of fees paid to the Fund’s sub-advisers. The Trustees also considered the Investment Adviser’s undertaking to limit each Fund’s “other expenses” ratios (excluding certain expenses) to a specified level.
100
GOLDMAN SACHS STRATEGIC MULTI-ASSET CLASS FUNDS
Statement Regarding Basis for Approval of Management Agreement and Sub-Advisory Agreements (Unaudited) (continued)
In addition, the Trustees noted that shareholders are able to redeem their Fund shares at any time if shareholders believe that the Fund fees and expenses are too high or if they are dissatisfied with the performance of the Fund.
Profitability
The Trustees reviewed the Investment Adviser’s revenues and pre-tax profit margins with respect to each of the Funds. In this regard the Trustees noted that they had received, among other things, profitability analyses and summaries, revenue and expense schedules by Fund and by function (i.e., investment management and transfer agency), and information on the Investment Adviser’s expense allocation methodology. They observed that the profitability and expense figures are substantially similar to those used by the Investment Adviser for many internal purposes, including compensation decisions among various business groups, and are thus subject to a vigorous internal debate about how certain revenue and expenses should be allocated. The Trustees also noted that the internal audit group within the Goldman Sachs organization had audited the expense allocation methodology and was satisfied with the reasonableness, consistency, and accuracy of the Investment Adviser’s expense allocation methodology and profitability analysis calculations. The Trustees considered profitability information for each Fund in relation to the Investment Adviser’s overall profitability.
Economies of Scale
The Trustees considered the information that had been provided regarding the Investment Adviser’s profitability. The Trustees also considered the breakpoints in the fee rate payable under the Management Agreement for each of the Funds at the following annual percentage rates of the average daily net assets of the Funds:
| | | | | | | | | | | | |
Average Daily
Net Assets | | Multi-Manager
Non-Core Fixed
Income Fund | | | Multi-Manager
Global Equity
Fund | | | Multi-Manager
Real Assets
Strategy Fund | |
| First $1 billion | | | 0.85 | % | | | 1.03 | % | | | 1.00 | % |
| Next $1 billion | | | 0.85 | | | | 0.93 | | | | 0.90 | |
| Next $3 billion | | | 0.77 | | | | 0.89 | | | | 0.86 | |
| Next $3 billion | | | 0.73 | | | | 0.87 | | | | 0.84 | |
| Over $8 billion | | | 0.71 | | | | 0.84 | | | | 0.82 | |
The Trustees noted that the breakpoints were designed to share potential economies of scale, if any, with the Funds and their shareholders as assets under management reach those asset levels. The Trustees considered the amounts of assets in the Funds; the Funds’ recent share purchase and redemption activity; the information provided by the Investment Adviser relating to the costs of the services provided by the Investment Adviser and its affiliates and their realized profits; information comparing fee rates charged by the Investment Adviser with fee rates charged to other funds in the peer groups; and the Investment Adviser’s undertakings to waive a portion of its management fee and to limit certain expenses of the Funds that exceed specified levels. Upon reviewing these matters at the Annual Meeting, the Trustees concluded that the fee breakpoints represented a means of assuring that benefits of scalability, if any, would be passed along to shareholders at the specified asset levels. The Independent Trustees also considered the relationship between the advisory and sub-advisory fee rate schedules.
Other Benefits to the Investment Adviser and Its Affiliates
The Trustees also considered the other benefits derived by the Investment Adviser and its affiliates from their relationships with the Funds as stated above, including: (a) transfer agency fees received by Goldman, Sachs & Co. (“Goldman Sachs”); (b) brokerage and futures commissions earned by Goldman Sachs for executing securities and futures transactions on behalf of the Funds; (c) the Investment Adviser’s ability to leverage the infrastructure designed to service the Funds on behalf of its other clients; (d) the Investment Adviser’s ability to cross-market other products and services to Fund shareholders; (e) Goldman Sachs’ retention of certain fees as Fund Distributor; (f) the Investment Adviser’s ability to negotiate better pricing with custodians on behalf of its other clients, as a result of the relationship with the Funds; and (g) the possibility that the working relationship between the Investment Adviser and the Funds’ third-party service providers (including the Sub-Advisers) may cause those service providers to be more likely to do business with other areas of Goldman Sachs. In the course of considering the foregoing, the Independent Trustees requested and received further information quantifying certain of these fall-out benefits.
101
GOLDMAN SACHS STRATEGIC MULTI-ASSET CLASS FUNDS
Statement Regarding Basis for Approval of Management Agreement and Sub-Advisory Agreements (Unaudited) (continued)
Other Benefits to the Funds and Their Shareholders
The Trustees also noted that the Funds receive certain potential benefits as a result of their relationship with the Investment Adviser, including: (a) enhanced servicing from vendors because of the volume of business generated by the Investment Adviser and its affiliates; (b) the Investment Adviser’s knowledge and experience gained from managing other accounts and products; (c) the Investment Adviser’s ability to hire and retain qualified personnel to provide services to the Funds because of the reputation of the Goldman Sachs organization; (d) the Funds’ access, through the Investment Adviser, to certain firmwide resources (e.g., proprietary risk management systems and databases), subject to certain restrictions; and (e) the Funds’ access to certain affiliated distribution channels. In addition, the Trustees noted the competitive nature of the mutual fund marketplace, and considered that many of the Funds’ shareholders invested in the Funds in part because of the Funds’ relationship with the Investment Adviser and that those shareholders have a general expectation that the relationship will continue.
Conclusion
In connection with their consideration of the Management Agreement, the Trustees gave weight to each of the factors described above, but did not identify any particular factor as controlling their decision. After deliberation and consideration of all of the information provided, including the factors described above, the Trustees concluded, in the exercise of their business judgment, that the management fees paid by each of the Funds were reasonable in light of the services provided to it by the Investment Adviser, the Investment Adviser’s costs and each Fund’s current and reasonably foreseeable asset levels. The Trustees unanimously concluded that the Management Agreement should be approved and continued with respect to each Fund until August 31, 2017.
Designated Sub-Advisory Agreements
Nature, Extent, and Quality of the Services Provided Under the Designated Sub-Advisory Agreements and Performance
In evaluating the Designated Sub-Advisory Agreements, the Trustees relied upon materials furnished and presentations made by the Investment Adviser and the Designated Sub-Advisers. In evaluating the nature, extent, and quality of services provided by each Designated Sub-Adviser, the Trustees considered information on the services provided to the Funds by each Designated Sub-Adviser, including information about each Designated Sub-Adviser’s (a) personnel and organizational structure; (b) track record in managing funds and/or accounts with investment strategies similar to those employed on behalf of the Funds; (c) policies and procedures in place to address potential conflicts of interest; and (d) compliance program and code of ethics. The Trustees also reviewed the operations and investment performance of each Designated Sub-Adviser’s respective sleeve of each Fund since its inception. In considering each Designated Sub-Adviser’s investment performance, the Trustees reviewed a comparison of each Designated Sub-Adviser to relevant benchmark indices based on various metrics, including realized beta, excess return, alpha, and volatility. The Trustees also reviewed the services provided to each Fund under each Designated Sub-Advisory Agreement.
Costs of Services Provided
The Trustees reviewed the terms of each Designated Sub-Advisory Agreement, including the fee schedules for the Designated Sub-Advisers. They considered the breakpoints (if applicable) in the sub-advisory fee rate payable under each Designated Sub-Advisory Agreement. The Trustees noted that the compensation paid to each Designated Sub-Adviser would be paid by the Investment Adviser, not by the Funds. They noted that the Investment Adviser believes that the relationship between the management fees paid by the Funds and the sub-advisory fees paid by the Investment Adviser is appropriate given the level of services the Investment Adviser provides to the Funds and significant differences in cost drivers and risks associated with the respective services offered by the Investment Adviser and each Designated Sub-Adviser, as well as the management fee waivers and expense limitations that substantially reduce the fees retained by the Investment Adviser. In this regard, the Trustees considered that at their meeting held on May 4, 2016, they had approved an amendment to the Sub-Advisory Agreement with Vulcan on behalf of Goldman Sachs Multi-Manager Global Equity Fund, which reflected a reduction from the prior fee schedule. They noted that the fee reduction benefitted shareholders of the Fund in light of the existing management fee waiver arrangement. The Trustees reviewed the anticipated blended average of all sub-advisory fees to be paid by the Investment Adviser with respect to each Fund in light of the overall management fee to be paid by each Fund.
Conclusion
In connection with their consideration of the Designated Sub-Advisory Agreements at the Meeting, the Trustees gave weight to various factors, but did not identify any particular factor as controlling their decision. After deliberation and consideration of the
102
GOLDMAN SACHS STRATEGIC MULTI-ASSET CLASS FUNDS
Statement Regarding Basis for Approval of Management Agreement and Sub-Advisory Agreements (Unaudited) (continued)
information provided, the Trustees present concluded that each Designated Sub-Advisory Agreement should be approved and continued until August 31, 2017.
Amendment to Designated Sub-Advisory Agreements
Upon the recommendation of the Investment Adviser, at a meeting held on September 14, 2016, the Trustees, including all of the Independent Trustees present, approved amendments to the Sub-Advisory Agreements with RARE Infrastructure (North America) Pty Ltd (“RARE”) (on behalf of Goldman Sachs Multi-Manager Real Assets Strategy Fund) and WCM Investment Management (“WCM”) (on behalf of Goldman Sachs Multi-Manager Global Equity Fund). The Trustees considered that the amendment to the Sub-Advisory Agreement with WCM would reduce WCM’s sub-advisory fee after giving effect to breakpoints. They noted that the amended Sub-Advisory Agreement would benefit shareholders of Goldman Sachs Multi-Manager Global Equity Fund in light of the Fund’s existing management fee waiver arrangement. The Trustees noted that the fee schedule for the Sub-Advisory Agreement with RARE was being revised to remove the provision that total assets for purposes of applying breakpoints also included assets managed by RARE on behalf of any fund organized under the European Union Directive on Undertakings for Collective Investment in Transferable Securities (UCITS) pursuant to a sub-advisory agreement with the Investment Adviser. The Trustees considered that at the time of the approval of the amended Sub-Advisory Agreement RARE had not yet been allocated assets of Goldman Sachs Multi-Manager Real Assets Strategy Fund.
New Sub-Advisory Agreements
In addition to the actions taken by the Trustees to approve the continuation of the Management Agreement and the Designated Sub-Advisory Agreements, upon the recommendation of the Investment Adviser, at meetings held on May 4, 2016 and September 14, 2016, the Trustees, including all of the Independent Trustees present, approved sub-advisory agreements (each, a “New Sub-Advisory Agreement”) between the Investment Adviser and Legal & General Investment Management America, Inc. (“Legal & General”) (on behalf of Goldman Sachs Multi-Manager Global Equity Fund); and Presima Inc. and RARE Infrastructure (North America) Pty Ltd (on behalf of Goldman Sachs Multi-Manager Real Assets Strategy Fund) (each, a “New Sub-Adviser” and, collectively, the “New Sub-Advisers”). In connection with their evaluation of the New Sub-Advisory Agreements, the Trustees received written materials and oral presentations on the topics covered, and were advised by their independent legal counsel. In addition, the Trustees received information prepared by each New Sub-Adviser in a written response to a formal request from the Investment Adviser.
Nature, Extent, and Quality of the Services Provided Under the New Sub-Advisory Agreements
In evaluating the New Sub-Advisory Agreements, they relied on the information provided by the Investment Adviser and each New Sub-Adviser. In evaluating the nature, extent, and quality of services to be provided by each New Sub-Adviser, the Trustees considered information on the services to be provided to the Fund by the New Sub-Adviser, including information about the New Sub-Adviser’s (a) personnel and compensation structure; (b) track record in managing funds and/or accounts with investment strategies similar to those to be employed on behalf of the Fund (or, with respect to Legal & General, its expected tracking error to the index used in managing its sleeve of the Fund); (c) policies and procedures in place to address potential conflicts of interest; and (d) compliance program and code of ethics. In this regard, they considered assessments provided by the Investment Adviser of each New Sub-Adviser, the New Sub-Adviser’s investment strategies and personnel and its compliance program. The Trustees considered that that certain of the New Sub-Advisers manage other assets for the Investment Adviser’s clients. They noted that, because none of the New Sub-Advisers had previously provided services to the Fund for which they were being proposed, there was no performance information to evaluate with respect to the Funds.
Costs of Services to be Provided
The Trustees reviewed the terms of the New Sub-Advisory Agreements and the proposed fee schedules, including any breakpoints. They noted that the compensation paid to the New Sub-Advisers would be paid by the Investment Adviser, not by the Fund. They also noted that the terms of the New Sub-Advisory Agreements were the result of arms’ length negotiations between the Investment Adviser and the applicable New Sub-Adviser. They considered GSAM’s undertaking to waive the portion of its management fee which is in excess of the weighted average of the Fund’s sub-advisory fees.
103
GOLDMAN SACHS STRATEGIC MULTI-ASSET CLASS FUNDS
Statement Regarding Basis for Approval of Management Agreement and Sub-Advisory Agreements (Unaudited) (continued)
Conclusion
In connection with their consideration of the New Sub-Advisory Agreements, the Trustees gave weight to various factors, but did not identify any particular factor as controlling their decision. After deliberation and consideration of the information provided, the Trustees present concluded that each New Sub-Advisory Agreement should be approved for a period of two years from the time of its approval.
104
GOLDMAN SACHS STRATEGIC MULTI-ASSET CLASS FUNDS
Trustees and Officers (Unaudited)
Independent Trustees
| | | | | | | | | | |
Name,
Address and Age1 | | Position(s) Held with the Trust | | Term of Office and
Length of
Time Served2 | | Principal Occupation(s) During Past 5 Years | | Number of
Portfolios in
Fund Complex
Overseen by
Trustee3 | | Other Directorships Held by Trustee4 |
Ashok N. Bakhru Age: 74 | | Chairman of the Board of Trustees | | Since 2012 | | Mr. Bakhru is retired. He was formerly Director, Apollo Investment Corporation (a business development company) (2008-2013); President, ABN Associates (a management and financial consulting firm) (1994-1996 and 1998-2012); Trustee, Scholarship America (1998-2005); Trustee, Institute for Higher Education Policy (2003-2008); Director, Private Equity Investors — III and IV (1998-2007), and Equity-Linked Investors II (April 2002-2007). Chairman of the Board of Trustees — Goldman Sachs Trust II; Goldman Sachs Trust; Goldman Sachs Variable Insurance Trust; Goldman Sachs BDC, Inc.; Goldman Sachs Private Middle Market Credit LLC; Goldman Sachs MLP Income Opportunities Fund; Goldman Sachs MLP and Energy Renaissance Fund; and Goldman Sachs ETF Trust. | | 142 | | None |
Cheryl K. Beebe Age: 60 | | Trustee | | Since 2015 | | Ms. Beebe is retired. She is Director, Convergys Corporation (2015-Present); Director, Packaging Corporation of America (2008-Present); and was formerly Executive Vice President, (2010-2014); and Chief Financial Officer, Ingredion, Inc. (a global corn refining and manufacturing company) (2004-2014). Trustee — Goldman Sachs Trust II. | | 17 | | Convergys Corporation (a customer management company); Packaging Corporation of America (producer of container board) |
John P. Coblentz, Jr. Age: 75 | | Trustee | | Since 2012 | | Mr. Coblentz is retired. Formerly, he was Partner, Deloitte & Touche LLP (a professional services firm) (1975-2003); Director, Emerging Markets Group, Ltd. (a consulting company) (2004-2006); and Director, Elderhostel, Inc. (a not-for profit organization) (2006-2012). Previously, Mr. Coblentz served as Trustee of Goldman Sachs Trust and Goldman Sachs Variable Insurance Trust (2003-2015). Trustee — Goldman Sachs Trust II; Goldman Sachs BDC, Inc.; Goldman Sachs Private Middle Market Credit LLC; Goldman Sachs MLP Income Opportunities Fund; Goldman Sachs MLP and Energy Renaissance Fund; and Goldman Sachs ETF Trust. | | 36 | | None |
Lawrence Hughes Age: 58 | | Trustee | | Since 2016 | | Mr. Hughes is retired. Formerly, he held senior management positions with BNY Mellon Wealth Management, a division of The Bank of New York Mellon Corporation (a financial services company) (1991-2015), most recently as Chief Executive Officer (2010-2015). He serves as Chairman of the Board of Directors, Ellis Memorial and Eldredge House (a not-for-profit organization) (2012-Present). Previously, Mr. Hughes served as an Advisory Board Member of Goldman Sachs Trust II
(February 2016-April 2016). Trustee — Goldman Sachs Trust II. | | 17 | | None |
John F. Killian Age: 61 | | Trustee | | Since 2015 | | Mr. Killian is retired. He is Director, Consolidated Edison, Inc. (2007-Present); Director, Houghton Mifflin Harcourt Publishing Company (2011-Present); and formerly held senior management positions with Verizon Communications, Inc., including Executive Vice President and Chief Financial Officer (2009-2010); and President, Verizon Business, Verizon Communications, Inc. (2005-2009). Trustee — Goldman Sachs Trust II. | | 17 | | Consolidated Edison, Inc. (a utility holding company); Houghton Mifflin Harcourt Publishing Company |
| | | | | | | | | | |
105
GOLDMAN SACHS STRATEGIC MULTI-ASSET CLASS FUNDS
Trustees and Officers (Unaudited) (continued)
Independent Trustees (continued)
| | | | | | | | | | |
Name,
Address and Age1 | | Position(s) Held with the Trust | | Term of Office and
Length of
Time Served2 | | Principal Occupation(s) During Past 5 Years | | Number of
Portfolios in
Fund Complex
Overseen by
Trustee3 | | Other Directorships Held by Trustee4 |
Richard P. Strubel Age: 77 | | Trustee | | Since 2012 | | Mr. Strubel is retired. Formerly, he served as Chairman of the Board of Trustees, Northern Funds (a family of retail and institutional mutual funds managed by Northern Trust Investments, Inc.) (2008-2014) and Trustee (1982-2014); Director, Cardean Learning Group (provider of educational services via the internet) (2003-2008); and Director, Gildan Activewear Inc. (a clothing marketing and manufacturing company) (2000-2014). He serves as Trustee Emeritus, The University of Chicago (1987-Present). Previously, Mr. Strubel served as Trustee of Goldman Sachs Trust (1987-2015) and Goldman Sachs Variable Insurance Trust (1997-2015). Trustee — Goldman Sachs Trust II; Goldman Sachs BDC, Inc.; Goldman Sachs Private Middle Market Credit LLC; Goldman Sachs MLP Income Opportunities Fund; Goldman Sachs MLP and Energy Renaissance Fund; and Goldman Sachs ETF Trust. | | 36 | | None |
Westley V. Thompson Age: 61 | | Trustee | | Since 2016 | | Mr. Thompson is retired. Formerly, he was President, Sun Life Financial, Inc. (a financial services company) (2008-2014); and held senior management positions at various insurance companies including affiliates of Lincoln National Corporation (1998-2008), Cigna Corporation (1994-1997), and Aetna, Inc. (1979-1994). Previously, Mr. Thompson served as an Advisory Board Member of Goldman Sachs Trust II (February 2016-April 2016). Trustee — Goldman Sachs Trust II. | | 17 | | None |
| | | | | | | | | | |
106
GOLDMAN SACHS STRATEGIC MULTI-ASSET CLASS FUNDS
Trustees and Officers (Unaudited) (continued)
Interested Trustee*
| | | | | | | | | | |
Name,
Address and Age1 | | Position(s) Held with the Trust | | Term of Office and
Length of
Time Served2 | | Principal Occupation(s) During Past 5 Years | | Number of
Portfolios in
Fund Complex
Overseen by
Trustee3 | | Other Directorships Held by Trustee4 |
James A. McNamara Age: 54 | | President and Trustee | | Since 2012 | | Managing Director, Goldman Sachs (December 1998-Present); Director of Institutional Fund Sales, GSAM (April 1998-December 2000); and Senior Vice President and Manager, Dreyfus Institutional Service Corporation (January 1993- April 1998). President and Trustee — Goldman Sachs Trust II; Goldman Sachs Trust; Goldman Sachs Variable Insurance Trust; Goldman Sachs MLP Income Opportunities Fund; Goldman Sachs MLP and Energy Renaissance Fund; and Goldman Sachs ETF Trust. | | 140 | | None |
| | | | | | | | | | |
| * | | Mr. McNamara is considered to be an “Interested Trustee” because he holds a position with Goldman Sachs and owns securities issued by The Goldman Sachs Group, Inc. He holds comparable positions with certain other companies of which Goldman Sachs, GSAM or an affiliate thereof is the investment adviser, administrator and/or distributor. |
| 1 | | Each Trustee may be contacted by writing to the Trustee, c/o Goldman Sachs, 200 West Street, New York, New York, 10282, Attn: Caroline Kraus. Information is provided as of October 31, 2016. |
| 2 | | Subject to such policies as may be adopted by the Board from time-to-time, each Trustee holds office for an indefinite term, until the earliest of: (a) the election of his or her successor; (b) the date the Trustee resigns or is removed by the Board or shareholders, in accordance with the Trust’s Declaration of Trust; or (c) the termination of the Trust. The Board has adopted policies which provide that (a) no Trustee shall hold office for more than 15 years and (b) a Trustee shall retire as of December 31st of the calendar year in which he or she reaches his or her 74th birthday, unless a waiver of such requirement shall have been adopted by a majority of the other Trustees. These policies may be changed by the Trustees without shareholder vote. |
| 3 | | The Goldman Sachs Fund Complex includes certain other companies listed above for each respective Trustee. As of October 31, 2016, Goldman Sachs Trust II consisted of 17 portfolios (15 of which offered shares to the public); Goldman Sachs Trust consisted of 92 portfolios (91 of which offered shares to the public); Goldman Sachs Variable Insurance Trust consisted of 14 portfolios; Goldman Sachs BDC, Inc., Goldman Sachs Private Middle Market Credit LLC, Goldman Sachs MLP Income Opportunities Fund, and Goldman Sachs MLP and Energy Renaissance Fund each consisted of one portfolio; and Goldman Sachs ETF Trust consisted of 15 portfolios (eight of which offered shares to the public). Goldman Sachs Private Middle Market Credit LLC does not offer shares to the public. |
| 4 | | This column includes only directorships of companies required to report to the Securities and Exchange Commission under the Securities Exchange Act of 1934 (i.e., “public companies”) or other investment companies registered under the Act. |
Additional information about the Trustees is available in the Funds’ Statement of Additional Information, which can be obtained from Goldman Sachs free of charge by calling this toll-free number (in the United States of America): 1-800-621-2550.
107
GOLDMAN SACHS STRATEGIC MULTI-ASSET CLASS FUNDS
Trustees and Officers (Unaudited) (continued)
Officers of the Trust*
| | | | | | |
Name, Address and Age1 | | Position(s) Held with the Trust | | Term of
Office and
Length of
Time Served2 | | Principal Occupation(s) During Past 5 Years |
James A. McNamara 200 West Street New York, NY 10282 Age: 54 | | President and Trustee | | Since 2012 | | Managing Director, Goldman Sachs (December 1998-Present); Director of Institutional Fund Sales, GSAM (April 1998-December 2000); and Senior Vice President and Manager, Dreyfus Institutional Service Corporation (January 1993-April 1998). President and Trustee — Goldman Sachs Trust II; Goldman Sachs Trust; Goldman Sachs Variable Insurance Trust; Goldman Sachs MLP Income Opportunities Fund; Goldman Sachs MLP and Energy Renaissance Fund; and Goldman Sachs ETF Trust. |
Caroline L. Kraus 200 West Street New York, NY 10282 Age: 39 | | Secretary | | Since 2012 | | Managing Director, Goldman Sachs (January 2016-Present); Vice President, Goldman Sachs (August 2006-December 2015); Associate General Counsel, Goldman Sachs (2012-Present); Assistant General Counsel, Goldman Sachs (August 2006-December 2011); and Associate, Weil, Gotshal & Manges, LLP (2002-2006). Secretary — Goldman Sachs Trust II; Goldman Sachs Trust (previously Assistant Secretary (2012)); Goldman Sachs Variable Insurance Trust (previously Assistant Secretary (2012)); Goldman Sachs BDC, Inc.; Goldman Sachs Private Middle Market Credit LLC; Goldman Sachs Middle Market Lending LLC; Goldman Sachs MLP Income Opportunities Fund; Goldman Sachs MLP and Energy Renaissance Fund; and Goldman Sachs ETF Trust. |
Scott M. McHugh 200 West Street New York, NY 10282 Age: 45 | | Treasurer, Senior Vice President and Principal Financial Officer | | Since 2012 (Principal Financial Officer since 2013) | | Managing Director, Goldman Sachs (January 2016-Present); Vice President, Goldman Sachs (February 2007-December 2015); Assistant Treasurer of certain mutual funds administered by DWS Scudder (2005-2007); and Director (2005-2007), Vice President (2000-2005), and Assistant Vice President (1998-2000), Deutsche Asset Management or its predecessor (1998-2007). Treasurer, Senior Vice President and Principal Financial Officer — Goldman Sachs Trust II; Goldman Sachs Trust; Goldman Sachs Variable Insurance Trust; Goldman Sachs MLP Income Opportunities Fund; Goldman Sachs MLP and Energy Renaissance Fund; and Goldman Sachs ETF Trust. |
| | | | | | |
| * | | Represents a partial list of officers of the Trust. Additional information about all the officers is available in the Funds’ Statement of Additional Information, which can be obtained from Goldman Sachs free of charge by calling this toll-free number (in the United States): 1-800-621-2550. |
| 1 | | Information is provided as of October 31, 2016. |
| 2 | | Officers hold office at the pleasure of the Board of Trustees or until their successors are duly elected and qualified. Each officer holds comparable positions with certain other companies of which Goldman Sachs, GSAM or an affiliate thereof is the investment adviser, administrator and/or distributor. |
Goldman Sachs Trust II — Strategic Multi-Asset Class Funds — Tax Information (Unaudited)
For the year ended October 31, 2016, 26.36% and 21.67% of the dividends paid from net investment company taxable income by the Multi-Manager Global Equity and Multi-Manager Real Assets Strategy Funds, respectively, qualify for the dividends received deduction available to corporations.
For the year ended October 31, 2016, 100% and 51.92% of the dividends paid from net investment company taxable income by the Multi-Manager Global Equity, and Multi-Manager Real Assets Strategy, respectively, qualify for the reduced tax rate under the Jobs and Growth Tax Relief and Reconciliation Act of 2003.
From distributions paid during the year ended October 31, 2016, the total amount of income received by the Multi-Manager Global Equity Fund from sources within foreign countries and possessions of the United States was $0.0125 per share, all of which is attributable to qualified passive income. The percentage of net investment income dividends paid from foreign sources by the Multi-Manager Global Equity Fund was 39.18%. The total amount of taxes paid by the Multi-Manager Global Equity Fund to such countries was $0.0013 per share.
108
FUNDS PROFILE
Goldman Sachs Funds
Goldman Sachs is a premier financial services firm, known since 1869 for creating thoughtful and customized investment solutions in complex global markets.
Today, the Investment Management Division of Goldman Sachs serves a diverse set of clients worldwide, including private institutions, public entities and individuals. With approximately $1.15 trillion in assets under supervision as of September 30, 2016, Goldman Sachs Asset Management (“GSAM”) has portfolio management teams located around the world and our investment professionals bring firsthand knowledge of local markets to every investment decision. Assets under supervision includes assets under management and other client assets for which Goldman Sachs does not have full discretion. GSAM leverages the resources of Goldman, Sachs & Co. subject to legal, internal and regulatory restrictions.
Money Market
Financial Square FundsSM
| n | | Financial Square Treasury Solutions Fund1 |
| n | | Financial Square Government Fund1 |
| n | | Financial Square Money Market Fund2 |
| n | | Financial Square Prime Obligations Fund2 |
| n | | Financial Square Treasury Instruments Fund1 |
| n | | Financial Square Treasury Obligations Fund1 |
| n | | Financial Square Federal Instruments Fund1 |
| n | | Financial Square Tax-Exempt Money Market Fund2 |
Investor FundsSM
| n | | Investor Money Market Fund3 |
| n | | Investor Tax-Exempt Money Market Fund3,4 |
Fixed Income
Short Duration and Government
| n | | High Quality Floating Rate Fund |
| n | | Short-Term Conservative Income Fund5 |
| n | | Short Duration Government Fund |
| n | | Short Duration Income Fund |
| n | | Inflation Protected Securities Fund |
Multi-Sector
Municipal and Tax-Free
| n | | High Yield Municipal Fund |
| n | | Dynamic Municipal Income Fund |
| n | | Short Duration Tax-Free Fund |
Single Sector
| n | | Investment Grade Credit Fund |
| n | | High Yield Floating Rate Fund |
| n | | Emerging Markets Debt Fund |
| n | | Local Emerging Markets Debt Fund |
| n | | Dynamic Emerging Markets Debt Fund |
Fixed Income Alternatives
| n | | Long Short Credit Strategies Fund |
| n | | Fixed Income Macro Strategies Fund |
Fundamental Equity
| n | | Small/Mid Cap Value Fund |
| n | | Small/Mid Cap Growth Fund |
| n | | Flexible Cap Growth Fund |
| n | | Concentrated Growth Fund |
| n | | Technology Opportunities Fund |
| n | | Growth Opportunities Fund |
| n | | Rising Dividend Growth Fund |
| n | | Dynamic U.S. Equity Fund |
Tax-Advantaged Equity
| n | | U.S. Tax-Managed Equity Fund |
| n | | International Tax-Managed Equity Fund |
| n | | U.S. Equity Dividend and Premium Fund |
| n | | International Equity Dividend and Premium Fund |
Equity Insights
| n | | Small Cap Equity Insights Fund |
| n | | U.S. Equity Insights Fund |
| n | | Small Cap Growth Insights Fund |
| n | | Large Cap Growth Insights Fund |
| n | | Large Cap Value Insights Fund |
| n | | Small Cap Value Insights Fund |
| n | | International Small Cap Insights Fund6 |
| n | | International Equity Insights Fund |
| n | | Emerging Markets Equity Insights Fund |
Fundamental Equity International
| n | | Strategic International Equity Fund |
| n | | Focused International Equity Fund |
| n | | Emerging Markets Equity Fund |
Select Satellite
| n | | Real Estate Securities Fund |
| n | | International Real Estate Securities Fund |
| n | | Commodity Strategy Fund |
| n | | Global Real Estate Securities Fund |
| n | | Dynamic Commodity Strategy Fund |
| n | | Dynamic Allocation Fund |
| n | | Absolute Return Tracker Fund |
| n | | Managed Futures Strategy Fund |
| n | | MLP Energy Infrastructure Fund |
| n | | Multi-Manager Alternatives Fund |
| n | | Multi-Asset Real Return Fund |
| n | | Absolute Return Multi-Asset Fund |
| n | | Global Infrastructure Fund |
Total Portfolio Solutions
| n | | Global Managed Beta Fund |
| n | | Multi-Manager Non-Core Fixed Income Fund |
| n | | Multi-Manager U.S. Dynamic Equity Fund |
| n | | Multi-Manager Global Equity Fund |
| n | | Multi-Manager International Equity Fund |
| n | | Tactical Tilt Overlay Fund7 |
| n | | Balanced Strategy Portfolio |
| n | | Multi-Manager U.S. Small Cap Equity Fund |
| n | | Multi-Manager Real Assets Strategy Fund |
| n | | Growth and Income Strategy Portfolio |
| n | | Growth Strategy Portfolio |
| n | | Equity Growth Strategy Portfolio |
| n | | Satellite Strategies Portfolio |
| n | | Enhanced Dividend Global Equity Portfolio |
| n | | Tax-Advantaged Global Equity Portfolio |
| n | | Strategic Factor Allocation Fund |
| n | | Target Date 2020 Portfolio |
| n | | Target Date 2025 Portfolio |
| n | | Target Date 2030 Portfolio |
| n | | Target Date 2035 Portfolio |
| n | | Target Date 2040 Portfolio |
| n | | Target Date 2045 Portfolio |
| n | | Target Date 2050 Portfolio |
| n | | Target Date 2055 Portfolio |
| n | | GQG Partners International Opportunities Fund |
| 1 | | You could lose money by investing in the Fund. Although the Fund seeks to preserve the value of your investment at $1.00 per share, it cannot guarantee it will do so. An investment in the Fund is not a deposit of a bank and is not insured or guaranteed by the Federal Deposit Insurance Corporation or any other government agency. The Fund’s sponsor has no legal obligation to provide financial support to the Fund, and you should not expect that the sponsor will provide financial support to the Fund at any time. |
| 2 | | You could lose money by investing in the Fund. Because the share price of the Fund will fluctuate, when you sell your shares they may be worth more or less than what you originally paid for them. The Fund may impose a fee upon sale of your shares or may temporarily suspend your ability to sell shares if the Fund’s liquidity falls below required minimums because of market conditions or other factors. An investment in the Fund is not a deposit of a bank and is not insured or guaranteed by the Federal Deposit Insurance Corporation or any other government agency. The Fund’s sponsor has no legal obligation to provide financial support to the Fund, and you should not expect that the sponsor will provide financial support to the Fund at any time. |
| 3 | | You could lose money by investing in the Fund. Although the Fund seeks to preserve the value of your investment at $1.00 per share, it cannot guarantee it will do so. The Fund may impose a fee upon sale of your shares or may temporarily suspend your ability to sell shares if the Fund’s liquidity falls below required minimums because of market conditions or other factors. An investment in the Fund is not a deposit of a bank and is not insured or guaranteed by the Federal Deposit Insurance Corporation or any other government agency. The Fund’s sponsor has no legal obligation to provide financial support to the Fund, and you should not expect that the sponsor will provide financial support to the Fund at any time. |
| 4 | | Effective on March 31, 2016, the Goldman Sachs Financial Square Tax-Free Money Market Fund was renamed the Goldman Sachs Investor Tax-Exempt Money Market Fund. |
| 5 | | Effective on July 29, 2016, the Goldman Sachs Limited Maturity Obligations Fund was renamed the Goldman Sachs Short-Term Conservative Income Fund. |
| 6 | | Effective at the close of business on February 5, 2016, the Goldman Sachs International Small Cap Fund was reorganized with and into the Goldman Sachs International Small Cap Insights Fund. |
| 7 | | Effective on June 1, 2016, the Goldman Sachs Tactical Tilt Implementation Fund was renamed the Goldman Sachs Tactical Tilt Overlay Fund. Financial Square FundsSM and Investor FundsSM are registered service marks of Goldman, Sachs & Co. |
| * | | This list covers open-end funds only. Please visit our website at www.GSAMFUNDS.com to learn about our closed-end funds and exchange-traded funds. |
| | |
TRUSTEES Ashok N. Bakhru, Chairman Cheryl K. Beebe John P. Coblentz, Jr. Lawrence Hughes James A. McNamara John F. Killian Richard P. Strubel Westley V. Thompson | | OFFICERS James A. McNamara, President Scott M. McHugh, Principal Financial Officer, Senior Vice President, and Treasurer Caroline L. Kraus, Secretary |
| |
GOLDMAN, SACHS & CO. Distributor and Transfer Agent | | GOLDMAN SACHS ASSET MANAGEMENT, L.P. Investment Adviser |
Visit our web site at www.GSAMFUNDS.com to obtain the most recent month-end returns.
Goldman Sachs Asset Management, L.P., 200 West Street, New York, New York 10282
The reports concerning the Funds included in this shareholder report may contain certain forward-looking statements about the factors that may affect the performance of the Funds in the future. These statements are based on Fund management’s predictions and expectations concerning certain future events and their expected impact on the Funds, such as performance of the economy as a whole and of specific industry sectors, changes in the levels of interest rates, the impact of developing world events, and other factors that may influence the future performance of the Funds. Management believes these forward-looking statements to be reasonable, although they are inherently uncertain and difficult to predict. Actual events may cause adjustments in portfolio management strategies from those currently expected to be employed.
A description of the policies and procedures that the Funds uses to determine how to vote proxies relating to portfolio securities and information regarding how Funds voted proxies relating to portfolio securities during the most recent 12-month period ended June 30 is available (I) without charge, upon request by calling 1-800-621-2550; and (II) on the Securities and Exchange Commission (’’SEC’’) web site at http://www.sec.gov.
Each Fund files its complete schedule of portfolio holdings with the SEC for the first and third quarters of each fiscal year on Form N-Q. The Funds’ Form N-Qs are available on the SEC’s web site at http://www.sec.gov within 60 days after the Funds’ first and third fiscal quarters. The Funds’ Form N-Qs may be reviewed and copied at the SEC’s Public Reference Room in Washington, D.C., and information on the operation of the Public Reference Room may also be obtained by calling 1-800-SEC-0330. Form N-Q may be obtained upon request and without charge by calling 1-800-621-2550.
Fund holdings and allocations shown are as of October 31, 2016 and may not be representative of future investments. Fund holdings should not be relied on in making investment decisions and should not be construed as research or investment advice regarding particular securities. Current and future holdings are subject to risk.
Economic and market forecasts presented herein reflect our judgment as of the date of this presentation and are subject to change without notice. These forecasts do not take into account the specific investment objectives, restrictions, tax and financial situation or other needs of any specific client. Actual data will vary and may not be reflected here. These forecasts are subject to high levels of uncertainty that may affect actual performance. Accordingly, these forecasts should be viewed as merely representative of a broad range of possible outcomes. These forecasts are estimated, based on assumptions, and are subject to significant revision and may change materially as economic and market conditions change. Goldman Sachs has no obligation to provide updates or changes to these forecasts. Case studies and examples are for illustrative purposes only.
The portfolio risk management process includes an effort to monitor and manage risk, but does not imply low risk. Diversification does not protect an investor from market risk and does not ensure a profit. Past correlations are not indicative of future correlations, which may vary.
This material is not authorized for distribution to prospective investors unless preceded or accompanied by a current Prospectus or summary prospectus, if applicable. Investors should consider the Funds’ objective, risks, and charges and expenses, and read the summary prospectus, if available, and/or the Prospectus carefully before investing or sending money. The summary prospectus, if available, and the Prospectus contain this and other information about each Fund and may be obtained from your authorized dealer or from Goldman, Sachs & Co. by calling 1-800-621-2550.
© 2016 Goldman Sachs. All rights reserved. 74839-TMPL-12/2016 SMACAR-16/169
Goldman Sachs Funds

| | | | |
| | |
| Annual Report | | | | October 31, 2016 |
| | |
| | | | Target Date Portfolios |
| | | | Target Date 2020 |
| | | | Target Date 2025 |
| | | | Target Date 2030 |
| | | | Target Date 2035 |
| | | | Target Date 2040 |
| | | | Target Date 2045 |
| | | | Target Date 2050 |
| | | | Target Date 2055 |

Goldman Sachs Target Date Portfolios
| | | | |
TABLE OF CONTENTS | | | | |
| |
Market Review | | | 1 | |
| |
Portfolio Management Discussions and Performance Summaries | | | 7 | |
| |
Schedules of Investments | | | 40 | |
| |
Financial Statements | | | 48 | |
| |
Financial Highlights | | | 58 | |
| |
Notes to Financial Statements | | | 74 | |
| |
Report of Independent Registered Public Accounting Firm | | | 94 | |
| |
Other Information | | | 95 | |
| | | | |
| | | |
| NOT FDIC-INSURED | | May Lose Value | | No Bank Guarantee |
MARKET REVIEW
Target Date Portfolios
Market Review
During the 12-month period ended October 31, 2016 (the “Reporting Period”), U.S. and emerging markets equities recorded positive returns, while international equities declined. Spread, or non-government bond, sectors posted gains. As explained further below, for certain share classes of Target Date 2020 Portfolio, Target Date 2030 Portfolio, Target Date 2040 Portfolio and Target Date 2050 Portfolio, the Reporting Period is from each class’s inception on August 22, 2016 through October 31, 2016. The Reporting Period for all classes of Target Date 2025 Portfolio, Target Date 2035 Portfolio, Target Date 2045 Portfolio and Target Date 2055 Portfolio is also from their inception on August 22, 2016 through October 31, 2016.
U.S. Equities
Monetary policy and economic data were among the biggest themes dominating the U.S. equity markets during the Reporting Period. After leaving the targeted federal funds rate unchanged at its September and October 2015 policy meetings, the Federal Reserve (“the Fed”) voted unanimously for a 25 basis point interest rate increase in December 2015, a move largely expected by the markets. (A basis point is 1/100th of a percentage point.) However, the fairly dovish language in the announcement, which emphasized “gradual” future adjustments to policy, helped to somewhat assuage the markets. (Dovish language tends to imply lower interest rates; opposite of hawkish.)
At the beginning of 2016, U.S. equities were embroiled in a rout that encompassed the broad global equity market, triggered by investor concerns of an intensifying economic slowdown in China and exacerbated by an oil price plunge. In its January 2016 policy statement, the Fed acknowledged these external risks and tightening financial conditions. U.S. equity markets stabilized in mid-February 2016, as market sentiment improved on the more dovish tone set by global central banks broadly. U.S. equities were also supported by stronger economic data, rallying as the fourth quarter 2015 U.S. Gross Domestic Product (“GDP”) came in above expectations. In March 2016, the Fed kept interest rates on hold and surprised on the dovish side, reducing its forecast to two hikes in 2016, down from four. Along with receding global economic concerns, the dovish forecast helped to drive a recovery in U.S. equities.
Market sentiment appeared to remain optimistic in April 2016, as oil prices rose and Chinese economic growth concerns abated with modestly improving economic data. However, U.S. equities fell near the end of April 2016, as investors were disappointed by a lack of additional stimulus from the Bank of Japan (“BoJ”) and by first quarter 2016 U.S. GDP growth that was weaker than expected at 0.5%. In May 2016, weaker U.S. payrolls data drove expectations for a Fed hike during June 2016 temporarily lower, but subsequent hawkish Fed meeting minutes revived market expectations. The Fed ultimately held rates steady and signaled a slower pace of hikes, acknowledging the slowdown in the labor market. During June 2016, investors were focused on the U.K. referendum about whether to leave the European Union. Late in the month, after the surprise “leave” result, popularly known as “Brexit”, U.S. equities declined amid a broad global sell-off. The market later rebounded, owing to improving risk appetite, as investors digested the outcome and on dovish remarks from Bank of England (“BoE”) Governor Mark Carney.
U.S. equities were further buoyed in July 2016 by strong economic data and corporate earnings, though uncertainty generally increased following the Brexit vote. In her Jackson Hole speech toward the end of August 2016, Fed Chair Janet Yellen acknowledged that the case for an interest rate hike had strengthened in recent months. Along with strong labor data and other hawkish comments from the Fed, Yellen’s speech significantly increased market
1
MARKET REVIEW
expectations of an interest rate hike by year-end 2016, leading to a selloff in U.S. equities. In early September 2016, U.S. equities declined as the European Central Bank (“ECB”) disappointed markets with its lack of commitment to extending monetary easing beyond March 2017. However, U.S. equities rebounded after the Fed’s decision to leave interest rates unchanged.
In October 2016, a combination of a hawkish Fed commentary and stronger U.S. economic data heightened market expectations of a December 2016 interest rate hike. Third quarter 2016 U.S. GDP increased at a 2.9% annual rate, higher than consensus expectations and the strongest growth rate in two years.
For the Reporting Period overall, the S&P 500® Index returned 4.51%, with eight of the 11 sectors generating positive returns. (Effective after the market close on August 31, 2016, real estate was reclassified as an eleventh sector within the Global Industry Classification Standard (“GICS”).) The utilities and telecommunication services sectors generated double-digit gains, followed by the information technology and consumer staples sectors. The health care, consumer discretionary and financials sectors posted declines.
In terms of market capitalization, large-cap stocks outperformed small-cap stocks. The Russell 2000® Index, which measures the small-cap universe, returned 4.10% during the Reporting Period. In the style arena, value stocks outperformed growth stocks overall. The Russell 1000® Value Index, representing large-cap value stocks, rose 6.35% during the Reporting Period, while the Russell 1000® Growth Index, representing large-cap growth stocks, returned 2.28%.
International Equities
Divergent monetary policy between international developed market central banks and an increasingly hawkish Fed were key themes at the beginning of the Reporting Period. When the Fed hiked interest rates by 25 basis points in December 2015, the fairly dovish language in the statement, which emphasized “gradual” future adjustments to policy, helped to somewhat assuage market sentiment. Meanwhile, the BoJ announced supplementary support for its quantitative and qualitative easing programs in the same month. While the ECB also lowered its deposit rate by 10 basis points and announced an extension of its quantitative easing program at its December 2015 meeting, market reaction was one of disappointment as more had been expected.
International equities suffered a rout at the beginning of 2016, triggered by investor concerns of an intensifying economic slowdown in China and exacerbated by an oil price plunge. Sentiment improved following a dovish January ECB press conference and the BoJ’s introduction of negative interest rates. In turn, international equities stabilized a bit in February 2016. During March 2016, further central bank dovishness, along with receding global economic concerns and oil price stabilization, helped to finally drive a global equity market recovery. Notably, the ECB implemented heavy easing, cutting its deposit rate to -40 basis points, raising its monthly quantitative easing purchases, including corporate bonds, and unveiling a new series of four-year loans to banks. The BoJ left its monetary policy unchanged in March 2016, but its rhetoric about negative interest rates heightened expectations for further easing to come.
Market sentiment appeared to remain optimistic in April 2016, as oil prices rose and Chinese economic growth concerns abated with modestly improving economic data. Both the ECB and BoJ were on hold in April 2016, not making any changes to their monetary policies. BoJ inaction came as a major disappointment against expectations of further easing, causing international equities to sell off once again and the yen to appreciate. Relative currency appreciation was exacerbated by U.S. dollar weakness following a weaker than expected
2
MARKET REVIEW
first quarter U.S. GDP release and an uneventful Fed meeting during which rates were left unchanged. In May 2016, disappointing U.S. payrolls data drove expectations for a Fed hike in June 2016 temporarily lower, but subsequent hawkish Fed meeting minutes revived the market-implied probability. Equities rallied toward month-end on anticipation of better economic data, rising oil prices and optimism that the economy could withstand interest rate hikes. Japanese equities also benefited from stronger than expected first quarter 2016 GDP growth and a weaker yen. Markets were dominated in June 2016 by the U.K. referendum on whether to leave the European Union. International equities declined in the global sell-off in late June 2016 following the surprise “leave” result, popularly known as Brexit. Markets later rebounded, amid improving risk appetite, as markets digested the outcome and on dovish remarks from BoE Governor Carney.
International equities rallied strongly in July 2016, buoyed by expectations of easier monetary policy and a rebound in risk appetite, despite the increased uncertainty post Brexit. Sentiment was propped up as BoE Governor Carney hinted at monetary easing during the summer. In August 2016, the BoE delivered, cutting U.K. policy rates by 25 basis points and introducing a significant extension to its quantitative easing program. However, investor concerns about the impending U.S. interest rate hike intensified following a strong July 2016 U.S. jobs report and Fed Chair Yellen’s hawkish Jackson Hole speech. In September 2016, equities fell on the ECB’s lack of commitment to extending monetary easing beyond March 2017. However, there was a subsequent rebound following Fed and BoJ decisions, which markets viewed as generally benign—the Fed left rates unchanged, while the BoJ introduced a 0% target for its 10-year government bond yield to exercise “yield curve control.” (Yield curve indicates the spectrum of maturities within a particular sector.)
In October 2016, ECB minutes stressed a commitment to continued monthly bond-buying of 80 billion euros at least through March 2017, helping to dispel earlier concerns about potential tapering. The U.K.’s first official GDP growth figure since the Brexit vote was more robust than the consensus expected at 0.5%. Japanese equities enjoyed strong performance owing to weakness of the Japanese yen, as BoJ governor Kuroda stated there was room for further easing if necessary to achieve its 2% inflation target.
During the Reporting Period overall, international equities, as represented by the MSCI® Europe, Australasia, Far East (“EAFE”) Index (Net, USD, Unhedged) (the “MSCI® EAFE Index”), posted a return of -3.22%. Materials, industrials, energy, information technology and real estate were the only sectors in the MSCI® EAFE Index to post a positive return. The weakest performing sectors in the MSCI® EAFE Index during the Reporting Period were health care, financials and consumer discretionary.
From a country perspective, Australia and Japan were the only constituents of the MSCI® EAFE Index to post a positive return during the Reporting Period. Italy was the weakest individual country constituent in the MSCI® EAFE Index during the Reporting Period, followed at some distance by the U.K., Ireland and Spain.
Emerging Markets Equities
When the Reporting Period began in November 2015, there was broad emerging market “risk off” sentiment based on a combination of Fed interest rate hike concerns and disappointing macroeconomic data and negative news flow from China. When the Fed finally raised U.S. interest rates by 25 basis points in December 2015, the fairly dovish language in its statement, which emphasized “gradual” future adjustments to policy, helped to somewhat assuage market sentiment.
3
MARKET REVIEW
Emerging market equities suffered a rout at the beginning of 2016, triggered by investor concerns of an intensifying economic slowdown in China and exacerbated by an oil price plunge. Market sentiment improved in February 2016, and emerging market equities stabilized as global central banks set a more accommodative tone. For example, the BoJ introduced negative interest rates in late January 2016 and the People’s Bank of China resumed quantitative easing, while the Fed released dovish remarks in February 2016. In March 2016, further central bank dovishness, along with receding global economic concerns and a commodity price rebound, helped to drive a strong recovery in emerging market equities. Notably, the ECB implemented heavy monetary policy easing, cutting its deposit rate to -40 basis points and raising its monthly quantitative easing purchases. The BoJ left its monetary policy unchanged in March 2016, but its rhetoric about negative interest rates heightened expectations for further easing to come.
Market sentiment appeared to remain optimistic in April 2016, as oil prices rose and Chinese economic growth concerns abated with modestly improving economic data. The Fed left rates unchanged but expressed less concern about market volatility and global economic growth, opening up the possibility of a June 2016 rate hike. However, global sentiment moderated near the end of April 2016, as the BoJ disappointed markets by not implementing an additional monetary stimulus. Emerging market equities declined in May 2016, as they were affected by hawkish Fed meeting minutes that resulted in U.S. dollar strength against emerging market currencies. Moreover, disappointing April 2016 economic data from China, which indicated a slowdown in both consumption and industrial activity, fueled investor concerns of an economic slowdown within the emerging markets more broadly. Markets around the world were dominated in June 2016 by the U.K.’s referendum decision to leave the European Union, popularly known as Brexit. Emerging market equities shrugged off the initial risk-off response and rebounded quickly, outperforming developed market equities.
In July 2016, emerging market equities were buoyed by rebounding risk appetite and expectations of easier monetary policy following Brexit. Moreover, China’s economic data indicated improving momentum. Emerging market equities continued their ascent in August 2016, as China performed better than consensus expectations on a robust earnings season and on encouraging consumption and industrial data. While investor concerns about an impending U.S. interest rate hike intensified after a strong July 2016 U.S. jobs report and Fed Chair Yellen’s hawkish speech at Jackson Hole, there was limited impact on sentiment toward emerging market equities, which rallied further. In September 2016, emerging market equities maintained their uptrend, as the Fed left interest rates unchanged amidst much anticipation, citing concerns over low inflation. In October 2016, despite the headwinds from a stronger U.S. dollar that resulted from hawkish Fed commentary and strong U.S. economic data, emerging market equities, led by Latin America, outperformed their developed market counterparts.
During the Reporting Period overall, emerging market equities, as measured by the MSCI® Emerging Markets Index (Net, USD, Unhedged) (the “MSCI® EM Index”), generated a return of 9.24%. Energy, materials and information technology were the best performing sectors in the MSCI® EM Index during the Reporting Period. Health care, industrials and telecommunication services were the weakest sectors in the MSCI® EM Index, the only three sectors in the MSCI® EM Index to post negative returns during the Reporting Period.
From a country perspective, Brazil, Hungary, Indonesia and Peru were by a wide margin the best performing individual country constituents of the MSCI® EM Index for the Reporting Period. Conversely, Greece was by far the weakest individual country constituent of the MSCI® EM Index, followed at some distance by Poland, Qatar, Turkey, the Czech Republic and Mexico, which also significantly lagged the MSCI® EM Index during the Reporting Period.
4
MARKET REVIEW
Fixed Income Markets
Spread sectors started off the Reporting Period on a positive note, performing well during November and December 2015. Spread sectors then sold off in January 2016 through mid-
February 2016. The sell-off was driven by an increase in a number of perceived risks, such as slowing Chinese economic activity, the possibility of persistent oil oversupply and concerns about the effect of negative interest rates on the banking system after the BoJ surprised markets by cutting interest rates into negative territory. Some of these risks eased in the second half of the first quarter of 2016, as economic news from China improved, U.S. oil production showed signs of slowing and commodity prices appeared to stabilize. As a result, spread sectors largely retraced their earlier losses by the end of March 2016.
During the second quarter of 2016, spread sectors rallied on stabilization of commodities prices as well as on declining fears about slowing Chinese economic growth and the potential for a U.S. economic recession. Global interest rates broadly declined amid continued accommodative monetary policy from the world’s central banks. In the U.S., minutes from the Fed’s April 2016 policy meeting, released in mid-May 2016, suggested to many observers that policymakers might raise interest rates in June 2016 if U.S. economic growth strengthened, employment data firmed and inflation rose toward the Fed’s 2% target. In early June 2016, however, the release of weak May 2016 employment data raised concerns about the health of the U.S. economy, pushing down market expectations of a Fed interest rate hike. Indeed, the Fed did not raise interest rates at its June 2016 policy meeting. In the last week of June 2016, Brexit renewed investor uncertainty about the path of global economic growth. Spread sectors withstood the “leave” vote relatively well, selling off at first but then recovering most of their losses afterwards.
During the third calendar quarter and through the end of the Reporting Period, spread sectors generally advanced. Overall, global interest rates remained low, as the world’s central banks remained broadly accommodative. However, the Fed’s July 2016 policy statement was more hawkish than most observers expected, reflecting cautious optimism amid the market’s relatively muted reaction to the Brexit outcome and strengthening U.S. economic data. The July 2016 U.S. non-farm payrolls report showed 255,000 new jobs added, exceeding market expectations and countering a disappointing second quarter 2016 U.S. GDP report that showed growth of 1.2%. In the Eurozone, the ECB kept interest rates unchanged during July 2016. The BoJ, meanwhile, fell short of market expectations with the announcement of an equity purchase program and the lack of key monetary measures, such as an interest rate cut and increased government bond purchases. In August 2016, the BoE unveiled a “timely, coherent and comprehensive package,” as described by Governor Mark Carney, which included a number of measures intended to help the U.K. economy navigate a post-Brexit environment. Although the ECB kept monetary policy unchanged that same month, the European and U.K. credit markets received support from the ongoing corporate bond purchases of central banks. In the U.S., non-farm payroll gains moderated in August 2016, and manufacturing and services data weakened, but continued hawkish comments from the Fed boosted market expectations of an interest rate hike by the end of 2016. However, at its September 2016 policy meeting, the Fed kept short-term interest rates unchanged. In Japan, the BoJ announced a new “yield curve control” framework designed to steepen Japan’s government bond yield curve and alleviate the impact on financial institutions of low longer-term rates. During October 2016, the ECB kept monetary policy unchanged and offered little guidance on the possibility of an extension to its asset purchase program. Other central banks, including those in Australia, Canada and Sweden, also kept policy rates unchanged at their October 2016 meetings. In the U.S., the October 2016 non-farm payrolls report indicated 161,000 new jobs
5
MARKET REVIEW
were added, below market consensus, although August and September 2016 figures were revised upwards.
The broad U.S. fixed income market, as represented by the Bloomberg Barclays U.S. Aggregate Bond Index, generated a return of 4.36% for the Reporting Period overall. High yield corporate bonds and sovereign emerging markets debt outperformed U.S. Treasuries, followed at some distance by investment grade corporate bonds. Commercial mortgage-backed securities, asset-backed securities and agency mortgage-backed securities also outperformed U.S. Treasuries, albeit more modestly. The U.S. Treasury yield curve, or spectrum of maturities, flattened during the Reporting Period, as yields on maturities of two years and less edged up and yields on maturities of three years and longer fell. The yield on the bellwether 10-year U.S. Treasury dropped approximately 32 basis points to end the Reporting Period at 1.84%. (A basis point is 1/100th of a percentage point. A flattening yield curve is one wherein the differential in yields between longer-term and shorter-term maturities narrows.)
Looking Ahead
At the end of the Reporting Period, we expected the economic growth outlook for the U.S., Japan and China to improve. In the U.S., a strong labor market appeared to be supporting consumption, and a slower pace of monetary policy normalization should, in our view, prevent a sharp tightening of financial conditions. We also believed that positive developments in the manufacturing sector, arising from a decline in inventories as well as a boost in consumer spending due to a strengthening labor market, may further support U.S. economic growth for the rest of 2016. Looking to 2017, we expect President-elect Donald Trump’s administration to pursue tax cuts and increased fiscal spending, which could lead to an acceleration in both U.S. economic growth and inflation. As a result, we believe the Fed is likely to raise interest rates at its December 2016 meeting.
In Japan, we believe the continuation and expansion of the BoJ’s accommodative monetary policy means economic growth could potentially surprise to the upside, though we believe Abenomics is running out of ammunition. (Abenomics refers to the multi-pronged economic program of Japanese Prime Minister Shinzo Abe. It seeks to remedy two decades of economic stagnation by increasing Japan’s money supply, boosting government spending and enacting reforms to make the economy more competitive.) In China, the government’s rapid fiscal policy response to the economic slowdown earlier in 2016 suggests to us that the country’s positive growth impulses are likely to continue in the near term.
In Europe, we expect the ECB to extend its quantitative easing program beyond March 2017, when it is currently scheduled to end, to address a weak economic growth and inflation outlook. We believe Eurozone inflation will likely continue to be disappointing and that economic growth may slow in 2017. While the U.K. appears to have avoided the worst immediate near-term Brexit scenario, we expect additional easing from the BoE in the coming months. Political uncertainty arising from negotiations on issues such as immigration and access to the European Union’s single market are likely, in our view, to provide challenges for the U.K.’s economic outlook, and thus we anticipate weak economic growth in the U.K. during 2017.
In the months ahead, global political uncertainty has the potential to increase market volatility. These uncertainties include the December 2016 Italian referendum on constitutional reform and 2017 elections in Germany and France.
6
PORTFOLIO RESULTS
Goldman Sachs Target Date 2020 Portfolio, Goldman Sachs Target Date 2030 Portfolio, Goldman Sachs Target Date 2040 Portfolio and Goldman Sachs Target Date 2050 Portfolio
Investment Process and Principal Strategies
The Goldman Sachs Target Date 2020 Portfolio, the Goldman Sachs Target Date 2030 Portfolio, the Goldman Sachs Target Date 2040 Portfolio and the Goldman Sachs Target Date 2050 Portfolio (collectively, the “Portfolios”) seek to provide capital appreciation and current income consistent with each respective Portfolio’s current asset allocation. The Portfolios employ asset allocation strategies designed for investors who plan to retire and to begin gradually withdrawing their investment beginning on or around 2020, 2030, 2040 and 2050, respectively (the “Target Dates”). The Portfolios generally seek to achieve their investment objective by investing in shares of exchange-traded funds (“ETFs”) and other registered investment companies (collectively, the “Underlying Funds”), according to an asset allocation strategy developed by Madison Asset Management, LLC, the sub-adviser, which is unaffiliated with Goldman Sachs Asset Management, L.P., the investment adviser for the Portfolios.
Portfolio Management Discussion and Analysis
Below, the Madison Asset Management, LLC portfolio management team, the Portfolios’ sub-adviser, discusses the Portfolios’ performance and positioning for the 12-month period ended October 31, 2016 (the “Reporting Period”). Effective August 22, 2016, Madison Target Retirement 2020 Fund, Madison Target Retirement 2030 Fund, Madison Target Retirement 2040 Fund, and Madison Target Retirement 2050 Fund (each, a “Predecessor Fund”) were reorganized into a corresponding Portfolio. Each Portfolio has assumed the applicable Predecessor Fund’s historical performance. Therefore, the performance information reported below for each Portfolio is the combined performance of the Portfolio and its Predecessor Fund (except for Class A, Institutional, Service, IR and R Shares, which were not offered by the Predecessor Fund).
| Q | | How did the Portfolios perform during the Reporting Period? |
| A | | Goldman Sachs Target Date 2020 Portfolio — During the Reporting Period, the Target Date 2020 Portfolio’s Class R6 Shares generated an average annual total return of 3.65%. This compares to the 3.48% average annual total return of the Portfolio’s benchmark, the S&P Target Date To 2020 Index (Total Return, Unhedged, USD) during the same period. For the period since their inception on August 22, 2016 through October 31, 2016, the Target Date 2020 Portfolio’s Class A, Institutional, Service, IR, and R Shares generated cumulative total returns of -1.49%, -1.39%, -1.49%, -1.39% and -1.49%, respectively. This compares to the -1.37% cumulative total return of the S&P Target Date To 2020 Index (Total Return, Unhedged, USD) during the same period. |
| | Goldman Sachs Target Date 2030 Portfolio — During the Reporting Period, the Target Date 2030 Portfolio’s Class R6 Shares generated an average annual total return of 3.23%. This compares to the 3.43% average annual total return of the Portfolio’s benchmark, the S&P Target Date To 2030 Index (Total Return, Unhedged, USD) during the same period. For the period since their inception on August 22, 2016 through October 31, 2016, the Target Date 2030 Portfolio’s Class A, Institutional, Service, IR, and R Shares generated cumulative total returns of -1.91%, -1.81%, -1.91%, -1.81% and -1.91%, respectively. This compares to the -1.63% cumulative total return of the S&P Target Date To 2030 Index (Total Return, Unhedged, USD) during the same period. |
| | Goldman Sachs Target Date 2040 Portfolio — During the Reporting Period, the Target Date 2040 Portfolio’s Class R6 |
7
PORTFOLIO RESULTS
| | Shares generated an average annual total return of 3.33%. This compares to the 3.23% average annual total return of the Portfolio’s benchmark, the S&P Target Date To 2040 Index (Total Return, Unhedged, USD) during the same period. For the period since their inception on August 22, 2016 through October 31, 2016, the Target Date 2040 Portfolio’s Class A, Institutional, Service, IR, and R Shares generated cumulative total returns of -1.94%, -1.94%, -1.94%, -1.94% and -2.05%, respectively. This compares to the -1.89% cumulative total return of the S&P Target Date To 2040 Index (Total Return, Unhedged, USD) during the same period. |
| | Goldman Sachs Target Date 2050 Portfolio — During the Reporting Period, the Target Date 2050 Portfolio’s Class R6 Shares generated an average annual total return of 3.37%. This compares to the 3.13% average annual total return of the Portfolio’s benchmark, the S&P Target Date To 2050 Index (Total Return, Unhedged, USD) during the same period. For the period since their inception on August 22, 2016 through October 31, 2016, the Target Date 2050 Portfolio’s Class A, Institutional, Service, IR, and R Shares generated cumulative total returns of -2.00%, -2.00%, -2.10%, -2.00% and -2.10%, respectively. This compares to the -1.96% cumulative total return of the S&P Target Date To 2050 Index (Total Return, Unhedged, USD) during the same period. |
| Q | | What key factors affected the Portfolios’ performance during the Reporting Period? |
| A | | During the Reporting Period, the Portfolios benefited from our strategic allocation decisions to favor certain asset classes through the Underlying Funds. The implementation of our tactical allocation decisions produced mixed results. Overall, the performance of the Underlying Funds hurt the Portfolios’ returns during the Reporting Period. |
| Q | | How did the Portfolios’ strategic allocations affect performance during the Reporting Period? |
| A | | Within the Portfolios’ strategic allocations, our preference for U.S. equities over international equities added to performance as U.S. stocks outperformed international equities during the Reporting Period. Within U.S. stocks, the Portfolios’ allocations to large-cap and mid-cap stocks contributed positively to results. The Portfolios also benefited from allocations to the information technology and energy sectors as well as to the regional banking industry. However, the Portfolios were hampered by stock selection within their strategic allocations to the PowerShares BuyBack Achievers™ Portfolio, the SPDR® S&P® Homebuilders ETF and the Vanguard Health Care ETF. |
| | Overall, the Portfolios’ limited exposure to fixed income did not have meaningful impact on performance. Within fixed income, the Portfolios were biased toward U.S. Treasury securities, which hurt returns overall. On the positive side, allocations to long duration U.S. Treasury securities, bank loans and Treasury inflation-protected securities (“TIPS”) added to results. |
| Q | | How did your tactical allocation decisions help or hurt performance during the Reporting Period? |
| A | | Our tactical allocation decisions to focus on certain asset classes through the Underlying Funds generated mixed results during the Reporting Period. |
| | The Portfolios were hindered overall by our preference for U.S. Treasury securities. Although our emphasis on long-duration Treasuries added to performance, these results were more than offset by large allocations to three- to seven-year Treasuries as well as to corporate credit, which detracted from performance. In addition, the Portfolios were hurt by their large cash positions. The Portfolios’ limited exposure to emerging market equities also dampened results. |
| | The Portfolios’ allocations to TIPS bolstered returns as inflation expectations increased throughout the Reporting Period. In addition, allocations to bank loans performed well as spreads (or yield differentials) narrowed between U.S. Treasuries and high yield corporate bonds of comparable maturity. The Portfolios were also helped by their allocations to gold. Within U.S. equities, a bias toward information technology stocks contributed positively. |
| Q | | Did the Underlying Funds help or hurt the Portfolios’ performance during the Reporting Period? |
| A | | During the Reporting Period, the performance of the Portfolios’ Underlying Funds overall detracted from returns. |
| | Of the Portfolios’ equity-related Underlying Funds, the Portfolios’ weakest performers were the iShares® Edge MSCI® Min Vol EAFE ETF (EFAV), the WisdomTree Japan Hedged Equity Fund (DXJ) and the PowerShares BuyBack Achievers™ Portfolio (PKW). EFAV, which was rather conservatively positioned, lagged as riskier asset classes rallied during the last six months of the Reporting Period. DXJ’s hedged U.S. dollar positions were hurt by the strength of the Japanese yen. PKW was hampered by its emphasis on consumer discretionary stocks. The Portfolios’ |
8
PORTFOLIO RESULTS
| | strongest performers were the Vanguard Information Technology ETF (VGT), the Energy Select Sector SPDR® ETF (XLE) and the SPDR® S&P® Regional Banking ETF (KRE). VGT performed well as large-cap technology companies maintained strong earnings. XLE benefited from rising oil prices. KRE gained as interest rates rose during the last three months of the Reporting Period. |
| | Of the Portfolios’ fixed income-related Underlying Funds, the iShares® TIPS Bond ETF (TIP) and the PowerShares Senior Loan Fund (BKLN) posted solid results. TIP gained as inflation expectations increased throughout the Reporting Period. BKLN benefited as spreads narrowed between U.S. Treasuries and high yield corporate bonds. Although the iShares® 20+ Year Treasury Bond ETF performed well, the iShares® 3-7 Year Treasury Bond ETF retreated. |
| | Of the Portfolios’ Underlying Funds focused on alternative investments, the SPDR® Gold Shares ETF generated positive returns as gold prices rose during the Reporting Period. |
| Q | | How did the Portfolios use derivatives and similar instruments during the Reporting Period? |
| A | | The Portfolios do not directly invest in derivatives. However, some of the Underlying Funds used derivatives during the Reporting Period to allow them to track their respective benchmark indices with more precision. These included options, forwards, futures, swaps, structured securities and other derivative instruments. |
| Q | | What changes did you make to the Portfolios’ strategic allocations during the Reporting Period? |
| A | | During the Reporting Period, we modestly increased the Portfolios’ strategic allocations to international equities. In addition, we modestly reduced the Portfolios’ strategic allocations to U.S. equities as we considered non-U.S. equities somewhat more attractive after the uncertainty of the Brexit vote had passed. |
| Q | | What is the Portfolios’ tactical view and strategy for the months ahead? |
| A | | In the near term, we expect to see low returns from virtually all asset classes. Therefore, we believe managing risk is likely to be of greater importance going forward. We plan to maintain a defensive posture in the Portfolios, with a continued emphasis on seeking to generate strong risk-adjusted returns. |
9
FUND BASICS
Target Date 2020 Portfolio
as of October 31, 2016
| | | | | | | | | | |
| | PERFORMANCE REVIEW | |
| | | November 1, 2015–October 31, 2016 | | Portfolio Total Return
(based on NAV)1 | | | S&P Target Date To 2020
(Total Return, Unhedged, USD)2 | |
| | | Class R6 | | | 3.65 | % | | | 3.48 | % |
| | | |
| | | | | | | | | |
| | | August 22, 2016–October 31, 2016 | | | | | | |
| | Class A | | | -1.49 | % | | | -1.37 | % |
| | Institutional | | | -1.39 | | | | -1.37 | |
| | Service | | | -1.49 | | | | -1.37 | |
| | Class IR | | | -1.39 | | | | -1.37 | |
| | | Class R | | | -1.49 | | | | -1.37 | |
| | 1 | | The net asset value (“NAV”) represents the net assets of the class of the Portfolio (ex-dividend) divided by the total number of shares of the class outstanding. The Portfolio’s performance assumes the reinvestment of dividends and other distributions. The Portfolio’s performance does not reflect the deduction of any applicable sales charges. |
| | 2 | | The S&P Target Date Index Series is a component of the S&P Target Allocation Index Family, and is related to the S&P Target Risk Index Series. Both series are broadly representative of the investment opportunity available to investors in target risk and target date funds, respectively. The index series reflects the market consensus for asset allocations for different target date horizons. In particular, each index is representative of the investment opportunity available to investors for the corresponding target date horizon, with asset class exposures driven by a survey of available target date funds for that horizon. |
| | | | Effective August 22, 2016, the Madison Target Retirement 2020 Fund (the “Predecessor Fund”) was reorganized into the Portfolio. The Portfolio has assumed the Predecessor Fund’s historical performance. The returns for the Predecessor Fund for periods prior to August 29, 2014 reflect the performance of the Madison Target Retirement 2020 Fund’s Class I Shares, a series of Ultra Series Fund (the “Ultra Predecessor Fund”). As of August 29, 2014, the inception date of the Predecessor Fund, the Ultra Predecessor Fund exchanged in kind substantially all of its portfolio holdings for Class R6 shares of the Predecessor Fund. As a result, the Predecessor Fund assumed the performance of the Ultra Predecessor Fund. Performance reflects applicable fee waivers and/or expense limitations in effect during the periods shown. Past performance does not guarantee future results, which may vary. The value of investments and the income derived from investments will fluctuate and can go down as well as up. A loss of principal may occur. |
The returns set forth in the table above represent past performance. Past performance does not guarantee future results. The Portfolio’s investment return and principal value will fluctuate so that an investor’s shares, when redeemed, may be worth more or less than their original cost. Current performance may be lower or higher than the performance quoted above. Please visit our web site at www.GSAMFUNDS.com to obtain the most recent month-end returns. Performance reflects fee waivers and/or expense limitations in effect. In their absence, performance would be reduced. Returns do not reflect the deduction of taxes that a shareholder would pay on Portfolio distributions or the redemption of Portfolio shares. Returns less than 12 months are cumulative, not annualized.
10
FUND BASICS
| | | | | | | | | | | | | | | | |
| | STANDARDIZED TOTAL RETURNS3 |
| | | For the period ended 09/30/16 | | One Year | | | Five Years | | | Since Inception | | | Inception Date |
| | Class A | | | N/A | | | | N/A | | | | -5.74 | % | | 8/22/16 |
| | Institutional | | | N/A | | | | N/A | | | | -0.20 | | | 8/22/16 |
| | Service | | | N/A | | | | N/A | | | | -0.30 | | | 8/22/16 |
| | Class IR | | | N/A | | | | N/A | | | | -0.20 | | | 8/22/16 |
| | Class R | | | N/A | | | | N/A | | | | -0.30 | | | 8/22/16 |
| | | Class R6 | | | 7.60 | % | | | 7.92 | % | | | 2.60 | | | 10/01/07 |
| | 3 | | The Standardized Total Returns are average annual or cumulative total returns (only if the performance period is one year or less) as of the most recent calendar quarter-end. They assume reinvestment of all distributions at NAV. These returns reflect a maximum initial sales charge of 5.5% for Class A Shares. Because Institutional, Service, Class IR, Class R and Class R6 Shares do not involve a sales charge, such a charge is not applied to their Standardized Total Returns. |
| | Effective | | August 22, 2016, the Madison Target Retirement 2020 Fund (the “Predecessor Fund”) was reorganized into the Portfolio. The Portfolio has assumed the Predecessor Fund’s historical performance. The returns for the Predecessor Fund for periods prior to August 29, 2014 reflect the performance of the Madison Target Retirement 2020 Fund’s Class I Shares, a series of Ultra Series Fund (the “Ultra Predecessor Fund”). As of August 29, 2014, the inception date of the Predecessor Fund, the Ultra Predecessor Fund exchanged in kind substantially all of its portfolio holdings for Class R6 shares of the Predecessor Fund. As a result, the Predecessor Fund assumed the performance of the Ultra Predecessor Fund. Performance reflects applicable fee waivers and/or expense limitations in effect during the periods shown. Past performance does not guarantee future results, which may vary. The value of investments and the income derived from investments will fluctuate and can go down as well as up. A loss of principal may occur. |
The returns set forth in the table above represent past performance. Past performance does not guarantee future results. The Portfolio’s investment return and principal value will fluctuate so that an investor’s shares, when redeemed, may be worth more or less than their original cost. Current performance may be lower or higher than the performance quoted above. Please visit our web site at www.GSAMFUNDS.com to obtain the most recent month-end returns. Performance reflects applicable fee waivers and/or expense limitations in effect during the periods shown. In their absence, performance would be reduced. Returns do not reflect the deduction of taxes that a shareholder would pay on Portfolio distributions or the redemption of Portfolio shares.
| | | | | | | | | | |
| | EXPENSE RATIOS4 | |
| | | | | Net Expense Ratio (Current) | | | Gross Expense Ratio (Before Waivers) | |
| | Class A | | | 0.96 | % | | | 1.06 | % |
| | Institutional | | | 0.56 | | | | 0.66 | |
| | Service | | | 1.06 | | | | 1.16 | |
| | Class IR | | | 0.71 | | | | 0.81 | |
| | Class R | | | 1.21 | | | | 1.31 | |
| | | Class R6 | | | 0.54 | | | | 0.64 | |
| | 4 | | The expense ratios of the Portfolio, both current (net of applicable fee waivers and/or expense limitations) and before waivers (gross of applicable fee waivers and/or expense limitations) are as set forth above according to the most recent publicly available Prospectus for the Portfolio and will differ from the expense ratios disclosed in the Financial Highlights in this report due to the inclusion of Underlying Fund fees and expenses, which are not included in the operating expenses of the Portfolio reflected in the Financial Highlights. Pursuant to a contractual arrangement, the Portfolio’s waivers and/or expense limitations will remain in place through at least August 22, 2018, and prior to such date the Investment Adviser may not terminate the arrangements without the approval of the Portfolio’s Board of Trustees. If these arrangements are discontinued in the future, the expense ratios may change without shareholder approval. |
11
FUND BASICS
| | | | | | | | |
| | TOP TEN HOLDINGS AS OF 10/31/165 |
| | | Holding | | % of Net Assets | | | Line of Business |
| | iShares 3-7 Year Treasury Bond ETF | | | 17.5 | % | | Exchange Traded Funds |
| | iShares TIPS Bond ETF | | | 15.0 | | | Exchange Traded Funds |
| | iShares 7-10 Year Treasury Bond ETF | | | 10.0 | | | Exchange Traded Funds |
| | iShares Core S&P 500 ETF | | | 8.6 | | | Exchange Traded Funds |
| | Vanguard Short-Term Corporate Bond ETF | | | 7.0 | | | Exchange Traded Funds |
| | PowerShares Senior Loan Portfolio | | | 7.0 | | | Exchange Traded Funds |
| | SPDR S&P 500 ETF Trust | | | 4.9 | | | Exchange Traded Funds |
| | Vanguard FTSE All-World ex-U.S. ETF | | | 3.5 | | | Exchange Traded Funds |
| | PowerShares DB Gold Fund | | | 2.5 | | | Exchange Traded Funds |
| | | iShares Core S&P Mid-Cap ETF | | | 2.3 | | | Exchange Traded Funds |
| | 5 | | The top 10 holdings may not be representative of the Portfolio’s future investments. |
| | | | | | | | | | |
| | PORTFOLIO COMPOSITION6 | | | | | |
| | | | | As of October 31, 2016 | | | As of October 31, 2015 | |
| | Bond Funds | | | 59.6 | % | | | 60.6 | % |
| | Stock Funds | | | 25.5 | | | | 27.4 | |
| | Foreign Stock Funds | | | 8.5 | | | | 7.5 | |
| | Alternative Funds | | | 2.5 | | | | 2.5 | |
| | | Investment Companies | | | — | | | | 2.0 | |
| 6 | | The Portfolio is actively managed and, as such, its composition may differ over time. The percentage shown for each fund type reflects the value of that fund type as a percentage of the Portfolio’s net assets. Figures above may not sum to 100% due to rounding and/or exclusion of other assets and liabilities. |
12
GOLDMAN SACHS TARGET DATE 2020 PORTFOLIO
Performance Summary
October 31, 2016
The following graph shows the value, as of October 31, 2016, of a $10,000 investment made on October 1, 2007 (commencement of operations of the Ultra Predecessor Fund) in Class R6 Shares. For comparative purposes, the performance of the Portfolio’s benchmark, the S&P Target Date to 2020 Index (Total Return, Unhedged, USD), is shown. This performance data represents past performance and should not be considered indicative of future performance, which will fluctuate with changes in market conditions. These performance fluctuations may cause an investor’s shares, when redeemed, to be worth more or less than their original cost. Performance reflects applicable fee waivers and/or expense limitations currently in effect during the periods shown and in their absence, performance would be reduced. Returns do not reflect the deduction of taxes that a shareholder would pay on Portfolio distributions or the redemption of Portfolio shares. Performance of Class A, Institutional, Service, Class IR and Class R Shares will vary from Class R6 Shares due to differences in class specific fees and any applicable sales charges. In addition to the Investment Adviser’s decisions regarding underlying fund selection and allocations among them, other factors may affect Portfolio performance. These factors include, but are not limited to, portfolio operating fees and expenses, portfolio turnover and subscription and redemption cash flows affecting the Portfolio.
|
| Target Date 2020 Portfolio’s Lifetime Performance |
Performance of a $10,000 investment, with distributions reinvested, from October 1, 2007 through October 31, 2016.
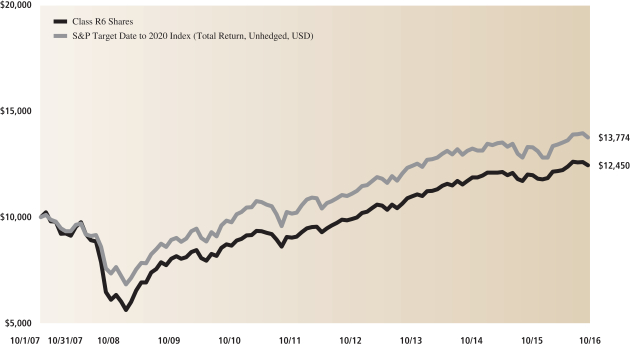
| | | | | | | | | | |
| Average Annual Total Return through October 31, 2016 | | | One Year | | | | Five Years | | | Since Inception |
Class A (Commenced August 22, 2016) | | | | | | | | | | |
Excluding sales charges | | | N/A | | | | N/A | | | -1.49%* |
Including sales charges | | | N/A | | | | N/A | | | -6.87%* |
|
Institutional Class (Commenced August 22, 2016) | | | N/A | | | | N/A | | | -1.39%* |
|
Service Class (Commenced August 22, 2016) | | | N/A | | | | N/A | | | -1.49%* |
|
Class IR (Commenced August 22, 2016) | | | N/A | | | | N/A | | | -1.39%* |
|
Class R (Commenced August 22, 2016) | | | N/A | | | | N/A | | | -1.49%* |
|
Class R6 (Commenced October 1, 2007) | | | 3.65% | | | | 6.56% | | | 2.44% |
|
| * | | Total return for periods of less than one year represents cumulative total return. |
13
FUND BASICS
Target Date 2030 Portfolio
as of October 31, 2016
| | | | | | | | | | |
| | PERFORMANCE REVIEW | |
| | | November 1, 2015–October 31, 2016 | | Portfolio Total Return
(based on NAV)1 | | | S&P Target Date To 2030
(Total Return, Unhedged, USD)2 | |
| | | Class R6 | | | 3.23 | % | | | 3.43 | % |
| | | |
| | | | | | | | | |
| | | August 22, 2016–October 31, 2016 | | | | | | |
| | Class A | | | -1.91 | % | | | -1.63 | % |
| | Institutional | | | -1.81 | | | | -1.63 | |
| | Service | | | -1.91 | | | | -1.63 | |
| | Class IR | | | -1.81 | | | | -1.63 | |
| | | Class R | | | -1.91 | | | | -1.63 | |
| | 1 | | The net asset value (“NAV”) represents the net assets of the class of the Portfolio (ex-dividend) divided by the total number of shares of the class outstanding. The Portfolio’s performance assumes the reinvestment of dividends and other distributions. The Portfolio’s performance does not reflect the deduction of any applicable sales charges. |
| | 2 | | The S&P Target Date Index Series is a component of the S&P Target Allocation Index Family, and is related to the S&P Target Risk Index Series. Both series are broadly representative of the investment opportunity available to investors in target risk and target date funds, respectively. The index series reflects the market consensus for asset allocations for different target date horizons. In particular, each index is representative of the investment opportunity available to investors for the corresponding target date horizon, with asset class exposures driven by a survey of available target date funds for that horizon. |
| | | | Effective August 22, 2016, the Madison Target Retirement 2030 Fund (the “Predecessor Fund”) was reorganized into the Portfolio. The Portfolio has assumed the Predecessor Fund’s historical performance. The returns for the Predecessor Fund for periods prior to August 29, 2014 reflect the performance of the Madison Target Retirement 2030 Fund’s Class I Shares, a series of Ultra Series Fund (the “Ultra Predecessor Fund”). As of August 29, 2014, the inception date of the Predecessor Fund, the Ultra Predecessor Fund exchanged in kind substantially all of its portfolio holdings for Class R6 shares of the Predecessor Fund. As a result, the Predecessor Fund assumed the performance of the Ultra Predecessor Fund. Performance reflects applicable fee waivers and/or expense limitations in effect during the periods shown. Past performance does not guarantee future results, which may vary. The value of investments and the income derived from investments will fluctuate and can go down as well as up. A loss of principal may occur. |
The returns set forth in the table above represent past performance. Past performance does not guarantee future results. The Portfolio’s investment return and principal value will fluctuate so that an investor’s shares, when redeemed, may be worth more or less than their original cost. Current performance may be lower or higher than the performance quoted above. Please visit our web site at www.GSAMFUNDS.com to obtain the most recent month-end returns. Performance reflects fee waivers and/or expense limitations in effect. In their absence, performance would be reduced. Returns do not reflect the deduction of taxes that a shareholder would pay on Portfolio distributions or the redemption of Portfolio shares. Returns less than 12 months are cumulative, not annualized.
14
FUND BASICS
| | | | | | | | | | | | | | | | |
| | STANDARDIZED TOTAL RETURNS3 |
| | | For the period ended 09/30/16 | | One Year | | | Five Years | | | Since Inception | | | Inception Date |
| | Class A | | | N/A | | | | N/A | | | | -5.80 | % | | 8/22/16 |
| | Institutional | | | N/A | | | | N/A | | | | -0.30 | | | 8/22/16 |
| | Service | | | N/A | | | | N/A | | | | -0.30 | | | 8/22/16 |
| | Class IR | | | N/A | | | | N/A | | | | -0.30 | | | 8/22/16 |
| | Class R | | | N/A | | | | N/A | | | | -0.30 | | | 8/22/16 |
| | | Class R6 | | | 9.25 | % | | | 9.59 | % | | | 2.89 | | | 10/01/07 |
| | 3 | | The Standardized Total Returns are average annual or cumulative total returns (only if the performance period is one year or less) as of the most recent calendar quarter-end. They assume reinvestment of all distributions at NAV. These returns reflect a maximum initial sales charge of 5.5% for Class A Shares. Because Institutional, Service, Class IR, Class R and Class R6 Shares do not involve a sales charge, such a charge is not applied to their Standardized Total Returns. |
| | | | Effective August 22, 2016, the Madison Target Retirement 2030 Fund (the “Predecessor Fund”) was reorganized into the Portfolio. The Portfolio has assumed the Predecessor Fund’s historical performance. The returns for the Predecessor Fund for periods prior to August 29, 2014 reflect the performance of the Madison Target Retirement 2030 Fund’s Class I Shares, a series of Ultra Series Fund (the “Ultra Predecessor Fund”). As of August 29, 2014, the inception date of the Predecessor Fund, the Ultra Predecessor Fund exchanged in kind substantially all of its portfolio holdings for Class R6 shares of the Predecessor Fund. As a result, the Predecessor Fund assumed the performance of the Ultra Predecessor Fund. Performance reflects applicable fee waivers and/or expense limitations in effect during the periods shown. Past performance does not guarantee future results, which may vary. The value of investments and the income derived from investments will fluctuate and can go down as well as up. A loss of principal may occur. |
The returns set forth in the table above represent past performance. Past performance does not guarantee future results. The Portfolio’s investment return and principal value will fluctuate so that an investor’s shares, when redeemed, may be worth more or less than their original cost. Current performance may be lower or higher than the performance quoted above. Please visit our web site at www.GSAMFUNDS.com to obtain the most recent month-end returns. Performance reflects applicable fee waivers and/or expense limitations in effect during the periods shown. In their absence, performance would be reduced. Returns do not reflect the deduction of taxes that a shareholder would pay on Portfolio distributions or the redemption of Portfolio shares.
| | | | | | | | | | |
| | EXPENSE RATIOS4 | |
| | | | | Net Expense Ratio (Current) | | | Gross Expense Ratio (Before Waivers) | |
| | Class A | | | 0.96 | % | | | 1.06 | % |
| | Institutional | | | 0.56 | | | | 0.66 | |
| | Service | | | 1.06 | | | | 1.16 | |
| | Class IR | | | 0.71 | | | | 0.81 | |
| | Class R | | | 1.21 | | | | 1.31 | |
| | | Class R6 | | | 0.54 | | | | 0.64 | |
| | 4 | | The expense ratios of the Portfolio, both current (net of applicable fee waivers and/or expense limitations) and before waivers (gross of applicable fee waivers and/or expense limitations) are as set forth above according to the most recent publicly available Prospectus for the Portfolio and will differ from the expense ratios disclosed in the Financial Highlights in this report due to the inclusion of Underlying Fund fees and expenses, which are not included in the operating expenses of the Portfolio reflected in the Financial Highlights. Pursuant to a contractual arrangement, the Portfolio’s waivers and/or expense limitations will remain in place through at least August 22, 2018, and prior to such date the Investment Adviser may not terminate the arrangements without the approval of the Portfolio’s Board of Trustees. If these arrangements are discontinued in the future, the expense ratios may change without shareholder approval. |
15
FUND BASICS
| | | | | | | | |
| | TOP TEN HOLDINGS AS OF 10/31/165 |
| | | Holding | | % of Net Assets | | | Line of Business |
| | SPDR S&P 500 ETF Trust | | | 14.0 | % | | Exchange Traded Funds |
| | iShares TIPS Bond ETF | | | 11.0 | | | Exchange Traded Funds |
| | iShares 7-10 Year Treasury Bond ETF | | | 9.0 | | | Exchange Traded Funds |
| | iShares Core S&P 500 ETF | | | 8.5 | | | Exchange Traded Funds |
| | Vanguard FTSE All-World ex-U.S. ETF | | | 5.8 | | | Exchange Traded Funds |
| | PowerShares Senior Loan Portfolio | | | 5.5 | | | Exchange Traded Funds |
| | Vanguard Short-Term Corporate Bond ETF | | | 4.0 | | | Exchange Traded Funds |
| | iShares Core S&P Mid-Cap ETF | | | 3.8 | | | Exchange Traded Funds |
| | iShares Edge MSCI® Minimum Volatility EAFE ETF | | | 3.3 | | | Exchange Traded Funds |
| | | iShares 3-7 Year Treasury Bond ETF | | | 3.0 | | | Exchange Traded Funds |
| | 5 | | The top 10 holdings may not be representative of the Portfolio’s future investments. |
| | | | | | | | | | |
| | PORTFOLIO COMPOSITION6 | | | | | |
| | | | | As of October 31, 2016 | | | As of October 31, 2015 | |
| | Stock Funds | | | 43.5 | % | | | 43.8 | % |
| | Bond Funds | | | 35.0 | | | | 39.1 | |
| | Foreign Stock Funds | | | 14.3 | | | | 12.0 | |
| | Alternative Funds | | | 2.5 | | | | 3.1 | |
| | | Investment Companies | | | 0.8 | | | | 2.0 | |
| | 6 | | The Portfolio is actively managed and, as such, its composition may differ over time. The percentage shown for each fund type reflects the value of that fund type as a percentage of the Portfolio’s net assets. Figures above may not sum to 100% due to rounding and/or exclusion of other assets and liabilities. |
16
GOLDMAN SACHS TARGET DATE 2030 PORTFOLIO
Performance Summary
October 31, 2016
The following graph shows the value, as of October 31, 2016, of a $10,000 investment made on October 1, 2007 (commencement of operations of the Ultra Predecessor Fund) in Class R6 Shares. For comparative purposes, the performance of the Portfolio’s benchmark, the S&P Target Date to 2030 Index (Total Return, Unhedged, USD), is shown. This performance data represents past performance and should not be considered indicative of future performance, which will fluctuate with changes in market conditions. These performance fluctuations may cause an investor’s shares, when redeemed, to be worth more or less than their original cost. Performance reflects applicable fee waivers and/or expense limitations currently in effect during the periods shown and in their absence, performance would be reduced. Returns do not reflect the deduction of taxes that a shareholder would pay on Portfolio distributions or the redemption of Portfolio shares. Performance of Class A, Institutional, Service, Class IR and Class R Shares will vary from Class R6 Shares due to differences in class specific fees and any applicable sales charges. In addition to the Investment Adviser’s decisions regarding underlying fund selection and allocations among them, other factors may affect Portfolio performance. These factors include, but are not limited to, portfolio operating fees and expenses, portfolio turnover and subscription and redemption cash flows affecting the Portfolio.
|
| Target Date 2030 Portfolio’s Lifetime Performance |
Performance of a $10,000 investment, with distributions reinvested, from October 1, 2007 through October 31, 2016.
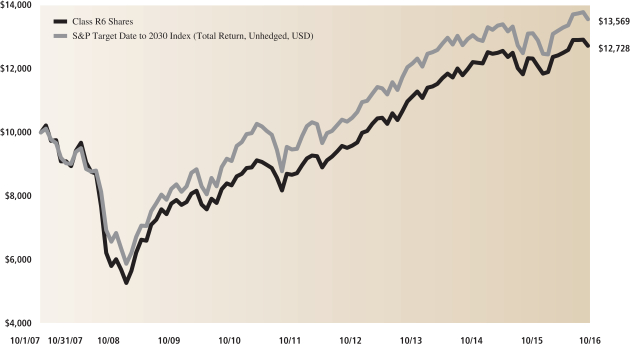
| | | | | | | | | | |
| Average Annual Total Return through October 31, 2016 | | | One Year | | | | Five Years | | | Since Inception |
Class A (Commenced August 22, 2016) | | | | | | | | | | |
Excluding sales charges | | | N/A | | | | N/A | | | -1.91%* |
Including sales charges | | | N/A | | | | N/A | | | -7.33%* |
|
Institutional Class (Commenced August 22, 2016) | | | N/A | | | | N/A | | | -1.81%* |
|
Service Class (Commenced August 22, 2016) | | | N/A | | | | N/A | | | -1.91%* |
|
Class IR (Commenced August 22, 2016) | | | N/A | | | | N/A | | | -1.81%* |
|
Class R (Commenced August 22, 2016) | | | N/A | | | | N/A | | | -1.91%* |
|
Class R6 (Commenced October 1, 2007) | | | 3.23% | | | | 7.91% | | | 2.69% |
|
| * | | Total return for periods of less than one year represents cumulative total return. |
17
FUND BASICS
Target Date 2040 Portfolio
as of October 31, 2016
| | | | | | | | | | |
| | PERFORMANCE REVIEW | |
| | | November 1, 2015–October 31, 2016 | | Portfolio Total Return
(based on NAV)1 | | | S&P Target Date To 2040
(Total Return, Unhedged, USD)2 | |
| | | Class R6 | | | 3.33 | % | | | 3.23 | % |
| | | |
| | | | | | | | | |
| | | August 22, 2016–October 31, 2016 | | | | | | |
| | Class A | | | -1.94 | % | | | -1.85 | % |
| | Institutional | | | -1.94 | | | | -1.85 | |
| | Service | | | -1.94 | | | | -1.85 | |
| | Class IR | | | -1.94 | | | | -1.85 | |
| | | Class R | | | -2.05 | | | | -1.85 | |
| | 1 | | The net asset value (“NAV”) represents the net assets of the class of the Portfolio (ex-dividend) divided by the total number of shares of the class outstanding. The Portfolio’s performance reflects the reinvestment of dividends and other distributions. The Portfolio’s performance does not reflect the deduction of any applicable sales charges. |
| | 2 | | The S&P Target Date Index Series is a component of the S&P Target Allocation Index Family, and is related to the S&P Target Risk Index Series. Both series are broadly representative of the investment opportunity available to investors in target risk and target date funds, respectively. The index series reflects the market consensus for asset allocations for different target date horizons. In particular, each index is representative of the investment opportunity available to investors for the corresponding target date horizon, with asset class exposures driven by a survey of available target date funds for that horizon. |
| | | | Effective August 22, 2016, the Madison Target Retirement 2040 Fund (the “Predecessor Fund”) was reorganized into the Portfolio. The Portfolio has assumed the Predecessor Fund’s historical performance. The returns for the Predecessor Fund for periods prior to August 29, 2014 reflect the performance of the Madison Target Retirement 2040 Fund’s Class I Shares, a series of Ultra Series Fund (the “Ultra Predecessor Fund”). As of August 29, 2014, the inception date of the Predecessor Fund, the Ultra Predecessor Fund exchanged in kind substantially all of its portfolio holdings for Class R6 shares of the Predecessor Fund. As a result, the Predecessor Fund assumed the performance of the Ultra Predecessor Fund. Performance reflects applicable fee waivers and/or expense limitations in effect during the periods shown. Past performance does not guarantee future results, which may vary. The value of investments and the income derived from investments will fluctuate and can go down as well as up. A loss of principal may occur. |
The returns set forth in the table above represent past performance. Past performance does not guarantee future results. The Portfolio’s investment return and principal value will fluctuate so that an investor’s shares, when redeemed, may be worth more or less than their original cost. Current performance may be lower or higher than the performance quoted above. Please visit our web site at www.GSAMFUNDS.com to obtain the most recent month-end returns. Performance reflects fee waivers and/or expense limitations in effect. In their absence, performance would be reduced. Returns do not reflect the deduction of taxes that a shareholder would pay on Portfolio distributions or the redemption of Portfolio shares. Returns less than 12 months are cumulative, not annualized.
18
FUND BASICS
| | | | | | | | | | | | | | | | |
| | STANDARDIZED TOTAL RETURNS3 |
| | | For the period ended 09/30/16 | | One Year | | | Five Years | | | Since Inception | | | Inception Date |
| | Class A | | | N/A | | | | N/A | | | | -5.80 | % | | 8/22/16 |
| | Institutional | | | N/A | | | | N/A | | | | -0.31 | | | 8/22/16 |
| | Service | | | N/A | | | | N/A | | | | -0.41 | | | 8/22/16 |
| | Class IR | | | N/A | | | | N/A | | | | -0.31 | | | 8/22/16 |
| | Class R | | | N/A | | | | N/A | | | | -0.41 | | | 8/22/16 |
| | | Class R6 | | | 10.28 | % | | | 10.50 | % | | | 2.61 | | | 10/01/07 |
| | 3 | | The Standardized Total Returns are average annual or cumulative total returns (only if the performance period is one year or less) as of the most recent calendar quarter-end. They assume reinvestment of all distributions at NAV. These returns reflect a maximum initial sales charge of 5.5% for Class A Shares. Because Institutional, Service, Class IR, Class R and Class R6 Shares do not involve a sales charge, such a charge is not applied to their Standardized Total Returns. |
| | | | Effective August 22, 2016, the Madison Target Retirement 2040 Fund (the “Predecessor Fund”) was reorganized into the Portfolio. The Portfolio has assumed the Predecessor Fund’s historical performance. The returns for the Predecessor Fund for periods prior to August 29, 2014 reflect the performance of the Madison Target Retirement 2040 Fund’s Class I Shares, a series of Ultra Series Fund (the “Ultra Predecessor Fund”). As of August 29, 2014, the inception date of the Predecessor Fund, the Ultra Predecessor Fund exchanged in kind substantially all of its portfolio holdings for Class R6 shares of the Predecessor Fund. As a result, the Predecessor Fund assumed the performance of the Ultra Predecessor Fund. Performance reflects applicable fee waivers and/or expense limitations in effect during the periods shown. Past performance does not guarantee future results, which may vary. The value of investments and the income derived from investments will fluctuate and can go down as well as up. A loss of principal may occur. |
The returns set forth in the table above represent past performance. Past performance does not guarantee future results. The Portfolio’s investment return and principal value will fluctuate so that an investor’s shares, when redeemed, may be worth more or less than their original cost. Current performance may be lower or higher than the performance quoted above. Please visit our web site at www.GSAMFUNDS.com to obtain the most recent month-end returns. Performance reflects applicable fee waivers and/or expense limitations in effect during the periods shown. In their absence, performance would be reduced. Returns do not reflect the deduction of taxes that a shareholder would pay on Portfolio distributions or the redemption of Portfolio shares.
| | | | | | | | | | |
| | EXPENSE RATIOS4 | |
| | | | | Net Expense Ratio (Current) | | | Gross Expense Ratio (Before Waivers) | |
| | Class A | | | 0.96 | % | | | 1.06 | % |
| | Institutional | | | 0.56 | | | | 0.66 | |
| | Service | | | 1.06 | | | | 1.16 | |
| | Class IR | | | 0.71 | | | | 0.81 | |
| | Class R | | | 1.21 | | | | 1.31 | |
| | | Class R6 | | | 0.54 | | | | 0.64 | |
| | 4 | | The expense ratios of the Portfolio, both current (net of applicable fee waivers and/or expense limitations) and before waivers (gross of applicable fee waivers and/or expense limitations) are as set forth above according to the most recent publicly available Prospectus for the Portfolio and will differ from the expense ratios disclosed in the Financial Highlights in this report due to the inclusion of Underlying Fund fees and expenses, which are not included in the operating expenses of the Portfolio reflected in the Financial Highlights. Pursuant to a contractual arrangement, the Portfolio’s waivers and/or expense limitations will remain in place through at least August 22, 2018, and prior to such date the Investment Adviser may not terminate the arrangements without the approval of the Portfolio’s Board of Trustees. If these arrangements are discontinued in the future, the expense ratios may change without shareholder approval. |
19
FUND BASICS
| | | | | | | | |
| | TOP TEN HOLDINGS AS OF 10/31/165 |
| | | Holding | | % of Net Assets | | | Line of Business |
| | SPDR S&P 500 ETF Trust | | | 15.5 | % | | Exchange Traded Funds |
| | iShares Core S&P 500 ETF | | | 10.0 | | | Exchange Traded Funds |
| | iShares 7-10 Year Treasury Bond ETF | | | 8.0 | | | Exchange Traded Funds |
| | iShares TIPS Bond ETF | | | 7.0 | | | Exchange Traded Funds |
| | Vanguard FTSE All-World ex-U.S. ETF | | | 5.8 | | | Exchange Traded Funds |
| | PowerShares Senior Loan Portfolio | | | 4.5 | | | Exchange Traded Funds |
| | iShares Core S&P Mid-Cap ETF | | | 4.3 | | | Exchange Traded Funds |
| | Schwab U.S. Dividend Equity ETF | | | 4.0 | | | Exchange Traded Funds |
| | Vanguard Information Technology ETF | | | 4.0 | | | Exchange Traded Funds |
| | | iShares Edge MSCI® Minimum Volatility EAFE ETF | | | 3.8 | | | Exchange Traded Funds |
| | 5 | | The top 10 holdings may not be representative of the Portfolio’s future investments. |
| | | | | | | | | | |
| | PORTFOLIO COMPOSITION6 | | | | | |
| | | | | As of October 31, 2016 | | | As of October 31, 2015 | |
| | Stock Funds | | | 50.5 | % | | | 51.4 | % |
| | Bond Funds | | | 25.0 | | | | 29.1 | |
| | Foreign Stock Funds | | | 16.8 | | | | 14.5 | |
| | Alternative Funds | | | 2.5 | | | | 3.0 | |
| | | Investment Companies | | | 1.3 | | | | 2.0 | |
| 6 | | The Portfolio is actively managed and, as such, its composition may differ over time. The percentage shown for each fund type reflects the value of that fund type as a percentage of the Portfolio’s net assets. Figures above may not sum to 100% due to rounding and/or exclusion of other assets and liabilities. |
20
GOLDMAN SACHS TARGET DATE 2040 PORTFOLIO
Performance Summary
October 31, 2016
The following graph shows the value, as of October 31, 2016, of a $10,000 investment made on October 1, 2007 (commencement of operations of the Ultra Predecessor Fund) in Class R6 Shares. For comparative purposes, the performance of the Portfolio’s benchmark, the S&P Target Date to 2040 Index (Total Return, Unhedged, USD), is shown. This performance data represents past performance and should not be considered indicative of future performance, which will fluctuate with changes in market conditions. These performance fluctuations may cause an investor’s shares, when redeemed, to be worth more or less than their original cost. Performance reflects applicable fee waivers and/or expense limitations currently in effect during the periods shown and in their absence, performance would be reduced. Returns do not reflect the deduction of taxes that a shareholder would pay on Portfolio distributions or the redemption of Portfolio shares. Performance of Class A, Institutional, Service, Class IR and Class R Shares will vary from Class R6 Shares due to differences in class specific fees and any applicable sales charges. In addition to the Investment Adviser’s decisions regarding underlying fund selection and allocations among them, other factors may affect Portfolio performance. These factors include, but are not limited to, portfolio operating fees and expenses, portfolio turnover and subscription and redemption cash flows affecting the Portfolio.
|
| Target Date 2040 Portfolio’s Lifetime Performance |
Performance of a $10,000 investment, with distributions reinvested, from October 1, 2007 through October 31, 2016.
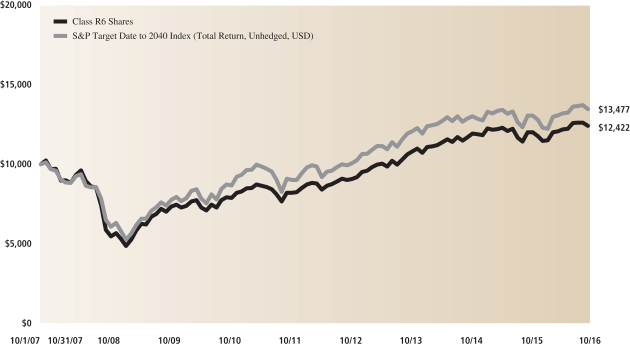
| | | | | | | | | | |
| Average Annual Total Return through October 31, 2016 | | | One Year | | | | Five Years | | | Since Inception |
Class A (Commenced August 22, 2016) | | | | | | | | | | |
Excluding sales charges | | | N/A | | | | N/A | | | -1.94%* |
Including sales charges | | | N/A | | | | N/A | | | -7.35%* |
|
Institutional Class (Commenced August 22, 2016) | | | N/A | | | | N/A | | | -1.94%* |
|
Service Class (Commenced August 22, 2016) | | | N/A | | | | N/A | | | -1.94%* |
|
Class IR (Commenced August 22, 2016) | | | N/A | | | | N/A | | | -1.94%* |
|
Class R (Commenced August 22, 2016) | | | N/A | | | | N/A | | | -2.05%* |
|
Class R6 (Commenced October 1, 2007) | | | 3.33% | | | | 8.62% | | | 2.41% |
|
| * | | Total return for periods of less than one year represents cumulative total return. |
21
FUND BASICS
Target Date 2050 Portfolio
as of October 31, 2016
| | | | | | | | | | |
| | PERFORMANCE REVIEW | |
| | | November 1, 2015–October 31, 2016 | | Portfolio Total Return
(based on NAV)1 | | | S&P Target Date To 2050
(Total Return, Unhedged, USD)2 | |
| | | Class R6 | | | 3.37 | % | | | 3.13 | % |
| | | |
| | | | | | | | | |
| | | August 22, 2016–October 31, 2016 | | | | | | |
| | Class A | | | -2.00 | % | | | -1.96 | % |
| | Institutional | | | -2.00 | | | | -1.96 | |
| | Service | | | -2.10 | | | | -1.96 | |
| | Class IR | | | -2.00 | | | | -1.96 | |
| | | Class R | | | -2.10 | | | | -1.96 | |
| | 1 | | The net asset value (“NAV”) represents the net assets of the class of the Portfolio (ex-dividend) divided by the total number of shares of the class outstanding. The Portfolio’s performance reflects the reinvestment of dividends and other distributions. The Portfolio’s performance does not reflect the deduction of any applicable sales charges. |
| | 2 | | The S&P Target Date Index Series is a component of the S&P Target Allocation Index Family, and is related to the S&P Target Risk Index Series. Both series are broadly representative of the investment opportunity available to investors in target risk and target date funds, respectively. The index series reflects the market consensus for asset allocations for different target date horizons. In particular, each index is representative of the investment opportunity available to investors for the corresponding target date horizon, with asset class exposures driven by a survey of available target date funds for that horizon. |
| | | | Effective August 22, 2016, the Madison Target Retirement 2050 Fund (the “Predecessor Fund”) was reorganized into the Portfolio. The Portfolio has assumed the Predecessor Fund’s historical performance. The returns for the Predecessor Fund for periods prior to August 29, 2014 reflect the performance of the Madison Target Retirement 2050 Fund’s Class I Shares, a series of Ultra Series Fund (the “Ultra Predecessor Fund”). As of August 29, 2014, the inception date of the Predecessor Fund, the Ultra Predecessor Fund exchanged in kind substantially all of its portfolio holdings for Class R6 shares of the Predecessor Fund. As a result, the Predecessor Fund assumed the performance of the Ultra Predecessor Fund. Performance reflects applicable fee waivers and/or expense limitations in effect during the periods shown. Past performance does not guarantee future results, which may vary. The value of investments and the income derived from investments will fluctuate and can go down as well as up. A loss of principal may occur. |
The returns set forth in the table above represent past performance. Past performance does not guarantee future results. The Portfolio’s investment return and principal value will fluctuate so that an investor’s shares, when redeemed, may be worth more or less than their original cost. Current performance may be lower or higher than the performance quoted above. Please visit our web site at www.GSAMFUNDS.com to obtain the most recent month-end returns. Performance reflects fee waivers and/or expense limitations in effect. In their absence, performance would be reduced. Returns do not reflect the deduction of taxes that a shareholder would pay on Portfolio distributions or the redemption of Portfolio shares. Returns less than 12 months are cumulative, not annualized.
22
FUND BASICS
| | | | | | | | | | | | | | | | |
| | STANDARDIZED TOTAL RETURNS3 |
| | | For the period ended 09/30/16 | | One Year | | | Five Years | | | Since Inception | | | Inception Date |
| | Class A | | | N/A | | | | N/A | | | | -5.77 | % | | 8/22/16 |
| | Institutional | | | N/A | | | | N/A | | | | -0.30 | | | 8/22/16 |
| | Service | | | N/A | | | | N/A | | | | -0.30 | | | 8/22/16 |
| | Class IR | | | N/A | | | | N/A | | | | -0.30 | | | 8/22/16 |
| | Class R | | | N/A | | | | N/A | | | | -0.40 | | | 8/22/16 |
| | | Class R6 | | | 11.36 | % | | | 11.55 | % | | | 8.16 | | | 10/01/07 |
| | 3 | | The Standardized Total Returns are average annual or cumulative total returns (only if the performance period is one year or less) as of the most recent calendar quarter-end. They assume reinvestment of all distributions at NAV. These returns reflect a maximum initial sales charge of 5.5% for Class A Shares. Because Institutional, Service, Class IR, Class R and Class R6 Shares do not involve a sales charge, such a charge is not applied to their Standardized Total Returns. |
| | | | Effective August 22, 2016, the Madison Target Retirement 2050 Fund (the “Predecessor Fund”) was reorganized into the Portfolio. The Portfolio has assumed the Predecessor Fund’s historical performance. The returns for the Predecessor Fund for periods prior to August 29, 2014 reflect the performance of the Madison Target Retirement 2050 Fund’s Class I Shares, a series of Ultra Series Fund (the “Ultra Predecessor Fund”). As of August 29, 2014, the inception date of the Predecessor Fund, the Ultra Predecessor Fund exchanged in kind substantially all of its portfolio holdings for Class R6 shares of the Predecessor Fund. As a result, the Predecessor Fund assumed the performance of the Ultra Predecessor Fund. Performance reflects applicable fee waivers and/or expense limitations in effect during the periods shown. Past performance does not guarantee future results, which may vary. The value of investments and the income derived from investments will fluctuate and can go down as well as up. A loss of principal may occur. |
The returns set forth in the table above represent past performance. Past performance does not guarantee future results. The Portfolio’s investment return and principal value will fluctuate so that an investor’s shares, when redeemed, may be worth more or less than their original cost. Current performance may be lower or higher than the performance quoted above. Please visit our web site at www.GSAMFUNDS.com to obtain the most recent month-end returns. Performance reflects applicable fee waivers and/or expense limitations in effect during the periods shown. In their absence, performance would be reduced. Returns do not reflect the deduction of taxes that a shareholder would pay on Portfolio distributions or the redemption of Portfolio shares.
| | | | | | | | | | |
| | EXPENSE RATIOS4 | |
| | | | | Net Expense Ratio (Current) | | | Gross Expense Ratio (Before Waivers) | |
| | Class A | | | 0.96 | % | | | 1.06 | % |
| | Institutional | | | 0.56 | | | | 0.66 | |
| | Service | | | 1.06 | | | | 1.16 | |
| | Class IR | | | 0.71 | | | | 0.81 | |
| | Class R | | | 1.21 | | | | 1.31 | |
| | | Class R6 | | | 0.54 | | | | 0.64 | |
| | 4 | | The expense ratios of the Portfolio, both current (net of applicable fee waivers and/or expense limitations) and before waivers (gross of applicable fee waivers and/or expense limitations) are as set forth above according to the most recent publicly available Prospectus for the Portfolio and will differ from the expense ratios disclosed in the Financial Highlights in this report due to the inclusion of Underlying Fund fees and expenses, which are not included in the operating expenses of the Portfolio reflected in the Financial Highlights. Pursuant to a contractual arrangement, the Portfolio’s waivers and/or expense limitations will remain in place through at least August 22, 2018, and prior to such date the Investment Adviser may not terminate the arrangements without the approval of the Portfolio’s Board of Trustees. If these arrangements are discontinued in the future, the expense ratios may change without shareholder approval. |
23
FUND BASICS
| | | | | | | | |
| | TOP TEN HOLDINGS AS OF 10/31/165 |
| | | Holding | | % of Net Assets | | | Line of Business |
| | iShares Core S&P 500 ETF | | | 21.5 | % | | Exchange Traded Funds |
| | SPDR S&P 500 ETF Trust | | | 6.5 | | | Exchange Traded Funds |
| | iShares 7-10 Year Treasury Bond ETF | | | 6.0 | | | Exchange Traded Funds |
| | Vanguard FTSE All-World ex-U.S. ETF | | | 5.8 | | | Exchange Traded Funds |
| | Schwab U.S. Dividend Equity ETF | | | 5.0 | | | Exchange Traded Funds |
| | iShares Core S&P Mid-Cap ETF | | | 4.8 | | | Exchange Traded Funds |
| | Vanguard Information Technology ETF | | | 4.7 | | | Exchange Traded Funds |
| | iShares Edge MSCI® Minimum Volatility EAFE ETF | | | 4.3 | | | Exchange Traded Funds |
| | iShares TIPS Bond ETF | | | 4.0 | | | Exchange Traded Funds |
| | | PowerShares Buyback Achievers Portfolio | | | 3.5 | | | Exchange Traded Funds |
| | 5 | | The top 10 holdings may not be representative of the Portfolio’s future investments. |
| | | | | | | | | | |
| | PORTFOLIO COMPOSITION6 | | | | | |
| | | | | As of October 31, 2016 | | | As of October 31, 2015 | |
| | Stock Funds | | | 58.0 | % | | | 58.9 | % |
| | Foreign Stock Funds | | | 19.3 | | | | 17.0 | |
| | Bond Funds | | | 15.0 | | | | 19.1 | |
| | Alternative Funds | | | 2.5 | | | | 3.0 | |
| | | Investment Companies | | | 1.3 | | | | 2.0 | |
| 6 | | The Portfolio is actively managed and, as such, its composition may differ over time. The percentage shown for each fund type reflects the value of that fund type as a percentage of the Portfolio’s net assets. Figures above may not sum to 100% due to rounding and/or exclusion of other assets and liabilities. |
24
GOLDMAN SACHS TARGET DATE 2050 PORTFOLIO
Performance Summary
October 31, 2016
The following graph shows the value, as of October 31, 2016, of a $10,000 investment made on January 3, 2011 (commencement of operations of the Ultra Predecessor Fund) in Class R6 Shares. For comparative purposes, the performance of the Portfolio’s benchmark, the S&P Target Date to 2050 Index (Total Return, Unhedged, USD), is shown. This performance data represents past performance and should not be considered indicative of future performance, which will fluctuate with changes in market conditions. These performance fluctuations may cause an investor’s shares, when redeemed, to be worth more or less than their original cost. Performance reflects applicable fee waivers and/or expense limitations currently in effect during the periods shown and in their absence, performance would be reduced. Returns do not reflect the deduction of taxes that a shareholder would pay on Portfolio distributions or the redemption of Portfolio shares. Performance of Class A, Institutional, Service, Class IR and Class R Shares will vary from Class R6 Shares due to differences in class specific fees and any applicable sales charges. In addition to the Investment Adviser’s decisions regarding underlying fund selection and allocations among them, other factors may affect Portfolio performance. These factors include, but are not limited to, portfolio operating fees and expenses, portfolio turnover and subscription and redemption cash flows affecting the Portfolio.
|
| Target Date 2050 Portfolio’s Lifetime Performance |
Performance of a $10,000 investment, with distributions reinvested, from January 3, 2011 through October 31, 2016.
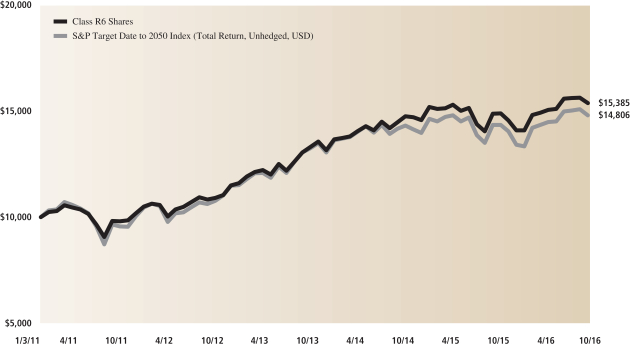
| | | | | | | | | | |
| Average Annual Total Return through October 31, 2016 | | | One Year | | | | Five Years | | | Since Inception |
Class A (Commenced August 22, 2016) | | | | | | | | | | |
Excluding sales charges | | | N/A | | | | N/A | | | -2.00%* |
Including sales charges | | | N/A | | | | N/A | | | -7.37%* |
|
Institutional Class (Commenced August 22, 2016) | | | N/A | | | | N/A | | | -2.00%* |
|
Service Class (Commenced August 22, 2016) | | | N/A | | | | N/A | | | -2.10%* |
|
Class IR (Commenced August 22, 2016) | | | N/A | | | | N/A | | | -2.00%* |
|
Class R (Commenced August 22, 2016) | | | N/A | | | | N/A | | | -2.10%* |
|
Class R6 (Commenced January 3, 2011) | | | 3.37% | | | | 9.37% | | | 7.72% |
|
| * | | Total return for periods of less than one year represents cumulative total return. |
25
PORTFOLIO RESULTS
Goldman Sachs Target Date 2025 Portfolio, Goldman Sachs Target Date 2035 Portfolio, Goldman Sachs Target Date 2045 Portfolio and Goldman Sachs Target Date 2055 Portfolio
Investment Process and Principal Strategies
The Goldman Sachs Target Date 2025 Portfolio, the Goldman Sachs Target Date 2035 Portfolio, the Goldman Sachs Target Date 2045 Portfolio and the Goldman Sachs Target Date 2055 Portfolio (collectively, the “Portfolios”) seek to provide capital appreciation and current income consistent with each respective Portfolio’s current asset allocation. The Portfolios employ asset allocation strategies designed for investors who plan to retire and to begin gradually withdrawing their investment beginning on or around 2025, 2035, 2045 and 2055, respectively (the “Target Dates”). The Portfolios generally seek to achieve their investment objective by investing in shares of exchange-traded funds (“ETFs”) and other registered investment companies (collectively, the “Underlying Funds”), according to an asset allocation strategy developed by Madison Asset Management, LLC, the sub-adviser, which is unaffiliated with Goldman Sachs Asset Management, L.P., the investment adviser for the Portfolios.
Portfolio Management Discussion and Analysis
Below, the Madison Asset Management, LLC portfolio management team, the Portfolios’ sub-adviser, discusses the Portfolios’ performance and positioning for the period since inception on August 22, 2016 through October 31, 2016 (the “Reporting Period”).
| Q | | How did the Portfolios perform during the Reporting Period? |
| A | | Goldman Sachs Target Date 2025 Portfolio — During the Reporting Period, the Target Date 2025 Portfolio’s Class A, Institutional, Service, IR, R and R6 Shares generated cumulative total returns of -1.70%, -1.70%, -1.80%, -1.70%, -1.80% and -1.70%, respectively. This compares to the -1.51% cumulative total return of the Portfolio’s benchmark, the S&P Target Date To 2025 Index (Total Return, Unhedged, USD) during the same period. |
| | Goldman Sachs Target Date 2035 Portfolio — During the Reporting Period, the Target Date 2035 Portfolio’s Class A, Institutional, Service, IR, R and R6 Shares generated cumulative total returns of -1.90%, -1.90%, -2.00%, -1.90%, -2.00% and -1.90%, respectively. This compares to the -1.74% cumulative total return of the Portfolio’s benchmark, the S&P Target Date To 2035 Index (Total Return, Unhedged, USD) during the same period. |
| | Goldman Sachs Target Date 2045 Portfolio — During the Reporting Period, the Target Date 2045 Portfolio’s Class A, Institutional, Service, IR, R and R6 Shares generated cumulative total returns of -2.00%, -1.90%, -2.00%, -2.00%, -2.10% and -2.00%, respectively. This compares to the -1.91% cumulative total return of the Portfolio’s benchmark, the S&P Target Date To 2045 Index (Total Return, Unhedged, USD) during the same period. |
| | Goldman Sachs Target Date 2055 Portfolio — During the Reporting Period, the Target Date 2055 Portfolio’s Class A, Institutional, Service, IR, R and R6 Shares generated cumulative total returns of -2.10%, -2.00%, -2.10%, -2.00%, -2.10% and -2.00%, respectively. This compares to the -1.99% cumulative total return of the Portfolio’s benchmark, the S&P Target Date To 2055 Index (Total Return, Unhedged, USD) during the same period. |
26
PORTFOLIO RESULTS
| Q | | What key factors affected the Portfolios’ performance during the Reporting Period? |
| A | | During the Reporting Period, the Portfolios were hurt by our strategic allocation decisions to favor certain asset classes through the Underlying Funds. The implementation of our tactical allocation decisions added to returns. Overall, the performance of Underlying Funds detracted from results during the Reporting Period. |
| Q | | How did the Portfolios’ strategic allocations affect performance during the Reporting Period? |
| A | | The Portfolios’ limited exposure to fixed income and international equities detracted from performance. U.S. stocks outperformed both the broad fixed income market and international equities during the Reporting Period. |
| | Within U.S. equities, the Portfolios benefited from their allocations to information technology and regional banks as well as to the S&P 500® Index and dividend-paying stocks. However, stock selection within the Portfolios’ strategic allocation to the SPDR® S&P® Homebuilders ETF detracted from results. |
| | Within international equities, security selection with the Portfolios’ strategic allocations to the iShares® Edge MSCI® Min Vol EAFE ETF and the VanEck Vectors™ Gold Miners ETF hurt performance. On the other hand, the Portfolios were helped by their U.S. dollar-hedged positions in the Japanese and European stock markets. |
| | Within fixed income, security selection within the Portfolios’ strategic allocations to the iShares® 20+ Year Treasury Bond ETF dampened returns. However, allocations to Treasury inflation-protected securities (“TIPS”) and bank loans bolstered performance. |
| Q | | How did your tactical allocation decisions help or hurt performance during the Reporting Period? |
| A | | Our tactical allocation decisions to focus on certain asset classes through the Underlying Funds added to relative performance during the Reporting Period. |
| | The Portfolios’ tactical allocations to TIPS and bank loans contributed positively. Within U.S. equities, the Portfolios’ emphasis on information technology and regional bank stocks added to returns. In addition, a bias toward Japanese stocks produced gains. |
| | The Portfolios were hurt by their tactical allocations to longer-duration U.S. Treasury securities. In addition, exposure to rising interest rates through the iShares® Edge MSCI® Min Vol EAFE ETF had negative impact on the performance of the Portfolios’ non-U.S. tactical allocations. Our preference for U.S. homebuilders detracted from overall results. |
| Q | | Did the Underlying Funds help or hurt the Portfolios’ performance during the Reporting Period? |
| A | | During the Reporting Period, the performance of the Underlying Funds detracted overall from the Portfolios’ returns. |
| | Of the Portfolios’ equity-related Underlying Funds, the weakest performers were the SPDR® S&P® Homebuilders ETF and the Vanguard Health Care ETF. Health care stocks struggled during the Reporting Period on a combination of political uncertainty going into the November 2016 U.S. election and downgrades to forward guidance by certain companies (Forward guidance is information a company provides as an indication or estimate of its future earnings.). The Portfolios’ strongest performers were the Vanguard Information Technology ETF (VGT) and the SPDR® S&P® Regional Banking ETF (KRE). VGT performed well as large-cap technology companies maintained strong earnings. KRE gained as interest rates rose during the Reporting Period. |
| | Of the Portfolios’ fixed income-related Underlying Funds, the weakest performer was the iShares® 20+ Year Treasury Bond ETF, which retreated as long-term interest rates rose during the Reporting Period. The strongest performers were the iShares® TIPS Bond ETF (TIP) and the PowerShares Senior Loan Fund (BKLN). TIP gained as inflation expectations increased. BKLN benefited as spreads (or yield differentials) narrowed between U.S. Treasuries and high yield corporate bonds of comparable maturity. |
| | Of the Portfolios’ Underlying Funds focused on alternative investments, the SPDR® Gold Shares ETF was hurt as interest rates rose and gold prices fell during the Reporting Period. |
| Q | | How did the Portfolios use derivatives and similar instruments during the Reporting Period? |
| A | | The Portfolios do not directly invest in derivatives. However, some of the Underlying Funds used derivatives during the Reporting Period to allow them to track their respective benchmark indices with more precision. These may have included options, forwards, futures, swaps, structured securities and other derivative instruments. |
27
PORTFOLIO RESULTS
| Q | | What changes did you make to the Portfolios’ strategic allocations during the Reporting Period? |
| A | | During the Reporting Period, we reduced the Portfolios’ strategic allocations to long-duration U.S. Treasuries and increased their strategic allocations to TIPS because we expected the U.S. Treasury yield curve to steepen and inflation expectations to rise. (Yield curve is a spectrum of maturities. A steepening yield curve is one wherein the differential in yields between longer-term and shorter-term maturities widens.) |
| Q | | What is the Portfolios’ tactical view and strategy for the months ahead? |
| A | | In the near term, we expect to see low returns from virtually all asset classes. Therefore, we believe managing risk is likely to be of greater importance going forward. We plan to maintain a defensive posture in the Portfolios, with a continued emphasis on seeking to generate strong risk-adjusted returns. |
28
FUND BASICS
Target Date 2025 Portfolio
as of October 31, 2016
| | | | | | | | | | |
| | PERFORMANCE REVIEW | |
| | | August 22, 2016–October 31, 2016 | | Portfolio Total Return
(based on NAV)1 | | | S&P Target Date To 2025
(Total Return, Unhedged, USD)2 | |
| | Class A | | | -1.70 | % | | | -1.51 | % |
| | Institutional | | | -1.70 | | | | -1.51 | |
| | Service | | | -1.80 | | | | -1.51 | |
| | Class IR | | | -1.70 | | | | -1.51 | |
| | Class R | | | -1.80 | | | | -1.51 | |
| | | Class R6 | | | -1.70 | | | | -1.51 | |
| | 1 | | The net asset value (“NAV”) represents the net assets of the class of the Portfolio (ex-dividend) divided by the total number of shares of the class outstanding. The Portfolio’s performance assumes the reinvestment of dividends and other distributions. The Portfolio’s performance does not reflect the deduction of any applicable sales charges. |
| | 2 | | The S&P Target Date Index Series is a component of the S&P Target Allocation Index Family, and is related to the S&P Target Risk Index Series. Both series are broadly representative of the investment opportunity available to investors in target risk and target date funds, respectively. The index series reflects the market consensus for asset allocations for different target date horizons. In particular, each index is representative of the investment opportunity available to investors for the corresponding target date horizon, with asset class exposures driven by a survey of available target date funds for that horizon. |
The returns set forth in the table above represent past performance. Past performance does not guarantee future results. The Portfolio’s investment return and principal value will fluctuate so that an investor’s shares, when redeemed, may be worth more or less than their original cost. Current performance may be lower or higher than the performance quoted above. Please visit our web site at www.GSAMFUNDS.com to obtain the most recent month-end returns. Performance reflects fee waivers and/or expense limitations in effect. In their absence, performance would be reduced. Returns do not reflect the deduction of taxes that a shareholder would pay on Portfolio distributions or the redemption of Portfolio shares.
| | | | | | | | |
| | STANDARDIZED TOTAL RETURNS3 |
| | | For the period ended 09/30/16 | | Since Inception | | | Inception Date |
| | Class A | | | -5.77 | % | | 8/22/16 |
| | Institutional | | | -0.30 | | | 8/22/16 |
| | Service | | | -0.30 | | | 8/22/16 |
| | Class IR | | | -0.30 | | | 8/22/16 |
| | Class R | | | -0.30 | | | 8/22/16 |
| | | Class R6 | | | -0.30 | | | 8/22/16 |
| | 3 | | The Standardized Total Returns are average annual or cumulative total returns (only if the performance period is one year or less) as of the most recent calendar quarter-end. They assume reinvestment of all distributions at NAV. These returns reflect a maximum initial sales charge of 5.5% for Class A Shares. Because Institutional, Service, Class IR, Class R and Class R6 Shares do not involve a sales charge, such a charge is not applied to their Standardized Total Returns. |
The returns set forth in the table above represent past performance. Past performance does not guarantee future results. The Portfolio’s investment return and principal value will fluctuate so that an investor’s shares, when redeemed, may be worth more or less than their original cost. Current performance may be lower or higher than the performance quoted above. Please visit our web site at www.GSAMFUNDS.com to obtain the most recent month-end returns. Performance reflects applicable fee waivers and/or expense limitations in effect during the periods shown. In their absence, performance would be reduced. Returns do not reflect the deduction of taxes that a shareholder would pay on Portfolio distributions or the redemption of Portfolio shares. Returns less than 12 months are cumulative, not annualized.
29
FUND BASICS
| | | | | | | | | | |
| | EXPENSE RATIOS4 | |
| | | | | Net Expense Ratio (Current) | | | Gross Expense Ratio (Before Waivers) | |
| | Class A | | | 0.96 | % | | | 1.06 | % |
| | Institutional | | | 0.56 | | | | 0.66 | |
| | Service | | | 1.06 | | | | 1.16 | |
| | Class IR | | | 0.71 | | | | 0.81 | |
| | Class R | | | 1.21 | | | | 1.31 | |
| | | Class R6 | | | 0.54 | | | | 0.64 | |
| | 4 | | The expense ratios of the Portfolio, both current (net of applicable fee waivers and/or expense limitations) and before waivers (gross of applicable fee waivers and/or expense limitations) are as set forth above according to the most recent publicly available Prospectus for the Portfolio and will differ from the expense ratios disclosed in the Financial Highlights in this report due to the inclusion of Underlying Fund fees and expenses, which are not included in the operating expenses of the Portfolio reflected in the Financial Highlights. Pursuant to a contractual arrangement, the Portfolio’s waivers and/or expense limitations will remain in place through at least August 22, 2018, and prior to such date the Investment Adviser may not terminate the arrangements without the approval of the Portfolio’s Board of Trustees. If these arrangements are discontinued in the future, the expense ratios may change without shareholder approval. |
| | | | | | | | |
| | TOP TEN HOLDINGS AS OF 10/31/165 |
| | | Holding | | % of Net Assets | | | Line of Business |
| | SPDR S&P 500 ETF Trust | | | 18.9 | % | | Exchange Traded Funds |
| | iShares TIPS Bond ETF | | | 12.9 | | | Exchange Traded Funds |
| | iShares 7-10 Year Treasury Bond ETF | | | 9.4 | | | Exchange Traded Funds |
| | iShares 3-7 Year Treasury Bond ETF | | | 6.5 | | | Exchange Traded Funds |
| | PowerShares Senior Loan Portfolio | | | 6.0 | | | Exchange Traded Funds |
| | Vanguard FTSE All-World ex-U.S. ETF | | | 5.7 | | | Exchange Traded Funds |
| | Vanguard Short-Term Corporate Bond ETF | | | 5.0 | | | Exchange Traded Funds |
| | iShares Core S&P Mid-Cap ETF | | | 3.4 | | | Exchange Traded Funds |
| | iShares Edge MSCI® Minimum Volatility EAFE ETF | | | 2.6 | | | Exchange Traded Funds |
| | | PowerShares DB Gold Fund | | | 2.5 | | | Exchange Traded Funds |
| | 5 | | The top 10 holdings may not be representative of the Portfolio’s future investments. |
| | | | | | |
| | PORTFOLIO COMPOSITION6 | |
| | | | | As of October 31, 2016 | |
| | Bond Funds | | | 42.2 | % |
| | Stock Funds | | | 37.9 | |
| | Foreign Stock Funds | | | 12.3 | |
| | Alternative Funds | | | 2.5 | |
| | | Investment Companies | | | 0.5 | |
| | 6 | | The Portfolio is actively managed and, as such, its composition may differ over time. The percentage shown for each fund type reflects the value of that fund type as a percentage of the Portfolio’s net assets. Figures above may not sum to 100% due to rounding and/or exclusion of other assets and liabilities. |
30
FUND BASICS
Target Date 2035 Portfolio
as of October 31, 2016
| | | | | | | | | | |
| | PERFORMANCE REVIEW | |
| | | August 22, 2016–October 31, 2016 | | Portfolio Total Return
(based on NAV)1 | | | S&P Target Date To 2035
(Total Return, Unhedged, USD)2 | |
| | Class A | | | -1.90 | % | | | -1.74 | % |
| | Institutional | | | -1.90 | | | | -1.74 | |
| | Service | | | -2.00 | | | | -1.74 | |
| | Class IR | | | -1.90 | | | | -1.74 | |
| | Class R | | | -2.00 | | | | -1.74 | |
| | | Class R6 | | | -1.90 | | | | -1.74 | |
| | 1 | | The net asset value (“NAV”) represents the net assets of the class of the Portfolio (ex-dividend) divided by the total number of shares of the class outstanding. The Portfolio’s performance assumes the reinvestment of dividends and other distributions. The Portfolio’s performance does not reflect the deduction of any applicable sales charges. |
| | 2 | | The S&P Target Date Index Series is a component of the S&P Target Allocation Index Family, and is related to the S&P Target Risk Index Series. Both series are broadly representative of the investment opportunity available to investors in target risk and target date funds, respectively. The index series reflects the market consensus for asset allocations for different target date horizons. In particular, each index is representative of the investment opportunity available to investors for the corresponding target date horizon, with asset class exposures driven by a survey of available target date funds for that horizon. |
The returns set forth in the table above represent past performance. Past performance does not guarantee future results. The Portfolio’s investment return and principal value will fluctuate so that an investor’s shares, when redeemed, may be worth more or less than their original cost. Current performance may be lower or higher than the performance quoted above. Please visit our web site at www.GSAMFUNDS.com to obtain the most recent month-end returns. Performance reflects fee waivers and/or expense limitations in effect. In their absence, performance would be reduced. Returns do not reflect the deduction of taxes that a shareholder would pay on Portfolio distributions or the redemption of Portfolio shares. Returns less than 12 months are cumulative, not annualized.
| | | | | | | | |
| | STANDARDIZED TOTAL RETURNS3 |
| | | For the period ended 09/30/16 | | Since Inception | | | Inception Date |
| | Class A | | | -5.77 | % | | 8/22/16 |
| | Institutional | | | -0.30 | | | 8/22/16 |
| | Service | | | -0.40 | | | 8/22/16 |
| | Class IR | | | -0.30 | | | 8/22/16 |
| | Class R | | | -0.40 | | | 8/22/16 |
| | | Class R6 | | | -0.30 | | | 8/22/16 |
| | 3 | | The Standardized Total Returns are average annual or cumulative total returns (only if the performance period is one year or less) as of the most recent calendar quarter-end. They assume reinvestment of all distributions at NAV. These returns reflect a maximum initial sales charge of 5.5% for Class A Shares. Because Institutional, Service, Class IR, Class R and Class R6 Shares do not involve a sales charge, such a charge is not applied to their Standardized Total Returns. |
The returns set forth in the table above represent past performance. Past performance does not guarantee future results. The Portfolio’s investment return and principal value will fluctuate so that an investor’s shares, when redeemed, may be worth more or less than their original cost. Current performance may be lower or higher than the performance quoted above. Please visit our web site at www.GSAMFUNDS.com to obtain the most recent month-end returns. Performance reflects applicable fee waivers and/or expense limitations in effect during the periods shown. In their absence, performance would be reduced. Returns do not reflect the deduction of taxes that a shareholder would pay on Portfolio distributions or the redemption of Portfolio shares.
31
FUND BASICS
| | | | | | | | | | |
| | EXPENSE RATIOS4 | |
| | | | | Net Expense Ratio (Current) | | | Gross Expense Ratio (Before Waivers) | |
| | Class A | | | 0.96 | % | | | 1.06 | % |
| | Institutional | | | 0.56 | | | | 0.66 | |
| | Service | | | 1.06 | | | | 1.16 | |
| | Class IR | | | 0.71 | | | | 0.81 | |
| | Class R | | | 1.21 | | | | 1.31 | |
| | | Class R6 | | | 0.54 | | | | 0.64 | |
| | 4 | | The expense ratios of the Portfolio, both current (net of applicable fee waivers and/or expense limitations) and before waivers (gross of applicable fee waivers and/or expense limitations) are as set forth above according to the most recent publicly available Prospectus for the Portfolio and will differ from the expense ratios disclosed in the Financial Highlights in this report due to the inclusion of Underlying Fund fees and expenses, which are not included in the operating expenses of the Portfolio reflected in the Financial Highlights. Pursuant to a contractual arrangement, the Portfolio’s waivers and/or expense limitations will remain in place through at least August 22, 2018, and prior to such date the Investment Adviser may not terminate the arrangements without the approval of the Portfolio’s Board of Trustees. If these arrangements are discontinued in the future, the expense ratios may change without shareholder approval. |
| | | | | | | | |
| | TOP TEN HOLDINGS AS OF 10/31/165 |
| | | Holding | | % of Net Assets | | | Line of Business |
| | SPDR S&P 500 ETF Trust | | | 21.8 | % | | Exchange Traded Funds |
| | iShares TIPS Bond ETF | | | 9.0 | | | Exchange Traded Funds |
| | iShares 7-10 Year Treasury Bond ETF | | | 8.5 | | | Exchange Traded Funds |
| | Vanguard FTSE All-World ex-U.S. ETF | | | 5.7 | | | Exchange Traded Funds |
| | PowerShares Senior Loan Portfolio | | | 5.0 | | | Exchange Traded Funds |
| | iShares Core S&P Mid-Cap ETF | | | 4.0 | | | Exchange Traded Funds |
| | Vanguard Information Technology ETF | | | 3.5 | | | Exchange Traded Funds |
| | Schwab U.S. Dividend Equity ETF | | | 3.5 | | | Exchange Traded Funds |
| | iShares Edge MSCI® Minimum Volatility EAFE ETF | | | 3.5 | | | Exchange Traded Funds |
| | | Vanguard Short-Term Corporate Bond ETF | | | 3.0 | | | Exchange Traded Funds |
| | 5 | | The top 10 holdings may not be representative of the Portfolio’s future investments. |
| | | | | | |
| | PORTFOLIO COMPOSITION6 | |
| | | | | As of October 31, 2016 | |
| | Stock Funds | | | 46.7 | % |
| | Bond Funds | | | 29.8 | |
| | Foreign Stock Funds | | | 15.4 | |
| | Alternative Funds | | | 2.5 | |
| | | Investment Companies | | | 1.0 | |
| | 6 | | The Portfolio is actively managed and, as such, its composition may differ over time. The percentage shown for each fund type reflects the value of that fund type as a percentage of the Portfolio’s net assets. Figures above may not sum to 100% due to rounding and/or exclusion of other assets and liabilities. |
32
FUND BASICS
Target Date 2045 Portfolio
as of October 31, 2016
| | | | | | | | | | |
| | PERFORMANCE REVIEW | |
| | | August 22, 2016–October 31, 2016 | | Portfolio Total Return
(based on NAV)1 | | | S&P Target Date To 2045
(Total Return, Unhedged, USD)2 | |
| | Class A | | | -2.00 | % | | | -1.91 | % |
| | Institutional | | | -1.90 | | | | -1.91 | |
| | Service | | | -2.00 | | | | -1.91 | |
| | Class IR | | | -2.00 | | | | -1.91 | |
| | Class R | | | -2.10 | | | | -1.91 | |
| | | Class R6 | | | -2.00 | | | | -1.91 | |
| | 1 | | The net asset value (“NAV”) represents the net assets of the class of the Portfolio (ex-dividend) divided by the total number of shares of the class outstanding. The Portfolio’s performance reflects the reinvestment of dividends and other distributions. The Portfolio’s performance does not reflect the deduction of any applicable sales charges. |
| | 2 | | The returns set forth in the table above represent past performance. Past performance does not guarantee future results. The Portfolio’s investment return and principal value will fluctuate so that an investor’s shares, when redeemed, may be worth more or less than their original cost. Current performance may be lower or higher than the performance quoted above. Please visit our web site at www.GSAMFUNDS.com to obtain the most recent month-end returns. Performance reflects fee waivers and/or expense limitations in effect. In their absence, performance would be reduced. Returns do not reflect the deduction of taxes that a shareholder would pay on Portfolio distributions or the redemption of Portfolio shares. |
The returns set forth in the table above represent past performance. Past performance does not guarantee future results. The Portfolio’s investment return and principal value will fluctuate so that an investor’s shares, when redeemed, may be worth more or less than their original cost. Current performance may be lower or higher than the performance quoted above. Please visit our web site at www.GSAMFUNDS.com to obtain the most recent month-end returns. Performance reflects fee waivers and/or expense limitations in effect. In their absence, performance would be reduced. Returns do not reflect the deduction of taxes that a shareholder would pay on Portfolio distributions or the redemption of Portfolio shares. Returns less than 12 months are cumulative, not annualized.
33
FUND BASICS
| | | | | | | | |
| | STANDARDIZED TOTAL RETURNS3 |
| | | For the period ended 09/30/16 | | Since Inception | | | Inception Date |
| | Class A | | | -5.77 | % | | 8/22/16 |
| | Institutional | | | -0.30 | | | 8/22/16 |
| | Service | | | -0.40 | | | 8/22/16 |
| | Class IR | | | -0.30 | | | 8/22/16 |
| | Class R | | | -0.40 | | | 8/22/16 |
| | | Class R6 | | | -0.30 | | | 8/22/16 |
| | 3 | | The Standardized Total Returns are average annual or cumulative total returns (only if the performance period is one year or less) as of the most recent calendar quarter-end. They assume reinvestment of all distributions at NAV. These returns reflect a maximum initial sales charge of 5.5% for Class A Shares. Because Institutional, Service, Class IR, Class R and Class R6 Shares do not involve a sales charge, such a charge is not applied to their Standardized Total Returns. |
The returns set forth in the table above represent past performance. Past performance does not guarantee future results. The Portfolio’s investment return and principal value will fluctuate so that an investor’s shares, when redeemed, may be worth more or less than their original cost. Current performance may be lower or higher than the performance quoted above. Please visit our web site at www.GSAMFUNDS.com to obtain the most recent month-end returns. Performance reflects applicable fee waivers and/or expense limitations in effect during the periods shown. In their absence, performance would be reduced. Returns do not reflect the deduction of taxes that a shareholder would pay on Portfolio distributions or the redemption of Portfolio shares.
| | | | | | | | | | |
| | EXPENSE RATIOS4 | |
| | | | | Net Expense Ratio (Current) | | | Gross Expense Ratio (Before Waivers) | |
| | Class A | | | 0.96 | % | | | 1.06 | % |
| | Institutional | | | 0.56 | | | | 0.66 | |
| | Service | | | 1.06 | | | | 1.16 | |
| | Class IR | | | 0.71 | | | | 0.81 | |
| | Class R | | | 1.21 | | | | 1.31 | |
| | | Class R6 | | | 0.54 | | | | 0.64 | |
| | 4 | | The expense ratios of the Portfolio, both current (net of applicable fee waivers and/or expense limitations) and before waivers (gross of applicable fee waivers and/or expense limitations) are as set forth above according to the most recent publicly available Prospectus for the Portfolio and will differ from the expense ratios disclosed in the Financial Highlights in this report due to the inclusion of Underlying Fund fees and expenses, which are not included in the operating expenses of the Portfolio reflected in the Financial Highlights. Pursuant to a contractual arrangement, the Portfolio’s waivers and/or expense limitations will remain in place through at least August 22, 2018, and prior to such date the Investment Adviser may not terminate the arrangements without the approval of the Portfolio’s Board of Trustees. If these arrangements are discontinued in the future, the expense ratios may change without shareholder approval. |
34
FUND BASICS
| | | | | | | | |
| | TOP TEN HOLDINGS AS OF 10/31/165 |
| | | Holding | | % of Net Assets | | | Line of Business |
| | SPDR S&P 500 ETF Trust | | | 25.3 | % | | Exchange Traded Funds |
| | iShares 7-10 Year Treasury Bond ETF | | | 7.5 | | | Exchange Traded Funds |
| | iShares TIPS Bond ETF | | | 6.0 | | | Exchange Traded Funds |
| | Vanguard FTSE All-World ex-U.S. ETF | | | 5.7 | | | Exchange Traded Funds |
| | Schwab U.S. Dividend Equity ETF | | | 4.5 | | | Exchange Traded Funds |
| | iShares Core S&P Mid-Cap ETF | | | 4.5 | | | Exchange Traded Funds |
| | Vanguard Information Technology ETF | | | 4.5 | | | Exchange Traded Funds |
| | PowerShares Senior Loan Portfolio | | | 4.0 | | | Exchange Traded Funds |
| | iShares Edge MSCI® Minimum Volatility EAFE ETF | | | 4.0 | | | Exchange Traded Funds |
| | | Vanguard Growth ETF | | | 3.0 | | | Exchange Traded Funds |
| | 5 | | The top 10 holdings may not be representative of the Portfolio’s future investments. |
| | | | | | |
| | PORTFOLIO COMPOSITION6 | |
| | | | | As of October 31, 2016 | |
| | Stock Funds | | | 53.9 | % |
| | Bond Funds | | | 19.9 | |
| | Foreign Stock Funds | | | 17.8 | |
| | Alternative Funds | | | 2.5 | |
| | | Investment Companies | | | 1.3 | |
| 6 | | The Portfolio is actively managed and, as such, its composition may differ over time. The percentage shown for each fund type reflects the value of that fund type as a percentage of the Portfolio’s net assets. Figures above may not sum to 100% due to rounding and/or exclusion of other assets and liabilities. |
35
FUND BASICS
Target Date 2055 Portfolio
as of October 31, 2016
| | | | | | | | | | |
| | PERFORMANCE REVIEW | |
| | | August 22, 2016–October 31, 2016 | | Portfolio Total Return
(based on NAV)1 | | | S&P Target Date To 2055
(Total Return, Unhedged, USD)2 | |
| | Class A | | | -2.10 | % | | | -1.99 | % |
| | Institutional | | | -2.00 | | | | -1.99 | |
| | Service | | | -2.10 | | | | -1.99 | |
| | Class IR | | | -2.00 | | | | -1.99 | |
| | Class R | | | -2.10 | | | | -1.99 | |
| | | Class R6 | | | -2.00 | | | | -1.99 | |
| | 1 | | The net asset value (“NAV”) represents the net assets of the class of the Portfolio (ex-dividend) divided by the total number of shares of the class outstanding. The Portfolio’s performance reflects the reinvestment of dividends and other distributions. The Portfolio’s performance does not reflect the deduction of any applicable sales charges. |
| | 2 | | The S&P Target Date Index Series is a component of the S&P Target Allocation Index Family, and is related to the S&P Target Risk Index Series. Both series are broadly representative of the investment opportunity available to investors in target risk and target date funds, respectively. The index series reflects the market consensus for asset allocations for different target date horizons. In particular, each index is representative of the investment opportunity available to investors for the corresponding target date horizon, with asset class exposures driven by a survey of available target date funds for that horizon. |
The returns set forth in the table above represent past performance. Past performance does not guarantee future results. The Portfolio’s investment return and principal value will fluctuate so that an investor’s shares, when redeemed, may be worth more or less than their original cost. Current performance may be lower or higher than the performance quoted above. Please visit our web site at www.GSAMFUNDS.com to obtain the most recent month-end returns. Performance reflects fee waivers and/or expense limitations in effect. In their absence, performance would be reduced. Returns do not reflect the deduction of taxes that a shareholder would pay on Portfolio distributions or the redemption of Portfolio shares. Returns less than 12 months are cumulative, not annualized.
36
FUND BASICS
| | | | | | | | |
| | STANDARDIZED TOTAL RETURNS3 |
| | | For the period ended 09/30/16 | | Since Inception | | | Inception Date |
| | Class A | | | -5.77 | % | | 8/22/16 |
| | Institutional | | | -0.30 | | | 8/22/16 |
| | Service | | | -0.30 | | | 8/22/16 |
| | Class IR | | | -0.30 | | | 8/22/16 |
| | Class R | | | -0.40 | | | 8/22/16 |
| | | Class R6 | | | -0.30 | | | 8/22/16 |
| | 3 | | The Standardized Total Returns are average annual or cumulative total returns (only if the performance period is one year or less) as of the most recent calendar quarter-end. They assume reinvestment of all distributions at NAV. These returns reflect a maximum initial sales charge of 5.5% for Class A Shares. Because Institutional, Service, Class IR, Class R and Class R6 Shares do not involve a sales charge, such a charge is not applied to their Standardized Total Returns. |
The returns set forth in the table above represent past performance. Past performance does not guarantee future results. The Portfolio’s investment return and principal value will fluctuate so that an investor’s shares, when redeemed, may be worth more or less than their original cost. Current performance may be lower or higher than the performance quoted above. Please visit our web site at www.GSAMFUNDS.com to obtain the most recent month-end returns. Performance reflects applicable fee waivers and/or expense limitations in effect during the periods shown. In their absence, performance would be reduced. Returns do not reflect the deduction of taxes that a shareholder would pay on Portfolio distributions or the redemption of Portfolio shares.
| | | | | | | | | | |
| | EXPENSE RATIOS4 | |
| | | | | Net Expense Ratio (Current) | | | Gross Expense Ratio (Before Waivers) | |
| | Class A | | | 0.96 | % | | | 1.06 | % |
| | Institutional | | | 0.56 | | | | 0.66 | |
| | Service | | | 1.06 | | | | 1.16 | |
| | Class IR | | | 0.71 | | | | 0.81 | |
| | Class R | | | 1.21 | | | | 1.31 | |
| | | Class R6 | | | 0.54 | | | | 0.64 | |
| | 4 | | The expense ratios of the Portfolio, both current (net of applicable fee waivers and/or expense limitations) and before waivers (gross of applicable fee waivers and/or expense limitations) are as set forth above according to the most recent publicly available Prospectus for the Portfolio and will differ from the expense ratios disclosed in the Financial Highlights in this report due to the inclusion of Underlying Fund fees and expenses, which are not included in the operating expenses of the Portfolio reflected in the Financial Highlights. Pursuant to a contractual arrangement, the Portfolio’s waivers and/or expense limitations will remain in place through at least August 22, 2018, and prior to such date the Investment Adviser may not terminate the arrangements without the approval of the Portfolio’s Board of Trustees. If these arrangements are discontinued in the future, the expense ratios may change without shareholder approval. |
37
FUND BASICS
| | | | | | | | |
| | TOP TEN HOLDINGS AS OF 10/31/165 |
| | | Holding | | % of Net Assets | | | Line of Business |
| | SPDR S&P 500 ETF Trust | | | 27.4 | % | | Exchange Traded Funds |
| | Vanguard FTSE All-World ex-U.S. ETF | | | 6.0 | | | Exchange Traded Funds |
| | Schwab U.S. Dividend Equity ETF | | | 5.0 | | | Exchange Traded Funds |
| | iShares Core S&P Mid-Cap ETF | | | 5.0 | | | Exchange Traded Funds |
| | Vanguard Information Technology ETF | | | 5.0 | | | Exchange Traded Funds |
| | iShares 7-10 Year Treasury Bond ETF | | | 4.5 | | | Exchange Traded Funds |
| | iShares Edge MSCI® Minimum Volatility EAFE ETF | | | 4.5 | | | Exchange Traded Funds |
| | PowerShares Buyback Achievers Portfolio | | | 4.0 | | | Exchange Traded Funds |
| | Vanguard Growth ETF | | | 3.5 | | | Exchange Traded Funds |
| | | PowerShares DB Gold Fund | | | 2.5 | | | Exchange Traded Funds |
| | 5 | | The top 10 holdings may not be representative of the Portfolio’s future investments. |
| | | | | | |
| | PORTFOLIO COMPOSITION6 | |
| | | | | As of October 31, 2016 | |
| | Stock Funds | | | 61.4 | % |
| | Foreign Stock Funds | | | 20.3 | |
| | Bond Funds | | | 9.9 | |
| | Alternative Funds | | | 2.5 | |
| | | Investment Companies | | | 1.3 | |
| | 6 | | The Portfolio is actively managed and, as such, its composition may differ over time. The percentage shown for each fund type reflects the value of that fund type as a percentage of the Portfolio’s net assets. Figures above may not sum to 100% due to rounding and/or exclusion of other assets and liabilities. |
38
FUND BASICS
Index Definitions
The S&P 500® Index is the Standard & Poor’s 500 composite index of 500 stocks, an unmanaged index of common stock prices.
The MSCI® EAFE Index is an equity index that captures large-cap and mid-cap representation across 21 developed markets countries around the world, excluding the U.S. and Canada. The index covers approximately 85% of the free float-adjusted market capitalization in each country. Developed markets countries in the index include Australia, Austria, Belgium, Denmark, Finland, France, Germany, Hong Kong, Ireland, Israel, Italy, Japan, the Netherlands, New Zealand, Norway, Portugal, Singapore, Spain, Sweden, Switzerland and the U.K.
The MSCI® Emerging Markets Index captures large-cap and mid-cap representation across 23 emerging markets countries. The index covers approximately 85% of the free float-adjusted market capitalization in each country. Emerging markets countries in the index include Brazil, Chile, China, Colombia, the Czech Republic, Egypt, Greece, Hungary, India, Indonesia, South Korea, Malaysia, Mexico, Peru, the Philippines, Poland, Russia, Qatar, South Africa, Taiwan, Thailand, Turkey and the United Arab Emirates.
The Bloomberg Barclays U.S. Aggregate Bond Index is an unmanaged, broad-based index that measures the investment grade, U.S. dollar-denominated, fixed-rate taxable bond market. The index includes U.S. Treasury, government-related and corporate securities, mortgage-backed securities (agency fixed-rate and hybrid adjustable-rate mortgage pass-through securities), asset-backed securities and commercial mortgage-backed securities (agency and non-agency).
The Russell 1000® Index measures the performance of the large-cap segment of the U.S. equity universe. It is a subset of the Russell 3000® Index and includes approximately 1000 of the largest securities based on a combination of their market cap and current index membership. The Russell 1000® Index represents approximately 92% of the U.S. market.
The Russell 1000® Growth Index is an unmanaged index of common stock prices that measures the performance of those Russell 1000 companies with higher price-to-book ratios and higher forecasted growth values.
The Russell 1000® Value Index measures the performance of the large-cap value segment of the U.S. equity universe. It includes those Russell 1000® Index companies with lower price-to-book ratios and lower expected growth values.
The Russell 2000® Index is an unmanaged index of common stock prices that measures the performance of the 2000 smallest companies in the Russell 3000 Index.
The Russell 2000® Growth Index is an unmanaged index of common stock prices that measures the performance of those Russell 2000 companies with higher price-to-book ratios and higher forecasted growth values.
The Russell 2000® Value Index measures the performance of small-cap value segment of the U.S. equity universe. It includes those Russell 2000 companies with lower price-to-book ratios and lower forecasted growth values. The Index is completely reconstituted annually to ensure larger stocks do not distort the performance and characteristics of the true small-cap opportunity set and that the represented companies continue to reflect value characteristics.
39
GOLDMAN SACHS TARGET DATE 2020 PORTFOLIO
Schedule of Investments
October 31, 2016
| | | | | | | | |
Shares | | | Description | | Value | |
| | Exchange Traded Funds – 96.1% | |
| | Alternative Funds* – 2.5% | |
| | 32,691 | | | PowerShares DB Gold Fund | | $ | 1,350,138 | |
| | |
| | Bond Funds – 59.6% | |
| | 4,108 | | | iShares 20+ Year Treasury Bond ETF | | | 539,175 | |
| | 74,912 | | | iShares 3-7 Year Treasury Bond ETF | | | 9,410,446 | |
| | 48,879 | | | iShares 7-10 Year Treasury Bond ETF | | | 5,379,623 | |
| | 69,650 | | | iShares TIPS Bond ETF | | | 8,069,649 | |
| | 162,232 | | | PowerShares Senior Loan Portfolio | | | 3,760,538 | |
| | 12,140 | | | Vanguard Intermediate-Term Corporate Bond ETF | | | 1,075,118 | |
| | 46,857 | | | Vanguard Short-Term Corporate Bond ETF | | | 3,763,554 | |
| | | | | | | | |
| | | | 31,998,103 | |
| | |
| | Foreign Stock Funds – 8.5% | |
| | 16,738 | | | iShares Edge MSCI Minimum Volatility EAFE ETF | | | 1,076,086 | |
| | 5,080 | | | iShares Edge MSCI Minimum Volatility Emerging Markets ETF | | | 268,377 | |
| | 10,500 | | | iShares MSCI Canada ETF | | | 266,175 | |
| | 17,833 | | | iShares MSCI United Kingdom ETF | | | 267,495 | |
| | 42,111 | | | Vanguard FTSE All-World ex-U.S. ETF | | | 1,880,677 | |
| | 7,376 | | | WisdomTree Europe Hedged Equity Fund | | | 400,664 | |
| | 8,914 | | | WisdomTree Japan Hedged Equity Fund | | | 402,467 | |
| | | | | | | | |
| | | | 4,561,941 | |
| | |
| | Stock Funds – 25.5% | |
| | 3,910 | | | Energy Select Sector SPDR Fund | | | 268,304 | |
| | 4,691 | | | Industrial Select Sector SPDR Fund | | | 268,372 | |
| | 21,602 | | | iShares Core S&P 500 ETF | | | 4,616,131 | |
| | 8,066 | | | iShares Core S&P Mid-Cap ETF | | | 1,214,498 | |
| | 17,166 | | | PowerShares Buyback Achievers Portfolio | | | 804,055 | |
| | 25,781 | | | Schwab U.S. Dividend Equity ETF | | | 1,073,779 | |
| | 12,378 | | | SPDR S&P 500 ETF Trust | | | 2,630,944 | |
| | 8,497 | | | SPDR S&P Homebuilders ETF | | | 268,675 | |
| | 15,333 | | | SPDR S&P Regional Banking ETF | | | 671,432 | |
| | 6,139 | | | Vanguard Growth ETF | | | 671,484 | |
| | 2,177 | | | Vanguard Health Care ETF | | | 268,533 | |
| | 7,830 | | | Vanguard Information Technology ETF | | | 937,408 | |
| | | | | | | | |
| | | | 13,693,615 | |
| | |
| | TOTAL EXCHANGE TRADED FUNDS | | | | |
| | (Cost $48,618,783) | | $ | 51,603,797 | |
| | |
| | TOTAL INVESTMENTS – 96.1% | | | | |
| | (Cost $48,618,783) | | $ | 51,603,797 | |
| | |
| OTHER ASSETS IN EXCESS OF
LIABILITIES – 3.9% | | | 2,116,786 | |
| | |
| | NET ASSETS – 100.0% | | $ | 53,720,583 | |
| | |
| | |
| The percentage shown for each investment category reflects the value of investments in that category as a percentage of net assets. |
* | | Non-income producing security. |
| | |
|
Investment Abbreviations: |
ETF | | —Exchange Traded Fund |
|
| | |
| 40 | | The accompanying notes are an integral part of these financial statements. |
GOLDMAN SACHS TARGET DATE 2025 PORTFOLIO
Schedule of Investments
October 31, 2016
| | | | | | | | |
Shares | | | Description | | Value | |
| | Exchange Traded Funds – 94.9% | |
| | Alternative Funds* – 2.5% | |
| | 5,960 | | | PowerShares DB Gold Fund | | $ | 246,148 | |
| | |
| | Bond Funds – 42.2% | |
| | 745 | | | iShares 20+ Year Treasury Bond ETF | | | 97,781 | |
| | 5,056 | | | iShares 3-7 Year Treasury Bond ETF | | | 635,135 | |
| | 8,436 | | | iShares 7-10 Year Treasury Bond ETF | | | 928,466 | |
| | 10,968 | | | iShares TIPS Bond ETF | | | 1,270,753 | |
| | 25,286 | | | PowerShares Senior Loan Portfolio | | | 586,130 | |
| | 1,663 | | | Vanguard Intermediate-Term Corporate Bond ETF | | | 147,275 | |
| | 6,082 | | | Vanguard Short-Term Corporate Bond ETF | | | 488,506 | |
| | | | | | | | |
| | | | | | | 4,154,046 | |
| | |
| | Foreign Stock Funds – 12.3% | |
| | 3,995 | | | iShares Edge MSCI Minimum Volatility EAFE ETF | | | 256,839 | |
| | 1,371 | | | iShares Edge MSCI Minimum Volatility Emerging Markets ETF | | | 72,430 | |
| | 2,827 | | | iShares MSCI Canada ETF | | | 71,664 | |
| | 3,208 | | | iShares MSCI United Kingdom ETF | | | 48,120 | |
| | 12,570 | | | Vanguard FTSE All-World ex-U.S. ETF | | | 561,376 | |
| | 2,235 | | | WisdomTree Europe Hedged Equity Fund | | | 121,405 | |
| | 1,621 | | | WisdomTree Japan Hedged Equity Fund | | | 73,188 | |
| | | | | | | | |
| | | | | | | 1,205,022 | |
| | |
| | Stock Funds – 37.9% | |
| | 1,066 | | | Energy Select Sector SPDR Fund | | | 73,149 | |
| | 590 | | | Guggenheim S&P 500 Equal Weight ETF | | | 48,114 | |
| | 1,282 | | | Industrial Select Sector SPDR Fund | | | 73,343 | |
| | 685 | | | iShares Core S&P 500 ETF | | | 146,378 | |
| | 2,198 | | | iShares Core S&P Mid-Cap ETF | | | 330,953 | |
| | 3,642 | | | PowerShares Buyback Achievers Portfolio | | | 170,591 | |
| | 5,865 | | | Schwab U.S. Dividend Equity ETF | | | 244,277 | |
| | 8,733 | | | SPDR S&P 500 ETF Trust | | | 1,856,199 | |
| | 2,306 | | | SPDR S&P Homebuilders ETF | | | 72,916 | |
| | 2,787 | | | SPDR S&P Regional Banking ETF | | | 122,043 | |
| | 1,963 | | | VanEck Vectors Agribusiness ETF | | | 96,795 | |
| | 1,563 | | | Vanguard Growth ETF | | | 170,961 | |
| | 593 | | | Vanguard Health Care ETF | | | 73,147 | |
| | 2,051 | | | Vanguard Information Technology ETF | | | 245,546 | |
| | | | | | | | |
| | | | | | | 3,724,412 | |
| | |
| | TOTAL EXCHANGE TRADED FUNDS | |
| | (Cost $9,465,474) | | $ | 9,329,628 | |
| | |
| | Investment Company – 0.5% | |
| | 3,232 | | | Schwab Fundamental U.S. Large Company Index Fund Institutional Shares (Cost $50,021) | | $ | 48,866 | |
| | |
| | TOTAL INVESTMENTS – 95.4% | |
| | (Cost $9,515,495) | | $ | 9,378,494 | |
| | |
| OTHER ASSETS IN EXCESS OF
LIABILITIES – 4.6% | | | 453,821 | |
| | |
| | NET ASSETS – 100.0% | | $ | 9,832,315 | |
| | |
| | |
| The percentage shown for each investment category reflects the value of investments in that category as a percentage of net assets. |
* | | Non-income producing security. |
| | |
|
Investment Abbreviations: |
ETF | | —Exchange Traded Fund |
|
| | |
| The accompanying notes are an integral part of these financial statements. | | 41 |
GOLDMAN SACHS TARGET DATE 2030 PORTFOLIO
Schedule of Investments
October 31, 2016
| | | | | | | | |
Shares | | | Description | | Value | |
| | Exchange Traded Funds – 95.3% | |
| | Alternative Funds* – 2.5% | |
| | 45,206 | | | PowerShares DB Gold Fund | | $ | 1,867,008 | |
| | |
| | Bond Funds – 35.0% | |
| | 5,681 | | | iShares 20+ Year Treasury Bond ETF | | | 745,631 | |
| | 17,782 | | | iShares 3-7 Year Treasury Bond ETF | | | 2,233,775 | |
| | 60,810 | | | iShares 7-10 Year Treasury Bond ETF | | | 6,692,749 | |
| | 70,607 | | | iShares TIPS Bond ETF | | | 8,180,527 | |
| | 176,349 | | | PowerShares Senior Loan Portfolio | | | 4,087,770 | |
| | 12,587 | | | Vanguard Intermediate-Term Corporate Bond ETF | | | 1,114,705 | |
| | 37,017 | | | Vanguard Short-Term Corporate Bond ETF | | | 2,973,205 | |
| | | | | | | | |
| | | | | | | 26,028,362 | |
| | |
| | Foreign Stock Funds – 14.3% | |
| | 37,561 | | | iShares Edge MSCI Minimum Volatility EAFE ETF | | | 2,414,797 | |
| | 14,051 | | | iShares Edge MSCI Minimum Volatility Emerging Markets ETF | | | 742,314 | |
| | 29,245 | | | iShares MSCI Canada ETF | | | 741,361 | |
| | 37,015 | | | iShares MSCI United Kingdom ETF | | | 555,225 | |
| | 95,728 | | | Vanguard FTSE All-World ex-U.S. ETF | | | 4,275,212 | |
| | 20,476 | | | WisdomTree Europe Hedged Equity Fund | | | 1,112,256 | |
| | 16,444 | | | WisdomTree Japan Hedged Equity Fund | | | 742,447 | |
| | | | | | | | |
| | | | | | | 10,583,612 | |
| | |
| | Stock Funds – 43.5% | |
| | 10,814 | | | Energy Select Sector SPDR Fund | | | 742,057 | |
| | 4,556 | | | Guggenheim S&P 500 Equal Weight ETF | | | 371,542 | |
| | 12,974 | | | Industrial Select Sector SPDR Fund | | | 742,242 | |
| | 29,525 | | | iShares Core S&P 500 ETF | | | 6,309,197 | |
| | 18,509 | | | iShares Core S&P Mid-Cap ETF | | | 2,786,900 | |
| | 31,795 | | | PowerShares Buyback Achievers Portfolio | | | 1,489,278 | |
| | 53,549 | | | Schwab U.S. Dividend Equity ETF | | | 2,230,316 | |
| | 48,907 | | | SPDR S&P 500 ETF Trust | | | 10,395,183 | |
| | 23,404 | | | SPDR S&P Homebuilders ETF | | | 740,034 | |
| | 25,444 | | | SPDR S&P Regional Banking ETF | | | 1,114,193 | |
| | 15,034 | | | VanEck Vectors Agribusiness ETF | | | 741,326 | |
| | 15,291 | | | Vanguard Growth ETF | | | 1,672,530 | |
| | 6,020 | | | Vanguard Health Care ETF | | | 742,567 | |
| | 18,619 | | | Vanguard Information Technology ETF | | | 2,229,067 | |
| | | | | | | | |
| | | | | | | 32,306,432 | |
| | |
| | TOTAL EXCHANGE TRADED FUNDS | |
| | (Cost $63,606,603) | | $ | 70,785,414 | |
| | |
| | Investment Company – 0.8% | |
| | 36,883 | | | Schwab Fundamental U.S. Large Company Index Fund Institutional Shares | | | | |
| | | | (Cost $505,943) | | $ | 557,665 | |
| | |
| | TOTAL INVESTMENTS – 96.1% | |
| | (Cost $64,112,546) | | $ | 71,343,079 | |
| | |
| OTHER ASSETS IN EXCESS OF
LIABILITIES – 3.9% | | | 2,930,062 | |
| | |
| | NET ASSETS – 100.0% | | $ | 74,273,141 | |
| | |
| | |
| The percentage shown for each investment category reflects the value of investments in that category as a percentage of net assets. |
* | | Non-income producing security. |
| | |
|
Investment Abbreviations: |
ETF | | —Exchange Traded Fund |
|
| | |
| 42 | | The accompanying notes are an integral part of these financial statements. |
GOLDMAN SACHS TARGET DATE 2035 PORTFOLIO
Schedule of Investments
October 31, 2016
| | | | | | | | |
Shares | | | Description | | Value | |
| | Exchange Traded Funds – 94.4% | |
| | Alternative Funds* – 2.5% | |
| | 5,931 | | | PowerShares DB Gold Fund | | $ | 244,950 | |
| | |
| | Bond Funds – 29.8% | |
| | 738 | | | iShares 20+ Year Treasury Bond ETF | | | 96,862 | |
| | 1,548 | | | iShares 3-7 Year Treasury Bond ETF | | | 194,460 | |
| | 7,546 | | | iShares 7-10 Year Treasury Bond ETF | | | 830,513 | |
| | 7,587 | | | iShares TIPS Bond ETF | | | 879,030 | |
| | 21,078 | | | PowerShares Senior Loan Portfolio | | | 488,588 | |
| | 1,642 | | | Vanguard Intermediate-Term Corporate Bond ETF | | | 145,416 | |
| | 3,632 | | | Vanguard Short-Term Corporate Bond ETF | | | 291,722 | |
| | | | | | | | |
| | | | | | | 2,926,591 | |
| | |
| | Foreign Stock Funds – 15.4% | |
| | 5,300 | | | iShares Edge MSCI Minimum Volatility EAFE ETF | | | 340,737 | |
| | 2,281 | | | iShares Edge MSCI Minimum Volatility Emerging Markets ETF | | | 120,505 | |
| | 3,837 | | | iShares MSCI Canada ETF | | | 97,268 | |
| | 6,491 | | | iShares MSCI United Kingdom ETF | | | 97,365 | |
| | 12,552 | | | Vanguard FTSE All-World ex-U.S. ETF | | | 560,572 | |
| | 3,132 | | | WisdomTree Europe Hedged Equity Fund | | | 170,130 | |
| | 2,718 | | | WisdomTree Japan Hedged Equity Fund | | | 122,718 | |
| | | | | | | | |
| | | | | | | 1,509,295 | |
| | |
| | Stock Funds – 46.7% | |
| | 1,419 | | | Energy Select Sector SPDR Fund | | | 97,372 | |
| | 591 | | | Guggenheim S&P 500 Equal Weight ETF | | | 48,196 | |
| | 1,705 | | | Industrial Select Sector SPDR Fund | | | 97,543 | |
| | 911 | | | iShares Core S&P 500 ETF | | | 194,672 | |
| | 2,590 | | | iShares Core S&P Mid-Cap ETF | | | 389,976 | |
| | 4,676 | | | PowerShares Buyback Achievers Portfolio | | | 219,024 | |
| | 8,197 | | | Schwab U.S. Dividend Equity ETF | | | 341,405 | |
| | 10,083 | | | SPDR S&P 500 ETF Trust | | | 2,143,142 | |
| | 3,079 | | | SPDR S&P Homebuilders ETF | | | 97,358 | |
| | 3,917 | | | SPDR S&P Regional Banking ETF | | | 171,525 | |
| | 1,974 | | | VanEck Vectors Agribusiness ETF | | | 97,338 | |
| | 2,229 | | | Vanguard Growth ETF | | | 243,808 | |
| | 790 | | | Vanguard Health Care ETF | | | 97,447 | |
| | 2,856 | | | Vanguard Information Technology ETF | | | 341,920 | |
| | | | | | | | |
| | | | | | | 4,580,726 | |
| | |
| | TOTAL EXCHANGE TRADED FUNDS | |
| | (Cost $9,416,396) | | $ | 9,261,562 | |
| | |
| | | | | | | | |
Shares | | | Description | | Value | |
| | Investment Company – 1.0% | |
| | 6,517 | | | Schwab Fundamental U.S. Large Company Index Fund Institutional Shares (Cost $100,963) | | $ | 98,532 | |
| | |
| | TOTAL INVESTMENTS – 95.4% | |
| | (Cost $9,517,359) | | $ | 9,360,094 | |
| | |
| OTHER ASSETS IN EXCESS OF
LIABILITIES – 4.6% | | | 453,588 | |
| | |
| | NET ASSETS – 100.0% | | $ | 9,813,682 | |
| | |
| | |
| The percentage shown for each investment category reflects the value of investments in that category as a percentage of net assets. |
* | | Non-income producing security. |
| | |
|
Investment Abbreviations: |
ETF | | —Exchange Traded Fund |
|
| | |
| The accompanying notes are an integral part of these financial statements. | | 43 |
GOLDMAN SACHS TARGET DATE 2040 PORTFOLIO
Schedule of Investments
October 31, 2016
| | | | | | | | |
Shares | | | Description | | Value | |
| | Exchange Traded Funds – 94.8% | |
| | Alternative Funds* – 2.5% | |
| | 28,850 | | | PowerShares DB Gold Fund | | $ | 1,191,505 | |
| | |
| | Bond Funds – 25.0% | |
| | 3,625 | | | iShares 20+ Year Treasury Bond ETF | | | 475,781 | |
| | 3,779 | | | iShares 3-7 Year Treasury Bond ETF | | | 474,718 | |
| | 34,496 | | | iShares 7-10 Year Treasury Bond ETF | | | 3,796,630 | |
| | 28,675 | | | iShares TIPS Bond ETF | | | 3,322,285 | |
| | 92,082 | | | PowerShares Senior Loan Portfolio | | | 2,134,461 | |
| | 8,033 | | | Vanguard Intermediate-Term Corporate Bond ETF | | | 711,402 | |
| | 11,818 | | | Vanguard Short-Term Corporate Bond ETF | | | 949,222 | |
| | | | | | | | |
| | | | | | | 11,864,499 | |
| | |
| | Foreign Stock Funds – 16.8% | |
| | 27,659 | | | iShares Edge MSCI Minimum Volatility EAFE ETF | | | 1,778,197 | |
| | 13,450 | | | iShares Edge MSCI Minimum Volatility Emerging Markets ETF | | | 710,564 | |
| | 18,664 | | | iShares MSCI Canada ETF | | | 473,132 | |
| | 39,465 | | | iShares MSCI United Kingdom ETF | | | 591,975 | |
| | 61,063 | | | Vanguard FTSE All-World ex-U.S. ETF | | | 2,727,074 | |
| | 17,472 | | | WisdomTree Europe Hedged Equity Fund | | | 949,079 | |
| | 15,742 | | | WisdomTree Japan Hedged Equity Fund | | | 710,751 | |
| | | | | | | | |
| | | | | | | 7,940,772 | |
| | |
| | Stock Funds – 50.5% | |
| | 6,901 | | | Energy Select Sector SPDR Fund | | | 473,547 | |
| | 2,890 | | | Guggenheim S&P 500 Equal Weight ETF | | | 235,679 | |
| | 8,301 | | | Industrial Select Sector SPDR Fund | | | 474,900 | |
| | 22,168 | | | iShares Core S&P 500 ETF | | | 4,737,080 | |
| | 13,387 | | | iShares Core S&P Mid-Cap ETF | | | 2,015,681 | |
| | 25,317 | | | PowerShares Buyback Achievers Portfolio | | | 1,185,848 | |
| | 45,566 | | | Schwab U.S. Dividend Equity ETF | | | 1,897,824 | |
| | 34,556 | | | SPDR S&P 500 ETF Trust | | | 7,344,878 | |
| | 14,976 | | | SPDR S&P Homebuilders ETF | | | 473,541 | |
| | 21,651 | | | SPDR S&P Regional Banking ETF | | | 948,097 | |
| | 9,580 | | | VanEck Vectors Agribusiness ETF | | | 472,390 | |
| | 11,927 | | | Vanguard Growth ETF | | | 1,304,575 | |
| | 3,842 | | | Vanguard Health Care ETF | | | 473,911 | |
| | 15,843 | | | Vanguard Information Technology ETF | | | 1,896,724 | |
| | | | | | | | |
| | | | | | | 23,934,675 | |
| | |
| | TOTAL EXCHANGE TRADED FUNDS | |
| | (Cost $39,431,799) | | $ | 44,931,451 | |
| | |
| | Investment Company – 1.3% | |
| | 39,230 | | | Schwab Fundamental U.S. Large Company Index Fund Institutional Shares (Cost $459,973) | | $ | 593,160 | |
| | |
| | TOTAL INVESTMENTS – 96.1% | |
| | (Cost $39,891,772) | | $ | 45,524,611 | |
| | |
| OTHER ASSETS IN EXCESS OF
LIABILITIES – 3.9% | | | 1,867,109 | |
| | |
| | NET ASSETS – 100.0% | | $ | 47,391,720 | |
| | |
| | |
| The percentage shown for each investment category reflects the value of investments in that category as a percentage of net assets. |
* | | Non-income producing security. |
| | |
|
Investment Abbreviations: |
ETF | | —Exchange Traded Fund |
|
| | |
| 44 | | The accompanying notes are an integral part of these financial statements. |
GOLDMAN SACHS TARGET DATE 2045 PORTFOLIO
Schedule of Investments
October 31, 2016
| | | | | | | | |
Shares | | | Description | | Value | |
| | Exchange Traded Funds – 94.1% | |
| | Alternative Funds* – 2.5% | |
| | 5,927 | | | PowerShares DB Gold Fund | | $ | 244,785 | |
| | |
| | Bond Funds – 19.9% | |
| | 745 | | | iShares 20+ Year Treasury Bond ETF | | | 97,781 | |
| | 6,644 | | | iShares 7-10 Year Treasury Bond ETF | | | 731,239 | |
| | 5,052 | | | iShares TIPS Bond ETF | | | 585,325 | |
| | 16,814 | | | PowerShares Senior Loan Portfolio | | | 389,748 | |
| | 1,816 | | | Vanguard Short-Term Corporate Bond ETF | | | 145,861 | |
| | | | | | | | |
| | | | 1,949,954 | |
| | |
| | Foreign Stock Funds – 17.8% | |
| | 6,061 | | | iShares Edge MSCI Minimum Volatility EAFE ETF | | | 389,662 | |
| | 3,210 | | | iShares Edge MSCI Minimum Volatility Emerging Markets ETF | | | 169,584 | |
| | 3,834 | | | iShares MSCI Canada ETF | | | 97,192 | |
| | 9,729 | | | iShares MSCI United Kingdom ETF | | | 145,935 | |
| | 12,537 | | | Vanguard FTSE All-World ex-U.S. ETF | | | 559,902 | |
| | 4,022 | | | WisdomTree Europe Hedged Equity Fund | | | 218,475 | |
| | 3,794 | | | WisdomTree Japan Hedged Equity Fund | | | 171,299 | |
| | | | | | | | |
| | | | 1,752,049 | |
| | |
| | Stock Funds – 53.9% | |
| | 1,418 | | | Energy Select Sector SPDR Fund | | | 97,303 | |
| | 591 | | | Guggenheim S&P 500 Equal Weight ETF | | | 48,196 | |
| | 1,702 | | | Industrial Select Sector SPDR Fund | | | 97,371 | |
| | 683 | | | iShares Core S&P 500 ETF | | | 145,950 | |
| | 2,912 | | | iShares Core S&P Mid-Cap ETF | | | 438,460 | |
| | 6,230 | | | PowerShares Buyback Achievers Portfolio | | | 291,813 | |
| | 10,531 | | | Schwab U.S. Dividend Equity ETF | | | 438,616 | |
| | 11,679 | | | SPDR S&P 500 ETF Trust | | | 2,482,372 | |
| | 3,077 | | | SPDR S&P Homebuilders ETF | | | 97,295 | |
| | 5,026 | | | SPDR S&P Regional Banking ETF | | | 220,089 | |
| | 1,959 | | | VanEck Vectors Agribusiness ETF | | | 96,598 | |
| | 2,673 | | | Vanguard Growth ETF | | | 292,373 | |
| | 789 | | | Vanguard Health Care ETF | | | 97,323 | |
| | 3,662 | | | Vanguard Information Technology ETF | | | 438,415 | |
| | | | | | | | |
| | | | 5,282,174 | |
| | |
| | TOTAL EXCHANGE TRADED FUNDS | |
| | (Cost $9,390,214) | | $ | 9,228,962 | |
| | |
| | | | | | | | |
| | Investment Company – 1.3% | |
| | 8,123 | | | Schwab Fundamental U.S. Large Company Index Fund Institutional Shares (Cost $125,879) | | $ | 122,827 | |
| | |
| | TOTAL INVESTMENTS – 95.4% | |
| | (Cost $9,516,093) | | $ | 9,351,789 | |
| | |
| OTHER ASSETS IN EXCESS OF
LIABILITIES – 4.6% | | | 453,678 | |
| | |
| | NET ASSETS – 100.0% | | $ | 9,805,467 | |
| | |
| | |
| The percentage shown for each investment category reflects the value of investments in that category as a percentage of net assets. |
* | | Non-income producing security. |
| | |
|
Investment Abbreviations: |
ETF | | —Exchange Traded Fund |
|
| | |
| The accompanying notes are an integral part of these financial statements. | | 45 |
GOLDMAN SACHS TARGET DATE 2050 PORTFOLIO
Schedule of Investments
October 31, 2016
| | | | | | | | |
Shares | | | Description | | Value | |
| | Exchange Traded Funds – 94.8% | |
| | Alternative Funds* – 2.5% | |
| | 13,219 | | | PowerShares DB Gold Fund | | $ | 545,945 | |
| | |
| | Bond Funds – 15.0% | |
| | 1,661 | | | iShares 20+ Year Treasury Bond ETF | | | 218,006 | |
| | 11,854 | | | iShares 7-10 Year Treasury Bond ETF | | | 1,304,651 | |
| | 7,514 | | | iShares TIPS Bond ETF | | | 870,572 | |
| | 23,439 | | | PowerShares Senior Loan Portfolio | | | 543,316 | |
| | 4,051 | | | Vanguard Short-Term Corporate Bond ETF | | | 325,377 | |
| | | | | | | | |
| | | | 3,261,922 | |
| | |
| | Foreign Stock Funds – 19.3% | |
| | 14,366 | | | iShares Edge MSCI Minimum Volatility EAFE ETF | | | 923,590 | |
| | 8,197 | | | iShares Edge MSCI Minimum Volatility Emerging Markets ETF | | | 433,047 | |
| | 8,551 | | | iShares MSCI Canada ETF | | | 216,768 | |
| | 25,315 | | | iShares MSCI United Kingdom ETF | | | 379,725 | |
| | 27,988 | | | Vanguard FTSE All-World ex-U.S. ETF | | | 1,249,944 | |
| | 10,006 | | | WisdomTree Europe Hedged Equity Fund | | | 543,526 | |
| | 9,617 | | | WisdomTree Japan Hedged Equity Fund | | | 434,208 | |
| | | | | | | | |
| | | | 4,180,808 | |
| | |
| | Stock Funds – 58.0% | |
| | 3,952 | | | Energy Select Sector SPDR Fund | | | 271,186 | |
| | 1,332 | | | Guggenheim S&P 500 Equal Weight ETF | | | 108,625 | |
| | 4,752 | | | Industrial Select Sector SPDR Fund | | | 271,862 | |
| | 21,837 | | | iShares Core S&P 500 ETF | | | 4,666,348 | |
| | 6,855 | | | iShares Core S&P Mid-Cap ETF | | | 1,032,157 | |
| | 16,238 | | | PowerShares Buyback Achievers Portfolio | | | 760,588 | |
| | 26,097 | | | Schwab U.S. Dividend Equity ETF | | | 1,086,940 | |
| | 6,640 | | | SPDR S&P 500 ETF Trust | | | 1,411,332 | |
| | 6,862 | | | SPDR S&P Homebuilders ETF | | | 216,976 | |
| | 12,400 | | | SPDR S&P Regional Banking ETF | | | 542,996 | |
| | 4,399 | | | VanEck Vectors Agribusiness ETF | | | 216,915 | |
| | 6,458 | | | Vanguard Growth ETF | | | 706,376 | |
| | 2,200 | | | Vanguard Health Care ETF | | | 271,370 | |
| | 8,612 | | | Vanguard Information Technology ETF | | | 1,031,029 | |
| | | | | | | | |
| | | | 12,594,700 | |
| | |
| | TOTAL EXCHANGE TRADED FUNDS | | | | |
| | (Cost $18,762,014) | | $ | 20,583,375 | |
| | |
| | Investment Company – 1.3% | |
| | 17,974 | | | Schwab Fundamental U.S. Large Company Index Fund Institutional Shares | | | | |
| | | | (Cost $195,584) | | $ | 271,774 | |
| | |
| | TOTAL INVESTMENTS – 96.1% | |
| | (Cost $18,957,598) | | $ | 20,855,149 | |
| | |
| OTHER ASSETS IN EXCESS OF
LIABILITIES – 3.9% | | | 850,556 | |
| | |
| | NET ASSETS – 100.0% | | $ | 21,705,705 | |
| | |
| | |
| The percentage shown for each investment category reflects the value of investments in that category as a percentage of net assets. |
* | | Non-income producing security. |
| | |
|
Investment Abbreviations: |
ETF | | —Exchange Traded Fund |
|
| | |
| 46 | | The accompanying notes are an integral part of these financial statements. |
GOLDMAN SACHS TARGET DATE 2055 PORTFOLIO
Schedule of Investments
October 31, 2016
| | | | | | | | |
Shares | | | Description | | Value | |
| | Exchange Traded Funds – 94.1% | |
| | Alternative Funds* – 2.5% | |
| | 5,923 | | | PowerShares DB Gold Fund | | $ | 244,620 | |
| | |
| | Bond Funds – 9.9% | |
| | 746 | | | iShares 20+ Year Treasury Bond ETF | | | 97,912 | |
| | 3,983 | | | iShares 7-10 Year Treasury Bond ETF | | | 438,369 | |
| | 1,682 | | | iShares TIPS Bond ETF | | | 194,877 | |
| | 4,181 | | | PowerShares Senior Loan Portfolio | | | 96,916 | |
| | 1,816 | | | Vanguard Short-Term Corporate Bond ETF | | | 145,861 | |
| | | | | | | | |
| | | | | | | 973,935 | |
| | |
| | Foreign Stock Funds – 20.3% | |
| | 6,811 | | | iShares Edge MSCI Minimum Volatility EAFE ETF | | | 437,879 | |
| | 4,129 | | | iShares Edge MSCI Minimum Volatility Emerging Markets ETF | | | 218,135 | |
| | 4,762 | | | iShares MSCI Canada ETF | | | 120,717 | |
| | 12,938 | | | iShares MSCI United Kingdom ETF | | | 194,070 | |
| | 13,060 | | | Vanguard FTSE All-World ex-U.S. ETF | | | 583,259 | |
| | 4,474 | | | WisdomTree Europe Hedged Equity Fund | | | 243,028 | |
| | 4,323 | | | WisdomTree Japan Hedged Equity Fund | | | 195,183 | |
| | | | | | | | |
| | | | | | | 1,992,271 | |
| | |
| | Stock Funds – 61.4% | |
| | 1,771 | | | Energy Select Sector SPDR Fund | | | 121,526 | |
| | 591 | | | Guggenheim S&P 500 Equal Weight ETF | | | 48,196 | |
| | 2,552 | | | Industrial Select Sector SPDR Fund | | | 146,000 | |
| | 1,138 | | | iShares Core S&P 500 ETF | | | 243,179 | |
| | 3,233 | | | iShares Core S&P Mid-Cap ETF | | | 486,793 | |
| | 8,305 | | | PowerShares Buyback Achievers Portfolio | | | 389,006 | |
| | 11,692 | | | Schwab U.S. Dividend Equity ETF | | | 486,972 | |
| | 12,616 | | | SPDR S&P 500 ETF Trust | | | 2,681,531 | |
| | 3,113 | | | SPDR S&P Homebuilders ETF | | | 98,433 | |
| | 5,537 | | | SPDR S&P Regional Banking ETF | | | 242,465 | |
| | 1,971 | | | VanEck Vectors Agribusiness ETF | | | 97,190 | |
| | 3,105 | | | Vanguard Growth ETF | | | 339,625 | |
| | 1,175 | | | Vanguard Health Care ETF | | | 144,936 | |
| | 4,057 | | | Vanguard Information Technology ETF | | | 485,704 | |
| | | | | | | | |
| | | | | | | 6,011,556 | |
| | |
| | TOTAL EXCHANGE TRADED FUNDS | |
| | (Cost $9,384,422) | | $ | 9,222,382 | |
| | |
| | Investment Company – 1.3% | |
| | 8,053 | | | Schwab Fundamental U.S. Large Company Index Fund Institutional Shares | | | | |
| | | | (Cost $124,907) | | $ | 121,767 | |
| | |
| | TOTAL INVESTMENTS – 95.4% | |
| | (Cost $9,509,329) | | $ | 9,344,149 | |
| | |
| OTHER ASSETS IN EXCESS OF
LIABILITIES – 4.6% | | | 453,306 | |
| | |
| | NET ASSETS – 100.0% | | $ | 9,797,455 | |
| | |
| | |
| The percentage shown for each investment category reflects the value of investments in that category as a percentage of net assets. |
* | | Non-income producing security. |
| | |
|
Investment Abbreviations: |
ETF | | —Exchange Traded Fund |
|
| | |
| The accompanying notes are an integral part of these financial statements. | | 47 |
GOLDMAN SACHS TARGET DATE PORTFOLIOS
Statements of Assets and Liabilities
October 31, 2016
| | | | | | |
| | | | | Target Date 2020
Portfolio | |
| | Assets: | | | | |
| | Investments, at value (cost $48,618,783, $9,515,495, $64,112,546, $9,517,359, $39,891,772, $9,516,093, $18,957,598 and $9,509,329, respectively) | | $ | 51,603,797 | |
| | Cash | | | 1,914,831 | |
| | Deferred offering costs | | | — | |
| | Receivables: | | | | |
| | Investments sold | | | 2,376,390 | |
| | Reimbursement from investment adviser | | | 113,785 | |
| | Total assets | | | 56,008,803 | |
| | | | | | |
| | Liabilities: | | | | |
| | Payables: | | | | |
| | Investments purchased | | | 2,140,182 | |
| | Management fees | | | 11,552 | |
| | Distribution and Service fees and Transfer Agency fees | | | 939 | |
| | Organization costs | | | — | |
| | Accrued offering costs | | | — | |
| | Accrued expenses | | | 135,547 | |
| | Total liabilities | | | 2,288,220 | |
| | | | | | |
| | Net Assets: | | | | |
| | Paid-in capital | | | 48,471,069 | |
| | Undistributed net investment income | | | 747,818 | |
| | Accumulated net realized gain (loss) | | | 1,516,682 | |
| | Net unrealized gain (loss) | | | 2,985,014 | |
| | | NET ASSETS | | $ | 53,720,583 | |
| | | Net Assets: | | | | |
| | | Class A | | $ | 9,852 | |
| | | Institutional | | | 9,861 | |
| | | Service | | | 9,850 | |
| | | Class IR | | | 9,857 | |
| | | Class R | | | 9,848 | |
| | | Class R6 | | | 53,671,315 | |
| | | Total Net Assets | | $ | 53,720,583 | |
| | | Shares Outstanding $0.001 par value (unlimited number of shares authorized): | | | | |
| | | Class A | | | 995 | |
| | | Institutional | | | 995 | |
| | | Service | | | 995 | |
| | | Class IR | | | 995 | |
| | | Class R | | | 995 | |
| | | Class R6 | | | 5,415,393 | |
| | | Net asset value, offering and redemption price per share:(a) | | | | |
| | | Class A | | | $9.90 | |
| | | Institutional | | | 9.91 | |
| | | Service | | | 9.90 | |
| | | Class IR | | | 9.91 | |
| | | Class R | | | 9.90 | |
| | | Class R6 | | | 9.91 | |
| | (a) | | Maximum public offering price per share for Class A Shares of the Target Date 2020, Target Date 2025, Target Date 2030, Target Date 2035, Target Date 2040, Target Date 2045, Target Date 2050, and Target Date 2055 Portfolios is $10.48, $10.40, $10.31, $10.38, $10.14, $10.37, $10.37 and $10.36, respectively. |
| | |
| 48 | | The accompanying notes are an integral part of these financial statements. |
GOLDMAN SACHS TARGET DATE PORTFOLIOS
| | | | | | | | | | | | | | | | | | | | | | | | | | | | | | | | | | | | | | | | |
| | | Target Date 2025
Portfolio | | | | | Target Date 2030
Portfolio | | | | | Target Date 2035
Portfolio | | | | | Target Date 2040
Portfolio | | | | | Target Date 2045
Portfolio | | | | | Target Date 2050
Portfolio | | | | | Target Date 2055
Portfolio | |
| | | | | | | | | | | | | | | | | | | | | | | | | | | | | | | | | | | | | | | | |
| | $ | 9,378,494 | | | | | $ | 71,343,079 | | | | | $ | 9,360,094 | | | | | $ | 45,524,611 | | | | | $ | 9,351,789 | | | | | $ | 20,855,149 | | | | | $ | 9,344,149 | |
| | | 355,455 | | | | | | 2,671,796 | | | | | | 355,005 | | | | | | 1,718,711 | | | | | | 355,936 | | | | | | 774,334 | | | | | | 387,670 | |
| | | 136,049 | | | | | | — | | | | | | 136,049 | | | | | | — | | | | | | 136,049 | | | | | | — | | | | | | 136,321 | |
| | | | | | | | | | | | | | | | | | | | | | | | | | | | | | | | | | | | | | | | |
| | | 121,409 | | | | | | 826,029 | | | | | | 135,002 | | | | | | 678,182 | | | | | | 158,358 | | | | | | 525,907 | | | | | | 227,255 | |
| | | 36,523 | | | | | | 112,988 | | | | | | 36,524 | | | | | | 113,368 | | | | | | 36,524 | | | | | | 114,651 | | | | | | 36,523 | |
| | | 10,027,930 | | | | | | 74,953,892 | | | | | | 10,022,674 | | | | | | 48,034,872 | | | | | | 10,038,656 | | | | | | 22,270,041 | | | | | | 10,131,918 | |
| | | | | | | | | | | | | | | | | | | | | | | | | | | | | | | | | | | | | | | | |
| | | | | | | | | | | | | | | | | | | | | | | | | | | | | | | | | | | | | | | | |
| | | | | | | | | | | | | | | | | | | | | | | | | | | | | | | | | | | | | | | | |
| | | 86,329 | | | | | | 524,033 | | | | | | 99,712 | | | | | | 497,571 | | | | | | 123,908 | | | | | | 429,365 | | | | | | 224,910 | |
| | | 2,092 | | | | | | 15,967 | | | | | | 2,090 | | | | | | 10,330 | | | | | | 2,089 | | | | | | 4,690 | | | | | | 2,089 | |
| | | 350 | | | | | | 1,292 | | | | | | 348 | | | | | | 841 | | | | | | 348 | | | | | | 390 | | | | | | 348 | |
| | | 12,000 | | | | | | — | | | | | | 12,000 | | | | | | — | | | | | | 12,000 | | | | | | — | | | | | | 12,000 | |
| | | 58,027 | | | | | | — | | | | | | 58,027 | | | | | | — | | | | | | 58,027 | | | | | | — | | | | | | 58,298 | |
| | | 36,817 | | | | | | 139,459 | | | | | | 36,815 | | | | | | 134,410 | | | | | | 36,817 | | | | | | 129,891 | | | | | | 36,818 | |
| | | 195,615 | | | | | | 680,751 | | | | | | 208,992 | | | | | | 643,152 | | | | | | 233,189 | | | | | | 564,336 | | | | | | 334,463 | |
| | | | | | | | | | | | | | | | | | | | | | | | | | | | | | | | | | | | | | | | |
| | | | | | | | | | | | | | | | | | | | | | | | | | | | | | | | | | | | | | | | |
| | | 9,999,493 | | | | | | 64,693,058 | | | | | | 9,999,493 | | | | | | 39,835,129 | | | | | | 9,999,493 | | | | | | 19,083,144 | | | | | | 9,999,493 | |
| | | 27,333 | | | | | | 1,109,790 | | | | | | 27,791 | | | | | | 738,785 | | | | | | 27,605 | | | | | | 333,260 | | | | | | 27,485 | |
| | | (57,510 | ) | | | | | 1,239,760 | | | | | | (56,337 | ) | | | | | 1,184,967 | | | | | | (57,327 | ) | | | | | 391,750 | | | | | | (64,343 | ) |
| | | (137,001 | ) | | | | | 7,230,533 | | | | | | (157,265 | ) | | | | | 5,632,839 | | | | | | (164,304 | ) | | | | | 1,897,551 | | | | | | (165,180 | ) |
| | | $ | 9,832,315 | | | | | $ | 74,273,141 | | | | | $ | 9,813,682 | | | | | $ | 47,391,720 | | | | | $ | 9,805,467 | | | | | $ | 21,705,705 | | | | | $ | 9,797,455 | |
| | | | | | | | | | | | | | | | | | | | | | | | | | | | | | | | | | | | | | | | | |
| | | $ | 9,824 | | | | | $ | 9,811 | | | | | $ | 9,806 | | | | | $ | 12,663 | | | | | $ | 9,798 | | | | | $ | 9,796 | | | | | $ | 9,790 | |
| | | | 9,783,185 | | | | | | 9,820 | | | | | | 9,764,645 | | | | | | 9,812 | | | | | | 9,756,471 | | | | | | 9,804 | | | | | | 9,748,499 | |
| | | | 9,823 | | | | | | 9,810 | | | | | | 9,804 | | | | | | 9,801 | | | | | | 9,796 | | | | | | 9,794 | | | | | | 9,788 | |
| | | | 9,830 | | | | | | 9,816 | | | | | | 9,811 | | | | | | 9,808 | | | | | | 9,803 | | | | | | 9,801 | | | | | | 9,795 | |
| | | | 9,820 | | | | | | 9,807 | | | | | | 9,802 | | | | | | 9,798 | | | | | | 9,793 | | | | | | 9,791 | | | | | | 9,785 | |
| | | | 9,833 | | | | | | 74,224,077 | | | | | | 9,814 | | | | | | 47,339,838 | | | | | | 9,806 | | | | | | 21,656,719 | | | | | | 9,798 | |
| | | | $9,832,315 | | | | | $ | 74,273,141 | | | | | $ | 9,813,682 | | | | | $ | 47,391,720 | | | | | $ | 9,805,467 | | | | | $ | 21,705,705 | | | | | $ | 9,797,455 | |
| | | | | | | | | | | | | | | | | | | | | | | | | | | | | | | | | | | | | | | | | |
| | | | 1,000 | | | | | | 1,007 | | | | | | 1,000 | | | | | | 1,322 | | | | | | 1,000 | | | | | | 1,000 | | | | | | 1,000 | |
| | | | 995,000 | | | | | | 1,007 | | | | | | 995,000 | | | | | | 1,024 | | | | | | 995,000 | | | | | | 1,000 | | | | | | 995,000 | |
| | | | 1,000 | | | | | | 1,007 | | | | | | 1,000 | | | | | | 1,024 | | | | | | 1,000 | | | | | | 1,000 | | | | | | 1,000 | |
| | | | 1,000 | | | | | | 1,007 | | | | | | 1,000 | | | | | | 1,024 | | | | | | 1,000 | | | | | | 1,000 | | | | | | 1,000 | |
| | | | 1,000 | | | | | | 1,007 | | | | | | 1,000 | | | | | | 1,024 | | | | | | 1,000 | | | | | | 1,000 | | | | | | 1,000 | |
| | | | 1,000 | | | | | | 7,615,752 | | | | | | 1,000 | | | | | | 4,936,947 | | | | | | 1,000 | | | | | | 2,209,136 | | | | | | 1,000 | |
| | | | | | | | | | | | | | | | | | | | | | | | | | | | | | | | | | | | | | | | | |
| | | | $9.82 | | | | | | $9.74 | | | | | | $9.81 | | | | | | $9.58 | | | | | | $9.80 | | | | | | $9.80 | | | | | | $9.79 | |
| | | | 9.83 | | | | | | 9.75 | | | | | | 9.81 | | | | | | 9.58 | | | | | | 9.81 | | | | | | 9.80 | | | | | | 9.80 | |
| | | | 9.82 | | | | | | 9.74 | | | | | | 9.80 | | | | | | 9.58 | | | | | | 9.80 | | | | | | 9.79 | | | | | | 9.79 | |
| | | | 9.83 | | | | | | 9.75 | | | | | | 9.81 | | | | | | 9.58 | | | | | | 9.80 | | | | | | 9.80 | | | | | | 9.79 | |
| | | | 9.82 | | | | | | 9.74 | | | | | | 9.80 | | | | | | 9.57 | | | | | | 9.79 | | | | | | 9.79 | | | | | | 9.79 | |
| | | | 9.83 | | | | | | 9.75 | | | | | | 9.81 | | | | | | 9.59 | | | | | | 9.81 | | | | | | 9.80 | | | | | | 9.80 | |
| | |
| The accompanying notes are an integral part of these financial statements. | | 49 |
GOLDMAN SACHS TARGET DATE PORTFOLIOS
Statements of Operations
For the Fiscal Year Ended October 31, 2016
| | | | | | |
| | | | | Target Date 2020
Portfolio | |
| | Investment income: | | | | |
| | Dividends | | $ | 1,133,681 | |
| | Interest | | | 2,967 | |
| | Total investment income | | | 1,136,648 | |
| | | | | | |
| | Expenses: | | | | |
| | Management fees | | | 159,742 | |
| | Registration fees | | | 103,913 | |
| | Professional fees | | | 98,339 | |
| | Printing and mailing costs | | | 26,841 | |
| | Trustee fees | | | 10,142 | |
| | Custody, accounting and administrative services | | | 8,073 | |
| | Transfer Agency fees(b) | | | 2,172 | |
| | Distribution and Service fees(b) | | | 25 | |
| | Organization Costs | | | — | |
| | Amortization of offering costs | | | — | |
| | Other | | | 4,243 | |
| | Total expenses | | | 413,490 | |
| | Less — expense reductions | | | (246,152 | ) |
| | Net expenses | | | 167,338 | |
| | NET INVESTMENT INCOME | | | 969,310 | |
| | | | | | |
| | Realized and unrealized gain (loss): | | | | |
| | Capital gain distributions from Underlying Funds | | | 135,945 | |
| | Net realized gain (loss) from investments | | | 2,168,805 | |
| | Net change in unrealized gain (loss) on investments | | | (1,317,333 | ) |
| | Net realized and unrealized gain (loss) | | | 987,417 | |
| | NET INCREASE (DECREASE) IN NET ASSETS RESULTING FROM OPERATIONS | | $ | 1,956,727 | |
| | (a) | | Commenced operations on August 22, 2016. |
| | (b) | | Class specific Distribution and Service and Transfer Agency fees were as follows: |
| | | | | | | | | | | | | | | | | | | | | | | | | | | | | | | | | | | | |
| | | Distribution and Service Fees | | | Transfer Agent Fees | |
Portfolio | | Class A | | | Service | | | Class R | | | Class A | | | Institutional | | | Service | | | Class IR | | | Class R | | | Class R6 | |
Target Date 2020 | | $ | 5 | | | $ | 10 | | | $ | 10 | | | $ | 4 | | | $ | 1 | | | $ | 1 | | | $ | 4 | | | $ | 4 | | | $ | 2,158 | |
Target Date 2025 | | | 5 | | | | 10 | | | | 10 | | | | 4 | | | | 755 | | | | 1 | | | | 4 | | | | 4 | | | | 1 | |
Target Date 2030 | | | 5 | | | | 10 | | | | 10 | | | | 4 | | | | 1 | | | | 1 | | | | 4 | | | | 4 | | | | 3,005 | |
Target Date 2035 | | | 5 | | | | 10 | | | | 10 | | | | 4 | | | | 755 | | | | 1 | | | | 4 | | | | 4 | | | | 1 | |
Target Date 2040 | | | 5 | | | | 10 | | | | 10 | | | | 4 | | | | 1 | | | | 1 | | | | 4 | | | | 4 | | | | 1,978 | |
Target Date 2045 | | | 5 | | | | 10 | | | | 10 | | | | 4 | | | | 755 | | | | 1 | | | | 4 | | | | 4 | | | | 1 | |
Target Date 2050 | | | 5 | | | | 10 | | | | 10 | | | | 4 | | | | 1 | | | | 1 | | | | 4 | | | | 4 | | | | 881 | |
Target Date 2055 | | | 5 | | | | 10 | | | | 10 | | | | 4 | | | | 755 | | | | 1 | | | | 4 | | | | 4 | | | | 1 | |
| | |
| 50 | | The accompanying notes are an integral part of these financial statements. |
GOLDMAN SACHS TARGET DATE PORTFOLIOS
| | | | | | | | | | | | | | | | | | | | | | | | | | | | | | | | | | | | | | | | |
| | | Target Date 2025
Portfolio(a) | | | | | Target Date 2030
Portfolio | | | | | Target Date 2035
Portfolio(a) | | | | | Target Date 2040
Portfolio | | | | | Target Date 2045
Portfolio(a) | | | | | Target Date 2050
Portfolio | | | | | Target Date 2055
Portfolio(a) | |
| | | | | | | | | | | | | | | | | | | | | | | | | | | | | | | | | | | | | | | | |
| | $ | 33,312 | | | | | $ | 1,694,381 | | | | | $ | 33,763 | | | | | $ | 1,134,608 | | | | | $ | 33,575 | | | | | $ | 512,196 | | | | | $ | 33,456 | |
| | | — | | | | | | 4,079 | | | | | | — | | | | | | 2,660 | | | | | | — | | | | | | 1,168 | | | | | | — | |
| | | 33,312 | | | | | | 1,698,460 | | | | | | 33,763 | | | | | | 1,137,268 | | | | | | 33,575 | | | | | | 513,364 | | | | | | 33,456 | |
| | | | | | | | | | | | | | | | | | | | | | | | | | | | | | | | | | | | | | | | |
| | | | | | | | | | | | | | | | | | | | | | | | | | | | | | | | | | | | | | | | |
| | | 4,744 | | | | | | 226,031 | | | | | | 4,741 | | | | | | 147,269 | | | | | | 4,740 | | | | | | 63,738 | | | | | | 4,740 | |
| | | 4,373 | | | | | | 103,913 | | | | | | 4,373 | | | | | | 103,913 | | | | | | 4,373 | | | | | | 103,913 | | | | | | 4,373 | |
| | | 21,969 | | | | | | 98,339 | | | | | | 21,969 | | | | | | 98,339 | | | | | | 21,969 | | | | | | 98,339 | | | | | | 21,969 | |
| | | 7,500 | | | | | | 26,839 | | | | | | 7,500 | | | | | | 26,839 | | | | | | 7,500 | | | | | | 27,369 | | | | | | 7,500 | |
| | | 9,877 | | | | | | 10,209 | | | | | | 9,877 | | | | | | 10,138 | | | | | | 9,877 | | | | | | 10,057 | | | | | | 9,877 | |
| | | 5,789 | | | | | | 8,124 | | | | | | 5,789 | | | | | | 7,413 | | | | | | 5,789 | | | | | | 5,901 | | | | | | 5,789 | |
| | | 769 | | | | | | 3,019 | | | | | | 769 | | | | | | 1,992 | | | | | | 769 | | | | | | 895 | | | | | | 769 | |
| | | 25 | | | | | | 25 | | | | | | 25 | | | | | | 25 | | | | | | 25 | | | | | | 25 | | | | | | 25 | |
| | | 12,000 | | | | | | — | | | | | | 12,000 | | | | | | — | | | | | | 12,000 | | | | | | — | | | | | | 12,000 | |
| | | 32,282 | | | | | | — | | | | | | 32,282 | | | | | | — | | | | | | 32,282 | | | | | | — | | | | | | 32,281 | |
| | | 750 | | | | | | 4,243 | | | | | | 747 | | | | | | 4,242 | | | | | | 746 | | | | | | 4,242 | | | | | | 747 | |
| | | 100,078 | | | | | | 480,742 | | | | | | 100,072 | | | | | | 400,170 | | | | | | 100,070 | | | | | | 314,479 | | | | | | 100,070 | |
| | | (93,591 | ) | | | | | (244,151 | ) | | | | | (93,592 | ) | | | | | (245,937 | ) | | | | | (93,592 | ) | | | | | (247,616 | ) | | | | | (93,591 | ) |
| | | 6,487 | | | | | | 236,591 | | | | | | 6,480 | | | | | | 154,233 | | | | | | 6,478 | | | | | | 66,863 | | | | | | 6,479 | |
| | | 26,825 | | | | | | 1,461,869 | | | | | | 27,283 | | | | | | 983,035 | | | | | | 27,097 | | | | | | 446,501 | | | | | | 26,977 | |
| | | | | | | | | | | | | | | | | | | | | | | | | | | | | | | | | | | | | | | | |
| | | | | | | | | | | | | | | | | | | | | | | | | | | | | | | | | | | | | | | | |
| | | — | | | | | | 242,271 | | | | | | — | | | | | | 192,305 | | | | | | — | | | | | | 95,186 | | | | | | — | |
| | | (57,510 | ) | | | | | 2,494,888 | | | | | | (56,337 | ) | | | | | 2,008,437 | | | | | | (57,327 | ) | | | | | 749,735 | | | | | | (64,343 | ) |
| | | (137,001 | ) | | | | | (1,710,529 | ) | | | | | (157,265 | ) | | | | | (1,495,190 | ) | | | | | (164,304 | ) | | | | | (529,507 | ) | | | | | (165,180 | ) |
| | | (194,511 | ) | | | | | 1,026,630 | | | | | | (213,602 | ) | | | | | 705,552 | | | | | | (221,631 | ) | | | | | 315,414 | | | | | | (229,523 | ) |
| | $ | (167,686 | ) | | | | $ | 2,488,499 | | | | | $ | (186,319 | ) | | | | $ | 1,688,587 | | | | | $ | (194,534 | ) | | | | $ | 761,915 | | | | | $ | (202,546 | ) |
| | |
| The accompanying notes are an integral part of these financial statements. | | 51 |
GOLDMAN SACHS TARGET DATE PORTFOLIOS
Statements of Changes in Net Assets
| | | | | | | | | | |
| | | | | Target Date 2020 Portfolio | |
| | | | | For the Fiscal
Year Ended
October 31, 2016 | | | For the Fiscal
Year Ended
October 31, 2015 | |
| | From operations: | | | | | | | | |
| | Net investment income | | $ | 969,310 | | | $ | 872,479 | |
| | Net realized gain (loss) | | | 2,304,750 | | | | 1,693,559 | |
| | Net change in unrealized loss | | | (1,317,333 | ) | | | (984,069 | ) |
| | Net increase (decrease) in net assets resulting from operations | | | 1,956,727 | | | | 1,581,969 | |
| | | | | | | | | | |
| | Distributions to shareholders: | | | | | | | | |
| | From net investment income | | | | | | | | |
| | Class R6 Shares | | | (899,589 | ) | | | (537,568 | ) |
| | From net realized gains | | | | | | | | |
| | Class R6 Shares | | | (1,764,331 | ) | | | (604,745 | ) |
| | Total distributions to shareholders | | | (2,663,920 | ) | | | (1,142,313 | ) |
| | | | | | | | | | |
| | From share transactions: | | | | | | | | |
| | Proceeds from sales of shares | | | 5,445,589 | | | | 1,965,286 | |
| | Reinvestment of distributions | | | 2,663,920 | | | | 1,142,314 | |
| | Cost of shares redeemed | | | (7,300,343 | ) | | | (11,892,996 | ) |
| | Net increase (decrease) in net assets resulting from share transactions | | | 809,166 | | | | (8,785,396 | ) |
| | TOTAL INCREASE (DECREASE) | | | 101,973 | | | | (8,345,740 | ) |
| | | | | | | | | | |
| | Net assets: | | | | | | | | |
| | Beginning of year | | | 53,618,610 | | | | 61,964,350 | |
| | End of year | | $ | 53,720,583 | | | $ | 53,618,610 | |
| | Undistributed net investment income | | $ | 747,818 | | | $ | 624,905 | |
| | (a) | | Commenced operations on August 22, 2016. |
| | |
| 52 | | The accompanying notes are an integral part of these financial statements. |
GOLDMAN SACHS TARGET DATE PORTFOLIOS
| | | | | | | | | | | | | | | | |
| | | Target Date 2025 Portfolio(a) | | | | | Target Date 2030 Portfolio | |
| | | For the Period Ended October 31, 2016 | | | | | For the Fiscal
Year Ended
October 31, 2016 | | | | | For the Fiscal
Year Ended
October 31, 2015 | |
| | | | | | | | | | | | | | | | |
| | $ | 26,825 | | | | | $ | 1,461,869 | | | | | $ | 1,234,059 | |
| | | (57,510 | ) | | | | | 2,737,159 | | | | | | 2,099,659 | |
| | | (137,001 | ) | | | | | (1,710,529 | ) | | | | | (1,065,611 | ) |
| | | (167,686 | ) | | | | | 2,488,499 | | | | | | 2,268,107 | |
| | | | | | | | | | | | | | | | |
| | | | | | | | | | | | | | | | |
| | | | | | | | | | | | | | | | |
| | | — | | | | | | (1,258,551 | ) | | | | | (781,023 | ) |
| | | | | | | | | | | | | | | | |
| | | — | | | | | | (2,672,152 | ) | | | | | (1,632,546 | ) |
| | | — | | | | | | (3,930,703 | ) | | | | | (2,413,569 | ) |
| | | | | | | | | | | | | | | | |
| | | | | | | | | | | | | | | | |
| | | 10,000,066 | | | | | | 2,761,285 | | | | | | 2,827,154 | |
| | | — | | | | | | 3,930,703 | | | | | | 2,413,569 | |
| | | (65 | ) | | | | | (9,983,568 | ) | | | | | (8,940,513 | ) |
| | | 10,000,001 | | | | | | (3,291,580 | ) | | | | | (3,699,790 | ) |
| | | 9,832,315 | | | | | | (4,733,784 | ) | | | | | (3,845,252 | ) |
| | | | | | | | | | | | | | | | |
| | | | | | | | | | | | | | | | |
| | | — | | | | | | 79,006,925 | | | | | | 82,852,177 | |
| | $ | 9,832,315 | | | | | $ | 74,273,141 | | | | | $ | 79,006,925 | |
| | $ | 27,333 | | | | | $ | 1,109,790 | | | | | $ | 815,924 | |
| | |
| The accompanying notes are an integral part of these financial statements. | | 53 |
GOLDMAN SACHS TARGET DATE PORTFOLIOS
Statements of Changes in Net Assets (continued)
| | | | | | |
| | | | | Target Date 2035 Portfolio(a) | |
| | | | | For the Fiscal Year Ended October 31, 2016 | |
| | From operations: | | | | |
| | Net investment income | | $ | 27,283 | |
| | Net realized gain (loss) | | | (56,337 | ) |
| | Net change in unrealized loss | | | (157,265 | ) |
| | Net increase (decrease) in net assets resulting from operations | | | (186,319 | ) |
| | | | | | |
| | Distributions to shareholders: | | | | |
| | From net investment income | | | | |
| | Class R6 Shares | | | — | |
| | From net realized gains | | | | |
| | Class R6 Shares | | | — | |
| | Total distributions to shareholders | | | — | |
| | | | | | |
| | From share transactions: | | | | |
| | Proceeds from sales of shares | | | 10,000,066 | |
| | Reinvestment of distributions | | | — | |
| | Cost of shares redeemed | | | (65 | ) |
| | Net increase (decrease) in net assets resulting from share transactions | | | 10,000,001 | |
| | TOTAL INCREASE (DECREASE) | | | 9,813,682 | |
| | | | | | |
| | Net assets: | | | | |
| | Beginning of year | | | — | |
| | End of year | | $ | 9,813,682 | |
| | Undistributed (distributions in excess of) net investment income (loss) | | $ | 27,791 | |
| | (a) | | Commenced operations on August 22, 2016. |
| | |
| 54 | | The accompanying notes are an integral part of these financial statements. |
GOLDMAN SACHS TARGET DATE PORTFOLIOS
| | | | | | | | | | | | | | | | |
| | | Target Date 2040 Portfolio | | | | | Target Date 2045 Portfolio(a) | |
| | | For the Fiscal Year Ended October 31, 2016 | | | | | For the Fiscal
Year Ended
October 31, 2015 | | | | | For the
Period Ended
October 31, 2016 | |
| | | | | | | | | | | | | | | | |
| | $ | 983,035 | | | | | $ | 839,055 | | | | | $ | 27,097 | |
| | | 2,200,742 | | | | | | 1,997,182 | | | | | | (57,327 | ) |
| | | (1,495,190 | ) | | | | | (1,252,918 | ) | | | | | (164,304 | ) |
| | | 1,688,587 | | | | | | 1,583,319 | | | | | | (194,534 | ) |
| | | | | | | | | | | | | | | | |
| | | | | | | | | | | | | | | | |
| | | | | | | | | | | | | | | | |
| | | (839,070 | ) | | | | | (588,549 | ) | | | | | — | |
| | | | | | | | | | | | | | | | |
| | | (2,209,026 | ) | | | | | (1,513,221 | ) | | | | | — | |
| | | (3,048,096 | ) | | | | | (2,101,770 | ) | | | | | — | |
| | | | | | | | | | | | | | | | |
| | | | | | | | | | | | | | | | |
| | | 1,187,738 | | | | | | 1,322,699 | | | | | | 10,000,066 | |
| | | 3,048,096 | | | | | | 2,101,769 | | | | | | — | |
| | | (5,514,019 | ) | | | | | (11,779,177 | ) | | | | | (65 | ) |
| | | (1,278,185 | ) | | | | | (8,354,709 | ) | | | | | 10,000,001 | |
| | | (2,637,694 | ) | | | | | (8,873,160 | ) | | | | | 9,805,467 | |
| | | | | | | | | | | | | | | | |
| | | | | | | | | | | | | | | | |
| | | 50,029,414 | | | | | | 58,902,574 | | | | | | — | |
| | $ | 47,391,720 | | | | | $ | 50,029,414 | | | | | $ | 9,805,467 | |
| | $ | 738,785 | | | | | $ | 522,865 | | | | | $ | 27,605 | |
| | |
| The accompanying notes are an integral part of these financial statements. | | 55 |
GOLDMAN SACHS TARGET DATE PORTFOLIOS
Statements of Changes in Net Assets (continued)
| | | | | | | | | | |
| | | | | Target Date 2050 Portfolio | |
| | | | | For the Fiscal
Year Ended
October 31, 2016 | | | For the Fiscal
Year Ended
October 31, 2015 | |
| | From operations: | | | | | | | | |
| | Net investment income | | $ | 446,501 | | | $ | 326,330 | |
| | Net realized gain (loss) | | | 844,921 | | | | 416,075 | |
| | Net change in unrealized loss | | | (529,507 | ) | | | (90,904 | ) |
| | Net increase (decrease) in net assets resulting from operations | | | 761,915 | | | | 651,501 | |
| | | | | | | | | | |
| | Distributions to shareholders: | | | | | | | | |
| | From net investment income | | | | | | | | |
| | Class R6 Shares | | | (348,249 | ) | | | (227,101 | ) |
| | From net realized gains | | | | | | | | |
| | Class R6 Shares | | | (629,298 | ) | | | (463,433 | ) |
| | Total distributions to shareholders | | | (977,547 | ) | | | (690,534 | ) |
| | | | | | | | | | |
| | From share transactions: | | | | | | | | |
| | Proceeds from sales of shares | | | 1,728,932 | | | | 2,060,597 | |
| | Reinvestment of distributions | | | 977,547 | | | | 690,534 | |
| | Cost of shares redeemed | | | (1,267,315 | ) | | | (3,495,489 | ) |
| | Net increase (decrease) in net assets resulting from share transactions | | | 1,439,164 | | | | (744,358 | ) |
| | TOTAL INCREASE (DECREASE) | | | 1,223,532 | | | | (783,391 | ) |
| | | | | | | | | | |
| | Net assets: | | | | | | | | |
| | Beginning of year | | | 20,482,173 | | | | 21,265,564 | |
| | End of year | | $ | 21,705,705 | | | $ | 20,482,173 | |
| | Undistributed net investment income | | $ | 333,260 | | | $ | 199,012 | |
| | (a) | | Commenced operations on August 22, 2016. |
| | |
| 56 | | The accompanying notes are an integral part of these financial statements. |
GOLDMAN SACHS TARGET DATE PORTFOLIOS
| | | | | | |
| | Target Date 2055 Portfolio(a) | | | |
| | | For the Period Ended October 31, 2016 | | | |
| | | | | | |
| | $ | 26,977 | | | |
| | | (64,343 | ) | | |
| | | (165,180 | ) | | |
| | | (202,546 | ) | | |
| | | | | | |
| | | | | | |
| | | | | | |
| | | — | | | |
| | | | | | |
| | | — | | | |
| | | — | | | |
| | | | | | |
| | | | | | |
| | | 10,000,066 | | | |
| | | — | | | |
| | | (65 | ) | | |
| | | 10,000,001 | | | |
| | | 9,797,455 | | | |
| | | | | | |
| | | | | | |
| | | — | | | |
| | $ | 9,797,455 | | | |
| | $ | 27,485 | | | |
| | |
| The accompanying notes are an integral part of these financial statements. | | 57 |
GOLDMAN SACHS TARGET DATE 2020 PORTFOLIO
Financial Highlights
Selected Data for a Share Outstanding Throughout Each Year
| | | | | | | | | | | | | | | | | | | | | | | | | | | | | | |
| | | | | | Income (loss) from
Investment Operations | | | Distributions
to shareholders | |
| | | | | Net asset
value,
beginning
of year | | | Net
investment
income(a) | | | Net realized
and unrealized
gain (loss) | | | Total from
investment
operations | | | From net
investment
income | | | From net
realized
gains | | | Total distributions | |
| | FOR THE FISCAL YEARS ENDED OCTOBER 31, | |
| | 2016 - A (Commenced August 22, 2016) | | $ | 10.05 | | | $ | 0.02 | | | $ | (0.17 | ) | | $ | (0.15 | ) | | $ | — | | | $ | — | | | $ | — | |
| | 2016 - Institutional (Commenced August 22, 2016) | | | 10.05 | | | | 0.03 | | | | (0.17 | ) | | | (0.14 | ) | | | — | | | | — | | | | — | |
| | 2016 - Service (Commenced August 22, 2016) | | | 10.05 | | | | 0.02 | | | | (0.17 | ) | | | (0.15 | ) | | | — | | | | — | | | | — | |
| | 2016 - IR (Commenced August 22, 2016) | | | 10.05 | | | | 0.02 | | | | (0.16 | ) | | | (0.14 | ) | | | — | | | | — | | | | — | |
| | 2016 - R (Commenced August 22, 2016) | | | 10.05 | | | | 0.01 | | | | (0.16 | ) | | | (0.15 | ) | | | — | | | | — | | | | — | |
| | 2016 - R6 | | | 10.07 | | | | 0.18 | | | | 0.16 | | | | 0.34 | | | | (0.17 | ) | | | (0.33 | ) | | | (0.50 | ) |
| | 2015 - R6 | | | 10.00 | | | | 0.16 | | | | 0.10 | | | | 0.26 | | | | (0.09 | ) | | | (0.10 | ) | | | (0.19 | ) |
| | | | | | | | | | | | | | | | | | | | | | | | | | | | | | |
| | FOR THE PERIOD ENDED OCTOBER 31, | |
| | 2014 - R6 (Commenced August 29, 2014) | | | 10.00 | | | | 0.03 | | | | (0.03 | ) | | | — | | | | — | | | | — | | | | — | |
| | (a) | | Calculated based on the average shares outstanding methodology. |
| | (b) | | Assumes investment at the net asset value at the beginning of the year, reinvestment of all dividends and distributions, a complete redemption of the investment at the net asset value at the end of the year and no sales or redemption charges. Total returns would be reduced if a sales or redemption charge was taken into account. Returns do not reflect the impact of taxes to shareholders relating to Portfolio distributions or the redemption of Portfolio shares. Total returns for periods less than one full year are not annualized. The Goldman Sachs Target Date 2020 Portfolio’s Predecessor was the Madison Target Retirement 2020 Fund (the “Predecessor Fund”). On August 22, 2016, the Predecessor Fund was reorganized as a new series of the Goldman Sachs Trust II. Performance prior to August 22, 2016 is that of the Predecessor Fund. Total return information of the Predecessor Fund is included in the above table because the Predecessor Fund is considered the accounting survivor of the reorganization. |
| | (d) | | The Portfolio’s portfolio turnover rate is calculated in accordance with regulatory requirements, without regard to transactions involving short term investments. If such transactions were included, the Portfolio’s portfolio turnover rate may be higher. |
| | |
| 58 | | The accompanying notes are an integral part of these financial statements. |
GOLDMAN SACHS TARGET DATE 2020 PORTFOLIO
| | | | | | | | | | | | | | | | | | | | | | | | | | | | | | | | | | | | | | | | |
| | | | | | | | | | | | | |
| | | Net asset
value, end
of year | | | | | Total return(b) | | | | | Net assets,
end of
year (in 000s) | | | | | Ratio of
net expenses
to average
net assets | | | | | Ratio of
total expenses
to average
net assets | | | | | Ratio of
net investment
income to average net assets | | | | | Portfolio
turnover rate(d) | |
| | | | | | | | | | | | | | | | | | | | | | | | | | | | | | | | | | | | | | | | |
| | $ | 9.90 | | | | | | (1.49 | )% | | | | $ | 10 | | | | | | 0.74 | %(c) | | | | | 3.01 | %(c) | | | | | 0.94 | %(c) | | | | | 204 | % |
| | | 9.91 | | | | | | (1.39 | ) | | | | | 10 | | | | | | 0.34 | (c) | | | | | 2.61 | (c) | | | | | 1.34 | (c) | | | | | 204 | |
| | | 9.90 | | | | | | (1.49 | ) | | | | | 10 | | | | | | 0.84 | (c) | | | | | 3.11 | (c) | | | | | 0.84 | (c) | | | | | 204 | |
| | | 9.91 | | | | | | (1.39 | ) | | | | | 10 | | | | | | 0.48 | (c) | | | | | 2.75 | (c) | | | | | 1.19 | (c) | | | | | 204 | |
| | | 9.90 | | | | | | (1.49 | ) | | | | | 10 | | | | | | 0.98 | (c) | | | | | 3.25 | (c) | | | | | 0.69 | (c) | | | | | 204 | |
| | | 9.91 | | | | | | 3.65 | | | | | | 53,671 | | | | | | 0.31 | | | | | | 0.76 | | | | | | 1.79 | | | | | | 204 | |
| | | 10.07 | | | | | | 2.61 | | | | | | 53,619 | | | | | | 0.30 | | | | | | 0.30 | | | | | | 1.46 | | | | | | 207 | |
| | | | | | | | | | | | | | | | | | | | | | | | | | | | | | | | | | | | | | | | |
| | | | | | | | | | | | | | | | | | | | | | | | | | | | | | | | | | | | | | | | |
| | | 10.00 | | | | | | — | | | | | | 61,964 | | | | | | 0.32 | (c) | | | | | 0.32 | (c) | | | | | 1.82 | (c) | | | | | 48 | |
| | |
| The accompanying notes are an integral part of these financial statements. | | 59 |
GOLDMAN SACHS TARGET DATE 2025 PORTFOLIO
Financial Highlights
Selected Data for a Share Outstanding Throughout the Period
| | | | | | | | | | | | | | | | | | |
| | | | | | Income (loss) from
Investment Operations | |
| | | Period - Share Class | | Net asset
value,
beginning
of period | | | Net
investment
income(a) | | | Net realized
and unrealized
gain (loss) | | | Total from
investment
operations | |
| | FOR THE PERIOD ENDED OCTOBER 31, | | | | | | | | | | | | | | | | |
| | 2016 - A (Commenced August 22, 2016) | | $ | 10.00 | | | $ | 0.02 | | | $ | (0.20 | ) | | $ | (0.18 | ) |
| | 2016 - Institutional (Commenced August 22, 2016) | | | 10.00 | | | | 0.03 | | | | (0.20 | ) | | | (0.17 | ) |
| | 2016 - Service (Commenced August 22, 2016) | | | 10.00 | | | | 0.02 | | | | (0.20 | ) | | | (0.18 | ) |
| | 2016 - IR (Commenced August 22, 2016) | | | 10.00 | | | | 0.02 | | | | (0.19 | ) | | | (0.17 | ) |
| | 2016 - R (Commenced August 22, 2016) | | | 10.00 | | | | 0.01 | | | | (0.19 | ) | | | (0.18 | ) |
| | 2016 - R6 (Commenced August 22, 2016) | | | 10.00 | | | | 0.03 | | | | (0.20 | ) | | | (0.17 | ) |
| | (a) | | Calculated based on the average shares outstanding methodology. |
| | (b) | | Assumes investment at the net asset value at the beginning of the year, reinvestment of all dividends and distributions, a complete redemption of the investment at the net asset value at the end of the year and no sales or redemption charges. Total returns would be reduced if a sales or redemption charge was taken into account. Returns do not reflect the impact of taxes to shareholders relating to Portfolio distributions or the redemption of Portfolio shares. Total returns for periods less than one full year are not annualized. |
| | (d) | | The Portfolio’s portfolio turnover rate is calculated in accordance with regulatory requirements, without regard to transactions involving short term investments. If such transactions were included, the Portfolio’s portfolio turnover rate may be higher. |
| | |
| 60 | | The accompanying notes are an integral part of these financial statements. |
GOLDMAN SACHS TARGET DATE 2025 PORTFOLIO
| | | | | | | | | | | | | | | | | | | | | | | | | | | | | | | | | | | | | | | | |
| | | | | | | | | | | | | |
| | | Net asset value, end of period | | | | | Total
return(b) | | | | | Net assets,
end of
period (in 000s) | | | | | Ratio of
net expenses
to average
net assets(c) | | | | | Ratio of
total expenses
to average
net assets(c) | | | | | Ratio of
net investment
income to average net assets(c) | | | | | Portfolio
turnover
rate(d) | |
| | | | | | | | | | | | | | | | | | | | | | | | | | | | | | | | | | | | | | | | |
| | $ | 9.82 | | | | | | (1.70 | )% | | | | $ | 10 | | | | | | 0.75 | % | | | | | 4.23 | % | | | | | 1.01 | % | | | | | 33 | % |
| | | 9.83 | | | | | | (1.70 | ) | | | | | 9,783 | | | | | | 0.34 | | | | | | 3.85 | | | | | | 1.42 | | | | | | 33 | |
| | | 9.82 | | | | | | (1.80 | ) | | | | | 10 | | | | | | 0.84 | | | | | | 4.32 | | | | | | 0.91 | | | | | | 33 | |
| | | 9.83 | | | | | | (1.70 | ) | | | | | 10 | | | | | | 0.49 | | | | | | 3.97 | | | | | | 1.27 | | | | | | 33 | |
| | | 9.82 | | | | | | (1.80 | ) | | | | | 10 | | | | | | 0.99 | | | | | | 4.47 | | | | | | 0.77 | | | | | | 33 | |
| | | 9.83 | | | | | | (1.70 | ) | | | | | 10 | | | | | | 0.33 | | | | | | 3.92 | | | | | | 1.43 | | | | | | 33 | |
| | |
| The accompanying notes are an integral part of these financial statements. | | 61 |
GOLDMAN SACHS TARGET DATE 2030 PORTFOLIO
Financial Highlights
Selected Data for a Share Outstanding Throughout Each Year
| | | | | | | | | | | | | | | | | | | | | | | | | | | | | | |
| | | | | | Income (loss) from
Investment Operations | | | Distributions
to shareholders | |
| | | Year - Share Class | | Net asset
value,
beginning
of year | | | Net
investment
income(a) | | | Net realized
and unrealized
gain (loss) | | | Total from
investment
operations | | | From net
investment
income | | | From net
realized
gains | | | Total
distributions | |
| | FOR THE FISCAL YEARS ENDED OCTOBER 31, | |
| | 2016 - A (Commenced August 22, 2016) | | $ | 9.93 | | | $ | 0.02 | | | $ | (0.21 | ) | | $ | (0.19 | ) | | $ | — | | | $ | — | | | $ | — | |
| | 2016 - Institutional (Commenced August 22, 2016) | | | 9.93 | | | | 0.03 | | | | (0.21 | ) | | | (0.18 | ) | | | — | | | | — | | | | — | |
| | 2016 - Service ( Commenced August 22, 2016) | | | 9.93 | | | | 0.02 | | | | (0.21 | ) | | | (0.19 | ) | | | — | | | | — | | | | — | |
| | 2016 - IR (Commenced August 22, 2016) | | | 9.93 | | | | 0.02 | | | | (0.20 | ) | | | (0.18 | ) | | | — | | | | — | | | | — | |
| | 2016 - R (Commenced August 22, 2016) | | | 9.93 | | | | 0.02 | | | | (0.21 | ) | | | (0.19 | ) | | | — | | | | — | | | | — | |
| | 2016 - R6 | | | 9.97 | | | | 0.19 | | | | 0.11 | | | | 0.30 | | | | (0.17 | ) | | | (0.35 | ) | | | (0.52 | ) |
| | 2015 - R6 | | | 9.99 | | | | 0.15 | | | | 0.12 | | | | 0.27 | | | | (0.09 | ) | | | (0.20 | ) | | | (0.29 | ) |
| | | | | | | | | | | | | | | | | | | | | | | | | | | | | | |
| | FOR THE PERIOD ENDED OCTOBER 31, | |
| | 2014 - R6 (Commenced August 29, 2014) | | | 10.00 | | | | 0.03 | | | | (0.04 | ) | | | (0.01 | ) | | | — | | | | — | | | | — | |
| | (a) | | Calculated based on the average shares outstanding methodology. |
| | (b) | | Assumes investment at the net asset value at the beginning of the year, reinvestment of all dividends and distributions, a complete redemption of the investment at the net asset value at the end of the year and no sales or redemption charges. Total returns would be reduced if a sales or redemption charge was taken into account. Returns do not reflect the impact of taxes to shareholders relating to Portfolio distributions or the redemption of Portfolio shares. Total returns for periods less than one full year are not annualized. The Goldman Sachs Target Date 2030 Portfolio’s Predecessor was the Madison Target Retirement 2030 Fund (the “Predecessor Fund”). On August 22, 2016, the Predecessor Fund was reorganized as a new series of the Goldman Sachs Trust II. Performance prior to August 22, 2016 is that of the Predecessor Fund. Total return information of the Predecessor Fund is included in the above table because the Predecessor Fund is considered the accounting survivor of the reorganization. |
| | (d) | | The Portfolio’s portfolio turnover rate is calculated in accordance with regulatory requirements, without regard to transactions involving short term investments. If such transactions were included, the Portfolio’s portfolio turnover rate may be higher. |
| | |
| 62 | | The accompanying notes are an integral part of these financial statements. |
GOLDMAN SACHS TARGET DATE 2030 PORTFOLIO
| | | | | | | | | | | | | | | | | | | | | | | | | | | | | | | | | | | | | | | | |
| | | | | | | | | | | | | |
| | | Net asset value, end of year | | | | | Total
return(b) | | | | | Net assets,
end of
year (in 000s) | | | | | Ratio of
net expenses
to average
net assets | | | | | Ratio of
total expenses
to average
net assets | | | | | Ratio of
net investment
income to average net assets | | | | | Portfolio
turnover
rate(d) | |
| | | | | | | | | | | | | | | | | | | | | | | | | | | | | | | | | | | | | | | | |
| | $ | 9.74 | | | | | | (1.91 | )% | | | | $ | 10 | | | | | | 0.74 | %(c) | | | | | 2.33 | %(c) | | | | | 1.01 | %(c) | | | | | 176 | % |
| | | 9.75 | | | | | | (1.81 | ) | | | | | 10 | | | | | | 0.34 | (c) | | | | | 1.93 | (c) | | | | | 1.41 | (c) | | | | | 176 | |
| | | 9.74 | | | | | | (1.91 | ) | | | | | 10 | | | | | | 0.83 | (c) | | | | | 2.43 | (c) | | | | | 0.92 | (c) | | | | | 176 | |
| | | 9.75 | | | | | | (1.81 | ) | | | | | 10 | | | | | | 0.48 | (c) | | | | | 2.08 | (c) | | | | | 1.27 | (c) | | | | | 176 | |
| | | 9.74 | | | | | | (1.91 | ) | | | | | 10 | | | | | | 0.98 | (c) | | | | | 2.57 | (c) | | | | | 0.77 | (c) | | | | | 176 | |
| | | 9.75 | | | | | | 3.23 | | | | | | 74,224 | | | | | | 0.31 | | | | | | 0.62 | | | | | | 1.91 | | | | | | 176 | |
| | | 9.97 | | | | | | 2.76 | | | | | | 79,007 | | | | | | 0.30 | | | | | | 0.30 | | | | | | 1.49 | | | | | | 156 | |
| | | | | | | | | | | | | | | | | | | | | | | | | | | | | | | | | | | | | | | | |
| | | | | | | | | | | | | | | | | | | | | | | | | | | | | | | | | | | | | | | | |
| | | 9.99 | | | | | | (0.10 | ) | | | | | 82,852 | | | | | | 0.32 | (c) | | | | | 0.32 | (c) | | | | | 1.87 | (c) | | | | | 44 | |
| | |
| The accompanying notes are an integral part of these financial statements. | | 63 |
GOLDMAN SACHS TARGET DATE 2035 PORTFOLIO
Financial Highlights
Selected Data for a Share Outstanding Throughout the Period
| | | | | | | | | | | | | | | | | | |
| | | | | | | | Income (loss) from
Investment Operations | |
| | | Year - Share Class | | Net asset
value,
beginning
of period | | | Net
investment
income(a) | | | Net realized
and unrealized
gain (loss) | | | Total from
investment
operations | |
| | FOR THE PERIOD ENDED OCTOBER 31, | | | | | | | | | | | | | | | | |
| | 2016 - A (Commenced August 22, 2016) | | $ | 10.00 | | | $ | 0.02 | | | $ | (0.21 | ) | | $ | (0.19 | ) |
| | 2016 - Institutional (Commenced August 22, 2016) | | | 10.00 | | | | 0.03 | | | | (0.22 | ) | | | (0.19 | ) |
| | 2016 - Service (Commenced August 22, 2016) | | | 10.00 | | | | 0.02 | | | | (0.22 | ) | | | (0.20 | ) |
| | 2016 - IR (Commenced August 22, 2016) | | | 10.00 | | | | 0.02 | | | | (0.21 | ) | | | (0.19 | ) |
| | 2016 - R (Commenced August 22, 2016) | | | 10.00 | | | | 0.02 | | | | (0.22 | ) | | | (0.20 | ) |
| | 2016 - R6 (Commenced August 22, 2016) | | | 10.00 | | | | 0.03 | | | | (0.22 | ) | | | (0.19 | ) |
| | (a) | | Calculated based on the average shares outstanding methodology. |
| | (b) | | Assumes investment at the net asset value at the beginning of the year, reinvestment of all dividends and distributions, a complete redemption of the investment at the net asset value at the end of the year and no sales or redemption charges. Total returns would be reduced if a sales or redemption charge was taken into account. Returns do not reflect the impact of taxes to shareholders relating to Portfolio distributions or the redemption of Portfolio shares. Total returns for periods less than one full year are not annualized. |
| | (d) | | The Portfolio’s portfolio turnover rate is calculated in accordance with regulatory requirements, without regard to transactions involving short term investments. If such transactions were included, the Portfolio’s portfolio turnover rate may be higher. |
| | |
| 64 | | The accompanying notes are an integral part of these financial statements. |
GOLDMAN SACHS TARGET DATE 2035 PORTFOLIO
| | | | | | | | | | | | | | | | | | | | | | | | | | | | | | | | | | | | | | | | |
| | | | | | | | | | | | | |
| | | Net asset value, end of period | | | | | Total
return(b) | | | | | Net assets,
end of
period (in 000s) | | | | | Ratio of
net expenses
to average
net assets(c) | | | | | Ratio of
total expenses
to average
net assets(c) | | | | | Ratio of
net investment
income to average net assets(c) | | | | | Portfolio
turnover
rate(d) | |
| | | | | | | | | | | | | | | | | | | | | | | | | | | | | | | | | | | | | | | | |
| | $ | 9.81 | | | | | | (1.90 | )% | | | | $ | 10 | | | | | | 0.75 | % | | | | | 4.23 | % | | | | | 1.03 | % | | | | | 29 | % |
| | | 9.81 | | | | | | (1.90 | ) | | | | | 9,765 | | | | | | 0.34 | | | | | | 3.85 | | | | | | 1.44 | | | | | | 29 | |
| | | 9.80 | | | | | | (2.00 | ) | | | | | 10 | | | | | | 0.84 | | | | | | 4.33 | | | | | | 0.94 | | | | | | 29 | |
| | | 9.81 | | | | | | (1.90 | ) | | | | | 10 | | | | | | 0.49 | | | | | | 3.97 | | | | | | 1.29 | | | | | | 29 | |
| | | 9.80 | | | | | | (2.00 | ) | | | | | 10 | | | | | | 0.99 | | | | | | 4.47 | | | | | | 0.79 | | | | | | 29 | |
| | | 9.81 | | | | | | (1.90 | ) | | | | | 10 | | | | | | 0.32 | | | | | | 3.93 | | | | | | 1.46 | | | | | | 29 | |
| | |
| The accompanying notes are an integral part of these financial statements. | | 65 |
GOLDMAN SACHS TARGET DATE 2040 PORTFOLIO
Financial Highlights
Selected Data for a Share Outstanding Throughout Each Year
| | | | | | | | | | | | | | | | | | | | | | | | | | | | | | |
| | | | | | | | Income (loss) from
Investment Operations | | | Distributions
to shareholders | |
| | | | | Net asset
value,
beginning
of year | | | Net
investment
income(a) | | | Net realized
and unrealized
gain (loss) | | | Total from
investment
operations | | | From net
investment
income | | | From net
realized
gains | | | Total
distributions | |
| | FOR FISCAL YEARS ENDED OCTOBER 31, | |
| | 2016 - A (Commenced August 22, 2016) | | $ | 9.77 | | | $ | 0.02 | | | $ | (0.21 | ) | | $ | (0.19 | ) | | $ | — | | | $ | — | | | $ | — | |
| | 2016 - Institutional (Commenced August 22, 2016) | | | 9.77 | | | | 0.03 | | | | (0.22 | ) | | | (0.19 | ) | | | — | | | | — | | | | — | |
| | 2016 - Service (Commenced August 22, 2016) | | | 9.77 | | | | 0.02 | | | | (0.21 | ) | | | (0.19 | ) | | | — | | | | — | | | | — | |
| | 2016 - IR (Commenced August 22, 2016) | | | 9.77 | | | | 0.02 | | | | (0.21 | ) | | | (0.19 | ) | | | — | | | | — | | | | — | |
| | 2016 - R (Commenced August 22, 2016) | | | 9.77 | | | | 0.01 | | | | (0.21 | ) | | | (0.20 | ) | | | — | | | | — | | | | — | |
| | 2016 - R6 | | | 9.90 | | | | 0.19 | | | | 0.11 | | | | 0.30 | | | | (0.17 | ) | | | (0.44 | ) | | | (0.61 | ) |
| | 2015 - R6 | | | 9.98 | | | | 0.15 | | | | 0.13 | | | | 0.28 | | | | (0.10 | ) | | | (0.26 | ) | | | (0.36 | ) |
| | | | | | | | | | | | | | | | | | | | | | | | | | | | | | |
| | FOR THE PERIOD ENDED OCTOBER 31, | |
| | 2014 - R6 (Commenced August 29, 2014) | | | 10.00 | | | | 0.03 | | | | (0.05 | ) | | | (0.02 | ) | | | — | | | | — | | | | — | |
| | (a) | | Calculated based on the average shares outstanding methodology. |
| | (b) | | Assumes investment at the net asset value at the beginning of the year, reinvestment of all dividends and distributions, a complete redemption of the investment at the net asset value at the end of the year and no sales or redemption charges. Total returns would be reduced if a sales or redemption charge was taken into account. Returns do not reflect the impact of taxes to shareholders relating to Portfolio distributions or the redemption of Portfolio shares. Total returns for periods less than one full year are not annualized. The Goldman Sachs Target Date 2040 Portfolio’s Predecessor was the Madison Target Retirement 2040 Fund (the “Predecessor Fund”). On August 22, 2016, the Predecessor Fund was reorganized as a new series of the Goldman Sachs Trust II. Performance prior to August 22, 2016 is that of the Predecessor Fund. Total return information of the Predecessor Fund is included in the above table because the Predecessor Fund is considered the accounting survivor of the reorganization. |
| | (d) | | The Portfolio’s portfolio turnover rate is calculated in accordance with regulatory requirements, without regard to transactions involving short term investments. If such transactions were included, the Portfolio’s portfolio turnover rate may be higher. |
| | |
| 66 | | The accompanying notes are an integral part of these financial statements. |
GOLDMAN SACHS TARGET DATE 2040 PORTFOLIO
| | | | | | | | | | | | | | | | | | | | | | | | | | | | | | | | | | | | | | | | |
| | | | | | | | | | | | | |
| | | Net asset
value, end
of year | | | | | Total
return(b) | | | | | Net assets,
end of
year (in 000s) | | | | | Ratio of
net expenses
to average
net assets | | | | | Ratio of
total expenses
to average
net assets | | | | | Ratio of
net investment
income to average net assets | | | | | Portfolio
turnover
rate(d) | |
| | | | | | | | | | | | | | | | | | | | | | | | | | | | | | | | | | | | | | | | |
| | $ | 9.58 | | | | | | (1.94 | )% | | | | $ | 13 | | | | | | 0.74 | %(c) | | | | | 3.23 | %(c) | | | | | 0.98 | %(c) | | | | | 174 | % |
| | | 9.58 | | | | | | (1.94 | ) | | | | | 10 | | | | | | 0.34 | (c) | | | | | 2.82 | (c) | | | | | 1.41 | (c) | | | | | 174 | |
| | | 9.58 | | | | | | (1.94 | ) | | | | | 10 | | | | | | 0.83 | (c) | | | | | 3.31 | (c) | | | | | 0.92 | (c) | | | | | 174 | |
| | | 9.58 | | | | | | (1.94 | ) | | | | | 10 | | | | | | 0.48 | (c) | | | | | 2.96 | (c) | | | | | 1.27 | (c) | | | | | 174 | |
| | | 9.57 | | | | | | (2.05 | ) | | | | | 10 | | | | | | 0.98 | (c) | | | | | 3.46 | (c) | | | | | 0.77 | (c) | | | | | 174 | |
| | | 9.59 | | | | | | 3.33 | | | | | | 47,340 | | | | | | 0.31 | | | | | | 0.80 | | | | | | 1.97 | (c) | | | | | 174 | |
| | | 9.90 | | | | | | 2.86 | | | | | | 50,029 | | | | | | 0.30 | | | | | | 0.30 | | | | | | 1.50 | | | | | | 160 | |
| | | | | | | | | | | | | | | | | | | | | | | | | | | | | | | | | | | | | | | | |
| | | | | | | | | | | | | | | | | | | | | | | | | | | | | | | | | | | | | | | | |
| | | 9.98 | | | | | | (0.20 | ) | | | | | 58,903 | | | | | | 0.32 | (c) | | | | | 0.32 | (c) | | | | | 1.84 | (c) | | | | | 46 | |
| | |
| The accompanying notes are an integral part of these financial statements. | | 67 |
GOLDMAN SACHS TARGET DATE 2045 PORTFOLIO
Financial Highlights
Selected Data for a Share Outstanding Throughout the Period
| | | | | | | | | | | | | | | | | | |
| | | | | | | | Income (loss) from
investment operations | |
| | | Period - Share Class | | Net asset
value,
beginning
of period | | | Net
investment
income(a) | | | Net realized
and unrealized
gain (loss) | | | Total from
investment
operations | |
| | FOR THE PERIOD ENDED OCTOBER 31, | | | | | | | | | | | | | | | | |
| | 2016 - A (Commenced August 22, 2016) | | $ | 10.00 | | | $ | 0.02 | | | $ | (0.22 | ) | | $ | (0.20 | ) |
| | 2016 - Institutional (Commenced August 22, 2016) | | | 10.00 | | | | 0.03 | | | | (0.22 | ) | | | (0.19 | ) |
| | 2016 - Service (Commenced August 22, 2016) | | | 10.00 | | | | 0.02 | | | | (0.22 | ) | | | (0.20 | ) |
| | 2016 - IR (Commenced August 22, 2016) | | | 10.00 | | | | 0.02 | | | | (0.22 | ) | | | (0.20 | ) |
| | 2016 - R (Commenced August 22, 2016) | | | 10.00 | | | | 0.01 | | | | (0.22 | ) | | | (0.21 | ) |
| | 2016 - R6 (Commenced August 22, 2016) | | | 10.00 | | | | 0.03 | | | | (0.22 | ) | | | (0.19 | ) |
| | (a) | | Calculated based on the average shares outstanding methodology. |
| | (b) | | Assumes investment at the net asset value at the beginning of the year, reinvestment of all dividends and distributions, a complete redemption of the investment at the net asset value at the end of the year and no sales or redemption charges. Total returns would be reduced if a sales or redemption charge was taken into account. Returns do not reflect the impact of taxes to shareholders relating to Portfolio distributions or the redemption of Portfolio shares. Total returns for periods less than one full year are not annualized. |
| | (d) | | The Portfolio’s portfolio turnover rate is calculated in accordance with regulatory requirements, without regard to transactions involving short term investments. If such transactions were included, the Portfolio’s portfolio turnover rate may be higher. |
| | |
| 68 | | The accompanying notes are an integral part of these financial statements. |
GOLDMAN SACHS TARGET DATE 2045 PORTFOLIO
| | | | | | | | | | | | | | | | | | | | | | | | | | | | | | | | | | | | | | | | |
| | | | | | | | | | | | | |
| | | Net asset value, end of period | | | | | Total return(b) | | | | | Net assets,
end of
period (in 000s) | | | | | Ratio of
net expenses
to average
net assets(c) | | | | | Ratio of
total expenses
to average
net assets(c) | | | | | Ratio of
net investment
income to average net assets(c) | | | | | Portfolio
turnover
rate(d) | |
| | | | | | | | | | | | | | | | | | | | | | | | | | | | | | | | | | | | | | | | |
| | $ | 9.80 | | | | | | (2.00 | )% | | | | $ | 10 | | | | | | 0.75 | % | | | | | 4.23 | % | | | | | 1.02 | % | | | | | 29 | % |
| | | 9.81 | | | | | | (1.90 | ) | | | | | 9,756 | | | | | | 0.34 | | | | | | 3.85 | | | | | | 1.43 | | | | | | 29 | |
| | | 9.80 | | | | | | (2.00 | ) | | | | | 10 | | | | | | 0.84 | | | | | | 4.33 | | | | | | 0.93 | | | | | | 29 | |
| | | 9.80 | | | | | | (2.00 | ) | | | | | 10 | | | | | | 0.49 | | | | | | 3.97 | | | | | | 1.28 | | | | | | 29 | |
| | | 9.79 | | | | | | (2.10 | ) | | | | | 10 | | | | | | 0.99 | | | | | | 4.48 | | | | | | 0.78 | | | | | | 29 | |
| | | 9.81 | | | | | | (2.00 | ) | | | | | 10 | | | | | | 0.32 | | | | | | 3.93 | | | | | | 1.45 | | | | | | 29 | |
| | |
| The accompanying notes are an integral part of these financial statements. | | 69 |
GOLDMAN SACHS TARGET DATE 2050 PORTFOLIO
Financial Highlights
Selected Data for a Share Outstanding Throughout Each Year
| | | | | | | | | | | | | | | | | | | | | | | | | | | | | | |
| | | | | | Income (loss) from
Investment Operations | | | Distributions
to shareholders | |
| | | | | Net asset
value,
beginning
of year | | | Net
investment
income(a) | | | Net realized
and unrealized
gain (loss) | | | Total from
investment
operations | | | From net
investment
income | | | From net
realized
gains | | | Total
distributions | |
| | FOR THE FISCAL YEARS ENDED OCTOBER 31, | |
| | 2016 - A (Commenced August 22, 2016) | | $ | 10.00 | | | $ | 0.02 | | | $ | (0.22 | ) | | $ | (0.20 | ) | | $ | — | | | $ | — | | | $ | — | |
| | 2016 - Institutional (Commenced August 22, 2016) | | | 10.00 | | | | 0.03 | | | | (0.23 | ) | | | (0.20 | ) | | | — | | | | — | | | | — | |
| | 2016 - Service (Commenced August 22, 2016) | | | 10.00 | | | | 0.02 | | | | (0.23 | ) | | | (0.21 | ) | | | — | | | | — | | | | — | |
| | 2016 - IR (Commenced August 22, 2016) | | | 10.00 | | | | 0.02 | | | | (0.22 | ) | | | (0.20 | ) | | | — | | | | — | | | | — | |
| | 2016 - R (Commenced August 22, 2016) | | | 10.00 | | | | 0.02 | | | | (0.23 | ) | | | (0.21 | ) | | | — | | | | — | | | | — | |
| | 2016 - R6 | | | 9.95 | | | | 0.20 | | | | 0.11 | | | | 0.31 | | | | (0.16 | ) | | | (0.30 | ) | | | (0.46 | ) |
| | 2015 - R6 | | | 9.98 | | | | 0.15 | | | | 0.13 | | | | 0.28 | | | | (0.10 | ) | | | (0.21 | ) | | | (0.31 | ) |
| | | | | | | | | | | | | | | | | | | | | | | | | | | | | | |
| | FOR THE PERIOD ENDED OCTOBER 31, | |
| | 2014 - R6 (Commenced August 29, 2014) | | | 10.00 | | | | 0.03 | | | | (0.05 | ) | | | (0.02 | ) | | | — | | | | — | | | | — | |
| | (a) | | Calculated based on the average shares outstanding methodology. |
| | (b) | | Assumes investment at the net asset value at the beginning of the year, reinvestment of all dividends and distributions, a complete redemption of the investment at the net asset value at the end of the year and no sales or redemption charges. Total returns would be reduced if a sales or redemption charge was taken into account. Returns do not reflect the impact of taxes to shareholders relating to Portfolio distributions or the redemption of Portfolio shares. Total returns for periods less than one full year are not annualized. The Goldman Sachs Target Date 2050 Portfolio’s Predecessor was the Madison Target Retirement 2050 Fund (the “Predecessor Fund”). On August 22, 2016, the Predecessor Fund was reorganized as a new series of the Goldman Sachs Trust II. Performance prior to August 22, 2016 is that of the Predecessor Fund. Total return information of the Predecessor Fund is included in the above table because the Predecessor Fund is considered the accounting survivor of the reorganization. |
| | (d) | | The Portfolio’s portfolio turnover rate is calculated in accordance with regulatory requirements, without regard to transactions involving short term investments. If such transactions were included, the Portfolio’s portfolio turnover rate may be higher. |
| | |
| 70 | | The accompanying notes are an integral part of these financial statements. |
GOLDMAN SACHS TARGET DATE 2050 PORTFOLIO
| | | | | | | | | | | | | | | | | | | | | | | | | | | | | | | | | | | | | | | | |
| | | | | | | | | | | | | |
| | | Net asset
value, end
of year | | | | | Total
return(b) | | | | | Net assets,
end of
year
(in 000s) | | | | | Ratio of
net expenses
to average
net assets | | | | | Ratio of
total expenses
to average
net assets | | | | | Ratio of
net investment
income to average net assets | | | | | Portfolio
turnover
rate(d) | |
| | | | | | | | | | | | | | | | | | | | | | | | | | | | | | | | | | | | | | | | |
| | $ | 9.80 | | | | | | (2.00 | )% | | | | $ | 10 | | | | | | 0.74 | %(c) | | | | | 6.30 | %(c) | | | | | 1.04 | %(c) | | | | | 191 | % |
| | | 9.80 | | | | | | (2.00 | ) | | | | | 10 | | | | | | 0.34 | (c) | | | | | 5.90 | (c) | | | | | 1.44 | (c) | | | | | 191 | |
| | | 9.79 | | | | | | (2.10 | ) | | | | | 10 | | | | | | 0.83 | (c) | | | | | 6.40 | (c) | | | | | 0.95 | (c) | | | | | 191 | |
| | | 9.80 | | | | | | (2.00 | ) | | | | | 10 | | | | | | 0.48 | (c) | | | | | 6.04 | (c) | | | | | 1.30 | (c) | | | | | 191 | |
| | | 9.79 | | | | | | (2.10 | ) | | | | | 10 | | | | | | 0.98 | (c) | | | | | 6.54 | (c) | | | | | 0.80 | (c) | | | | | 191 | |
| | | 9.80 | | | | | | 3.37 | | | | | | 21,657 | | | | | | 0.31 | | | | | | 1.45 | | | | | | 2.07 | | | | | | 191 | |
| | | 9.95 | | | | | | 2.87 | | | | | | 20,482 | | | | | | 0.30 | | | | | | 0.30 | | | | | | 1.51 | | | | | | 204 | |
| | | | | | | | | | | | | | | | | | | | | | | | | | | | | | | | | | | | | | | | |
| | | | | | | | | | | | | | | | | | | | | | | | | | | | | | | | | | | | | | | | |
| | | 9.98 | | | | | | (0.20 | ) | | | | | 21,266 | | | | | | 0.32 | (c) | | | | | 0.32 | (c) | | | | | 1.72 | (c) | | | | | 52 | |
| | |
| The accompanying notes are an integral part of these financial statements. | | 71 |
GOLDMAN SACHS TARGET DATE 2055 PORTFOLIO
Financial Highlights
Selected Data for a Share Outstanding Throughout the Period
| | | | | | | | | | | | | | | | | | |
| | | | | | | | Income (loss) from
Investment Operations | |
| | | Year - Share Class | | Net asset
value,
beginning
of period | | | Net
investment
income(a) | | | Net realized
and unrealized
gain (loss) | | | Total from
investment
operations | |
| | FOR THE PERIOD ENDED OCTOBER 31, | | | | | | | | | | | | | | | | |
| | 2016 - A (Commenced August 22, 2016) | | $ | 10.00 | | | $ | 0.02 | | | $ | (0.23 | ) | | $ | (0.21 | ) |
| | 2016 - Institutional (Commenced August 22, 2016) | | | 10.00 | | | | 0.03 | | | | (0.23 | ) | | | (0.20 | ) |
| | 2016 - Service (Commenced August 22, 2016) | | | 10.00 | | | | 0.02 | | | | (0.23 | ) | | | (0.21 | ) |
| | 2016 - IR (Commenced August 22, 2016) | | | 10.00 | | | | 0.02 | | | | (0.23 | ) | | | (0.21 | ) |
| | 2016 - R (Commenced August 22, 2016) | | | 10.00 | | | | 0.01 | | | | (0.22 | ) | | | (0.21 | ) |
| | 2016 - R6 (Commenced August 22, 2016) | | | 10.00 | | | | 0.03 | | | | (0.23 | ) | | | (0.20 | ) |
| | (a) | | Calculated based on the average shares outstanding methodology. |
| | (b) | | Assumes investment at the net asset value at the beginning of the year, reinvestment of all dividends and distributions, a complete redemption of the investment at the net asset value at the end of the year and no sales or redemption charges. Total returns would be reduced if a sales or redemption charge was taken into account. Returns do not reflect the impact of taxes to shareholders relating to Portfolio distributions or the redemption of Portfolio shares. Total returns for periods less than one full year are not annualized. |
| | (d) | | The Portfolio’s portfolio turnover rate is calculated in accordance with regulatory requirements, without regard to transactions involving short term investments. If such transactions were included, the Portfolio’s portfolio turnover rate may be higher. |
| | |
| 72 | | The accompanying notes are an integral part of these financial statements. |
GOLDMAN SACHS TARGET DATE 2055 PORTFOLIO
| | | | | | | | | | | | | | | | | | | | | | | | | | | | | | | | | | | | | | | | |
| | | | | | | | | | | | | |
| | | Net asset
value, end
of period | | | | | Total
return(b) | | | | | Net assets,
end of
period (in 000s) | | | | | Ratio of
net expenses
to average
net assets(c) | | | | | Ratio of
total expenses
to average
net assets(c) | | | | | Ratio of
net investment
income
to average
net assets(c) | | | | | Portfolio turnover rate(d) | |
| | | | | | | | | | | | | | | | | | | | | | | | | | | | | | | | | | | | | | | | |
| | $ | 9.79 | | | | | | (2.10 | )% | | | | $ | 10 | | | | | | 0.75 | % | | | | | 4.23 | % | | | | | 1.02 | % | | | | | 34 | % |
| | | 9.80 | | | | | | (2.00 | ) | | | | | 9,748 | | | | | | 0.34 | | | | | | 3.85 | | | | | | 1.43 | | | | | | 34 | |
| | | 9.79 | | | | | | (2.10 | ) | | | | | 10 | | | | | | 0.84 | | | | | | 4.33 | | | | | | 0.92 | | | | | | 34 | |
| | | 9.79 | | | | | | (2.00 | ) | | | | | 10 | | | | | | 0.49 | | | | | | 3.97 | | | | | | 1.28 | | | | | | 34 | |
| | | 9.79 | | | | | | (2.10 | ) | | | | | 10 | | | | | | 0.99 | | | | | | 4.48 | | | | | | 0.77 | | | | | | 34 | |
| | | 9.80 | | | | | | (2.00 | ) | | | | | 10 | | | | | | 0.32 | | | | | | 3.92 | | | | | | 1.45 | | | | | | 34 | |
| | |
| The accompanying notes are an integral part of these financial statements. | | 73 |
GOLDMAN SACHS TARGET DATE PORTFOLIOS
Notes to Financial Statements
October 31, 2016
Goldman Sachs Trust II (the “Trust”) is a Delaware statutory trust registered under the Investment Company Act of 1940, as amended (the “Act”), as an open-end management investment company. The following table lists those series of the Trust that are included in this report (collectively, the “Portfolios” or individually a “Portfolio”), along with their corresponding share classes and respective diversification status under the Act:
| | | | | | | | |
| Portfolio | | | | Share Classes Offered | | | | Diversified/
Non-diversified |
Target Date 2020 | | | | A*, Institutional*, Service*, IR*, R* and R6 | | | | Diversified |
Target Date 2025* | | | | A, Institutional, Service, IR, R and R6 | | | | Diversified |
Target Date 2030 | | | | A*, Institutional*, Service*, IR*, R* and R6 | | | | Diversified |
Target Date 2035* | | | | A, Institutional, Service, IR, R and R6 | | | | Diversified |
Target Date 2040 | | | | A*, Institutional*, Service*, IR*, R* and R6 | | | | Diversified |
Target Date 2045* | | | | A, Institutional, Service, IR, R and R6 | | | | Diversified |
Target Date 2050 | | | | A*, Institutional*, Service*, IR*, R* and R6 | | | | Diversified |
Target Date 2055* | | | | A, Institutional, Service, IR, R and R6 | | | | Diversified |
| * | | Commenced operations on August 22, 2016. |
Class A Shares are sold with a front-end sales charge of up to 5.50%. Institutional, Service, Class IR, Class R and Class R6 Shares are not subject to a sales charge.
Goldman Sachs Asset Management, L.P. (“GSAM”), an affiliate of Goldman, Sachs & Co. (“Goldman Sachs”), serves as investment adviser to the Portfolios pursuant to a management agreement (the “Agreement”) with the Trust.
Pursuant to an Agreement and Plan of Reorganization (the “Reorganization Agreement”) approved by the Trust’s Board of Trustees, on August 22, 2016, all of the assets and liabilities of the Madison Target Retirement 2020 Fund, the Madison Target Retirement 2030 Fund, the Madison Target Retirement 2040 Fund, and the Madison Target Retirement 2050 Fund (“Predecessor Funds”) were transferred to Goldman Sachs Target Date 2020, Goldman Sachs Target Date 2030, Goldman Sachs Target Date 2040 and Goldman Sachs Target Date 2050 Portfolios (“Reorganized Portfolios”), respectively, in exchange for shares of beneficial interest of the corresponding Reorganized Portfolio on August 22, 2016, as of the close of business on August 19, 2016 (the “Reorganization”). Holders of Class R6 Shares of the Predecessor Funds received Class R6 Shares of the Reorganized Portfolios in an amount equal to the aggregate net asset value of their investment in the Predecessor Funds. The exchange was a tax-free event to shareholders. The Predecessor Funds were the accounting survivors in the Reorganization and as such, the financial statements and financial highlights include the financial information of the Predecessor Funds through August 19, 2016. On August 22, 2016, the Reorganized Portfolios also commenced offering Class A, Institutional, Service, Class IR, and Class R Shares. Subsequent to the Reorganization, Madison Asset Management, LLC, (“Madison” or “Sub Adviser”) serves as the sub-adviser to the Portfolios. GSAM compensates the Sub Adviser directly in accordance with the terms of the Sub-Advisory Agreement. The Portfolios are not charged any separate or additional investment advisory fees by the Sub Adviser.
74
GOLDMAN SACHS TARGET DATE PORTFOLIOS
|
| 2. SIGNIFICANT ACCOUNTING POLICIES |
The financial statements have been prepared in accordance with accounting principles generally accepted in the United States of America (“GAAP”) and require management to make estimates and assumptions that may affect the reported amounts and disclosures. Actual results may differ from those estimates and assumptions.
A. Investment Valuation — The Portfolios’ valuation policy is to value investments at fair value.
B. Investment Income and Investments — Investment income includes interest income, dividend income, net of any foreign withholding taxes, less any amounts reclaimable, and securities lending income. Interest income is accrued daily and adjusted for amortization of premiums and accretion of discounts. Dividend income is recognized on ex-dividend date or, for certain foreign securities, as soon as such information is obtained subsequent to the ex-dividend date. Investment transactions are reflected on trade date. Realized gains and losses are calculated using identified cost. Investment transactions are recorded on the following business day for daily net asset value (“NAV”) calculations. Any foreign capital gains tax is accrued daily based upon net unrealized gains, and is payable upon sale of such investments. Income distributions are recognized as capital gains or income in the financial statements in accordance with the character that is distributed.
C. Class Allocations and Expenses — Investment income, realized and unrealized gain (loss), and non-class specific expenses of each Portfolio are allocated daily based upon the proportion of net assets of each class. Non-class specific expenses directly incurred by a Portfolio are charged to that Portfolio, while such expenses incurred by the Trust are allocated across the Portfolios on a straight-line and/or pro-rata basis depending upon the nature of the expenses. Class specific expenses, where applicable, are borne by the respective share classes and include Distribution and Service, Transfer Agency and Service and Shareholder Administration fees.
Expenses included in the accompanying financial statements reflect the expenses of each Portfolio and do not include any expenses associated with the Underlying Funds (“Underlying Funds”). Because the Underlying Funds have varied expense and fee levels and the Portfolios may own different proportions of the Underlying Funds at different times, the amount of fees and expenses incurred indirectly by each Portfolio will vary.
D. Offering and Organization Costs — Offering costs paid in connection with the initial offering of shares of the Target Date 2025, Target Date 2035, Target Date 2045 and Target Date 2055 Portfolios are being amortized on a straight-line basis over 12 months from the date of commencement of operations. Organization costs paid in connection with the organization of Target Date 2025, Target Date 2035, Target Date 2045 and Target Date 2055 Portfolios were expensed on the first day of operations.
E. Federal Taxes and Distributions to Shareholders — It is each Portfolio’s policy to comply with the requirements of the Internal Revenue Code of 1986, as amended (the “Code”), applicable to regulated investment companies (mutual funds) and to distribute each year substantially all of its investment company taxable income and capital gains to its shareholders. Accordingly, the Portfolios are not required to make any provisions for the payment of federal income tax. Distributions to shareholders are recorded on the ex-dividend date. Income and capital gains distributions, if any, are declared and paid annually.
Net capital losses are carried forward to future fiscal years and may be used to the extent allowed by the Code to offset any future capital gains. Losses that are carried forward will retain their character as either short-term or long-term capital losses. Utilization of capital loss carryforwards will reduce the requirement of future capital gains distributions.
The characterization of distributions to shareholders for financial reporting purposes is determined in accordance with federal income tax rules, which may differ from GAAP. The source of each Portfolio’s distributions may be shown in the accompanying financial statements as either from net investment income, net realized gain or capital. Certain components of the Portfolios’ net assets on the Statements of Assets and Liabilities reflect permanent GAAP/tax differences based on the appropriate tax character.
75
GOLDMAN SACHS TARGET DATE PORTFOLIOS
Notes to Financial Statements (continued)
October 31, 2016
|
| 3. INVESTMENTS AND FAIR VALUE MEASUREMENTS |
The fair value of a financial instrument is the amount that would be received to sell an asset or paid to transfer a liability in an orderly transaction between market participants at the measurement date (i.e., the exit price). GAAP establishes a fair value hierarchy that prioritizes the inputs to valuation techniques used to measure fair value. The hierarchy gives the highest priority to unadjusted quoted prices in active markets for identical assets or liabilities (Level 1 measurements) and the lowest priority to unobservable inputs (Level 3 measurements). The levels used for classifying investments are not necessarily an indication of the risk associated with investing in these investments. The three levels of the fair value hierarchy are described below:
Level 1 — Unadjusted quoted prices in active markets that are accessible at the measurement date for identical, unrestricted assets or liabilities;
Level 2 — Quoted prices in markets that are not active or financial instruments for which significant inputs are observable (including, but not limited to, quoted prices for similar investments, interest rates, foreign exchange rates, volatility and credit spreads), either directly or indirectly;
Level 3 — Prices or valuations that require significant unobservable inputs (including GSAM’s assumptions in determining fair value measurement).
Changes in valuation techniques may result in transfers into or out of an assigned level within the hierarchy. In accordance with the Portfolios’ policy, transfers between different levels of the fair value hierarchy resulting from such changes are deemed to have occurred as of the beginning of the reporting period.
The Board of Trustees (“Trustees”) has approved Valuation Procedures that govern the valuation of the portfolio investments held by the Portfolios, including investments for which market quotations are not readily available. The Trustees have delegated to GSAM day-to-day responsibility for implementing and maintaining internal controls and procedures related to the valuation of the Portfolios’ portfolio investments. To assess the continuing appropriateness of pricing sources and methodologies, GSAM regularly performs price verification procedures and issues challenges as necessary to third party pricing vendors or brokers, and any differences are reviewed in accordance with the Valuation Procedures.
A. Level 1 and Level 2 Fair Value Investments — The valuation techniques and significant inputs used in determining the fair values for investments classified as Level 1 and Level 2 are as follows:
Underlying Funds — Underlying Funds include other investment companies and exchange-traded funds (“ETFs”). Investments in the Underlying Funds (except ETFs) are valued at the NAV per share of the Institutional Share class on the day of valuation. ETFs are valued daily at the last sale price or official closing price on the principal exchange or system on which the investment is traded. Because the Portfolios invest in Underlying Funds that fluctuate in value, the Portfolios’ shares will correspondingly fluctuate in value. To the extent these investments are actively traded, they are classified as Level 1 of the fair value hierarchy, otherwise they are generally classified as Level 2. For information regarding an Underlying Fund’s accounting policies and investment holdings, please see the Underlying Fund’s shareholder report.
B. Level 3 Fair Value Investments — To the extent that significant inputs to valuation models and other alternative pricing sources are unobservable, or if quotations are not readily available, or if GSAM believes that such quotations do not accurately reflect fair value, the fair value of the Portfolios’ investments may be determined under Valuation Procedures approved by the Trustees. GSAM, consistent with its procedures and applicable regulatory guidance, may make an adjustment to the most recent valuation prices of either domestic or foreign securities in light of significant events to reflect what it believes to be the fair value of the securities at the time of determining a Portfolio’s NAV. Significant events which could affect a large number of securities in a particular market may include, but are not limited to: significant fluctuations in U.S. or foreign markets; market dislocations; market disruptions; or unscheduled market closings. Significant events which could also affect a single issuer may include, but are not limited to: corporate actions such as reorganizations, mergers and buy-outs; ratings downgrades; and bankruptcies.
76
GOLDMAN SACHS TARGET DATE PORTFOLIOS
|
| 3. INVESTMENTS AND FAIR VALUE MEASUREMENTS (continued) |
C. Fair Value Hierarchy — The following is a summary of the Portfolios’ investments classified in the fair value hierarchy as of October 31, 2016:
| | | | | | | | | | | | |
| | | |
| TARGET DATE 2020 PORTFOLIO | | | | | | | | | | | | |
| | | |
| Investment Type | | Level 1 | | | Level 2 | | | Level 3 | |
| Assets | | | | | | | | | | | | |
Exchange Traded Funds | | $ | 51,603,797 | | | $ | — | | | $ | — | |
| Total | | $ | 51,603,797 | | | $ | — | | | $ | — | |
| | | |
| TARGET DATE 2025 PORTFOLIO | | | | | | | | | | | | |
| | | |
| Investment Type | | Level 1 | | | Level 2 | | | Level 3 | |
| Assets | | | | | | | | | | | | |
Exchange Traded Funds | | $ | 9,329,628 | | | $ | — | | | $ | — | |
Investment Companies | | | 48,866 | | | | — | | | | — | |
| Total | | $ | 9,378,494 | | | $ | — | | | $ | — | |
| | | |
| TARGET DATE 2030 PORTFOLIO | | | | | | | | | | | | |
| | | |
| Investment Type | | Level 1 | | | Level 2 | | | Level 3 | |
| Assets | | | | | | | | | | | | |
Exchange Traded Funds | | $ | 70,785,414 | | | $ | — | | | $ | — | |
Investment Companies | | | 557,665 | | | | — | | | | — | |
| Total | | $ | 71,343,079 | | | $ | — | | | $ | — | |
| | | |
| TARGET DATE 2035 PORTFOLIO | | | | | | | | | | | | |
| | | |
| Investment Type | | Level 1 | | | Level 2 | | | Level 3 | |
| Assets | | | | | | | | | | | | |
Exchange Traded Funds | | $ | 9,261,562 | | | $ | — | | | $ | — | |
Investment Companies | | | 98,532 | | | | — | | | | — | |
| Total | | $ | 9,360,094 | | | $ | — | | | $ | — | |
77
GOLDMAN SACHS TARGET DATE PORTFOLIOS
Notes to Financial Statements (continued)
October 31, 2016
|
| 3. INVESTMENTS AND FAIR VALUE MEASUREMENTS (continued) |
| | | | | | | | | | | | |
| | | |
| TARGET DATE 2040 PORTFOLIO | | | | | | | | | | | | |
| | | |
| Investment Type | | Level 1 | | | Level 2 | | | Level 3 | |
| Assets | | | | | | | | | | | | |
Exchange Traded Funds | | $ | 44,931,451 | | | $ | — | | | $ | — | |
Investment Companies | | | 593,160 | | | | — | | | | — | |
| Total | | $ | 45,524,611 | | | $ | — | | | $ | — | |
| | | |
| TARGET DATE 2045 PORTFOLIO | | | | | | | | | | | | |
| | | |
| Investment Type | | Level 1 | | | Level 2 | | | Level 3 | |
| Assets | | | | | | | | | | | | |
Exchange Traded Funds | | $ | 9,228,962 | | | $ | — | | | $ | — | |
Investment Companies | | | 122,827 | | | | — | | | | — | |
| Total | | $ | 9,351,789 | | | $ | — | | | $ | — | |
| | | |
| TARGET DATE 2050 PORTFOLIO | | | | | | | | | | | | |
| | | |
| Investment Type | | Level 1 | | | Level 2 | | | Level 3 | |
| Assets | | | | | | | | | | | | |
Exchange Traded Funds | | $ | 20,583,375 | | | $ | — | | | $ | — | |
Investment Companies | | | 271,774 | | | | — | | | | — | |
| Total | | $ | 20,855,149 | | | $ | — | | | $ | — | |
| | | |
| TARGET DATE 2055 PORTFOLIO | | | | | | | | | | | | |
| | | |
| Investment Type | | Level 1 | | | Level 2 | | | Level 3 | |
| Assets | | | | | | | | | | | | |
Exchange Traded Funds | | $ | 9,222,382 | | | $ | — | | | $ | — | |
Investment Companies | | | 121,767 | | | | — | | | | — | |
| Total | | $ | 9,344,149 | | | $ | — | | | $ | — | |
78
GOLDMAN SACHS TARGET DATE PORTFOLIOS
|
| 4. AGREEMENTS AND AFFILIATED TRANSACTIONS |
A. Management Agreement — Under the Agreement, GSAM manages the Portfolios, subject to the general supervision of the Trustees.
As compensation for the services rendered pursuant to the Agreement, the assumption of the expenses related thereto and administration of the Portfolios’ business affairs, including providing facilities, GSAM is entitled to a management fee, accrued daily and paid monthly, equal to an annual percentage rate of each Portfolio’s average daily net assets.
For the period August 22, 2016 through October 31, 2016, the contractual and effective management fees with GSAM were at the following rates for each Portfolio:
| | | | | | |
| Contractual Management Rate | | Effective
Management Fee
Annual Rate |
First $2 billion | | Next $3 billion | | Over $5 billion | |
| 0.25% | | 0.23% | | 0.21% | | 0.25% |
Prior to the Reorganization, Madison served as investment adviser to the Predecessor Funds. The Predecessor Funds paid Madison a fee computed and accrued daily and paid monthly at an annual rate of 0.30% of each Predecessor Fund’s average daily net assets. The 0.30% fee paid to Madison consist of a 0.25% Advisory fee and a 0.05% Administrative Services fee. Under the Administrative Services Agreement, Madison was responsible for paying substantially all of the expenses of the Predecessor Funds.
B. Distribution Plan — Effective August 22, 2016, the Trust, on behalf of each Portfolio, has adopted Distribution Plan (the “Plan”). Under the Plan, Goldman Sachs, which serves as distributor (the “Distributor”), is entitled to a fee accrued daily and paid monthly for distribution services and personal and account maintenance services, which may then be paid by Goldman Sachs to authorized dealers, at the following annual rates calculated on a Portfolio’s average daily net assets of each respective share class:
| | | | | | | | |
| | | Distribution
Rates | |
| | | Class A* | | | Class R* | |
Distribution Plan | | | 0.25 | % | | | 0.50 | % |
| * | | With respect to Class A and Class R Shares, the Distributor at its discretion may use compensation for distribution services paid under the Distribution Plan to compensate service organizations for personal and account maintenance services and expenses as long as such total compensation does not exceed the maximum cap on “service fees” imposed by the Financial Industry Regulatory Authority. |
C. Distribution Agreement — Goldman Sachs, as Distributor of the shares of the Portfolios pursuant to a Distribution Agreement, may retain a portion of the Class A Shares’ front end sales charge. During the fiscal year ended October 31, 2016, Goldman Sachs did not retain any of the Class A Shares’ front end sales charge.
D. Service Plan and Shareholder Administration Plan — Effective August 22, 2016, the Trust, on behalf of each Portfolio that offers Service Shares, has adopted a Service Plan and a Shareholder Administration Plan. These plans allow for service organizations (including Goldman Sachs) to provide varying levels of personal and account maintenance and shareholder administration services to their customers who are beneficial owners of such shares. The Service Plan and Shareholder Administration Plan each provide for compensation to the service organizations which is accrued daily and paid monthly at an annual rate of 0.25% (0.50% in aggregate) of the average daily net assets of the Service Shares.
79
GOLDMAN SACHS TARGET DATE PORTFOLIOS
Notes to Financial Statements (continued)
October 31, 2016
|
| 4. AGREEMENTS AND AFFILIATED TRANSACTIONS (continued) |
E. Transfer Agency Agreement — Effective August 22, 2016, Goldman Sachs also serves as the transfer agent of the Portfolios for a fee pursuant to the Transfer Agency Agreement. The fees charged for such transfer agency services are accrued daily and paid monthly at annual rates as follows: 0.19% of the average daily net assets of Class A, Class IR and Class R Shares; 0.02% of the average daily net assets of Class R6 Shares; and 0.04% of the average daily net assets of Institutional and Service Shares.
F. Other Expense Agreements and Affiliated Transactions — Effective August 22, 2016, GSAM has agreed to limit certain “Other Expenses” of the Portfolios (excluding acquired fund fees and expenses, transfer agency fees and expenses, service fees and shareholder administration fees (as applicable), taxes, interest, brokerage fees, shareholder meeting, litigation, indemnification, and extraordinary expenses) to the extent such expenses exceed, on an annual basis, a percentage rate of the average daily net assets of the Portfolios. Such Other Expense reimbursements, if any, are accrued daily and paid monthly. In addition, the Portfolios are not obligated to reimburse GSAM for prior fiscal year expense reimbursements, if any. The Other Expense limitations as an annual percentage rate of average daily net assets for each Portfolio are 0.05%. These Other Expense limitations will remain in place through at least August 22, 2018, and prior to such dates GSAM may not terminate the arrangements without the approval of the Trustees. In addition, the Portfolios have entered into certain offset arrangements with the transfer agent, which may result in a reduction of the Portfolios’ expenses and are received irrespective of the application of the “Other Expense” limitations described above.
For the fiscal year ended October 31, 2016, these Other Expense reimbursements, were as follows:
| | | | | | |
| Portfolio | | | | Other Expense
Reimbursements | |
Target Date 2020 | | | | $ | 246,152 | |
Target Date 2025 | | | | | 93,591 | |
Target Date 2030 | | | | | 244,151 | |
Target Date 2035 | | | | | 93,592 | |
Target Date 2040 | | | | | 245,937 | |
Target Date 2045 | | | | | 93,592 | |
Target Date 2050 | | | | | 247,616 | |
Target Date 2055 | | | | | 93,591 | |
80
GOLDMAN SACHS TARGET DATE PORTFOLIOS
|
| 4. AGREEMENTS AND AFFILIATED TRANSACTIONS (continued) |
As of October 31, 2016, The Goldman Sachs Group, Inc. was the beneficial owner of 5% or more of total outstanding shares of the following Portfolios:
| | | | | | | | | | | | | | | | | | | | | | | | | | |
| Portfolio | | | | Class A | | | Institutional | | | Service | | | Class IR | | | Class R | | | Class R6 | |
Target Date 2020 | | | | | 100 | % | | | 100 | % | | | 100 | % | | | 100 | % | | | 100 | % | | | — | % |
Target Date 2025 | | | | | 100 | | | | 100 | | | | 100 | | | | 100 | | | | 100 | | | | 100 | |
Target Date 2030 | | | | | 100 | | | | 100 | | | | 100 | | | | 100 | | | | 100 | | | | — | |
Target Date 2035 | | | | | 100 | | | | 100 | | | | 100 | | | | 100 | | | | 100 | | | | 100 | |
Target Date 2040 | | | | | 77 | | | | 100 | | | | 100 | | | | 100 | | | | 100 | | | | — | |
Target Date 2045 | | | | | 100 | | | | 100 | | | | 100 | | | | 100 | | | | 100 | | | | 100 | |
Target Date 2050 | | | | | 100 | | | | 100 | | | | 100 | | | | 100 | | | | 100 | | | | — | |
Target Date 2055 | | | | | 100 | | | | 100 | | | | 100 | | | | 100 | | | | 100 | | | | 100 | |
|
| 5. PORTFOLIO SECURITIES TRANSACTIONS |
The cost of purchases and proceeds from sales and maturities of long-term securities for the fiscal year or period ended October 31, 2016, were as follows:
| | | | | | | | | | |
| Portfolio | | | | Purchases | | | Sales and Maturities | |
Target Date 2020 | | | | $ | 106,243,199 | | | $ | 108,173,665 | |
Target Date 2025 | | | | | 12,653,775 | | | | 3,080,768 | |
Target Date 2030 | | | | | 129,811,621 | | | | 136,915,022 | |
Target Date 2035 | | | | | 12,297,877 | | | | 2,724,181 | |
Target Date 2040 | | | | | 83,613,535 | | | | 87,829,199 | |
Target Date 2045 | | | | | 12,337,079 | | | | 2,763,658 | |
Target Date 2050 | | | | | 40,345,787 | | | | 39,878,356 | |
Target Date 2055 | | | | | 12,753,223 | | | | 3,179,551 | |
81
GOLDMAN SACHS TARGET DATE PORTFOLIOS
Notes to Financial Statements (continued)
October 31, 2016
The tax character of distributions paid during the fiscal year ended October 31, 2016 was as follows:
| | | | | | | | | | | | | | | | |
| | | Target Date
2020 | | | Target Date
2030 | | | Target Date
2040 | | | Target Date
2050 | |
Distribution paid from: | | | | | | | | | | | | | | | | |
Ordinary income | | $ | 1,207,803 | | | $ | 1,551,992 | | | $ | 1,118,464 | | | $ | 469,675 | |
Net long-term capital gains | | | 1,456,117 | | | | 2,378,711 | | | | 1,929,632 | | | | 507,872 | |
Total taxable distributions | | $ | 2,663,920 | | | $ | 3,930,703 | | | $ | 3,048,096 | | | $ | 977,547 | |
The tax character of distributions paid during the fiscal year ended October 31, 2015 was as follows:
| | | | | | | | | | | | | | | | |
| | | Target Date
2020 | | | Target Date
2030 | | | Target Date
2040 | | | Target Date
2050 | |
Distribution paid from: | | | | | | | | | | | | | | | | |
Ordinary income | | $ | 745,004 | | | $ | 939,469 | | | $ | 687,796 | | | $ | 240,391 | |
Net long-term capital gains | | | 397,309 | | | | 1,474,100 | | | | 1,413,974 | | | | 450,143 | |
Total taxable distributions | | $ | 1,142,313 | | | $ | 2,413,569 | | | $ | 2,101,770 | | | $ | 690,534 | |
As of October 31, 2016, the components of accumulated earnings (losses) on a tax basis were as follows:
| | | | | | | | | | | | | | | | | | | | | | | | | | | | | | | | |
| | | Target Date
2020 | | | Target Date
2025 | | | Target Date
2030 | | | Target Date
2035 | | | Target Date
2040 | | | Target Date
2045 | | | Target Date
2050 | | | Target Date
2055 | |
Undistributed ordinary income — net | | $ | 884,799 | | | $ | 27,333 | | | $ | 1,157,215 | | | $ | 27,791 | | | $ | 894,024 | | | $ | 27,605 | | | $ | 419,793 | | | $ | 27,485 | |
Undistributed long-term capital gains | | | 1,887,095 | | | | — | | | | 2,360,025 | | | | — | | | | 1,980,519 | | | | — | | | | 807,554 | | | | — | |
Total undistributed earnings | | $ | 2,771,894 | | | $ | 27,333 | | | $ | 3,517,240 | | | $ | 27,791 | | | $ | 2,874,543 | | | $ | 27,605 | | | $ | 1,227,347 | | | $ | 27,485 | |
Capital loss carryforwards: | | | | | | | | | | | | | | | | | | | | | | | | | | | | | | | | |
Perpetual Short-Term | | | — | | | | (42,018 | ) | | | — | | | | (43,545 | ) | | | — | | | | (42,812 | ) | | | — | | | | (42,112 | ) |
Unrealized gains (losses) — net | | | 2,477,620 | | | | (152,493 | ) | | | 6,062,843 | | | | (170,057 | ) | | | 4,682,048 | | | | (178,819 | ) | | | 1,395,214 | | | | (187,411 | ) |
Total accumulated earnings (losses) net | | $ | 5,249,514 | | | $ | (167,178 | ) | | $ | 9,580,083 | | | $ | (185,811 | ) | | $ | 7,556,591 | | | $ | (194,026 | ) | | $ | 2,622,561 | | | $ | (202,038 | ) |
As of October 31, 2016, the Portfolios’ aggregate security unrealized gains and losses based on cost for U.S. federal income tax purposes were as follows:
| | | | | | | | | | | | | | | | | | | | | | | | | | | | | | | | |
| | | Target Date
2020 | | | Target Date
2025 | | | Target Date
2030 | | | Target Date
2035 | | | Target Date
2040 | | | Target Date
2045 | | | Target Date
2050 | | | Target Date
2055 | |
Tax Cost | | $ | 49,126,177 | | | $ | 9,530,987 | | | $ | 65,280,236 | | | $ | 9,530,151 | | | $ | 40,842,563 | | | $ | 9,530,608 | | | $ | 19,459,935 | | | $ | 9,531,560 | |
Gross unrealized gain | | | 3,063,444 | | | | 18,007 | | | | 7,410,423 | | | | 26,902 | | | | 5,753,559 | | | | 35,488 | | | | 1,938,634 | | | | 39,924 | |
Gross unrealized loss | | | (585,824 | ) | | | (170,500 | ) | | | (1,347,580 | ) | | | (196,959 | ) | | | (1,071,511 | ) | | | (214,307 | ) | | | (543,420 | ) | | | (227,335 | ) |
Net unrealized gains (losses) | | $ | 2,477,620 | | | $ | (152,493 | ) | | $ | 6,062,843 | | | $ | (170,057 | ) | | $ | 4,682,048 | | | $ | (178,819 | ) | | $ | 1,395,214 | | | $ | (187,411 | ) |
82
GOLDMAN SACHS TARGET DATE PORTFOLIOS
|
| 6. TAX INFORMATION (continued) |
The difference between GAAP-basis and tax-basis unrealized gains (losses) is attributable primarily to wash sales.
In order to present certain components of the Portfolios’ capital accounts on a tax-basis, certain reclassifications have been recorded to the Portfolios’ accounts. These reclassifications have no impact on the net asset value of the Portfolios and result primarily from dividend redesignations, certain non-deductible expenses and differences in the tax treatment of underlying fund investments.
| | | | | | | | | | | | | | |
| Portfolio | | | | Paid-in Capital | | | Accumulated Net Realized Gain (Loss) | | | Undistributed Net Investment Income (Loss) | |
Target Date 2020 | | | | $ | — | | | $ | (53,192 | ) | | $ | 53,192 | |
Target Date 2025 | | | | | (508 | ) | | | — | | | | 508 | |
Target Date 2030 | | | | | — | | | | (90,548 | ) | | | 90,548 | |
Target Date 2035 | | | | | (508 | ) | | | — | | | | 508 | |
Target Date 2040 | | | | | — | | | | (71,955 | ) | | | 71,955 | |
Target Date 2045 | | | | | (508 | ) | | | — | | | | 508 | |
Target Date 2050 | | | | | — | | | | (35,996 | ) | | | 35,996 | |
Target Date 2055 | | | | | (508 | ) | | | — | | | | 508 | |
GSAM has reviewed the Portfolios’ tax positions for all open tax years (the current and prior years, as applicable) and has concluded that no provision for income tax is required in the Portfolios’ financial statements. Such open tax years remain subject to examination and adjustment by tax authorities.
The Portfolios’ risks include, but are not limited to, the following:
Investments in Other Investment Companies — As a shareholder of another investment company, including an exchange-traded fund (“ETF”), a Portfolio will indirectly bear its proportionate share of any net management fees and other expenses paid by such other investment companies, in addition to the fees and expenses regularly borne by the Portfolio. ETFs are subject to risks that do not apply to conventional mutual funds, including but not limited to the following: (i) the market price of the ETF’s shares may trade at a premium or a discount to their NAV; and (ii) an active trading market for an ETF’s shares may not develop or be maintained.
The Portfolios may be indirectly exposed to the following risks through their investments in the Underlying Funds. For more information regarding the risks of an Underlying Fund, please see the Underlying Fund’s shareholder report.
Liquidity Risk — The Portfolios may make investments that are illiquid or that may become less liquid in response to market developments or adverse investor perceptions. Illiquid investments may be more difficult to value. Liquidity risk may also refer to the risk that a Portfolio will not be able to pay redemption proceeds within the allowable time period because of unusual market conditions, an unusually high volume of redemption requests, or other reasons. To meet redemption requests, a Portfolio may be forced to sell investments at an unfavorable time and/or under unfavorable conditions.
Market and Credit Risks — In the normal course of business, the Portfolios trade financial instruments and enter into financial transactions where risk of potential loss exists due to changes in the market (market risk). Additionally, the Portfolios may also be exposed to credit risk in the event that an issuer or guarantor fails to perform or that an institution or entity with which the Portfolios have unsettled or open transactions defaults.
83
GOLDMAN SACHS TARGET DATE PORTFOLIOS
Notes to Financial Statements (continued)
October 31, 2016
Under the Trust’s organizational documents, its Trustees, officers, employees and agents are indemnified, to the extent permitted by the Act and state law, against certain liabilities that may arise out of performance of their duties to the Portfolios. Additionally, in the course of business, the Portfolios enter into contracts that contain a variety of indemnification clauses. The Portfolios’ maximum exposure under these arrangements is unknown, as this would involve future claims that may be made against the Portfolios that have not yet occurred. However, GSAM believes the risk of loss under these arrangements to be remote.
At a meeting held on May 4, 2016, the Board of Trustees of the Trust approved the Reorganization Agreement providing for the tax-free acquisition by each Portfolio of the assets of it’s Predecessor Fund. The acquisition was completed on August 22, 2016, as of close of business on August 19, 2016.
Pursuant to the Reorganization Agreement, the assets and liabilities of the Predecessor Funds were transferred in exchange for the Reorganized Portfolios’ Class R6 Shares, which were then redistributed to the Predecessor Funds’ shareholders, in a tax-free exchange as follows:
| | | | | | | | | | | | |
| Predecessor Fund*/The Portfolio | | Exchanged Shares of
Survivor Issued | | | Value of
Exchanged
Shares | | | Acquired
Fund’s Shares
Outstanding as of
August 22, 2016 | |
Madison Target Retirement 2020 Fund, Class R6 / Goldman Sachs Target Date 2020 Portfolio, Class R6 | | | 5,656,518 | | | $ | 56,798,406 | | | | 5,656,518 | |
Madison Target Retirement 2030 Fund, Class R6 / Goldman Sachs Target Date 2030 Portfolio, Class R6 | | | 8,078,424 | | | | 80,128,305 | | | | 8,078,424 | |
Madison Target Retirement 2040 Fund, Class R6 / Goldman Sachs Target Date 2040 Portfolio, Class R6 | | | 5,420,189 | | | | 52,950,565 | | | | 5,420,189 | |
Madison Target Retirement 2050 Fund, Class R6 / Goldman Sachs Target Date 2050 Portfolio, Class R6 | | | 2,327,735 | | | | 23,271,762 | | | | 2,327,735 | |
| * | | Represents the accounting survivor. |
84
GOLDMAN SACHS TARGET DATE PORTFOLIOS
|
| 9. OTHER MATTERS (continued) |
Pursuant to the Reorganization Agreement, the assets and liabilities of the Predecessor Funds’ were transferred in exchange for the Reorganized Portfolios’ Class R6 Shares, in a tax-free exchange as follows:
| | | | | | | | | | | | | | | | |
| Predecessor Fund*/The Portfolio | | The Portfolio’s Aggregate Net Assets before the Reorganization | | | The Predecessor Fund’s Aggregate Net Assets before the Reorganization | | | The Predecessor Fund’s Unrealized Appreciation | | | The Portfolio’s Aggregate Net Assets Immediately after the Reorganization | |
Madison Target Retirement 2020 Fund, Class R6 / Goldman Sachs Target Date 2020 Portfolio, Class R6 | | $ | — | | | $ | 56,798,406 | | | $ | 4,618,169 | | | $ | 56,798,406 | |
Madison Target Retirement 2030 Fund, Class R6 / Goldman Sachs Target Date 2030 Portfolio, Class R6 | | | — | | | | 80,128,305 | | | | 9,430,943 | | | | 80,128,305 | |
Madison Target Retirement 2040 Fund, Class R6 / Goldman Sachs Target Date 2040 Portfolio, Class R6 | | | — | | | | 52,950,565 | | | | 7,610,885 | | | | 52,950,565 | |
Madison Target Retirement 2050 Fund, Class R6 / Goldman Sachs Target Date 2050 Portfolio, Class R6 | | | — | | | | 23,271,762 | | | | 2,717,875 | | | | 23,271,762 | |
| * | | Represents the accounting survivor |
Subsequent events after the Statements of Assets and Liabilities date have been evaluated and GSAM has concluded that there is no impact requiring adjustment or disclosure in the financial statements.
85
GOLDMAN SACHS TARGET DATE PORTFOLIOS
Notes to Financial Statements (continued)
October 31, 2016
|
| 11. SUMMARY OF SHARE TRANSACTIONS |
Share activity is as follows:
| | | | | | | | | | | | | | | | |
| | | Target Date 2020 Portfolio | |
| | | | |
| | | For the Fiscal Year Ended October 31, 2016 | | | For the Fiscal Year Ended October 31, 2015 | |
| | | | |
| | | Shares | | | Dollars | | | Shares | | | Dollars | |
| | | | |
| Class A Shares(a) | | | | | | | | | | | | | | | | |
Shares sold | | | 996 | | | $ | 10,010 | | | | — | | | $ | — | |
Shares redeemed | | | (1 | ) | | | (11 | ) | | | — | | | | — | |
| | | | 995 | | | | 9,999 | | | | — | | | | — | |
| Institutional Shares(a) | | | | | | | | | | | | | | | | |
Shares sold | | | 996 | | | | 10,010 | | | | — | | | | — | |
Shares redeemed | | | (1 | ) | | | (10 | ) | | | — | | | | — | |
| | | | 995 | | | | 10,000 | | | | — | | | | — | |
| Service Shares(a) | | | | | | | | | | | | | | | | |
Shares sold | | | 996 | | | | 10,010 | | | | — | | | | — | |
Shares redeemed | | | (1 | ) | | | (11 | ) | | | — | | | | — | |
| | | | 995 | | | | 9,999 | | | | — | | | | — | |
| Class IR Shares(a) | | | | | | | | | | | | | | | | |
Shares sold | | | 996 | | | | 10,010 | | | | — | | | | — | |
Shares redeemed | | | (1 | ) | | | (11 | ) | | | — | | | | — | |
| | | | 995 | | | | 9,999 | | | | — | | | | — | |
| Class R Shares(a) | | | | | | | | | | | | | | | | |
Shares sold | | | 996 | | | | 10,010 | | | | — | | | | — | |
Shares redeemed | | | (1 | ) | | | (11 | ) | | | — | | | | — | |
| | | | 995 | | | | 9,999 | | | | — | | | | — | |
| Class R6 Shares | | | | | | | | | | | | | | | | |
Shares sold | | | 556,157 | | | | 5,395,539 | | | | 194,179 | | | | 1,965,286 | |
Reinvestment of distributions | | | 282,195 | | | | 2,663,920 | | | | 114,460 | | | | 1,142,314 | |
Shares redeemed | | | (745,292 | ) | | | (7,300,289 | ) | | | (1,184,264 | ) | | | (11,892,996 | ) |
| | | | 93,060 | | | | 759,170 | | | | (875,625 | ) | | | (8,785,396 | ) |
NET INCREASE (DECREASE) | | | 98,035 | | | $ | 809,166 | | | | (875,625 | ) | | $ | (8,785,396 | ) |
| (a) | | Commenced operations on August 22, 2016. |
86
GOLDMAN SACHS TARGET DATE PORTFOLIOS
|
| 11. SUMMARY OF SHARE TRANSACTIONS (continued) |
Share activity is as follows:
| | | | | | | | |
| | | Target Date 2025 Portfolio(a) | |
| | | | |
| | | For the Period Ended October 31, 2016 | |
| | | | |
| | | Shares | | | Dollars | |
| | | | |
| Class A Shares | | | | | | | | |
Shares sold | | | 1,001 | | | $ | 10,011 | |
Shares redeemed | | | (1 | ) | | | (11 | ) |
| | | | 1,000 | | | | 10,000 | |
| Institutional Shares | | | | | | | | |
Shares sold | | | 995,001 | | | | 9,950,011 | |
Shares redeemed | | | (1 | ) | | | (10 | ) |
| | | | 995,000 | | | | 9,950,001 | |
| Service Shares | | | | | | | | |
Shares sold | | | 1,001 | | | | 10,011 | |
Shares redeemed | | | (1 | ) | | | (11 | ) |
| | | | 1,000 | | | | 10,000 | |
| Class IR Shares | | | | | | | | |
Shares sold | | | 1,001 | | | | 10,011 | |
Shares redeemed | | | (1 | ) | | | (11 | ) |
| | | | 1,000 | | | | 10,000 | |
| Class R Shares | | | | | | | | |
Shares sold | | | 1,001 | | | | 10,011 | |
Shares redeemed | | | (1 | ) | | | (11 | ) |
| | | | 1,000 | | | | 10,000 | |
| Class R6 Shares | | | | | | | | |
Shares sold | | | 1,001 | | | | 10,011 | |
Shares redeemed | | | (1 | ) | | | (11 | ) |
| | | | 1,000 | | | | 10,000 | |
NET INCREASE | | | 1,000,000 | | | $ | 10,000,001 | |
| (a) | | Commenced operations on August 22, 2016. |
87
GOLDMAN SACHS TARGET DATE PORTFOLIOS
Notes to Financial Statements (continued)
October 31, 2016
|
| 11. SUMMARY OF SHARE TRANSACTIONS (continued) |
Share activity is as follows:
| | | | | | | | | | | | | | | | |
| | | Target Date 2030 Portfolio | |
| | | | |
| | | For the Fiscal Year Ended
October 31, 2016 | | | For the Fiscal Year Ended
October 31, 2015 | |
| | | | |
| | | Shares | | | Dollars | | | Shares | | | Dollars | |
| | | | |
| Class A Shares(a) | | | | | | | | | | | | | | | | |
Shares sold | | | 1,008 | | | $ | 10,010 | | | | — | | | $ | — | |
Shares redeemed | | | (1 | ) | | | (11 | ) | | | — | | | | — | |
| | | | 1,007 | | | | 9,999 | | | | — | | | | — | |
| Institutional Shares(a) | | | | | | | | | | | | | | | | |
Shares sold | | | 1,008 | | | | 10,010 | | | | — | | | | — | |
Shares redeemed | | | (1 | ) | | | (10 | ) | | | — | | | | — | |
| | | | 1,007 | | | | 10,000 | | | | — | | | | — | |
| Service Shares(a) | | | | | | | | | | | | | | | | |
Shares sold | | | 1,008 | | | | 10,010 | | | | — | | | | — | |
Shares redeemed | | | (1 | ) | | | (11 | ) | | | — | | | | — | |
| | | | 1,007 | | | | 9,999 | | | | — | | | | — | |
| Class IR Shares(a) | | | | | | | | | | | | | | | | |
Shares sold | | | 1,008 | | | | 10,010 | | | | — | | | | — | |
Shares redeemed | | | (1 | ) | | | (11 | ) | | | — | | | | — | |
| | | | 1,007 | | | | 9,999 | | | | — | | | | — | |
| Class R Shares(a) | | | | | | | | | | | | | | | | |
Shares sold | | | 1,008 | | | | 10,010 | | | | — | | | | — | |
Shares redeemed | | | (1 | ) | | | (11 | ) | | | — | | | | — | |
| | | | 1,007 | | | | 9,999 | | | | — | | | | — | |
| Class R6 Shares | | | | | | | | | | | | | | | | |
Shares sold | | | 284,587 | | | | 2,711,235 | | | | 279,805 | | | | 2,827,154 | |
Reinvestment of distributions | | | 422,202 | | | | 3,930,703 | | | | 243,549 | | | | 2,413,569 | |
Shares redeemed | | | (1,015,250 | ) | | | (9,983,514 | ) | | | (894,665 | ) | | | (8,940,513 | ) |
| | | | (308,461 | ) | | | (3,341,576 | ) | | | (371,311 | ) | | | (3,699,790 | ) |
NET DECREASE | | | (303,426 | ) | | $ | (3,291,580 | ) | | | (371,311 | ) | | $ | (3,699,790 | ) |
| (a) | | Commenced operations on August 22, 2016. |
88
GOLDMAN SACHS TARGET DATE PORTFOLIOS
|
| 11. SUMMARY OF SHARE TRANSACTIONS (continued) |
Share activity is as follows:
| | | | | | | | |
| | | Target Date 2035 Portfolio(a) | |
| | | | |
| | | For the Period Ended October 31, 2016 | |
| | | | |
| | | Shares | | | Dollars | |
| | | | |
| Class A Shares | | | | | | | | |
Shares sold | | | 1,001 | | | $ | 10,011 | |
Shares redeemed | | | (1 | ) | | | (11 | ) |
| | | | 1,000 | | | | 10,000 | |
| Institutional Shares | | | | | | | | |
Shares sold | | | 995,001 | | | | 9,950,011 | |
Shares redeemed | | | (1 | ) | | | (10 | ) |
| | | | 995,000 | | | | 9,950,001 | |
| Service Shares | | | | | | | | |
Shares sold | | | 1,001 | | | | 10,011 | |
Shares redeemed | | | (1 | ) | | | (11 | ) |
| | | | 1,000 | | | | 10,000 | |
| Class IR Shares | | | | | | | | |
Shares sold | | | 1,001 | | | | 10,011 | |
Shares redeemed | | | (1 | ) | | | (11 | ) |
| | | | 1,000 | | | | 10,000 | |
| Class R Shares | | | | | | | | |
Shares sold | | | 1,001 | | | | 10,011 | |
Shares redeemed | | | (1 | ) | | | (11 | ) |
| | | | 1,000 | | | | 10,000 | |
| Class R6 Shares | | | | | | | | |
Shares sold | | | 1,001 | | | | 10,011 | |
Shares redeemed | | | (1 | ) | | | (11 | ) |
| | | | 1,000 | | | | 10,000 | |
NET INCREASE | | | 1,000,000 | | | $ | 10,000,001 | |
| (a) | | Commenced operations on August 22, 2016. |
89
GOLDMAN SACHS TARGET DATE PORTFOLIOS
Notes to Financial Statements (continued)
October 31, 2016
|
| 11. SUMMARY OF SHARE TRANSACTIONS (continued) |
Share activity is as follows:
| | | | | | | | | | | | | | | | |
| | | Target Date 2040 Portfolio | |
| | | | |
| | | For the Fiscal Year Ended
October 31, 2016 | | | For the Fiscal Year Ended
October 31, 2015 | |
| | | | |
| | | Shares | | | Dollars | | | Shares | | | Dollars | |
| | | | |
| Class A Shares(a) | | | | | | | | | | | | | | | | |
Shares sold | | | 1,323 | | | $ | 12,879 | | | | — | | | $ | — | |
Shares redeemed | | | (1 | ) | | | (11 | ) | | | — | | | | — | |
| | | | 1,322 | | | | 12,868 | | | | — | | | | — | |
| Institutional Shares(a) | | | | | | | | | | | | | | | | |
Shares sold | | | 1,025 | | | | 10,010 | | | | — | | | | — | |
Shares redeemed | | | (1 | ) | | | (10 | ) | | | — | | | | — | |
| | | | 1,024 | | | | 10,000 | | | | — | | | | — | |
| Service Shares(a) | | | | | | | | | | | | | | | | |
Shares sold | | | 1,025 | | | | 10,010 | | | | — | | | | — | |
Shares redeemed | | | (1 | ) | | | (11 | ) | | | — | | | | — | |
| | | | 1,024 | | | | 9,999 | | | | — | | | | — | |
| Class IR Shares(a) | | | | | | | | | | | | | | | | |
Shares sold | | | 1,025 | | | | 10,010 | | | | — | | | | — | |
Shares redeemed | | | (1 | ) | | | (11 | ) | | | — | | | | — | |
| | | | 1,024 | | | | 9,999 | | | | — | | | | — | |
| Class R Shares(a) | | | | | | | | | | | | | | | | |
Shares sold | | | 1,025 | | | | 10,010 | | | | — | | | | — | |
Shares redeemed | | | (1 | ) | | | (11 | ) | | | — | | | | — | |
| | | | 1,024 | | | | 9,999 | | | | — | | | | — | |
| Class R6 Shares | | | | | | | | | | | | | | | | |
Shares sold | | | 121,810 | | | | 1,134,819 | | | | 132,290 | | | | 1,322,699 | |
Reinvestment of distributions | | | 333,125 | | | | 3,048,096 | | | | 213,378 | | | | 2,101,769 | |
Shares redeemed | | | (572,414 | ) | | | (5,513,965 | ) | | | (1,191,593 | ) | | | (11,779,177 | ) |
| | | | (117,479 | ) | | | (1,331,050 | ) | | | (845,925 | ) | | | (8,354,709 | ) |
NET DECREASE | | | (112,061 | ) | | $ | (1,278,185 | ) | | | (845,925 | ) | | $ | (8,354,709 | ) |
| (a) | | Commenced operations on August 22, 2016. |
90
GOLDMAN SACHS TARGET DATE PORTFOLIOS
|
| 11. SUMMARY OF SHARE TRANSACTIONS (continued) |
Share activity is as follows:
| | | | | | | | |
| | | Target Date 2045 Portfolio(a) | |
| | | | |
| | | For the Period Ended October 31, 2016 | |
| | | | |
| | | Shares | | | Dollars | |
| | | | |
| Class A Shares | | | | | | | | |
Shares sold | | | 1,001 | | | $ | 10,011 | |
Shares redeemed | | | (1 | ) | | | (11 | ) |
| | | | 1,000 | | | | 10,000 | |
| Institutional Shares | | | | | | | | |
Shares sold | | | 995,001 | | | | 9,950,011 | |
Shares redeemed | | | (1 | ) | | | (10 | ) |
| | | | 995,000 | | | | 9,950,001 | |
| Service Shares | | | | | | | | |
Shares sold | | | 1,001 | | | | 10,011 | |
Shares redeemed | | | (1 | ) | | | (11 | ) |
| | | | 1,000 | | | | 10,000 | |
| Class IR Shares | | | | | | | | |
Shares sold | | | 1,001 | | | | 10,011 | |
Shares redeemed | | | (1 | ) | | | (11 | ) |
| | | | 1,000 | | | | 10,000 | |
| Class R Shares | | | | | | | | |
Shares sold | | | 1,001 | | | | 10,011 | |
Shares redeemed | | | (1 | ) | | | (11 | ) |
| | | | 1,000 | | | | 10,000 | |
| Class R6 Shares | | | | | | | | |
Shares sold | | | 1,001 | | | | 10,011 | |
Shares redeemed | | | (1 | ) | | | (11 | ) |
| | | | 1,000 | | | | 10,000 | |
NET INCREASE | | | 1,000,000 | | | $ | 10,000,001 | |
| (a) | | Commenced operations on August 22, 2016. |
91
GOLDMAN SACHS TARGET DATE PORTFOLIOS
Notes to Financial Statements (continued)
October 31, 2016
|
| 11. SUMMARY OF SHARE TRANSACTIONS (continued) |
Share activity is as follows:
| | | | | | | | | | | | | | | | |
| | | Target Date 2050 Portfolio | |
| | | | |
| | | For the Fiscal Year Ended
October 31, 2016 | | | For the Fiscal Year Ended
October 31, 2015 | |
| | | | |
| | | Shares | | | Dollars | | | Shares | | | Dollars | |
| | | | |
| Class A Shares(a) | | | | | | | | | | | | | | | | |
Shares sold | | | 1,001 | | | $ | 10,010 | | | | — | | | $ | — | |
Shares redeemed | | | (1 | ) | | | (11 | ) | | | — | | | | — | |
| | | | 1,000 | | | | 9,999 | | | | — | | | | — | |
| Institutional Shares(a) | | | | | | | | | | | | | | | | |
Shares sold | | | 1,001 | | | | 10,010 | | | | — | | | | — | |
Shares redeemed | | | (1 | ) | | | (10 | ) | | | — | | | | — | |
| | | | 1,000 | | | | 10,000 | | | | — | | | | — | |
| Service Shares(a) | | | | | | | | | | | | | | | | |
Shares sold | | | 1,001 | | | | 10,010 | | | | — | | | | — | |
Shares redeemed | | | (1 | ) | | | (11 | ) | | | — | | | | — | |
| | | | 1,000 | | | | 9,999 | | | | — | | | | — | |
| Class IR Shares(a) | | | | | | | | | | | | | | | | |
Shares sold | | | 1,001 | | | | 10,010 | | | | — | | | | — | |
Shares redeemed | | | (1 | ) | | | (11 | ) | | | — | | | | — | |
| | | | 1,000 | | | | 9,999 | | | | — | | | | — | |
| Class R Shares(a) | | | | | | | | | | | | | | | | |
Shares sold | | | 1,001 | | | | 10,010 | | | | — | | | | — | |
Shares redeemed | | | (1 | ) | | | (11 | ) | | | — | | | | — | |
| | | | 1,000 | | | | 9,999 | | | | — | | | | — | |
| Class R6 Shares | | | | | | | | | | | | | | | | |
Shares sold | | | 175,129 | | | | 1,678,882 | | | | 204,401 | | | | 2,060,597 | |
Reinvestment of distributions | | | 104,550 | | | | 977,547 | | | | 69,681 | | | | 690,534 | |
Shares redeemed | | | (128,796 | ) | | | (1,267,261 | ) | | | (346,869 | ) | | | (3,495,489 | ) |
| | | | 150,883 | | | | 1,389,168 | | | | (72,787 | ) | | | (744,358 | ) |
NET INCREASE (DECREASE) | | | 155,883 | | | $ | 1,439,164 | | | | (72,787 | ) | | $ | (744,358 | ) |
| (a) | | Commenced operations on August 22, 2016. |
92
GOLDMAN SACHS TARGET DATE PORTFOLIOS
|
| 11. SUMMARY OF SHARE TRANSACTIONS (continued) |
Share activity is as follows:
| | | | | | | | |
| | | Target Date 2055 Portfolio(a) | |
| | | | |
| | | For the Period Ended October 31, 2016 | |
| | | | |
| | | Shares | | | Dollars | |
| | | | |
| Class A Shares | | | | | | | | |
Shares sold | | | 1,001 | | | $ | 10,011 | |
Shares redeemed | | | (1 | ) | | | (11 | ) |
| | | | 1,000 | | | | 10,000 | |
| Institutional Shares | | | | | | | | |
Shares sold | | | 995,001 | | | | 9,950,011 | |
Shares redeemed | | | (1 | ) | | | (10 | ) |
| | | | 995,000 | | | | 9,950,001 | |
| Service Shares | | | | | | | | |
Shares sold | | | 1,001 | | | | 10,011 | |
Shares redeemed | | | (1 | ) | | | (11 | ) |
| | | | 1,000 | | | | 10,000 | |
| Class IR Shares | | | | | | | | |
Shares sold | | | 1,001 | | | | 10,011 | |
Shares redeemed | | | (1 | ) | | | (11 | ) |
| | | | 1,000 | | | | 10,000 | |
| Class R Shares | | | | | | | | |
Shares sold | | | 1,001 | | | | 10,011 | |
Shares redeemed | | | (1 | ) | | | (11 | ) |
| | | | 1,000 | | | | 10,000 | |
| Class R6 Shares | | | | | | | | |
Shares sold | | | 1,001 | | | | 10,011 | |
Shares redeemed | | | (1 | ) | | | (11 | ) |
| | | | 1,000 | | | | 10,000 | |
NET INCREASE | | | 1,000,000 | | | $ | 10,000,001 | |
| (a) | | Commenced operations on August 22, 2016. |
93
Report of Independent Registered Public
Accounting Firm
To the Board of Trustees of Goldman Sachs Trust II and
Shareholders of the Goldman Sachs Target Date Portfolios:
In our opinion, the accompanying statements of assets and liabilities, including the schedules of investments, and the related statements of operations and of changes in net assets and the financial highlights present fairly, in all material respects, the financial position of the Goldman Sachs Target Date 2020 Portfolio, Goldman Sachs Target Date 2025 Portfolio, Goldman Sachs Target Date 2030 Portfolio, Goldman Sachs Target Date 2035 Portfolio, Goldman Sachs Target Date 2040 Portfolio, Goldman Sachs Target Date 2045 Portfolio, Goldman Sachs Target Date 2050 Portfolio, and Goldman Sachs Target Date 2055 Portfolio (collectively the “Portfolios”), portfolios of the Goldman Sachs Trust II, at October 31, 2016, and the results of each of their operations, the changes in each of their net assets and the financial highlights for each of the periods indicated, in conformity with accounting principles generally accepted in the United States of America. These financial statements and financial highlights (hereafter referred to as “financial statements”) are the responsibility of the Portfolios’ management. Our responsibility is to express an opinion on these financial statements based on our audits. We conducted our audits of these financial statements in accordance with the standards of the Public Company Accounting Oversight Board (United States). Those standards require that we plan and perform the audit to obtain reasonable assurance about whether the financial statements are free of material misstatement. An audit includes examining, on a test basis, evidence supporting the amounts and disclosures in the financial statements, assessing the accounting principles used and significant estimates made by management, and evaluating the overall financial statement presentation. We believe that our audits, which included confirmation of securities at October 31, 2016 by correspondence with the custodian, brokers, transfer agent of the underlying funds and the application of alternative auditing procedures where securities purchased confirmations had not been received, provide a reasonable basis for our opinion.
The statements of changes in net assets and the financial highlights for the year or periods ending October 31, 2015 or prior for the Goldman Sachs Target Date 2020 Portfolio, Goldman Sachs Target Date 2030 Portfolio, Goldman Sachs Target Date 2040 Portfolio, and Goldman Sachs Target Date 2050 Portfolio were audited by another independent registered public accounting firm, whose report dated December 18, 2015 expressed an unqualified opinion on those financial statements and financial highlights.
PricewaterhouseCoopers LLP
Boston, Massachusetts
December 23, 2016
94
GOLDMAN SACHS TARGET DATE PORTFOLIOS
Fund Expenses — Period Ended October 31, 2016 (Unaudited)
As a shareholder of Class A, Institutional, Service, Class IR, Class R, and Class R6 Shares of the Portfolios, you incur two types of costs: (1) transaction costs, including sales charges on purchase payments (with respect to Class A Shares), and (2) ongoing costs, including management fees; distribution and/or service (12b-1) fees (with respect to Class A, Service and Class R Shares); and other Portfolio expenses. This Example is intended to help you understand your ongoing costs (in dollars) of investing in Class A, Institutional, Service, Class IR, Class R or Class R6 Shares of the Portfolios and to compare these costs with the ongoing costs of investing in other mutual funds.
The Example is based on an investment of $1,000 invested at the beginning of the period and held for the entire period from May 1, 2016 through October 31, 2016 (for Class R6, which represents a period of 184 Days) and from August 22, 2016 through October 31, 2016 (for Class A, Institutional, Service, Class R and Class IR, which represents a period of 71 Days), in a 366 day year for the Target Date 2020, Target Date 2030, Target Date 2040 and Target Date 2050 Portfolios. The Class A, Institutional, Service, Class R, Class IR and Class R6 Example is based on the period from August 22, 2016 through October 31, 2016 which represents a period of 71 days in a 366 day year for the Target Date 2025, Target Date 2035, Target Date 2045 and Target Date 2055 Portfolios.
Actual Expenses — The first line under each share class in the table below provides information about actual account values and actual expenses. You may use the information in this line, together with the amount you invested, to estimate the expenses that you paid over the period. Simply divide your account value by $1,000 (for example, an $8,600 account value divided by $1,000=8.6), then multiply the result by the number in the first line under the heading entitled “Expenses Paid” to estimate the expenses you paid on your account during this period.
Hypothetical Example for Comparison Purposes — The second line under each share class in the table below provides information about hypothetical account values and hypothetical expenses based on the Portfolios’ actual net expense ratios and an assumed rate of return of 5% per year before expenses, which is not the Portfolios’ actual return. The hypothetical account values and expenses may not be used to estimate the actual ending account balance or expenses you paid for the period. You may use this information to compare the ongoing costs of investing in the Portfolios and other funds. To do so, compare this 5% hypothetical example with the 5% hypothetical examples that appear in the shareholder reports of the other funds.
Please note that the expenses shown in the table are meant to highlight your ongoing costs only and do not reflect any transactional costs, such as sales charges, redemption fees, or exchange fees. Therefore, the second line of the table is useful in comparing ongoing costs only, and will not help you determine the relative total costs of owning different funds. In addition, if these transactional costs were included, your costs would have been higher.
| | | | | | | | | | | | | | | | | | | | | | | | | | | | | | | | | | | | | | | | | | | | | | | | |
| | | Target Date 2020 Portfolio | | | Target Date 2025 Portfolio(a) | | | Target Date 2030 Portfolio | | | Target Date 2035 Portfolio(a) | |
| Share Class | | Beginning Account
Value 5/1/16 | | | Ending Account
Value 10/31/16 | | | Expenses Paid for the 6 months ended
10/31/16* | | | Beginning Account
Value
8/22/16 | | | Ending Account
Value 10/31/16 | | | Expenses Paid for the 6 months ended 10/31/16* | | | Beginning Account
Value 5/1/16 | | | Ending Account
Value 10/31/16 | | | Expenses Paid for the 6 months ended 10/31/16* | | | Beginning Account
Value 8/22/16 | | | Ending Account
Value 10/31/16 | | | Expenses Paid for the 6 months ended 10/31/16* | |
| Class A(a) | | | | | | | | | | | | | | | | | | | | | | | | | | | | | | | | | | | | | | | | | | | | | | | | |
Actual | | $ | 1,000.00 | | | $ | 985.10 | | | $ | 1.42 | | | $ | 1,000.00 | | | $ | 983.00 | | | $ | 1.42 | | | $ | 1,000.00 | | | $ | 980.90 | | | $ | 1.42 | | | $ | 1,000.00 | | | $ | 981.00 | | | $ | 1.42 | |
Hypothetical 5% return | | | 1,000.00 | | | | 1,008.26 | + | | | 1.44 | | | | 1,000.00 | | | | 1,008.13 | + | | | 1.44 | | | | 1,000.00 | | | | 1,008.26 | + | | | 1.44 | | | | 1,000.00 | | | | 1,008.13 | + | | | 1.44 | |
| Institutional(a) | | | | | | | | | | | | | | | | | | | | | | | | | | | | | | | | | | | | | | | | | | | | | | | | |
Actual | | | 1,000.00 | | | | 986.10 | | | | 0.65 | | | | 1,000.00 | | | | 983.00 | | | | 0.64 | | | | 1,000.00 | | | | 981.90 | | | | 0.65 | | | | 1,000.00 | | | | 981.00 | | | | 0.64 | |
Hypothetical 5% return | | | 1,000.00 | | | | 1,009.04 | + | | | 0.66 | | | | 1,000.00 | | | | 1,008.91 | + | | | 0.65 | | | | 1,000.00 | | | | 1,009.04 | + | | | 0.66 | | | | 1,000.00 | | | | 1,008.91 | + | | | 0.65 | |
| Service(a) | | | | | | | | | | | | | | | | | | | | | | | | | | | | | | | | | | | | | | | | | | | | | | | | |
Actual | | | 1,000.00 | | | | 985.10 | | | | 1.62 | | | | 1,000.00 | | | | 982.00 | | | | 1.59 | | | | 1,000.00 | | | | 980.90 | | | | 1.59 | | | | 1,000.00 | | | | 980.00 | | | | 1.59 | |
Hypothetical 5% return | | | 1,000.00 | | | | 1,008.07 | + | | | 1.64 | | | | 1,000.00 | | | | 1,007.96 | + | | | 1.61 | | | | 1,000.00 | | | | 1,008.09 | + | | | 1.62 | | | | 1,000.00 | | | | 1,007.96 | + | | | 1.61 | |
| Class IR(a) | | | | | | | | | | | | | | | | | | | | | | | | | | | | | | | | | | | | | | | | | | | | | | | | |
Actual | | | 1,000.00 | | | | 986.10 | | | | 0.92 | | | | 1,000.00 | | | | 983.00 | | | | 0.93 | | | | 1,000.00 | | | | 981.90 | | | | 0.92 | | | | 1,000.00 | | | | 981.00 | | | | 0.93 | |
Hypothetical 5% return | | | 1,000.00 | | | | 1,008.77 | + | | | 0.94 | | | | 1,000.00 | | | | 1,008.63 | + | | | 0.94 | | | | 1,000.00 | | | | 1,008.77 | + | | | 0.94 | | | | 1,000.00 | | | | 1,008.63 | + | | | 0.94 | |
| Class R(a) | | | | | | | | | | | | | | | | | | | | | | | | | | | | | | | | | | | | | | | | | | | | | | | | |
Actual | | | 1,000.00 | | | | 985.10 | | | | 1.89 | | | | 1,000.00 | | | | 982.00 | | | | 1.88 | | | | 1,000.00 | | | | 980.90 | | | | 1.88 | | | | 1,000.00 | | | | 980.00 | | | | 1.87 | |
Hypothetical 5% return | | | 1,000.00 | | | | 1,007.80 | + | | | 1.91 | | | | 1,000.00 | | | | 1,007.67 | + | | | 1.90 | | | | 1,000.00 | | | | 1,007.80 | + | | | 1.91 | | | | 1,000.00 | | | | 1,007.67 | + | | | 1.90 | |
| Class R6 | | | | | | | | | | | | | | | | | | | | | | | | | | | | | | | | | | | | | | | | | | | | | | | | |
Actual | | | 1,000.00 | | | | 1,021.60 | | | | 1.58 | | | | 1,000.00 | | | | 983.00 | | | | 0.63 | | | | 1,000.00 | | | | 1,024.20 | | | | 1.58 | | | | 1,000.00 | | | | 981.00 | | | | 0.61 | |
Hypothetical 5% return | | | 1,000.00 | | | | 1,023.58 | + | | | 1.58 | | | | 1,000.00 | | | | 1,008.93 | + | | | 0.63 | | | | 1,000.00 | | | | 1,023.58 | + | | | 1.58 | | | | 1,000.00 | | | | 1,008.95 | + | | | 0.61 | |
95
Fund Expenses — Period Ended October 31, 2016 (Unaudited) (continued)
| | | | | | | | | | | | | | | | | | | | | | | | | | | | | | | | | | | | | | | | | | | | | | | | |
| | | Target Date 2040 Portfolio | | | Target Date 2045 Portfolio(a) | | | Target Date 2050 Portfolio | | | Target Date 2055 Portfolio(a) | |
| Share Class | | Beginning Account
Value 5/1/16 | | | Ending Account
Value 10/31/16 | | | Expenses Paid for the 6 months ended 10/31/16* | | | Beginning Account
Value 8/22/16 | | | Ending Account
Value 10/31/16 | | | Expenses Paid for the 6 months ended 10/31/16* | | | Beginning Account
Value 5/1/16 | | | Ending Account
Value 10/31/16 | | | Expenses Paid for the
6 months ended 10/31/16* | | | Beginning Account
Value 8/22/16 | | | Ending Account
Value 10/31/16 | | | Expenses Paid for the 6 months ended 10/31/16* | |
| Class A(a) | | | | | | | | | | | | | | | | | | | | | | | | | | | | | | | | | | | | | | | | | | | | | | | | |
Actual | | $ | 1,000.00 | | | $ | 980.60 | | | $ | 1.42 | | | $ | 1,000.00 | | | $ | 980.00 | | | $ | 1.42 | | | $ | 1,000.00 | | | $ | 980.00 | | | $ | 1.42 | | | $ | 1,000.00 | | | $ | 979.00 | | | $ | 1.42 | |
Hypothetical 5% return | | | 1,000.00 | | | | 1,008.26 | + | | | 1.44 | | | | 1,000.00 | | | | 1,008.13 | + | | | 1.44 | | | | 1,000.00 | | | | 1,008.26 | + | | | 1.44 | | | | 1,000.00 | | | | 1,008.13 | + | | | 1.44 | |
| Institutional(a) | | | | | | | | | | | | | | | | | | | | | | | | | | | | | | | | | | | | | | | | | | | | | | | | |
Actual | | | 1,000.00 | | | | 980.60 | | | | 0.65 | | | | 1,000.00 | | | | 981.00 | | | | 0.64 | | | | 1,000.00 | | | | 980.00 | | | | 0.65 | | | | 1,000.00 | | | | 980.00 | | | | 0.64 | |
Hypothetical 5% return | | | 1,000.00 | | | | 1,009.04 | + | | | 0.66 | | | | 1,000.00 | | | | 1,008.91 | + | | | 0.65 | | | | 1,000.00 | | | | 1,009.04 | + | | | 0.66 | | | | 1,000.00 | | | | 1,008.91 | + | | | 0.65 | |
| Service(a) | | | | | | | | | | | | | | | | | | | | | | | | | | | | | | | | | | | | | | | | | | | | | | | | |
Actual | | | 1,000.00 | | | | 980.60 | | | | 1.59 | | | | 1,000.00 | | | | 980.00 | | | | 1.59 | | | | 1,000.00 | | | | 979.00 | | | | 1.59 | | | | 1,000.00 | | | | 979.00 | | | | 1.59 | |
Hypothetical 5% return | | | 1,000.00 | | | | 1,008.09 | + | | | 1.62 | | | | 1,000.00 | | | | 1,007.96 | + | | | 1.61 | | | | 1,000.00 | | | | 1,008.09 | + | | | 1.62 | | | | 1,000.00 | | | | 1,007.96 | + | | | 1.61 | |
| Class IR(a) | | | | | | | | | | | | | | | | | | | | | | | | | | | | | | | | | | | | | | | | | | | | | | | | |
Actual | | | 1,000.00 | | | | 980.60 | | | | 0.92 | | | | 1,000.00 | | | | 980.00 | | | | 0.93 | | | | 1,000.00 | | | | 980.00 | | | | 0.92 | | | | 1,000.00 | | | | 980.00 | | | | 0.93 | |
Hypothetical 5% return | | | 1,000.00 | | | | 1,008.77 | + | | | 0.94 | | | | 1,000.00 | | | | 1,008.63 | + | | | 0.94 | | | | 1,000.00 | | | | 1,008.77 | + | | | 0.94 | | | | 1,000.00 | | | | 1,008.63 | + | | | 0.94 | |
| Class R(a) | | | | | | | | | | | | | | | | | | | | | | | | | | | | | | | | | | | | | | | | | | | | | | | | |
Actual | | | 1,000.00 | | | | 979.50 | | | | 1.88 | | | | 1,000.00 | | | | 979.00 | | | | 1.87 | | | | 1,000.00 | | | | 979.00 | | | | 1.88 | | | | 1,000.00 | | | | 979.00 | | | | 1.87 | |
Hypothetical 5% return | | | 1,000.00 | | | | 1,007.80 | + | | | 1.91 | | | | 1,000.00 | | | | 1,007.67 | + | | | 1.90 | | | | 1,000.00 | | | | 1,007.80 | + | | | 1.91 | | | | 1,000.00 | | | | 1,007.67 | + | | | 1.90 | |
| Class R6 | | | | | | | | | | | | | | | | | | | | | | | | | | | | | | | | | | | | | | | | | | | | | | | | |
Actual | | | 1,000.00 | | | | 1,027.90 | | | | 1.58 | | | | 1,000.00 | | | | 980.00 | | | | 0.61 | | | | 1,000.00 | | | | 1,030.50 | | | | 1.58 | | | | 1,000.00 | | | | 980.00 | | | | 0.61 | |
Hypothetical 5% return | | | 1,000.00 | | | | 1,023.58 | + | | | 1.58 | | | | 1,000.00 | | | | 1,008.95 | + | | | 0.61 | | | | 1,000.00 | | | | 1,023.58 | + | | | 1.58 | | | | 1,000.00 | | | | 1,008.95 | + | | | 0.61 | |
| * | | Expenses for each share class are calculated using each Portfolio’s annualized net expense ratio for each class, which represents the ongoing expenses as a percentage of net assets for the six months ended October 31, 2016. Expenses are calculated by multiplying the annualized net expense ratio by the average account value for the period; then multiplying the result by the number of days in the most recent fiscal half year; and then dividing that result by the number of days in the fiscal year. The annualized net expense ratios for the period were as follows: |
| | | | | | | | | | | | | | | | | | | | | | | | |
| Portfolio | | Class A(a) | | | Institutional(a) | | | Service(a) | | | Class IR(a) | | | Class R(a) | | | Class R6 | |
Target Date 2020 | | | 0.74 | | | | 0.34 | | | | 0.84 | | | | 0.48 | | | | 0.98 | | | | 0.31 | |
Target Date 2025 | | | 0.75 | | | | 0.34 | | | | 0.84 | | | | 0.49 | | | | 0.99 | | | | 0.33 | (a) |
Target Date 2030 | | | 0.74 | | | | 0.34 | | | | 0.83 | | | | 0.48 | | | | 0.98 | | | | 0.31 | |
Target Date 2035 | | | 0.75 | | | | 0.34 | | | | 0.84 | | | | 0.49 | | | | 0.99 | | | | 0.32 | (a) |
Target Date 2040 | | | 0.74 | | | | 0.34 | | | | 0.83 | | | | 0.48 | | | | 0.98 | | | | 0.31 | |
Target Date 2045 | | | 0.75 | | | | 0.34 | | | | 0.84 | | | | 0.49 | | | | 0.99 | | | | 0.32 | (a) |
Target Date 2050 | | | 0.74 | | | | 0.34 | | | | 0.83 | | | | 0.48 | | | | 0.98 | | | | 0.31 | |
Target Date 2055 | | | 0.75 | | | | 0.34 | | | | 0.84 | | | | 0.49 | | | | 0.99 | | | | 0.32 | (a) |
| + | | Hypothetical expenses are based on each Portfolio’s actual annualized net expense ratios and an assumed rate of return of 5% per year before expenses. |
| (a) | | Commenced operations on August 22, 2016. |
96
GOLDMAN SACHS TARGET DATE PORTFOLIOS
Statement Regarding Basis for Approval of Management Agreement and Sub-Advisory Agreement (Unaudited)
Background
The Goldman Sachs Target Date 2020 Portfolio, Goldman Sachs Target Date 2025 Portfolio, Goldman Sachs Target Date 2030 Portfolio, Goldman Sachs Target Date 2035 Portfolio, Goldman Sachs Target Date 2040 Portfolio, Goldman Sachs Target Date 2045 Portfolio, Goldman Sachs Target Date 2050 Portfolio, and Goldman Sachs Target Date 2055 Portfolio (the “Portfolios”) are newly-organized investment portfolios of Goldman Sachs Trust II (the “Trust”) that commenced investment operations on June 23, 2016. At a meeting held on May 4, 2016 (the “Meeting”) in connection with the Portfolios’ launch, the Trustees, including all of the Trustees present who are not parties to the Portfolios’ investment management agreement or any sub-advisory agreement or “interested persons” (as defined in the Investment Company Act of 1940, as amended) of any party thereto (the “Independent Trustees”), approved (i) the investment management agreement (the “Management Agreement”) between the Trust on behalf of the Portfolios and Goldman Sachs Asset Management, L.P. (the “Investment Adviser”); and (ii) the sub-advisory agreement (the “Sub-Advisory Agreement” and, collectively with the Management Agreement, the “Agreements”) between the Investment Adviser and Madison Asset Management, LLC (the “Sub-Adviser”), each for a term of two years.
In connection with their consideration of the Agreements, the Trustees received written materials and oral presentations on the topics covered, and were advised by their independent legal counsel regarding their responsibilities under applicable law. In evaluating the Agreements, the Trustees relied upon information included in presentations made by the Investment Adviser (and, with respect to the Sub-Advisory Agreement, materials furnished and presentations made by the Sub-Adviser) and other information received at the Meeting and at prior Board meetings.
Management Agreement
At the Meeting, the Trustees reviewed the Management Agreement, including information regarding the terms of the Management Agreement; the nature, extent and quality of the Investment Adviser’s anticipated services; the fees and expenses to be paid by each Portfolio; a comparison of each Portfolio’s proposed management fees and anticipated expenses with those paid by other similar mutual funds; potential benefits to be derived by the Investment Adviser and its affiliates from their relationships with the Portfolios; and potential benefits to be derived by the Portfolios from their relationship with the Investment Adviser and its affiliates.
Nature, Extent, and Quality of the Services Provided Under the Management Agreement
As part of their review, the Trustees considered the nature, extent and quality of the services to be provided to the Portfolios by the Investment Adviser. In this regard, the Trustees considered both the investment advisory services and non-advisory services that would be provided by the Investment Adviser and its affiliates. The Trustees also considered information about the Portfolios’ structure, investment objectives, strategies and other characteristics. The Trustees noted the experience and capabilities of the Investment Adviser’s portfolio management team and other key personnel that would be providing services to the Portfolios.
97
GOLDMAN SACHS TARGET DATE PORTFOLIOS
Statement Regarding Basis for Approval of Management Agreement and Sub-Advisory Agreement (Unaudited) (continued)
The Trustees concluded that the Investment Adviser would be able to commit substantial financial and other resources to the Portfolios. They considered that although the Portfolios were new, certain of the Portfolios were the successors to mutual funds managed by the Sub-Adviser for which prior performance information was available. They also observed that the Investment Adviser had experience managing other sub-advised funds (including other series of the Trust), and has a team dedicated to sub-adviser oversight. The Trustees also reviewed the sub-adviser oversight process that the Investment Adviser had employed and was expected to employ going forward, which included areas such as investment analytics, risk management and compliance.
Costs of Services to be Provided and Profitability
The Trustees considered the contractual terms of the Management Agreement, the fee rates payable by each Portfolio thereunder, and the net amount expected to be retained by the Investment Adviser after payment of sub-advisory fees. In this regard, the Trustees considered information on the services to be rendered by the Investment Adviser to the Portfolios, which include both advisory and administrative services that were directed to the needs and operations of the Portfolios as registered mutual funds. The Trustees also reviewed each Portfolio’s projected total operating expense ratios (both gross and net of expense limitations). They compared each Portfolio’s projected fees and expenses to similar information for comparable mutual funds advised by other, unaffiliated investment management firms (including the predecessor target date funds managed by the Sub-Adviser), as well as the peer group and category medians. The comparisons of each Portfolio’s fee rates and total operating expense ratios were prepared by a third-party provider of mutual fund data. The Trustees believed that the comparisons were useful in evaluating the reasonableness of the management fees and total expenses expected to be paid by each Portfolio.
The Trustees recognized that there was not yet profitability data to evaluate for the Portfolios, but considered the Investment Adviser’s representations that such data would be provided after the Portfolios commenced operations.
Economies of Scale
The Trustees considered the breakpoints in the fee rate payable under the Management Agreement at the following annual percentage rates of the average daily net assets of each Portfolio:
| | | | |
| Average Daily Net Assets | | Management Fee Annual Rate | |
First $2 billion | | | 0.25 | % |
Next $3 billion | | | 0.23 | |
Over $5 billion | | | 0.21 | |
The Trustees noted that the breakpoints were meant to share potential economies of scale, if any, with each Portfolio and its shareholders as assets under management reach those asset levels. The Trustees considered each Portfolio’s projected asset levels and information comparing fee rates charged by the Investment Adviser with fee rates charged to other funds in the peer group, as well as the Investment Adviser’s undertaking to limit certain expenses of each Portfolio that exceed a specified level. The Independent Trustees also considered the relationship between the advisory and sub-advisory fee rate schedules, including the terms of the minimum sub-advisory fee arrangement (described below). Upon reviewing these matters, the Trustees concluded that the fee breakpoints represented a means of assuring that benefits of scalability, if any, would be passed along to shareholders at the specified asset levels.
98
GOLDMAN SACHS TARGET DATE PORTFOLIOS
Statement Regarding Basis for Approval of Management Agreement and Sub-Advisory Agreement (Unaudited) (continued)
Other Benefits to the Investment Adviser and Its Affiliates
The Trustees also considered the other benefits expected to be derived by the Investment Adviser and its affiliates from their relationships with the Portfolios, including: (a) transfer agency fees received by Goldman, Sachs & Co. (“Goldman Sachs”); (b) the Investment Adviser’s ability to leverage the infrastructure designed to service the Portfolios on behalf of the Investment Adviser’s other clients; (c) the Investment Adviser’s ability to cross-market other products and services to Portfolio shareholders; (d) Goldman Sachs’ retention of certain fees as Distributor; (e) the Investment Adviser’s ability to negotiate better pricing with custodians on behalf of its other clients, as a result of the relationship with the Portfolios; and (f) the possibility that the working relationship between the Investment Adviser and the Portfolios’ third party service providers (including the Sub-Adviser) may cause those service providers to be more likely to do business with other areas of Goldman Sachs.
Other Benefits to the Portfolios and Their Shareholders
The Trustees also noted that the Portfolios are expected to receive certain potential benefits as a result of their relationship with the Investment Adviser, including: (a) enhanced servicing from vendors because of the volume of business generated by the Investment Adviser and its affiliates; (b) the Investment Adviser’s ability to hire and retain qualified personnel, along with certain sub-advisers, to provide services to the Portfolios because of the reputation of the Goldman Sachs organization; and (c) the Portfolios’ access to certain affiliated distribution channels.
Conclusion
In connection with their consideration of the Management Agreement, the Trustees gave weight to various factors, but did not identify any particular factor as controlling their decision. After deliberation and consideration of the information provided, including the factors described above, the Trustees concluded, in the exercise of their business judgment, that the investment management fees that would be payable by each Portfolio were reasonable in light of the services to be provided to it by the Investment Adviser, the Investment Adviser’s anticipated costs and each Portfolio’s reasonably anticipated asset levels. The Trustees present concluded that the Management Agreement should be approved for a period of two years.
Sub-Advisory Agreement with Madison Asset Management, LLC
Nature, Extent, and Quality of the Services Provided Under the Sub-Advisory Agreement
The Trustees, including all of the Independent Trustees present, concluded that the Sub-Advisory Agreement between the Investment Adviser and Madison Asset Management, LLC (the “Sub-Adviser”) with respect to the Fund should be approved. In reaching this determination, they relied on the information provided by the Investment Adviser and the Sub-Adviser. In evaluating the nature of the Sub-Adviser’s services, the Trustees considered that the Sub-Adviser currently manages other “target date” mutual funds, which were expected to be reorganized into certain of the Portfolios having corresponding target dates. In evaluating the extent and quality of services to be provided by the Sub-Adviser, the Trustees considered information on the respective services to be provided to the Portfolios by the Investment Adviser and the Sub-Adviser, including information about the Sub-Adviser’s (a) personnel and compensation structure; (b) track record in managing a suite of target date mutual funds; (c) policies and procedures in place to address potential conflicts of interest; and (d) compliance program and code of ethics. In this regard, they considered assessments provided by the Investment Adviser of the Sub-Adviser, the Sub-Adviser’s investment strategies and personnel, and its compliance program.
99
GOLDMAN SACHS TARGET DATE PORTFOLIOS
Statement Regarding Basis for Approval of Management Agreement and Sub-Advisory Agreement (Unaudited) (continued)
Costs of Services to be Provided
The Trustees reviewed the terms of the Sub-Advisory Agreement and the proposed fee schedule, including breakpoints, as well as the Investment Adviser’s agreement to pay the Sub-Adviser a minimum sub-advisory fee with respect to the Sub-Adviser’s first three years of service. They noted that the compensation paid to the Sub-Adviser would be paid by the Investment Adviser, not by the Portfolios. They also noted that the terms of the Sub-Advisory Agreement were the result of arms’ length negotiations between the Investment Adviser and the Sub-Adviser. The Trustees considered the amount of the management fee expected to be retained by the Investment Adviser.
Conclusion
In connection with their consideration of the Sub-Advisory Agreement at the Meeting, the Trustees gave weight to various factors, but did not identify any particular factor as controlling their decision. After deliberation and consideration of the information provided, including the factors described above, the Trustees present concluded that the Sub-Advisory Agreement should be approved.
100
GOLDMAN SACHS TARGET DATE PORTFOLIOS
Trustees and Officers (Unaudited)
Independent Trustees
| | | | | | | | | | |
Name,
Address and Age1 | | Position(s) Held with the Trust | | Term of Office and
Length of
Time Served2 | | Principal Occupation(s) During Past 5 Years | | Number of
Portfolios in
Fund Complex
Overseen by
Trustee3 | | Other Directorships Held by Trustee4 |
Ashok N. Bakhru Age: 74 | | Chairman of the Board of Trustees | | Since 2012 | | Mr. Bakhru is retired. He was formerly Director, Apollo Investment Corporation (a business development company) (2008-2013); President, ABN Associates (a management and financial consulting firm) (1994-1996 and 1998-2012); Trustee, Scholarship America (1998-2005); Trustee, Institute for Higher Education Policy (2003-2008); Director, Private Equity Investors — III and IV (1998-2007), and Equity-Linked Investors II (April 2002-2007). Chairman of the Board of Trustees — Goldman Sachs Trust II; Goldman Sachs Trust; Goldman Sachs Variable Insurance Trust; Goldman Sachs BDC, Inc.; Goldman Sachs Private Middle Market Credit LLC; Goldman Sachs MLP Income Opportunities Fund; Goldman Sachs MLP and Energy Renaissance Fund; and Goldman Sachs ETF Trust. | | 142 | | None |
Cheryl K. Beebe Age: 60 | | Trustee | | Since 2015 | | Ms. Beebe is retired. She is Director, Convergys Corporation (2015-Present); Director, Packaging Corporation of America (2008-Present); and was formerly Executive Vice President, (2010-2014); and Chief Financial Officer, Ingredion, Inc. (a global corn refining and manufacturing company) (2004-2014). Trustee — Goldman Sachs Trust II. | | 17 | | Convergys Corporation (a customer management company); Packaging Corporation of America (producer of container board) |
John P. Coblentz, Jr. Age: 75 | | Trustee | | Since 2012 | | Mr. Coblentz is retired. Formerly, he was Partner, Deloitte & Touche LLP (a professional services firm) (1975-2003); Director, Emerging Markets Group, Ltd. (a consulting company) (2004-2006); and Director, Elderhostel, Inc. (a not-for profit organization) (2006-2012). Previously, Mr. Coblentz served as Trustee of Goldman Sachs Trust and Goldman Sachs Variable Insurance Trust (2003-2015). Trustee — Goldman Sachs Trust II; Goldman Sachs BDC, Inc.; Goldman Sachs Private Middle Market Credit LLC; Goldman Sachs MLP Income Opportunities Fund; Goldman Sachs MLP and Energy Renaissance Fund; and Goldman Sachs ETF Trust. | | 36 | | None |
Lawrence Hughes Age: 58 | | Trustee | | Since 2016 | | Mr. Hughes is retired. Formerly, he held senior management positions with BNY Mellon Wealth Management, a division of The Bank of New York Mellon Corporation (a financial services company) (1991-2015), most recently as Chief Executive Officer (2010-2015). He serves as Chairman of the Board of Directors, Ellis Memorial and Eldredge House (a not-for-profit organization) (2012-Present). Previously, Mr. Hughes served as an Advisory Board Member of Goldman Sachs Trust II (February 2016-April 2016). Trustee — Goldman Sachs Trust II. | | 17 | | None |
John F. Killian Age: 61 | | Trustee | | Since 2015 | | Mr. Killian is retired. He is Director, Consolidated Edison, Inc. (2007-Present); Director, Houghton Mifflin Harcourt Publishing Company (2011-Present); and formerly held senior management positions with Verizon Communications, Inc., including Executive Vice President and Chief Financial Officer (2009-2010); and President, Verizon Business, Verizon Communications, Inc. (2005-2009). Trustee — Goldman Sachs Trust II. | | 17 | | Consolidated Edison, Inc. (a utility holding company); Houghton Mifflin Harcourt Publishing Company |
| | | | | | | | | | |
101
GOLDMAN SACHS TARGET DATE PORTFOLIOS
Trustees and Officers (Unaudited) (continued)
Independent Trustees (continued)
| | | | | | | | | | |
Name,
Address and Age1 | | Position(s) Held with the Trust | | Term of Office and
Length of
Time Served2 | | Principal Occupation(s) During Past 5 Years | | Number of
Portfolios in
Fund Complex
Overseen by
Trustee3 | | Other Directorships Held by Trustee4 |
Richard P. Strubel Age: 77 | | Trustee | | Since 2012 | | Mr. Strubel is retired. Formerly, he served as Chairman of the Board of Trustees, Northern Funds (a family of retail and institutional mutual funds managed by Northern Trust Investments, Inc.) (2008-2014) and Trustee (1982-2014); Director, Cardean Learning Group (provider of educational services via the internet) (2003-2008); and Director, Gildan Activewear Inc. (a clothing marketing and manufacturing company) (2000-2014). He serves as Trustee Emeritus, The University of Chicago (1987-Present). Previously, Mr. Strubel served as Trustee of Goldman Sachs Trust (1987-2015) and Goldman Sachs Variable Insurance Trust (1997-2015). Trustee — Goldman Sachs Trust II; Goldman Sachs BDC, Inc.; Goldman Sachs Private Middle Market Credit LLC; Goldman Sachs MLP Income Opportunities Fund; Goldman Sachs MLP and Energy Renaissance Fund; and Goldman Sachs ETF Trust. | | 36 | | None |
Westley V. Thompson Age: 61 | | Trustee | | Since 2016 | | Mr. Thompson is retired. Formerly, he was President, Sun Life Financial, Inc. (a financial services company) (2008-2014); and held senior management positions at various insurance companies including affiliates of Lincoln National Corporation (1998-2008), Cigna Corporation (1994-1997), and Aetna, Inc. (1979-1994). Previously, Mr. Thompson served as an Advisory Board Member of Goldman Sachs Trust II (February 2016-April 2016). Trustee — Goldman Sachs Trust II. | | 17 | | None |
| | | | | | | | | | |
102
GOLDMAN SACHS TARGET DATE PORTFOLIOS
Trustees and Officers (Unaudited) (continued)
Interested Trustee*
| | | | | | | | | | |
Name,
Address and Age1 | | Position(s) Held with the Trust | | Term of Office and
Length of
Time Served2 | | Principal Occupation(s) During Past 5 Years | | Number of
Portfolios in
Fund Complex
Overseen by
Trustee3 | | Other Directorships Held by Trustee4 |
James A. McNamara Age: 54 | | President and Trustee | | Since 2012 | | Managing Director, Goldman Sachs (December 1998-Present); Director of Institutional Fund Sales, GSAM (April 1998-December 2000); and Senior Vice President and Manager, Dreyfus Institutional Service Corporation (January 1993- April 1998). President and Trustee — Goldman Sachs Trust II; Goldman Sachs Trust; Goldman Sachs Variable Insurance Trust; Goldman Sachs MLP Income Opportunities Fund; Goldman Sachs MLP and Energy Renaissance Fund; and Goldman Sachs ETF Trust. | | 140 | | None |
| | | | | | | | | | |
| * | | Mr. McNamara is considered to be an “Interested Trustee” because he holds a position with Goldman Sachs and owns securities issued by The Goldman Sachs Group, Inc. He holds comparable positions with certain other companies of which Goldman Sachs, GSAM or an affiliate thereof is the investment adviser, administrator and/or distributor. |
| 1 | | Each Trustee may be contacted by writing to the Trustee, c/o Goldman Sachs, 200 West Street, New York, New York, 10282, Attn: Caroline Kraus. Information is provided as of October 31, 2016. |
| 2 | | Subject to such policies as may be adopted by the Board from time-to-time, each Trustee holds office for an indefinite term, until the earliest of: (a) the election of his or her successor; (b) the date the Trustee resigns or is removed by the Board or shareholders, in accordance with the Trust’s Declaration of Trust; or (c) the termination of the Trust. The Board has adopted policies which provide that (a) no Trustee shall hold office for more than 15 years and (b) a Trustee shall retire as of December 31st of the calendar year in which he or she reaches his or her 74th birthday, unless a waiver of such requirement shall have been adopted by a majority of the other Trustees. These policies may be changed by the Trustees without shareholder vote. |
| 3 | | The Goldman Sachs Fund Complex includes certain other companies listed above for each respective Trustee. As of October 31, 2016, Goldman Sachs Trust II consisted of 17 portfolios (15 of which offered shares to the public); Goldman Sachs Trust consisted of 92 portfolios (91 of which offered shares to the public); Goldman Sachs Variable Insurance Trust consisted of 14 portfolios; Goldman Sachs BDC, Inc., Goldman Sachs Private Middle Market Credit LLC, Goldman Sachs MLP Income Opportunities Fund, and Goldman Sachs MLP and Energy Renaissance Fund each consisted of one portfolio; and Goldman Sachs ETF Trust consisted of 15 portfolios (eight of which offered shares to the public). Goldman Sachs Private Middle Market Credit LLC does not offer shares to the public. |
| 4 | | This column includes only directorships of companies required to report to the Securities and Exchange Commission under the Securities Exchange Act of 1934 (i.e., “public companies”) or other investment companies registered under the Act. |
Additional information about the Trustees is available in the Portfolios’ Statement of Additional Information, which can be obtained from Goldman Sachs free of charge by calling this toll-free number (in the United States of America): 1-800-526-7384.
103
GOLDMAN SACHS TARGET DATE PORTFOLIOS
Trustees and Officers (Unaudited) (continued)
Officers of the Trust*
| | | | | | |
Name, Address and Age1 | | Position(s) Held with the Trust | | Term of
Office and
Length of
Time Served2 | | Principal Occupation(s) During Past 5 Years |
James A. McNamara 200 West Street New York, NY 10282 Age: 54 | | President and Trustee | | Since 2012 | | Managing Director, Goldman Sachs (December 1998-Present); Director of Institutional Fund Sales, GSAM (April 1998-December 2000); and Senior Vice President and Manager, Dreyfus Institutional Service Corporation (January 1993-April 1998). President and Trustee — Goldman Sachs Trust II; Goldman Sachs Trust; Goldman Sachs Variable Insurance Trust; Goldman Sachs MLP Income Opportunities Fund; Goldman Sachs MLP and Energy Renaissance Fund; and Goldman Sachs ETF Trust. |
Caroline L. Kraus 200 West Street New York, NY 10282 Age: 39 | | Secretary | | Since 2012 | | Managing Director, Goldman Sachs (January 2016-Present); Vice President, Goldman Sachs (August 2006-December 2015); Associate General Counsel, Goldman Sachs (2012-Present); Assistant General Counsel, Goldman Sachs (August 2006-December 2011); and Associate, Weil, Gotshal & Manges, LLP (2002-2006). Secretary — Goldman Sachs Trust II; Goldman Sachs Trust (previously Assistant Secretary (2012)); Goldman Sachs Variable Insurance Trust (previously Assistant Secretary (2012)); Goldman Sachs BDC, Inc.; Goldman Sachs Private Middle Market Credit LLC; Goldman Sachs Middle Market Lending LLC; Goldman Sachs MLP Income Opportunities Fund; Goldman Sachs MLP and Energy Renaissance Fund; and Goldman Sachs ETF Trust. |
Scott M. McHugh 200 West Street New York, NY 10282 Age: 45 | | Treasurer, Senior Vice President and Principal Financial Officer | | Since 2012 (Principal Financial Officer since 2013) | | Managing Director, Goldman Sachs (January 2016-Present); Vice President, Goldman Sachs (February 2007-December 2015); Assistant Treasurer of certain mutual funds administered by DWS Scudder (2005-2007); and Director (2005-2007), Vice President (2000-2005), and Assistant Vice President (1998-2000), Deutsche Asset Management or its predecessor (1998-2007). Treasurer, Senior Vice President and Principal Financial Officer — Goldman Sachs Trust II; Goldman Sachs Trust; Goldman Sachs Variable Insurance Trust; Goldman Sachs MLP Income Opportunities Fund; Goldman Sachs MLP and Energy Renaissance Fund; and Goldman Sachs ETF Trust. |
| | | | | | |
| * | | Represents a partial list of officers of the Trust. Additional information about all the officers is available in the Portfolios’ Statement of Additional Information, which can be obtained from Goldman Sachs free of charge by calling this toll-free number (in the United States): 1-800-526-7384. |
| 1 | | Information is provided as of October 31, 2016. |
| 2 | | Officers hold office at the pleasure of the Board of Trustees or until their successors are duly elected and qualified. Each officer holds comparable positions with certain other companies of which Goldman Sachs, GSAM or an affiliate thereof is the investment adviser, administrator and/or distributor. |
Goldman Sachs Trust II — Goldman Sachs Target Date Portfolios — Tax Information (Unaudited)
For the fiscal year ended October, 2016, 18.05%, 32.53%, 31.68% and 32.58% of the dividends paid from net investment company taxable income by the Target Date 2020, Target Date 2030, Target Date 2040 and Target Date 2050 Portfolios, respectively, qualify for the dividends received deduction available to corporations.
For the fiscal year ended October, 2016, the Target Date 2020, Target Date 2030, Target Date 2040 and Target Date 2050 Portfolios designate 26.47%, 48.46%, 48.67% and 53.80%, respectively, of the dividends paid from net investment company taxable income as qualifying for the reduced tax rate under the Jobs and Growth Tax Relief and Reconciliation Act of 2003.
Pursuant to Section 852 of the Internal Revenue Code, the Target Date 2020, Target Date 2030, Target Date 2040 and Target Date 2050 Portfolios designate $1,456,117, $2,378,711, $1,929,632 and $507,872, respectively, or, if different, the maximum amount allowable, as capital gain dividends paid during the fiscal year ended October, 2016.
During the fiscal year ended October, 2016, the Target Date 2020, Target Date 2030, Target Date 2040 and Target Date 2050 Portfolios designate $342,597, $298,412, $283,125, and $123,040, respectively, as short-term capital gain dividends pursuant to Section 871(k) of the Internal Revenue Code.
104
FUNDS PROFILE
Goldman Sachs Funds
Goldman Sachs is a premier financial services firm, known since 1869 for creating thoughtful and customized investment solutions in complex global markets.
Today, the Investment Management Division of Goldman Sachs serves a diverse set of clients worldwide, including private institutions, public entities and individuals. With approximately $1.15 trillion in assets under supervision as of September 30, 2016, Goldman Sachs Asset Management (“GSAM”) has portfolio management teams located around the world and our investment professionals bring firsthand knowledge of local markets to every investment decision. Assets under supervision includes assets under management and other client assets for which Goldman Sachs does not have full discretion. GSAM leverages the resources of Goldman, Sachs & Co. subject to legal, internal and regulatory restrictions.
Money Market
Financial Square FundsSM
| n | | Financial Square Treasury Solutions Fund1 |
| n | | Financial Square Government Fund1 |
| n | | Financial Square Money Market Fund2 |
| n | | Financial Square Prime Obligations Fund2 |
| n | | Financial Square Treasury Instruments Fund1 |
| n | | Financial Square Treasury Obligations Fund1 |
| n | | Financial Square Federal Instruments Fund1 |
| n | | Financial Square Tax-Exempt Money Market Fund2 |
Investor FundsSM
| n | | Investor Money Market Fund3 |
| n | | Investor Tax-Exempt Money Market Fund3,4 |
Fixed Income
Short Duration and Government
| n | | High Quality Floating Rate Fund |
| n | | Short-Term Conservative Income Fund5 |
| n | | Short Duration Government Fund |
| n | | Short Duration Income Fund |
| n | | Inflation Protected Securities Fund |
Multi-Sector
Municipal and Tax-Free
| n | | High Yield Municipal Fund |
| n | | Dynamic Municipal Income Fund |
| n | | Short Duration Tax-Free Fund |
Single Sector
| n | | Investment Grade Credit Fund |
| n | | High Yield Floating Rate Fund |
| n | | Emerging Markets Debt Fund |
| n | | Local Emerging Markets Debt Fund |
| n | | Dynamic Emerging Markets Debt Fund |
Fixed Income Alternatives
| n | | Long Short Credit Strategies Fund |
| n | | Fixed Income Macro Strategies Fund |
Fundamental Equity
| n | | Small/Mid Cap Value Fund |
| n | | Small/Mid Cap Growth Fund |
| n | | Flexible Cap Growth Fund |
| n | | Concentrated Growth Fund |
| n | | Technology Opportunities Fund |
| n | | Growth Opportunities Fund |
| n | | Rising Dividend Growth Fund |
| n | | Dynamic U.S. Equity Fund |
Tax-Advantaged Equity
| n | | U.S. Tax-Managed Equity Fund |
| n | | International Tax-Managed Equity Fund |
| n | | U.S. Equity Dividend and Premium Fund |
| n | | International Equity Dividend and Premium Fund |
Equity Insights
| n | | Small Cap Equity Insights Fund |
| n | | U.S. Equity Insights Fund |
| n | | Small Cap Growth Insights Fund |
| n | | Large Cap Growth Insights Fund |
| n | | Large Cap Value Insights Fund |
| n | | Small Cap Value Insights Fund |
| n | | International Small Cap Insights Fund6 |
| n | | International Equity Insights Fund |
| n | | Emerging Markets Equity Insights Fund |
Fundamental Equity International
| n | | Strategic International Equity Fund |
| n | | Focused International Equity Fund |
| n | | Emerging Markets Equity Fund |
Select Satellite
| n | | Real Estate Securities Fund |
| n | | International Real Estate Securities Fund |
| n | | Commodity Strategy Fund |
| n | | Global Real Estate Securities Fund |
| n | | Dynamic Commodity Strategy Fund |
| n | | Dynamic Allocation Fund |
| n | | Absolute Return Tracker Fund |
| n | | Managed Futures Strategy Fund |
| n | | MLP Energy Infrastructure Fund |
| n | | Multi-Manager Alternatives Fund |
| n | | Multi-Asset Real Return Fund |
| n | | Absolute Return Multi-Asset Fund |
| n | | Global Infrastructure Fund |
Total Portfolio Solutions
| n | | Global Managed Beta Fund |
| n | | Multi-Manager Non-Core Fixed Income Fund |
| n | | Multi-Manager U.S. Dynamic Equity Fund |
| n | | Multi-Manager Global Equity Fund |
| n | | Multi-Manager International Equity Fund |
| n | | Tactical Tilt Overlay Fund7 |
| n | | Balanced Strategy Portfolio |
| n | | Multi-Manager U.S. Small Cap Equity Fund |
| n | | Multi-Manager Real Assets Strategy Fund |
| n | | Growth and Income Strategy Portfolio |
| n | | Growth Strategy Portfolio |
| n | | Equity Growth Strategy Portfolio |
| n | | Satellite Strategies Portfolio |
| n | | Enhanced Dividend Global Equity Portfolio |
| n | | Tax-Advantaged Global Equity Portfolio |
| n | | Strategic Factor Allocation Fund |
| n | | Target Date 2020 Portfolio |
| n | | Target Date 2025 Portfolio |
| n | | Target Date 2030 Portfolio |
| n | | Target Date 2035 Portfolio |
| n | | Target Date 2040 Portfolio |
| n | | Target Date 2045 Portfolio |
| n | | Target Date 2050 Portfolio |
| n | | Target Date 2055 Portfolio |
| n | | GQG Partners International Opportunities Fund |
| 1 | | You could lose money by investing in the Fund. Although the Fund seeks to preserve the value of your investment at $1.00 per share, it cannot guarantee it will do so. An investment in the Fund is not a deposit of a bank and is not insured or guaranteed by the Federal Deposit Insurance Corporation or any other government agency. The Fund’s sponsor has no legal obligation to provide financial support to the Fund, and you should not expect that the sponsor will provide financial support to the Fund at any time. |
| 2 | | You could lose money by investing in the Fund. Because the share price of the Fund will fluctuate, when you sell your shares they may be worth more or less than what you originally paid for them. The Fund may impose a fee upon sale of your shares or may temporarily suspend your ability to sell shares if the Fund’s liquidity falls below required minimums because of market conditions or other factors. An investment in the Fund is not a deposit of a bank and is not insured or guaranteed by the Federal Deposit Insurance Corporation or any other government agency. The Fund’s sponsor has no legal obligation to provide financial support to the Fund, and you should not expect that the sponsor will provide financial support to the Fund at any time. |
| 3 | | You could lose money by investing in the Fund. Although the Fund seeks to preserve the value of your investment at $1.00 per share, it cannot guarantee it will do so. The Fund may impose a fee upon sale of your shares or may temporarily suspend your ability to sell shares if the Fund’s liquidity falls below required minimums because of market conditions or other factors. An investment in the Fund is not a deposit of a bank and is not insured or guaranteed by the Federal Deposit Insurance Corporation or any other government agency. The Fund’s sponsor has no legal obligation to provide financial support to the Fund, and you should not expect that the sponsor will provide financial support to the Fund at any time. |
| 4 | | Effective on March 31, 2016, the Goldman Sachs Financial Square Tax-Free Money Market Fund was renamed the Goldman Sachs Investor Tax-Exempt Money Market Fund. |
| 5 | | Effective on July 29, 2016, the Goldman Sachs Limited Maturity Obligations Fund was renamed the Goldman Sachs Short-Term Conservative Income Fund. |
| 6 | | Effective at the close of business on February 5, 2016, the Goldman Sachs International Small Cap Fund was reorganized with and into the Goldman Sachs International Small Cap Insights Fund. |
| 7 | | Effective on June 1, 2016, the Goldman Sachs Tactical Tilt Implementation Fund was renamed the Goldman Sachs Tactical Tilt Overlay Fund. |
Financial Square FundsSM and Investor FundsSM are registered service marks of Goldman, Sachs & Co.
| * | | This list covers open-end funds only. Please visit our website at www.GSAMFUNDS.com to learn about our closed-end funds and exchange-traded funds. |
| | |
TRUSTEES Ashok N. Bakhru, Chairman Cheryl K. Beebe John P. Coblentz, Jr. Lawrence Hughes John F. Killian James A. McNamara Richard P. Strubel Westley V. Thompson | | OFFICERS James A. McNamara, President Scott M. McHugh, Treasurer, Senior Vice President, and Principal Financial Officer Caroline L. Kraus, Secretary |
| |
GOLDMAN, SACHS & CO. Distributor and Transfer Agent | | GOLDMAN SACHS ASSET MANAGEMENT, L.P. Investment Adviser |
Visit our Web site at www.GSAMFUNDS.com to obtain the most recent month-end returns.
Goldman Sachs Asset Management, L.P. 200 West Street, New York, New York 10282
The portfolio risk management process includes an effort to monitor and manage risk, but does not imply low risk.
The reports concerning the Portfolios included in this shareholder report may contain certain forward-looking statements about the factors that may affect the performance of the Portfolios in the future. These statements are based on Portfolio management’s predictions and expectations concerning certain future events and their expected impact on the Portfolios, such as performance of the economy as a whole and of specific industry sectors, changes in the levels of interest rates, the impact of developing world events, and other factors that may influence the future performance of the Portfolios. Management believes these forward-looking statements to be reasonable, although they are inherently uncertain and difficult to predict. Actual events may cause adjustments in portfolio management strategies from those currently expected to be employed.
Views and opinions expressed are for informational purposes only and do not constitute a recommendation by GSAM to buy, sell, or hold any security. Views and opinions are current as of the date of this presentation and may be subject to change, they should not be construed as investment advice.
A description of the policies and procedures that the Portfolios use to determine how to vote proxies relating to portfolio securities and information regarding how a Portfolio voted proxies relating to portfolio securities during the most recent 12-month period ended June 30 is available (i) without charge, upon request by calling 1-800-526-7384 (for Retail Shareholders) or 1-800-621-2550 (for Institutional Shareholders); and (ii) on the Securities and Exchange Commission (“SEC”) web site at http://www.sec.gov.
References to indices, benchmarks or other measures of relative market performance over a specified period of time are provided for your information only and do not imply that the portfolio will achieve similar results. The index composition may not reflect the manner in which a portfolio is constructed. While an adviser seeks to design a portfolio which reflects appropriate risk and return features, portfolio characteristics may deviate from those of the benchmark.
The Portfolios file their complete schedule of portfolio holdings with the SEC for the first and third quarters of each fiscal year on Forms N-Q. The Portfolios’ Forms N-Q will become available on the SEC’s website at http://www.sec.gov within 60 days after the Portfolios’ first and third fiscal quarters. When available, the Portfolios’ Forms N-Q may be reviewed and copied at the SEC’s Public Reference Room in Washington, D.C. and information on the operation of the Public Reference Room may also be obtained by calling 1-800-SEC-0330. When available, Forms N-Q may be obtained upon request and without charge by calling 1-800-526-7384 (for Retail Shareholders) or 1-800-621-2550 (for Institutional Shareholders).
Economic and market forecasts presented herein reflect a series of assumptions and judgments as of the date of this presentation and are subject to change without notice. These forecasts do not take into account the specific investment objectives, restrictions, tax and financial situation or other needs of any specific client. Actual data will vary and may not be reflected here. These forecasts are subject to high levels of uncertainty that may affect actual performance. Accordingly, these forecasts should be viewed as merely representative of a broad range of possible outcomes. These forecasts are estimated, based on assumptions, and are subject to significant revision and may change materially as economic and market conditions change. Goldman Sachs has no obligation to provide updates or changes to these forecasts. Case studies and examples are for illustrative purposes only.
Portfolio holdings and allocations shown are as of October 31, 2016 and may not be representative of future investments. Portfolio holdings should not be relied on in making investment decisions and should not be construed as research or investment advice regarding particular securities. Current and future holdings are subject to risk.
This material is not authorized for distribution to prospective investors unless preceded or accompanied by a current Prospectus or summary prospectus, if applicable. Investors should consider a Portfolio’s objective, risks, and charges and expenses, and read the summary prospectus, if available, and/or the Prospectus carefully before investing or sending money. The summary prospectus, if available, and the Prospectus contain this and other information about a Portfolio and may be obtained from your Authorized Institution or from Goldman, Sachs & Co. by calling (retail – 1-800-526-7384) (institutional – 1-800-621-2550).
© 2016 Goldman Sachs. All rights reserved. 76002-TMPL-12/2016 TARGDATEAR-16/218
(a) As of the end of the period covered by this report, the registrant has adopted a code of ethics that applies to the registrant’s principal executive officer, principal financial officer, principal accounting officer or controller, or persons performing similar functions, regardless of whether these individuals are employed by the registrant or a third party (the “Code of Ethics”).
(b) During the period covered by this report, no amendments were made to the provisions of the Code of Ethics.
(c) During the period covered by this report, the registrant did not grant any waivers, including an implicit waiver, from any provision of the Code of Ethics.
(d) A copy of the Code of Ethics is available as provided in Item 12(a)(1) of this report.
| ITEM 3. | AUDIT COMMITTEE FINANCIAL EXPERT. |
The registrant’s board of trustees has determined that the registrant has at least one “audit committee financial expert” (as defined in Item 3 of Form N-CSR) serving on its audit committee. John F. Killian is the “audit committee financial expert” and is “independent” (as each term is defined in Item 3 of Form N-CSR).
| ITEM 4. | PRINCIPAL ACCOUNTANT FEES AND SERVICES. |
Table 1 — Items 4(a) - 4(d). The accountant fees below reflect the aggregate fees billed by the Fund of the Goldman Sachs Trust II to which this certified shareholder report relates.
| | | | | | | | | | | | |
| | | 2016 | | 2015 | | Description of Services Rendered |
| | | | | | | | | | | | |
| | | |
Audit Fees: | | | | | | | | | | | | |
| | | |
• PricewaterhouseCoopers LLP
(“PwC”) | | | $ | 266,060 | | | | $ | 58,926 | | | Financial Statement audits. |
| | | |
Audit-Related Fees: | | | | | | | | | | | | |
| | | |
• PwC | | | $ | 11,328 | | | | $ | 0 | | | |
| | | |
Tax Fees: | | | | | | | | | | | | |
| | | |
• PwC | | | $ | 65,432 | | | | $ | 9,204 | | | |
Table 2 — Items 4(b)(c) & (d). Non-Audit Services to the Goldman Sachs Trust II’s service affiliates * that were pre-approved by the Audit Committee of the Goldman Sachs Trust II pursuant to Rule 2-01(c)(7)(ii) of Regulation S-X.
| | | | | | | | | | | | |
| | | 2016 | | 2015 | | Description of Services Rendered |
| | | | | | | | | | | | |
| | | |
Audit-Related Fees: | | | | | | | | | | | | |
| | | |
• PwC | | | $ | 1,428,616 | | | | $ | 1,658,616 | | | Internal control review performed in accordance with Statement on Standards for Attestation Engagements No. 16 and semi annual updates relating to withholding tax accrual for non-US jurisdictions. These fees are borne by the Fund’s Adviser. |
| * | These include the advisor (excluding sub-advisors) and any entity controlling, controlled by or under common control with the advisor that provides ongoing services to the registrant (hereinafter referred to as “service affiliates”). |
Item 4(e)(1) — Audit Committee Pre-Approval Policies and Procedures
Pre-Approval of Audit and Non-Audit Services Provided to the Funds of the Goldman Sachs Trust II. The Audit and Non-Audit Services Pre-Approval Policy (the “Policy”) adopted by the Audit Committee of Goldman Sachs Trust II (“GST II”) sets forth the procedures and the conditions pursuant to which services performed by an independent auditor for GST II may be pre-approved. Services may be pre-approved specifically by the Audit Committee as a whole or, in certain circumstances, by the Audit Committee Chairman or the person designated as the Audit Committee Financial Expert. In addition, subject to specified cost limitations, certain services may be pre-approved under the provisions of the Policy. The Policy provides that the Audit Committee will consider whether the services provided by an independent auditor are consistent with the Securities and Exchange Commission’s rules on auditor independence. The Policy provides for periodic review and pre-approval by the Audit Committee of the services that may be provided by the independent auditor.
De Minimis Waiver. The pre-approval requirements of the Policy may be waived with respect to the provision of non-audit services that are permissible for an independent auditor to perform, provided (1) the aggregate amount of all such services provided constitutes no more than five percent of the total amount of revenues subject to pre-approval that was paid to the independent auditors during the fiscal year in which the services are provided; (2) such services were not recognized by GST II at the time of the engagement to be non-audit services; and (3) such services are promptly brought to the attention of the Audit Committee and approved prior to the completion of the audit by the Audit Committee or by one or more members of the Audit Committee to whom authority to grant such approvals has been delegated by the Audit Committee, pursuant to the pre-approval provisions of the Policy.
Pre-Approval of Non-Audit Services Provided to GST’s Investment Advisers. The Policy provides that, in addition to requiring pre-approval of audit and non-audit services provided to GST II, the Audit Committee will pre-approve those non-audit services provided to GST II’s investment advisers (and entities controlling, controlled by or under common control with the investment advisers that provide ongoing services to GST II) where the engagement relates directly to the operations or financial reporting of GST II.
Item 4(e)(2) – 0% of the audit-related fees, tax fees and other fees listed in Table 1 were approved by GST II’s Audit Committee pursuant to the “de minimis” exception of Rule 2-01(c)(7)(i)(C) of Regulation S-X. In addition, 0% of the non-audit services to the GST II’s service affiliates listed in Table 2 were approved by GST II’s Audit Committee pursuant to the “de minimis” exception of Rule 2-01(c)(7)(i)(C) of Regulation S-X.
Item 4(f) – Not applicable.
Item 4(g) Aggregate Non-Audit Fees Disclosure
The aggregate non-audit fees billed to GST II by PwC for the twelve months ended October 31, 2016 and October 31, 2015 were $76,760 and $9,204 respectively. The aggregate non-audit fees billed to GST II’s adviser and service affiliates by PwC for the twelve months ended October 31, 2016 and October 31, 2015 were approximately $14.4 million and $10.2 million respectively. With regard to the aggregate non-audit fees billed to GST II’s adviser and service affiliates, the 2016 and 2015 amounts include fees for non-audit services required to be pre-approved [see Table 2] and fees for non-audit services that did not require pre-approval since they did not directly relate to GST II’s operations or financial reporting.
Item 4(h) — GST II’s Audit Committee has considered whether the provision of non-audit services to GST II’s investment adviser and service affiliates that did not require pre-approval pursuant to paragraph (c)(7)(ii) of Rule 2-01 of Regulation S-X is compatible with maintaining the auditors’ independence.
| ITEM 5. | AUDIT COMMITTEE OF LISTED REGISTRANTS. |
| ITEM 6. | SCHEDULE OF INVESTMENTS. |
| | Schedule of Investments is included as part of the Report to Shareholders filed under Item 1. |
| ITEM 7. | DISCLOSURE OF PROXY VOTING POLICIES AND PROCEDURES FOR CLOSED-END MANAGEMENT INVESTMENT COMPANIES. |
| ITEM 8. | PORTFOLIO MANAGERS OF CLOSED-END MANAGEMENT INVESTMENT COMPANIES. |
| ITEM 9. | PURCHASES OF EQUITY SECURITIES BY CLOSED-END MANAGEMENT INVESTMENT COMPANY AND AFFILIATED PURCHASERS. |
| ITEM 10. | SUBMISSION OF MATTERS TO A VOTE OF SECURITY HOLDERS. |
| | There have been no material changes to the procedures by which shareholders may recommend nominees to the registrant’s board of trustees. |
| ITEM 11. | CONTROLS AND PROCEDURES. |
| | (a) | The registrant’s principal executive and principal financial officers, or persons performing similar functions have concluded that the registrant’s disclosure controls and procedures (as defined in Rule 30a-3(c) under the Investment Company Act of 1940, as amended (the “1940 Act”)) are effective as of a date within 90 days of the filing of this report that includes the disclosure required by this paragraph, based on the evaluation of these controls and procedures required by Rule 30a-3(b) under the 1940 Act and 15d-15(b) under the Securities Exchange Act of 1934, as amended. |
| | (b) | There were no changes in the registrant’s internal control over financial reporting (as defined in Rule 30a-3(d) under the 1940 Act) that occurred during the registrant’s most recent fiscal quarter of the period covered by this report that have materially affected, or are reasonably likely to materially affect, the registrant’s internal control over financial reporting. |
| | | | |
| (a)(1) | | Goldman Sachs Trust II’s Code of Ethics for Principal Executive and Senior Financial Officers is incorporated by reference to Exhibit 12(a)(1) of the registrant’s Form N-CSR filed on July 8, 2015 for its Multi-Manager Non-Core Fixed Income Fund. |
| | |
| (a)(2) | | Exhibit 99.CERT | | Certifications pursuant to Section 302 of the Sarbanes-Oxley Act of 2002 filed herewith. |
| | |
| (b) | | Exhibit 99.906CERT | | Certifications pursuant to Section 906 of the Sarbanes-Oxley Act of 2002 filed herewith. |
SIGNATURES
Pursuant to the requirements of the Securities Exchange Act of 1934 and the Investment Company Act of 1940, the registrant has duly caused this report to be signed on its behalf by the undersigned, thereunto duly authorized.
| | | | |
| | | | Goldman Sachs Trust II |
| | |
| By: | | | | /s/ James A. McNamara |
| | | | James A. McNamara |
| | | | President/Chief Executive Officer |
| | | | Goldman Sachs Trust II |
| | |
| Date: | | | | January 5, 2017 |
Pursuant to the requirements of the Securities Exchange Act of 1934 and the Investment Company Act of 1940, this report has been signed below by the following persons on behalf of the registrant and in the capacities and on the dates indicated.
| | | | |
| By: | | | | /s/ James A. McNamara |
| | | | James A. McNamara |
| | | | President/Chief Executive Officer |
| | | | Goldman Sachs Trust II |
| | |
| Date: | | | | January 5, 2017 |
| | |
| By: | | | | /s/ Scott McHugh |
| | | | Scott McHugh |
| | | | Principal Financial Officer |
| | | | Goldman Sachs Trust II |
| | |
| Date: | | | | January 5, 2017 |