UNITED STATES
SECURITIES AND EXCHANGE COMMISSION
Washington, D.C. 20549
FORM N-CSR
CERTIFIED SHAREHOLDER REPORT OF REGISTERED
MANAGEMENT INVESTMENT COMPANIES
Investment Company Act file number 811-22781
Goldman Sachs Trust II
(Exact name of registrant as specified in charter)
200 West Street
15th Floor
New York, New York 10282
(Address of principal executive offices) (Zip code)
| | |
Copies to: |
Caroline Kraus | | Geoffrey R.T. Kenyon, Esq. |
Goldman Sachs & Co. LLC | | Dechert LLP |
200 West Street | | 100 Oliver Street |
New York, New York 10282 | | 40th Floor |
| | Boston, MA 02110-2605 |
(Name and address of agents for service)
Registrant’s telephone number, including area code: (212) 902-1000
Date of fiscal year end: August 31
Date of reporting period: August 31, 2018
| ITEM 1. | REPORTS TO STOCKHOLDERS. |
| | The Annual Report to Shareholders is filed herewith. |
Goldman Sachs Funds

| | | | |
| | |
| Annual Report | | | | August 31, 2018 |
| | |
| | | | Target Date Portfolios |
| | | | Target Date 2020 |
| | | | Target Date 2025 |
| | | | Target Date 2030 |
| | | | Target Date 2035 |
| | | | Target Date 2040 |
| | | | Target Date 2045 |
| | | | Target Date 2050 |
| | | | Target Date 2055 |
| | | | Target Date 2060 |

Goldman Sachs Target Date Portfolios
| | | | |
| | | |
| NOT FDIC-INSURED | | May Lose Value | | No Bank Guarantee |
MARKET REVIEW
Target Date Portfolios
Market Review
During the 12 months ended August 31, 2018 (the “Reporting Period”), economic growth indicators, shifting expectations about central bank policy, strong corporate earnings and geopolitics drove the performance of the financial markets. U.S. stocks recorded double-digit gains, significantly outperforming non-U.S. developed markets stocks, which nevertheless generated positive returns. In contrast, emerging markets stocks and fixed income declined.
Equity Markets
When the Reporting Period began in September 2017, developed markets stocks gained. In the U.S., economic activity and labor market data showed consistent strength, with the reversal in August of five consecutive downside inflation surprises, the unemployment rate down to 4.2% in September, and the Gross Domestic Product (“GDP”) growing at an annualized rate above 3% during the third calendar quarter. The European Central Bank (“ECB”) kept monetary policy unchanged at its September meeting and revised downward its inflation forecast. Investor sentiment in Japan deteriorated amid North Korean missile launches and escalating geopolitical tensions, while in Europe, the disputed independence referendum in Catalonia, Spain was negative for risk sentiment. Meanwhile, emerging markets equities underperformed developed markets equities in September 2017, as investors generally favored less risky assets. During October 2017, emerging markets stocks advanced despite strength in the U.S. dollar. In Japan, the Prime Minister’s landslide victory reassured investors, signaling a continuation of then-current policies. Progress on U.S. tax reform and strong economic activity data was supportive of U.S. stocks during October and November 2017. In November 2017, a robust earnings season boosted emerging markets stocks, which overcame weakness driven by a global selloff in information technology stocks. In December, the U.S. Federal Reserve (the “Fed”) delivered its third interest rate hike of 2017, having previously raised short-term interest rates in March and June, and maintained its projections for three hikes in 2018. U.S. equities gained additional momentum toward the end of 2017 from the passage of tax reform legislation that reduced the corporate tax rate from 35% to 21%.
Developed markets equities saw a strong start to 2018, driven by positive economic data, the $1.5 trillion U.S. tax reform plan and robust corporate earnings across the U.S., Europe and Japan. Fourth quarter 2017 U.S. GDP came in below the economic growth rates recorded in the second and third calendar quarters but was still at a respectable annualized rate of 2.5%. In January 2018, labor market data highlighted the tightening of slack in the U.S. economy. In Japan, concerns around a strengthening yen increased, driven by the Bank of Japan’s announcement of reduced Japanese government bond purchases, which were interpreted by the markets as a withdrawal from ultra-accommodative monetary policy. Emerging markets equities outperformed developed markets equities during January 2018, bolstered by global economic growth, rising crude oil prices and a softer U.S. dollar. In February 2018, global equities broadly sold off on market speculation about a faster pace of Fed interest rate hikes, which led to a sharp rise in yields and volatility. Robust U.S. labor market data sparked the initial “risk-off” sentiment, or reduced risk appetite. Concerns about Fed monetary policy tightening were further exacerbated by solid U.S. inflation data. New Fed Chair Jerome Powell’s testimony before the U.S. Congress in February 2018, positing a more optimistic economic outlook since the December 2017 Fed policy meeting, surprised the markets with its hawkish tilt. (Jerome Powell assumed the chairmanship of the Fed in February 2018. Hawkish language tends to suggest higher interest rates; opposite of dovish.) Renewed concerns about increasingly hostile exchanges between North Korea and the White House — as well as
1
MARKET REVIEW
heightened European political risk ahead of Italian general elections and a grand coalition referendum in Germany — also fueled volatility. In March 2018, escalating trade tensions and potential tariffs drove further declines in global stocks broadly. Meanwhile, the Fed delivered on a widely expected interest rate increase, with its “dot plot” pointing to a total of three interest rate hikes in the 2018 calendar year and potentially two in 2019. (The “dot plot” shows rate projections of the members of the Fed’s Open Market Committee.) However, Fed policymakers acknowledged that the “economic outlook has strengthened in recent months,” revising their economic growth forecast higher and their unemployment forecast lower. In Europe, an agreement between the U.K. and European Union on a 21-month Brexit transition period reduced political uncertainty. (Brexit refers to the U.K.’s efforts to leave the European Union.)
The U.S. and China continued to generate trade headlines and geopolitical uncertainty about sanctions on Russia surfaced, but the impact of such on developed markets and emerging markets stocks remained relatively muted during April 2018, as investors stayed rather resistant to the risk of a trade war. U.S. equities rallied in May 2018, driven by strong corporate earnings, upside surprises in economic activity and sentiment data, and a new U.S. unemployment low of 3.8%. However, non-U.S. developed markets equities and emerging markets stocks declined amid escalating geopolitical uncertainty stemming from an unexpected political outcome in Italy, ongoing unpredictability around the U.S.-North Korea summit, and escalating trade tensions with many U.S. allies. In June 2018, the Fed raised interest rates again, as widely expected, but the outcome of the Fed meeting was more hawkish than the consensus had anticipated. The Fed retained language indicating an “accommodative” monetary policy stance, but its economic growth and inflation forecasts were upgraded, and its median projection was lifted to four interest rate hikes in 2018 from the three it had indicated in March 2018. Fed Chair Powell was also slightly hawkish in his June press conference. Still-escalating trade tensions between the U.S. and China hurt market sentiment broadly, as the U.S. threatened tariffs on $200 billion worth of Chinese goods and China vowed to retaliate.
Global equities gained during July 2018, though market volatility was high, driven by heightened trade rhetoric between the U.S. and China as well as between the U.S. and key allies and by strong U.S. macroeconomic data relative to other developed and emerging markets countries. The U.S. economy grew 4.2% year over year in the second calendar quarter, its fastest annualized pace since 2004. Re-escalating trade tensions and renewed fears of a Chinese economic slowdown dampened investor risk sentiment, but fiscal stimulus policies announced by the Chinese government and the promising outcome of a trade meeting between the U.S. and European Union lifted developed markets stocks higher in July overall. In August 2018, U.S. equities reached an all-time high, with strong domestic economic data outweighing headwinds posed by moderating global economic growth and escalating trade and diplomatic tensions. However, the same headlines drove declines in non-U.S. developed markets equities and emerging markets stocks. At the start of the month, they fell on signs of an economic slowdown in China, along with escalating U.S.-China trade tensions, as the U.S. considered imposing additional tariffs on Chinese goods. They were also hurt by news about U.S. economic sanctions on Iran and a sharp sell-off in Turkish stocks following its diplomatic disputes with the U.S., which exacerbated existing investor worries about Turkey’s economic imbalances and unorthodox policies. In Europe, political concerns centered around Italy and its upcoming 2019 budget. Although a strong earning season and progress on North American free trade negotiations boosted investor sentiment mid-month, it subsequently deteriorated due
2
MARKET REVIEW
to the U.S. President’s comments about the potential of further additional tariffs on Chinese goods.
Fixed Income Markets
In September 2017, government bond sectors sold off, and spread, or non-government bond, sectors generally advanced. The Fed kept its monetary policy unchanged but unveiled its plans for balance sheet normalization. (Balance sheet normalization refers to the steps the Fed is taking to reverse quantitative easing.) This prompted a modestly hawkish market reaction, with the U.S. dollar strengthening and yields on U.S. government bonds rising, though the move had been largely anticipated given earlier signaling by policymakers. The central banks of other developed countries also set the stage for less accommodative monetary policy. The Bank of England (“BoE”) noted “a majority” of its policymakers were in favor of tightening policy “over the coming months,” while the Bank of Canada (“BoC”) surprised the markets with its second interest rate hike of 2017. The market’s expectations for a BoE rate hike in November 2017, along with a constructive tone for Brexit negotiations, drove the British pound higher versus the U.S. dollar.
During the fourth calendar quarter, spread sector performance was broadly positive, supported by ongoing strength in the global macroeconomic environment and contained market, macro and political volatility. Passage of U.S. tax legislation and solid corporate earnings were particularly supportive of U.S. corporate credit. In October 2017, the ECB announced it would reduce its monthly asset purchases from €60 billion to €30 billion for nine months beginning in January 2018, mainly by purchasing fewer sovereign government bonds. The ECB also said its policy rates would remain low for “an extended period of time, and well past the horizon of the net asset purchases.” During the same month, the BoE reversed an emergency interest rate cut, made in August 2016 following the Brexit referendum, and signaled that future monetary policy tightening would be limited, gradual and dependent on the economic reaction to the U.K.’s eventual departure from the European Union. In December 2017, the Fed delivered its third short-term interest rate hike of 2017. The Fed’s dot plot indicated that three rate increases were on tap for 2018 and potentially two more in 2019. The U.S. dollar weakened versus many major currencies during the fourth quarter of 2017, as strong global economic growth supported non-U.S. currencies and in particular, emerging markets currencies.
In the first quarter of 2018, spread sectors were challenged by a surge in market volatility. Firmer than consensus expected U.S. wage and price inflation data prompted higher market volatility and equity market declines, though the magnitude of the moves was exacerbated by changing market structures, including the increased presence of algorithmic trading strategies. (Algorithmic trading uses complex mathematical models and formulas to make high-speed decisions and transactions in the financial markets.) The Fed raised short-term interest rates at its March policy meeting and reiterated its plan for a total of three rate hikes during 2018. Beyond the U.S., monetary policy action was muted in the developed markets during the first calendar quarter, though policymakers in Europe and Japan sounded mildly dovish and those in Norway appeared more hawkish. Economic activity data moderated in emerging markets and developed markets countries but remained in expansionary territory and therefore was supportive of cyclical asset classes geared toward growth. The U.S. was a notable exception, experiencing continued strength in economic data. During the first quarter of 2018, the U.S. dollar weakened slightly versus many major currencies, due in part to market concerns about the U.S. current account and fiscal deficits.
3
MARKET REVIEW
During the second calendar quarter, spread sectors broadly weakened amid increased U.S.-China trade tensions, political events in emerging markets countries and Italy, higher U.S. interest rates and a stronger U.S. dollar. U.S. high yield corporate bonds, however, generated a small positive return. Rising oil prices were a tailwind for the broader high yield corporate bond sector, as many energy bonds are high yield rated. In June 2018, the Fed delivered the seventh interest rate hike of its current tightening cycle. The Fed’s dot plot pointed to two more rate increases in 2018, implying a total of four rate hikes in the calendar year. U.S. economic growth strengthened, with GDP expanding at an annualized rate of 4.2% in the second calendar quarter. Elsewhere, the ECB announced plans to taper its quantitative easing program beginning September 2018. The U.S. dollar appreciated relative to many major currencies during the second quarter of 2018.
Spread sectors performed well in July 2018 amid “risk-on” market sentiment, or reduced risk aversion, which was motivated by ongoing strength in U.S. economic data, strong second calendar quarter corporate earnings and fewer news reports about protectionist trade policies. The Fed kept interest rates unchanged during the month but issued an upbeat statement. The BoJ said it would continue its existing monetary policy of negative interest rates, quantitative easing and “yield curve control.” (Yield curve control is designed to steepen Japan’s government bond yield curve and alleviate the impact on financial institutions of low longer-term rates. Yield curve indicates a spectrum of maturities.) The BoE raised its interest rates by 25 basis points, citing reduced slack in the U.K. economy and signs of wage growth. (A basis point is 1/100th of a percentage point.) The U.S. dollar strengthened versus many major currencies during July 2018.
In August 2018, spread sectors generally weakened. Emerging markets assets, especially emerging markets currencies, came under pressure due to a number of country-specific events, including U.S. sanctions on Russia, investor concerns about external funding needs in Turkey and Argentina, and doubts surrounding economic reform progress in South Africa. The “risk-off” market sentiment also challenged the performance of U.S. investment grade corporate bonds, which faced additional headwinds from a large amount of new supply. In contrast, U.S. high yield corporate bonds produced a positive return amid muted new issuance and firmer crude oil prices. In August 2018, the U.S. dollar weakened slightly versus many major currencies.
Looking Ahead
At the end of the Reporting Period, we believed the pace of U.S. economic growth had largely peaked relative to the growth of other developed markets countries. In our view, the U.S. economy had benefited from strong fiscal policy support during the second quarter of 2018, and we expected that support to fade over time. Meanwhile, economic growth in Europe appeared to be stabilizing at a lower, but more sustainable, level compared to the growth seen during 2017. The economic recovery in Japan, which has been more muted than we expected, was continuing gradually. In China, policy support has been firm in the face of weaker economic data and risks from trade, and we expected to see a period of positive surprises eventually. Beyond China, most emerging markets countries had healthy economic fundamentals, in our view, and we expected them to benefit from U.S. economic growth. We believed the weakness in emerging markets assets near the end of the Reporting Period reflected country-specific challenges rather than a broad emerging markets crisis. In terms of the bigger picture at the end of the Reporting Period, we expected global economic growth to converge at healthy levels after a period defined by U.S. economic exceptionalism. As for
4
MARKET REVIEW
U.S. interest rates, we expected them to continue climbing over the longer term, but we see few catalysts for a significant move higher in the closing months of 2018. With inflation rising gradually and U.S. economic growth likely to moderate, we believed at the end of the Reporting Period that the Fed would raise short-term interest rates twice more in 2018, which is consistent with market expectations.
5
PORTFOLIO RESULTS
Goldman Sachs Target Date 2020 Portfolio, Goldman Sachs Target Date 2025 Portfolio, Goldman Sachs Target Date 2030 Portfolio, Goldman Sachs Target Date 2035 Portfolio, Goldman Sachs Target Date 2040 Portfolio, Goldman Sachs Target Date 2045 Portfolio, Goldman Sachs Target Date 2050 Portfolio, Goldman Sachs Target Date 2055 Portfolio and Goldman Sachs Target Date 2060 Portfolio
Investment Objective
The Goldman Sachs Target Date 2020 Portfolio, the Goldman Sachs Target Date 2025 Portfolio, the Goldman Sachs Target Date 2030 Portfolio, the Goldman Sachs Target Date 2035 Portfolio, the Goldman Sachs Target Date 2040 Portfolio, the Goldman Sachs Target Date 2045 Portfolio, the Goldman Sachs Target Date 2050 Portfolio, the Goldman Sachs Target Date 2055 Portfolio and the Goldman Sachs Target Date 2060 Portfolio (collectively, the “Portfolios”) seek to provide capital appreciation and current income consistent with each respective Portfolio’s current asset allocation. The Portfolios employ asset allocation strategies designed for investors who plan to retire and to begin gradually withdrawing their investment beginning in or around 2020, 2025, 2030, 2035, 2040, 2045, 2050, 2055 and 2060. The Portfolios generally seek to achieve their investment objective by investing in shares of exchange-traded funds (“ETFs”) and other registered investment companies (collectively, the “Underlying Funds”), according to an asset allocation strategy developed by Madison Asset Management, LLC, the sub-adviser, which is unaffiliated with Goldman Sachs Asset Management, L.P., the investment adviser for the Portfolios.
Portfolio Management Discussion and Analysis
Below, the Madison Asset Management, LLC portfolio management team, the Portfolios’ sub-adviser, discusses the Portfolios’ performance and positioning for the 12-month period ended August 31, 2018 (the “Reporting Period”).
| Q | | How did the Portfolios perform during the Reporting Period? |
| A | | Goldman Sachs Target Date 2020 Portfolio — During the Reporting Period, the Target Date 2020 Portfolio’s Class A, Institutional, Service, Investor, R and R6 Shares generated average annual total returns of 2.89%, 3.33%, 2.73%, 3.19%, 2.61% and 3.33%, respectively. These returns compare to the 5.82% average annual total return of the Portfolio’s benchmark, the S&P Target Date To 2020 Index (Total Return, Unhedged, USD) during the same period. |
| | Goldman Sachs Target Date 2025 Portfolio — During the Reporting Period, the Target Date 2025 Portfolio’s Class A, Institutional, Service, Investor, R and R6 Shares generated average annual total returns of 5.42%, 5.70%, 5.22%, 5.59%, 4.98% and 5.73%, respectively. These returns compare to the 7.19% average annual total return of the Portfolio’s benchmark, the S&P Target Date To 2025 Index (Total Return, Unhedged, USD) during the same period. |
| | Goldman Sachs Target Date 2030 Portfolio — During the Reporting Period, the Target Date 2030 Portfolio’s Class A, Institutional, Service, Investor, R and R6 Shares generated average annual total returns of 6.93%, 7.29%, 6.71%, 7.06%, 6.59% and 7.30%, respectively. These returns compare to the 8.66% average annual total return of the Portfolio’s benchmark, the S&P Target Date To 2030 Index (Total Return, Unhedged, USD) during the same period. |
| | Goldman Sachs Target Date 2035 Portfolio — During the Reporting Period, the Target Date 2035 Portfolio’s Class A, Institutional, Service, Investor, R and R6 Shares generated average annual total returns of 7.54%, 8.02%, 7.44%, 7.82%, 7.29% and 8.05%, respectively. These returns compare to the 10.01% average annual total return of the Portfolio’s benchmark, the S&P Target Date To 2035 Index (Total Return, Unhedged, USD) during the same period. |
| | Goldman Sachs Target Date 2040 Portfolio — During the Reporting Period, the Target Date 2040 Portfolio’s Class A, |
6
PORTFOLIO RESULTS
| | Institutional, Service, Investor, R and R6 Shares generated average annual total returns of 8.23%, 8.71%, 8.13%, 8.46%, 8.02% and 8.70%, respectively. These returns compare to the 11.10% average annual total return of the Portfolio’s benchmark, the S&P Target Date To 2040 Index (Total Return, Unhedged, USD) during the same period. |
| | Goldman Sachs Target Date 2045 Portfolio — During the Reporting Period, the Target Date 2045 Portfolio’s Class A, Institutional, Service, Investor, R and R6 Shares generated average annual total returns of 9.02%, 9.40%, 8.83%, 9.19%, 8.74% and 9.34%, respectively. These returns compare to the 11.53% average annual total return of the Portfolio’s benchmark, the S&P Target Date To 2045 Index (Total Return, Unhedged, USD) during the same period. |
| | Goldman Sachs Target Date 2050 Portfolio — During the Reporting Period, the Target Date 2050 Portfolio’s Class A, Institutional, Service, Investor, R and R6 Shares generated average annual total returns of 9.66%, 10.10%, 9.53%, 9.98%, 9.38% and 10.11%, respectively. These returns compare to the 11.75% average annual total return of the Portfolio’s benchmark, the S&P Target Date To 2050 Index (Total Return, Unhedged, USD) during the same period. |
| | Goldman Sachs Target Date 2055 Portfolio — During the Reporting Period, the Target Date 2055 Portfolio’s Class A, Institutional, Service, Investor, R and R6 Shares generated average annual total returns of 10.37%, 10.82%, 10.27%, 10.62%, 10.09% and 10.85%, respectively. These returns compare to the 12.08% average annual total return of the Portfolio’s benchmark, the S&P Target Date To 2055 Index (Total Return, Unhedged, USD) during the same period. |
| | Goldman Sachs Target Date 2060 Portfolio — For the period since their inception on April 30, 2018 through August 31, 2018, the Target Date 2060 Portfolio’s Class A, Institutional, Service, Investor, R and R6 Shares generated cumulative total returns of 4.50%, 4.60%, 4.40%, 4.60%, 4.40% and 4.60%, respectively. These returns compare to the 4.72% cumulative total return of the Portfolio’s benchmark, the S&P Target Date To 2060 Index (Total Return, Unhedged, USD) during the same period. |
| Q | | What key factors affected the Portfolios’ performance during the Reporting Period? |
| A | | All of the Portfolios, including the Goldman Sachs Target Date 2060 Portfolio, were hurt by our asset allocation decisions to favor certain asset classes through the Underlying Funds. Security selection also detracted from each Portfolio’s performance. |
| Q | | How did the Portfolios’ asset allocations affect performance during the Reporting Period? |
| A | | Regarding strategic allocations, we had a slight preference for fixed income over equities in all of the Portfolios, except the Goldman Sachs Target Date 2020 Portfolio and the Goldman Sachs Target Date 2025 Portfolio. This preference had a negative impact on performance, as equities outperformed fixed income during the Reporting Period. In the Goldman Sachs Target Date 2020 Portfolio and the Goldman Sachs Target Date 2025 Portfolio, which have higher exposure to inflation risk compared to the rest of the Portfolios, our slight preference for equities over fixed income bolstered returns. Within equities, all the Portfolios were hampered by our preference for non-U.S. equities over U.S. equities, given that U.S. equities outpaced non-U.S. equities during the Reporting Period. Within fixed income, our focus on investment grade corporate bonds over high yield corporate bonds and the Portfolios’ overweight positions in U.S. Treasury securities also dampened overall performance. |
| | Within the Portfolios’ tactical equity allocations, our decision to overweight U.S. information technology stocks and U.S. growth stocks contributed positively. Tactical positioning in the U.S. energy and materials sectors held back performance. Within non-U.S. equities, the Portfolios benefited from their overweight positions in Japan relative to Europe. In addition, our decision to gain tactical exposure to emerging markets equities through the iShares® Edge MSCI Minimum Volatility Emerging Markets ETF, which tends to have a quality bias and is less cyclically oriented, added to the Portfolios’ results. Select currency hedged positions that sought to gain from the strong U.S. dollar further enhanced returns. Conversely, the Portfolios’ were hurt by their tactical exposure to European equities during the Reporting Period. |
| | Within tactical fixed income allocations, the Portfolios were helped by their positions in Treasury inflation protected securities (“TIPS”), which benefited from higher inflation, and in floating-rate corporate bonds, which have less duration risk. (Duration is a measure of the sensitivity of the price of a fixed income investment to a change in interest rates.) Tactical exposure to short-term corporate bonds also added to performance. On the other hand, the Portfolios’ tactical exposure to U.S. Treasury securities detracted from returns. |
7
PORTFOLIO RESULTS
| Q | | Did the Underlying Funds help or hurt the Portfolios’ performance during the Reporting Period? |
| A | | During the Reporting Period, the Portfolios’ Underlying Funds detracted from performance overall. |
| | | Within the Portfolios’ equity-related Underlying Funds, tactical exposures to the energy and materials sectors through the Energy Select Sector SPDR® ETF and the Vanguard Materials ETF, respectively, hurt results. Both Underlying Funds underperformed their respective benchmark indices during the Reporting Period largely because of the stronger U.S. dollar, slowing economic growth outside the U.S. and broad market concerns about trade. On the positive side, the Portfolios benefited from their tactical exposures to the information technology sector through the Vanguard Information Technology ETF and their tactical exposures to U.S. large-cap growth stocks through the Vanguard Growth ETF. These Underlying Funds performed well due to investors’ preference for growth-oriented stocks during the Reporting Period. Meanwhile, U.S. dollar strength drove positive performance by the Xtrackers MSCI EAFE Hedged Equity ETF. In addition, the Portfolios were helped by their tactical exposures to Japan through the WisdomTree Japan Hedged Equity ETF and the iShares® MSCI Japan ETF, as Japan saw relatively better economic data than Europe. |
| | Among the Portfolios’ fixed income-related Underlying Funds, tactical exposures to U.S. Treasury securities through the Schwab Intermediate-Term U.S. Treasury ETF, the iShares® 7-10 Year Treasury Bond ETF and the iShares® 20+ Year Treasury Bond ETF, detracted from returns as interest rates rose along the U.S. Treasury yield curve, reflecting a higher term premium for U.S. Treasuries and higher inflation expectations by investors. (Yield curve is a spectrum of maturities. Term premium is the amount by which the yield-to-maturity of a long-term bond exceeds that of a short-term bond.) The Portfolios benefited from their tactical exposures to corporate bonds through the Vanguard Short-Term Corporate Bond ETF and the iShares® Floating Rate Bond ETF, as credit spreads narrowed. (Spreads are yield differentials between bonds of comparable maturity.) Corporate bonds broadly outperformed U.S. government bonds during the Reporting Period, as U.S. economic data remained strong. |
| | Of the Portfolios’ commodities-related Underlying Funds, the Invesco Optimum Yield Diversified Commodity Strategy No K-1 ETF was a drag on performance. Although the Underlying Fund produced a positive return, it trailed the broad U.S. equity market. |
| Q | | How did the Portfolios use derivatives and similar instruments during the Reporting Period? |
| A | | The Portfolios do not directly invest in derivatives. However, some of the Underlying Funds may have used derivatives to allow them to track their respective benchmark indices with more precision. These may have included options, forwards, futures, swaps, structured securities and other derivative instruments. |
| Q | | What changes did you make to the Portfolios’ strategic allocations during the Reporting Period? |
| A | | We slightly reduced the Portfolios’ strategic allocations to non-U.S. stocks and slightly increased their strategic allocations to U.S. stocks, given that U.S. economic prospects looked relatively more attractive than those of other countries, in our view. Within the Portfolios’ U.S. equity allocations, we increased our emphasis on quality. We continued to favor the information technology sector, while maintaining strategic exposures to the cyclically-oriented energy and materials sectors. We increased the Portfolios’ strategic allocations to dividend-paying stocks, which resulted in additional exposure to the consumer staples sector. We also increased their strategic allocations to pharmaceuticals stocks. In addition, during the Reporting Period, we decreased the Portfolios’ broad exposure to non-U.S. equities, while adopting underweight positions in Europe and overweight positions in Japan. We also added select currency hedging positions. |
| Q | | What is the Portfolios’ tactical view and strategy for the months ahead? |
| A | | In the near term, we expect to see low returns from virtually all asset classes. Therefore, we believe managing risk is likely to be of greater importance going forward. We plan to maintain a modestly defensive posture in the Portfolios, with a continued emphasis on seeking to generate strong risk-adjusted returns. |
8
PORTFOLIO RESULTS
|
| |
| Changes to Portfolio Management and Principal Investment Strategy on or about November 30, 2018 |
| |
Effective on or about November 30, 2018, after the close of the Reporting Period, Madison Asset Management, LLC will no longer serve as sub-adviser to the Portfolios, and David Hottmann and Patrick Ryan will no longer serve as portfolio managers of the Portfolios. At the same time, Goldman Sachs Asset Management, L.P. (the “Investment Adviser”) will provide day-to-day advice regarding each of the Portfolios’ investment transactions, and Raymond Chan and Christopher Lvoff will serve as portfolio managers for each of the Portfolios. The Portfolios’ principal investment strategy, including the Portfolios’ glide path, will also change. On or about November 30, 2018, each of the Portfolios will employ an asset allocation strategy designed for investors who plan to retire and withdraw their investment beginning on approximately the date specified in the specific Portfolio’s name (the “Target Date”). Each Portfolio will be managed for an investor planning to retire at the age of 65 on or around the Target Date. The Portfolios will generally seek to achieve their investment objective by investing in shares of exchange-traded funds (“ETFs”) for which the Investment Adviser or an affiliate now or in the future acts as investment adviser or principal underwriter, and may also invest in mutual funds for which the Investment Adviser or an affiliate now or in the future acts as investment adviser or principal underwriter as well as unaffiliated ETFs and mutual funds (collectively, the “Underlying Funds”), without considering or canvassing the universe of unaffiliated funds available. Under normal conditions, each of the Portfolios will invest in Underlying Funds according to the Investment Adviser’s asset allocation strategy such that over time each Portfolio’s asset allocation will generally become more conservative through the reduced allocation to equity funds and increased allocation to fixed income funds in accordance with the glide path’s strategic allocation. |
9
FUND BASICS
Target Date 2020 Portfolio
as of August 31, 2018
| | | | | | | | | | |
| | PERFORMANCE REVIEW | |
| | | September 1, 2017–August 31, 2018 | | Portfolio Total Return
(based on NAV)1 | | | S&P Target Date To
2020 (Total Return,
Unhedged, USD)2 | |
| | Class A | | | 2.89 | % | | | 5.82 | % |
| | Institutional | | | 3.33 | | | | 5.82 | |
| | Service | | | 2.73 | | | | 5.82 | |
| | Investor | | | 3.19 | | | | 5.82 | |
| | Class R | | | 2.61 | | | | 5.82 | |
| | | Class R6 | | | 3.33 | | | | 5.82 | |
| | 1 | | The net asset value (“NAV”) represents the net assets of the class of the Portfolio (ex-dividend) divided by the total number of shares of the class outstanding. The Portfolio’s performance assumes the reinvestment of dividends and other distributions. The Portfolio’s performance does not reflect the deduction of any applicable sales charges. |
| | 2 | | The S&P Target Date Index Series is a component of the S&P Target Allocation Index Family, and is related to the S&P Target Risk Index Series. Both series are broadly representative of the investment opportunity available to investors in target date and target risk funds, respectively. The index series reflects the market consensus for asset allocations for different target date horizons. In particular, each index is representative of the investment opportunity available to investors for the corresponding target date horizon, with asset class exposures driven by a survey of available target date funds for that horizon. |
The returns set forth in the table above represent past performance. Past performance does not guarantee future results. The Portfolio’s investment return and principal value will fluctuate so that an investor’s shares, when redeemed, may be worth more or less than their original cost. Current performance may be lower or higher than the performance quoted above. Please visit our web site at www.GSAMFUNDS.com to obtain the most recent month-end returns.
Performance reflects fee waivers and/or expense limitations in effect. In their absence, performance would be reduced. Returns do not reflect the deduction of taxes that a shareholder would pay on Portfolio distributions or the redemption of Portfolio shares. Returns less than 12 months are cumulative, not annualized.
10
FUND BASICS
| | | | | | | | | | | | | | | | | | |
| | STANDARDIZED TOTAL RETURNS3 |
| | | For the period ended 6/30/18 | | One Year | | | Five Years | | | Ten Years | | | Since Inception | | Inception Date |
| | Class A | | | -2.64 | % | | | N/A | | | | N/A | | | 0.18% | | 8/22/16 |
| | Institutional | | | 3.46 | | | | N/A | | | | N/A | | | 3.67 | | 8/22/16 |
| | Service | | | 2.87 | | | | N/A | | | | N/A | | | 3.14 | | 8/22/16 |
| | Investor | | | 3.33 | | | | N/A | | | | N/A | | | 3.52 | | 8/22/16 |
| | Class R | | | 2.74 | | | | N/A | | | | N/A | | | 2.99 | | 8/22/16 |
| | | Class R6 | | | 3.46 | | | | 5.45 | % | | | 3.91 | % | | 2.83 | | 10/01/07 |
| | 3 | | The Standardized Total Returns are average annual total returns or cumulative total returns (only if the performance period is one year or less) as of the most recent calendar quarter-end. They assume reinvestment of all distributions at NAV. These returns reflect a maximum initial sales charge of 5.5% for Class A Shares. Because Institutional, Service, Investor, Class R and Class R6 Shares do not involve a sales charge, such a charge is not applied to their Standardized Total Returns. |
Effective August 22, 2016, the Madison Target Retirement 2020 Fund (the “Predecessor Fund”) was reorganized into the Portfolio. The Portfolio has assumed the Predecessor Fund’s historical performance. The returns for the Predecessor Fund for periods prior to August 29, 2014 reflect the performance of the Madison Target Retirement 2020 Fund’s Class I Shares, a series of Ultra Series Fund (the “Ultra Predecessor Fund”). As of August 29, 2014, the inception date of the Predecessor Fund, the Ultra Predecessor Fund exchanged in kind substantially all of its portfolio holdings for Class R6 shares of the Predecessor Fund. As a result, the Predecessor Fund assumed the performance of the Ultra Predecessor Fund. Performance reflects applicable fee waivers and/or expense limitations in effect during the periods shown. Past performance does not guarantee future results, which may vary. The value of investments and the income derived from investments will fluctuate and can go down as well as up. A loss of principal may occur.
The returns set forth in the table above represent past performance. Past performance does not guarantee future results. The Portfolio’s investment return and principal value will fluctuate so that an investor’s shares, when redeemed, may be worth more or less than their original cost. Current performance may be lower or higher than the performance quoted above. Please visit our web site at www.GSAMFUNDS.com to obtain the most recent month-end returns. Performance reflects applicable fee waivers and/or expense limitations in effect during the periods shown. In their absence, performance would be reduced. Returns do not reflect the deduction of taxes that a shareholder would pay on Portfolio distributions or the redemption of Portfolio shares. Returns less than 12 months are cumulative, not annualized.
| | | | | | | | | | |
| | EXPENSE RATIOS4 | |
| | | | | Net Expense Ratio (Current) | | | Gross Expense Ratio (Before Waivers) | |
| | Class A | | | 0.87 | % | | | 1.52 | % |
| | Institutional | | | 0.48 | | | | 1.13 | |
| | Service | | | 0.98 | | | | 1.63 | |
| | Investor | | | 0.62 | | | | 1.27 | |
| | Class R | | | 1.12 | | | | 1.77 | |
| | | Class R6 | | | 0.47 | | | | 1.12 | |
| | 4 | | The expense ratios of the Portfolio, both current (net of applicable fee waivers and/or expense limitations) and before waivers (gross of applicable fee waivers and/or expense limitations) are as set forth above according to the most recent publicly available Prospectus for the Portfolio and will differ from the expense ratios disclosed in the Financial Highlights in this report due to the inclusion of Underlying Fund fees and expenses, which are not included in the operating expenses of the Portfolio reflected in the Financial Highlights. Pursuant to a contractual arrangement, the Portfolio’s waivers and/or expense limitations will remain in place through at least December 29, 2018, and prior to such date, the Investment Adviser may not terminate the arrangements without the approval of the Portfolio’s Board of Trustees. If these arrangements are discontinued in the future, the expense ratios may change without shareholder approval. |
11
FUND BASICS
| | | | | | | | |
| | TOP TEN HOLDINGS AS OF 8/31/185 |
| | | Holding | | % of Net Assets | | | Line of Business |
| | Schwab Intermediate-Term U.S. Treasury ETF | | | 25.0 | % | | Exchange Traded Funds |
| | Vanguard Short-Term Corporate Bond ETF | | | 21.0 | | | Exchange Traded Funds |
| | Schwab U.S. TIPS ETF | | | 20.0 | | | Exchange Traded Funds |
| | iShares 20+ Year Treasury Bond ETF | | | 5.0 | | | Exchange Traded Funds |
| | iShares Core S&P 500 ETF | | | 4.0 | | | Exchange Traded Funds |
| | Schwab U.S. Dividend Equity ETF | | | 3.5 | | | Exchange Traded Funds |
| | iShares Edge MSCI USA Quality Factor ETF | | | 2.5 | | | Exchange Traded Funds |
| | iShares Edge MSCI Minimum Volatility Emerging Markets ETF | | | 2.0 | | | Exchange Traded Funds |
| | Invesco Optimum Yield Diversified Commodity Strategy No. K-1 ETF | | | 2.0 | | | Exchange Traded Funds |
| | | Vanguard Information Technology ETF | | | 2.0 | | | Exchange Traded Funds |
| | 5 | | The top 10 holdings may not be representative of the Portfolio’s future investments. The top 10 holdings exclude investments in money market funds. |
| | | | | | | | | | |
| | PORTFOLIO COMPOSITION6 | |
| | | Holding | | As of August 31, 2018 | | | As of August 31, 2017 | |
| | Bond Funds | | | 71.0 | % | | | 65.1 | % |
| | Stock Funds | | | 19.0 | | | | 20.3 | |
| | Foreign Stock Funds | | | 5.9 | | | | 7.8 | |
| | Investment Companies | | | 0.5 | | | | 3.2 | |
| | | Alternative Funds | | | 2.0 | | | | 3.0 | |
| | 6 | | The Portfolio is actively managed and, as such, its composition may differ over time. The percentage shown for each fund type reflects the value of that fund type as a percentage of the Portfolio’s net assets. Figures above may not sum to 100% due to rounding and/or exclusion of other assets and liabilities. |
12
GOLDMAN SACHS TARGET DATE 2020 PORTFOLIO
Performance Summary
August 31, 2018
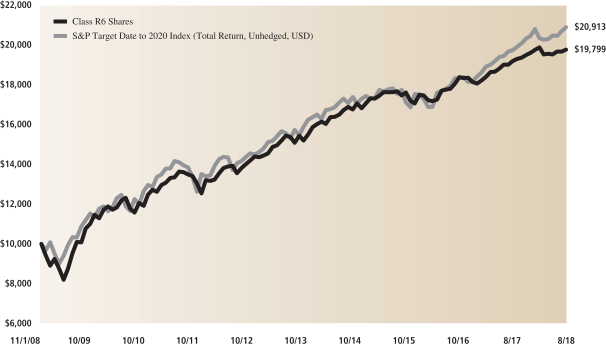
The following graph shows the value, as of August 31, 2018, of a $10,000 investment made on November 1, 2008 in Class R6 Shares. For comparative purposes, the performance of the Portfolio’s benchmark, the S&P Target Date to 2020 Index (Total Return, Unhedged, USD), is shown. This performance data represents past performance and should not be considered indicative of future performance, which will fluctuate with changes in market conditions. These performance fluctuations may cause an investor’s shares, when redeemed, to be worth more or less than their original cost. Performance reflects applicable fee waivers and/or expense limitations currently in effect during the periods shown and in their absence, performance would be reduced. Returns do not reflect the deduction of taxes that a shareholder would pay on Portfolio distributions or the redemption of Portfolio shares. Performance of Class A, Institutional, Service, Investor and Class R Shares will vary from Class R6 Shares due to differences in class specific fees and any applicable sales charges. In addition to the Sub-Adviser’s decisions regarding underlying fund selection and allocations among them, other factors may affect Portfolio performance. These factors include, but are not limited to, portfolio operating fees and expenses, portfolio turnover and subscription and redemption cash flows affecting the Portfolio.
|
| Target Date 2020 Portfolio’s Lifetime Performance |
Performance of a $10,000 investment, with distributions reinvested, from November 1, 2008 through August 31, 2018.
| | | | | | | | | | | | | | | | |
Average Annual Total Return through August 31, 2018 | | | One Year | | | | Five Years | | | | Ten Years | | | | Since Inception | |
Class A (Commenced August 22, 2016) | | | | | | | | | | | | | | | | |
Excluding sales charges | | | 2.89% | | | | N/A | | | | N/A | | | | 3.63% | |
Including sales charges | | | -2.78% | | | | N/A | | | | N/A | | | | 0.80% | |
| |
Institutional (Commenced August 22, 2016) | | | 3.33% | | | | N/A | | | | N/A | | | | 4.07% | |
| |
Service (Commenced August 22, 2016) | | | 2.73% | | | | N/A | | | | N/A | | | | 3.53% | |
| |
Investor (Commenced August 22, 2016) | | | 3.19% | | | | N/A | | | | N/A | | | | 3.93% | |
| |
Class R (Commenced August 22, 2016) | | | 2.61% | | | | N/A | | | | N/A | | | | 3.39% | |
| |
Class R6 (Commenced October 1, 2007) | | | 3.33% | | | | 5.59% | | | | 4.45% | | | | 2.92% | |
| |
13
FUND BASICS
Target Date 2025 Portfolio
as of August 31, 2018
| | | | | | | | | | |
| | PERFORMANCE REVIEW | |
| | | September 1, 2017–August 31, 2018 | | Portfolio Total Return
(based on NAV)1 | | | S&P Target Date To
2025 (Total Return,
Unhedged, USD)2 | |
| | Class A | | | 5.42 | % | | | 7.19 | % |
| | Institutional | | | 5.70 | | | | 7.19 | |
| | Service | | | 5.22 | | | | 7.19 | |
| | Investor | | | 5.59 | | | | 7.19 | |
| | Class R | | | 4.98 | | | | 7.19 | |
| | | Class R6 | | | 5.73 | | | | 7.19 | |
| | 1 | | The net asset value (“NAV”) represents the net assets of the class of the Portfolio (ex-dividend) divided by the total number of shares of the class outstanding. The Portfolio’s performance assumes the reinvestment of dividends and other distributions. The Portfolio’s performance does not reflect the deduction of any applicable sales charges. |
| | 2 | | The S&P Target Date Index Series is a component of the S&P Target Allocation Index Family, and is related to the S&P Target Risk Index Series. Both series are broadly representative of the investment opportunity available to investors in target date and target risk funds, respectively. The index series reflects the market consensus for asset allocations for different target date horizons. In particular, each index is representative of the investment opportunity available to investors for the corresponding target date horizon, with asset class exposures driven by a survey of available target date funds for that horizon. |
| | | | | | | | | | | | |
| | STANDARDIZED TOTAL RETURNS3 | | | |
| | | For the period ended 6/30/18 | | One Year | | | Since Inception | | | Inception Date |
| | Class A | | | -0.82 | % | | | 2.34 | % | | 8/22/16 |
| | Institutional | | | 5.25 | | | | 5.88 | | | 8/22/16 |
| | Service | | | 4.77 | | | | 5.36 | | | 8/22/16 |
| | Investor | | | 5.14 | | | | 5.74 | | | 8/22/16 |
| | Class R | | | 4.63 | | | | 5.19 | | | 8/22/16 |
| | | Class R6 | | | 5.28 | | | | 5.90 | | | 8/22/16 |
| | 3 | | The Standardized Total Returns are average annual total returns or cumulative total returns (only if the performance period is one year or less) as of the most recent calendar quarter-end. They assume reinvestment of all distributions at NAV. These returns reflect a maximum initial sales charge of 5.5% for Class A Shares. Because Institutional, Service, Investor, Class R and Class R6 Shares do not involve a sales charge, such a charge is not applied to their Standardized Total Returns. |
The returns set forth in the tables above represent past performance. Past performance does not guarantee future results. The Portfolio’s investment return and principal value will fluctuate so that an investor’s shares, when redeemed, may be worth more or less than their original cost. Current performance may be lower or higher than the performance quoted above. Please visit our web site at www.GSAMFUNDS.com to obtain the most recent month-end returns. Performance reflects applicable fee waivers and/or expense limitations in effect during the periods shown. In their absence, performance would be reduced. Returns do not reflect the deduction of taxes that a shareholder would pay on Portfolio distributions or the redemption of Portfolio shares. Returns less than 12 months are cumulative, not annualized.
14
FUND BASICS
| | | | | | | | | | |
| | EXPENSE RATIOS4 | |
| | | | | Net Expense Ratio (Current) | | | Gross Expense Ratio (Before Waivers) | |
| | Class A | | | 0.87 | % | | | 3.29 | % |
| | Institutional | | | 0.48 | | | | 2.90 | |
| | Service | | | 0.98 | | | | 3.40 | |
| | Investor | | | 0.62 | | | | 3.04 | |
| | Class R | | | 1.12 | | | | 3.54 | |
| | | Class R6 | | | 0.47 | | | | 2.89 | |
| | 4 | | The expense ratios of the Portfolio, both current (net of applicable fee waivers and/or expense limitations) and before waivers (gross of applicable fee waivers and/or expense limitations) are as set forth above according to the most recent publicly available Prospectus for the Portfolio and will differ from the expense ratios disclosed in the Financial Highlights in this report due to the inclusion of Underlying Fund fees and expenses, which are not included in the operating expenses of the Portfolio reflected in the Financial Highlights. Pursuant to a contractual arrangement, the Portfolio’s waivers and/or expense limitations will remain in place through at least December 29, 2018, and prior to such date, the Investment Adviser may not terminate the arrangements without the approval of the Portfolio’s Board of Trustees. If these arrangements are discontinued in the future, the expense ratios may change without shareholder approval. |
| | | | | | | | |
| | TOP TEN HOLDINGS AS OF 8/31/185 |
| | | Holding | | % of Net Assets | | | Line of Business |
| | Schwab Intermediate-Term U.S. Treasury ETF | | | 20.0 | % | | Exchange Traded Funds |
| | Vanguard Short-Term Corporate Bond ETF | | | 15.0 | | | Exchange Traded Funds |
| | Schwab U.S. TIPS ETF | | | 15.0 | | | Exchange Traded Funds |
| | iShares Core S&P 500 ETF | | | 11.5 | | | Exchange Traded Funds |
| | Schwab U.S. Dividend Equity ETF | | | 4.5 | | | Exchange Traded Funds |
| | iShares Edge MSCI Minimum Volatility Emerging Markets ETF | | | 3.5 | | | Exchange Traded Funds |
| | iShares 20+ Year Treasury Bond ETF | | | 3.5 | | | Exchange Traded Funds |
| | iShares Core S&P Mid-Cap ETF | | | 3.0 | | | Exchange Traded Funds |
| | iShares Edge MSCI USA Quality Factor ETF | | | 2.5 | | | Exchange Traded Funds |
| | | Invesco Optimum Yield Diversified Commodity Strategy No. K-1 ETF | | | 2.5 | | | Exchange Traded Funds |
| | 5 | | The top 10 holdings may not be representative of the Portfolio’s future investments. The top 10 holdings exclude investments in money market funds. |
| | | | | | | | | | |
| | PORTFOLIO COMPOSITION6 | |
| | | Holding | | As of August 31, 2018 | | | As of August 31, 2017 | |
| | Bond Funds | | | 53.5 | % | | | 48.5 | % |
| | Stock Funds | | | 30.9 | | | | 31.5 | |
| | Foreign Stock Funds | | | 10.9 | | | | 13.1 | |
| | Alternative Funds | | | 2.5 | | | | 3.0 | |
| | | Investment Companies | | | 0.5 | | | | 3.5 | |
| | 6 | | The Portfolio is actively managed and, as such, its composition may differ over time. The percentage shown for each fund type reflects the value of that fund type as a percentage of the Portfolio’s net assets. Figures above may not sum to 100% due to rounding and/or exclusion of other assets and liabilities. |
15
GOLDMAN SACHS TARGET DATE 2025 PORTFOLIO
Performance Summary
August 31, 2018
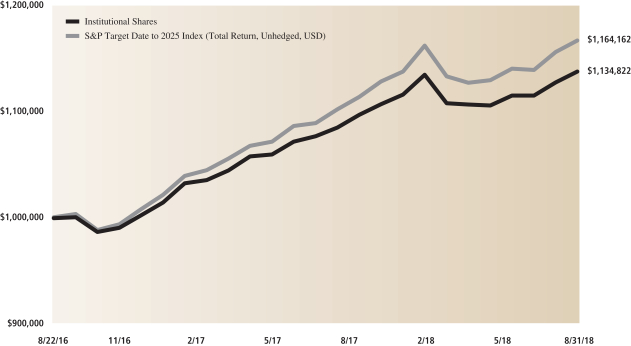
The following graph shows the value, as of August 31, 2018, of a $1,000,000 investment made on August 22, 2016 (commencement of operations) in Institutional Shares. For comparative purposes, the performance of the Portfolio’s benchmark, the S&P Target Date to 2025 Index (Total Return, Unhedged, USD), is shown. This performance data represents past performance and should not be considered indicative of future performance, which will fluctuate with changes in market conditions. These performance fluctuations may cause an investor’s shares, when redeemed, to be worth more or less than their original cost. Performance reflects applicable fee waivers and/or expense limitations currently in effect during the periods shown and in their absence, performance would be reduced. Returns do not reflect the deduction of taxes that a shareholder would pay on Portfolio distributions or the redemption of Portfolio shares. Performance of Class A, Service, Investor, Class R and Class R6 Shares will vary from Institutional Shares due to differences in class specific fees and any applicable sales charges. In addition to the Sub-Adviser’s decisions regarding underlying fund selection and allocations among them, other factors may affect Portfolio performance. These factors include, but are not limited to, portfolio operating fees and expenses, portfolio turnover and subscription and redemption cash flows affecting the Portfolio.
|
| Target Date 2025 Portfolio’s Lifetime Performance |
Performance of a $1,000,000 investment, with distributions reinvested, from August 22, 2016 through August 31, 2018.
| | | | | | | | |
Average Annual Total Return through August 31, 2018 | | | One Year | | | | Since Inception | |
Class A (Commenced August 22, 2016) | | | | | | | | |
Excluding sales charges | | | 5.42% | | | | 6.08% | |
Including sales charges | | | -0.40% | | | | 3.17% | |
| |
Institutional (Commenced August 22, 2016) | | | 5.70% | | | | 6.44% | |
| |
Service (Commenced August 22, 2016) | | | 5.22% | | | | 5.96% | |
| |
Investor (Commenced August 22, 2016) | | | 5.59% | | | | 6.30% | |
| |
Class R (Commenced August 22, 2016) | | | 4.98% | | | | 5.76% | |
| |
Class R6 (Commenced August 22, 2016) | | | 5.73% | | | | 6.45% | |
| |
16
FUND BASICS
Target Date 2030 Portfolio
as of August 31, 2018
| | | | | | | | | | |
| | PERFORMANCE REVIEW | |
| | | September 1, 2017–August 31, 2018 | | Portfolio Total Return
(based on NAV)1 | | | S&P Target Date To
2030 (Total Return,
Unhedged, USD)2 | |
| | Class A | | | 6.93 | % | | | 8.66 | % |
| | Institutional | | | 7.29 | | | | 8.66 | |
| | Service | | | 6.71 | | | | 8.66 | |
| | Investor | | | 7.06 | | | | 8.66 | |
| | Class R | | | 6.59 | | | | 8.66 | |
| | | Class R6 | | | 7.30 | | | | 8.66 | |
| | 1 | | The net asset value (“NAV”) represents the net assets of the class of the Portfolio (ex-dividend) divided by the total number of shares of the class outstanding. The Portfolio’s performance assumes the reinvestment of dividends and other distributions. The Portfolio’s performance does not reflect the deduction of any applicable sales charges. |
| | 2 | | The S&P Target Date Index Series is a component of the S&P Target Allocation Index Family, and is related to the S&P Target Risk Index Series. Both series are broadly representative of the investment opportunity available to investors in target date and target risk funds, respectively. The index series reflects the market consensus for asset allocations for different target date horizons. In particular, each index is representative of the investment opportunity available to investors for the corresponding target date horizon, with asset class exposures driven by a survey of available target date funds for that horizon. |
The returns set forth in the table above represent past performance. Past performance does not guarantee future results. The Portfolio’s investment return and principal value will fluctuate so that an investor’s shares, when redeemed, may be worth more or less than their original cost. Current performance may be lower or higher than the performance quoted above. Please visit our web site at www.GSAMFUNDS.com to obtain the most recent month-end returns. Performance reflects fee waivers and/or expense limitations in effect. In their absence, performance would be reduced. Returns do not reflect the deduction of taxes that a shareholder would pay on Portfolio distributions or the redemption of Portfolio shares. Returns less than 12 months are cumulative, not annualized.
17
FUND BASICS
| | | | | | | | | | | | | | | | | | | | |
| | STANDARDIZED TOTAL RETURNS3 |
| | | For the period ended 6/30/18 | | One Year | | | Five Years | | | Ten Years | | | Since Inception | | | Inception Date |
| | Class A | | | 0.15 | % | | | N/A | | | | N/A | | | | 3.52 | % | | 8/22/16 |
| | Institutional | | | 6.39 | | | | N/A | | | | N/A | | | | 7.20 | | | 8/22/16 |
| | Service | | | 5.82 | | | | N/A | | | | N/A | | | | 6.68 | | | 8/22/16 |
| | Investor | | | 6.16 | | | | N/A | | | | N/A | | | | 6.99 | | | 8/22/16 |
| | Class R | | | 5.70 | | | | N/A | | | | N/A | | | | 6.52 | | | 8/22/16 |
| | | Class R6 | | | 6.40 | | | | 7.50 | % | | | 5.01 | % | | | 3.68 | | | 10/01/07 |
| | 3 | | The Standardized Total Returns are average annual total returns or cumulative total returns (only if the performance period is one year or less) as of the most recent calendar quarter-end. They assume reinvestment of all distributions at NAV. These returns reflect a maximum initial sales charge of 5.5% for Class A Shares. Because Institutional, Service, Investor, Class R and Class R6 Shares do not involve a sales charge, such a charge is not applied to their Standardized Total Returns. |
Effective August 22, 2016, the Madison Target Retirement 2030 Fund (the “Predecessor Fund”) was reorganized into the Portfolio. The Portfolio has assumed the Predecessor Fund’s historical performance. The returns for the Predecessor Fund for periods prior to August 29, 2014 reflect the performance of the Madison Target Retirement 2030 Fund’s Class I Shares, a series of Ultra Series Fund (the “Ultra Predecessor Fund”). As of August 29, 2014, the inception date of the Predecessor Fund, the Ultra Predecessor Fund exchanged in kind substantially all of its portfolio holdings for Class R6 shares of the Predecessor Fund. As a result, the Predecessor Fund assumed the performance of the Ultra Predecessor Fund. Performance reflects applicable fee waivers and/or expense limitations in effect during the periods shown. Past performance does not guarantee future results, which may vary. The value of investments and the income derived from investments will fluctuate and can go down as well as up. A loss of principal may occur.
The returns set forth in the table above represent past performance. Past performance does not guarantee future results. The Portfolio’s investment return and principal value will fluctuate so that an investor’s shares, when redeemed, may be worth more or less than their original cost. Current performance may be lower or higher than the performance quoted above. Please visit our web site at www.GSAMFUNDS.com to obtain the most recent month-end returns. Performance reflects applicable fee waivers and/or expense limitations in effect during the periods shown. In their absence, performance would be reduced. Returns do not reflect the deduction of taxes that a shareholder would pay on Portfolio distributions or the redemption of Portfolio shares. Returns less than 12 months are cumulative, not annualized.
| | | | | | | | | | |
| | EXPENSE RATIOS4 | |
| | | | | Net Expense Ratio (Current) | | | Gross Expense Ratio (Before Waivers) | |
| | Class A | | | 0.87 | % | | | 1.34 | % |
| | Institutional | | | 0.48 | | | | 0.95 | |
| | Service | | | 0.98 | | | | 1.45 | |
| | Investor | | | 0.62 | | | | 1.09 | |
| | Class R | | | 1.12 | | | | 1.59 | |
| | | Class R6 | | | 0.47 | | | | 0.94 | |
| | 4 | | The expense ratios of the Portfolio, both current (net of applicable fee waivers and/or expense limitations) and before waivers (gross of applicable fee waivers and/or expense limitations) are as set forth above according to the most recent publicly available Prospectus for the Portfolio and will differ from the expense ratios disclosed in the Financial Highlights in this report due to the inclusion of Underlying Fund fees and expenses, which are not included in the operating expenses of the Portfolio reflected in the Financial Highlights. Pursuant to a contractual arrangement, the Portfolio’s waivers and/or expense limitations will remain in place through at least December 29, 2018, and prior to such date, the Investment Adviser may not terminate the arrangements without the approval of the Portfolio’s Board of Trustees. If these arrangements are discontinued in the future, the expense ratios may change without shareholder approval. |
18
FUND BASICS
| | | | | | | | |
| | TOP TEN HOLDINGS AS OF 8/31/185 |
| | | Holding | | % of Net Assets | | | Line of Business |
| | Schwab Intermediate-Term U.S. Treasury ETF | | | 18.0 | % | | Exchange Traded Funds |
| | iShares Core S&P 500 ETF | | | 17.0 | | | Exchange Traded Funds |
| | Vanguard Short-Term Corporate Bond ETF | | | 12.0 | | | Exchange Traded Funds |
| | Schwab U.S. TIPS ETF | | | 10.5 | | | Exchange Traded Funds |
| | Schwab U.S. Dividend Equity ETF | | | 5.0 | | | Exchange Traded Funds |
| | iShares Edge MSCI Minimum Volatility Emerging Markets ETF | | | 4.0 | | | Exchange Traded Funds |
| | iShares Core S&P Mid-Cap ETF | | | 3.5 | | | Exchange Traded Funds |
| | iShares Edge MSCI USA Quality Factor ETF | | | 2.7 | | | Exchange Traded Funds |
| | iShares 20+ Year Treasury Bond ETF | | | 2.5 | | | Exchange Traded Funds |
| | | Invesco DB Optimum Yield Diversified Commodity Strategy No. K-1 ETF | | | 2.5 | | | Exchange Traded Funds |
| | 5 | | The top 10 holdings may not be representative of the Portfolio’s future investments. The top 10 holdings exclude investments in money market funds. |
| | | | | | | | | | |
| | PORTFOLIO COMPOSITION6 | |
| | | Holding | | As of August 31, 2018 | | | As of August 31, 2017 | |
| | Bond Funds | | | 43.1 | % | | | 39.3 | % |
| | Stock Funds | | | 39.9 | | | | 36.3 | |
| | Foreign Stock Funds | | | 12.5 | | | | 16.4 | |
| | Alternative Funds | | | 2.5 | | | | 3.0 | |
| | | Investment Companies | | | 0.5 | | | | 2.0 | |
| | 6 | | The Portfolio is actively managed and, as such, its composition may differ over time. The percentage shown for each fund type reflects the value of that fund type as a percentage of the Portfolio’s net assets. Figures above may not sum to 100% due to rounding and/or exclusion of other assets and liabilities. |
19
GOLDMAN SACHS TARGET DATE 2030 PORTFOLIO
Performance Summary
August 31, 2018
The following graph shows the value, as of August 31, 2018, of a $10,000 investment made on November 1, 2008 in Class R6 Shares. For comparative purposes, the performance of the Portfolio’s benchmark, the S&P Target Date to 2030 Index (Total Return, Unhedged, USD), is shown. This performance data represents past performance and should not be considered indicative of future performance, which will fluctuate with changes in market conditions. These performance fluctuations may cause an investor’s shares, when redeemed, to be worth more or less than their original cost. Performance reflects applicable fee waivers and/or expense limitations currently in effect during the periods shown and in their absence, performance would be reduced. Returns do not reflect the deduction of taxes that a shareholder would pay on Portfolio distributions or the redemption of Portfolio shares. Performance of Class A, Institutional, Service, Investor and Class R Shares will vary from Class R6 Shares due to differences in class specific fees and any applicable sales charges. In addition to the Sub-Adviser’s decisions regarding underlying fund selection and allocations among them, other factors may affect Portfolio performance. These factors include, but are not limited to, portfolio operating fees and expenses, portfolio turnover and subscription and redemption cash flows affecting the Portfolio.
|
| Target Date 2030 Portfolio’s Lifetime Performance |
Performance of a $10,000 investment, with distributions reinvested, from November 1, 2008 through August 31, 2018.

| | | | | | | | | | | | |
Average Annual Total Return through August 31, 2018 | | | One Year | | | | Five Years | | | Ten Years | | Since Inception |
Class A (Commenced August 22, 2016) | | | | | | | | | | | | |
Excluding sales charges | | | 6.93% | | | | N/A | | | N/A | | 7.53% |
Including sales charges | | | 1.09% | | | | N/A | | | N/A | | 4.56% |
|
Institutional (Commenced August 22, 2016) | | | 7.29% | | | | N/A | | | N/A | | 7.96% |
|
Service (Commenced August 22, 2016) | | | 6.71% | | | | N/A | | | N/A | | 7.43% |
|
Investor (Commenced August 22, 2016) | | | 7.06% | | | | N/A | | | N/A | | 7.77% |
|
Class R (Commenced August 22, 2016) | | | 6.59% | | | | N/A | | | N/A | | 7.28% |
|
Class R6 (Commenced October 1, 2007) | | | 7.30% | | | | 7.82% | | | 5.69% | | 3.87% |
|
20
FUND BASICS
Target Date 2035 Portfolio
as of August 31, 2018
| | | | | | | | | | |
| | PERFORMANCE REVIEW | |
| | | September 1, 2017–August 31, 2018 | | Portfolio Total Return
(based on NAV)1 | | | S&P Target Date To
2035 (Total Return,
Unhedged, USD)2 | |
| | Class A | | | 7.54 | % | | | 10.01 | % |
| | Institutional | | | 8.02 | | | | 10.01 | |
| | Service | | | 7.44 | | | | 10.01 | |
| | Investor | | | 7.82 | | | | 10.01 | |
| | Class R | | | 7.29 | | | | 10.01 | |
| | | Class R6 | | | 8.05 | | | | 10.01 | |
| | 1 | | The net asset value (“NAV”) represents the net assets of the class of the Portfolio (ex-dividend) divided by the total number of shares of the class outstanding. The Portfolio’s performance assumes the reinvestment of dividends and other distributions. The Portfolio’s performance does not reflect the deduction of any applicable sales charges. |
| | 2 | | The S&P Target Date Index Series is a component of the S&P Target Allocation Index Family, and is related to the S&P Target Risk Index Series. Both series are broadly representative of the investment opportunity available to investors in target date and target risk funds, respectively. The index series reflects the market consensus for asset allocations for different target date horizons. In particular, each index is representative of the investment opportunity available to investors for the corresponding target date horizon, with asset class exposures driven by a survey of available target date funds for that horizon. |
| | | | | | | | | | | | |
| | STANDARDIZED TOTAL RETURNS3 |
| | | For the period ended 6/30/18 | | One Year | | | Since Inception | | | Inception Date |
| | Class A | | | 0.70 | % | | | 4.25 | % | | 8/22/16 |
| | Institutional | | | 6.94 | | | | 7.86 | | | 8/22/16 |
| | Service | | | 6.37 | | | | 7.33 | | | 8/22/16 |
| | Investor | | | 6.84 | | | | 7.71 | | | 8/22/16 |
| | Class R | | | 6.22 | | | | 7.17 | | | 8/22/16 |
| | | Class R6 | | | 6.97 | | | | 7.87 | | | 8/22/16 |
| | 3 | | The Standardized Total Returns are average annual total returns or cumulative total returns (only if the performance period is one year or less) as of the most recent calendar quarter-end. They assume reinvestment of all distributions at NAV. These returns reflect a maximum initial sales charge of 5.5% for Class A Shares. Because Institutional, Service, Investor, Class R and Class R6 Shares do not involve a sales charge, such a charge is not applied to their Standardized Total Returns. |
The returns set forth in the tables above represent past performance. Past performance does not guarantee future results. The Portfolio’s investment return and principal value will fluctuate so that an investor’s shares, when redeemed, may be worth more or less than their original cost. Current performance may be lower or higher than the performance quoted above. Please visit our web site at www.GSAMFUNDS.com to obtain the most recent month-end returns. Performance reflects applicable fee waivers and/or expense limitations in effect during the periods shown. In their absence, performance would be reduced. Returns do not reflect the deduction of taxes that a shareholder would pay on Portfolio distributions or the redemption of Portfolio shares. Returns less than 12 months are cumulative, not annualized.
21
FUND BASICS
| | | | | | | | | | |
| | EXPENSE RATIOS4 | |
| | | | | Net Expense Ratio (Current) | | | Gross Expense Ratio (Before Waivers) | |
| | Class A | | | 0.87 | % | | | 3.26 | % |
| | Institutional | | | 0.48 | | | | 2.87 | |
| | Service | | | 0.98 | | | | 3.37 | |
| | Investor | | | 0.62 | | | | 3.01 | |
| | Class R | | | 1.12 | | | | 3.51 | |
| | | Class R6 | | | 0.47 | | | | 2.86 | |
| | 4 | | The expense ratios of the Portfolio, both current (net of applicable fee waivers and/or expense limitations) and before waivers (gross of applicable fee waivers and/or expense limitations) are as set forth above according to the most recent publicly available Prospectus for the Portfolio and will differ from the expense ratios disclosed in the Financial Highlights in this report due to the inclusion of Underlying Fund fees and expenses, which are not included in the operating expenses of the Portfolio reflected in the Financial Highlights. Pursuant to a contractual arrangement, the Portfolio’s waivers and/or expense limitations will remain in place through at least December 29, 2018, and prior to such date, the Investment Adviser may not terminate the arrangements without the approval of the Portfolio’s Board of Trustees. If these arrangements are discontinued in the future, the expense ratios may change without shareholder approval. |
| | | | | | | | |
| | TOP TEN HOLDINGS AS OF 8/31/185 |
| | | Holding | | % of Net Assets | | | Line of Business |
| | iShares Core S&P 500 ETF | | | 17.9 | % | | Exchange Traded Funds |
| | Schwab Intermediate-Term U.S. Treasury ETF | | | 16.0 | | | Exchange Traded Funds |
| | Vanguard Short-Term Corporate Bond ETF | | | 10.5 | | | Exchange Traded Funds |
| | Schwab U.S. TIPS ETF | | | 9.0 | | | Exchange Traded Funds |
| | Schwab U.S. Dividend Equity ETF | | | 5.5 | | | Exchange Traded Funds |
| | iShares Edge MSCI Minimum Volatility Emerging Markets ETF | | | 4.5 | | | Exchange Traded Funds |
| | iShares Core S&P Mid-Cap ETF | | | 4.0 | | | Exchange Traded Funds |
| | iShares Edge MSCI USA Quality Factor ETF | | | 3.0 | | | Exchange Traded Funds |
| | Invesco Optimum Yield Diversified Commodity Strategy No. K-1 ETF | | | 3.0 | | | Exchange Traded Funds |
| | | Vanguard FTSE Europe ETF | | | 3.0 | | | Exchange Traded Funds |
| | 5 | | The top 10 holdings may not be representative of the Portfolio’s future investments. The top 10 holdings exclude investments in money market funds. |
| | | | | | | | | | |
| | PORTFOLIO COMPOSITION6 | |
| | | Holding | | As of August 31, 2018 | | | As of August 31, 2017 | |
| | Stock Funds | | | 41.6 | % | | | 39.6 | % |
| | Bond Funds | | | 38.0 | | | | 34.5 | |
| | Foreign Stock Funds | | | 15.2 | | | | 18.5 | |
| | Investment Companies | | | 0.5 | | | | 3.5 | |
| | | Alternative Funds | | | 3.0 | | | | 3.0 | |
| | 6 | | The Portfolio is actively managed and, as such, its composition may differ over time. The percentage shown for each fund type reflects the value of that fund type as a percentage of the Portfolio’s net assets. Figures above may not sum to 100% due to rounding and/or exclusion of other assets and liabilities. |
22
GOLDMAN SACHS TARGET DATE 2035 PORTFOLIO
Performance Summary
August 31, 2018
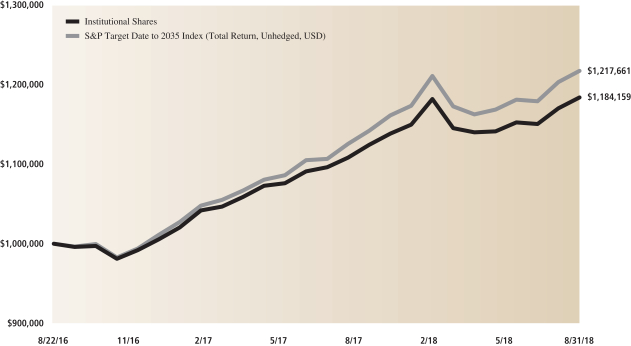
The following graph shows the value, as of August 31, 2018, of a $1,000,000 investment made on August 22, 2016 (commencement of operations) in Institutional Shares. For comparative purposes, the performance of the Portfolio’s benchmark, the S&P Target Date to 2035 Index (Total Return, Unhedged, USD), is shown. This performance data represents past performance and should not be considered indicative of future performance, which will fluctuate with changes in market conditions. These performance fluctuations may cause an investor’s shares, when redeemed, to be worth more or less than their original cost. Performance reflects applicable fee waivers and/or expense limitations currently in effect during the periods shown and in their absence, performance would be reduced. Returns do not reflect the deduction of taxes that a shareholder would pay on Portfolio distributions or the redemption of Portfolio shares. Performance of Class A, Service, Investor, Class R and Class R6 Shares will vary from Institutional Shares due to differences in class specific fees and any applicable sales charges. In addition to the Sub-Adviser’s decisions regarding underlying fund selection and allocations among them, other factors may affect Portfolio performance. These factors include, but are not limited to, portfolio operating fees and expenses, portfolio turnover and subscription and redemption cash flows affecting the Portfolio.
|
| Target Date 2035 Portfolio’s Lifetime Performance |
Performance of a $1,000,000 investment, with distributions reinvested, from August 22, 2016 through August 31, 2018.
| | | | | | |
Average Annual Total Return through August 31, 2018 | | | One Year | | | Since Inception |
Class A (Commenced August 22, 2016) | | | | | | |
Excluding sales charges | | | 7.54% | | | 8.28% |
Including sales charges | | | 1.64% | | | 5.32% |
|
Institutional (Commenced August 22, 2016) | | | 8.02% | | | 8.69% |
|
Service (Commenced August 22, 2016) | | | 7.44% | | | 8.17% |
|
Investor (Commenced August 22, 2016) | | | 7.82% | | | 8.52% |
|
Class R (Commenced August 22, 2016) | | | 7.29% | | | 8.02% |
|
Class R6 (Commenced August 22, 2016) | | | 8.05% | | | 8.71% |
|
23
FUND BASICS
Target Date 2040 Portfolio
as of August 31, 2018
| | | | | | | | | | |
| | PERFORMANCE REVIEW | |
| | | September 1, 2017–August 31, 2018 | | Portfolio Total Return
(based on NAV)1 | | | S&P Target Date To
2040 (Total Return,
Unhedged, USD)2 | |
| | Class A | | | 8.23 | % | | | 11.10 | % |
| | Institutional | | | 8.71 | | | | 11.10 | |
| | Service | | | 8.13 | | | | 11.10 | |
| | Investor | | | 8.46 | | | | 11.10 | |
| | Class R | | | 8.02 | | | | 11.10 | |
| | | Class R6 | | | 8.70 | | | | 11.10 | |
| | 1 | | The net asset value (“NAV”) represents the net assets of the class of the Portfolio (ex-dividend) divided by the total number of shares of the class outstanding. The Portfolio’s performance assumes the reinvestment of dividends and other distributions. The Portfolio’s performance does not reflect the deduction of any applicable sales charges. |
| | 2 | | The S&P Target Date Index Series is a component of the S&P Target Allocation Index Family, and is related to the S&P Target Risk Index Series. Both series are broadly representative of the investment opportunity available to investors in target date and target risk funds, respectively. The index series reflects the market consensus for asset allocations for different target date horizons. In particular, each index is representative of the investment opportunity available to investors for the corresponding target date horizon, with asset class exposures driven by a survey of available target date funds for that horizon. |
The returns set forth in the table above represent past performance. Past performance does not guarantee future results. The Portfolio’s investment return and principal value will fluctuate so that an investor’s shares, when redeemed, may be worth more or less than their original cost. Current performance may be lower or higher than the performance quoted above. Please visit our web site at www.GSAMFUNDS.com to obtain the most recent month-end returns. Performance reflects fee waivers and/or expense limitations in effect. In their absence, performance would be reduced. Returns do not reflect the deduction of taxes that a shareholder would pay on Portfolio distributions or the redemption of Portfolio shares. Returns less than 12 months are cumulative, not annualized.
24
FUND BASICS
| | | | | | | | | | | | | | | | | | | | |
| | STANDARDIZED TOTAL RETURNS3 |
| | | For the period ended 6/30/18 | | One Year | | | Five Years | | | Ten Years | | | Since Inception | | | Inception Date |
| | Class A | | | 1.13 | % | | | N/A | | | | N/A | | | | 4.93 | % | | 8/22/16 |
| | Institutional | | | 7.53 | | | | N/A | | | | N/A | | | | 8.63 | | | 8/22/16 |
| | Service | | | 6.96 | | | | N/A | | | | N/A | | | | 8.11 | | | 8/22/16 |
| | Investor | | | 7.28 | | | | N/A | | | | N/A | | | | 8.47 | | | 8/22/16 |
| | Class R | | | 6.74 | | | | N/A | | | | N/A | | | | 7.90 | | | 8/22/16 |
| | | Class R6 | | | 7.53 | | | | 8.43 | % | | | 5.14 | % | | | 3.70 | | | 10/01/07 |
| | 3 | | The Standardized Total Returns are average annual total returns or cumulative total returns (only if the performance period is one year or less) as of the most recent calendar quarter-end. They assume reinvestment of all distributions at NAV. These returns reflect a maximum initial sales charge of 5.5% for Class A Shares. Because Institutional, Service, Investor, Class R and Class R6 Shares do not involve a sales charge, such a charge is not applied to their Standardized Total Returns. |
Effective August 22, 2016, the Madison Target Retirement 2040 Fund (the “Predecessor Fund”) was reorganized into the Portfolio. The Portfolio has assumed the Predecessor Fund’s historical performance. The returns for the Predecessor Fund for periods prior to August 29, 2014 reflect the performance of the Madison Target Retirement 2040 Fund’s Class I Shares, a series of Ultra Series Fund (the “Ultra Predecessor Fund”). As of August 29, 2014, the inception date of the Predecessor Fund, the Ultra Predecessor Fund exchanged in kind substantially all of its portfolio holdings for Class R6 shares of the Predecessor Fund. As a result, the Predecessor Fund assumed the performance of the Ultra Predecessor Fund. Performance reflects applicable fee waivers and/or expense limitations in effect during the periods shown. Past performance does not guarantee future results, which may vary. The value of investments and the income derived from investments will fluctuate and can go down as well as up. A loss of principal may occur.
The returns set forth in the table above represent past performance. Past performance does not guarantee future results. The Portfolio’s investment return and principal value will fluctuate so that an investor’s shares, when redeemed, may be worth more or less than their original cost. Current performance may be lower or higher than the performance quoted above. Please visit our web site at www.GSAMFUNDS.com to obtain the most recent month-end returns. Performance reflects applicable fee waivers and/or expense limitations in effect during the periods shown. In their absence, performance would be reduced. Returns do not reflect the deduction of taxes that a shareholder would pay on Portfolio distributions or the redemption of Portfolio shares. Returns less than 12 months are cumulative, not annualized.
| | | | | | | | | | |
| | EXPENSE RATIOS4 | |
| | | | | Net Expense Ratio (Current) | | | Gross Expense Ratio (Before Waivers) | |
| | Class A | | | 0.88 | % | | | 1.45 | % |
| | Institutional | | | 0.49 | | | | 1.06 | |
| | Service | | | 0.99 | | | | 1.56 | |
| | Investor | | | 0.63 | | | | 1.20 | |
| | Class R | | | 1.13 | | | | 1.70 | |
| | | Class R6 | | | 0.48 | | | | 1.05 | |
| | 4 | | The expense ratios of the Portfolio, both current (net of applicable fee waivers and/or expense limitations) and before waivers (gross of applicable fee waivers and/or expense limitations) are as set forth above according to the most recent publicly available Prospectus for the Portfolio and will differ from the expense ratios disclosed in the Financial Highlights in this report due to the inclusion of Underlying Fund fees and expenses, which are not included in the operating expenses of the Portfolio reflected in the Financial Highlights. Pursuant to a contractual arrangement, the Portfolio’s waivers and/or expense limitations will remain in place through at least December 29, 2018, and prior to such date, the Investment Adviser may not terminate the arrangements without the approval of the Portfolio’s Board of Trustees. If these arrangements are discontinued in the future, the expense ratios may change without shareholder approval. |
25
FUND BASICS
| | | | | | | | |
| | TOP TEN HOLDINGS AS OF 8/31/185 |
| | | Holding | | % of Net Assets | | | Line of Business |
| | iShares Core S&P 500 ETF | | | 19.0 | % | | Exchange Traded Funds |
| | Schwab Intermediate-Term U.S. Treasury ETF | | | 14.0 | | | Exchange Traded Funds |
| | Vanguard Short-Term Corporate Bond ETF | | | 9.0 | | | Exchange Traded Funds |
| | Schwab U.S. TIPS ETF | | | 7.5 | | | Exchange Traded Funds |
| | Schwab U.S. Dividend Equity ETF | | | 6.0 | | | Exchange Traded Funds |
| | iShares Edge MSCI Minimum Volatility Emerging Markets ETF | | | 5.0 | | | Exchange Traded Funds |
| | iShares Core S&P Mid-Cap ETF | | | 4.5 | | | Exchange Traded Funds |
| | Vanguard FTSE Europe ETF | | | 3.5 | | | Exchange Traded Funds |
| | iShares Edge MSCI USA Quality Factor ETF | | | 3.2 | | | Exchange Traded Funds |
| | | Invesco Optimum Yield Diversified Commodity Strategy No. K-1 ETF | | | 3.0 | | | Exchange Traded Funds |
| | 5 | | The top 10 holdings may not be representative of the Portfolio’s future investments. The top 10 holdings exclude investments in money market funds. |
| | | | | | | | | | |
| | PORTFOLIO COMPOSITION6 | |
| | | Holding | | As of August 31, 2018 | | | As of August 31, 2017 | |
| | Stock Funds | | | 46.4 | % | | | 43.1 | % |
| | Bond Funds | | | 33.1 | | | | 29.6 | |
| | Foreign Stock Funds | | | 15.4 | | | | 20.0 | |
| | Alternative Funds | | | 3.0 | | | | 3.0 | |
| | | Investment Companies | | | 0.6 | | | | 2.3 | |
| | 6 | | The Portfolio is actively managed and, as such, its composition may differ over time. The percentage shown for each fund type reflects the value of that fund type as a percentage of the Portfolio’s net assets. Figures above may not sum to 100% due to rounding and/or exclusion of other assets and liabilities. |
26
GOLDMAN SACHS TARGET DATE 2040 PORTFOLIO
Performance Summary
August 31, 2018
The following graph shows the value, as of August 31, 2018, of a $10,000 investment made on November 1, 2008 in Class R6 Shares. For comparative purposes, the performance of the Portfolio’s benchmark, the S&P Target Date to 2040 Index (Total Return, Unhedged, USD), is shown. This performance data represents past performance and should not be considered indicative of future performance, which will fluctuate with changes in market conditions. These performance fluctuations may cause an investor’s shares, when redeemed, to be worth more or less than their original cost. Performance reflects applicable fee waivers and/or expense limitations currently in effect during the periods shown and in their absence, performance would be reduced. Returns do not reflect the deduction of taxes that a shareholder would pay on Portfolio distributions or the redemption of Portfolio shares. Performance of Class A, Institutional, Service, Investor and Class R Shares will vary from Class R6 Shares due to differences in class specific fees and any applicable sales charges. In addition to the Sub-Adviser’s decisions regarding underlying fund selection and allocations among them, other factors may affect Portfolio performance. These factors include, but are not limited to, portfolio operating fees and expenses, portfolio turnover and subscription and redemption cash flows affecting the Portfolio.
|
| Target Date 2040 Portfolio’s Lifetime Performance |
Performance of a $10,000 investment, with distributions reinvested, from November 1, 2008 through August 31, 2018.
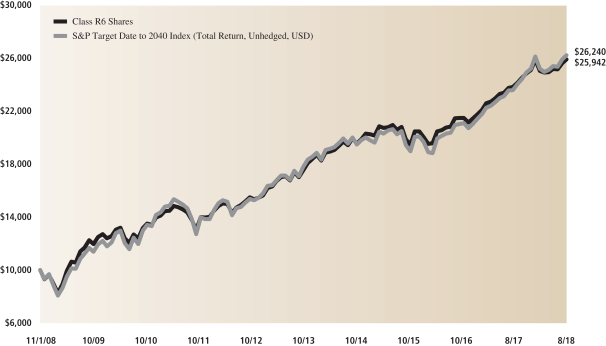
| | | | | | | | | | | | | | | | |
Average Annual Total Return through August 31, 2018 | | | One Year | | | | Five Years | | | | Ten Years | | | | Since Inception | |
Class A (Commenced August 22, 2016) | | | | | | | | | | | | | | | | |
Excluding sales charges | | | 8.23% | | | | N/A | | | | N/A | | | | 9.07% | |
Including sales charges | | | 2.25% | | | | N/A | | | | N/A | | | | 6.07% | |
| |
Institutional (Commenced August 22, 2016) | | | 8.71% | | | | N/A | | | | N/A | | | | 9.54% | |
| |
Service (Commenced August 22, 2016) | | | 8.13% | | | | N/A | | | | N/A | | | | 8.95% | |
| |
Investor (Commenced August 22, 2016) | | | 8.46% | | | | N/A | | | | N/A | | | | 9.33% | |
| |
Class R (Commenced August 22, 2016) | | | 8.02% | | | | N/A | | | | N/A | | | | 8.81% | |
| |
Class R6 (Commenced October 1, 2007) | | | 8.70% | | | | 8.79% | | | | 5.95% | | | | 3.92% | |
| |
27
FUND BASICS
Target Date 2045 Portfolio
as of August 31, 2018
| | | | | | | | | | |
| | PERFORMANCE REVIEW | |
| | | September 1, 2017–August 31, 2018 | | Portfolio Total Return
(based on NAV)1 | | | S&P Target Date To
2045 (Total Return,
Unhedged, USD)2 | |
| | Class A | | | 9.02 | % | | | 11.53 | % |
| | Institutional | | | 9.40 | | | | 11.53 | |
| | Service | | | 8.83 | | | | 11.53 | |
| | Investor | | | 9.19 | | | | 11.53 | |
| | Class R | | | 8.74 | | | | 11.53 | |
| | | Class R6 | | | 9.34 | | | | 11.53 | |
| | 1 | | The net asset value (“NAV”) represents the net assets of the class of the Portfolio (ex-dividend) divided by the total number of shares of the class outstanding. The Portfolio’s performance assumes the reinvestment of dividends and other distributions. The Portfolio’s performance does not reflect the deduction of any applicable sales charges. |
| | 2 | | The S&P Target Date Index Series is a component of the S&P Target Allocation Index Family, and is related to the S&P Target Risk Index Series. Both series are broadly representative of the investment opportunity available to investors in target date and target risk funds, respectively. The index series reflects the market consensus for asset allocations for different target date horizons. In particular, each index is representative of the investment opportunity available to investors for the corresponding target date horizon, with asset class exposures driven by a survey of available target date funds for that horizon. |
| | | | | | | | | | | | |
| | STANDARDIZED TOTAL RETURNS3 |
| | | For the period ended 6/30/18 | | One Year | | | Since Inception | | | Inception Date |
| | Class A | | | 1.75 | % | | | 5.64 | % | | 8/22/16 |
| | Institutional | | | 8.08 | | | | 9.30 | | | 8/22/16 |
| | Service | | | 7.61 | | | | 8.78 | | | 8/22/16 |
| | Investor | | | 7.86 | | | | 9.15 | | | 8/22/16 |
| | Class R | | | 7.31 | | | | 8.58 | | | 8/22/16 |
| | | Class R6 | | | 8.11 | | | | 9.32 | | | 8/22/16 |
| | 3 | | The Standardized Total Returns are average annual total returns or cumulative total returns (only if the performance period is one year or less) as of the most recent calendar quarter-end. They assume reinvestment of all distributions at NAV. These returns reflect a maximum initial sales charge of 5.5% for Class A Shares. Because Institutional, Service, Investor, Class R and Class R6 Shares do not involve a sales charge, such a charge is not applied to their Standardized Total Returns. |
The returns set forth in the tables above represent past performance. Past performance does not guarantee future results. The Portfolio’s investment return and principal value will fluctuate so that an investor’s shares, when redeemed, may be worth more or less than their original cost. Current performance may be lower or higher than the performance quoted above. Please visit our web site at www.GSAMFUNDS.com to obtain the most recent month-end returns.
Performance reflects applicable fee waivers and/or expense limitations in effect during the periods shown. In their absence, performance would be reduced. Returns do not reflect the deduction of taxes that a shareholder would pay on Portfolio distributions or the redemption of Portfolio shares. Returns less than 12 months are cumulative, not annualized.
28
FUND BASICS
| | | | | | | | | | |
| | EXPENSE RATIOS4 | |
| | | | | Net Expense Ratio (Current) | | | Gross Expense Ratio (Before Waivers) | |
| | Class A | | | 0.88 | % | | | 3.23 | % |
| | Institutional | | | 0.49 | | | | 2.84 | |
| | Service | | | 0.99 | | | | 3.34 | |
| | Investor | | | 0.63 | | | | 2.98 | |
| | Class R | | | 1.13 | | | | 3.48 | |
| | | Class R6 | | | 0.48 | | | | 2.83 | |
| | 4 | | The expense ratios of the Portfolio, both current (net of applicable fee waivers and/or expense limitations) and before waivers (gross of applicable fee waivers and/or expense limitations) are as set forth above according to the most recent publicly available Prospectus for the Portfolio and will differ from the expense ratios disclosed in the Financial Highlights in this report due to the inclusion of Underlying Fund fees and expenses, which are not included in the operating expenses of the Portfolio reflected in the Financial Highlights. Pursuant to a contractual arrangement, the Portfolio’s waivers and/or expense limitations will remain in place through at least December 29, 2018, and prior to such date, the Investment Adviser may not terminate the arrangements without the approval of the Portfolio’s Board of Trustees. If these arrangements are discontinued in the future, the expense ratios may change without shareholder approval. |
| | | | | | | | |
| | TOP TEN HOLDINGS AS OF 8/31/185 |
| | | Holding | | % of Net Assets | | | Line of Business |
| | iShares Core S&P 500 ETF | | | 19.9 | % | | Exchange Traded Funds |
| | Schwab Intermediate-Term U.S. Treasury ETF | | | 12.5 | | | Exchange Traded Funds |
| | Vanguard Short-Term Corporate Bond ETF | | | 7.5 | | | Exchange Traded Funds |
| | Schwab U.S. Dividend Equity ETF | | | 6.2 | | | Exchange Traded Funds |
| | Schwab U.S. TIPS ETF | | | 6.0 | | | Exchange Traded Funds |
| | iShares Edge MSCI Minimum Volatility Emerging Markets ETF | | | 5.5 | | | Exchange Traded Funds |
| | iShares Core S&P Mid-Cap ETF | | | 5.0 | | | Exchange Traded Funds |
| | Vanguard FTSE Europe ETF | | | 4.0 | | | Exchange Traded Funds |
| | iShares Edge MSCI USA Quality Factor ETF | | | 3.5 | | | Exchange Traded Funds |
| | | Vanguard Information Technology ETF | | | 3.2 | | | Exchange Traded Funds |
| | 5 | | The top 10 holdings may not be representative of the Portfolio’s future investments. The top 10 holdings exclude investments in money market funds. |
| | | | | | | | | | |
| | PORTFOLIO COMPOSITION6 | |
| | | Holding | | As of August 31, 2018 | | | As of August 31, 2017 | |
| | Stock Funds | | | 49.9 | % | | | 45.3 | % |
| | Bond Funds | | | 28.0 | | | | 25.5 | |
| | Foreign Stock Funds | | | 16.9 | | | | 21.7 | |
| | Alternative Funds | | | 3.0 | | | | 3.0 | |
| | | Investment Companies | | | 0.5 | | | | 3.5 | |
| | 6 | | The Portfolio is actively managed and, as such, its composition may differ over time. The percentage shown for each fund type reflects the value of that fund type as a percentage of the Portfolio’s net assets. Figures above may not sum to 100% due to rounding and/or exclusion of other assets and liabilities. |
29
GOLDMAN SACHS TARGET DATE 2045 PORTFOLIO
Performance Summary
August 31, 2018
The following graph shows the value, as of August 31, 2018, of a $1,000,000 investment made on August 22, 2016 (commencement of operations) in Institutional Shares. For comparative purposes, the performance of the Portfolio’s benchmark, the S&P Target Date to 2045 Index (Total Return, Unhedged, USD), is shown. This performance data represents past performance and should not be considered indicative of future performance, which will fluctuate with changes in market conditions. These performance fluctuations may cause an investor’s shares, when redeemed, to be worth more or less than their original cost. Performance reflects applicable fee waivers and/or expense limitations currently in effect during the periods shown and in their absence, performance would be reduced. Returns do not reflect the deduction of taxes that a shareholder would pay on Portfolio distributions or the redemption of Portfolio shares. Performance of Class A, Service, Investor, Class R and Class R6 Shares will vary from Institutional Shares due to differences in class specific fees and any applicable sales charges. In addition to the Sub-Adviser’s decisions regarding underlying fund selection and allocations among them, other factors may affect Portfolio performance. These factors include, but are not limited to, portfolio operating fees and expenses, portfolio turnover and subscription and redemption cash flows affecting the Portfolio.
|
| Target Date 2045 Portfolio’s Lifetime Performance |
Performance of a $1,000,000 investment, with distributions reinvested, from August 22, 2016 through August 31, 2018.
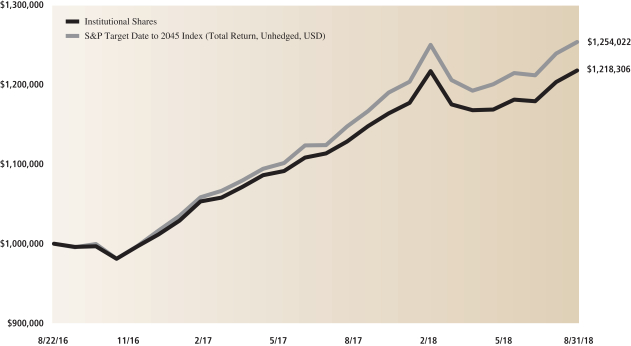
| | | | | | |
Average Annual Total Return through August 31, 2018 | | | One Year | | | Since Inception |
Class A (Commenced August 22, 2016) | | | | | | |
Excluding sales charges | | | 9.02% | | | 9.82% |
Including sales charges | | | 3.03% | | | 6.80% |
|
Institutional (Commenced August 22, 2016) | | | 9.40% | | | 10.23% |
|
Service (Commenced August 22, 2016) | | | 8.83% | | | 9.66% |
|
Investor (Commenced August 22, 2016) | | | 9.19% | | | 10.05% |
|
Class R (Commenced August 22, 2016) | | | 8.74% | | | 9.53% |
|
Class R6 (Commenced August 22, 2016) | | | 9.34% | | | 10.20% |
|
30
FUND BASICS
Target Date 2050 Portfolio
as of August 31, 2018
| | | | | | | | | | |
| | PERFORMANCE REVIEW | |
| | | September 1, 2017–August 31, 2018 | | Portfolio Total Return
(based on NAV)1 | | | S&P Target Date To
2050 (Total Return,
Unhedged, USD)2 | |
| | Class A | | | 9.66 | % | | | 11.75 | % |
| | Institutional | | | 10.10 | | | | 11.75 | |
| | Service | | | 9.53 | | | | 11.75 | |
| | Investor | | | 9.98 | | | | 11.75 | |
| | Class R | | | 9.38 | | | | 11.75 | |
| | | Class R6 | | | 10.11 | | | | 11.75 | |
| | 1 | | The net asset value (“NAV”) represents the net assets of the class of the Portfolio (ex-dividend) divided by the total number of shares of the class outstanding. The Portfolio’s performance assumes the reinvestment of dividends and other distributions. The Portfolio’s performance does not reflect the deduction of any applicable sales charges. |
| | 2 | | The S&P Target Date Index Series is a component of the S&P Target Allocation Index Family, and is related to the S&P Target Risk Index Series. Both series are broadly representative of the investment opportunity available to investors in target date and target risk funds, respectively. The index series reflects the market consensus for asset allocations for different target date horizons. In particular, each index is representative of the investment opportunity available to investors for the corresponding target date horizon, with asset class exposures driven by a survey of available target date funds for that horizon. |
The returns set forth in the table above represent past performance. Past performance does not guarantee future results. The Portfolio’s investment return and principal value will fluctuate so that an investor’s shares, when redeemed, may be worth more or less than their original cost. Current performance may be lower or higher than the performance quoted above. Please visit our web site at www.GSAMFUNDS.com to obtain the most recent month-end returns.
Performance reflects fee waivers and/or expense limitations in effect. In their absence, performance would be reduced. Returns do not reflect the deduction of taxes that a shareholder would pay on Portfolio distributions or the redemption of Portfolio shares. Returns less than 12 months are cumulative, not annualized.
31
FUND BASICS
| | | | | | | | | | | | | | | | |
| | STANDARDIZED TOTAL RETURNS3 |
| | | For the period ended 6/30/18 | | One Year | | | Five Years | | | Since Inception | | | Inception Date |
| | Class A | | | 2.19 | % | | | N/A | | | | 6.35 | % | | 8/22/16 |
| | Institutional | | | 8.56 | | | | N/A | | | | 10.06 | | | 8/22/16 |
| | Service | | | 8.10 | | | | N/A | | | | 9.54 | | | 8/22/16 |
| | Investor | | | 8.45 | | | | N/A | | | | 9.91 | | | 8/22/16 |
| | Class R | | | 7.96 | | | | N/A | | | | 9.37 | | | 8/22/16 |
| | | Class R6 | | | 8.58 | | | | 9.33 | % | | | 8.80 | | | 1/3/11 |
| | 3 | | The Standardized Total Returns are average annual total returns or cumulative total returns (only if the performance period is one year or less) as of the most recent calendar quarter-end. They assume reinvestment of all distributions at NAV. These returns reflect a maximum initial sales charge of 5.5% for Class A Shares. Because Institutional, Service, Investor, Class R and Class R6 Shares do not involve a sales charge, such a charge is not applied to their Standardized Total Returns. |
Effective August 22, 2016, the Madison Target Retirement 2050 Fund (the “Predecessor Fund”) was reorganized into the Portfolio. The Portfolio has assumed the Predecessor Fund’s historical performance. The returns for the Predecessor Fund for periods prior to August 29, 2014 reflect the performance of the Madison Target Retirement 2050 Fund’s Class I Shares, a series of Ultra Series Fund (the “Ultra Predecessor Fund”). As of August 29, 2014, the inception date of the Predecessor Fund, the Ultra Predecessor Fund exchanged in kind substantially all of its portfolio holdings for Class R6 shares of the Predecessor Fund. As a result, the Predecessor Fund assumed the performance of the Ultra Predecessor Fund. Performance reflects applicable fee waivers and/or expense limitations in effect during the periods shown. Past performance does not guarantee future results, which may vary. The value of investments and the income derived from investments will fluctuate and can go down as well as up. A loss of principal may occur.
The returns set forth in the table above represent past performance. Past performance does not guarantee future results. The Portfolio’s investment return and principal value will fluctuate so that an investor’s shares, when redeemed, may be worth more or less than their original cost. Current performance may be lower or higher than the performance quoted above. Please visit our web site at www.GSAMFUNDS.com to obtain the most recent month-end returns.
Performance reflects applicable fee waivers and/or expense limitations in effect during the periods shown. In their absence, performance would be reduced. Returns do not reflect the deduction of taxes that a shareholder would pay on Portfolio distributions or the redemption of Portfolio shares. Returns less than 12 months are cumulative, not annualized.
| | | | | | | | | | |
| | EXPENSE RATIOS4 | |
| | | | | Net Expense Ratio (Current) | | | Gross Expense Ratio (Before Waivers) | |
| | Class A | | | 0.87 | % | | | 2.16 | % |
| | Institutional | | | 0.48 | | | | 1.77 | |
| | Service | | | 0.98 | | | | 2.27 | |
| | Investor | | | 0.62 | | | | 1.91 | |
| | Class R | | | 1.12 | | | | 2.41 | |
| | | Class R6 | | | 0.47 | | | | 1.76 | |
| | 4 | | The expense ratios of the Portfolio, both current (net of applicable fee waivers and/or expense limitations) and before waivers (gross of applicable fee waivers and/or expense limitations) are as set forth above according to the most recent publicly available Prospectus for the Portfolio and will differ from the expense ratios disclosed in the Financial Highlights in this report due to the inclusion of Underlying Fund fees and expenses, which are not included in the operating expenses of the Portfolio reflected in the Financial Highlights. Pursuant to a contractual arrangement, the Portfolio’s waivers and/or expense limitations will remain in place through at least December 29, 2018, and prior to such date, the Investment Adviser may not terminate the arrangements without the approval of the Portfolio’s Board of Trustees. If these arrangements are discontinued in the future, the expense ratios may change without shareholder approval. |
32
FUND BASICS
| | | | | | | | |
| | TOP TEN HOLDINGS AS OF 8/31/185 |
| | | Holding | | % of Net Assets | | | Line of Business |
| | iShares Core S&P 500 ETF | | | 20.9 | % | | Exchange Traded Funds |
| | Schwab Intermediate-Term U.S. Treasury ETF | | | 11.0 | | | Exchange Traded Funds |
| | Schwab U.S. Dividend Equity ETF | | | 6.5 | | | Exchange Traded Funds |
| | iShares Edge MSCI Minimum Volatility Emerging Markets ETF | | | 6.0 | | | Exchange Traded Funds |
| | Vanguard Short-Term Corporate Bond ETF | | | 6.0 | | | Exchange Traded Funds |
| | iShares Core S&P Mid-Cap ETF | | | 5.5 | | | Exchange Traded Funds |
| | Schwab U.S. TIPS ETF | | | 4.5 | | | Exchange Traded Funds |
| | Vanguard FTSE Europe ETF | | | 4.4 | | | Exchange Traded Funds |
| | iShares Edge MSCI USA Quality Factor ETF | | | 4.0 | | | Exchange Traded Funds |
| | | Vanguard Information Technology ETF | | | 3.5 | | | Exchange Traded Funds |
| | 5 | | The top 10 holdings may not be representative of the Portfolio’s future investments. The top 10 holdings exclude investments in money market funds. |
| | | | | | | | | | |
| | PORTFOLIO COMPOSITION6 | |
| | | Holding | | As of August 31, 2018 | | | As of August 31, 2017 | |
| | Stock Funds | | | 52.9 | % | | | 48.4 | % |
| | Bond Funds | | | 23.0 | | | | 20.5 | |
| | Foreign Stock Funds | | | 18.9 | | | | 23.8 | |
| | Alternative Funds | | | 3.0 | | | | 3.0 | |
| | | Investment Companies | | | 0.5 | | | | 3.5 | |
| | 6 | | The Portfolio is actively managed and, as such, its composition may differ over time. The percentage shown for each fund type reflects the value of that fund type as a percentage of the Portfolio’s net assets. Figures above may not sum to 100% due to rounding and/or exclusion of other assets and liabilities. |
33
GOLDMAN SACHS TARGET DATE 2050 PORTFOLIO
Performance Summary
August 31, 2018
The following graph shows the value, as of August 31, 2018, of a $10,000 investment made on January 3, 2011 (commencement of operations of the Ultra Predecessor Fund) in Class R6 Shares. For comparative purposes, the performance of the Portfolio’s benchmark, the S&P Target Date to 2050 Index (Total Return, Unhedged, USD), is shown. This performance data represents past performance and should not be considered indicative of future performance, which will fluctuate with changes in market conditions. These performance fluctuations may cause an investor’s shares, when redeemed, to be worth more or less than their original cost. Performance reflects applicable fee waivers and/or expense limitations currently in effect during the periods shown and in their absence, performance would be reduced. Returns do not reflect the deduction of taxes that a shareholder would pay on Portfolio distributions or the redemption of Portfolio shares. Performance of Class A, Institutional, Service, Investor and Class R Shares will vary from Class R6 Shares due to differences in class specific fees and any applicable sales charges. In addition to the Sub-Adviser’s decisions regarding underlying fund selection and allocations among them, other factors may affect Portfolio performance. These factors include, but are not limited to, portfolio operating fees and expenses, portfolio turnover and subscription and redemption cash flows affecting the Portfolio.
|
| Target Date 2050 Portfolio’s Lifetime Performance |
Performance of a $10,000 investment, with distributions reinvested, from January 3, 2011 through August 31, 2018.
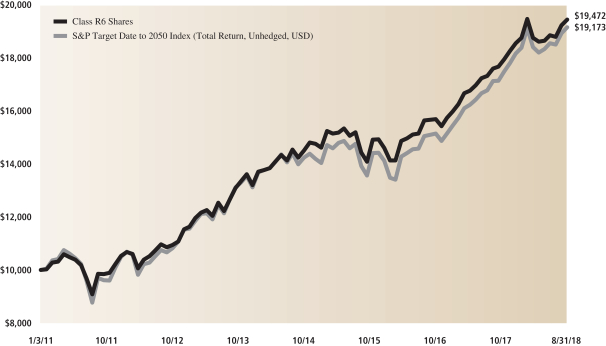
| | | | | | | | | | | | |
| Average Annual Total Return through August 31, 2018 | | | One Year | | | | Five Years | | | | Since Inception | |
Class A (Commenced August 22, 2016) | | | | | | | | | | | | |
Excluding sales charges | | | 9.66% | | | | N/A | | | | 10.64% | |
Including sales charges | | | 3.67% | | | | N/A | | | | 7.60% | |
| |
Institutional (Commenced August 22, 2016) | | | 10.10% | | | | N/A | | | | 11.03% | |
| |
Service (Commenced August 22, 2016) | | | 9.53% | | | | N/A | | | | 10.50% | |
| |
Investor (Commenced August 22, 2016) | | | 9.98% | | | | N/A | | | | 10.90% | |
| |
Class R (Commenced August 22, 2016) | | | 9.38% | | | | N/A | | | | 10.35% | |
| |
Class R6 (Commenced January 3, 2011) | | | 10.11% | | | | 9.73% | | | | 9.08% | |
| |
34
FUND BASICS
Target Date 2055 Portfolio
as of August 31, 2018
| | | | | | | | | | |
| | PERFORMANCE REVIEW | |
| | | September 1, 2017–August 31, 2018 | | Portfolio Total Return
(based on NAV)1 | | | S&P Target Date To
2055 (Total Return,
Unhedged, USD)2 | |
| | Class A | | | 10.37 | % | | | 12.08 | % |
| | Institutional | | | 10.82 | | | | 12.08 | |
| | Service | | | 10.27 | | | | 12.08 | |
| | Investor | | | 10.62 | | | | 12.08 | |
| | Class R | | | 10.09 | | | | 12.08 | |
| | | Class R6 | | | 10.85 | | | | 12.08 | |
| | 1 | | The net asset value (“NAV”) represents the net assets of the class of the Portfolio (ex-dividend) divided by the total number of shares of the class outstanding. The Portfolio’s performance assumes the reinvestment of dividends and other distributions. The Portfolio’s performance does not reflect the deduction of any applicable sales charges. |
| | 2 | | The S&P Target Date Index Series is a component of the S&P Target Allocation Index Family, and is related to the S&P Target Risk Index Series. Both series are broadly representative of the investment opportunity available to investors in target date and target risk funds, respectively. The index series reflects the market consensus for asset allocations for different target date horizons. In particular, each index is representative of the investment opportunity available to investors for the corresponding target date horizon, with asset class exposures driven by a survey of available target date funds for that horizon. |
| | | | | | | | | | | | | | |
| | STANDARDIZED TOTAL RETURNS3 | |
| | | For the period ended 6/30/18 | | One Year | | | Since Inception | | | Inception Date | |
| | Class A | | | 2.69 | % | | | 6.95 | % | | | 8/22/16 | |
| | Institutional | | | 9.16 | | | | 10.72 | | | | 8/22/16 | |
| | Service | | | 8.69 | | | | 10.20 | | | | 8/22/16 | |
| | Investor | | | 9.05 | | | | 10.58 | | | | 8/22/16 | |
| | Class R | | | 8.51 | | | | 10.02 | | | | 8/22/16 | |
| | | Class R6 | | | 9.29 | | | | 10.74 | | | | 8/22/16 | |
| | 3 | | The Standardized Total Returns are average annual total returns or cumulative total returns (only if the performance period is one year or less) as of the most recent calendar quarter-end. They assume reinvestment of all distributions at NAV. These returns reflect a maximum initial sales charge of 5.5% for Class A Shares. Because Institutional, Service, Investor, Class R and Class R6 Shares do not involve a sales charge, such a charge is not applied to their Standardized Total Returns. |
The returns set forth in the tables above represent past performance. Past performance does not guarantee future results. The Portfolio’s investment return and principal value will fluctuate so that an investor’s shares, when redeemed, may be worth more or less than their original cost. Current performance may be lower or higher than the performance quoted above. Please visit our web site at www.GSAMFUNDS.com to obtain the most recent month-end returns.
Performance reflects applicable fee waivers and/or expense limitations in effect during the periods shown. In their absence, performance would be reduced. Returns do not reflect the deduction of taxes that a shareholder would pay on Portfolio distributions or the redemption of Portfolio shares. Returns less than 12 months are cumulative, not annualized.
35
FUND BASICS
| | | | | | | | |
| | EXPENSE RATIOS4 | |
| | | | | Net Expense Ratio (Current) | | Gross Expense Ratio (Before Waivers) | |
| | Class A | | 0.86% | | | 3.44 | % |
| | Institutional | | 0.47 | | | 3.05 | |
| | Service | | 0.97 | | | 3.55 | |
| | Investor | | 0.61 | | | 3.19 | |
| | Class R | | 1.11 | | | 3.69 | |
| | | Class R6 | | 0.46 | | | 3.04 | |
| | 4 | | The expense ratios of the Portfolio, both current (net of applicable fee waivers and/or expense limitations) and before waivers (gross of applicable fee waivers and/or expense limitations) are as set forth above according to the most recent publicly available Prospectus for the Portfolio and will differ from the expense ratios disclosed in the Financial Highlights in this report due to the inclusion of Underlying Fund fees and expenses, which are not included in the operating expenses of the Portfolio reflected in the Financial Highlights. Pursuant to a contractual arrangement, the Portfolio’s waivers and/or expense limitations will remain in place through at least December 29, 2018, and prior to such date, the Investment Adviser may not terminate the arrangements without the approval of the Portfolio’s Board of Trustees. If these arrangements are discontinued in the future, the expense ratios may change without shareholder approval. |
| | | | | | | | |
| | TOP TEN HOLDINGS AS OF 8/31/185 |
| | | Holding | | % of Net Assets | | | Line of Business |
| | iShares Core S&P 500 ETF | | | 22.4 | % | | Exchange Traded Funds |
| | Schwab Intermediate-Term U.S. Treasury ETF | | | 10.0 | | | Exchange Traded Funds |
| | Schwab U.S. Dividend Equity ETF | | | 6.7 | | | Exchange Traded Funds |
| | iShares Edge MSCI Minimum Volatility Emerging Markets ETF | | | 6.5 | | | Exchange Traded Funds |
| | iShares Core S&P Mid-Cap ETF | | | 6.0 | | | Exchange Traded Funds |
| | Vanguard FTSE Europe ETF | | | 4.9 | | | Exchange Traded Funds |
| | iShares Edge MSCI USA Quality Factor ETF | | | 4.5 | | | Exchange Traded Funds |
| | Vanguard Short-Term Corporate Bond ETF | | | 4.0 | | | Exchange Traded Funds |
| | Vanguard Information Technology ETF | | | 3.7 | | | Exchange Traded Funds |
| | | Xtrackers MSCI EAFE Hedged Equity ETF | | | 3.5 | | | Exchange Traded Funds |
| | 5 | | The top 10 holdings may not be representative of the Portfolio’s future investments. The top 10 holdings exclude investments in money market funds. |
| | | | | | | | | | |
| | PORTFOLIO COMPOSITION6 | |
| | | Holding | | As of August 31, 2018 | | | As of August 31, 2017 | |
| | Stock Funds | | | 56.4 | % | | | 51.5 | % |
| | Foreign Stock Funds | | | 20.4 | | | | 25.5 | |
| | Bond Funds | | | 18.0 | | | | 15.5 | |
| | Alternative Funds | | | 3.0 | | | | 3.0 | |
| | | Investment Companies | | | 0.5 | | | | 3.5 | |
| | 6 | | The Portfolio is actively managed and, as such, its composition may differ over time. The percentage shown for each fund type reflects the value of that fund type as a percentage of the Portfolio’s net assets. Figures above may not sum to 100% due to rounding and/or exclusion of other assets and liabilities. |
36
GOLDMAN SACHS TARGET DATE 2055 PORTFOLIO
Performance Summary
August 31, 2018
The following graph shows the value, as of August 31, 2018, of a $1,000,000 investment made on August 22, 2016 (commencement of operations) in Institutional Shares. For comparative purposes, the performance of the Portfolio’s benchmark, the S&P Target Date to 2055 Index (Total Return, Unhedged, USD), is shown. This performance data represents past performance and should not be considered indicative of future performance, which will fluctuate with changes in market conditions. These performance fluctuations may cause an investor’s shares, when redeemed, to be worth more or less than their original cost. Performance reflects applicable fee waivers and/or expense limitations currently in effect during the periods shown and in their absence, performance would be reduced. Returns do not reflect the deduction of taxes that a shareholder would pay on Portfolio distributions or the redemption of Portfolio shares. Performance of Class A, Service, Investor, Class R and Class R6 Shares will vary from Institutional Shares due to differences in class specific fees and any applicable sales charges. In addition to the Sub-Adviser’s decisions regarding underlying fund selection and allocations among them, other factors may affect Portfolio performance. These factors include, but are not limited to, portfolio operating fees and expenses, portfolio turnover and subscription and redemption cash flows affecting the Portfolio.
|
| Target Date 2055 Portfolio’s Lifetime Performance |
Performance of a $1,000,000 investment, with distributions reinvested, from August 22, 2016 through August 31, 2018.
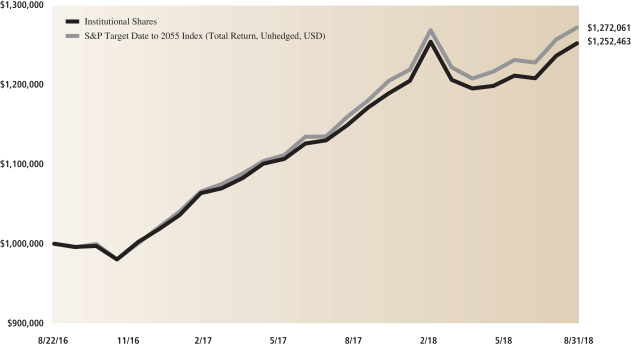
| | | | | | | | |
| Average Annual Total Return through August 31, 2018 | | | One Year | | | | Since Inception | |
Class A (Commenced August 22, 2016) | | | | | | | | |
Excluding sales charges | | | 10.37% | | | | 11.26% | |
Including sales charges | | | 4.30% | | | | 8.21% | |
| | | | | | | | |
Institutional (Commenced August 22, 2016) | | | 10.82% | | | | 11.74% | |
| | | | | | | | |
Service (Commenced August 22, 2016) | | | 10.27% | | | | 11.17% | |
| | | | | | | | |
Investor (Commenced August 22, 2016) | | | 10.62% | | | | 11.57% | |
| | | | | | | | |
Class R (Commenced August 22, 2016) | | | 10.09% | | | | 11.01% | |
| | | | | | | | |
Class R6 (Commenced August 22, 2016) | | | 10.85% | | | | 11.76% | |
| | | | | | | | |
37
FUND BASICS
Target Date 2060 Portfolio
as of August 31, 2018
| | | | | | | | | | |
| | PERFORMANCE REVIEW | |
| | | April 30, 2018–August 31, 2018 | | Portfolio Total Return
(based on NAV)1 | | | S&P Target Date To
2060 (Total Return,
Unhedged, USD)2 | |
| | Class A | | | 4.50 | % | | | 4.72 | % |
| | Institutional | | | 4.60 | | | | 4.72 | |
| | Service | | | 4.40 | | | | 4.72 | |
| | Investor | | | 4.60 | | | | 4.72 | |
| | Class R | | | 4.40 | | | | 4.72 | |
| | | Class R6 | | | 4.60 | | | | 4.72 | |
| | 1 | | The net asset value (“NAV”) represents the net assets of the class of the Portfolio (ex-dividend) divided by the total number of shares of the class outstanding. The Portfolio’s performance assumes the reinvestment of dividends and other distributions. The Portfolio’s performance does not reflect the deduction of any applicable sales charges. |
| | 2 | | The S&P Target Date Index Series is a component of the S&P Target Allocation Index Family, and is related to the S&P Target Risk Index Series. Both series are broadly representative of the investment opportunity available to investors in target date and target risk funds, respectively. The index series reflects the market consensus for asset allocations for different target date horizons. In particular, each index is representative of the investment opportunity available to investors for the corresponding target date horizon, with asset class exposures driven by a survey of available target date funds for that horizon. |
| | | | | | | | | | |
| | STANDARDIZED TOTAL RETURNS3 | |
| | | For the period ended 6/30/18 | | Since Inception | | | Inception Date | |
| | Class A | | | -4.82 | % | | | 4/30/18 | |
| | Institutional | | | 0.80 | | | | 4/30/18 | |
| | Service | | | 0.70 | | | | 4/30/18 | |
| | Investor | | | 0.70 | | | | 4/30/18 | |
| | Class R | | | 0.70 | | | | 4/30/18 | |
| | | Class R6 | | | 0.80 | | | | 4/30/18 | |
| | 3 | | The Standardized Total Returns are average annual total returns or cumulative total returns (only if the performance period is one year or less) as of the most recent calendar quarter-end. They assume reinvestment of all distributions at NAV. These returns reflect a maximum initial sales charge of 5.5% for Class A Shares. Because Institutional, Service, Investor, Class R and Class R6 Shares do not involve a sales charge, such a charge is not applied to their Standardized Total Returns. |
The returns set forth in the tables above represent past performance. Past performance does not guarantee future results. The Portfolio’s investment return and principal value will fluctuate so that an investor’s shares, when redeemed, may be worth more or less than their original cost. Current performance may be lower or higher than the performance quoted above. Please visit our web site at www.GSAMFUNDS.com to obtain the most recent month-end returns.
Performance reflects applicable fee waivers and/or expense limitations in effect during the periods shown. In their absence, performance would be reduced. Returns do not reflect the deduction of taxes that a shareholder would pay on Portfolio distributions or the redemption of Portfolio shares. Returns less than 12 months are cumulative, not annualized.
38
FUND BASICS
| | | | | | | | |
| | EXPENSE RATIOS4 | |
| | | | | Net Expense Ratio (Current) | | Gross Expense Ratio (Before Waivers) | |
| | Class A | | 0.86% | | | 3.19 | % |
| | Institutional | | 0.47 | | | 2.80 | |
| | Service | | 0.97 | | | 3.30 | |
| | Investor | | 0.61 | | | 2.94 | |
| | Class R | | 1.11 | | | 3.44 | |
| | | Class R6 | | 0.45 | | | 2.79 | |
| | 4 | | The expense ratios of the Portfolio, both current (net of applicable fee waivers and/or expense limitations) and before waivers (gross of applicable fee waivers and/or expense limitations) are as set forth above according to the most recent publicly available Prospectus for the Portfolio and will differ from the expense ratios disclosed in the Financial Highlights in this report due to the inclusion of Underlying Fund fees and expenses, which are not included in the operating expenses of the Portfolio reflected in the Financial Highlights. Pursuant to a contractual arrangement, the Portfolio’s waivers and/or expense limitations will remain in place through at least April 30, 2019, and prior to such date, the Investment Adviser may not terminate the arrangements without the approval of the Portfolio’s Board of Trustees. If these arrangements are discontinued in the future, the expense ratios may change without shareholder approval. |
| | | | | | | | |
| | TOP TEN HOLDINGS AS OF 8/31/185 |
| | | Holding | | % of Net Assets | | | Line of Business |
| | iShares Core S&P 500 ETF | | | 23.5 | % | | Exchange Traded Funds |
| | Schwab Intermediate-Term U.S. Treasury ETF | | | 9.8 | | | Exchange Traded Funds |
| | Schwab U.S. Dividend Equity ETF | | | 6.9 | | | Exchange Traded Funds |
| | iShares Edge MSCI Minimum Volatility Emerging Markets ETF | | | 6.9 | | | Exchange Traded Funds |
| | iShares Core S&P Mid-Cap ETF | | | 5.9 | | | Exchange Traded Funds |
| | Vanguard FTSE Europe ETF | | | 5.3 | | | Exchange Traded Funds |
| | iShares Edge MSCI USA Quality Factor ETF | | | 4.4 | | | Exchange Traded Funds |
| | Vanguard Information Technology ETF | | | 3.9 | | | Exchange Traded Funds |
| | Xtrackers MSCI EAFE Hedged Equity ETF | | | 3.4 | | | Exchange Traded Funds |
| | | Invesco Optimum Yield Diversified Commodity Strategy No. K-1 ETF | | | 2.9 | | | Exchange Traded Funds |
| | 5 | | The top 10 holdings may not be representative of the Portfolio’s future investments. The top 10 holdings exclude investments in money market funds. |
| | | | | | |
| | PORTFOLIO COMPOSITION6 | |
| | | Holding | | As of August 31, 2018 | |
| | Stock Funds | | | 57.3 | % |
| | Foreign Stock Funds | | | 21.0 | |
| | Bond Funds | | | 14.7 | |
| | Alternative Funds | | | 2.9 | |
| | | Investment Companies | | | 0.4 | |
| | 6 | | The Portfolio is actively managed and, as such, its composition may differ over time. The percentage shown for each fund type reflects the value of that fund type as a percentage of the Portfolio’s net assets. Figures above may not sum to 100% due to rounding and/or exclusion of other assets and liabilities. |
39
PORTFOLIO RESULTS
Index Definitions
S&P 500® Index is the Standard & Poor’s 500 composite index of 500 stocks, an unmanaged index of common stock prices.
It is not possible to invest directly in an unmanaged index.
40
GOLDMAN SACHS TARGET DATE 2020 PORTFOLIO
Schedule of Investments
August 31, 2018
| | | | | | | | |
Shares | | | Description | | Value | |
| Exchange Traded Funds – 97.9% | |
| Alternative Funds – 2.0% | |
| | 50,604 | | | Invesco Optimum Yield Diversified Commodity Strategy No. K-1 ETF | | $ | 918,969 | |
| | |
| Bond Funds – 71.0% | |
| | 18,939 | | | iShares 20+ Year Treasury Bond ETF | | | 2,291,524 | |
| | 219,433 | | | Schwab Intermediate-Term U.S. Treasury ETF | | | 11,476,346 | |
| | 167,793 | | | Schwab U.S. TIPS ETF | | | 9,168,209 | |
| | 122,949 | | | Vanguard Short-Term Corporate Bond ETF | | | 9,639,202 | |
| | | | | | | | |
| | | | | | | 32,575,281 | |
| | |
| Foreign Stock Funds – 5.9% | |
| | 15,535 | | | iShares Edge MSCI Minimum Volatility Emerging Markets ETF | | | 919,051 | |
| | 1,987 | | | Vanguard FTSE All World ex-US Small-Cap ETF | | | 227,551 | |
| | 4,349 | | | Vanguard FTSE All-World ex-U.S. ETF | | | 226,539 | |
| | 12,047 | | | Vanguard FTSE Europe ETF | | | 679,451 | |
| | 4,126 | | | WisdomTree Japan Hedged Equity Fund | | | 226,187 | |
| | 14,255 | | | Xtrackers MSCI EAFE Hedged Equity ETF | | | 454,592 | |
| | | | | | | | |
| | | | | | | 2,733,371 | |
| | |
| Stock Funds – 19.0% | |
| | 6,093 | | | Energy Select Sector SPDR Fund | | | 453,563 | |
| | 6,200 | | | Invesco Dynamic Pharmaceuticals ETF | | | 458,056 | |
| | 6,258 | | | iShares Core S&P 500 ETF | | | 1,830,089 | |
| | 3,362 | | | iShares Core S&P Mid-Cap ETF | | | 687,025 | |
| | 3,173 | | | iShares Edge MSCI Minimum Volatility EAFE ETF | | | 229,186 | |
| | 12,778 | | | iShares Edge MSCI USA Quality Factor ETF | | | 1,146,698 | |
| | 3,932 | | | iShares MSCI Japan ETF | | | 228,921 | |
| | 30,438 | | | Schwab U.S. Dividend Equity ETF | | | 1,604,387 | |
| | 9,644 | | | Vanguard Financials ETF | | | 690,317 | |
| | 1,421 | | | Vanguard Growth ETF | | | 228,412 | |
| | 4,519 | | | Vanguard Information Technology ETF | | | 916,453 | |
| | 1,691 | | | Vanguard Materials ETF | | | 227,000 | |
| | | | | | | | |
| | | | | | | 8,700,107 | |
| | |
| | TOTAL EXCHANGE TRADED FUNDS | | | | |
| | (Cost $43,126,942) | | $ | 44,927,728 | |
| | |
Shares | | | Distribution
Rate | | Value | |
| | Investment Company(a) – 0.5% | |
| Goldman Sachs Financial Square Government Fund –
Institutional Shares |
|
| | 229,794 | | | 1.879% | | $ | 229,794 | |
| | (Cost $229,794) | |
| | |
| | TOTAL INVESTMENTS – 98.4% | |
| | (Cost $43,356,736) | | $ | 45,157,522 | |
| | |
| OTHER ASSETS IN EXCESS OF
LIABILITIES – 1.6% | | | 728,165 | |
| | |
| | NET ASSETS – 100.0% | | $ | 45,885,687 | |
| | |
| | |
| The percentage shown for each investment category reflects the value of investments in that category as a percentage of net assets. |
(a) | | Represents an affiliated fund. |
| | |
|
Investment Abbreviations: |
ETF | | —Exchange Traded Fund |
TIPS | | —Treasury Inflation Protected Securities |
|
| | |
| The accompanying notes are an integral part of these financial statements. | | 41 |
GOLDMAN SACHS TARGET DATE 2025 PORTFOLIO
Schedule of Investments
August 31, 2018
| | | | | | | | |
Shares | | | Description | | Value | |
| Exchange Traded Funds – 97.8% | |
| Alternative Funds – 2.5% | |
| | 15,700 | | | Invesco Optimum Yield Diversified Commodity Strategy No. K-1 ETF | | $ | 285,112 | |
| | |
| Bond Funds – 53.5% | |
| | 3,298 | | | iShares 20+ Year Treasury Bond ETF | | | 399,041 | |
| | 43,664 | | | Schwab Intermediate-Term U.S. Treasury ETF | | | 2,283,627 | |
| | 31,302 | | | Schwab U.S. TIPS ETF | | | 1,710,341 | |
| | 21,844 | | | Vanguard Short-Term Corporate Bond ETF | | | 1,712,570 | |
| | | | | | | | |
| | | | | | | 6,105,579 | |
| | |
| Foreign Stock Funds – 10.9% | |
| | 1,178 | | | iShares Edge MSCI Minimum Volatility EAFE ETF | | | 85,087 | |
| | 6,762 | | | iShares Edge MSCI Minimum Volatility Emerging Markets ETF | | | 400,040 | |
| | 737 | | | Vanguard FTSE All World ex-US Small-Cap ETF | | | 84,401 | |
| | 3,267 | | | Vanguard FTSE All-World ex-U.S. ETF | | | 170,178 | |
| | 3,984 | | | Vanguard FTSE Europe ETF | | | 224,698 | |
| | 1,029 | | | WisdomTree Japan Hedged Equity Fund | | | 56,410 | |
| | 7,106 | | | Xtrackers MSCI EAFE Hedged Equity ETF | | | 226,610 | |
| | | | | | | | |
| | | | | | | 1,247,424 | |
| | |
| Stock Funds – 30.9% | |
| | 2,280 | | | Energy Select Sector SPDR Fund | | | 169,723 | |
| | 2,320 | | | Invesco Dynamic Pharmaceuticals ETF | | | 171,402 | |
| | 4,473 | | | iShares Core S&P 500 ETF | | | 1,308,084 | |
| | 1,678 | | | iShares Core S&P Mid-Cap ETF | | | 342,899 | |
| | 3,178 | | | iShares Edge MSCI USA Quality Factor ETF | | | 285,194 | |
| | 1,959 | | | iShares MSCI Japan ETF | | | 114,053 | |
| | 9,738 | | | Schwab U.S. Dividend Equity ETF | | | 513,290 | |
| | 2,780 | | | Vanguard Financials ETF | | | 198,992 | |
| | 711 | | | Vanguard Growth ETF | | | 114,286 | |
| | 1,264 | | | Vanguard Information Technology ETF | | | 256,339 | |
| | 424 | | | Vanguard Materials ETF | | | 56,918 | |
| | | | | | | | |
| | | | | | | 3,531,180 | |
| | |
| | TOTAL EXCHANGE TRADED FUNDS | | | | |
| | (Cost $10,480,224) | | $ | 11,169,295 | |
| | |
| Shares | | | Distribution
Rate | | Value | |
| | Investment Company(a) – 0.5% | |
| Goldman Sachs Financial Square Government Fund –
Institutional Shares |
|
| | 56,506 | | | 1.879% | | $ | 56,506 | |
| | (Cost $56,506) | |
| | |
| | TOTAL INVESTMENTS – 98.3% | |
| | (Cost $10,536,730) | | $ | 11,225,801 | |
| | |
| OTHER ASSETS IN EXCESS OF
LIABILITIES – 1.7% | | | 188,835 | |
| | |
| | NET ASSETS – 100.0% | | $ | 11,414,636 | |
| | |
| | |
| The percentage shown for each investment category reflects the value of investments in that category as a percentage of net assets. |
(a) | | Represents an affiliated fund. |
| | |
|
Investment Abbreviations: |
ETF | | —Exchange Traded Fund |
TIPS | | —Treasury Inflation Protected Securities |
|
| | |
| 42 | | The accompanying notes are an integral part of these financial statements. |
GOLDMAN SACHS TARGET DATE 2030 PORTFOLIO
Schedule of Investments
August 31, 2018
| | | | | | | | |
Shares | | | Description | | Value | |
| Exchange Traded Funds – 98.0% | |
| Alternative Funds – 2.5% | |
| | 105,640 | | | Invesco Optimum Yield Diversified Commodity Strategy No. K-1 ETF | | $ | 1,918,422 | |
| | |
| Bond Funds – 43.1% | |
| | 15,871 | | | iShares 20+ Year Treasury Bond ETF | | | 1,920,312 | |
| | 264,427 | | | Schwab Intermediate-Term U.S. Treasury ETF | | | 13,829,532 | |
| | 147,437 | | | Schwab U.S. TIPS ETF | | | 8,055,958 | |
| | 117,587 | | | Vanguard Short-Term Corporate Bond ETF | | | 9,218,821 | |
| | | | | | | | |
| | | | | | | 33,024,623 | |
| | |
| Foreign Stock Funds – 12.5% | |
| | 52,001 | | | iShares Edge MSCI Minimum Volatility Emerging Markets ETF | | | 3,076,379 | |
| | 6,667 | | | Vanguard FTSE All World ex-US Small-Cap ETF | | | 763,505 | |
| | 29,311 | | | Vanguard FTSE All-World ex-U.S. ETF | | | 1,526,810 | |
| | 33,604 | | | Vanguard FTSE Europe ETF | | | 1,895,266 | |
| | 10,453 | | | WisdomTree Japan Hedged Equity Fund | | | 573,033 | |
| | 53,809 | | | Xtrackers MSCI EAFE Hedged Equity ETF | | | 1,715,969 | |
| | | | | | | | |
| | | | | | | 9,550,962 | |
| | |
| Stock Funds – 39.9% | |
| | 20,488 | | | Energy Select Sector SPDR Fund | | | 1,525,127 | |
| | 15,577 | | | Invesco Dynamic Pharmaceuticals ETF | | | 1,150,829 | |
| | 44,490 | | | iShares Core S&P 500 ETF | | | 13,010,656 | |
| | 13,138 | | | iShares Core S&P Mid-Cap ETF | | | 2,684,750 | |
| | 10,598 | | | iShares Edge MSCI Minimum Volatility EAFE ETF | | | 765,494 | |
| | 23,439 | | | iShares Edge MSCI USA Quality Factor ETF | | | 2,103,416 | |
| | 16,492 | | | iShares MSCI Japan ETF | | | 960,164 | |
| | 72,775 | | | Schwab U.S. Dividend Equity ETF | | | 3,835,970 | |
| | 21,378 | | | Vanguard Financials ETF | | | 1,530,237 | |
| | 4,776 | | | Vanguard Growth ETF | | | 767,694 | |
| | 9,453 | | | Vanguard Information Technology ETF | | | 1,917,068 | |
| | 2,852 | | | Vanguard Materials ETF | | | 382,853 | |
| | | | | | | | |
| | | | | | | 30,634,258 | |
| | |
| | TOTAL EXCHANGE TRADED FUNDS | | | | |
| | (Cost $67,421,601) | | $ | 75,128,265 | |
| | |
| | | | | | | | |
Shares | | | Distribution
Rate | | Value | |
| | Investment Company(a) – 0.5% | |
| Goldman Sachs Financial Square Government Fund –
Institutional Shares |
|
| | 385,903 | | | 1.879% | | $ | 385,903 | |
| | (Cost $385,903) | | | | |
| | |
| | TOTAL INVESTMENTS – 98.5% | |
| | (Cost $67,807,504) | | $ | 75,514,168 | |
| | |
| OTHER ASSETS IN EXCESS OF
LIABILITIES – 1.5% | | | 1,182,639 | |
| | |
| | NET ASSETS – 100.0% | | $ | 76,696,807 | |
| | |
| | |
| The percentage shown for each investment category reflects the value of investments in that category as a percentage of net assets. |
(a) | | Represents an affiliated fund. |
| | |
|
Investment Abbreviations: |
ETF | | —Exchange Traded Fund |
TIPS | | —Treasury Inflation Protected Securities |
|
| | |
| The accompanying notes are an integral part of these financial statements. | | 43 |
GOLDMAN SACHS TARGET DATE 2035 PORTFOLIO
Schedule of Investments
August 31, 2018
| | | | | | | | |
Shares | | | Description | | Value | |
| Exchange Traded Funds – 97.8% | |
| Alternative Funds – 3.0% | |
| | 20,618 | | | Invesco Optimum Yield Diversified Commodity Strategy No. K-1 ETF | | $ | 374,423 | |
| | |
| Bond Funds – 38.0% | |
| | 2,583 | | | iShares 20+ Year Treasury Bond ETF | | | 312,530 | |
| | 38,217 | | | Schwab Intermediate-Term U.S. Treasury ETF | | | 1,998,749 | |
| | 20,554 | | | Schwab U.S. TIPS ETF | | | 1,123,070 | |
| | 16,734 | | | Vanguard Short-Term Corporate Bond ETF | | | 1,311,946 | |
| | | | | | | | |
| | | | | | | 4,746,295 | |
| | |
| Foreign Stock Funds – 15.2% | |
| | 9,515 | | | iShares Edge MSCI Minimum Volatility Emerging Markets ETF | | | 562,907 | |
| | 2,675 | | | iShares MSCI Japan ETF | | | 155,739 | |
| | 1,081 | | | Vanguard FTSE All World ex-US Small-Cap ETF | | | 123,796 | |
| | 5,363 | | | Vanguard FTSE All-World ex-U.S. ETF | | | 279,359 | |
| | 6,559 | | | Vanguard FTSE Europe ETF | | | 369,928 | |
| | 1,703 | | | WisdomTree Japan Hedged Equity Fund | | | 93,358 | |
| | 9,712 | | | Xtrackers MSCI EAFE Hedged Equity ETF | | | 309,716 | |
| | | | | | | | |
| | | | | | | 1,894,803 | |
| | |
| Stock Funds – 41.6% | |
| | 3,750 | | | Energy Select Sector SPDR Fund | | | 279,150 | |
| | 2,538 | | | Invesco Dynamic Pharmaceuticals ETF | | | 187,507 | |
| | 7,662 | | | iShares Core S&P 500 ETF | | | 2,240,675 | |
| | 2,441 | | | iShares Core S&P Mid-Cap ETF | | | 498,818 | |
| | 1,719 | | | iShares Edge MSCI Minimum Volatility EAFE ETF | | | 124,163 | |
| | 4,174 | | | iShares Edge MSCI USA Quality Factor ETF | | | 374,575 | |
| | 13,019 | | | Schwab U.S. Dividend Equity ETF | | | 686,232 | |
| | 3,477 | | | Vanguard Financials ETF | | | 248,884 | |
| | 777 | | | Vanguard Growth ETF | | | 124,895 | |
| | 1,691 | | | Vanguard Information Technology ETF | | | 342,935 | |
| | 691 | | | Vanguard Materials ETF | | | 92,760 | |
| | | | | | | | |
| | | | | | | 5,200,594 | |
| | |
| | TOTAL EXCHANGE TRADED FUNDS | | | | |
| | (Cost $11,108,125) | | $ | 12,216,115 | |
| | |
Shares | | | Distribution
Rate | | Value | |
| | Investment Company(a) – 0.5% | |
| Goldman Sachs Financial Square Government Fund –
Institutional Shares |
|
| | 56,895 | | | 1.879% | | $ | 56,895 | |
| | (Cost $56,895) | |
| | |
| | TOTAL INVESTMENTS – 98.3% | |
| | (Cost $11,165,020) | | $ | 12,273,010 | |
| | |
| OTHER ASSETS IN EXCESS OF
LIABILITIES – 1.7% | | | 215,629 | |
| | |
| | NET ASSETS – 100.0% | | $ | 12,488,639 | |
| | |
| | |
| The percentage shown for each investment category reflects the value of investments in that category as a percentage of net assets. |
(a) | | Represents an affiliated fund. |
| | |
|
Investment Abbreviations: |
ETF | | —Exchange Traded Fund |
TIPS | | —Treasury Inflation Protected Securities |
|
| | |
| 44 | | The accompanying notes are an integral part of these financial statements. |
GOLDMAN SACHS TARGET DATE 2040 PORTFOLIO
Schedule of Investments
August 31, 2018
| | | | | | | | |
Shares | | | Description | | Value | |
| Exchange Traded Funds – 97.9% | |
| Alternative Funds – 3.0% | |
| | 82,905 | | | Invesco Optimum Yield Diversified Commodity Strategy No. K-1 ETF | | $ | 1,505,555 | |
| | |
| Bond Funds – 33.1% | |
| | 10,380 | | | iShares 20+ Year Treasury Bond ETF | | | 1,255,928 | |
| | 134,503 | | | Schwab Intermediate-Term U.S. Treasury ETF | | | 7,034,507 | |
| | 68,873 | | | Schwab U.S. TIPS ETF | | | 3,763,221 | |
| | 57,676 | | | Vanguard Short-Term Corporate Bond ETF | | | 4,521,798 | |
| | | | | | | | |
| | | | | | | 16,575,454 | |
| | |
| Foreign Stock Funds – 15.4% | |
| | 42,510 | | | iShares Edge MSCI Minimum Volatility Emerging Markets ETF | | | 2,514,892 | |
| | 4,372 | | | Vanguard FTSE All World ex-US Small-Cap ETF | | | 500,681 | |
| | 23,961 | | | Vanguard FTSE All-World ex-U.S. ETF | | | 1,248,128 | |
| | 30,768 | | | Vanguard FTSE Europe ETF | | | 1,735,315 | |
| | 6,836 | | | WisdomTree Japan Hedged Equity Fund | | | 374,750 | |
| | 43,011 | | | Xtrackers MSCI EAFE Hedged Equity ETF | | | 1,371,621 | |
| | | | | | | | |
| | | | | | | 7,745,387 | |
| | |
| Stock Funds – 46.4% | |
| | 16,749 | | | Energy Select Sector SPDR Fund | | | 1,246,796 | |
| | 11,890 | | | Invesco Dynamic Pharmaceuticals ETF | | | 878,433 | |
| | 32,519 | | | iShares Core S&P 500 ETF | | | 9,509,856 | |
| | 11,052 | | | iShares Core S&P Mid-Cap ETF | | | 2,258,476 | |
| | 6,909 | | | iShares Edge MSCI Minimum Volatility EAFE ETF | | | 499,037 | |
| | 18,126 | | | iShares Edge MSCI USA Quality Factor ETF | | | 1,626,627 | |
| | 12,902 | | | iShares MSCI Japan ETF | | | 751,154 | |
| | 57,113 | | | Schwab U.S. Dividend Equity ETF | | | 3,010,426 | |
| | 13,981 | | | Vanguard Financials ETF | | | 1,000,760 | |
| | 3,125 | | | Vanguard Growth ETF | | | 502,313 | |
| | 7,419 | | | Vanguard Information Technology ETF | | | 1,504,573 | |
| | 3,711 | | | Vanguard Materials ETF | | | 498,165 | |
| | | | | | | | |
| | | | | | | 23,286,616 | |
| | |
| | TOTAL EXCHANGE TRADED FUNDS | | | | |
| | (Cost $43,286,020) | | $ | 49,113,012 | |
| | |
Shares | | | Distribution
Rate | | Value | |
| | Investment Company(a) – 0.6% | |
| Goldman Sachs Financial Square Government Fund –
Institutional Shares |
|
| | 290,705 | | | 1.879% | | $ | 290,705 | |
| | (Cost $290,705) | |
| | |
| | TOTAL INVESTMENTS – 98.5% | | | | |
| | (Cost $43,576,725) | | $ | 49,403,717 | |
| | |
| OTHER ASSETS IN EXCESS OF
LIABILITIES – 1.5% | | | 760,856 | |
| | |
| | NET ASSETS – 100.0% | | $ | 50,164,573 | |
| | |
| | |
| The percentage shown for each investment category reflects the value of investments in that category as a percentage of net assets. |
(a) | | Represents an affiliated fund. |
| | |
|
Investment Abbreviations: |
ETF | | —Exchange Traded Fund |
TIPS | | —Treasury Inflation Protected Securities |
|
| | |
| The accompanying notes are an integral part of these financial statements. | | 45 |
GOLDMAN SACHS TARGET DATE 2045 PORTFOLIO
Schedule of Investments
August 31, 2018
| | | | | | | | |
Shares | | | Description | | Value | |
| Exchange Traded Funds – 97.8% | |
| Alternative Funds – 3.0% | |
| | 20,647 | | | Invesco Optimum Yield Diversified Commodity Strategy No. K-1 ETF | | $ | 374,950 | |
| | |
| Bond Funds – 28.0% | |
| | 2,071 | | | iShares 20+ Year Treasury Bond ETF | | | 250,581 | |
| | 29,894 | | | Schwab Intermediate-Term U.S. Treasury ETF | | | 1,563,456 | |
| | 13,722 | | | Schwab U.S. TIPS ETF | | | 749,770 | |
| | 11,970 | | | Vanguard Short-Term Corporate Bond ETF | | | 938,448 | |
| | | | | | | | |
| | | | | | | 3,502,255 | |
| | |
| Foreign Stock Funds – 16.9% | |
| | 11,645 | | | iShares Edge MSCI Minimum Volatility Emerging Markets ETF | | | 688,918 | |
| | 1,084 | | | Vanguard FTSE All World ex-US Small-Cap ETF | | | 124,140 | |
| | 6,564 | | | Vanguard FTSE All-World ex-U.S. ETF | | | 341,919 | |
| | 8,757 | | | Vanguard FTSE Europe ETF | | | 493,895 | |
| | 1,690 | | | WisdomTree Japan Hedged Equity Fund | | | 92,646 | |
| | 11,685 | | | Xtrackers MSCI EAFE Hedged Equity ETF | | | 372,634 | |
| | | | | | | | |
| | | | | | | 2,114,152 | |
| | |
| Stock Funds – 49.9% | |
| | 4,575 | | | Energy Select Sector SPDR Fund | | | 340,563 | |
| | 3,386 | | | Invesco Dynamic Pharmaceuticals ETF | | | 250,158 | |
| | 8,525 | | | iShares Core S&P 500 ETF | | | 2,493,051 | |
| | 3,061 | | | iShares Core S&P Mid-Cap ETF | | | 625,515 | |
| | 2,156 | | | iShares Edge MSCI Minimum Volatility EAFE ETF | | | 155,728 | |
| | 4,876 | | | iShares Edge MSCI USA Quality Factor ETF | | | 437,572 | |
| | 3,228 | | | iShares MSCI Japan ETF | | | 187,934 | |
| | 14,814 | | | Schwab U.S. Dividend Equity ETF | | | 780,846 | |
| | 3,935 | | | Vanguard Financials ETF | | | 281,667 | |
| | 775 | | | Vanguard Growth ETF | | | 124,573 | |
| | 2,002 | | | Vanguard Information Technology ETF | | | 406,006 | |
| | 1,153 | | | Vanguard Materials ETF | | | 154,779 | |
| | | | | | | | |
| | | | | | | 6,238,392 | |
| | |
| | TOTAL EXCHANGE TRADED FUNDS | | | | |
| | (Cost $10,955,203) | | $ | 12,229,749 | |
| | |
Shares | | | Distribution
Rate | | Value | |
| | Investment Company(a) – 0.5% | |
| Goldman Sachs Financial Square Government Fund –
Institutional Shares |
|
| | 54,070 | | | 1.879% | | $ | 54,070 | |
| | (Cost $54,070) | |
| | |
| | TOTAL INVESTMENTS – 98.3% | | | | |
| | (Cost $11,009,273) | | $ | 12,283,819 | |
| | |
| OTHER ASSETS IN EXCESS OF
LIABILITIES – 1.7% | | | 217,826 | |
| | |
| | NET ASSETS – 100.0% | | $ | 12,501,645 | |
| | |
| | |
| The percentage shown for each investment category reflects the value of investments in that category as a percentage of net assets. |
(a) | | Represents an affiliated fund. |
| | |
|
Investment Abbreviations: |
ETF | | —Exchange Traded Fund |
TIPS | | —Treasury Inflation Protected Securities |
|
| | |
| 46 | | The accompanying notes are an integral part of these financial statements. |
GOLDMAN SACHS TARGET DATE 2050 PORTFOLIO
Schedule of Investments
August 31, 2018
| | | | | | | | |
Shares | | | Description | | Value | |
| Exchange Traded Funds – 97.8% | |
| Alternative Funds – 3.0% | |
| | 50,497 | | | Invesco Optimum Yield Diversified Commodity Strategy No. K-1 ETF | | $ | 917,026 | |
| | |
| Bond Funds – 23.0% | |
| | 3,792 | | | iShares 20+ Year Treasury Bond ETF | | | 458,813 | |
| | 64,370 | | | Schwab Intermediate-Term U.S. Treasury ETF | | | 3,366,551 | |
| | 25,170 | | | Schwab U.S. TIPS ETF | | | 1,375,289 | |
| | 23,420 | | | Vanguard Short-Term Corporate Bond ETF | | | 1,836,128 | |
| | | | | | | | |
| | | | | | | 7,036,781 | |
| | |
| Foreign Stock Funds – 18.9% | |
| | 31,071 | | | iShares Edge MSCI Minimum Volatility Emerging Markets ETF | | | 1,838,160 | |
| | 3,328 | | | Vanguard FTSE All World ex-US Small-Cap ETF | | | 381,123 | |
| | 17,514 | | | Vanguard FTSE All-World ex-U.S. ETF | | | 912,304 | |
| | 24,095 | | | Vanguard FTSE Europe ETF | | | 1,358,958 | |
| | 5,552 | | | WisdomTree Japan Hedged Equity Fund | | | 304,361 | |
| | 30,961 | | | Xtrackers MSCI EAFE Hedged Equity ETF | | | 987,346 | |
| | | | | | | | |
| | | | | | | 5,782,252 | |
| | |
| Stock Funds – 52.9% | |
| | 12,223 | | | Energy Select Sector SPDR Fund | | | 909,880 | |
| | 8,281 | | | Invesco Dynamic Pharmaceuticals ETF | | | 611,800 | |
| | 21,892 | | | iShares Core S&P 500 ETF | | | 6,402,096 | |
| | 8,219 | | | iShares Core S&P Mid-Cap ETF | | | 1,679,553 | |
| | 5,260 | | | iShares Edge MSCI Minimum Volatility EAFE ETF | | | 379,930 | |
| | 13,630 | | | iShares Edge MSCI USA Quality Factor ETF | | | 1,223,156 | |
| | 7,859 | | | iShares MSCI Japan ETF | | | 457,551 | |
| | 37,686 | | | Schwab U.S. Dividend Equity ETF | | | 1,986,429 | |
| | 9,580 | | | Vanguard Financials ETF | | | 685,736 | |
| | 1,904 | | | Vanguard Growth ETF | | | 306,049 | |
| | 5,272 | | | Vanguard Information Technology ETF | | | 1,069,162 | |
| | 3,403 | | | Vanguard Materials ETF | | | 456,819 | |
| | | | | | | | |
| | | | | | | 16,168,161 | |
| | |
| | TOTAL EXCHANGE TRADED FUNDS | | | | |
| | (Cost $25,860,923) | | $ | 29,904,220 | |
| | |
| Shares | | | Distribution
Rate | | Value | |
| | Investment Company(a) – 0.5% | |
| Goldman Sachs Financial Square Government Fund –
Institutional Shares |
|
| | 139,647 | | | 1.879% | | $ | 139,647 | |
| | (Cost $139,647) | |
| | |
| | TOTAL INVESTMENTS – 98.3% | |
| | (Cost $26,000,570) | | $ | 30,043,867 | |
| | |
| OTHER ASSETS IN EXCESS OF
LIABILITIES – 1.7% | | | 522,295 | |
| | |
| | NET ASSETS – 100.0% | | $ | 30,566,162 | |
| | |
| | |
| The percentage shown for each investment category reflects the value of investments in that category as a percentage of net assets. |
(a) | | Represents an affiliated fund. |
| | |
|
Investment Abbreviations: |
ETF | | —Exchange Traded Fund |
TIPS | | —Treasury Inflation Protected Securities |
|
| | |
| The accompanying notes are an integral part of these financial statements. | | 47 |
GOLDMAN SACHS TARGET DATE 2055 PORTFOLIO
Schedule of Investments
August 31, 2018
| | | | | | | | |
Shares | | | Description | | Value | |
| Exchange Traded Funds – 97.8% | |
| Alternative Funds – 3.0% | |
| | 20,900 | | | Invesco Optimum Yield Diversified Commodity Strategy No. K-1 ETF | | $ | 379,544 | |
| | |
| Bond Funds – 18.0% | |
| | 1,047 | | | iShares 20+ Year Treasury Bond ETF | | | 126,681 | |
| | 24,220 | | | Schwab Intermediate-Term U.S. Treasury ETF | | | 1,266,706 | |
| | 6,945 | | | Schwab U.S. TIPS ETF | | | 379,475 | |
| | 6,462 | | | Vanguard Short-Term Corporate Bond ETF | | | 506,621 | |
| | | | | | | | |
| | | | | | | 2,279,483 | |
| | |
| Foreign Stock Funds – 20.4% | |
| | 13,932 | | | iShares Edge MSCI Minimum Volatility Emerging Markets ETF | | | 824,217 | |
| | 1,653 | | | Vanguard FTSE All World ex-US Small-Cap ETF | | | 189,302 | |
| | 7,249 | | | Vanguard FTSE All-World ex-U.S. ETF | | | 377,601 | |
| | 11,081 | | | Vanguard FTSE Europe ETF | | | 624,968 | |
| | 2,282 | | | WisdomTree Japan Hedged Equity Fund | | | 125,099 | |
| | 13,800 | | | Xtrackers MSCI EAFE Hedged Equity ETF | | | 440,082 | |
| | | | | | | | |
| | | | | | | 2,581,269 | |
| | |
| Stock Funds – 56.4% | |
| | 5,055 | | | Energy Select Sector SPDR Fund | | | 376,294 | |
| | 3,419 | | | Invesco Dynamic Pharmaceuticals ETF | | | 252,596 | |
| | 9,708 | | | iShares Core S&P 500 ETF | | | 2,839,007 | |
| | 3,718 | | | iShares Core S&P Mid-Cap ETF | | | 759,773 | |
| | 2,612 | | | iShares Edge MSCI Minimum Volatility EAFE ETF | | | 188,665 | |
| | 6,346 | | | iShares Edge MSCI USA Quality Factor ETF | | | 569,490 | |
| | 3,256 | | | iShares MSCI Japan ETF | | | 189,564 | |
| | 16,198 | | | Schwab U.S. Dividend Equity ETF | | | 853,797 | |
| | 4,423 | | | Vanguard Financials ETF | | | 316,598 | |
| | 789 | | | Vanguard Growth ETF | | | 126,824 | |
| | 2,338 | | | Vanguard Information Technology ETF | | | 474,146 | |
| | 1,398 | | | Vanguard Materials ETF | | | 187,668 | |
| | | | | | | | |
| | | | | | | 7,134,422 | |
| | |
| | TOTAL EXCHANGE TRADED FUNDS | |
| | (Cost $10,892,372) | | $ | 12,374,718 | |
| | |
Shares | | | Distribution
Rate | | Value | |
| | Investment Company(a) – 0.5% | |
| Goldman Sachs Financial Square Government Fund –
Institutional Shares |
|
| | 61,121 | | | 1.879% | | $ | 61,121 | |
| | (Cost $61,121) | | | | |
| | |
| | TOTAL INVESTMENTS – 98.3% | | | | |
| | (Cost $10,953,493) | | $ | 12,435,839 | |
| | |
| OTHER ASSETS IN EXCESS OF
LIABILITIES – 1.7% | | | 213,783 | |
| | |
| | NET ASSETS – 100.0% | | $ | 12,649,622 | |
| | |
| | |
| The percentage shown for each investment category reflects the value of investments in that category as a percentage of net assets. |
(a) | | Represents an affiliated fund. |
| | |
|
Investment Abbreviations: |
ETF | | —Exchange Traded Fund |
TIPS | | —Treasury Inflation Protected Securities |
|
| | |
| 48 | | The accompanying notes are an integral part of these financial statements. |
GOLDMAN SACHS TARGET DATE 2060 PORTFOLIO
Schedule of Investments
August 31, 2018
| | | | | | | | |
Shares | | | Description | | Value | |
| Exchange Traded Funds – 95.9% | |
| Alternative Funds – 2.9% | |
| | 8,473 | | | Invesco Optimum Yield Diversified Commodity Strategy No. K-1 ETF | | $ | 153,870 | |
| | |
| Bond Funds – 14.7% | |
| | 426 | | | iShares 20+ Year Treasury Bond ETF | | | 51,544 | |
| | 9,800 | | | Schwab Intermediate-Term U.S. Treasury ETF | | | 512,540 | |
| | 1,883 | | | Schwab U.S. TIPS ETF | | | 102,887 | |
| | 1,315 | | | Vanguard Short-Term Corporate Bond ETF | | | 103,096 | |
| | | | | | | | |
| | | | | | | 770,067 | |
| | |
| Foreign Stock Funds – 21.0% | |
| | 6,065 | | | iShares Edge MSCI Minimum Volatility Emerging Markets ETF | | | 358,805 | |
| | 670 | | | Vanguard FTSE All World ex-US Small-Cap ETF | | | 76,728 | |
| | 2,930 | | | Vanguard FTSE All-World ex-U.S. ETF | | | 152,624 | |
| | 4,941 | | | Vanguard FTSE Europe ETF | | | 278,672 | |
| | 942 | | | WisdomTree Japan Hedged Equity Fund | | | 51,641 | |
| | 5,589 | | | Xtrackers MSCI EAFE Hedged Equity ETF | | | 178,233 | |
| | | | | | | | |
| | | | | | | 1,096,703 | |
| | |
| Stock Funds – 57.3% | |
| | 2,058 | | | Energy Select Sector SPDR Fund | | | 153,197 | |
| | 1,386 | | | Invesco Dynamic Pharmaceuticals ETF | | | 102,398 | |
| | 4,198 | | | iShares Core S&P 500 ETF | | | 1,227,663 | |
| | 1,504 | | | iShares Core S&P Mid-Cap ETF | | | 307,342 | |
| | 1,074 | | | iShares Edge MSCI Minimum Volatility EAFE ETF | | | 77,575 | |
| | 2,561 | | | iShares Edge MSCI USA Quality Factor ETF | | | 229,824 | |
| | 1,322 | | | iShares MSCI Japan ETF | | | 76,967 | |
| | 6,812 | | | Schwab U.S. Dividend Equity ETF | | | 359,060 | |
| | 1,786 | | | Vanguard Financials ETF | | | 127,842 | |
| | 324 | | | Vanguard Growth ETF | | | 52,080 | |
| | 1,011 | | | Vanguard Information Technology ETF | | | 205,031 | |
| | 569 | | | Vanguard Materials ETF | | | 76,383 | |
| | | | | | | | |
| | | | | | | 2,995,362 | |
| | |
| | TOTAL EXCHANGE TRADED FUNDS | |
| | (Cost $4,815,010) | | $ | 5,016,002 | |
| | |
| | | | | | | | |
Shares | | | Distribution
Rate | | Value | |
| | Investment Company(a) – 0.4% | |
| Goldman Sachs Financial Square Government Fund –
Institutional Shares |
|
| | 20,736 | | | 1.879% | | $ | 20,736 | |
| | (Cost $20,736) | |
| | |
| | TOTAL INVESTMENTS – 96.3% | |
| | (Cost $4,835,746) | | $ | 5,036,738 | |
| | |
| OTHER ASSETS IN EXCESS OF
LIABILITIES – 3.7% | | | 193,619 | |
| | |
| | NET ASSETS – 100.0% | | $ | 5,230,357 | |
| | |
| | |
The percentage shown for each investment category reflects the value of investments in that category as a percentage of net assets. |
(a) | | Represents an affiliated fund. |
| | |
|
Investment Abbreviations: |
ETF | | —Exchange Traded Fund |
TIPS | | —Treasury Inflation Protected Securities |
|
| | |
| The accompanying notes are an integral part of these financial statements. | | 49 |
GOLDMAN SACHS TARGET DATE PORTFOLIOS
Statements of Assets and Liabilities
August 31, 2018
| | | | | | | | | | | | | | |
| | | | |
| | | | | Target Date 2020
Portfolio | | | Target Date 2025
Portfolio | | | Target Date 2030
Portfolio | |
| | Assets: | |
| | Investments of unaffiliated issuers, at value (cost $43,126,942, $10,480,224 and $67,421,601) | | $ | 44,927,728 | | | $ | 11,169,295 | | | $ | 75,128,265 | |
| | Investments of affiliated issuers, at value (cost $229,794, $56,506 and $385,903) | | | 229,794 | | | | 56,506 | | | | 385,903 | |
| | Cash | | | 679,624 | | | | 140,688 | | | | 1,146,258 | |
| | Receivables: | |
| | Investments sold | | | 716,741 | | | | 147,280 | | | | 468,446 | |
| | Reimbursement from investment adviser | | | 57,703 | | | | 32,944 | | | | 58,580 | |
| | Portfolio shares sold | | | 6,819 | | | | 4,143 | | | | 8,674 | |
| | Dividends | | | 662 | | | | 173 | | | | 1,075 | |
| | Other assets | | | 58,728 | | | | 56,460 | | | | 60,007 | |
| | Total assets | | | 46,677,799 | | | | 11,607,489 | | | | 77,257,208 | |
| | | | | | | | | | | | | | |
| | Liabilities: | | | | | | | | | | | | |
| | Payables: | | | | | | | | | | | | |
| | Investments purchased | | | 707,109 | | | | 116,669 | | | | 464,685 | |
| | Management fees | | | 9,600 | | | | 2,406 | | | | 16,103 | |
| | Distribution and Service fees and Transfer Agency fees | | | 921 | | | | 497 | | | | 1,651 | |
| | Accrued expenses | | | 74,482 | | | | 73,281 | | | | 77,962 | |
| | Total liabilities | | | 792,112 | | | | 192,853 | | | | 560,401 | |
| | | | | | | | | | | | | | |
| | Net Assets: | | | | | | | | | | | | |
| | Paid-in capital | | | 42,972,629 | | | | 10,462,334 | | | | 66,886,676 | |
| | Undistributed net investment income | | | 456,433 | | | | 109,700 | | | | 721,043 | |
| | Accumulated net realized gain | | | 655,839 | | | | 153,531 | | | | 1,382,424 | |
| | Net unrealized gain | | | 1,800,786 | | | | 689,071 | | | | 7,706,664 | |
| | | NET ASSETS | | $ | 45,885,687 | | | $ | 11,414,636 | | | $ | 76,696,807 | |
| | | Net Assets: | | | | | | | | | | | | |
| | | Class A | | $ | 57,206 | | | $ | 151,675 | | | $ | 362,095 | |
| | | Institutional | | | 10,872 | | | | 10,655,023 | | | | 11,684 | |
| | | Service | | | 10,733 | | | | 11,240 | | | | 11,564 | |
| | | Investor | | | 894,142 | | | | 372,580 | | | | 1,330,064 | |
| | | Class R | | | 12,248 | | | | 11,207 | | | | 29,534 | |
| | | Class R6 | | | 44,900,486 | | | | 212,911 | | | | 74,951,866 | |
| | | Total Net Assets | | $ | 45,885,687 | | | $ | 11,414,636 | | | $ | 76,696,807 | |
| | | Shares Outstanding $0.001 par value (unlimited number of shares authorized): | | | | | | | | | | | | |
| | | Class A | | | 6,099 | | | | 13,881 | | | | 37,425 | |
| | | Institutional | | | 1,154 | | | | 974,422 | | | | 1,202 | |
| | | Service | | | 1,144 | | | | 1,032 | | | | 1,195 | |
| | | Investor | | | 95,121 | | | | 34,140 | | | | 137,205 | |
| | | Class R | | | 1,307 | | | | 1,030 | | | | 3,058 | |
| | | Class R6 | | | 4,764,821 | | | | 19,471 | | | | 7,711,552 | |
| | | Net asset value, offering and redemption price per share:(a) | | | | | | | | | | | | |
| | | Class A | | | $9.38 | | | | $10.93 | | | | $9.68 | |
| | | Institutional | | | 9.42 | | | | 10.93 | | | | 9.72 | |
| | | Service | | | 9.38 | | | | 10.90 | | | | 9.68 | |
| | | Investor | | | 9.40 | | | | 10.91 | | | | 9.69 | |
| | | Class R | | | 9.37 | | | | 10.88 | | | | 9.66 | |
| | | Class R6 | | | 9.42 | | | | 10.93 | | | | 9.72 | |
| | (a) | | Maximum public offering price per share for Class A Shares of the Target Date 2020, Target Date 2025 and Target Date 2030 Portfolios is $9.93, $11.57 and $10.24, respectively. |
| | |
| 50 | | The accompanying notes are an integral part of these financial statements. |
GOLDMAN SACHS TARGET DATE PORTFOLIOS
Statements of Assets and Liabilities (continued)
August 31, 2018
| | | | | | | | | | | | | | |
| | | | |
| | | | | Target Date 2035
Portfolio | | | Target Date 2040
Portfolio | | | Target Date 2045
Portfolio | |
| | Assets: | |
| | Investments of unaffiliated issuers, at value (cost $11,108,125, $43,286,020 and $10,955,203) | | $ | 12,216,115 | | | $ | 49,113,012 | | | $ | 12,229,749 | |
| | Investments of affiliated issuers, at value (cost $56,895, $290,705 and $54,070) | | | 56,895 | | | | 290,705 | | | | 54,070 | |
| | Cash | | | 189,465 | | | | 707,537 | | | | 190,859 | |
| | Receivables: | |
| | Investments sold | | | 80,047 | | | | 319,046 | | | | 82,822 | |
| | Reimbursement from investment adviser | | | 32,700 | | | | 57,301 | | | | 32,924 | |
| | Portfolio shares sold | | | 7,280 | | | | 11,552 | | | | 9,105 | |
| | Dividends | | | 178 | | | | 701 | | | | 187 | |
| | Other assets | | | 56,486 | | | | 58,774 | | | | 56,480 | |
| | Total assets | | | 12,639,166 | | | | 50,558,628 | | | | 12,656,196 | |
| | | | | | | | | | | | | | |
| | Liabilities: | | | | | | | | | | | | |
| | Payables: | | | | | | | | | | | | |
| | Investments purchased | | | 74,804 | | | | 310,003 | | | | 78,022 | |
| | Management fees | | | 2,608 | | | | 10,485 | | | | 2,612 | |
| | Distribution and Service fees and Transfer Agency fees | | | 563 | | | | 973 | | | | 550 | |
| | Accrued expenses | | | 72,552 | | | | 72,594 | | | | 73,367 | |
| | Total liabilities | | | 150,527 | | | | 394,055 | | | | 154,551 | |
| | | | | | | | | | | | | | |
| | Net Assets: | | | | | | | | | | | | |
| | Paid-in capital | | | 11,072,978 | | | | 42,350,820 | | | | 10,809,712 | |
| | Undistributed net investment income | | | 112,191 | | | | 461,837 | | | | 109,812 | |
| | Accumulated net realized gain | | | 195,480 | | | | 1,524,924 | | | | 307,575 | |
| | Net unrealized gain | | | 1,107,990 | | | | 5,826,992 | | | | 1,274,546 | |
| | | NET ASSETS | | $ | 12,488,639 | | | $ | 50,164,573 | | | $ | 12,501,645 | |
| | | Net Assets: | | | | | | | | | | | | |
| | | Class A | | $ | 106,683 | | | $ | 51,122 | | | $ | 106,372 | |
| | | Institutional | | | 11,138,942 | | | | 12,024 | | | | 11,471,574 | |
| | | Service | | | 11,725 | | | | 11,901 | | | | 12,059 | |
| | | Investor | | | 889,702 | | | | 635,606 | | | | 600,485 | |
| | | Class R | | | 11,763 | | | | 35,963 | | | | 41,157 | |
| | | Class R6 | | | 329,824 | | | | 49,417,957 | | | | 269,998 | |
| | | Total Net Assets | | $ | 12,488,639 | | | $ | 50,164,573 | | | $ | 12,501,645 | |
| | | Shares Outstanding $0.001 par value (unlimited number of shares authorized): | | | | | | | | | | | | |
| | | Class A | | | 9,409 | | | | 5,388 | | | | 9,172 | |
| | | Institutional | | | 979,501 | | | | 1,261 | | | | 984,904 | |
| | | Service | | | 1,035 | | | | 1,254 | | | | 1,039 | |
| | | Investor | | | 78,450 | | | | 66,824 | | | | 51,656 | |
| | | Class R | | | 1,040 | | | | 3,799 | | | | 3,555 | |
| | | Class R6 | | | 28,999 | | | | 5,178,821 | | | | 23,187 | |
| | | Net asset value, offering and redemption price per share:(a) | | | | | | | | | | | | |
| | | Class A | | | $11.34 | | | | $9.49 | | | | $11.60 | |
| | | Institutional | | | 11.37 | | | | 9.54 | | | | 11.65 | |
| | | Service | | | 11.33 | | | | 9.49 | | | | 11.60 | |
| | | Investor | | | 11.34 | | | | 9.51 | | | | 11.62 | |
| | | Class R | | | 11.32 | | | | 9.47 | | | | 11.58 | |
| | | Class R6 | | | 11.37 | | | | 9.54 | | | | 11.64 | |
| | (a) | | Maximum public offering price per share for Class A Shares of the Target Date 2035, Target Date 2040 and Target Date 2045 Portfolios is $12.00, $10.04 and $12.28, respectively. |
| | |
| The accompanying notes are an integral part of these financial statements. | | 51 |
GOLDMAN SACHS TARGET DATE PORTFOLIOS
Statements of Assets and Liabilities (continued)
August 31, 2018
| | | | | | | | | | | | | | |
| | | | |
| | | | | Target Date 2050
Portfolio | | | Target Date 2055
Portfolio | | | Target Date 2060
Portfolio | |
| | Assets: | |
| | Investments of unaffiliated issuers, at value (cost $25,860,923, $10,892,372 and $4,815,010) | | $ | 29,904,220 | | | $ | 12,374,718 | | | $ | 5,016,002 | |
| | Investments of affiliated issuers, at value (cost $139,647, $61,121 and $20,736) | | | 139,647 | | | | 61,121 | | | | 20,736 | |
| | Cash | | | 469,315 | | | | 187,751 | | | | 56,823 | |
| | Receivables: | | | | | | | | | | | | |
| | Deferred offering costs | | | — | | | | — | | | | 125,642 | |
| | Investments sold | | | 196,249 | | | | 83,263 | | | | 49,563 | |
| | Reimbursement from investment adviser | | | 56,728 | | | | 33,958 | | | | 46,762 | |
| | Portfolio shares sold | | | 6,355 | | | | 6,809 | | | | — | |
| | Dividends | | | 446 | | | | 183 | | | | 73 | |
| | Other assets | | | 57,802 | | | | 56,494 | | | | 100,461 | |
| | Total assets | | | 30,830,762 | | | | 12,804,297 | | | | 5,416,062 | |
| | | | | | | | | | | | | | |
| | Liabilities: | | | | | | | | | | | | |
| | Payables: | | | | | | | | | | | | |
| | Investments purchased | | | 190,583 | | | | 78,583 | | | | 24,549 | |
| | Management fees | | | 6,366 | | | | 2,639 | | | | 1,092 | |
| | Distribution and Service fees and Transfer Agency fees | | | 710 | | | | 546 | | | | 103 | |
| | Organization costs | | | — | | | | — | | | | 12,000 | |
| | Offering expense | | | — | | | | — | | | | 84,168 | |
| | Accrued expenses | | | 66,941 | | | | 72,907 | | | | 63,793 | |
| | Total liabilities | | | 264,600 | | | | 154,675 | | | | 185,705 | |
| | | | | | | | | | | | | | |
| | Net Assets: | | | | | | | | | | | | |
| | Paid-in capital | | | 25,474,126 | | | | 10,682,937 | | | | 4,999,939 | |
| | Undistributed net investment income | | | 263,044 | | | | 108,193 | | | | 31,954 | |
| | Accumulated net realized gain (loss) | | | 785,695 | | | | 376,146 | | | | (2,528 | ) |
| | Net unrealized gain | | | 4,043,297 | | | | 1,482,346 | | | | 200,992 | |
| | | NET ASSETS | | $ | 30,566,162 | | | $ | 12,649,622 | | | $ | 5,230,357 | |
| | | Net Assets: | | | | | | | | | | | | |
| | | Class A | | $ | 218,473 | | | $ | 118,303 | | | $ | 10,446 | |
| | | Institutional | | | 12,369 | | | | 11,810,935 | | | | 10,460 | |
| | | Service | | | 12,244 | | | | 12,399 | | | | 10,443 | |
| | | Investor | | | 830,220 | | | | 509,062 | | | | 10,455 | |
| | | Class R | | | 12,234 | | | | 38,004 | | | | 10,437 | |
| | | Class R6 | | | 29,480,622 | | | | 160,919 | | | | 5,178,116 | |
| | | Total Net Assets | | $ | 30,566,162 | | | $ | 12,649,622 | | | $ | 5,230,357 | |
| | | Shares Outstanding $0.001 par value (unlimited number of shares authorized): | | | | | | | | | | | | |
| | | Class A | | | 20,446 | | | | 9,971 | | | | 1,000 | |
| | | Institutional | | | 1,151 | | | | 990,978 | | | | 1,000 | |
| | | Service | | | 1,144 | | | | 1,044 | | | | 1,000 | |
| | | Investor | | | 77,453 | | | | 42,796 | | | | 1,000 | |
| | | Class R | | | 1,145 | | | | 3,214 | | | | 1,000 | |
| | | Class R6 | | | 2,743,696 | | | | 13,504 | | | | 495,000 | |
| | | Net asset value, offering and redemption price per share:(a) | | | | | | | | | | | | |
| | | Class A | | | $10.69 | | | | $11.86 | | | | $10.45 | |
| | | Institutional | | | 10.74 | | | | 11.92 | | | | 10.46 | |
| | | Service | | | 10.70 | | | | 11.87 | | | | 10.44 | |
| | | Investor | | | 10.72 | | | | 11.89 | | | | 10.46 | |
| | | Class R | | | 10.69 | | | | 11.82 | | | | 10.44 | |
| | | Class R6 | | | 10.74 | | | | 11.92 | | | | 10.46 | |
| | (a) | | Maximum public offering price per share for Class A Shares of the Target Date 2050, Target Date 2055 and Target Date 2060 Portfolios is $11.31, $12.55 and $11.06, respectively. |
| | |
| 52 | | The accompanying notes are an integral part of these financial statements. |
GOLDMAN SACHS TARGET DATE PORTFOLIOS
Statements of Operations
For the Fiscal Year Ended August 31, 2018
| | | | | | | | | | | | | | |
| | | | |
| | | | | Target Date 2020
Portfolio | | | Target Date 2025
Portfolio | | | Target Date 2030
Portfolio | |
| | Investment income: | |
| | Dividends — unaffiliated issuers | | $ | 1,059,652 | | | $ | 249,892 | | | $ | 1,667,697 | |
| | Dividends — affiliated issuers | | | 3,568 | | | | 748 | | | | 6,605 | |
| | Total investment income | | | 1,063,220 | | | | 250,640 | | | | 1,674,302 | |
| | | | | | | | | | | | | | |
| | Expenses: | |
| | Management fees | | | 118,721 | | | | 28,499 | | | | 194,404 | |
| | Professional fees | | | 113,642 | | | | 90,071 | | | | 93,131 | |
| | Custody, accounting and administrative services | | | 73,328 | | | | 53,763 | | | | 36,052 | |
| | Trustee fees | | | 26,105 | | | | 24,974 | | | | 27,142 | |
| | Transfer Agency fees(a) | | | 15,062 | | | | 5,219 | | | | 25,182 | |
| | Printing and mailing costs | | | 13,500 | | | | 16,997 | | | | 16,918 | |
| | Distribution and Service fees(a) | | | 165 | | | | 363 | | | | 922 | |
| | Registration fees | | | — | | | | 10,761 | | | | — | |
| | Other | | | 23,145 | | | | 18,268 | | | | — | |
| | Total expenses | | | 383,668 | | | | 248,915 | | | | 393,751 | |
| | Less — expense reductions | | | (242,980 | ) | | | (213,353 | ) | | | (162,319 | ) |
| | Net expenses | | | 140,688 | | | | 35,562 | | | | 231,432 | |
| | NET INVESTMENT INCOME | | | 922,532 | | | | 215,078 | | | | 1,442,870 | |
| | | | |
| | | | | | | | | | | | | | |
| | Realized and unrealized gain (loss): | |
| | Net realized gain from investments | | | 1,440,945 | | | | 290,566 | | | | 2,712,074 | |
| | Net change in unrealized gain (loss) on investments | | | (833,541 | ) | | | 119,284 | | | | 1,247,578 | |
| | Net realized and unrealized gain | | | 607,404 | | | | 409,850 | | | | 3,959,652 | |
| | NET INCREASE IN NET ASSETS RESULTING FROM OPERATIONS | | $ | 1,529,936 | | | $ | 624,928 | | | $ | 5,402,522 | |
| | (a) | | Class specific Distribution and/or Service and Transfer Agency fees were as follows: |
| | | | | | | | | | | | | | | | | | | | | | | | | | | | | | | | | | | | |
| | | Distribution and/or Service Fees | | | Transfer Agency Fees | |
| | | Class A | | | Service | | | Class R | | | Class A | | | Institutional | | | Service | | | Investor(b) | | | Class R | | | Class R6 | |
Target Date 2020 Portfolio | | $ | 58 | | | $ | 53 | | | $ | 54 | | | $ | 41 | | | $ | 4 | | | $ | 4 | | | $ | 1,497 | | | $ | 19 | | | $ | 13,497 | |
Target Date 2025 Portfolio | | | 253 | | | | 55 | | | | 55 | | | | 183 | | | | 4,314 | | | | 4 | | | | 662 | | | | 19 | | | | 37 | |
Target Date 2030 Portfolio | | | 735 | | | | 56 | | | | 131 | | | | 531 | | | | 4 | | | | 4 | | | | 2,566 | | | | 47 | | | | 22,030 | |
| | (b) | | Effective October 10, 2017, Class IR Shares changed its name to Investor Shares. |
| | |
| The accompanying notes are an integral part of these financial statements. | | 53 |
GOLDMAN SACHS TARGET DATE PORTFOLIOS
Statements of Operations (continued)
For the Fiscal Year Ended August 31, 2018
| | | | | | | | | | | | | | |
| | | | |
| | | | | Target Date 2035
Portfolio | | | Target Date 2040
Portfolio | | | Target Date 2045
Portfolio | |
| | Investment income: | | | | | | | | | | | | |
| | Dividends — unaffiliated issuers | | $ | 260,875 | | | $ | 1,071,423 | | | $ | 259,065 | |
| | Dividends — affiliated issuers | | | 1,017 | | | | 4,308 | | | | 1,022 | |
| | Total investment income | | | 261,892 | | | | 1,075,731 | | | | 260,087 | |
| | | | | | | | | | | | | | |
| | Expenses: | |
| | Professional fees | | | 90,071 | | | | 113,642 | | | | 90,071 | |
| | Custody, accounting and administrative services | | | 52,866 | | | | 70,134 | | | | 53,746 | |
| | Management fees | | | 30,437 | | | | 126,175 | | | | 30,560 | |
| | Trustee fees | | | 25,002 | | | | 26,243 | | | | 25,002 | |
| | Printing and mailing costs | | | 16,941 | | | | 13,900 | | | | 17,012 | |
| | Registration fees | | | 10,773 | | | | — | | | | 10,781 | |
| | Transfer Agency fees(a) | | | 5,993 | | | | 15,561 | | | | 5,769 | |
| | Distribution and Service fees(a) | | | 244 | | | | 282 | | | | 472 | |
| | Other | | | 18,328 | | | | — | | | | 18,333 | |
| | Total expenses | | | 250,655 | | | | 365,937 | | | | 251,746 | |
| | Less — expense reductions | | | (212,436 | ) | | | (216,886 | ) | | | (213,390 | ) |
| | Net expenses | | | 38,219 | | | | 149,051 | | | | 38,356 | |
| | NET INVESTMENT INCOME | | | 223,673 | | | | 926,680 | | | | 221,731 | |
| | | | |
| | | | | | | | | | | | | | |
| | Realized and unrealized gain (loss): | |
| | Net realized gain from investments | | | 320,714 | | | | 2,439,258 | | | | 426,539 | |
| | Net change in unrealized gain on investments | | | 377,089 | | | | 819,690 | | | | 432,827 | |
| | Net realized and unrealized gain | | | 697,803 | | | | 3,258,948 | | | | 859,366 | |
| | NET INCREASE IN NET ASSETS RESULTING FROM OPERATIONS | | $ | 921,476 | | | $ | 4,185,628 | | | $ | 1,081,097 | |
| | (a) | | Class specific Distribution and/or Service and Transfer Agency fees were as follows: |
| | | | | | | | | | | | | | | | | | | | | | | | | | | | | | | | | | | | |
| | | Distribution and/or Service Fees | | | Transfer Agency Fees | |
| | | Class A | | | Service | | | Class R | | | Class A | | | Institutional | | | Service | | | Investor(b) | | | Class R | | | Class R6 | |
Target Date 2035 Portfolio | | $ | 129 | | | $ | 57 | | | $ | 58 | | | $ | 93 | | | $ | 4,467 | | | $ | 4 | | | $ | 1,353 | | | $ | 22 | | | $ | 54 | |
Target Date 2040 Portfolio | | | 73 | | | | 58 | | | | 151 | | | | 52 | | | | 4 | | | | 4 | | | | 998 | | | | 55 | | | | 14,448 | |
Target Date 2045 Portfolio | | | 237 | | | | 58 | | | | 177 | | | | 172 | | | | 4,577 | | | | 4 | | | | 913 | | | | 64 | | | | 39 | |
| | (b) | | Effective October 10, 2017, Class IR Shares changed its name to Investor Shares. |
| | |
| 54 | | The accompanying notes are an integral part of these financial statements. |
GOLDMAN SACHS TARGET DATE PORTFOLIOS
Statements of Operations (continued)
For the Fiscal Year Ended August 31, 2018
| | | | | | | | | | | | | | |
| | | | |
| | | | | Target Date 2050
Portfolio | | | Target Date 2055
Portfolio | | | Target Date 2060
Portfolio(c) | |
| | Investment income: | | | | | | | | | | | | |
| | Dividends — unaffiliated issuers | | $ | 625,119 | | | $ | 258,548 | | | $ | 36,682 | |
| | Dividends — affiliated issuers | | | 2,972 | | | | 990 | | | | 150 | |
| | Total investment income | | | 628,091 | | | | 259,538 | | | | 36,832 | |
| | | | | | | | | | | | | | |
| | Expenses: | |
| | Professional fees | | | 113,642 | | | | 91,166 | | | | 25,970 | |
| | Management fees | | | 74,308 | | | | 30,817 | | | | 4,305 | |
| | Custody, accounting and administrative services | | | 61,356 | | | | 53,972 | | | | 15,951 | |
| | Trustee fees | | | 25,586 | | | | 25,003 | | | | 11,144 | |
| | Printing and mailing costs | | | 11,421 | | | | 17,249 | | | | 8,717 | |
| | Transfer Agency fees(a) | | | 10,082 | | | | 5,618 | | | | 532 | |
| | Distribution and Service fees(a) | | | 466 | | | | 470 | | | | 43 | |
| | Registration fees | | | — | | | | 10,773 | | | | — | |
| | Organization costs | | | — | | | | — | | | | 12,000 | |
| | Amortization of offering costs | | | — | | | | — | | | | 63,858 | |
| | Other | | | 20,274 | | | | 18,344 | | | | 18,270 | |
| | Total expenses | | | 317,135 | | | | 253,412 | | | | 160,790 | |
| | Less — expense reductions | | | (228,149 | ) | | | (214,928 | ) | | | (155,851 | ) |
| | Net expenses | | | 88,986 | | | | 38,484 | | | | 4,939 | |
| | NET INVESTMENT INCOME | | | 539,105 | | | | 221,054 | | | | 31,893 | |
| | | | |
| | | | | | | | | | | | | | |
| | Realized and unrealized gain (loss): | |
| | Net realized gain (loss) from investments | | | 1,186,611 | | | | 511,715 | | | | (2,528 | ) |
| | Net change in unrealized gain on investments | | | 1,058,332 | | | | 517,717 | | | | 200,992 | |
| | Net realized and unrealized gain | | | 2,244,943 | | | | 1,029,432 | | | | 198,464 | |
| | NET INCREASE IN NET ASSETS RESULTING FROM OPERATIONS | | $ | 2,784,048 | | | $ | 1,250,486 | | | $ | 230,357 | |
| | (a) | | Class specific Distribution and/or Service and Transfer Agency fees were as follows: |
| | | | | | | | | | | | | | | | | | | | | | | | | | | | | | | | | | | | |
| | | Distribution and/or Service Fees | | | Transfer Agency Fees | |
| | | Class A | | | Service | | | Class R | | | Class A | | | Institutional | | | Service | | | Investor(b) | | | Class R | | | Class R6 | |
Target Date 2050 Portfolio | | $ | 348 | | | $ | 59 | | | $ | 59 | | | $ | 251 | | | $ | 4 | | | $ | 4 | | | $ | 1,446 | | | $ | 22 | | | $ | 8,355 | |
Target Date 2055 Portfolio | | | 250 | | | | 60 | | | | 160 | | | | 181 | | | | 4,692 | | | | 4 | | | | 657 | | | | 57 | | | | 27 | |
Target Date 2060 Portfolio | | | 9 | | | | 17 | | | | 17 | | | | 6 | | | | 1 | | | | 1 | | | | 6 | | | | 6 | | | | 512 | |
| | (b) | | Effective October 10, 2017, Class IR Shares changed its name to Investor Shares. |
| | (c) | | Commenced operations on April 30, 2018. |
| | |
| The accompanying notes are an integral part of these financial statements. | | 55 |
GOLDMAN SACHS TARGET DATE PORTFOLIOS
Statements of Changes in Net Assets
| | | | | | | | | | | | | | |
| | | | | Target Date 2020 Portfolio | |
| | | | | For the Fiscal
Year Ended
August 31, 2018 | | | For the Period November 1, 2016 – August 31, 2017* | | | For the Fiscal
Year Ended
October 31, 2016 | |
| | From operations: | | | | | | | | | | | | |
| | Net investment income | | $ | 922,532 | | | $ | 749,850 | | | $ | 969,310 | |
| | Net realized gain | | | 1,440,945 | | | | 2,911,207 | | | | 2,304,750 | |
| | Net change in unrealized loss | | | (833,541 | ) | | | (350,687 | ) | | | (1,317,333 | ) |
| | Net increase in net assets resulting from operations | | | 1,529,936 | | | | 3,310,370 | | | | 1,956,727 | |
| | | | | | | | | | | | | | |
| | Distributions to shareholders: | | | | | | | | | | | | |
| | From net investment income | |
| | Class A Shares(a) | | | (282 | ) | | | (167 | ) | | | — | |
| | Institutional Shares(a) | | | (211 | ) | | | (182 | ) | | | — | |
| | Service Shares(a) | | | (159 | ) | | | (164 | ) | | | — | |
| | Investor Shares(a)(b) | | | (16,543 | ) | | | (177 | ) | | | — | |
| | Class R Shares(a) | | | (145 | ) | | | (159 | ) | | | — | |
| | Class R6 Shares | | | (936,697 | ) | | | (1,005,896 | ) | | | (899,589 | ) |
| | From net realized gains | |
| | Class A Shares(a) | | | (1,090 | ) | | | (373 | ) | | | — | |
| | Institutional Shares(a) | | | (708 | ) | | | (373 | ) | | | — | |
| | Service Shares(a) | | | (707 | ) | | | (373 | ) | | | — | |
| | Investor Shares(a)(b) | | | (55,965 | ) | | | (373 | ) | | | — | |
| | Class R Shares(a) | | | (707 | ) | | | (373 | ) | | | — | |
| | Class R6 Shares | | | (3,132,674 | ) | | | (2,022,264 | ) | | | (1,764,331 | ) |
| | Total distributions to shareholders | | | (4,145,888 | ) | | | (3,030,874 | ) | | | (2,663,920 | ) |
| | | | | | | | | | | | | | |
| | From share transactions: | | | | | | | | | | | | |
| | Proceeds from sales of shares | | | 3,009,932 | | | | 1,740,467 | | | | 5,445,589 | |
| | Reinvestment of distributions | | | 4,145,888 | | | | 3,030,874 | | | | 2,663,920 | |
| | Cost of shares redeemed | | | (6,614,042 | ) | | | (10,811,559 | ) | | | (7,300,343 | ) |
| | Net increase (decrease) in net assets resulting from share transactions | | | 541,778 | | | | (6,040,218 | ) | | | 809,166 | |
| | TOTAL INCREASE (DECREASE) | | | (2,074,174 | ) | | | (5,760,722 | ) | | | 101,973 | |
| | | | | | | | | | | | | | |
| | Net assets: | | | | | | | | | | | | |
| | Beginning of year | | | 47,959,861 | | | | 53,720,583 | | | | 53,618,610 | |
| | End of year | | $ | 45,885,687 | | | $ | 47,959,861 | | | $ | 53,720,583 | |
| | Undistributed net investment income | | $ | 456,433 | | | $ | 488,324 | | | $ | 747,818 | |
| | * | | The Portfolios changed their fiscal year end from October 31 to August 31. |
| | (a) | | Commenced operations on August 22, 2016. |
| | (b) | | Effective October 10, 2017, Class IR Shares changed its name to Investor Shares. |
| | |
| 56 | | The accompanying notes are an integral part of these financial statements. |
GOLDMAN SACHS TARGET DATE PORTFOLIOS
Statements of Changes in Net Assets (continued)
| | | | | | | | | | | | | | |
| | | | | Target Date 2025 Portfolio | |
| | | | | For the Fiscal
Year Ended
August 31, 2018 | | | For the Period November 1, 2016 – August 31, 2017* | | | For the
Period Ended
October 31, 2016(a) | |
| | From operations: | | | | | | | | | | | | |
| | Net investment income | | $ | 215,078 | | | $ | 145,466 | | | $ | 26,825 | |
| | Net realized gain (loss) | | | 290,566 | | | | 59,137 | | | | (57,510 | ) |
| | Net change in unrealized gain (loss) | | | 119,284 | | | | 706,788 | | | | (137,001 | ) |
| | Net increase (decrease) in net assets resulting from operations | | | 624,928 | | | | 911,391 | | | | (167,686 | ) |
| | | | | | | | | | | | | | |
| | Distributions to shareholders: | | | | | | | | | | | | |
| | From net investment income | |
| | Class A Shares | | | (375 | ) | | | (375 | ) | | | — | |
| | Institutional Shares | | | (190,671 | ) | | | (79,700 | ) | | | — | |
| | Service Shares | | | (139 | ) | | | (62 | ) | | | — | |
| | Investor Shares(b) | | | (5,981 | ) | | | (75 | ) | | | — | |
| | Class R Shares | | | (123 | ) | | | (57 | ) | | | — | |
| | Class R6 Shares | | | (1,700 | ) | | | (80 | ) | | | — | |
| | From net realized gains | |
| | Class A Shares | | | (407 | ) | | | — | | | | — | |
| | Institutional Shares | | | (132,503 | ) | | | — | | | | — | |
| | Service Shares | | | (133 | ) | | | — | | | | — | |
| | Investor Shares(b) | | | (4,127 | ) | | | — | | | | — | |
| | Class R Shares | | | (133 | ) | | | — | | | | — | |
| | Class R6 Shares | | | (1,090 | ) | | | — | | | | — | |
| | Total distributions to shareholders | | | (337,382 | ) | | | (80,349 | ) | | | — | |
| | | | | | | | | | | | | | |
| | From share transactions: | | | | | | | | | | | | |
| | Proceeds from sales of shares | | | 811,765 | | | | 84,579 | | | | 10,000,066 | |
| | Reinvestment of distributions | | | 337,382 | | | | 80,349 | | | | — | |
| | Cost of shares redeemed | | | (850,266 | ) | | | (76 | ) | | | (65 | ) |
| | Net increase in net assets resulting from share transactions | | | 298,881 | | | | 164,852 | | | | 10,000,001 | |
| | TOTAL INCREASE | | | 586,427 | | | | 995,894 | | | | 9,832,315 | |
| | | | | | | | | | | | | | |
| | Net assets: | | | | | | | | | | | | |
| | Beginning of year | | | 10,828,209 | | | | 9,832,315 | | | | — | |
| | End of year | | $ | 11,414,636 | | | $ | 10,828,209 | | | $ | 9,832,315 | |
| | Undistributed net investment income | | $ | 109,700 | | | $ | 93,676 | | | $ | 27,333 | |
| | * | | The Portfolios changed their fiscal year end from October 31 to August 31. |
| | (a) | | Commenced operations on August 22, 2016. |
| | (b) | | Effective October 10, 2017, Class IR Shares changed its name to Investor Shares. |
| | |
| The accompanying notes are an integral part of these financial statements. | | 57 |
GOLDMAN SACHS TARGET DATE PORTFOLIOS
Statements of Changes in Net Assets (continued)
| | | | | | | | | | | | | | |
| | | | | Target Date 2030 Portfolio | |
| | | | | For the Fiscal
Year Ended
August 31, 2018 | | | For the Period November 1, 2016 – August 31, 2017* | | | For the Fiscal
Year Ended
October 31, 2016 | |
| | From operations: | | | | | | | | | | | | |
| | Net investment income | | $ | 1,442,870 | | | $ | 1,094,982 | | | $ | 1,461,869 | |
| | Net realized gain | | | 2,712,074 | | | | 7,588,451 | | | | 2,737,159 | |
| | Net change in unrealized gain (loss) | | | 1,247,578 | | | | (771,447 | ) | | | (1,710,529 | ) |
| | Net increase in net assets resulting from operations | | | 5,402,522 | | | | 7,911,986 | | | | 2,488,499 | |
| | | | | | | | | | | | | | |
| | Distributions to shareholders: | | | | | | | | | | | | |
| | From net investment income | |
| | Class A Shares(a) | | | (3,123 | ) | | | (306 | ) | | | — | |
| | Institutional Shares(a) | | | (204 | ) | | | (198 | ) | | | — | |
| | Service Shares(a) | | | (150 | ) | | | (181 | ) | | | — | |
| | Investor Shares(a)(b) | | | (25,079 | ) | | | (193 | ) | | | — | |
| | Class R Shares(a) | | | (332 | ) | | | (175 | ) | | | — | |
| | Class R6 Shares | | | (1,365,572 | ) | | | (1,529,883 | ) | | | (1,258,551 | ) |
| | From net realized gains | |
| | Class A Shares(a) | | | (21,854 | ) | | | (317 | ) | | | — | |
| | Institutional Shares(a) | | | (1,138 | ) | | | (317 | ) | | | — | |
| | Service Shares(a) | | | (1,136 | ) | | | (317 | ) | | | — | |
| | Investor Shares(a)(b) | | | (140,985 | ) | | | (317 | ) | | | — | |
| | Class R Shares(a) | | | (2,546 | ) | | | (317 | ) | | | — | |
| | Class R6 Shares | | | (7,582,810 | ) | | | (2,407,010 | ) | | | (2,672,152 | ) |
| | Total distributions to shareholders | | | (9,144,929 | ) | | | (3,939,531 | ) | | | (3,930,703 | ) |
| | | | | | | | | | | | | | |
| | From share transactions: | | | | | | | | | | | | |
| | Proceeds from sales of shares | | | 4,794,234 | | | | 3,528,594 | | | | 2,761,285 | |
| | Reinvestment of distributions | | | 9,144,928 | | | | 3,939,531 | | | | 3,930,703 | |
| | Cost of shares redeemed | | | (9,436,035 | ) | | | (9,777,634 | ) | | | (9,983,568 | ) |
| | Net increase (decrease) in net assets resulting from share transactions | | | 4,503,127 | | | | (2,309,509 | ) | | | (3,291,580 | ) |
| | TOTAL INCREASE (DECREASE) | | | 760,720 | | | | 1,662,946 | | | | (4,733,784 | ) |
| | | | | | | | | | | | | | |
| | Net assets: | | | | | | | | | | | | |
| | Beginning of year | | | 75,936,087 | | | | 74,273,141 | | | | 79,006,925 | |
| | End of year | | $ | 76,696,807 | | | $ | 75,936,087 | | | $ | 74,273,141 | |
| | Undistributed net investment income | | $ | 721,043 | | | $ | 673,115 | | | $ | 1,109,790 | |
| | * | | The Portfolios changed their fiscal year end from October 31 to August 31. |
| | (a) | | Commenced operations on August 22, 2016. |
| | (b) | | Effective October 10, 2017, Class IR Shares changed its name to Investor Shares. |
| | |
| 58 | | The accompanying notes are an integral part of these financial statements. |
GOLDMAN SACHS TARGET DATE PORTFOLIOS
Statements of Changes in Net Assets (continued)
| | | | | | | | | | | | | | |
| | | | | Target Date 2035 Portfolio | |
| | | | | For the Fiscal
Year Ended
August 31, 2018 | | | For the Period November 1, 2016 – August 31, 2017* | | | For the
Period Ended
October 31, 2016(a) | |
| | From operations: | | | | | | | | | | | | |
| | Net investment income | | $ | 223,673 | | | $ | 147,635 | | | $ | 27,283 | |
| | Net realized gain (loss) | | | 320,714 | | | | 118,829 | | | | (56,337 | ) |
| | Net change in unrealized gain (loss) | | | 377,089 | | | | 888,166 | | | | (157,265 | ) |
| | Net increase (decrease) in net assets resulting from operations | | | 921,476 | | | | 1,154,630 | | | | (186,319 | ) |
| | | | | | | | | | | | | | |
| | Distributions to shareholders: | | | | | | | | | | | | |
| | From net investment income | |
| | Class A Shares | | | (389 | ) | | | (71 | ) | | | — | |
| | Institutional Shares | | | (188,851 | ) | | | (84,675 | ) | | | — | |
| | Service Shares | | | (136 | ) | | | (67 | ) | | | — | |
| | Investor Shares(b) | | | (11,788 | ) | | | (80 | ) | | | — | |
| | Class R Shares | | | (120 | ) | | | (62 | ) | | | — | |
| | Class R6 Shares | | | (1,665 | ) | | | (85 | ) | | | — | |
| | From net realized gains | |
| | Class A Shares | | | (461 | ) | | | — | | | | — | |
| | Institutional Shares | | | (174,407 | ) | | | — | | | | — | |
| | Service Shares | | | (175 | ) | | | — | | | | — | |
| | Investor Shares(b) | | | (10,932 | ) | | | — | | | | — | |
| | Class R Shares | | | (176 | ) | | | — | | | | — | |
| | Class R6 Shares | | | (1,394 | ) | | | — | | | | — | |
| | Total distributions to shareholders | | | (390,494 | ) | | | (85,040 | ) | | | — | |
| | | | | | | | | | | | | | |
| | From share transactions: | | | | | | | | | | | | |
| | Proceeds from sales of shares | | | 1,191,837 | | | | 180,035 | | | | 10,000,066 | |
| | Reinvestment of distributions | | | 390,494 | | | | 85,040 | | | | — | |
| | Cost of shares redeemed | | | (772,931 | ) | | | (90 | ) | | | (65 | ) |
| | Net increase in net assets resulting from share transactions | | | 809,400 | | | | 264,985 | | | | 10,000,001 | |
| | TOTAL INCREASE | | | 1,340,382 | | | | 1,334,575 | | | | 9,813,682 | |
| | | | | | | | | | | | | | |
| | Net assets: | | | | | | | | | | | | |
| | Beginning of year | | | 11,148,257 | | | | 9,813,682 | | | | — | |
| | End of year | | $ | 12,488,639 | | | $ | 11,148,257 | | | $ | 9,813,682 | |
| | Undistributed net investment income | | $ | 112,191 | | | $ | 91,530 | | | $ | 27,791 | |
| | * | | The Portfolios changed their fiscal year end from October 31 to August 31. |
| | (a) | | Commenced operations on August 22, 2016. |
| | (b) | | Effective October 10, 2017, Class IR Shares changed its name to Investor Shares. |
| | |
| The accompanying notes are an integral part of these financial statements. | | 59 |
GOLDMAN SACHS TARGET DATE PORTFOLIOS
Statements of Changes in Net Assets (continued)
| | | | | | | | | | | | | | |
| | | | | Target Date 2040 Portfolio | |
| | | | | For the Fiscal
Year Ended
August 31, 2018 | | | For the Period November 1, 2016 – August 31, 2017* | | | For the Fiscal
Year Ended
October 31, 2016 | |
| | From operations: | | | | | | | | | | | | |
| | Net investment income | | $ | 926,680 | | | $ | 718,594 | | | $ | 983,035 | |
| | Net realized gain | | | 2,439,258 | | | | 5,848,943 | | | | 2,200,742 | |
| | Net change in unrealized gain (loss) | | | 819,690 | | | | (625,537 | ) | | | (1,495,190 | ) |
| | Net increase in net assets resulting from operations | | | 4,185,628 | | | | 5,942,000 | | | | 1,688,587 | |
| | | | | | | | | | | | | | |
| | Distributions to shareholders: | | | | | | | | | | | | |
| | From net investment income | |
| | Class A Shares(a) | | | (317 | ) | | | (256 | ) | | | — | |
| | Institutional Shares(a) | | | (208 | ) | | | (211 | ) | | | — | |
| | Service Shares(a) | | | (154 | ) | | | (193 | ) | | | — | |
| | Investor Shares(a)(b) | | | (9,199 | ) | | | (206 | ) | | | — | |
| | Class R Shares(a) | | | (369 | ) | | | (188 | ) | | | — | |
| | Class R6 Shares | | | (890,648 | ) | | | (1,022,650 | ) | | | (839,070 | ) |
| | From net realized gains | |
| | Class A Shares(a) | | | (2,341 | ) | | | (571 | ) | | | — | |
| | Institutional Shares(a) | | | (1,349 | ) | | | (442 | ) | | | — | |
| | Service Shares(a) | | | (1,347 | ) | | | (443 | ) | | | — | |
| | Investor Shares(a)(b) | | | (60,128 | ) | | | (442 | ) | | | — | |
| | Class R Shares(a) | | | (3,188 | ) | | | (442 | ) | | | — | |
| | Class R6 Shares | | | (5,740,865 | ) | | | (2,134,309 | ) | | | (2,209,026 | ) |
| | Total distributions to shareholders | | | (6,710,113 | ) | | | (3,160,353 | ) | | | (3,048,096 | ) |
| | | | | | | | | | | | | | |
| | From share transactions: | | | | | | | | | | | | |
| | Proceeds from sales of shares | | | 2,240,301 | | | | 2,044,481 | | | | 1,187,738 | |
| | Reinvestment of distributions | | | 6,710,113 | | | | 3,160,353 | | | | 3,048,096 | |
| | Cost of shares redeemed | | | (5,356,520 | ) | | | (6,283,037 | ) | | | (5,514,019 | ) |
| | Net increase (decrease) in net assets resulting from share transactions | | | 3,593,894 | | | | (1,078,203 | ) | | | (1,278,185 | ) |
| | TOTAL INCREASE (DECREASE) | | | 1,069,409 | | | | 1,703,444 | | | | (2,637,694 | ) |
| | | | | | | | | | | | | | |
| | Net assets: | | | | | | | | | | | | |
| | Beginning of year | | | 49,095,164 | | | | 47,391,720 | | | | 50,029,414 | |
| | End of year | | $ | 50,164,573 | | | $ | 49,095,164 | | | $ | 47,391,720 | |
| | Undistributed net investment income | | $ | 461,837 | | | $ | 436,364 | | | $ | 738,785 | |
| | * | | The Portfolios changed their fiscal year end from October 31 to August 31. |
| | (a) | | Commenced operations on August 22, 2016. |
| | (b) | | Effective October 10, 2017, Class IR Shares changed its name to Investor Shares. |
| | |
| 60 | | The accompanying notes are an integral part of these financial statements. |
GOLDMAN SACHS TARGET DATE PORTFOLIOS
Statements of Changes in Net Assets (continued)
| | | | | | | | | | | | | | |
| | | | | Target Date 2045 Portfolio | |
| | | | | For the Fiscal
Year Ended
August 31, 2018 | | | For the Period November 1, 2016 – August 31, 2017* | | | For the
Period Ended
October 31, 2016(a) | |
| | From operations: | | | | | | | | | | | | |
| | Net investment income | | $ | 221,731 | | | $ | 149,139 | | | $ | 27,097 | |
| | Net realized gain (loss) | | | 426,539 | | | | 175,421 | | | | (57,327 | ) |
| | Net change in unrealized gain (loss) | | | 432,827 | | | | 1,006,023 | | | | (164,304 | ) |
| | Net increase (decrease) in net assets resulting from operations | | | 1,081,097 | | | | 1,330,583 | | | | (194,534 | ) |
| | | | | | | | | | | | | | |
| | Distributions to shareholders: | | | | | | | | | | | | |
| | From net investment income | |
| | Class A Shares | | | (1,331 | ) | | | (73 | ) | | | — | |
| | Institutional Shares | | | (191,700 | ) | | | (87,162 | ) | | | — | |
| | Service Shares | | | (139 | ) | | | (70 | ) | | | — | |
| | Investor Shares(b) | | | (7,286 | ) | | | (82 | ) | | | — | |
| | Class R Shares | | | (390 | ) | | | (65 | ) | | | — | |
| | Class R6 Shares | | | (1,489 | ) | | | (88 | ) | | | — | |
| | From net realized gains | |
| | Class A Shares | | | (1,765 | ) | | | — | | | | — | |
| | Institutional Shares | | | (224,124 | ) | | | — | | | | — | |
| | Service Shares | | | (225 | ) | | | — | | | | — | |
| | Investor Shares(b) | | | (8,463 | ) | | | — | | | | — | |
| | Class R Shares | | | (635 | ) | | | — | | | | — | |
| | Class R6 Shares | | | (1,542 | ) | | | — | | | | — | |
| | Total distributions to shareholders | | | (439,089 | ) | | | (87,540 | ) | | | — | |
| | | | | | | | | | | | | | |
| | From share transactions: | | | | | | | | | | | | |
| | Proceeds from sales of shares | | | 919,531 | | | | 251,712 | | | | 10,000,066 | |
| | Reinvestment of distributions | | | 439,087 | | | | 87,540 | | | | — | |
| | Cost of shares redeemed | | | (811,250 | ) | | | (75,493 | ) | | | (65 | ) |
| | Net increase in net assets resulting from share transactions | | | 547,368 | | | | 263,759 | | | | 10,000,001 | |
| | TOTAL INCREASE | | | 1,189,376 | | | | 1,506,802 | | | | 9,805,467 | |
| | | | | | | | | | | | | | |
| | Net assets: | | | | | | | | | | | | |
| | Beginning of year | | | 11,312,269 | | | | 9,805,467 | | | | — | |
| | End of year | | $ | 12,501,645 | | | $ | 11,312,269 | | | $ | 9,805,467 | |
| | Undistributed net investment income | | $ | 109,812 | | | $ | 90,473 | | | $ | 27,605 | |
| | * | | The Portfolios changed their fiscal year end from October 31 to August 31. |
| | (a) | | Commenced operations on August 22, 2016. |
| | (b) | | Effective October 10, 2017, Class IR Shares changed its name to Investor Shares. |
| | |
| The accompanying notes are an integral part of these financial statements. | | 61 |
GOLDMAN SACHS TARGET DATE PORTFOLIOS
Statements of Changes in Net Assets (continued)
| | | | | | | | | | | | | | |
| | | | | Target Date 2050 Portfolio | |
| | | | | For the Fiscal
Year Ended
August 31, 2018 | | | For the Period November 1, 2016 – August 31, 2017* | | | For the Fiscal
Year Ended
October 31, 2016 | |
| | From operations: | | | | | | | | | | | | |
| | Net investment income | | $ | 539,105 | | | $ | 350,541 | | | $ | 446,501 | |
| | Net realized gain | | | 1,186,611 | | | | 1,845,973 | | | | 844,921 | |
| | Net change in unrealized gain (loss) | | | 1,058,332 | | | | 1,087,414 | | | | (529,507 | ) |
| | Net increase in net assets resulting from operations | | | 2,784,048 | | | | 3,283,928 | | | | 761,915 | |
| | | | | | | | | | | | | | |
| | Distributions to shareholders: | | | | | | | | | | | | |
| | From net investment income | |
| | Class A Shares(a) | | | (1,493 | ) | | | (196 | ) | | | — | |
| | Institutional Shares(a) | | | (200 | ) | | | (210 | ) | | | — | |
| | Service Shares(a) | | | (144 | ) | | | (192 | ) | | | — | |
| | Investor Shares(a)(b) | | | (13,606 | ) | | | (205 | ) | | | — | |
| | Class R Shares(a) | | | (127 | ) | | | (187 | ) | | | — | |
| | Class R6 Shares | | | (474,938 | ) | | | (470,084 | ) | | | (348,249 | ) |
| | From net realized gains | |
| | Class A Shares(a) | | | (5,788 | ) | | | (404 | ) | | | — | |
| | Institutional Shares(a) | | | (713 | ) | | | (404 | ) | | | — | |
| | Service Shares(a) | | | (712 | ) | | | (404 | ) | | | — | |
| | Investor Shares(a)(b) | | | (48,815 | ) | | | (404 | ) | | | — | |
| | Class R Shares(a) | | | (714 | ) | | | (404 | ) | | | — | |
| | Class R6 Shares | | | (1,685,988 | ) | | | (892,169 | ) | | | (629,298 | ) |
| | Total distributions to shareholders | | | (2,233,238 | ) | | | (1,365,263 | ) | | | (977,547 | ) |
| | | | | | | | | | | | | | |
| | From share transactions: | | | | | | | | | | | | |
| | Proceeds from sales of shares | | | 4,089,517 | | | | 3,007,855 | | | | 1,728,932 | |
| | Reinvestment of distributions | | | 2,233,238 | | | | 1,365,263 | | | | 977,547 | |
| | Cost of shares redeemed | | | (2,700,388 | ) | | | (1,604,503 | ) | | | (1,267,315 | ) |
| | Net increase in net assets resulting from share transactions | | | 3,622,367 | | | | 2,768,615 | | | | 1,439,164 | |
| | TOTAL INCREASE | | | 4,173,177 | | | | 4,687,280 | | | | 1,223,532 | |
| | | | | | | | | | | | | | |
| | Net assets: | | | | | | | | | | | | |
| | Beginning of year | | | 26,392,985 | | | | 21,705,705 | | | | 20,482,173 | |
| | End of year | | $ | 30,566,162 | | | $ | 26,392,985 | | | $ | 21,705,705 | |
| | Undistributed net investment income | | $ | 263,044 | | | $ | 214,585 | | | $ | 333,260 | |
| | * | | The Portfolios changed their fiscal year end from October 31 to August 31. |
| | (a) | | Commenced operations on August 22, 2016. |
| | (b) | | Effective October 10, 2017, Class IR Shares changed its name to Investor Shares. |
| | |
| 62 | | The accompanying notes are an integral part of these financial statements. |
GOLDMAN SACHS TARGET DATE PORTFOLIOS
Statements of Changes in Net Assets (continued)
| | | | | | | | | | | | | | |
| | | | | Target Date 2055 Portfolio | |
| | | | | For the Fiscal
Year Ended
August 31, 2018 | | | For the Period November 1, 2016 – August 31, 2017* | | | For the
Period Ended
October 31, 2016(a) | |
| | From operations: | | | | | | | | | | | | |
| | Net investment income | | $ | 221,054 | | | $ | 151,195 | | | $ | 26,977 | |
| | Net realized gain (loss) | | | 511,715 | | | | 224,897 | | | | (64,343 | ) |
| | Net change in unrealized gain (loss) | | | 517,717 | | | | 1,129,809 | | | | (165,180 | ) |
| | Net increase (decrease) in net assets resulting from operations | | | 1,250,486 | | | | 1,505,901 | | | | (202,546 | ) |
| | | | | | | | | | | | | | |
| | Distributions to shareholders: | | | | | | | | | | | | |
| | From net investment income | |
| | Class A Shares | | | (1,292 | ) | | | (98 | ) | | | — | |
| | Institutional Shares | | | (193,278 | ) | | | (91,043 | ) | | | — | |
| | Service Shares | | | (139 | ) | | | (74 | ) | | | — | |
| | Investor Shares(b) | | | (5,284 | ) | | | (86 | ) | | | — | |
| | Class R Shares | | | (440 | ) | | | (69 | ) | | | — | |
| | Class R6 Shares | | | (1,022 | ) | | | (92 | ) | | | — | |
| | From net realized gains | |
| | Class A Shares | | | (2,272 | ) | | | — | | | | — | |
| | Institutional Shares | | | (283,232 | ) | | | — | | | | — | |
| | Service Shares | | | (284 | ) | | | — | | | | — | |
| | Investor Shares(b) | | | (7,710 | ) | | | — | | | | — | |
| | Class R Shares | | | (778 | ) | | | — | | | | — | |
| | Class R6 Shares | | | (1,378 | ) | | | — | | | | — | |
| | Total distributions to shareholders | | | (497,109 | ) | | | (91,462 | ) | | | — | |
| | | | | | | | | | | | | | |
| | From share transactions: | | | | | | | | | | | | |
| | Proceeds from sales of shares | | | 573,293 | | | | 176,911 | | | | 10,000,066 | |
| | Reinvestment of distributions | | | 497,109 | | | | 91,462 | | | | — | |
| | Cost of shares redeemed | | | (654,371 | ) | | | (53 | ) | | | (65 | ) |
| | Net increase in net assets resulting from share transactions | | | 416,031 | | | | 268,320 | | | | 10,000,001 | |
| | TOTAL INCREASE | | | 1,169,408 | | | | 1,682,759 | | | | 9,797,455 | |
| | | | | | | | | | | | | | |
| | Net assets: | | | | | | | | | | | | |
| | Beginning of year | | | 11,480,214 | | | | 9,797,455 | | | | — | |
| | End of year | | $ | 12,649,622 | | | $ | 11,480,214 | | | $ | 9,797,455 | |
| | Undistributed net investment income | | $ | 108,193 | | | $ | 88,669 | | | $ | 27,485 | |
| | * | | The Portfolios changed their fiscal year end from October 31 to August 31. |
| | (a) | | Commenced operations on August 22, 2016. |
| | (b) | | Effective October 10, 2017, Class IR Shares changed its name to Investor Shares. |
| | |
| The accompanying notes are an integral part of these financial statements. | | 63 |
GOLDMAN SACHS TARGET DATE PORTFOLIOS
Statements of Changes in Net Assets (continued)
| | | | | | |
| | | | | Target Date 2060
Portfolio | |
| | | | | For the
Period Ended
August 31, 2018(a) | |
| | From operations: | | | | |
| | Net investment income | | $ | 31,893 | |
| | Net realized loss | | | (2,528 | ) |
| | Net change in unrealized gain | | | 200,992 | |
| | Net increase in net assets resulting from operations | | | 230,357 | |
| | | | | | |
| | From share transactions: | | | | |
| | Proceeds from sales of shares | | | 5,000,010 | |
| | Cost of shares redeemed | | | (10 | ) |
| | Net increase in net assets resulting from share transactions | | | 5,000,000 | |
| | TOTAL INCREASE | | | 5,230,357 | |
| | | | | | |
| | Net assets: | | | | |
| | Beginning of period | | | — | |
| | End of period | | $ | 5,230,357 | |
| | Undistributed net investment income | | $ | 31,954 | |
| | (a) | | Commenced operations on April 30, 2018. |
| | |
| 64 | | The accompanying notes are an integral part of these financial statements. |
GOLDMAN SACHS TARGET DATE 2020 PORTFOLIO
Financial Highlights
Selected Share Data for a Share Outstanding Throughout Each Period
| | | | | | | | | | | | | | |
| | | | | Goldman Sachs Target Date 2020 Portfolio | |
| | | | | Class A Shares | |
| | | | | Year Ended
August 31, 2018 | | | Period November 1, 2016 –
August 31, 2017* | | | Period Ended
October 31, 2016 | |
| | Per Share Data | | | | | | | | | | | | |
| | Net asset value, beginning of period | | $ | 9.93 | | | $ | 9.90 | | | $ | 10.05 | |
| | Net investment income(a) | | | 0.14 | | | | 0.10 | | | | 0.02 | |
| | Net realized and unrealized gain (loss) | | | 0.14 | | | | 0.47 | | | | (0.17 | ) |
| | Total from investment operations | | | 0.28 | | | | 0.57 | | | | (0.15 | ) |
| | Distributions to shareholders from net investment income | | | (0.16 | ) | | | (0.16 | ) | | | — | |
| | Distributions to shareholders from net realized gains | | | (0.67 | ) | | | (0.38 | ) | | | — | |
| | Total distributions | | | (0.83 | ) | | | (0.54 | ) | | | — | |
| | Net asset value, end of period | | $ | 9.38 | | | $ | 9.93 | | | $ | 9.90 | |
| | Total return(b) | | | 2.89 | % | | | 6.06 | % | | | (1.49 | )% |
| | Net assets, end of period (in 000s) | | $ | 57 | | | $ | 16 | | | $ | 10 | |
| | Ratio of net expenses to average net assets(c) | | | 0.70 | % | | | 0.72 | %(d) | | | 0.74 | %(d) |
| | Ratio of total expenses to average net assets(c) | | | 1.31 | % | | | 1.26 | %(d) | | | 3.01 | %(d) |
| | Ratio of net investment income to average net assets | | | 1.45 | % | | | 1.21 | %(d) | | | 0.94 | %(d) |
| | Portfolio turnover rate(e) | | | 200 | % | | | 189 | % | | | 204 | % |
| | * | | The Portfolio changed its fiscal year end from October 31 to August 31. |
| | (a) | | Calculated based on the average shares outstanding methodology. |
| | (b) | | Assumes investment at the NAV at the beginning of the period, reinvestment of all dividends and distributions, a complete redemption of the investment at the NAV at the end of the period and no sales or redemption charges. Total returns would be reduced if a sales or redemption charge was taken into account. Returns do not reflect the impact of taxes to shareholders relating to Portfolio distributions or the redemption of Portfolio shares. Total returns for periods less than one full year are not annualized. The Goldman Sachs Target Date 2020 Portfolio’s predecessor was the Madison Target Retirement 2020 Fund (the “Predecessor Fund”). On August 22, 2016, the Predecessor Fund was reorganized as a new series of Goldman Sachs Trust II. Performance prior to August 22, 2016 is that of the Predecessor Fund. Total return information of the Predecessor Fund is included in the above table because the Predecessor Fund is considered the accounting survivor of the reorganization. |
| | (c) | | Expense ratios exclude the expenses of the Underlying Funds in which the Portfolio invests. |
| | (e) | | The Portfolio’s turnover rate is calculated in accordance with regulatory requirements, without regard to transactions involving short term investments. If such transactions were included, the Portfolio’s turnover rate may be higher. |
| | |
| The accompanying notes are an integral part of these financial statements. | | 65 |
GOLDMAN SACHS TARGET DATE 2020 PORTFOLIO
Financial Highlights (continued)
Selected Share Data for a Share Outstanding Throughout Each Period
| | | | | | | | | | | | | | |
| | | | | Goldman Sachs Target Date 2020 Portfolio | |
| | | | | Institutional Shares | |
| | | | | Year Ended
August 31, 2018 | | | Period
November 1, 2016 –
August 31, 2017* | | | Period Ended
October 31, 2016 | |
| | Per Share Data | | | | | | | | | | | | |
| | Net asset value, beginning of period | | $ | 9.96 | | | $ | 9.91 | | | $ | 10.05 | |
| | Net investment income(a) | | | 0.18 | | | | 0.13 | | | | 0.03 | |
| | Net realized and unrealized gain (loss) | | | 0.14 | | | | 0.48 | | | | (0.17 | ) |
| | Total from investment operations | | | 0.32 | | | | 0.61 | | | | (0.14 | ) |
| | Distributions to shareholders from net investment income | | | (0.19 | ) | | | (0.18 | ) | | | — | |
| | Distributions to shareholders from net realized gains | | | (0.67 | ) | | | (0.38 | ) | | | — | |
| | Total distributions | | | (0.86 | ) | | | (0.56 | ) | | | — | |
| | Net asset value, end of period | | $ | 9.42 | | | $ | 9.96 | | | $ | 9.91 | |
| | Total return(b) | | | 3.33 | % | | | 6.42 | % | | | (1.39 | )% |
| | Net assets, end of period (in 000s) | | $ | 11 | | | $ | 10 | | | $ | 10 | |
| | Ratio of net expenses to average net assets(c) | | | 0.30 | % | | | 0.32 | %(d) | | | 0.34 | %(d) |
| | Ratio of total expenses to average net assets(c) | | | 0.81 | % | | | 0.96 | %(d) | | | 2.61 | %(d) |
| | Ratio of net investment income to average net assets | | | 1.93 | % | | | 1.66 | %(d) | | | 1.34 | %(d) |
| | Portfolio turnover rate(e) | | | 200 | % | | | 189 | % | | | 204 | % |
| | * | | The Portfolio changed its fiscal year end from October 31 to August 31. |
| | (a) | | Calculated based on the average shares outstanding methodology. |
| | (b) | | Assumes investment at the NAV at the beginning of the period, reinvestment of all dividends and distributions, a complete redemption of the investment at the NAV at the end of the period and no sales or redemption charges. Total returns would be reduced if a sales or redemption charge was taken into account. Returns do not reflect the impact of taxes to shareholders relating to Portfolio distributions or the redemption of Portfolio shares. Total returns for periods less than one full year are not annualized. The Goldman Sachs Target Date 2020 Portfolio’s predecessor was the Madison Target Retirement 2020 Fund (the “Predecessor Fund”). On August 22, 2016, the Predecessor Fund was reorganized as a new series of Goldman Sachs Trust II. Performance prior to August 22, 2016 is that of the Predecessor Fund. Total return information of the Predecessor Fund is included in the above table because the Predecessor Fund is considered the accounting survivor of the reorganization. |
| | (c) | | Expense ratios exclude the expenses of the Underlying Funds in which the Portfolio invests. |
| | (e) | | The Portfolio’s turnover rate is calculated in accordance with regulatory requirements, without regard to transactions involving short term investments. If such transactions were included, the Portfolio’s turnover rate may be higher. |
| | |
| 66 | | The accompanying notes are an integral part of these financial statements. |
GOLDMAN SACHS TARGET DATE 2020 PORTFOLIO
Financial Highlights (continued)
Selected Share Data for a Share Outstanding Throughout Each Period
| | | | | | | | | | | | | | |
| | | | | Goldman Sachs Target Date 2020 Portfolio
| |
| | | | | Service Shares | |
| | | | | Year Ended
August 31, 2018 | | | Period
November 1, 2016 –
August 31, 2017* | | | Period Ended
October 31, 2016 | |
| | Per Share Data | | | | | | | | | | | | |
| | Net asset value, beginning of period | | $ | 9.93 | | | $ | 9.90 | | | $ | 10.05 | |
| | Net investment income(a) | | | 0.14 | | | | 0.09 | | | | 0.02 | |
| | Net realized and unrealized gain (loss) | | | 0.12 | | | | 0.48 | | | | (0.17 | ) |
| | Total from investment operations | | | 0.26 | | | | 0.57 | | | | (0.15 | ) |
| | Distributions to shareholders from net investment income | | | (0.14 | ) | | | (0.16 | ) | | | — | |
| | Distributions to shareholders from net realized gains | | | (0.67 | ) | | | (0.38 | ) | | | — | |
| | Total distributions | | | (0.81 | ) | | | (0.54 | ) | | | — | |
| | Net asset value, end of period | | $ | 9.38 | | | $ | 9.93 | | | $ | 9.90 | |
| | Total return(b) | | | 2.73 | % | | | 6.02 | % | | | (1.49 | )% |
| | Net assets, end of period (in 000s) | | $ | 11 | | | $ | 10 | | | $ | 10 | |
| | Ratio of net expenses to average net assets(c) | | | 0.80 | % | | | 0.82 | %(d) | | | 0.84 | %(d) |
| | Ratio of total expenses to average net assets(c) | | | 1.31 | % | | | 1.46 | %(d) | | | 3.11 | %(d) |
| | Ratio of net investment income to average net assets | | | 1.43 | % | | | 1.16 | %(d) | | | 0.84 | %(d) |
| | Portfolio turnover rate(e) | | | 200 | % | | | 189 | % | | | 204 | % |
| | * | | The Portfolio changed its fiscal year end from October 31 to August 31. |
| | (a) | | Calculated based on the average shares outstanding methodology. |
| | (b) | | Assumes investment at the NAV at the beginning of the period, reinvestment of all dividends and distributions, a complete redemption of the investment at the NAV at the end of the period and no sales or redemption charges. Total returns would be reduced if a sales or redemption charge was taken into account. Returns do not reflect the impact of taxes to shareholders relating to Portfolio distributions or the redemption of Portfolio shares. Total returns for periods less than one full year are not annualized. The Goldman Sachs Target Date 2020 Portfolio’s predecessor was the Madison Target Retirement 2020 Fund (the “Predecessor Fund”). On August 22, 2016, the Predecessor Fund was reorganized as a new series of Goldman Sachs Trust II. Performance prior to August 22, 2016 is that of the Predecessor Fund. Total return information of the Predecessor Fund is included in the above table because the Predecessor Fund is considered the accounting survivor of the reorganization. |
| | (c) | | Expense ratios exclude the expenses of the Underlying Funds in which the Portfolio invests. |
| | (e) | | The Portfolio’s turnover rate is calculated in accordance with regulatory requirements, without regard to transactions involving short term investments. If such transactions were included, the Portfolio’s turnover rate may be higher. |
| | |
| The accompanying notes are an integral part of these financial statements. | | 67 |
GOLDMAN SACHS TARGET DATE 2020 PORTFOLIO
Financial Highlights (continued)
Selected Share Data for a Share Outstanding Throughout Each Period
| | | | | | | | | | | | | | |
| | | | | Goldman Sachs Target Date 2020 Portfolio | |
| | | | | Investor Shares(a) | |
| | | | | Year Ended
August 31, 2018 | | | Period
November 1, 2016 –
August 31, 2017* | | | Period Ended
October 31, 2016 | |
| | Per Share Data | | | | | | | | | | | | |
| | Net asset value, beginning of period | | $ | 9.95 | | | $ | 9.91 | | | $ | 10.05 | |
| | Net investment income(b) | | | 0.17 | | | | 0.09 | | | | 0.02 | |
| | Net realized and unrealized gain (loss) | | | 0.13 | | | | 0.50 | | | | (0.16 | ) |
| | Total from investment operations | | | 0.30 | | | | 0.59 | | | | (0.14 | ) |
| | Distributions to shareholders from net investment income | | | (0.18 | ) | | | (0.17 | ) | | | — | |
| | Distributions to shareholders from net realized gains | | | (0.67 | ) | | | (0.38 | ) | | | — | |
| | Total distributions | | | (0.85 | ) | | | (0.55 | ) | | | — | |
| | Net asset value, end of period | | $ | 9.40 | | | $ | 9.95 | | | $ | 9.91 | |
| | Total return(c) | | | 3.19 | % | | | 6.26 | % | | | (1.39 | )% |
| | Net assets, end of period (in 000s) | | $ | 894 | | | $ | 323 | | | $ | 10 | |
| | Ratio of net expenses to average net assets(d) | | | 0.45 | % | | | 0.46 | %(e) | | | 0.48 | %(e) |
| | Ratio of total expenses to average net assets(d) | | | 0.97 | % | | | 1.07 | %(e) | | | 2.75 | %(e) |
| | Ratio of net investment income to average net assets | | | 1.78 | % | | | 1.08 | %(e) | | | 1.19 | %(e) |
| | Portfolio turnover rate(f) | | | 200 | % | | | 189 | % | | | 204 | % |
| | * | | The Portfolio changed its fiscal year end from October 31 to August 31. |
| | (a) | | Effective October 10, 2017, Class IR Shares changed its name to Investor Shares. |
| | (b) | | Calculated based on the average shares outstanding methodology. |
| | (c) | | Assumes investment at the NAV at the beginning of the period, reinvestment of all dividends and distributions, a complete redemption of the investment at the NAV at the end of the period and no sales or redemption charges. Total returns would be reduced if a sales or redemption charge was taken into account. Returns do not reflect the impact of taxes to shareholders relating to Portfolio distributions or the redemption of Portfolio shares. Total returns for periods less than one full year are not annualized. The Goldman Sachs Target Date 2020 Portfolio’s predecessor was the Madison Target Retirement 2020 Fund (the “Predecessor Fund”). On August 22, 2016, the Predecessor Fund was reorganized as a new series of Goldman Sachs Trust II. Performance prior to August 22, 2016 is that of the Predecessor Fund. Total return information of the Predecessor Fund is included in the above table because the Predecessor Fund is considered the accounting survivor of the reorganization. |
| | (d) | | Expense ratios exclude the expenses of the Underlying Funds in which the Portfolio invests. |
| | (f) | | The Portfolio’s turnover rate is calculated in accordance with regulatory requirements, without regard to transactions involving short term investments. If such transactions were included, the Portfolio’s turnover rate may be higher. |
| | |
| 68 | | The accompanying notes are an integral part of these financial statements. |
GOLDMAN SACHS TARGET DATE 2020 PORTFOLIO
Financial Highlights (continued)
Selected Share Data for a Share Outstanding Throughout Each Period
| | | | | | | | | | | | | | |
| | | | | Goldman Sachs Target Date 2020 Portfolio
| |
| | | | | Class R Shares | |
| | | | | Year Ended August 31, 2018 | | | Period
November 1, 2016 –
August 31, 2017* | | | Period Ended
October 31, 2016 | |
| | Per Share Data | | | | | | | | | | | | |
| | Net asset value, beginning of period | | $ | 9.92 | | | $ | 9.90 | | | $ | 10.05 | |
| | Net investment income(a) | | | 0.12 | | | | 0.08 | | | | 0.01 | |
| | Net realized and unrealized gain (loss) | | | 0.13 | | | | 0.47 | | | | (0.16 | ) |
| | Total from investment operations | | | 0.25 | | | | 0.55 | | | | (0.15 | ) |
| | Distributions to shareholders from net investment income | | | (0.13 | ) | | | (0.15 | ) | | | — | |
| | Distributions to shareholders from net realized gains | | | (0.67 | ) | | | (0.38 | ) | | | — | |
| | Total distributions | | | (0.80 | ) | | | (0.53 | ) | | | — | |
| | Net asset value, end of period | | $ | 9.37 | | | $ | 9.92 | | | $ | 9.90 | |
| | Total return(b) | | | 2.61 | % | | | 5.86 | % | | | (1.49 | )% |
| | Net assets, end of period (in 000s) | | $ | 12 | | | $ | 10 | | | $ | 10 | |
| | Ratio of net expenses to average net assets(c) | | | 0.94 | % | | | 0.97 | %(d) | | | 0.98 | %(d) |
| | Ratio of total expenses to average net assets(c) | | | 1.45 | % | | | 1.61 | %(d) | | | 3.25 | %(d) |
| | Ratio of net investment income to average net assets | | | 1.29 | % | | | 1.01 | %(d) | | | 0.69 | %(d) |
| | Portfolio turnover rate(e) | | | 200 | % | | | 189 | % | | | 204 | % |
| | * | | The Portfolio changed its fiscal year end from October 31 to August 31. |
| | (a) | | Calculated based on the average shares outstanding methodology. |
| | (b) | | Assumes investment at the NAV at the beginning of the period, reinvestment of all dividends and distributions, a complete redemption of the investment at the NAV at the end of the period and no sales or redemption charges. Total returns would be reduced if a sales or redemption charge was taken into account. Returns do not reflect the impact of taxes to shareholders relating to Portfolio distributions or the redemption of Portfolio shares. Total returns for periods less than one full year are not annualized. The Goldman Sachs Target Date 2020 Portfolio’s predecessor was the Madison Target Retirement 2020 Fund (the “Predecessor Fund”). On August 22, 2016, the Predecessor Fund was reorganized as a new series of Goldman Sachs Trust II. Performance prior to August 22, 2016 is that of the Predecessor Fund. Total return information of the Predecessor Fund is included in the above table because the Predecessor Fund is considered the accounting survivor of the reorganization. |
| | (c) | | Expense ratios exclude the expenses of the Underlying Funds in which the Portfolio invests. |
| | (e) | | The Portfolio’s turnover rate is calculated in accordance with regulatory requirements, without regard to transactions involving short term investments. If such transactions were included, the Portfolio’s turnover rate may be higher. |
| | |
| The accompanying notes are an integral part of these financial statements. | | 69 |
GOLDMAN SACHS TARGET DATE 2020 PORTFOLIO
Financial Highlights (continued)
Selected Share Data for a Share Outstanding Throughout Each Period
| | | | | | | | | | | | | | | | | | | | | | |
| | | | | Goldman Sachs Target Date 2020 Portfolio | |
| | | | | Class R6 Shares | |
| | | | | Year Ended
August 31, 2018 | | | Period
November 1, 2016 –
August 31, 2017* | | | Year Ended October 31, | | | Period Ended
October 31, 2014 | |
| | | | | 2016 | | | 2015 | |
| | Per Share Data | | | | | | | | | | | | | | | | | | | | |
| | Net asset value, beginning of period | | $ | 9.96 | | | $ | 9.91 | | | $ | 10.07 | | | $ | 10.00 | | | $ | 10.00 | |
| | Net investment income(a) | | | 0.19 | | | | 0.14 | | | | 0.18 | | | | 0.16 | | | | 0.03 | |
| | Net realized and unrealized gain (loss) | | | 0.13 | | | | 0.47 | | | | 0.16 | | | | 0.10 | | | | (0.03 | ) |
| | Total from investment operations | | | 0.32 | | | | 0.61 | | | | 0.34 | | | | 0.26 | | | | — | |
| | Distributions to shareholders from net investment income | | | (0.19 | ) | | | (0.18 | ) | | | (0.17 | ) | | | (0.09 | ) | | | — | |
| | Distributions to shareholders from net realized gains | | | (0.67 | ) | | | (0.38 | ) | | | (0.33 | ) | | | (0.10 | ) | | | — | |
| | Total distributions | | | (0.86 | ) | | | (0.56 | ) | | | (0.50 | ) | | | (0.19 | ) | | | — | |
| | Net asset value, end of period | | $ | 9.42 | | | $ | 9.96 | | | $ | 9.91 | | | $ | 10.07 | | | $ | 10.00 | |
| | Total return(b) | | | 3.33 | % | | | 6.42 | % | | | 3.65 | % | | | 2.61 | % | | | — | % |
| | Net assets, end of period (in 000s) | | $ | 44,900 | | | $ | 47,589 | | | $ | 53,671 | | | $ | 53,619 | | | $ | 61,964 | |
| | Ratio of net expenses to average net assets(c) | | | 0.29 | % | | | 0.30 | %(d) | | | 0.31 | % | | | 0.30 | % | | | 0.32 | %(d) |
| | Ratio of total expenses to average net assets(c) | | | 0.80 | % | | | 0.94 | %(d) | | | 0.76 | % | | | 0.30 | % | | | 0.32 | %(d) |
| | Ratio of net investment income to average net assets | | | 1.95 | % | | | 1.69 | %(d) | | | 1.79 | % | | | 1.46 | % | | | 1.82 | %(d) |
| | Portfolio turnover rate(e) | | | 200 | % | | | 189 | % | | | 204 | % | | | 207 | % | | | 48 | % |
| | * | | The Portfolio changed its fiscal year end from October 31 to August 31. |
| | (a) | | Calculated based on the average shares outstanding methodology. |
| | (b) | | Assumes investment at the NAV at the beginning of the period, reinvestment of all dividends and distributions, a complete redemption of the investment at the NAV at the end of the period and no sales or redemption charges. Total returns would be reduced if a sales or redemption charge was taken into account. Returns do not reflect the impact of taxes to shareholders relating to Portfolio distributions or the redemption of Portfolio shares. Total returns for periods less than one full year are not annualized. The Goldman Sachs Target Date 2020 Portfolio’s predecessor was the Madison Target Retirement 2020 Fund (the “Predecessor Fund”). On August 22, 2016, the Predecessor Fund was reorganized as a new series of Goldman Sachs Trust II. Performance prior to August 22, 2016 is that of the Predecessor Fund. Total return information of the Predecessor Fund is included in the above table because the Predecessor Fund is considered the accounting survivor of the reorganization. |
| | (c) | | Expense ratios exclude the expenses of the Underlying Funds in which the Portfolio invests. |
| | (e) | | The Portfolio’s turnover rate is calculated in accordance with regulatory requirements, without regard to transactions involving short term investments. If such transactions were included, the Portfolio’s turnover rate may be higher. |
| | |
| 70 | | The accompanying notes are an integral part of these financial statements. |
GOLDMAN SACHS TARGET DATE 2025 PORTFOLIO
Financial Highlights (continued)
Selected Share Data for a Share Outstanding Throughout Each Period
| | | | | | | | | | | | | | |
| | | | | Goldman Sachs Target Date 2025 Portfolio | |
| | | | | Class A Shares | |
| | | | | Year Ended
August 31, 2018 | | | Period
November 1, 2016 –
August 31, 2017* | | | Period Ended
October 31, 2016(a) | |
| | Per Share Data | | | | | | | | | | | | |
| | Net asset value, beginning of period | | $ | 10.61 | | | $ | 9.82 | | | $ | 10.00 | |
| | Net investment income(b) | | | 0.15 | | | | 0.12 | | | | 0.02 | |
| | Net realized and unrealized gain (loss) | | | 0.42 | | | | 0.75 | | | | (0.20 | ) |
| | Total from investment operations | | | 0.57 | | | | 0.87 | | | | (0.18 | ) |
| | Distributions to shareholders from net investment income | | | (0.12 | ) | | | (0.08 | ) | | | — | |
| | Distributions to shareholders from net realized gains | | | (0.13 | ) | | | — | | | | — | |
| | Total distributions | | | (0.25 | ) | | | (0.08 | ) | | | — | |
| | Net asset value, end of period | | $ | 10.93 | | | $ | 10.61 | | | $ | 9.82 | |
| | Total return(c) | | | 5.42 | % | | | 8.77 | % | | | (1.70 | )% |
| | Net assets, end of period (in 000s) | | $ | 152 | | | $ | 75 | | | $ | 10 | |
| | Ratio of net expenses to average net assets(d) | | | 0.69 | % | | | 0.71 | %(e) | | | 0.75 | %(e) |
| | Ratio of total expenses to average net assets(d) | | | 2.54 | % | | | 4.54 | %(e) | | | 4.23 | %(e) |
| | Ratio of net investment income to average net assets | | | 1.42 | % | | | 1.39 | %(e) | | | 1.01 | %(e) |
| | Portfolio turnover rate(f) | | | 177 | % | | | 167 | % | | | 33 | % |
| | * | | The Portfolio changed its fiscal year end from October 31 to August 31. |
| | (a) | | Commenced operations on August 22, 2016. |
| | (b) | | Calculated based on the average shares outstanding methodology. |
| | (c) | | Assumes investment at the NAV at the beginning of the period, reinvestment of all dividends and distributions, a complete redemption of the investment at the NAV at the end of the period and no sales or redemption charges. Total returns would be reduced if a sales or redemption charge was taken into account. Returns do not reflect the impact of taxes to shareholders relating to Portfolio distributions or the redemption of Portfolio shares. Total returns for periods less than one full year are not annualized. |
| | (d) | | Expense ratios exclude the expenses of the Underlying Funds in which the Portfolio invests. |
| | (f) | | The Portfolio’s turnover rate is calculated in accordance with regulatory requirements, without regard to transactions involving short term investments. If such transactions were included, the Portfolio’s turnover rate may be higher. |
| | |
| The accompanying notes are an integral part of these financial statements. | | 71 |
GOLDMAN SACHS TARGET DATE 2025 PORTFOLIO
Financial Highlights (continued)
Selected Share Data for a Share Outstanding Throughout Each Period
| | | | | | | | | | | | | | |
| | | | | Goldman Sachs Target Date 2025 Portfolio | |
| | | | | Institutional Shares | |
| | | | | Year Ended
August 31, 2018 | | | Period
November 1, 2016 –
August 31, 2017* | | | Period Ended
October 31, 2016(a) | |
| | Per Share Data | | | | | | | | | | | | |
| | Net asset value, beginning of period | | $ | 10.65 | | | $ | 9.83 | | | $ | 10.00 | |
| | Net investment income(b) | | | 0.20 | | | | 0.14 | | | | 0.03 | |
| | Net realized and unrealized gain (loss) | | | 0.40 | | | | 0.76 | | | | (0.20 | ) |
| | Total from investment operations | | | 0.60 | | | | 0.90 | | | | (0.17 | ) |
| | Distributions to shareholders from net investment income | | | (0.19 | ) | | | (0.08 | ) | | | — | |
| | Distributions to shareholders from net realized gains | | | (0.13 | ) | | | — | | | | — | |
| | Total distributions | | | (0.32 | ) | | | (0.08 | ) | | | — | |
| | Net asset value, end of period | | $ | 10.93 | | | $ | 10.65 | | | $ | 9.83 | |
| | Total return(c) | | | 5.70 | % | | | 9.22 | % | | | (1.70 | )% |
| | Net assets, end of period (in 000s) | | $ | 10,655 | | | $ | 10,687 | | | $ | 9,783 | |
| | Ratio of net expenses to average net assets(d) | | | 0.30 | % | | | 0.32 | %(e) | | | 0.34 | %(e) |
| | Ratio of total expenses to average net assets(d) | | | 2.18 | % | | | 3.92 | %(e) | | | 3.85 | %(e) |
| | Ratio of net investment income to average net assets | | | 1.90 | % | | | 1.69 | %(e) | | | 1.42 | %(e) |
| | Portfolio turnover rate(f) | | | 177 | % | | | 167 | % | | | 33 | % |
| | * | | The Portfolio changed its fiscal year end from October 31 to August 31. |
| | (a) | | Commenced operations on August 22, 2016. |
| | (b) | | Calculated based on the average shares outstanding methodology. |
| | (c) | | Assumes investment at the NAV at the beginning of the period, reinvestment of all dividends and distributions, a complete redemption of the investment at the NAV at the end of the period and no sales or redemption charges. Total returns would be reduced if a sales or redemption charge was taken into account. Returns do not reflect the impact of taxes to shareholders relating to Portfolio distributions or the redemption of Portfolio shares. Total returns for periods less than one full year are not annualized. |
| | (d) | | Expense ratios exclude the expenses of the Underlying Funds in which the Portfolio invests. |
| | (f) | | The Portfolio’s turnover rate is calculated in accordance with regulatory requirements, without regard to transactions involving short term investments. If such transactions were included, the Portfolio’s turnover rate may be higher. |
| | |
| 72 | | The accompanying notes are an integral part of these financial statements. |
GOLDMAN SACHS TARGET DATE 2025 PORTFOLIO
Financial Highlights (continued)
Selected Share Data for a Share Outstanding Throughout Each Period
| | | | | | | | | | | | | | |
| | | | | Goldman Sachs Target Date 2025 Portfolio | |
| | | | | Service Shares | |
| | | | | Year Ended
August 31, 2018 | | | Period
November 1, 2016 –
August 31, 2017* | | | Period Ended
October 31, 2016(a) | |
| | Per Share Data | | | | | | | | | | | | |
| | Net asset value, beginning of period | | $ | 10.62 | | | $ | 9.82 | | | $ | 10.00 | |
| | Net investment income(b) | | | 0.15 | | | | 0.10 | | | | 0.02 | |
| | Net realized and unrealized gain (loss) | | | 0.40 | | | | 0.76 | | | | (0.20 | ) |
| | Total from investment operations | | | 0.55 | | | | 0.86 | | | | (0.18 | ) |
| | Distributions to shareholders from net investment income | | | (0.14 | ) | | | (0.06 | ) | | | — | |
| | Distributions to shareholders from net realized gains | | | (0.13 | ) | | | — | | | | — | |
| | Total distributions | | | (0.27 | ) | | | (0.06 | ) | | | — | |
| | Net asset value, end of period | | $ | 10.90 | | | $ | 10.62 | | | $ | 9.82 | |
| | Total return(c) | | | 5.22 | % | | | 8.83 | % | | | (1.80 | )% |
| | Net assets, end of period (in 000s) | | $ | 11 | | | $ | 11 | | | $ | 10 | |
| | Ratio of net expenses to average net assets(d) | | | 0.80 | % | | | 0.81 | %(e) | | | 0.84 | %(e) |
| | Ratio of total expenses to average net assets(d) | | | 2.65 | % | | | 4.40 | %(e) | | | 4.32 | %(e) |
| | Ratio of net investment income to average net assets | | | 1.40 | % | | | 1.20 | %(e) | | | 0.91 | %(e) |
| | Portfolio turnover rate(f) | | | 177 | % | | | 167 | % | | | 33 | % |
| | * | | The Portfolio changed its fiscal year end from October 31 to August 31. |
| | (a) | | Commenced operations on August 22, 2016. |
| | (b) | | Calculated based on the average shares outstanding methodology. |
| | (c) | | Assumes investment at the NAV at the beginning of the period, reinvestment of all dividends and distributions, a complete redemption of the investment at the NAV at the end of the period and no sales or redemption charges. Total returns would be reduced if a sales or redemption charge was taken into account. Returns do not reflect the impact of taxes to shareholders relating to Portfolio distributions or the redemption of Portfolio shares. Total returns for periods less than one full year are not annualized. |
| | (d) | | Expense ratios exclude the expenses of the Underlying Funds in which the Portfolio invests. |
| | (f) | | The Portfolio’s turnover rate is calculated in accordance with regulatory requirements, without regard to transactions involving short term investments. If such transactions were included, the Portfolio’s turnover rate may be higher. |
| | |
| The accompanying notes are an integral part of these financial statements. | | 73 |
GOLDMAN SACHS TARGET DATE 2025 PORTFOLIO
Financial Highlights (continued)
Selected Share Data for a Share Outstanding Throughout Each Period
| | | | | | | | | | | | | | |
| | | | | Goldman Sachs Target Date 2025 Portfolio | |
| | | | | Investor Shares(a) | |
| | | | | Year Ended
August 31, 2018 | | | Period
November 1, 2016 –
August 31, 2017* | | | Period Ended
October 31, 2016(b) | |
| | Per Share Data | | | | | | | | | | | | |
| | Net asset value, beginning of period | | $ | 10.64 | | | $ | 9.83 | | | $ | 10.00 | |
| | Net investment income(c) | | | 0.19 | | | | 0.12 | | | | 0.02 | |
| | Net realized and unrealized gain (loss) | | | 0.40 | | | | 0.76 | | | | (0.19 | ) |
| | Total from investment operations | | | 0.59 | | | | 0.88 | | | | (0.17 | ) |
| | Distributions to shareholders from net investment income | | | (0.19 | ) | | | (0.07 | ) | | | — | |
| | Distributions to shareholders from net realized gains | | | (0.13 | ) | | | — | | | | — | |
| | Total distributions | | | (0.32 | ) | | | (0.07 | ) | | | — | |
| | Net asset value, end of period | | $ | 10.91 | | | $ | 10.64 | | | $ | 9.83 | |
| | Total return(d) | | | 5.59 | % | | | 9.06 | % | | | (1.70 | )% |
| | Net assets, end of period (in 000s) | | $ | 373 | | | $ | 35 | | | $ | 10 | |
| | Ratio of net expenses to average net assets(e) | | | 0.44 | % | | | 0.46 | %(f) | | | 0.49 | %(f) |
| | Ratio of total expenses to average net assets(e) | | | 2.30 | % | | | 5.20 | %(f) | | | 3.97 | %(f) |
| | Ratio of net investment income to average net assets | | | 1.74 | % | | | 1.37 | %(f) | | | 1.27 | %(f) |
| | Portfolio turnover rate(g) | | | 177 | % | | | 167 | % | | | 33 | % |
| | * | | The Portfolio changed its fiscal year end from October 31 to August 31. |
| | (a) | | Effective October 10, 2017, Class IR Shares changed its name to Investor Shares. |
| | (b) | | Commenced operations on August 22, 2016. |
| | (c) | | Calculated based on the average shares outstanding methodology. |
| | (d) | | Assumes investment at the NAV at the beginning of the period, reinvestment of all dividends and distributions, a complete redemption of the investment at the NAV at the end of the period and no sales or redemption charges. Total returns would be reduced if a sales or redemption charge was taken into account. Returns do not reflect the impact of taxes to shareholders relating to Portfolio distributions or the redemption of Portfolio shares. Total returns for periods less than one full year are not annualized. |
| | (e) | | Expense ratios exclude the expenses of the Underlying Funds in which the Portfolio invests. |
| | (g) | | The Portfolio’s turnover rate is calculated in accordance with regulatory requirements, without regard to transactions involving short term investments. If such transactions were included, the Portfolio’s turnover rate may be higher. |
| | |
| 74 | | The accompanying notes are an integral part of these financial statements. |
GOLDMAN SACHS TARGET DATE 2025 PORTFOLIO
Financial Highlights (continued)
Selected Share Data for a Share Outstanding Throughout Each Period
| | | | | | | | | | | | | | |
| | | | | Goldman Sachs Target Date 2025 Portfolio | |
| | | | | Class R Shares | |
| | | | | Year Ended
August 31, 2018 | | | Period
November 1, 2016 –
August 31, 2017* | | | Period Ended
October 31, 2016(a) | |
| | Per Share Data | | | | | | | | | | | | |
| | Net asset value, beginning of period | | $ | 10.61 | | | $ | 9.82 | | | $ | 10.00 | |
| | Net investment income(b) | | | 0.14 | | | | 0.09 | | | | 0.01 | |
| | Net realized and unrealized gain (loss) | | | 0.38 | | | | 0.76 | | | | (0.19 | ) |
| | Total from investment operations | | | 0.52 | | | | 0.85 | | | | (0.18 | ) |
| | Distributions to shareholders from net investment income | | | (0.12 | ) | | | (0.06 | ) | | | — | |
| | Distributions to shareholders from net realized gains | | | (0.13 | ) | | | — | | | | — | |
| | Total distributions | | | (0.25 | ) | | | (0.06 | ) | | | — | |
| | Net asset value, end of period | | $ | 10.88 | | | $ | 10.61 | | | $ | 9.82 | |
| | Total return(c) | | | 4.98 | % | | | 8.67 | % | | | (1.80 | )% |
| | Net assets, end of period (in 000s) | | $ | 11 | | | $ | 11 | | | $ | 10 | |
| | Ratio of net expenses to average net assets(d) | | | 0.94 | % | | | 0.95 | %(e) | | | 0.99 | %(e) |
| | Ratio of total expenses to average net assets(d) | | | 2.80 | % | | | 4.54 | %(e) | | | 4.47 | %(e) |
| | Ratio of net investment income to average net assets | | | 1.26 | % | | | 1.06 | %(e) | | | 0.77 | %(e) |
| | Portfolio turnover rate(f) | | | 177 | % | | | 167 | % | | | 33 | % |
| | * | | The Portfolio changed its fiscal year end from October 31 to August 31. |
| | (a) | | Commenced operations on August 22, 2016. |
| | (b) | | Calculated based on the average shares outstanding methodology. |
| | (c) | | Assumes investment at the NAV at the beginning of the period, reinvestment of all dividends and distributions, a complete redemption of the investment at the NAV at the end of the period and no sales or redemption charges. Total returns would be reduced if a sales or redemption charge was taken into account. Returns do not reflect the impact of taxes to shareholders relating to Portfolio distributions or the redemption of Portfolio shares. Total returns for periods less than one full year are not annualized. |
| | (d) | | Expense ratios exclude the expenses of the Underlying Funds in which the Portfolio invests. |
| | (f) | | The Portfolio’s turnover rate is calculated in accordance with regulatory requirements, without regard to transactions involving short term investments. If such transactions were included, the Portfolio’s turnover rate may be higher. |
| | |
| The accompanying notes are an integral part of these financial statements. | | 75 |
GOLDMAN SACHS TARGET DATE 2025 PORTFOLIO
Financial Highlights (continued)
Selected Share Data for a Share Outstanding Throughout Each Period
| | | | | | | | | | | | | | |
| | | | | Goldman Sachs Target Date 2025 Portfolio | |
| | | | | Class R6 Shares | |
| | | | | Year Ended
August 31, 2018 | | | Period
November 1, 2016 –
August 31, 2017* | | | Period Ended
October 31, 2016(a) | |
| | Per Share Data | | | | | | | | | | | | |
| | Net asset value, beginning of period | | $ | 10.65 | | | $ | 9.83 | | | $ | 10.00 | |
| | Net investment income(b) | | | 0.20 | | | | 0.14 | | | | 0.03 | |
| | Net realized and unrealized gain (loss) | | | 0.40 | | | | 0.76 | | | | (0.20 | ) |
| | Total from investment operations | | | 0.60 | | | | 0.90 | | | | (0.17 | ) |
| | Distributions to shareholders from net investment income | | | (0.19 | ) | | | (0.08 | ) | | | — | |
| | Distributions to shareholders from net realized gains | | | (0.13 | ) | | | — | | | | — | |
| | Total distributions | | | (0.32 | ) | | | (0.08 | ) | | | — | |
| | Net asset value, end of period | | $ | 10.93 | | | $ | 10.65 | | | $ | 9.83 | |
| | Total return(c) | | | 5.73 | % | | | 9.22 | % | | | (1.70 | )% |
| | Net assets, end of period (in 000s) | | $ | 213 | | | $ | 11 | | | $ | 10 | |
| | Ratio of net expenses to average net assets(d) | | | 0.28 | % | | | 0.31 | %(e) | | | 0.33 | %(e) |
| | Ratio of total expenses to average net assets(d) | | | 2.14 | % | | | 3.95 | %(e) | | | 3.92 | %(e) |
| | Ratio of net investment income to average net assets | | | 1.85 | % | | | 1.69 | %(e) | | | 1.43 | %(e) |
| | Portfolio turnover rate(f) | | | 177 | % | | | 167 | % | | | 33 | % |
| | * | | The Portfolio changed its fiscal year end from October 31 to August 31. |
| | (a) | | Commenced operations on August 22, 2016. |
| | (b) | | Calculated based on the average shares outstanding methodology. |
| | (c) | | Assumes investment at the NAV at the beginning of the period, reinvestment of all dividends and distributions, a complete redemption of the investment at the NAV at the end of the period and no sales or redemption charges. Total returns would be reduced if a sales or redemption charge was taken into account. Returns do not reflect the impact of taxes to shareholders relating to Portfolio’s distributions or the redemption of Portfolio shares. Total returns for periods less than one full year are not annualized. |
| | (d) | | Expense ratios exclude the expenses of the Underlying Funds in which the Portfolio invests. |
| | (f) | | The Portfolio’s turnover rate is calculated in accordance with regulatory requirements, without regard to transactions involving short term investments. If such transactions were included, the Portfolio’s turnover rate may be higher. |
| | |
| 76 | | The accompanying notes are an integral part of these financial statements. |
GOLDMAN SACHS TARGET DATE 2030 PORTFOLIO
Financial Highlights (continued)
Selected Share Data for a Share Outstanding Throughout Each Period
| | | | | | | | | | | | | | |
| | | | | Goldman Sachs Target Date 2030 Portfolio | |
| | | | | Class A Shares | |
| | | | | Year Ended
August 31, 2018 | | | Period
November 1, 2016 –
August 31, 2017* | | | Period Ended
October 31, 2016 | |
| | Per Share Data | | | | | | | | | | | | |
| | Net asset value, beginning of period | | $ | 10.22 | | | $ | 9.74 | | | $ | 9.93 | |
| | Net investment income(a) | | | 0.13 | | | | 0.08 | | | | 0.02 | |
| | Net realized and unrealized gain (loss) | | | 0.54 | | | | 0.90 | | | | (0.21 | ) |
| | Total from investment operations | | | 0.67 | | | | 0.98 | | | | (0.19 | ) |
| | Distributions to shareholders from net investment income | | | (0.14 | ) | | | (0.18 | ) | | | — | |
| | Distributions to shareholders from net realized gains | | | (1.07 | ) | | | (0.32 | ) | | | — | |
| | Total distributions | | | (1.21 | ) | | | (0.50 | ) | | | — | |
| | Net asset value, end of period | | $ | 9.68 | | | $ | 10.22 | | | $ | 9.74 | |
| | Total return(b) | | | 6.93 | % | | | 10.47 | % | | | (1.91 | )% |
| | Net assets, end of period (in 000s) | | $ | 362 | | | $ | 205 | | | $ | 10 | |
| | Ratio of net expenses to average net assets(c) | | | 0.70 | % | | | 0.72 | %(d) | | | 0.74 | %(d) |
| | Ratio of total expenses to average net assets(c) | | | 0.86 | % | | | 0.99 | %(d) | | | 2.33 | %(d) |
| | Ratio of net investment income to average net assets | | | 1.34 | % | | | 0.99 | %(d) | | | 1.01 | %(d) |
| | Portfolio turnover rate(e) | | | 156 | % | | | 143 | % | | | 176 | % |
| | * | | The Portfolio changed its fiscal year end from October 31 to August 31. |
| | (a) | | Calculated based on the average shares outstanding methodology. |
| | (b) | | Assumes investment at the net asset value at the beginning of the period, reinvestment of all dividends and distributions, a complete redemption of the investment at the net asset value at the end of the period and no sales or redemption charges. Total returns would be reduced if a sales or redemption charge was taken into account. Returns do not reflect the impact of taxes to shareholders relating to Portfolio distributions or the redemption of Portfolio shares. Total returns for periods less than one full year are not annualized. The Goldman Sachs Target Date 2030 Portfolio’s predecessor was the Madison Target Retirement 2030 Fund (the “Predecessor Fund”). On August 22, 2016, the Predecessor Fund was reorganized as a new series of Goldman Sachs Trust II. Performance prior to August 22, 2016 is that of the Predecessor Fund. Total return information of the Predecessor Fund is included in the above table because the Predecessor Fund is considered the accounting survivor of the reorganization. |
| | (c) | | Expense ratios exclude the expenses of the Underlying Funds in which the Portfolio invests. |
| | (e) | | The Portfolio’s turnover rate is calculated in accordance with regulatory requirements, without regard to transactions involving short term investments. If such transactions were included, the Portfolio’s turnover rate may be higher. |
| | |
| The accompanying notes are an integral part of these financial statements. | | 77 |
GOLDMAN SACHS TARGET DATE 2030 PORTFOLIO
Financial Highlights (continued)
Selected Share Data for a Share Outstanding Throughout Each Period
| | | | | | | | | | | | | | |
| | | | | Goldman Sachs Target Date 2030 Portfolio | |
| | | | | Institutional Shares | |
| | | | | Year Ended
August 31, 2018 | | | Period
November 1, 2016 –
August 31, 2017* | | | Period Ended
October 31, 2016 | |
| | Per Share Data | | | | | | | | | | | | |
| | Net asset value, beginning of period | | $ | 10.26 | | | $ | 9.75 | | | $ | 9.93 | |
| | Net investment income(a) | | | 0.18 | | | | 0.14 | | | | 0.03 | |
| | Net realized and unrealized gain (loss) | | | 0.52 | | | | 0.88 | | | | (0.21 | ) |
| | Total from investment operations | | | 0.70 | | | | 1.02 | | | | (0.18 | ) |
| | Distributions to shareholders from net investment income | | | (0.17 | ) | | | (0.19 | ) | | | — | |
| | Distributions to shareholders from net realized gains | | | (1.07 | ) | | | (0.32 | ) | | | — | |
| | Total distributions | | | (1.24 | ) | | | (0.51 | ) | | | — | |
| | Net asset value, end of period | | $ | 9.72 | | | $ | 10.26 | | | $ | 9.75 | |
| | Total return(b) | | | 7.29 | % | | | 10.87 | % | | | (1.81 | )% |
| | Net assets, end of period (in 000s) | | $ | 12 | | | $ | 11 | | | $ | 10 | |
| | Ratio of net expenses to average net assets(c) | | | 0.31 | % | | | 0.31 | %(d) | | | 0.34 | %(d) |
| | Ratio of total expenses to average net assets(c) | | | 0.49 | % | | | 0.75 | %(d) | | | 1.93 | %(d) |
| | Ratio of net investment income to average net assets | | | 1.84 | % | | | 1.69 | %(d) | | | 1.41 | %(d) |
| | Portfolio turnover rate(e) | | | 156 | % | | | 143 | % | | | 176 | % |
| | * | | The Portfolio changed its fiscal year end from October 31 to August 31. |
| | (a) | | Calculated based on the average shares outstanding methodology. |
| | (b) | | Assumes investment at the net asset value at the beginning of the period, reinvestment of all dividends and distributions, a complete redemption of the investment at the net asset value at the end of the period and no sales or redemption charges. Total returns would be reduced if a sales or redemption charge was taken into account. Returns do not reflect the impact of taxes to shareholders relating to Portfolio distributions or the redemption of Portfolio shares. Total returns for periods less than one full year are not annualized. The Goldman Sachs Target Date 2030 Portfolio’s predecessor was the Madison Target Retirement 2030 Fund (the “Predecessor Fund”). On August 22, 2016, the Predecessor Fund was reorganized as a new series of Goldman Sachs Trust II. Performance prior to August 22, 2016 is that of the Predecessor Fund. Total return information of the Predecessor Fund is included in the above table because the Predecessor Fund is considered the accounting survivor of the reorganization. |
| | (c) | | Expense ratios exclude the expenses of the Underlying Funds in which the Portfolio invests. |
| | (e) | | The Portfolio’s turnover rate is calculated in accordance with regulatory requirements, without regard to transactions involving short term investments. If such transactions were included, the Portfolio’s turnover rate may be higher. |
| | |
| 78 | | The accompanying notes are an integral part of these financial statements. |
GOLDMAN SACHS TARGET DATE 2030 PORTFOLIO
Financial Highlights (continued)
Selected Share Data for a Share Outstanding Throughout Each Period
| | | | | | | | | | | | | | |
| | | | | Goldman Sachs Target Date 2030 Portfolio | |
| | | | | Service Shares | |
| | | | | Year Ended
August 31, 2018 | | | Period
November 1, 2016 –
August 31, 2017* | | | Period Ended
October 31, 2016 | |
| | Per Share Data | | | | | | | | | | | | |
| | Net asset value, beginning of period | | $ | 10.23 | | | $ | 9.74 | | | $ | 9.93 | |
| | Net investment income(a) | | | 0.13 | | | | 0.10 | | | | 0.02 | |
| | Net realized and unrealized gain (loss) | | | 0.52 | | | | 0.88 | | | | (0.21 | ) |
| | Total from investment operations | | | 0.65 | | | | 0.98 | | | | (0.19 | ) |
| | Distributions to shareholders from net investment income | | | (0.13 | ) | | | (0.17 | ) | | | — | |
| | Distributions to shareholders from net realized gains | | | (1.07 | ) | | | (0.32 | ) | | | — | |
| | Total distributions | | | (1.20 | ) | | | (0.49 | ) | | | — | |
| | Net asset value, end of period | | $ | 9.68 | | | $ | 10.23 | | | $ | 9.74 | |
| | Total return(b) | | | 6.71 | % | | | 10.47 | % | | | (1.91 | )% |
| | Net assets, end of period (in 000s) | | $ | 12 | | | $ | 11 | | | $ | 10 | |
| | Ratio of net expenses to average net assets(c) | | | 0.81 | % | | | 0.82 | %(d) | | | 0.83 | %(d) |
| | Ratio of total expenses to average net assets(c) | | | 0.99 | % | | | 1.26 | %(d) | | | 2.43 | %(d) |
| | Ratio of net investment income to average net assets | | | 1.34 | % | | | 1.19 | %(d) | | | 0.92 | %(d) |
| | Portfolio turnover rate(e) | | | 156 | % | | | 143 | % | | | 176 | % |
| | * | | The Portfolio changed its fiscal year end from October 31 to August 31. |
| | (a) | | Calculated based on the average shares outstanding methodology. |
| | (b) | | Assumes investment at the net asset value at the beginning of the period, reinvestment of all dividends and distributions, a complete redemption of the investment at the net asset value at the end of the period and no sales or redemption charges. Total returns would be reduced if a sales or redemption charge was taken into account. Returns do not reflect the impact of taxes to shareholders relating to Portfolio distributions or the redemption of Portfolio shares. Total returns for periods less than one full year are not annualized. The Goldman Sachs Target Date 2030 Portfolio’s predecessor was the Madison Target Retirement 2030 Fund (the “Predecessor Fund”). On August 22, 2016, the Predecessor Fund was reorganized as a new series of Goldman Sachs Trust II. Performance prior to August 22, 2016 is that of the Predecessor Fund. Total return information of the Predecessor Fund is included in the above table because the Predecessor Fund is considered the accounting survivor of the reorganization. |
| | (c) | | Expense ratios exclude the expenses of the Underlying Funds in which the Portfolio invests. |
| | (e) | | The Portfolio’s turnover rate is calculated in accordance with regulatory requirements, without regard to transactions involving short term investments. If such transactions were included, the Portfolio’s turnover rate may be higher. |
| | |
| The accompanying notes are an integral part of these financial statements. | | 79 |
GOLDMAN SACHS TARGET DATE 2030 PORTFOLIO
Financial Highlights (continued)
Selected Share Data for a Share Outstanding Throughout Each Period
| | | | | | | | | | | | | | |
| | | | | Goldman Sachs Target Date 2030 Portfolio | |
| | | | | Investor Shares(a) | |
| | | | | Year Ended
August 31, 2018 | | | Period
November 1, 2016 –
August 31, 2017* | | | Period Ended
October 31, 2016 | |
| | Per Share Data | | | | | | | | | | | | |
| | Net asset value, beginning of period | | $ | 10.25 | | | $ | 9.75 | | | $ | 9.93 | |
| | Net investment income(b) | | | 0.16 | | | | 0.11 | | | | 0.02 | |
| | Net realized and unrealized gain (loss) | | | 0.52 | | | | 0.90 | | | | (0.20 | ) |
| | Total from investment operations | | | 0.68 | | | | 1.01 | | | | (0.18 | ) |
| | Distributions to shareholders from net investment income | | | (0.17 | ) | | | (0.19 | ) | | | — | |
| | Distributions to shareholders from net realized gains | | | (1.07 | ) | | | (0.32 | ) | | | — | |
| | Total distributions | | | (1.24 | ) | | | (0.51 | ) | | | — | |
| | Net asset value, end of period | | $ | 9.69 | | | $ | 10.25 | | | $ | 9.75 | |
| | Total return(c) | | | 7.06 | % | | | 10.71 | % | | | (1.81 | )% |
| | Net assets, end of period (in 000s) | | $ | 1,330 | | | $ | 625 | | | $ | 10 | |
| | Ratio of net expenses to average net assets(d) | | | 0.45 | % | | | 0.46 | %(e) | | | 0.48 | %(e) |
| | Ratio of total expenses to average net assets(d) | | | 0.64 | % | | | 0.82 | %(e) | | | 2.08 | %(e) |
| | Ratio of net investment income to average net assets | | | 1.69 | % | | | 1.30 | %(e) | | | 1.27 | %(e) |
| | Portfolio turnover rate(f) | | | 156 | % | | | 143 | % | | | 176 | % |
| | * | | The Portfolio changed its fiscal year end from October 31 to August 31. |
| | (a) | | Effective October 10, 2017, Class IR Shares changed its name to Investor Shares. |
| | (b) | | Calculated based on the average shares outstanding methodology. |
| | (c) | | Assumes investment at the net asset value at the beginning of the period, reinvestment of all dividends and distributions, a complete redemption of the investment at the net asset value at the end of the period and no sales or redemption charges. Total returns would be reduced if a sales or redemption charge was taken into account. Returns do not reflect the impact of taxes to shareholders relating to Portfolio distributions or the redemption of Portfolio shares. Total returns for periods less than one full year are not annualized. The Goldman Sachs Target Date 2030 Portfolio’s predecessor was the Madison Target Retirement 2030 Fund (the “Predecessor Fund”). On August 22, 2016, the Predecessor Fund was reorganized as a new series of Goldman Sachs Trust II. Performance prior to August 22, 2016 is that of the Predecessor Fund. Total return information of the Predecessor Fund is included in the above table because the Predecessor Fund is considered the accounting survivor of the reorganization. |
| | (d) | | Expense ratios exclude the expenses of the Underlying Funds in which the Portfolio invests. |
| | (f) | | The Portfolio’s turnover rate is calculated in accordance with regulatory requirements, without regard to transactions involving short term investments. If such transactions were included, the Portfolio’s turnover rate may be higher. |
| | |
| 80 | | The accompanying notes are an integral part of these financial statements. |
GOLDMAN SACHS TARGET DATE 2030 PORTFOLIO
Financial Highlights (continued)
Selected Share Data for a Share Outstanding Throughout Each Period
| | | | | | | | | | | | | | |
| | | | | Goldman Sachs Target Date 2030 Portfolio | |
| | | | | Class R Shares | |
| | | | | Year Ended
August 31, 2018 | | | Period
November 1, 2016 –
August 31, 2017* | | | Period Ended
October 31, 2016 | |
| | Per Share Data | | | | | | | | | | | | |
| | Net asset value, beginning of period | | $ | 10.22 | | | $ | 9.74 | | | $ | 9.93 | |
| | Net investment income(a) | | | 0.12 | | | | 0.09 | | | | 0.02 | |
| | Net realized and unrealized gain (loss) | | | 0.51 | | | | 0.88 | | | | (0.21 | ) |
| | Total from investment operations | | | 0.63 | | | | 0.97 | | | | (0.19 | ) |
| | Distributions to shareholders from net investment income | | | (0.12 | ) | | | (0.17 | ) | | | — | |
| | Distributions to shareholders from net realized gains | | | (1.07 | ) | | | (0.32 | ) | | | — | |
| | Total distributions | | | (1.19 | ) | | | (0.49 | ) | | | — | |
| | Net asset value, end of period | | $ | 9.66 | | | $ | 10.22 | | | $ | 9.74 | |
| | Total return(b) | | | 6.59 | % | | | 10.30 | % | | | (1.91 | )% |
| | Net assets, end of period (in 000s) | | $ | 30 | | | $ | 23 | | | $ | 10 | |
| | Ratio of net expenses to average net assets(c) | | | 0.95 | % | | | 0.97 | %(d) | | | 0.98 | %(d) |
| | Ratio of total expenses to average net assets(c) | | | 1.14 | % | | | 1.28 | %(d) | | | 2.57 | %(d) |
| | Ratio of net investment income to average net assets | | | 1.19 | % | | | 1.04 | %(d) | | | 0.77 | %(d) |
| | Portfolio turnover rate(e) | | | 156 | % | | | 143 | % | | | 176 | % |
| | * | | The Portfolio changed its fiscal year end from October 31 to August 31. |
| | (a) | | Calculated based on the average shares outstanding methodology. |
| | (b) | | Assumes investment at the net asset value at the beginning of the period, reinvestment of all dividends and distributions, a complete redemption of the investment at the net asset value at the end of the period and no sales or redemption charges. Total returns would be reduced if a sales or redemption charge was taken into account. Returns do not reflect the impact of taxes to shareholders relating to Portfolio distributions or the redemption of Portfolio shares. Total returns for periods less than one full year are not annualized. The Goldman Sachs Target Date 2030 Portfolio’s predecessor was the Madison Target Retirement 2030 Fund (the “Predecessor Fund”). On August 22, 2016, the Predecessor Fund was reorganized as a new series of Goldman Sachs Trust II. Performance prior to August 22, 2016 is that of the Predecessor Fund. Total return information of the Predecessor Fund is included in the above table because the Predecessor Fund is considered the accounting survivor of the reorganization. |
| | (c) | | Expense ratios exclude the expenses of the Underlying Funds in which the Portfolio invests. |
| | (e) | | The Portfolio’s turnover rate is calculated in accordance with regulatory requirements, without regard to transactions involving short term investments. If such transactions were included, the Portfolio’s turnover rate may be higher. |
| | |
| The accompanying notes are an integral part of these financial statements. | | 81 |
GOLDMAN SACHS TARGET DATE 2030 PORTFOLIO
Financial Highlights (continued)
Selected Share Data for a Share Outstanding Throughout Each Period
| | | | | | | | | | | | | | | | | | | | | | |
| | | | | Goldman Sachs Target Date 2030 Portfolio | |
| | | | | Class R6 Shares | |
| | | | | Year Ended
August 31, 2018 | | | Period
November 1, 2016 –
August 31, 2017* | | | Year Ended October 31, | | | Period Ended
October 31, 2014 | |
| | | | | 2016 | | | 2015 | |
| | Per Share Data | | | | | | | | | | | | | | | | | | | | |
| | Net asset value, beginning of period | | $ | 10.26 | | | $ | 9.75 | | | $ | 9.97 | | | $ | 9.99 | | | $ | 10.00 | |
| | Net investment income(a) | | | 0.18 | | | | 0.14 | | | | 0.19 | | | | 0.15 | | | | 0.03 | |
| | Net realized and unrealized gain (loss) | | | 0.52 | | | | 0.88 | | | | 0.11 | | | | 0.12 | | | | (0.04 | ) |
| | Total from investment operations | | | 0.70 | | | | 1.02 | | | | 0.30 | | | | 0.27 | | | | (0.01 | ) |
| | Distributions to shareholders from net investment income | | | (0.17 | ) | | | (0.19 | ) | | | (0.17 | ) | | | (0.09 | ) | | | — | |
| | Distributions to shareholders from net realized gains | | | (1.07 | ) | | | (0.32 | ) | | | (0.35 | ) | | | (0.20 | ) | | | — | |
| | Total distributions | | | (1.24 | ) | | | (0.51 | ) | | | (0.52 | ) | | | (0.29 | ) | | | — | |
| | Net asset value, end of period | | $ | 9.72 | | | $ | 10.26 | | | $ | 9.75 | | | $ | 9.97 | | | $ | 9.99 | |
| | Total return(b) | | | 7.30 | % | | | 10.88 | % | | | 3.23 | % | | | 2.76 | % | | | (0.10 | )% |
| | Net assets, end of period (in 000s) | | $ | 74,952 | | | $ | 75,061 | | | $ | 74,224 | | | $ | 79,007 | | | $ | 82,852 | |
| | Ratio of net expenses to average net assets(c) | | | 0.29 | % | | | 0.30 | %(d) | | | 0.31 | % | | | 0.30 | % | | | 0.32 | %(d) |
| | Ratio of total expenses to average net assets(c) | | | 0.50 | % | | | 0.76 | %(d) | | | 0.62 | % | | | 0.30 | % | | | 0.32 | %(d) |
| | Ratio of net investment income to average net assets | | | 1.86 | % | | | 1.72 | %(d) | | | 1.91 | % | | | 1.49 | % | | | 1.87 | %(d) |
| | Portfolio turnover rate(e) | | | 156 | % | | | 143 | % | | | 176 | % | | | 156 | % | | | 44 | % |
| | * | | The Portfolio changed its fiscal year end from October 31 to August 31. |
| | (a) | | Calculated based on the average shares outstanding methodology. |
| | (b) | | Assumes investment at the net asset value at the beginning of the period, reinvestment of all dividends and distributions, a complete redemption of the investment at the net asset value at the end of the period and no sales or redemption charges. Total returns would be reduced if a sales or redemption charge was taken into account. Returns do not reflect the impact of taxes to shareholders relating to Portfolio distributions or the redemption of Portfolio shares. Total returns for periods less than one full year are not annualized. The Goldman Sachs Target Date 2030 Portfolio’s predecessor was the Madison Target Retirement 2030 Fund (the “Predecessor Fund”). On August 22, 2016, the Predecessor Fund was reorganized as a new series of Goldman Sachs Trust II. Performance prior to August 22, 2016 is that of the Predecessor Fund. Total return information of the Predecessor Fund is included in the above table because the Predecessor Fund is considered the accounting survivor of the reorganization. |
| | (c) | | Expense ratios exclude the expenses of the Underlying Funds in which the Portfolio invests. |
| | (e) | | The Portfolio’s turnover rate is calculated in accordance with regulatory requirements, without regard to transactions involving short term investments. If such transactions were included, the Portfolio’s turnover rate may be higher. |
| | |
| 82 | | The accompanying notes are an integral part of these financial statements. |
GOLDMAN SACHS TARGET DATE 2035 PORTFOLIO
Financial Highlights (continued)
Selected Share Data for a Share Outstanding Throughout Each Period
| | | | | | | | | | | | | | |
| | | | | Goldman Sachs Target Date 2035 Portfolio
| |
| | | | | Class A Shares | |
| | | | | Year Ended
August 31, 2018 | | | Period
November 1, 2016 –
August 31, 2017* | | | Period Ended
October 31, 2016(a) | |
| | Per Share Data | | | | | | | | | | | | |
| | Net asset value, beginning of period | | $ | 10.85 | | | $ | 9.81 | | | $ | 10.00 | |
| | Net investment income(b) | | | 0.17 | | | | 0.10 | | | | 0.02 | |
| | Net realized and unrealized gain (loss) | | | 0.63 | | | | 1.01 | | | | (0.21 | ) |
| | Total from investment operations | | | 0.80 | | | | 1.11 | | | | (0.19 | ) |
| | Distributions to shareholders from net investment income | | | (0.14 | ) | | | (0.07 | ) | | | — | |
| | Distributions to shareholders from net realized gains | | | (0.17 | ) | | | — | | | | — | |
| | Total distributions | | | (0.31 | ) | | | (0.07 | ) | | | — | |
| | Net asset value, end of period | | $ | 11.34 | | | $ | 10.85 | | | $ | 9.81 | |
| | Total return(c) | | | 7.54 | % | | �� | 11.39 | % | | | (1.90 | )% |
| | Net assets, end of period (in 000s) | | $ | 107 | | | $ | 29 | | | $ | 10 | |
| | Ratio of net expenses to average net assets(d) | | | 0.69 | % | | | 0.71 | %(e) | | | 0.75 | %(e) |
| | Ratio of total expenses to average net assets(d) | | | 2.31 | % | | | 4.28 | %(e) | | | 4.23 | %(e) |
| | Ratio of net investment income to average net assets | | | 1.57 | % | | | 1.11 | %(e) | | | 1.03 | %(e) |
| | Portfolio turnover rate(f) | | | 139 | % | | | 137 | % | | | 29 | % |
| | * | | The Portfolio changed its fiscal year end from October 31 to August 31. |
| | (a) | | Commenced operations on August 22, 2016. |
| | (b) | | Calculated based on the average shares outstanding methodology. |
| | (c) | | Assumes investment at the NAV at the beginning of the period, reinvestment of all dividends and distributions, a complete redemption of the investment at the NAV at the end of the period and no sales or redemption charges. Total returns would be reduced if a sales or redemption charge was taken into account. Returns do not reflect the impact of taxes to shareholders relating to Portfolio distributions or the redemption of Portfolio shares. Total returns for periods less than one full year are not annualized. |
| | (d) | | Expense ratios exclude the expenses of the Underlying Funds in which the Portfolio invests. |
| | (f) | | The Portfolio’s turnover rate is calculated in accordance with regulatory requirements, without regard to transactions involving short term investments. If such transactions were included, the Portfolio’s turnover rate may be higher. |
| | |
| The accompanying notes are an integral part of these financial statements. | | 83 |
GOLDMAN SACHS TARGET DATE 2035 PORTFOLIO
Financial Highlights (continued)
Selected Share Data for a Share Outstanding Throughout Each Period
| | | | | | | | | | | | | | |
| | | | | Goldman Sachs Target Date 2035 Portfolio
| |
| | | | | Institutional Shares | |
| | | | | Year Ended
August 31, 2018 | | | Period
November 1, 2016 –
August 31, 2017* | | | Period Ended
October 31, 2016(a) | |
| | Per Share Data | | | | | | | | | | | | |
| | Net asset value, beginning of period | | $ | 10.87 | | | $ | 9.81 | | | $ | 10.00 | |
| | Net investment income(b) | | | 0.21 | | | | 0.15 | | | | 0.03 | |
| | Net realized and unrealized gain (loss) | | | 0.65 | | | | 1.00 | | | | (0.22 | ) |
| | Total from investment operations | | | 0.86 | | | | 1.15 | | | | (0.19 | ) |
| | Distributions to shareholders from net investment income | | | (0.19 | ) | | | (0.09 | ) | | | — | |
| | Distributions to shareholders from net realized gains | | | (0.17 | ) | | | — | | | | — | |
| | Total distributions | | | (0.36 | ) | | | (0.09 | ) | | | — | |
| | Net asset value, end of period | | $ | 11.37 | | | $ | 10.87 | | | $ | 9.81 | |
| | Total return(c) | | | 8.02 | % | | | 11.75 | % | | | (1.90 | )% |
| | Net assets, end of period (in 000s) | | $ | 11,139 | | | $ | 10,911 | | | $ | 9,765 | |
| | Ratio of net expenses to average net assets(d) | | | 0.30 | % | | | 0.32 | %(e) | | | 0.34 | %(e) |
| | Ratio of total expenses to average net assets(d) | | | 2.05 | % | | | 3.86 | %(e) | | | 3.85 | %(e) |
| | Ratio of net investment income to average net assets | | | 1.85 | % | | | 1.69 | %(e) | | | 1.44 | %(e) |
| | Portfolio turnover rate(f) | | | 139 | % | | | 137 | % | | | 29 | % |
| | * | | The Portfolio changed its fiscal year end from October 31 to August 31. |
| | (a) | | Commenced operations on August 22, 2016. |
| | (b) | | Calculated based on the average shares outstanding methodology. |
| | (c) | | Assumes investment at the NAV at the beginning of the period, reinvestment of all dividends and distributions, a complete redemption of the investment at the NAV at the end of the period and no sales or redemption charges. Total returns would be reduced if a sales or redemption charge was taken into account. Returns do not reflect the impact of taxes to shareholders relating to Portfolio distributions or the redemption of Portfolio shares. Total returns for periods less than one full year are not annualized. |
| | (d) | | Expense ratios exclude the expenses of the Underlying Funds in which the Portfolio invests. |
| | (f) | | The Portfolio’s turnover rate is calculated in accordance with regulatory requirements, without regard to transactions involving short term investments. If such transactions were included, the Portfolio’s turnover rate may be higher. |
| | |
| 84 | | The accompanying notes are an integral part of these financial statements. |
GOLDMAN SACHS TARGET DATE 2035 PORTFOLIO
Financial Highlights (continued)
Selected Share Data for a Share Outstanding Throughout Each Period
| | | | | | | | | | | | | | |
| | | | | Goldman Sachs Target Date 2035 Portfolio | |
| | | | | Service Shares | |
| | | | | Year Ended
August 31, 2018 | | | Period
November 1, 2016 –
August 31, 2017* | | | Period Ended
October 31, 2016(a) | |
| | Per Share Data | | | | | | | | | | | | |
| | Net asset value, beginning of period | | $ | 10.84 | | | $ | 9.80 | | | $ | 10.00 | |
| | Net investment income(b) | | | 0.15 | | | | 0.10 | | | | 0.02 | |
| | Net realized and unrealized gain (loss) | | | 0.64 | | | | 1.01 | | | | (0.22 | ) |
| | Total from investment operations | | | 0.79 | | | | 1.11 | | | | (0.20 | ) |
| | Distributions to shareholders from net investment income | | | (0.13 | ) | | | (0.07 | ) | | | — | |
| | Distributions to shareholders from net realized gains | | | (0.17 | ) | | | — | | | | — | |
| | Total distributions | | | (0.30 | ) | | | (0.07 | ) | | | — | |
| | Net asset value, end of period | | $ | 11.33 | | | $ | 10.84 | | | $ | 9.80 | |
| | Total return(c) | | | 7.44 | % | | | 11.36 | % | | | (2.00 | )% |
| | Net assets, end of period (in 000s) | | $ | 12 | | | $ | 11 | | | $ | 10 | |
| | Ratio of net expenses to average net assets(d) | | | 0.80 | % | | | 0.81 | %(e) | | | 0.84 | %(e) |
| | Ratio of total expenses to average net assets(d) | | | 2.53 | % | | | 4.34 | %(e) | | | 4.33 | %(e) |
| | Ratio of net investment income to average net assets | | | 1.35 | % | | | 1.20 | %(e) | | | 0.94 | %(e) |
| | Portfolio turnover rate(f) | | | 139 | % | | | 137 | % | | | 29 | % |
| | * | | The Portfolio changed its fiscal year end from October 31 to August 31. |
| | (a) | | Commenced operations on August 22, 2016. |
| | (b) | | Calculated based on the average shares outstanding methodology. |
| | (c) | | Assumes investment at the NAV at the beginning of the period, reinvestment of all dividends and distributions, a complete redemption of the investment at the NAV at the end of the period and no sales or redemption charges. Total returns would be reduced if a sales or redemption charge was taken into account. Returns do not reflect the impact of taxes to shareholders relating to Portfolio distributions or the redemption of Portfolio shares. Total returns for periods less than one full year are not annualized. |
| | (d) | | Expense ratios exclude the expenses of the Underlying Funds in which the Portfolio invests. |
| | (f) | | The Portfolio’s turnover rate is calculated in accordance with regulatory requirements, without regard to transactions involving short term investments. If such transactions were included, the Portfolio’s turnover rate may be higher. |
| | |
| The accompanying notes are an integral part of these financial statements. | | 85 |
GOLDMAN SACHS TARGET DATE 2035 PORTFOLIO
Financial Highlights (continued)
Selected Share Data for a Share Outstanding Throughout Each Period
| | | | | | | | | | | | | | |
| | | | | Goldman Sachs Target Date 2035 Portfolio
| |
| | | | | Investor Shares(a) | |
| | | | | Year Ended
August 31, 2018 | | | Period
November 1, 2016 –
August 31, 2017* | | | Period Ended
October 31, 2016(b) | |
| | Per Share Data | | | | | | | | | | | | |
| | Net asset value, beginning of period | | $ | 10.86 | | | $ | 9.81 | | | $ | 10.00 | |
| | Net investment income(c) | | | 0.19 | | | | 0.08 | | | | 0.02 | |
| | Net realized and unrealized gain (loss) | | | 0.64 | | | | 1.05 | | | | (0.21 | ) |
| | Total from investment operations | | | 0.83 | | | | 1.13 | | | | (0.19 | ) |
| | Distributions to shareholders from net investment income | | | (0.18 | ) | | | (0.08 | ) | | | — | |
| | Distributions to shareholders from net realized gains | | | (0.17 | ) | | | — | | | | — | |
| | Total distributions | | | (0.35 | ) | | | (0.08 | ) | | | — | |
| | Net asset value, end of period | | $ | 11.34 | | | $ | 10.86 | | | $ | 9.81 | |
| | Total return(d) | | | 7.82 | % | | | 11.59 | % | | | (1.90 | )% |
| | Net assets, end of period (in 000s) | | $ | 890 | | | $ | 152 | | | $ | 10 | |
| | Ratio of net expenses to average net assets(e) | | | 0.44 | % | | | 0.45 | %(f) | | | 0.49 | %(f) |
| | Ratio of total expenses to average net assets(e) | | | 2.18 | % | | | 7.23 | %(f) | | | 3.97 | %(f) |
| | Ratio of net investment income to average net assets | | | 1.71 | % | | | 0.89 | %(f) | | | 1.29 | %(f) |
| | Portfolio turnover rate(g) | | | 139 | % | | | 137 | % | | | 29 | % |
| | * | | The Portfolio changed its fiscal year end from October 31 to August 31. |
| | (a) | | Effective October 10, 2017, Class IR Shares changed its name to Investor Shares. |
| | (b) | | Commenced operations on August 22, 2016. |
| | (c) | | Calculated based on the average shares outstanding methodology. |
| | (d) | | Assumes investment at the NAV at the beginning of the period, reinvestment of all dividends and distributions, a complete redemption of the investment at the NAV at the end of the period and no sales or redemption charges. Total returns would be reduced if a sales or redemption charge was taken into account. Returns do not reflect the impact of taxes to shareholders relating to Portfolio distributions or the redemption of Portfolio shares. Total returns for periods less than one full year are not annualized. |
| | (e) | | Expense ratios exclude the expenses of the Underlying Funds in which the Portfolio invests. |
| | (g) | | The Portfolio’s turnover rate is calculated in accordance with regulatory requirements, without regard to transactions involving short term investments. If such transactions were included, the Portfolio’s turnover rate may be higher. |
| | |
| 86 | | The accompanying notes are an integral part of these financial statements. |
GOLDMAN SACHS TARGET DATE 2035 PORTFOLIO
Financial Highlights (continued)
Selected Share Data for a Share Outstanding Throughout Each Period
| | | | | | | | | | | | | | |
| | | | | Goldman Sachs Target Date 2035 Portfolio | |
| | | | | Class R Shares | |
| | | | | Year Ended
August 31, 2018 | | | Period
November 1, 2016 –
August 31, 2017* | | | Period Ended
October 31, 2016(a) | |
| | Per Share Data | | | | | | | | | | | | |
| | Net asset value, beginning of period | | $ | 10.83 | | | $ | 9.80 | | | $ | 10.00 | |
| | Net investment income(b) | | | 0.13 | | | | 0.09 | | | | 0.02 | |
| | Net realized and unrealized gain (loss) | | | 0.65 | | | | 1.00 | | | | (0.22 | ) |
| | Total from investment operations | | | 0.78 | | | | 1.09 | | | | (0.20 | ) |
| | Distributions to shareholders from net investment income | | | (0.12 | ) | | | (0.06 | ) | | | — | |
| | Distributions to shareholders from net realized gains | | | (0.17 | ) | | | — | | | | — | |
| | Total distributions | | | (0.29 | ) | | | (0.06 | ) | | | — | |
| | Net asset value, end of period | | $ | 11.32 | | | $ | 10.83 | | | $ | 9.80 | |
| | Total return(c) | | | 7.29 | % | | | 11.20 | % | | | (2.00 | )% |
| | Net assets, end of period (in 000s) | | $ | 12 | | | $ | 11 | | | $ | 10 | |
| | Ratio of net expenses to average net assets(d) | | | 0.96 | % | | | 0.98 | %(e) | | | 0.99 | %(e) |
| | Ratio of total expenses to average net assets(d) | | | 2.69 | % | | | 4.50 | %(e) | | | 4.47 | %(e) |
| | Ratio of net investment income to average net assets | | | 1.19 | % | | | 1.04 | %(e) | | | 0.79 | %(e) |
| | Portfolio turnover rate(f) | | | 139 | % | | | 137 | % | | | 29 | % |
| | * | | The Portfolio changed its fiscal year end from October 31 to August 31. |
| | (a) | | Commenced operations on August 22, 2016. |
| | (b) | | Calculated based on the average shares outstanding methodology. |
| | (c) | | Assumes investment at the NAV at the beginning of the period, reinvestment of all dividends and distributions, a complete redemption of the investment at the NAV at the end of the period and no sales or redemption charges. Total returns would be reduced if a sales or redemption charge was taken into account. Returns do not reflect the impact of taxes to shareholders relating to Portfolio distributions or the redemption of Portfolio shares. Total returns for periods less than one full year are not annualized. |
| | (d) | | Expense ratios exclude the expenses of the Underlying Funds in which the Portfolio invests. |
| | (f) | | The Portfolio’s turnover rate is calculated in accordance with regulatory requirements, without regard to transactions involving short term investments. If such transactions were included, the Portfolio’s turnover rate may be higher. |
| | |
| The accompanying notes are an integral part of these financial statements. | | 87 |
GOLDMAN SACHS TARGET DATE 2035 PORTFOLIO
Financial Highlights (continued)
Selected Share Data for a Share Outstanding Throughout Each Period
| | | | | | | | | | | | | | |
| | | | | Goldman Sachs Target Date 2035 Portfolio
| |
| | | | | Class R6 Shares | |
| | | | | Year Ended
August 31, 2018 | | | Period
November 1, 2016 –
August 31, 2017* | | | Period Ended
October 31, 2016(a) | |
| | Per Share Data | | | | | | | | | | | | |
| | Net asset value, beginning of period | | $ | 10.87 | | | $ | 9.81 | | | $ | 10.00 | |
| | Net investment income(b) | | | 0.20 | | | | 0.14 | | | | 0.03 | |
| | Net realized and unrealized gain (loss) | | | 0.66 | | | | 1.01 | | | | (0.22 | ) |
| | Total from investment operations | | | 0.86 | | | | 1.15 | | | | (0.19 | ) |
| | Distributions to shareholders from net investment income | | | (0.19 | ) | | | (0.09 | ) | | | — | |
| | Distributions to shareholders from net realized gains | | | (0.17 | ) | | | — | | | | — | |
| | Total distributions | | | (0.36 | ) | | | (0.09 | ) | | | — | |
| | Net asset value, end of period | | $ | 11.37 | | | $ | 10.87 | | | $ | 9.81 | |
| | Total return(c) | | | 8.05 | % | | | 11.75 | % | | | (1.90 | )% |
| | Net assets, end of period (in 000s) | | $ | 330 | | | $ | 35 | | | $ | 10 | |
| | Ratio of net expenses to average net assets(d) | | | 0.28 | % | | | 0.30 | %(e) | | | 0.32 | %(e) |
| | Ratio of total expenses to average net assets(d) | | | 2.00 | % | | | 4.22 | %(e) | | | 3.93 | %(e) |
| | Ratio of net investment income to average net assets | | | 1.77 | % | | | 1.64 | %(e) | | | 1.46 | %(e) |
| | Portfolio turnover rate(f) | | | 139 | % | | | 137 | % | | | 29 | % |
| | * | | The Portfolio changed its fiscal year end from October 31 to August 31. |
| | (a) | | Commenced operations on August 22, 2016. |
| | (b) | | Calculated based on the average shares outstanding methodology. |
| | (c) | | Assumes investment at the NAV at the beginning of the period, reinvestment of all dividends and distributions, a complete redemption of the investment at the NAV at the end of the period and no sales or redemption charges. Total returns would be reduced if a sales or redemption charge was taken into account. Returns do not reflect the impact of taxes to shareholders relating to Portfolio distributions or the redemption of Portfolio shares. Total returns for periods less than one full year are not annualized. |
| | (d) | | Expense ratios exclude the expenses of the Underlying Funds in which the Portfolio invests. |
| | (f) | | The Portfolio’s turnover rate is calculated in accordance with regulatory requirements, without regard to transactions involving short term investments. If such transactions were included, the Portfolio’s turnover rate may be higher. |
| | |
| 88 | | The accompanying notes are an integral part of these financial statements. |
GOLDMAN SACHS TARGET DATE 2040 PORTFOLIO
Financial Highlights (continued)
Selected Share Data for a Share Outstanding Throughout Each Period
| | | | | | | | | | | | | | |
| | | | | Goldman Sachs Target Date 2040 Portfolio
| |
| | | | | Class A Shares | |
| | | | | Year Ended
August 31, 2018 | | | Period
November 1, 2016 –
August 31, 2017* | | | Period Ended
October 31, 2016 | |
| | Per Share Data | | | | | | | | | | | | |
| | Net asset value, beginning of period | | $ | 10.09 | | | $ | 9.58 | | | $ | 9.77 | |
| | Net investment income(a) | | | 0.13 | | | | 0.10 | | | | 0.02 | |
| | Net realized and unrealized gain (loss) | | | 0.64 | | | | 1.03 | | | | (0.21 | ) |
| | Total from investment operations | | | 0.77 | | | | 1.13 | | | | (0.19 | ) |
| | Distributions to shareholders from net investment income | | | (0.14 | ) | | | (0.19 | ) | | | — | |
| | Distributions to shareholders from net realized gains | | | (1.23 | ) | | | (0.43 | ) | | | — | |
| | Total distributions | | | (1.37 | ) | | | (0.62 | ) | | | — | |
| | Net asset value, end of period | | $ | 9.49 | | | $ | 10.09 | | | $ | 9.58 | |
| | Total return(b) | | | 8.23 | % | | | 12.37 | % | | | (1.94 | )% |
| | Net assets, end of period (in 000s) | | $ | 51 | | | $ | 13 | | | $ | 13 | |
| | Ratio of net expenses to average net assets(c) | | | 0.70 | % | | | 0.73 | %(d) | | | 0.74 | %(d) |
| | Ratio of total expenses to average net assets(c) | | | 1.20 | % | | | 1.41 | %(d) | | | 3.23 | %(d) |
| | Ratio of net investment income to average net assets | | | 1.40 | % | | | 1.27 | %(d) | | | 0.98 | %(d) |
| | Portfolio turnover rate(e) | | | 143 | % | | | 142 | % | | | 174 | % |
| | * | | The Portfolio changed its fiscal year end from October 31 to August 31. |
| | (a) | | Calculated based on the average shares outstanding methodology. |
| | (b) | | Assumes investment at the net asset value at the beginning of the period, reinvestment of all dividends and distributions, a complete redemption of the investment at the net asset value at the end of the period and no sales or redemption charges. Total returns would be reduced if a sales or redemption charge was taken into account. Returns do not reflect the impact of taxes to shareholders relating to Portfolio distributions or the redemption of Portfolio shares. Total returns for periods less than one full year are not annualized. The Goldman Sachs Target Date 2040 Portfolio’s predecessor was the Madison Target Retirement 2040 Fund (the “Predecessor Fund”). On August 22, 2016, the Predecessor Fund was reorganized as a new series of Goldman Sachs Trust II. Performance prior to August 22, 2016 is that of the Predecessor Fund. Total return information of the Predecessor Fund is included in the above table because the Predecessor Fund is considered the accounting survivor of the reorganization. |
| | (c) | | Expense ratios exclude the expenses of the Underlying Funds in which the Portfolio invests. |
| | (e) | | The Portfolio’s turnover rate is calculated in accordance with regulatory requirements, without regard to transactions involving short term investments. If such transactions were included, the Portfolio’s turnover rate may be higher. |
| | |
| The accompanying notes are an integral part of these financial statements. | | 89 |
GOLDMAN SACHS TARGET DATE 2040 PORTFOLIO
Financial Highlights (continued)
Selected Share Data for a Share Outstanding Throughout Each Period
| | | | | | | | | | | | | | |
| | | | | Goldman Sachs Target Date 2040 Portfolio
| |
| | | | | Institutional Shares | |
| | | | | Year Ended
August 31, 2018 | | | Period
November 1, 2016 –
August 31, 2017* | | | Period Ended
October 31, 2016 | |
| | Per Share Data | | | | | | | | | | | | |
| | Net asset value, beginning of period | | $ | 10.12 | | | $ | 9.58 | | | $ | 9.77 | |
| | Net investment income(a) | | | 0.17 | | | | 0.14 | | | | 0.03 | |
| | Net realized and unrealized gain (loss) | | | 0.65 | | | | 1.03 | | | | (0.22 | ) |
| | Total from investment operations | | | 0.82 | | | | 1.17 | | | | (0.19 | ) |
| | Distributions to shareholders from net investment income | | | (0.17 | ) | | | (0.20 | ) | | | — | |
| | Distributions to shareholders from net realized gains | | | (1.23 | ) | | | (0.43 | ) | | | — | |
| | Total distributions | | | (1.40 | ) | | | (0.63 | ) | | | — | |
| | Net asset value, end of period | | $ | 9.54 | | | $ | 10.12 | | | $ | 9.58 | |
| | Total return(b) | | | 8.71 | % | | | 12.85 | % | | | (1.94 | )% |
| | Net assets, end of period (in 000s) | | $ | 12 | | | $ | 11 | | | $ | 10 | |
| | Ratio of net expenses to average net assets(c) | | | 0.30 | % | | | 0.32 | %(d) | | | 0.34 | %(d) |
| | Ratio of total expenses to average net assets(c) | | | 0.73 | % | | | 0.98 | %(d) | | | 2.82 | %(d) |
| | Ratio of net investment income to average net assets | | | 1.82 | % | | | 1.70 | %(d) | | | 1.41 | %(d) |
| | Portfolio turnover rate(e) | | | 143 | % | | | 142 | % | | | 174 | % |
| | * | | The Portfolio changed its fiscal year end from October 31 to August 31. |
| | (a) | | Calculated based on the average shares outstanding methodology. |
| | (b) | | Assumes investment at the net asset value at the beginning of the period, reinvestment of all dividends and distributions, a complete redemption of the investment at the net asset value at the end of the period and no sales or redemption charges. Total returns would be reduced if a sales or redemption charge was taken into account. Returns do not reflect the impact of taxes to shareholders relating to Portfolio distributions or the redemption of Portfolio shares. Total returns for periods less than one full year are not annualized. The Goldman Sachs Target Date 2040 Portfolio’s predecessor was the Madison Target Retirement 2040 Fund (the “Predecessor Fund”). On August 22, 2016, the Predecessor Fund was reorganized as a new series of Goldman Sachs Trust II. Performance prior to August 22, 2016 is that of the Predecessor Fund. Total return information of the Predecessor Fund is included in the above table because the Predecessor Fund is considered the accounting survivor of the reorganization. |
| | (c) | | Expense ratios exclude the expenses of the Underlying Funds in which the Portfolio invests. |
| | (e) | | The Portfolio’s turnover rate is calculated in accordance with regulatory requirements, without regard to transactions involving short term investments. If such transactions were included, the Portfolio’s turnover rate may be higher. |
| | |
| 90 | | The accompanying notes are an integral part of these financial statements. |
GOLDMAN SACHS TARGET DATE 2040 PORTFOLIO
Financial Highlights (continued)
Selected Share Data for a Share Outstanding Throughout Each Period
| | | | | | | | | | | | | | |
| | | | | Goldman Sachs Target Date 2040 Portfolio
| |
| | | | | Service Shares | |
| | | | | Year Ended
August 31, 2018 | | | Period
November 1, 2016 –
August 31, 2017* | | | Period Ended
October 31, 2016 | |
| | Per Share Data | | | | | | | | | | | | |
| | Net asset value, beginning of period | | $ | 10.08 | | | $ | 9.58 | | | $ | 9.77 | |
| | Net investment income(a) | | | 0.13 | | | | 0.10 | | | | 0.02 | |
| | Net realized and unrealized gain (loss) | | | 0.63 | | | | 1.01 | | | | (0.21 | ) |
| | Total from investment operations | | | 0.76 | | | | 1.11 | | | | (0.19 | ) |
| | Distributions to shareholders from net investment income | | | (0.12 | ) | | | (0.18 | ) | | | — | |
| | Distributions to shareholders from net realized gains | | | (1.23 | ) | | | (0.43 | ) | | | — | |
| | Total distributions | | | (1.35 | ) | | | (0.61 | ) | | | — | |
| | Net asset value, end of period | | $ | 9.49 | | | $ | 10.08 | | | $ | 9.58 | |
| | Total return(b) | | | 8.13 | % | | | 12.21 | % | | | (1.94 | )% |
| | Net assets, end of period (in 000s) | | $ | 12 | | | $ | 11 | | | $ | 10 | |
| | Ratio of net expenses to average net assets(c) | | | 0.81 | % | | | 0.82 | %(d) | | | 0.83 | %(d) |
| | Ratio of total expenses to average net assets(c) | | | 1.24 | % | | | 1.48 | %(d) | | | 3.31 | %(d) |
| | Ratio of net investment income to average net assets | | | 1.32 | % | | | 1.20 | %(d) | | | 0.92 | %(d) |
| | Portfolio turnover rate(e) | | | 143 | % | | | 142 | % | | | 174 | % |
| | * | | The Portfolio changed its fiscal year end from October 31 to August 31. |
| | (a) | | Calculated based on the average shares outstanding methodology. |
| | (b) | | Assumes investment at the net asset value at the beginning of the period, reinvestment of all dividends and distributions, a complete redemption of the investment at the net asset value at the end of the period and no sales or redemption charges. Total returns would be reduced if a sales or redemption charge was taken into account. Returns do not reflect the impact of taxes to shareholders relating to Portfolio distributions or the redemption of Portfolio shares. Total returns for periods less than one full year are not annualized. The Goldman Sachs Target Date 2040 Portfolio’s predecessor was the Madison Target Retirement 2040 Fund (the “Predecessor Fund”). On August 22, 2016, the Predecessor Fund was reorganized as a new series of Goldman Sachs Trust II. Performance prior to August 22, 2016 is that of the Predecessor Fund. Total return information of the Predecessor Fund is included in the above table because the Predecessor Fund is considered the accounting survivor of the reorganization. |
| | (c) | | Expense ratios exclude the expenses of the Underlying Funds in which the Portfolio invests. |
| | (e) | | The Portfolio’s turnover rate is calculated in accordance with regulatory requirements, without regard to transactions involving short term investments. If such transactions were included, the Portfolio’s turnover rate may be higher. |
| | |
| The accompanying notes are an integral part of these financial statements. | | 91 |
GOLDMAN SACHS TARGET DATE 2040 PORTFOLIO
Financial Highlights (continued)
Selected Share Data for a Share Outstanding Throughout Each Period
| | | | | | | | | | | | | | |
| | | | | Goldman Sachs Target Date 2040 Portfolio
| |
| | | | | Investor Shares(a) | |
| | | | | Year Ended
August 31, 2018 | | | Period
November 1, 2016 –
August 31, 2017* | | | Period Ended
October 31, 2016 | |
| | Per Share Data | | | | | | | | | | | | |
| | Net asset value, beginning of period | | $ | 10.11 | | | $ | 9.58 | | | $ | 9.77 | |
| | Net investment income(b) | | | 0.16 | | | | 0.09 | | | | 0.02 | |
| | Net realized and unrealized gain (loss) | | | 0.64 | | | | 1.06 | | | | (0.21 | ) |
| | Total from investment operations | | | 0.80 | | | | 1.15 | | | | (0.19 | ) |
| | Distributions to shareholders from net investment income | | | (0.17 | ) | | | (0.19 | ) | | | — | |
| | Distributions to shareholders from net realized gains | | | (1.23 | ) | | | (0.43 | ) | | | — | |
| | Total distributions | | | (1.40 | ) | | | (0.62 | ) | | | — | |
| | Net asset value, end of period | | $ | 9.51 | | | $ | 10.11 | | | $ | 9.58 | |
| | Total return(c) | | | 8.46 | % | | | 12.68 | % | | | (1.94 | )% |
| | Net assets, end of period (in 000s) | | $ | 636 | | | $ | 130 | | | $ | 10 | |
| | Ratio of net expenses to average net assets(d) | | | 0.45 | % | | | 0.46 | %(e) | | | 0.48 | %(e) |
| | Ratio of total expenses to average net assets(d) | | | 0.89 | % | | | 0.98 | %(e) | | | 2.96 | %(e) |
| | Ratio of net investment income to average net assets | | | 1.67 | % | | | 1.11 | %(e) | | | 1.27 | %(e) |
| | Portfolio turnover rate(f) | | | 143 | % | | | 142 | % | | | 174 | % |
| | * | | The Portfolio changed its fiscal year end from October 31 to August 31. |
| | (a) | | Effective October 10, 2017, Class IR Shares changed its name to Investor Shares. |
| | (b) | | Calculated based on the average shares outstanding methodology. |
| | (c) | | Assumes investment at the net asset value at the beginning of the period, reinvestment of all dividends and distributions, a complete redemption of the investment at the net asset value at the end of the period and no sales or redemption charges. Total returns would be reduced if a sales or redemption charge was taken into account. Returns do not reflect the impact of taxes to shareholders relating to Portfolio distributions or the redemption of Portfolio shares. Total returns for periods less than one full year are not annualized. The Goldman Sachs Target Date 2040 Portfolio’s predecessor was the Madison Target Retirement 2040 Fund (the “Predecessor Fund”). On August 22, 2016, the Predecessor Fund was reorganized as a new series of Goldman Sachs Trust II. Performance prior to August 22, 2016 is that of the Predecessor Fund. Total return information of the Predecessor Fund is included in the above table because the Predecessor Fund is considered the accounting survivor of the reorganization. |
| | (d) | | Expense ratios exclude the expenses of the Underlying Funds in which the Portfolio invests. |
| | (f) | | The Portfolio’s turnover rate is calculated in accordance with regulatory requirements, without regard to transactions involving short term investments. If such transactions were included, the Portfolio’s turnover rate may be higher. |
| | |
| 92 | | The accompanying notes are an integral part of these financial statements. |
GOLDMAN SACHS TARGET DATE 2040 PORTFOLIO
Financial Highlights (continued)
Selected Share Data for a Share Outstanding Throughout Each Period
| | | | | | | | | | | | | | |
| | | | | Goldman Sachs Target Date 2040 Portfolio
| |
| | | | | Class R Shares | |
| | | | | Year Ended
August 31, 2018 | | | Period
November 1, 2016 –
August 31, 2017* | | | Period Ended
October 31, 2016 | |
| | Per Share Data | | | | | | | | | | | | |
| | Net asset value, beginning of period | | $ | 10.07 | | | $ | 9.57 | | | $ | 9.77 | |
| | Net investment income(a) | | | 0.11 | | | | 0.09 | | | | 0.01 | |
| | Net realized and unrealized gain (loss) | | | 0.64 | | | | 1.02 | | | | (0.21 | ) |
| | Total from investment operations | | | 0.75 | | | | 1.11 | | | | (0.20 | ) |
| | Distributions to shareholders from net investment income | | | (0.12 | ) | | | (0.18 | ) | | | — | |
| | Distributions to shareholders from net realized gains | | | (1.23 | ) | | | (0.43 | ) | | | — | |
| | Total distributions | | | (1.35 | ) | | | (0.61 | ) | | | — | |
| | Net asset value, end of period | | $ | 9.47 | | | $ | 10.07 | | | $ | 9.57 | |
| | Total return(b) | | | 8.02 | % | | | 12.16 | % | | | (2.05 | )% |
| | Net assets, end of period (in 000s) | | $ | 36 | | | $ | 24 | | | $ | 10 | |
| | Ratio of net expenses to average net assets(c) | | | 0.95 | % | | | 0.97 | %(d) | | | 0.98 | %(d) |
| | Ratio of total expenses to average net assets(c) | | | 1.39 | % | | | 1.42 | %(d) | | | 3.46 | %(d) |
| | Ratio of net investment income to average net assets | | | 1.16 | % | | | 1.05 | %(d) | | | 0.77 | %(d) |
| | Portfolio turnover rate(e) | | | 143 | % | | | 142 | % | | | 174 | % |
| | * | | The Portfolio changed its fiscal year end from October 31 to August 31. |
| | (a) | | Calculated based on the average shares outstanding methodology. |
| | (b) | | Assumes investment at the net asset value at the beginning of the period, reinvestment of all dividends and distributions, a complete redemption of the investment at the net asset value at the end of the period and no sales or redemption charges. Total returns would be reduced if a sales or redemption charge was taken into account. Returns do not reflect the impact of taxes to shareholders relating to Portfolio distributions or the redemption of Portfolio shares. Total returns for periods less than one full year are not annualized. The Goldman Sachs Target Date 2040 Portfolio’s predecessor was the Madison Target Retirement 2040 Fund (the “Predecessor Fund”). On August 22, 2016, the Predecessor Fund was reorganized as a new series of Goldman Sachs Trust II. Performance prior to August 22, 2016 is that of the Predecessor Fund. Total return information of the Predecessor Fund is included in the above table because the Predecessor Fund is considered the accounting survivor of the reorganization. |
| | (c) | | Expense ratios exclude the expenses of the Underlying Funds in which the Portfolio invests. |
| | (e) | | The Portfolio’s turnover rate is calculated in accordance with regulatory requirements, without regard to transactions involving short term investments. If such transactions were included, the Portfolio’s turnover rate may be higher. |
| | |
| The accompanying notes are an integral part of these financial statements. | | 93 |
GOLDMAN SACHS TARGET DATE 2040 PORTFOLIO
Financial Highlights (continued)
Selected Share Data for a Share Outstanding Throughout Each Period
| | | | | | | | | | | | | | | | | | | | | | |
| | | | | Goldman Sachs Target Date 2040 Portfolio
| |
| | | | | Class R6 Shares | |
| | | | | Year Ended
August 31, 2018 | | | Period
November 1, 2016 –
August 31, 2017* | | | Year Ended October 31, | | | Period Ended
October 31, 2014 | |
| | | | | 2016 | | | 2015 | |
| | Per Share Data | | | | | | | | | | | | | | | | | | | | |
| | Net asset value, beginning of period | | $ | 10.12 | | | $ | 9.59 | | | $ | 9.90 | | | $ | 9.98 | | | $ | 10.00 | |
| | Net investment income(a) | | | 0.18 | | | | 0.14 | | | | 0.19 | | | | 0.15 | | | | 0.03 | |
| | Net realized and unrealized gain (loss) | | | 0.64 | | | | 1.02 | | | | 0.11 | | | | 0.13 | | | | (0.05 | ) |
| | Total from investment operations | | | 0.82 | | | | 1.16 | | | | 0.30 | | | | 0.28 | | | | (0.02 | ) |
| | Distributions to shareholders from net investment income | | | (0.17 | ) | | | (0.20 | ) | | | (0.17 | ) | | | (0.10 | ) | | | — | |
| | Distributions to shareholders from net realized gains | | | (1.23 | ) | | | (0.43 | ) | | | (0.44 | ) | | | (0.26 | ) | | | — | |
| | Total distributions | | | (1.40 | ) | | | (0.63 | ) | | | (0.61 | ) | | | (0.36 | ) | | | — | |
| | Net asset value, end of period | | $ | 9.54 | | | $ | 10.12 | | | $ | 9.59 | | | $ | 9.90 | | | $ | 9.98 | |
| | Total return(b) | | | 8.70 | % | | | 12.73 | % | | | 3.33 | % | | | 2.86 | % | | | (0.20 | )% |
| | Net assets, end of period (in 000s) | | $ | 49,418 | | | $ | 48,905 | | | $ | 47,340 | | | $ | 50,029 | | | $ | 58,903 | |
| | Ratio of net expenses to average net assets(c) | | | 0.29 | % | | | 0.30 | %(d) | | | 0.31 | % | | | 0.30 | % | | | 0.32 | %(d) |
| | Ratio of total expenses to average net assets(c) | | | 0.72 | % | | | 0.98 | %(d) | | | 0.80 | % | | | 0.30 | % | | | 0.32 | %(d) |
| | Ratio of net investment income to average net assets | | | 1.84 | % | | | 1.73 | %(d) | | | 1.97 | % | | | 1.50 | % | | | 1.84 | %(d) |
| | Portfolio turnover rate(e) | | | 143 | % | | | 142 | % | | | 174 | % | | | 160 | % | | | 46 | % |
| | * | | The Portfolio changed its fiscal year end from October 31 to August 31. |
| | (a) | | Calculated based on the average shares outstanding methodology. |
| | (b) | | Assumes investment at the net asset value at the beginning of the period, reinvestment of all dividends and distributions, a complete redemption of the investment at the net asset value at the end of the period and no sales or redemption charges. Total returns would be reduced if a sales or redemption charge was taken into account. Returns do not reflect the impact of taxes to shareholders relating to Portfolio distributions or the redemption of Portfolio shares. Total returns for periods less than one full year are not annualized. The Goldman Sachs Target Date 2040 Portfolio’s predecessor was the Madison Target Retirement 2040 Fund (the “Predecessor Fund”). On August 22, 2016, the Predecessor Fund was reorganized as a new series of Goldman Sachs Trust II. Performance prior to August 22, 2016 is that of the Predecessor Fund. Total return information of the Predecessor Fund is included in the above table because the Predecessor Fund is considered the accounting survivor of the reorganization. |
| | (c) | | Expense ratios exclude the expenses of the Underlying Funds in which the Portfolio invests. |
| | (e) | | The Portfolio’s turnover rate is calculated in accordance with regulatory requirements, without regard to transactions involving short term investments. If such transactions were included, the Portfolio’s turnover rate may be higher. |
| | |
| 94 | | The accompanying notes are an integral part of these financial statements. |
GOLDMAN SACHS TARGET DATE 2045 PORTFOLIO
Financial Highlights (continued)
Selected Share Data for a Share Outstanding Throughout Each Period
| | | | | | | | | | | | | | |
| | | | | Goldman Sachs Target Date 2045 Portfolio | |
| | | | | Class A Shares | |
| | | | | Year Ended
August 31, 2018 | | | Period
November 1, 2016 –
August 31, 2017* | | | Period Ended
October 31, 2016(a) | |
| | Per Share Data | | | | | | | | | | | | |
| | Net asset value, beginning of period | | $ | 11.01 | | | $ | 9.80 | | | $ | 10.00 | |
| | Net investment income(b) | | | 0.16 | | | | 0.08 | | | | 0.02 | |
| | Net realized and unrealized gain (loss) | | | 0.81 | | | | 1.20 | | | | (0.22 | ) |
| | Total from investment operations | | | 0.97 | | | | 1.28 | | | | (0.20 | ) |
| | Distributions to shareholders from net investment income | | | (0.16 | ) | | | (0.07 | ) | | | — | |
| | Distributions to shareholders from net realized gains | | | (0.22 | ) | | | — | | | | — | |
| | Total distributions | | | (0.38 | ) | | | (0.07 | ) | | | — | |
| | Net asset value, end of period | | $ | 11.60 | | | $ | 11.01 | | | $ | 9.80 | |
| | Total return(c) | | | 9.02 | % | | | 13.17 | % | | | (2.00 | )% |
| | Net assets, end of period (in 000s) | | $ | 106 | | | $ | 84 | | | $ | 10 | |
| | Ratio of net expenses to average net assets(d) | | | 0.69 | % | | | 0.71 | %(e) | | | 0.75 | %(e) |
| | Ratio of total expenses to average net assets(d) | | | 2.44 | % | | | 5.43 | %(e) | | | 4.23 | %(e) |
| | Ratio of net investment income to average net assets | | | 1.42 | % | | | 0.90 | %(e) | | | 1.02 | %(e) |
| | Portfolio turnover rate(f) | | | 145 | % | | | 143 | % | | | 29 | % |
| | * | | The Portfolio changed its fiscal year end from October 31 to August 31. |
| | (a) | | Commenced operations on August 22, 2016. |
| | (b) | | Calculated based on the average shares outstanding methodology. |
| | (c) | | Assumes investment at the NAV at the beginning of the period, reinvestment of all dividends and distributions, a complete redemption of the investment at the NAV at the end of the period and no sales or redemption charges. Total returns would be reduced if a sales or redemption charge was taken into account. Returns do not reflect the impact of taxes to shareholders relating to Portfolio distributions or the redemption of Portfolio shares. Total returns for periods less than one full year are not annualized. |
| | (d) | | Expense ratios exclude the expenses of the Underlying Funds in which the Portfolio invests. |
| | (f) | | The Portfolio’s turnover rate is calculated in accordance with regulatory requirements, without regard to transactions involving short term investments. If such transactions were included, the Portfolio’s turnover rate may be higher. |
| | |
| The accompanying notes are an integral part of these financial statements. | | 95 |
GOLDMAN SACHS TARGET DATE 2045 PORTFOLIO
Financial Highlights (continued)
Selected Share Data for a Share Outstanding Throughout Each Period
| | | | | | | | | | | | | | |
| | | | | Goldman Sachs Target Date 2045 Portfolio | |
| | | | | Institutional Shares | |
| | | | | Year Ended
August 31, 2018 | | | Period
November 1, 2016 –
August 31, 2017* | | | Period Ended
October 31, 2016(a) | |
| | Per Share Data | | | | | | | | | | | | |
| | Net asset value, beginning of period | | $ | 11.04 | | | $ | 9.81 | | | $ | 10.00 | |
| | Net investment income(b) | | | 0.21 | | | | 0.15 | | | | 0.03 | |
| | Net realized and unrealized gain (loss) | | | 0.81 | | | | 1.17 | | | | (0.22 | ) |
| | Total from investment operations | | | 1.02 | | | | 1.32 | | | | (0.19 | ) |
| | Distributions to shareholders from net investment income | | | (0.19 | ) | | | (0.09 | ) | | | — | |
| | Distributions to shareholders from net realized gains | | | (0.22 | ) | | | — | | | | — | |
| | Total distributions | | | (0.41 | ) | | | (0.09 | ) | | | — | |
| | Net asset value, end of period | | $ | 11.65 | | | $ | 11.04 | | | $ | 9.81 | |
| | Total return(c) | | | 9.40 | % | | | 13.52 | % | | | (1.90 | )% |
| | Net assets, end of period (in 000s) | | $ | 11,472 | | | $ | 11,077 | | | $ | 9,756 | |
| | Ratio of net expenses to average net assets(d) | | | 0.30 | % | | | 0.32 | %(e) | | | 0.34 | %(e) |
| | Ratio of total expenses to average net assets(d) | | | 2.05 | % | | | 3.82 | %(e) | | | 3.85 | %(e) |
| | Ratio of net investment income to average net assets | | | 1.83 | % | | | 1.69 | %(e) | | | 1.43 | %(e) |
| | Portfolio turnover rate(f) | | | 145 | % | | | 143 | % | | | 29 | % |
| | * | | The Portfolio changed its fiscal year end from October 31 to August 31. |
| | (a) | | Commenced operations on August 22, 2016. |
| | (b) | | Calculated based on the average shares outstanding methodology. |
| | (c) | | Assumes investment at the NAV at the beginning of the period, reinvestment of all dividends and distributions, a complete redemption of the investment at the NAV at the end of the period and no sales or redemption charges. Total returns would be reduced if a sales or redemption charge was taken into account. Returns do not reflect the impact of taxes to shareholders relating to Portfolio distributions or the redemption of Portfolio shares. Total returns for periods less than one full year are not annualized. |
| | (d) | | Expense ratios exclude the expenses of the Underlying Funds in which the Portfolio invests. |
| | (f) | | The Portfolio’s turnover rate is calculated in accordance with regulatory requirements, without regard to transactions involving short term investments. If such transactions were included, the Portfolio’s turnover rate may be higher. |
| | |
| 96 | | The accompanying notes are an integral part of these financial statements. |
GOLDMAN SACHS TARGET DATE 2045 PORTFOLIO
Financial Highlights (continued)
Selected Share Data for a Share Outstanding Throughout Each Period
| | | | | | | | | | | | | | |
| | | | | Goldman Sachs Target Date 2045 Portfolio | |
| | | | | Service Shares | |
| | | | | Year Ended
August 31, 2018 | | | Period
November 1, 2016 –
August 31, 2017* | | | Period Ended
October 31, 2016(a) | |
| | Per Share Data | | | | | | | | | | | | |
| | Net asset value, beginning of period | | $ | 11.00 | | | $ | 9.80 | | | $ | 10.00 | |
| | Net investment income(b) | | | 0.15 | | | | 0.10 | | | | 0.02 | |
| | Net realized and unrealized gain (loss) | | | 0.81 | | | | 1.17 | | | | (0.22 | ) |
| | Total from investment operations | | | 0.96 | | | | 1.27 | | | | (0.20 | ) |
| | Distributions to shareholders from net investment income | | | (0.14 | ) | | | (0.07 | ) | | | — | |
| | Distributions to shareholders from net realized gains | | | (0.22 | ) | | | — | | | | — | |
| | Total distributions | | | (0.36 | ) | | | (0.07 | ) | | | — | |
| | Net asset value, end of period | | $ | 11.60 | | | $ | 11.00 | | | $ | 9.80 | |
| | Total return(c) | | | 8.83 | % | | | 13.03 | % | | | (2.00 | )% |
| | Net assets, end of period (in 000s) | | $ | 12 | | | $ | 11 | | | $ | 10 | |
| | Ratio of net expenses to average net assets(d) | | | 0.80 | % | | | 0.81 | %(e) | | | 0.84 | %(e) |
| | Ratio of total expenses to average net assets(d) | | | 2.53 | % | | | 4.30 | %(e) | | | 4.33 | %(e) |
| | Ratio of net investment income to average net assets | | | 1.33 | % | | | 1.20 | %(e) | | | 0.93 | %(e) |
| | Portfolio turnover rate(f) | | | 145 | % | | | 143 | % | | | 29 | % |
| | * | | The Portfolio changed its fiscal year end from October 31 to August 31. |
| | (a) | | Commenced operations on August 22, 2016. |
| | (b) | | Calculated based on the average shares outstanding methodology. |
| | (c) | | Assumes investment at the NAV at the beginning of the period, reinvestment of all dividends and distributions, a complete redemption of the investment at the NAV at the end of the period and no sales or redemption charges. Total returns would be reduced if a sales or redemption charge was taken into account. Returns do not reflect the impact of taxes to shareholders relating to Portfolio distributions or the redemption of Portfolio shares. Total returns for periods less than one full year are not annualized. |
| | (d) | | Expense ratios exclude the expenses of the Underlying Funds in which the Portfolio invests. |
| | (f) | | The Portfolio’s turnover rate is calculated in accordance with regulatory requirements, without regard to transactions involving short term investments. If such transactions were included, the Portfolio’s turnover rate may be higher. |
| | |
| The accompanying notes are an integral part of these financial statements. | | 97 |
GOLDMAN SACHS TARGET DATE 2045 PORTFOLIO
Financial Highlights (continued)
Selected Share Data for a Share Outstanding Throughout Each Period
| | | | | | | | | | | | | | |
| | | | | Goldman Sachs Target Date 2045 Portfolio | |
| | | | | Investor Shares(a) | |
| | | | | Year Ended
August 31, 2018 | | | Period
November 1, 2016 –
August 31, 2017* | | | Period Ended
October 31, 2016(b) | |
| | Per Share Data | | | | | | | | | | | | |
| | Net asset value, beginning of period | | $ | 11.03 | | | $ | 9.80 | | | $ | 10.00 | |
| | Net investment income(c) | | | 0.19 | | | | 0.10 | | | | 0.02 | |
| | Net realized and unrealized gain (loss) | | | 0.80 | | | | 1.21 | | | | (0.22 | ) |
| | Total from investment operations | | | 0.99 | | | | 1.31 | | | | (0.20 | ) |
| | Distributions to shareholders from net investment income | | | (0.18 | ) | | | (0.08 | ) | | | — | |
| | Distributions to shareholders from net realized gains | | | (0.22 | ) | | | — | | | | — | |
| | Total distributions | | | (0.40 | ) | | | (0.08 | ) | | | — | |
| | Net asset value, end of period | | $ | 11.62 | | | $ | 11.03 | | | $ | 9.80 | |
| | Total return(d) | | | 9.19 | % | | | 13.48 | % | | | (2.00 | )% |
| | Net assets, end of period (in 000s) | | $ | 600 | | | $ | 97 | | | $ | 10 | |
| | Ratio of net expenses to average net assets(e) | | | 0.44 | % | | | 0.46 | %(f) | | | 0.49 | %(f) |
| | Ratio of total expenses to average net assets(e) | | | 2.18 | % | | | 6.16 | %(f) | | | 3.97 | %(f) |
| | Ratio of net investment income to average net assets | | | 1.69 | % | | | 1.13 | %(f) | | | 1.28 | %(f) |
| | Portfolio turnover rate(g) | | | 145 | % | | | 143 | % | | | 29 | % |
| | * | | The Portfolio changed its fiscal year end from October 31 to August 31. |
| | (a) | | Effective October 10, 2017, Class IR Shares changed its name to Investor Shares. |
| | (b) | | Commenced operations on August 22, 2016. |
| | (c) | | Calculated based on the average shares outstanding methodology. |
| | (d) | | Assumes investment at the NAV at the beginning of the period, reinvestment of all dividends and distributions, a complete redemption of the investment at the NAV at the end of the period and no sales or redemption charges. Total returns would be reduced if a sales or redemption charge was taken into account. Returns do not reflect the impact of taxes to shareholders relating to Portfolio distributions or the redemption of Portfolio shares. Total returns for periods less than one full year are not annualized. |
| | (e) | | Expense ratios exclude the expenses of the Underlying Funds in which the Portfolio invests. |
| | (g) | | The Portfolio’s turnover rate is calculated in accordance with regulatory requirements, without regard to transactions involving short term investments. If such transactions were included, the Portfolio’s turnover rate may be higher. |
| | |
| 98 | | The accompanying notes are an integral part of these financial statements. |
GOLDMAN SACHS TARGET DATE 2045 PORTFOLIO
Financial Highlights (continued)
Selected Share Data for a Share Outstanding Throughout Each Period
| | | | | | | | | | | | | | |
| | | | | Goldman Sachs Target Date 2045 Portfolio | |
| | | | | Class R Shares | |
| | | | | Year Ended
August 31, 2018 | | | Period
November 1, 2016 –
August 31, 2017* | | | Period Ended
October 31, 2016(a) | |
| | Per Share Data | | | | | | | | | | | | |
| | Net asset value, beginning of period | | $ | 10.99 | | | $ | 9.79 | | | $ | 10.00 | |
| | Net investment income(b) | | | 0.13 | | | | 0.09 | | | | 0.01 | |
| | Net realized and unrealized gain (loss) | | | 0.81 | | | | 1.17 | | | | (0.22 | ) |
| | Total from investment operations | | | 0.94 | | | | 1.26 | | | | (0.21 | ) |
| | Distributions to shareholders from net investment income | | | (0.13 | ) | | | (0.06 | ) | | | — | |
| | Distributions to shareholders from net realized gains | | | (0.22 | ) | | | — | | | | — | |
| | Total distributions | | | (0.35 | ) | | | (0.06 | ) | | | — | |
| | Net asset value, end of period | | $ | 11.58 | | | $ | 10.99 | | | $ | 9.79 | |
| | Total return(c) | | | 8.74 | % | | | 12.98 | % | | | (2.10 | )% |
| | Net assets, end of period (in 000s) | | $ | 41 | | | $ | 29 | | | $ | 10 | |
| | Ratio of net expenses to average net assets(d) | | | 0.94 | % | | | 0.95 | %(e) | | | 0.99 | %(e) |
| | Ratio of total expenses to average net assets(d) | | | 2.68 | % | | | 4.63 | %(e) | | | 4.48 | %(e) |
| | Ratio of net investment income to average net assets | | | 1.17 | % | | | 1.07 | %(e) | | | 0.78 | %(e) |
| | Portfolio turnover rate(f) | | | 145 | % | | | 143 | % | | | 29 | % |
| | * | | The Portfolio changed its fiscal year end from October 31 to August 31. |
| | (a) | | Commenced operations on August 22, 2016. |
| | (b) | | Calculated based on the average shares outstanding methodology. |
| | (c) | | Assumes investment at the NAV at the beginning of the period, reinvestment of all dividends and distributions, a complete redemption of the investment at the NAV at the end of the period and no sales or redemption charges. Total returns would be reduced if a sales or redemption charge was taken into account. Returns do not reflect the impact of taxes to shareholders relating to Portfolio distributions or the redemption of Portfolio shares. Total returns for periods less than one full year are not annualized. |
| | (d) | | Expense ratios exclude the expenses of the Underlying Funds in which the Portfolio invests. |
| | (f) | | The Portfolio’s turnover rate is calculated in accordance with regulatory requirements, without regard to transactions involving short term investments. If such transactions were included, the Portfolio’s turnover rate may be higher. |
| | |
| The accompanying notes are an integral part of these financial statements. | | 99 |
GOLDMAN SACHS TARGET DATE 2045 PORTFOLIO
Financial Highlights (continued)
Selected Share Data for a Share Outstanding Throughout Each Period
| | | | | | | | | | | | | | |
| | | | | Goldman Sachs Target Date 2045 Portfolio | |
| | | | | Class R6 Shares | |
| | | | | Year Ended
August 31, 2018 | | | Period
November 1, 2016 –
August 31, 2017* | | | Period Ended
October 31, 2016(a) | |
| | Per Share Data | | | | | | | | | | | | |
| | Net asset value, beginning of period | | $ | 11.04 | | | $ | 9.81 | | | $ | 10.00 | |
| | Net investment income(b) | | | 0.20 | | | | 0.15 | | | | 0.03 | |
| | Net realized and unrealized gain (loss) | | | 0.81 | | | | 1.17 | | | | (0.22 | ) |
| | Total from investment operations | | | 1.01 | | | | 1.32 | | | | (0.19 | ) |
| | Distributions to shareholders from net investment income | | | (0.19 | ) | | | (0.09 | ) | | | — | |
| | Distributions to shareholders from net realized gains | | | (0.22 | ) | | | — | | | | — | |
| | Total distributions | | | (0.41 | ) | | | (0.09 | ) | | | — | |
| | Net asset value, end of period | | $ | 11.64 | | | $ | 11.04 | | | $ | 9.81 | |
| | Total return(c) | | | 9.34 | % | | | 13.64 | % | | | (2.00 | )% |
| | Net assets, end of period (in 000s) | | $ | 270 | | | $ | 14 | | | $ | 10 | |
| | Ratio of net expenses to average net assets(d) | | | 0.28 | % | | | 0.31 | %(e) | | | 0.32 | %(e) |
| | Ratio of total expenses to average net assets(d) | | | 2.03 | % | | | 4.00 | %(e) | | | 3.93 | %(e) |
| | Ratio of net investment income to average net assets | | | 1.72 | % | | | 1.68 | %(e) | | | 1.45 | %(e) |
| | Portfolio turnover rate(f) | | | 145 | % | | | 143 | % | | | 29 | % |
| | * | | The Portfolio changed its fiscal year end from October 31 to August 31. |
| | (a) | | Commenced operations on August 22, 2016. |
| | (b) | | Calculated based on the average shares outstanding methodology. |
| | (c) | | Assumes investment at the NAV at the beginning of the period, reinvestment of all dividends and distributions, a complete redemption of the investment at the NAV at the end of the period and no sales or redemption charges. Total returns would be reduced if a sales or redemption charge was taken into account. Returns do not reflect the impact of taxes to shareholders relating to Portfolio distributions or the redemption of Portfolio shares. Total returns for periods less than one full year are not annualized. |
| | (d) | | Expense ratios exclude the expenses of the Underlying Funds in which the Portfolio invests. |
| | (f) | | The Portfolio’s turnover rate is calculated in accordance with regulatory requirements, without regard to transactions involving short term investments. If such transactions were included, the Portfolio’s turnover rate may be higher. |
| | |
| 100 | | The accompanying notes are an integral part of these financial statements. |
GOLDMAN SACHS TARGET DATE 2050 PORTFOLIO
Financial Highlights (continued)
Selected Share Data for a Share Outstanding Throughout Each Period
| | | | | | | | | | | | | | |
| | | | | Goldman Sachs Target Date 2050 Portfolio | |
| | | | | Class A Shares | |
| | | | | Year Ended
August 31, 2018 | | | Period
November 1, 2016 –
August 31, 2017* | | | Period Ended
October 31, 2016 | |
| | Per Share Data | | | | | | | | | | | | |
| | Net asset value, beginning of period | | $ | 10.54 | | | $ | 9.80 | | | $ | 10.00 | |
| | Net investment income(a) | | | 0.14 | | | | 0.12 | | | | 0.02 | |
| | Net realized and unrealized gain (loss) | | | 0.84 | | | | 1.21 | | | | (0.22 | ) |
| | Total from investment operations | | | 0.98 | | | | 1.33 | | | | (0.20 | ) |
| | Distributions to shareholders from net investment income | | | (0.16 | ) | | | (0.19 | ) | | | — | |
| | Distributions to shareholders from net realized gains | | | (0.67 | ) | | | (0.40 | ) | | | — | |
| | Total distributions | | | (0.83 | ) | | | (0.59 | ) | | | — | |
| | Net asset value, end of period | | $ | 10.69 | | | $ | 10.54 | | | $ | 9.80 | |
| | Total return(b) | | | 9.66 | % | | | 14.21 | % | | | (2.00 | )% |
| | Net assets, end of period (in 000s) | | $ | 218 | | | $ | 49 | | | $ | 10 | |
| | Ratio of net expenses to average net assets(c) | | | 0.70 | % | | | 0.71 | %(d) | | | 0.74 | %(d) |
| | Ratio of total expenses to average net assets(c) | | | 1.57 | % | | | 1.34 | %(d) | | | 6.30 | %(d) |
| | Ratio of net investment income to average net assets | | | 1.38 | % | | | 1.38 | %(d) | | | 1.04 | %(d) |
| | Portfolio turnover rate(e) | | | 155 | % | | | 139 | % | | | 191 | % |
| | * | | The Portfolio changed its fiscal year end from October 31 to August 31. |
| | (a) | | Calculated based on the average shares outstanding methodology. |
| | (b) | | Assumes investment at the NAV at the beginning of the period, reinvestment of all dividends and distributions, a complete redemption of the investment at the NAV at the end of the period and no sales or redemption charges. Total returns would be reduced if a sales or redemption charge was taken into account. Returns do not reflect the impact of taxes to shareholders relating to Portfolio distributions or the redemption of Portfolio shares. Total returns for periods less than one full year are not annualized. The Goldman Sachs Target Date 2050 Portfolio’s predecessor was the Madison Target Retirement 2050 Fund (the “Predecessor Fund”). On August 22, 2016, the Predecessor Fund was reorganized as a new series of Goldman Sachs Trust II. Performance prior to August 22, 2016 is that of the Predecessor Fund. Total return information of the Predecessor Fund is included in the above table because the Predecessor Fund is considered the accounting survivor of the reorganization. |
| | (c) | | Expense ratios exclude the expenses of the Underlying Funds in which the Portfolio invests. |
| | (e) | | The Portfolio’s turnover rate is calculated in accordance with regulatory requirements, without regard to transactions involving short term investments. If such transactions were included, the Portfolio’s turnover rate may be higher. |
| | |
| The accompanying notes are an integral part of these financial statements. | | 101 |
GOLDMAN SACHS TARGET DATE 2050 PORTFOLIO
Financial Highlights (continued)
Selected Share Data for a Share Outstanding Throughout Each Period
| | | | | | | | | | | | | | |
| | | | | Goldman Sachs Target Date 2050 Portfolio | |
| | | | | Institutional Shares | |
| | | | | Year Ended
August 31, 2018 | | | Period
November 1, 2016 –
August 31, 2017* | | | Period Ended
October 31, 2016 | |
| | Per Share Data | | | | | | | | | | | | |
| | Net asset value, beginning of period | | $ | 10.56 | | | $ | 9.80 | | | $ | 10.00 | |
| | Net investment income(a) | | | 0.19 | | | | 0.14 | | | | 0.03 | |
| | Net realized and unrealized gain (loss) | | | 0.84 | | | | 1.22 | | | | (0.23 | ) |
| | Total from investment operations | | | 1.03 | | | | 1.36 | | | | (0.20 | ) |
| | Distributions to shareholders from net investment income | | | (0.18 | ) | | | (0.20 | ) | | | — | |
| | Distributions to shareholders from net realized gains | | | (0.67 | ) | | | (0.40 | ) | | | — | |
| | Total distributions | | | (0.85 | ) | | | (0.60 | ) | | | — | |
| | Net asset value, end of period | | $ | 10.74 | | | $ | 10.56 | | | $ | 9.80 | |
| | Total return(b) | | | 10.10 | % | | | 14.58 | % | | | (2.00 | )% |
| | Net assets, end of period (in 000s) | | $ | 12 | | | $ | 11 | | | $ | 10 | |
| | Ratio of net expenses to average net assets(c) | | | 0.30 | % | | | 0.32 | %(d) | | | 0.34 | %(d) |
| | Ratio of total expenses to average net assets(c) | | | 1.06 | % | | | 1.63 | %(d) | | | 5.90 | %(d) |
| | Ratio of net investment income to average net assets | | | 1.81 | % | | | 1.71 | %(d) | | | 1.44 | %(d) |
| | Portfolio turnover rate(e) | | | 155 | % | | | 139 | % | | | 191 | % |
| | * | | The Portfolio changed its fiscal year end from October 31 to August 31. |
| | (a) | | Calculated based on the average shares outstanding methodology. |
| | (b) | | Assumes investment at the NAV at the beginning of the period, reinvestment of all dividends and distributions, a complete redemption of the investment at the NAV at the end of the period and no sales or redemption charges. Total returns would be reduced if a sales or redemption charge was taken into account. Returns do not reflect the impact of taxes to shareholders relating to Portfolio distributions or the redemption of Portfolio shares. Total returns for periods less than one full year are not annualized. The Goldman Sachs Target Date 2050 Portfolio’s predecessor was the Madison Target Retirement 2050 Fund (the “Predecessor Fund”). On August 22, 2016, the Predecessor Fund was reorganized as a new series of Goldman Sachs Trust II. Performance prior to August 22, 2016 is that of the Predecessor Fund. Total return information of the Predecessor Fund is included in the above table because the Predecessor Fund is considered the accounting survivor of the reorganization. |
| | (c) | | Expense ratios exclude the expenses of the Underlying Funds in which the Portfolio invests. |
| | (e) | | The Portfolio’s turnover rate is calculated in accordance with regulatory requirements, without regard to transactions involving short term investments. If such transactions were included, the Portfolio’s turnover rate may be higher. |
| | |
| 102 | | The accompanying notes are an integral part of these financial statements. |
GOLDMAN SACHS TARGET DATE 2050 PORTFOLIO
Financial Highlights (continued)
Selected Share Data for a Share Outstanding Throughout Each Period
| | | | | | | | | | | | | | |
| | | | | Goldman Sachs Target Date 2050 Portfolio | |
| | | | | Service Shares | |
| | | | | Year Ended
August 31, 2018 | | | Period
November 1, 2016 –
August 31, 2017* | | | Period Ended
October 31, 2016 | |
| | Per Share Data | | | | | | | | | | | | |
| | Net asset value, beginning of period | | $ | 10.53 | | | $ | 9.79 | | | $ | 10.00 | |
| | Net investment income(a) | | | 0.14 | | | | 0.10 | | | | 0.02 | |
| | Net realized and unrealized gain (loss) | | | 0.83 | | | | 1.22 | | | | (0.23 | ) |
| | Total from investment operations | | | 0.97 | | | | 1.32 | | | | (0.21 | ) |
| | Distributions to shareholders from net investment income | | | (0.13 | ) | | | (0.18 | ) | | | — | |
| | Distributions to shareholders from net realized gains | | | (0.67 | ) | | | (0.40 | ) | | | — | |
| | Total distributions | | | (0.80 | ) | | | (0.58 | ) | | | — | |
| | Net asset value, end of period | | $ | 10.70 | | | $ | 10.53 | | | $ | 9.79 | |
| | Total return(b) | | | 9.53 | % | | | 14.18 | % | | | (2.10 | )% |
| | Net assets, end of period (in 000s) | | $ | 12 | | | $ | 11 | | | $ | 10 | |
| | Ratio of net expenses to average net assets(c) | | | 0.80 | % | | | 0.82 | %(d) | | | 0.83 | %(d) |
| | Ratio of total expenses to average net assets(c) | | | 1.56 | % | | | 2.13 | %(d) | | | 6.40 | %(d) |
| | Ratio of net investment income to average net assets | | | 1.32 | % | | | 1.21 | %(d) | | | 0.95 | %(d) |
| | Portfolio turnover rate(e) | | | 155 | % | | | 139 | % | | | 191 | % |
| | * | | The Portfolio changed its fiscal year end from October 31 to August 31. |
| | (a) | | Calculated based on the average shares outstanding methodology. |
| | (b) | | Assumes investment at the NAV at the beginning of the period, reinvestment of all dividends and distributions, a complete redemption of the investment at the NAV at the end of the period and no sales or redemption charges. Total returns would be reduced if a sales or redemption charge was taken into account. Returns do not reflect the impact of taxes to shareholders relating to Portfolio distributions or the redemption of Portfolio shares. Total returns for periods less than one full year are not annualized. The Goldman Sachs Target Date 2050 Portfolio’s predecessor was the Madison Target Retirement 2050 Fund (the “Predecessor Fund”). On August 22, 2016, the Predecessor Fund was reorganized as a new series of Goldman Sachs Trust II. Performance prior to August 22, 2016 is that of the Predecessor Fund. Total return information of the Predecessor Fund is included in the above table because the Predecessor Fund is considered the accounting survivor of the reorganization. |
| | (c) | | Expense ratios exclude the expenses of the Underlying Funds in which the Portfolio invests. |
| | (e) | | The Portfolio’s turnover rate is calculated in accordance with regulatory requirements, without regard to transactions involving short term investments. If such transactions were included, the Portfolio’s turnover rate may be higher. |
| | |
| The accompanying notes are an integral part of these financial statements. | | 103 |
GOLDMAN SACHS TARGET DATE 2050 PORTFOLIO
Financial Highlights (continued)
Selected Share Data for a Share Outstanding Throughout Each Period
| | | | | | | | | | | | | | |
| | | | | Goldman Sachs Target Date 2050 Portfolio | |
| | | | | Investor Shares(a) | |
| | | | | Year Ended
August 31, 2018 | | | Period
November 1, 2016 –
August 31, 2017* | | | Period Ended
October 31, 2016 | |
| | Per Share Data | | | | | | | | | | | | |
| | Net asset value, beginning of period | | $ | 10.55 | | | $ | 9.80 | | | $ | 10.00 | |
| | Net investment income(b) | | | 0.18 | | | | 0.11 | | | | 0.02 | |
| | Net realized and unrealized gain (loss) | | | 0.83 | | | | 1.24 | | | | (0.22 | ) |
| | Total from investment operations | | | 1.01 | | | | 1.35 | | | | (0.20 | ) |
| | Distributions to shareholders from net investment income | | | (0.17 | ) | | | (0.20 | ) | | | — | |
| | Distributions to shareholders from net realized gains | | | (0.67 | ) | | | (0.40 | ) | | | — | |
| | Total distributions | | | (0.84 | ) | | | (0.60 | ) | | | — | |
| | Net asset value, end of period | | $ | 10.72 | | | $ | 10.55 | | | $ | 9.80 | |
| | Total return(c) | | | 9.98 | % | | | 14.42 | % | | | (2.00 | )% |
| | Net assets, end of period (in 000s) | | $ | 830 | | | $ | 156 | | | $ | 10 | |
| | Ratio of net expenses to average net assets(d) | | | 0.45 | % | | | 0.47 | %(e) | | | 0.48 | %(e) |
| | Ratio of total expenses to average net assets(d) | | | 1.21 | % | | | 1.45 | %(e) | | | 6.04 | %(e) |
| | Ratio of net investment income to average net assets | | | 1.70 | % | | | 1.31 | %(e) | | | 1.30 | %(e) |
| | Portfolio turnover rate(f) | | | 155 | % | | | 139 | % | | | 191 | % |
| | * | | The Portfolio changed its fiscal year end from October 31 to August 31. |
| | (a) | | Effective October 10, 2017, Class IR Shares changed its name to Investor Shares. |
| | (b) | | Calculated based on the average shares outstanding methodology. |
| | (c) | | Assumes investment at the NAV at the beginning of the period, reinvestment of all dividends and distributions, a complete redemption of the investment at the NAV at the end of the period and no sales or redemption charges. Total returns would be reduced if a sales or redemption charge was taken into account. Returns do not reflect the impact of taxes to shareholders relating to Portfolio distributions or the redemption of Portfolio shares. Total returns for periods less than one full year are not annualized. The Goldman Sachs Target Date 2050 Portfolio’s predecessor was the Madison Target Retirement 2050 Fund (the “Predecessor Fund”). On August 22, 2016, the Predecessor Fund was reorganized as a new series of Goldman Sachs Trust II. Performance prior to August 22, 2016 is that of the Predecessor Fund. Total return information of the Predecessor Fund is included in the above table because the Predecessor Fund is considered the accounting survivor of the reorganization. |
| | (d) | | Expense ratios exclude the expenses of the Underlying Funds in which the Portfolio invests. |
| | (f) | | The Portfolio’s turnover rate is calculated in accordance with regulatory requirements, without regard to transactions involving short term investments. If such transactions were included, the Portfolio’s turnover rate may be higher. |
| | |
| 104 | | The accompanying notes are an integral part of these financial statements. |
GOLDMAN SACHS TARGET DATE 2050 PORTFOLIO
Financial Highlights (continued)
Selected Share Data for a Share Outstanding Throughout Each Period
| | | | | | | | | | | | | | |
| | | | | Goldman Sachs Target Date 2050 Portfolio | |
| | | | | Class R Shares | |
| | | | | Year Ended
August 31, 2018 | | | Period
November 1, 2016 –
August 31, 2017* | | | Period Ended
October 31, 2016 | |
| | Per Share Data | | | | | | | | | | | | |
| | Net asset value, beginning of period | | $ | 10.52 | | | $ | 9.79 | | | $ | 10.00 | |
| | Net investment income(a) | | | 0.12 | | | | 0.09 | | | | 0.02 | |
| | Net realized and unrealized gain (loss) | | | 0.83 | | | | 1.22 | | | | (0.23 | ) |
| | Total from investment operations | | | 0.95 | | | | 1.31 | | | | (0.21 | ) |
| | Distributions to shareholders from net investment income | | | (0.11 | ) | | | (0.18 | ) | | | — | |
| | Distributions to shareholders from net realized gains | | | (0.67 | ) | | | (0.40 | ) | | | — | |
| | Total distributions | | | (0.78 | ) | | | (0.58 | ) | | | — | |
| | Net asset value, end of period | | $ | 10.69 | | | $ | 10.52 | | | $ | 9.79 | |
| | Total return(b) | | | 9.38 | % | | | 14.02 | % | | | 2.10 | % |
| | Net assets, end of period (in 000s) | | $ | 12 | | | $ | 11 | | | $ | 10 | |
| | Ratio of net expenses to average net assets(c) | | | 0.96 | % | | | 0.98 | %(d) | | | 0.98 | %(d) |
| | Ratio of total expenses to average net assets(c) | | | 1.71 | % | | | 2.29 | %(d) | | | 6.54 | %(d) |
| | Ratio of net investment income to average net assets | | | 1.16 | % | | | 1.05 | %(d) | | | 0.80 | %(d) |
| | Portfolio turnover rate(e) | | | 155 | % | | | 139 | % | | | 191 | % |
| | * | | The Portfolio changed its fiscal year end from October 31 to August 31. |
| | (a) | | Calculated based on the average shares outstanding methodology. |
| | (b) | | Assumes investment at the NAV at the beginning of the period, reinvestment of all dividends and distributions, a complete redemption of the investment at the NAV at the end of the period and no sales or redemption charges. Total returns would be reduced if a sales or redemption charge was taken into account. Returns do not reflect the impact of taxes to shareholders relating to Portfolio distributions or the redemption of Portfolio shares. Total returns for periods less than one full year are not annualized. The Goldman Sachs Target Date 2050 Portfolio’s predecessor was the Madison Target Retirement 2050 Fund (the “Predecessor Fund”). On August 22, 2016, the Predecessor Fund was reorganized as a new series of Goldman Sachs Trust II. Performance prior to August 22, 2016 is that of the Predecessor Fund. Total return information of the Predecessor Fund is included in the above table because the Predecessor Fund is considered the accounting survivor of the reorganization. |
| | (c) | | Expense ratios exclude the expenses of the Underlying Funds in which the Portfolio invests. |
| | (e) | | The Portfolio’s turnover rate is calculated in accordance with regulatory requirements, without regard to transactions involving short term investments. If such transactions were included, the Portfolio’s turnover rate may be higher. |
| | |
| The accompanying notes are an integral part of these financial statements. | | 105 |
GOLDMAN SACHS TARGET DATE 2050 PORTFOLIO
Financial Highlights (continued)
Selected Share Data for a Share Outstanding Throughout Each Period
| | | | | | | | | | | | | | | | | | | | | | |
| | | | | Goldman Sachs Target Date 2050 Portfolio | |
| | | | | Class R6 Shares | |
| | | | | Year Ended
August 31, 2018 | | | Period
November 1, 2016 –
August 31, 2017* | | | Year Ended October 31, | | | Period Ended
October 31, 2014 | |
| | | | | 2016 | | | 2015 | |
| | Per Share Data | | | | | | | | | | | | | | | | | | | | |
| | Net asset value, beginning of period | | $ | 10.56 | | | $ | 9.80 | | | $ | 9.95 | | | $ | 9.98 | | | $ | 10.00 | |
| | Net investment income(a) | | | 0.19 | | | | 0.14 | | | | 0.20 | | | | 0.15 | | | | 0.03 | |
| | Net realized and unrealized gain (loss) | | | 0.84 | | | | 1.22 | | | | 0.11 | | | | 0.13 | | | | (0.05 | ) |
| | Total from investment operations | | | 1.03 | | | | 1.36 | | | | 0.31 | | | | 0.28 | | | | (0.02 | ) |
| | Distributions to shareholders from net investment income | | | (0.18 | ) | | | (0.20 | ) | | | (0.16 | ) | | | (0.10 | ) | | | — | |
| | Distributions to shareholders from net realized gains | | | (0.67 | ) | | | (0.40 | ) | | | (0.30 | ) | | | (0.21 | ) | | | — | |
| | Total distributions | | | (0.85 | ) | | | (0.60 | ) | | | (0.46 | ) | | | (0.31 | ) | | | — | |
| | Net asset value, end of period | | $ | 10.74 | | | $ | 10.56 | | | $ | 9.80 | | | $ | 9.95 | | | $ | 9.98 | |
| | Total return(b) | | | 10.11 | % | | | 14.59 | % | | | 3.37 | % | | | 2.87 | % | | | (0.20 | )% |
| | Net assets, end of period (in 000s) | | $ | 29,481 | | | $ | 26,154 | | | $ | 21,657 | | | $ | 20,482 | | | $ | 21,266 | |
| | Ratio of net expenses to average net assets(c) | | | 0.29 | % | | | 0.30 | %(d) | | | 0.31 | % | | | 0.30 | % | | | 0.32 | %(d) |
| | Ratio of total expenses to average net assets(c) | | | 1.06 | % | | | 1.58 | %(d) | | | 1.45 | % | | | 0.30 | % | | | 0.32 | %(d) |
| | Ratio of net investment income to average net assets | | | 1.82 | % | | | 1.71 | %(d) | | | 2.07 | % | | | 1.51 | % | | | 1.72 | %(d) |
| | Portfolio turnover rate(e) | | | 155 | % | | | 139 | % | | | 191 | % | | | 204 | % | | | 52 | % |
| | * | | The Portfolio changed its fiscal year end from October 31 to August 31. |
| | (a) | | Calculated based on the average shares outstanding methodology. |
| | (b) | | Assumes investment at the NAV at the beginning of the period, reinvestment of all dividends and distributions, a complete redemption of the investment at the NAV at the end of the period and no sales or redemption charges. Total returns would be reduced if a sales or redemption charge was taken into account. Returns do not reflect the impact of taxes to shareholders relating to Portfolio distributions or the redemption of Portfolio shares. Total returns for periods less than one full year are not annualized. The Goldman Sachs Target Date 2050 Portfolio’s predecessor was the Madison Target Retirement 2050 Fund (the “Predecessor Fund”). On August 22, 2016, the Predecessor Fund was reorganized as a new series of Goldman Sachs Trust II. Performance prior to August 22, 2016 is that of the Predecessor Fund. Total return information of the Predecessor Fund is included in the above table because the Predecessor Fund is considered the accounting survivor of the reorganization. |
| | (c) | | Expense ratios exclude the expenses of the Underlying Funds in which the Portfolio invests. |
| | (e) | | The Portfolio’s turnover rate is calculated in accordance with regulatory requirements, without regard to transactions involving short term investments. If such transactions were included, the Portfolio’s turnover rate may be higher. |
| | |
| 106 | | The accompanying notes are an integral part of these financial statements. |
GOLDMAN SACHS TARGET DATE 2055 PORTFOLIO
Financial Highlights (continued)
Selected Share Data for a Share Outstanding Throughout Each Period
| | | | | | | | | | | | | | |
| | | | | Goldman Sachs Target Date 2055 Portfolio | |
| | | | | Class A Shares | |
| | | | | Year Ended
August 31, 2018 | | | Period
November 1, 2016 –
August 31, 2017* | | | Period Ended
October 31, 2016(a) | |
| | Per Share Data | | | | | | | | | | | | |
| | Net asset value, beginning of period | | $ | 11.16 | | | $ | 9.79 | | | $ | 10.00 | |
| | Net investment income(b) | | | 0.16 | | | | 0.09 | | | | 0.02 | |
| | Net realized and unrealized gain (loss) | | | 0.98 | | | | 1.36 | | | | (0.23 | ) |
| | Total from investment operations | | | 1.14 | | | | 1.45 | | | | (0.21 | ) |
| | Distributions to shareholders from net investment income | | | (0.16 | ) | | | (0.08 | ) | | | — | |
| | Distributions to shareholders from net realized gains | | | (0.28 | ) | | | — | | | | — | |
| | Total distributions | | | (0.44 | ) | | | (0.08 | ) | | | — | |
| | Net asset value, end of period | | $ | 11.86 | | | $ | 11.16 | | | $ | 9.79 | |
| | Total return(c) | | | 10.37 | % | | | 14.90 | % | | | (2.10 | )% |
| | Net assets, end of period (in 000s) | | $ | 118 | | | $ | 87 | | | $ | 10 | |
| | Ratio of net expenses to average net assets(d) | | | 0.69 | % | | | 0.71 | %(e) | | | 0.75 | %(e) |
| | Ratio of total expenses to average net assets(d) | | | 2.46 | % | | | 4.43 | %(e) | | | 4.23 | %(e) |
| | Ratio of net investment income to average net assets | | | 1.38 | % | | | 1.01 | %(e) | | | 1.02 | %(e) |
| | Portfolio turnover rate(f) | | | 177 | % | | | 182 | % | | | 34 | % |
| | * | | The Portfolio changed its fiscal year end from October 31 to August 31. |
| | (a) | | Commenced operations on August 22, 2016. |
| | (b) | | Calculated based on the average shares outstanding methodology. |
| | (c) | | Assumes investment at the NAV at the beginning of the period, reinvestment of all dividends and distributions, a complete redemption of the investment at the NAV at the end of the period and no sales or redemption charges. Total returns would be reduced if a sales or redemption charge was taken into account. Returns do not reflect the impact of taxes to shareholders relating to Portfolio distributions or the redemption of Portfolio shares. Total returns for periods less than one full year are not annualized. |
| | (d) | | Expense ratios exclude the expenses of the Underlying Funds in which the Portfolio invests. |
| | (f) | | The Portfolio’s turnover rate is calculated in accordance with regulatory requirements, without regard to transactions involving short term investments. If such transactions were included, the Portfolio’s turnover rate may be higher. |
| | |
| The accompanying notes are an integral part of these financial statements. | | 107 |
GOLDMAN SACHS TARGET DATE 2055 PORTFOLIO
Financial Highlights (continued)
Selected Share Data for a Share Outstanding Throughout Each Period
| | | | | | | | | | | | | | |
| | | | | Goldman Sachs Target Date 2055 Portfolio | |
| | | | | Institutional Shares | |
| | | | | Year Ended
August 31, 2018 | | | Period
November 1, 2016 –
August 31, 2017* | | | Period Ended
October 31, 2016(a) | |
| | Per Share Data | | | | | | | | | | | | |
| | Net asset value, beginning of period | | $ | 11.20 | | | $ | 9.80 | | | $ | 10.00 | |
| | Net investment income(b) | | | 0.21 | | | | 0.15 | | | | 0.03 | |
| | Net realized and unrealized gain (loss) | | | 0.98 | | | | 1.34 | | | | (0.23 | ) |
| | Total from investment operations | | | 1.19 | | | | 1.49 | | | | (0.20 | ) |
| | Distributions to shareholders from net investment income | | | (0.19 | ) | | | (0.09 | ) | | | — | |
| | Distributions to shareholders from net realized gains | | | (0.28 | ) | | | — | | | | — | |
| | Total distributions | | | (0.47 | ) | | | (0.09 | ) | | | — | |
| | Net asset value, end of period | | $ | 11.92 | | | $ | 11.20 | | | $ | 9.80 | |
| | Total return(c) | | | 10.82 | % | | | 15.32 | % | | | (2.00 | )% |
| | Net assets, end of period (in 000s) | | $ | 11,811 | | | $ | 11,242 | | | $ | 9,748 | |
| | Ratio of net expenses to average net assets(d) | | | 0.30 | % | | | 0.32 | %(e) | | | 0.34 | %(e) |
| | Ratio of total expenses to average net assets(d) | | | 2.05 | % | | | 3.78 | %(e) | | | 3.85 | %(e) |
| | Ratio of net investment income to average net assets | | | 1.80 | % | | | 1.70 | %(e) | | | 1.43 | %(e) |
| | Portfolio turnover rate(f) | | | 177 | % | | | 182 | % | | | 34 | % |
| | * | | The Portfolio changed its fiscal year end from October 31 to August 31. |
| | (a) | | Commenced operations on August 22, 2016. |
| | (b) | | Calculated based on the average shares outstanding methodology. |
| | (c) | | Assumes investment at the NAV at the beginning of the period, reinvestment of all dividends and distributions, a complete redemption of the investment at the NAV at the end of the period and no sales or redemption charges. Total returns would be reduced if a sales or redemption charge was taken into account. Returns do not reflect the impact of taxes to shareholders relating to Portfolio distributions or the redemption of Portfolio shares. Total returns for periods less than one full year are not annualized. |
| | (d) | | Expense ratios exclude the expenses of the Underlying Funds in which the Portfolio invests. |
| | (f) | | The Portfolio’s turnover rate is calculated in accordance with regulatory requirements, without regard to transactions involving short term investments. If such transactions were included, the Portfolio’s turnover rate may be higher. |
| | |
| 108 | | The accompanying notes are an integral part of these financial statements. |
GOLDMAN SACHS TARGET DATE 2055 PORTFOLIO
Financial Highlights (continued)
Selected Share Data for a Share Outstanding Throughout Each Period
| | | | | | | | | | | | | | |
| | | | | Goldman Sachs Target Date 2055 Portfolio | |
| | | | | Service Shares | |
| | | | | Year Ended
August 31, 2018 | | | Period
November 1, 2016 –
August 31, 2017* | | | Period Ended
October 31, 2016(a) | |
| | Per Share Data | | | | | | | | | | | | |
| | Net asset value, beginning of period | | $ | 11.16 | | | $ | 9.79 | | | $ | 10.00 | |
| | Net investment income(b) | | | 0.15 | | | | 0.11 | | | | 0.02 | |
| | Net realized and unrealized gain (loss) | | | 0.98 | | | | 1.33 | | | | (0.23 | ) |
| | Total from investment operations | | | 1.13 | | | | 1.44 | | | | (0.21 | ) |
| | Distributions to shareholders from net investment income | | | (0.14 | ) | | | (0.07 | ) | | | — | |
| | Distributions to shareholders from net realized gains | | | (0.28 | ) | | | — | | | | — | |
| | Total distributions | | | (0.42 | ) | | | (0.07 | ) | | | — | |
| | Net asset value, end of period | | $ | 11.87 | | | $ | 11.16 | | | $ | 9.79 | |
| | Total return(c) | | | 10.27 | % | | | 14.83 | % | | | (2.10 | )% |
| | Net assets, end of period (in 000s) | | $ | 12 | | | $ | 11 | | | $ | 10 | |
| | Ratio of net expenses to average net assets(d) | | | 0.79 | % | | | 0.81 | %(e) | | | 0.84 | %(e) |
| | Ratio of total expenses to average net assets(d) | | | 2.52 | % | | | 4.26 | %(e) | | | 4.33 | %(e) |
| | Ratio of net investment income to average net assets | | | 1.31 | % | | | 1.20 | %(e) | | | 0.92 | %(e) |
| | Portfolio turnover rate(f) | | | 177 | % | | | 182 | % | | | 34 | % |
| | * | | The Portfolio changed its fiscal year end from October 31 to August 31. |
| | (a) | | Commenced operations on August 22, 2016. |
| | (b) | | Calculated based on the average shares outstanding methodology. |
| | (c) | | Assumes investment at the NAV at the beginning of the period, reinvestment of all dividends and distributions, a complete redemption of the investment at the NAV at the end of the period and no sales or redemption charges. Total returns would be reduced if a sales or redemption charge was taken into account. Returns do not reflect the impact of taxes to shareholders relating to Portfolio distributions or the redemption of Portfolio shares. Total returns for periods less than one full year are not annualized. |
| | (d) | | Expense ratios exclude the expenses of the Underlying Funds in which the Portfolio invests. |
| | (f) | | The Portfolio’s turnover rate is calculated in accordance with regulatory requirements, without regard to transactions involving short term investments. If such transactions were included, the Portfolio’s turnover rate may be higher. |
| | |
| The accompanying notes are an integral part of these financial statements. | | 109 |
GOLDMAN SACHS TARGET DATE 2055 PORTFOLIO
Financial Highlights (continued)
Selected Share Data for a Share Outstanding Throughout Each Period
| | | | | | | | | | | | | | |
| | | | | Goldman Sachs Target Date 2055 Portfolio | |
| | | | | Investor Shares(a) | |
| | | | | Year Ended
August 31, 2018 | | | Period
November 1, 2016 –
August 31, 2017* | | | Period Ended
October 31, 2016(b) | |
| | Per Share Data | | | | | | | | | | | | |
| | Net asset value, beginning of period | | $ | 11.19 | | | $ | 9.79 | | | $ | 10.00 | |
| | Net investment income(c) | | | 0.19 | | | | 0.07 | | | | 0.02 | |
| | Net realized and unrealized gain (loss) | | | 0.98 | | | | 1.42 | | | | (0.23 | ) |
| | Total from investment operations | | | 1.17 | | | | 1.49 | | | | (0.21 | ) |
| | Distributions to shareholders from net investment income | | | (0.19 | ) | | | (0.09 | ) | | | — | |
| | Distributions to shareholders from net realized gains | | | (0.28 | ) | | | — | | | | — | |
| | Total distributions | | | (0.47 | ) | | | (0.09 | ) | | | — | |
| | Net asset value, end of period | | $ | 11.89 | | | $ | 11.19 | | | $ | 9.79 | |
| | Total return(d) | | | 10.62 | % | | | 15.16 | % | | | (2.00 | )% |
| | Net assets, end of period (in 000s) | | $ | 509 | | | $ | 101 | | | $ | 10 | |
| | Ratio of net expenses to average net assets(e) | | | 0.44 | % | | | 0.46 | %(f) | | | 0.49 | %(f) |
| | Ratio of total expenses to average net assets(e) | | | 2.19 | % | | | 6.85 | %(f) | | | 3.97 | %(f) |
| | Ratio of net investment income to average net assets | | | 1.64 | % | | | 0.77 | %(f) | | | 1.28 | %(f) |
| | Portfolio turnover rate(g) | | | 177 | % | | | 182 | % | | | 34 | % |
| | * | | The Portfolio changed its fiscal year end from October 31 to August 31. |
| | (a) | | Effective October 10, 2017, Class IR Shares changed its name to Investor Shares. |
| | (b) | | Commenced operations on August 22, 2016. |
| | (c) | | Calculated based on the average shares outstanding methodology. |
| | (d) | | Assumes investment at the NAV at the beginning of the period, reinvestment of all dividends and distributions, a complete redemption of the investment at the NAV at the end of the period and no sales or redemption charges. Total returns would be reduced if a sales or redemption charge was taken into account. Returns do not reflect the impact of taxes to shareholders relating to Portfolio distributions or the redemption of Portfolio shares. Total returns for periods less than one full year are not annualized. |
| | (e) | | Expense ratios exclude the expenses of the Underlying Funds in which the Portfolio invests. |
| | (g) | | The Portfolio’s turnover rate is calculated in accordance with regulatory requirements, without regard to transactions involving short term investments. If such transactions were included, the Portfolio’s turnover rate may be higher. |
| | |
| 110 | | The accompanying notes are an integral part of these financial statements. |
GOLDMAN SACHS TARGET DATE 2055 PORTFOLIO
Financial Highlights (continued)
Selected Share Data for a Share Outstanding Throughout Each Period
| | | | | | | | | | | | | | |
| | | | | Goldman Sachs Target Date 2055 Portfolio | |
| | | | | Class R Shares | |
| | | | | Year Ended
August 31, 2018 | | | Period
November 1, 2016 –
August 31, 2017* | | | Period Ended
October 31, 2016(a) | |
| | Per Share Data | | | | | | | | | | | | |
| | Net asset value, beginning of period | | $ | 11.15 | | | $ | 9.79 | | | $ | 10.00 | |
| | Net investment income(b) | | | 0.12 | | | | 0.09 | | | | 0.01 | |
| | Net realized and unrealized gain (loss) | | | 0.98 | | | | 1.34 | | | | (0.22 | ) |
| | Total from investment operations | | | 1.10 | | | | 1.43 | | | | (0.21 | ) |
| | Distributions to shareholders from net investment income | | | (0.15 | ) | | | (0.07 | ) | | | — | |
| | Distributions to shareholders from net realized gains | | | (0.28 | ) | | | — | | | | — | |
| | Total distributions | | | (0.43 | ) | | | (0.07 | ) | | | — | |
| | Net asset value, end of period | | $ | 11.82 | | | $ | 11.15 | | | $ | 9.79 | |
| | Total return(c) | | | 10.09 | % | | | 14.66 | % | | | (2.10 | )% |
| | Net assets, end of period (in 000s) | | $ | 38 | | | $ | 11 | | | $ | 10 | |
| | Ratio of net expenses to average net assets(d) | | | 0.94 | % | | | 0.97 | %(e) | | | 0.99 | %(e) |
| | Ratio of total expenses to average net assets(d) | | | 2.67 | % | | | 4.42 | %(e) | | | 4.48 | %(e) |
| | Ratio of net investment income to average net assets | | | 1.06 | % | | | 1.05 | %(e) | | | 0.77 | %(e) |
| | Portfolio turnover rate(f) | | | 177 | % | | | 182 | % | | | 34 | % |
| | * | | The Portfolio changed its fiscal year end from October 31 to August 31. |
| | (a) | | Commenced operations on August 22, 2016. |
| | (b) | | Calculated based on the average shares outstanding methodology. |
| | (c) | | Assumes investment at the NAV at the beginning of the period, reinvestment of all dividends and distributions, a complete redemption of the investment at the NAV at the end of the period and no sales or redemption charges. Total returns would be reduced if a sales or redemption charge was taken into account. Returns do not reflect the impact of taxes to shareholders relating to Portfolio distributions or the redemption of Portfolio shares. Total returns for periods less than one full year are not annualized. |
| | (d) | | Expense ratios exclude the expenses of the Underlying Funds in which the Portfolio invests. |
| | (f) | | The Portfolio’s turnover rate is calculated in accordance with regulatory requirements, without regard to transactions involving short term investments. If such transactions were included, the Portfolio’s turnover rate may be higher. |
| | |
| The accompanying notes are an integral part of these financial statements. | | 111 |
GOLDMAN SACHS TARGET DATE 2055 PORTFOLIO
Financial Highlights (continued)
Selected Share Data for a Share Outstanding Throughout Each Period
| | | | | | | | | | | | | | |
| | | | | Goldman Sachs Target Date 2055 Portfolio | |
| | | | | Class R6 Shares | |
| | | | | Year Ended
August 31, 2018 | | | Period
November 1, 2016 –
August 31, 2017* | | | Period Ended
October 31, 2016(a) | |
| | Per Share Data | | | | | | | | | | | | |
| | Net asset value, beginning of period | | $ | 11.20 | | | $ | 9.80 | | | $ | 10.00 | |
| | Net investment income(b) | | | 0.20 | | | | 0.15 | | | | 0.03 | |
| | Net realized and unrealized gain (loss) | | | 0.99 | | | | 1.34 | | | | (0.23 | ) |
| | Total from investment operations | | | 1.19 | | | | 1.49 | | | | (0.20 | ) |
| | Distributions to shareholders from net investment income | | | (0.19 | ) | | | (0.09 | ) | | | — | |
| | Distributions to shareholders from net realized gains | | | (0.28 | ) | | | — | | | | — | |
| | Total distributions | | | (0.47 | ) | | | (0.09 | ) | | | — | |
| | Net asset value, end of period | | $ | 11.92 | | | $ | 11.20 | | | $ | 9.80 | |
| | Total return(c) | | | 10.85 | % | | | 15.32 | % | | | (2.00 | )% |
| | Net assets, end of period (in 000s) | | $ | 161 | | | $ | 27 | | | $ | 10 | |
| | Ratio of net expenses to average net assets(d) | | | 0.28 | % | | | 0.29 | %(e) | | | 0.32 | %(e) |
| | Ratio of total expenses to average net assets(d) | | | 2.01 | % | | | 3.99 | %(e) | | | 3.92 | %(e) |
| | Ratio of net investment income to average net assets | | | 1.76 | % | | | 1.68 | %(e) | | | 1.45 | %(e) |
| | Portfolio turnover rate(f) | | | 177 | % | | | 182 | % | | | 34 | % |
| | * | | The Portfolio changed its fiscal year end from October 31 to August 31. |
| | (a) | | Commenced operations on August 22, 2016. |
| | (b) | | Calculated based on the average shares outstanding methodology. |
| | (c) | | Assumes investment at the NAV at the beginning of the period, reinvestment of all dividends and distributions, a complete redemption of the investment at the NAV at the end of the period and no sales or redemption charges. Total returns would be reduced if a sales or redemption charge was taken into account. Returns do not reflect the impact of taxes to shareholders relating to Portfolio distributions or the redemption of Portfolio shares. Total returns for periods less than one full year are not annualized. |
| | (d) | | Expense ratios exclude the expenses of the Underlying Funds in which the Portfolio invests. |
| | (f) | | The Portfolio’s turnover rate is calculated in accordance with regulatory requirements, without regard to transactions involving short term investments. If such transactions were included, the Portfolio’s turnover rate may be higher. |
| | |
| 112 | | The accompanying notes are an integral part of these financial statements. |
GOLDMAN SACHS TARGET DATE 2060 PORTFOLIO
Financial Highlights (continued)
Selected Share Data for a Share Outstanding Throughout the Period
| | | | | | |
| | | | | Goldman Sachs
Target Date 2060
Portfolio | |
| | | | | Class A Shares | |
| | | | | Period Ended
August 31, 2018(a) | |
| | Per Share Data | | | | |
| | Net asset value, beginning of period | | $ | 10.00 | |
| | Net investment income(b) | | | 0.05 | |
| | Net realized and unrealized gain | | | 0.40 | |
| | Total from investment operations | | | 0.45 | |
| | Net asset value, end of period | | $ | 10.45 | |
| | Total return(c) | | | 4.50 | % |
| | Net assets, end of period (in 000s) | | $ | 10 | |
| | Ratio of net expenses to average net assets(d) | | | 0.69 | %(e) |
| | Ratio of total expenses to average net assets(d) | | | 8.72 | %(e) |
| | Ratio of net investment income to average net assets | | | 1.44 | %(e) |
| | Portfolio turnover rate(f) | | | 56 | % |
| | (a) | | Commenced operations on April 30, 2018. |
| | (b) | | Calculated based on the average shares outstanding methodology. |
| | (c) | | Assumes investment at the NAV at the beginning of the period, reinvestment of all dividends and distributions, a complete redemption of the investment at the NAV at the end of the period and no sales or redemption charges. Total returns would be reduced if a sales or redemption charge was taken into account. Returns do not reflect the impact of taxes to shareholders relating to Portfolio distributions or the redemption of Portfolio shares. Total returns for periods less than one full year are not annualized. |
| | (d) | | Expense ratios exclude the expenses of the Underlying Funds in which the Portfolio invests. |
| | (f) | | The Portfolio’s turnover rate is calculated in accordance with regulatory requirements, without regard to transactions involving short term investments. If such transactions were included, the Portfolio’s turnover rate may be higher. |
| | |
| The accompanying notes are an integral part of these financial statements. | | 113 |
GOLDMAN SACHS TARGET DATE 2060 PORTFOLIO
Financial Highlights (continued)
Selected Share Data for a Share Outstanding Throughout the Period
| | | | | | |
| | | | | Goldman Sachs
Target Date 2060
Portfolio | |
| | | | | Institutional Shares | |
| | | | | Period Ended
August 31, 2018(a) | |
| | Per Share Data | | | | |
| | Net asset value, beginning of period | | $ | 10.00 | |
| | Net investment income(b) | | | 0.06 | |
| | Net realized and unrealized gain | | | 0.40 | |
| | Total from investment operations | | | 0.46 | |
| | Net asset value, end of period | | $ | 10.46 | |
| | Total return(c) | | | 4.60 | % |
| | Net assets, end of period (in 000s) | | $ | 10 | |
| | Ratio of net expenses to average net assets(d) | | | 0.30 | %(e) |
| | Ratio of total expenses to average net assets(d) | | | 8.34 | %(e) |
| | Ratio of net investment income to average net assets | | | 1.84 | %(e) |
| | Portfolio turnover rate(f) | | | 56 | % |
| | (a) | | Commenced operations on April 30, 2018. |
| | (b) | | Calculated based on the average shares outstanding methodology. |
| | (c) | | Assumes investment at the NAV at the beginning of the period, reinvestment of all dividends and distributions, a complete redemption of the investment at the NAV at the end of the period and no sales or redemption charges. Total returns would be reduced if a sales or redemption charge was taken into account. Returns do not reflect the impact of taxes to shareholders relating to Portfolio distributions or the redemption of Portfolio shares. Total returns for periods less than one full year are not annualized. |
| | (d) | | Expense ratios exclude the expenses of the Underlying Funds in which the Portfolio invests. |
| | (f) | | The Portfolio’s turnover rate is calculated in accordance with regulatory requirements, without regard to transactions involving short term investments. If such transactions were included, the Portfolio’s turnover rate may be higher. |
| | |
| 114 | | The accompanying notes are an integral part of these financial statements. |
GOLDMAN SACHS TARGET DATE 2060 PORTFOLIO
Financial Highlights (continued)
Selected Share Data for a Share Outstanding Throughout the Period
| | | | | | |
| | | | | Goldman Sachs
Target Date 2060
Portfolio | |
| | | | | Service Shares | |
| | | | | Period Ended
August 31, 2018(a) | |
| | Per Share Data | | | | |
| | Net asset value, beginning of period | | $ | 10.00 | |
| | Net investment income(b) | | | 0.05 | |
| | Net realized and unrealized gain | | | 0.39 | |
| | Total from investment operations | | | 0.44 | |
| | Net asset value, end of period | | $ | 10.44 | |
| | Total return(c) | | | 4.40 | % |
| | Net assets, end of period (in 000s) | | $ | 10 | |
| | Ratio of net expenses to average net assets(d) | | | 0.80 | %(e) |
| | Ratio of total expenses to average net assets(d) | | | 8.82 | %(e) |
| | Ratio of net investment income to average net assets | | | 1.34 | %(e) |
| | Portfolio turnover rate(f) | | | 56 | % |
| | (a) | | Commenced operations on April 30, 2018. |
| | (b) | | Calculated based on the average shares outstanding methodology. |
| | (c) | | Assumes investment at the NAV at the beginning of the period, reinvestment of all dividends and distributions, a complete redemption of the investment at the NAV at the end of the period and no sales or redemption charges. Total returns would be reduced if a sales or redemption charge was taken into account. Returns do not reflect the impact of taxes to shareholders relating to Portfolio distributions or the redemption of Portfolio shares. Total returns for periods less than one full year are not annualized. |
| | (d) | | Expense ratios exclude the expenses of the Underlying Funds in which the Portfolio invests. |
| | (f) | | The Portfolio’s turnover rate is calculated in accordance with regulatory requirements, without regard to transactions involving short term investments. If such transactions were included, the Portfolio’s turnover rate may be higher. |
| | |
| The accompanying notes are an integral part of these financial statements. | | 115 |
GOLDMAN SACHS TARGET DATE 2060 PORTFOLIO
Financial Highlights (continued)
Selected Share Data for a Share Outstanding Throughout the Period
| | | | | | |
| | | | | Goldman Sachs
Target Date 2060
Portfolio | |
| | | | | Investor Shares | |
| | | | | Period Ended
August 31, 2018(a) | |
| | Per Share Data | | | | |
| | Net asset value, beginning of period | | $ | 10.00 | |
| | Net investment income(b) | | | 0.06 | |
| | Net realized and unrealized gain | | | 0.40 | |
| | Total from investment operations | | | 0.46 | |
| | Net asset value, end of period | | $ | 10.46 | |
| | Total return(c) | | | 4.60 | % |
| | Net assets, end of period (in 000s) | | $ | 10 | |
| | Ratio of net expenses to average net assets(d) | | | 0.44 | %(e) |
| | Ratio of total expenses to average net assets(d) | | | 8.48 | %(e) |
| | Ratio of net investment income to average net assets | | | 1.69 | %(e) |
| | Portfolio turnover rate(f) | | | 56 | % |
| | (a) | | Commenced operations on April 30, 2018. |
| | (b) | | Calculated based on the average shares outstanding methodology. |
| | (c) | | Assumes investment at the NAV at the beginning of the period, reinvestment of all dividends and distributions, a complete redemption of the investment at the NAV at the end of the period and no sales or redemption charges. Total returns would be reduced if a sales or redemption charge was taken into account. Returns do not reflect the impact of taxes to shareholders relating to Portfolio distributions or the redemption of Portfolio shares. Total returns for periods less than one full year are not annualized. |
| | (d) | | Expense ratios exclude the expenses of the Underlying Funds in which the Portfolio invests. |
| | (f) | | The Portfolio’s turnover rate is calculated in accordance with regulatory requirements, without regard to transactions involving short term investments. If such transactions were included, the Portfolio’s turnover rate may be higher. |
| | |
| 116 | | The accompanying notes are an integral part of these financial statements. |
GOLDMAN SACHS TARGET DATE 2060 PORTFOLIO
Financial Highlights (continued)
Selected Share Data for a Share Outstanding Throughout the Period
| | | | | | |
| | | | | Goldman Sachs
Target Date 2060
Portfolio | |
| | | | | Class R Shares | |
| | | | | Period Ended
August 31, 2018(a) | |
| | Per Share Data | | | | |
| | Net asset value, beginning of period | | $ | 10.00 | |
| | Net investment income(b) | | | 0.04 | |
| | Net realized and unrealized gain | | | 0.40 | |
| | Total from investment operations | | | 0.44 | |
| | Net asset value, end of period | | $ | 10.44 | |
| | Total return(c) | | | 4.40 | % |
| | Net assets, end of period (in 000s) | | $ | 10 | |
| | Ratio of net expenses to average net assets(d) | | | 0.94 | %(e) |
| | Ratio of total expenses to average net assets(d) | | | 8.96 | %(e) |
| | Ratio of net investment income to average net assets | | | 1.19 | %(e) |
| | Portfolio turnover rate(f) | | | 56 | % |
| | (a) | | Commenced operations on April 30, 2018. |
| | (b) | | Calculated based on the average shares outstanding methodology. |
| | (c) | | Assumes investment at the NAV at the beginning of the period, reinvestment of all dividends and distributions, a complete redemption of the investment at the NAV at the end of the period and no sales or redemption charges. Total returns would be reduced if a sales or redemption charge was taken into account. Returns do not reflect the impact of taxes to shareholders relating to Portfolio distributions or the redemption of Portfolio shares. Total returns for periods less than one full year are not annualized. |
| | (d) | | Expense ratios exclude the expenses of the Underlying Funds in which the Portfolio invests. |
| | (f) | | The Portfolio’s turnover rate is calculated in accordance with regulatory requirements, without regard to transactions involving short term investments. If such transactions were included, the Portfolio’s turnover rate may be higher. |
| | |
| The accompanying notes are an integral part of these financial statements. | | 117 |
GOLDMAN SACHS TARGET DATE 2060 PORTFOLIO
Financial Highlights (continued)
Selected Share Data for a Share Outstanding Throughout the Period
| | | | | | |
| | | | | Goldman Sachs
Target Date 2060
Portfolio | |
| | | | | Class R6 Shares | |
| | | | | Period Ended
August 31, 2018(a) | |
| | Per Share Data | | | | |
| | Net asset value, beginning of period | | $ | 10.00 | |
| | Net investment income(b) | | | 0.06 | |
| | Net realized and unrealized gain | | | 0.40 | |
| | Total from investment operations | | | 0.46 | |
| | Net asset value, end of period | | $ | 10.46 | |
| | Total return(c) | | | 4.60 | % |
| | Net assets, end of period (in 000s) | | $ | 5,178 | |
| | Ratio of net expenses to average net assets(d) | | | 0.28 | %(e) |
| | Ratio of total expenses to average net assets(d) | | | 8.33 | %(e) |
| | Ratio of net investment income to average net assets | | | 1.86 | %(e) |
| | Portfolio turnover rate(f) | | | 56 | % |
| | (a) | | Commenced operations on April 30, 2018. |
| | (b) | | Calculated based on the average shares outstanding methodology. |
| | (c) | | Assumes investment at the NAV at the beginning of the period, reinvestment of all dividends and distributions, a complete redemption of the investment at the NAV at the end of the period and no sales or redemption charges. Total returns would be reduced if a sales or redemption charge was taken into account. Returns do not reflect the impact of taxes to shareholders relating to Portfolio distributions or the redemption of Portfolio shares. Total returns for periods less than one full year are not annualized. |
| | (d) | | Expense ratios exclude the expenses of the Underlying Funds in which the Portfolio invests. |
| | (f) | | The Portfolio’s turnover rate is calculated in accordance with regulatory requirements, without regard to transactions involving short term investments. If such transactions were included, the Portfolio’s turnover rate may be higher. |
| | |
| 118 | | The accompanying notes are an integral part of these financial statements. |
GOLDMAN SACHS TARGET DATE PORTFOLIOS
Notes to Financial Statements
August 31, 2018
Goldman Sachs Trust II (the “Trust”) is a Delaware statutory trust registered under the Investment Company Act of 1940, as amended (the “Act”), as an open-end management investment company. The following table lists those series of the Trust that are included in this report (collectively, the “Portfolios” or individually a “Portfolio”), along with their corresponding share classes and respective diversification status under the Act:
| | | | |
| Portfolio | | Share Classes Offered | | Diversified/
Non-diversified |
All Portfolios | | A, Institutional, Service, Investor*, R, R6 | | Diversified |
| * | | Effective October 10, 2017, Class IR Shares changed its name to Investor Shares. |
Class A Shares are sold with a front-end sales charge of up to 5.50%. Institutional, Service, Investor, Class R and Class R6 Shares are not subject to a sales charge.
Goldman Sachs Asset Management, L.P. (“GSAM”), an affiliate of Goldman Sachs & Co. LLC (“Goldman Sachs”), serves as investment adviser to the Portfolios pursuant to a management agreement (the “Agreement”) with the Trust. Madison Asset Management, LLC, (the “Sub-Adviser”) serves as the subadviser to the Portfolios.
GSAM compensates the Sub-Adviser directly in accordance with the terms of the Sub-Advisory Agreement. The Portfolios are not charged any separate or additional investment advisory fees by the Sub-Adviser.
The Portfolios are expected to invest in shares of exchange-traded funds and other registered investment companies according to an asset allocation strategy developed by the Sub-Adviser for investors planning to retire within a few years of each Portfolio’s respective target date.
|
| 2. SIGNIFICANT ACCOUNTING POLICIES |
The financial statements have been prepared in accordance with accounting principles generally accepted in the United States of America (“GAAP”) and require management to make estimates and assumptions that may affect the reported amounts and disclosures. Actual results may differ from those estimates and assumptions.
A. Investment Valuation — The Portfolios’ valuation policy is to value investments at fair value.
B. Investment Income and Investments — Investment income includes interest income, dividend income, and securities lending income, if any. Interest income is accrued daily and adjusted for amortization of premiums and accretion of discounts. Dividend income is recognized on ex-dividend date or, for certain foreign securities, as soon as such information is obtained subsequent to the ex-dividend date. Investment transactions are reflected on trade date. Realized gains and losses are calculated using identified cost. Investment transactions are recorded on the following business day for daily net asset value (“NAV”) calculations. Investment income is recorded net of any foreign withholding taxes, less any amounts reclaimable. The Portfolios may file withholding tax reclaims in certain jurisdictions to recover a portion of amounts previously withheld. Any foreign capital gains tax is accrued daily based upon net unrealized gains, and is payable upon sale of such investments. Income distributions are recognized as capital gains or income in the financial statements in accordance with the character that is distributed.
C. Class Allocations and Expenses — Investment income, realized and unrealized gain (loss), if any, and non-class specific expenses of each Portfolio are allocated daily based upon the proportion of net assets of each class. Non-class specific expenses directly incurred by a Portfolio are charged to that Portfolio, while such expenses incurred by the Trust are allocated across the applicable Portfolios on a straight-line and/or pro-rata basis depending upon the nature of the expenses. Class specific expenses, where applicable, are borne by the respective share classes and include Distribution and Service, Transfer Agency and Service and Shareholder Administration fees.
Expenses included in the accompanying financial statements reflect the expenses of each Portfolio and do not include any expenses associated with the Underlying Funds (“Underlying Funds”). Because the Underlying Funds have varied expense and fee levels and the Portfolios may own different proportions of the Underlying Funds at different times, the amount of fees and expenses incurred indirectly by each Portfolio will vary.
119
GOLDMAN SACHS TARGET DATE PORTFOLIOS
Notes to Financial Statements (continued)
August 31, 2018
|
| 2. SIGNIFICANT ACCOUNTING POLICIES (continued) |
D. Offering and Organization Costs — Offering costs paid in connection with the initial offering of shares of Target Date 2060 are being amortized on a straight-line basis over 12 months from the date of commencement of operations. Organization costs paid in connection with the organization of Target Date 2060 were expensed on the first day of operations.
E. Federal Taxes and Distributions to Shareholders — It is each Portfolio’s policy to comply with the requirements of the Internal Revenue Code of 1986, as amended (the “Code”), applicable to regulated investment companies and to distribute each year substantially all of its investment company taxable income and capital gains to its shareholders. Accordingly, each Portfolio is not required to make any provisions for the payment of federal income tax. Distributions to shareholders are recorded on the ex-dividend date. Income and capital gains distributions, if any, are declared and paid annually.
Net capital losses, if any, are carried forward to future fiscal years and may be used to the extent allowed by the Code to offset any future capital gains. Losses that are carried forward will retain their character as either short-term or long-term capital losses. Utilization of capital loss carryforwards will reduce the requirement of future capital gains distributions.
The characterization of distributions to shareholders for financial reporting purposes is determined in accordance with federal income tax rules, which may differ from GAAP. The source of each Portfolio’s distributions may be shown in the accompanying financial statements as either from net investment income, net realized gain or capital. Certain components of the Portfolios’ net assets on the Statements of Assets and Liabilities reflect permanent GAAP/tax differences based on the appropriate tax character.
| | |
| 3. INVESTMENTS AND FAIR VALUE MEASUREMENTS | | |
U.S. GAAP defines the fair value of a financial instrument as the amount that would be received to sell an asset or paid to transfer a liability in an orderly transaction between market participants at the measurement date (i.e., the exit price); the Portfolios’ policy is to use the market approach. GAAP establishes a fair value hierarchy that prioritizes the inputs to valuation techniques used to measure fair value. The hierarchy gives the highest priority to unadjusted quoted prices in active markets for identical assets or liabilities (Level 1 measurements) and the lowest priority to unobservable inputs (Level 3 measurements). The levels used for classifying investments are not necessarily an indication of the risk associated with investing in these investments. The three levels of the fair value hierarchy are described below:
Level 1 — Unadjusted quoted prices in active markets that are accessible at the measurement date for identical, unrestricted assets or liabilities;
Level 2 — Quoted prices in markets that are not active or financial instruments for which significant inputs are observable (including, but not limited to, quoted prices for similar investments, interest rates, foreign exchange rates, volatility and credit spreads), either directly or indirectly;
Level 3 — Prices or valuations that require significant unobservable inputs (including GSAM’s assumptions in determining fair value measurement).
Changes in valuation techniques may result in transfers into or out of an assigned level within the hierarchy. In accordance with the Portfolios’ policy, transfers between different levels of the fair value hierarchy resulting from such changes are deemed to have occurred as of the beginning of the reporting period.
The Board of Trustees (“Trustees”) has approved Valuation Procedures that govern the valuation of the portfolio investments held by the Portfolios, including investments for which market quotations are not readily available. The Trustees have delegated to GSAM day-to-day responsibility for implementing and maintaining internal controls and procedures related to the valuation of the Portfolios’ investments. To assess the continuing appropriateness of pricing sources and methodologies, GSAM regularly performs price verification procedures and issues challenges as necessary to third party pricing vendors or brokers, and any differences are reviewed in accordance with the Valuation Procedures.
120
GOLDMAN SACHS TARGET DATE PORTFOLIOS
|
| 3. INVESTMENTS AND FAIR VALUE MEASUREMENTS (continued) |
A. Level 1 and Level 2 Fair Value Investments — The valuation techniques and significant inputs used in determining the fair values for investments classified as Level 1 and Level 2 are as follows:
Underlying Funds — Underlying Funds include other investment companies and exchange-traded funds (“ETFs”). Investments in the Underlying Funds (except ETFs) are valued at the NAV per share of the Institutional Share class on the day of valuation. ETFs are valued daily at the last sale price or official closing price on the principal exchange or system on which the investment is traded. Because the Portfolios invest in Underlying Funds that fluctuate in value, the Portfolios’ shares will correspondingly fluctuate in value. To the extent these investments are actively traded, they are classified as Level 1 of the fair value hierarchy, otherwise they are generally classified as Level 2. For information regarding an Underlying Fund’s accounting policies and investment holdings, please see the Underlying Fund’s shareholder report.
B. Level 3 Fair Value Investments — To the extent that significant inputs to valuation models and other alternative pricing sources are unobservable, or if quotations are not readily available, or if GSAM believes that such quotations do not accurately reflect fair value, the fair value of a Portfolio’s investments may be determined under Valuation Procedures approved by the Trustees. GSAM, consistent with its procedures and applicable regulatory guidance, may make an adjustment to the most recent valuation prices of either domestic or foreign securities in light of significant events to reflect what it believes to be the fair value of the securities at the time of determining a Portfolio’s NAV. Significant events which could affect a large number of securities in a particular market may include, but are not limited to: significant fluctuations in U.S. or foreign markets; market dislocations; market disruptions; or unscheduled market closings. Significant events which could also affect a single issuer may include, but are not limited to: corporate actions such as reorganizations, mergers and buy-outs; ratings downgrades; and bankruptcies.
C. Fair Value Hierarchy — The following is a summary of the Portfolios’ investments classified in the fair value hierarchy as of August 31, 2018:
| | | | | | | | | | | | |
|
| TARGET DATE 2020 PORTFOLIO | |
| | | |
| Investment Type | | Level 1 | | | Level 2 | | | Level 3 | |
| Assets | | | | | | | | | | | | |
Exchange Traded Funds | | $ | 44,927,728 | | | $ | — | | | $ | — | |
Investment Company | | | 229,794 | | | | — | | | | — | |
| Total | | $ | 45,157,522 | | | $ | — | | | $ | — | |
|
| TARGET DATE 2025 PORTFOLIO | |
| | | |
| Investment Type | | Level 1 | | | Level 2 | | | Level 3 | |
| Assets | | | | | | | | | | | | |
Exchange Traded Funds | | $ | 11,169,295 | | | $ | — | | | $ | — | |
Investment Company | | | 56,506 | | | | — | | | | — | |
| Total | | $ | 11,225,801 | | | $ | — | | | $ | — | |
| | | |
| TARGET DATE 2030 PORTFOLIO | | | | | | | | | | | | |
| | | |
| Investment Type | | Level 1 | | | Level 2 | | | Level 3 | |
| Assets | | | | | | | | | | | | |
Exchange Traded Funds | | $ | 75,128,265 | | | $ | — | | | $ | — | |
Investment Company | | | 385,903 | | | | — | | | | — | |
| Total | | $ | 75,514,168 | | | $ | — | | | $ | — | |
121
GOLDMAN SACHS TARGET DATE PORTFOLIOS
Notes to Financial Statements (continued)
August 31, 2018
|
| 3. INVESTMENTS AND FAIR VALUE MEASUREMENTS (continued) |
| | | | | | | | | | | | |
|
| TARGET DATE 2035 PORTFOLIO | |
| | | |
| Investment Type | | Level 1 | | | Level 2 | | | Level 3 | |
| Assets | | | | | | | | | | | | |
Exchange Traded Funds | | $ | 12,216,115 | | | $ | — | | | $ | — | |
Investment Company | | | 56,895 | | | | — | | | | — | |
| Total | | $ | 12,273,010 | | | $ | — | | | $ | — | |
|
| TARGET DATE 2040 PORTFOLIO | |
| | | |
| Investment Type | | Level 1 | | | Level 2 | | | Level 3 | |
| Assets | | | | | | | | | | | | |
Exchange Traded Funds | | $ | 49,113,012 | | | $ | — | | | $ | — | |
Investment Company | | | 290,705 | | | | — | | | | — | |
| Total | | $ | 49,403,717 | | | $ | — | | | $ | — | |
|
| TARGET DATE 2045 PORTFOLIO | |
| | | |
| Investment Type | | Level 1 | | | Level 2 | | | Level 3 | |
| Assets | | | | | | | | | | | | |
Exchange Traded Funds | | $ | 12,229,749 | | | $ | — | | | $ | — | |
Investment Company | | | 54,070 | | | | — | | | | — | |
| Total | | $ | 12,283,819 | | | $ | — | | | $ | — | |
|
| TARGET DATE 2050 PORTFOLIO | |
| | | |
| Investment Type | | Level 1 | | | Level 2 | | | Level 3 | |
| Assets | | | | | | | | | | | | |
Exchange Traded Funds | | $ | 29,904,220 | | | $ | — | | | $ | — | |
Investment Company | | | 139,647 | | | | — | | | | — | |
| Total | | $ | 30,043,867 | | | $ | — | | | $ | — | |
|
| TARGET DATE 2055 PORTFOLIO | |
| | | |
| Investment Type | | Level 1 | | | Level 2 | | | Level 3 | |
| Assets | | | | | | | | | | | | |
Exchange Traded Funds | | $ | 12,374,718 | | | $ | — | | | $ | — | |
Investment Company | | | 61,121 | | | | — | | | | — | |
| Total | | $ | 12,435,839 | | | $ | — | | | $ | — | |
|
| TARGET DATE 2060 PORTFOLIO | |
| | | |
| Investment Type | | Level 1 | | | Level 2 | | | Level 3 | |
| Assets | | | | | | | | | | | | |
Exchange Traded Funds | | $ | 5,016,002 | | | $ | — | | | $ | — | |
Investment Company | | | 20,736 | | | | — | | | | — | |
| Total | | $ | 5,036,738 | | | $ | — | | | $ | — | |
For further information regarding security characteristics, see the Schedules of Investments.
122
GOLDMAN SACHS TARGET DATE PORTFOLIOS
|
| 4. AGREEMENTS AND AFFILIATED TRANSACTIONS |
A. Management Agreement — Under the Agreement, GSAM manages the Portfolios, subject to the general supervision of the Trustees.
As compensation for the services rendered pursuant to the Agreement, the assumption of the expenses related thereto and administration of the Portfolios’ business affairs, including providing facilities, GSAM is entitled to a management fee, accrued daily and paid monthly, equal to an annual percentage rate of each Portfolio’s average daily net assets.
For the fiscal year ended August 31, 2018, contractual and effective net management fees with GSAM for Target Date 2020, Target Date 2025, Target Date 2030, Target Date 2035, Target Date 2040, Target Date 2045, Target Date 2050, Target Date 2055 and Target Date 2060 were at the following rates:
| | | | | | | | | | | | | | |
| Contractual Management Rate | | | Contractual Management Fee Annual Rate* | |
First $2 billion | | | Next $3 billion | | | Over $5 billion | |
| | 0.25% | | | | 0.23% | | | | 0.21% | | | | 0.25% | |
| * | | The Target Date 2060 Portfolio commenced operations on April 30, 2018. |
The Portfolios invest in Institutional Shares of the Goldman Sachs Financial Square Government Fund (“Government Money Market Fund”), which is an affiliated Underlying Fund. GSAM has agreed to waive a portion of its management fee payable by the Portfolios in an amount equal to the management fee it earns as an investment adviser to the affiliated Underlying Funds in which the Portfolios invest. For the fiscal year ended August 31, 2018, the management fee waived by GSAM for each Portfolio was as follows:
| | | | | | |
| Fund | | | | Management Fee Waived | |
Target Date 2020 | | | | $ | 480 | |
Target Date 2025 | | | | | 101 | |
Target Date 2030 | | | | | 907 | |
Target Date 2035 | | | | | 142 | |
Target Date 2040 | | | | | 598 | |
Target Date 2045 | | | | | 142 | |
Target Date 2050 | | | | | 399 | |
Target Date 2055 | | | | | 137 | |
Target Date 2060* | | | | | 13 | |
| * | | The Target Date 2060 Portfolio commenced operations on April 30, 2018. |
123
GOLDMAN SACHS TARGET DATE PORTFOLIOS
Notes to Financial Statements (continued)
August 31, 2018
|
| 4. AGREEMENTS AND AFFILIATED TRANSACTIONS (continued) |
B. Distribution and/or Service (12b-1) Plans — The Trust, on behalf of Class A and Class R Shares of each applicable Portfolio, has adopted Distribution and Service Plans subject to Rule 12b-1 under the Act. Under the Distribution and Service Plans, Goldman Sachs, which serves as distributor (the “Distributor”), is entitled to a fee accrued daily and paid monthly, for distribution services and personal and account maintenance services, which may then be paid by Goldman Sachs to authorized dealers. These fees are equal to an annual percentage rate of the average daily net assets attributable to Class A or Class R Shares of the Portfolios, as applicable, as set forth below.
The Trust, on behalf of Service Shares of each applicable Portfolio, has adopted a Service Plan subject to Rule 12b-1 under the Act to allow Service Shares to compensate service organizations (including Goldman Sachs) for providing personal account maintenance to their customers who are beneficial owners of such shares. The Service Plan provides for compensation to the service organizations equal to an annual percentage rate of the average daily net assets attributable to the Service Shares of the Portfolios, as set forth below.
| | | | | | | | | | | | |
| | | Distribution and/or Service Plan Rates | |
| | | Class A* | | | Class R* | | | Service | |
Distribution and/or Service Plan | | | 0.25 | % | | | 0.50 | % | | | 0.25 | % |
| * | | With respect to Class A and Class R Shares, the Distributor at its discretion may use compensation for distribution services paid under the Distribution Plan to compensate service organizations for personal and account maintenance services and expenses as long as such total compensation does not exceed the maximum cap on “service fees” imposed by the Financial Industry Regulatory Authority. |
C. Distribution Agreement — Goldman Sachs, as Distributor of the shares of the Portfolios pursuant to a Distribution Agreement, may retain a portion of the Class A Shares’ front end sales charge. For the fiscal year ended August 31, 2018, Goldman Sachs advised that it retained the following amounts:
| | | | | | |
| | | | | Front End
Sales Charge | |
| Fund | | | | Class A | |
Target Date 2020 | | | | $ | 6 | |
Target Date 2025 | | | | | 147 | |
Target Date 2030 | | | | | 289 | |
Target Date 2035 | | | | | 484 | |
Target Date 2040 | | | | | 217 | |
Target Date 2045 | | | | | 69 | |
Target Date 2050 | | | | | 1,051 | |
Target Date 2055 | | | | | 161 | |
Target Date 2060 | | | | | — | |
D. Shareholder Administration Plan — The Trust, on behalf of each applicable Portfolio, has adopted a Shareholder Administration Plan to allow Service Shares to compensate service organizations (including Goldman Sachs) for providing varying levels of shareholder administration services to their customers who are beneficial owners of such shares. The Shareholder Administration Plan provides for compensation to the service organizations equal to an annual percentage rate of 0.25% of the average daily net assets attributable to Service Shares of the Portfolios.
124
GOLDMAN SACHS TARGET DATE PORTFOLIOS
|
| 4. AGREEMENTS AND AFFILIATED TRANSACTIONS (continued) |
E. Transfer Agency Agreement — Goldman Sachs also serves as the transfer agent of the Portfolios for a fee pursuant to the Transfer Agency Agreement. The fees charged for such transfer agency services are accrued daily and paid monthly at annual rates as follows: 0.18% of the average daily net assets of Class A, Investor and Class R Shares; 0.03% of the average daily net assets of Class R6 Shares; and 0.04% of the average daily net assets of Institutional and Service Shares. Prior to October 8, 2017 the annual rates were as follows: 0.19% of the average daily net assets of Class A, Investor and Class R Shares and 0.02% of the average daily net assets of Class R6 Shares. Goldman Sachs has agreed to waive a portion of its transfer agency fee (a component of “Other Expenses”) equal to 0.01% as an annual percentage rate of the average daily net assets attributable to Class R6 Shares through at least December 29, 2018 for Target Date 2020, Target Date 2025, Target Date 2030, Target Date 2035, Target Date 2040, Target Date 2045, Target Date 2050 and Target Date 2055, and through at least April 30, 2019 for Target Date 2060, and prior to such dates, Goldman Sachs may not terminate the arrangements without the approval of the Board of Trustees.
F. Other Expense Agreements and Affiliated Transactions — GSAM has agreed to limit certain “Other Expenses” of the Portfolios (excluding acquired (underlying) fund fees and expenses, transfer agency fees and expenses, service fees and shareholder administration fees (as applicable), taxes, interest, brokerage fees, expenses of shareholder meetings, litigation and indemnification, and extraordinary expenses) to the extent such expenses exceed, on an annual basis, a percentage rate of the average daily net assets of each Portfolio. Such Other Expense reimbursements, if any, are accrued daily and paid monthly. In addition, the Portfolios are not obligated to reimburse GSAM for prior fiscal year expense reimbursements, if any. The Other Expense limitations as an annual percentage rate of average daily net assets for Target Date 2020, Target Date 2030, Target Date 2040 and Target Date 2050 are each 0.024%, and Target Date 2025, Target Date 2035, Target Date 2045, Target Date 2055 and Target Date 2060 are each 0.014%. These Other Expense limitations will remain in place through at least December 29, 2018 for Target Date 2020, Target Date 2025, Target Date 2030, Target Date 2035, Target Date 2040, Target Date 2045, Target Date 2050 and Target Date 2055, and through at least April 30, 2019 for Target Date 2060, and prior to such dates, GSAM may not terminate the arrangements without the approval of the Trustees. In addition, the Portfolios have entered into certain offset arrangements with the transfer agent, which may result in a reduction of the Portfolios’ expenses and are received irrespective of the application of the “Other Expense” limitations described above.
For the fiscal year ended August 31, 2018, these expense reductions, including any fee waivers and Other Expense reimbursements, were as follows:
| | | | | | | | | | | | | | | | | | |
| Portfolio | | | | Management Fee Waiver | | | Transfer Agency Waivers/Credits | | | Other
Expense
Reimbursements | | | Total Expense Reductions | |
Target Date 2020 | | | | $ | 480 | | | $ | 4,176 | | | $ | 238,324 | | | $ | 242,980 | |
Target Date 2025 | | | | | 101 | | | | 14 | | | | 213,238 | | | | 213,353 | |
Target Date 2030 | | | | | 907 | | | | 6,831 | | | | 154,581 | | | | 162,319 | |
Target Date 2035 | | | | | 142 | | | | 18 | | | | 212,276 | | | | 212,436 | |
Target Date 2040 | | | | | 598 | | | | 4,481 | | | | 211,807 | | | | 216,886 | |
Target Date 2045 | | | | | 142 | | | | 14 | | | | 213,234 | | | | 213,390 | |
Target Date 2050 | | | | | 399 | | | | 2,606 | | | | 225,144 | | | | 228,149 | |
Target Date 2055 | | | | | 137 | | | | 9 | | | | 214,782 | | | | 214,928 | |
Target Date 2060 | | | | | 13 | | | | 170 | | | | 155,668 | | | | 155,851 | |
125
GOLDMAN SACHS TARGET DATE PORTFOLIOS
Notes to Financial Statements (continued)
August 31, 2018
|
| 4. AGREEMENTS AND AFFILIATED TRANSACTIONS (continued) |
G. Line of Credit Facility — As of August 31, 2018, the Portfolios participated in a $770,000,000 committed, unsecured revolving line of credit facility (the “facility”) together with other funds of the Trust and certain registered investment companies having management agreements with GSAM or its affiliates. This facility is to be used for temporary emergency purposes, or to allow for an orderly liquidation of securities to meet redemption requests. The interest rate on borrowings is based on the federal funds rate. The facility also requires a fee to be paid by the Portfolios based on the amount of the commitment that has not been utilized. For the fiscal year ended August 31, 2018, the Portfolios did not have any borrowings under the facility.
H. Other Transactions with Affiliates — For the fiscal year ended August 31, 2018, Goldman Sachs did not earn any brokerage commissions from portfolio transactions, on behalf of the Portfolios.
The following table provides information about the Portfolios’ investments in the Goldman Sachs Financial Square Government Fund for the fiscal year ended August 31, 2018:
| | | | | | | | | | | | | | | | | | | | | | | | | | |
| Portfolio | | | | Market Value
as of
August 31, 2017 | | | Purchases
at Cost | | | Proceeds
from Sales | | | Market
Value as of August 31, 2018 | | | Shares as of
August 31, 2018 | | | Dividend
Income | |
Target Date 2020 | | | | $ | 1,542,601 | | | $ | 4,812,558 | | | $ | 6,125,365 | | | $ | 229,794 | | | $ | 229,794 | | | $ | 3,568 | |
Target Date 2025 | | | | | 381,305 | | | | 1,299,787 | | | | 1,624,586 | | | | 56,506 | | | | 56,506 | | | | 748 | |
Target Date 2030 | | | | | 1,170,153 | | | | 7,346,068 | | | | 8,130,318 | | | | 385,903 | | | | 385,903 | | | | 6,605 | |
Target Date 2035 | | | | | 333,517 | | | | 1,471,044 | | | | 1,747,666 | | | | 56,895 | | | | 56,895 | | | | 1,017 | |
Target Date 2040 | | | | | 882,582 | | | | 3,958,526 | | | | 4,550,403 | | | | 290,705 | | | | 290,705 | | | | 4,308 | |
Target Date 2045 | | | | | 336,673 | | | | 1,067,881 | | | | 1,350,484 | | | | 54,070 | | | | 54,070 | | | | 1,022 | |
Target Date 2050 | | | | | 791,555 | | | | 4,093,224 | | | | 4,745,132 | | | | 139,647 | | | | 139,647 | | | | 2,972 | |
Target Date 2055 | | | | | 342,191 | | | | 963,508 | | | | 1,244,578 | | | | 61,121 | | | | 61,121 | | | | 990 | |
Target Date 2060 | | | | | — | | | | 266,766 | | | | 246,030 | | | | 20,736 | | | | 20,736 | | | | 150 | |
As of August 31, 2018, The Goldman Sachs Group, Inc. was the beneficial owner of 5% or more of total outstanding shares of the following Portfolios:
| | | | | | | | | | | | | | | | | | | | | | | | | | |
| Portfolio | | | | Class A | | | Institutional | | | Service | | | Investor | | | Class R | | | Class R6 | |
Target Date 2020 | | | | | 19 | % | | | 100 | % | | | 100 | % | | | — | % | | | 87 | % | | | — | % |
Target Date 2025 | | | | | 7 | | | | 100 | | | | 100 | | | | — | | | | 100 | | | | 5 | |
Target Date 2030 | | | | | — | | | | 100 | | | | 100 | | | | — | | | | 39 | | | | — | |
Target Date 2035 | | | | | 11 | | | | 100 | | | | 100 | | | | — | | | | 99 | | | | — | |
Target Date 2040 | | | | | 23 | | | | 100 | | | | 100 | | | | — | | | | 33 | | | | — | |
Target Date 2045 | | | | | 11 | | | | 100 | | | | 100 | | | | — | | | | 29 | | | | — | |
Target Date 2050 | | | | | 6 | | | | 100 | | | | 100 | | | | — | | | | 100 | | | | — | |
Target Date 2055 | | | | | 10 | | | | 100 | | | | 100 | | | | — | | | | 33 | | | | 8 | |
Target Date 2060 | | | | | 100 | | | | 100 | | | | 100 | | | | 100 | | | | 100 | | | | 100 | |
126
GOLDMAN SACHS TARGET DATE PORTFOLIOS
|
| 5. PORTFOLIO SECURITIES TRANSACTIONS |
The cost of purchases and proceeds from sales and maturities of long-term securities for the fiscal year ended August 31, 2018, were:
| | | | | | | | | | |
| Fund | | | | Purchases | | | Sales and Maturities | |
Target Date 2020 | | | | $ | 92,789,102 | | | $ | 94,574,892 | |
Target Date 2025 | | | | | 20,104,666 | | | | 19,746,546 | |
Target Date 2030 | | | | | 118,619,136 | | | | 119,975,027 | |
Target Date 2035 | | | | | 17,280,922 | | | | 16,471,610 | |
Target Date 2040 | | | | | 70,572,657 | | | | 71,971,472 | |
Target Date 2045 | | | | | 17,829,562 | | | | 17,325,647 | |
Target Date 2050 | | | | | 47,456,350 | | | | 45,191,171 | |
Target Date 2055 | | | | | 21,617,302 | | | | 21,299,517 | |
Target Date 2060 | | | | | 7,613,119 | | | | 2,795,581 | |
The tax character of distributions paid during the period ended August 31, 2018 was as follows:
| | | | | | | | | | | | | | | | | | | | | | | | | | | | | | | | | | | | |
| | | Target Date
2020 | | | Target Date
2025 | | | Target Date
2030 | | | Target Date
2035 | | | Target Date
2040 | | | Target Date
2045 | | | Target Date
2050 | | | Target Date
2055 | | | Target Date
2060 | |
Distribution paid from: | | | | | | | | | | | | | | | | | | | | | | | | | | | | | | | | | | | | |
Ordinary income | | $ | 2,112,336 | | | $ | 335,077 | | | $ | 3,264,490 | | | $ | 381,214 | | | $ | 2,219,974 | | | $ | 439,089 | | | $ | 1,093,151 | | | $ | 484,113 | | | $ | — | |
Net long-term capital gains | | | 2,033,552 | | | | 2,305 | | | | 5,880,439 | | | | 9,280 | | | | 4,490,139 | | | | — | | | | 1,140,087 | | | | 12,996 | | | | — | |
Total taxable distributions | | $ | 4,145,888 | | | $ | 337,382 | | | $ | 9,144,929 | | | $ | 390,494 | | | $ | 6,710,113 | | | $ | 439,089 | | | $ | 2,233,238 | | | $ | 497,109 | | | $ | — | |
The tax character of distributions paid during the fiscal year ended August 31, 2017 was as follows:
| | | | | | | | | | | | | | | | | | | | | | | | | | | | | | | | |
| | | Target Date
2020 | | | Target Date
2025 | | | Target Date
2030 | | | Target Date
2035 | | | Target Date
2040 | | | Target Date
2045 | | | Target Date
2050 | | | Target Date
2055 | |
Distribution paid from: | | | | | | | | | | | | | | | | | | | | | | | | | | | | | | | | |
Ordinary income | | $ | 1,143,779 | | | $ | 80,349 | | | $ | 1,579,091 | | | $ | 85,040 | | | $ | 1,179,834 | | | $ | 87,540 | | | $ | 557,709 | | | $ | 91,462 | |
Net long-term capital gains | | | 1,887,095 | | | | — | | | | 2,360,440 | | | | — | | | | 1,980,519 | | | | — | | | | 807,554 | | | | — | |
Total taxable distributions | | $ | 3,030,874 | | | $ | 80,349 | | | $ | 3,939,531 | | | $ | 85,040 | | | $ | 3,160,353 | | | $ | 87,540 | | | $ | 1,365,263 | | | $ | 91,462 | |
The tax character of distributions paid during the fiscal year ended October 31, 2016 was as follows:
| | | | | | | | | | | | | | | | | | | | | | | | | | | | | | | | |
| | | Target Date
2020 | | | Target Date
2025 | | | Target Date
2030 | | | Target Date
2035 | | | Target Date
2040 | | | Target Date
2045 | | | Target Date
2050 | | | Target Date
2055 | |
Distribution paid from: | | | | | | | | | | | | | | | | | | | | | | | | | | | | | | | | |
Ordinary income | | $ | 1,207,803 | | | $ | — | | | $ | 1,551,992 | | | $ | — | | | $ | 1,118,464 | | | $ | — | | | $ | 469,675 | | | $ | — | |
Net long-term capital gains | | | 1,456,117 | | | | — | | | | 2,378,711 | | | | — | | | | 1,929,632 | | | | — | | | | 507,872 | | | | — | |
Total taxable distributions | | $ | 2,663,920 | | | $ | — | | | $ | 3,930,703 | | | $ | — | | | $ | 3,048,096 | | | $ | — | | | $ | 977,547 | | | $ | — | |
127
GOLDMAN SACHS TARGET DATE PORTFOLIOS
Notes to Financial Statements (continued)
August 31, 2018
|
| 6. TAX INFORMATION (continued) |
As of August 31, 2018, the components of accumulated earnings (losses) on a tax basis were as follows:
| | | | | | | | | | | | | | | | | | | | | | | | | | | | | | | | | | | | |
| | | Target Date
2020 | | | Target Date
2025 | | | Target Date
2030 | | | Target Date
2035 | | | Target Date
2040 | | | Target Date
2045 | | | Target Date
2050 | | | Target Date
2055 | | | Target Date
2060 | |
Undistributed ordinary income — net | | $ | 634,561 | | | $ | 186,655 | | | $ | 998,482 | | | $ | 184,177 | | | $ | 743,281 | | | $ | 209,802 | | | $ | 515,828 | | | $ | 245,960 | | | $ | 45,806 | |
Undistributed long-term capital gains | | | 998,535 | | | | 174,608 | | | | 1,852,860 | | | | 210,914 | | | | 1,812,530 | | | | 299,194 | | | | 829,832 | | | | 337,338 | | | | — | |
Total undistributed earnings | | $ | 1,633,096 | | | $ | 361,263 | | | $ | 2,851,342 | | | $ | 395,091 | | | $ | 2,555,811 | | | $ | 508,996 | | | $ | 1,345,660 | | | $ | 583,298 | | | $ | 45,806 | |
Unrealized gains — net | | | 1,279,962 | | | | 591,039 | | | | 6,958,789 | | | | 1,020,570 | | | | 5,257,942 | | | | 1,182,937 | | | | 3,746,376 | | | | 1,383,387 | | | | 184,612 | |
Total accumulated earnings net | | $ | 2,913,058 | | | $ | 952,302 | | | $ | 9,810,131 | | | $ | 1,415,661 | | | $ | 7,813,753 | | | $ | 1,691,933 | | | $ | 5,092,036 | | | $ | 1,966,685 | | | $ | 230,418 | |
As of August 31, 2018, the Portfolios’ aggregate security unrealized gains and losses based on cost for U.S. federal income tax purposes were as follows:
| | | | | | | | | | | | | | | | | | | | | | | | | | | | | | | | | | | | |
| | | Target Date
2020 | | | Target Date
2025 | | | Target Date
2030 | | | Target Date
2035 | | | Target Date
2040 | | | Target Date
2045 | | | Target Date
2050 | | | Target Date
2055 | | | Target Date
2060 | |
Tax Cost | | $ | 43,877,560 | | | $ | 10,634,762 | | | $ | 68,555,379 | | | $ | 11,252,440 | | | $ | 44,145,775 | | | $ | 11,100,882 | | | $ | 26,297,491 | | | $ | 11,052,452 | | | $ | 4,852,126 | |
Gross unrealized gain | | | 1,925,428 | | | | 709,951 | | | | 7,828,547 | | | | 1,128,764 | | | | 5,899,573 | | | | 1,290,042 | | | | 4,063,040 | | | | 1,488,970 | | | | 231,116 | |
Gross unrealized loss | | | (645,466 | ) | | | (118,912 | ) | | | (869,758 | ) | | | (108,194 | ) | | | (641,631 | ) | | | (107,105 | ) | | | (316,664 | ) | | | (105,583 | ) | | | (46,504 | ) |
Net unrealized gains | | $ | 1,279,962 | | | $ | 591,039 | | | $ | 6,958,789 | | | $ | 1,020,570 | | | $ | 5,257,942 | | | $ | 1,182,937 | | | $ | 3,746,376 | | | $ | 1,383,387 | | | $ | 184,612 | |
The difference between GAAP-basis and tax basis unrealized gains (losses) is attributable primarily to wash sales.
128
GOLDMAN SACHS TARGET DATE PORTFOLIOS
|
| 6. TAX INFORMATION (continued) |
In order to present certain components of the Portfolios’ capital accounts on a tax-basis, certain reclassifications have been recorded to the Portfolios’ accounts. These reclassifications have no impact on the net asset value of the Portfolios and result primarily from non-deductible expenses, and differences in the tax treatment of underlying fund investments and partnership investments.
| | | | | | | | | | | | | | |
| | | | | Paid in Capital | | | Accumulated Net Realized Gain (Loss) | | | Undistributed Net Investment Income (Loss) | |
Target Date 2020 | | | | $ | — | | | $ | 386 | | | $ | (386 | ) |
Target Date 2025 | | | | | — | | | | 65 | | | | (65 | ) |
Target Date 2030 | | | | | — | | | | 482 | | | | (482 | ) |
Target Date 2035 | | | | | — | | | | 63 | | | | (63 | ) |
Target Date 2040 | | | | | — | | | | 312 | | | | (312 | ) |
Target Date 2045 | | | | | — | | | | 57 | | | | (57 | ) |
Target Date 2050 | | | | | — | | | | 138 | | | | (138 | ) |
Target Date 2055 | | | | | — | | | | 75 | | | | (75 | ) |
Target Date 2060 | | | | | (61 | ) | | | — | | | | 61 | |
GSAM has reviewed the Portfolios’ tax positions for all open tax years (the current and prior three years, as applicable) and has concluded that no provision for income tax is required in the Portfolios’ financial statements. Such open tax years remain subject to examination and adjustment by tax authorities.
The Portfolios’ risks include, but are not limited to, the following:
Foreign and Emerging Countries Risk — Investing in foreign markets may involve special risks and considerations not typically associated with investing in the U.S. Foreign securities may be subject to risk of loss because of more or less foreign government regulation, less public information and less economic, political and social stability in the countries in which a Portfolio or an Underlying Fund invests. The imposition of exchange controls (including repatriation restrictions), confiscations, trade restrictions (including tariffs) and other government restrictions by the U.S. or other governments, or from problems in share registration, settlement or custody, may also result in losses. Foreign risk also involves the risk of negative foreign currency rate fluctuations, which may cause the value of securities denominated in such foreign currency (or other instruments through which a Portfolio or an Underlying Fund has exposure to foreign currencies) to decline in value. Currency exchange rates may fluctuate significantly over short periods of time. To the extent that a Portfolio or an Underlying Fund also invests in securities of issuers located in emerging markets, these risks may be more pronounced.
Investments in Other Investment Companies Risk — As a shareholder of another investment company, including an ETF, a Portfolio will indirectly bear its proportionate share of any net management fees and other expenses paid by such other investment companies, in addition to the fees and expenses regularly borne by the Portfolio. ETFs are subject to risks that do not apply to conventional mutual funds, including but not limited to the following: (i) the market price of the ETF’s shares may trade at a premium or a discount to their NAV; and (ii) an active trading market for an ETF’s shares may not develop or be maintained.
The Portfolios may be indirectly exposed to the following risks through their investments in the Underlying Funds. For more information regarding the risks of an Underlying Fund, please see the Underlying Fund’s shareholder report.
129
GOLDMAN SACHS TARGET DATE PORTFOLIOS
Notes to Financial Statements (continued)
August 31, 2018
|
| 7. OTHER RISKS (continued) |
Liquidity Risk — A Portfolio may make investments that are illiquid or that may become less liquid in response to market developments or adverse investor perceptions. Illiquid investments may be more difficult to value. Liquidity risk may also refer to the risk that a Portfolio will not be able to pay redemption proceeds within the allowable time period because of unusual market conditions, an unusually high volume of redemption requests, or other reasons. To meet redemption requests, a Portfolio may be forced to sell investments at an unfavorable time and/or under unfavorable conditions. These risks may be more pronounced in connection with the Portfolios’ investments in securities of issuers located in emerging market countries.
Market and Credit Risks — In the normal course of business, a Portfolio trades financial instruments and enters into financial transactions where risk of potential loss exists due to changes in the market (market risk). Additionally, a Portfolio may also be exposed to credit risk in the event that an issuer or guarantor fails to perform or that an institution or entity with which the Portfolio has unsettled or open transactions defaults.
Under the Trust’s organizational documents, its Trustees, officers, employees and agents are indemnified, to the extent permitted by the Act and state law, against certain liabilities that may arise out of performance of their duties to the Portfolios. Additionally, in the course of business, the Portfolios enter into contracts that contain a variety of indemnification clauses. The Portfolios’ maximum exposure under these arrangements is unknown, as this would involve future claims that may be made against the Portfolios that have not yet occurred. However, GSAM believes the risk of loss under these arrangements to be remote.
In September 2018, the Financial Accounting Standards Board issued Accounting Standards Update (ASU) 2018-13 — Fair Value Measurement (Topic 820) Disclosure Framework — Changes to the Disclosure Requirements for Fair Value Measurement. The amendments in the ASU modify fair value measurement disclosures. The amendments are effective for the Portfolios’ fiscal years beginning after December 15, 2019. GSAM is currently evaluating the impact, if any, of the amendments.
At a meeting held on August 7-8, 2018, the Board of Trustees of Goldman Sachs Trust II approved the termination of Madison Asset Management, LLC as sub-adviser to the Portfolios. Effective on or about November 30, 2018, Goldman Sachs Asset Management, L.P., investment adviser to the Portfolios, will provide day-to-day advice regarding the Portfolios’ investment transactions.
At a meeting held on September 12-13, 2018, the Board of Trustees of Goldman Sachs Trust II also approved certain changes to the Portfolios’ principal investment strategy, including changes to the Portfolios’ glide path, to take effect on or about November 30, 2018.
Subsequent events after the Statements of Assets and Liabilities date have been evaluated. Other than the matters discussed above, GSAM has concluded that there is no impact requiring adjustment or disclosure in the financial statements.
130
GOLDMAN SACHS TARGET DATE PORTFOLIOS
|
| 10. SUMMARY OF SHARE TRANSACTIONS |
Share activity is as follows:
| | | | | | | | | | | | | | | | | | | | | | | | |
| | | Target Date 2020 Portfolio | |
| | | | |
| | | For the Fiscal Year Ended
August 31, 2018 | | | For the Period
November 1, 2016 –
August 31, 2017(a) | | | For the Fiscal Year Ended
October 31, 2016 | |
| | | | |
| | | Shares | | | Dollars | | | Shares | | | Dollars | | | Shares | | | Dollars | |
| | | | |
| Class A Shares(b) | | | | | | | | | | | | | | | | | | | | | | | | |
Shares sold | | | 4,332 | | | $ | 40,287 | | | | 571 | | | $ | 5,508 | | | | 996 | | | $ | 10,010 | |
Reinvestment of distributions | | | 146 | | | | 1,372 | | | | 57 | | | | 540 | | | | — | | | | — | |
Shares redeemed | | | (2 | ) | | | (17 | ) | | | — | | | | — | | | | (1 | ) | | | (11 | ) |
| | | | 4,476 | | | | 41,642 | | | | 628 | | | | 6,048 | | | | 995 | | | | 9,999 | |
| Institutional Shares(b) | | | | | | | | | | | | | | | | | | | | | | | | |
Shares sold | | | 4 | | | | 38 | | | | 1 | | | | 5 | | | | 996 | | | | 10,010 | |
Reinvestment of distributions | | | 97 | | | | 919 | | | | 59 | | | | 555 | | | | — | | | | — | |
Shares redeemed | | | (1 | ) | | | (10 | ) | | | (1 | ) | | | (5 | ) | | | (1 | ) | | | (10 | ) |
| | | | 100 | | | | 947 | | | | 59 | | | | 555 | | | | 995 | | | | 10,000 | |
| Service Shares(b) | | | | | | | | | | | | | | | | | | | | | | | | |
Shares sold | | | — | | | | — | | | | — | | | | — | | | | 996 | | | | 10,010 | |
Reinvestment of distributions | | | 92 | | | | 866 | | | | 57 | | | | 537 | | | | — | | | | — | |
Shares redeemed | | | — | | | | — | | | | — | | | | — | | | | (1 | ) | | | (11 | ) |
| | | | 92 | | | | 866 | | | | 57 | | | | 537 | | | | 995 | | | | 9,999 | |
| Investor Shares(b)(c) | | | | | | | | | | | | | | | | | | | | | | | | |
Shares sold | | | 86,978 | | | | 854,761 | | | | 31,422 | | | | 311,469 | | | | 996 | | | | 10,010 | |
Reinvestment of distributions | | | 7,699 | | | | 72,508 | | | | 58 | | | | 550 | | | | — | | | | — | |
Shares redeemed | | | (32,030 | ) | | | (309,552 | ) | | | (1 | ) | | | (10 | ) | | | (1 | ) | | | (11 | ) |
| | | | 62,647 | | | | 617,717 | | | | 31,479 | | | | 312,009 | | | | 995 | | | | 9,999 | |
| Class R Shares(b) | | | | | | | | | | | | | | | | | | | | | | | | |
Shares sold | | | 165 | | | | 1,529 | | | | — | | | | — | | | | 996 | | | | 10,010 | |
Reinvestment of distributions | | | 91 | | | | 852 | | | | 56 | | | | 532 | | | | — | | | | — | |
Shares redeemed | | | — | | | | — | | | | — | | | | — | | | | (1 | ) | | | (11 | ) |
| | | | 256 | | | | 2,381 | | | | 56 | | | | 532 | | | | 995 | | | | 9,999 | |
| Class R6 Shares | | | | | | | | | | | | | | | | | | | | | | | | |
Shares sold | | | 222,354 | | | | 2,113,317 | | | | 148,501 | | | | 1,423,485 | | | | 556,157 | | | | 5,395,539 | |
Reinvestment of distributions | | | 431,304 | | | | 4,069,371 | | | | 319,101 | | | | 3,028,160 | | | | 282,195 | | | | 2,663,920 | |
Shares redeemed | | | (665,102 | ) | | | (6,304,463 | ) | | | (1,106,730 | ) | | | (10,811,544 | ) | | | (745,292 | ) | | | (7,300,289 | ) |
| | | | (11,444 | ) | | | (121,775 | ) | | | (639,128 | ) | | | (6,359,899 | ) | | | 93,060 | | | | 759,170 | |
NET INCREASE (DECREASE) | | | 56,127 | | | $ | 541,778 | | | | (606,849 | ) | | $ | (6,040,218 | ) | | | 98,035 | | | $ | 809,166 | |
| (a) | | The Portfolios changed their fiscal year end from October 31 to August 31. |
| (b) | | Commenced operations on August 22, 2016. |
| (c) | | Effective October 10, 2017, Class IR Shares changed its name to Investor Shares. |
131
GOLDMAN SACHS TARGET DATE PORTFOLIOS
Notes to Financial Statements (continued)
August 31, 2018
|
| 10. SUMMARY OF SHARE TRANSACTIONS (continued) |
| | | | | | | | | | | | | | | | | | | | | | | | |
| | | Target Date 2025 Portfolio | |
| | | | |
| | | For the Fiscal Year Ended
August 31, 2018 | | | For the Period
November 1, 2016 – August 31, 2017(a) | | | For the Period Ended
October 31, 2016(b) | |
| | | | |
| | | Shares | | | Dollars | | | Shares | | | Dollars | | | Shares | | | Dollars | |
| | | | |
| Class A Shares | | | | | | | | | | | | | | | | | | | | | | | | |
Shares sold | | | 11,326 | | | $ | 121,207 | | | | 5,992 | | | $ | 60,856 | | | | 1,001 | | | $ | 10,011 | |
Reinvestment of distributions | | | 73 | | | | 782 | | | | 38 | | | | 375 | | | | — | | | | — | |
Shares redeemed | | | (4,548 | ) | | | (48,927 | ) | | | — | | | | — | | | | (1 | ) | | | (11 | ) |
| | | | 6,851 | | | | 73,062 | | | | 6,030 | | | | 61,231 | | | | 1,000 | | | | 10,000 | |
| Institutional Shares | | | | | | | | | | | | | | | | | | | | | | | | |
Shares sold | | | — | | | | — | | | | 1 | | | | 5 | | | | 995,001 | | | | 9,950,011 | |
Reinvestment of distributions | | | 30,021 | | | | 323,174 | | | | 8,051 | | | | 79,700 | | | | — | | | | — | |
Shares redeemed | | | (58,650 | ) | | | (625,000 | ) | | | (1 | ) | | | (5 | ) | | | (1 | ) | | | (10 | ) |
| | | | (28,629 | ) | | | (301,826 | ) | | | 8,051 | | | | 79,700 | | | | 995,000 | | | | 9,950,001 | |
| Service Shares | | | | | | | | | | | | | | | | | | | | | | | | |
Shares sold | | | — | | | | — | | | | — | | | | — | | | | 1,001 | | | | 10,011 | |
Reinvestment of distributions | | | 26 | | | | 272 | | | | 6 | | | | 62 | | | | — | | | | — | |
Shares redeemed | | | — | | | | — | | | | — | | | | — | | | | (1 | ) | | | (11 | ) |
| | | | 26 | | | | 272 | | | | 6 | | | | 62 | | | | 1,000 | | | | 10,000 | |
| Investor Shares(c) | | | | | | | | | | | | | | | | | | | | | | | | |
Shares sold | | | 44,320 | | | | 474,619 | | | | 2,241 | | | | 23,671 | | | | 1,001 | | | | 10,011 | |
Reinvestment of distributions | | | 940 | | | | 10,108 | | | | 8 | | | | 75 | | | | — | | | | — | |
Shares redeemed | | | (14,366 | ) | | | (155,689 | ) | | | (3 | ) | | | (25 | ) | | | (1 | ) | | | (11 | ) |
| | | | 30,894 | | | | 329,038 | | | | 2,246 | | | | 23,721 | | | | 1,000 | | | | 10,000 | |
| Class R Shares | | | | | | | | | | | | | | | | | | | | | | | | |
Shares sold | | | — | | | | — | | | | 3 | | | | 36 | | | | 1,001 | | | | 10,011 | |
Reinvestment of distributions | | | 24 | | | | 256 | | | | 6 | | | | 57 | | | | — | | | | — | |
Shares redeemed | | | — | | | | — | | | | (3 | ) | | | (36 | ) | | | (1 | ) | | | (11 | ) |
| | | | 24 | | | | 256 | | | | 6 | | | | 57 | | | | 1,000 | | | | 10,000 | |
| Class R6 Shares | | | | | | | | | | | | | | | | | | | | | | | | |
Shares sold | | | 20,123 | | | | 215,939 | | | | 1 | | | | 11 | | | | 1,001 | | | | 10,011 | |
Reinvestment of distributions | | | 259 | | | | 2,790 | | | | 8 | | | | 80 | | | | — | | | | — | |
Shares redeemed | | | (1,919 | ) | | | (20,650 | ) | | | (1 | ) | | | (10 | ) | | | (1 | ) | | | (11 | ) |
| | | | 18,463 | | | | 198,079 | | | | 8 | | | | 81 | | | | 1,000 | | | | 10,000 | |
NET INCREASE | | | 27,629 | | | $ | 298,881 | | | | 16,347 | | | $ | 164,852 | | | | 1,000,000 | | | $ | 10,000,001 | |
| (a) | | The Portfolios changed their fiscal year end from October 31 to August 31. |
| (b) | | Commenced operations on August 22, 2016. |
| (c) | | Effective October 10, 2017, Class IR Shares changed its name to Investor Shares. |
132
GOLDMAN SACHS TARGET DATE PORTFOLIOS
|
| 10. SUMMARY OF SHARE TRANSACTIONS (continued) |
| | | | | | | | | | | | | | | | | | | | | | | | |
| | | Target Date 2030 Portfolio | |
| | | | |
| | | For the Fiscal Year Ended
August 31, 2018 | | | For the Period November 1, 2016 –
August 31, 2017(a) | | | For the Fiscal Year Ended
October 31, 2016 | |
| | | | |
| | | Shares | | | Dollars | | | Shares | | | Dollars | | | Shares | | | Dollars | |
| | | | |
| Class A Shares(b) | | | | | | | | | | | | | | | | | | | | | | | | |
Shares sold | | | 14,896 | | | $ | 141,029 | | | | 19,953 | | | $ | 189,739 | | | | 1,008 | | | $ | 10,010 | |
Reinvestment of distributions | | | 2,629 | | | | 24,977 | | | | 65 | | | | 623 | | | | — | | | | — | |
Shares redeemed | | | (140 | ) | | | (1,338 | ) | | | (985 | ) | | | (9,998 | ) | | | (1 | ) | | | (11 | ) |
| | | | 17,385 | | | | 164,668 | | | | 19,033 | | | | 180,364 | | | | 1,007 | | | | 9,999 | |
| Institutional Shares(b) | | | | | | | | | | | | | | | | | | | | | | | | |
Shares sold | | | — | | | | — | | | | 1 | | | | 5 | | | | 1,008 | | | | 10,010 | |
Reinvestment of distributions | | | 141 | | | | 1,342 | | | | 54 | | | | 515 | | | | — | | | | — | |
Shares redeemed | | | — | | | | — | | | | (1 | ) | | | (5 | ) | | | (1 | ) | | | (10 | ) |
| | | | 141 | | | | 1,342 | | | | 54 | | | | 515 | | | | 1,007 | | | | 10,000 | |
| Service Shares(b) | | | | | | | | | | | | | | | | | | | | | | | | |
Shares sold | | | — | | | | — | | | | — | | | | — | | | | 1,008 | | | | 10,010 | |
Reinvestment of distributions | | | 136 | | | | 1,286 | | | | 52 | | | | 498 | | | | — | | | | — | |
Shares redeemed | | | — | | | | — | | | | — | | | | — | | | | (1 | ) | | | (11 | ) |
| | | | 136 | | | | 1,286 | | | | 52 | | | | 498 | | | | 1,007 | | | | 9,999 | |
| Investor Shares(b)(c) | | | | | | | | | | | | | | | | | | | | | | | | |
Shares sold | | | 91,301 | | | | 925,057 | | | | 59,937 | | | | 613,794 | | | | 1,008 | | | | 10,010 | |
Reinvestment of distributions | | | 17,435 | | | | 166,064 | | | | 53 | | | | 510 | | | | — | | | | — | |
Shares redeemed | | | (32,519 | ) | | | (314,942 | ) | | | (9 | ) | | | (90 | ) | | | (1 | ) | | | (11 | ) |
| | | | 76,217 | | | | 776,179 | | | | 59,981 | | | | 614,214 | | | | 1,007 | | | | 9,999 | |
| Class R Shares(b) | | | | | | | | | | | | | | | | | | | | | | | | |
Shares sold | | | 519 | | | | 5,048 | | | | 1,182 | | | | 11,639 | | | | 1,008 | | | | 10,010 | |
Reinvestment of distributions | | | 304 | | | | 2,878 | | | | 52 | | | | 492 | | | | — | | | | — | |
Shares redeemed | | | (4 | ) | | | (39 | ) | | | (2 | ) | | | (16 | ) | | | (1 | ) | | | (11 | ) |
| | | | 819 | | | | 7,887 | | | | 1,232 | | | | 12,115 | | | | 1,007 | | | | 9,999 | |
| Class R6 Shares | | | | | | | | | | | | | | | | | | | | | | | | |
Shares sold | | | 380,758 | | | | 3,723,100 | | | | 276,954 | | | | 2,713,417 | | | | 284,587 | | | | 2,711,235 | |
Reinvestment of distributions | | | 937,533 | | | | 8,948,381 | | | | 412,273 | | | | 3,936,893 | | | | 422,202 | | | | 3,930,703 | |
Shares redeemed | | | (923,626 | ) | | | (9,119,716 | ) | | | (988,092 | ) | | | (9,767,525 | ) | | | (1,015,250 | ) | | | (9,983,514 | ) |
| | | | 394,665 | | | | 3,551,765 | | | | (298,865 | ) | | | (3,117,215 | ) | | | (308,461 | ) | | | (3,341,576 | ) |
NET INCREASE (DECREASE) | | | 489,363 | | | $ | 4,503,127 | | | | (218,513 | ) | | $ | (2,309,509 | ) | | | (303,426 | ) | | $ | (3,291,580 | ) |
| (a) | | The Portfolios changed their fiscal year end from October 31 to August 31. |
| (b) | | Commenced operations on August 22, 2016. |
| (c) | | Effective October 10, 2017, Class IR Shares changed its name to Investor Shares. |
133
GOLDMAN SACHS TARGET DATE PORTFOLIOS
Notes to Financial Statements (continued)
August 31, 2018
|
| 10. SUMMARY OF SHARE TRANSACTIONS (continued) |
| | | | | | | | | | | | | | | | | | | | | | | | |
| | | Target Date 2035 Portfolio | |
| | | | |
| | | For the Fiscal Year Ended
August 31, 2018 | | | For the Period
November 1, 2016 –
August 31, 2017(a) | | | For the Period Ended
October 31, 2016(b) | |
| | | | |
| | | Shares | | | Dollars | | | Shares | | | Dollars | | | Shares | | | Dollars | |
| | | | |
| Class A Shares | | | | | | | | | | | | | | | | | | | | | | | | |
Shares sold | | | 13,348 | | | $ | 149,806 | | | | 1,645 | | | $ | 16,616 | | | | 1,001 | | | $ | 10,011 | |
Reinvestment of distributions | | | 77 | | | | 850 | | | | 7 | | | | 71 | | | | — | | | | — | |
Shares redeemed | | | (6,668 | ) | | | (74,458 | ) | | | — | | | | — | | | | (1 | ) | | | (11 | ) |
| | | | 6,757 | | | | 76,198 | | | | 1,652 | | | | 16,687 | | | | 1,000 | | | | 10,000 | |
| Institutional Shares | | | | | | | | | | | | | | | | | | | | | | | | |
Shares sold | | | — | | | | — | | | | — | | | | 5 | | | | 995,001 | | | | 9,950,011 | |
Reinvestment of distributions | | | 32,776 | | | | 363,258 | | | | 8,493 | | | | 84,675 | | | | — | | | | — | |
Shares redeemed | | | (56,768 | ) | | | (625,005 | ) | | | — | | | | (5 | ) | | | (1 | ) | | | (10 | ) |
| | | | (23,992 | ) | | | (261,747 | ) | | | 8,493 | | | | 84,675 | | | | 995,000 | | | | 9,950,001 | |
| Service Shares | | | | | | | | | | | | | | | | | | | | | | | | |
Shares sold | | | — | | | | — | | | | — | | | | — | | | | 1,001 | | | | 10,011 | |
Reinvestment of distributions | | | 28 | | | | 311 | | | | 7 | | | | 67 | | | | — | | | | — | |
Shares redeemed | | | — | | | | — | | | | — | | | | — | | | | (1 | ) | | | (11 | ) |
| | | | 28 | | | | 311 | | | | 7 | | | | 67 | | | | 1,000 | | | | 10,000 | |
| Investor Shares(c) | | | | | | | | | | | | | | | | | | | | | | | | |
Shares sold | | | 66,609 | | | | 730,554 | | | | 12,990 | | | | 140,121 | | | | 1,001 | | | | 10,011 | |
Reinvestment of distributions | | | 2,054 | | | | 22,720 | | | | 8 | | | | 80 | | | | — | | | | — | |
Shares redeemed | | | (4,205 | ) | | | (46,352 | ) | | | (6 | ) | | | (69 | ) | | | (1 | ) | | | (11 | ) |
| | | | 64,458 | | | | 706,922 | | | | 12,992 | | | | 140,132 | | | | 1,000 | | | | 10,000 | |
| Class R Shares | | | | | | | | | | | | | | | | | | | | | | | | |
Shares sold | | | — | | | | — | | | | 7 | | | | 67 | | | | 1,001 | | | | 10,011 | |
Reinvestment of distributions | | | 27 | | | | 296 | | | | 6 | | | | 62 | | | | — | | | | — | |
Shares redeemed | | | — | | | | — | | | | — | | | | — | | | | (1 | ) | | | (11 | ) |
| | | | 27 | | | | 296 | | | | 13 | | | | 129 | | | | 1,000 | | | | 10,000 | |
| Class R6 Shares | | | | | | | | | | | | | | | | | | | | | | | | |
Shares sold | | | 27,920 | | | | 311,477 | | | | 2,209 | | | | 23,226 | | | | 1,001 | | | | 10,011 | |
Reinvestment of distributions | | | 276 | | | | 3,059 | | | | 9 | | | | 85 | | | | — | | | | — | |
Shares redeemed | | | (2,413 | ) | | | (27,116 | ) | | | (2 | ) | | | (16 | ) | | | (1 | ) | | | (11 | ) |
| | | | 25,783 | | | | 287,420 | | | | 2,216 | | | | 23,295 | | | | 1,000 | | | | 10,000 | |
NET INCREASE | | | 73,061 | | | $ | 809,400 | | | | 25,373 | | | $ | 264,985 | | | | 1,000,000 | | | $ | 10,000,001 | |
| (a) | | The Portfolios changed their fiscal year end from October 31 to August 31. |
| (b) | | Commenced operations on August 22, 2016. |
| (c) | | Effective October 10, 2017, Class IR Shares changed its name to Investor Shares. |
134
GOLDMAN SACHS TARGET DATE PORTFOLIOS
|
| 10. SUMMARY OF SHARE TRANSACTIONS (continued) |
| | | | | | | | | | | | | | | | | | | | | | | | |
| | | Target Date 2040 Portfolio | |
| | | | |
| | | For the Fiscal Year Ended
August 31, 2018 | | | For the Period
November 1, 2016 –
August 31, 2017(a) | | | For the Fiscal Year Ended
October 31, 2016 | |
| | | | |
| | | Shares | | | Dollars | | | Shares | | | Dollars | | | Shares | | | Dollars | |
| | | | |
| Class A Shares(b) | | | | | | | | | | | | | | | | | | | | | | | | |
Shares sold | | | 3,789 | | | $ | 35,596 | | | | 227 | | | $ | 2,223 | | | | 1,323 | | | $ | 12,879 | |
Reinvestment of distributions | | | 287 | | | | 2,658 | | | | 88 | | | | 827 | | | | — | | | | — | |
Shares redeemed | | | (6 | ) | | | (54 | ) | | | (319 | ) | | | (3,121 | ) | | | (1 | ) | | | (11 | ) |
| | | | 4,070 | | | | 38,200 | | | | (4 | ) | | | (71 | ) | | | 1,322 | | | | 12,868 | |
| Institutional Shares(b) | | | | | | | | | | | | | | | | | | | | | | | | |
Shares sold | | | — | | | | — | | | | 1 | | | | 5 | | | | 1,025 | | | | 10,010 | |
Reinvestment of distributions | | | 167 | | | | 1,557 | | | | 70 | | | | 654 | | | | — | | | | — | |
Shares redeemed | | | — | | | | — | | | | (1 | ) | | | (5 | ) | | | (1 | ) | | | (10 | ) |
| | | | 167 | | | | 1,557 | | | | 70 | | | | 654 | | | | 1,024 | | | | 10,000 | |
| Service Shares(b) | | | | | | | | | | | | | | | | | | | | | | | | |
Shares sold | | | — | | | | — | | | | — | | | | — | | | | 1,025 | | | | 10,010 | |
Reinvestment of distributions | | | 162 | | | | 1,501 | | | | 68 | | | | 636 | | | | — | | | | — | |
Shares redeemed | | | — | | | | — | | | | — | | | | — | | | | (1 | ) | | | (11 | ) |
| | | | 162 | | | | 1,501 | | | | 68 | | | | 636 | | | | 1,024 | | | | 9,999 | |
| Investor Shares(b)(c) | | | | | | | | | | | | | | | | | | | | | | | | |
Shares sold | | | 53,009 | | | | 528,273 | | | | 11,815 | | | | 118,889 | | | | 1,025 | | | | 10,010 | |
Reinvestment of distributions | | | 7,463 | | | | 69,327 | | | | 69 | | | | 648 | | | | — | | | | — | |
Shares redeemed | | | (6,550 | ) | | | (63,831 | ) | | | (6 | ) | | | (55 | ) | | | (1 | ) | | | (11 | ) |
| | | | 53,922 | | | | 533,769 | | | | 11,878 | | | | 119,482 | | | | 1,024 | | | | 9,999 | |
| Class R Shares(b) | | | | | | | | | | | | | | | | | | | | | | | | |
Shares sold | | | 1,022 | | | | 9,689 | | | | 1,308 | | | | 12,647 | | | | 1,025 | | | | 10,010 | |
Reinvestment of distributions | | | 385 | | | | 3,557 | | | | 67 | | | | 630 | | | | — | | | | — | |
Shares redeemed | | | (5 | ) | | | (49 | ) | | | (2 | ) | | | (16 | ) | | | (1 | ) | | | (11 | ) |
| | | | 1,402 | | | | 13,197 | | | | 1,373 | | | | 13,261 | | | | 1,024 | | | | 9,999 | |
| Class R6 Shares | | | | | | | | | | | | | | | | | | | | | | | | |
Shares sold | | | 170,834 | | | | 1,666,743 | | | | 200,436 | | | | 1,910,717 | | | | 121,810 | | | | 1,134,819 | |
Reinvestment of distributions | | | 712,362 | | | | 6,631,513 | | | | 337,128 | | | | 3,156,958 | | | | 333,125 | | | | 3,048,096 | |
Shares redeemed | | | (536,507 | ) | | | (5,292,586 | ) | | | (642,379 | ) | | | (6,279,840 | ) | | | (572,414 | ) | | | (5,513,965 | ) |
| | | | 346,689 | | | | 3,005,670 | | | | (104,815 | ) | | | (1,212,165 | ) | | | (117,479 | ) | | | (1,331,050 | ) |
NET INCREASE (DECREASE) | | | 406,412 | | | $ | 3,593,894 | | | | (91,430 | ) | | $ | (1,078,203 | ) | | | (112,061 | ) | | $ | (1,278,185 | ) |
| (a) | | The Portfolios changed their fiscal year end from October 31 to August 31. |
| (b) | | Commenced operations on August 22, 2016. |
| (c) | | Effective October 10, 2017, Class IR Shares changed its name to Investor Shares. |
135
GOLDMAN SACHS TARGET DATE PORTFOLIOS
Notes to Financial Statements (continued)
August 31, 2018
|
| 10. SUMMARY OF SHARE TRANSACTIONS (continued) |
| | | | | | | | | | | | | | | | | | | | | | | | |
| | | Target Date 2045 Portfolio | |
| | | | |
| | | For the Fiscal Year Ended
August 31, 2018 | | | For the Period November 1, 2016 –
August 31, 2017(a) | | | For the Fiscal Year Ended
October 31, 2016(b) | |
| | | | |
| | | Shares | | | Dollars | | | Shares | | | Dollars | | | Shares | | | Dollars | |
| | | | |
| Class A Shares | | | | | | | | | | | | | | | | | | | | | | | | |
Shares sold | | | 1,339 | | | $ | 15,155 | | | | 6,611 | | | $ | 71,383 | | | | 1,001 | | | $ | 10,011 | |
Reinvestment of distributions | | | 275 | | | | 3,096 | | | | 7 | | | | 73 | | | | — | | | | — | |
Shares redeemed | | | (59 | ) | | | (661 | ) | | | (1 | ) | | | (10 | ) | | | (1 | ) | | | (11 | ) |
| | | | 1,555 | | | | 17,590 | | | | 6,617 | | | | 71,446 | | | | 1,000 | | | | 10,000 | |
| Institutional Shares | | | | | | | | | | | | | | | | | | | | | | | | |
Shares sold | | | — | | | | — | | | | — | | | | 5 | | | | 995,001 | | | | 9,950,011 | |
Reinvestment of distributions | | | 36,839 | | | | 415,824 | | | | 8,690 | | | | 87,162 | | | | — | | | | — | |
Shares redeemed | | | (55,625 | ) | | | (625,000 | ) | | | — | | | | (5 | ) | | | (1 | ) | | | (10 | ) |
| | | | (18,786 | ) | | | (209,176 | ) | | | 8,690 | | | | 87,162 | | | | 995,000 | | | | 9,950,001 | |
| Service Shares | | | | | | | | | | | | | | | | | | | | | | | | |
Shares sold | | | — | | | | — | | | | — | | | | — | | | | 1,001 | | | | 10,011 | |
Reinvestment of distributions | | | 32 | | | | 363 | | | | 7 | | | | 70 | | | | — | | | | — | |
Shares redeemed | | | — | | | | — | | | | — | | | | — | | | | (1 | ) | | | (11 | ) |
| | | | 32 | | | | 363 | | | | 7 | | | | 70 | | | | 1,000 | | | | 10,000 | |
| Investor Shares(c) | | | | | | | | | | | | | | | | | | | | | | | | |
Shares sold | | | 56,891 | | | | 638,755 | | | | 14,630 | | | | 160,250 | | | | 1,001 | | | | 10,011 | |
Reinvestment of distributions | | | 1,397 | | | | 15,748 | | | | 8 | | | | 82 | | | | — | | | | — | |
Shares redeemed | | | (15,418 | ) | | | (174,767 | ) | | | (6,852 | ) | | | (75,444 | ) | | | (1 | ) | | | (11 | ) |
| | | | 42,870 | | | | 479,736 | | | | 7,786 | | | | 84,888 | | | | 1,000 | | | | 10,000 | |
| Class R Shares | | | | | | | | | | | | | | | | | | | | | | | | |
Shares sold | | | 820 | | | | 9,272 | | | | 1,645 | | | | 17,338 | | | | 1,001 | | | | 10,011 | |
Reinvestment of distributions | | | 91 | | | | 1,025 | | | | 6 | | | | 65 | | | | — | | | | — | |
Shares redeemed | | | (5 | ) | | | (60 | ) | | | (2 | ) | | | (23 | ) | | | (1 | ) | | | (11 | ) |
| | | | 906 | | | | 10,237 | | | | 1,649 | | | | 17,380 | | | | 1,000 | | | | 10,000 | |
| Class R6 Shares | | | | | | | | | | | | | | | | | | | | | | | | |
Shares sold | | | 22,593 | | | | 256,349 | | | | 250 | | | | 2,736 | | | | 1,001 | | | | 10,011 | |
Reinvestment of distributions | | | 269 | | | | 3,031 | | | | 9 | | | | 88 | | | | — | | | | — | |
Shares redeemed | | | (933 | ) | | | (10,762 | ) | | | (1 | ) | | | (11 | ) | | | (1 | ) | | | (11 | ) |
| | | | 21,929 | | | | 248,618 | | | | 258 | | | | 2,813 | | | | 1,000 | | | | 10,000 | |
NET INCREASE | | | 48,506 | | | $ | 547,368 | | | | 25,007 | | | $ | 263,759 | | | | 1,000,000 | | | $ | 10,000,001 | |
| (a) | | The Portfolios changed their fiscal year end from October 31 to August 31. |
| (b) | | Commenced operations on August 22, 2016. |
| (c) | | Effective October 10, 2017, Class IR Shares changed its name to Investor Shares. |
136
GOLDMAN SACHS TARGET DATE PORTFOLIOS
|
| 10. SUMMARY OF SHARE TRANSACTIONS (continued) |
| | | | | | | | | | | | | | | | | | | | | | | | |
| | | Target Date 2050 Portfolio | |
| | | | |
| | | For the Fiscal Year Ended
August 31, 2018 | | | For the Period
November 1, 2016 –
August 31, 2017(a) | | | For the Fiscal Year Ended
October 31, 2016 | |
| | | | |
| | | Shares | | | Dollars | | | Shares | | | Dollars | | | Shares | | | Dollars | |
| | | | |
| Class A Shares(b) | | | | | | | | | | | | | | | | | | | | | | | | |
Shares sold | | | 15,311 | | | $ | 161,552 | | | | 3,615 | | | $ | 37,062 | | | | 1,001 | | | $ | 10,010 | |
Reinvestment of distributions | | | 703 | | | | 7,281 | | | | 62 | | | | 600 | | | | — | | | | — | |
Shares redeemed | | | (244 | ) | | | (2,564 | ) | | | (1 | ) | | | (12 | ) | | | (1 | ) | | | (11 | ) |
| | | | 15,770 | | | | 166,269 | | | | 3,676 | | | | 37,650 | | | | 1,000 | | | | 9,999 | |
| Institutional Shares(b) | | | | | | | | | | | | | | | | | | | | | | | | |
Shares sold | | | — | | | | — | | | | 1 | | | | 5 | | | | 1,001 | | | | 10,010 | |
Reinvestment of distributions | | | 88 | | | | 913 | | | | 63 | | | | 614 | | | | — | | | | — | |
Shares redeemed | | | — | | | | — | | | | (1 | ) | | | (5 | ) | | | (1 | ) | | | (10 | ) |
| | | | 88 | | | | 913 | | | | 63 | | | | 614 | | | | 1,000 | | | | 10,000 | |
| Service Shares(b) | | | | | | | | | | | | | | | | | | | | | | | | |
Shares sold | | | — | | | | — | | | | — | | | | — | | | | 1,001 | | | | 10,010 | |
Reinvestment of distributions | | | 82 | | | | 856 | | | | 62 | | | | 596 | | | | — | | | | — | |
Shares redeemed | | | — | | | | — | | | | — | | | | — | | | | (1 | ) | | | (11 | ) |
| | | | 82 | | | | 856 | | | | 62 | | | | 596 | | | | 1,000 | | | | 9,999 | |
| Investor Shares(b)(c) | | | | | | | | | | | | | | | | | | | | | | | | |
Shares sold | | | 83,976 | | | | 892,132 | | | | 14,233 | | | | 149,919 | | | | 1,001 | | | | 10,010 | |
Reinvestment of distributions | | | 6,010 | | | | 62,421 | | | | 63 | | | | 609 | | | | — | | | | — | |
Shares redeemed | | | (27,334 | ) | | | (289,440 | ) | | | (495 | ) | | | (5,184 | ) | | | (1 | ) | | | (11 | ) |
| | | | 62,652 | | | | 665,113 | | | | 13,801 | | | | 145,344 | | | | 1,000 | | | | 9,999 | |
| Class R Shares(b) | | | | | | | | | | | | | | | | | | | | | | | | |
Shares sold | | | — | | | | — | | | | 3 | | | | 25 | | | | 1,001 | | | | 10,010 | |
Reinvestment of distributions | | | 81 | | | | 841 | | | | 61 | | | | 591 | | | | — | | | | — | |
Shares redeemed | | | — | | | | — | | | | — | | | | — | | | | (1 | ) | | | (11 | ) |
| | | | 81 | | | | 841 | | | | 64 | | | | 616 | | | | 1,000 | | | | 9,999 | |
| Class R6 Shares | | | | | | | | | | | | | | | | | | | | | | | | |
Shares sold | | | 288,029 | | | | 3,035,833 | | | | 284,037 | | | | 2,820,844 | | | | 175,129 | | | | 1,678,882 | |
Reinvestment of distributions | | | 207,646 | | | | 2,160,926 | | | | 140,583 | | | | 1,362,253 | | | | 104,550 | | | | 977,547 | |
Shares redeemed | | | (227,773 | ) | | | (2,408,384 | ) | | | (157,962 | ) | | | (1,599,302 | ) | | | (128,796 | ) | | | (1,267,261 | ) |
| | | | 267,902 | | | | 2,788,375 | | | | 266,658 | | | | 2,583,795 | | | | 150,883 | | | | 1,389,168 | |
NET INCREASE | | | 346,575 | | | $ | 3,622,367 | | | | 284,324 | | | $ | 2,768,615 | | | | 155,883 | | | $ | 1,439,164 | |
| (a) | | The Portfolios changed their fiscal year end from October 31 to August 31. |
| (b) | | Commenced operations on August 22, 2016. |
| (c) | | Effective October 10, 2017, Class IR Shares changed its name to Investor Shares. |
137
GOLDMAN SACHS TARGET DATE PORTFOLIOS
Notes to Financial Statements (continued)
August 31, 2018
|
| 10. SUMMARY OF SHARE TRANSACTIONS (continued) |
| | | | | | | | | | | | | | | | | | | | | | | | |
| | | Target Date 2055 Portfolio | |
| | | | |
| | | For the Fiscal Year Ended
August 31, 2018 | | | For the Period
November 1, 2016 –
August 31, 2017(a) | | | For the Fiscal Year Ended
October 31, 2016(b) | |
| | | | |
| | | Shares | | | Dollars | | | Shares | | | Dollars | | | Shares | | | Dollars | |
| | | | |
| Class A Shares | | | | | | | | | | | | | | | | | | | | | | | | |
Shares sold | | | 2,113 | | | $ | 24,381 | | | | 6,796 | | | $ | 71,928 | | | | 1,001 | | | $ | 10,011 | |
Reinvestment of distributions | | | 311 | | | | 3,564 | | | | 10 | | | | 98 | | | | — | | | | — | |
Shares redeemed | | | (258 | ) | | | (3,011 | ) | | | (1 | ) | | | (10 | ) | | | (1 | ) | | | (11 | ) |
| | | | 2,166 | | | | 24,934 | | | | 6,805 | | | | 72,016 | | | | 1,000 | | | | 10,000 | |
| Institutional Shares | | | | | | | | | | | | | | | | | | | | | | | | |
Shares sold | | | — | | | | 5 | | | | — | | | | 5 | | | | 995,001 | | | | 9,950,011 | |
Reinvestment of distributions | | | 41,458 | | | | 476,510 | | | | 9,014 | | | | 91,043 | | | | — | | | | — | |
Shares redeemed | | | (54,494 | ) | | | (625,005 | ) | | | — | | | | (5 | ) | | | (1 | ) | | | (10 | ) |
| | | | (13,036 | ) | | | (148,490 | ) | | | 9,014 | | | | 91,043 | | | | 995,000 | | | | 9,950,001 | |
| Service Shares | | | | | | | | | | | | | | | | | | | | | | | | |
Shares sold | | | — | | | | — | | | | — | | | | — | | | | 1,001 | | | | 10,011 | |
Reinvestment of distributions | | | 37 | | | | 423 | | | | 7 | | | | 74 | | | | — | | | | — | |
Shares redeemed | | | — | | | | — | | | | — | | | | — | | | | (1 | ) | | | (11 | ) |
| | | | 37 | | | | 423 | | | | 7 | | | | 74 | | | | 1,000 | | | | 10,000 | |
| Investor Shares(c) | | | | | | | | | | | | | | | | | | | | | | | | |
Shares sold | | | 32,754 | | | | 374,892 | | | | 8,035 | | | | 89,578 | | | | 1,001 | | | | 10,011 | |
Reinvestment of distributions | | | 1,132 | | | | 12,994 | | | | 9 | | | | 86 | | | | — | | | | — | |
Shares redeemed | | | (133 | ) | | | (1,552 | ) | | | (1 | ) | | | (13 | ) | | | (1 | ) | | | (11 | ) |
| | | | 33,753 | | | | 386,334 | | | | 8,043 | | | | 89,651 | | | | 1,000 | | | | 10,000 | |
| Class R Shares | | | | | | | | | | | | | | | | | | | | | | | | |
Shares sold | | | 2,106 | | | | 24,081 | | | | — | | | | — | | | | 1,001 | | | | 10,011 | |
Reinvestment of distributions | | | 106 | | | | 1,218 | | | | 7 | | | | 69 | | | | — | | | | — | |
Shares redeemed | | | (5 | ) | | | (57 | ) | | | — | | | | — | | | | (1 | ) | | | (11 | ) |
| | | | 2,207 | | | | 25,242 | | | | 7 | | | | 69 | | | | 1,000 | | | | 10,000 | |
| Class R6 Shares | | | | | | | | | | | | | | | | | | | | | | | | |
Shares sold | | | 12,947 | | | | 149,934 | | | | 1,444 | | | | 15,400 | | | | 1,001 | | | | 10,011 | |
Reinvestment of distributions | | | 209 | | | | 2,400 | | | | 9 | | | | 92 | | | | — | | | | — | |
Shares redeemed | | | (2,103 | ) | | | (24,746 | ) | | | (2 | ) | | | (25 | ) | | | (1 | ) | | | (11 | ) |
| | | | 11,053 | | | | 127,588 | | | | 1,451 | | | | 15,467 | | | | 1,000 | | | | 10,000 | |
NET INCREASE | | | 36,180 | | | $ | 416,031 | | | | 25,327 | | | $ | 268,320 | | | | 1,000,000 | | | $ | 10,000,001 | |
| (a) | | The Portfolios changed their fiscal year end from October 31 to August 31. |
| (b) | | Commenced operations on August 22, 2016. |
| (c) | | Effective October 10, 2017, Class IR Shares changed its name to Investor Shares. |
138
GOLDMAN SACHS TARGET DATE PORTFOLIOS
|
| 10. SUMMARY OF SHARE TRANSACTIONS (continued) |
| | | | | | | | |
| | | Target Date 2060 Portfolio | |
| | | | |
| | | For the Period Ended
August 31, 2018(a) | |
| | | | |
| | | Shares | | | Dollars | |
| | | | |
| Class A Shares | | | | | | | | |
Shares sold | | | 1,000 | | | $ | 10,000 | |
| Institutional Shares | | | | | | | | |
Shares sold | | | 1,000 | | | | 10,000 | |
| Service Shares | | | | | | | | |
Shares sold | | | 1,000 | | | | 10,000 | |
| Investor Shares | | | | | | | | |
Shares sold | | | 1,000 | | | | 10,000 | |
| Class R Shares | | | | | | | | |
Shares sold | | | 1,000 | | | | 10,000 | |
| Class R6 Shares | | | | | | | | |
Shares sold | | | 495,001 | | | | 4,950,010 | |
Shares redeemed | | | (1 | ) | | | (10 | ) |
| | | | 495,000 | | | | 4,950,000 | |
NET INCREASE | | | 500,000 | | | $ | 5,000,000 | |
| (a) | | Commenced operations on April 30, 2018. |
139
Report of Independent Registered Public
Accounting Firm
To the Board of Trustees of Goldman Sachs Trust II and Shareholders of Goldman Sachs Target Date 2020 Portfolio, Goldman Sachs Target Date 2025 Portfolio, Goldman Sachs Target Date 2030 Portfolio, Goldman Sachs Target Date 2035 Portfolio, Goldman Sachs Target Date 2040 Portfolio, Goldman Sachs Target Date 2045 Portfolio, Goldman Sachs Target Date 2050 Portfolio, Goldman Sachs Target Date 2055 Portfolio, and Goldman Sachs Target Date 2060 Portfolio
Opinions on the Financial Statements
We have audited the accompanying statements of assets and liabilities, including the schedules of investments, of each of the portfolios listed in the table below (nine of the portfolios constituting Goldman Sachs Trust II, hereafter collectively referred to as the “Portfolios”) as of August 31, 2018, the related statements of operations and of changes in net assets for each of the periods indicated in the table below, including the related notes, and the financial highlights for each of the periods indicated in the table below (collectively referred to as the “financial statements”). In our opinion, the financial statements present fairly, in all material respects, the financial position of each of the Portfolios as of August 31, 2018, the results of each of their operations, the changes in each of their net assets, and each of the financial highlights for each of the periods indicated in the table below in conformity with accounting principles generally accepted in the United States of America.
| | | | | | |
| Portfolio | | Statement of
operations | | Statements of changes in net assets | | Financial highlights |
Goldman Sachs Target Date 2020 Portfolio, Goldman Sachs Target Date 2030 Portfolio, Goldman Sachs Target Date 2040 Portfolio, Goldman Sachs Target Date 2050 Portfolio | | For the year ended August 31, 2018 | | For the year ended August 31, 2018, for the period November 1, 2016 through August 31, 2017, and for the year ended October 31, 2016 | | For each of the periods ended subsequent to October 31, 2015 indicated therein |
Goldman Sachs Target Date 2025 Portfolio, Goldman Sachs Target Date 2035 Portfolio, Goldman Sachs Target Date 2045 Portfolio, Goldman Sachs Target Date 2055 Portfolio | | For the year ended
August 31, 2018 | | For the year ended August 31, 2018, for the period November 1, 2016 through August 31, 2017, and for the period August 22, 2016 (commencement of operations) through October 31, 2016 |
| Goldman Sachs Target Date 2060 Portfolio | | For the period April 30, 2018 (commencement of operations) through August 31, 2018 |
The financial statements of Goldman Sachs Target Date 2020 Portfolio, Goldman Sachs Target Date 2030 Portfolio, Goldman Sachs Target Date 2040 Portfolio, and Goldman Sachs Target Date 2050 Portfolio as of and for the year ended October 31, 2015 and the financial highlights for each of the periods ended on or prior to October 31, 2015 (not presented herein, other than the financial highlights) were audited by other auditors whose report dated December 18, 2015 expressed unqualified opinions on those financial statements and financial highlights.
Basis for Opinions
These financial statements are the responsibility of the Portfolios’ management. Our responsibility is to express an opinion on the Portfolios’ financial statements based on our audits. We are a public accounting firm registered with the Public Company Accounting Oversight Board (United States) (“PCAOB”) and are required to be independent with respect to the Portfolios in accordance with the U.S. federal securities laws and the applicable rules and regulations of the Securities and Exchange Commission and the PCAOB.
We conducted our audits of these financial statements in accordance with the standards of the PCAOB. Those standards require that we plan and perform the audit to obtain reasonable assurance about whether the financial statements are free of material misstatement, whether due to error or fraud.
Our audits included performing procedures to assess the risks of material misstatement of the financial statements, whether due to error or fraud, and performing procedures that respond to those risks. Such procedures included examining, on a test basis, evidence regarding the amounts and disclosures in the financial statements. Our audits also included evaluating the accounting principles used and significant estimates made by management, as well as evaluating the overall presentation of the financial statements. Our procedures included confirmation of securities owned as of August 31, 2018 by correspondence with the custodian, transfer agent and brokers; when replies were not received from brokers, we performed other auditing procedures. We believe that our audits provide a reasonable basis for our opinions.
PricewaterhouseCoopers LLP
Boston, Massachusetts
October 26, 2018
We have served as the auditor of one or more investment companies in the Goldman Sachs fund complex since 2000.
140
GOLDMAN SACHS TARGET DATE PORTFOLIOS
| | |
Fund Expenses — Period Ended August 31, 2018 (Unaudited) | | |
As a shareholder of Class A, Institutional, Service, Investor, Class R, and Class R6 Shares of the Portfolios, you incur two types of costs: (1) transaction costs, including sales charges on purchase payments (with respect to Class A Shares), and (2) ongoing costs, including management fees; distribution and/or service (12b-1) fees (with respect to Class A, Service and Class R Shares); and other Portfolio expenses. This example is intended to help you understand your ongoing costs (in dollars) of investing in Class A, Institutional, Service, Investor, Class R or Class R6 Shares of the Portfolios and to compare these costs with the ongoing costs of investing in other mutual funds.
The example is based on an investment of $1,000 invested at the beginning of the period and held for the entire period from March 1, 2018 through August 31, 2018, which represents a period of 184 days out of a 365 day year. The Target Date 2060 Portfolio example is based on the period from April 30, 2018 through August 31, 2018, which represents a period of 123 days out of 365 days. The Target Date 2060 Portfolio example for hypothetical expenses reflects projected activity for the period from March 1, 2018 through August 31, 2018 for the purposes of comparability. This projection assumes that annualized expense ratios were in effect during the period.
Actual Expenses — The first line under each share class in the table below provides information about actual account values and actual expenses. You may use the information in this line, together with the amount you invested, to estimate the expenses that you paid over the period. Simply divide your account value by $1,000 (for example, an $8,600 account value divided by $1,000=8.6), then multiply the result by the number in the first line under the heading entitled “Expenses Paid” to estimate the expenses you paid on your account during this period.
Hypothetical Example for Comparison Purposes — The second line under each share class in the table below provides information about hypothetical account values and hypothetical expenses based on the Portfolios’ actual net expense ratios and an assumed rate of return of 5% per year before expenses, which is not the Portfolios’ actual return. The hypothetical account values and expenses may not be used to estimate the actual ending account balance or expenses you paid for the period. You may use this information to compare the ongoing costs of investing in the Portfolios and other funds. To do so, compare this 5% hypothetical example with the 5% hypothetical examples that appear in the shareholder reports of the other funds.
Please note that the expenses shown in the table are meant to highlight your ongoing costs only and do not reflect any transactional costs, such as sales charges, redemption fees, or exchange fees and do not include expenses of Underlying Funds in which the Portfolios invest. Therefore, the second line of the table is useful in comparing ongoing costs only, and will not help you determine the relative total costs of owning different funds. In addition, if these transactional costs were included, your costs would have been higher.
| | | | | | | | | | | | | | | | | | | | | | | | | | | | | | | | | | | | |
| | | Target Date 2020 Portfolio | | | Target Date 2025 Portfolio | | | Target Date 2030 Portfolio | |
| Share Class | | Beginning
Account Value
3/1/18 | | | Ending
Account Value
8/31/18 | | | Expenses
Paid for the
6 months
ended
8/31/18* | | | Beginning
Account Value
3/1/18 | | | Ending
Account Value
8/31/18 | | | Expenses
Paid for the
6 months
ended
8/31/18* | | | Beginning
Account Value
3/1/18 | | | Ending
Account Value
8/31/18 | | | Expenses
Paid for the
6 months
ended
8/31/18* | |
| Class A | | | | | | | | | | | | | | | | | | | | | | | | | | | | | | | | | | | | |
Actual | | $ | 1,000.00 | | | $ | 1,018.50 | | | $ | 3.61 | | | $ | 1,000.00 | | | $ | 1,025.30 | | | $ | 3.52 | | | $ | 1,000.00 | | | $ | 1,030.90 | | | $ | 3.63 | |
Hypothetical 5% return | | | 1,000.00 | | | | 1,021.63 | + | | | 3.62 | | | | 1,000.00 | | | | 1,021.63 | + | | | 3.52 | | | | 1,000.00 | | | | 1,021.63 | + | | | 3.62 | |
| Institutional | | | | | | | | | | | | | | | | | | | | | | | | | | | | | | | | | | | | |
Actual | | | 1,000.00 | | | | 1,021.70 | | | | 1.63 | | | | 1,000.00 | | | | 1,027.30 | | | | 1.53 | | | | 1,000.00 | | | | 1,031.80 | | | | 1.69 | |
Hypothetical 5% return | | | 1,000.00 | | | | 1,023.59 | + | | | 1.63 | | | | 1,000.00 | | | | 1,023.69 | + | | | 1.53 | | | | 1,000.00 | | | | 1,023.54 | + | | | 1.68 | |
| Service | | | | | | | | | | | | | | | | | | | | | | | | | | | | | | | | | | | | |
Actual | | | 1,000.00 | | | | 1,018.50 | | | | 4.17 | | | | 1,000.00 | | | | 1,025.40 | | | | 4.14 | | | | 1,000.00 | | | | 1,029.80 | | | | 4.25 | |
Hypothetical 5% return | | | 1,000.00 | | | | 1,021.07 | + | | | 4.18 | | | | 1,000.00 | | | | 1,021.07 | + | | | 4.13 | | | | 1,000.00 | | | | 1,021.07 | + | | | 4.23 | |
| Investor(a) | | | | | | | | | | | | | | | | | | | | | | | | | | | | | | | | | | | | |
Actual | | | 1,000.00 | | | | 1,020.60 | | | | 2.29 | | | | 1,000.00 | | | | 1,026.30 | | | | 2.25 | | | | 1,000.00 | | | | 1,030.90 | | | | 2.30 | |
Hypothetical 5% return | | | 1,000.00 | | | | 1,022.94 | + | | | 2.29 | | | | 1,000.00 | | | | 1,022.99 | + | | | 2.24 | | | | 1,000.00 | | | | 1,022.94 | + | | | 2.29 | |
| Class R | | | | | | | | | | | | | | | | | | | | | | | | | | | | | | | | | | | | |
Actual | | | 1,000.00 | | | | 1,017.40 | | | | 4.88 | | | | 1,000.00 | | | | 1,023.50 | | | | 4.79 | | | | 1,000.00 | | | | 1,028.80 | | | | 4.81 | |
Hypothetical 5% return | | | 1,000.00 | | | | 1,020.37 | + | | | 4.89 | | | | 1,000.00 | | | | 1,020.37 | + | | | 4.79 | | | | 1,000.00 | | | | 1,020.37 | + | | | 4.79 | |
| Class R6 | | | | | | | | | | | | | | | | | | | | | | | | | | | | | | | | | | | | |
Actual | | | 1,000.00 | | | | 1,021.70 | | | | 1.48 | | | | 1,000.00 | | | | 1,027.30 | | | | 1.43 | | | | 1,000.00 | | | | 1,031.80 | | | | 1.49 | |
Hypothetical 5% return | | | 1,000.00 | | | | 1,023.74 | + | | | 1.48 | | | | 1,000.00 | | | | 1,023.79 | + | | | 1.43 | | | | 1,000.00 | | | | 1,023.74 | + | | | 1.48 | |
| | + | | Hypothetical expenses are based on each Portfolio’s actual annualized net expense ratios and an assumed rate of return of 5% per year before expenses. | |
| | * | | Expenses for each share class are calculated using each Portfolio’s annualized net expense ratio for each class, which represents the ongoing expenses as a percentage of net assets for the six months ended August 31, 2018. Expenses are calculated by multiplying the annualized net expense ratio by the average account value for the period; then multiplying the result by the number of days in the most recent fiscal half year; and then dividing that result by the number of days in the fiscal year. The annualized net expense ratios for the period were as follows: | |
| | | | | | | | | | | | | | | | | | | | | | | | |
| Fund | | Class A | | | Institutional | | | Service | | | Investor(a) | | | Class R | | | Class R6 | |
Target Date 2020 Portfolio | | | 0.71 | % | | | 0.32 | % | | | 0.82 | % | | | 0.45 | % | | | 0.96 | % | | | 0.29 | % |
Target Date 2025 Portfolio | | | 0.69 | | | | 0.30 | | | | 0.81 | | | | 0.44 | | | | 0.94 | | | | 0.28 | |
Target Date 2030 Portfolio | | | 0.71 | | | | 0.33 | | | | 0.83 | | | | 0.45 | | | | 0.94 | | | | 0.29 | |
| | (a) | | Effective October 10, 2017, Class IR Shares changed its name to Investor Shares. | |
141
GOLDMAN SACHS TARGET DATE PORTFOLIOS
| | |
Fund Expenses — Period Ended August 31, 2018 (Unaudited) (continued) | | |
| | | | | | | | | | | | | | | | | | | | | | | | | | | | | | | | | | | | |
| | | Target Date 2035 Portfolio | | | Target Date 2040 Portfolio | | | Target Date 2045 Portfolio | |
| Share Class | | Beginning
Account Value
3/1/18 | | | Ending
Account Value
8/31/18 | | | Expenses
Paid for the
6 months
ended
8/31/18* | | | Beginning
Account Value
3/1/18 | | | Ending
Account Value
8/31/18 | | | Expenses
Paid for the
6 months
ended
8/31/18* | | | Beginning
Account Value
3/1/18 | | | Ending
Account Value
8/31/18 | | | Expenses
Paid for the
6 months
ended
8/31/18* | |
| Class A | | | | | | | | | | | | | | | | | | | | | | | | | | | | | | | | | | | | |
Actual | | $ | 1,000.00 | | | $ | 1,031.80 | | | $ | 3.58 | | | $ | 1,000.00 | | | $ | 1,032.60 | | | $ | 3.59 | | | $ | 1,000.00 | | | $ | 1,033.90 | | | $ | 3.54 | |
Hypothetical 5% return | | | 1,000.00 | | | | 1,021.68 | + | | | 3.57 | | | | 1,000.00 | | | | 1,021.68 | + | | | 3.57 | | | | 1,000.00 | | | | 1,021.68 | + | | | 3.52 | |
| Institutional | | | | | | | | | | | | | | | | | | | | | | | | | | | | | | | | | | | | |
Actual | | | 1,000.00 | | | | 1,033.60 | | | | 1.54 | | | | 1,000.00 | | | | 1,035.80 | | | | 1.64 | | | | 1,000.00 | | | | 1,036.50 | | | | 1.54 | |
Hypothetical 5% return | | | 1,000.00 | | | | 1,023.69 | + | | | 1.53 | | | | 1,000.00 | | | | 1,023.59 | + | | | 1.63 | | | | 1,000.00 | | | | 1,023.69 | + | | | 1.53 | |
| Service | | | | | | | | | | | | | | | | | | | | | | | | | | | | | | | | | | | | |
Actual | | | 1,000.00 | | | | 1,030.90 | | | | 4.10 | | | | 1,000.00 | | | | 1,031.50 | | | | 4.20 | | | | 1,000.00 | | | | 1,032.90 | | | | 4.15 | |
Hypothetical 5% return | | | 1,000.00 | | | | 1,021.07 | + | | | 4.08 | | | | 1,000.00 | | | | 1,021.07 | + | | | 4.18 | | | | 1,000.00 | | | | 1,021.07 | + | | | 4.13 | |
| Investor(a) | | | | | | | | | | | | | | | | | | | | | | | | | | | | | | | | | | | | |
Actual | | | 1,000.00 | | | | 1,032.80 | | | | 2.25 | | | | 1,000.00 | | | | 1,033.70 | | | | 2.31 | | | | 1,000.00 | | | | 1,034.70 | | | | 2.26 | |
Hypothetical 5% return | | | 1,000.00 | | | | 1,022.99 | + | | | 2.24 | | | | 1,000.00 | | | | 1,022.94 | + | | | 2.29 | | | | 1,000.00 | | | | 1,022.99 | + | | | 2.24 | |
| Class R | | | | | | | | | | | | | | | | | | | | | | | | | | | | | | | | | | | | |
Actual | | | 1,000.00 | | | | 1,030.00 | | | | 4.91 | | | | 1,000.00 | | | | 1,031.60 | | | | 4.86 | | | | 1,000.00 | | | | 1,033.00 | | | | 4.82 | |
Hypothetical 5% return | | | 1,000.00 | | | | 1,020.42 | + | | | 4.89 | | | | 1,000.00 | | | | 1,020.42 | + | | | 4.84 | | | | 1,000.00 | | | | 1,020.42 | + | | | 4.79 | |
| Class R6 | | | | | | | | | | | | | | | | | | | | | | | | | | | | | | | | | | | | |
Actual | | | 1,000.00 | | | | 1,033.60 | | | | 1.44 | | | | 1,000.00 | | | | 1,034.70 | | | | 1.49 | | | | 1,000.00 | | | | 1,035.60 | | | | 1.44 | |
Hypothetical 5% return | | | 1,000.00 | | | | 1,023.79 | + | | | 1.43 | | | | 1,000.00 | | | | 1,023.74 | + | | | 1.48 | | | | 1,000.00 | | | | 1,023.79 | + | | | 1.43 | |
| | + | | Hypothetical expenses are based on each Portfolio’s actual annualized net expense ratios and an assumed rate of return of 5% per year before expenses. | |
| | * | | Expenses for each share class are calculated using each Portfolio’s annualized net expense ratio for each class, which represents the ongoing expenses as a percentage of net assets for the six months ended August 31, 2018. Expenses are calculated by multiplying the annualized net expense ratio by the average account value for the period; then multiplying the result by the number of days in the most recent fiscal half year; and then dividing that result by the number of days in the fiscal year. The annualized net expense ratios for the period were as follows: | |
| | | | | | | | | | | | | | | | | | | | | | | | |
| Fund | | Class A | | | Institutional | | | Service | | | Investor(a) | | | Class R | | | Class R6 | |
Target Date 2035 Portfolio | | | 0.70 | % | | | 0.30 | % | | | 0.80 | % | | | 0.44 | % | | | 0.96 | % | | | 0.28 | % |
Target Date 2040 Portfolio | | | 0.70 | | | | 0.32 | | | | 0.82 | | | | 0.45 | | | | 0.95 | | | | 0.29 | |
Target Date 2045 Portfolio | | | 0.69 | | | | 0.30 | | | | 0.81 | | | | 0.44 | | | | 0.94 | | | | 0.28 | |
| | (a) | | Effective October 10, 2017, Class IR Shares changed its name to Investor Shares. | |
142
GOLDMAN SACHS TARGET DATE PORTFOLIOS
| | |
Fund Expenses — Period Ended August 31, 2018 (Unaudited) (continued) | | |
| | | | | | | | | | | | | | | | | | | | | | | | | | | | | | | | | | | | |
| | | Target Date 2050 Portfolio | | | Target Date 2055 Portfolio | | | Target Date 2060 Portfolio(a) | |
| Share Class | | Beginning
Account Value
3/1/18 | | | Ending
Account Value
8/31/18 | | | Expenses
Paid for the
6 months
ended
8/31/18* | | | Beginning
Account Value
3/1/18 | | | Ending
Account Value
8/31/18 | | | Expenses
Paid for the
6 months
ended
8/31/18* | | | Beginning
Account Value
3/1/18 | | | Ending
Account Value
8/31/18 | | | Expenses
Paid for the
6 months
ended
8/31/18* | |
| Class A | | | | | | | | | | | | | | | | | | | | | | | | | | | | | | | | | | | | |
Actual | | $ | 1,000.00 | | | $ | 1,034.90 | | | $ | 3.59 | | | $ | 1,000.00 | | | $ | 1,035.80 | | | $ | 3.54 | | | $ | 1,000.00 | | | $ | 1,045.00 | | | $ | 2.38 | |
Hypothetical 5% return | | | 1,000.00 | | | | 1,021.68 | + | | | 3.57 | | | | 1,000.00 | | | | 1,021.68 | + | | | 3.52 | | | | 1,000.00 | | | | 1,021.68 | + | | | 3.50 | |
| Institutional | | | | | | | | | | | | | | | | | | | | | | | | | | | | | | | | | | | | |
Actual | | | 1,000.00 | | | | 1,036.70 | | | | 1.54 | | | | 1,000.00 | | | | 1,038.30 | | | | 1.54 | | | | 1,000.00 | | | | 1,046.00 | | | | 1.03 | |
Hypothetical 5% return | | | 1,000.00 | | | | 1,023.69 | + | | | 1.53 | | | | 1,000.00 | | | | 1,023.69 | + | | | 1.53 | | | | 1,000.00 | | | | 1,023.69 | + | | | 1.52 | |
| Service | | | | | | | | | | | | | | | | | | | | | | | | | | | | | | | | | | | | |
Actual | | | 1,000.00 | | | | 1,034.80 | | | | 4.10 | | | | 1,000.00 | | | | 1,034.90 | | | | 4.05 | | | | 1,000.00 | | | | 1,044.00 | | | | 2.76 | |
Hypothetical 5% return | | | 1,000.00 | | | | 1,021.17 | + | | | 4.08 | | | | 1,000.00 | | | | 1,021.17 | + | | | 4.02 | | | | 1,000.00 | | | | 1,021.17 | + | | | 4.06 | |
| Investor(a) | | | | | | | | | | | | | | | | | | | | | | | | | | | | | | | | | | | | |
Actual | | | 1,000.00 | | | | 1,036.80 | | | | 2.31 | | | | 1,000.00 | | | | 1,036.60 | | | | 2.26 | | | | 1,000.00 | | | | 1,046.00 | | | | 1.52 | |
Hypothetical 5% return | | | 1,000.00 | | | | 1,022.94 | + | | | 2.29 | | | | 1,000.00 | | | | 1,022.99 | + | | | 2.24 | | | | 1,000.00 | | | | 1,022.99 | + | | | 2.23 | |
| Class R | | | | | | | | | | | | | | | | | | | | | | | | | | | | | | | | | | | | |
Actual | | | 1,000.00 | | | | 1,033.80 | | | | 4.87 | | | | 1,000.00 | | | | 1,034.10 | | | | 4.82 | | | | 1,000.00 | | | | 1,044.00 | | | | 3.24 | |
Hypothetical 5% return | | | 1,000.00 | | | | 1,020.42 | + | | | 4.84 | | | | 1,000.00 | | | | 1,020.42 | + | | | 4.79 | | | | 1,000.00 | | | | 1,020.42 | + | | | 4.77 | |
| Class R6 | | | | | | | | | | | | | | | | | | | | | | | | | | | | | | | | | | | | |
Actual | | | 1,000.00 | | | | 1,036.70 | | | | 1.49 | | | | 1,000.00 | | | | 1,038.30 | | | | 1.44 | | | | 1,000.00 | | | | 1,046.00 | | | | 0.97 | |
Hypothetical 5% return | | | 1,000.00 | | | | 1,023.74 | + | | | 1.48 | | | | 1,000.00 | | | | 1,023.79 | + | | | 1.43 | | | | 1,000.00 | | | | 1,023.79 | + | | | 1.42 | |
| | + | | Hypothetical expenses are based on each Portfolio’s actual annualized net expense ratios and an assumed rate of return of 5% per year before expenses. | |
| | * | | Expenses for each share class are calculated using each Portfolio’s annualized net expense ratio for each class, which represents the ongoing expenses as a percentage of net assets for the six months ended August 31, 2018. Expenses are calculated by multiplying the annualized net expense ratio by the average account value for the period; then multiplying the result by the number of days in the most recent fiscal half year; and then dividing that result by the number of days in the fiscal year. The annualized net expense ratios for the period were as follows: | |
| | (a) | | Commenced operations on April 30, 2018. | |
| | | | | | | | | | | | | | | | | | | | | | | | |
| Fund | | Class A | | | Institutional | | | Service | | | Investor(b) | | | Class R | | | Class R6 | |
Target Date 2050 Portfolio | | | 0.70 | % | | | 0.30 | % | | | 0.80 | % | | | 0.45 | % | | | 0.95 | % | | | 0.29 | % |
Target Date 2055 Portfolio | | | 0.69 | | | | 0.30 | | | | 0.79 | | | | 0.44 | | | | 0.94 | | | | 0.28 | |
Target Date 2060 Portfolio(a) | | | 0.69 | | | | 0.30 | | | | 0.80 | | | | 0.44 | | | | 0.94 | | | | 0.28 | |
| | (b) | | Effective October 10, 2017, Class IR Shares changed its name to Investor Shares. | |
143
GOLDMAN SACHS TARGET DATE PORTFOLIOS
Statement Regarding Basis for Approval of Management Agreement and Sub-Advisory Agreement (Unaudited)
Background
The Goldman Sachs Target Date 2020 Portfolio, Goldman Sachs Target Date 2025 Portfolio, Goldman Sachs Target Date 2030 Portfolio, Goldman Sachs Target Date 2035 Portfolio, Goldman Sachs Target Date 2040 Portfolio, Goldman Sachs Target Date 2045 Portfolio, Goldman Sachs Target Date 2050 Portfolio, and Goldman Sachs Target Date 2055 Portfolio (the “Portfolios”) are investment portfolios of Goldman Sachs Trust II (the “Trust”). Each of the Goldman Sachs Target Date 2020, 2030, 2040, and 2050 Portfolios were successors to corresponding series of the Madison Target Retirement Funds (collectively, the “Predecessor Funds”). Each Predecessor Fund was managed by the Sub-Adviser (as defined below) and had an investment objective and strategy similar to that of the applicable Portfolio, and was reorganized into the applicable Portfolio on August 22, 2016.
The Board of Trustees oversees the management of the Trust and reviews the investment performance and expenses of the Portfolios at regularly scheduled meetings held throughout the year. In addition, the Board of Trustees determines annually whether to approve the continuance of the Trust’s investment management agreement (the “Management Agreement”) with Goldman Sachs Asset Management, L.P. (the “Investment Adviser”) on behalf of the Portfolios. The Management Agreement was most recently approved for continuation until August 31, 2019 by the Board of Trustees, including those Trustees who are not parties to the Management Agreement or “interested persons” (as defined in the Investment Company Act of 1940, as amended) of any party thereto (the “Independent Trustees”), at a meeting held on August 7-8, 2018 (the “Annual Meeting”).
At the Annual Meeting, the Board also considered the sub-advisory agreement (the “Sub-Advisory Agreement” and, together with the Management Agreement, the “Agreements”) between the Investment Adviser and Madison Asset Management, LLC (the “Sub-Adviser”). As discussed further below, the Trustees recognized that, effective on or about November 30, 2018, the Sub-Adviser would no longer serve as sub-adviser to the Goldman Sachs Target Date Portfolios and the Investment Adviser would assume responsibility for the day-to-day management of the Portfolios.
The review process undertaken by the Trustees spans the course of the year and culminates with the Annual Meeting. To assist the Trustees in their deliberations, the Trustees have established a Contract Review Committee (the “Committee”), comprised of the Independent Trustees. The Committee held five meetings over the course of the year since the Management Agreement was last approved. At those Committee meetings, regularly scheduled Board or other committee meetings, and/or the Annual Meeting, matters relevant to the renewal of the Management Agreement and the Sub-Advisory Agreement were considered by the Board, or the Independent Trustees, as applicable. With respect to each Portfolio, such matters included:
| | (a) | | the nature and quality of the advisory, administrative, and other services provided to the Portfolio by the Investment Adviser and its affiliates and the Sub-Adviser, including, as applicable, information about: |
| | (i) | | the structure, staff, and capabilities of the Investment Adviser, the Sub-Adviser and their respective portfolio management teams; |
| | (ii) | | the groups within the Investment Adviser and its affiliates that support the portfolio management teams or provide other types of necessary services, including fund services groups (e.g., accounting and financial reporting, tax, shareholder services, and operations); controls and risk management groups (e.g., legal, compliance, valuation oversight, credit risk management, internal audit, compliance testing, market risk analysis, finance, and central funding); sales and distribution support groups, and others (e.g., information technology and training); |
| | (iii) | | trends in employee headcount; |
| | (iv) | | the Investment Adviser’s financial resources and ability to hire and retain talented personnel and strengthen its operations; and |
| | (v) | | the parent company’s support of the Investment Adviser and its mutual fund business, as expressed by the firm’s senior management; |
| | (b) | | information on the investment performance of the Portfolio, including comparisons to the performance of similar mutual funds, as provided by a third-party mutual fund data provider engaged as part of the contract review process (the “Outside Data Provider”), and a benchmark performance index; and information on general investment outlooks in the markets in which the Portfolio invests; |
| | (c) | | information provided by the Investment Adviser indicating the Investment Adviser’s views on whether the Portfolio’s peer group and/or benchmark index had high, medium, or low relevance given the Portfolio’s particular investment strategy; |
| | (d) | | the terms of the Agreements and other agreements with affiliated service providers entered into by the Trust on behalf of the Portfolio; |
| | (e) | | fee and expense information for the Portfolio, including: |
| | (i) | | the relative management fee and expense levels of the Portfolio as compared to those of comparable funds managed by other advisers, as provided by the Outside Data Provider; and |
144
GOLDMAN SACHS TARGET DATE PORTFOLIOS
Statement Regarding Basis for Approval of Management Agreement and Sub-Advisory Agreement (Unaudited) (continued)
| | (ii) | | the Portfolio’s expense trends over time; |
| | (f) | | with respect to the investment performance and expense comparison data provided by the Outside Data Provider, its processes in producing that data for the Portfolio; |
| | (g) | | the undertakings of the Investment Adviser and its affiliates to implement fee waivers and/or expense limitations; |
| | (h) | | information relating to the profitability of the Management Agreement and the transfer agency, distribution and service arrangements of the Portfolio to the Investment Adviser and its affiliates; |
| | (i) | | whether the Portfolio’s existing management fee schedule adequately addressed any economies of scale; |
| | (j) | | a summary of the “fall-out” benefits derived by the Investment Adviser and its affiliates from their relationships with the Portfolio, including the fees received by the Investment Adviser’s affiliates from the Portfolio for transfer agency, portfolio trading, distribution and other services; |
| | (k) | | a summary of potential benefits derived by the Portfolio as a result of its relationship with the Investment Adviser; |
| | (l) | | portfolio manager ownership of Portfolio shares; the manner in which portfolio manager compensation is determined; information on the Sub-Adviser’s compensation arrangements; and the number and types of accounts managed by the portfolio managers; |
| | (m) | | the nature and quality of the services provided to the Portfolio by its unaffiliated service providers (including the Sub-Adviser), and the Investment Adviser’s general oversight and evaluation (including reports on due diligence) of those service providers as part of the administrative services provided under the Management Agreement; and |
| | (n) | | the Investment Adviser’s and Sub-Adviser’s processes and policies addressing various types of potential conflicts of interest; their approaches to risk management; the annual review of the effectiveness of the Portfolio’s compliance program; and periodic compliance reports. |
The Trustees also received an overview of the Portfolios’ distribution arrangements. They received information regarding the Portfolios’ assets, share purchase and redemption activity, and payment of distribution, service, and shareholder administration fees, as applicable. Information was also provided to the Trustees relating to revenue sharing payments made by and services provided by the Investment Adviser and its affiliates to intermediaries that promote the sale, distribution, and/or servicing of Portfolio shares. The Independent Trustees also discussed the broad range of other investment choices that are available to Portfolio investors, including the availability of comparable funds managed by other advisers.
The presentations made at the Board and Committee meetings and at the Annual Meeting encompassed the Portfolios and other mutual funds for which the Board of Trustees has responsibility. In evaluating the Agreements at the Annual Meeting, the Trustees relied upon their knowledge, resulting from their meetings and other interactions throughout the year, of the Portfolios and the respective services of the Investment Adviser and its affiliates, and the Sub-Adviser. In conjunction with these meetings, the Trustees received written materials and oral presentations on the topics covered, and the Investment Adviser addressed the questions and concerns of the Trustees, including concerns regarding the investment performance of certain of the funds they oversee. In addition, the Independent Trustees periodically received written materials and oral presentations from the funds’ various sub-advisers, including the Sub-Adviser. The Independent Trustees were advised by their independent legal counsel regarding their responsibilities and other regulatory requirements related to the approval and continuation of mutual fund investment management agreements under applicable law. In addition, the Investment Adviser and its affiliates provided the Independent Trustees with a written response to a formal request for information sent on behalf of the Independent Trustees by their independent legal counsel. The Independent Trustees reviewed a written response prepared by the Sub-Adviser to a similar request for information submitted to the Sub-Adviser by the Investment Adviser. During the course of their deliberations, the Independent Trustees met in executive sessions with their independent legal counsel, without representatives of the Investment Adviser or its affiliates present.
Nature, Extent, and Quality of the Services Provided Under the Management Agreement
As part of their review, the Trustees considered the nature, extent, and quality of the services provided to the Portfolios by the Investment Adviser. In this regard, the Trustees considered both the investment advisory services and non-advisory services (including oversight of the Sub-Adviser’s day-to-day management of the Portfolios) that are provided by the Investment Adviser and its affiliates. The Trustees considered the Investment Adviser’s experience in developing and implementing asset allocation strategies, as well as its ongoing research on optimizing the Portfolios’ “glide path.” The Trustees noted the ongoing recruitment efforts aimed at bringing high quality investment talent to the Investment Adviser. They also noted the Investment Adviser’s commitment to maintaining high quality systems and expending substantial resources to respond to ongoing changes to the regulatory and control environment in which the Portfolios and their service providers operate, as well as the efforts of the Investment Adviser and its affiliates to combat cyber security risks. The Trustees concluded that the Investment Adviser continued
145
GOLDMAN SACHS TARGET DATE PORTFOLIOS
Statement Regarding Basis for Approval of Management Agreement and Sub-Advisory Agreement (Unaudited) (continued)
to commit substantial financial and operational resources to the Portfolios and expressed confidence that the Investment Adviser would continue to do so in the future. The Trustees also recognized that the Investment Adviser had made significant commitments to address regulatory compliance requirements applicable to the Portfolios and the Investment Adviser and its affiliates.
Investment Performance
The Trustees considered the investment performance of the Portfolios. In this regard, they compared the investment performance of each Portfolio to its peers using rankings and ratings compiled by the Outside Data Provider, and updated performance information prepared by the Investment Adviser using the Morningstar peer groups. The Trustees also reviewed each Portfolio’s investment performance relative to its performance benchmark. As part of this review, they considered the investment performance trends of the Portfolios over time, and reviewed the investment performance of each Portfolio in light of its investment objective and policies and market conditions.
In addition, the Trustees considered materials prepared and presentations made by the Investment Adviser’s senior management and the Sub-Adviser’s portfolio management personnel in which Portfolio performance was assessed. The Trustees also considered the Investment Adviser’s periodic reports with respect to the Portfolios’ risk profiles, and how the Investment Adviser’s approach to risk monitoring and management influences portfolio management.
The Trustees noted that each of the Portfolios (Institutional Shares) had placed in the fourth quartile of its respective performance peer group, and had underperformed its respective benchmark index for the one-year period ended March 31, 2018. They considered that, in addition to assuming day-to-day management responsibility for the Portfolios, the Investment Adviser had indicated that it intended to make certain enhancements to each Portfolio’s glide path strategy, which were designed to improve long-term performance.
Costs of Services Provided and Competitive Information
The Trustees considered the contractual terms of the Management Agreement, the fee rates payable by each Portfolio thereunder, and the net amount retained by the Investment Adviser after payment of sub-advisory fees. In this regard, the Trustees considered information on the services rendered by the Investment Adviser to the Portfolios, which included both advisory and administrative services that were directed to the needs and operations of the Portfolios as registered mutual funds.
In particular, the Trustees reviewed the analyses prepared by the Outside Data Provider regarding the expense rankings of the Portfolios, as well as additional information provided by the Investment Adviser throughout the year. The analyses provided a comparison of each Portfolio’s management fee and breakpoints to those of a relevant peer group and category universe; an expense analysis which compared each Portfolio’s overall net and gross expenses to a peer group and a category universe; and data comparing each Portfolio’s net expenses to the peer and category medians. The analyses also compared each Portfolio’s transfer agency, custody, distribution fees, other expenses, and fee waivers/reimbursements to those of the peer group and category medians. The Trustees concluded that the comparisons provided by the Outside Data Provider and the Investment Adviser were useful in evaluating the reasonableness of the management fees and total expenses paid by the Portfolios.
The Trustees considered the Investment Adviser’s undertaking to limit each Portfolio’s “other expenses” ratio (excluding certain expenses) to a specified level. In addition, the Trustees noted that shareholders are able to redeem their Portfolio shares at any time if shareholders believe that the Portfolio fees and expenses are too high or if they are dissatisfied with the performance of the Portfolio.
The Investment Adviser’s Profitability
The Trustees reviewed each Portfolio’s contribution to the Investment Adviser’s revenues and pre-tax profit margins. In this regard the Trustees noted that they had received, among other things, profitability analyses and summaries, revenue and expense schedules by Portfolio and by function (i.e., investment management, transfer agency, and distribution and service), and information on the Investment Adviser’s expense allocation methodology. They observed that the profitability and expense figures are substantially similar to those used by the Investment Adviser for many internal purposes, including compensation decisions among various business groups, and are thus subject to a vigorous internal debate about how certain revenue and expenses should be allocated.
The Trustees also noted that the internal audit group within the Goldman Sachs organization had audited the expense allocation methodology and that the internal audit group was satisfied with the reasonableness, consistency, and accuracy of the Investment Adviser’s expense allocation methodology and profitability analysis calculations. Profitability data for each Portfolio was provided for 2017 and 2016, and the Trustees considered this information in relation to the Investment Adviser’s overall profitability.
146
GOLDMAN SACHS TARGET DATE PORTFOLIOS
Statement Regarding Basis for Approval of Management Agreement and Sub-Advisory Agreement (Unaudited) (continued)
Economies of Scale
The Trustees considered the information that had been provided regarding whether there have been economies of scale with respect to the management of the Portfolios. The Trustees also considered the breakpoints in the fee rate payable under the Management Agreement for each of the Portfolios at the following annual percentage rates of the average daily net assets of the Portfolios:
| | | | |
| Average Daily Net Assets | | Management Fee Annual Rate | |
First $2 billion | | | 0.25 | % |
Next $3 billion | | | 0.23 | % |
Over $5 billion | | | 0.21 | % |
The Trustees noted that the breakpoints were designed to share potential economies of scale, if any, with the Portfolios and their shareholders as assets under management reach those asset levels. The Trustees considered the amounts of assets in the Portfolios; the Portfolios’ recent share purchase and redemption activity; the information provided by the Investment Adviser relating to the costs of the services provided by the Investment Adviser and its affiliates and their realized profits; information comparing fee rates charged by the Investment Adviser with fee rates charged to other funds in the peer group; and the Investment Adviser’s undertaking to limit certain expenses of the Portfolios that exceed specified levels. The Independent Trustees also considered the relationship between the advisory and sub-advisory fee rate schedules. Upon reviewing these matters at the Annual Meeting, the Trustees concluded that the fee breakpoints represented a means of assuring that benefits of scalability, if any, would be passed along to shareholders at the specified asset levels.
Other Benefits to the Investment Adviser and Its Affiliates
The Trustees also considered the other benefits derived by the Investment Adviser and its affiliates from their relationships with the Portfolios, including: (a) transfer agency fees received by Goldman Sachs & Co. LLC (“Goldman Sachs”); (b) the Investment Adviser’s ability to leverage the infrastructure designed to service the Portfolios on behalf of the Investment Adviser’s other clients; (c) the Investment Adviser’s ability to cross-market other products and services to Portfolio shareholders; (d) Goldman Sachs’ retention of certain fees as Portfolio distributor; (e) the Investment Adviser’s ability to negotiate better pricing with the Portfolios’ custodian on behalf of its other clients, as a result of the relationship with the Portfolios; and (f) the possibility that the working relationship between the Investment Adviser and the Portfolios’ third-party service providers (including the Sub-Adviser) may cause those service providers to be more likely to do business with other areas of Goldman Sachs. In the course of considering the foregoing, the Independent Trustees requested and received further information quantifying certain of these fall-out benefits.
Other Benefits to the Portfolios and Their Shareholders
The Trustees also noted that the Portfolios receive certain potential benefits as a result of their relationship with the Investment Adviser, including: (a) enhanced servicing from vendors because of the volume of business generated by the Investment Adviser and its affiliates; (b) the advantages received from the Investment Adviser’s knowledge and experience gained from managing other accounts and products; (c) the Investment Adviser’s ability to hire and retain qualified personnel to provide services to the Portfolios because of the reputation of the Goldman Sachs organization; (d) the Portfolios’ access, through the Investment Adviser, to certain firm-wide resources (e.g., proprietary risk management systems and databases), subject to certain restrictions; and (e) access to certain affiliated distribution channels.
Conclusion
In connection with their consideration of the Management Agreement, the Trustees gave weight to various factors, but did not identify any particular factor as controlling their decision. After deliberation and consideration of the information provided, including the factors described above, the Trustees, including the Independent Trustees, unanimously concluded, in the exercise of their business judgment, that the investment management fees paid by each Portfolio were reasonable in light of the factors considered, and that the Management Agreement, and the terms thereof, should be approved and continued with respect to each Portfolio until August 31, 2019.
147
GOLDMAN SACHS TARGET DATE PORTFOLIOS
Statement Regarding Basis for Approval of Management Agreement and Sub-Advisory Agreement (Unaudited) (continued)
Sub-Advisory Agreement with Madison Asset Management, LLC
Background
In evaluating the Sub-Advisory Agreement, the Trustees considered that the Investment Adviser, with the Board’s assent, had decided to terminate the Sub-Adviser effective on or about November 30, 2018, at which time the Investment Adviser would assume responsibility for the day-to-day management of the Portfolios. The Trustees recognized that the Sub-Advisory Agreement was currently scheduled to expire on August 31, 2018. They considered the Investment Adviser’s representation that the delayed termination was intended to facilitate an orderly transition in management responsibilities and provide shareholders with ample prior notice.
Nature, Extent, and Quality of the Services Provided Under the Sub-Advisory Agreement
In evaluating the Sub-Advisory Agreement, the Trustees relied upon materials furnished and presentations made by the Investment Adviser and Sub-Adviser. In evaluating the nature, extent, and quality of services provided by the Sub-Adviser, the Trustees considered information on the services provided to each Portfolio by the Sub-Adviser, including information about the Sub-Adviser’s (a) personnel and compensation structure; (b) track record in managing the Portfolio and, with respect to certain Portfolios, the Predecessor Funds; (c) policies and procedures in place to address potential conflicts of interest; and (d) compliance program and code of ethics. In this regard, they also considered assessments provided by the Investment Adviser of the Sub-Adviser, the Sub-Adviser’s investment strategies and personnel, and its compliance program.
Costs of Services Provided
The Trustees reviewed the terms of the Sub-Advisory Agreement and the fee schedule, including breakpoints. They noted that the compensation paid to the Sub-Adviser is paid by the Investment Adviser, not by the Portfolios, and that the retention of the Sub-Adviser does not directly increase the fees incurred by the Portfolio for advisory services. They considered the Investment Adviser’s belief that the relationship between the management fees paid by each Portfolio and the sub-advisory fees paid by the Investment Adviser is appropriate given the level of services the Investment Adviser provides to each Portfolio and significant differences in cost drivers and risks associated with the respective services offered by the Investment Adviser and the Sub-Adviser. They also considered the expense limitations that substantially reduce the fees retained by the Investment Adviser. The Trustees reviewed the average sub-advisory fees paid by the Investment Adviser with respect to each Portfolio in light of the overall management fee paid by such Portfolio.
Conclusion
As described above, the Trustees considered these factors in light of the Portfolios’ investment management transition, as the Investment Adviser assumes the Portfolios’ day-to-day portfolio management responsibilities from the Sub-Adviser. The Trustees gave weight to various factors, but did not identify any particular factor as controlling their decision. After deliberation and consideration of the information provided, including the factors described above, the Trustees, including the Independent Trustees, unanimously concluded, in the exercise of their business judgment, that the sub-advisory fees paid by the Investment Adviser to the Sub-Adviser were reasonable in light of the factors considered, and that the Sub-Advisory Agreement should be approved and continued until August 31, 2019, or such earlier date as may be determined by the officers of the Trust.
148
GOLDMAN SACHS TARGET DATE PORTFOLIOS
Statement Regarding Basis for Approval of Management Agreement and Sub-Advisory Agreement for Goldman Sachs Target Date 2060 Portfolio (Unaudited)
Background
The Goldman Sachs Target Date 2060 Portfolio (the “Portfolio”) is a newly-organized investment portfolio of Goldman Sachs Trust II (the “Trust”) that commenced investment operations on April 30, 2018. At a meeting held on February 6-7, 2018 (the “Meeting”) in connection with the Portfolio’s launch, the Board of Trustees, including those Trustees who are not parties to the Portfolio’s investment management agreement or sub-advisory agreement or “interested persons” as defined in the Investment Company Act of 1940, as amended, of any party thereto (the “Independent Trustees”), approved (i) the investment management agreement (the “Management Agreement”) between the Trust on behalf of the Portfolio and Goldman Sachs Asset Management, L.P. (the “Investment Adviser”); and (ii) the sub-advisory agreement (the “Sub-Advisory Agreement” and, collectively with the Management Agreement, the “Agreements”) between the Investment Adviser and Madison Asset Management, LLC (the “Sub-Adviser”), each for a term of two years (subject to earlier termination pursuant to the terms of the applicable Agreement).
In connection with their consideration of each Agreement, the Trustees received written materials and oral presentations prepared by the Investment Adviser and the Sub-Adviser on the topics covered, and were advised by their independent legal counsel. In addition, the Trustees received information prepared by the Sub-Adviser in a written response to a formal request from the Investment Adviser. In evaluating the Management Agreement, the Trustees considered information included in presentations made by the Investment Adviser and other information received at prior Board meetings.
Management Agreement
At the Meeting, the Trustees reviewed the Management Agreement, including information regarding the terms of the Management Agreement; the nature, extent and quality of the Investment Adviser’s anticipated services; the fees and expenses to be paid by the Portfolio; a comparison of the Portfolio’s proposed management fees and anticipated expenses with those paid by similar mutual funds; potential ancillary benefits to be derived by the Investment Adviser and its affiliates from their relationships with the Portfolio; and potential ancillary benefits to be derived by the Portfolio from its relationship with the Investment Adviser and its affiliates.
Nature, Extent, and Quality of the Services to be Provided Under the Management Agreement
As part of their review, the Trustees considered the nature, extent and quality of the services to be provided to the Portfolio by the Investment Adviser. In this regard, the Trustees considered both the investment advisory services and non-advisory services (including oversight of the Sub-Adviser’s day-to-day management of the Portfolio) that would be provided by the Investment Adviser and its affiliates. The Trustees also considered information about the Portfolio’s structure, investment objective, strategies and other characteristics. The Trustees noted the experience and capabilities of the Investment Adviser’s portfolio management team and other key personnel that would be providing services to the Portfolio.
They observed that the Investment Adviser had experience managing other sub-advised funds (including the existing Goldman Sachs Target Date Portfolios), and has a team dedicated to sub-adviser oversight. The Trustees also reviewed the sub-adviser oversight process that the Investment Adviser was expected to employ on behalf of the Portfolio, which included areas such as investment analytics, risk management and compliance. The Trustees concluded that the Investment Adviser would be able to commit substantial financial and other resources to the Portfolio. They considered that the Portfolio was new, and there was therefore no performance information to review with respect to the Portfolio.
Costs of Services to be Provided and Competitive Information
The Trustees considered the contractual terms of the Management Agreement, the fee rates payable by the Portfolio thereunder, and the net amount expected to be retained by the Investment Adviser after payment of sub-advisory fees. In this regard, the Trustees considered information on the services to be rendered by the Investment Adviser to the Portfolio, which included both advisory and administrative services directed to the needs and operations of the Portfolio as a registered mutual fund. They considered the Investment Adviser’s undertaking to limit certain expenses of the Portfolio that exceed specified levels. The Trustees also reviewed the Portfolio’s projected total operating expense ratios (both gross and net of expense limitations). They compared the Portfolio’s projected fees and expenses to similar information for comparable mutual funds advised by other, unaffiliated investment management firms, as well as the peer group and category medians. The comparisons of the Portfolio’s management fee rate and total operating expense ratios were prepared by a third-party provider of mutual fund data. The Trustees concluded that the information was useful in evaluating the reasonableness of the management fees and total expenses expected to be paid by the Portfolio.
The Trustees recognized that there was not yet profitability data to evaluate for the Portfolio, but considered the Investment Adviser’s representation that such data would be provided after the Portfolio commenced operations.
149
GOLDMAN SACHS TARGET DATE PORTFOLIOS
Statement Regarding Basis for Approval of Management Agreement and Sub-Advisory Agreement for Goldman Sachs Target Date 2060 Portfolio (Unaudited) (continued)
Economies of Scale
The Trustees considered the proposed breakpoints in the fee rate payable under the Management Agreement at the following annual percentage rates of the average daily net assets of the Portfolio:
| | | | |
| Average Daily Net Assets | | Management Fee Annual Rate | |
First $2 billion | | | 0.25 | % |
Next $3 billion | | | 0.23 | % |
Over $5 billion | | | 0.21 | % |
The Trustees noted that the breakpoints were designed to share potential economies of scale, if any, with the Portfolio and its shareholders as assets under management reach those asset levels. The Trustees considered the Portfolio’s projected asset levels and information comparing the fee rate charged by the Investment Adviser with fee rates charged to other funds in the peer group; and the Investment Adviser’s undertaking to limit certain expenses of the Portfolio that exceed specified levels. The Trustees also considered the relationship between the advisory and sub-advisory fee rate schedules. Upon reviewing these matters, the Trustees concluded that the fee breakpoints represented a means of assuring that benefits of scalability, if any, would be passed along to shareholders at the specified asset levels.
Other Benefits to the Investment Adviser and Its Affiliates
The Trustees also considered the other benefits expected to be derived by the Investment Adviser and its affiliates from their relationships with the Portfolio, including: (a) transfer agency fees received by Goldman Sachs & Co. LLC (“Goldman Sachs”); (b) the Investment Adviser’s ability to leverage the infrastructure designed to service the Portfolio on behalf of the Investment Adviser’s other clients; (c) the Investment Adviser’s ability to cross-market other products and services to Portfolio shareholders; (d) Goldman Sachs’ retention of certain fees as Portfolio distributor; (e) the Investment Adviser’s ability to negotiate better pricing with the Portfolio’s custodian on behalf of its other clients, as a result of the relationship with the Portfolio; and (f) the possibility that the working relationship between the Investment Adviser and the Portfolio’s third party service providers (including the Sub-Adviser) may cause those service providers to be more likely to do business with other areas of Goldman Sachs.
Other Benefits to the Portfolio and Its Shareholders
The Trustees also noted that the Portfolio is expected to receive certain potential benefits as a result of its relationship with the Investment Adviser, including: (a) enhanced servicing from vendors because of the volume of business generated by the Investment Adviser and its affiliates; (b) the advantages received from the Investment Adviser’s knowledge and experience gained from managing other accounts and products; (c) the Investment Adviser’s ability to hire and retain qualified personnel to provide services to the Portfolio because of the reputation of the Goldman Sachs organization; (d) the Portfolio’s access, through the Investment Adviser, to certain firm-wide resources (e.g., proprietary risk management systems and databases), subject to certain restrictions; and (e) the Portfolio’s access to certain affiliated distribution channels.
Conclusion
In connection with their consideration of the Management Agreement, the Trustees gave weight to various factors, but did not identify any particular factor as controlling their decision. After deliberation and consideration of the information provided, including the factors described above, the Trustees, including the Independent Trustees, unanimously concluded, in the exercise of their business judgment, that the investment management fees to be paid by the Portfolio were reasonable in light of the factors considered, and that the Management Agreement, and the terms thereof, should be approved for a period of two years.
150
GOLDMAN SACHS TARGET DATE PORTFOLIOS
Statement Regarding Basis for Approval of Management Agreement and Sub-Advisory Agreement for Goldman Sachs Target Date 2060 Portfolio (Unaudited) (continued)
Sub-Advisory Agreement with Madison Asset Management, LLC
Nature, Extent, and Quality of the Services to be Provided Under the Sub-Advisory Agreement
In evaluating the Sub-Advisory Agreement, the Trustees relied upon materials furnished and presentations made by the Investment Adviser and Sub-Adviser. In evaluating the nature, extent and quality of services to be provided by the Sub-Adviser, the Trustees considered information on the services to be provided to the Portfolio by the Sub-Adviser, including information about the Sub-Adviser’s (a) personnel and compensation structure; (b) track record in managing the existing Goldman Sachs Target Date Portfolios; (c) policies and procedures in place to address potential conflicts of interest; and (d) compliance program and code of ethics. In this regard, they also considered assessments provided by the Investment Adviser of the Sub-Adviser, the Sub-Adviser’s investment strategies and personnel, and its compliance program.
Costs of Services to be Provided
The Trustees reviewed the terms of the Sub-Advisory Agreement and the proposed fee schedule, including breakpoints. They noted that the compensation paid to the Sub-Adviser would be paid by the Investment Adviser, not by the Portfolio, and that the retention of the Sub-Adviser would not directly increase the fees incurred by the Portfolio for advisory services. They also noted that the terms of the Sub-Advisory Agreement were the result of arm’s length negotiations between the Investment Adviser and the Sub-Adviser. The Trustees considered the amount of the management fee expected to be retained by the Investment Adviser.
Conclusion
In connection with their consideration of the Sub-Advisory Agreement, the Trustees gave weight to various factors, but did not identify any particular factor as controlling their decision. After deliberation and consideration of the information provided, including the factors described above, the Trustees, including the Independent Trustees, unanimously concluded, in the exercise of their business judgment, that the sub-advisory fees to be paid by the Investment Adviser to the Sub-Adviser were reasonable in light of the factors considered, and that the Sub-Advisory Agreement, and the terms thereof, should be approved for a period of two years from its effective date.
151
GOLDMAN SACHS TARGET DATE PORTFOLIOS
Trustees and Officers (Unaudited)
Independent Trustees
| | | | | | | | | | |
Name,
Address and Age1 | | Position(s) Held
with the Trust | | Term of
Office and
Length of
Time Served2 | | Principal Occupation(s)
During Past 5 Years | | Number of
Portfolios in
Fund Complex
Overseen by
Trustee3 | | Other
Directorships
Held by Trustee4 |
Cheryl K. Beebe Age: 62 | | Chair of the Board of Trustees | | Since 2017 (Trustee since 2015) | | Ms. Beebe is retired. She is Director, Convergys Corporation (2015-Present); Director, Packaging Corporation of America (2008-Present); and was formerly Executive Vice President, (2010-2014); and Chief Financial Officer, Ingredion, Inc. (a leading global ingredient solutions company) (2004-2014). Chair of the Board of Trustees — Goldman Sachs Trust II. | | 19 | | Convergys Corporation (a global leader in customer experience outsourcing); Packaging Corporation of America (producer of container board) |
Lawrence Hughes Age: 60 | | Trustee | | Since 2016 | | Mr. Hughes is retired. Formerly, he held senior management positions with BNY Mellon Wealth Management, a division of The Bank of New York Mellon Corporation (a financial services company) (1991-2015), most recently as Chief Executive Officer (2010-2015). He serves as Chairman of the Board of Directors, Ellis Memorial and Eldredge House (a not-for-profit organization) (2012-Present). Previously, Mr. Hughes served as an Advisory Board Member of Goldman Sachs Trust II (February 2016-April 2016). Trustee — Goldman Sachs Trust II. | | 19 | | None |
John F. Killian Age: 63 | | Trustee | | Since 2015 | | Mr. Killian is retired. He is Director, Consolidated Edison, Inc. (2007-Present); Director, Houghton Mifflin Harcourt Publishing Company (2011-Present); and formerly held senior management positions with Verizon Communications, Inc., including Executive Vice President and Chief Financial Officer (2009- 2010); and President, Verizon Business, Verizon Communications, Inc. (2005-2009). Trustee — Goldman Sachs Trust II. | | 19 | | Consolidated Edison, Inc. (a utility holding company); Houghton Mifflin Harcourt Publishing Company |
Steven D. Krichmar Age: 60 | | Trustee | | Since 2018 | | Mr. Krichmar is retired. Formerly, he held senior management and governance positions with Putnam Investments, LLC, a financial services company (2001-2016). He was most recently Chief of Operations and a member of the Operating Committee of Putnam Investments, LLC and Principal Financial Officer of The Putnam Funds. Previously, Mr. Krichmar served as an Audit Partner with PricewaterhouseCoopers LLP and its predecessor company (1990-2001). Trustee — Goldman Sachs Trust II. | | 19 | | None |
| | | | | | | | | | |
152
GOLDMAN SACHS TARGET DATE PORTFOLIOS
Trustees and Officers (Unaudited) (continued)
Interested Trustee*
| | | | | | | | | | |
Name,
Address and Age1 | | Position(s) Held
with the Trust | | Term of
Office and
Length of
Time Served2 | | Principal Occupation(s)
During Past 5 Years | | Number of
Portfolios in
Fund Complex
Overseen by
Trustee3 | | Other
Directorships
Held by Trustee4 |
| James A. McNamara Age: 55 | | President and Trustee | | Since 2012 | | Advisory Director, Goldman Sachs (January 2018-Present); Managing Director, Goldman Sachs (January 2000-December 2017); Director of Institutional Fund Sales, GSAM (April 1998-December 2000); and Senior Vice President and Manager, Dreyfus Institutional Service Corporation (January 1993- April 1998). President and Trustee — Goldman Sachs Trust II; Goldman Sachs Trust; Goldman Sachs Variable Insurance Trust; Goldman Sachs MLP Income Opportunities Fund; Goldman Sachs MLP and Energy Renaissance Fund; Goldman Sachs ETF Trust; Goldman Sachs Private Markets Fund 2018 LLC; Goldman Sachs Private Markets Fund 2018 (A) LLC; and Goldman Sachs Private Markets Fund 2018 (B) LLC. | | 152 | | None |
| | | | | | | | | | |
| * | | Mr. McNamara is considered to be an “Interested Trustee” because he holds a position with Goldman Sachs and owns securities issued by The Goldman Sachs Group, Inc. He holds comparable positions with certain other companies of which Goldman Sachs, GSAM or an affiliate thereof is the investment adviser, administrator and/or distributor. |
| 1 | | Each Trustee may be contacted by writing to the Trustee, c/o Goldman Sachs, 200 West Street, New York, New York, 10282, Attn: Caroline Kraus. Information is provided as of August 31, 2018. |
| 2 | | Subject to such policies as may be adopted by the Board from time-to-time, each Trustee holds office for an indefinite term, until the earliest of: (a) the election of his or her successor; (b) the date the Trustee resigns or is removed by the Board or shareholders, in accordance with the Trust’s Declaration of Trust; or (c) the termination of the Trust. The Board has adopted policies which provide that (a) no Trustee shall hold office for more than 15 years and (b) a Trustee shall retire as of December 31st of the calendar year in which he or she reaches his or her 74th birthday, unless a waiver of such requirement shall have been adopted by a majority of the other Trustees. These policies may be changed by the Trustees without shareholder vote. |
| 3 | | The Goldman Sachs Fund Complex includes certain other companies listed above for each respective Trustee. As of August 31, 2018, Goldman Sachs Trust II consisted of 19 portfolios (17 of which offered shares to the public); Goldman Sachs Trust consisted of 89 portfolios (88 of which offered shares to the public); Goldman Sachs Variable Insurance Trust consisted of 13 portfolios; Goldman Sachs MLP Income Opportunities Fund, Goldman Sachs MLP and Energy Renaissance Fund, Goldman Sachs Private Markets Fund 2018 LLC, Goldman Sachs Private Markets Fund 2018 (A) LLC and Goldman Sachs Private Markets Fund 2018 (B) LLC each consisted of one portfolio; and Goldman Sachs ETF Trust consisted of 26 portfolios (14 of which offered shares to the public). |
| 4 | | This column includes only directorships of companies required to report to the Securities and Exchange Commission under the Securities Exchange Act of 1934 (i.e., “public companies”) or other investment companies registered under the Act. |
Additional information about the Trustees is available in the Portfolios’ Statement of Additional Information, which can be obtained from Goldman Sachs free of charge by calling this toll-free number (in the United States of America): 1-800-526-7384.
153
GOLDMAN SACHS TARGET DATE PORTFOLIOS
Trustees and Officers (Unaudited) (continued)
Officers of the Trust*
| | | | | | |
| Name, Address and Age1 | | Position(s) Held
with the Trust | | Term of
Office and
Length of
Time Served2 | | Principal Occupation(s) During Past 5 Years |
James A. McNamara 200 West Street New York, NY 10282 Age: 55 | | Trustee and President | | Since 2012 | | Advisory Director, Goldman Sachs (January 2018-Present); Managing Director, Goldman Sachs (January 2000-December 2017); Director of Institutional Fund Sales, GSAM (April 1998-December 2000); and Senior Vice President and Manager, Dreyfus Institutional Service Corporation (January 1993-April 1998). President and Trustee — Goldman Sachs Trust II; Goldman Sachs Trust; Goldman Sachs Variable Insurance Trust; Goldman Sachs MLP Income Opportunities Fund; Goldman Sachs MLP and Energy Renaissance Fund; Goldman Sachs ETF Trust; Goldman Sachs Private Markets Fund 2018 LLC; Goldman Sachs Private Markets Fund 2018 (A) LLC; and Goldman Sachs Private Markets Fund 2018 (B) LLC. |
Caroline L. Kraus 200 West Street New York, NY 10282 Age: 41 | | Secretary | | Since 2012 | | Managing Director, Goldman Sachs (January 2016-Present); Vice President, Goldman Sachs (August 2006-December 2015); Associate General Counsel, Goldman Sachs (2012-Present); Assistant General Counsel, Goldman Sachs (August 2006-December 2011); and Associate, Weil, Gotshal & Manges, LLP (2002-2006). Secretary — Goldman Sachs Trust II; Goldman Sachs Trust (previously Assistant Secretary (2012)); Goldman Sachs Variable Insurance Trust (previously Assistant Secretary (2012)); Goldman Sachs BDC, Inc.; Goldman Sachs Private Middle Market Credit LLC; Goldman Sachs Middle Market Lending Corp.; Goldman Sachs MLP Income Opportunities Fund; Goldman Sachs MLP and Energy Renaissance Fund; Goldman Sachs ETF Trust; Goldman Sachs Private Markets Fund 2018 LLC; Goldman Sachs Private Markets Fund 2018 (A) LLC; and Goldman Sachs Private Markets Fund 2018 (B) LLC. |
Scott M. McHugh 200 West Street New York, NY 10282 Age: 46 | | Treasurer, Senior Vice President and Principal Financial Officer | | Since 2012 (Principal Financial Officer since 2013) | | Managing Director, Goldman Sachs (January 2016-Present); Vice President, Goldman Sachs (February 2007-December 2015); Assistant Treasurer of certain mutual funds administered by DWS Scudder (2005-2007); and Director (2005-2007), Vice President (2000-2005), and Assistant Vice President (1998-2000), Deutsche Asset Management or its predecessor (1998-2007). Treasurer, Senior Vice President and Principal Financial Officer — Goldman Sachs Trust II; Goldman Sachs Trust; Goldman Sachs Variable Insurance Trust; Goldman Sachs MLP Income Opportunities Fund; Goldman Sachs MLP and Energy Renaissance Fund; Goldman Sachs ETF Trust; Goldman Sachs Private Markets Fund 2018 LLC; Goldman Sachs Private Markets Fund 2018 (A) LLC; and Goldman Sachs Private Markets Fund 2018 (B) LLC. |
Joseph F. DiMaria 30 Hudson Street Jersey City, NJ 07302 Age: 50 | | Assistant Treasurer and Principal Accounting Officer | | Since 2017 | | Managing Director, Goldman Sachs (November 2015-Present) and Vice President — Mutual Fund Administration, Columbia Management Investment Advisers, LLC (May 2010-October 2015). Assistant Treasurer and Principal Accounting Officer — Goldman Sachs Trust II; Goldman Sachs Trust; Goldman Sachs Variable Insurance Trust; Goldman Sachs MLP Income Opportunities Fund; Goldman Sachs MLP and Energy Renaissance Fund; Goldman Sachs ETF Trust; Goldman Sachs Private Markets Fund 2018 LLC; Goldman Sachs Private Markets Fund 2018 (A) LLC; and Goldman Sachs Private Markets Fund 2018 (B) LLC. |
| | | | | | |
| * | | Represents a partial list of officers of the Trust. Additional information about all the officers is available in the Portfolios’ Statement of Additional Information, which can be obtained from Goldman Sachs free of charge by calling this toll-free number (in the United States): 1-800-526-7384. |
| 1 | | Information is provided as of August 31, 2018. |
| 2 | | Officers hold office at the pleasure of the Board of Trustees or until their successors are duly elected and qualified. Each officer holds comparable positions with certain other companies of which Goldman Sachs, GSAM or an affiliate thereof is the investment adviser, administrator and/or distributor. |
154
GOLDMAN SACHS TARGET DATE PORTFOLIOS
Goldman Sachs Trust II — Goldman Sachs Target Date Portfolios — Tax Information (Unaudited)
For the fiscal year ended August 31, 2018, 8.29%, 16.66%, 16.55%, 20.39%, 17.78%, 20.05%, 20.39% and 20.09% of the dividends paid from net investment company taxable income by the Target Date 2020, Target Date 2025, Target Date 2030, Target Date 2035, Target Date 2040, Target Date 2045, Target Date 2050 and Target Date 2055 Portfolios, respectively, qualify for the dividends received deduction available to corporations.
From distributions paid during the fiscal year ended August 31, 2018, the total amount of income received by the Target Date 2020, Target Date 2025, Target Date 2030, Target Date 2035, Target Date 2040, Target Date 2045, Target Date 2050 and Target Date 2055 Portfolios from sources within foreign countries and possessions of the United States was $0.0282, $0.0466, $0.0528, $0.0623, $0.0612, $0.0739, $0.0724 and $0.0843 per share, respectively, all of which is attributable to qualified passive income. The percentage of net investment income dividends paid from foreign sources by the Target Date 2020, Target Date 2025, Target Date 2030, Target Date 2035, Target Date 2040, Target Date 2045, Target Date 2050 and Target Date 2055 Portfolios was 5.09%, 13.38%, 12.08%, 16.32%, 13.68%, 16.71%, 17.11% and 17.27%, respectively. The total amount of taxes paid by the Target Date 2020, Target Date 2025, Target Date 2030, Target Date 2035, Target Date 2040, Target Date 2045, Target Date 2050 and Target Date 2055 Portfolios to such countries was $0.0020, $0.0033, $0.0038, $0.0045, $0.0044, $0.0053, $0.0052 and $0.0061 per share, respectively.
For the fiscal year ended August 31, 2018, the Target Date 2020, Target Date 2025, Target Date 2030, Target Date 2035, Target Date 2040, Target Date 2045, Target Date 2050 and Target Date 2055 Portfolios designate 11.17%, 24.50%, 21.79%, 29.69%, 24.74%, 29.81%, 30.29% and 30.84%, respectively, of the dividends paid from net investment company taxable income as qualifying for the reduced tax rate under the Jobs and Growth Tax Relief and Reconciliation Act of 2003.
Pursuant to Section 852 of the Internal Revenue Code, the Target Date 2020, Target Date 2025, Target Date 2030, Target Date 2035, Target Date 2040, Target Date 2050 and Target Date 2055 Portfolios designate $2,033,552, $2,305, $5,880,439, $9,280, $4,490,139, $1,140,087 and $12,996, respectively, or, if different, the maximum amount allowable, as capital gain dividends paid during the fiscal year ended August 31, 2018.
During the fiscal year ended August 31, 2018, the Target Date 2020, Target Date 2025, Target Date 2030, Target Date 2035, Target Date 2040, Target Date 2045, Target Date 2050 and Target Date 2055 Portfolios designate $1,158,299, $136,088, $1,870,030, $178,265, $1,319,079, $236,754, $602,643 and $282,658, respectively, as short-term capital gain dividends pursuant to Section 871(k) of the Internal Revenue Code.
FUNDS PROFILE
Goldman Sachs Funds
Goldman Sachs is a premier financial services firm, known since 1869 for creating thoughtful and customized investment solutions in complex global markets.
Today, the Investment Management Division of Goldman Sachs serves a diverse set of clients worldwide, including private institutions, public entities and individuals. With approximately $1.30 trillion in assets under supervision as of June 30, 2018, Goldman Sachs Asset Management (“GSAM”) has portfolio management teams located around the world and our investment professionals bring firsthand knowledge of local markets to every investment decision. Assets under supervision includes assets under management and other client assets for which Goldman Sachs does not have full discretion. GSAM leverages the resources of Goldman Sachs & Co. LLC subject to legal, internal and regulatory restrictions.
Money Market
Financial Square FundsSM
| ∎ | | Financial Square Treasury Solutions Fund1 |
| ∎ | | Financial Square Government Fund1 |
| ∎ | | Financial Square Money Market Fund2 |
| ∎ | | Financial Square Prime Obligations Fund2 |
| ∎ | | Financial Square Treasury Instruments Fund1 |
| ∎ | | Financial Square Treasury Obligations Fund1 |
| ∎ | | Financial Square Federal Instruments Fund1 |
Investor FundsSM
| ∎ | | Investor Money Market Fund3 |
| ∎ | | Investor Tax-Exempt Money Market Fund3 |
Fixed Income
Short Duration and Government
| ∎ | | High Quality Floating Rate Fund |
| ∎ | | Short-Term Conservative Income Fund |
| ∎ | | Short Duration Government Fund |
| ∎ | | Short Duration Income Fund |
| ∎ | | Inflation Protected Securities Fund |
Multi-Sector
Municipal and Tax-Free
| ∎ | | High Yield Municipal Fund |
| ∎ | | Dynamic Municipal Income Fund |
| ∎ | | Short Duration Tax-Free Fund |
Single Sector
| ∎ | | Investment Grade Credit Fund |
| ∎ | | High Yield Floating Rate Fund |
| ∎ | | Emerging Markets Debt Fund |
| ∎ | | Local Emerging Markets Debt Fund |
| ∎ | | Total Emerging Markets Income Fund4 |
Fixed Income Alternatives
| ∎ | | Long Short Credit Strategies Fund |
Fundamental Equity
| ∎ | | Small/Mid Cap Value Fund |
| ∎ | | Small/Mid Cap Growth Fund |
| ∎ | | Concentrated Growth Fund |
| ∎ | | Technology Opportunities Fund |
| ∎ | | Growth Opportunities Fund |
| ∎ | | Rising Dividend Growth Fund |
Tax-Advantaged Equity
| ∎ | | U.S. Tax-Managed Equity Fund |
| ∎ | | International Tax-Managed Equity Fund |
| ∎ | | U.S. Equity Dividend and Premium Fund |
| ∎ | | International Equity Dividend and Premium Fund |
Equity Insights
| ∎ | | Small Cap Equity Insights Fund |
| ∎ | | U.S. Equity Insights Fund |
| ∎ | | Small Cap Growth Insights Fund |
| ∎ | | Large Cap Growth Insights Fund |
| ∎ | | Large Cap Value Insights Fund |
| ∎ | | Small Cap Value Insights Fund |
| ∎ | | International Small Cap Insights Fund |
| ∎ | | International Equity Insights Fund |
| ∎ | | Emerging Markets Equity Insights Fund |
Fundamental Equity International
| ∎ | | International Equity Income Fund5 |
| ∎ | | International Equity ESG Fund6 |
| ∎ | | Emerging Markets Equity Fund |
| ∎ | | ESG Emerging Markets Equity Fund |
Select Satellite
| ∎ | | Real Estate Securities Fund |
| ∎ | | International Real Estate Securities Fund |
| ∎ | | Commodity Strategy Fund |
| ∎ | | Global Real Estate Securities Fund |
| ∎ | | Alternative Premia Fund |
| ∎ | | Absolute Return Tracker Fund |
| ∎ | | Managed Futures Strategy Fund |
| ∎ | | MLP Energy Infrastructure Fund |
| ∎ | | Multi-Manager Alternatives Fund |
| ∎ | | Absolute Return Multi-Asset Fund |
| ∎ | | Global Infrastructure Fund |
Total Portfolio Solutions
| ∎ | | Global Managed Beta Fund |
| ∎ | | Multi-Manager Non-Core Fixed Income Fund |
| ∎ | | Multi-Manager U.S. Dynamic Equity Fund |
| ∎ | | Multi-Manager Global Equity Fund |
| ∎ | | Multi-Manager International Equity Fund |
| ∎ | | Tactical Tilt Overlay Fund |
| ∎ | | Balanced Strategy Portfolio |
| ∎ | | Multi-Manager U.S. Small Cap Equity Fund |
| ∎ | | Multi-Manager Real Assets Strategy Fund |
| ∎ | | Growth and Income Strategy Portfolio |
| ∎ | | Growth Strategy Portfolio |
| ∎ | | Equity Growth Strategy Portfolio |
| ∎ | | Satellite Strategies Portfolio |
| ∎ | | Enhanced Dividend Global Equity Portfolio |
| ∎ | | Tax-Advantaged Global Equity Portfolio |
| ∎ | | Strategic Factor Allocation Fund |
| ∎ | | Target Date 2020 Portfolio |
| ∎ | | Target Date 2025 Portfolio |
| ∎ | | Target Date 2030 Portfolio |
| ∎ | | Target Date 2035 Portfolio |
| ∎ | | Target Date 2040 Portfolio |
| ∎ | | Target Date 2045 Portfolio |
| ∎ | | Target Date 2050 Portfolio |
| ∎ | | Target Date 2055 Portfolio |
| ∎ | | Target Date 2060 Portfolio |
| ∎ | | GQG Partners International Opportunities Fund |
| 1 | | You could lose money by investing in the Fund. Although the Fund seeks to preserve the value of your investment at $1.00 per share, it cannot guarantee it will do so. An investment in the Fund is not a deposit of a bank and is not insured or guaranteed by the Federal Deposit Insurance Corporation or any other government agency. The Fund’s sponsor has no legal obligation to provide financial support to the Fund, and you should not expect that the sponsor will provide financial support to the Fund at any time. |
| 2 | | You could lose money by investing in the Fund. Because the share price of the Fund will fluctuate, when you sell your shares they may be worth more or less than what you originally paid for them. The Fund may impose a fee upon sale of your shares or may temporarily suspend your ability to sell shares if the Fund’s liquidity falls below required minimums because of market conditions or other factors. An investment in the Fund is not a deposit of a bank and is not insured or guaranteed by the Federal Deposit Insurance Corporation or any other government agency. The Fund’s sponsor has no legal obligation to provide financial support to the Fund, and you should not expect that the sponsor will provide financial support to the Fund at any time. |
| 3 | | You could lose money by investing in the Fund. Although the Fund seeks to preserve the value of your investment at $1.00 per share, it cannot guarantee it will do so. The Fund may impose a fee upon sale of your shares or may temporarily suspend your ability to sell shares if the Fund’s liquidity falls below required minimums because of market conditions or other factors. An investment in the Fund is not a deposit of a bank and is not insured or guaranteed by the Federal Deposit Insurance Corporation or any other government agency. The Fund’s sponsor has no legal obligation to provide financial support to the Fund, and you should not expect that the sponsor will provide financial support to the Fund at any time. |
| 4 | | Effective after the close of business on December 26, 2017, the Goldman Sachs Dynamic Emerging Markets Debt Fund was renamed the Goldman Sachs Total Emerging Markets Income Fund. |
| 5 | | Effective after the close of business on February 27, 2018, the Goldman Sachs Strategic International Equity Fund was renamed the Goldman Sachs International Equity Income Fund. |
| 6 | | Effective after the close of business on February 27, 2018, the Goldman Sachs Focused International Equity Fund was renamed the Goldman Sachs International Equity ESG Fund. |
| | | Financial Square FundsSM and Investor FundsSM are registered service marks of Goldman Sachs & Co. LLC. |
| * | | This list covers open-end funds only. Please visit our website at www.GSAMFUNDS.com to learn about our closed-end funds and exchange-traded funds. |
| | |
TRUSTEES Cheryl K. Beebe, Chair Lawrence Hughes John F. Killian Steven D. Krichmar James A. McNamara | | OFFICERS James A. McNamara, President Scott M. McHugh, Treasurer, Senior Vice President and Principal Financial Officer
Joseph F. DiMaria, Assistant Treasurer and Principal
Accounting Officer
Caroline L. Kraus, Secretary |
| |
GOLDMAN SACHS & CO. LLC Distributor and Transfer Agent | | GOLDMAN SACHS ASSET MANAGEMENT, L.P. Investment Adviser |
Visit our web site at www.GSAMFUNDS.com to obtain the most recent month-end returns.
Goldman Sachs Asset Management, L.P. 200 West Street, New York, New York 10282
The portfolio risk management process includes an effort to monitor and manage risk, but does not imply low risk.
The reports concerning the Portfolios included in this shareholder report may contain certain forward-looking statements about the factors that may affect the performance of the Portfolios in the future. These statements are based on Portfolio management’s predictions and expectations concerning certain future events and their expected impact on the Portfolios, such as performance of the economy as a whole and of specific industry sectors, changes in the levels of interest rates, the impact of developing world events, and other factors that may influence the future performance of the Portfolios. Management believes these forward-looking statements to be reasonable, although they are inherently uncertain and difficult to predict. Actual events may cause adjustments in portfolio management strategies from those currently expected to be employed.
Views and opinions expressed are for informational purposes only and do not constitute a recommendation by GSAM to buy, sell, or hold any security. Views and opinions are current as of the date of this presentation and may be subject to change, they should not be construed as investment advice.
A description of the policies and procedures that the Portfolios use to determine how to vote proxies relating to portfolio securities and information regarding how a Portfolio voted proxies relating to portfolio securities during the most recent 12-month period ended June 30 is available (i) without charge, upon request by calling 1-800-526-7384 (for Retail Shareholders) or 1-800-621-2550 (for Institutional Shareholders); and (ii) on the Securities and Exchange Commission (“SEC”) web site at http://www.sec.gov.
References to indices, benchmarks or other measures of relative market performance over a specified period of time are provided for your information only and do not imply that the portfolio will achieve similar results. The index composition may not reflect the manner in which a portfolio is constructed. While an adviser seeks to design a portfolio which reflects appropriate risk and return features, portfolio characteristics may deviate from those of the benchmark.
The Portfolios file their complete schedule of portfolio holdings with the SEC for the first and third quarters of each fiscal year on Form N-Qs. The Portfolios’ Form N-Qs are available on the SEC’s website at http://www.sec.gov within 60 days after the Portfolios’ first and third fiscal quarters. The Portfolios’ Form N-Qs may be reviewed and copied at the SEC’s Public Reference Room in Washington, D.C. and information on the operation of the Public Reference Room may also be obtained by calling 1-800-SEC-0330. When available, Form N-Qs may be obtained upon request and without charge by calling 1-800-526-7384 (for Retail Shareholders) or 1-800-621-2550 (for Institutional Shareholders).
Economic and market forecasts presented herein reflect a series of assumptions and judgments as of the date of this presentation and are subject to change without notice. These forecasts do not take into account the specific investment objectives, restrictions, tax and financial situation or other needs of any specific client. Actual data will vary and may not be reflected here. These forecasts are subject to high levels of uncertainty that may affect actual performance. Accordingly, these forecasts should be viewed as merely representative of a broad range of possible outcomes. These forecasts are estimated, based on assumptions, land are subject to significant revision and may change materially as economic and market conditions change. Goldman Sachs has no obligation to provide updates or changes to these forecasts. Case studies and examples are for illustrative purposes only.
Portfolio holdings and allocations shown are as of August 31, 2018 and may not be representative of future investments. Portfolio holdings should not be relied on in making investment decisions and should not be construed as research or investment advice regarding particular securities. Current and future holdings are subject to risk.
This material is not authorized for distribution to prospective investors unless preceded or accompanied by a current Prospectus or summary prospectus, if applicable. Investors should consider a Portfolio’s objective, risks, and charges and expenses, and read the summary prospectus, if available, and/or the Prospectus carefully before investing or sending money. The summary prospectus, if available, and the Prospectus contain this and other information about a Portfolio and may be obtained from your authorized dealer or from Goldman Sachs & Co. LLC by calling (retail – 1-800-526-7384) (institutional – 1-800-621-2550).
© 2018 Goldman Sachs. All rights reserved 144794-TMPL-10/2018-852070 TARGDATEAR-18/406
(a) As of the end of the period covered by this report, the registrant has adopted a code of ethics that applies to the registrant’s principal executive officer, principal financial officer, principal accounting officer or controller, or persons performing similar functions, regardless of whether these individuals are employed by the registrant or a third party (the “Code of Ethics”).
(b) During the period covered by this report, no amendments were made to the provisions of the Code of Ethics.
(c) During the period covered by this report, the registrant did not grant any waivers, including an implicit waiver, from any provision of the Code of Ethics.
(d) A copy of the Code of Ethics is available as provided in Item 13(a)(1) of this report.
| ITEM 3. | AUDIT COMMITTEE FINANCIAL EXPERT. |
The registrant’s board of trustees has determined that the registrant has at least one “audit committee financial expert” (as defined in Item 3 of Form N-CSR) serving on its audit committee. John F. Killian is the “audit committee financial expert” and is “independent” (as each term is defined in Item 3 of Form N-CSR).
| ITEM 4. | PRINCIPAL ACCOUNTANT FEES AND SERVICES. |
Table 1 — Items 4(a) - 4(d). The accountant fees below reflect the aggregate fees billed by the Funds of the Goldman Sachs Trust II to which this certified shareholder report relates.
| | | | | | | | | | | | |
| | | 2018 | | 2017 | | Description of Services Rendered |
| | | | | | | | | | | | |
| | | |
Audit Fees: | | | | | | | | | | | | |
| | | |
• PricewaterhouseCoopers LLP
(“PwC”) | | | $ | 549,908 | | | | $ | 528,965 | | | Financial Statement audits. |
| | | |
Audit-Related Fees: | | | | | | | | | | | | |
| | | |
• PwC | | | $ | 54,252 | | | | $ | 25,795 | | | |
| | | |
Tax Fees: | | | | | | | | | | | | |
| | | |
• PwC | | | $ | 293,884 | | | | $ | 158,592 | | | |
Table 2 — Items 4(b)(c) & (d). Non-Audit Services to the Goldman Sachs Trust II’s service affiliates * that were pre-approved by the Audit Committee of the Goldman Sachs Trust II pursuant to Rule 2-01(c)(7)(ii) of Regulation S-X.
| | | | | | | | | | | | |
| | | 2018 | | 2017 | | Description of Services Rendered |
| | | | | | | | | | | | |
| | | |
Audit-Related Fees: | | | | | | | | | | | | |
| | | |
• PwC | | | $ | 1,897,685 | | | | $ | 1,560,883 | | | Internal control review performed in accordance with Statement on Standards for Attestation Engagements No. 16 and semi annual updates relating to withholding tax accrual for non-US jurisdictions. These fees are borne by the Funds’ Adviser. |
| * | These include the advisor (excluding sub-advisors) and any entity controlling, controlled by or under common control with the advisor that provides ongoing services to the registrant (hereinafter referred to as “service affiliates”). |
Item 4(e)(1) — Audit Committee Pre-Approval Policies and Procedures
Pre-Approval of Audit and Non-Audit Services Provided to the Funds of the Goldman Sachs Trust II. The Audit and Non-Audit Services Pre-Approval Policy (the “Policy”) adopted by the Audit Committee of Goldman Sachs Trust II (“GST II”) sets forth the procedures and the conditions pursuant to which services performed by an independent auditor for GST II may be pre-approved. Services may be pre-approved specifically by the Audit Committee as a whole or, in certain circumstances, by the Audit Committee Chairman or the person designated as the Audit Committee Financial Expert. In addition, subject to specified cost limitations, certain services may be pre-approved under the provisions of the Policy. The Policy provides that the Audit Committee will consider whether the services provided by an independent auditor are consistent with the Securities and Exchange Commission’s rules on auditor independence. The Policy provides for periodic review and pre-approval by the Audit Committee of the services that may be provided by the independent auditor.
De Minimis Waiver. The pre-approval requirements of the Policy may be waived with respect to the provision of non-audit services that are permissible for an independent auditor to perform, provided (1) the aggregate amount of all such services provided constitutes no more than five percent of the total amount of revenues subject to pre-approval that was paid to the independent auditors during the fiscal year in which the services are provided; (2) such services were not recognized by GST II at the time of the engagement to be non-audit services; and (3) such services are promptly brought to the attention of the Audit Committee and approved prior to the completion of the audit by the Audit Committee or by one or more members of the Audit Committee to whom authority to grant such approvals has been delegated by the Audit Committee, pursuant to the pre-approval provisions of the Policy.
Pre-Approval of Non-Audit Services Provided to GST’s Investment Advisers. The Policy provides that, in addition to requiring pre-approval of audit and non-audit services provided to GST II, the Audit Committee will pre-approve those non-audit services provided to GST II’s investment advisers (and entities controlling, controlled by or under common control with the investment advisers that provide ongoing services to GST II) where the engagement relates directly to the operations or financial reporting of GST II.
Item 4(e)(2) – 0% of the audit-related fees, tax fees and other fees listed in Table 1 were approved by GST II’s Audit Committee pursuant to the “de minimis” exception of Rule 2-01(c)(7)(i)(C) of Regulation S-X. In addition, 0% of the non-audit services to the GST II’s service affiliates listed in Table 2 were approved by GST II’s Audit Committee pursuant to the “de minimis” exception of Rule 2-01(c)(7)(i)(C) of Regulation S-X.
Item 4(f) – Not applicable.
Item 4(g) Aggregate Non-Audit Fees Disclosure
The aggregate non-audit fees billed to GST II by PwC for the twelve months ended August 31, 2018 and August 31, 2017 were $348,136 and $184,387 respectively. The aggregate non-audit fees billed to GST II’s adviser and service affiliates by PwC for the twelve months ended December 31, 2017 and December 31, 2016 were approximately $9.7 million and $11.4 million respectively. With regard to the aggregate non-audit fees billed to GST II’s adviser and service affiliates, the 2017 and 2016 amounts include fees for non-audit services required to be pre-approved [see Table 2] and fees for non-audit services that did not require pre-approval since they did not directly relate to GST II’s operations or financial reporting.
Item 4(h) — GST II’s Audit Committee has considered whether the provision of non-audit services to GST II’s investment adviser and service affiliates that did not require pre-approval pursuant to paragraph (c)(7)(ii) of Rule 2-01 of Regulation S-X is compatible with maintaining the auditors’ independence.
| ITEM 5. | AUDIT COMMITTEE OF LISTED REGISTRANTS. |
| ITEM 6. | SCHEDULE OF INVESTMENTS. |
| | Schedule of Investments is included as part of the Report to Shareholders filed under Item 1. |
| ITEM 7. | DISCLOSURE OF PROXY VOTING POLICIES AND PROCEDURES FOR CLOSED-END MANAGEMENT INVESTMENT COMPANIES. |
| ITEM 8. | PORTFOLIO MANAGERS OF CLOSED-END MANAGEMENT INVESTMENT COMPANIES. |
| ITEM 9. | PURCHASES OF EQUITY SECURITIES BY CLOSED-END MANAGEMENT INVESTMENT COMPANY AND AFFILIATED PURCHASERS. |
| ITEM 10. | SUBMISSION OF MATTERS TO A VOTE OF SECURITY HOLDERS. |
| | There have been no material changes to the procedures by which shareholders may recommend nominees to the registrant’s board of trustees. |
| ITEM 11. | CONTROLS AND PROCEDURES. |
| | (a) | The registrant’s principal executive and principal financial officers, or persons performing similar functions have concluded that the registrant’s disclosure controls and procedures (as defined in Rule 30a-3(c) under the Investment Company Act of 1940, as amended (the “1940 Act”)) are effective as of a date within 90 days of the filing of this report that includes the disclosure required by this paragraph, based on the evaluation of these controls and procedures required by Rule 30a-3(b) under the 1940 Act and 15d-15(b) under the Securities Exchange Act of 1934, as amended. |
| | (b) | There were no changes in the registrant’s internal control over financial reporting (as defined in Rule 30a-3(d) under the 1940 Act) that occurred during the registrant’s last fiscal quarter that have materially affected, or are reasonably likely to materially affect, the registrant’s internal control over financial reporting. |
| ITEM 12. | DISCLOSURE OF SECURITIES LENDING ACTIVITIES FOR CLOSED-END MANAGEMENT INVESTMENT COMPANIES |
| | | | |
| (a)(1) | | Goldman Sachs Trust II’s Code of Ethics for Principal Executive and Senior Financial Officers is incorporated by reference to Exhibit 12(a)(1) of the registrant’s Form N-CSR filed on July 8, 2015 for its Multi-Manager Non-Core Fixed Income Fund. |
| | |
| (a)(2) | | Exhibit 99.CERT | | Certifications pursuant to Section 302 of the Sarbanes-Oxley Act of 2002 filed herewith. |
| |
| (a)(3) | | Not applicable to open-end investment companies. |
| |
| (a)(4) | | There was no change in the registrant’s independent public accountant for the period covered by this report. |
| | |
| (b) | | Exhibit 99.906CERT | | Certifications pursuant to Section 906 of the Sarbanes-Oxley Act of 2002 filed herewith. |
SIGNATURES
Pursuant to the requirements of the Securities Exchange Act of 1934 and the Investment Company Act of 1940, the registrant has duly caused this report to be signed on its behalf by the undersigned, thereunto duly authorized.
| | | | |
| | | | Goldman Sachs Trust II |
| | |
| By: | | | | /s/ James A. McNamara |
| | | | James A. McNamara |
| | | | President/Chief Executive Officer |
| | | | Goldman Sachs Trust II |
| | |
| Date: | | | | November 6, 2018 |
Pursuant to the requirements of the Securities Exchange Act of 1934 and the Investment Company Act of 1940, this report has been signed below by the following persons on behalf of the registrant and in the capacities and on the dates indicated.
| | | | |
| By: | | | | /s/ James A. McNamara |
| | | | James A. McNamara |
| | | | President/Chief Executive Officer |
| | | | Goldman Sachs Trust II |
| | |
| Date: | | | | November 6, 2018 |
| | |
| By: | | | | /s/ Scott McHugh |
| | | | Scott McHugh |
| | | | Principal Financial Officer |
| | | | Goldman Sachs Trust II |
| | |
| Date: | | | | November 6, 2018 |