UNITED STATES
SECURITIES AND EXCHANGE COMMISSION
Washington, D.C. 20549
FORM N-CSR
CERTIFIED SHAREHOLDER REPORT OF REGISTERED
MANAGEMENT INVESTMENT COMPANIES
Investment Company Act file number 811-22781
Goldman Sachs Trust II
(Exact name of registrant as specified in charter)
200 West Street
15th Floor
New York, New York 10282
(Address of principal executive offices) (Zip code)
| | |
Copies to: |
Caroline Kraus | | Geoffrey R.T. Kenyon, Esq. |
Goldman Sachs & Co. LLC | | Dechert LLP |
200 West Street | | 100 Oliver Street |
New York, New York 10282 | | 40th Floor |
| | Boston, MA 02110-2605 |
(Name and address of agents for service)
Registrant’s telephone number, including area code: (212) 902-1000
Date of fiscal year end: October 31
Date of reporting period: October 31, 2018
| ITEM 1. | REPORTS TO STOCKHOLDERS. |
| | The Annual Report to Shareholders is filed herewith. |
Goldman Sachs Funds

| | | | |
| | |
| Annual Report | | | | October 31, 2018 |
| | |
| | | | Active Equity Multi-Manager Funds |
| | | | Multi-Manager International Equity |
| | | | Multi-Manager U.S. Dynamic Equity |
| | | | Multi-Manager U.S. Small Cap Equity |

Active Equity Multi-Manager Funds
| ∎ | | MULTI-MANAGER INTERNATIONAL EQUITY |
| ∎ | | MULTI-MANAGER U.S. DYNAMIC EQUITY |
| ∎ | | MULTI-MANAGER U.S. SMALL CAP EQUITY |
| | | | |
| | | |
| NOT FDIC-INSURED | | May Lose Value | | No Bank Guarantee |
MARKET REVIEW
Active Equity Multi-Manager Funds
Market Review
The capital markets experienced mixed results during the 12 months ended October 31, 2018 (the “Reporting Period”) amidst a resurgence of volatility.
When the Reporting Period began in November 2017, global equity markets marched higher, extending their record highs of the calendar year on the heels of strong corporate earnings growth and positive business sentiment. Bullish market sentiment was further augmented by the passage of a U.S. tax reform bill in December 2017. The U.S. Federal Reserve’s (“Fed”) decision in the same month to raise short-term interest rates by a quarter of a percentage point did little to temper the rally, as the rate hike was largely driven by the Fed’s positive outlook for U.S. economic growth and a strong jobs market. In late January 2018, the U.S. dollar fell to a three-year low versus other developed markets currencies based on concerns about rhetoric from the U.S. Treasury Secretary, who said he favored a weak U.S. dollar, as well as by what investors perceived as the erosion of the U.S. dollar’s yield relative to those of other currencies. During February 2018, volatility returned to the capital markets amid bond market jitters and a significant sell-off in the global equity markets, which was largely influenced by a rise in the 10-year U.S. Treasury yield. The U.S. Administration’s announcement of steel and aluminum tariffs compounded equity investors’ concerns. In March 2018, at Jerome Powell’s first policy meeting as Fed chair, the U.S. central bank raised short-term interest rates by another quarter percentage point. Fed policymakers went on to raise short-term rates by the same amount on two more occasions — in June and September 2018, and the capital markets anticipated a fourth hike before calendar year end. The Fed’s interest rate hikes led to higher U.S. bond yields, which, in addition to strong corporate earnings growth and a relatively stable macroeconomic picture, helped keep global equity markets rather range bound between March and September 2018. Then, in October, global equities sold off significantly, largely erasing earlier gains. The sell-off was triggered by the continued rise in U.S. bond yields and emerging signs of a slowdown in global economic growth, which sparked investors’ rotation out of growth- and momentum-oriented sectors, such as consumer discretionary and information technology, into value-oriented sectors, such as energy, and traditionally defensive sectors, such as utilities. Global equities finished the Reporting Period with modest losses, as positive returns in the U.S. were offset by the negative performance of European and emerging markets stocks. From a sector perspective, gains overall in health care and information technology were offset by declines in financials and industrials. In commodities, energy prices broadly moved higher during the Reporting Period overall on a combination of U.S. sanctions on Russia, trade disputes and continuing tightness in crude oil supplies. However, metals lagged, particularly in the closing months of the Reporting Period, as the outlook for global economic growth became a focal point for investors.
Credit markets generally sold off during the Reporting Period overall, as a more hawkish Fed continued to forecast additional interest rate hikes against the backdrop of strong U.S. economic growth and increasing signs of inflation. (Hawkish tends to suggest higher interest rates; opposite of dovish.) Credit spreads, or yield differentials between corporate bonds and U.S. Treasury securities of comparable maturity, widened slightly, with concerns about U.S.-China trade tensions weighing on investor sentiment for corporate bonds. Floating-rate bank loans were the best performing sector in the U.S. fixed income markets during the Reporting Period, as each increase in LIBOR boosted coupon payments, fueling investor demand. (LIBOR is London interbank offered rates, which are floating interest rates widely used as reference rates in bank, corporate and government lending agreements.) Demand for floating-rate bank loans came at the expense of fixed-rate investment grade bonds and
1
MARKET REVIEW
fixed-rate high yield corporate bonds. That said, high yield corporate bonds recorded a positive return for the Reporting Period overall, as their higher yields generally offset the negative effects of their greater duration and the widening of credit spreads. (Duration measures sensitivity to changes in interest rates.) Outside the U.S., emerging markets credit spreads also widened, as rising U.S. interest rates proved to be a headwind for emerging markets debt. Meanwhile, a strong U.S. dollar dampened the performance of local emerging markets bonds. As a result, U.S. dollar-denominated emerging markets debt and local emerging markets debt were among the worst performing fixed income sectors during the Reporting Period overall.
Public real estate markets were driven primarily by fundamentals during the Reporting Period overall, as investors’ search for yield continued to decrease at the margin. Dispersion among returns across yield quintiles, or market segments, remained modest, with lower yielding, higher quality real estate investment trusts (“REITs”) slightly outperforming. Global real estate markets were up modestly for the Reporting Period as a whole, largely because of a rally in industrial REITs, which benefited from ongoing e-commerce demand and higher barriers to entry for competitive new supply. That said, the performance of the global real estate markets varied during 2018, as a weak first quarter was offset by a rebounding second quarter and a rather muted third quarter. Among market segments, health care REITs struggled on weaker supply/demand dynamics, though more defensive securities performed well during the market volatility in October 2018. Self-storage REITs performed particularly well in the first half of 2018 but had an unusually poor third calendar quarter due to concerns about a potential moderation in 2019 earnings growth. Regionally, North American property stocks experienced a material reversal during the Reporting Period, going from being the worst performing region in the first quarter of 2018 to being the best performing region in the second calendar quarter, with modest additional gains during in the third calendar quarter. Japan and North America generally drove real estate markets during the Reporting Period overall, while Asia (ex-Japan) real estate lagged due in large part to a sell-off in Hong Kong listed companies. Real estate stocks broadly continued to price in further Fed rate hikes as well as elevated investor concerns surrounding U.S. tariffs and trade policy for more economically sensitive property types. In addition, merger and acquisition activity picked up during the Reporting Period.
Looking Ahead
At the end of the Reporting Period, investors appeared to be monitoring political developments in the U.S., with a focus on the midterm elections. A key issue was whether the Democrats would be able to win a majority in the House of Representatives, a result that could create political gridlock in the second half of the President’s term in office, in our view. (On November 6, 2018, after the end of the Reporting Period, the Democratic Party won a majority in the House of Representatives.) Additionally, U.S. trade policy remained a concern at the end of the Reporting Period, as investors monitored whether U.S.-China trade tensions would ease. On the economic front, investors continued to watch for any increase in U.S. inflation, as this could drive the Fed’s schedule for interest rate hikes. Finally, signs of slowing economic growth in China and Europe were drawing significant market attention, with investors looking to discern whether the global economic cycle had plateaued, which could potentially drive strong shifts in market performance.
2
PORTFOLIO RESULTS
Multi-Manager International Equity Fund
Investment Objective and Principal Strategy
The Fund seeks to provide long-term capital growth.
Portfolio Management Discussion and Analysis
Below, the Goldman Sachs Alternative Investments & Manager Selection (“AIMS”) Group discusses the Multi-Manager International Equity Fund’s (the “Fund”) performance and positioning for the 12-month period ended October 31, 2018 (the “Reporting Period”).
| Q | | How did the Fund perform during the Reporting Period? |
| A | | During the Reporting Period, the Fund’s Class P Shares (formerly Institutional Shares) generated an average annual total return of -5.63%. The return compares to the -6.85% average annual total return of the Fund’s benchmark, the MSCI Europe, Australasia and Far East (“EAFE”) Index (Net, USD, Unhedged) (the “Index”) during the same time period. |
| Q | | What key factors were responsible for the Fund’s performance during the Reporting Period? |
| A | | The Fund uses a multi-manager approach and generally seeks to achieve its investment objective by dynamically allocating its assets among unaffiliated investment managers (“Underlying Managers”) that employ an international equity investment strategy. The AIMS Group is responsible for making recommendations with respect to hiring, terminating or replacing the Fund’s Underlying Managers as well as for determining the Fund’s asset allocations. The AIMS Group applies a multifaceted process with respect to manager due diligence, portfolio construction and risk management. |
| | During the Reporting Period, the Fund recorded a negative absolute return but outperformed the Index. The relative outperformance can be attributed to the performance of the Fund’s Underlying Managers. The Fund allocated capital to three Underlying Managers during the Reporting Period as part of its top-level strategy allocation — Causeway Capital Management LLC (“Causeway”), Massachusetts Financial Services Company doing business as MFS Investment Management (“MFS”) and WCM Investment Management (“WCM”). |
| | All three of the Underlying Managers with allocated capital during the Reporting Period generated negative absolute returns. However, on a relative basis, growth-oriented Underlying Manager WCM and core-oriented MFS outperformed the Index. Value-oriented Causeway underperformed the Index. The Index serves as the benchmark index for all three Underlying Managers. |
| Q | | Which international equity strategies most significantly affected Fund performance? |
| A | | The Fund’s results were driven by growth-oriented Underlying Manager WCM, which outperformed the Index during the Reporting Period. WCM benefited from an overweight position and strong stock selection in health care as well as effective stock selection in the information technology and consumer discretionary sectors. |
| | Core-oriented Underlying Manager MFS outperformed the Index as well. Strong stock selection in information technology, plus an underweight and strong stock selection in financials, added to relative returns. In addition, an overweight in the health care sector contributed positively. |
| | Value-oriented Underlying Manager Causeway lagged the Index during the Reporting Period. Causeway was hurt by weak stock selection in consumer staples, information technology and utilities. |
| Q | | How did the Fund use derivatives and similar instruments during the Reporting Period? |
| A | | The Fund used forward foreign currency exchange contracts during the Reporting Period to take positions in select non-U.S. markets. The use of these derivatives did not have a material impact on the Fund’s results during the Reporting Period. |
| Q | | Were there any notable changes in the Fund’s allocations during the Reporting Period? |
| A | | At the beginning of the Reporting Period, the Fund’s assets were allocated approximately 44% to Causeway, 25% to MFS and 30% to WCM. The remainder of the Fund’s assets |
3
PORTFOLIO RESULTS
| | were invested in cash and cash equivalents. In August 2018, we decided to reduce the Fund’s exposure to growth stocks and trim its exposure to the emerging markets. As a result, we decreased the Fund’s allocation to WCM and increased its allocation to MFS. At the end of the Reporting Period, the Fund’s assets were allocated approximately 44% to Causeway, 35% to MFS and 20% to WCM. The remainder of the Fund’s assets were invested in cash and cash equivalents. |
| Q | | What is the Fund’s tactical view and strategy for the months ahead? |
| A | | At the end of the Reporting Period, the Fund was more defensively positioned than the Index. Compared to the Index, the Fund was overweight information technology and health care stocks and was underweight financials and real estate stocks. On a regional basis, the Fund was significantly underweight Japan and developed Asia, while maintaining out-of-benchmark exposure to the emerging markets and North America. From a market capitalization perspective, the Fund was overweight at the end of the Reporting Period in mega-cap stocks and maintained underweights relative to the Index in mid-cap and large-cap companies. |
| | We intend to continue to position the Fund in alignment with our longer-term strategic views within the international equity complex. We further intend to continue to monitor allocations and Underlying Manager performance as we seek to generate long-term capital growth. |
4
FUND BASICS
Multi-Manager International Equity Fund
as of October 31, 2018
| | | | | | | | | | |
| | PERFORMANCE REVIEW | | | | | | | | |
| | | November 1, 2017–October 31, 2018 | | Fund Total Return
(based on NAV)1 | | | MSCI® EAFE® Index
(Net, USD, Unhedged)2 | |
| | | Class P Shares | | | -5.63 | % | | | -6.85 | % |
| | 1 | | The net asset value (“NAV”) represents the net assets of the class of the Fund (ex-dividend) divided by the total number of shares of the class outstanding. The Fund’s performance assumes the reinvestment of dividends and other distributions. |
| | 2 | | The MSCI® EAFE® Index is a stock market index that is designed to measure the equity market performance of developed markets in Europe, Australasia and the Far East, excluding the U.S. and Canada. The Index figures do not reflect any deductions for fees, expenses or taxes. It is not possible to invest directly in an index. |
| | | | | | | | | | | | |
| | STANDARDIZED TOTAL RETURNS3 |
| | | For the period ended 9/30/18 | | One Year | | | Since Inception | | | Inception Date |
| | | Class P Shares | | | 5.01 | % | | | 6.42 | % | | 7/31/15 |
| | 3 | | The Standardized Total Returns are average annual total returns or cumulative total returns (only if the performance period is one year or less) as of the most recent calendar quarter-end. They assume reinvestment of all distributions at NAV. Because Class P Shares do not involve a sales charge, such a charge is not applied to their Standardized Total Returns. |
The returns set forth in the tables above represent past performance. Past performance does not guarantee future results. The Fund’s investment return and principal value will fluctuate so that an investor’s shares, when redeemed, may be worth more or less than their original cost. Current performance may be lower or higher than the performance quoted above. Please visit our web site at www.GSAMFUNDS.com to obtain the most recent month-end returns. Performance reflects applicable fee waivers and/or expense limitations in effect during the periods shown. In their absence, performance would be reduced. Returns do not reflect the deduction of taxes that a shareholder would pay on Fund distributions or the redemption of Fund shares.
| | | | | | | | | | |
| | EXPENSE RATIOS4 | |
| | | | | Net Expense Ratio (Current) | | | Gross Expense Ratio (Before Waivers) | |
| | | Class P Shares | | | 0.57 | % | | | 0.82 | % |
| | 4 | | The expense ratios of the Fund, both current (net of applicable fee waivers and/or expense limitations) and before waivers (gross of applicable fee waivers and/or expense limitations) are as set forth above according to the most recent publicly available Prospectus for the Fund and may differ from the expense ratios disclosed in the Financial Highlights in this report. Pursuant to contractual arrangements, the Fund’s waivers and/or expense limitations will remain in place through at least February 28, 2019, and prior to such date the Investment Adviser may not terminate the arrangements without the approval of the Fund’s Board of Trustees. If these arrangements are discontinued in the future, the expense ratios may change without shareholder approval. |
5
FUND BASICS
| | | | | | | | |
| TOP TEN EQUITY HOLDINGS AS OF 10/31/185 |
| | | Holding | | % of Net Assets | | | Line of Business |
| | Nestle SA | | | 2.2 | % | | Food Products |
| | Volkswagen AG | | | 1.9 | | | Automobiles |
| | Linde PLC | | | 1.9 | | | Chemicals |
| | Roche Holding AG | | | 1.8 | | | Pharmaceuticals |
| | Novartis AG | | | 1.8 | | | Pharmaceuticals |
| | Akzo Nobel NV | | | 1.8 | | | Chemicals |
| | AIA Group Ltd. | | | 1.6 | | | Insurance |
| | LVMH Moet Hennessy Louis Vuitton SE | | | 1.6 | | | Textiles, Apparel & Luxury Goods |
| | Prudential PLC | | | 1.6 | | | Insurance |
| | | Experian PLC | | | 1.5 | | | Professional Services |
| | 5 | | The top 10 holdings may not be representative of the Fund’s future investments. |
| | | | | | |
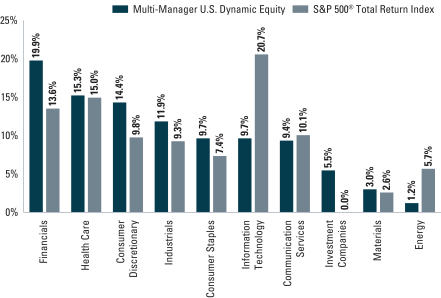
| | FUND VS. BENCHMARK SECTOR ALLOCATIONS (%)6 |
| | | As of October 31, 2018 | | | | |
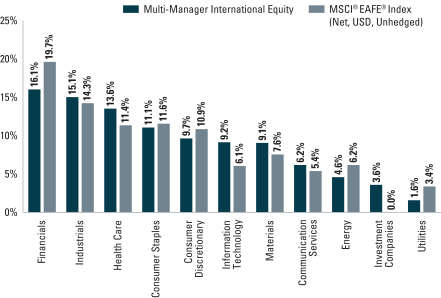
| | 6 | | The Fund is actively managed and, as such, its composition may differ over time. Consequently, the Fund’s overall sector allocations may differ from the percentages contained in the graph above. Figures in the graph may not sum to 100% due to rounding and/or the exclusion of other assets and liabilities. The graph categorizes investments using the Global Industry Classification Standard (“GICS”), however, the sector classifications used by the portfolio management team may differ from GICS. The percentage shown for each investment category reflects the value of investments in that category as a percentage of market value. The graph depicts the Fund’s investments but may not represent the Fund’s market exposure due to the exclusion of certain derivatives, if any, as listed in the Additional Investment Information section of the Schedule of Investments. |
6
MULTI-MANAGER INTERNATIONAL EQUITY FUND
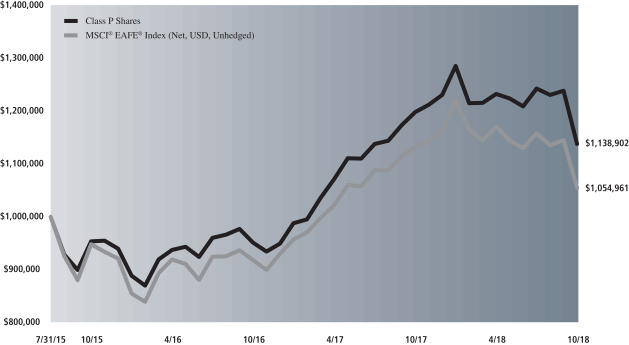
Performance Summary
October 31, 2018
The following graph shows the value, as of October 31, 2018, of a $1,000,000 investment made on July 31, 2015 (commencement of operations) in Class P Shares at NAV. For comparative purposes, the performance of the Fund’s benchmark, the MSCI® EAFE® Index (Net, USD, Unhedged) is shown. This performance data represents past performance and should not be considered indicative of future performance, which will fluctuate with changes in market conditions. These performance fluctuations may cause an investor’s shares, when redeemed, to be worth more or less than their original cost. Performance reflects applicable fee waivers and/or expense limitations in effect during the periods shown and in their absence, performance would be reduced. Returns do not reflect the deduction of taxes that a shareholder would pay on Fund distributions or the redemption of Fund shares. In addition to the Underlying Managers’ decisions regarding issuer/industry investment selection and allocation, other factors may affect Fund performance. These factors include, but are not limited to, Fund operating fees and expenses, portfolio turnover and subscription and redemption cash flows affecting the Fund.
|
| Multi-Manager International Equity Fund’s Lifetime Performance |
Performance of a $1,000,000 Investment, with distributions reinvested, from July 31, 2015 through October 31, 2018.
| | | | |
| Average Annual Total Return through October 31, 2018 | | One Year | | Since Inception |
|
Class P (Commenced July 31, 2015)* | | (5.63)% | | 3.47% |
|
| * | | Effective April 16, 2018, Institutional Shares were redesignated as Class P Shares. |
7
PORTFOLIO RESULTS
Multi-Manager U.S. Dynamic Equity Fund
Investment Objective and Principal Strategy
The Fund seeks to provide long-term capital growth.
Portfolio Management Discussion and Analysis
Below, the Goldman Sachs Alternative Investments & Manager Selection (“AIMS”) Group discusses the Multi-Manager U.S. Dynamic Equity Fund’s (the “Fund”) performance and positioning for the 12-month period ended October 31, 2018 (the “Reporting Period”).
| Q | | How did the Fund perform during the Reporting Period? |
| A | | During the Reporting Period, the Fund’s Class P Shares (formerly Institutional Shares) generated an average annual total return of 6.51%. This return compares to the 7.35% average annual total return of the Fund’s benchmark, the S&P 500® Total Return Index (the “Index”) during the same time period. |
| Q | | What key factors were responsible for the Fund’s performance during the Reporting Period? |
| A | | The Fund uses a multi-manager approach and generally seeks to achieve its investment objective by dynamically allocating its assets among unaffiliated investment managers (“Underlying Managers”) that employ dynamic equity investment strategies. (Dynamic equity investment strategies generally involve investing in equity instruments, often with a long term view. They are long-biased strategies and may have low excess return correlations to traditional long-only equity strategies.) The AIMS Group is responsible for making recommendations with respect to hiring, terminating or replacing the Fund’s Underlying Managers as well as for determining the Fund’s asset allocations. The AIMS Group applies a multifaceted process with respect to manager due diligence, portfolio construction and risk management. |
| | During the Reporting Period, the Fund recorded a positive absolute return but underperformed the Index. The relative underperformance can be attributed to the performance of the Fund’s Underlying Managers. The Fund allocated capital to three Underlying Managers during the Reporting Period as part of its top-level strategy allocation — Lazard Asset Management LLC (“Lazard”), Sirios Capital Management, L.P. (“Sirios”) and Smead Capital Management, Inc. (“Smead”). |
| | All three of the Underlying Managers with allocated capital during the Reporting Period posted positive absolute returns. On a relative basis, Sirios and Lazard underperformed the Index during the Reporting Period, while Smead outperformed the Index. The Index serves as the benchmark index for all three Underlying Managers. |
| Q | | Which dynamic equity strategies most significantly affected Fund performance? |
| A | | The Fund’s relative underperformance was driven by growth-oriented Underlying Manager Sirios, which lagged the Index during the Reporting Period because of weak stock selection in the consumer discretionary and telecommunication services sectors. An overweight and poor stock selection in the financials sector also detracted from results. |
| | Lazard, which uses an all cap, concentrated investment strategy, also underperformed the Index. An overweight in materials, along with a significant overweight and poor stock selection in consumer staples, detracted from relative performance. Weak stock selection in information technology further diminished returns. |
| | Core-oriented Underlying Manager Smead outpaced the Index during the Reporting Period through an underweight position and strong stock selection in consumer staples. Effective stock selection in health care and a significant overweight in the consumer discretionary sector also aided relative performance. |
| Q | | How did the Fund use derivatives and similar instruments during the Reporting Period? |
| A | | The Fund used forward foreign currency exchange contracts during the Reporting Period to take positions in select non-U.S. markets. The use of these derivatives had a positive impact on the Fund’s results during the Reporting Period. |
8
PORTFOLIO RESULTS
| Q | | Were there any notable changes in the Fund’s allocations during the Reporting Period? |
| A | | There were no changes in the Fund’s allocations during the Reporting Period. At the beginning and end of the Reporting Period, the Fund’s assets were allocated approximately 40.5% to Smead, 40.5% to Sirios and 18% to Lazard. The remainder of the Fund’s assets were invested in cash and cash equivalents. |
| | | Near the end of the Reporting Period, Vaughan Nelson Investment Management, L.P. (“Vaughan Nelson”) was added as an Underlying Manager of the Fund but was not allocated capital. Vaughan Nelson invests in companies that are earning above their cost of capital, with stable to improving returns and where it considers the valuation to be attractive (undervalued growth); companies valued at a significant discount to a specific asset value, with an identifiable catalyst to close the gap (undervalued assets); and companies with an attractive dividend yield and minimum basis risk (undervalued dividends). We added Vaughan Nelson as an Underlying Manager to balance the Fund more effectively from a sector perspective while more evenly dispersing risk across the Fund’s Underlying Managers. |
| Q | | What is the Fund’s tactical view and strategy for the months ahead? |
| A | | At the end of the Reporting Period, the Fund remained overweight relative to the Index in the consumer discretionary sector, primarily concentrated in the media and household durables industries. It also maintained an overweight in financials, with bank exposure held by Smead and Sirios. Lazard has not historically invested in banks. In addition, the Fund was overweight in the consumer staples sector compared to the Index. The Fund was most underweight in information technology, energy and communication services relative to the Index at the end of the Reporting Period and had no exposure to utilities or real estate. (Near the end of September 2018, the telecommunications services sector was renamed the communication services sector and was broadened to include certain companies from the information technology and consumer discretionary sectors that facilitate communication and offer related content and information through various media.) In terms of market capitalization, the Fund maintained a significant underweight in mega caps and an overweight relative to the Index in small/mid cap stocks. Regionally, the Fund was primarily invested in North American equities but also had modest exposure to companies domiciled in Europe and the U.K. |
| | We intend to continue to position the Fund in alignment with our longer-term strategic views within the U.S. equity complex. We further intend to continue to monitor allocations and Underlying Manager performance as we seek to generate long-term capital growth. |
9
FUND BASICS
Multi-Manager U.S. Dynamic Equity Fund
as of October 31, 2018
| | | | | | | | | | |
| | PERFORMANCE REVIEW | |
| | | November 1, 2017–October 31, 2018 | | Fund Total Return
(based on NAV)1 | | | S&P 500®
Total Return Index2 | |
| | | Class P Shares | | | 6.51 | % | | | 7.35 | % |
| | 1 | | The net asset value (“NAV”) represents the net assets of the class of the Fund (ex-dividend) divided by the total number of shares of the class outstanding. The Fund’s performance assumes the reinvestment of dividends and other distributions. |
| | 2 | | The S&P 500® Total Return Index is the Standard & Poor’s 500 Composite Index of 500 stocks, an unmanaged index of common stock prices. The Index figures do not reflect any deductions for fees, expenses or taxes. It is not possible to invest directly in an index. |
| | | | | | | | | | | | |
| | STANDARDIZED TOTAL RETURNS3 |
| | | For the period ended 9/30/18 | | One Year | | | Since Inception | | | Inception Date |
| | | Class P Shares | | | 14.69 | % | | | 8.43 | % | | 7/31/15 |
| | 3 | | The Standardized Total Returns are average annual total returns or cumulative total returns (only if the performance period is one year or less) as of the most recent calendar quarter-end. They assume reinvestment of all distributions at NAV. Because Class P Shares do not involve a sales charge, such a charge is not applied to their Standardized Total Returns. |
The returns set forth in the tables above represent past performance. Past performance does not guarantee future results. The Fund’s investment return and principal value will fluctuate so that an investor’s shares, when redeemed, may be worth more or less than their original cost. Current performance may be lower or higher than the performance quoted above. Please visit our web site at www.GSAMFUNDS.com to obtain the most recent month-end returns. Performance reflects applicable fee waivers and/or expense limitations in effect during the periods shown. In their absence, performance would be reduced. Returns do not reflect the deduction of taxes that a shareholder would pay on Fund distributions or the redemption of Fund shares.
| | | | | | | | | | |
| | EXPENSE RATIOS4 | |
| | | | | Net Expense Ratio (Current) | | | Gross Expense Ratio (Before Waivers) | |
| | | Class P Shares | | | 0.79 | % | | | 1.23 | % |
| | 4 | | The expense ratios of the Fund, both current (net of applicable fee waivers and/or expense limitations) and before waivers (gross of applicable fee waivers and/or expense limitations) are as set forth above according to the most recent publicly available Prospectus for the Fund and may differ from the expense ratios disclosed in the Financial Highlights in this report. Pursuant to contractual arrangements, the Fund’s waivers and/or expense limitations will remain in place through at least February 28, 2019, and prior to such date the Investment Adviser may not terminate the arrangements without the approval of the Fund’s Board of Trustees. If these arrangements are discontinued in the future, the expense ratios may change without shareholder approval. |
10
FUND BASICS
| | | | | | | | |
| | TOP TEN EQUITY HOLDINGS AS OF 10/31/185 |
| | | Holding | | % of Net Assets | | | Line of Business |
| | Berkshire Hathaway, Inc. Class B | | | 4.7 | % | | Diversified Financial Services |
| | JPMorgan Chase & Co. | | | 3.9 | | | Banks |
| | The Coca-Cola Co. | | | 3.5 | | | Beverages |
| | Bank of America Corp. | | | 3.1 | | | Banks |
| | Discovery, Inc. Class A | | | 3.1 | | | Media |
| | Amgen, Inc. | | | 2.6 | | | Biotechnology |
| | Airbus SE | | | 2.5 | | | Aerospace & Defense |
| | Walgreens Boots Alliance, Inc. | | | 2.4 | | | Food & Staples Retailing |
| | Target Corp. | | | 2.4 | | | Multiline Retail |
| | | American Express Co. | | | 2.3 | | | Consumer Finance |
| | 5 | | The top 10 holdings may not be representative of the Fund’s future investments. |
|
| FUND VS. BENCHMARK SECTOR ALLOCATIONS (%)6 |
| As of October 31, 2018 |
| | 6 | | The Fund is actively managed and, as such, its composition may differ over time. Consequently, the Fund’s overall sector allocations may differ from the percentages contained in the graph above. Figures in the graph may not sum to 100% due to rounding and/or the exclusion of other assets and liabilities. The graph categorizes investments using the Global Industry Classification Standard (“GICS”), however, the sector classifications used by the portfolio management team may differ from GICS. The percentage shown for each investment category reflects the value of investments in that category as a percentage of market value. The graph depicts the Fund’s investments but may not represent the Fund’s market exposure due to the exclusion of certain derivatives, if any, as listed in the Additional Investment Information section of the Schedule of Investments. |
11
MULTI-MANAGER U.S. DYNAMIC EQUITY FUND
Performance Summary
October 31, 2018
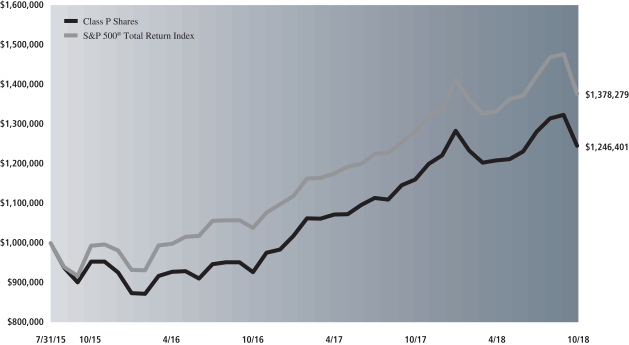
The following graph shows the value, as of October 31, 2018, of a $1,000,000 investment made on July 31, 2015 (commencement of operations) in Class P Shares at NAV. For comparative purposes, the performance of the Fund’s benchmark, the S&P 500® Total Return Index is shown. This performance data represents past performance and should not be considered indicative of future performance, which will fluctuate with changes in market conditions. These performance fluctuations may cause an investor’s shares, when redeemed, to be worth more or less than their original cost. Performance reflects applicable fee waivers and/or expense limitations in effect during the periods shown and in their absence, performance would be reduced. Returns do not reflect the deduction of taxes that a shareholder would pay on Fund distributions or the redemption of Fund shares. In addition to the Underlying Managers’ decisions regarding issuer/industry investment selection and allocation, other factors may affect Fund performance. These factors include, but are not limited to, Fund operating fees and expenses, portfolio turnover and subscription and redemption cash flows affecting the Fund.
|
| Multi-Manager U.S. Dynamic Equity Fund’s Lifetime Performance |
Performance of a $1,000,000 Investment, with distributions reinvested, from July 31, 2015 through October 31, 2018.
| | | | |
| Average Annual Total Return through October 31, 2018 | | One Year | | Since Inception |
|
Class P (Commenced July 31, 2015)* | | 6.51% | | 6.15% |
|
| * | | Effective April 16, 2018, Institutional Shares were redesignated as Class P Shares. |
12
PORTFOLIO RESULTS
Multi-Manager U.S. Small Cap Equity Fund
Investment Objective and Principal Strategy
The Fund seeks to provide long-term capital growth.
Portfolio Management Discussion and Analysis
Below, the Goldman Sachs Alternative Investments & Manager Selection (“AIMS”) Group discusses the Multi-Manager U.S. Small Cap Equity Fund’s (the “Fund”) performance and positioning for the 12-month period ended October 31, 2018 (the “Reporting Period”).
| Q | | How did the Fund perform during the Reporting Period? |
| A | | During the Reporting Period, the Fund’s Class P Shares (formerly Institutional Shares) generated an average annual total return of -0.40%. This return compares to the 1.85% average annual total return of the Fund’s benchmark, the Russell 2000® Total Return Index (the “Index”) during the same time period. |
| Q | | What key factors were responsible for the Fund’s performance during the Reporting Period? |
| A | | The Fund uses a multi-manager approach and generally seeks to achieve its investment objective by dynamically allocating its assets among unaffiliated investment managers (“Underlying Managers”) that employ a small-cap equity investment strategy. The AIMS Group is responsible for making recommendations with respect to hiring, terminating or replacing the Fund’s Underlying Managers as well as for determining the Fund’s asset allocations. The AIMS Group applies a multifaceted process with respect to manager due diligence, portfolio construction and risk management. |
| | | During the Reporting Period, the Fund recorded a slightly negative absolute return and underperformed the Index. The relative underperformance can be attributed to the performance of the Fund’s Underlying Managers. The Fund allocated capital to three Underlying Managers during the Reporting Period as part of its top-level strategy allocation — Brown Advisory, LLC (“Brown Advisory”), PNC Capital Advisors, LLC (“PNC”) and Boston Partners Global Investors Inc. (“Boston Partners”). |
| | | All three of the Underlying Managers with allocated capital during the Reporting Period generated negative absolute returns. On a relative basis, value-oriented Boston Partners and core-oriented manager PNC underperformed their benchmark indices. Growth-oriented manager Brown Advisory slightly outperformed its benchmark index during the Reporting Period. |
| Q | | Which small-cap equity strategies most significantly affected Fund performance? |
| A | | The Fund’s relative underperformance was led by value-oriented Underlying Manager Boston Partners, which lagged its benchmark index, the Russell 2000® Value Index, during the Reporting Period. An overweight position and poor stock selection within materials detracted from relative returns. Weak stock selection and an overweight in the consumer discretionary sector further diminished results. |
| | | Core-oriented Underlying Manager PNC also underperformed its benchmark index, the Russell 2000® Total Return Index. Its negative results were due to poor stock selection in the consumer discretionary sector as well as an underweight position and weak stock selection in the health care sector. |
| | | Growth-oriented Underlying Manager Brown Advisory slightly outperformed its benchmark index, the Russell 2000® Growth Index, during the Reporting Period, driven by a significant overweight in the information technology sector and a lack of exposure to the materials sector. Additionally, strong stock selection in industrials aided results. |
| Q | | How did the Fund use derivatives and similar instruments during the Reporting Period? |
| A | | The Fund did not use derivatives or similar instruments during the Reporting Period. |
| Q | | Were there any notable changes in the Fund’s allocations during the Reporting Period? |
| A | | There were no changes in the Fund’s allocations during the Reporting Period. At the beginning and end of the Reporting Period, the Fund’s assets were allocated approximately 44% |
13
PORTFOLIO RESULTS
| | to Boston Partners, 30% to Brown Advisory and 25% to PNC. The remainder of the Fund’s assets were invested in cash and cash equivalents. |
| Q | | What is the Fund’s tactical view and strategy for the months ahead? |
| A | | At the end of the Reporting Period, the Fund was moderately overweight compared to the Index in financials, industrials and information technology, while it was underweight health care, real estate and utilities. In terms of market capitalization, the Fund maintained a slight small/mid cap bias relative to the Index, driven predominantly by Underlying Manager Brown Advisory. |
| | | We intend to continue to position the Fund in alignment with our longer-term strategic views within the U.S. small-cap equity complex. We further intend to continue to monitor allocations and Underlying Manager performance as we seek to generate long-term capital growth. |
14
FUND BASICS
Multi-Manager U.S. Small Cap Equity Fund
as of October 31, 2018
| | | | | | | | | | |
| | PERFORMANCE REVIEW | |
| | | November 1, 2017–October 31, 2018 | | Fund Total Return
(based on NAV)1 | | | Russell 2000®
Total Return Index2 | |
| | | Class P Shares | | | -0.40 | % | | | 1.85 | % |
| | 1 | | The net asset value (“NAV”) represents the net assets of the class of the Fund (ex-dividend) divided by the total number of shares of the class outstanding. The Fund’s performance assumes the reinvestment of dividends and other distributions. |
| | 2 | | The Russell 2000® Total Return Index is an unmanaged index of common stock prices that measures the performance of the 2000 smallest companies in the Russell 3000® Index. The Index is constructed to provide a comprehensive and unbiased small-cap barometer and is completely reconstituted annually to ensure larger stocks do not distort the performance and characteristics of the true small-cap opportunity set. |
| | | | | | | | | | | | |
| | STANDARDIZED TOTAL RETURNS3 |
| | | For the period ended 9/30/18 | | One Year | | | Since Inception | | | Inception Date |
| | | Class P Shares | | | 12.03 | % | | | 15.75 | % | | 4/29/16 |
| | 3 | | The Standardized Total Returns are average annual total returns or cumulative total returns (only if the performance period is one year or less) as of the most recent calendar quarter-end. They assume reinvestment of all distributions at NAV. Because Class P Shares do not involve a sales charge, such a charge is not applied to their Standardized Total Returns. |
The returns set forth in the tables above represent past performance. Past performance does not guarantee future results. The Fund’s investment return and principal value will fluctuate so that an investor’s shares, when redeemed, may be worth more or less than their original cost. Current performance may be lower or higher than the performance quoted above. Please visit our web site at www.GSAMFUNDS.com to obtain the most recent month-end returns. Performance reflects applicable fee waivers and/or expense limitations in effect during the periods shown. In their absence, performance would be reduced. Returns do not reflect the deduction of taxes that a shareholder would pay on Fund distributions or the redemption of Fund shares.
| | | | | | | | | | |
| | EXPENSE RATIOS4 | |
| | | | | Net Expense Ratio (Current) | | | Gross Expense Ratio (Before Waivers) | |
| | | Class P Shares | | | 0.80 | % | | | 1.13 | % |
| | 4 | | The expense ratios of the Fund, both current (net of applicable fee waivers and/or expense limitations) and before waivers (gross of applicable fee waivers and/or expense limitations) are as set forth above according to the most recent publicly available Prospectus for the Fund and may differ from the expense ratios disclosed in the Financial Highlights in this report. Pursuant to contractual arrangements, the Fund’s waivers and/or expense limitations will remain in place through at least February 28, 2019, and prior to such date the Investment Adviser may not terminate the arrangements without the approval of the Fund’s Board of Trustees. If these arrangements are discontinued in the future, the expense ratios may change without shareholder approval. |
15
FUND BASICS
| | | | | | | | |
| | TOP TEN EQUITY HOLDINGS AS OF 10/31/185 |
| | | Holding | | % of Net Assets | | | Line of Business |
| | EnerSys | | | 1.4 | % | | Electrical Equipment |
| | HEICO Corp. | | | 1.4 | | | Aerospace & Defense |
| | Waste Connections, Inc. | | | 1.2 | | | Commercial Services & Supplies |
| | Lithia Motors, Inc. Class A | | | 1.2 | | | Specialty Retail |
| | ASGN, Inc. | | | 1.1 | | | Professional Services |
| | Bright Horizons Family Solutions, Inc. | | | 1.1 | | | Diversified Consumer Services |
| | National General Holdings Corp. | | | 1.0 | | | Insurance |
| | Two Harbors Investment Corp. | | | 1.0 | | | Mortgage Real Estate
Investment Trusts (REITs) |
| | PRA Group, Inc. | | | 1.0 | | | Consumer Finance |
| | | SLM Corp. | | | 1.0 | | | Consumer Finance |
| | 5 | | The top 10 holdings may not be representative of the Fund’s future investments. |
|
| FUND VS. BENCHMARK SECTOR ALLOCATIONS(%)6 |
| As of October 31, 2018 |
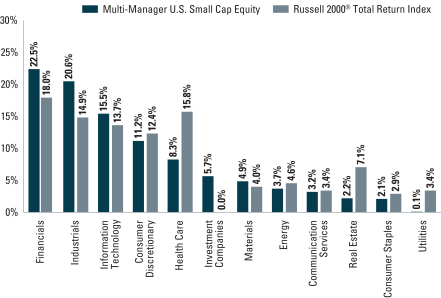
| | 6 | | The Fund is actively managed and, as such, its composition may differ over time. Consequently, the Fund’s overall sector allocations may differ from the percentages contained in the graph above. Figures in the graph may not sum to 100% due to rounding and/or the exclusion of other assets and liabilities. The graph categorizes investments using the Global Industry Classification Standard (“GICS”), however, the sector classifications used by the portfolio management team may differ from GICS. The percentage shown for each investment category reflects the value of investments in that category as a percentage of market value. Short-term investments represent repurchase agreements. The graph depicts the Fund’s investments but may not represent the Fund’s market exposure due to the exclusion of certain derivatives, if any, as listed in the Additional Investment Information section of the Schedule of Investments. |
16
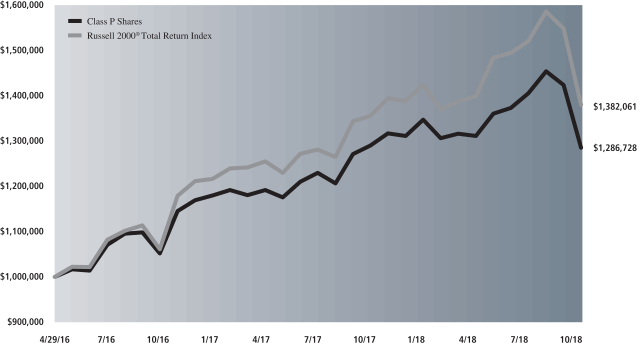
MULTI-MANAGER U.S. SMALL CAP EQUITY
Performance Summary
October 31, 2018
The following graph shows the value, as of October 31, 2018, of a $1,000,000 investment made on April 29, 2016 (commencement of operations) in Class P Shares at NAV. For comparative purposes, the performance of the Fund’s benchmark, the Russell 2000® Total Return Index is shown. This performance data represents past performance and should not be considered indicative of future performance, which will fluctuate with changes in market conditions. These performance fluctuations may cause an investor’s shares, when redeemed, to be worth more or less than their original cost. Performance reflects applicable fee waivers and/or expense limitations in effect during the periods shown and in their absence, performance would be reduced. Returns do not reflect the deduction of taxes that a shareholder would pay on Fund distributions or the redemption of Fund shares. In addition to the Underlying Managers’ decisions regarding issuer/industry investment selection and allocation, other factors may affect Fund performance. These factors include, but are not limited to, Fund operating fees and expenses, portfolio turnover and subscription and redemption cash flows affecting the Fund.
|
| Multi-Manager U.S. Small Cap Equity Fund’s Lifetime Performance |
Performance of a $1,000,000 Investment, with distributions reinvested, from April 29, 2016 through October 31, 2018.
| | | | |
| Average Annual Total Return through October 31, 2018 | | One Year | | Since Inception |
|
Class P (Commenced April 29, 2016)* | | (0.40)% | | 10.57% |
|
| * | | Effective April 16, 2018, Institutional Shares were redesignated as Class P Shares. |
17
FUND BASICS
Index Definitions
The Russell 2000® Growth Index measures the performance of the small-cap growth stocks of the U.S. equity universe. It is not possible to invest in an unmanaged index.
The Russell 2000® Value Index measures the performance of the small-cap value stocks of the U.S. equity universe. It is not possible to invest in an unmanaged index.
18
MULTI-MANAGER INTERNATIONAL EQUITY FUND
Schedule of Investments
October 31, 2018
| | | | | | | | |
Shares | | | Description | | Value | |
| Common Stocks – 94.3% | |
| Australia – 1.3% | | | |
| | 96,002 | | | Amcor Ltd. (Containers & Packaging) | | $ | 905,895 | |
| | 48,846 | | | CSL Ltd. (Biotechnology) | | | 6,520,801 | |
| | 41,839 | | | Orica Ltd. (Chemicals) | | | 509,760 | |
| | | | | | | | |
| | | | | | | 7,936,456 | |
| | |
| Belgium – 0.5% | |
| | 42,519 | | | KBC Group NV (Banks) | | | 2,930,241 | |
| | |
| Brazil – 0.6% | |
| | 305,338 | | | Ambev SA ADR (Beverages) | | | 1,322,114 | |
| | 125,800 | | | Raia Drogasil SA (Food & Staples Retailing) | | | 2,123,540 | |
| | | | | | | | |
| | | | | | | 3,445,654 | |
| | |
| Canada – 6.6% | |
| | 7,835 | | | Canadian Imperial Bank of Commerce (Banks) | | | 676,579 | |
| | 47,029 | | | Canadian National Railway Co. (Road & Rail) | | | 4,020,039 | |
| | 48,594 | | | Canadian Pacific Railway Ltd. (Road & Rail) | | | 9,963,046 | |
| | 74,283 | | | Dollarama, Inc. (Multiline Retail) | | | 2,054,498 | |
| | 491,954 | | | Encana Corp. (Oil, Gas & Consumable Fuels) | | | 5,022,494 | |
| | 134,243 | | | Gildan Activewear, Inc. (Textiles, Apparel & Luxury Goods) | | | 4,012,657 | |
| | 436,838 | | | Manulife Financial Corp. (Insurance) | | | 6,878,842 | |
| | 35,840 | | | Shopify, Inc. Class A* (IT Services) | | | 4,951,296 | |
| | 113,937 | | | Suncor Energy, Inc. (Oil, Gas & Consumable Fuels) | | | 3,821,989 | |
| | | | | | | | |
| | | | | | | 41,401,440 | |
| | |
| Cayman Islands – 1.8% | |
| | 42,334 | | | Baidu, Inc. ADR* (Interactive Media & Services) | | | 8,046,000 | |
| | 95,840 | | | Tencent Holdings Ltd. (Interactive Media & Services) | | | 3,283,407 | |
| | | | | | | | |
| | | | | | | 11,329,407 | |
| | |
| Denmark – 1.6% | |
| | 264 | | | AP Moller – Maersk A/S Class B (Marine) | | | 333,223 | |
| | 14,792 | | | Carlsberg A/S Class B (Beverages) | | | 1,631,803 | |
| | 47,663 | | | Chr Hansen Holding A/S (Chemicals) | | | 4,811,201 | |
| | 80,980 | | | Novo Nordisk A/S Class B (Pharmaceuticals) | | | 3,497,247 | |
| | | | | | | | |
| | | | | | | 10,273,474 | |
| | |
| France – 8.6% | |
| | 48,595 | | | Air Liquide SA (Chemicals) | | | 5,874,467 | |
| | 97,092 | | | BNP Paribas SA (Banks) | | | 5,059,857 | |
| | 40,728 | | | Danone SA (Food Products) | | | 2,884,086 | |
| | 10,733 | | | Dassault Systemes SE (Software) | | | 1,343,606 | |
| | 324,918 | | | Engie SA (Multi-Utilities) | | | 4,317,249 | |
| | 38,538 | | | EssilorLuxottica SA (Health Care Equipment & Supplies) | | | 5,263,463 | |
| | |
| Common Stocks – (continued) | |
| France – (continued) | |
| | 232 | | | Hermes International (Textiles, Apparel & Luxury Goods) | | | 132,449 | |
| | 10,994 | | | L’Oreal SA (Personal Products) | | | 2,477,017 | |
| | 31,919 | | | Legrand SA (Electrical Equipment) | | | 2,084,340 | |
| | 33,053 | | | LVMH Moet Hennessy Louis Vuitton SE (Textiles, Apparel & Luxury Goods) | | | 10,028,460 | |
| | 57,983 | | | Pernod Ricard SA (Beverages) | | | 8,841,630 | |
| | 74,821 | | | Schneider Electric SE (Electrical Equipment) | | | 5,410,388 | |
| | | | | | | | |
| | | | | | | 53,717,012 | |
| | |
| Germany – 5.4% | |
| | 21,925 | | | adidas AG (Textiles, Apparel & Luxury Goods) | | | 5,155,969 | |
| | 107,586 | | | BASF SE (Chemicals) | | | 8,255,989 | |
| | 14,982 | | | Bayer AG (Pharmaceuticals) | | | 1,148,407 | |
| | 43,618 | | | Beiersdorf AG (Personal Products) | | | 4,509,984 | |
| | 124,661 | | | Deutsche Post AG (Air Freight & Logistics) | | | 3,936,204 | |
| | 25,630 | | | Merck KGaA (Pharmaceuticals) | | | 2,742,493 | |
| | 6,533 | | | MTU Aero Engines AG (Aerospace & Defense) | | | 1,387,165 | |
| | 41,861 | | | ProSiebenSat.1 Media SE (Media) | | | 966,633 | |
| | 53,045 | | | SAP SE (Software) | | | 5,679,711 | |
| | | | | �� | | | |
| | | | | | | 33,782,555 | |
| | |
| Hong Kong – 3.1% | |
| | 1,352,000 | | | AIA Group Ltd. (Insurance) | | | 10,284,722 | |
| | 759,514 | | | China Merchants Port Holdings Co. Ltd. (Transportation Infrastructure) | | | 1,293,702 | |
| | 847,000 | | | China Mobile Ltd. (Wireless Telecommunication Services) | | | 7,934,593 | |
| | | | | | | | |
| | | | | | | 19,513,017 | |
| | |
| India – 1.6% | |
| | 52,664 | | | HDFC Bank Ltd. ADR (Banks) | | | 4,682,356 | |
| | 81,901 | | | Housing Development Finance Corp. Ltd. (Thrifts & Mortgage Finance) | | | 1,959,361 | |
| | 135,496 | | | Tata Consultancy Services Ltd. (IT Services) | | | 3,552,088 | |
| | | | | | | | |
| | | | | | | 10,193,805 | |
| | |
| Ireland – 3.9% | |
| | 39,339 | | | Accenture PLC Class A (IT Services) | | | 6,200,613 | |
| | 31,722 | | | ICON PLC* (Life Sciences Tools & Services) | | | 4,380,174 | |
| | 71,599 | | | Linde PLC* (Chemicals) | | | 11,746,778 | |
| | 26,773 | | | Ryanair Holdings PLC ADR* (Airlines) | | | 2,216,805 | |
| | | | | | | | |
| | | | | | | 24,544,370 | |
| | |
| Israel* – 0.4% | |
| | 23,167 | | | Check Point Software Technologies Ltd. (Software) | | | 2,571,537 | |
| | |
| | |
| The accompanying notes are an integral part of these financial statements. | | 19 |
MULTI-MANAGER INTERNATIONAL EQUITY FUND
Schedule of Investments (continued)
October 31, 2018
| | | | | | | | |
Shares | | | Description | | Value | |
| Common Stocks – (continued) | |
| Italy – 2.5% | |
| | 141,286 | | | Eni SpA (Oil, Gas & Consumable Fuels) | | $ | 2,509,204 | |
| | 830,029 | | | Intesa Sanpaolo SpA (Banks) | | | 1,838,576 | |
| | 48,259 | | | Luxottica Group SpA (Textiles, Apparel & Luxury Goods) | | | 3,030,822 | |
| | 664,853 | | | UniCredit SpA (Banks) | | | 8,500,250 | |
| | | | | | | | |
| | | | | | | 15,878,852 | |
| | |
| Japan – 12.2% | |
| | 24,400 | | | Daikin Industries Ltd. (Building Products) | | | 2,828,250 | |
| | 62,400 | | | Denso Corp. (Auto Components) | | | 2,783,398 | |
| | 62,100 | | | East Japan Railway Co. (Road & Rail) | | | 5,423,669 | |
| | 47,300 | | | FANUC Corp. (Machinery) | | | 8,228,635 | |
| | 102,300 | | | Hoya Corp. (Health Care Equipment & Supplies) | | | 5,787,700 | |
| | 124,200 | | | Japan Airlines Co. Ltd. (Airlines) | | | 4,408,001 | |
| | 118,100 | | | Japan Tobacco, Inc. (Tobacco) | | | 3,034,615 | |
| | 6,800 | | | Kao Corp. (Personal Products) | | | 452,351 | |
| | 262,600 | | | KDDI Corp. (Wireless Telecommunication Services) | | | 6,354,877 | |
| | 11,100 | | | Keyence Corp. (Electronic Equipment, Instruments & Components) | | | 5,422,567 | |
| | 170,700 | | | Kubota Corp. (Machinery) | | | 2,694,804 | |
| | 58,200 | | | Kyocera Corp. (Electronic Equipment, Instruments & Components) | | | 3,149,951 | |
| | 73,300 | | | Olympus Corp. (Health Care Equipment & Supplies) | | | 2,443,221 | |
| | 9,100 | | | Shin-Etsu Chemical Co. Ltd. (Chemicals) | | | 760,400 | |
| | 102,600 | | | Sompo Holdings, Inc. (Insurance) | | | 4,231,789 | |
| | 93,100 | | | Sumitomo Mitsui Financial Group, Inc. (Banks) | | | 3,624,857 | |
| | 40,495 | | | Sysmex Corp. (Health Care Equipment & Supplies) | | | 2,840,299 | |
| | 191,400 | | | Takeda Pharmaceutical Co. Ltd. (Pharmaceuticals) | | | 7,935,352 | |
| | 80,100 | | | Terumo Corp. (Health Care Equipment & Supplies) | | | 4,323,950 | |
| | | | | | | | |
| | | | | | | 76,728,686 | |
| | |
| Mexico – 0.6% | |
| | 1,466,265 | | | Wal-Mart de Mexico SAB de CV (Food & Staples Retailing) | | | 3,744,838 | |
| | |
| Netherlands – 3.7% | |
| | 130,767 | | | Akzo Nobel NV (Chemicals) | | | 10,979,851 | |
| | 32,016 | | | Core Laboratories NV (Energy Equipment & Services) | | | 2,729,044 | |
| | 440,645 | | | ING Groep NV (Banks) | | | 5,213,267 | |
| | 46,522 | | | QIAGEN NV* (Life Sciences Tools & Services) | | | 1,688,688 | |
| | 53,377 | | | Randstad NV (Professional Services) | | | 2,685,538 | |
| | | | | | | | |
| | | | | | | 23,296,388 | |
| | |
| Common Stocks – (continued) | |
| Singapore – 0.3% | |
| | 92,500 | | | DBS Group Holdings Ltd. (Banks) | | | 1,569,486 | |
| | |
| South Korea – 1.6% | |
| | 3,083 | | | Samsung Electronics Co. Ltd. GDR (Technology Hardware, Storage & Peripherals) | | | 2,876,439 | |
| | |
| | 4,343 | | | SK Innovation Co. Ltd. (Oil, Gas & Consumable Fuels) | | | 815,051 | |
| | 236,623 | | | SK Telecom Co. Ltd. ADR (Wireless Telecommunication Services) | | | 6,130,902 | |
| | | | | | | | |
| | | | | | | 9,822,392 | |
| | |
| Spain – 1.8% | |
| | 90,559 | | | Amadeus IT Group SA (IT Services) | | | 7,292,225 | |
| | 687,534 | | | CaixaBank SA (Banks) | | | 2,782,252 | |
| | 50,172 | | | Industria de Diseno Textil SA (Specialty Retail) | | | 1,414,083 | |
| | | | | | | | |
| | | | | | | 11,488,560 | |
| | |
| Sweden – 1.3% | |
| | 105,601 | | | Atlas Copco AB Class A (Machinery) | | | 2,610,642 | |
| | 68,390 | | | Essity AB Class B (Household Products) | | | 1,560,759 | |
| | 81,610 | | | Hexagon AB Class B (Electronic Equipment, Instruments & Components) | | | 3,994,288 | |
| | | | | | | | |
| | | | | | | 8,165,689 | |
| | |
| Switzerland – 11.1% | |
| | 391,429 | | | ABB Ltd. (Electrical Equipment) | | | 7,876,154 | |
| | 74,280 | | | Aryzta AG* (Food Products) | | | 692,804 | |
| | 40,006 | | | Chubb Ltd. (Insurance) | | | 4,997,150 | |
| | 68,196 | | | Cie Financiere Richemont SA (Textiles, Apparel & Luxury Goods) | | | 4,984,485 | |
| | 1,357 | | | Givaudan SA (Chemicals) | | | 3,289,256 | |
| | 6,881 | | | Kuehne & Nagel International AG (Marine) | | | 956,353 | |
| | 162,008 | | | Nestle SA (Food Products) | | | 13,677,215 | |
| | 128,062 | | | Novartis AG (Pharmaceuticals) | | | 11,214,683 | |
| | 46,573 | | | Roche Holding AG (Pharmaceuticals) | | | 11,334,118 | |
| | 23,790 | | | Sika AG (Chemicals) | | | 3,050,413 | |
| | 332,778 | | | UBS Group AG* (Capital Markets) | | | 4,651,276 | |
| | 8,758 | | | Zurich Insurance Group AG (Insurance) | | | 2,719,194 | |
| | | | | | | | |
| | | | | | | 69,443,101 | |
| | |
| Taiwan – 1.3% | |
| | 215,018 | | | Taiwan Semiconductor Manufacturing Co. Ltd. ADR (Semiconductors & Semiconductor Equipment) | | | 8,192,186 | |
| | |
| Turkey – 0.1% | |
| | 674,881 | | | Akbank T.A.S. (Banks) | | | 798,104 | |
| | |
| | |
| 20 | | The accompanying notes are an integral part of these financial statements. |
MULTI-MANAGER INTERNATIONAL EQUITY FUND
| | | | | | | | |
Shares | | | Description | | Value | |
| Common Stocks – (continued) | |
| United Kingdom – 21.2% | |
| | 82,015 | | | AstraZeneca PLC (Pharmaceuticals) | | $ | 6,273,296 | |
| | 910,595 | | | Aviva PLC (Insurance) | | | 4,976,297 | |
| | 556,479 | | | Balfour Beatty PLC (Construction & Engineering) | | | 1,869,491 | |
| | 4,255,421 | | | Barclays PLC (Banks) | | | 9,375,992 | |
| | 101,667 | | | BHP Billiton PLC (Metals & Mining) | | | 2,028,124 | |
| | 927,982 | | | BP PLC (Oil, Gas & Consumable Fuels) | | | 6,703,481 | |
| | 218,538 | | | British American Tobacco PLC (Tobacco) | | | 9,473,680 | |
| | 72,148 | | | Carnival PLC (Hotels, Restaurants & Leisure) | | | 3,932,461 | |
| | 2,541,577 | | | Cobham PLC* (Aerospace & Defense) | | | 3,488,697 | |
| | 378,433 | | | Compass Group PLC (Hotels, Restaurants & Leisure) | | | 7,443,320 | |
| | 213,348 | | | Diageo PLC (Beverages) | | | 7,375,764 | |
| | 416,063 | | | Experian PLC (Professional Services) | | | 9,569,114 | |
| | 172,848 | | | GlaxoSmithKline PLC (Pharmaceuticals) | | | 3,347,678 | |
| | 48,089 | | | Johnson Matthey PLC (Chemicals) | | | 1,823,233 | |
| | 121,287 | | | Just Eat PLC* (Internet & Direct Marketing Retail) | | | 940,881 | |
| | 4,375,425 | | | Lloyds Banking Group PLC (Banks) | | | 3,192,917 | |
| | 161,695 | | | Micro Focus International PLC (Software) | | | 2,506,630 | |
| | 492,525 | | | Prudential PLC (Insurance) | | | 9,862,138 | |
| | 53,937 | | | Reckitt Benckiser Group PLC (Household Products) | | | 4,361,566 | |
| | 123,789 | | | RELX PLC* (Professional Services) | | | 2,449,463 | |
| | 55,529 | | | RELX PLC (Professional Services) | | | 1,098,178 | |
| | 53,431 | | | Rio Tinto PLC (Metals & Mining) | | | 2,594,116 | |
| | 29,495,967 | | | Rolls-Royce Holdings PLC* (Aerospace & Defense) | | | 7,098,962 | |
| | 221,453 | | | Royal Dutch Shell PLC Class B (Oil, Gas & Consumable Fuels) | | | 7,222,230 | |
| | 43,617 | | | Smiths Group PLC (Industrial Conglomerates) | | | 777,495 | |
| | 394,061 | | | SSE PLC (Electric Utilities) | | | 5,743,606 | |
| | 528,419 | | | Tesco PLC (Food & Staples Retailing) | | | 1,439,108 | |
| | 2,106,507 | | | Vodafone Group PLC (Wireless Telecommunication Services) | | | 3,961,367 | |
| | 200,030 | | | WPP PLC (Media) | | | 2,263,486 | |
| | | | | | | | |
| | | | | | | 133,192,771 | |
| | |
| United States – 1.2% | |
| | 8,450 | | | Mettler-Toledo International, Inc.* (Life Sciences Tools & Services) | | | 4,620,629 | |
| | 82,492 | | | Yum China Holdings, Inc. (Hotels, Restaurants & Leisure) | | | 2,976,311 | |
| | | | | | | | |
| | | | | | | 7,596,940 | |
| | |
| | TOTAL COMMON STOCKS
| |
| (Cost $583,251,407) | | $591,556,961 | |
| | |
| Preferred Stock – 1.9% | |
| Germany – 1.9% | |
Volkswagen AG (Automobiles) | |
| 70,351 | | 2.700% | | $ | 11,819,173 | |
| (Cost $10,582,188) | | | | |
| |
| | | | | | |
| Investment Company(a) – 3.6% | |
Goldman Sachs Financial Square Government Fund – Institutional Shares | |
| 22,326,171 | | 2.102% | | $ | 22,326,171 | |
| (Cost $22,326,171) | | | | |
| |
| TOTAL INVESTMENTS – 99.8% | |
| (Cost $616,159,766) | | $ | 625,702,305 | |
| |
OTHER ASSETS IN EXCESS OF LIABILITIES – 0.2% | | | 1,268,944 | |
| |
| NET ASSETS – 100.0% | | $ | 626,971,249 | |
| |
| | | | |
| The percentage shown for each investment category reflects the value of investments in that category as a percentage of net assets. |
* | | Non-income producing security. |
(a) | | Represents an affiliated issuer. |
| | |
|
Investment Abbreviations: |
ADR | | —American Depositary Receipt |
GDR | | —Global Depository Receipt |
PLC | | —Public Limited Company |
|
| | |
| The accompanying notes are an integral part of these financial statements. | | 21 |
MULTI-MANAGER INTERNATIONAL EQUITY FUND
Schedule of Investments (continued)
October 31, 2018
|
| ADDITIONAL INVESTMENT INFORMATION |
FORWARD FOREIGN CURRENCY EXCHANGE CONTRACTS — At October 31, 2018, the Fund had the following forward foreign currency exchange contracts:
FORWARD FOREIGN CURRENCY EXCHANGE CONTRACTS WITH UNREALIZED GAIN
| | | | | | | | | | | | | | |
| Counterparty | | Currency
Purchased | | | Currency
Sold | | Settlement
Date | | | Unrealized
Gain | |
State Street Bank and Trust | | | JPY 13,235,371 | | | USD 117,049 | | | 11/05/18 | | | $ | 290 | |
| | | | USD 82,269 | | | JPY 9,252,099 | | | 11/01/18 | | | | 267 | |
| Total | | | | | | | | | | | | $ | 557 | |
| | |
| 22 | | The accompanying notes are an integral part of these financial statements. |
MULTI-MANAGER U.S. DYNAMIC EQUITY FUND
Schedule of Investments
October 31, 2018
| | | | | | | | |
Shares | | | Description | | Value | |
| Common Stocks – 92.5% | |
| Aerospace & Defense – 4.6% | | | |
| | 35,785 | | | Airbus SE | | $ | 3,954,751 | |
| | 15,769 | | | General Dynamics Corp. | | | 2,721,414 | |
| | 5,037 | | | Safran SA | | | 650,921 | |
| | | | | | | | |
| | | | | | | 7,327,086 | |
| | |
| Air Freight & Logistics – 0.7% | |
| | 5,174 | | | FedEx Corp. | | | 1,140,039 | |
| | |
| Auto Components – 0.5% | |
| | 9,970 | | | Aptiv PLC | | | 765,696 | |
| | |
| Automobiles*(a) – 0.1% | |
| | 9,162 | | | Aston Martin Lagonda Global Holdings PLC | | | 178,614 | |
| | |
| Banks – 8.8% | |
| | 184,704 | | | Bank of America Corp. | | | 5,079,360 | |
| | 56,902 | | | JPMorgan Chase & Co. | | | 6,203,456 | |
| | 37,651 | | | Regions Financial Corp. | | | 638,938 | |
| | 40,017 | | | Wells Fargo & Co. | | | 2,130,105 | |
| | 2,455 | | | Western Alliance Bancorp* | | | 118,429 | |
| | | | | | | | |
| | | | | | | 14,170,288 | |
| | |
| Beverages – 4.5% | |
| | 2,910 | | | Constellation Brands, Inc. Class A | | | 579,759 | |
| | 14,880 | | | Molson Coors Brewing Co. Class B | | | 952,320 | |
| | 118,336 | | | The Coca-Cola Co. | | | 5,665,928 | |
| | | | | | | | |
| | | | | | | 7,198,007 | |
| | |
| Biotechnology – 2.6% | |
| | 21,272 | | | Amgen, Inc. | | | 4,101,029 | |
| | |
| Building Products* – 0.8% | |
| | 20,970 | | | Armstrong World Industries, Inc. | | | 1,294,897 | |
| | 1 | | | Resideo Technologies, Inc. | | | 18 | |
| | | | | | | | |
| | | | | | | 1,294,915 | |
| | |
| Capital Markets – 1.8% | |
| | 18,049 | | | Affiliated Managers Group, Inc. | | | 2,051,449 | |
| | 4,205 | | | S&P Global, Inc. | | | 766,656 | |
| | | | | | | | |
| | | | | | | 2,818,105 | |
| | |
| Chemicals – 1.8% | |
| | 7,188 | | | The Sherwin-Williams Co. | | | 2,828,262 | |
| | |
| Communications Equipment – 2.6% | |
| | 59,780 | | | Cisco Systems, Inc. | | | 2,734,935 | |
| | 11,725 | | | Motorola Solutions, Inc. | | | 1,437,016 | |
| | | | | | | | |
| | | | | | | 4,171,951 | |
| | |
| Construction Materials – 0.9% | |
| | 14,211 | | | Vulcan Materials Co. | | | 1,437,301 | |
| | |
| Consumer Finance – 2.3% | |
| | 35,847 | | | American Express Co. | | | 3,682,562 | |
| | |
| Diversified Financial Services* – 4.7% | |
| | 36,431 | | | Berkshire Hathaway, Inc. Class B | | | 7,478,556 | |
| | |
| Common Stocks – (continued) | |
| Electrical Equipment – 0.5% | |
| | 5,125 | | | Rockwell Automation, Inc. | | | 844,241 | |
| | |
| Energy Equipment & Services – 0.2% | |
| | 5,683 | | | Schlumberger Ltd. | | | 291,595 | |
| | |
| Entertainment – 2.7% | |
| | 8,500 | | | Electronic Arts, Inc.* | | | 773,330 | |
| | 21,818 | | | The Walt Disney Co. | | | 2,505,361 | |
| | 14,147 | | | World Wrestling Entertainment, Inc. Class A | | | 1,026,931 | |
| | | | | | | | |
| | | | | | | 4,305,622 | |
| | |
| Food & Staples Retailing – 4.9% | |
| | 85,849 | | | BJ’s Wholesale Club Holdings, Inc.* | | | 1,901,555 | |
| | 67,147 | | | The Kroger Co. | | | 1,998,295 | |
| | 48,827 | | | Walgreens Boots Alliance, Inc. | | | 3,894,930 | |
| | | | | | | | |
| | | | | | | 7,794,780 | |
| | |
| Health Care Equipment & Supplies – 7.3% | |
| | 48,183 | | | Abbott Laboratories | | | 3,321,736 | |
| | 13,470 | | | Becton Dickinson & Co. | | | 3,104,835 | |
| | 76,843 | | | Boston Scientific Corp.* | | | 2,777,106 | |
| | 28,230 | | | Medtronic PLC | | | 2,535,619 | |
| | | | | | | | |
| | | | | | | 11,739,296 | |
| | |
| Health Care Providers & Services – 1.6% | |
| | 12,810 | | | AmerisourceBergen Corp. | | | 1,127,280 | |
| | 11,225 | | | Universal Health Services, Inc. Class B | | | 1,364,511 | |
| | | | | | | | |
| | | | | | | 2,491,791 | |
| | |
| Hotels, Restaurants & Leisure – 1.9% | |
| | 13,615 | | | McDonald’s Corp. | | | 2,408,493 | |
| | 10,070 | | | Starbucks Corp. | | | 586,779 | |
| | | | | | | | |
| | | | | | | 2,995,272 | |
| | |
| Household Durables – 3.8% | |
| | 18,509 | | | D.R. Horton, Inc. | | | 665,583 | |
| | 49,952 | | | Lennar Corp. Class A | | | 2,146,937 | |
| | 1,498 | | | NVR, Inc.* | | | 3,354,067 | |
| | | | | | | | |
| | | | | | | 6,166,587 | |
| | |
| Industrial Conglomerates – 0.9% | |
| | 9,841 | | | Honeywell International, Inc. | | | 1,425,174 | |
| | |
| Insurance – 1.9% | |
| | 71,206 | | | Aflac, Inc. | | | 3,066,842 | |
| | |
| Interactive Media & Services* – 1.1% | |
| | 1,620 | | | Alphabet, Inc. Class A | | | 1,766,740 | |
| | |
| Internet & Direct Marketing Retail* – 1.6% | |
| | 90,923 | | | eBay, Inc. | | | 2,639,495 | |
| | |
| IT Services – 2.9% | |
| | 12,913 | | | Accenture PLC Class A | | | 2,035,347 | |
| | 6,550 | | | DXC Technology Co. | | | 477,036 | |
| | 6,195 | | | International Business Machines Corp. | | | 715,089 | |
| | 10,747 | | | PayPal Holdings, Inc.* | | | 904,790 | |
| | |
| | |
| The accompanying notes are an integral part of these financial statements. | | 23 |
MULTI-MANAGER U.S. DYNAMIC EQUITY FUND
Schedule of Investments (continued)
October 31, 2018
| | | | | | | | |
Shares | | | Description | | Value | |
| Common Stocks – (continued) | |
| IT Services – (continued) | |
| | 22,997 | | | Perspecta, Inc. | | $ | 563,197 | |
| | | | | | | | |
| | | | | | | 4,695,459 | |
| | |
| Machinery – 0.8% | |
| | 17,135 | | | Kennametal, Inc. | | | 607,436 | |
| | 8,330 | | | Wabtec Corp. | | | 683,226 | |
| | | | | | | | |
| | | | | | | 1,290,662 | |
| | |
| Media – 5.2% | |
| | 53,414 | | | Comcast Corp. Class A | | | 2,037,210 | |
| | 152,955 | | | Discovery, Inc. Class A* | | | 4,954,212 | |
| | 124,412 | | | TEGNA, Inc. | | | 1,435,715 | |
| | | | | | | | |
| | | | | | | 8,427,137 | |
| | |
| Metals & Mining – 0.3% | |
| | 12,955 | | | Steel Dynamics, Inc. | | | 513,018 | |
| | |
| Multiline Retail – 3.4% | |
| | 25,182 | | | Nordstrom, Inc. | | | 1,656,220 | |
| | 45,018 | | | Target Corp. | | | 3,764,855 | |
| | | | | | | | |
| | | | | | | 5,421,075 | |
| | |
| Oil, Gas & Consumable Fuels – 1.0% | |
| | 1,353 | | | Marathon Petroleum Corp. | | | 95,319 | |
| | 13,641 | | | PBF Energy, Inc. Class A | | | 570,876 | |
| | 5,253 | | | Pioneer Natural Resources Co. | | | 773,609 | |
| | 2,705 | | | Royal Dutch Shell PLC ADR Class A | | | 170,929 | |
| | | | | | | | |
| | | | | | | 1,610,733 | |
| | |
| Personal Products – 0.2% | |
| | 2,403 | | | Beiersdorf AG | | | 248,464 | |
| | |
| Pharmaceuticals – 3.5% | |
| | 8,562 | | | Johnson & Johnson | | | 1,198,594 | |
| | 30,690 | | | Merck & Co., Inc. | | | 2,259,091 | |
| | 51,908 | | | Pfizer, Inc. | | | 2,235,159 | |
| | | | | | | | |
| | | | | | | 5,692,844 | |
| | |
| Road & Rail – 3.3% | |
| | 18,189 | | | CSX Corp. | | | 1,252,494 | |
| | 23,869 | | | Kansas City Southern | | | 2,433,683 | |
| | 12,711 | | | Old Dominion Freight Line, Inc. | | | 1,657,769 | |
| | | | | | | | |
| | | | | | | 5,343,946 | |
| | |
| Semiconductors & Semiconductor Equipment – 3.5% | |
| | 34,250 | | | Analog Devices, Inc. | | | 2,867,067 | |
| | 13,414 | | | Intel Corp. | | | 628,848 | |
| | 13,155 | | | Skyworks Solutions, Inc. | | | 1,141,328 | |
| | 10,796 | | | Texas Instruments, Inc. | | | 1,002,193 | |
| | | | | | | | |
| | | | | | | 5,639,436 | |
| | |
| Software* – 0.4% | |
| | 1,705 | | | Check Point Software Technologies Ltd. | | | 189,255 | |
| | 9,629 | | | Imperva, Inc. | | | 532,965 | |
| | | | | | | | |
| | | | | | | 722,220 | |
| | |
| Common Stocks – (continued) | |
| Specialty Retail – 2.8% | |
| | 14,629 | | | CarMax, Inc.* | | | 993,455 | |
| | 10,925 | | | Lowe’s Cos., Inc. | | | 1,040,278 | |
| | 14,237 | | | The Home Depot, Inc. | | | 2,504,004 | |
| | | | | | | | |
| | | | | | | 4,537,737 | |
| | |
| Wireless Telecommunication Services – 0.1% | |
| | 85,734 | | | VEON Ltd. ADR | | | 240,913 | |
| | |
| | TOTAL COMMON STOCKS
| |
| | (Cost $126,406,324) | | $ | 148,503,490 | |
| | |
| | |
| Shares | | | Dividend
Rate | | Value | |
| Investment Company(b) – 5.4% | |
| Goldman Sachs Financial Square Government Fund –
Institutional Shares |
|
| | 8,575,215 | | | 2.102% | | $ | 8,575,215 | |
| | (Cost $8,575,215) | | | | |
| | |
| | TOTAL INVESTMENTS – 97.9%
| |
| | (Cost $134,981,539) | | $ | 157,078,705 | |
| | |
| OTHER ASSETS IN EXCESS OF
LIABILITIES – 2.1% | | | 3,447,951 | |
| | |
| | NET ASSETS – 100.0% | | $ | 160,526,656 | |
| | |
| | |
| The percentage shown for each investment category reflects the value of investments in that category as a percentage of net assets. |
* | | Non-income producing security. |
(a) | | Exempt from registration under Rule 144A of the Securities Act of 1933. Under procedures approved by the Board of Trustees, such securities may be deemed liquid by the investment Adviser and may be resold, normally to qualified institutional buyers in transactions exempt from registration. Total market value of Rule 144A securities amounts to $178,614, which represents approximately 0.1% of the Fund’s net assets as of October 31, 2018. The liquidity determination is unaudited. |
(b) | | Represents an affiliated issuer. |
| | |
|
| Currency Abbreviations: |
| | EUR —Euro |
| | GBP —British Pound |
| | USD —U.S. Dollar |
| | |
| | Investment Abbreviations: |
| | ADR —American Depositary Receipt |
| | PLC —Public Limited Company |
|
| | |
| 24 | | The accompanying notes are an integral part of these financial statements. |
MULTI-MANAGER U.S. DYNAMIC EQUITY FUND
|
| ADDITIONAL INVESTMENT INFORMATION |
FORWARD FOREIGN CURRENCY EXCHANGE CONTRACTS — At October 31, 2018, the Fund had the following forward foreign currency exchange contracts:
FORWARD FOREIGN CURRENCY EXCHANGE CONTRACTS WITH UNREALIZED GAIN
| | | | | | | | | | | | | | | | | | | | |
| Counterparty | | Currency
Purchased | | | Currency
Sold | | | Settlement
Date | | | Unrealized
Gain | |
MS & Co. Int. PLC | | USD | | | 6,045,524 | | | EUR | | | 5,159,000 | | | | 12/19/18 | | | $ | 175,506 | |
| | | USD | | | 198,758 | | | GBP | | | 152,000 | | | | 12/19/18 | | | | 3,964 | |
| TOTAL | | | | | | | $ | 179,470 | |
FORWARD FOREIGN CURRENCY EXCHANGE CONTRACTS WITH UNREALIZED LOSS
| | | | | | | | | | | | | | | | | | | | |
| Counterparty | | Currency
Purchased | | | Currency
Sold | | | Settlement
Date | | | Unrealized
Loss | |
MS & Co. Int. PLC | | EUR | | | 966,000 | | | USD | | | 1,122,778 | | | | 12/19/18 | | | $ | (23,644 | ) |
| | | USD | | | 106,643 | | | EUR | | | 94,000 | | | | 12/19/18 | | | | (312 | ) |
| TOTAL | | | | | | | $ | (23,956 | ) |
| | |
|
| Abbreviations: |
| | MS & Co. Int. PLC—Morgan Stanley & Co. International PLC |
|
| | |
| The accompanying notes are an integral part of these financial statements. | | 25 |
MULTI-MANAGER U.S. SMALL CAP EQUITY FUND
Schedule of Investments
October 31, 2018
| | | | | | | | |
Shares | | | Description | | Value | |
| Common Stocks – 92.5% | |
| Aerospace & Defense – 2.8% | | | |
| | 34,547 | | | BWX Technologies, Inc. | | $ | 2,019,618 | |
| | 16,975 | | | Engility Holdings, Inc.* | | | 526,734 | |
| | 52,479 | | | HEICO Corp. | | | 4,399,314 | |
| | 22,490 | | | Hexcel Corp. | | | 1,316,115 | |
| | 12,421 | | | Mercury Systems, Inc.* | | | 582,048 | |
| | | | | | | | |
| | | | | | | 8,843,829 | |
| | |
| Auto Components – 2.6% | |
| | 31,715 | | | Cooper Tire & Rubber Co. | | | 979,676 | |
| | 22,703 | | | Dorman Products, Inc.* | | | 1,793,764 | |
| | 41,946 | | | Fox Factory Holding Corp.* | | | 2,253,759 | |
| | 39,630 | | | LCI Industries | | | 2,748,341 | |
| | 9,231 | | | Standard Motor Products, Inc. | | | 499,489 | |
| | | | | | | | |
| | | | | | | 8,275,029 | |
| | |
| Banks – 6.1% | |
| | 12,169 | | | Allegiance Bancshares, Inc.* | | | 471,062 | |
| | 59,320 | | | Bank OZK | | | 1,622,995 | |
| | 71,590 | | | BankUnited, Inc. | | | 2,369,629 | |
| | 38,167 | | | Cadence BanCorp | | | 841,964 | |
| | 21,386 | | | CenterState Bank Corp. | | | 525,668 | |
| | 22,584 | | | Columbia Banking System, Inc. | | | 837,641 | |
| | 25,693 | | | ConnectOne Bancorp, Inc. | | | 532,616 | |
| | 24,517 | | | FCB Financial Holdings, Inc. Class A* | | | 959,350 | |
| | 3,858 | | | First Citizens BancShares, Inc. Class A | | | 1,645,939 | |
| | 22,918 | | | First Merchants Corp. | | | 953,618 | |
| | 27,952 | | | First Midwest Bancorp, Inc. | | | 641,778 | |
| | 33,187 | | | Hanmi Financial Corp. | | | 696,263 | |
| | 63,331 | | | Home BancShares, Inc. | | | 1,205,822 | |
| | 39,738 | | | LegacyTexas Financial Group, Inc. | | | 1,531,105 | |
| | 18,531 | | | Pacific Premier Bancorp, Inc.* | | | 541,661 | |
| | 14,041 | | | Peapack Gladstone Financial Corp. | | | 378,967 | |
| | 11,532 | | | Preferred Bank | | | 592,860 | |
| | 14,205 | | | Prosperity Bancshares, Inc. | | | 923,751 | |
| | 23,084 | | | Veritex Holdings, Inc.* | | | 543,859 | |
| | 27,498 | | | Webster Financial Corp. | | | 1,617,982 | |
| | | | | | | | |
| | | | | | | 19,434,530 | |
| | |
| Biotechnology* – 1.3% | |
| | 11,222 | | | Acceleron Pharma, Inc. | | | 569,741 | |
| | 9,572 | | | Agios Pharmaceuticals, Inc. | | | 603,610 | |
| | 32,257 | | | Alder Biopharmaceuticals, Inc. | | | 409,664 | |
| | 3,396 | | | AnaptysBio, Inc. | | | 253,749 | |
| | 18,560 | | | Coherus Biosciences, Inc. | | | 216,967 | |
| | 5,360 | | | Global Blood Therapeutics, Inc. | | | 188,082 | |
| | 5,979 | | | Loxo Oncology, Inc. | | | 912,754 | |
| | 7,790 | | | Neurocrine Biosciences, Inc. | | | 834,699 | |
| | 5,347 | | | Ultragenyx Pharmaceutical, Inc. | | | 259,062 | |
| | | | | | | | |
| | | | | | | 4,248,328 | |
| | |
| Building Products – 0.8% | |
| | 26,721 | | | Patrick Industries, Inc.* | | | 1,162,630 | |
| | 47,325 | | | Universal Forest Products, Inc. | | | 1,337,878 | |
| | | | | | | | |
| | | | | | | 2,500,508 | |
| | |
| Common Stocks – (continued) | |
| Capital Markets – 1.5% | |
| | 48,775 | | | Ares Management LP | | | 956,478 | |
| | 34,062 | | | Artisan Partners Asset Management, Inc. Class A | | | 933,640 | |
| | 5,190 | | | Diamond Hill Investment Group, Inc. | | | 893,614 | |
| | 18,248 | | | Hamilton Lane, Inc. Class A | | | 700,358 | |
| | 30,800 | | | Stifel Financial Corp. | | | 1,408,176 | |
| | | | | | | | |
| | | | | | | 4,892,266 | |
| | |
| Chemicals – 2.2% | |
| | 19,605 | | | Balchem Corp. | | | 1,836,008 | |
| | 29,250 | | | Ferro Corp.* | | | 495,495 | |
| | 21,273 | | | Minerals Technologies, Inc. | | | 1,164,697 | |
| | 66,466 | | | PQ Group Holdings, Inc.* | | | 1,066,779 | |
| | 13,691 | | | Trinseo SA | | | 737,671 | |
| | 87,193 | | | Valvoline, Inc. | | | 1,736,885 | |
| | | | | | | | |
| | | | | | | 7,037,535 | |
| | |
| Commercial Services & Supplies – 2.8% | |
| | 28,701 | | | ABM Industries, Inc. | | | 882,556 | |
| | 87,562 | | | ACCO Brands Corp. | | | 706,625 | |
| | 22,057 | | | Healthcare Services Group, Inc. | | | 895,294 | |
| | 38,328 | | | Tetra Tech, Inc. | | | 2,531,181 | |
| | 51,440 | | | Waste Connections, Inc. | | | 3,932,073 | |
| | | | | | | | |
| | | | | | | 8,947,729 | |
| | |
| Communications Equipment* – 1.0% | |
| | 70,583 | | | Ciena Corp. | | | 2,206,425 | |
| | 16,173 | | | NETGEAR, Inc. | | | 897,278 | |
| | | | | | | | |
| | | | | | | 3,103,703 | |
| | |
| Construction & Engineering – 1.1% | |
| | 51,965 | | | Aegion Corp.* | | | 1,006,042 | |
| | 13,527 | | | Dycom Industries, Inc.* | | | 918,213 | |
| | 20,506 | | | Granite Construction, Inc. | | | 937,534 | |
| | 41,001 | | | Tutor Perini Corp.* | | | 635,516 | |
| | | | | | | | |
| | | | | | | 3,497,305 | |
| | |
| Consumer Finance – 4.6% | |
| | 7,082 | | | Credit Acceptance Corp.* | | | 3,005,743 | |
| | 19,160 | | | FirstCash, Inc. | | | 1,540,464 | |
| | 164,245 | | | Navient Corp. | | | 1,901,957 | |
| | 34,767 | | | Nelnet, Inc. Class A | | | 1,957,035 | |
| | 101,617 | | | PRA Group, Inc.* | | | 3,133,868 | |
| | 297,988 | | | SLM Corp.* | | | 3,021,598 | |
| | | | | | | | |
| | | | | | | 14,560,665 | |
| | |
| Containers & Packaging – 1.1% | |
| | 245,085 | | | Graphic Packaging Holding Co. | | | 2,698,386 | |
| | 55,437 | | | Owens-Illinois, Inc.* | | | 868,698 | |
| | | | | | | | |
| | | | | | | 3,567,084 | |
| | |
| Distributors – 0.2% | |
| | 19,712 | | | Core-Mark Holding Co., Inc. | | | 757,138 | |
| | |
| Diversified Consumer Services* – 1.2% | |
| | 30,699 | | | Bright Horizons Family Solutions, Inc. | | | 3,527,622 | |
| | |
| | |
| 26 | | The accompanying notes are an integral part of these financial statements. |
MULTI-MANAGER U.S. SMALL CAP EQUITY FUND
| | | | | | | | |
Shares | | | Description | | Value | |
| Common Stocks – (continued) | |
| Diversified Consumer Services* – (continued) | |
| | 9,738 | | | Chegg, Inc. | | $ | 265,653 | |
| | | | | | | | |
| | | | | | | 3,793,275 | |
| | |
| Diversified Telecommunication Services – 0.7% | |
| | 41,020 | | | Cogent Communications Holdings, Inc. | | | 2,132,220 | |
| | |
| Electric Utilities – 0.2% | |
| | 10,451 | | | Portland General Electric Co. | | | 471,131 | |
| | |
| Electrical Equipment – 1.4% | |
| | 55,316 | | | EnerSys | | | 4,401,494 | |
| | |
| Electronic Equipment, Instruments & Components – 2.9% | |
| | 11,574 | | | Anixter International, Inc.* | | | 760,296 | |
| | 30,445 | | | Belden, Inc. | | | 1,645,552 | |
| | 29,262 | | | ePlus, Inc.* | | | 2,483,759 | |
| | 36,857 | | | Insight Enterprises, Inc.* | | | 1,905,138 | |
| | 6,275 | | | Littelfuse, Inc. | | | 1,136,779 | |
| | 17,969 | | | SYNNEX Corp. | | | 1,394,574 | |
| | | | | | | | |
| | | | | | | 9,326,098 | |
| | |
| Energy Equipment & Services* – 1.2% | |
| | 42,179 | | | Cactus, Inc. Class A | | | 1,411,309 | |
| | 23,471 | | | Dril-Quip, Inc. | | | 998,926 | |
| | 58,286 | | | Forum Energy Technologies, Inc. | | | 522,243 | |
| | 8,442 | | | KLX Energy Services Holdings, Inc. | | | 243,889 | |
| | 71,496 | | | Superior Energy Services, Inc. | | | 559,814 | |
| | | | | | | | |
| | | | | | | 3,736,181 | |
| | |
| Entertainment* – 0.9% | |
| | 8,361 | | | The Madison Square Garden Co. Class A | | | 2,312,820 | |
| | 132,813 | | | Zynga, Inc. Class A | | | 483,439 | |
| | | | | | | | |
| | | | | | | 2,796,259 | |
| | |
| Equity Real Estate Investment Trusts (REITs) – 0.1% | |
| | 21,160 | | | Chatham Lodging Trust | | | 412,620 | |
| | |
| Food & Staples Retailing – 0.7% | |
| | 12,076 | | | Casey’s General Stores, Inc. | | | 1,522,904 | |
| | 11,323 | | | PriceSmart, Inc. | | | 794,309 | |
| | | | | | | | |
| | | | | | | 2,317,213 | |
| | |
| Food Products – 0.7% | |
| | 16,649 | | | Calavo Growers, Inc. | | | 1,614,953 | |
| | 23,029 | | | Fresh Del Monte Produce, Inc. | | | 760,648 | |
| | | | | | | | |
| | | | | | | 2,375,601 | |
| | |
| Health Care Equipment & Supplies* – 0.9% | |
| | 29,374 | | | Integra LifeSciences Holdings Corp. | | | 1,573,565 | |
| | 22,221 | | | Neogen Corp. | | | 1,349,259 | |
| | | | | | | | |
| | | | | | | 2,922,824 | |
| | |
| Health Care Providers & Services – 2.8% | |
| | 52,581 | | | AMN Healthcare Services, Inc.* | | | 2,661,650 | |
| | 5,889 | | | Chemed Corp. | | | 1,792,200 | |
| | 11,520 | | | HealthEquity, Inc.* | | | 1,057,536 | |
| | |
| Common Stocks – (continued) | |
| Health Care Providers & Services – (continued) | |
| | 11,727 | | | Henry Schein, Inc.* | | | 973,341 | |
| | 31,817 | | | LifePoint Health, Inc.* | | | 2,063,651 | |
| | 20,335 | | | Patterson Cos., Inc. | | | 459,164 | |
| | | | | | | | |
| | | | | | | 9,007,542 | |
| | |
| Hotels, Restaurants & Leisure – 1.3% | |
| | 61,457 | | | Carrols Restaurant Group, Inc.* | | | 808,774 | |
| | 24,241 | | | Choice Hotels International, Inc. | | | 1,779,289 | |
| | 60,247 | | | Lindblad Expeditions Holdings, Inc.* | | | 813,937 | |
| | 46,311 | | | The Habit Restaurants, Inc. Class A* | | | 588,150 | |
| | | | | | | | |
| | | | | | | 3,990,150 | |
| | |
| Household Durables – 1.6% | |
| | 11,169 | | | Helen of Troy Ltd.* | | | 1,386,296 | |
| | 16,645 | | | Hooker Furniture Corp. | | | 487,199 | |
| | 24,964 | | | Installed Building Products, Inc.* | | | 760,404 | |
| | 31,134 | | | La-Z-Boy, Inc. | | | 865,525 | |
| | 31,945 | | | TopBuild Corp.* | | | 1,457,331 | |
| | | | | | | | |
| | | | | | | 4,956,755 | |
| | |
| Household Products – 0.3% | |
| | 15,479 | | | Energizer Holdings, Inc. | | | 909,701 | |
| | |
| Insurance – 5.0% | |
| | 16,913 | | | AMERISAFE, Inc. | | | 1,100,867 | |
| | 15,809 | | | Aspen Insurance Holdings Ltd. | | | 662,081 | |
| | 57,283 | | | Assured Guaranty Ltd. | | | 2,290,174 | |
| | 9,429 | | | Axis Capital Holdings Ltd. | | | 526,044 | |
| | 20,556 | | | Global Indemnity Ltd. | | | 735,905 | |
| | 117,745 | | | National General Holdings Corp. | | | 3,280,376 | |
| | 22,654 | | | ProAssurance Corp. | | | 994,964 | |
| | 32,065 | | | RLI Corp. | | | 2,370,565 | |
| | 17,100 | | | The Hanover Insurance Group, Inc. | | | 1,904,598 | |
| | 12,082 | | | The Navigators Group, Inc. | | | 835,470 | |
| | 1,174 | | | White Mountains Insurance Group Ltd.* | | | 1,040,951 | |
| | | | | | | | |
| | | | | | | 15,741,995 | |
| | |
| Internet & Direct Marketing Retail* – 0.9% | |
| | 28,935 | | | Despegar.com Corp. | | | 464,986 | |
| | 28,662 | | | Etsy, Inc. | | | 1,218,708 | |
| | 51,836 | | | MakeMyTrip Ltd. | | | 1,285,014 | |
| | | | | | | | |
| | | | | | | 2,968,708 | |
| | |
| IT Services – 4.4% | |
| | 11,939 | | | Booz Allen Hamilton Holding Corp. | | | 591,458 | |
| | 3,398 | | | Broadridge Financial Solutions, Inc. | | | 397,362 | |
| | 34,164 | | | Carbonite, Inc.* | | | 1,168,751 | |
| | 14,074 | | | CoreLogic, Inc.* | | | 571,686 | |
| | 74,187 | | | Evo Payments, Inc. Class A* | | | 1,761,199 | |
| | 93,181 | | | Genpact Ltd. | | | 2,554,091 | |
| | 22,036 | | | MAXIMUS, Inc. | | | 1,431,679 | |
| | 49,110 | | | Sykes Enterprises, Inc.* | | | 1,506,204 | |
| | 45,324 | | | TTEC Holdings, Inc. | | | 1,129,474 | |
| | 15,899 | | | WEX, Inc.* | | | 2,797,588 | |
| | | | | | | | |
| | | | | | | 13,909,492 | |
| | |
| | |
| The accompanying notes are an integral part of these financial statements. | | 27 |
MULTI-MANAGER U.S. SMALL CAP EQUITY FUND
Schedule of Investments (continued)
October 31, 2018
| | | | | | | | |
Shares | | | Description | | Value | |
| Common Stocks – (continued) | |
| Leisure Products – 0.1% | |
| | 41,164 | | | Clarus Corp. | | $ | 403,407 | |
| | |
| Life Sciences Tools & Services* – 2.1% | |
| | 7,341 | | | Cambrex Corp. | | | 391,202 | |
| | 22,212 | | | Charles River Laboratories International, Inc. | | | 2,705,866 | |
| | 11,435 | | | ICON PLC | | | 1,578,945 | |
| | 59,441 | | | NeoGenomics, Inc. | | | 1,096,092 | |
| | 22,545 | | | Syneos Health, Inc. | | | 1,028,728 | |
| | | | | | | | |
| | | | | | | 6,800,833 | |
| | |
| Machinery – 4.0% | |
| | 18,624 | | | Alamo Group, Inc. | | | 1,596,449 | |
| | 25,878 | | | ESCO Technologies, Inc. | | | 1,584,251 | |
| | 11,857 | | | Hillenbrand, Inc. | | | 567,950 | |
| | 7,278 | | | IDEX Corp. | | | 922,996 | |
| | 27,619 | | | John Bean Technologies Corp. | | | 2,871,548 | |
| | 59,580 | | | REV Group, Inc. | | | 650,018 | |
| | 19,722 | | | The Timken Co. | | | 780,005 | |
| | 124,846 | | | Welbilt, Inc.* | | | 2,337,117 | |
| | 18,809 | | | Woodward, Inc. | | | 1,385,095 | |
| | | | | | | | |
| | | | | | | 12,695,429 | |
| | |
| Media – 1.6% | |
| | 32,463 | | | AMC Networks, Inc. Class A* | | | 1,901,683 | |
| | 69,901 | | | Entercom Communications Corp. Class A | | | 453,657 | |
| | 39,590 | | | GCI Liberty, Inc. Class A* | | | 1,873,795 | |
| | 16,742 | | | Scholastic Corp. | | | 726,268 | |
| | | | | | | | |
| | | | | | | 4,955,403 | |
| | |
| Metals & Mining – 0.7% | |
| | 91,974 | | | Ferroglobe PLC | | | 560,122 | |
| | 52,699 | | | Ferroglobe Representation & Warranty Insurance Trust(a) | | | — | |
| | 146,262 | | | SunCoke Energy, Inc.* | | | 1,638,134 | |
| | | | | | | | |
| | | | | | | 2,198,256 | |
| | |
| Mortgage Real Estate Investment Trusts (REITs) – 2.9% | |
| | 74,779 | | | Ares Commercial Real Estate Corp. | | | 1,082,052 | |
| | 47,614 | | | Blackstone Mortgage Trust, Inc. Class A | | | 1,606,496 | |
| | 204,877 | | | MFA Financial, Inc. | | | 1,419,798 | |
| | 82,028 | | | Starwood Property Trust, Inc. | | | 1,781,648 | |
| | 220,925 | | | Two Harbors Investment Corp. | | | 3,245,388 | |
| | | | | | | | |
| | | | | | | 9,135,382 | |
| | |
| Oil, Gas & Consumable Fuels – 2.5% | |
| | 117,147 | | | Enerplus Corp. | | | 1,088,296 | |
| | 70,026 | | | Extraction Oil & Gas, Inc.* | | | 559,508 | |
| | 44,574 | | | Gulfport Energy Corp.* | | | 406,069 | |
| | 77,615 | | | Jagged Peak Energy, Inc.* | | | 956,217 | |
| | 106,849 | | | Kosmos Energy Ltd.* | | | 693,450 | |
| | 54,568 | | | WildHorse Resource Development Corp.* | | | 1,157,387 | |
| | 93,629 | | | World Fuel Services Corp. | | | 2,996,128 | |
| | | | | | | | |
| | | | | | | 7,857,055 | |
| | |
| Common Stocks – (continued) | |
| Paper & Forest Products – 0.8% | |
| | 16,055 | | | Neenah, Inc. | | | 1,291,785 | |
| | 37,089 | | | Schweitzer-Mauduit International, Inc. | | | 1,183,881 | |
| | | | | | | | |
| | | | | | | 2,475,666 | |
| | |
| Pharmaceuticals* – 0.9% | |
| | 71,544 | | | Catalent, Inc. | | | 2,886,085 | |
| | |
| Professional Services – 4.7% | |
| | 55,115 | | | ASGN, Inc.* | | | 3,697,114 | |
| | 50,773 | | | Exponent, Inc. | | | 2,562,005 | |
| | 26,171 | | | FTI Consulting, Inc.* | | | 1,808,678 | |
| | 18,560 | | | Huron Consulting Group, Inc.* | | | 1,011,334 | |
| | 26,366 | | | Insperity, Inc. | | | 2,896,305 | |
| | 56,351 | | | Navigant Consulting, Inc. | | | 1,217,182 | |
| | 29,926 | | | WageWorks, Inc.* | | | 1,191,354 | |
| | 18,058 | | | Willdan Group, Inc.* | | | 545,352 | |
| | | | | | | | |
| | | | | | | 14,929,324 | |
| | |
| Real Estate Management & Development – 2.0% | |
| | 24,526 | | | Colliers International Group, Inc. | | | 1,664,089 | |
| | 32,580 | | | FirstService Corp. | | | 2,391,372 | |
| | 31,194 | | | RE/MAX Holdings, Inc. Class A | | | 1,166,344 | |
| | 58,050 | | | Realogy Holdings Corp. | | | 1,107,013 | |
| | | | | | | | |
| | | | | | | 6,328,818 | |
| | |
| Road & Rail – 0.4% | |
| | 40,304 | | | Knight-Swift Transportation Holdings, Inc. | | | 1,289,728 | |
| | |
| Semiconductors & Semiconductor Equipment – 0.8% | |
| | 44,747 | | | Brooks Automation, Inc. | | | 1,388,500 | |
| | 35,449 | | | Marvell Technology Group Ltd. | | | 581,718 | |
| | 14,918 | | | Versum Materials, Inc. | | | 470,812 | |
| | | | | | | | |
| | | | | | | 2,441,030 | |
| | |
| Software – 5.9% | |
| | 10,263 | | | 2U, Inc.* | | | 645,645 | |
| | 6,816 | | | Alarm.com Holdings, Inc.* | | | 303,176 | |
| | 18,681 | | | Aspen Technology, Inc.* | | | 1,585,830 | |
| | 13,484 | | | Blackbaud, Inc. | | | 967,073 | |
| | 26,835 | | | Blackline, Inc.* | | | 1,244,607 | |
| | 3,485 | | | Coupa Software, Inc.* | | | 225,933 | |
| | 39,716 | | | Envestnet, Inc.* | | | 2,066,026 | |
| | 16,412 | | | Everbridge, Inc.* | | | 834,222 | |
| | 6,033 | | | Fair Isaac Corp.* | | | 1,162,619 | |
| | 13,203 | | | Guidewire Software, Inc.* | | | 1,174,671 | |
| | 65,676 | | | Mimecast Ltd.* | | | 2,289,465 | |
| | 15,503 | | | Paylocity Holding Corp.* | | | 1,019,942 | |
| | 20,510 | | | RealPage, Inc.* | | | 1,087,030 | |
| | 4,555 | | | The Ultimate Software Group, Inc.* | | | 1,214,500 | |
| | 6,433 | | | Tyler Technologies, Inc.* | | | 1,361,609 | |
| | 32,000 | | | Workiva, Inc.* | | | 1,090,880 | |
| | 20,162 | | | Zuora, Inc. Class A* | | | 411,708 | |
| | | | | | | | |
| | | | | | | 18,684,936 | |
| | |
| | |
| 28 | | The accompanying notes are an integral part of these financial statements. |
MULTI-MANAGER U.S. SMALL CAP EQUITY FUND
| | | | | | | | |
Shares | | | Description | | Value | |
| Common Stocks – (continued) | |
| Specialty Retail – 2.2% | |
| | 52,578 | | | Camping World Holdings, Inc. Class A | | $ | 901,713 | |
| | 6,697 | | | Group 1 Automotive, Inc. | | | 386,685 | |
| | 34,053 | | | Hudson Ltd. Class A* | | | 719,880 | |
| | 42,589 | | | Lithia Motors, Inc. Class A | | | 3,793,828 | |
| | 32,103 | | | National Vision Holdings, Inc.* | | | 1,330,027 | |
| | | | | | | | |
| | | | | | | 7,132,133 | |
| | |
| Technology Hardware, Storage & Peripherals* – 0.3% | |
| | 35,017 | | | NCR Corp. | | | 940,206 | |
| | |
| Textiles, Apparel & Luxury Goods – 0.8% | |
| | 43,067 | | | Skechers U.S.A., Inc. Class A* | | | 1,230,424 | |
| | 44,667 | | | Steven Madden Ltd. | | | 1,396,737 | |
| | | | | | | | |
| | | | | | | 2,627,161 | |
| | |
| Thrifts & Mortgage Finance – 2.0% | |
| | 43,608 | | | Essent Group Ltd.* | | | 1,719,027 | |
| | 32,150 | | | NMI Holdings, Inc.* | | | 679,651 | |
| | 42,932 | | | Radian Group, Inc. | | | 823,865 | |
| | 46,408 | | | Walker & Dunlop, Inc. | | | 1,947,280 | |
| | 47,496 | | | Washington Federal, Inc. | | | 1,337,487 | |
| | | | | | | | |
| | | | | | | 6,507,310 | |
| | |
| Tobacco – 0.3% | |
| | 16,031 | | | Universal Corp. | | | 1,087,864 | |
| | |
| Trading Companies & Distributors – 2.2% | |
| | 54,274 | | | Air Lease Corp. | | | 2,067,839 | |
| | 76,825 | | | BMC Stock Holdings, Inc.* | | | 1,286,050 | |
| | 24,844 | | | H&E Equipment Services, Inc. | | | 598,492 | |
| | 14,245 | | | SiteOne Landscape Supply, Inc.* | | | 969,230 | |
| | 44,364 | | | WESCO International, Inc.* | | | 2,226,186 | |
| | | | | | | | |
| | | | | | | 7,147,797 | |
| | |
| TOTAL COMMON STOCKS
(Cost $277,149,329) | | $ | 294,358,731 | |
| | |
| | |
| Shares | | | Dividend
Rate | | Value | |
| Investment Company(b) – 5.6% | |
| Goldman Sachs Financial Square Government Fund –
Institutional Shares |
|
| | 17,772,708 | | | 2.102% | | $ | 17,772,708 | |
| | (Cost $17,772,708) | | | | |
| | |
| | TOTAL INVESTMENTS – 98.1%
| |
| | (Cost $294,922,037) | | $ | 312,131,439 | |
| | |
| OTHER ASSETS IN EXCESS OF
LIABILITIES – 1.9% | | | 6,034,582 | |
| | |
| | NET ASSETS – 100.0% | | $ | 318,166,021 | |
| | |
| | |
| The percentage shown for each investment category reflects the value of investments in that category as a percentage of net assets. |
* | | Non-income producing security. |
(a) | | Significant unobservable inputs were used in the valuation of this portfolio security; i.e. Level 3. |
(b) | | Represents an affiliated issuer. |
| | |
|
Investment Abbreviations: |
| | LP —Limited Partnership |
| | PLC —Public Limited Company |
| | REIT —Real Estate Investment Trust |
|
| | |
| The accompanying notes are an integral part of these financial statements. | | 29 |
ACTIVE EQUITY MULTI-MANAGER FUNDS
Statements of Assets and Liabilities
October 31, 2018
| | | | | | | | | | | | | | |
| | | | | Multi-Manager
International
Equity Fund | | | Multi-Manager
U.S. Dynamic
Equity Fund | | | Multi-Manager
U.S. Small Cap
Equity Fund | |
| | Assets: | |
| | Investments, at value (cost $593,833,595, $126,406,324 and $277,149,329, respectively) | | $ | 603,376,134 | | | $ | 148,503,490 | | | $ | 294,358,731 | |
| | Investments of affiliated issuers, at value (cost $22,326,171, $8,575,215 and $17,772,708, respectively) | | | 22,326,171 | | | | 8,575,215 | | | | 17,772,708 | |
| | Foreign currencies, at value (cost $46,050, $0 and $0, respectively) | | | 46,054 | | | | — | | | | — | |
| | Cash | | | 455,054 | | | | 608,753 | | | | 584,596 | |
| | Unrealized gain on forward foreign currency exchange contracts | | | 557 | | | | 179,470 | | | | — | |
| | Receivables: | | | | | | | | | | | | |
| | Dividends | | | 1,172,068 | | | | 89,074 | | | | 58,745 | |
| | Investments sold | | | 978,991 | | | | 4,143,037 | | | | 1,212,954 | |
| | Foreign tax reclaims | | | 767,862 | | | | 4,195 | | | | — | |
| | Fund shares sold | | | 90,000 | | | | — | | | | 6,990,000 | |
| | Reimbursement from investment adviser | | | 69,340 | | | | 52,366 | | | | 24,524 | |
| | Collateral on certain derivative contracts(a) | | | — | | | | 120,000 | | | | — | |
| | Other assets | | | 50,442 | | | | 30,545 | | | | 43,210 | |
| | Total assets | | | 629,332,673 | | | | 162,306,145 | | | | 321,045,468 | |
| | | | | | | | | | | | | | |
| | Liabilities: | | | | | | | | | | | | |
| | Unrealized loss on forward foreign currency exchange contracts | | | — | | | | 23,956 | | | | — | |
| | Payables: | | | | | | | | | | | | |
| | Investments purchased | | | 1,690,542 | | | | 1,417,561 | | | | 2,427,853 | |
| | Management fees | | | 234,226 | | | | 91,348 | | | | 174,871 | |
| | Investments purchased on an extended settlement basis | | | 36,860 | | | | — | | | | — | |
| | Transfer agency fees | | | 10,798 | | | | 2,766 | | | | 5,361 | |
| | Accrued expenses | | | 388,998 | | | | 243,858 | | | | 271,362 | |
| | Total liabilities | | | 2,361,424 | | | | 1,779,489 | | | | 2,879,447 | |
| | | | | | | | | | | | | | |
| | Net Assets: | | | | | | | | | | | | |
| | Paid-in capital | | | 598,508,964 | | | | 130,309,629 | | | | 294,788,677 | |
| | Total distributable earnings | | | 28,462,285 | | | | 30,217,027 | | | | 23,377,344 | |
| | NET ASSETS | | $ | 626,971,249 | | | $ | 160,526,656 | | | $ | 318,166,021 | |
| | Shares Outstanding $0.001 par value (unlimited number of shares authorized): | | | 58,028,903 | | | | 13,787,545 | | | | 25,662,275 | |
| | Net asset value, offering and redemption price per share: | | $ | 10.80 | | | $ | 11.64 | | | $ | 12.40 | |
| | (a) | | Segregated for collateral on forward foreign currency exchange transactions. |
| | |
| 30 | | The accompanying notes are an integral part of these financial statements. |
ACTIVE EQUITY MULTI-MANAGER FUNDS
Statements of Operations
For the Fiscal Year Ended October 31, 2018
| | | | | | | | | | | | | | |
| | | | | Multi-Manager
International
Equity Fund | | | Multi-Manager
U.S. Dynamic
Equity Fund | | | Multi-Manager
U.S. Small Cap
Equity Fund | |
| | Investment income: | | | | | | | | | |
| | Dividends — unaffiliated issuers (net of foreign withholding taxes of $1,216,887, $18,688 and $6,621, respectively) | | $ | 12,606,457 | | | $ | 2,259,738 | | | $ | 2,331,238 | |
| | Dividends — affiliated issuers | | | 184,526 | | | | 95,991 | | | | 108,967 | |
| | Non-cash dividends — unaffiliated issuers | | | — | | | | — | | | | 475,288 | |
| | Interest | | | 91,493 | | | | 38,050 | | | | 55,499 | |
| | Total investment income | | | 12,882,476 | | | | 2,393,779 | | | | 2,970,992 | |
| | | | | | | | | | | | | | |
| | Expenses: | | | | | | | | | |
| | Management fees | | | 3,199,499 | | | | 1,205,343 | | | | 1,948,188 | |
| | Custody, accounting and administrative services | | | 505,318 | | | | 270,412 | | | | 302,146 | |
| | Professional fees | | | 205,524 | | | | 200,239 | | | | 181,051 | |
| | Transfer Agency fees | | | 106,650 | | | | 30,134 | | | | 51,952 | |
| | Trustee fees | | | 43,026 | | | | 29,870 | | | | 33,873 | |
| | Printing and mailing costs | | | 33,746 | | | | 22,535 | | | | 25,427 | |
| | Registration fees | | | 20,326 | | | | 2,036 | | | | 10,935 | |
| | Other | | | 79,583 | | | | 23,598 | | | | 50,791 | |
| | Total expenses | | | 4,193,672 | | | | 1,784,167 | | | | 2,604,363 | |
| | Less — expense reductions | | | (1,170,418 | ) | | | (602,616 | ) | | | (535,958 | ) |
| | Net expenses | | | 3,023,254 | | | | 1,181,551 | | | | 2,068,405 | |
| | NET INVESTMENT INCOME | | | 9,859,222 | | | | 1,212,228 | | | | 902,587 | |
| | | | | | | | | | | | | | |
| | Realized and unrealized gain (loss): | |
| | Net realized gain (loss) from: | | | | | | | | | | | | |
| | Investments | | | 13,009,924 | | | | 8,054,690 | | | | 7,248,286 | |
| | Forward foreign currency exchange contracts | | | 20,102 | | | | 132,229 | | | | — | |
| | Foreign currency transactions | | | (141,119 | ) | | | 1,514 | | | | (14 | ) |
| | Net change in unrealized gain (loss) on: | | | | | | | | | | | | |
| | Investments | | | (62,854,716 | ) | | | 321,465 | | | | (16,208,874 | ) |
| | Forward foreign currency exchange contracts | | | (165 | ) | | | 46,788 | | | | — | |
| | Foreign currency translation | | | (40,411 | ) | | | (406 | ) | | | (2 | ) |
| | Net realized and unrealized gain (loss) | | | (50,006,385 | ) | | | 8,556,280 | | | | (8,960,604 | ) |
| | NET INCREASE (DECREASE) IN NET ASSETS RESULTING FROM OPERATIONS | | $ | (40,147,163 | ) | | $ | 9,768,508 | | | $ | (8,058,017 | ) |
| | |
| The accompanying notes are an integral part of these financial statements. | | 31 |
ACTIVE EQUITY MULTI-MANAGER FUNDS
Statements of Changes in Net Assets
| | | | | | | | | | | | | | | | | | | | | | |
| | | | | Multi-Manager International Equity Fund | | | | | | Multi-Manager U.S. Dynamic Equity Fund | |
| | | | | For the Fiscal
Year Ended
October 31, 2018 | | | For the Fiscal
Year Ended
October 31, 2017 | | | | | | For the Fiscal
Year Ended
October 31, 2018 | | | For the Fiscal
Year Ended
October 31, 2017 | |
| | From operations: | | | | | | | | | | | | | |
| | Net investment income | | $ | 9,859,222 | | | $ | 6,484,098 | | | | | | | $ | 1,212,228 | | | $ | 881,208 | |
| | Net realized gain | | | 12,888,907 | | | | 3,372,536 | | | | | | | | 8,188,433 | | | | 13,166,487 | |
| | Net change in unrealized gain (loss) | | | (62,895,292 | ) | | | 72,253,349 | | | | | | | | 367,847 | | | | 16,606,944 | |
| | Net increase (decrease) in net assets resulting from operations | | | (40,147,163 | ) | | | 82,109,983 | | | | | | | | 9,768,508 | | | | 30,654,639 | |
| | | | | | | | | | | | | | | | | | | | | | |
| | Distributions to shareholders: | | | | | | | | | | | | | |
| | From distributable earnings | | | (7,093,278 | ) | | | (4,582,050 | )(a) | | | | | | | (4,291,680 | ) | | | (896,870 | )(a) |
| | | | | | | | | | | | | | | | | | | | | | |
| | From share transactions: | | | | | | | | | | | | | |
| | Proceeds from sales of shares | | | 269,285,343 | | | | 148,372,005 | | | | | | | | 54,210,000 | | | | 17,020,000 | |
| | Reinvestment of distributions | | | 7,093,278 | | | | 4,582,050 | | | | | | | | 4,291,680 | | | | 896,870 | |
| | Cost of shares redeemed | | | (44,996,789 | ) | | | (81,272,305 | ) | | | | | | | (35,535,266 | ) | | | (51,586,859 | ) |
| | Net increase (decrease) in net assets resulting from share transactions | | | 231,381,832 | | | | 71,681,750 | | | | | | | | 22,966,414 | | | | (33,669,989 | ) |
| | TOTAL INCREASE (DECREASE) | | | 184,141,391 | | | | 149,209,683 | | | | | | | | 28,443,242 | | | | (3,912,220 | ) |
| | | | | | | | | | | | | | | | | | | | | | |
| | Net assets:(b) | | | | | | | | | | | | | |
| | Beginning of year | | | 442,829,858 | | | | 293,620,175 | | | | | | | | 132,083,414 | | | | 135,995,634 | |
| | End of year | | $ | 626,971,249 | | | $ | 442,829,858 | | | | | | | $ | 160,526,656 | | | $ | 132,083,414 | |
| | (a) | | Prior year information has been revised to conform to current year presentation. Distributions to shareholders for both Funds consisted solely of net investment income for the fiscal year ended October 31, 2017. |
| | (b) | | Prior year information has been revised to conform with current year presentation. Undistributed net investment income was $6,085,339 and $140,843 for the Multi-Manager International Equity Fund and Multi-Manager U.S. Dynamic Equity Fund, respectively as of October 31, 2017. |
| | |
| 32 | | The accompanying notes are an integral part of these financial statements. |
ACTIVE EQUITY MULTI-MANAGER FUNDS
Statements of Changes in Net Assets (continued)
| | | | | | | | | | |
| | | | | Multi-Manager U.S. Small Cap Equity
Fund | |
| | | | | For the Fiscal
Year Ended
October 31, 2018 | | | For the Fiscal
Year Ended
October 31, 2017 | |
| | From operations: | | | | | | | | |
| | Net investment income | | $ | 902,587 | | | $ | 385,139 | |
| | Net realized gain | | | 7,248,272 | | | | 3,122,031 | |
| | Net change in unrealized gain (loss) | | | (16,208,876 | ) | | | 28,645,980 | |
| | Net increase (decrease) in net assets resulting from operations | | | (8,058,017 | ) | | | 32,153,150 | |
| | | | | | | | | | |
| | Distributions to shareholders: | | | | | | | | |
| | From distributable earnings | | | (5,101,142 | ) | | | (1,632,917 | )(a) |
| | | | | | | | | | |
| | From share transactions: | | | | | | | | |
| | Proceeds from sales of shares | | | 165,669,010 | | | | 75,997,000 | |
| | Reinvestment of distributions | | | 5,101,142 | | | | 1,632,917 | |
| | Cost of shares redeemed | | | (37,822,987 | ) | | | (38,547,475 | ) |
| | Net increase in net assets resulting from share transactions | | | 132,947,165 | | | | 39,082,442 | |
| | TOTAL INCREASE | | | 119,788,006 | | | | 69,602,675 | |
| | | | | | | | | | |
| | Net assets:(b) | | | | | | | | |
| | Beginning of year | | | 198,378,015 | | | | 128,775,340 | |
| | End of year | | $ | 318,166,021 | | | $ | 198,378,015 | |
| | (a) | | Prior year information has been revised to conform to current year presentation, see prior year presentation below: |
| | | | |
Distributions from net investment income: | |
Multi-Manager U.S. Small Cap Equity Fund | | $ | 451,085 | |
Distributions from net realized gains: | |
Multi-Manager U.S. Small Cap Equity Fund | | $ | 1,181,832 | |
| | (b) | | Prior year information has been revised to conform with current year presentation. Undistributed net investment income was $294,145 as of October 31, 2017. |
| | |
| The accompanying notes are an integral part of these financial statements. | | 33 |
ACTIVE EQUITY MULTI-MANAGER FUNDS
Financial Highlights
Selected Share Data for a Share Outstanding Throughout Each Period
| | | | | | | | | | | | | | | | | | |
| | | | | Multi-Manager International Equity Fund | |
| | | | | Class P Shares(a) | |
| | | | | Year Ended October 31, | | | Period Ended
October 31, 2015(b) | |
| | | | | 2018 | | | 2017 | | | 2016 | |
| | Per Share Data | | | | | | | | | | | | | | | | |
| | Net asset value, beginning of period | | $ | 11.62 | | | $ | 9.41 | | | $ | 9.52 | | | $ | 10.00 | |
| | Net investment income(c) | | | 0.22 | | | | 0.19 | | | | 0.17 | | | | 0.03 | |
| | Net realized and unrealized gain (loss) | | | (0.86 | ) | | | 2.17 | | | | (0.25 | ) | | | (0.51 | ) |
| | Total from investment operations | | | (0.64 | ) | | | 2.36 | | | | (0.08 | ) | | | (0.48 | ) |
| | Distributions to shareholders from net investment income | | | (0.18 | ) | | | (0.15 | ) | | | (0.03 | ) | | | — | |
| | Distributions to shareholders from net realized gains | | | — | (d) | | | — | | | | — | | | | — | |
| | Total distributions | | | (0.18 | ) | | | (0.15 | ) | | | (0.03 | ) | | | — | |
| | Net asset value, end of period | | $ | 10.80 | | | $ | 11.62 | | | $ | 9.41 | | | $ | 9.52 | |
| | Total return(e) | | | (5.63 | )% | | | 25.44 | % | | | (0.82 | )% | | | (4.80 | )% |
| | Net assets, end of year (in 000s) | | $ | 626,971 | | | $ | 442,830 | | | $ | 293,620 | | | $ | 185,055 | |
| | Ratio of net expenses to average net assets | | | 0.57 | % | | | 0.57 | % | | | 0.57 | % | | | 0.57 | %(f) |
| | Ratio of total expenses to average net assets | | | 0.79 | % | | | 0.82 | % | | | 1.01 | % | | | 1.07 | %(f) |
| | Ratio of net investment income to average net assets | | | 1.85 | % | | | 1.82 | % | | | 1.81 | % | | | 1.31 | %(f) |
| | Portfolio turnover rate(g) | | | 28 | % | | | 37 | % | | | 25 | % | | | 6 | % |
| | (a) | | Effective April 16, 2018, Institutional Shares were redesignated as Class P Shares. |
| | (b) | | Commenced operations on July 31, 2015. |
| | (c) | | Calculated based on the average shares outstanding methodology. |
| | (d) | | Amount is less than $0.005 per share. |
| | (e) | | Assumes investment at the NAV at the beginning of the period, reinvestment of all dividends and distributions, a complete redemption of the investment at the NAV at the end of the period and no sales or redemption charges. Total returns would be reduced if a sales or redemption charge was taken into account. Returns do not reflect the impact of taxes to shareholders relating to Fund distributions or the redemption of Fund shares. Total returns for periods less than one full year are not annualized. |
| | (g) | | The Fund’s portfolio turnover rate is calculated in accordance with regulatory requirements, without regard to transactions involving short term investments and certain derivatives. If such transactions were included, the Fund’s portfolio turnover rate may be higher. |
| | |
| 34 | | The accompanying notes are an integral part of these financial statements. |
ACTIVE EQUITY MULTI-MANAGER FUNDS
Financial Highlights (continued)
Selected Share Data for a Share Outstanding Throughout Each Period
| | | | | | | | | | | | | | | | | | |
| | | | | Multi-Manager U.S. Dynamic Equity Fund | |
| | | | | Class P Shares(a) | |
| | | | | Year Ended October 31, | | | Period Ended
October 31, 2015(b) | |
| | | | | 2018 | | | 2017 | | | 2016 | |
| | Per Share Data | | | | | | | | | | | | | | | | |
| | Net asset value, beginning of period | | $ | 11.28 | | | $ | 9.13 | | | $ | 9.51 | | | $ | 10.00 | |
| | Net investment income(c) | | | 0.09 | | | | 0.07 | | | | 0.06 | (d) | | | 0.02 | |
| | Net realized and unrealized gain (loss) | | | 0.64 | | | | 2.14 | | | | (0.40 | ) | | | (0.51 | ) |
| | Total from investment operations | | | 0.73 | | | | 2.21 | | | | (0.34 | ) | | | (0.49 | ) |
| | Distributions to shareholders from net investment income | | | (0.04 | ) | | | (0.06 | ) | | | (0.04 | ) | | | — | |
| | Distributions to shareholders from net realized gains | | | (0.33 | ) | | | — | | | | — | | | | — | |
| | Total distributions | | | (0.37 | ) | | | (0.06 | ) | | | (0.04 | ) | | | — | |
| | Net asset value, end of period | | $ | 11.64 | | | $ | 11.28 | | | $ | 9.13 | | | $ | 9.51 | |
| | Total return(e) | | | 6.51 | % | | | 24.34 | % | | | (3.54 | )% | | | (4.90 | )% |
| | Net assets, end of year (in 000s) | | $ | 160,527 | | | $ | 132,083 | | | $ | 135,996 | | | $ | 131,932 | |
| | Ratio of net expenses to average net assets | | | 0.78 | % | | | 0.79 | % | | | 0.80 | % | | | 0.79 | %(f) |
| | Ratio of total expenses to average net assets | | | 1.18 | % | | | 1.23 | % | | | 1.31 | % | | | 1.51 | %(f) |
| | Ratio of net investment income to average net assets | | | 0.80 | % | | | 0.63 | % | | | 0.70 | % | | | 0.70 | %(f) |
| | Portfolio turnover rate(g) | | | 86 | % | | | 96 | % | | | 112 | % | | | 14 | % |
| | (a) | | Effective April 16, 2018, Institutional Shares were redesignated as Class P Shares. |
| | (b) | | Commenced operations on July 31, 2015. |
| | (c) | | Calculated based on the average shares outstanding methodology. |
| | (d) | | Reflects income recognized from a special dividend which amounted to $0.01 per share and 0.17% of average net assets. |
| | (e) | | Assumes investment at the NAV at the beginning of the period, reinvestment of all dividends and distributions, a complete redemption of the investment at the NAV at the end of the period and no sales or redemption charges. Total returns would be reduced if a sales or redemption charge was taken into account. Returns do not reflect the impact of taxes to shareholders relating to Fund distributions or the redemption of Fund shares. Total returns for periods less than one full year are not annualized. |
| | (g) | | The Fund’s portfolio turnover rate is calculated in accordance with regulatory requirements, without regard to transactions involving short term investments and certain derivatives. If such transactions were included, the Fund’s portfolio turnover rate may be higher. |
| | |
| The accompanying notes are an integral part of these financial statements. | | 35 |
ACTIVE EQUITY MULTI-MANAGER FUNDS
Financial Highlights (continued)
Selected Share Data for a Share Outstanding Throughout Each Period
| | | | | | | | | | | | | | |
| | | | | Multi-Manager U.S. Small Cap Equity Fund | |
| | | | | Class P Shares(a) | |
| | | | | Year Ended October 31, | | | Period Ended
October 31, 2016(b) | |
| | | | | 2018 | | | 2017 | |
| | Per Share Data | | | | | | | | | | | | |
| | Net asset value, beginning of period | | $ | 12.77 | | | $ | 10.52 | | | $ | 10.00 | |
| | Net investment income(c) | | | 0.05 | (g) | | | 0.03 | | | | 0.01 | |
| | Net realized and unrealized gain (loss) | | | (0.10 | ) | | | 2.36 | | | | 0.51 | |
| | Total from investment operations | | | (0.05 | ) | | | 2.39 | | | | 0.52 | |
| | Distributions to shareholders from net investment income | | | (0.07 | ) | | | (0.04 | ) | | | — | |
| | Distributions to shareholders from net realized gains | | | (0.25 | ) | | | (0.10 | ) | | | — | |
| | Total distributions | | | (0.32 | ) | | | (0.14 | ) | | | — | |
| | Net asset value, end of period | | $ | 12.40 | | | $ | 12.77 | | | $ | 10.52 | |
| | Total return(d) | | | (0.40 | )% | | | 22.80 | % | | | 5.20 | % |
| | Net assets, end of year (in 000s) | | $ | 318,166 | | | $ | 198,378 | | | $ | 128,775 | |
| | Ratio of net expenses to average net assets | | | 0.80 | % | | | 0.80 | % | | | 0.80 | %(e) |
| | Ratio of total expenses to average net assets | | | 1.00 | % | | | 1.19 | % | | | 1.32 | %(e) |
| | Ratio of net investment income to average net assets | | | 0.35 | %(g) | | | 0.25 | % | | | 0.26 | %(e) |
| | Portfolio turnover rate(f) | | | 32 | % | | | 44 | % | | | 15 | % |
| | (a) | | Effective April 16, 2018, Institutional Shares were redesignated as Class P Shares. |
| | (b) | | Commenced operations on April 29, 2016. |
| | (c) | | Calculated based on the average shares outstanding methodology. |
| | (d) | | Assumes investment at the NAV at the beginning of the period, reinvestment of all dividends and distributions, a complete redemption of the investment at the NAV at the end of the period and no sales or redemption charges. Total returns would be reduced if a sales or redemption charge was taken into account. Returns do not reflect the impact of taxes to shareholders relating to Fund distributions or the redemption of Fund shares. Total returns for periods less than one full year are not annualized. |
| | (f) | | The Fund’s portfolio turnover rate is calculated in accordance with regulatory requirements, without regard to transactions involving short term investments. If such transactions were included, the Fund’s portfolio turnover rate may be higher. |
| | (g) | | Reflects income recognized from special dividends which amounted to $0.03 per share and 0.23% of average net assets. |
| | |
| 36 | | The accompanying notes are an integral part of these financial statements. |
ACTIVE EQUITY MULTI-MANAGER FUNDS
Notes to Financial Statements
October 31, 2018
Goldman Sachs Trust II (the “Trust”) is a Delaware statutory trust registered under the Investment Company Act of 1940, as amended (the “Act”), as an open-end management investment company. The following table lists those series of the Trust that are included in this report (collectively, the “Funds” or individually a “Fund”), along with their corresponding share classes and respective diversification status under the Act:
| | | | |
| Fund | | Share Classes Offered* | | Diversified/
Non-diversified |
Multi-Manager International Equity | | Class P | | Diversified |
Multi-Manager U.S. Dynamic Equity | | Class P | | Diversified** |
Multi-Manager U.S. Small Cap Equity | | Class P | | Diversified |
| * | | Effective April 16, 2018, Institutional Shares were redesignated as Class P Shares. |
| ** | | The Multi-Manager U.S. Dynamic Equity Fund was previously registered as a non-diversified investment company. Pursuant to current positions of the SEC staff, the Multi-Manager U.S. Dynamic Equity Fund’s classification has changed from non-diversified to diversified, and the Fund will not be able to become non-diversified unless it seeks and obtains the approval of shareholders. Accordingly, the Multi-Manager U.S. Dynamic Equity Fund may not make any investment inconsistent with the Fund’s classification as a diversified company under the Act. |
Goldman Sachs Asset Management, L.P. (“GSAM”), an affiliate of Goldman Sachs & Co. LLC (“Goldman Sachs”), serves as investment adviser to the Funds pursuant to management agreements (each, an “Agreement”) with the Trust. As of October 31, 2018, GSAM had sub-advisory agreements (the “Sub-Advisory Agreements”) for the Multi-Manager International Equity Fund with Causeway Capital Management LLC, Massachusetts Financial Services Company, doing business as MFS Investment Management and WCM Investment Management; for the Multi-Manager U.S. Dynamic Equity Fund with Lazard Asset Management LLC, Sirios Capital Management, L.P., and Smead Capital Management, Inc.; and for the Multi-Manager U.S. Small Cap Equity Fund with Boston Partners Global Investors Inc., Brown Advisory, LLC and PNC Capital Advisors, LLC (the “Underlying Managers”). Pursuant to the terms of the Sub-Advisory Agreements, the Underlying Managers are responsible for making investment decisions and managing the investments of the applicable Fund. GSAM compensates the Underlying Managers directly in accordance with the terms of the applicable Sub-Advisory Agreements. The Funds are not charged any separate or additional investment advisory fees by the Underlying Managers.
|
| 2. SIGNIFICANT ACCOUNTING POLICIES |
The financial statements have been prepared in accordance with accounting principles generally accepted in the United States of America (“GAAP”) and require management to make estimates and assumptions that may affect the reported amounts and disclosures. Actual results may differ from those estimates and assumptions.
A. Investment Valuation — The Funds’ valuation policy is to value investments at fair value.
B. Investment Income and Investments — Investment income includes interest income, dividend income, and securities lending income, if any. Interest income is accrued daily and adjusted for amortization of premiums and accretion of discounts. Dividend income is recognized on ex-dividend date or, for certain foreign securities, as soon as such information is obtained subsequent to the ex-dividend date. Investment transactions are reflected on trade date. Realized gains and losses are calculated using identified cost. Investment transactions are recorded on the following business day for daily net asset value (“NAV”) calculations. Investment income is recorded net of any foreign withholding taxes, less any amounts reclaimable. The Funds may file withholding tax reclaims in certain jurisdictions to recover a portion of amounts previously withheld. Any foreign capital gains tax is accrued daily based upon net unrealized gains, and is payable upon sale of such investments. Distributions received from the Funds’ investments in U.S. real estate investment trusts (“REITs”) may be characterized as ordinary income, net capital gain or a return of capital. A return of capital is recorded by the Funds as a reduction to the cost basis of the REIT.
For derivative contracts, realized gains and losses are recorded upon settlement of the contract.
37
ACTIVE EQUITY MULTI-MANAGER FUNDS
Notes to Financial Statements (continued)
October 31, 2018
|
| 2. SIGNIFICANT ACCOUNTING POLICIES (continued) |
C. Expenses — Expenses incurred directly by a Fund are charged to the Fund, and certain expenses incurred by the Trust are allocated across the applicable Funds on a straight-line and/or pro-rata basis, depending upon the nature of the expenses, and are accrued daily.
D. Federal Taxes and Distributions to Shareholders — It is each Fund’s policy to comply with the requirements of the Internal Revenue Code of 1986, as amended (the “Code”), applicable to regulated investment companies and to distribute each year substantially all of its investment company taxable income and capital gains to its shareholders. Accordingly, each Fund is not required to make any provisions for the payment of federal income tax. Distributions to shareholders are recorded on the ex-dividend date. Income and capital gains distributions, if any, are declared and paid annually.
Net capital losses, if any, are carried forward to future fiscal years and may be used to the extent allowed by the Code to offset any future capital gains. Losses that are carried forward will retain their character as either short-term or long-term capital losses. Utilization of capital loss carryforwards will reduce the requirement of future capital gains distributions.
The characterization of distributions to shareholders for financial reporting purposes is determined in accordance with federal income tax rules, which may differ from GAAP. The source of each Fund’s distributions may be shown in the accompanying financial statements as either from distributable earnings or capital. Certain components of the Funds’ net assets on the Statements of Assets and Liabilities reflect permanent GAAP/tax differences based on the appropriate tax character.
E. Foreign Currency Translation — The accounting records and reporting currency of the Funds are maintained in U.S. dollars. Assets and liabilities denominated in foreign currencies are translated into U.S. dollars using the current exchange rates at the close of each business day. The effect of changes in foreign currency exchange rates on investments is included within net realized and unrealized gain (loss) on investments. Changes in the value of other assets and liabilities as a result of fluctuations in foreign exchange rates are included in the Statements of Operations within net change in unrealized gain (loss) on foreign currency translation. Transactions denominated in foreign currencies are translated into U.S. dollars on the date the transaction occurred, the effects of which are included within net realized gain (loss) on foreign currency transactions.
| | |
| 3. INVESTMENTS AND FAIR VALUE MEASUREMENTS | | |
U.S. GAAP defines the fair value of a financial instrument as the amount that would be received to sell an asset or paid to transfer a liability in an orderly transaction between market participants at the measurement date (i.e., the exit price); the Funds’ policy is to use the market approach. GAAP establishes a fair value hierarchy that prioritizes the inputs to valuation techniques used to measure fair value. The hierarchy gives the highest priority to unadjusted quoted prices in active markets for identical assets or liabilities (Level 1 measurements) and the lowest priority to unobservable inputs (Level 3 measurements). The levels used for classifying investments are not necessarily an indication of the risk associated with investing in these investments. The three levels of the fair value hierarchy are described below:
Level 1 — Unadjusted quoted prices in active markets that are accessible at the measurement date for identical, unrestricted assets or liabilities;
Level 2 — Quoted prices in markets that are not active or financial instruments for which significant inputs are observable (including, but not limited to, quoted prices for similar investments, interest rates, foreign exchange rates, volatility and credit spreads), either directly or indirectly;
Level 3 — Prices or valuations that require significant unobservable inputs (including GSAM’s assumptions in determining fair value measurement).
Changes in valuation techniques may result in transfers into or out of an assigned level within the hierarchy. In accordance with the Funds’ policy, transfers between different levels of the fair value hierarchy resulting from such changes are deemed to have occurred as of the beginning of the reporting period.
The Board of Trustees (“Trustees”) has approved Valuation Procedures that govern the valuation of the portfolio investments held by the Funds, including investments for which market quotations are not readily available. The Trustees have delegated to
38
ACTIVE EQUITY MULTI-MANAGER FUNDS
|
| 3. INVESTMENTS AND FAIR VALUE MEASUREMENTS (continued) |
GSAM day-to-day responsibility for implementing and maintaining internal controls and procedures related to the valuation of the Funds’ investments. To assess the continuing appropriateness of pricing sources and methodologies, GSAM regularly performs price verification procedures and issues challenges as necessary to third party pricing vendors or brokers, and any differences are reviewed in accordance with the Valuation Procedures.
A. Level 1 and Level 2 Fair Value Investments — The valuation techniques and significant inputs used in determining the fair values for investments classified as Level 1 and Level 2 are as follows:
Equity Securities — Equity securities traded on a United States (“U.S.”) securities exchange or the NASDAQ system, or those located on certain foreign exchanges, including but not limited to the Americas, are valued daily at their last sale price or official closing price on the principal exchange or system on which they are traded. If there is no sale or official closing price or such price is believed by GSAM to not represent fair value, equity securities are valued at the last bid price for long positions and at the last ask price for short positions. To the extent these investments are actively traded, they are classified as Level 1 of the fair value hierarchy, otherwise they are generally classified as Level 2.
Unlisted equity securities for which market quotations are available are valued at the last sale price on the valuation date, or if no sale occurs, at the last bid price, and are generally classified as Level 2. Securities traded on certain foreign securities exchanges are valued daily at fair value determined by an independent fair value service (if available) under Valuation Procedures approved by the Trustees and consistent with applicable regulatory guidance. The independent fair value service takes into account multiple factors including, but not limited to, movements in the securities markets, certain depositary receipts, futures contracts and foreign currency exchange rates that have occurred subsequent to the close of the foreign securities exchange. These investments are generally classified as Level 2 of the fair value hierarchy.
Money Market Funds — Investments in the Goldman Sachs Financial Square Government Fund (“Underlying Fund”) are valued at the NAV of the Institutional Share class on the day of valuation. These investments are generally classified as Level 1 of the fair value hierarchy. For information regarding an Underlying Fund’s accounting policies and investment holdings, please see the Underlying Fund’s shareholder report.
Derivative Contracts — A derivative is an instrument whose value is derived from underlying assets, indices, reference rates or a combination of these factors. A Fund enters into derivative transactions to hedge against changes in interest rates, securities prices, and/or currency exchange rates, to increase total return, or to gain access to certain markets or attain exposure to other underliers.
Exchange-traded derivatives, including futures and options contracts, are generally valued at the last sale or settlement price on the exchange where they are principally traded. Exchange-traded options without settlement prices are generally valued at the midpoint of the bid and ask prices on the exchange where they are principally traded (or, in the absence of two-way trading, at the last bid price for long positions and the last ask price for short positions). Exchange-traded derivatives typically fall within Level 1 of the fair value hierarchy. Over-the-counter (“OTC”) and centrally cleared derivatives are valued using market transactions and other market evidence, including market-based inputs to models, calibration to market-clearing transactions, broker or dealer quotations, or other alternative pricing sources. Where models are used, the selection of a particular model to value OTC and centrally cleared derivatives depends upon the contractual terms of, and specific risks inherent in, the instrument, as well as the availability of pricing information in the market. Valuation models require a variety of inputs, including contractual terms, market prices, yield curves, credit curves, measures of volatility, voluntary and involuntary prepayment rates, loss severity rates and correlations of such inputs. For OTC and centrally cleared derivatives that trade in liquid markets, model inputs can generally be verified and model selection does not involve significant management judgment. OTC and centrally cleared derivatives are classified within Level 2 of the fair value hierarchy when significant inputs are corroborated by market evidence.
i. Forward Contracts — A forward contract is a contract between two parties to buy or sell an asset at a specified price on a future date. A forward contract settlement can occur on a cash or delivery basis. Forward contracts are marked-to-market daily using independent vendor prices, and the change in value, if any, is recorded as an unrealized gain or loss. Cash and certain investments may be used to collateralize forward contracts.
39
ACTIVE EQUITY MULTI-MANAGER FUNDS
Notes to Financial Statements (continued)
October 31, 2018
|
| 3. INVESTMENTS AND FAIR VALUE MEASUREMENTS (continued) |
A forward foreign currency exchange contract is a forward contract in which a Fund agrees to receive or deliver a fixed quantity of one currency for another, at a pre-determined price at a future date. All forward foreign currency exchange contracts are marked-to-market daily at the applicable forward rate. Non-deliverable forward foreign currency exchange contracts are settled with the counterparty in cash without the delivery of foreign currency.
B. Level 3 Fair Value Investments — To the extent that significant inputs to valuation models and other alternative pricing sources are unobservable, or if quotations are not readily available, or if GSAM believes that such quotations do not accurately reflect fair value, the fair value of the Funds’ investments may be determined under Valuation Procedures approved by the Trustees. GSAM, consistent with its procedures and applicable regulatory guidance, may make an adjustment to the most recent valuation prices of either domestic or foreign securities in light of significant events to reflect what it believes to be the fair value of the securities at the time of determining a Fund’s NAV. Significant events which could affect a large number of securities in a particular market may include, but are not limited to: significant fluctuations in U.S. or foreign markets; market dislocations; market disruptions; or unscheduled market closings. Significant events which could also affect a single issuer may include, but are not limited to: corporate actions such as reorganizations, mergers and buy-outs; ratings downgrades; and bankruptcies.
C. Fair Value Hierarchy — The following is a summary of the Funds’ investments and derivatives classified in the fair value hierarchy as of October 31, 2018:
| | | | | | | | | | | | |
|
| MULTI-MANAGER INTERNATIONAL EQUITY | |
| | | |
| Investment Type | | Level 1 | | | Level 2 | | | Level 3 | |
| Assets | | | | | | | | | | | | |
Common Stock and/or Other Equity Investments(a) | | | | | | | | | | | | |
Asia | | $ | 32,599,292 | | | $ | 110,297,536 | | | $ | — | |
Australia and Oceania | | | — | | | | 9,964,580 | | | | — | |
Europe | | | 34,720,026 | | | | 358,649,678 | | | | — | |
North America | | | 49,766,907 | | | | 3,932,461 | | | | — | |
South America | | | 3,445,654 | | | | — | | | | — | |
Investment Company | | | 22,326,171 | | | | — | | | | — | |
| Total | | $ | 142,858,050 | | | $ | 482,844,255 | | | $ | — | |
| | | |
| Derivative Type | | | | | | | | | |
| Assets(b) | | | | | | | | | | | | |
Forward Foreign Currency Exchange Contracts | | $ | — | | | $ | 557 | | | $ | — | |
|
| MULTI-MANAGER U.S. DYNAMIC EQUITY | |
| | | |
| Investment Type | | Level 1 | | | Level 2 | | | Level 3 | |
| Assets | | | | | | | | | | | | |
Common Stock and/or Other Equity Investments(a) | | | | | | | | | | | | |
Asia | | $ | 189,255 | | | $ | — | | | $ | — | |
Europe | | | 5,927,118 | | | | 4,854,136 | | | | — | |
North America | | | 137,532,981 | | | | — | | | | — | |
Investment Company | | | 8,575,215 | | | | — | | | | — | |
| Total | | $ | 152,224,569 | | | $ | 4,854,136 | | | $ | — | |
40
ACTIVE EQUITY MULTI-MANAGER FUNDS
|
| 3. INVESTMENTS AND FAIR VALUE MEASUREMENTS (continued) |
| | | | | | | | | | | | |
|
| MULTI-MANAGER U.S. DYNAMIC EQUITY (continued) | |
| | | |
| Derivative Type | | Level 1 | | | Level 2 | | | Level 3 | |
| Assets(b) | | | | | | | | | | | | |
Forward Foreign Currency Exchange Contracts | | $ | — | | | $ | 179,470 | | | $ | — | |
| Liabilities(b) | | | | | | | | | | | | |
Forward Foreign Currency Exchange Contracts | | $ | — | | | $ | (23,956 | ) | | $ | — | |
|
MULTI-MANAGER U.S. SMALL CAP EQUITY
| |
| | | |
| Investment Type | | Level 1 | | | Level 2 | | | Level 3 | |
| Assets | | | | | | | | | | | | |
Common Stock and/or Other Equity Investments(a) | | | | | | | | | | | | |
Asia | | $ | 1,285,014 | | | $ | — | | | $ | — | |
Europe | | | 2,139,067 | | | | — | | | | — | |
North America | | | 290,469,664 | | | | — | | | | — | |
South America | | | 464,986 | | | | — | | | | — | |
Investment Company | | | 17,772,708 | | | | — | | | | — | |
| Total | | $ | 312,131,439 | | | $ | — | | | $ | — | |
| (a) | | Amounts are disclosed by continent to highlight the impact of time zone differences between local market close and the calculation of NAV. Security valuations are based on the principal exchange or system on which they are traded, which may differ from country of domicile. The Funds utilize fair value model prices provided by an independent fair value service for international equities, resulting in a Level 2 classification. |
| (b) | | Amount shown represents unrealized gain (loss) at period end. |
For further information regarding security characteristics, see the Schedules of Investments.
|
| 4. INVESTMENTS IN DERIVATIVES |
The following tables set forth, by certain risk types, the gross value of derivative contracts (not considered to be hedging instruments for accounting disclosure purposes) as of October 31, 2018. These instruments were used as part of the Funds’ investment strategies and to obtain and/or manage exposure related to the risks below. The values in the tables below exclude the effects of cash collateral received or posted pursuant to these derivative contracts, and therefore are not representative of the Funds’ net exposure.
| | | | | | | | | | | | |
| Multi-Manager International Equity Fund | | | | | | | | | | |
| | | | |
| Risk | | Statements of Assets and Liabilities | | Assets | | | Statements of Assets and Liabilities | | Liabilities | |
Currency | | Receivable for unrealized gain on forward foreign currency exchange contracts | | $ | 557 | | | Payable for unrealized loss on forward foreign currency exchange contracts | | $ | — | |
| | | |
| Multi-Manager U.S. Dynamic Equity Fund | | | | | | | | | | |
| | | | |
| Risk | | Statements of Assets and Liabilities | | Assets | | | Statements of Assets and Liabilities | | Liabilities | |
Currency | | Receivable for unrealized gain on forward foreign currency exchange contracts | | $ | 179,470 | | | Payable for unrealized loss on forward foreign currency exchange contracts | | $ | (23,956) | |
The following tables set forth, by certain risk types, the Funds’ gains (losses) related to these derivatives and their indicative volumes for the fiscal year ended October 31, 2018. These gains (losses) should be considered in the context that these derivative contracts may have been executed to create investment opportunities and/or economically hedge certain investments, and
41
ACTIVE EQUITY MULTI-MANAGER FUNDS
Notes to Financial Statements (continued)
October 31, 2018
|
| 4. INVESTMENTS IN DERIVATIVES (continued) |
accordingly, certain gains (losses) on such derivative contracts may offset certain (losses) gains attributable to investments. These gains (losses) are included in “Net realized gain (loss)” or “Net change in unrealized gain (loss)” on the Statements of Operations:
| | | | | | | | | | | | | | |
| Multi-Manager International Equity Fund | | | | | | | | | | | | |
| | | | |
| Risk | | Statements of Operations | | Net Realized
Gain (Loss) | | | Net Change in
Unrealized
Gain (Loss) | | | Average
Number of
Contracts | |
| Currency | | Net realized gain (loss) from forward foreign currency exchange contracts/Net unrealized gain (loss) on forward foreign currency exchange contracts | | $ | 20,102 | | | $ | (165 | ) | | | 2 | |
|
| Multi-Manager U.S. Dynamic Equity Fund | |
| Risk | | Statements of Operations | | Net Realized
Gain (Loss) | | | Net Change in
Unrealized
Gain (Loss) | | | Average
Number of
Contracts | |
| Currency | | Net realized gain (loss) from forward foreign currency exchange contracts/Net unrealized gain(loss) on forward foreign currency exchange contracts | | $ | 132,229 | | | $ | 46,788 | | | | 13 | |
In order to better define its contractual rights and to secure rights that will help a Fund mitigate its counterparty risk, a Fund may enter into an International Swaps and Derivatives Association, Inc. Master Agreement (“ISDA Master Agreement”) or similar agreement with its derivatives counterparties. An ISDA Master Agreement is a bilateral agreement between a Fund and a counterparty that governs OTC derivatives (including forward foreign currency exchange contracts, and certain options and swaps), and typically contains, among other things, collateral posting terms and netting provisions in the event of a default and/or termination event. The provisions of the ISDA Master Agreement typically permit a single net payment in the event of a default (close-out netting) or similar event, including the bankruptcy or insolvency of the counterparty.
Collateral and margin requirements differ between exchange traded derivatives and OTC derivatives. Margin requirements are established by the broker or clearing house for exchange-traded and centrally cleared derivatives (financial futures contracts, options and centrally cleared swaps) pursuant to governing agreements for those instrument types. Brokers can ask for margin in excess of the minimum in certain circumstances. Collateral terms are contract-specific for OTC derivatives. For derivatives traded under an ISDA Master Agreement, the collateral requirements are typically calculated by netting the marked to market amount for each transaction under such agreement and comparing that amount to the value of any collateral currently pledged by a Fund and the counterparty. Additionally, a Fund may be required to post initial margin to the counterparty, the terms of which would be outlined in the confirmation of the OTC transaction.
For financial reporting purposes, cash collateral that has been pledged to cover obligations of a Fund and cash collateral received from the counterparty, if any, is reported separately on the Statements of Assets and Liabilities as receivables/payables for collateral on certain derivative contracts. Non-cash collateral pledged by a Fund, if any, is noted in the Schedules of Investments. Generally, the amount of collateral due from or to a counterparty must exceed a minimum transfer amount threshold before a transfer is required to be made. To the extent amounts due to a Fund from its counterparties are not fully collateralized, contractually or otherwise, the Fund bears the risk of loss from counterparty nonperformance. A Fund attempts to mitigate counterparty risk by only entering into agreements with counterparties that the Underlying Managers believe to be of good standing and by monitoring the financial stability of those counterparties.
Additionally, the netting of assets and liabilities and the offsetting of collateral pledged or received are based on contractual netting/set-off provisions in the ISDA Master Agreement or similar agreements. However, in the event of a default or insolvency of a counterparty, a court could determine that such rights are not enforceable due to the restrictions or prohibitions against the right of setoff that may be imposed in accordance with a particular jurisdiction’s bankruptcy or insolvency laws.
|
| 5. AGREEMENTS AND AFFILIATED TRANSACTIONS |
A. Management Agreement — Under the Agreement, GSAM manages the Funds, subject to the general supervision of the Trustees.
42
ACTIVE EQUITY MULTI-MANAGER FUNDS
|
| 5. AGREEMENTS AND AFFILIATED TRANSACTIONS (continued) |
As compensation for the services rendered pursuant to the Agreement, the assumption of the expenses related thereto and administration of the Funds’ business affairs, including providing facilities, GSAM is entitled to a management fee, accrued daily and paid monthly, equal to an annual percentage rate of each Fund’s average daily net assets.
For the fiscal year ended October 31, 2018, contractual and effective net management fees with GSAM were at the following rates:
| | | | | | | | | | |
| | | | | Management Rate | |
| Fund | | | | Contractual
Management Rate | | | Effective Net Management Rate* | |
Multi-Manager International Equity | | | | | 0.60 | % | | | 0.44 | % |
Multi-Manager U.S. Dynamic Equity | | | | | 0.80 | | | | 0.68 | |
Multi-Manager U.S. Small Cap Equity | | | | | 0.75 | | | | 0.66 | |
| * | | GSAM has agreed to waive a portion of its management fee for each Fund in order to achieve an effective net management fee rate that is equal to the actual cost of fees paid to the Fund’s Underlying Managers. This arrangement will remain in effect through at least February 28, 2019 and prior to such date, GSAM may not terminate the applicable arrangement without the approval of the Trustees. |
The Multi-Manager International Equity, Multi-Manager U.S. Dynamic Equity and Multi-Manager U.S. Small Cap Equity Funds invest in Institutional Shares of the Goldman Sachs Financial Square Government Fund, which is an affiliated Underlying Fund. GSAM has agreed to waive a portion of its management fee payable by the Funds in an amount equal to the management fee it earns as an investment adviser to the affiliated Underlying Fund in which the Funds invest. For the fiscal year ended October 31, 2018, GSAM waived $16,270, $8,726 and $9,662 of the Fund’s management fee for the Multi-Manager International Equity, Multi-Manager U.S. Dynamic Equity and Multi-Manager U.S. Small Cap Equity Funds, respectively.
B. Transfer Agency Agreement — Goldman Sachs also serves as the transfer agent of the Funds for a fee pursuant to the Transfer Agency Agreement. The fees charged for such transfer agency services are accrued daily and paid monthly at annual rates as follows: 0.02% of the average daily net assets of Class P Shares.
C. Other Expense Agreements and Affiliated Transactions — GSAM has agreed to limit each Fund’s “Total Annual Operating Expenses” (excluding acquired fund fees and expenses, taxes, interest, brokerage fees, expenses of shareholder meetings, litigation and indemnification, and extraordinary expenses) to the extent such expenses exceed, on an annual basis, a percentage rate of the average daily net assets of each Fund. Such expense reimbursements, if any, are accrued daily and paid monthly. In addition, the Funds are not obligated to reimburse GSAM for prior fiscal year expense reimbursements, if any. The Total Annual Operating Expense limitations as an annual percentage rate of average daily net assets for the Multi-Manager International Equity, Multi-Manager U.S. Dynamic Equity and the Multi-Manager U.S. Small Cap Equity Funds are 0.57%, 0.79% and 0.80% respectively. These Total Annual Operating Expense limitations will remain in place through at least February 28, 2019, and prior to such date GSAM may not terminate the arrangements without the approval of the Trustees. In addition, the Funds have entered into certain offset arrangements with the transfer agent, which may result in a reduction of the Funds’ expenses and are received irrespective of the application of the “Total Annual Operating Expense” limitations described above.
For the fiscal year ended October 31, 2018, these expense reductions, including any fee waivers and expense reimbursements, were as follows:
| | | | | | | | | | | | | | |
| Fund | | | | Management
Fee Waiver | | | Other
Expense
Reimbursements | | | Total Annual
Operating Expense
Reductions | |
Multi-Manager International Equity | | | | $ | 876,385 | | | $ | 294,033 | | | $ | 1,170,418 | |
Multi-Manager U.S. Dynamic Equity | | | | | 183,023 | | | | 419,593 | | | | 602,616 | |
Multi-Manager U.S. Small Cap Equity | | | | | 240,488 | | | | 295,470 | | | | 535,958 | |
43
ACTIVE EQUITY MULTI-MANAGER FUNDS
Notes to Financial Statements (continued)
October 31, 2018
|
| 5. AGREEMENTS AND AFFILIATED TRANSACTIONS (continued) |
D. Line of Credit Facility — As of October 31, 2018, the Funds participated in a $770,000,000 committed, unsecured revolving line of credit facility (the “facility”) together with other funds of the Trust and certain registered investment companies having management agreements with GSAM or its affiliates. This facility is to be used for temporary emergency purposes, or to allow for an orderly liquidation of securities to meet redemption requests. The interest rate on borrowings is based on the federal funds rate. The facility also requires a fee to be paid by the Funds based on the amount of the commitment that has not been utilized. For the fiscal year ended October 31, 2018, the Funds did not have any borrowings under the facility.
E. Other Transactions with Affiliates — For the fiscal year ended October 31, 2018, Goldman Sachs earned $146 and 1,723, in brokerage commissions from portfolio transactions on behalf of the Multi-Manager International Equity Fund and Multi-Manager U.S. Small Cap Equity Fund, respectively.
The following table provides information about the Funds’ investments in the Goldman Sachs Financial Square Government Fund as of and for the fiscal year ended October 31, 2018:
| | | | | | | | | | | | | | | | | | | | | | | | |
| Fund | | Market Value as
of October 31,
2017 | | | Purchases
at Cost | | | Proceeds
from Sales | | | Market Value
as of October 31,
2018 | | | Shares as
of October 31,
2018 | | | Dividend
Income | |
Multi-Manager International Equity | | $ | — | | | $ | 210,726,228 | | | $ | (188,400,057 | ) | | $ | 22,326,171 | | | | 22,326,171 | | | $ | 184,526 | |
Multi-Manager U.S. Dynamic Equity | | | — | | | | 98,629,649 | | | | (90,054,434 | ) | | | 8,575,215 | | | | 8,575,215 | | | | 95,991 | |
Multi-Manager U.S. Small Cap Equity | | | — | | | | 152,757,939 | | | | (134,985,231 | ) | | | 17,772,708 | | | | 17,772,708 | | | | 108,967 | |
|
| 6. PORTFOLIO SECURITIES TRANSACTIONS |
The cost of purchases and proceeds from sales and maturities of long-term securities for the fiscal year ended October 31, 2018, were:
| | | | | | | | | | |
| Fund | | | | Purchases | | | Sales and Maturities | |
Multi-Manager International Equity Fund | | | | $ | 373,822,188 | | | $ | 140,664,602 | |
Multi-Manager U.S. Dynamic Equity Fund | | | | | 138,349,659 | | | | 119,515,602 | |
Multi-Manager U.S. Small Cap Equity Fund | | | | | 198,839,466 | | | | 78,932,362 | |
The tax character of distributions paid during the fiscal year ended October 31, 2018 was as follows:
| | | | | | | | | | | | |
| | | Multi-Manager
International
Equity Fund | | | Multi-Manager
U.S. Dynamic
Equity Fund | | | Multi-Manager
U.S. Small Cap
Equity Fund | |
Distribution paid from: | | | | | | | | | | | | |
Ordinary income | | $ | 7,089,359 | | | $ | 475,869 | | | $ | 3,155,996 | |
Net long-term capital gains | | | 3,919 | | | | 3,815,811 | | | | 1,945,146 | |
Total taxable distributions | | $ | 7,093,278 | | | $ | 4,291,680 | | | $ | 5,101,142 | |
44
ACTIVE EQUITY MULTI-MANAGER FUNDS
|
| 7. TAX INFORMATION (continued) |
The tax character of distributions paid during the fiscal year ended October 31, 2017 was as follows:
| | | | | | | | | | | | |
| |
| | | Multi-Manager
International
Equity Fund | | | Multi-Manager
U.S. Dynamic
Equity Fund | | | Multi-Manager
U.S. Small Cap
Equity Fund | |
Distribution paid from: | | | | | | | | | | | | |
Ordinary income | | $ | 4,582,050 | | | $ | 896,870 | | | $ | 1,600,555 | |
Net long-term capital gains | | | — | | | | — | | | | 32,362 | |
Total taxable distributions | | $ | 4,582,050 | | | $ | 896,870 | | | $ | 1,632,917 | |
As of October 31, 2018, the components of accumulated earnings (losses) on a tax basis were as follows:
| | | | | | | | | | | | |
| | | Multi-Manager
International
Equity Fund | | | Multi-Manager
U.S. Dynamic
Equity Fund | | | Multi-Manager
U.S. Small Cap
Equity Fund | |
Undistributed ordinary income — net | | $ | 10,561,374 | | | $ | 4,177,967 | | | $ | 3,077,307 | |
Undistributed long-term capital gains | | | 12,969,093 | | | | 5,731,187 | | | | 5,219,932 | |
Total undistributed earnings | | $ | 23,530,467 | | | $ | 9,909,154 | | | $ | 8,297,239 | |
Unrealized gains (losses) — net | | | 4,931,818 | | | | 20,307,873 | | | | 15,080,105 | |
Total accumulated earnings (losses) net | | $ | 28,462,285 | | | $ | 30,217,027 | | | $ | 23,377,344 | |
As of October 31, 2018, the Funds’ aggregate security unrealized gains and losses based on cost for U.S. federal income tax purposes were as follows:
| | | | | | | | | | | | |
| | | Multi-Manager
International
Equity Fund | | | Multi-Manager
U.S. Dynamic
Equity Fund | | | Multi-Manager
U.S. Small Cap
Equity Fund | |
Tax Cost | | $ | 620,744,992 | | | $ | 136,926,341 | | | $ | 297,051,332 | |
Gross unrealized gain | | | 50,720,075 | | | | 25,498,922 | | | | 37,481,311 | |
Gross unrealized loss | | | (45,788,257 | ) | | | (5,191,049 | ) | | | (22,401,206 | ) |
Net unrealized gains (losses) | | $ | 4,931,818 | | | $ | 20,307,873 | | | $ | 15,080,105 | |
The difference between GAAP-basis and tax basis unrealized gains (losses) is attributable primarily to wash sales and differences in the tax treatment of passive foreign investment company investments, net mark to market gains/(losses) on foreign currency contracts and differences in the tax treatment of underlying fund investments.
GSAM has reviewed the Funds’ tax positions for all open tax years (the current and prior three years, as applicable) and has concluded that no provision for income tax is required in the Funds’ financial statements. Such open tax years remain subject to examination and adjustment by tax authorities.
The Funds’ risks include, but are not limited to, the following:
Derivatives Risk — The Funds’ use of derivatives may result in loss. Derivative instruments, which may pose risks in addition to and greater than those associated with investing directly in securities, currencies or other instruments, may be illiquid or less liquid, volatile, difficult to price and leveraged so that small changes in the value of the underlying instruments may produce
45
ACTIVE EQUITY MULTI-MANAGER FUNDS
Notes to Financial Statements (continued)
October 31, 2018
|
| 8. OTHER RISKS (continued) |
disproportionate losses to the Funds. Derivatives are also subject to counterparty risk, which is the risk that the other party in the transaction will not fulfill its contractual obligation. The use of derivatives is a highly specialized activity that involves investment techniques and risks different from those associated with investments in more traditional securities and instruments. Losses from derivatives can also result from a lack of correlation between changes in the value of derivative instruments and the portfolio assets (if any) being hedged.
Foreign and Emerging Countries Risk — Investing in foreign markets may involve special risks and considerations not typically associated with investing in the United States. Foreign securities may be subject to risk of loss because of more or less foreign government regulation, less public information and less economic, political and social stability in the countries in which the Funds invest. The imposition of exchange controls (including repatriation restrictions), confiscations, trade restrictions (including tariffs) and other government restrictions by the United States or other governments, or from problems in share registration, settlement or custody, may also result in losses. Foreign risk also involves the risk of negative foreign currency rate fluctuations, which may cause the value of securities denominated in such foreign currency (or other instruments through which the Funds have exposure to foreign currencies) to decline in value. Currency exchange rates may fluctuate significantly over short periods of time.
To the extent that the Funds also invest in securities of issuers located in emerging markets, these risks may be more pronounced.
Foreign Custody Risk — If a Fund invests in foreign securities, the Fund may hold such securities and cash with foreign banks, agents, and securities depositories appointed by the Fund’s custodian (each a “Foreign Custodian”). Some foreign custodians may be recently organized or new to the foreign custody business. In some countries, Foreign Custodians may be subject to little or no regulatory oversight over, or independent evaluation of, their operations. Further, the laws of certain countries may place limitations on a Fund’s ability to recover its assets if a Foreign Custodian enters bankruptcy. Investments in emerging markets may be subject to even greater custody risks than investments in more developed markets. Custody services in emerging market countries are very often undeveloped and may be considerably less well regulated than in more developed countries, and thus may not afford the same level of investor protection as would apply in developed countries.
Investments in Other Investment Companies Risk — As a shareholder of another investment company, including an exchange traded fund (“ETF”), a Fund will indirectly bear its proportionate share of any net management fees and other expenses paid by such other investment companies, in addition to the fees and expenses regularly borne by the Fund. ETFs are subject to risks that do not apply to conventional mutual funds, including but not limited to the following: (i) the market price of the ETF’s shares may trade at a premium or a discount to their NAV; and (ii) an active trading market for an ETF’s shares may not develop or be maintained.
Geographic Risk — If a Fund focuses its investments in securities of issuers located in a particular country or geographic region, the Fund may be subjected, to a greater extent than if its investments were less focused, to the risks of volatile economic cycles and/or conditions and developments that may be particular to that country or region, such as: adverse securities markets; adverse exchange rates; adverse social, political, regulatory, economic, business, environmental or other developments; or natural disasters.
Large Shareholder Transactions Risk — A Fund may experience adverse effects when certain large shareholders, such as other funds, institutional investors (including those trading by use of non-discretionary mathematical formulas), financial intermediaries (who may make investment decisions on behalf of underlying clients and/or include a Fund in their investment model), individuals, accounts and Goldman Sachs affiliates, purchase or redeem large amounts of shares of a Fund. Such large shareholder redemptions may cause a Fund to sell portfolio securities at times when it would not otherwise do so, which may negatively impact a Fund’s NAV and liquidity. These transactions may also accelerate the realization of taxable income to shareholders if such sales of investments resulted in gains, and may also increase transaction costs. In addition, a large redemption could result in a Fund’s current expenses being allocated over a smaller asset base, leading to an increase in the Fund’s expense ratio. Similarly, large Fund share purchases may adversely affect a Fund’s performance to the extent that the Fund is delayed in investing new cash and is required to maintain a larger cash position than it ordinarily would.
46
ACTIVE EQUITY MULTI-MANAGER FUNDS
|
| 8. OTHER RISKS (continued) |
Liquidity Risk — A Fund may make investments that are illiquid or that may become less liquid in response to market developments or adverse investor perceptions. Illiquid investments may be more difficult to value. Liquidity risk may also refer to the risk that a Fund will not be able to pay redemption proceeds within the allowable time period because of unusual market conditions, an unusually high volume of redemption requests, or other reasons. To meet redemption requests, a Fund may be forced to sell investments at an unfavorable time and/or under unfavorable conditions. These risks may be more pronounced in connection with the Funds’ investments in securities of issuers located in emerging market countries.
Market and Credit Risks — In the normal course of business, the Funds trade financial instruments and enter into financial transactions where risk of potential loss exists due to changes in the market (market risk). Additionally, the Funds may also be exposed to credit risk in the event that an issuer or guarantor fails to perform or that an institution or entity with which the Funds have unsettled or open transactions defaults.
Multi-Manager Approach Risk— The Funds’ performance depends on the ability of the Investment Adviser in selecting, overseeing, and allocating Fund assets to the Underlying Managers. The Underlying Managers’ investment styles may not always be complementary. The Funds’ multi-manager approach may result in the Fund investing a significant percentage of its assets in certain types of investments, which could be beneficial or detrimental to the Funds’ performance depending on the performance of those investments and the overall market environment. The Funds’ Underlying Managers may underperform the market generally or underperform other investment managers that could have been selected for the Funds. Because the Funds’ Underlying Managers may trade with counterparties, prime brokers, clearing brokers or futures commission merchants on terms that are different than those on which the Investment Adviser would trade, and because each Underlying Manager applies its own risk analysis in evaluating potential counterparties for the Funds, the Funds may be subject to greater counterparty risk than if they were managed directly by the Investment Adviser.
Under the Trust’s organizational documents, its Trustees, officers, employees and agents are indemnified, to the extent permitted by the Act and state law, against certain liabilities that may arise out of performance of their duties to the Funds. Additionally, in the course of business, the Funds enter into contracts that contain a variety of indemnification clauses. The Funds’ maximum exposure under these arrangements is unknown, as this would involve future claims that may be made against the Funds that have not yet occurred. However, GSAM believes the risk of loss under these arrangements to be remote.
In September 2018, the Financial Accounting Standards Board issued Accounting Standards Update (ASU) 2018-13 — Fair Value Measurement (Topic 820) Disclosure Framework — Changes to the Disclosure Requirements for Fair Value Measurement. The amendments in the ASU modify fair value measurement disclosures. The amendments are effective for each Fund’s fiscal year beginning after December 15, 2019. GSAM is currently evaluating the impact, if any, of the amendments.
Subsequent events after the Statements of Assets and Liabilities date have been evaluated, and GSAM has concluded that there is no impact requiring adjustment or disclosure in the financial statements.
47
ACTIVE EQUITY MULTI-MANAGER FUNDS
Notes to Financial Statements (continued)
October 31, 2018
|
| 12. SUMMARY OF SHARE TRANSACTIONS |
Share activity is as follows:
| | | | | | | | | | | | | | | | |
| | | Multi-Manager International Equity Fund | |
| | | For the Fiscal Year Ended
October 31, 2018
| | | For the Fiscal Year Ended
October 31, 2017
| |
| | | | |
| | | Shares | | | Dollars | | | Shares | | | Dollars | |
| | | | |
| Class P Shares(a) | | | | | | | | | | | | | | | | |
Shares sold | | | 23,098,089 | | | $ | 269,285,343 | | | | 14,000,192 | | | $ | 148,372,005 | |
Reinvestment of distributions | | | 605,229 | | | | 7,093,278 | | | | 496,969 | | | | 4,582,050 | |
Shares redeemed | | | (3,791,376 | ) | | | (44,996,789 | ) | | | (7,578,837 | ) | | | (81,272,305 | ) |
NET INCREASE | | | 19,911,942 | | | $ | 231,381,832 | | | | 6,918,324 | | | $ | 71,681,750 | |
| | | | | | | | | | | | | | | | |
| | | Multi-Manager U.S. Dynamic Equity Fund | |
| | | For the Fiscal Year Ended
October 31, 2018
| | | For the Fiscal Year Ended
October 31, 2017
| |
| | | | |
| | | Shares | | | Dollars | | | Shares | | | Dollars | |
| | | | |
| Class P Shares(a) | | | | | | | | | | | | | | | | |
Shares sold | | | 4,651,595 | | | $ | 54,210,000 | | | | 1,576,466 | | | $ | 17,020,000 | |
Reinvestment of distributions | | | 375,628 | | | | 4,291,680 | | | | 92,844 | | | | 896,870 | |
Shares redeemed | | | (2,945,947 | ) | | | (35,535,266 | ) | | | (4,864,921 | ) | | | (51,586,859 | ) |
NET INCREASE (DECREASE) | | | 2,081,276 | | | $ | 22,966,414 | | | | (3,195,611 | ) | | $ | (33,669,989 | ) |
| | | | | | | | | | | | | | | | |
| | | Multi-Manager U.S. Small Cap Equity Fund | |
| | | For the Fiscal Year Ended
October 31, 2018
| | | For the Fiscal Year Ended
October 31, 2017
| |
| | | | |
| | | Shares | | | Dollars | | | Shares | | | Dollars | |
| | | | |
| Class P Shares(a) | | | | | | | | | | | | | | | | |
Shares sold | | | 12,533,550 | | | $ | 165,669,010 | | | | 6,370,134 | | | $ | 75,997,000 | |
Reinvestment of distributions | | | 403,074 | | | | 5,101,142 | | | | 138,300 | | | | 1,632,917 | |
Shares redeemed | | | (2,809,267 | ) | | | (37,822,987 | ) | | | (3,211,143 | ) | | | (38,547,475 | ) |
NET INCREASE | | | 10,127,357 | | | $ | 132,947,165 | | | | 3,297,291 | | | $ | 39,082,442 | |
| (a) | | Effective April 16, 2018, Institutional Shares were redesignated as Class P Shares. |
48
Report of Independent Registered Public Accounting Firm
To the Board of Trustees of Goldman Sachs Trust II and Shareholders of Multi-Manager International Equity Fund, Multi-Manager U.S. Dynamic Equity Fund and Multi-Manager U.S. Small Cap Equity Fund
Opinions on the Financial Statements
We have audited the accompanying statements of assets and liabilities, including the schedules of investments, of Multi-Manager International Equity Fund, Multi-Manager U.S. Dynamic Equity Fund and Multi-Manager U.S. Small Cap Equity Fund (three of the funds constituting Goldman Sachs Trust II, hereafter collectively referred to as the “Funds”) as of October 31, 2018, the related statements of operations for the year ended October 31, 2018, the statements of changes in net assets for each of the two years in the period ended October 31, 2018, including the related notes, and the financial highlights for each of the periods indicated therein (collectively referred to as the “financial statements”). In our opinion, the financial statements present fairly, in all material respects, the financial position of each of the Funds as of October 31, 2018, the results of each of their operations for the year then ended, the changes in each of their net assets for each of the two years in the period ended October 31, 2018 and the financial highlights for each of the periods indicated therein in conformity with accounting principles generally accepted in the United States of America.
Basis for Opinions
These financial statements are the responsibility of the Funds’ management. Our responsibility is to express an opinion on the Funds’ financial statements based on our audits. We are a public accounting firm registered with the Public Company Accounting Oversight Board (United States) (“PCAOB”) and are required to be independent with respect to the Funds in accordance with the U.S. federal securities laws and the applicable rules and regulations of the Securities and Exchange Commission and the PCAOB.
We conducted our audits of these financial statements in accordance with the standards of the PCAOB. Those standards require that we plan and perform the audit to obtain reasonable assurance about whether the financial statements are free of material misstatement, whether due to error or fraud.
Our audits included performing procedures to assess the risks of material misstatement of the financial statements, whether due to error or fraud, and performing procedures that respond to those risks. Such procedures included examining, on a test basis, evidence regarding the amounts and disclosures in the financial statements. Our audits also included evaluating the accounting principles used and significant estimates made by management, as well as evaluating the overall presentation of the financial statements. Our procedures included confirmation of securities owned as of October 31, 2018 by correspondence with the custodian, transfer agent and brokers; when replies were not received from brokers, we performed other auditing procedures. We believe that our audits provide a reasonable basis for our opinions.
PricewaterhouseCoopers LLP
Boston, Massachusetts
December 27, 2018
We have served as the auditor of one or more investment companies in the Goldman Sachs fund complex since 2000.
49
ACTIVE EQUITY MULTI-MANAGER FUNDS
Fund Expenses — Period Ended October 31, 2018 (Unaudited)
As a shareholder of Class P Shares of the Funds, you incur two types of costs: (1) transaction costs, including sales charges on purchase payments, and (2) ongoing costs, including management fees; and other Fund expenses. This example is intended to help you understand your ongoing costs (in dollars) of investing in the Funds and to compare these costs with the ongoing costs of investing in other mutual funds.
The example is based on an investment of $1,000 invested at the beginning of the period and held for the entire period from May 1, 2018 through October 31, 2018, which represents a period of 184 days in a 365 day year.
Actual Expenses — The first line under each share class in the table below provides information about actual account values and actual expenses. You may use the information in this line, together with the amount you invested, to estimate the expenses that you paid over the period. Simply divide your account value by $1,000 (for example, an $8,600 account value divided by $1,000=8.6), then multiply the result by the number in the first line under the heading entitled “Expenses Paid” to estimate the expenses you paid on your account during this period.
Hypothetical Example for Comparison Purposes — The second line under each share class in the table below provides information about hypothetical account values and hypothetical expenses based on the Funds’ actual net expense ratios and an assumed rate of return of 5% per year before expenses, which is not the Funds’ actual return. The hypothetical account values and expenses may not be used to estimate the actual ending account balance or expenses you paid for the period. You may use this information to compare the ongoing costs of investing in the Funds and other funds. To do so, compare this 5% hypothetical example with the 5% hypothetical examples that appear in the shareholder reports of the other funds.
Please note that the expenses shown in the table are meant to highlight your ongoing costs only and do not reflect any transactional costs, such as sales charges, redemption fees, or exchange fees. Therefore, the second line of the table is useful in comparing ongoing costs only, and will not help you determine the relative total costs of owning different funds. In addition, if these transactional costs were included, your costs would have been higher.
| | | | | | | | | | | | | | | | | | | | | | | | | | | | | | | | | | | | |
| | | Multi-Manager International Equity Fund | | | Multi-Manager U.S. Dynamic Equity Fund | | | Multi-Manager U.S. Small Cap Equity Fund | |
| Share Class | | Beginning
Account
Value
5/1/18 | | | Ending
Account
Value
10/31/18 | | | Expenses
Paid for the
6 months
ended
10/31/18* | | | Beginning
Account
Value
5/1/18 | | | Ending
Account
Value
10/31/18 | | | Expenses
Paid for the
6 months
ended
10/31/18* | | | Beginning
Account
Value
5/1/18 | | | Ending
Account
Value
10/31/18 | | | Expenses
Paid for the
6 months
ended
10/31/18* | |
| Class P(a) | | | | | | | | | | | | | | | | | | | | | | | | | | | | | | | | | | | | |
Actual | | $ | 1,000.00 | | | $ | 919.90 | | | $ | 2.76 | | | $ | 1,000.00 | | | $ | 1,025.60 | | | $ | 3.98 | | | $ | 1,000.00 | | | $ | 980.20 | | | $ | 3.94 | |
Hypothetical 5% return | | | 1,000.00 | | | | 1,022.33 | + | | | 2.91 | | | | 1,000.00 | | | | 1,021.27 | + | | | 3.97 | | | | 1,000.00 | | | | 1,021.22 | + | | | 4.02 | |
| | (a) | | Effective April 16, 2018, Institutional Shares were redesignated as Class P Shares. | |
| | + | | Hypothetical expenses are based on each Fund’s actual annualized net expense ratios and an assumed rate of return of 5% per year before expenses. | |
| | * | | Expenses for each share class are calculated using each Fund’s annualized net expense ratio for each class, which represents the ongoing expenses as a percentage of net assets for the six months ended October 31, 2018. Expenses are calculated by multiplying the annualized net expense ratio by the average account value for the period; then multiplying the result by the number of days in the most recent fiscal half year; and then dividing that result by the number of days in the fiscal year. The annualized net expense ratios for the period were as follows: | |
| | | | |
| Fund | | Class P | |
Multi-Manager International Equity Fund | | | 0.57 | % |
Multi-Manager U.S. Dynamic Equity Fund | | | 0.78 | |
Multi-Manager U.S. Small Cap Equity | | | 0.80 | |
50
ACTIVE EQUITY MULTI-MANAGER FUNDS
Statement Regarding Basis for Approval of Management Agreement and Sub-Advisory Agreements (Unaudited)
Background
The Multi-Manager International Equity Fund, Multi-Manager U.S. Dynamic Equity Fund, and Multi-Manager U.S. Small Cap Equity Fund (the “Funds”) are investment portfolios of Goldman Sachs Trust II (the “Trust”). The Board of Trustees oversees the management of the Trust and reviews the investment performance and expenses of the Funds at regularly scheduled meetings held throughout the year. Each Fund employs a “manager of managers” structure, whereby Goldman Sachs Asset Management, L.P. (the “Investment Adviser”) is responsible for selecting sub-advisers (subject to Board approval), allocating the Fund’s assets among them, and overseeing their day-to-day management of Fund assets. The Board of Trustees determines annually whether to approve the continuance of the Trust’s investment management agreement (the “Management Agreement”) with the Investment Adviser on behalf of the Funds.
The Management Agreement was most recently approved for continuation until August 31, 2019 by the Board of Trustees, including those Trustees who are not parties to the Management Agreement or “interested persons” (as defined in the Investment Company Act of 1940, as amended) of any party thereto (the “Independent Trustees”), at a meeting held on August 7-8, 2018 (the “Annual Meeting”). At the Annual Meeting, the Board also considered the sub-advisory agreements (each a “ Designated Sub-Advisory Agreement” and, together with the Management Agreement, the “Agreements”) between the Investment Adviser and (i) each of Causeway Capital Management LLC, Massachusetts Financial Services Company (d/b/a MFS Investment Management), and WCM Investment Management (on behalf of Multi-Manager International Equity Fund); (ii) each of Lazard Asset Management LLC, Sirios Capital Management, L.P., and Smead Capital Management, Inc. (on behalf of Multi-Manager U.S. Dynamic Equity Fund); and (iii) each of Boston Partners Global Investors, Inc., Brown Advisory LLC, and PNC Capital Advisors LLC (on behalf of Multi-Manager U.S. Small Cap Equity Fund) (each, a “Designated Sub-Adviser” and collectively, the “Designated Sub-Advisers”).
The review process undertaken by the Trustees spans the course of the year and culminates with the Annual Meeting. To assist the Trustees in their deliberations, the Trustees have established a Contract Review Committee (the “Committee”), comprised of the Independent Trustees. The Committee held five meetings over the course of the year since the Management Agreement was last approved. At those Committee meetings, regularly scheduled Board or other committee meetings, and/or the Annual Meeting, matters relevant to the renewal of the Management Agreement and the Designated Sub-Advisory Agreements were considered by the Board, or the Independent Trustees, as applicable. With respect to each Fund, such matters included:
| | (a) | | the nature and quality of the advisory, administrative, and other services provided to the Fund by the Investment Adviser and its affiliates, and the Designated Sub-Advisers, including, as applicable, information about: |
| | (i) | | the structure, staff, and capabilities of the Investment Adviser and the Designated Sub-Advisers and the Designated Sub-Advisers’ portfolio management teams; |
| | (ii) | | the groups within the Investment Adviser and its affiliates that support the portfolio management teams or provide other types of necessary services, including fund services groups (e.g., accounting and financial reporting, tax, shareholder services, and operations); controls and risk management groups (e.g., legal, compliance, valuation oversight, credit risk management, internal audit, compliance testing, market risk analysis, finance, and central funding); sales and distribution support groups, and others (e.g., information technology and training); |
| | (iii) | | trends in employee headcount; |
| | (iv) | | the Investment Adviser’s financial resources and ability to hire and retain talented personnel and strengthen its operations; and |
| | (v) | | the parent company’s support of the Investment Adviser and its mutual fund business, as expressed by the firm’s senior management; |
| | (b) | | information on the investment performance of the Fund, including comparisons to the performance of similar mutual funds, as provided by a third-party mutual fund data provider engaged as part of the contract review process (the “Outside Data Provider”), benchmark performance indices, and commingled investment vehicles with comparable investment strategies managed by the Investment Adviser, as well as general investment outlooks in the markets in which the Fund invests; |
| | (c) | | information provided by the Investment Adviser indicating the Investment Adviser’s views on whether the Fund’s peer group and/or benchmark index had high, medium, or low relevance given the Fund’s particular investment strategy; |
| | (d) | | the terms of the Agreements and other agreements with affiliated service providers entered into by the Trust on behalf of the Fund; |
| | (e) | | fee and expense information for the Fund, including: |
| | (i) | | the relative management fee and expense levels of the Fund as compared to those of comparable funds managed by other advisers, as provided by the Outside Data Provider; |
51
ACTIVE EQUITY MULTI-MANAGER FUNDS
Statement Regarding Basis for Approval of Management Agreement and Sub-Advisory Agreements (Unaudited) (continued)
| | (ii) | | the Fund’s expense trends over time; and |
| | (iii) | | comparative information on the advisory fees charged and services provided by the Investment Adviser to certain collective investment vehicles that it manages with comparable investment strategies; |
| | (f) | | with respect to the extensive investment performance and expense comparison data provided by the Outside Data Provider, its processes in producing that data for the Fund; |
| | (g) | | the undertakings of the Investment Adviser and its affiliates to implement fee waivers and/or expense limitations; |
| | (h) | | information relating to the profitability of the Management Agreement and the transfer agency arrangements of the Fund to the Investment Adviser and its affiliates; |
| | (i) | | whether the Fund’s existing management fee schedule adequately addressed any economies of scale; |
| | (j) | | a summary of the “fall-out” benefits derived by the Investment Adviser and its affiliates from their relationships with the Fund, including the fees received by the Investment Adviser’s affiliates from the Fund for transfer agency, portfolio trading, and other services; |
| | (k) | | a summary of potential benefits derived by the Fund as a result of its relationship with the Investment Adviser; |
| | (l) | | with respect to the Investment Adviser, portfolio manager ownership of Fund shares and the manner in which portfolio manager compensation is determined; information on the Designated Sub-Advisers’ compensation arrangements; and the number and types of accounts managed by the portfolio managers; |
| | (m) | | the nature and quality of the services provided to the Fund by its unaffiliated service providers (including the Designated Sub-Advisers), and the Investment Adviser’s general oversight and evaluation (including reports on due diligence) of those service providers as part of the services provided under the Management Agreement; and |
| | (n) | | the Investment Adviser’s and Designated Sub-Advisers’ processes and policies addressing various types of potential conflicts of interest; their approaches to risk management; the annual review of the effectiveness of the Fund’s compliance program; and periodic compliance reports. |
The Trustees also received an overview of the Funds’ distribution arrangements. They received information regarding the Funds’ assets and share purchase and redemption activity.
The presentations made at the Board and Committee meetings and at the Annual Meeting encompassed the Funds and other mutual funds for which the Board of Trustees has responsibility. In evaluating the Agreements at the Annual Meeting, the Trustees relied upon their knowledge, resulting from their meetings and other interactions throughout the year, of the Funds and the respective services of the Investment Adviser and its affiliates, and the Designated Sub-Advisers. In conjunction with these meetings, the Trustees received written materials and oral presentations on the topics covered, and the Investment Adviser addressed the questions and concerns of the Trustees, including concerns regarding the investment performance of certain of the funds they oversee. In addition, the Independent Trustees periodically received written materials and oral presentations from the funds’ various sub-advisers, including the Designated Sub-Advisers. The Independent Trustees were advised by their independent legal counsel regarding their responsibilities and other regulatory requirements related to the approval and continuation of mutual fund investment management agreements under applicable law. In addition, the Investment Adviser and its affiliates provided the Independent Trustees with a written response to a formal request for information sent on behalf of the Independent Trustees by their independent legal counsel. The Independent Trustees reviewed a written response prepared by each Designated Sub-Adviser to a similar request for information submitted to the Designated Sub-Adviser by the Investment Adviser. During the course of their deliberations, the Independent Trustees met in executive sessions with their independent legal counsel, without representatives of the Investment Adviser or its affiliates present.
Nature, Extent, and Quality of the Services Provided Under the Management Agreement
As part of their review, the Trustees considered the nature, extent, and quality of the services provided to the Funds by the Investment Adviser. In this regard, the Trustees considered both the investment advisory services and non-advisory services that are provided by the Investment Adviser and its affiliates. The Trustees noted the ongoing recruitment efforts aimed at bringing high quality investment talent to the Investment Adviser. They also noted the Investment Adviser’s commitment to maintaining high quality systems and expending substantial resources to respond to ongoing changes to the regulatory and control environment in which the Funds and their service providers operate, as well as the efforts of the Investment Adviser and its affiliates to combat cyber security risks. The Trustees concluded that the Investment Adviser continued to commit substantial financial and operational resources to the Funds and expressed confidence that the Investment Adviser would continue to do so in the future. The Trustees also recognized that the Investment Adviser had made significant commitments to address regulatory compliance requirements applicable to the Funds and the Investment Adviser and its affiliates. In addition, the Trustees reviewed the Sub-Adviser oversight
52
ACTIVE EQUITY MULTI-MANAGER FUNDS
Statement Regarding Basis for Approval of Management Agreement and Sub-Advisory Agreements (Unaudited) (continued)
process that the Investment Adviser had employed, which included areas such as investment analytics, risk management and compliance.
Investment Performance
The Trustees considered the investment performance of the Funds. In this regard, they compared the investment performance of each Fund to its peers using rankings and ratings compiled by the Outside Data Provider, and updated performance information prepared by the Investment Adviser using the peer groups identified by the Outside Data Provider. The Trustees also reviewed each Fund’s investment performance relative to its performance benchmark. As part of this review, they considered the investment performance trends of the Funds over time, and reviewed the investment performance of each Fund in light of its investment objective and policies and market conditions. The Trustees considered the Investment Adviser’s representations that each Fund had significant differences from its Outside Data Provider peer group that caused it to be an imperfect basis for comparison. The Trustees also compared the investment performance of each Fund to the performance of comparable unregistered funds for which the Investment Adviser also serves as investment adviser. They considered that the unregistered funds provide an imperfect performance comparison because they are not subject to the requirements of the Investment Company Act of 1940, as amended.
In addition, the Trustees considered materials prepared and presentations made by the Investment Adviser’s senior management and the Sub-Advisers’ portfolio management personnel in which Fund performance was assessed. The Trustees also considered the Investment Adviser’s periodic reports with respect to the Funds’ risk profiles, and how the Investment Adviser’s approach to risk monitoring and management influences portfolio management.
The Trustees noted that the Multi-Manager International Equity Fund’s Institutional Shares had placed in the second quartile of the Fund’s performance peer group, and had outperformed the Fund’s benchmark index for the one-year period ended March 31, 2018. They noted that the Multi-Manager U.S. Dynamic Equity Fund’s Institutional Shares had placed in the third quartile of the Fund’s performance peer group, and had underperformed the Fund’s benchmark index for the one-year period ended March 31, 2018. They noted that the Multi-Manager U.S. Small Cap Equity Fund’s Institutional Shares had placed in the second quartile of the Fund’s performance peer group, and had underperformed the Fund’s benchmark index for the one-year period ended March 31, 2018.
Costs of Services Provided and Competitive Information
The Trustees considered the contractual terms of the Management Agreement, the fee rates payable by each Fund thereunder, and the net amount retained by the Investment Adviser after payment of sub-advisory fees. In this regard, the Trustees considered information on the services rendered by the Investment Adviser to the Funds, which included both advisory and administrative services that were directed to the needs and operations of the Funds as registered mutual funds.
In particular, the Trustees reviewed the analyses prepared by the Outside Data Provider regarding the expense rankings of the Funds, as well as additional information provided by the Investment Adviser throughout the year. The analyses provided a comparison of each Fund’s management fee to those of a relevant peer group and category universe; an expense analysis which compared each Fund’s overall net and gross expenses to a peer group and a category universe; and data comparing each Fund’s net expenses to the peer and category medians. The analyses also compared each Fund’s transfer agency and custody fees, other expenses and fee waivers/reimbursements to those of the peer group and category medians. The Trustees also considered comparative fee information for services provided by the Investment Adviser to collective investment vehicles having investment objectives and policies similar to those of the Funds. They also noted that, in some cases, these collective investment vehicles have a compensation structure that includes performance fees and also pay additional asset-based fees and performance fees to the managers of underlying hedge funds. The Trustees considered that services provided to the Funds differed in various significant respects from the services provided to these collective investment vehicles, which generally operated under less stringent regulatory and financial reporting requirements, required fewer services from the Investment Adviser to a smaller number of client contact points, and were less time-sensitive. The Trustees concluded that the comparisons provided by the Outside Data Provider and the Investment Adviser were useful in evaluating the reasonableness of the management fees and total expenses paid by the Funds.
The Trustees considered the Investment Adviser’s undertaking to waive a portion of the management fee payable by each Fund. In this regard, the Trustees noted that the Investment Adviser’s institutional clients that are invested in the Funds pay a single management fee for the Investment Adviser’s management of their accounts, and that the Investment Adviser waives a portion of the management fee with respect to each Fund in order to achieve an effective net management fee rate that is equal to the actual cost of fees paid to the Fund’s sub-advisers. They also considered the Investment Adviser’s undertaking to limit each Fund’s “other expenses” ratio (excluding certain expenses) to a specified level. In addition, the Trustees noted that shareholders are
53
ACTIVE EQUITY MULTI-MANAGER FUNDS
Statement Regarding Basis for Approval of Management Agreement and Sub-Advisory Agreements (Unaudited) (continued)
able to redeem their Fund shares at any time if shareholders believe that the Fund fees and expenses are too high or if they are dissatisfied with the performance of the Fund.
The Investment Adviser’s Profitability
The Trustees reviewed each Fund’s contribution to the Investment Adviser’s revenues and pre-tax profit margins. In this regard the Trustees noted that they had received, among other things, profitability analyses and summaries, revenue and expense schedules by Fund and by function (i.e., investment management, transfer agency, and distribution and service), and information on the Investment Adviser’s expense allocation methodology. They observed that the profitability and expense figures are substantially similar to those used by the Investment Adviser for many internal purposes, including compensation decisions among various business groups, and are thus subject to a vigorous internal debate about how certain revenue and expenses should be allocated.
The Trustees also noted that the internal audit group within the Goldman Sachs organization had audited the expense allocation methodology and that the internal audit group was satisfied with the reasonableness, consistency, and accuracy of the Investment Adviser’s expense allocation methodology and profitability analysis calculations. Profitability data for each Fund was provided for 2017 and 2016, and the Trustees considered this information in relation to the Investment Adviser’s overall profitability.
Economies of Scale
The Trustees considered the information that had been provided regarding whether there have been economies of scale with respect to the management of the Funds. The Trustees considered that the Funds are offered to the Investment Adviser’s institutional clients as part of an investment model whereby the Funds and other funds act as core “building blocks” with which the client and the Investment Adviser form an investment strategy for the client’s portfolio. The Trustees considered the Investment Adviser’s representations that its clients benefit from this investment model with increased liquidity, increased investment oversight, access to new investment strategies, economies of scale, and reduced complexity in managing client portfolios. The Trustees noted that, pursuant to the model, clients pay a management fee for the Investment Adviser’s management of their accounts, and that the fund-level management fee in excess of the weighted average sub-advisory fees are waived in order to avoid charging two layers of management fees. The Trustees considered the amounts of assets in the Funds; the Funds’ recent share purchase and redemption activity; the information provided by the Investment Adviser relating to the costs of the services provided by the Investment Adviser and its affiliates and their realized profits (if any); information comparing fee rates charged by the Investment Adviser with fee rates charged to other funds in the peer groups; and the Investment Adviser’s undertakings to waive a portion of its management fee and to limit certain expenses of the Funds that exceed specified levels. The Independent Trustees also considered the relationship between the advisory and sub-advisory fee rate schedules.
Other Benefits to the Investment Adviser and Its Affiliates
The Trustees also considered the other benefits derived by the Investment Adviser and its affiliates from their relationships with the Funds, including: (a) transfer agency fees received by Goldman Sachs & Co. LLC (“Goldman Sachs”); (b) brokerage and futures commissions earned by Goldman Sachs for executing securities transactions (in its capacity as clearing broker) and futures transactions on behalf of the Funds; (c) the Investment Adviser’s ability to leverage the infrastructure designed to service the Funds on behalf of the Investment Adviser’s other clients; (d) the Investment Adviser’s ability to cross-market other products and services to Fund shareholders; (e) the Investment Adviser’s ability to negotiate better pricing with the Funds’ custodian on behalf of its other clients, as a result of the relationship with the Funds; and (f) the possibility that the working relationship between the Investment Adviser and the Funds’ third-party service providers (including the Sub-Advisers) may cause those service providers to be more likely to do business with other areas of Goldman Sachs. In the course of considering the foregoing, the Independent Trustees requested and received further information quantifying certain of these fall-out benefits.
Other Benefits to the Funds and Their Shareholders
The Trustees also noted that the Funds receive certain potential benefits as a result of their relationship with the Investment Adviser, including: (a) enhanced servicing from vendors because of the volume of business generated by the Investment Adviser and its affiliates; (b) the advantages received from the Investment Adviser’s knowledge and experience gained from managing other accounts and products; (c) the Investment Adviser’s ability to hire and retain qualified personnel to provide services to the Funds because of the reputation of the Goldman Sachs organization; (d) the Funds’ access, through the Investment Adviser, to certain firm-wide resources (e.g., proprietary risk management systems and databases), subject to certain restrictions; and (e) access to certain affiliated distribution channels.
54
ACTIVE EQUITY MULTI-MANAGER FUNDS
Statement Regarding Basis for Approval of Management Agreement and Sub-Advisory Agreements (Unaudited) (continued)
Conclusion
In connection with their consideration of the Management Agreement, the Trustees gave weight to various factors, but did not identify any particular factor as controlling their decision. After deliberation and consideration of the information provided, including the factors described above, the Trustees, including the Independent Trustees, unanimously concluded, in the exercise of their business judgment, that the investment management fees paid by each Fund were reasonable in light of the factors considered, and that the Management Agreement, and the terms thereof, should be approved and continued with respect to each Fund until August 31, 2019.
Designated Sub-Advisory Agreements
Nature, Extent, and Quality of the Services Provided Under the Designated Sub-Advisory Agreements and Performance
In evaluating the Designated Sub-Advisory Agreements, the Trustees relied upon materials furnished and presentations made by the Investment Adviser and the Designated Sub-Advisers. In evaluating the nature, extent, and quality of services provided by each Designated Sub-Adviser, the Trustees considered information on the services provided to the Funds by their respective Designated Sub-Advisers, including information about each Designated Sub-Adviser’s (a) personnel and compensation structure; (b) track record in managing the Fund and, if applicable, other funds and/or accounts with investment strategies similar to those employed on behalf of the Funds; (c) policies and procedures in place to address potential conflicts of interest; and (d) compliance program and code of ethics. In this regard, they also considered assessments provided by the Investment Adviser of each Designated Sub-Adviser, the Designated Sub-Adviser’s investment strategies and personnel, and its compliance program. The Trustees also reviewed the operations and investment performance of each Designated Sub-Adviser’s respective sleeve of the applicable Fund since its inception, including a comparison of each Designated Sub-Adviser to relevant benchmark indices based on various metrics, including realized beta, excess return, alpha, and volatility.
Costs of Services Provided
The Trustees reviewed the terms of each Designated Sub-Advisory Agreement, including the schedule of fees payable to the Designated Sub-Advisers. They considered any breakpoints in the sub-advisory fee rate payable under each Designated Sub-Advisory Agreement. The Trustees noted that the compensation paid to each Designated Sub-Adviser is paid by the Investment Adviser, not by the Funds. The Trustees considered that certain Designated Sub-Advisers had agreed to reduce their sub-advisory fee rate, which benefited shareholders of the applicable Funds in light of the existing management fee waiver arrangement. The Trustees reviewed the blended average of all sub-advisory fees paid by the Investment Adviser with respect to each Fund in light of the overall management fee paid by each Fund.
Conclusion
In connection with their consideration of the Designated Sub-Advisory Agreements, the Trustees gave weight to various factors, but did not identify any particular factor as controlling their decision. After deliberation and consideration of the information provided, including the factors described above, the Trustees, including the Independent Trustees, unanimously concluded, in the exercise of their business judgment, that the sub-advisory fees paid by the Investment Adviser to each Designated Sub-Adviser were reasonable in light of the factors considered, and that each Designated Sub-Advisory Agreement should be approved and continued until August 31, 2019.
New Sub-Advisory Agreement
In addition to the actions taken by the Trustees to approve the continuation of the Management Agreement and the Designated Sub-Advisory Agreements, upon the recommendation of the Investment Adviser, at a meeting held on September 12-13, 2018, the Trustees, including all of the Independent Trustees present, approved a sub-advisory agreement (the “New Sub-Advisory Agreement”) between the Investment Adviser and Vaughan Nelson Investment Management, L.P. (the “New Sub-Adviser”) on behalf of Multi-Manager U.S. Dynamic Equity Fund. In connection with their evaluation of the New Sub-Advisory Agreement, the Trustees received written materials and oral presentations prepared by the Investment Adviser and the New Sub-Adviser on the topics covered, and were advised by their independent legal counsel. In addition, the Trustees received information prepared by the New Sub-Adviser in a written response to a formal request from the Investment Adviser.
55
ACTIVE EQUITY MULTI-MANAGER FUNDS
Statement Regarding Basis for Approval of Management Agreement and Sub-Advisory Agreements (Unaudited) (continued)
Nature, Extent, and Quality of the Services to be Provided Under the New Sub-Advisory Agreement
In evaluating the New Sub-Advisory Agreement, the Trustees relied upon materials furnished and presentations made by the Investment Adviser and the New Sub-Adviser. In evaluating the nature, extent, and quality of services to be provided by the New Sub-Adviser, the Trustees considered information on the services to be provided to the Fund by the New Sub-Adviser, including information about the New Sub-Adviser’s (a) personnel and compensation structure; (b) track record in managing other funds and accounts, which have investment strategies similar to those to be employed on behalf of the Fund; (c) policies and procedures in place to address potential conflicts of interest; and (d) compliance program and code of ethics. In this regard, they also considered assessments provided by the Investment Adviser of the New Sub-Adviser, the New Sub-Adviser’s investment strategies and personnel, and its compliance program. They noted that, because the New Sub-Adviser had not previously provided services to the Fund, there was no performance information to evaluate with respect to the Fund.
Costs of Services to be Provided
The Trustees reviewed the terms of the New Sub-Advisory Agreement and the proposed fee schedule. They noted that the compensation paid to the New Sub-Adviser would be paid by the Investment Adviser, not by the Fund. They also noted that the terms of the New Sub-Advisory Agreement were the result of arm’s length negotiations between the Investment Adviser and the New Sub-Adviser. The Trustees reviewed the anticipated blended average of all sub-advisory fees to be paid by the Investment Adviser with respect to the Fund and how it would change upon hiring the New Sub-Adviser. They considered the Investment Adviser’s undertaking to waive the portion of its management fee which is in excess of the weighted average of the Funds’ sub-advisory fees.
Conclusion
In connection with their consideration of the New Sub-Advisory Agreement, the Trustees gave weight to various factors, but did not identify any particular factor as controlling their decision. After deliberation and consideration of the information provided, including the factors described above, the Trustees, including the Independent Trustees, unanimously concluded, in the exercise of their business judgment, that the sub-advisory fees to be paid by the Investment Adviser to the New Sub-Adviser were reasonable in light of the factors considered, and that the New Sub-Advisory Agreement, and the terms thereof, should be approved for a period of two years from its effective date.
56
ACTIVE EQUITY MULTI-MANAGER FUNDS
Trustees and Officers (Unaudited)
Independent Trustees
| | | | | | | | | | |
Name,
Address and Age1 | | Position(s) Held
with the Trust | | Term of
Office and
Length of
Time Served2 | | Principal Occupation(s)
During Past 5 Years | | Number of
Portfolios in
Fund Complex
Overseen by
Trustee3 | | Other
Directorships
Held by Trustee4 |
Cheryl K. Beebe Age: 62 | | Chair of the Board of Trustees | | Since 2017 (Trustee since 2015) | | Ms. Beebe is retired. She is Director, Convergys Corporation (2015-Present); Director, Packaging Corporation of America (2008-Present); and was formerly Executive Vice President, (2010-2014); and Chief Financial Officer, Ingredion, Inc. (a leading global ingredient solutions company) (2004-2014). Chair of the Board of Trustees — Goldman Sachs Trust II. | | 19 | | Convergys Corporation (a global leader in customer experience outsourcing); Packaging Corporation of America (producer of container board) |
Lawrence Hughes Age: 60 | | Trustee | | Since 2016 | | Mr. Hughes is retired. Formerly, he held senior management positions with BNY Mellon Wealth Management, a division of The Bank of New York Mellon Corporation (a financial services company) (1991-2015), most recently as Chief Executive Officer (2010-2015). He serves as Chairman of the Board of Directors, Ellis Memorial and Eldredge House (a not-for-profit organization) (2012-Present). Previously, Mr. Hughes served as an Advisory Board Member of Goldman Sachs Trust II (February 2016-April 2016). Trustee — Goldman Sachs Trust II. | | 19 | | None |
John F. Killian Age: 63 | | Trustee | | Since 2015 | | Mr. Killian is retired. He is Director, Consolidated Edison, Inc. (2007-Present); Director, Houghton Mifflin Harcourt Publishing Company (2011-Present); and formerly held senior management positions with Verizon Communications, Inc., including Executive Vice President and Chief Financial Officer (2009- 2010); and President, Verizon Business, Verizon Communications, Inc. (2005-2009). Trustee — Goldman Sachs Trust II. | | 19 | | Consolidated Edison, Inc. (a utility holding company); Houghton Mifflin Harcourt Publishing Company |
Steven D. Krichmar Age: 60 | | Trustee | | Since 2018 | | Mr. Krichmar is retired. Formerly, he held senior management and governance positions with Putnam Investments, LLC, a financial services company (2001-2016). He was most recently Chief of Operations and a member of the Operating Committee of Putnam Investments, LLC and Principal Financial Officer of The Putnam Funds. Previously, Mr. Krichmar served as an Audit Partner with PricewaterhouseCoopers LLP and its predecessor company (1990-2001). Trustee — Goldman Sachs Trust II. | | 19 | | None |
| | | | | | | | | | |
57
ACTIVE EQUITY MULTI-MANAGER FUNDS
Trustees and Officers (Unaudited) (continued)
Interested Trustee*
| | | | | | | | | | |
Name,
Address and Age1 | | Position(s) Held
with the Trust | | Term of
Office and
Length of
Time Served2 | | Principal Occupation(s)
During Past 5 Years | | Number of
Portfolios in
Fund Complex
Overseen by
Trustee3 | | Other
Directorships
Held by Trustee4 |
| James A. McNamara Age: 56 | | President and Trustee | | Since 2012 | | Advisory Director, Goldman Sachs (January 2018-Present); Managing Director, Goldman Sachs (January 2000-December 2017); Director of Institutional Fund Sales, GSAM (April 1998-December 2000); and Senior Vice President and Manager, Dreyfus Institutional Service Corporation (January 1993- April 1998). President and Trustee — Goldman Sachs Trust II; Goldman Sachs Trust; Goldman Sachs Variable Insurance Trust; Goldman Sachs MLP Income Opportunities Fund; Goldman Sachs MLP and Energy Renaissance Fund; Goldman Sachs ETF Trust; Goldman Sachs Private Markets Fund 2018 LLC; Goldman Sachs Private Markets Fund 2018 (A) LLC; and Goldman Sachs Private Markets Fund 2018 (B) LLC. | | 154 | | None |
| | | | | | | | | | |
| * | | Mr. McNamara is considered to be an “Interested Trustee” because he holds positions with Goldman Sachs and owns securities issued by The Goldman Sachs Group, Inc. He holds comparable positions with certain other companies of which Goldman Sachs, GSAM or an affiliate thereof is the investment adviser, administrator and/or distributor. |
| 1 | | Each Trustee may be contacted by writing to the Trustee, c/o Goldman Sachs, 200 West Street, New York, New York, 10282, Attn: Caroline Kraus. Information is provided as of October 31, 2018. |
| 2 | | Subject to such policies as may be adopted by the Board from time-to-time, each Trustee holds office for an indefinite term, until the earliest of: (a) the election of his or her successor; (b) the date the Trustee resigns or is removed by the Board or shareholders, in accordance with the Trust’s Declaration of Trust; or (c) the termination of the Trust. The Board has adopted policies which provide that (a) no Trustee shall hold office for more than 15 years and (b) a Trustee shall retire as of December 31st of the calendar year in which he or she reaches his or her 74th birthday, unless a waiver of such requirement shall have been adopted by a majority of the other Trustees. These policies may be changed by the Trustees without shareholder vote. |
| 3 | | The Goldman Sachs Fund Complex includes certain other companies listed above for each respective Trustee. As of October 31, 2018, Goldman Sachs Trust II consisted of 19 portfolios (17 of which offered shares to the public); Goldman Sachs Trust consisted of 89 portfolios (88 of which offered shares to the public); Goldman Sachs Variable Insurance Trust consisted of 13 portfolios; Goldman Sachs MLP Income Opportunities Fund, Goldman Sachs MLP and Energy Renaissance Fund, Goldman Sachs Private Markets Fund 2018 LLC, Goldman Sachs Private Markets Fund 2018 (A) LLC and Goldman Sachs Private Markets Fund 2018 (B) LLC each consisted of one portfolio; and Goldman Sachs ETF Trust consisted of 28 portfolios (14 of which offered shares to the public). |
| 4 | | This column includes only directorships of companies required to report to the Securities and Exchange Commission under the Securities Exchange Act of 1934 (i.e., “public companies”) or other investment companies registered under the Act. |
Additional information about the Trustees is available in the Funds’ Statement of Additional Information, which can be obtained from Goldman Sachs free of charge by calling this toll-free number (in the United States of America): 1-800-526-7384.
58
ACTIVE EQUITY MULTI-MANAGER FUNDS
Trustees and Officers (Unaudited) (continued)
Officers of the Trust*
| | | | | | |
| Name, Address and Age1 | | Position(s) Held
with the Trust | | Term of
Office and
Length of
Time Served2 | | Principal Occupation(s) During Past 5 Years |
James A. McNamara 200 West Street New York, NY 10282 Age: 56 | | Trustee and President | | Since 2012 | | Advisory Director, Goldman Sachs (January 2018-Present); Managing Director, Goldman Sachs (January 2000-December 2017); Director of Institutional Fund Sales, GSAM (April 1998-December 2000); and Senior Vice President and Manager, Dreyfus Institutional Service Corporation (January 1993-April 1998). President and Trustee — Goldman Sachs Trust II; Goldman Sachs Trust; Goldman Sachs Variable Insurance Trust; Goldman Sachs MLP Income Opportunities Fund; Goldman Sachs MLP and Energy Renaissance Fund; Goldman Sachs ETF Trust; Goldman Sachs Private Markets Fund 2018 LLC; Goldman Sachs Private Markets Fund 2018 (A) LLC; and Goldman Sachs Private Markets Fund 2018 (B) LLC. |
Caroline L. Kraus 200 West Street New York, NY 10282 Age: 41 | | Secretary | | Since 2012 | | Managing Director, Goldman Sachs (January 2016-Present); Vice President, Goldman Sachs (August 2006-December 2015); Associate General Counsel, Goldman Sachs (2012-Present); Assistant General Counsel, Goldman Sachs (August 2006-December 2011); and Associate, Weil, Gotshal & Manges, LLP (2002-2006). Secretary — Goldman Sachs Trust II; Goldman Sachs Trust (previously Assistant Secretary (2012)); Goldman Sachs Variable Insurance Trust (previously Assistant Secretary (2012)); Goldman Sachs BDC, Inc.; Goldman Sachs Private Middle Market Credit LLC; Goldman Sachs Middle Market Lending Corp.; Goldman Sachs MLP Income Opportunities Fund; Goldman Sachs MLP and Energy Renaissance Fund; Goldman Sachs ETF Trust; Goldman Sachs Private Markets Fund 2018 LLC; Goldman Sachs Private Markets Fund 2018 (A) LLC; and Goldman Sachs Private Markets Fund 2018 (B) LLC. |
Scott M. McHugh 200 West Street New York, NY 10282 Age: 47 | | Treasurer, Senior Vice President and Principal Financial Officer | | Since 2012 (Principal Financial Officer since 2013) | | Managing Director, Goldman Sachs (January 2016-Present); Vice President, Goldman Sachs (February 2007-December 2015); Assistant Treasurer of certain mutual funds administered by DWS Scudder (2005-2007); and Director (2005-2007), Vice President (2000-2005), and Assistant Vice President (1998-2000), Deutsche Asset Management or its predecessor (1998-2007). Treasurer, Senior Vice President and Principal Financial Officer — Goldman Sachs Trust II; Goldman Sachs Trust; Goldman Sachs Variable Insurance Trust; Goldman Sachs MLP Income Opportunities Fund; Goldman Sachs MLP and Energy Renaissance Fund; Goldman Sachs ETF Trust; Goldman Sachs Private Markets Fund 2018 LLC; Goldman Sachs Private Markets Fund 2018 (A) LLC; and Goldman Sachs Private Markets Fund 2018 (B) LLC. |
Joseph F. DiMaria 30 Hudson Street Jersey City, NJ 07302 Age: 50 | | Assistant Treasurer and Principal Accounting Officer | | Since 2017 | | Managing Director, Goldman Sachs (November 2015-Present) and Vice President — Mutual Fund Administration, Columbia Management Investment Advisers, LLC (May 2010-October 2015). Assistant Treasurer and Principal Accounting Officer — Goldman Sachs Trust II; Goldman Sachs Trust; Goldman Sachs Variable Insurance Trust; Goldman Sachs MLP Income Opportunities Fund; Goldman Sachs MLP and Energy Renaissance Fund; Goldman Sachs ETF Trust; Goldman Sachs Private Markets Fund 2018 LLC; Goldman Sachs Private Markets Fund 2018 (A) LLC; and Goldman Sachs Private Markets Fund 2018 (B) LLC. |
| | | | | | |
| * | | Represents a partial list of officers of the Trust. Additional information about all the officers is available in the Funds’ Statement of Additional Information, which can be obtained from Goldman Sachs free of charge by calling this toll-free number (in the United States): 1-800-526-7384. |
| 1 | | Information is provided as of October 31, 2018. |
| 2 | | Officers hold office at the pleasure of the Board of Trustees or until their successors are duly elected and qualified. Each officer holds comparable positions with certain other companies of which Goldman Sachs, GSAM or an affiliate thereof is the investment adviser, administrator and/or distributor. |
59
ACTIVE EQUITY MULTI-MANAGER FUNDS
Goldman Sachs Trust II — Active Equity Multi-Manager Funds — Tax Information (Unaudited)
For the year ended October 31, 2018, 0.05 %, 73.64% and 39.30 % of the dividends paid from net investment company taxable income by the Multi-Manager International Equity, Multi-Manager U.S. Dynamic Equity, and Multi-Manager U.S. Small Cap Equity Funds qualify for the dividends received deduction available to corporations.
For the year ended October 31, 2018 100%, 100% and 38.30% of the dividends paid from net investment company taxable income by the Multi-Manager International Equity, Multi-Manager U.S. Dynamic Equity, and Multi-Manager U.S. Small Cap Equity Funds qualify for the reduced tax rate under the Jobs and Growth Tax Relief and Reconciliation Act of 2003.
Pursuant to Section 852 of the Internal Revenue Code, the Multi-Manager International Equity, Multi-Manager U.S. Dynamic Equity, and Multi-Manager U.S. Small Cap Equity Funds designate $3,919, $3,815,811 and $1,945,146 or if different, the maximum amount allowable, as capital gain dividends paid during the fiscal year ended October 31, 2018.
From distributions paid during the year ended October 31, 2018, the total amount of income received by the Multi-Manager International Equity Fund from sources within foreign countries and possessions of the United States was $0.1808 per share, all of which is attributable to qualified passive income. The percentage of net investment income dividends paid from foreign sources by the Multi-Manager International Equity Fund was 94.51%. The total amount of taxes paid by the Multi-Manager International Equity Fund was $0.0194 per share.
During the fiscal year ended October 31, 2018, the Multi-Manager U.S. Small Cap Equity Fund designated $1,961,471 as short-term capital gain dividends pursuant to Section 871(k) of the Internal Revenue Code.
60
FUNDS PROFILE
Goldman Sachs Funds
Goldman Sachs is a premier financial services firm, known since 1869 for creating thoughtful and customized investment solutions in complex global markets.
Today, the Investment Management Division of Goldman Sachs serves a diverse set of clients worldwide, including private institutions, public entities and individuals. With approximately $1.34 trillion in assets under supervision as of September 30, 2018, Goldman Sachs Asset Management (“GSAM”) has portfolio management teams located around the world and our investment professionals bring firsthand knowledge of local markets to every investment decision. Assets under supervision includes assets under management and other client assets for which Goldman Sachs does not have full discretion. GSAM leverages the resources of Goldman Sachs & Co. LLC subject to legal, internal and regulatory restrictions.
Money Market
Financial Square FundsSM
| ∎ | | Financial Square Treasury Solutions Fund1 |
| ∎ | | Financial Square Government Fund1 |
| ∎ | | Financial Square Money Market Fund2 |
| ∎ | | Financial Square Prime Obligations Fund2 |
| ∎ | | Financial Square Treasury Instruments Fund1 |
| ∎ | | Financial Square Treasury Obligations Fund1 |
| ∎ | | Financial Square Federal Instruments Fund1 |
Investor FundsSM
| ∎ | | Investor Money Market Fund3 |
| ∎ | | Investor Tax-Exempt Money Market Fund3 |
Fixed Income
Short Duration and Government
| ∎ | | High Quality Floating Rate Fund |
| ∎ | | Short-Term Conservative Income Fund |
| ∎ | | Short Duration Government Fund |
| ∎ | | Short Duration Income Fund |
| ∎ | | Inflation Protected Securities Fund |
Multi-Sector
Municipal and Tax-Free
| ∎ | | High Yield Municipal Fund |
| ∎ | | Dynamic Municipal Income Fund |
| ∎ | | Short Duration Tax-Free Fund |
Single Sector
| ∎ | | Investment Grade Credit Fund |
| ∎ | | High Yield Floating Rate Fund |
| ∎ | | Emerging Markets Debt Fund |
| ∎ | | Local Emerging Markets Debt Fund |
| ∎ | | Total Emerging Markets Income Fund |
Fixed Income Alternatives
| ∎ | | Long Short Credit Strategies Fund |
Fundamental Equity
| ∎ | | Small/Mid Cap Value Fund |
| ∎ | | Small/Mid Cap Growth Fund |
| ∎ | | Concentrated Growth Fund |
| ∎ | | Technology Opportunities Fund |
| ∎ | | Growth Opportunities Fund |
| ∎ | | Rising Dividend Growth Fund |
Tax-Advantaged Equity
| ∎ | | U.S. Tax-Managed Equity Fund |
| ∎ | | International Tax-Managed Equity Fund |
| ∎ | | U.S. Equity Dividend and Premium Fund |
| ∎ | | International Equity Dividend and Premium Fund |
Equity Insights
| ∎ | | Small Cap Equity Insights Fund |
| ∎ | | U.S. Equity Insights Fund |
| ∎ | | Small Cap Growth Insights Fund |
| ∎ | | Large Cap Growth Insights Fund |
| ∎ | | Large Cap Value Insights Fund |
| ∎ | | Small Cap Value Insights Fund |
| ∎ | | International Small Cap Insights Fund |
| ∎ | | International Equity Insights Fund |
| ∎ | | Emerging Markets Equity Insights Fund |
Fundamental Equity International
| ∎ | | International Equity Income Fund4 |
| ∎ | | International Equity ESG Fund5 |
| ∎ | | Emerging Markets Equity Fund |
| ∎ | | ESG Emerging Markets Equity Fund |
Select Satellite
| ∎ | | Real Estate Securities Fund |
| ∎ | | International Real Estate Securities Fund |
| ∎ | | Commodity Strategy Fund |
| ∎ | | Global Real Estate Securities Fund |
| ∎ | | Alternative Premia Fund |
| ∎ | | Absolute Return Tracker Fund |
| ∎ | | Managed Futures Strategy Fund |
| ∎ | | MLP Energy Infrastructure Fund |
| ∎ | | Multi-Manager Alternatives Fund |
| ∎ | | Absolute Return Multi-Asset Fund |
| ∎ | | Global Infrastructure Fund |
Total Portfolio Solutions
| ∎ | | Global Managed Beta Fund |
| ∎ | | Multi-Manager Non-Core Fixed Income Fund |
| ∎ | | Multi-Manager U.S. Dynamic Equity Fund |
| ∎ | | Multi-Manager Global Equity Fund |
| ∎ | | Multi-Manager International Equity Fund |
| ∎ | | Tactical Tilt Overlay Fund |
| ∎ | | Balanced Strategy Portfolio |
| ∎ | | Multi-Manager U.S. Small Cap Equity Fund |
| ∎ | | Multi-Manager Real Assets Strategy Fund |
| ∎ | | Growth and Income Strategy Portfolio |
| ∎ | | Growth Strategy Portfolio |
| ∎ | | Equity Growth Strategy Portfolio |
| ∎ | | Satellite Strategies Portfolio |
| ∎ | | Enhanced Dividend Global Equity Portfolio |
| ∎ | | Tax-Advantaged Global Equity Portfolio |
| ∎ | | Strategic Factor Allocation Fund |
| ∎ | | Target Date 2020 Portfolio |
| ∎ | | Target Date 2025 Portfolio |
| ∎ | | Target Date 2030 Portfolio |
| ∎ | | Target Date 2035 Portfolio |
| ∎ | | Target Date 2040 Portfolio |
| ∎ | | Target Date 2045 Portfolio |
| ∎ | | Target Date 2050 Portfolio |
| ∎ | | Target Date 2055 Portfolio |
| ∎ | | Target Date 2060 Portfolio |
| ∎ | | GQG Partners International Opportunities Fund |
| 1 | | You could lose money by investing in the Fund. Although the Fund seeks to preserve the value of your investment at $1.00 per share, it cannot guarantee it will do so. An investment in the Fund is not a deposit of a bank and is not insured or guaranteed by the Federal Deposit Insurance Corporation or any other government agency. The Fund’s sponsor has no legal obligation to provide financial support to the Fund, and you should not expect that the sponsor will provide financial support to the Fund at any time. |
| 2 | | You could lose money by investing in the Fund. Because the share price of the Fund will fluctuate, when you sell your shares they may be worth more or less than what you originally paid for them. The Fund may impose a fee upon sale of your shares or may temporarily suspend your ability to sell shares if the Fund’s liquidity falls below required minimums because of market conditions or other factors. An investment in the Fund is not a deposit of a bank and is not insured or guaranteed by the Federal Deposit Insurance Corporation or any other government agency. The Fund’s sponsor has no legal obligation to provide financial support to the Fund, and you should not expect that the sponsor will provide financial support to the Fund at any time. |
| 3 | | You could lose money by investing in the Fund. Although the Fund seeks to preserve the value of your investment at $1.00 per share, it cannot guarantee it will do so. The Fund may impose a fee upon sale of your shares or may temporarily suspend your ability to sell shares if the Fund’s liquidity falls below required minimums because of market conditions or other factors. An investment in the Fund is not a deposit of a bank and is not insured or guaranteed by the Federal Deposit Insurance Corporation or any other government agency. The Fund’s sponsor has no legal obligation to provide financial support to the Fund, and you should not expect that the sponsor will provide financial support to the Fund at any time. |
| 4 | | Effective after the close of business on February 27, 2018, the Goldman Sachs Strategic International Equity Fund was renamed the Goldman Sachs International Equity Income Fund. |
| 5 | | Effective after the close of business on February 27, 2018, the Goldman Sachs Focused International Equity Fund was renamed the Goldman Sachs International Equity ESG Fund. |
| | | Financial Square FundsSM and Investor FundsSM are registered service marks of Goldman Sachs & Co. LLC. |
| *This | | list covers open-end funds only. Please visit our website at www.GSAMFUNDS.com to learn about our closed-end funds and exchange-traded funds. |
| | |
TRUSTEES Cheryl K. Beebe, Chair Lawrence Hughes John F. Killian Steven D. Krichmar James A. McNamara | | OFFICERS James A. McNamara, President Scott M. McHugh, Treasurer, Senior Vice President and Principal Financial Officer Joseph F. DiMaria, Assistant Treasurer and Principal Accounting Officer Caroline L. Kraus, Secretary |
| |
GOLDMAN SACHS & CO. LLC Distributor and Transfer Agent | | GOLDMAN SACHS ASSET MANAGEMENT, L.P. Investment Adviser |
Visit our website at www.GSAMFUNDS.com to obtain the most recent month-end returns.
Goldman Sachs Asset Management, L.P. 200 West Street, New York, New York 10282
The reports concerning the Funds included in this shareholder report may contain certain forward-looking statements about the factors that may affect the performance of the Funds in the future. These statements are based on the Funds’ managements’ predictions and expectations concerning certain future events and their expected impact on the Funds, such as performance of the economy as a whole and of specific industry sectors, changes in the levels of interest rates, the impact of developing world events, and other factors that may influence the future performance of the Funds. Management believes these forward-looking statements to be reasonable, although they are inherently uncertain and difficult to predict. Actual events may cause adjustments in portfolio management strategies from those currently expected to be employed.
A description of the policies and procedures that the Funds use to determine how to vote proxies relating to portfolio securities and information regarding how the Funds voted proxies relating to portfolio securities for the most recent 12-month period ended June 30, are available (I) without charge, upon request by calling 1-800-621-2550; and (II) on the Securities and Exchange Commission (“SEC’’) web site at http://www.sec.gov.
The Funds file their complete schedules of portfolio holdings with the SEC for the first and third quarters of each fiscal year on Form N-Qs. A Fund’s Form N-Qs are available on the SEC’s web site at http://www.sec.gov within 60 days after the Fund’s first and third fiscal quarters. Form N-Qs may be obtained upon request and without charge by calling 1-800-621-2550.
Fund holdings and allocations shown are unaudited, and may not be representative of current or future investments. Fund holdings and allocations may not include a Fund’s entire investment portfolio, which may change at any time. Fund holdings should not be relied on in making investment decisions and should not be construed as research or investment advice regarding particular securities. Current and future holdings are subject to risk.
The Global Industry Classification Standard (GICS) was developed by and is the exclusive property and a service mark of Morgan Stanley Capital International Inc. (MSCI) and Standard & Poor’s, a division of The McGraw-Hill Companies, Inc. (S&P) and is licensed for use by Goldman Sachs. Neither MSCI, S&P nor any other party involved in making or compiling the GICS or any GICS classifications makes any express or implied warranties or representations with respect to such standard or classification (or the results to be obtained by the use thereof), and all such parties hereby expressly disclaim all warranties of originality, accuracy, completeness, merchantability or fitness for a particular purpose with respect to any of such standard or classification. Without limiting any of the foregoing, in no event shall MSCI, S&P, any of their affiliates or any third party involved in making or compiling the GICS or any GICS classifications have any liability for any direct, indirect, special, punitive, consequential or any other damages (including lost profits) even if notified of the possibility of such damages.
The portfolio risk management process includes an effort to monitor and manage risk, but does not imply low risk.
Fund holdings and allocations shown are as of October 31, 2018 and may not be representative of future investments. Fund holdings should not be relied on in making investment decisions and should not be construed as research or investment advice regarding particular securities. Current and future holdings are subject to risk.
This material is not authorized for distribution to prospective investors unless preceded or accompanied by a current Prospectus or summary prospectus, if applicable. Investors should consider a Fund’s objective, risks, and charges and expenses, and read the summary prospectus, if available, and/or the Prospectus carefully before investing or sending money. The summary prospectus, if available, and the Prospectus contain this and other information about a Fund and may be obtained from your authorized dealer or from Goldman Sachs & Co. LLC by calling 1-800-621-2550.
© 2018 Goldman Sachs. All rights reserved. 151914-OTU-889054 MMGRFDSAR-18/162
Goldman Sachs Funds

| | | | |
| | |
| Annual Report | | | | October 31, 2018 |
| | |
| | | | GQG Partners International
Opportunities Fund |

Goldman Sachs GQG Partners International Opportunities Fund
| | | | |
| | | |
| NOT FDIC-INSURED | | May Lose Value | | No Bank Guarantee |
PORTFOLIO RESULTS
Goldman Sachs GQG Partners International Opportunities Fund
Investment Objective
The Fund seeks long-term capital appreciation.
Portfolio Management Discussion and Analysis
Below, the portfolio management team of GQG Partners LLC, the Goldman Sachs GQG Partners International Opportunities Fund’s (the “Fund”) sub-adviser, discusses the Fund’s performance and positioning for the 12-month period ended October 31, 2018 (the “Reporting Period”).
| Q | | How did the Fund perform during the Reporting Period? |
| A | | During the Reporting Period, the Fund’s Class A, C, Institutional, Investor, R and R6 Shares generated average annual total returns, without sales charges, of -2.92%, -3.57%, -2.52%, -2.64%, -3.16% and -2.52%, respectively. These returns compare to the -8.24% average annual total return of the Fund’s benchmark, the MSCI ACWI ex USA Index (Net, Unhedged) (the “Index”), during the same time period. |
| | From their inception on April 16, 2018 through the end of the Reporting Period, the Fund’s Class P Shares generated a cumulative total return of -5.92% compared to the -11.13% cumulative total return of the Index. |
| Q | | What economic and market factors most influenced the Fund during the Reporting Period? |
| A | | During the Reporting Period, non-U.S. developed markets equities and emerging markets equities produced negative returns, with non-U.S. developed markets equities generally outperforming emerging markets equities. |
| | As the Reporting Period began in November 2017, the returns of non-U.S. developed markets equities were relatively muted, particularly amongst larger companies. The U.K., however, performed better than many other developed markets. Although the U.K. Prime Minister suffered a defeat in the House of Commons over the European Union Withdrawal Bill in December 2017, the U.K. was judged by the European Union to have made sufficient progress on key issues to allow the next phase of Brexit negotiations — including discussions on trade — to begin. (Brexit refers to the U.K.’s efforts to leave the European Union.) Meanwhile, a robust third calendar quarter corporate earnings reporting season was a positive driver for emerging markets equities, despite a pullback from a global technology sell-off. A weaker U.S. dollar and commodities strength also helped emerging markets equities close out calendar year 2017 with a healthy total return. In December 2017, the U.S. Federal Reserve (the “Fed”) delivered its third interest rate hike of 2017, as had been widely expected, and maintained its projections for three additional interest rate hikes in 2018. |
| | Non-U.S. developed markets equities enjoyed a strong start to 2018, driven by market exuberance about strong economic data, the $1.5 trillion U.S. tax reform plan passed by Congress and signed into law by the President in December 2017 and the favorable start of the corporate earnings reporting season. Emerging markets equities also advanced, buoyed by a strong global economic backdrop, rising oil prices and a softer U.S. dollar. In February 2018, however, equities sold off globally on market speculation of a faster pace of interest rate hikes by the Fed, which stoked a sharp rise in bond yields and in equity market volatility. Concerns about monetary policy tightening were further exacerbated by solid U.S. labor and inflation data. While the hawkish Fed minutes released were largely expected, Fed Chair Jerome Powell’s Congressional testimony surprised markets with its hawkish tilt, sparking another sell-off. (Hawkish tends to suggest higher interest rates; opposite of dovish.) In March 2018, escalating trade tensions and tariffs weighed on investor sentiment and on global equity market performance. The same month, the Fed delivered on a consensus-expected interest rate increase, with its projections continuing to point to three interest rate hikes this calendar year. |
| | During the second calendar quarter overall, non-U.S. developed markets equities and emerging markets equities declined. In April 2018, non-U.S. developed markets equities were comparatively muted, as the U.S. and China generated trade headlines and geopolitical uncertainty stemming from sanctions on Russia surfaced. May 2018 was a volatile month for non-U.S. developed markets equities amid further |
1
PORTFOLIO RESULTS
| | political and protectionism concerns, including Italian political turmoil, ongoing unpredictability around the U.S.-North Korea summit and escalating trade tensions. The Fed’s interest rate hike in June 2018 was largely expected, but the outcome of the meeting was slightly hawkish. Still-escalating trade tension between the U.S. and China hurt market sentiment, with the U.S. threatening tariffs on an additional $200 billion worth of Chinese goods and China vowing to retaliate. Meanwhile, emerging markets equities suffered their first quarterly loss since 2016 during the second quarter of 2018, as headwinds from U.S.-China trade wars, a stronger U.S. dollar and rising U.S. Treasury yields negatively affected sentiment. Investor concern also increased with more focus on the technology sector given ongoing discussion around the regulatory environment, rising geopolitical risks surrounding North Korea and Syria, and the announcement of additional sanctions on Russia. |
| | Volatility remained high for non-U.S. developed markets equities and emerging markets equities during the third quarter of 2018, driven both by the trade rhetoric between the U.S. and China and other key U.S. allies and by strong U.S. macroeconomic data relative to other markets. Within non-U.S. developed markets equities, European stocks ended the quarter in positive territory, supported by resilient macroeconomic data and a constructive environment for European companies. Despite this, a number of factors weighed on investor sentiment, including trade tensions and protectionism, uncertainty about Italy’s 2019 budget, the risk of a no-deal Brexit, and concerns that Turkey’s financial crisis could spread to other markets. As for emerging markets equities, they advanced in July 2018 after five consecutive months of declines but resumed their descent in August and September. They closed the third quarter of 2018 with rather flat returns overall, as heightened risk aversion, escalating trade tensions and tightening global liquidity dominated headlines. |
| | October 2018 was a difficult and volatile month for equities around the world. Such volatility was driven by various factors, including a delayed response to the rise in global interest rates early in the month, a moderation of economic growth expectations, hawkish rhetoric from Fed policymakers, and concerns around global trade expressed in third quarter 2018 corporate earnings guidance. Chinese equities faced additional headwinds from signs of a domestic economic slowdown to 6.5% year over year in the third quarter of 2018 compared to a 6.8% average year over year growth rate in the first half of 2018, slightly below the 6.6% consensus estimate. In response, Chinese regulators introduced multi-pronged policy measures to stimulate domestic demand. |
| Q | | What key factors were responsible for the Fund’s performance during the Reporting Period? |
| A | | While the Fund posted negative absolute returns, it significantly outperformed the Index during the Reporting Period. Security selection contributed most positively to the Fund’s relative returns during the Reporting Period. Asset allocation decisions also added to performance. |
| Q | | Which equity market sectors and countries most significantly affected Fund performance? |
| A | | During the Reporting Period, the Fund benefited from security selection in the financials sector, led by investments in Deutsche Bourse, a German financial exchange; Ping An Insurance, a China-based insurance company; Macquarie Group, an Australia-headquartered asset manager; and London Stock Exchange Group, a U.K. financial exchange. Stocks picks in information technology, such as U.S. payment processors Mastercard and Visa, also contributed positively. Security selection and an underweight in the industrials sector further bolstered performance. Conversely, the Fund was hurt by its large underweight in the energy sector, where it held only one stock, i.e., British-Dutch oil and gas company Royal Dutch Shell. As commodity prices rose during the Reporting Period, such positioning detracted. Within the consumer staples sector, the Fund was hampered by its investments in the beverage industry, including Anheuser-Busch InBev, a Belgium-based drink and brewing company; Coca-Cola Hellenic Bottling Company, a Switzerland-headquartered bottler; Diageo, a U.K.-based producer of spirits, beer and wine; and Heineken, a Dutch brewer. An underweight in the utilities sector also detracted from the Fund’s relative performance. |
| | With regards to countries, the Fund’s exposure to the U.S. was the largest positive contributor to relative returns. Top performers included U.S. electronic payment providers Mastercard and Visa. Exposure to Germany and China also added to returns. On the other hand, the Fund’s allocation to Russia, highlighted by notable individual detractor Yandex, a Russian provider of Internet-related services and products, hurt performance. Exposure to Switzerland and Belgium also detracted from the Fund’s returns. |
| Q | | What were some of the Fund’s best-performing individual stocks during the Reporting Period? |
| A | | Among the Fund’s best-performing individual holdings were Mastercard, Deutsche Bourse and Visa, each mentioned earlier. |
2
PORTFOLIO RESULTS
| | Both Mastercard and Visa posted double-digit gains during the Reporting Period on better than consensus expected earnings. |
| | Deutsche Bourse benefited from the increase in market volatility during the Reporting Period, as such volatility boosted trading activity. |
| Q | | Which stocks detracted most from the Fund’s relative performance during the Reporting Period? |
| A | | Coca-Cola Hellenic Bottling Company, Yandex and ASML Holding were the Fund’s weakest individual performers during the Reporting Period. |
| | Shares of Coca-Cola Hellenic Bottling Company, mentioned earlier, were pressured by weaker than consensus expected earnings, as economic growth slowed in Europe and the emerging markets. |
| | Yandex, also mentioned earlier, experienced a share price decline along with other Russian stocks in the wake of U.S. economic sanctions, which were imposed during April 2018. We eliminated the Fund’s position in this provider of Internet-related services and products by the end of April. |
| | Despite stronger than market expected earnings, Netherlands-based ASML Holding, which supplies photolithographic equipment for the semiconductor industry, saw its share price retreat amid broad declines in the information technology sector during the final months of the Reporting Period. We, in turn, trimmed the Fund’s position in ASML Holding. |
| Q | | Were there any significant purchases or sales during the Reporting Period? |
| A | | Among notable transactions during the Reporting Period was our decision to exit all of the Fund’s investments in Russia due to the U.S.-imposed sanctions on the country. None of the Fund’s holdings were targeted by the U.S. government, but we decided to take this action because of the changing dimension of risk, i.e., what we considered a potentially catastrophic loss of capital. |
| Q | | What changes were made to the Fund’s sector and country weightings during the Reporting Period? |
| A | | In terms of sector weightings, we reduced the Fund’s exposure to communication services because of a structural change in the regulatory environment for some of the sector’s key companies. (Near the end of September 2018, the telecommunications services sector was renamed the communication services sector and was broadened to include certain companies from the information technology and consumer discretionary sectors that facilitate communication and offer related content and information through various media.) Also during the Reporting Period, we increased the Fund’s exposure to consumer staples, shifting from an underweight position relative to the Index to an overweight, because we thought valuations were starting to look compelling and growth had begun to pick up across certain market segments, such as beverages and spirits. |
| | Regarding countries, the Fund increased its exposure to Japanese equities through select investments, as valuations began to look attractive, in our view, following a sell-off in Japan’s stock market. As mentioned previously, we eliminated the Fund’s exposure to Russia after the U.S. imposed economic sanctions. |
| Q | | How did the Fund use derivatives and similar instruments during the Reporting Period? |
| A | | Forward foreign exchange contracts were used during the Reporting Period as part of the standard process of buying and selling non-U.S. securities in their local currency. The use of forward foreign exchange contracts did not have a material impact on the Fund’s performance. |
| Q | | How was the Fund positioned relative to its benchmark index at the end of the Reporting Period? |
| A | | The Fund was overweight relative to the Index in the consumer staples, information technology, financials, health care and materials sectors at the end of the Reporting Period. It was underweight the real estate, utilities, industrials, energy and consumer discretionary sectors. The Fund was rather neutral compared to the Index in the communication services sector at the end of the Reporting Period. |
| | In terms of countries, the Fund had significant exposure to the U.S., which had no weighting in the Index at the end of the Reporting Period. It was overweight relative to the Index in France, Hong Kong, India, Switzerland, the U.K., Germany, the Netherlands and Australia. Compared to the Index, the Fund was significantly underweight Japan. It was also underweight Canada, China, Taiwan, Sweden, Brazil, Italy and South Korea. At the end of the Reporting Period, the Fund was rather neutrally weighted in the other countries comprising the Index. |
3
PORTFOLIO RESULTS
| Q | | What is the Fund’s tactical view and strategy for the months ahead? |
| A | | At the end of the Reporting Period, we believed international equities broadly were a compelling opportunity given the difference in their valuations relative to U.S. stocks. That said, we thought that higher global interest rates were likely to impact economic growth and, therefore, stocks with higher multiples. Consequently, we planned to maintain the Fund’s reduced exposure to cyclical stocks, while increasing its investments in companies with what we saw as stable earnings streams. This meant the Fund’s beta (i.e., its sensitivity to broad market returns) was lower at the end of the Reporting Period than it was when the Reporting Period started. At the same time, its dividend yield was higher at the end of the Reporting Period than at the beginning of November 2017. |
| | Looking ahead, we plan to monitor trade-related issues and their potential impact on the international equity markets broadly. We also plan to keep an eye on commodity prices, as higher commodities prices tend to increase inflationary pressures, which could, in turn, affect the monetary policies of global central banks. Overall, our strategy remains the same — to look for what we consider to be high quality companies with solid prospects over the next three years and beyond. The Fund’s positioning will always be affected by share price movements, which may reflect macro events, including political developments, as well as company-specific events, including operational developments and mergers and acquisitions. |
4
FUND BASICS
GQG Partners International Opportunities Fund
as of October 31, 2018
| | | | | | | | | | |
| | PERFORMANCE REVIEW | |
| | | November 1, 2017–October 31, 2018 | | Fund Total Return
(based on NAV)1 | | | MSCI ACWI ex USA
(Net, unhedged)2 | |
| | Class A | | | -2.92 | % | | | -8.24 | % |
| | Class C | | | -3.57 | | | | -8.24 | |
| | Institutional | | | -2.52 | | | | -8.24 | |
| | Investor | | | -2.64 | | | | -8.24 | |
| | Class R | | | -3.16 | | | | -8.24 | |
| | | Class R6 | | | -2.52 | | | | -8.24 | |
| | | | | | | | | |
| | | April 16, 2018–October 31, 2018 | | | | | | |
| | | Class P | | | -5.92 | % | | | -11.13 | % |
| | 1 | | The net asset value (“NAV”) represents the net assets of the class of the Fund (ex-dividend) divided by the total number of shares of the class outstanding. The Fund’s performance assumes the reinvestment of dividends and other distributions. The Fund’s performance does not reflect the deduction of any applicable sales charges. |
| | 2 | | The MSCI ACWI ex USA Index is an international equity index that tracks stocks from 22 developed and 24 emerging markets countries. Developed countries include Australia, Austria, Belgium, Canada, Denmark, Finland, France, Germany, Hong Kong, Ireland, Israel, Italy, Japan, the Netherlands, New Zealand, Norway, Portugal, Singapore, Spain, Sweden, Switzerland, and the U.K. Emerging markets countries include: Brazil, Chile, China, Colombia, Czech Republic, Egypt, Greece, Hungary, India, Indonesia, Korea, Malaysia, Mexico, Pakistan, Peru, the Philippines, Poland, Russia, Qatar, South Africa, Taiwan, Thailand, Turkey and United Arab Emirates. It is not possible to invest directly in an unmanaged index. |
| | | | | | | | | | | | | | |
| | STANDARDIZED TOTAL RETURNS3 | |
| | | For the period ended 9/30/18 | | One Year | | | Since Inception | | | Inception Date | |
| | Class A | | | 1.52 | % | | | 13.97 | % | | | 12/15/16 | |
| | Class C | | | 5.62 | | | | 16.75 | | | | 12/15/16 | |
| | Institutional | | | 7.86 | | | | 18.06 | | | | 12/15/16 | |
| | Investor | | | 7.75 | | | | 17.88 | | | | 12/15/16 | |
| | Class P | | | N/A | | | | 1.97 | | | | 4/16/18 | |
| | Class R | | | 7.17 | | | | 17.30 | | | | 12/15/16 | |
| | | Class R6 | | | 7.86 | | | | 18.06 | | | | 12/15/16 | |
| | 3 | | The Standardized Total Returns are average annual total returns or cumulative total returns (only if the performance is one year or less) as of the most recent calendar quarter-end. They assume reinvestment of all distributions at NAV. These returns reflect a maximum initial sales charge of 5.5% for Class A Shares and the assumed contingent deferred sales charge for Class C Shares (1% if redeemed within 12 months of purchase). Because Institutional, Investor, Class P, Class R and Class R6 Shares do not involve a sales charge, such a charge is not applied to their Standardized Total Returns. |
The returns set forth in the tables above represent past performance. Past performance does not guarantee future results. The Fund’s investment return and principal value will fluctuate so that an investor’s shares, when redeemed, may be worth more or less than their original cost. Current performance may be lower or higher than the performance quoted above. Please visit our web site at www.GSAMFUNDS.com to obtain the most recent month-end returns. Performance reflects applicable fee waivers and/or expense limitations in effect during the periods shown. In their absence, performance would be reduced. Returns do not reflect the deduction of taxes that a shareholder would pay on Fund distributions or the redemption of Fund shares.
5
FUND BASICS
| | | | | | | | | | |
| | EXPENSE RATIOS4 | |
| | | | | Net Expense Ratio (Current) | | | Gross Expense Ratio (Before Waivers) | |
| | Class A | | | 1.29 | % | | | 1.56 | % |
| | Class C | | | 2.04 | | | | 2.31 | |
| | Institutional | | | 0.90 | | | | 1.17 | |
| | Investor | | | 1.04 | | | | 1.31 | |
| | Class P | | | 0.88 | | | | 1.16 | |
| | Class R | | | 1.54 | | | | 1.81 | |
| | | Class R6 | | | 0.88 | | | | 1.16 | |
| | 4 | | The expense ratios of the Fund, both current (net of applicable fee waivers and/or expense limitations) and before waivers (gross of applicable fee waivers and/or expense limitations) are as set forth above according to the most recent publicly available Prospectus for the Fund and may differ from the expense ratios disclosed in the Financial Highlights in this report. Pursuant to contractual arrangements, the Fund’s waivers and/or expense limitations will remain in place through at least February 28, 2019 with respect to all share classes except for Class P Shares, and through April 16, 2019 with respect to Class P Shares, and prior to such dates the Investment Adviser and Transfer Agent (as applicable) may not terminate the arrangements without the approval of the Fund’s Board of Trustees. If these arrangements are discontinued in the future, the expense ratios may change without shareholder approval. |
| | | | | | | | |
| | TOP TEN HOLDINGS AS OF 10/31/185,6 |
| | | Holding | | % of Net Assets | | | Line of Business |
| | HDFC Bank Ltd. ADR | | | 4.9 | % | | Banks |
| | Air Liquide SA | | | 4.4 | | | Chemicals |
| | SAP SE ADR | | | 4.3 | | | Software |
| | Sika AG | | | 3.7 | | | Chemicals |
| | Heineken NV | | | 3.3 | | | Beverages |
| | London Stock Exchange Group PLC | | | 3.3 | | | Capital Markets |
| | Mastercard, Inc. Class A | | | 3.2 | | | IT Services |
| | Deutsche Boerse AG | | | 3.0 | | | Capital Markets |
| | Diageo PLC | | | 2.9 | | | Beverages |
| | | Ping An Insurance Group Co. of China Ltd. Class H | | | 2.8 | | | Insurance |
| | 5 | | The top 10 holdings may not be representative of the Fund’s future investments. |
| | 6 | | The Fund’s overall top 10 holdings differ from the table above due to the exclusion of the Goldman Sachs Financial Square Government Fund (a short-term investment fund), which represents approximately 3.2% of the Fund’s net assets as of 10/31/18. |
6
FUND BASICS
|
| FUND VS. BENCHMARK SECTOR ALLOCATIONS7 |
| As of October 31, 2018 |
| | 7 | | The Fund is actively managed and, as such, its composition may differ over time. Consequently, the Fund���s overall sector allocations may differ from the percentages contained in the graph above. The graph generally categorizes investments using the Global Industry Classification Standard (“GICS”); however, the sector classifications used by the portfolio management team may differ from GICS. The percentage shown for each investment category reflects the value of investments in that category as a percentage of market value. The graph depicts the Fund’s investments but may not represent the Fund’s market exposure due to the exclusion of certain derivatives, if any, as listed in the Additional Investment Information section of the Schedule of Investments. |
7
GOLDMAN SACHS GQG PARTNERS INTERNATIONAL OPPORTUNITIES FUND
Performance Summary
October 31, 2018
The following graph shows the value, as of October 31, 2018, of a $1,000,000 investment made on December 15, 2016 (commencement of operations) in Institutional Shares at NAV. For comparative purposes, the performance of the Fund’s benchmark, the MSCI All Country World Index ex USA Index (Net, Unhedged) is shown. This performance data represents past performance and should not be considered indicative of future performance, which may fluctuate with changes in market conditions. These performance fluctuations may cause an investor’s shares, when redeemed, to be worth more or less than their original cost. Performance reflects applicable fee waivers and/or expense limitations in effect during the periods shown and in their absence, performance would be reduced. Returns do not reflect the deduction of taxes that a shareholder would pay on Fund distributions or the redemption of Fund shares. Performance of Class A, Class C, Investor, Class P, Class R and Class R6 Shares will vary from that of Institutional Shares due to differences in class specific fees. In addition to the Investment Adviser’s decisions regarding issuer/industry investment selection and allocation, other factors may affect Fund performance. These factors include, but are not limited to, Fund operating fees and expenses, portfolio turnover and subscription and redemption cash flows affecting the Fund.
|
| Goldman Sachs GQG Partners International Opportunities Fund’s Lifetime Performance |
Performance of a $1,000,000 investment, with distributions reinvested, from December 15, 2016 through October 31, 2018.
| | | | | | | | |
| Average Annual Total Return through October 31, 2018 | | | One Year | | | | Since Inception | |
Class A (Commenced December 15, 2016) | | | | | | | | |
Excluding sales charges | | | -2.92% | | | | 11.77% | |
Including sales charges | | | -8.27% | | | | 8.47% | |
| |
Class C (Commenced December 15, 2016) | | | | | | | | |
Excluding contingent deferred sales charges | | | -3.57% | | | | 10.98% | |
Including contingent deferred sales charges | | | -4.53% | | | | 10.98% | |
| |
Institutional Class (Commenced December 15, 2016) | | | -2.52% | | | | 12.21% | |
| |
Investor Class (Commenced December 15, 2016) | | | -2.64% | | | | 12.04% | |
| |
Class P (Commenced April 16, 2018) | | | N/A | | | | -5.92%* | |
| |
Class R (Commenced December 15, 2016) | | | -3.16% | | | | 11.48% | |
| |
Class R6 (Commenced December 15, 2016) | | | -2.52% | | | | 12.21% | |
| |
| * | | Total return for periods of less than one year represents cumulative total return. |
8
GOLDMAN SACHS GQG PARTNERS INTERNATIONAL OPPORTUNITIES FUND
Schedule of Investments
October 31, 2018
| | | | | | | | |
Shares | | | Description | | Value | |
| Common Stocks – 98.1% | |
| Australia – 6.1% | |
| | 1,166,623 | | | Aristocrat Leisure Ltd. (Hotels, Restaurants & Leisure) | | $ | 21,983,764 | |
| | 159,008 | | | CSL Ltd. (Biotechnology) | | | 21,227,112 | |
| | 401,995 | | | Macquarie Group Ltd. (Capital Markets) | | | 33,523,230 | |
| | | | | | | | |
| | | | | | | 76,734,106 | |
| | |
| Belgium – 1.4% | |
| | 246,433 | | | KBC Group NV (Banks) | | | 16,983,189 | |
| | |
| Brazil – 0.4% | |
| | 338,191 | | | Vale SA ADR (Metals & Mining) | | | 5,106,684 | |
| | |
| Cayman Islands – 1.2% | |
| | 1,520,290 | | | CK Hutchison Holdings Ltd. (Industrial Conglomerates) | | | 15,312,542 | |
| | |
| China – 2.8% | |
| | 3,751,783 | | | Ping An Insurance Group Co. of China Ltd. Class H (Insurance) | | | 35,469,462 | |
| | |
| Denmark – 1.0% | |
| | 275,780 | | | Novo Nordisk A/S Class B (Pharmaceuticals) | | | 11,909,988 | |
| | |
| France – 12.7% | |
| | 456,140 | | | Air Liquide SA (Chemicals) | | | 55,141,049 | |
| | 99,583 | | | Capgemini SE (IT Services) | | | 12,159,553 | |
| | 88,642 | | | EssilorLuxottica SA (Health Care Equipment & Supplies) | | | 12,106,593 | |
| | 27,599 | | | Hermes International (Textiles, Apparel & Luxury Goods) | | | 15,756,315 | |
| | 152,737 | | | L’Oreal SA (Personal Products) | | | 34,412,598 | |
| | 218,828 | | | Safran SA (Aerospace & Defense) | | | 28,278,674 | |
| | | | | | | | |
| | | | | | | 157,854,782 | |
| | |
| Germany – 8.9% | |
| | 128,583 | | | Beiersdorf AG (Personal Products) | | | 13,295,137 | |
| | 294,684 | | | Deutsche Boerse AG (Capital Markets) | | | 37,239,955 | |
| | 28,051 | | | Muenchener Rueckversicherungs-Gesellschaft AG in Muenchen (Insurance) | | | 6,024,948 | |
| | 502,707 | | | SAP SE ADR (Software) | | | 53,920,353 | |
| | | | | | | | |
| | | | | | | 110,480,393 | |
| | |
| Hong Kong – 5.3% | |
| | 2,679,751 | | | AIA Group Ltd. (Insurance) | | | 20,384,981 | |
| | 1,119,303 | | | Hang Seng Bank Ltd. (Banks) | | | 26,244,935 | |
| | 691,155 | | | Link REIT (Equity Real Estate Investment Trusts (REITs)) | | | 6,142,355 | |
| | 2,752,502 | | | MTR Corp. Ltd. (Road & Rail) | | | 13,355,777 | |
| | | | | | | | |
| | | | | | | 66,128,048 | |
| | |
| India – 5.9% | |
| | 688,559 | | | HDFC Bank Ltd. ADR (Banks) | | | 61,219,781 | |
| | 1,334,915 | | | Infosys Ltd. ADR (IT Services) | | | 12,641,645 | |
| | | | | | | | |
| | | | | | | 73,861,426 | |
| | |
| Common Stocks – (continued) | |
| Indonesia – 1.0% | |
| | 8,212,667 | | | Bank Central Asia Tbk PT (Banks) | | | 12,787,620 | |
| | |
| Ireland – 1.2% | |
| | 166,740 | | | Medtronic PLC (Health Care Equipment & Supplies) | | | 14,976,587 | |
| | |
| Japan – 4.6% | |
| | 227,886 | | | Secom Co. Ltd. (Commercial Services & Supplies) | | | 18,657,376 | |
| | 195,155 | | | Shionogi & Co. Ltd. (Pharmaceuticals) | | | 12,478,927 | |
| | 554,482 | | | Tokio Marine Holdings, Inc. (Insurance) | | | 26,122,826 | |
| | | | | | | | |
| | | | | | | 57,259,129 | |
| | |
| Netherlands – 4.8% | |
| | 17,771 | | | ASML Holding NV (Semiconductors & Semiconductor Equipment) | | | 3,060,949 | |
| | 456,695 | | | Heineken NV (Beverages) | | | 41,087,611 | |
| | 285,436 | | | Unilever NV (Personal Products) | | | 15,337,905 | |
| | | | | | | | |
| | | | | | | 59,486,465 | |
| | |
| South Korea – 2.0% | |
| | 670,631 | | | Samsung Electronics Co. Ltd. (Technology Hardware, Storage & Peripherals) | | | 25,105,601 | |
| | |
| Spain(a) – 1.6% | |
| | 824,116 | | | Cellnex Telecom SA* (Diversified Telecommunication Services) | | | 20,500,944 | |
| | |
| Switzerland – 12.0% | |
| | 808,176 | | | Coca-Cola HBC AG* (Beverages) | | | 23,872,381 | |
| | 2,152,889 | | | Glencore PLC* (Metals & Mining) | | | 8,761,525 | |
| | 302,714 | | | Nestle SA (Food Products) | | | 25,556,049 | |
| | 56,617 | | | Roche Holding AG (Pharmaceuticals) | | | 13,778,449 | |
| | 357,463 | | | Sika AG (Chemicals) | | | 45,834,794 | |
| | 2,245,641 | | | UBS Group AG* | | | 31,376,017 | |
| | | | | | | | |
| | | | | | | 149,179,215 | |
| | |
| United Kingdom – 10.8% | |
| | 389,348 | | | AstraZeneca PLC (Pharmaceuticals) | | | 29,781,082 | |
| | 1,054,419 | | | Diageo PLC (Beverages) | | | 36,452,864 | |
| | 737,534 | | | London Stock Exchange Group PLC (Capital Markets) | | | 40,636,467 | |
| | 229,602 | | | Reckitt Benckiser Group PLC (Household Products) | | | 18,566,553 | |
| | 285,859 | | | Royal Dutch Shell PLC Class B (Oil, Gas & Consumable Fuels) | | | 9,322,698 | |
| | | | | | | | |
| | | | | | | 134,759,664 | |
| | |
| United States – 14.4% | |
| | 442,006 | | | Abbott Laboratories (Health Care Equipment & Supplies) | | | 30,471,894 | |
| | 22,186 | | | Alphabet, Inc. Class A* (Interactive Media & Services) | | | 24,195,608 | |
| | |
| | |
| The accompanying notes are an integral part of these financial statements. | | 9 |
GOLDMAN SACHS GQG PARTNERS INTERNATIONAL OPPORTUNITIES FUND
Schedule of Investments (continued)
October 31, 2018
| | | | | | | | |
Shares | | | Description | | Value | |
| Common Stocks – (continued) | |
| United States – (continued) | |
| | 22,508 | | | Alphabet, Inc. Class C* (Interactive Media & Services) | | $ | 24,235,939 | |
| | 210,637 | | | Facebook, Inc. Class A* (Interactive Media & Services) | | | 31,972,590 | |
| | 200,616 | | | Mastercard, Inc. Class A (IT Services) | | | 39,655,765 | |
| | 213,411 | | | Visa, Inc. Class A (IT Services) | | | 29,418,706 | |
| | | | | | | | |
| | | | | | | 179,950,502 | |
| | |
| | TOTAL COMMON STOCKS
| | | | |
| | (Cost $1,232,815,295) | | $ | 1,223,846,347 | |
| | |
| | | | | | | | |
| Shares | | Dividend Rate | | | Value | |
| Investment Company(b) – 3.2% | |
Goldman Sachs Financial Square Government Fund – Institutional Shares | |
| 39,990,504 | | | 2.102 | % | | $ | 39,990,504 | |
| (Cost $39,990,504) | |
| |
| TOTAL INVESTMENTS – 101.3% | |
| (Cost $1,272,805,799) | | | $ | 1,263,836,851 | |
| |
LIABILITIES IN EXCESS OF
OTHER ASSETS – (1.3)% | | | | (16,419,254 | ) |
| |
| NET ASSETS – 100.0% | | | $ | 1,247,417,597 | |
| |
| | |
| The percentage shown for each investment category reflects the value of investments in that category as a percentage of net assets. |
* | | Non-income producing security. |
(a) | | Exempt from registration under Rule 144A of the Securities Act of 1933. Under procedures approved by the Board of Trustees, such securities may be deemed liquid by the Investment Adviser and may be resold, normally to qualified institutional buyers in transactions exempt from registration. Total market value of Rule 144A securities amounts to $20,500,944, which represents approximately 1.6% of the Fund’s net assets as of October 31, 2018. The liquidity determination is unaudited. |
(b) | | Represents an affiliated issuer. |
| | |
|
Investment Abbreviations: |
ADR | | —American Depositary Receipt |
PLC | | —Public Limited Company |
REIT | | —Real Estate Investment Trust |
|
| | |
| 10 | | The accompanying notes are an integral part of these financial statements. |
GOLDMAN SACHS GQG PARTNERS INTERNATIONAL OPPORTUNITIES FUND
Statement of Assets and Liabilities
October 31, 2018
| | | | | | |
| | | | | | |
| | Assets: | | | | |
| | Investments of unaffiliated issuers, at value (cost $1,232,815,295) | | | $1,223,846,347 | |
| | Investments of affiliated issuers, at value (cost $39,990,504) | | | 39,990,504 | |
| | Cash | | | 815,118 | |
| | Foreign currencies, at value (cost $219,297) | | | 199,145 | |
| | Receivables: | | | | |
| | Fund shares sold | | | 9,149,614 | |
| | Dividends | | | 1,218,073 | |
| | Foreign tax reclaims | | | 615,806 | |
| | Reimbursement from investment adviser | | | 193,188 | |
| | Investments sold | | | 13,522 | |
| | Other assets | | | 161,276 | |
| | Total assets | | | 1,276,202,593 | |
| | | | | | |
| | Liabilities: | | | | |
| | Payables: | | | | |
| | Fund shares redeemed | | | 24,075,451 | |
| | Investments purchased | | | 3,373,382 | |
| | Management fees | | | 887,129 | |
| | Distribution and Service fees and Transfer Agency fees | | | 100,601 | |
| | Accrued expenses | | | 348,433 | |
| | Total liabilities | | | 28,784,996 | |
| | | | | | |
| | Net Assets: | | | | |
| | Paid-in capital | | | 1,276,413,276 | |
| | Total distributable loss | | | (28,995,679 | ) |
| | | NET ASSETS | | | $1,247,417,597 | |
| | | Net Assets: | | | | |
| | | Class A | | | $44,886,576 | |
| | | Class C | | | 20,146,752 | |
| | | Institutional | | | 713,691,353 | |
| | | Investor | | | 234,586,879 | |
| | | Class P | | | 233,541,320 | |
| | | Class R | | | 24,933 | |
| | | Class R6 | | | 539,784 | |
| | | Total Net Assets | | | $1,247,417,597 | |
| | | Shares Outstanding $0.001 par value (unlimited number of shares authorized): | | | | |
| | | Class A | | | 3,641,923 | |
| | | Class C | | | 1,657,142 | |
| | | Institutional | | | 57,590,247 | |
| | | Investor | | | 18,980,259 | |
| | | Class P | | | 18,856,614 | |
| | | Class R | | | 2,033 | |
| | | Class R6 | | | 43,556 | |
| | | Net asset value, offering and redemption price per share:(a) | | | | |
| | | Class A | | | $12.32 | |
| | | Class C | | | 12.16 | |
| | | Institutional | | | 12.39 | |
| | | Investor | | | 12.36 | |
| | | Class P | | | 12.39 | |
| | | Class R | | | 12.26 | |
| | | Class R6 | | | 12.39 | |
| | (a) | | Maximum public offering price per share for Class A Shares is $13.04. At redemption, Class C Shares may be subject to a contingent deferred sales charge, assessed on the amount equal to the lesser of the current net asset value (“NAV”) or the original purchase price of the shares. |
| | |
| The accompanying notes are an integral part of these financial statements. | | 11 |
GOLDMAN SACHS GQG PARTNERS INTERNATIONAL OPPORTUNITIES FUND
Statement of Operations
For the Fiscal Year Ended October 31, 2018
| | | | | | |
| | | | | | |
| | Investment income: | | | | |
| | Dividends — unaffiliated issuers (net of foreign withholding taxes of $1,627,131) | | $ | 16,656,062 | |
| | Dividends — affiliated issuers | | | 259,333 | |
| | Securities lending income — affiliated issuer | | | 42,172 | |
| | Interest | | | 237 | |
| | Total investment income | | | 16,957,804 | |
| | | | | | |
| | Expenses: | | | | |
| | Management fees | | | 7,952,668 | |
| | Transfer Agency fees(a) | | | 671,576 | |
| | Custody, accounting and administrative services | | | 314,900 | |
| | Distribution and Service fees(a) | | | 296,734 | |
| | Professional fees | | | 275,715 | |
| | Printing and mailing costs | | | 129,984 | |
| | Registration fees | | | 90,474 | |
| | Trustee fees | | | 58,899 | |
| | Amortization of offering costs | | | 38,321 | |
| | Other | | | 81,925 | |
| | Total expenses | | | 9,911,196 | |
| | Less — expense reductions | | | (890,223 | ) |
| | Net expenses | | | 9,020,973 | |
| | NET INVESTMENT INCOME | | | 7,936,831 | |
| | | | | | |
| | Realized and unrealized gain (loss): | | | | |
| | Net realized loss from: | | | | |
| | Investments — unaffiliated issuers | | | (21,618,757 | ) |
| | Forward foreign currency exchange contracts | | | (103,063 | ) |
| | Foreign currency transactions | | | (1,541,522 | ) |
| | Net change in unrealized loss on: | | | | |
| | Investments — unaffiliated issuers | | | (54,953,291 | ) |
| | Foreign currency translation | | | (55,963 | ) |
| | Net realized and unrealized loss | | | (78,272,596 | ) |
| | NET DECREASE IN NET ASSETS RESULTING FROM OPERATIONS | | $ | (70,335,765 | ) |
| | (a) | | Class specific Distribution and/or Service and Transfer Agency fees were as follows: |
| | | | | | | | | | | | | | | | | | | | | | | | | | | | | | | | | | | | | | |
| Distribution and/or Service Fees | | | Transfer Agency Fees | |
Class A | | | Class C | | | Class R | | | Class A | | | Class C | | | Institutional | | | Investor | | | Class P(b) | | | Class R | | | Class R6 | |
| $ | 88,829 | | | $ | 207,825 | | | $ | 80 | | | $ | 63,886 | | | $ | 37,326 | | | $ | 265,030 | | | $ | 285,659 | | | $ | 19,561 | | | $ | 29 | | | $ | 85 | |
| | (b) | | Class P Shares commenced operations on April 16, 2018. |
| | |
| 12 | | The accompanying notes are an integral part of these financial statements. |
GOLDMAN SACHS GQG PARTNERS INTERNATIONAL OPPORTUNITIES FUND
Statement of Changes in Net Assets
| | | | | | | | | | |
| | | | | For the Fiscal
Year Ended
October 31, 2018 | | | For the
Period Ended
October 31, 2017(a) | |
| | From operations: | | | | | | | | |
| | Net investment income | | $ | 7,936,831 | | | $ | 1,064,640 | |
| | Net realized loss | | | (23,263,342 | ) | | | (4,894,890 | ) |
| | Net change in unrealized gain (loss) | | | (55,009,254 | ) | | | 45,994,440 | |
| | Net increase (decrease) in net assets resulting from operations | | | (70,335,765 | ) | | | 42,164,190 | |
| | | | | | | | | | |
| | Distributions to shareholders: | | | | | | | | |
| | From distributable earnings: | | | | | | | | |
| | Class A Shares | | | — | | | | (5 | )(b) |
| | Class C Shares | | | — | | | | (2 | )(b) |
| | Institutional Shares | | | (730,804 | ) | | | (17,866 | )(b) |
| | Investor Shares | | | (90,579 | ) | | | (6 | )(b) |
| | Class R Shares | | | — | | | | (4 | )(b) |
| | Class R6 Shares | | | (27 | ) | | | (7 | )(b) |
| | Total distributions to shareholders | | | (821,410 | ) | | | (17,890 | )(b) |
| | | | | | | | | | |
| | From share transactions: | | | | | | | | |
| | Proceeds from sales of shares | | | 1,223,864,242 | | | | 465,798,260 | |
| | Reinvestment of distributions | | | 812,227 | | | | 17,890 | |
| | Cost of shares redeemed | | | (385,868,432 | ) | | | (28,195,715 | ) |
| | Net increase in net assets resulting from share transactions | | | 838,808,037 | | | | 437,620,435 | |
| | TOTAL INCREASE | | | 767,650,862 | | | | 479,766,735 | |
| | | | | | | | | | |
| | Net assets:(c) | | | | | | | | |
| | Beginning of period | | | 479,766,735 | | | | — | |
| | End of period | | $ | 1,247,417,597 | | | $ | 479,766,735 | |
| | (a) | | Commenced operations on December 15, 2016. |
| | (b) | | Prior year information has been revised to conform to current year presentation. Distributions to shareholders for the Fund consisted solely of net investment income for the period ended October 31, 2017. |
| | (c) | | Prior fiscal year information has been revised to conform with current year presentation. Undistributed net investment income was $556,793 as of October 31, 2017. |
| | |
| The accompanying notes are an integral part of these financial statements. | | 13 |
GOLDMAN SACHS GQG PARTNERS INTERNATIONAL OPPORTUNITIES FUND
Financial Highlights
Selected Data for a Share Outstanding Throughout Each Period
| | | | | | | | | | |
| | | | | Goldman Sachs GQG Partners
International Opportunities Fund | |
| | | | | Class A Shares | |
| | | | | Year Ended
October 31, 2018 | | | Period Ended
October 31, 2017(a) | |
| | Per Share Data | | | | | | | | |
| | Net asset value, beginning of period | | $ | 12.69 | | | $ | 10.00 | |
| | Net investment income(b) | | | 0.08 | | | | 0.04 | |
| | Net realized and unrealized gain (loss) | | | (0.45 | ) | | | 2.66 | |
| | Total from investment operations | | | (0.37 | ) | | | 2.70 | |
| | Distributions to shareholders from net investment income | | | — | | | | (0.01 | ) |
| | Net asset value, end of period | | $ | 12.32 | | | $ | 12.69 | |
| | Total return(c) | | | (2.92 | )% | | | 26.97 | % |
| | Net assets, end of period (in 000s) | | $ | 44,887 | | | $ | 11,297 | |
| | Ratio of net expenses to average net assets | | | 1.28 | % | | | 1.30 | %(d) |
| | Ratio of total expenses to average net assets | | | 1.38 | % | | | 1.65 | %(d) |
| | Ratio of net investment income to average net assets | | | 0.57 | % | | | 0.40 | %(d) |
| | Portfolio turnover rate(e) | | | 90 | % | | | 54 | % |
| | (a) | | Commenced operations on December 15, 2016. |
| | (b) | | Calculated based on the average shares outstanding methodology. |
| | (c) | | Assumes investment at the NAV at the beginning of the period, reinvestment of all dividends and distributions, a complete redemption of the investment at the NAV at the end of the period and no sales or redemption charges. Total returns would be reduced if a sales or redemption charge was taken into account. Returns do not reflect the impact of taxes to shareholders relating to Fund distributions or the redemption of Fund shares. Total returns for periods less than one full year are not annualized. |
| | (e) | | The Fund’s portfolio turnover rate is calculated in accordance with regulatory requirements, without regard to transactions involving certain derivatives and short term investments. If such transactions were included, the Fund’s portfolio turnover rate may be higher. |
| | |
| 14 | | The accompanying notes are an integral part of these financial statements. |
GOLDMAN SACHS GQG PARTNERS INTERNATIONAL OPPORTUNITIES FUND
Financial Highlights (continued)
Selected Data for a Share Outstanding Throughout Each Period
| | | | | | | | | | |
| | | | | Goldman Sachs GQG Partners
International Opportunities Fund | |
| | | | | Class C Shares | |
| | | | | Year Ended
October 31,
2018 | | | Period Ended
October 31, 2017(a) | |
| | Per Share Data | | | | | | | | |
| | Net asset value, beginning of period | | $ | 12.61 | | | $ | 10.00 | |
| | Net investment loss(b) | | | (0.02 | ) | | | (0.06 | ) |
| | Net realized and unrealized gain (loss) | | | (0.43 | ) | | | 2.67 | |
| | Total from investment operations | | | (0.45 | ) | | | 2.61 | |
| | Distributions to shareholders from net investment income | | | — | | | | — | (c) |
| | Net asset value, end of period | | $ | 12.16 | | | $ | 12.61 | |
| | Total return(d) | | | (3.57 | )% | | | 26.13 | % |
| | Net assets, end of period ( in 000s) | | $ | 20,147 | | | $ | 12,969 | |
| | Ratio of net expenses to average net assets | | | 2.04 | % | | | 2.05 | %(e) |
| | Ratio of total expenses to average net assets | | | 2.12 | % | | | 2.34 | %(e) |
| | Ratio of net investment loss to average net assets | | | (0.18 | )% | | | (0.57 | )%(e) |
| | Portfolio turnover rate(f) | | | 90 | % | | | 54 | % |
| | (a) | | Commenced operations on December 15, 2016. |
| | (b) | | Calculated based on the average shares outstanding methodology. |
| | (c) | | Amount is less than $0.005 per share. |
| | (d) | | Assumes investment at the NAV at the beginning of the period, reinvestment of all dividends and distributions, a complete redemption of the investment at the NAV at the end of the period and no sales or redemption charges. Total returns would be reduced if a sales or redemption charge was taken into account. Returns do not reflect the impact of taxes to shareholders relating to Fund distributions or the redemption of Fund shares. Total returns for periods less than one full year are not annualized. |
| | (f) | | The Fund’s portfolio turnover rate is calculated in accordance with regulatory requirements, without regard to transactions involving certain derivatives and short term investments. If such transactions were included, the Fund’s portfolio turnover rate may be higher. |
| | |
| The accompanying notes are an integral part of these financial statements. | | 15 |
GOLDMAN SACHS GQG PARTNERS INTERNATIONAL OPPORTUNITIES FUND
Financial Highlights (continued)
Selected Data for a Share Outstanding Throughout Each Period
| | | | | | | | | | |
| | | | | Goldman Sachs GQG Partners
International Opportunities Fund | |
| | | | | Institutional Shares | |
| | | | | Year Ended
October 31,
2018 | | | Period Ended
October 31, 2017(a) | |
| | Per Share Data | | | | | | | | |
| | Net asset value, beginning of period | | $ | 12.73 | | | $ | 10.00 | |
| | Net investment income(b) | | | 0.13 | | | | 0.08 | |
| | Net realized and unrealized gain (loss) | | | (0.45 | ) | | | 2.66 | |
| | Total from investment operations | | | (0.32 | ) | | | 2.74 | |
| | Distributions to shareholders from net investment income | | | (0.02 | ) | | | (0.01 | ) |
| | Net asset value, end of period | | $ | 12.39 | | | $ | 12.73 | |
| | Total return(c) | | | (2.52 | )% | | | 27.39 | % |
| | Net assets, end of period (in 000s) | | $ | 713,691 | | | $ | 392,168 | |
| | Ratio of net expenses to average net assets | | | 0.90 | % | | | 0.90 | %(d) |
| | Ratio of total expenses to average net assets | | | 0.98 | % | | | 1.30 | %(d) |
| | Ratio of net investment income to average net assets | | | 0.96 | % | | | 0.73 | %(d) |
| | Portfolio turnover rate(e) | | | 90 | % | | | 54 | % |
| | (a) | | Commenced operations on December 15, 2016. |
| | (b) | | Calculated based on the average shares outstanding methodology. |
| | (c) | | Assumes reinvestment of all dividends and distributions. Returns do not reflect the impact of taxes to shareholders relating to Fund distributions or the redemption of Fund shares. Total returns for periods less than one full year are not annualized. |
| | (e) | | The Fund’s portfolio turnover rate is calculated in accordance with regulatory requirements, without regard to transactions involving certain derivatives and short term investments. If such transactions were included, the Fund’s portfolio turnover rate may be higher. |
| | |
| 16 | | The accompanying notes are an integral part of these financial statements. |
GOLDMAN SACHS GQG PARTNERS INTERNATIONAL OPPORTUNITIES FUND
Financial Highlights (continued)
Selected Data for a Share Outstanding Throughout Each Period
| | | | | | | | | | |
| | | | | Goldman Sachs GQG Partners
International Opportunities Fund | |
| | | | | Investor Shares | |
| | | | | Year Ended
October 31,
2018 | | | Period Ended
October 31, 2017(a) | |
| | Per Share Data | | | | | | | | |
| | Net asset value, beginning of period | | $ | 12.71 | | | $ | 10.00 | |
| | Net investment income (loss)(b) | | | 0.10 | | | | (0.01 | ) |
| | Net realized and unrealized gain (loss) | | | (0.43 | ) | | | 2.73 | |
| | Total from investment operations | | | (0.33 | ) | | | 2.72 | |
| | Distributions to shareholders from net investment income | | | (0.02 | ) | | | (0.01 | ) |
| | Net asset value, end of period | | $ | 12.36 | | | $ | 12.71 | |
| | Total return(c) | | | (2.64 | )% | | | 27.18 | % |
| | Net assets, end of period (in 000s) | | $ | 234,587 | | | $ | 63,303 | |
| | Ratio of net expenses to average net assets | | | 1.03 | % | | | 1.05 | %(d) |
| | Ratio of total expenses to average net assets | | | 1.13 | % | | | 1.39 | %(d) |
| | Ratio of net investment loss to average net assets | | | 0.77 | % | | | (0.10 | )%(d) |
| | Portfolio turnover rate(e) | | | 90 | % | | | 54 | % |
| | (a) | | Commenced operations on December 15, 2016. |
| | (b) | | Calculated based on the average shares outstanding methodology. |
| | (c) | | Assumes reinvestment of all dividends and distributions. Returns do not reflect the impact of taxes to shareholders relating to Fund distributions or the redemption of Fund shares. Total returns for periods less than one full year are not annualized. |
| | (e) | | The Fund’s portfolio turnover rate is calculated in accordance with regulatory requirements, without regard to transactions involving certain derivatives and short term investments. If such transactions were included, the Fund’s portfolio turnover rate may be higher. |
| | |
| The accompanying notes are an integral part of these financial statements. | | 17 |
GOLDMAN SACHS GQG PARTNERS INTERNATIONAL OPPORTUNITIES FUND
Financial Highlights (continued)
Selected Data for a Share Outstanding Throughout the Period
| | | | | | |
| | | | | Goldman Sachs GQG
Partners International
Opportunities Fund | |
| | | | | Class P Shares | |
| | | | | Period Ended October 31,
2018(a) | |
| | Per Share Data | | | | |
| | Net asset value, beginning of period | | $ | 13.17 | |
| | Net investment income(b) | | | 0.02 | |
| | Net realized and unrealized loss | | | (0.80 | ) |
| | Total from investment operations | | | (0.78 | ) |
| | Net asset value, end of period | | $ | 12.39 | |
| | Total return(c) | | | (5.92 | )% |
| | Net assets, end of period (in 000s) | | $ | 233,541 | |
| | Ratio of net expenses to average net assets | | | 0.87 | %(d) |
| | Ratio of total expenses to average net assets | | | 1.02 | %(d) |
| | Ratio of net investment income to average net assets | | | 0.33 | %(d) |
| | Portfolio turnover rate(e) | | | 90 | % |
| | (a) | | Commenced operations on April 16, 2018. |
| | (b) | | Calculated based on the average shares outstanding methodology. |
| | (c) | | Assumes reinvestment of all dividends and distributions. Returns do not reflect the impact of taxes to shareholders relating to Fund distributions or the redemption of Fund shares. Total returns for periods less than one full year are not annualized. |
| | (e) | | The Fund’s portfolio turnover rate is calculated in accordance with regulatory requirements, without regard to transactions involving certain derivatives and short term investments. If such transactions were included, the Fund’s portfolio turnover rate may be higher. |
| | |
| 18 | | The accompanying notes are an integral part of these financial statements. |
GOLDMAN SACHS GQG PARTNERS INTERNATIONAL OPPORTUNITIES FUND
Financial Highlights (continued)
Selected Data for a Share Outstanding Throughout Each Period
| | | | | | | | | | |
| | | | | Goldman Sachs GQG Partners
International Opportunities Fund | |
| | | | | Class R Shares | |
| | | | | Year Ended
October 31,
2018 | | | Period Ended
October 31, 2017(a) | |
| | Per Share Data | | | | | | | | |
| | Net asset value, beginning of period | | $ | 12.66 | | | $ | 10.00 | |
| | Net investment income(b) | | | 0.02 | | | | 0.04 | |
| | Net realized and unrealized gain (loss) | | | (0.42 | ) | | | 2.62 | |
| | Total from investment operations | | | (0.40 | ) | | | 2.66 | |
| | Distributions to shareholders from net investment income | | | — | | | | — | (c) |
| | Net asset value, end of period | | $ | 12.26 | | | $ | 12.66 | |
| | Total return(d) | | | (3.16 | )% | | | 26.65 | % |
| | Net assets, end of period (in 000s) | | $ | 25 | | | $ | 17 | |
| | Ratio of net expenses to average net assets | | | 1.53 | % | | | 1.55 | %(e) |
| | Ratio of total expenses to average net assets | | | 1.62 | % | | | 2.22 | %(e) |
| | Ratio of net investment income to average net assets | | | 0.15 | % | | | 0.43 | %(e) |
| | Portfolio turnover rate(f) | | | 90 | % | | | 54 | % |
| | (a) | | Commenced operations on December 15, 2016. |
| | (b) | | Calculated based on the average shares outstanding methodology. |
| | (c) | | Amount is less than $0.005 per share. |
| | (d) | | Assumes reinvestment of all dividends and distributions. Returns do not reflect the impact of taxes to shareholders relating to Fund distributions or the redemption of Fund shares. Total returns for periods less than one full year are not annualized. |
| | (f) | | The Fund’s portfolio turnover rate is calculated in accordance with regulatory requirements, without regard to transactions involving certain derivatives and short term investments. If such transactions were included, the Fund’s portfolio turnover rate may be higher. |
| | |
| The accompanying notes are an integral part of these financial statements. | | 19 |
GOLDMAN SACHS GQG PARTNERS INTERNATIONAL OPPORTUNITIES FUND
Financial Highlights (continued)
Selected Data for a Share Outstanding Throughout Each Period
| | | | | | | | | | |
| | | | | Goldman Sachs GQG Partners
International Opportunities Fund | |
| | | | | Class R6 Shares | |
| | | | | Year Ended
October 31,
2018 | | | Period Ended
October 31, 2017(a) | |
| | Per Share Data | | | | | | | | |
| | Net asset value, beginning of period | | $ | 12.73 | | | $ | 10.00 | |
| | Net investment income(b) | | | 0.12 | | | | 0.11 | |
| | Net realized and unrealized gain (loss) | | | (0.44 | ) | | | 2.63 | |
| | Total from investment operations | | | (0.32 | ) | | | 2.74 | |
| | Distributions to shareholders from net investment income | | | (0.02 | ) | | | (0.01 | ) |
| | Net asset value, end of period | | $ | 12.39 | | | $ | 12.73 | |
| | Total return(c) | | | (2.52 | )% | | | 27.39 | % |
| | Net assets, end of period (in 000s) | | $ | 540 | | | $ | 13 | |
| | Ratio of net expenses to average net assets | | | 0.87 | % | | | 0.89 | %(d) |
| | Ratio of total expenses to average net assets | | | 0.98 | % | | | 1.66 | %(d) |
| | Ratio of net investment income to average net assets | | | 0.92 | % | | | 1.09 | %(d) |
| | Portfolio turnover rate(e) | | | 90 | % | | | 54 | % |
| | (a) | | Commenced operations on December 15, 2016. |
| | (b) | | Calculated based on the average shares outstanding methodology. |
| | (c) | | Assumes reinvestment of all dividends and distributions. Returns do not reflect the impact of taxes to shareholders relating to Fund distributions or the redemption of Fund shares. Total returns for periods less than one full year are not annualized. |
| | (e) | | The Fund’s portfolio turnover rate is calculated in accordance with regulatory requirements, without regard to transactions involving certain derivatives and short term investments. If such transactions were included, the Fund’s portfolio turnover rate may be higher. |
| | |
| 20 | | The accompanying notes are an integral part of these financial statements. |
GOLDMAN SACHS GQG PARTNERS INTERNATIONAL OPPORTUNITIES FUND
Notes to Financial Statements
October 31, 2018
Goldman Sachs Trust II (the “Trust”) is a Delaware statutory trust registered under the Investment Company Act of 1940, as amended (the “Act”), as an open-end management investment company. The Trust includes the Goldman Sachs GQG Partners International Opportunities Fund (the “Fund”). The Fund is a non-diversified portfolio that currently offers seven classes of shares: Class A, Class C, Institutional, Investor, Class P (commenced operations on April 16, 2018), Class R and Class R6 Shares.
Class A Shares are sold with a front-end sales charge of up to 5.50%. Class C Shares are sold with a contingent deferred sales charge (“CDSC”) of 1.00%, which is imposed on redemptions made within 12 months of purchase. Institutional, Investor, Class P, Class R, and Class R6 Shares are not subject to a sales charge.
Goldman Sachs Asset Management, L.P. (“GSAM”), an affiliate of Goldman Sachs & Co. LLC (“Goldman Sachs”), serves as investment adviser to the Fund pursuant to a management agreement (the “Agreement”) with the Trust.
GQG Partners LLC (“GQG Partners” or the “Sub-Adviser”) serves as the sub-adviser to the Fund. GSAM compensates the Sub-Adviser directly in accordance with the terms of the Sub-Advisory Agreement. The Fund is not charged any separate or additional investment advisory fees by the Sub-Adviser.
|
| 2. SIGNIFICANT ACCOUNTING POLICIES |
The financial statements have been prepared in accordance with accounting principles generally accepted in the United States of America (“GAAP”) and require management to make estimates and assumptions that may affect the reported amounts and disclosures. Actual results may differ from those estimates and assumptions.
A. Investment Valuation — The Fund’s valuation policy is to value investments at fair value.
B. Investment Income and Investments — Investment income includes interest income, dividend income and securities lending income, if any. Interest income is accrued daily and adjusted for amortization of premiums and accretion of discounts. Dividend income is recognized on ex-dividend date or, for certain foreign securities, as soon as such information is obtained subsequent to the ex-dividend date. Investment transactions are reflected on trade date. Realized gains and losses are calculated using identified cost. Investment transactions are recorded on the following business day for daily net asset value (“NAV”) calculations. Investment income is recorded net of any foreign withholding taxes, less any amounts reclaimable. The Fund may file withholding tax reclaims in certain jurisdictions to recover a portion of amounts previously withheld. Any foreign capital gains tax is accrued daily based upon net unrealized gains, and is payable upon sale of such investments.
For derivative contracts, realized gains and losses are recorded upon settlement of the contract.
C. Class Allocations and Expenses — Investment income, realized and unrealized gain (loss), if any, and non-class specific expenses of the Fund are allocated daily based upon the proportion of net assets of each class. Non-class specific expenses directly incurred by the Fund are charged to the Fund, while such expenses incurred by the Trust are allocated across the Fund on a straight-line and/or pro-rata basis depending upon the nature of the expenses. Class-specific expenses, where applicable, are borne by the respective share classes and include Distribution and Service and Transfer Agency fees.
D. Offering Costs — Offering costs paid in connection with the offering of shares of the Fund were amortized on a straight-line basis over 12 months from the date of commencement of operations.
E. Federal Taxes and Distributions to Shareholders — It is the Fund’s policy to comply with the requirements of the Internal Revenue Code of 1986, as amended (the “Code”), applicable to regulated investment companies and to distribute each year substantially all of its investment company taxable income and capital gains to its shareholders. Accordingly, the Fund is not required to make any provisions for the payment of federal income tax. Distributions to shareholders are recorded on the ex-dividend date. Income and capital gains distributions, if any, are declared and paid annually.
Net capital losses, if any, are carried forward to future fiscal years and may be used to the extent allowed by the Code to offset any future capital gains. Losses that are carried forward will retain their character as either short-term or long-term capital losses. Utilization of capital loss carryforwards will reduce the requirement of future capital gains distributions.
21
GOLDMAN SACHS GQG PARTNERS INTERNATIONAL OPPORTUNITIES FUND
Notes to Financial Statements (continued)
October 31, 2018
|
| 2. SIGNIFICANT ACCOUNTING POLICIES (continued) |
The characterization of distributions to shareholders for financial reporting purposes is determined in accordance with federal income tax rules, which may differ from GAAP. The source of the Fund’s distributions may be shown in the accompanying financial statements as either from distributable earnings or capital. Certain components of the Fund’s net assets on the Statement of Assets and Liabilities reflect permanent GAAP/tax differences based on the appropriate tax character.
F. Foreign Currency Translation — The accounting records and reporting currency of the Fund are maintained in U.S. dollars. Assets and liabilities denominated in foreign currencies are translated into U.S. dollars using the current exchange rates at the close of each business day. The effect of changes in foreign currency exchange rates on investments is included within net realized and unrealized gain (loss) on investments. Changes in the value of other assets and liabilities as a result of fluctuations in foreign exchange rates are included in the Statement of Operations within net change in unrealized gain (loss) on foreign currency translation. Transactions denominated in foreign currencies are translated into U.S. dollars on the date the transaction occurred, the effects of which are included within net realized gain (loss) on foreign currency transactions.
| | |
| 3. INVESTMENTS AND FAIR VALUE MEASUREMENTS |
U.S. GAAP defines the fair value of a financial instrument as the amount that would be received to sell an asset or paid to transfer a liability in an orderly transaction between market participants at the measurement date (i.e., the exit price); the Fund’s policy is to use the market approach. GAAP establishes a fair value hierarchy that prioritizes the inputs to valuation techniques used to measure fair value. The hierarchy gives the highest priority to unadjusted quoted prices in active markets for identical assets or liabilities (Level 1 measurements) and the lowest priority to unobservable inputs (Level 3 measurements). The levels used for classifying investments are not necessarily an indication of the risk associated with investing in these investments. The three levels of the fair value hierarchy are described below:
Level 1 — Unadjusted quoted prices in active markets that are accessible at the measurement date for identical, unrestricted assets or liabilities;
Level 2 — Quoted prices in markets that are not active or financial instruments for which significant inputs are observable (including, but not limited to, quoted prices for similar investments, interest rates, foreign exchange rates, volatility and credit spreads), either directly or indirectly;
Level 3 — Prices or valuations that require significant unobservable inputs (including GSAM’s assumptions in determining fair value measurement).
Changes in valuation techniques may result in transfers into or out of an assigned level within the hierarchy. In accordance with the Fund’s policy, transfers between different levels of the fair value hierarchy resulting from such changes are deemed to have occurred as of the beginning of the reporting period.
The Board of Trustees (“Trustees”) has approved Valuation Procedures that govern the valuation of the portfolio investments held by the Fund, including investments for which market quotations are not readily available. The Trustees have delegated to GSAM day-to-day responsibility for implementing and maintaining internal controls and procedures related to the valuation of the Fund’s investments. To assess the continuing appropriateness of pricing sources and methodologies, GSAM regularly performs price verification procedures and issues challenges as necessary to third party pricing vendors or brokers, and any differences are reviewed in accordance with the Valuation Procedures.
A. Level 1 and Level 2 Fair Value Investments — The valuation techniques and significant inputs used in determining the fair values for investments classified as Level 1 and Level 2 are as follows:
Equity Securities — Equity securities traded on a United States (“U.S.”) securities exchange or the NASDAQ system, or those located on certain foreign exchanges, including but not limited to the Americas, are valued daily at their last sale price or official closing price on the principal exchange or system on which they are traded. If there is no sale or official closing price or such price is believed by GSAM to not represent fair value, equity securities are valued at the last bid price for long positions and at the last ask price for short positions. To the extent these investments are actively traded, they are classified as Level 1 of the fair value hierarchy, otherwise they are generally classified as Level 2.
22
GOLDMAN SACHS GQG PARTNERS INTERNATIONAL OPPORTUNITIES FUND
|
| 3. INVESTMENTS AND FAIR VALUE MEASUREMENTS (continued) |
Unlisted equity securities for which market quotations are available are valued at the last sale price on the valuation date, or if no sale occurs, at the last bid price, and are generally classified as Level 2. Securities traded on certain foreign securities exchanges are valued daily at fair value determined by an independent fair value service (if available) under Valuation Procedures approved by the Trustees and consistent with applicable regulatory guidance. The independent fair value service takes into account multiple factors including, but not limited to, movements in the securities markets, certain depositary receipts, futures contracts and foreign currency exchange rates that have occurred subsequent to the close of the foreign securities exchange. These investments are generally classified as Level 2 of the fair value hierarchy.
Money Market Funds — Investments in the Goldman Sachs Financial Square Government Fund (“Underlying Fund”) are valued at the NAV of the Institutional Share class on the day of valuation. These investments are generally classified as Level 1 of the fair value hierarchy. For information regarding the Underlying Fund’s accounting policies and investment holdings, please see the Underlying Fund’s shareholder report.
Derivative Contracts — A derivative is an instrument whose value is derived from underlying assets, indices, reference rates or a combination of these factors. The Fund enters into derivative transactions to hedge against changes in interest rates, securities prices, and/or currency exchange rates, to increase total return, or to gain access to certain markets or attain exposure to other underliers.
Exchange-traded derivatives, including futures and options contracts, are generally valued at the last sale or settlement price on the exchange where they are principally traded. Exchange-traded options without settlement prices are generally valued at the midpoint of the bid and ask prices on the exchange where they are principally traded (or, in the absence of two-way trading, at the last bid price for long positions and the last ask price for short positions). Exchange-traded derivatives typically fall within Level 1 of the fair value hierarchy. Over-the-counter (“OTC”) and centrally cleared derivatives are valued using market transactions and other market evidence, including market-based inputs to models, calibration to market-clearing transactions, broker or dealer quotations, or other alternative pricing sources. Where models are used, the selection of a particular model to value OTC and centrally cleared derivatives depends upon the contractual terms of, and specific risks inherent in, the instrument, as well as the availability of pricing information in the market. Valuation models require a variety of inputs, including contractual terms, market prices, yield curves, credit curves, measures of volatility, voluntary and involuntary prepayment rates, loss severity rates and correlations of such inputs. For OTC and centrally cleared derivatives that trade in liquid markets, model inputs can generally be verified and model selection does not involve significant management judgment. OTC and centrally cleared derivatives are classified within Level 2 of the fair value hierarchy when significant inputs are corroborated by market evidence.
i. Forward Contracts — A forward contract is a contract between two parties to buy or sell an asset at a specified price on a future date. A forward contract settlement can occur on a cash or delivery basis. Forward contracts are marked-to-market daily using independent vendor prices, and the change in value, if any, is recorded as an unrealized gain or loss. Cash and certain investments may be used to collateralize forward contracts.
A forward foreign currency exchange contract is a forward contract in which the Fund agrees to receive or deliver a fixed quantity of one currency for another, at a pre-determined price at a future date. All forward foreign currency exchange contracts are marked-to-market daily at the applicable forward rate. Non-deliverable forward foreign currency exchange contracts are settled with the counterparty in cash without the delivery of foreign currency.
B. Level 3 Fair Value Investments — To the extent that significant inputs to valuation models and other alternative pricing sources are unobservable, or if quotations are not readily available, or if GSAM believes that such quotations do not accurately reflect fair value, the fair value of the Fund’s investments may be determined under Valuation Procedures approved by the Trustees. GSAM, consistent with its procedures and applicable regulatory guidance, may make an adjustment to the most recent valuation prices of either domestic or foreign securities in light of significant events to reflect what it believes to be the fair value of the securities at the time of determining the Fund’s NAV. Significant events which could affect a large number of securities in a particular market may include, but are not limited to: significant fluctuations in U.S. or foreign markets; market dislocations; market disruptions; or unscheduled market closings. Significant events which could also affect a single issuer may include, but are not limited to: corporate actions such as reorganizations, mergers and buy-outs; ratings downgrades; and bankruptcies.
23
GOLDMAN SACHS GQG PARTNERS INTERNATIONAL OPPORTUNITIES FUND
Notes to Financial Statements (continued)
October 31, 2018
|
| 3. INVESTMENTS AND FAIR VALUE MEASUREMENTS (continued) |
C. Fair Value Hierarchy — The following is a summary of the Fund’s investments and derivatives classified in the fair value hierarchy as of October 31, 2018:
| | | | | | | | | | | | |
| | | |
| Investment Type | | Level 1 | | | Level 2 | | | Level 3 | |
| Assets | | | | | | | | | | | | |
Common Stock and/or Other Equity Investments(a) | | | | | | | | | | | | |
Asia | | $ | 73,861,426 | | | $ | 212,062,402 | | | $ | — | |
Australia and Oceania | | | — | | | | 76,734,106 | | | | — | |
Europe | | | 70,981,537 | | | | 605,149,690 | | | | — | |
North America | | | 179,950,502 | | | | — | | | | — | |
South America | | | 5,106,684 | | | | — | | | | — | |
Investment Company | | | 39,990,504 | | | | — | | | | — | |
| Total | | $ | 369,890,653 | | | $ | 893,946,198 | | | $ | — | |
| (a) | | Amounts are disclosed by continent to highlight the impact of time zone differences between local market close and the calculation of net asset value. Security valuations are based on the principal exchange or system on which they are traded, which may differ from country of domicile. The Fund utilizes fair value model prices provided by an independent fair value service for international equities, resulting in a Level 2 classification. |
For further information regarding security characteristics, see the Schedule of Investments.
| | |
| 4. INVESTMENTS IN DERIVATIVES |
The following table sets forth, by certain risk types, the Fund’s gains (losses) related to these derivatives and their indicative volumes for the fiscal year ended October 31, 2018. These gains (losses) should be considered in the context that these derivative contracts may have been executed to create investment opportunities and/or economically hedge certain investments, and accordingly, certain gains (losses) on such derivative contracts may offset certain (losses) gains attributable to investments. These gains (losses) are included in “Net realized gain (loss)” or “Net change in unrealized gain (loss)” on the Statement of Operations:
| | | | | | | | |
| Risk | | Statement of Operations | | Net Realized
Gain (Loss) | | | Average
Number of
Contracts(a) |
Currency | | Net realized gain (loss) from forward foreign currency exchange contracts | | $ | (103,063) | | | 1 |
| (a) | | Average number of contracts is based on the average of month end balances for the fiscal year ended October 31, 2018. |
In order to better define its contractual rights and to secure rights that will help the Fund mitigate its counterparty risk, the Fund may enter into an International Swaps and Derivatives Association, Inc. Master Agreement (“ISDA Master Agreement”) or similar agreement with its derivatives counterparties. An ISDA Master Agreement is a bilateral agreement between the Fund and a counterparty that governs OTC derivatives (including forward foreign currency exchange contracts, and certain options and swaps), and typically contains, among other things, collateral posting terms and netting provisions in the event of a default and/or termination event. The provisions of the ISDA Master Agreement typically permit a single net payment in the event of a default (close-out netting) or similar event, including the bankruptcy or insolvency of the counterparty.
Collateral and margin requirements differ between exchange traded derivatives and OTC derivatives. Margin requirements are established by the broker or clearing house for exchange-traded and centrally cleared derivatives (financial futures contracts, options and centrally cleared swaps) pursuant to governing agreements for those instrument types. Brokers can ask for margin in excess of the minimum in certain circumstances. Collateral terms are contract-specific for OTC derivatives. For derivatives traded under an ISDA Master Agreement, the collateral requirements are typically calculated by netting the marked to market amount for each transaction under such agreement and comparing that amount to the value of any collateral currently pledged by the Fund and the counterparty. Additionally, the Fund may be required to post initial margin to the counterparty, the terms of which would be outlined in the confirmation of the OTC transaction.
24
GOLDMAN SACHS GQG PARTNERS INTERNATIONAL OPPORTUNITIES FUND
|
| 4. INVESTMENTS IN DERIVATIVES (continued) |
For financial reporting purposes, cash collateral that has been pledged to cover obligations of the Fund and cash collateral received from the counterparty, if any, is reported separately on the Statement of Assets and Liabilities as receivables/payables for collateral on certain derivative contracts. Non-cash collateral pledged by the Fund, if any, is noted in the Schedule of Investments. Generally, the amount of collateral due from or to a counterparty must exceed a minimum transfer amount threshold before a transfer is required to be made. To the extent amounts due to the Fund from its counterparties are not fully collateralized, contractually or otherwise, the Fund bears the risk of loss from counterparty nonperformance. The Fund attempts to mitigate counterparty risk by only entering into agreements with counterparties that the Sub-Adviser believes to be of good standing and by monitoring the financial stability of those counterparties.
Additionally, the netting of assets and liabilities and the offsetting of collateral pledged or received are based on contractual netting/set-off provisions in the ISDA Master Agreement or similar agreements. However, in the event of a default or insolvency of a counterparty, a court could determine that such rights are not enforceable due to the restrictions or prohibitions against the right of setoff that may be imposed in accordance with a particular jurisdiction’s bankruptcy or insolvency laws.
| | |
| 5. AGREEMENTS AND AFFILIATED TRANSACTIONS |
A. Management Agreement — Under the Agreement, GSAM manages the Fund, subject to the general supervision of the Trustees.
As compensation for the services rendered pursuant to the Agreement, the assumption of the expenses related thereto and administration of the Fund’s business affairs, including providing facilities, GSAM is entitled to a management fee, accrued daily and paid monthly, equal to an annual percentage rate of the Fund’s average daily net assets.
For the fiscal year ended October 31, 2018, contractual and effective net management fees with GSAM were at the following rates:
| | | | | | | | | | | | | | | | | | | | | | | | | | |
| Contractual Management Rate | | | | | | | |
First $1 Billion | | | Next $1 Billion | | | Next $3 Billion | | | Next $3 Billion | | | Over $8 Billion | | | Effective Rate | | | Effective Net Management Rate^ | |
| | 0.85% | | | | 0.77% | | | | 0.73% | | | | 0.71% | | | | 0.70% | | | | 0.84% | | | | 0.84% | |
| ^ | | Effective Net Management Rate includes the impact of management fee waivers of affiliated underlying funds, if any. |
The Fund invests in Institutional Shares of the Goldman Sachs Financial Square Government Fund, which is an affiliated Underlying Fund. GSAM has agreed to waive a portion of its management fee payable by the Fund in an amount equal to the management fee it earns as an investment adviser to the affiliated Underlying Fund in which the Fund invests, except those management fees it earns from the Fund’s investment of cash collateral received in connection with securities lending transactions in the Goldman Sachs Financial Square Government Fund. For the fiscal year ended October 31, 2018, GSAM waived $ 25,285 of the Fund’s management fee.
B. Distribution and/or Service (12b-1) Plans — The Trust, on behalf of Class A and Class R Shares of the Fund, has adopted Distribution and Service Plans subject to Rule 12b-1 under the Act. Under the Distribution and Service Plans, Goldman Sachs, which serves as distributor (the “Distributor”), is entitled to a fee accrued daily and paid monthly for distribution services and personal and account maintenance services, which may then be paid by Goldman Sachs to authorized dealers. These fees are equal to an annual percentage rate of the average daily net assets attributable to Class A or Class R Shares of the Fund, as applicable.
The Trust, on behalf of Class C Shares of the Fund, has adopted a Distribution Plan subject to Rule 12b-1 under the Act. Under the Distribution Plan, Goldman Sachs as Distributor is entitled to a fee accrued daily and paid monthly for distribution
25
GOLDMAN SACHS GQG PARTNERS INTERNATIONAL OPPORTUNITIES FUND
Notes to Financial Statements (continued)
October 31, 2018
|
| 5. AGREEMENTS AND AFFILIATED TRANSACTIONS (continued) |
services, which may then be paid by Goldman Sachs to authorized dealers. These fees are equal to an annual percentage rate of the average daily net assets attributable to Class C Shares of the Fund.
| | | | | | | | | | | | |
| |
| | | Distribution and/or Service Plan Rates | |
| | | Class A* | | | Class C | | | Class R* | |
Distribution and/or Service Plan | | | 0.25 | % | | | 0.75 | % | | | 0.50 | % |
| * | | With respect to Class A and Class R Shares, the Distributor at its discretion may use compensation for distribution services paid under the Distribution Plan to compensate service organizations for personal and account maintenance services and expenses as long as such total compensation does not exceed the maximum cap on “service fees” imposed by the Financial Industry Regulatory Authority. |
C. Distribution Agreement — Goldman Sachs, as Distributor of the shares of the Fund pursuant to a Distribution Agreement, may retain a portion of the Class A Shares’ front end sales charge and Class C Shares’ CDSC. During the fiscal year ended October 31, 2018, Goldman Sachs retained $34,630 of the front end sales charges for the Fund.
D. Service Plan — The Trust, on behalf of the Fund, has adopted a Service Plan to allow Class C Shares to compensate service organizations (including Goldman Sachs) for providing varying levels of personal and account maintenance services to their customers who are beneficial owners of such shares. The Service Plan provides for compensation to the service organizations equal to an annual percentage rate of 0.25% of the average daily net assets attributable to Class C Shares of the Fund.
E. Transfer Agency Agreement — Goldman Sachs also serves as the transfer agent of the Fund for a fee pursuant to the Transfer Agency Agreement. The fees charged for such transfer agency services are accrued daily and paid monthly at annual rates as follows: 0.18% of the average daily net assets of Class A, Class C, Investor and Class R Shares; 0.03% of the average daily net assets of Class P and Class R6 Shares; and 0.04% of the average daily net assets of Institutional Shares.
Goldman Sachs has agreed to waive a portion of its transfer agency fee equal to 0.01% as an annual percentage rate of the average daily net assets attributable to Class R6 Shares and Class P Shares of the Fund. These arrangements will remain in effect through at least February 28, 2019 with respect to Class R6 Shares, and April 16, 2019 with respect to Class P Shares, and prior to such dates Goldman Sachs may not terminate these arrangements without the approval of the Board of Trustees.
F. Other Expense Agreements and Affiliated Transactions — GSAM has agreed to limit certain “Other Expenses” of the Fund (excluding acquired fund fees and expenses, transfer agency fees and expenses, service fees, taxes, dividend and interest payments on securities sold short, interest, brokerage fees, expenses of shareholder meetings, litigation and indemnification, and extraordinary expenses) to the extent such expenses exceed, on an annual basis, a percentage rate of the average daily net assets of the Fund. Such Other Expense reimbursements, if any, are accrued daily and paid monthly. In addition, the Fund is not obligated to reimburse GSAM for prior fiscal year expense reimbursements, if any. The Other Expense limitation as an annual percentage rate of average daily net assets for the Fund is 0.014%. The Other Expense limitation will remain in place through at least February 28, 2019 for Class A, Class C, Institutional, Investor, Class R and Class R6 Shares, and through at least April 16, 2019 for Class P Shares, and prior to such dates GSAM may not terminate the arrangements without the approval of the Trustees. In addition, the Fund has entered into certain offset arrangements with the transfer agent, which may result in a reduction of the Fund’s expenses and are received irrespective of the application of the “Other Expense” limitation described above.
For the fiscal year ended October 31, 2018, these expense reductions, including any fee waivers and Other Expense reimbursements, were as follows:
| | | | | | | | | | | | | | |
Management Fee Waiver | | | Transfer Agency Waivers/Credits | | | Other Expense Reimbursements | | | Total Expense Reductions | |
| $ | 25,285 | | | $ | 6,782 | | | $ | 858,156 | | | $ | 890,223 | |
G. Line of Credit Facility — As of October 31, 2018, the Fund participated in a $770,000,000 committed, unsecured revolving line of credit facility (the “facility”) together with other funds of the Trust and certain registered investment companies having management agreements with GSAM or its affiliates. This facility is to be used for temporary emergency purposes, or to allow for
26
GOLDMAN SACHS GQG PARTNERS INTERNATIONAL OPPORTUNITIES FUND
|
| 5. AGREEMENTS AND AFFILIATED TRANSACTIONS (continued) |
an orderly liquidation of securities to meet redemption requests. The interest rate on borrowings is based on the federal funds rate. The facility also requires a fee to be paid by the Fund based on the amount of the commitment that has not been utilized. For the fiscal year ended October 31, 2018, the Fund did not have any borrowings under the facility.
H. Other Transactions with Affiliates — For the fiscal year ended October 31, 2018, Goldman Sachs earned $386 in brokerage commissions from portfolio transactions on behalf of the Fund.
As of October 31, 2018 The Goldman Sachs Group, Inc. was the beneficial owner of approximately 49% of Class R Shares.
The table below shows the transactions in and earnings from investments in the Goldman Sachs Financial Square Government Fund for the fiscal year ended October 31, 2018:
| | | | | | | | | | | | | | | | | | |
Beginning value as of October 31, 2017 | | Purchases at Cost | | Proceeds from Sales | | | Ending value as of October 31, 2018 | | | Shares as of October 31, 2018 | | | Dividend Income | |
| $11,456,987 | | $637,639,186 | | $ | (609,105,669 | ) | | $ | 39,990,504 | | | | 39,990,504 | | | $ | 259,333 | |
Pursuant to exemptive relief granted by the Securities and Exchange Commission (“SEC”) and the terms and conditions contained therein, the Fund may lend their securities through a securities lending agent, Goldman Sachs Agency Lending (“GSAL”), a wholly-owned subsidiary of Goldman Sachs, to certain qualified borrowers including Goldman Sachs and affiliates. In accordance with the Fund’s securities lending procedures, the Fund receive cash collateral at least equal to the market value of the securities on loan. The market value of the loaned securities is determined at the close of business of the Fund, at their last sale price or official closing price on the principal exchange or system on which they are traded, and any additional required collateral is delivered to the Fund on the next business day. As with other extensions of credit, the Fund may experience delay in the recovery of their securities or incur a loss should the borrower of the securities breach its agreement with the Fund or become insolvent at a time when the collateral is insufficient to cover the cost of repurchasing securities on loan. Dividend income received from securities on loan may not be subject to withholding taxes and therefore withholding taxes paid may differ from the amounts listed in the Statement of Operations. Loans of securities are terminable at any time and as such 1) the remaining contractual maturities of the outstanding securities lending transactions are considered to be overnight and continuous and 2) the borrower, after notice, is required to return borrowed securities within the standard time period for settlement of securities transactions.
The Fund invests the cash collateral received in connection with securities lending transactions in the Goldman Sachs Financial Square Government Fund (“Government Money Market Fund”), an affiliated series of the Trust. The Government Money Market Fund is registered under the Act as an open end investment company, is subject to Rule 2a-7 under the Act, and is managed by GSAM, for which GSAM may receive a management fee of up to 0.16% (prior to February 21, 2018, GSAM may have received a management fee of up to 0.205%) on an annualized basis of the average daily net assets of the Government Money Market Fund.
In the event of a default by a borrower with respect to any loan, GSAL will exercise any and all remedies provided under the applicable borrower agreement to make the Fund whole. These remedies include purchasing replacement securities by applying the collateral held from the defaulting broker against the purchase cost of the replacement securities. If GSAL is unable to purchase replacement securities, GSAL will indemnify the Fund by paying an amount equal to the market value of the securities loaned minus the value of cash collateral received from the borrower for the loan, subject to an exclusion for any shortfalls resulting from a loss of value in such cash collateral due to reinvestment risk. The Fund’s loaned securities were all subject to enforceable Securities Lending Agreements and the value of the collateral was at least equal to the value of the cash received. The Fund did not have securities on loan as of October 31, 2018.
The Fund and GSAL received compensation relating to the lending of the Fund’s securities. The amount earned by the Fund for the fiscal year ended October 31, 2018, are reported under Investment Income on the Statement of Operations.
27
GOLDMAN SACHS GQG PARTNERS INTERNATIONAL OPPORTUNITIES FUND
Notes to Financial Statements (continued)
October 31, 2018
|
| 6. SECURITIES LENDING (continued) |
The table below details securities lending activity with affiliates of Goldman Sachs.
| | | | | | | | | | | | | | |
| | | | | For the Fiscal Year Ended October 31, 2018 | | | Amounts Payable to
Goldman Sachs Upon
Return of
Securities Loaned as of
October 31, 2018 | |
| | | | | Earnings of GSAL Relating to Securities
Loaned | | | Amounts Received by the Fund’s from Lending to Goldman Sachs | |
| | | | | $ | 4,686 | | | $ | 5,130 | | | $ | — | |
The following table provides information about the Fund’s investments in the Government Money Market Fund for the fiscal year ended October 31, 2018.
| | | | | | | | | | |
Market Value as of
October 31, 2017 | | Purchases
at Cost | | Proceeds
from Sales | | | Market
Value as of
October 31, 2018 | |
| $— | | $76,413,253 | | $ | (76,413,253 | ) | | $ | — | |
| | |
| 7. PORTFOLIO SECURITIES TRANSACTIONS |
The cost of purchases and proceeds from sales and maturities of long-term securities for the fiscal year ended October 31, 2018, were $ 1,650,966,667 and $ 814,305,417, respectively.
The tax character of distributions paid during the fiscal year ended October 31, 2018 was as follows:
| | | | |
Distributions paid from: | | | | |
Ordinary income | | $ | 821,410 | |
Net long-term capital gains | | | — | |
Total taxable distributions | | $ | 821,410 | |
The tax character of distributions paid during the period ended October 31, 2017 was as follows:
| | | | |
Distributions paid from: | | | | |
Ordinary income | | $ | 17,890 | |
Net long-term capital gains | | | — | |
Total taxable distributions | | $ | 17,890 | |
28
GOLDMAN SACHS GQG PARTNERS INTERNATIONAL OPPORTUNITIES FUND
|
| 8. TAX INFORMATION (continued) |
As of October 31, 2018, the components of accumulated earnings (losses) on a tax basis were as follows:
| | | | |
Undistributed ordinary income — net | | $ | 6,036,177 | |
Undistributed long-term capital gains | | | — | |
Total undistributed earnings | | $ | 6,036,177 | |
Capital loss carryforwards: | | | | |
Perpetual Short-Term | | $ | (23,652,489 | ) |
Unrealized gains (losses) — net | | | (11,379,367 | ) |
Total accumulated earnings (losses) net | | $ | (28,995,679 | ) |
As of October 31, 2018, the Fund’s aggregate security unrealized gains and losses based on cost for U.S. federal income tax purposes were as follows:
| | | | |
Tax cost | | $ | 1,275,170,352 | |
Gross unrealized gain | | | 37,085,543 | |
Gross unrealized loss | | | (48,464,910) | |
Net unrealized security loss | | $ | (11,379,367) | |
The difference between GAAP-basis and tax basis unrealized gains (losses) is attributable primarily to wash sales.
The Fund reclassed $8,548 from paid in capital to distributable earning for the year ending October 31, 2018. In order to present certain components of the Fund’s capital accounts on a tax-basis, certain reclassifications have been recorded to the Fund’s accounts. These reclassifications have no impact on the net asset value of the Fund and result primarily from non-deductible expenses.
GSAM has reviewed the Fund’s tax positions for all open tax years (the current and prior year, as applicable) and has concluded that no provision for income tax is required in the Fund’s financial statements. Such open tax years remain subject to examination and adjustment by tax authorities.
The Fund’s risks include, but are not limited to, the following:
Derivatives Risk — The Fund’s use of derivatives may result in loss. Derivative instruments, which may pose risks in addition to and greater than those associated with investing directly in securities, currencies or other instruments, may be illiquid or less liquid, volatile, difficult to price and leveraged so that small changes in the value of the underlying instruments may produce disproportionate losses to the Fund. Derivatives are also subject to counterparty risk, which is the risk that the other party in the transaction will not fulfill its contractual obligation. The use of derivatives is a highly specialized activity that involves investment techniques and risks different from those associated with investments in more traditional securities and instruments. Losses from derivatives can also result from a lack of correlation between changes in the value of derivative instruments and the portfolio assets (if any) being hedged.
Foreign and Emerging Countries Risk — Investing in foreign markets may involve special risks and considerations not typically associated with investing in the United States. Foreign securities may be subject to risk of loss because of more or less foreign government regulation, less public information and less economic, political and social stability in the countries in which the Fund invests. The imposition of exchange controls (including repatriation restrictions), confiscations, trade restrictions (including tariffs) and other government restrictions by the United States or other governments, or from problems in share registration, settlement or custody, may also result in losses. Foreign risk also involves the risk of negative foreign currency rate fluctuations,
29
GOLDMAN SACHS GQG PARTNERS INTERNATIONAL OPPORTUNITIES FUND
Notes to Financial Statements (continued)
October 31, 2018
|
| 9. OTHER RISKS (continued) |
which may cause the value of securities denominated in such foreign currency (or other instruments through which the Fund has exposure to foreign currencies) to decline in value. Currency exchange rates may fluctuate significantly over short periods of time.
To the extent that the Fund also invests in securities of issuers located in emerging markets, these risks may be more pronounced.
Foreign Custody Risk — If the Fund invests in foreign securities, the Fund may hold such securities and cash with foreign banks, agents, and securities depositories appointed by the Fund’s custodian (each a “Foreign Custodian”). Some foreign custodians may be recently organized or new to the foreign custody business. In some countries, Foreign Custodians may be subject to little or no regulatory oversight over, or independent evaluation of, their operations. Further, the laws of certain countries may place limitations on a Fund’s ability to recover its assets if a Foreign Custodian enters bankruptcy.
Investments in emerging markets may be subject to even greater custody risks than investments in more developed markets. Custody services in emerging market countries are very often undeveloped and may be considerably less well regulated than in more developed countries, and thus may not afford the same level of investor protection as would apply in developed countries.
Geographic Risk — If the Fund focuses its investments in securities of issuers located in a particular country or geographic region, the Fund may be subjected, to a greater extent than if its investments were less focused, to the risks of volatile economic cycles and/or conditions and developments that may be particular to that country or region, such as: adverse securities markets; adverse exchange rates; adverse social, political, regulatory, economic, business, environmental or other developments; or natural disasters.
Large Shareholder Transactions Risk — The Fund may experience adverse effects when certain large shareholders, such as other funds, institutional investors (including those trading by use of non-discretionary mathematical formulas), financial intermediaries (who may make investment decisions on behalf of underlying clients and/or include the Fund in their investment model), individuals, accounts and Goldman Sachs affiliates, purchase or redeem large amounts of shares of the Fund. Such large shareholder redemptions may cause the Fund to sell portfolio securities at times when it would not otherwise do so, which may negatively impact the Fund’s NAV and liquidity. These transactions may also accelerate the realization of taxable income to shareholders if such sales of investments resulted in gains, and may also increase transaction costs. In addition, a large redemption could result in the Fund’s current expenses being allocated over a smaller asset base, leading to an increase in the Fund’s expense ratio. Similarly, large Fund share purchases may adversely affect the Fund’s performance to the extent that the Fund is delayed in investing new cash and is required to maintain a larger cash position than it ordinarily would.
Liquidity Risk — The Fund may make investments that are illiquid or that may become less liquid in response to market developments or adverse investor perceptions. Illiquid investments may be more difficult to value. Liquidity risk may also refer to the risk that the Fund will not be able to pay redemption proceeds within the allowable time period because of unusual market conditions, an unusually high volume of redemption requests, or other reasons. To meet redemption requests, the Fund may be forced to sell investments at an unfavorable time and/or under unfavorable conditions. These risks may be more pronounced
in connection with the Fund’s investments in securities of issuers located in emerging market countries.
Market and Credit Risks — In the normal course of business, the Fund trades financial instruments and enters into financial transactions where risk of potential loss exists due to changes in the market (market risk). Additionally, the Fund may also be exposed to credit risk in the event that an issuer or guarantor fails to perform or that an institution or entity with which the Fund has unsettled or open transactions defaults.
Non-Diversification Risk — The Fund is non-diversified, meaning that it is permitted to invest a larger percentage of its assets in fewer issuers than diversified mutual funds. Thus, the Fund may be more susceptible to adverse developments affecting any single issuer held in its portfolio, and may be more susceptible to greater losses because of these developments.
30
GOLDMAN SACHS GQG PARTNERS INTERNATIONAL OPPORTUNITIES FUND
In September 2018, the Financial Accounting Standards Board issued Accounting Standards Update (ASU) 2018-13 — Fair Value Measurement (Topic 820) Disclosure Framework — Changes to the Disclosure Requirements for Fair Value Measurement. The amendments in the ASU modify fair value measurement disclosures. The amendments are effective for the Fund’s fiscal year beginning after December 15, 2019. GSAM is currently evaluating the impact, if any, of the amendments.
Under the Trust’s organizational documents, its Trustees, officers, employees and agents are indemnified, to the extent permitted by the Act and state law, against certain liabilities that may arise out of performance of their duties to the Fund. Additionally, in the course of business, the Fund enters into contracts that contain a variety of indemnification clauses. The Fund’s maximum exposure under these arrangements is unknown, as this would involve future claims that may be made against the Fund that have not yet occurred. However, GSAM believes the risk of loss under these arrangements to be remote.
Subsequent events after the Statement of Assets and Liabilities date have been evaluated, and GSAM has concluded that there is no impact requiring adjustment or disclosure in the financial statements.
31
GOLDMAN SACHS GQG PARTNERS INTERNATIONAL OPPORTUNITIES FUND
Notes to Financial Statements (continued)
October 31, 2018
|
| 13. SUMMARY OF SHARE TRANSACTIONS |
Share activity is as follows:
| | | | | | | | | | | | | | | | |
| | | For the Fiscal Year Ended
October 31, 2018 | | | For the Period Ended
October 31, 2017(a) | |
| | | Shares | | | Dollars | | | Shares | | | Dollars | |
| | | | |
| Class A Shares | | | | | | | | | | | | | | | | |
Shares sold | | | 3,879,279 | | | $ | 51,311,140 | | | | 1,155,052 | | | $ | 13,447,997 | |
Reinvestment of distributions | | | — | | | | — | | | | 1 | | | | 5 | |
Shares redeemed | | | (1,127,407 | ) | | | (14,848,690 | ) | | | (265,002 | ) | | | (3,137,669 | ) |
| | | | 2,751,872 | | | | 36,462,450 | | | | 890,051 | | | | 10,310,333 | |
| Class C Shares | | | | | | | | | | | | | | | | |
Shares sold | | | 1,211,964 | | | | 15,889,397 | | | | 1,032,450 | | | | 12,144,475 | |
Reinvestment of distributions | | | — | | | | — | | | | 1 | | | | 2 | |
Shares redeemed | | | (582,916 | ) | | | (7,687,403 | ) | | | (4,357 | ) | | | (53,389 | ) |
| | | | 629,048 | | | | 8,201,994 | | | | 1,028,094 | | | | 12,091,088 | |
| Institutional Shares | | | | | | | | | | | | | | | | |
Shares sold | | | 47,829,586 | | | | 634,794,623 | | | | 32,762,823 | | | | 378,977,813 | |
Reinvestment of distributions | | | 55,896 | | | | 721,621 | | | | 1,806 | | | | 17,866 | |
Shares redeemed | | | (21,095,175 | ) | | | (281,335,801 | ) | | | (1,964,689 | ) | | | (23,989,162 | ) |
| | | | 26,790,307 | | | | 354,180,443 | | | | 30,799,940 | | | | 355,006,517 | |
| Investor Shares | | | | | | | | | | | | | | | | |
Shares sold | | | 17,770,210 | | | | 234,768,975 | | | | 5,063,139 | | | | 61,203,795 | |
Reinvestment of distributions | | | 7,027 | | | | 90,579 | | | | 1 | | | | 6 | |
Shares redeemed | | | (3,777,143 | ) | | | (49,472,001 | ) | | | (82,975 | ) | | | (1,015,475 | ) |
| | | | 14,000,094 | | | | 185,387,553 | | | | 4,980,165 | | | | 60,188,326 | |
| Class P Shares(b) | | | | | | | | | | | | | | | | |
Shares sold | | | 21,469,251 | | | | 286,501,481 | | | | — | | | | — | |
Shares redeemed | | | (2,612,637 | ) | | | (32,501,143 | ) | | | — | | | | — | |
| | | | 18,856,614 | | | | 254,000,338 | | | | — | | | | — | |
| Class R Shares | | | | | | | | | | | | | | | | |
Shares sold | | | 1,032 | | | | 13,500 | | | | 1,364 | | | | 14,170 | |
Reinvestment of distributions | | | — | | | | — | | | | 1 | | | | 4 | |
Shares redeemed | | | (363 | ) | | | (4,738 | ) | | | (1 | ) | | | (10 | ) |
| | | | 669 | | | | 8,762 | | | | 1,364 | | | | 14,164 | |
| Class R6 Shares | | | | | | | | | | | | | | | | |
Shares sold | | | 43,936 | | | | 585,126 | | | | 1,001 | | | | 10,010 | |
Reinvestment of distributions | | | 2 | | | | 27 | | | | 1 | | | | 7 | |
Shares redeemed | | | (1,383 | ) | | | (18,656 | ) | | | (1 | ) | | | (10 | ) |
| | | | 42,555 | | | | 566,497 | | | | 1,001 | | | | 10,007 | |
NET INCREASE | | | 63,071,159 | | | $ | 838,808,037 | | | | 37,700,615 | | | $ | 437,620,435 | |
| (a) | | Commenced operations on December 15, 2016. |
| (b) | | Commenced operations on April 16, 2018. |
32
Report of Independent Registered Public
Accounting Firm
To the Board of Trustees of Goldman Sachs Trust II and Shareholders of Goldman Sachs GQG Partners International Opportunities Fund
Opinion on the Financial Statements
We have audited the accompanying statement of assets and liabilities, including the schedule of investments, of Goldman Sachs GQG Partners International Opportunities Fund (one of the funds constituting Goldman Sachs Trust II, referred to hereafter as the “Fund”) as of October 31, 2018, the related statement of operations for the year ended October 31, 2018 and the statement of changes in net assets and the financial highlights for the year ended October 31, 2018 and for the period December 15, 2016 (commencement of operations) through October 31, 2017, including the related notes (collectively referred to as the “financial statements”). In our opinion, the financial statements present fairly, in all material respects, the financial position of the Fund as of October 31, 2018, the results of its operations for the year ended October 31, 2018, and the changes in its net assets and the financial highlights for the year ended October 31, 2018 and for the period December 15, 2016 (commencement of operations) through October 31, 2017 in conformity with accounting principles generally accepted in the United States of America.
Basis for Opinion
These financial statements are the responsibility of the Fund’s management. Our responsibility is to express an opinion on the Fund’s financial statements based on our audits. We are a public accounting firm registered with the Public Company Accounting Oversight Board (United States) (“PCAOB”) and are required to be independent with respect to the Fund in accordance with the U.S. federal securities laws and the applicable rules and regulations of the Securities and Exchange Commission and the PCAOB.
We conducted our audits of these financial statements in accordance with the standards of the PCAOB. Those standards require that we plan and perform the audit to obtain reasonable assurance about whether the financial statements are free of material misstatement, whether due to error or fraud.
Our audits included performing procedures to assess the risks of material misstatement of the financial statements, whether due to error or fraud, and performing procedures that respond to those risks. Such procedures included examining, on a test basis, evidence regarding the amounts and disclosures in the financial statements. Our audits also included evaluating the accounting principles used and significant estimates made by management, as well as evaluating the overall presentation of the financial statements. Our procedures included confirmation of securities owned as of October 31, 2018 by correspondence with the custodian, transfer agent and brokers; when replies were not received from brokers, we performed other auditing procedures. We believe that our audits provide a reasonable basis for our opinion.
PricewaterhouseCoopers LLP
Boston, Massachusetts
December 27, 2018
We have served as the auditor of one or more investment companies in the Goldman Sachs fund complex since 2000.
33
GOLDMAN SACHS GQG PARTNERS INTERNATIONAL OPPORTUNITIES FUND
| | |
Fund Expenses — Six Month Period Ended October 31, 2018 (Unaudited) | | |
As a shareholder of Class A, Class C, Institutional, Investor, Class P, Class R or Class R6 Shares of the Fund, you incur two types of costs: (1) transaction costs, including sales charges on purchase payments (with respect to Class A Shares) and contingent deferred sales charges on redemptions (with respect to Class C Shares); and (2) ongoing costs, including management fees; distribution and/or service (12b-1) fees (with respect to Class A, Class C and Class R Shares); and other Fund expenses. This example is intended to help you understand your ongoing costs (in dollars) of investing in Class A, Class C, Institutional, Investor, Class P, Class R and Class R6 Shares of the Fund and to compare these costs with the ongoing costs of investing in other mutual funds.
The example is based on an investment of $1,000 invested at the beginning of the period and held for the entire period from May 1, 2018 through October 31, 2018, which represents a period of 184 days out of 365 day year.
Actual Expenses — The first line in the table below provides information about actual account values and actual expenses. You may use the information in this line, together with the amount you invested, to estimate the expenses that you paid over the period. Simply divide your account value by $1,000 (for example, an $8,600 account value divided by $1,000=8.6), then multiply the result by the number in the first line under the heading entitled “Expenses Paid” to estimate the expenses you paid on your account during this period.
Hypothetical Example for Comparison Purposes — The second line in the table below provides information about hypothetical account values and hypothetical expenses based on the Fund’s actual net expense ratios and an assumed rate of return of 5% per year before expenses, which is not the Fund’s actual return. The hypothetical account values and expenses may not be used to estimate the actual ending account balance or expenses you paid for the period. You may use this information to compare the ongoing costs of investing in the Fund and other funds. To do so, compare this 5% hypothetical example with the 5% hypothetical examples that appear in the shareholder reports of the other funds.
Please note that the expenses shown in the table are meant to highlight your ongoing costs only and do not reflect any transactional costs, such as sales charges, redemption fees, or exchange fees. Therefore, the second line of the table is useful in comparing ongoing costs only, and will not help you determine the relative total costs of owning different funds. In addition, if these transactional costs were included, your costs would have been higher.
| | | | | | | | | | | | |
| Share Class | | Beginning
Account Value
5/1/18 | | | Ending
Account Value
10/31/18 | | | Expenses Paid for the
6 months ended
10/31/18* | |
| Class A | | | | | | | | | | | | |
Actual | | $ | 1,000.00 | | | $ | 942.60 | | | $ | 6.27 | |
Hypothetical 5% return | | | 1,000.00 | | | | 1,018.75 | + | | | 6.51 | |
| Class C | | | | | | | | | | | | |
Actual | | | 1,000.00 | | | | 939.70 | | | | 9.92 | |
Hypothetical 5% return | | | 1,000.00 | | | | 1,014.97 | + | | | 10.31 | |
| Institutional | | | | | | | | | | | | |
Actual | | | 1,000.00 | | | | 945.60 | | | | 4.36 | |
Hypothetical 5% return | | | 1,000.00 | | | | 1,020.72 | + | | | 4.53 | |
| Investor | | | | | | | | | | | | |
Actual | | | 1,000.00 | | | | 944.20 | | | | 5.05 | |
Hypothetical 5% return | | | 1,000.00 | | | | 1,020.01 | + | | | 5.24 | |
| Class P | | | | | | | | | | | | |
Actual | | | 1,000.00 | | | | 945.10 | | | | 4.27 | |
Hypothetical 5% return | | | 1,000.00 | | | | 1,020.82 | + | | | 4.43 | |
| Class R | | | | | | | | | | | | |
Actual | | | 1,000.00 | | | | 941.60 | | | | 7.44 | |
Hypothetical 5% return | | | 1,000.00 | | | | 1,017.54 | + | | | 7.73 | |
| Class R6 | | | | | | | | | | | | |
Actual | | | 1,000.00 | | | | 945.10 | | | | 4.27 | |
Hypothetical 5% return | | | 1,000.00 | | | | 1,020.82 | + | | | 4.43 | |
| | * | | Expenses for each share class are calculated using the Fund’s annualized net expense ratio for each class, which represents the ongoing expenses as a percentage of net assets for the six months ended October 31, 2018. Expenses are calculated by multiplying the annualized net expense ratio by the average account value for the period; then multiplying the result by the number of days in the most recent fiscal half year; and then dividing that result by the number of days in the fiscal year. The annualized net expense ratios for the period were as follows: | |
| | + | | Hypothetical expenses are based on the Fund’s actual annualized net expense ratios and an assumed rate of return of 5% per year before expenses. | |
| | | | | | | | | | | | | | | | | | | | | | | | | | | | |
| Fund | | Class A | | | Class C | | | Institutional | | | Investor | | | Class P | | | Class R | | | Class R6 | |
GQG Partners International Opportunities | | | 1.28 | % | | | 2.03 | % | | | 0.89 | % | | | 1.03 | % | | | 0.87 | % | | | 1.52 | % | | | 0.87 | % |
34
GOLDMAN SACHS GQG PARTNERS INTERNATIONAL OPPORTUNITIES FUND
Statement Regarding Basis for Approval of Management Agreement and Sub-Advisory Agreement (Unaudited)
Background
The Goldman Sachs GQG Partners International Opportunities Fund (the “Fund”) is an investment portfolio of Goldman Sachs Trust II (the “Trust”). The Board of Trustees oversees the management of the Trust and reviews the investment performance and expenses of the Fund at regularly scheduled meetings held throughout the year. In addition, the Board of Trustees determines annually whether to approve the continuance of the Trust’s investment management agreement (the “Management Agreement”) with Goldman Sachs Asset Management, L.P. (the “Investment Adviser”) on behalf of the Fund.
The Management Agreement was most recently approved for continuation until August 31, 2019 by the Board of Trustees, including those Trustees who are not parties to the Management Agreement or “interested persons” (as defined in the Investment Company Act of 1940, as amended) of any party thereto (the “Independent Trustees”), at a meeting held on August 7-8, 2018 (the “Annual Meeting”). At the Annual Meeting, the Board also considered the sub-advisory agreement (the “Sub-Advisory Agreement” and, together with the Management Agreement, the “Agreements”) between the Investment Adviser and GQG Partners LLC (the “Sub-Adviser”).
The review process undertaken by the Trustees spans the course of the year and culminates with the Annual Meeting. To assist the Trustees in their deliberations, the Trustees have established a Contract Review Committee (the “Committee”), comprised of the Independent Trustees. The Committee held five meetings over the course of the year since the Management Agreement was last approved. At those Committee meetings, regularly scheduled Board or other committee meetings, and/or the Annual Meeting, matters relevant to the renewal of the Management Agreement and the Sub-Advisory Agreement were considered by the Board, or the Independent Trustees, as applicable. With respect to the Fund, such matters included:
| | (a) | | the nature and quality of the advisory, administrative, and other services provided to the Fund by the Investment Adviser and its affiliates and the Sub-Adviser, including, as applicable, information about: |
| | (i) | | the structure, staff, and capabilities of the Investment Adviser and the Sub-Adviser and the Sub-Adviser’s portfolio management team; |
| | (ii) | | the groups within the Investment Adviser and its affiliates that support the portfolio management teams or provide other types of necessary services, including fund services groups (e.g., accounting and financial reporting, tax, shareholder services, and operations); controls and risk management groups (e.g., legal, compliance, valuation oversight, credit risk management, internal audit, compliance testing, market risk analysis, finance, and central funding); sales and distribution support groups, and others (e.g., information technology and training); |
| | (iii) | | trends in employee headcount; |
| | (iv) | | the Investment Adviser’s financial resources and ability to hire and retain talented personnel and strengthen its operations; and |
| | (v) | | the parent company’s support of the Investment Adviser and its mutual fund business, as expressed by the firm’s senior management; |
| | (b) | | information on the investment performance of the Fund, including comparisons to the performance of similar mutual funds, as provided by a third-party mutual fund data provider engaged as part of the contract review process (the “Outside Data Provider”), and a benchmark performance index; and information on general investment outlooks in the markets in which the Fund invests; |
| | (c) | | information provided by the Investment Adviser indicating the Investment Adviser’s views on whether the Fund’s peer group and/or benchmark index had high, medium, or low relevance given the Fund’s particular investment strategy; |
| | (d) | | the terms of the Agreements and other agreements with affiliated service providers entered into by the Trust on behalf of the Fund; |
| | (e) | | fee and expense information for the Fund, including: |
| | (i) | | the relative management fee and expense levels of the Fund as compared to those of comparable funds managed by other advisers, as provided by the Outside Data Provider; |
| | (ii) | | the Fund’s expense tends over time; and |
| | (iii) | | comparative information on the advisory fees charged and services provided by the Investment Adviser to a non-U.S. fund that it manages with comparable investment strategies; |
| | (f) | | with respect to the investment performance and expense comparison data provided by the Outside Data Provider, its processes in producing that data for the Fund; |
| | (g) | | the undertakings of the Investment Adviser and its affiliates to implement fee waivers and/or expense limitations; |
| | (h) | | information relating to the profitability of the Management Agreement and the transfer agency, distribution and service arrangements of the Fund to the Investment Adviser and its affiliates; |
| | (i) | | whether the Fund’s existing management fee schedule adequately addressed any economies of scale; |
35
GOLDMAN SACHS GQG PARTNERS INTERNATIONAL OPPORTUNITIES FUND
Statement Regarding Basis for Approval of Management Agreement and Sub-Advisory Agreement (Unaudited) (continued)
| | (j) | | a summary of the “fall-out” benefits derived by the Investment Adviser and its affiliates from their relationships with the Fund, including the fees received by the Investment Adviser’s affiliates from the Fund for transfer agency, securities lending, portfolio trading, distribution and other services; |
| | (k) | | a summary of potential benefits derived by the Fund as a result of its relationship with the Investment Adviser; |
| | (l) | | portfolio manager ownership of Fund shares; the manner in which portfolio manager compensation is determined; information on the Sub-Adviser’s compensation arrangements; and the number and types of accounts managed by the portfolio manager; |
| | (m) | | the nature and quality of the services provided to the Fund by its unaffiliated service providers (including the Sub-Adviser), and the Investment Adviser’s general oversight and evaluation (including reports on due diligence) of those service providers as part of the administrative services provided under the Management Agreement; and |
| | (n) | | the Investment Adviser’s and Sub-Adviser’s processes and policies addressing various types of potential conflicts of interest; their approaches to risk management; the annual review of the effectiveness of the Fund’s compliance program; and periodic compliance reports. |
The Trustees also received an overview of the Fund’s distribution arrangements. They received information regarding the Fund’s assets, share purchase and redemption activity, and payment of distribution and service fees. Information was also provided to the Trustees relating to revenue sharing payments made by and services provided by the Investment Adviser and its affiliates to intermediaries that promote the sale, distribution, and/or servicing of Fund shares. The Independent Trustees also discussed the broad range of other investment choices that are available to Fund investors, including the availability of comparable funds managed by other advisers.
The presentations made at the Board and Committee meetings and at the Annual Meeting encompassed the Fund and other mutual funds for which the Board of Trustees has responsibility. In evaluating the Agreements at the Annual Meeting, the Trustees relied upon their knowledge, resulting from their meetings and other interactions throughout the year, of the Fund and the respective services of the Investment Adviser and its affiliates, and the Sub-Adviser. In conjunction with these meetings, the Trustees received written materials and oral presentations on the topics covered, and the Investment Adviser addressed the questions and concerns of the Trustees, including concerns regarding the investment performance of certain of the funds they oversee. In addition, the Independent Trustees periodically received written materials and oral presentations from the funds’ various sub-advisers, including the Sub-Adviser. The Independent Trustees were advised by their independent legal counsel regarding their responsibilities and other regulatory requirements related to the approval and continuation of mutual fund investment management agreements under applicable law. In addition, the Investment Adviser and its affiliates provided the Independent Trustees with a written response to a formal request for information sent on behalf of the Independent Trustees by their independent legal counsel. The Independent Trustees reviewed a written response prepared by the Sub-Adviser to a similar request for information submitted to the Sub-Adviser by the Investment Adviser. During the course of their deliberations, the Independent Trustees met in executive sessions with their independent legal counsel, without representatives of the Investment Adviser or its affiliates present.
Nature, Extent, and Quality of the Services Provided Under the Management Agreement
As part of their review, the Trustees considered the nature, extent, and quality of the services provided to the Fund by the Investment Adviser. In this regard, the Trustees considered both the investment advisory services and non-advisory services (including oversight of the Sub-Adviser’s day-to-day management of the Fund) that are provided by the Investment Adviser and its affiliates. The Trustees noted the ongoing recruitment efforts aimed at bringing high quality investment talent to the Investment Adviser. They also noted the Investment Adviser’s commitment to maintaining high quality systems and expending substantial resources to respond to ongoing changes to the regulatory and control environment in which the Fund and its service providers operate, as well as the efforts of the Investment Adviser and its affiliates to combat cyber security risks. The Trustees concluded that the Investment Adviser continued to commit substantial financial and operational resources to the Fund and expressed confidence that the Investment Adviser would continue to do so in the future. The Trustees also recognized that the Investment Adviser had made significant commitments to address regulatory compliance requirements applicable to the Fund and the Investment Adviser and its affiliates.
Investment Performance
The Trustees considered the investment performance of the Fund. In this regard, they compared the investment performance of the Fund to its peers using rankings and ratings compiled by the Outside Data Provider, and updated performance information prepared by the Investment Adviser using the peer groups identified by the Outside Data Provider. The Trustees also reviewed the
36
GOLDMAN SACHS GQG PARTNERS INTERNATIONAL OPPORTUNITIES FUND
Statement Regarding Basis for Approval of Management Agreement and Sub-Advisory Agreement (Unaudited) (continued)
Fund’s investment performance relative to its performance benchmark. They reviewed the investment performance of the Fund in light of its investment objective and policies and market conditions.
In addition, the Trustees considered materials prepared and presentations made by the Investment Adviser’s senior management and the Sub-Adviser’s portfolio management personnel in which Fund performance was assessed. The Trustees also considered the Investment Adviser’s periodic reports with respect to the Fund’s risk profiles, and how the Investment Adviser’s approach to risk monitoring and management influences portfolio management.
The Trustees noted that the Fund’s Institutional Shares had placed in the second quartile of the Fund’s performance peer group, and had outperformed the Fund’s primary benchmark index for the one-year period ended March 31, 2018.
Costs of Services Provided and Competitive Information
The Trustees considered the contractual terms of the Management Agreement, the fee rates payable by the Fund thereunder, and the net amount retained by the Investment Adviser after payment of sub-advisory fees. In this regard, the Trustees considered information on the services rendered by the Investment Adviser to the Fund, which included both advisory and administrative services that were directed to the needs and operations of the Fund as a registered mutual fund.
In particular, the Trustees reviewed the analyses prepared by the Outside Data Provider regarding the expense rankings of the Fund, as well as additional information provided by the Investment Adviser throughout the year. The analyses provided a comparison of the Fund’s management fee and breakpoints to those of a relevant peer group and category universe; an expense analysis which compared the Fund’s overall net and gross expenses to a peer group and a category universe; and data comparing the Fund’s net expenses to the peer and category medians. The analyses also compared the Fund’s transfer agency, custody, distribution fees, other expenses, and fee waivers/reimbursements to those of the peer group and category medians. The Trustees concluded that the comparisons provided by the Outside Data Provider and the Investment Adviser were useful in evaluating the reasonableness of the management fees and total expenses paid by the Fund.
The Trustees considered the Investment Adviser’s undertaking to limit the Fund’s “other expenses” ratio (excluding certain expenses) to a specified level. They also considered comparative fee information for services provided by the Investment Adviser to a non-U.S. fund that has investment objectives and policies similar to those of the Fund.
In addition, the Trustees noted that shareholders are able to redeem their Fund shares at any time if shareholders believe that the Fund fees and expenses are too high or if they are dissatisfied with the performance of the Fund.
The Investment Adviser’s Profitability
The Trustees reviewed the Fund’s contribution to the Investment Adviser’s revenues and pre-tax profit margins. In this regard the Trustees noted that they had received, among other things, profitability analyses and summaries, revenue and expense schedules by Fund and by function (i.e., investment management, transfer agency, and distribution and service), and information on the Investment Adviser’s expense allocation methodology. They observed that the profitability and expense figures are substantially similar to those used by the Investment Adviser for many internal purposes, including compensation decisions among various business groups, and are thus subject to a vigorous internal debate about how certain revenue and expenses should be allocated. The Trustees also noted that the internal audit group within the Goldman Sachs organization had audited the expense allocation methodology and that the internal audit group was satisfied with the reasonableness, consistency, and accuracy of the Investment Adviser’s expense allocation methodology and profitability analysis calculations. Profitability data for the Fund was provided for 2017, and the Trustees considered this information in relation to the Investment Adviser’s overall profitability.
Economies of Scale
The Trustees considered the information that had been provided regarding whether there have been economies of scale with respect to the management of the Fund. The Trustees also considered the breakpoints in the fee rate payable under the Management Agreement for the Fund at the following annual percentage rates of the average daily net assets of the Fund:
| | | | |
| Average Daily Net Assets | | Management Fee Annual Rate | |
First $1 billion | | | 0.85 | % |
Next $1 billion | | | 0.77 | % |
Next $3 billion | | | 0.73 | % |
Next $3 billion | | | 0.71 | % |
Over $8 billion | | | 0.70 | % |
37
GOLDMAN SACHS GQG PARTNERS INTERNATIONAL OPPORTUNITIES FUND
Statement Regarding Basis for Approval of Management Agreement and Sub-Advisory Agreement (Unaudited) (continued)
The Trustees noted that the breakpoints were designed to share potential economies of scale, if any, with the Fund and their shareholders as assets under management reach those asset levels. The Trustees considered the amounts of assets in the Fund; the Fund’s recent share purchase and redemption activity; the information provided by the Investment Adviser relating to the costs of the services provided by the Investment Adviser and its affiliates and their realized profits; information comparing fee rates charged by the Investment Adviser with fee rates charged to other funds in the peer group; and the Investment Adviser’s undertaking to limit certain expenses of the Fund that exceed specified levels. The Independent Trustees also considered the relationship between the advisory and sub-advisory fee rate schedules. Upon reviewing these matters at the Annual Meeting, the Trustees concluded that the fee breakpoints represented a means of assuring that benefits of scalability, if any, would be passed along to shareholders at the specified asset levels.
Other Benefits to the Investment Adviser and Its Affiliates
The Trustees also considered the other benefits derived by the Investment Adviser and its affiliates from their relationships with the Fund, including: (a) transfer agency fees received by Goldman Sachs & Co. LLC (“Goldman Sachs”); (b) brokerage and futures commissions earned by Goldman Sachs for executing securities transactions (in its capacity as clearing broker) and futures transactions on behalf of the Fund; (c) fees earned by Goldman Sachs Agency Lending (“GSAL”), an affiliate of the Investment Adviser, as securities lending agent (and fees earned by the Investment Adviser for managing the portfolio in which the cash collateral is invested); (d) the Investment Adviser’s ability to leverage the infrastructure designed to service the Fund on behalf of the Investment Adviser’s other clients; (e) the Investment Adviser’s ability to cross-market other products and services to Fund shareholders; (f) Goldman Sachs’ retention of certain fees as Fund distributor; (g) the Investment Adviser’s ability to negotiate better pricing with the Fund’s custodian on behalf of its other clients, as a result of the relationship with the Fund; and (h) the possibility that the working relationship between the Investment Adviser and the Fund’s third-party service providers (including the Sub-Adviser) may cause those service providers to be more likely to do business with other areas of Goldman Sachs. In the course of considering the foregoing, the Independent Trustees requested and received further information quantifying certain of these fall-out benefits. They also considered the benefits to GSAL and the Investment Adviser from the securities lending program and observed that the benefit to the Fund from its participation in the program was greater than the benefits to GSAL and the Investment Adviser as measured by the revenue each party received in connection with the program.
Other Benefits to the Fund and Its Shareholders
The Trustees also noted that the Fund receives certain potential benefits as a result of their relationship with the Investment Adviser, including: (a) trading efficiencies resulting from aggregation of orders of the Fund with those of other funds or accounts managed by the Investment Adviser; (b) enhanced servicing from vendors because of the volume of business generated by the Investment Adviser and its affiliates; (c) the advantages received from the Investment Adviser’s knowledge and experience gained from managing other accounts and products; (d) the Investment Adviser’s ability to hire and retain qualified personnel to provide services to the Fund because of the reputation of the Goldman Sachs organization; (e) the Fund’s access, through the Investment Adviser, to certain firm-wide resources (e.g., proprietary risk management systems and databases), subject to certain restrictions; (f) the Fund’s ability to participate in the securities lending program administered by GSAL, as measured by the revenue received by the Fund in connection with the program; and (g) access to certain affiliated distribution channels.
Conclusion
In connection with their consideration of the Management Agreement, the Trustees gave weight to various factors, but did not identify any particular factor as controlling their decision. After deliberation and consideration of the information provided, including the factors described above, the Trustees, including the Independent Trustees, unanimously concluded, in the exercise of their business judgment, that the investment management fees paid by the Fund were reasonable in light of the factors considered, and that the Management Agreement, and the terms thereof, should be approved and continued with respect to the Fund until August 31, 2019.
38
GOLDMAN SACHS GQG PARTNERS INTERNATIONAL OPPORTUNITIES FUND
Statement Regarding Basis for Approval of Management Agreement and Sub-Advisory Agreement (Unaudited) (continued)
Sub-Advisory Agreement with GQG Partners LLC
Nature, Extent, and Quality of the Services Provided Under the Sub-Advisory Agreement
In evaluating the Sub-Advisory Agreement, the Trustees relied upon materials furnished and presentations made by the Investment Adviser and Sub-Adviser. In evaluating the nature, extent, and quality of services provided by the Sub-Adviser, the Trustees considered information on the services provided to the Fund by the Sub-Adviser, including information about the Sub-Adviser’s (a) personnel and compensation structure; (b) track record in managing the Fund and other funds and/or accounts with investment strategies similar to those employed on behalf of the Fund; (c) policies and procedures in place to address potential conflicts of interest; and (d) compliance program and code of ethics. In this regard, they also considered assessments provided by the Investment Adviser of the Sub-Adviser, the Sub-Adviser’s investment strategies and personnel, and its compliance program.
Costs of Services Provided
The Trustees reviewed the terms of the Sub-Advisory Agreement, including the schedule of fees payable to the Sub-Adviser. They considered the breakpoints in the sub-advisory fee rate payable under the Sub-Advisory Agreement. The Trustees noted that the compensation paid to the Sub-Adviser is paid by the Investment Adviser, not by the Fund. They also considered the expense limitations that substantially reduce the fees retained by the Investment Adviser, and that the retention of the Sub-Adviser does not directly increase the fees incurred by the Fund for advisory services. They considered the Investment Adviser’s belief that the relationship between the management fees paid by the Fund and the sub-advisory fees paid by the Investment Adviser is appropriate given the level of services the Investment Adviser provides to the Fund and significant differences in cost drivers and risks associated with the respective services offered by the Investment Adviser and the Sub-Adviser.
Conclusion
In connection with their consideration of the Sub-Advisory Agreement, the Trustees gave weight to various factors, but did not identify any particular factor as controlling their decision. After deliberation and consideration of the information provided, including the factors described above, the Trustees, including the Independent Trustees, unanimously concluded, in the exercise of their business judgment, that the sub-advisory fees paid by the Investment Adviser to the Sub-Adviser were reasonable in light of the factors considered, and that the Sub-Advisory Agreement should be approved and continued until August 31, 2019.
39
GOLDMAN SACHS GQG PARTNERS INTERNATIONAL OPPORTUNITIES FUND
Trustees and Officers (Unaudited)
Independent Trustees
| | | | | | | | | | |
Name,
Address and Age1 | | Position(s) Held
with the Trust | | Term of
Office and
Length of
Time Served2 | | Principal Occupation(s)
During Past 5 Years | | Number of
Portfolios in
Fund Complex
Overseen by
Trustee3 | | Other
Directorships
Held by Trustee4 |
Cheryl K. Beebe Age: 62 | | Chair of the Board of Trustees | | Since 2017 (Trustee since 2015) | | Ms. Beebe is retired. She is Director, Convergys Corporation (2015-Present); Director, Packaging Corporation of America (2008-Present); and was formerly Executive Vice President, (2010-2014); and Chief Financial Officer, Ingredion, Inc. (a leading global ingredient solutions company) (2004-2014). Chair of the Board of Trustees — Goldman Sachs Trust II. | | 19 | | Convergys Corporation (a global leader in customer experience outsourcing); Packaging Corporation of America (producer of container board) |
Lawrence Hughes Age: 60 | | Trustee | | Since 2016 | | Mr. Hughes is retired. Formerly, he held senior management positions with BNY Mellon Wealth Management, a division of The Bank of New York Mellon Corporation (a financial services company) (1991-2015), most recently as Chief Executive Officer (2010-2015). He serves as Chairman of the Board of Directors, Ellis Memorial and Eldredge House (a not-for-profit organization) (2012-Present). Previously, Mr. Hughes served as an Advisory Board Member of Goldman Sachs Trust II (February 2016-April 2016). Trustee — Goldman Sachs Trust II. | | 19 | | None |
John F. Killian Age: 63 | | Trustee | | Since 2015 | | Mr. Killian is retired. He is Director, Consolidated Edison, Inc. (2007-Present); Director, Houghton Mifflin Harcourt Publishing Company (2011-Present); and formerly held senior management positions with Verizon Communications, Inc., including Executive Vice President and Chief Financial Officer (2009- 2010); and President, Verizon Business, Verizon Communications, Inc. (2005-2009). Trustee — Goldman Sachs Trust II. | | 19 | | Consolidated Edison, Inc. (a utility holding company); Houghton Mifflin Harcourt Publishing Company |
Steven D. Krichmar Age: 60 | | Trustee | | Since 2018 | | Mr. Krichmar is retired. Formerly, he held senior management and governance positions with Putnam Investments, LLC, a financial services company (2001-2016). He was most recently Chief of Operations and a member of the Operating Committee of Putnam Investments, LLC and Principal Financial Officer of The Putnam Funds. Previously, Mr. Krichmar served as an Audit Partner with PricewaterhouseCoopers LLP and its predecessor company (1990-2001). Trustee — Goldman Sachs Trust II. | | 19 | | None |
| | | | | | | | | | |
40
GOLDMAN SACHS GQG PARTNERS INTERNATIONAL OPPORTUNITIES FUND
Trustees and Officers (Unaudited) (continued)
Interested Trustee*
| | | | | | | | | | |
Name,
Address and Age1 | | Position(s) Held
with the Trust | | Term of
Office and
Length of
Time Served2 | | Principal Occupation(s)
During Past 5 Years | | Number of
Portfolios in
Fund Complex
Overseen by
Trustee3 | | Other
Directorships
Held by Trustee4 |
| James A. McNamara Age: 56 | | President and Trustee | | Since 2012 | | Advisory Director, Goldman Sachs (January 2018-Present); Managing Director, Goldman Sachs (January 2000-December 2017); Director of Institutional Fund Sales, GSAM (April 1998-December 2000); and Senior Vice President and Manager, Dreyfus Institutional Service Corporation (January 1993- April 1998). President and Trustee — Goldman Sachs Trust II; Goldman Sachs Trust; Goldman Sachs Variable Insurance Trust; Goldman Sachs MLP Income Opportunities Fund; Goldman Sachs MLP and Energy Renaissance Fund; Goldman Sachs ETF Trust; Goldman Sachs Private Markets Fund 2018 LLC; Goldman Sachs Private Markets Fund 2018 (A) LLC; and Goldman Sachs Private Markets Fund 2018 (B) LLC. | | 154 | | None |
| | | | | | | | | | |
| * | | Mr. McNamara is considered to be an “Interested Trustee” because he holds positions with Goldman Sachs and owns securities issued by The Goldman Sachs Group, Inc. He holds comparable positions with certain other companies of which Goldman Sachs, GSAM or an affiliate thereof is the investment adviser, administrator and/or distributor. |
| 1 | | Each Trustee may be contacted by writing to the Trustee, c/o Goldman Sachs, 200 West Street, New York, New York, 10282, Attn: Caroline Kraus. Information is provided as of October 31, 2018. |
| 2 | | Subject to such policies as may be adopted by the Board from time-to-time, each Trustee holds office for an indefinite term, until the earliest of: (a) the election of his or her successor; (b) the date the Trustee resigns or is removed by the Board or shareholders, in accordance with the Trust’s Declaration of Trust; or (c) the termination of the Trust. The Board has adopted policies which provide that (a) no Trustee shall hold office for more than 15 years and (b) a Trustee shall retire as of December 31st of the calendar year in which he or she reaches his or her 74th birthday, unless a waiver of such requirement shall have been adopted by a majority of the other Trustees. These policies may be changed by the Trustees without shareholder vote. |
| 3 | | The Goldman Sachs Fund Complex includes certain other companies listed above for each respective Trustee. As of October 31, 2018, Goldman Sachs Trust II consisted of 19 portfolios (17 of which offered shares to the public); Goldman Sachs Trust consisted of 89 portfolios (88 of which offered shares to the public); Goldman Sachs Variable Insurance Trust consisted of 13 portfolios; Goldman Sachs MLP Income Opportunities Fund, Goldman Sachs MLP and Energy Renaissance Fund, Goldman Sachs Private Markets Fund 2018 LLC, Goldman Sachs Private Markets Fund 2018 (A) LLC and Goldman Sachs Private Markets Fund 2018 (B) LLC each consisted of one portfolio; and Goldman Sachs ETF Trust consisted of 28 portfolios (14 of which offered shares to the public). |
| 4 | | This column includes only directorships of companies required to report to the Securities and Exchange Commission under the Securities Exchange Act of 1934 (i.e., “public companies”) or other investment companies registered under the Act. |
Additional information about the Trustees is available in the Fund’s Statement of Additional Information, which can be obtained from Goldman Sachs free of charge by calling this toll-free number (in the United States of America): 1-800-526-7384.
41
GOLDMAN SACHS GQG PARTNERS INTERNATIONAL OPPORTUNITIES FUND
Trustees and Officers (Unaudited) (continued)
Officers of the Trust*
| | | | | | |
| Name, Address and Age1 | | Position(s) Held
with the Trust | | Term of
Office and
Length of
Time Served2 | | Principal Occupation(s) During Past 5 Years |
James A. McNamara 200 West Street New York, NY 10282 Age: 56 | | Trustee and President | | Since 2012 | | Advisory Director, Goldman Sachs (January 2018-Present); Managing Director, Goldman Sachs (January 2000-December 2017); Director of Institutional Fund Sales, GSAM (April 1998-December 2000); and Senior Vice President and Manager, Dreyfus Institutional Service Corporation (January 1993-April 1998). President and Trustee — Goldman Sachs Trust II; Goldman Sachs Trust; Goldman Sachs Variable Insurance Trust; Goldman Sachs MLP Income Opportunities Fund; Goldman Sachs MLP and Energy Renaissance Fund; Goldman Sachs ETF Trust; Goldman Sachs Private Markets Fund 2018 LLC; Goldman Sachs Private Markets Fund 2018 (A) LLC; and Goldman Sachs Private Markets Fund 2018 (B) LLC. |
Caroline L. Kraus 200 West Street New York, NY 10282 Age: 41 | | Secretary | | Since 2012 | | Managing Director, Goldman Sachs (January 2016-Present); Vice President, Goldman Sachs (August 2006-December 2015); Associate General Counsel, Goldman Sachs (2012-Present); Assistant General Counsel, Goldman Sachs (August 2006-December 2011); and Associate, Weil, Gotshal & Manges, LLP (2002-2006). Secretary — Goldman Sachs Trust II; Goldman Sachs Trust (previously Assistant Secretary (2012)); Goldman Sachs Variable Insurance Trust (previously Assistant Secretary (2012)); Goldman Sachs BDC, Inc.; Goldman Sachs Private Middle Market Credit LLC; Goldman Sachs Middle Market Lending Corp.; Goldman Sachs MLP Income Opportunities Fund; Goldman Sachs MLP and Energy Renaissance Fund; Goldman Sachs ETF Trust; Goldman Sachs Private Markets Fund 2018 LLC; Goldman Sachs Private Markets Fund 2018 (A) LLC; and Goldman Sachs Private Markets Fund 2018 (B) LLC. |
Scott M. McHugh 200 West Street New York, NY 10282 Age: 47 | | Treasurer, Senior Vice President and Principal Financial Officer | | Since 2012 (Principal Financial Officer since 2013) | | Managing Director, Goldman Sachs (January 2016-Present); Vice President, Goldman Sachs (February 2007-December 2015); Assistant Treasurer of certain mutual funds administered by DWS Scudder (2005-2007); and Director (2005-2007), Vice President (2000-2005), and Assistant Vice President (1998-2000), Deutsche Asset Management or its predecessor (1998-2007). Treasurer, Senior Vice President and Principal Financial Officer — Goldman Sachs Trust II; Goldman Sachs Trust; Goldman Sachs Variable Insurance Trust; Goldman Sachs MLP Income Opportunities Fund; Goldman Sachs MLP and Energy Renaissance Fund; Goldman Sachs ETF Trust; Goldman Sachs Private Markets Fund 2018 LLC; Goldman Sachs Private Markets Fund 2018 (A) LLC; and Goldman Sachs Private Markets Fund 2018 (B) LLC. |
Joseph F. DiMaria 30 Hudson Street Jersey City, NJ 07302 Age: 50 | | Assistant Treasurer and Principal Accounting Officer | | Since 2017 | | Managing Director, Goldman Sachs (November 2015-Present) and Vice President — Mutual Fund Administration, Columbia Management Investment Advisers, LLC (May 2010-October 2015). Assistant Treasurer and Principal Accounting Officer — Goldman Sachs Trust II; Goldman Sachs Trust; Goldman Sachs Variable Insurance Trust; Goldman Sachs MLP Income Opportunities Fund; Goldman Sachs MLP and Energy Renaissance Fund; Goldman Sachs ETF Trust; Goldman Sachs Private Markets Fund 2018 LLC; Goldman Sachs Private Markets Fund 2018 (A) LLC; and Goldman Sachs Private Markets Fund 2018 (B) LLC. |
| | | | | | |
| * | | Represents a partial list of officers of the Trust. Additional information about all the officers is available in the Fund’s Statement of Additional Information, which can be obtained from Goldman Sachs free of charge by calling this toll-free number (in the United States): 1-800-526-7384. |
| 1 | | Information is provided as of October 31, 2018. |
| 2 | | Officers hold office at the pleasure of the Board of Trustees or until their successors are duly elected and qualified. Each officer holds comparable positions with certain other companies of which Goldman Sachs, GSAM or an affiliate thereof is the investment adviser, administrator and/or distributor. |
Goldman Sachs GQG Partners International Opportunities Fund — Tax Information (Unaudited)
For the year ended October 31, 2018, 6.62% of the dividends paid from net investment company taxable income by the Goldman Sachs GQG Partners International Opportunities Fund qualify for the dividends received deduction available to corporations.
For the year ended October 31, 2018, 100% of the dividends paid from net investment company taxable income by the Goldman Sachs GQG Partners International Opportunities Fund qualify for the reduced tax rate under the Jobs and Growth Tax Relief and Reconciliation Act of 2003.
From distributions paid during the year ended October 31, 2018, the total amount of income received by the Goldman Sachs GQG Partners International Opportunities Fund from sources within foreign countries and possessions of the United States was $0.0287 per share, all of which is attributable to qualified passive income. The percentage of net investment income dividends paid from foreign sources by the Goldman Sachs GQG Partners International Opportunities Fund was 100.00%. The total amount of taxes paid by the Goldman Sachs GQG Partners International Opportunities Fund to such countries was $0.0066 per share.
42
FUNDS PROFILE
Goldman Sachs Funds
Goldman Sachs is a premier financial services firm, known since 1869 for creating thoughtful and customized investment solutions in complex global markets.
Today, the Investment Management Division of Goldman Sachs serves a diverse set of clients worldwide, including private institutions, public entities and individuals. With approximately $1.34 trillion in assets under supervision as of September 30, 2018, Goldman Sachs Asset Management (“GSAM”) has portfolio management teams located around the world and our investment professionals bring firsthand knowledge of local markets to every investment decision. Assets under supervision includes assets under management and other client assets for which Goldman Sachs does not have full discretion. GSAM leverages the resources of Goldman Sachs & Co. LLC subject to legal, internal and regulatory restrictions.
Money Market
Financial Square FundsSM
| ∎ | | Financial Square Treasury Solutions Fund1 |
| ∎ | | Financial Square Government Fund1 |
| ∎ | | Financial Square Money Market Fund2 |
| ∎ | | Financial Square Prime Obligations Fund2 |
| ∎ | | Financial Square Treasury Instruments Fund1 |
| ∎ | | Financial Square Treasury Obligations Fund1 |
| ∎ | | Financial Square Federal Instruments Fund1 |
Investor FundsSM
| ∎ | | Investor Money Market Fund3 |
| ∎ | | Investor Tax-Exempt Money Market Fund3 |
Fixed Income
Short Duration and Government
| ∎ | | High Quality Floating Rate Fund |
| ∎ | | Short-Term Conservative Income Fund |
| ∎ | | Short Duration Government Fund |
| ∎ | | Short Duration Income Fund |
| ∎ | | Inflation Protected Securities Fund |
Multi-Sector
Municipal and Tax-Free
| ∎ | | High Yield Municipal Fund |
| ∎ | | Dynamic Municipal Income Fund |
| ∎ | | Short Duration Tax-Free Fund |
Single Sector
| ∎ | | Investment Grade Credit Fund |
| ∎ | | High Yield Floating Rate Fund |
| ∎ | | Emerging Markets Debt Fund |
| ∎ | | Local Emerging Markets Debt Fund |
| ∎ | | Total Emerging Markets Income Fund |
Fixed Income Alternatives
| ∎ | | Long Short Credit Strategies Fund |
Fundamental Equity
| ∎ | | Small/Mid Cap Value Fund |
| ∎ | | Small/Mid Cap Growth Fund |
| ∎ | | Concentrated Growth Fund |
| ∎ | | Technology Opportunities Fund |
| ∎ | | Growth Opportunities Fund |
| ∎ | | Rising Dividend Growth Fund |
Tax-Advantaged Equity
| ∎ | | U.S. Tax-Managed Equity Fund |
| ∎ | | International Tax-Managed Equity Fund |
| ∎ | | U.S. Equity Dividend and Premium Fund |
| ∎ | | International Equity Dividend and Premium Fund |
Equity Insights
| ∎ | | Small Cap Equity Insights Fund |
| ∎ | | U.S. Equity Insights Fund |
| ∎ | | Small Cap Growth Insights Fund |
| ∎ | | Large Cap Growth Insights Fund |
| ∎ | | Large Cap Value Insights Fund |
| ∎ | | Small Cap Value Insights Fund |
| ∎ | | International Small Cap Insights Fund |
| ∎ | | International Equity Insights Fund |
| ∎ | | Emerging Markets Equity Insights Fund |
Fundamental Equity International
| ∎ | | International Equity Income Fund4 |
| ∎ | | International Equity ESG Fund5 |
| ∎ | | Emerging Markets Equity Fund |
| ∎ | | ESG Emerging Markets Equity Fund |
Select Satellite
| ∎ | | Real Estate Securities Fund |
| ∎ | | International Real Estate Securities Fund |
| ∎ | | Commodity Strategy Fund |
| ∎ | | Global Real Estate Securities Fund |
| ∎ | | Alternative Premia Fund |
| ∎ | | Absolute Return Tracker Fund |
| ∎ | | Managed Futures Strategy Fund |
| ∎ | | MLP Energy Infrastructure Fund |
| ∎ | | Multi-Manager Alternatives Fund |
| ∎ | | Absolute Return Multi-Asset Fund |
| ∎ | | Global Infrastructure Fund |
Total Portfolio Solutions
| ∎ | | Global Managed Beta Fund |
| ∎ | | Multi-Manager Non-Core Fixed Income Fund |
| ∎ | | Multi-Manager U.S. Dynamic Equity Fund |
| ∎ | | Multi-Manager Global Equity Fund |
| ∎ | | Multi-Manager International Equity Fund |
| ∎ | | Tactical Tilt Overlay Fund |
| ∎ | | Balanced Strategy Portfolio |
| ∎ | | Multi-Manager U.S. Small Cap Equity Fund |
| ∎ | | Multi-Manager Real Assets Strategy Fund |
| ∎ | | Growth and Income Strategy Portfolio |
| ∎ | | Growth Strategy Portfolio |
| ∎ | | Equity Growth Strategy Portfolio |
| ∎ | | Satellite Strategies Portfolio |
| ∎ | | Enhanced Dividend Global Equity Portfolio |
| ∎ | | Tax-Advantaged Global Equity Portfolio |
| ∎ | | Strategic Factor Allocation Fund |
| ∎ | | Target Date 2020 Portfolio |
| ∎ | | Target Date 2025 Portfolio |
| ∎ | | Target Date 2030 Portfolio |
| ∎ | | Target Date 2035 Portfolio |
| ∎ | | Target Date 2040 Portfolio |
| ∎ | | Target Date 2045 Portfolio |
| ∎ | | Target Date 2050 Portfolio |
| ∎ | | Target Date 2055 Portfolio |
| ∎ | | Target Date 2060 Portfolio |
| ∎ | | GQG Partners International Opportunities Fund |
| 1 | | You could lose money by investing in the Fund. Although the Fund seeks to preserve the value of your investment at $1.00 per share, it cannot guarantee it will do so. An investment in the Fund is not a deposit of a bank and is not insured or guaranteed by the Federal Deposit Insurance Corporation or any other government agency. The Fund’s sponsor has no legal obligation to provide financial support to the Fund, and you should not expect that the sponsor will provide financial support to the Fund at any time. |
| 2 | | You could lose money by investing in the Fund. Because the share price of the Fund will fluctuate, when you sell your shares they may be worth more or less than what you originally paid for them. The Fund may impose a fee upon sale of your shares or may temporarily suspend your ability to sell shares if the Fund’s liquidity falls below required minimums because of market conditions or other factors. An investment in the Fund is not a deposit of a bank and is not insured or guaranteed by the Federal Deposit Insurance Corporation or any other government agency. The Fund’s sponsor has no legal obligation to provide financial support to the Fund, and you should not expect that the sponsor will provide financial support to the Fund at any time. |
| 3 | | You could lose money by investing in the Fund. Although the Fund seeks to preserve the value of your investment at $1.00 per share, it cannot guarantee it will do so. The Fund may impose a fee upon sale of your shares or may temporarily suspend your ability to sell shares if the Fund’s liquidity falls below required minimums because of market conditions or other factors. An investment in the Fund is not a deposit of a bank and is not insured or guaranteed by the Federal Deposit Insurance Corporation or any other government agency. The Fund’s sponsor has no legal obligation to provide financial support to the Fund, and you should not expect that the sponsor will provide financial support to the Fund at any time. |
| 4 | | Effective after the close of business on February 27, 2018, the Goldman Sachs Strategic International Equity Fund was renamed the Goldman Sachs International Equity Income Fund. |
| 5 | | Effective after the close of business on February 27, 2018, the Goldman Sachs Focused International Equity Fund was renamed the Goldman Sachs International Equity ESG Fund. |
| | | Financial Square FundsSM and Investor FundsSM are registered service marks of Goldman Sachs & Co. LLC. |
| *This | | list covers open-end funds only. Please visit our website at www.GSAMFUNDS.com to learn about our closed-end funds and exchange-traded funds. |
| | |
TRUSTEES Cheryl K. Beebe, Chair Lawrence Hughes John F. Killian Steven D. Krichmar James A. McNamara | | OFFICERS James A. McNamara, President Scott M. McHugh, Treasurer, Senior Vice President and Principal Financial Officer Joseph F. DiMaria, Assistant Treasurer and Principal Accounting Officer Caroline L. Kraus, Secretary |
| |
GOLDMAN SACHS & CO. LLC Distributor and Transfer Agent | | GOLDMAN SACHS ASSET MANAGEMENT L.P. Investment Adviser |
Visit our website at www.GSAMFUNDS.com to obtain the most recent month-end returns.
Goldman Sachs Asset Management, L.P., 200 West Street, New York, New York 10282
The reports concerning the Fund included in this shareholder report may contain certain forward-looking statements about the factors that may affect the performance of the Fund in the future. These statements are based on Fund management’s predictions and expectations concerning certain future events and their expected impact on the Fund, such as performance of the economy as a whole and of specific industry sectors, changes in the levels of interest rates, the impact of developing world events, and other factors that may influence the future performance of the Fund. Management believes these forward-looking statements to be reasonable, although they are inherently uncertain and difficult to predict. Actual events may cause adjustments in portfolio management strategies from those currently expected to be employed.
A description of the policies and procedures that the Fund uses to determine how to vote proxies relating to portfolio securities and information regarding how the Fund voted proxies relating to portfolio securities during the most recent 12-month period ended June 30 is available (i) without charge, upon request by calling 1-800-526-7384 (for Retail Shareholders) or 1-800-621-2550 (for Institutional Shareholders); and (ii) on the Securities and Exchange Commission (the “SEC”) web site at http://www.sec.gov.
The Fund files its complete schedule of portfolio holdings with the SEC for the first and third quarters of each fiscal year on Form N-Qs. The Fund’s Form N-Qs are available on the SEC’s web site at http://www.sec.gov within 60 days after the Fund’s first and third fiscal quarters. Form N-Qs may be obtained upon request and without charge by calling 1-800-526-7384 (for Retail Shareholders) or 1-800-621-2550 (for Institutional Shareholders).
Holdings and allocations shown are as of October 31, 2018 and may not be representative of future investments. Fund holdings should not be relied on in making investment decisions and should not be construed as research or investment advice regarding particular securities. Current and future holdings are subject to risk.
Economic and market forecasts presented herein reflect our judgment as of the date of this presentation and are subject to change without notice. These forecasts do not take into account the specific investment objectives, restrictions, tax and financial situation or other needs of any specific client. Actual data will vary and may not be reflected here. These forecasts are subject to high levels of uncertainty that may affect actual performance. Accordingly, these forecasts should be viewed as merely representative of a broad range of possible outcomes. These forecasts are estimated, based on assumptions, and are subject to significant revision and may change materially as economic and market conditions change. Goldman Sachs has no obligation to provide updates or changes to these forecasts. Case studies and examples are for illustrative purposes only.
The Global Industry Classification Standard (GICS) was developed by and is the exclusive property and a service mark of Morgan Stanley Capital International Inc. (MSCI) and Standard & Poor’s, a division of The McGraw-Hill Companies, Inc. (S&P) and is licensed for use by Goldman Sachs. Neither MSCI, S&P nor any other party involved in making or compiling the GICS or any GICS classifications makes any express or implied warranties or representations with respect to such standard or classification (or the results to be obtained by the use thereof), and all such parties hereby expressly disclaim all warranties of originality, accuracy, completeness, merchantability or fitness for a particular purpose with respect to any of such standard or classification. Without limiting any of the foregoing, in no event shall MSCI, S&P, any of their affiliates or any third party involved in making or compiling the GICS or any GICS classifications have any liability for any direct, indirect, special, punitive, consequential or any other damages (including lost profits) even if notified of the possibility of such damages.
The portfolio risk management process includes an effort to monitor and manage risk, but does not imply low risk.
This material is not authorized for distribution to prospective investors unless preceded or accompanied by a current Prospectus or summary prospectus, if applicable. Investors should consider the Fund’s objective, risks, and charges and expenses, and read the summary prospectus, if available, and/or the Prospectus carefully before investing or sending money. The summary prospectus, if available, and the Prospectus contain this and other information about the Fund and may be obtained from your authorized dealer or from Goldman Sachs & Co. LLC by calling (retail – 1-800-526-7384) (institutional – 1-800-621-2550).
© 2018 Goldman Sachs. All rights reserved. 151112-OTU-888692 GQGPIOAR-18/15.8K
Goldman Sachs Funds

| | | | |
| | |
| Annual Report | | | | October 31, 2018 |
| | |
| | | | Multi-Manager Alternatives Fund |

Goldman Sachs Multi-Manager Alternatives Fund
| | | | |
| | | |
| NOT FDIC-INSURED | | May Lose Value | | No Bank Guarantee |
GOLDMAN SACHS MULTI-MANAGER ALTERNATIVES FUND
What Differentiates Goldman Sachs Multi-Manager Alternatives Fund Investment Process?
The Goldman Sachs Multi-Manager Alternatives Fund seeks long-term growth of capital by allocating its assets to underlying managers who employ a range of alternative and non-traditional investment strategies. The Fund benefits from the dedicated expertise of GSAM’s alternative investment team that has a legacy dating back to 19691 and is located in 8 offices globally.2
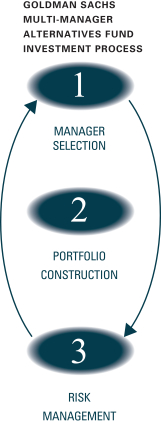

| ∎ | | We have over 100 alternative investment professionals2 dedicated to manager selection |
| ∎ | | We employ a rigorous due diligence process to evaluate each manager’s skill, strategy, and team and continually monitor managers after an investment is made |
| ∎ | | Our Investment Committee process includes an independent “Devil’s advocate” to promote fluid debate and intense examination of each manager |

| ∎ | | We combine “top down” market and economic environment considerations with “bottom up” manager-specific factors |
| ∎ | | We incorporate judgment and quantitative tools to determine the appropriate investment size in each manager |
| ∎ | | The process is continual with ongoing re-balancing and active management to optimize diversification |

| ∎ | | We have over 50 professionals2 focused on alternative investment risk management and operational diligence |
| ∎ | | We consider risk management an all-encompassing and real time discipline |
| ∎ | | Our dedicated strategists leverage our proprietary risk management systems to continually monitor risk |
| 1In | | June 1997, The Goldman Sachs Group, Inc. (GSG, Inc.) acquired the assets and business of Commodities Corporation, which GSG, Inc. subsequently renamed Goldman Sachs Hedge Fund Strategies LLC in December 2004. |
| 2As | | of September 30, 2018. |
| The | | portfolio risk management process includes an effort to monitor and manage risk, but does not imply low risk. Diversification does not protect an investor from market risk and does not ensure a profit. |
1
PORTFOLIO RESULTS
Goldman Sachs Multi-Manager Alternatives Fund
Investment Objective
The Fund seeks long-term growth of capital.
Portfolio Management Discussion and Analysis
Below, the Goldman Sachs Alternative Investments & Manager Selection (“AIMS”) Group discusses the Goldman Sachs Multi-Manager Alternatives Fund’s (the “Fund”) performance and positioning for the 12-month period ended October 31, 2018 (the “Reporting Period”).
| Q | | How did the Fund perform during the Reporting Period? |
| A | | During the Reporting Period, the Fund’s Class A, Class C, Institutional, Investor and Class R Shares generated average annual total returns, without sales charges, of -3.03%, -3.70%, -2.72%, -2.73% and -3.25%, respectively. These returns compare to the 1.68% average annual total return of the Fund’s primary benchmark, the ICE BofAML Three-Month U.S. Treasury Bill Index (the “ICE BofAML Index”), which reflects no deductions for fees or expenses, during the same time period. The HFRX Global Hedge Fund Index (the “HFRX Index”) (net of management, administrative and performance/incentive fees), a broad proxy for hedge fund performance and the Fund’s secondary benchmark, returned -3.53% during the Reporting Period. |
| | | From their inception on February 28, 2018 through the end of the Reporting Period, the Fund’s Class R6 Shares generated a cumulative total return of -2.05% compared to the 1.26% cumulative total return of the ICE BofAML Index. The HFRX Index returned -4.27% during the same period. |
| | | From their inception on April 16, 2018 through the end of the Reporting Period, the Fund’s Class P Shares generated a cumulative total return of -2.06% compared to the 1.05% cumulative total return of the ICE BofAML Index. The HFRX Index returned -3.91% during the same period. |
| | | References to the Fund’s benchmarks mentioned herein are for informational purposes only, and unless otherwise noted, are not an indication of how the Fund is managed. The use of the ICE BofAML Index as the Fund’s benchmark does not imply the Fund is being managed like cash and does not imply low risk or low volatility. |
| Q | | What economic and market factors most influenced the financial markets as a whole during the Reporting Period? |
| A | | The capital markets experienced mixed results during the Reporting Period amidst a resurgence of volatility. |
| | | When the Reporting Period began in November 2017, global equity markets marched higher, extending their record highs of the calendar year on the heels of strong corporate earnings growth and positive business sentiment. Bullish market sentiment was further augmented by the passage of a U.S. tax reform bill in December 2017. The U.S. Federal Reserve’s (“Fed”) decision in the same month to raise short-term interest rates by a quarter of a percentage point did little to temper the rally, as the rate hike was largely driven by the Fed’s positive outlook for U.S. economic growth and a strong jobs market. In late January 2018, the U.S. dollar fell to a three-year low versus other developed markets currencies based on concerns about rhetoric from the U.S. Treasury Secretary, who said he favored a weak U.S. dollar, as well as by what investors perceived as the erosion of the U.S. dollar’s yield relative to those of other currencies. During February 2018, volatility returned to the capital markets amid bond market jitters and a significant sell-off in the global equity markets, which was largely influenced by a rise in the 10-year U.S. Treasury yield. The U.S. Administration’s announcement of steel and aluminum tariffs compounded equity investors’ concerns. In March 2018, at Jerome Powell’s first policy meeting as Fed chair, the U.S. central bank raised short-term interest rates by another quarter percentage point. Fed policymakers went on to raise short-term rates by the same amount on two more occasions—in June and September 2018, and the capital markets anticipated a fourth hike before calendar year end. The Fed’s interest rate hikes led to higher U.S. bond yields, which, in addition to strong corporate earnings growth and a relatively stable macroeconomic picture, helped keep global |
2
PORTFOLIO RESULTS
| | equity markets rather range bound between March and September 2018. Then, in October, global equities sold off significantly, largely erasing earlier gains. The sell-off was triggered by the continued rise in U.S. bond yields and emerging signs of a slowdown in global economic growth, which sparked investors’ rotation out of growth- and momentum-oriented sectors, such as consumer discretionary and information technology, into value-oriented sectors, such as energy, and traditionally defensive sectors, such as utilities. Global equities finished the Reporting Period with modest losses, as positive returns in the U.S. were offset by the negative performance of European and emerging markets stocks. From a sector perspective, gains overall in health care and information technology were offset by declines in financials and industrials. In commodities, energy prices broadly moved higher during the Reporting Period overall on a combination of U.S. sanctions on Russia, trade disputes and continuing tightness in crude oil supplies. However, metals lagged, particularly in the closing months of the Reporting Period, as the outlook for global economic growth became a focal point for investors. |
| | | Credit markets generally sold off during the Reporting Period overall, as a more hawkish Fed continued to forecast additional interest rate hikes against the backdrop of strong U.S. economic growth and increasing signs of inflation. (Hawkish tends to suggest higher interest rates; opposite of dovish.) Credit spreads, or yield differentials between corporate bonds and U.S. Treasury securities of comparable maturity, widened slightly, with concerns about U.S.-China trade tensions weighing on investor sentiment for corporate bonds. Floating-rate bank loans were the best performing sector in the U.S. fixed income markets during the Reporting Period, as each increase in LIBOR boosted coupon payments, fueling investor demand. (LIBOR is London interbank offered rates, which are floating interest rates widely used as reference rates in bank, corporate and government lending agreements.) Demand for floating-rate bank loans came at the expense of fixed-rate investment grade bonds and fixed-rate high yield corporate bonds. That said, high yield corporate bonds recorded a positive return for the Reporting Period overall, as their higher yields generally offset the negative effects of their greater duration and the widening of credit spreads. (Duration measures sensitivity to changes in interest rates.) Outside the U.S., emerging markets credit spreads also widened, as rising U.S. interest rates proved to be a headwind for emerging markets debt. Meanwhile, a strong U.S. dollar dampened the performance of local emerging markets bonds. As a result, U.S. dollar-denominated emerging markets debt and local emerging markets debt were among the worst performing fixed income sectors of the Reporting Period overall. |
| Q | | What key factors were responsible for the Fund’s performance during the Reporting Period? |
| A | | The Fund generally seeks to achieve its investment objective by allocating its assets among multiple unaffiliated investment managers (“Underlying Managers”) that employ one or more non-traditional and alternative investment strategies. The AIMS Group is responsible for making recommendations with respect to hiring, terminating or replacing the Fund’s Underlying Managers as well as for determining the Fund’s asset allocations. The AIMS Group applies a multifaceted process with respect to manager due diligence, portfolio construction and risk management. |
| | | During the Reporting Period, the Fund’s performance can be attributed to the performance of the Fund’s Underlying Managers. |
| | | At various points during the Reporting Period, the Fund had capital allocated to 17 Underlying Managers — Acadian Asset Management LLC (“Acadian”); Algert Global LLC (“Algert”); Ares Capital Management II LLC (“Ares”); Atreaus Capital, LP (“Atreaus”); Bardin Hill Arbitrage IC Management LP (“Bardin Hill”) (known as Halcyon Arbitrage IC Management LP prior to October 23, 2018); Brigade Capital Management, LP (“Brigade”); Crabel Capital Management, LLC (“Crabel”); Emso Asset Management Limited (“Emso”); First Pacific Advisors, LP (“FPA”); GQG Partners LLC (“GQG Partners”); Graham Capital Management, L.P. (“Graham”); New Mountain Vantage Advisers, L.L.C. (“New Mountain Vantage”); One River Asset Management, LLC (“One River”); QMS Capital Management LP (“QMS”); River Canyon Fund Management LLC (“River Canyon”); Sirios Capital Management, L.P. (“Sirios”); and Wellington Management Company LLC (“Wellington”). |
| | | These 17 Underlying Managers represented five strategies — equity long/short (FPA, Sirios and Wellington); event driven and credit (Ares, Bardin Hill, Brigade, New Mountain Vantage and River Canyon); tactical trading (Atreaus, Crabel, Emso, Graham, One River and QMS); relative value (Acadian and Algert); and dynamic equity (GQG Partners). |
| | | Of the 17 Underlying Managers with allocated capital during the Reporting Period, four generated positive returns and 13 generated negative returns. |
3
PORTFOLIO RESULTS
| | | In addition, during the Reporting Period, the Fund allocated assets to Russell Investments Commodity Advisor, LLC (“RICA”). (Effective January 30, 2018, RICA agreed to be bound by and assume all of the rights and obligations of Russell Investments Implementation Services, LLC under the sub-advisory agreement between GSAM and Russell Investments Implementation Services, LLC with respect to the Fund.) RICA manages a beta completion mandate for the Fund, which provides us with an additional tool to manage the beta of the Fund and is not used to override any views and/or decisions of the Fund’s Underlying Managers. (Beta is a measure of the sensitivity of a portfolio’s returns to broad market returns.) During the Reporting Period, RICA contributed positively to the Fund’s performance. |
| Q | | Which strategies most significantly affected Fund performance? |
| A | | Of the five strategies employed across the Underlying Managers during the Reporting Period, four generated negative returns and one generated a positive return. The Fund did not have an allocation to the opportunistic fixed income strategy during the Reporting Period. |
| | | The Fund’s equity long/short strategy detracted most from performance, largely because of Underlying Managers’ positions in the financials, information technology and consumer discretionary sectors. Leading individual detractors were Affiliated Managers Group, a U.S. investment management firm; D.R. Horton, a U.S. home construction company; and Tencent Holdings, a China-based internet services conglomerate. The long/short strategy’s losses were offset slightly by its gains in the industrials and health care sectors, which contributed positively. Notable individual contributors included CSX, a U.S. company focusing on rail transportation and real estate; U.S.-based World Wrestling Entertainment; and Boston Scientific, a U.S.-based manufacturer of medical devices. Equity long/short strategies generally involve long and short investing, based on fundamental evaluations, research and various analytical measurements, in equity and equity-related investments. Equity long/short managers may, for example, buy stocks they expect to outperform or they believe are undervalued, and may also sell short stocks they believe will underperform or they believe are overvalued. Long positions benefit from an increase in the price of the underlying instrument or asset class, while short positions benefit from a decrease in that price. |
| | | The dynamic equity strategy hurt the Fund’s performance during the Reporting Period, driven by losses in the energy, financials and utilities sectors. Notable individual detractors were India’s HDFC Bank, U.S. social media company Facebook and South Korea-based Samsung Electronics. On a regional basis, the dynamic equity strategy was hurt by its exposure to Europe (ex-U.K.) and Asia (ex-Japan). Dynamic equity strategies generally involve investing in equity instruments, often with a long-term view, and may have low excess return correlations to traditional long-only equity strategies. Dynamic equity strategies are less likely to track a benchmark than traditional long-only strategies, and dynamic equity managers are less constrained than traditional long-only managers with respect to factors such as position concentration, sector and country weights, style and market capitalization. |
| | | The relative value strategy detracted from the Fund’s returns during the Reporting Period, led by Underlying Managers’ losses in the health care, materials and utilities sectors. These negative results were offset somewhat by gains in the information technology, consumer discretionary and consumer staples sectors. Relative value strategies seek to identify and capitalize on price discrepancies between related assets (assets that share a common financial factor, such as interest rates, an issuer, or an index). Relative value strategies generally rely on arbitrage (the simultaneous purchase and sale of related assets) and may exist between two issuers or within the capital structure of a single issuer. These strategies attempt to exploit a source of return with low correlation to the market and include, among others, fixed income arbitrage, convertible arbitrage, volatility arbitrage, statistical arbitrage and equity market neutral strategies. |
| | | The tactical trading strategy detracted slightly from performance during the Reporting Period, with the macro and managed futures strategies both diminishing Fund results. Within macro strategies, the key theme of Japanese cyclical reflation, as well as positions in external sovereign bonds, hampered results. This was partially offset by the positive performance of the key themes of U.S. stagflation (expressed by certain Underlying Managers through short positions in the U.S. dollar versus long positions in the Japanese yen) and global growth desynchronization. Positions in corporate emerging markets bonds also added value. Within managed futures strategies, the Underlying Managers were hurt by trading in stock indices and currencies, which was counterbalanced slightly by trading gains in energy and interest rates. Tactical trading strategies seek to produce total return by long and short investing across global fixed income, currency, equity and commodity |
4
PORTFOLIO RESULTS
| | markets. Tactical trading managers may employ various investment styles of which the two major strategies are macro and managed futures. Tactical trading managers that employ a global macro style may select their investments based upon fundamental and/or technical analysis. Tactical trading managers that employ a managed futures investing style may use quantitative modeling techniques, e.g., determining an asset’s value based upon an analysis of price history, price momentum and the asset’s value relative to that of other assets, among other factors. Some tactical trading managers may employ both fundamental analysis and quantitative modeling techniques. Tactical trading managers typically have no bias to be long, short or neutral, but at any given time may have significant long or short exposures in a particular market or asset. |
| | | On the positive side, the Fund’s event driven and credit strategy overall bolstered returns during the Reporting Period. Within merger arbitrage strategies, which involve taking long and/or short positions in securities affected by a corporate merger or acquisition, the Fund was helped by select positions in the consumer staples, consumer discretionary and communications services sectors. (Near the end of September 2018, the telecommunications services sector was renamed the communication services sector and was broadened to include certain companies from the information technology and consumer discretionary sectors that facilitate communication and offer related content and information through various media.) Within equity-oriented event driven strategies, top individual contributors included Twenty First Century Fox, a U.S. mass media company; Spectrum Brands, a U.S. diversified consumer products company; UBM, a U.K.-headquartered business-to-business events organizer; Nexstar, a U.S. telecommunications company; and British Sky Broadcasting, a U.K.-headquartered media company. Among individual detractors were a number of U.S. companies, including streaming device maker Roku, credit card processor First Data, diversified holding company HRG Group and oil and gas exploration company Energen. Within credit strategies, the Fund benefited from positions in select corporate bonds. Among the top individual contributors were the C-rated corporate bonds of U.S. music retailer Guitar Center and U.S. power generator Vistra Energy. Losses were concentrated in health care and energy corporate bonds, such as Canada-based Bausch Health Companies (formerly Valeant Pharmaceuticals) and U.S.-based drilling services company Noble Holding International. Event driven and credit strategies seek to achieve gains from market movements in security prices caused by specific corporate events or changes in perceived relative value. These strategies may include, among others, merger arbitrage, distressed credit, opportunistic credit and value with a catalyst investing style. |
| Q | | How did the Fund use derivatives and similar instruments during the Reporting Period? |
| A | | The Underlying Managers of the Fund employ derivatives and similar instruments as part of their underlying strategies to hedge market exposure and/or to gain implicit leverage, subject to the constraints of the Investment Company Act of 1940. The derivatives used most by Underlying Managers during the Reporting Period were commodity futures, equity futures and over-the-counter equity options, total return swaps (single name and index), bond futures, credit default swaps (single name and index), interest rate futures, interest rate swaps, swaptions (options on interest rate swap contracts), inflation swaps, currency futures, over-the-counter options on foreign currency and forward foreign exchange contracts. Overall, the use of derivatives and similar instruments by the Underlying Managers had a negative impact on the Fund’s performance during the Reporting Period. |
| Q | | Were there any notable changes in the Fund’s allocations and Underlying Managers during the Reporting Period? |
| A | | During the Reporting Period, shifts in the Fund’s asset allocation were made in response to the market environment and were also the result of changes in allocations to the Fund’s various strategies. One of the shifts in strategy allocation during the Reporting Period was an increase in the Fund’s exposure to the event driven and credit strategy. Most of the increase occurred in December 2017, with further increases in January, February and April 2018. This was largely driven by the addition of Bardin Hill as an Underlying Manager within the Fund’s event driven and credit strategy. Our decision to increase the Fund’s allocation to the event driven and credit strategy was partly due to the passage of U.S. tax reform, which had the potential, in our view, to increase mergers and acquisitions (“M&A”) volume and create a more attractive opportunity set. Bardin Hill has a focus on M&A. We funded the increase in the Fund’s allocation to the event driven and credit strategy by reducing its allocation to the relative value strategy. In addition, within the event driven and credit strategy, we added River Canyon as an Underlying Manager to manage a structured credit strategy for the Fund. We also diversified the lineup of |
5
PORTFOLIO RESULTS
| | Underlying Managers within the tactical trading strategy through the addition of Crabel. Crabel manages two managed futures strategies — Crabel Gemini, a systematic strategy with a 10-day average holding period, and Crabel Advanced Trend, a systematic strategy with a 35-day average holding period. In June 2018, we added exposure to the dynamic equity strategy through the addition of GQG Partners as an Underlying Manager. GQG Partners manages a long-only, relatively concentrated international equity strategy, with a focus on identifying businesses with inherent and sustainable competitive advantages and earnings growth. |
| | | Overall, we added four Underlying Managers and removed three Underlying Managers during the Reporting Period. As mentioned previously, we added Bardin Hill, Crabel, River Canyon and GQG Partners. Bardin Hill was added as an Underlying Manager within the Fund’s event driven and credit strategy, joining Ares, Brigade and New Mountain Vantage, and was allocated capital in December 2017. Crabel was added as an Underlying Manager within the Fund’s tactical trading strategy, joining Atreaus, Emso, Graham, One River and QMS, and was allocated capital in March 2018. River Canyon was added as an Underlying Manager within the Fund’s event driven and credit strategy, joining Ares, Bardin Hill and Brigade, and was allocated capital during April 2018. GQG Partners was added as an Underlying Manager within the Fund’s dynamic equity strategy and was allocated capital in June 2018. Effective March 19, 2018, New Mountain Vantage no longer served as an Underlying Manager within the Fund’s event driven and credit strategy. Graham and Atreaus no longer served as Underlying Managers within the tactical trading strategy, as of May 15, 2018 and September 28, 2018, respectively. |
| Q | | Were there any changes to the Fund’s management team during the Reporting Period? |
| A | | During the Reporting Period, Robert Mullane was added as a portfolio manager for the Fund, effective November 27, 2017. Effective June 15, 2018, he transferred to a different group within Goldman Sachs and no longer served as a portfolio manager for the Fund. As of December 15, 2017, Ryan Roderick no longer served as a portfolio manager of the Fund. By design, all investment decisions for the Fund are performed within a co-lead or team structure, with multiple subject matter experts. This strategic decision making has been the cornerstone of our approach and ensures continuity in the Fund. At the end of the Reporting Period, the portfolio managers for the Fund were Kent Clark and Betsy Gorton, who have been the Fund’s portfolio managers since 2016 and 2015, respectively. |
| Q | | What is the Fund’s tactical view and strategy for the months ahead? |
| A | | We intend to continue to closely monitor global economic growth, monetary policy and market volatility, while using active portfolio management and alternative investment strategies to position the Fund as we aim to deliver positive absolute returns across a variety of market environments. We believe the flexibility to allocate tactically across these alternative strategies may enable us to provide investors with positive absolute returns in a variety of market conditions and with significant diversification benefits. We intend to continue to actively explore adding new managers with what we consider to be unique alternative capabilities as market conditions warrant. |
6
FUND BASICS
Multi-Manager Alternatives Fund
as of October 31, 2018
| | | | | | | | | | | | | | |
| | PERFORMANCE REVIEW | |
| | | November 1, 2017–October 31, 2018 | | Fund Total Return
(based on NAV)1 | | | ICE BofAML
Three-Month
U.S. Treasury Bill Index2 | | | HFRX Global
Hedge Fund
Index3 | |
| | Class A | | | -3.03 | % | | | 1.68 | % | | | -3.53 | % |
| | Class C | | | -3.70 | | | | 1.68 | | | | -3.53 | |
| | Institutional | | | -2.72 | | | | 1.68 | | | | -3.53 | |
| | Investor | | | -2.73 | | | | 1.68 | | | | -3.53 | |
| | | Class R | | | -3.25 | | | | 1.68 | | | | -3.53 | |
| | | | | | | | | | | | |
| | | February 28, 2018–October 31, 2018 | | | | | | | | | |
| | | Class R6 | | | -2.05 | % | | | 1.26 | % | | | -4.27 | % |
| | | | | | | | | | | | |
| | | April 16, 2018–October 31, 2018 | | | | | | | | | |
| | | Class P | | | -2.06 | % | | | 1.05 | % | | | -3.91 | % |
| | 1 | | The net asset value (“NAV”) represents the net assets of the class of the Fund (ex-dividend) divided by the total number of shares of the class outstanding. The Fund’s performance reflects the reinvestment of dividends and other distributions. The Fund’s performance does not reflect the deduction of any applicable sales charges. |
| | 2 | | The ICE BofAML Three-Month U.S. Treasury Bill Index is comprised of a single issue purchased at the beginning of the month and held for a full month. At the end of the month that issue is sold and rolled into a newly selected issue. The issue selected at each month-end rebalancing is the outstanding Treasury Bill that matures closest to, but not beyond, three months from the rebalancing date. To qualify for selection, an issue must have settled on or before the month-end rebalancing date. While the index will often hold the Treasury Bill issued at the most recent 3-month auction, it is also possible for a seasoned 6-month Bill to be selected. |
| | 3 | | The HFRX Global Hedge Fund Index is designed to be representative of the overall composition of the hedge fund universe. It is comprised of all eligible hedge fund strategies, including but not limited to convertible arbitrage, distressed securities, equity hedge, equity market neutral, event driven, macro, merger arbitrage, and relative value arbitrage. The strategies are asset weighted based on the distribution of assets in the hedge fund industry. The index is investable through products managed by HFR Asset Management, LLC that track HFRX Indices. The HFRX Global Hedge Fund Index is a trademark of Hedge Fund Research, Inc. (“HFR”). HFR has not participated in the formation of the Fund. HFR does not endorse or approve the Fund or make any recommendation with respect to investing in the Fund. |
| | | | HFRI and HFRX and related indices are trademarks and service marks of HFR which has no affiliation with GSAM. Information regarding HFR indices was obtained from HFR’s website and other public sources and is provided for comparison purposes only. HFR does not endorse or approve any of the statements made herein. |
7
FUND BASICS
| | | | | | | | | | | | | | | | |
| | STANDARDIZED TOTAL RETURNS4 |
| | | For the period ended 9/30/18 | | One Year | | | Five Years | | | Since Inception | | | Inception Date |
| | Class A | | | -6.01 | % | | | -0.35 | % | | | -0.03 | % | | 4/30/13 |
| | Class C | | | -2.38 | | | | 0.00 | | | | 0.24 | | | 4/30/13 |
| | Institutional | | | -0.29 | | | | 1.15 | | | | 1.40 | | | 4/30/13 |
| | Investor | | | -0.39 | | | | 1.00 | | | | 1.25 | | | 4/30/13 |
| | Class P | | | N/A | | | | N/A | | | | 0.39 | | | 4/16/18 |
| | Class R | | | -0.79 | | | | 0.52 | | | | 0.76 | | | 4/30/13 |
| | | Class R6 | | | N/A | | | | N/A | | | | 0.39 | | | 2/28/18 |
| | 4 | | The Standardized Total Returns are average annual total returns or cumulative total returns (only if the performance period is one year or less) as of the most recent calendar quarter-end. They assume reinvestment of all distributions at NAV. These returns reflect a maximum initial sales charge of 5.50% for Class A Shares and the assumed contingent deferred sales charge for Class C Shares (1% if redeemed within 12 months of purchase). Because Institutional, Investor, Class P, Class R and Class R6 Shares do not involve a sales charge, such a charge is not applied to their Standardized Total Returns. |
The returns set forth in the tables above represent past performance. Past performance does not guarantee future results. The Fund’s investment return and principal value will fluctuate so that an investor’s shares, when redeemed, may be worth more or less than their original cost. Current performance may be lower or higher than the performance quoted above. Please visit our web site at www.GSAMFUNDS.com to obtain the most recent month-end returns. Performance reflects applicable fee waivers and/or expense limitations in effect during the periods shown. In their absence, performance would be reduced. Returns do not reflect the deduction of taxes that a shareholder would pay on Fund distributions or the redemption of Fund shares.
8
FUND BASICS
| | | | | | | | | | |
| | EXPENSE RATIOS5 | |
| | | | | Net Expense Ratio (Current) | | | Gross Expense Ratio (Before Waivers) | |
| | Class A | | | 2.26 | % | | | 2.83 | % |
| | Class C | | | 3.01 | | | | 3.58 | |
| | Institutional | | | 1.93 | | | | 2.44 | |
| | Investor | | | 2.01 | | | | 2.58 | |
| | Class P | | | 1.92 | | | | 2.43 | |
| | Class R | | | 2.51 | | | | 3.08 | |
| | | Class R6 | | | 1.92 | | | | 2.43 | |
| | 5 | | The expense ratios of the Fund, both current (net of applicable fee waivers and/or expense limitations) and before waivers (gross of applicable fee waivers and/or expense limitations) are as set forth above according to the most recent publicly available Prospectus for the Fund, as supplemented on May 10, 2018, and may differ from the expense ratios disclosed in the Financial Highlights in this report. Pursuant to a contractual arrangement, the management fee waiver arrangement with respect to the fee paid by each Subsidiary (as defined below) may not be discontinued by the Investment Adviser as long as its contract with the Subsidiary is in place. The Fund’s other waivers and/or expense limitations will remain in place through at least May 31, 2019, and prior to such date the Investment Adviser and Goldman Sachs, as applicable, may not terminate the arrangements without the approval of the Fund’s Board of Trustees. If these arrangements are discontinued in the future, the expense ratios may change without shareholder approval. |
| | 6 | | The percentage shown for each investment category reflects the value of investments in that category as a percentage of the Fund’s market value, excluding cash and the allocation to Russell Investments Commodity Advisor, LLC, which manages a beta completion mandate. The graph depicts the Fund’s investments but may not represent the Fund’s market exposure due to the exclusion of certain derivatives, if any, as listed in the Additional Investment Information section of the Consolidated Schedule of Investments. Short-term investments represent repurchase agreements. |
9
FUND BASICS
| | | | | | | | |
| | TOP TEN EQUITY HOLDINGS AS OF 10/31/187 |
| | | Holding | | % of Net Assets | | | Line of Business |
| | Express Scripts Holding Co. | | | 0.7 | % | | Health Care Providers & Services |
| | Abbott Laboratories | | | 0.7 | | | Health Care Equipment & Supplies |
| | Energen Corp. | | | 0.6 | | | Oil, Gas & Consumable Fuels |
| | Nevsun Resources Ltd. | | | 0.6 | | | Metals & Mining |
| | Shire PLC ADR | | | 0.6 | | | Biotechnology |
| | Twenty-First Century Fox, Inc. Class B | | | 0.6 | | | Entertainment |
| | Airbus SE | | | 0.5 | | | Aerospace & Defense |
| | Ocean Rig UDW, Inc. Class A | | | 0.5 | | | Energy Equipment & Services |
| | Berkshire Hathaway, Inc. Class B | | | 0.5 | | | Diversified Financial Services |
| | | JPMorgan Chase & Co. | | | 0.5 | | | Banks |
| | 7 | | The top 10 holdings may not be representative of the Fund’s future investments. |
| | | | | | |
| | SUBADVISOR ALLOCATION (%)8 | |
| | | | | Percentage of
Net Assets as of 10/31/18 | |
| | Emso Asset Management Limited | | | 11.3 | % |
| | Bardin Hill Arbitrage IC Management LP | | | 10.8 | |
| | River Canyon Fund Management LLC | | | 10.7 | |
| | Crabel Capital Management, LLC | | | 10.3 | |
| | Algert Global LLC | | | 9.5 | |
| | Sirios Capital Management, L.P. | | | 9.3 | |
| | Wellington Management Company LLP | | | 9.1 | |
| | GQG Partners LLC | | | 8.5 | |
| | QMS Capital Management LP | | | 8.5 | |
| | One River Asset Management, LLC | | | 5.8 | |
| | Acadian Asset Management LLC | | | 5.7 | |
| | Brigade Capital Management, LP | | | 0.4 | |
| | First Pacific Advisors, LP | | | 0.1 | |
| | | Ares Capital Management II LLC | | | 0.0 | |
| | 8 | | The chart above represents capital allocated to the Underlying Managers, as a percentage of net assets, excluding cash and the allocation to Russell Investments Commodity Advisor, LLC which manages a beta completion mandate for the Fund, and as such the weightings may not sum to 100%. |
10
FUND BASICS
|
| STRATEGY ALLOCATION (%)9 |
| As of October 31, 2018 |
| | 9 | | Equity Long/Short Strategies generally involve long and short investing, based on fundamental evaluations, research and various analytical measurements, in equity and equity-related investments. Dynamic Equity Strategies generally are long-biased strategies that are less constrained than traditional long-only managers with respect to factors such as position concentration, sector and country weights, style, and market capitalization. Relative Value Strategies seek to identify and benefit from pricing discrepancies between related assets. Event Driven and Credit Strategies seek to achieve gains from market movements in security prices caused by specific corporate events or changes in perceived relative value. Tactical Trading Strategies seek to produce total return by long and short investing across global fixed income, currency, equity, and commodity markets. Tactical Trading managers typically have no bias to be long, short, or neutral but at any given time may have significant long or short exposures in a particular market or asset class. The percentages above exclude cash and the allocation to Russell Investments Commodity Advisor, LLC, which manages a beta completion mandate for the Fund. |
11
GOLDMAN SACHS MULTI-MANAGER ALTERNATIVES FUND
Performance Summary
October 31, 2018
The following graph shows the value, as of October 31, 2018, of a $1,000,000 investment made on April 30, 2013 (commencement of operations) in Institutional Shares at NAV. For comparative purposes, the performance of the Fund’s current benchmarks, the ICE Bank of America Merrill Lynch Three-Month U.S. Treasury Bill Index and the HFRX Global Hedge Fund Index, are shown. This performance data represents past performance and should not be considered indicative of future performance, which may fluctuate with changes in market conditions. These performance fluctuations will cause an investor’s shares, when redeemed, to be worth more or less than their original cost. Performance reflects applicable fee waivers and/or expense limitations in effect during the periods shown and in their absence, performance would be reduced. Returns do not reflect the deduction of taxes that a shareholder would pay on Fund distributions or the redemption of Fund shares. Performance of Class A, Class C, Investor, Class P, Class R and Class R6 Shares will vary from that of Institutional Shares due to differences in class specific fees and any applicable sales charges. In addition to the Underlying Managers’ decisions regarding issuer/industry investment selection and allocation, other factors may affect Fund performance. These factors include, but are not limited to, Fund operating fees and expenses, portfolio turnover and subscription and redemption cash flows affecting the Fund.
|
| Multi-Manager Alternatives Fund’s Lifetime Performance |
Performance of a $1,000,000 investment, with distributions reinvested, from April 30, 2013 through October 31, 2018.
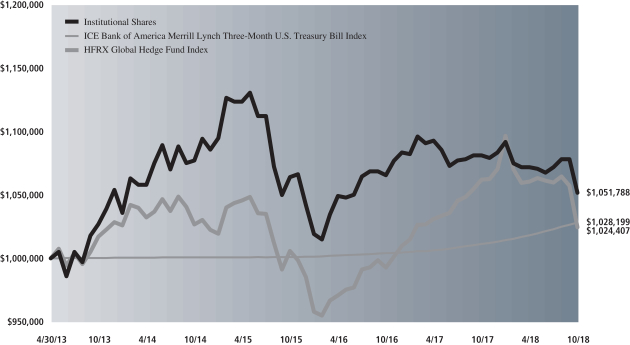
| | | | | | | | | | |
| Average Annual Total Return through October 31, 2018 | | | One Year | | | | Five Years | | | Since Inception |
Class A (Commenced April 30, 2013) | | | | | | | | | | |
Excluding sales charges | | | -3.03% | | | | 0.11% | | | 0.55% |
Including sales charges | | | -8.33% | | | | -1.02% | | | -0.48% |
|
Class C (Commenced April 30, 2013) | | | | | | | | | | |
Excluding contingent deferred sales charges | | | -3.70% | | | | -0.63% | | | -0.21% |
Including contingent deferred sales charges | | | -4.66% | | | | -0.63% | | | -0.21% |
|
Institutional Class (Commenced April 30, 2013) | | | -2.72% | | | | 0.48% | | | 0.92% |
|
Investor Class (Commenced April 30, 2013) | | | -2.73% | | | | 0.36% | | | 0.80% |
|
Class P (Commenced April 16, 2018) | | | N/A | | | | N/A | | | -2.06%* |
|
Class R (Commenced April 30, 2013) | | | 3.25% | | | | -0.14% | | | 0.29% |
|
Class R6 (Commenced February 28, 2018) | | | N/A | | | | N/A | | | -2.05%* |
|
| * | | Total return for periods of less than one year represents cumulative total return. |
12
GOLDMAN SACHS MULTI-MANAGER ALTERNATIVES FUND
Consolidated Schedule of Investments
October 31, 2018
| | | | | | | | | | | | | | |
Principal Amount | | | Interest
Rate | | | Maturity
Date | | | Value | |
| Corporate Obligations – 1.2% | |
| Apparel(a)(b) – 0.0% | |
| | Nine West Holdings, Inc. | |
| $ | 420,000 | | | | 8.250 | % | | | 03/15/19 | | | $ | 74,550 | |
| | |
| Banks – 0.1% | |
| | VTB Bank OJSC Via VTB Capital SA | |
| | 420,000 | | | | 6.950 | | | | 10/17/22 | | | | 409,500 | |
| | |
| Commercial Services(a)(b)(c) – 0.0% | |
| | Cenveo Corp. | |
| | 1,315,000 | | | | 8.500 | | | | 09/15/22 | | | | 13,150 | |
| | |
| Diversified Financial Services – 0.0% | |
| | MDC-GMTN B.V. | |
| | 200,000 | | | | 4.500 | | | | 11/07/28 | | | | 199,172 | |
| | |
| Electrical – 0.1% | |
| | Eskom Holdings SOC Ltd. | |
| | 450,000 | | | | 5.750 | | | | 01/26/21 | | | | 431,550 | |
| | 200,000 | | | | 6.350 | (d) | | | 08/10/28 | | | | 193,000 | |
| | | | | | | | | | | | | | |
| | | | | | | | | | | | | 624,550 | |
| | |
| Energy – Exploration & Production(b)(c)(e) – 0.0% | |
| | Midstates Petroleum Co., Inc./Midstates Petroleum Co. LLC | |
| | 100,000 | | | | 10.000 | | | | 06/01/20 | | | | — | |
| | 951,000 | | | | 10.750 | | | | 10/01/20 | | | | — | |
| | 245,000 | | | | 9.250 | | | | 06/01/21 | | | | — | |
| | | | | | | | | | | | | | |
| | | | | | | | | | | | | — | |
| | |
| Media(b)(c)(f) – 0.4% | |
| | iHeartCommunications, Inc. | |
| | 3,263,000 | | | | 11.250 | | | | 03/01/21 | | | | 2,349,360 | |
| | |
| Oil Field Services – 0.6% | |
| EP PetroEcuador via Noble Sovereign Funding I Ltd.(d)(g)
(3M USD LIBOR + 5.630%) |
|
| | 189,053 | | | | 8.016 | | | | 09/24/19 | | | | 187,162 | |
| | Petrobras Global Finance BV | |
| | 448,000 | | | | 6.125 | | | | 01/17/22 | | | | 463,747 | |
| | 484,000 | | | | 4.375 | | | | 05/20/23 | | | | 466,455 | |
| | 682,000 | | | | 6.250 | | | | 03/17/24 | | | | 688,990 | |
| | Petroleos Mexicanos | |
| | 476,000 | | | | 4.875 | | | | 01/24/22 | | | | 466,956 | |
| | 357,000 | | | | 3.500 | | | | 01/30/23 | | | | 328,083 | |
| | 443,000 | | | | 4.625 | | | | 09/21/23 | | | | 421,289 | |
| | Seventy Seven Energy, Inc.(b)(c)(e) | |
| | 205,000 | | | | 6.500 | | | | 07/15/22 | | | | — | |
| | | | | | | | | | | | | | |
| | | | | | | | | | | | | 3,022,682 | |
| | |
| | TOTAL CORPORATE OBLIGATIONS | |
| | (Cost $8,289,051) | | | $ | 6,692,964 | |
| | |
| | | | | | | | |
| Shares | | | Description | | Value | |
| Common Stocks – 27.0% | |
| Aerospace & Defense – 1.7% | |
| | 26,111 | | | Airbus SE | | $ | 2,885,637 | |
| | 4,694 | | | Esterline Technologies Corp.* | | | 550,888 | |
| | 11,649 | | | General Dynamics Corp. | | | 2,010,384 | |
| | 3,267 | | | Harris Corp. | | | 485,835 | |
| | |
| Common Stocks – (continued) | |
| Aerospace & Defense – (continued) | |
| | 14,691 | | | Rockwell Collins, Inc.(f) | | | 1,880,742 | |
| | 11,292 | | | Safran SA | | | 1,459,241 | |
| | | | | | | | |
| | | | | | | 9,272,727 | |
| | |
| Air Freight & Logistics – 0.5% | |
| | 69,727 | | | Ceva Logistics AG* | | | 2,040,910 | |
| | 3,677 | | | FedEx Corp. | | | 810,190 | |
| | | | | | | | |
| | | | | | | 2,851,100 | |
| | |
| Automobiles*(a) – 0.0% | |
| | 6,652 | | | Aston Martin Lagonda Global Holdings PLC | | | 129,681 | |
| | |
| Banks – 1.6% | |
| | 61,216 | | | Bank of America Corp. | | | 1,683,440 | |
| | 39,227 | | | Hang Seng Bank Ltd. | | | 919,778 | |
| | 24,035 | | | HDFC Bank Ltd. ADR | | | 2,136,952 | |
| | 21,899 | | | JPMorgan Chase & Co. | | | 2,387,429 | |
| | 9,198 | | | KBC Group NV | | | 633,890 | |
| | 27,876 | | | Regions Financial Corp. | | | 473,055 | |
| | 1,743 | | | Western Alliance Bancorp* | | | 84,082 | |
| | | | | | | | |
| | | | | | | 8,318,626 | |
| | |
| Beverages – 1.0% | |
| | 29,220 | | | Coca-Cola HBC AG* | | | 863,118 | |
| | 2,154 | | | Constellation Brands, Inc. Class A | | | 429,141 | |
| | 37,931 | | | Diageo PLC | | | 1,311,332 | |
| | 16,031 | | | Heineken NV | | | 1,442,266 | |
| | 24,457 | | | The Coca-Cola Co. | | | 1,171,001 | |
| | | | | | | | |
| | | | | | | 5,216,858 | |
| | |
| Biotechnology – 1.0% | |
| | 5,928 | | | CSL Ltd. | | | 791,371 | |
| | 19,337 | | | Shire PLC(f) | | | 1,167,005 | |
| | 18,058 | | | Shire PLC ADR(f) | | | 3,282,945 | |
| | | | | | | | |
| | | | | | | 5,241,321 | |
| | |
| Building Products(f) – 0.4% | |
| | 52,002 | | | USG Corp. | | | 2,195,524 | |
| | |
| Capital Markets – 1.3% | |
| | 12,885 | | | Affiliated Managers Group, Inc. | | | 1,464,509 | |
| | 10,333 | | | Deutsche Boerse AG | | | 1,305,807 | |
| | 26,044 | | | London Stock Exchange Group PLC | | | 1,434,966 | |
| | 14,059 | | | Macquarie Group Ltd. | | | 1,172,410 | |
| | 27,470 | | | NEX Group PLC(f) | | | 398,384 | |
| | 83,258 | | | UBS Group AG* | | | 1,163,289 | |
| | | | | | | | |
| | | | | | | 6,939,365 | |
| | |
| Chemicals – 1.1% | |
| | 16,011 | | | Air Liquide SA | | | 1,935,510 | |
| | 12,442 | | | Sika AG | | | 1,595,344 | |
| | 5,322 | | | The Sherwin-Williams Co. | | | 2,094,047 | |
| | | | | | | | |
| | | | | | | 5,624,901 | |
| | |
| Commercial Services & Supplies – 0.2% | |
| | 38,757 | | | Atento SA | | | 237,968 | |
| | 9,716 | | | Edenred | | | 368,558 | |
| | |
| | |
| The accompanying notes are an integral part of these financial statements. | | 13 |
GOLDMAN SACHS MULTI-MANAGER ALTERNATIVES FUND
Consolidated Schedule of Investments (continued)
October 31, 2018
| | | | | | | | |
Shares | | | Description | | Value | |
| Common Stocks – (continued) | |
| Commercial Services & Supplies – (continued) | |
| | 8,574 | | | Secom Co. Ltd. | | $ | 701,967 | |
| | | | | | | | |
| | | | | | | 1,308,493 | |
| | |
| Communications Equipment – 0.1% | |
| | 5,072 | | | CommScope Holding Co., Inc.* | | | 122,032 | |
| | 2,582 | | | Motorola Solutions, Inc. | | | 316,450 | |
| | 6,597 | | | Quantenna Communications, Inc.* | | | 118,482 | |
| | | | | | | | |
| | | | | | | 556,964 | |
| | |
| Diversified Consumer Services* – 0.0% | |
| | 19,321 | | | Gymboree Holding Corp. | | | 91,775 | |
| | |
| Diversified Financial Services* – 0.5% | |
| | 11,832 | | | Berkshire Hathaway, Inc. Class B | | | 2,428,873 | |
| | |
| Diversified Telecommunication Services – 0.5% | |
| | 30,387 | | | Cellnex Telecom SA(a) | | | 755,916 | |
| | 1,860,956 | | | China Tower Corp. Ltd. Class H*(a) | | | 282,396 | |
| | 31,060 | | | China Unicom Hong Kong Ltd. ADR | | | 323,956 | |
| | 26,803 | | | ORBCOMM, Inc.* | | | 255,432 | |
| | 14,324 | | | Verizon Communications, Inc. | | | 817,757 | |
| | | | | | | | |
| | | | | | | 2,435,457 | |
| | |
| Electric Utilities – 0.0% | |
| | 198,402 | | | TCEH Corp. | | | 155,349 | |
| | |
| Electrical Equipment – 0.1% | |
| | 3,760 | | | Rockwell Automation, Inc. | | | 619,385 | |
| | |
| Electronic Equipment, Instruments & Components* – 0.3% | |
| | 5,447 | | | Fabrinet | | | 235,964 | |
| | 59,518 | | | Flex Ltd. | | | 467,812 | |
| | 12,244 | | | Itron, Inc. | | | 638,402 | |
| | 3,038 | | | Zebra Technologies Corp. Class A | | | 505,219 | |
| | | | | | | | |
| | | | | | | 1,847,397 | |
| | |
| Energy Equipment & Services – 0.5% | |
| | 82,364 | | | Ocean Rig UDW, Inc. Class A* | | | 2,494,806 | |
| | 4,163 | | | Schlumberger Ltd. | | | 213,603 | |
| | | | | | | | |
| | | | | | | 2,708,409 | |
| | |
| Entertainment – 0.9% | |
| | 383 | | | Netflix, Inc.* | | | 115,582 | |
| | 21,239 | | | Nexon Co. Ltd.* | | | 242,278 | |
| | 3,309 | | | Spotify Technology SA* | | | 495,324 | |
| | 66,744 | | | Twenty-First Century Fox, Inc. Class B(f) | | | 3,015,494 | |
| | 10,518 | | | World Wrestling Entertainment, Inc. Class A | | | 763,502 | |
| | | | | | | | |
| | | | | | | 4,632,180 | |
| | |
| Equity Real Estate Investment Trusts (REITs) – 0.0% | |
| | 25,139 | | | Link REIT | | | 223,413 | |
| | |
| Food & Staples Retailing* – 0.3% | |
| | 62,976 | | | BJ’s Wholesale Club Holdings, Inc. | | | 1,394,918 | |
| | |
| Common Stocks – (continued) | |
| Food Products – 0.2% | |
| | 10,595 | | | Nestle SA | | | 894,463 | |
| | |
| Health Care Equipment & Supplies – 1.6% | |
| | 50,203 | | | Abbott Laboratories | | | 3,460,995 | |
| | 9,533 | | | Becton Dickinson & Co. | | | 2,197,356 | |
| | 50,721 | | | Boston Scientific Corp.* | | | 1,833,057 | |
| | 3,255 | | | EssilorLuxottica SA | | | 444,563 | |
| | 6,138 | | | Medtronic PLC | | | 551,315 | |
| | | | | | | | |
| | | | | | | 8,487,286 | |
| | |
| Health Care Providers & Services – 1.3% | |
| | 10,044 | | | Aetna, Inc.(f) | | | 1,992,730 | |
| | 38,639 | | | Express Scripts Holding Co.*(f) | | | 3,746,824 | |
| | 3,660 | | | Millennium Health LLC* | | | 212 | |
| | 8,292 | | | Universal Health Services, Inc. Class B | | | 1,007,975 | |
| | | | | | | | |
| | | | | | | 6,747,741 | |
| | |
| Hotels, Restaurants & Leisure – 0.5% | |
| | 41,160 | | | Aristocrat Leisure Ltd. | | | 775,616 | |
| | 9,847 | | | McDonald’s Corp. | | | 1,741,935 | |
| | | | | | | | |
| | | | | | | 2,517,551 | |
| | |
| Household Durables – 0.1% | |
| | 13,576 | | | D.R. Horton, Inc. | | | 488,193 | |
| | |
| Household Products – 0.1% | |
| | 7,985 | | | Reckitt Benckiser Group PLC | | | 645,700 | |
| | |
| Industrial Conglomerates – 0.3% | |
| | 53,772 | | | CK Hutchison Holdings Ltd. | | | 541,598 | |
| | 7,286 | | | Honeywell International, Inc. | | | 1,055,159 | |
| | | | | | | | |
| | | | | | | 1,596,757 | |
| | |
| Insurance – 0.8% | |
| | 94,493 | | | AIA Group Ltd. | | | 718,812 | |
| | 21,077 | | | Aspen Insurance Holdings Ltd. | | | 882,705 | |
| | 1,011 | | | Muenchener Rueckversicherungs AG | | | 217,148 | |
| | 130,312 | | | Ping An Insurance Group Co. of China Ltd. Class H | | | 1,231,973 | |
| | 20,450 | | | Tokio Marine Holdings, Inc. | | | 963,443 | |
| | 7,590 | | | Trupanion, Inc.* | | | 191,724 | |
| | | | | | | | |
| | | | | | | 4,205,805 | |
| | |
| Interactive Media & Services – 0.9% | |
| | 765 | | | Alphabet, Inc. Class A* | | | 834,294 | |
| | 1,106 | | | Alphabet, Inc. Class C* | | | 1,190,907 | |
| | 8,739 | | | Facebook, Inc. Class A* | | | 1,326,493 | |
| | 24,867 | | | Tencent Holdings Ltd. | | | 851,925 | |
| | 24,569 | | | Yandex NV Class A* | | | 740,264 | |
| | | | | | | | |
| | | | | | | 4,943,883 | |
| | |
| Internet & Direct Marketing Retail – 0.4% | |
| | 9,643 | | | Alibaba Group Holding Ltd. ADR* | | | 1,372,006 | |
| | 42 | | | Amazon.com, Inc.* | | | 67,116 | |
| | 58 | | | Booking Holdings, Inc.* | | | 108,726 | |
| | 5,326 | | | Delivery Hero SE*(a) | | | 214,452 | |
| | |
| | |
| 14 | | The accompanying notes are an integral part of these financial statements. |
GOLDMAN SACHS MULTI-MANAGER ALTERNATIVES FUND
| | | | | | | | |
Shares | | | Description | | Value | |
| Common Stocks – (continued) | |
| Internet & Direct Marketing Retail – (continued) | |
| | 1,564 | | | Expedia Group, Inc. | | $ | 196,173 | |
| | 41,546 | | | Just Eat PLC* | | | 322,292 | |
| | | | | | | | |
| | | | | | | 2,280,765 | |
| | |
| IT Services – 1.3% | |
| | 2,431 | | | Accenture PLC Class A | | | 383,174 | |
| | 2,338 | | | Automatic Data Processing, Inc. | | | 336,859 | |
| | 3,662 | | | Capgemini SE | | | 447,148 | |
| | 873 | | | EPAM Systems, Inc.* | | | 104,297 | |
| | 4,500 | | | ExlService Holdings, Inc.* | | | 288,450 | |
| | 840 | | | FleetCor Technologies, Inc.* | | | 168,025 | |
| | 4,200 | | | Genpact Ltd. | | | 115,122 | |
| | 600 | | | Global Payments, Inc. | | | 68,538 | |
| | 2,639 | | | GoDaddy, Inc. Class A* | | | 193,096 | |
| | 49,453 | | | Infosys Ltd. ADR | | | 468,320 | |
| | 4,606 | | | International Business Machines Corp. | | | 531,671 | |
| | 7,814 | | | Mastercard, Inc. Class A | | | 1,544,593 | |
| | 672 | | | PayPal Holdings, Inc.* | | | 56,576 | |
| | 15,517 | | | Perspecta, Inc. | | | 380,011 | |
| | 402 | | | StoneCo Ltd. Class A* | | | 11,533 | |
| | 3,497 | | | Total System Services, Inc. | | | 318,752 | |
| | 1,187 | | | VeriSign, Inc.* | | | 169,195 | |
| | 8,427 | | | Visa, Inc. Class A | | | 1,161,662 | |
| | 91 | | | WEX, Inc.* | | | 16,012 | |
| | | | | | | | |
| | | | | | | 6,763,034 | |
| | |
| Media – 0.1% | |
| | 14,003 | | | Comcast Corp. Class A | | | 534,074 | |
| | 10,455 | | | Cumulus Media, Inc. Class A* | | | 162,053 | |
| | | | | | | | |
| | | | | | | 696,127 | |
| | |
| Metals & Mining – 0.7% | |
| | 79,421 | | | Glencore PLC* | | | 323,216 | |
| | 753,277 | | | Nevsun Resources Ltd.(f) | | | 3,347,389 | |
| | 12,738 | | | Vale SA ADR | | | 192,344 | |
| | | | | | | | |
| | | | | | | 3,862,949 | |
| | |
| Multi-Utilities* – 0.1% | |
| | 10,332 | | | Innogy SE | | | 430,888 | |
| | |
| Oil, Gas & Consumable Fuels – 0.9% | |
| | 47,531 | | | Energen Corp.*(f) | | | 3,420,806 | |
| | 998 | | | Marathon Petroleum Corp. | | | 70,309 | |
| | 9,982 | | | PBF Energy, Inc. Class A | | | 417,747 | |
| | 3,730 | | | Pioneer Natural Resources Co. | | | 549,317 | |
| | 1,984 | | | Royal Dutch Shell PLC ADR Class A | | | 125,369 | |
| | 10,734 | | | Royal Dutch Shell PLC Class B | | | 350,067 | |
| | | | | | | | |
| | | | | | | 4,933,615 | |
| | |
| Personal Products – 0.5% | |
| | 6,597 | | | Beiersdorf AG | | | 682,112 | |
| | 5,358 | | | L’Oreal SA | | | 1,207,191 | |
| | 10,114 | | | Unilever NV | | | 543,476 | |
| | | | | | | | |
| | | | | | | 2,432,779 | |
| | |
| Common Stocks – (continued) | |
| Pharmaceuticals – 0.5% | |
| | 14,359 | | | AstraZeneca PLC | | | 1,098,315 | |
| | 9,698 | | | Novo Nordisk A/S Class B | | | 418,823 | |
| | 1,945 | | | Roche Holding AG | | | 473,340 | |
| | 7,063 | | | Shionogi & Co. Ltd. | | | 451,634 | |
| | | | | | | | |
| | | | | | | 2,442,112 | |
| | |
| Professional Services – 0.4% | |
| | 118 | | | CoStar Group, Inc.* | | | 42,648 | |
| | 269 | | | Equifax, Inc. | | | 27,287 | |
| | 5,644 | | | Experian PLC | | | 129,807 | |
| | 8,055 | | | Huron Consulting Group, Inc.* | | | 438,917 | |
| | 9,377 | | | The Dun & Bradstreet Corp. | | | 1,334,160 | |
| | 2,257 | | | TransUnion | | | 148,398 | |
| | 1,857 | | | TriNet Group, Inc.* | | | 87,260 | |
| | | | | | | | |
| | | | | | | 2,208,477 | |
| | |
| Road & Rail – 0.8% | |
| | 12,319 | | | CSX Corp. | | | 848,286 | |
| | 17,718 | | | Kansas City Southern | | | 1,806,527 | |
| | 100,127 | | | MTR Corp. Ltd. | | | 485,840 | |
| | 9,323 | | | Old Dominion Freight Line, Inc. | | | 1,215,906 | |
| | | | | | | | |
| | | | | | | 4,356,559 | |
| | |
| Semiconductors & Semiconductor Equipment – 1.1% | |
| | 33,510 | | | Advanced Micro Devices, Inc.* | | | 610,217 | |
| | 625 | | | ASML Holding NV | | | 107,652 | |
| | 3,234 | | | Broadcom, Inc. | | | 722,767 | |
| | 3,155 | | | First Solar, Inc.* | | | 131,879 | |
| | 36,077 | | | FormFactor, Inc.* | | | 441,582 | |
| | 23,594 | | | Integrated Device Technology, Inc.*(f) | | | 1,104,435 | |
| | 9,973 | | | Intel Corp. | | | 467,534 | |
| | 2,543 | | | KLA-Tencor Corp. | | | 232,786 | |
| | 25,943 | | | Marvell Technology Group Ltd. | | | 425,725 | |
| | 3,993 | | | Microchip Technology, Inc. | | | 262,660 | |
| | 186 | | | QUALCOMM, Inc. | | | 11,698 | |
| | 2,661 | | | Taiwan Semiconductor Manufacturing Co. Ltd. ADR | | | 101,384 | |
| | 12,353 | | | Teradyne, Inc. | | | 425,561 | |
| | 7,975 | | | Texas Instruments, Inc. | | | 740,319 | |
| | | | | | | | |
| | | | | | | 5,786,199 | |
| | |
| Software – 1.6% | |
| | 1,877 | | | Adobe, Inc.* | | | 461,292 | |
| | 6,562 | | | Atlassian Corp. PLC Class A* | | | 498,121 | |
| | 4,302 | | | Blackbaud, Inc. | | | 308,539 | |
| | 1,260 | | | Ceridian HCM Holding, Inc.* | | | 47,842 | |
| | 1,207 | | | Check Point Software Technologies Ltd.* | | | 133,977 | |
| | 14,532 | | | Dell Technologies, Inc. Class V*(f) | | | 1,313,548 | |
| | 9,515 | | | Gemalto NV* | | | 542,738 | |
| | 2,639 | | | Guidewire Software, Inc.* | | | 234,792 | |
| | 490 | | | HubSpot, Inc.* | | | 66,469 | |
| | 6,384 | | | Imperva, Inc.* | | | 353,354 | |
| | 1,871 | | | Intuit, Inc. | | | 394,781 | |
| | 2,175 | | | Microsoft Corp. | | | 232,312 | |
| | |
| | |
| The accompanying notes are an integral part of these financial statements. | | 15 |
GOLDMAN SACHS MULTI-MANAGER ALTERNATIVES FUND
Consolidated Schedule of Investments (continued)
October 31, 2018
| | | | | | | | |
Shares | | | Description | | Value | |
| Common Stocks – (continued) | |
| Software – (continued) | |
| | 4,867 | | | Red Hat, Inc.* | | $ | 835,372 | |
| | 1,107 | | | salesforce.com, Inc.* | | | 151,925 | |
| | 17,781 | | | SAP SE ADR | | | 1,907,190 | |
| | 1,360 | | | ServiceNow, Inc.* | | | 246,214 | |
| | 5,612 | | | Workday, Inc. Class A* | | | 746,508 | |
| | | | | | | | |
| | | | | | | 8,474,974 | |
| | |
| Specialty Retail* – 0.1% | |
| | 10,354 | | | CarMax, Inc. | | | 703,140 | |
| | |
| Technology Hardware, Storage & Peripherals – 0.3% | |
| | 13,506 | | | Cray, Inc.* | | | 306,451 | |
| | 5,811 | | | NetApp, Inc. | | | 456,105 | |
| | 23,534 | | | Samsung Electronics Co. Ltd. | | | 881,014 | |
| | | | | | | | |
| | | | | | | 1,643,570 | |
| | |
| Textiles, Apparel & Luxury Goods – 0.1% | |
| | 1,027 | | | Hermes International | | | 586,316 | |
| | |
| Wireless Telecommunication Services – 0.3% | |
| | 8,359 | | | Millicom International Cellular SA SDR | | | 471,717 | |
| | 16,201 | | | T-Mobile US, Inc.*(f) | | | 1,110,578 | |
| | 57,337 | | | VEON Ltd. | | | 161,117 | |
| | | | | | | | |
| | | | | | | 1,743,412 | |
| | |
| | TOTAL COMMON STOCKS | |
| | (Cost $142,927,094) | | $ | 144,065,011 | |
| | |
| | | | | | | | | | | | | | |
Principal Amount | | | Interest Rate | | | Maturity Date | | | Value | |
| Mortgage-Backed Obligations(g) – 2.3% | |
| Collateralized Mortgage Obligations – 2.3% | |
| Interest Only(h) – 1.2% | |
| FHLMC REMIC Series 4723, Class KS (-1 X 1M USD
LIBOR + 6.150%) |
|
| $ | 7,264,213 | | | | 3.992 | % | | | 09/15/47 | | | $ | 1,233,348 | |
| FHLMC REMIC Series 4729, Class KS (-1 X 1M USD
LIBOR + 6.150%) |
|
| | 5,489,588 | | | | 3.992 | | | | 11/15/47 | | | | 932,045 | |
| GNMA REMIC Series 2015-16, Class MS (-1X1M
LIBOR + 5.600%) |
|
| | 8,065,146 | | | | 3.435 | | | | 02/20/45 | | | | 1,070,051 | |
| GNMA REMIC Series 2017-117, Class AS (-1 X 1M
LIBOR + 6.200%) |
|
| | 8,671,040 | | | | 4.035 | | | | 08/20/47 | | | | 1,362,259 | |
| GNMA REMIC Series 2017-68, Class SA (-1X1M
LIBOR + 6.150%) |
|
| | 9,121,502 | | | | 3.985 | | | | 05/20/47 | | | | 1,516,389 | |
| | | | | | | | | | | | | | |
| | | | | | | | | | | | | 6,114,092 | |
| | |
| Regular Floater – 1.1% | |
| CHL GMSR Issuer Trust Series 2018-GT1, Class A(a) (1M USD
LIBOR + 2.750%) |
|
| | 1,000,000 | | | | 4.966 | | | | 05/25/23 | | | | 1,007,802 | |
| | |
| Mortgage-Backed Obligations(g) – (continued) | |
| Regular Floater – (continued) | |
| CHL GMSR Issuer Trust Series 2018-GT1, Class B(a) (1M USD
LIBOR + 3.500%) |
|
| 1,000,000 | | | | 5.716 | | | | 05/25/23 | | | | 1,006,510 | |
| Impac Secured Assets Trust Series 2006-3, Class A2 (1M USD
LIBOR + 0.200%) |
|
| | 2,650,649 | | | | 2.416 | | | | 11/25/36 | | | | 2,275,742 | |
| Impac Secured Assets Trust Series 2007-1, Class A3 (1M USD
LIBOR + 0.240%) |
|
| | 2,183,315 | | | | 2.456 | | | | 03/25/37 | | | | 1,623,734 | |
| | | | | | | | | | | | | | |
| | | | | | | | | | | | | 5,913,788 | |
| | |
| | TOTAL MORTGAGE-BACKED OBLIGATIONS | |
| | (Cost $12,102,519) | | | $ | 12,027,880 | |
| | |
| | | | | | | | | | | | | | |
| Asset-Backed Securities – 7.6% | |
| Collateralized Loan Obligations(a)(g) – 4.6% | |
| Atlas Senior Loan Fund V Ltd. Series 2014-1A, Class AR2
(3M USD LIBOR + 1.260%) |
|
| $ | 1,900,000 | | | | 3.599 | % | | | 07/16/29 | | | $ | 1,904,262 | |
| Atrium IX Series 2009A, Class AR (3M USD
LIBOR + 1.240%) |
|
| | 1,500,000 | | | | 3.559 | | | | 05/28/30 | | | | 1,502,034 | |
| Catamaran CLO Ltd. Series 2013-1A, Class DR (1M USD
LIBOR + 2.800%) |
|
| | 1,750,000 | | | | 5.137 | | | | 01/27/28 | | | | 1,725,936 | |
| CBAM Ltd. Series 2017-3A, Class A (3M USD
LIBOR + 1.230%) |
|
| | 1,900,000 | | | | 3.566 | | | | 10/17/29 | | | | 1,905,223 | |
| CIFC Funding Ltd. Series 2017-5A, Class A1 (3M USD
LIBOR + 1.180%) |
|
| | 1,500,000 | | | | 3.516 | | | | 11/16/30 | | | | 1,500,421 | |
| CVP CLO Ltd. Series 2017-2A, Class D (3M USD
LIBOR + 2.650%) |
|
| | 1,000,000 | | | | 4.998 | | | | 01/20/31 | | | | 971,217 | |
| Magnetite VII Ltd. Series 2012-7A, Class BR2 (3M USD
LIBOR + 1.650%) |
|
| | 816,000 | | | | 3.989 | | | | 01/15/28 | | | | 804,380 | |
| Neuberger Berman Loan Advisers CLO 26 Ltd.
Series 2017-26A, Class A (3M USD LIBOR + 1.170%) |
|
| | 2,500,000 | | | | 3.503 | | | | 10/18/30 | | | | 2,502,662 | |
| Shackleton CLO Ltd. Series 2013-3A, Class DR (3M USD
LIBOR + 3.020%) |
|
| | 1,500,000 | | | | 5.359 | | | | 07/15/30 | | | | 1,482,990 | |
| Shackleton CLO Ltd. Series 2015-7RA, Class A1 (3M USD
LIBOR + 1.170%) |
|
| | 1,275,000 | | | | 3.509 | | | | 07/15/31 | | | | 1,274,902 | |
| Venture CLO Ltd. Series 2014-17A, Class DRR (3M USD
LIBOR + 2.820%) |
|
| | 2,850,000 | | | | 5.159 | | | | 04/15/27 | | | | 2,829,711 | |
| Venture CLO Ltd. Series 2017-30A, Class D (3M USD
LIBOR + 3.000%) |
|
| | 1,500,000 | | | | 5.339 | | | | 01/15/31 | | | | 1,494,754 | |
| Vibrant CLO VII Ltd. Series 2017-7A, Class A1 (3M USD
LIBOR + 1.270%) |
|
| | 1,500,000 | | | | 3.618 | | | | 09/15/30 | | | | 1,500,669 | |
| | |
| | |
| 16 | | The accompanying notes are an integral part of these financial statements. |
GOLDMAN SACHS MULTI-MANAGER ALTERNATIVES FUND
| | | | | | | | | | | | | | |
Principal Amount | | | Interest Rate | | | Maturity Date | | | Value | |
| Asset-Backed Securities – (continued) | |
| Collateralized Loan Obligations(a)(g) – (continued) | |
| Voya CLO Ltd. Series 2013-1A, Class CR (3M USD
LIBOR + 2.950%) |
|
| $ | 1,500,000 | | | | 5.289 | % | | | 10/15/30 | | | $ | 1,489,784 | |
| York CLO-2 Ltd. Series 2015-1A, Class AR (3M USD
LIBOR + 1.150%) |
|
| | 1,404,400 | | | | 3.497 | | | | 01/22/31 | | | | 1,404,268 | |
| | | | | | | | | | | | | | |
| | | | | | | | | | | | | 24,293,213 | |
| | |
| Home Equity – 3.0% | |
| ACE Securities Corp. Home Equity Loan
Trust Series 2006-ASAP6, Class A2D(g) (1M USD
LIBOR + 0.220%) |
|
| | 5,483,546 | | | | 2.436 | | | | 12/25/36 | | | | 2,677,177 | |
| Argent Securities Trust Series 2006-M2, Class A2D(g) (1M USD
LIBOR + 0.240%) |
|
| | 2,852,102 | | | | 2.456 | | | | 09/25/36 | | | | 1,169,572 | |
| Countrywide Asset-Backed Certificates Series 2006-22,
Class M1(g) (1M USD LIBOR + 0.230%) |
|
| | 5,565,801 | | | | 2.446 | | | | 05/25/47 | | | | 1,251,793 | |
| JPMorgan Mortgage Acquisition Trust Series 2007-CH1,
Class MF2(i) |
|
| | 1,697,367 | | | | 4.932 | | | | 11/25/36 | | | | 932,195 | |
| Morgan Stanley IXIS Real Estate Capital Trust Series 2006-2,
Class A3(g) (1M USD LIBOR + 0.150%) |
|
| | 6,002,611 | | | | 2.366 | | | | 11/25/36 | | | | 3,007,199 | |
| Morgan Stanley IXIS Real Estate Capital Trust Series 2006-2,
Class AFPT(g) (1M USD LIBOR + 0.070%) |
|
| | 4,400,570 | | | | 2.286 | | | | 11/25/36 | | | | 2,190,208 | |
| Progress Residential Trust Series 2016-SFR2, Class F(a)(g)
(1M LIBOR + 4.220%) |
|
| | 1,300,000 | | | | 6.510 | | | | 01/17/34 | | | | 1,308,311 | |
| Securitized Asset Backed Receivables LLC Trust
Series 2006-FR3, Class A3(g) (1M USD LIBOR + 0.250%) |
|
| | 1,303,684 | | | | 2.466 | | | | 05/25/36 | | | | 836,474 | |
| Securitized Asset Backed Receivables LLC Trust
Series 2006-FR4, Class A1(a) (g) (1M USD LIBOR + 0.140%) |
|
| | 4,981,059 | | | | 2.356 | | | | 08/25/36 | | | | 2,606,421 | |
| | | | | | | | | | | | | | |
| | | | | | | | | | | | | 15,979,350 | |
| | |
| Other(e) – 0.0% | |
| | EFIH Intercompany Claim | |
| | 105,640 | | | | 1.000 | | | | 11/02/26 | | | | 12,677 | |
| | |
| | TOTAL ASSET-BACKED SECURITIES | |
| | (Cost $40,649,580) | | | $ | 40,285,240 | |
| | |
| | | | | | | | | | | | | | |
| Foreign Debt Obligations – 2.9% | |
| | Brazil Notas do Tesouro Nacional | |
| $ | 427,000 | | | | 4.875 | % | | | 01/22/21 | | | | 433,832 | |
| | Ecuador Government International Bond | |
| | 216,000 | | | | 10.750 | | | | 03/28/22 | | | | 223,020 | |
| | Hellenic Republic Government Bond | |
| EUR | 275,277 | | | | 3.900 | | | | 01/30/33 | | | | 283,053 | |
| | National Highways Authority of India | |
| INR | 40,000,000 | | | | 7.300 | | | | 05/18/22 | | | | 507,134 | |
| | |
| Foreign Debt Obligations – (continued) | |
| | Republic of Argentina | |
| $ | 6,144,336 | | | | 3.750 | | | | 02/08/19 | | | | 172,148 | |
| | 1,250,000 | | | | 3.875 | | | | 01/15/22 | | | | 1,258,304 | |
| ARS | 4,679,211 | | | | 42.819 | (g) | | | 06/21/20 | | | | 147,418 | |
| $ | 2,267,000 | | | | 4.625 | | | | 01/11/23 | | | | 1,912,214 | |
| | Republic of South Africa | |
| ZAR | 39,760,466 | | | | 10.500 | | | | 12/21/26 | | | | 2,864,380 | |
| | 17,202,189 | | | | 8.750 | | | | 02/28/48 | | | | 1,003,054 | |
| | Republic of Turkey | |
| $ | 654,000 | | | | 5.625 | | | | 03/30/21 | | | | 637,650 | |
| | 244,000 | | | | 7.000 | | | | 06/05/20 | | | | 245,830 | |
| | Russian Federation Bond | |
| | 2,200,000 | | | | 5.250 | | | | 06/23/47 | | | | 2,030,600 | |
| | 3,000,000 | | | | 4.500 | | | | 04/04/22 | | | | 3,025,500 | |
| | 200,000 | | | | 5.000 | | | | 04/29/20 | | | | 203,200 | |
| | Saudi Government International Bond | |
| | 600,000 | | | | 2.375 | | | | 10/26/21 | | | | 572,250 | |
| | |
| | TOTAL FOREIGN DEBT OBLIGATIONS | |
| | (Cost $17,246,669) | | | $ | 15,519,587 | |
| | |
| | | | | | | | |
Units | | | Expiration Date | | Value | |
| Warrant*(e) – 0.0% | |
| Specialty Retail – 0.0% | |
| | Guitar Center, Inc. | |
| | 2,837 | | | 04/16/25 | | $ | — | |
| | (Cost $0) | |
| | |
| | | | | | | | |
| Shares | | | Distribution Rate | | Value | |
| Investment Company(j) – 35.3% | |
| Goldman Sachs Financial Square Government Fund –
Institutional Shares |
|
| | 187,779,673 | | | 2.102% | | $ | 187,779,673 | |
| | (Cost $187,779,673) | |
| | |
| | | | | | | | | | | | | | |
Principal Amount | | | Interest Rate | | | Maturity Date | | | Value | |
| Short-term Investment(k) – 11.7% | |
| Repurchase Agreements – 11.7% | |
| | Joint Repurchase Agreement Account II | |
| $ | 62,100,000 | | | | 2.220 | % | | | 11/01/18 | | | $ | 62,100,000 | |
| | (Cost $62,100,000) | |
| | |
| TOTAL INVESTMENTS BEFORE SHORT
POSITIONS – 88.0% |
|
| | (Cost $471,094,586) | | | $ | 468,470,355 | |
| | |
| | |
| The accompanying notes are an integral part of these financial statements. | | 17 |
GOLDMAN SACHS MULTI-MANAGER ALTERNATIVES FUND
Consolidated Schedule of Investments (continued)
October 31, 2018
| | | | | | | | |
Shares | | | Description | | Value | |
| Common Stocks Sold Short – (2.5)% | |
| Aerospace & Defense – (0.1)% | |
| | 4,554 | | | United Technologies Corp. | | $ | (565,652 | ) |
| | |
| Capital Markets – (0.4)% | |
| | 10,535 | | | CME Group, Inc. | | | (1,930,433 | ) |
| | |
| Energy Equipment & Services* – (0.3)% | |
| | 132,836 | | | Transocean Ltd. | | | (1,462,524 | ) |
| | |
| Entertainment – (0.1)% | |
| | 6,007 | | | The Walt Disney Co. | | | (689,784 | ) |
| | |
| Health Care Providers & Services – (0.3)% | |
| | 5,410 | | | Cigna Corp. | | | (1,156,712 | ) |
| | 8,415 | | | CVS Health Corp. | | | (609,162 | ) |
| | | | | | | | |
| | | | | | | (1,765,874 | ) |
| | |
| Oil, Gas & Consumable Fuels – (0.6)% | |
| | 30,619 | | | Diamondback Energy, Inc. | | | (3,440,351 | ) |
| | |
| Pharmaceuticals – (0.4)% | |
| | 9,183 | | | Endocyte, Inc.* | | | (217,178 | ) |
| | 39,550 | | | Takeda Pharmaceutical Co. Ltd. | | | (1,639,724 | ) |
| | | | | | | | |
| | | | | | | (1,856,902 | ) |
| | |
| Software* – (0.1)% | |
| | 5,202 | | | VMware, Inc. Class A | | | (735,511 | ) |
| | |
| Wireless Telecommunication Services* – (0.2)% | |
| | 154,879 | | | Sprint Corp. | | | (947,860 | ) |
| | |
| TOTAL COMMON STOCKS SOLD SHORT | |
| | (Cost $(13,718,648)) | | $ | (13,394,891 | ) |
| | |
| | TOTAL SECURITIES SOLD SHORT – (2.5)% | |
| | (Cost $(13,718,648)) | | $ | (13,394,891 | ) |
| | |
| OTHER ASSETS IN EXCESS
OF OTHER LIABILITIES – 14.5% | | | 77,475,211 | |
| | |
| | NET ASSETS – 100.0% | | $ | 532,550,675 | |
| | |
| | |
| The percentage shown for each investment category reflects the value of investments in that category as a percentage of net assets. |
* | | Non-income producing security. |
(a) | | Exempt from registration under Rule 144A of the Securities Act of 1933. Under procedures approved by the Board of Trustees, such securities may be deemed liquid by the investment Adviser and may be resold, normally to qualified institutional buyers in transactions exempt from registration. Total market value of Rule 144A securities amounts to $31,692,402, which represents approximately 6.0% of the Fund’s net assets as of October 31, 2018. The liquidity determination is unaudited. |
(b) | | Security is currently in default. |
(c) | | Security with “Call” features with resetting interest rates. Maturity dates disclosed are the final maturity dates. |
(d) | | Guaranteed by a foreign government until maturity. |
| | |
(e) | | Significant unobservable inputs were used in the valuation of this portfolio security; i.e. Level 3. |
(f) | | All or portion of security is pledged as collateral for short sales. Total market value of securities pledged as collateral on short sales amounts to $15,474,400, which represents approximately 2.9% of net assets as of October 31, 2018. |
(g) | | Variable rate security. Except for floating rate notes (for which final maturity is disclosed), maturity date disclosed is the next interest reset date. Interest rate disclosed is that which is in effect on October 31, 2018. |
(h) | | Security with a notional or nominal principal amount. The actual effective yield of this security is different than the stated interest rate. |
(i) | | Coupon changes periodically based upon a predetermined schedule. Interest rate disclosed is that which is in effect on October 31, 2018. |
(j) | | Represents an affiliated issuer. |
(k) | | Joint repurchase agreement was entered into on October 31, 2018. Additional information appears on page 58. |
| | |
|
Currency Abbreviations: |
ARS | | —Argentine Peso |
AUD | | —Australian Dollar |
BRL | | —Brazilian Real |
CAD | | —Canadian Dollar |
CHF | | —Swiss Franc |
CLP | | —Chilean Peso |
CNH | | —Chinese Yuan Renminbi Offshore |
CNY | | —Chinese Yuan Renminbi |
COP | | —Colombian Peso |
DKK | | —Danish Krone |
EUR | | —Euro |
GBP | | —British Pound |
HKD | | —Hong Kong Dollar |
HUF | | —Hungarian Forint |
ILS | | —Israeli Shekel |
INR | | —Indian Rupee |
JPY | | —Japanese Yen |
KRW | | —South Korean Won |
MXN | | —Mexican Peso |
MYR | | —Malaysian Ringgit |
NOK | | —Norwegian Krone |
NZD | | —New Zealand Dollar |
PLN | | —Polish Zloty |
RUB | | —Russian Ruble |
SEK | | —Swedish Krona |
SGD | | —Singapore Dollar |
THB | | —Thai Baht |
TRY | | —Turkish Lira |
TWD | | —Taiwan Dollar |
USD | | —U.S. Dollar |
ZAR | | —South African Rand |
|
| | |
| 18 | | The accompanying notes are an integral part of these financial statements. |
GOLDMAN SACHS MULTI-MANAGER ALTERNATIVES FUND
| | |
|
Investment Abbreviations: |
ADR | | —American Depositary Receipt |
BP | | —British Pound Offered Rate |
BUBOR | | —Budapest Interbank Offered Rate |
CLO | | —Collateralized Loan Obligation |
CP | | —Commercial Paper |
ETF | | —Exchange Traded Fund |
EURO | | —Euro Offered Rate |
FHLMC | | —Federal Home Loan Mortgage Corp. |
GNMA | | —Government National Mortgage Association |
GP | | —General Partnership |
LIBOR | | —London Interbank Offered Rate |
LLC | | —Limited Liability Company |
LP | | —Limited Partnership |
NZDOR | | —New Zealand Dollar Offered Rate |
PLC | | —Public Limited Company |
REIT | | —Real Estate Investment Trust |
REMIC | | —Real Estate Mortgage Investment Conduit |
SDR | | —Special Drawing Rights |
SPA | | —Stand-by Purchase Agreement |
TIIE | | —La Tasa de Interbank Equilibrium Interest Rate |
|
|
| ADDITIONAL INVESTMENT INFORMATION |
FORWARD FOREIGN CURRENCY EXCHANGE CONTRACTS — At October 31, 2018, the Fund had the following forward foreign currency exchange contracts:
FORWARD FOREIGN CURRENCY EXCHANGE CONTRACTS WITH UNREALIZED GAIN
| | | | | | | | | | | | | | | | | | | | |
| Counterparty | | Currency
Purchased | | | Currency
Sold | | | Settlement
Date | | | Unrealized
Gain | |
Barclays Bank PLC | | BRL | | | 1,751,893 | | | USD | | | 450,561 | | | | 11/05/18 | | | $ | 19,863 | |
| | RUB | | | 34,359,429 | | | USD | | | 486,195 | | | | 12/19/18 | | | | 32,115 | |
| | TRY | | | 2,896,981 | | | USD | | | 431,226 | | | | 12/19/18 | | | | 71,461 | |
| | USD | | | 3,930,237 | | | BRL | | | 14,615,417 | | | | 11/05/18 | | | | 5,657 | |
| | USD | | | 1,283,928 | | | CNH | | | 8,879,500 | | | | 12/19/18 | | | | 14,107 | |
| | USD | | | 2,360,207 | | | EUR | | | 2,024,804 | | | | 12/19/18 | | | | 56,342 | |
| | USD | | | 588,803 | | | INR | | | 43,365,336 | | | | 11/26/18 | | | | 5,052 | |
| | USD | | | 1,084,874 | | | MXN | | | 20,698,183 | | | | 12/19/18 | | | | 74,384 | |
| | USD | | | 922,221 | | | ZAR | | | 13,402,189 | | | | 12/19/18 | | | | 19,367 | |
| | ZAR | | | 752,596 | | | USD | | | 49,501 | | | | 12/19/18 | | | | 1,198 | |
Deutsche Bank AG (London) | | AUD | | | 1,800,000 | | | CAD | | | 1,673,930 | | | | 11/15/18 | | | | 3,006 | |
| | AUD | | | 400,000 | | | JPY | | | 31,721,260 | | | | 11/15/18 | | | | 1,877 | |
| | AUD | | | 1,000,000 | | | NZD | | | 1,083,011 | | | | 11/15/18 | | | | 1,439 | |
| | AUD | | | 1,000,000 | | | USD | | | 707,544 | | | | 11/15/18 | | | | 725 | |
| | BRL | | | 19,382,706 | | | USD | | | 4,700,000 | | | | 12/20/18 | | | | 484,922 | |
| | EUR | | | 1,100,000 | | | GBP | | | 962,645 | | | | 11/15/18 | | | | 16,134 | |
| | EUR | | | 300,000 | | | HUF | | | 97,342,980 | | | | 11/15/18 | | | | 288 | |
| | EUR | | | 200,000 | | | JPY | | | 25,504,109 | | | | 11/15/18 | | | | 525 | |
| | EUR | | | 250,000 | | | NOK | | | 2,380,298 | | | | 11/15/18 | | | | 954 | |
| | EUR | | | 100,000 | | | PLN | | | 431,013 | | | | 11/15/18 | | | | 1,039 | |
| | HUF | | | 32,604,350 | | | EUR | | | 100,000 | | | | 11/15/18 | | | | 451 | |
| | INR | | | 179,016,000 | | | USD | | | 2,400,000 | | | | 11/05/18 | | | | 17,665 | |
| | JPY | | | 144,414,740 | | | AUD | | | 1,800,000 | | | | 11/15/18 | | | | 6,364 | |
| | JPY | | | 51,610,720 | | | CAD | | | 600,000 | | | | 11/15/18 | | | | 2,001 | |
| | JPY | | | 565,826,725 | | | CHF | | | 5,000,000 | | | | 11/15/18 | | | | 48,865 | |
| | JPY | | | 1,163,395,503 | | | EUR | | | 9,000,000 | | | | 11/15/18 | | | | 115,744 | |
| | JPY | | | 127,645,723 | | | GBP | | | 875,000 | | | | 11/15/18 | | | | 13,320 | |
| | JPY | | | 12,500,000 | | | USD | | | 110,854 | | | | 11/15/18 | | | | 46 | |
| | |
| The accompanying notes are an integral part of these financial statements. | | 19 |
GOLDMAN SACHS MULTI-MANAGER ALTERNATIVES FUND
Consolidated Schedule of Investments (continued)
October 31, 2018
|
| ADDITIONAL INVESTMENT INFORMATION (continued) |
FORWARD FOREIGN CURRENCY EXCHANGE CONTRACTS WITH UNREALIZED GAIN (continued)
| | | | | | | | | | | | | | | | | | | | |
| Counterparty | | Currency
Purchased | | | Currency
Sold | | | Settlement
Date | | | Unrealized
Gain | |
Deutsche Bank AG (London) (continued) | | JPY | | | 1,122,382,776 | | | USD | | | 9,926,626 | | | | 12/20/18 | | | $ | 65,588 | |
| | KRW | | | 1,483,560,000 | | | USD | | | 1,300,000 | | | | 11/05/18 | | | | 334 | |
| | NZD | | | 2,402,186 | | | AUD | | | 2,200,000 | | | | 11/15/18 | | | | 9,607 | |
| | NZD | | | 1,800,000 | | | JPY | | | 131,220,060 | | | | 11/15/18 | | | | 10,594 | |
| | NZD | | | 1,300,000 | | | USD | | | 847,743 | | | | 11/15/18 | | | | 709 | |
| | RUB | | | 6,640,880 | | | USD | | | 100,000 | | | | 11/15/18 | | | | 610 | |
| | SEK | | | 13,664,525 | | | NOK | | | 12,500,000 | | | | 11/15/18 | | | | 11,244 | |
| | TRY | | | 616,363 | | | USD | | | 100,000 | | | | 11/15/18 | | | | 9,233 | |
| | TWD | | | 12,390,400 | | | USD | | | 400,000 | | | | 11/05/18 | | | | 380 | |
| | USD | | | 2,637,028 | | | AUD | | | 3,700,000 | | | | 11/15/18 | | | | 16,432 | |
| | USD | | | 5,828,008 | | | AUD | | | 8,000,000 | | | | 12/20/18 | | | | 159,633 | |
| | USD | | | 8,431,984 | | | CAD | | | 11,000,000 | | | | 11/15/18 | | | | 74,012 | |
| | USD | | | 3,399,752 | | | CAD | | | 4,411,000 | | | | 12/20/18 | | | | 45,421 | |
| | USD | | | 3,416,529 | | | CHF | | | 3,375,000 | | | | 11/15/18 | | | | 60,999 | |
| | USD | | | 1,218,784 | | | CHF | | | 1,210,000 | | | | 12/20/18 | | | | 10,983 | |
| | USD | | | 310,619 | | | CLP | | | 204,942,012 | | | | 11/05/18 | | | | 16,154 | |
| | USD | | | 500,000 | | | CLP | | | 341,661,163 | | | | 11/13/18 | | | | 9,047 | |
| | USD | | | 200,000 | | | CLP | | | 136,574,000 | | | | 11/26/18 | | | | 3,714 | |
| | USD | | | 200,000 | | | CLP | | | 138,888,000 | | | | 12/05/18 | | | | 356 | |
| | USD | | | 18,622,000 | | | CLP | | | 12,538,587,720 | | | | 12/20/18 | | | | 592,671 | |
| | USD | | | 3,700,000 | | | CNH | | | 25,683,563 | | | | 11/15/18 | | | | 21,050 | |
| | USD | | | 5,460,000 | | | CNH | | | 37,868,024 | | | | 12/20/18 | | | | 44,893 | |
| | USD | | | 100,000 | | | COP | | | 308,225,510 | | | | 11/23/18 | | | | 4,367 | |
| | USD | | | 100,000 | | | COP | | | 311,635,000 | | | | 11/26/18 | | | | 3,324 | |
| | USD | | | 100,000 | | | COP | | | 319,950,000 | | | | 12/03/18 | | | | 775 | |
| | USD | | | 2,874,446 | | | EUR | | | 2,500,000 | | | | 11/15/18 | | | | 39,470 | |
| | USD | | | 6,649,499 | | | EUR | | | 5,766,000 | | | | 12/20/18 | | | | 88,078 | |
| | USD | | | 13,441,564 | | | GBP | | | 10,253,876 | | | | 11/15/18 | | | | 326,521 | |
| | USD | | | 1,284,965 | | | GBP | | | 984,000 | | | | 12/20/18 | | | | 23,852 | |
| | USD | | | 200,000 | | | HUF | | | 57,309,940 | | | | 11/05/18 | | | | 9 | |
| | USD | | | 800,000 | | | HUF | | | 224,865,600 | | | | 11/15/18 | | | | 14,800 | |
| | USD | | | 800,000 | | | ILS | | | 2,927,827 | | | | 11/15/18 | | | | 11,923 | |
| | USD | | | 2,400,000 | | | INR | | | 177,513,120 | | | | 11/05/18 | | | | 2,632 | |
| | USD | | | 2,400,000 | | | INR | | | 177,690,000 | | | | 11/19/18 | | | | 5,670 | |
| | USD | | | 2,400,000 | | | INR | | | 177,354,000 | | | | 11/26/18 | | | | 12,596 | |
| | USD | | | 500,000 | | | INR | �� | | 36,911,250 | | | | 11/29/18 | | | | 3,343 | |
| | USD | | | 1,900,000 | | | INR | | | 140,348,250 | | | | 12/03/18 | | | | 12,635 | |
| | USD | | | 106,239 | | | JPY | | | 11,935,622 | | | | 11/01/18 | | | | 452 | |
| | USD | | | 4,114,131 | | | JPY | | | 462,500,000 | | | | 11/15/18 | | | | 10,828 | |
| | USD | | | 15,005,562 | | | JPY | | | 1,680,790,681 | | | | 12/20/18 | | | | 42,022 | |
| | USD | | | 1,300,000 | | | KRW | | | 1,453,595,000 | | | | 11/05/18 | | | | 25,930 | |
| | USD | | | 1,300,000 | | | KRW | | | 1,483,534,000 | | | | 11/13/18 | | | | 25 | |
| | USD | | | 788,609 | | | KRW | | | 892,700,711 | | | | 11/16/18 | | | | 6,278 | |
| | USD | | | 1,200,000 | | | KRW | | | 1,353,730,753 | | | | 11/19/18 | | | | 13,511 | |
| | USD | | | 1,200,000 | | | KRW | | | 1,361,124,000 | | | | 11/26/18 | | | | 6,728 | |
| | USD | | | 1,200,000 | | | KRW | | | 1,367,292,000 | | | | 12/03/18 | | | | 1,015 | |
| | USD | | | 2,363,000 | | | KRW | | | 2,627,656,000 | | | | 12/20/18 | | | | 57,364 | |
| | USD | | | 563 | | | MXN | | | 11,250 | | | | 11/01/18 | | | | 9 | |
| | USD | | | 3,169,425 | | | MXN | | | 61,000,000 | | | | 11/15/18 | | | | 174,177 | |
| | USD | | | 7,201,500 | | | MXN | | | 139,875,027 | | | | 12/20/18 | | | | 373,965 | |
| | USD | | | 1,300,000 | | | NOK | | | 10,843,490 | | | | 11/15/18 | | | | 12,866 | |
| | USD | | | 327,274 | | | NZD | | | 500,000 | | | | 11/15/18 | | | | 947 | |
| | |
| 20 | | The accompanying notes are an integral part of these financial statements. |
GOLDMAN SACHS MULTI-MANAGER ALTERNATIVES FUND
|
| ADDITIONAL INVESTMENT INFORMATION (continued) |
FORWARD FOREIGN CURRENCY EXCHANGE CONTRACTS WITH UNREALIZED GAIN (continued)
| | | | | | | | | | | | | | | | | | | | |
| Counterparty | | Currency
Purchased | | | Currency
Sold | | | Settlement
Date | | | Unrealized
Gain | |
Deutsche Bank AG (London) (continued) | | USD | | | 900,000 | | | PLN | | | 3,427,864 | | | | 11/15/18 | | | $ | 6,396 | |
| | USD | | | 1,200,000 | | | RUB | | | 78,758,220 | | | | 11/15/18 | | | | 6,800 | |
| | USD | | | 1,400,000 | | | SEK | | | 12,666,646 | | | | 11/15/18 | | | | 14,169 | |
| | USD | | | 2,600,000 | | | SGD | | | 3,585,977 | | | | 11/15/18 | | | | 10,330 | |
| | USD | | | 400,000 | | | TWD | | | 12,202,000 | | | | 11/05/18 | | | | 5,708 | |
| | USD | | | 800,000 | | | TWD | | | 24,612,000 | | | | 11/16/18 | | | | 4,147 | |
| | USD | | | 500,000 | | | TWD | | | 15,430,249 | | | | 11/19/18 | | | | 926 | |
| | USD | | | 500,000 | | | TWD | | | 15,440,500 | | | | 11/26/18 | | | | 309 | |
| | USD | | | 500,000 | | | TWD | | | 15,441,000 | | | | 12/03/18 | | | | 13 | |
| | USD | | | 200,000 | | | ZAR | | | 2,933,094 | | | | 11/15/18 | | | | 1,548 | |
| | USD | | | 13,794,000 | | | ZAR | | | 199,733,636 | | | | 12/20/18 | | | | 340,415 | |
JPMorgan Securities, Inc. | | AUD | | | 6,836,180 | | | USD | | | 4,839,231 | | | | 12/19/18 | | | | 4,464 | |
| | JPY | | | 228,844,635 | | | USD | | | 2,027,822 | | | | 12/19/18 | | | | 9,270 | |
| | NZD | | | 23,821,502 | | | USD | | | 15,495,778 | | | | 12/19/18 | | | | 57,386 | |
| | USD | | | 19,094,961 | | | AUD | | | 26,666,028 | | | | 12/19/18 | | | | 201,061 | |
| | USD | | | 24,743,835 | | | CAD | | | 32,057,700 | | | | 12/19/18 | | | | 366,347 | |
| | USD | | | 33,078,294 | | | EUR | | | 28,503,848 | | | | 12/19/18 | | | | 646,019 | |
| | USD | | | 24,313,447 | | | GBP | | | 18,454,516 | | | | 12/19/18 | | | | 663,370 | |
| | USD | | | 1,548,159 | | | INR | | | 113,836,141 | | | | 12/19/18 | | | | 20,827 | |
| | USD | | | 24,778,275 | | | JPY | | | 2,768,139,224 | | | | 12/19/18 | | | | 137,310 | |
| | USD | | | 1,500,000 | | | MXN | | | 29,958,000 | | | | 11/01/18 | | | | 25,469 | |
| | USD | | | 37,550,981 | | | NOK | | | 310,479,477 | | | | 12/19/18 | | | | 632,601 | |
| | USD | | | 14,373,909 | | | NZD | | | 21,817,990 | | | | 12/19/18 | | | | 128,842 | |
| | USD | | | 24,622,803 | | | SEK | | | 220,958,854 | | | | 12/19/18 | | | | 358,690 | |
MS & Co. Int. PLC | | BRL | | | 64,863,827 | | | USD | | | 15,700,000 | | | | 12/20/18 | | | | 1,651,234 | |
| | USD | | | 3,800,000 | | | CHF | | | 3,714,956 | | | | 12/20/18 | | | | 91,792 | |
| | USD | | | 6,100,000 | | | CNH | | | 42,130,128 | | | | 12/20/18 | | | | 75,414 | |
| | USD | | | 11,795,087 | | | CNH | | | 79,917,300 | | | | 06/28/19 | | | | 441,658 | |
| | USD | | | 4,484,740 | | | EUR | | | 3,824,000 | | | | 12/19/18 | | | | 133,713 | |
| | USD | | | 159,546 | | | GBP | | | 122,000 | | | | 12/19/18 | | | | 3,198 | |
| | USD | | | 8,455,000 | | | JPY | | | 944,690,701 | | | | 12/20/18 | | | | 44,722 | |
| | USD | | | 4,300,000 | | | MXN | | | 82,015,142 | | | | 12/20/18 | | | | 296,703 | |
| | USD | | | 114,408 | | | SEK | | | 1,029,000 | | | | 12/19/18 | | | | 1,410 | |
| | | ZAR | | | 71,030,750 | | | USD | | | 4,700,000 | | | | 12/20/18 | | | | 84,463 | |
| TOTAL | | | | | | | | | | | | | | | | | | $ | 9,921,411 | |
FORWARD FOREIGN CURRENCY EXCHANGE CONTRACTS WITH UNREALIZED LOSS
| | | | | | | | | | | | | | | | | | | | |
| Counterparty | | Currency
Purchased | | | Currency
Sold | | | Settlement
Date | | | Unrealized
Loss | |
Barclays Bank PLC | | BRL | | | 14,597,010 | | | USD | | | 3,933,284 | | | | 11/05/18 | | | $ | (13,645 | ) |
| | COP | | | 3,612,185,967 | | | USD | | | 1,172,978 | | | | 11/23/18 | | | | (52,223 | ) |
| | EUR | | | 455,556 | | | USD | | | 531,646 | | | | 12/19/18 | | | | (13,304 | ) |
| | INR | | | 74,049,928 | | | USD | | | 1,013,001 | | | | 12/19/18 | | | | (19,479 | ) |
| | MXN | | | 20,698,183 | | | USD | | | 1,055,572 | | | | 12/19/18 | | | | (45,082 | ) |
| | USD | | | 429,399 | | | BRL | | | 1,733,486 | | | | 11/05/18 | | | | (36,082 | ) |
| | USD | | | 442,593 | | | TRY | | | 2,896,981 | | | | 12/19/18 | | | | (60,094 | ) |
| | USD | | | 3,094,768 | | | ZAR | | | 47,606,044 | | | | 12/19/18 | | | | (112,270 | ) |
Deutsche Bank AG (London) | | AUD | | | 400,000 | | | JPY | | | 32,016,800 | | | | 11/15/18 | | | | (745 | ) |
| | AUD | | | 6,400,000 | | | NZD | | | 6,997,647 | | | | 11/15/18 | | | | (34,126 | ) |
| | AUD | | | 1,500,000 | | | USD | | | 1,065,664 | | | | 11/15/18 | | | | (3,260 | ) |
| | |
| The accompanying notes are an integral part of these financial statements. | | 21 |
GOLDMAN SACHS MULTI-MANAGER ALTERNATIVES FUND
Consolidated Schedule of Investments (continued)
October 31, 2018
|
| ADDITIONAL INVESTMENT INFORMATION (continued) |
FORWARD FOREIGN CURRENCY EXCHANGE CONTRACTS WITH UNREALIZED LOSS (continued)
| | | | | | | | | | | | | | | | | | | | |
| Counterparty | | Currency
Purchased | | | Currency
Sold | | | Settlement
Date | | | Unrealized
Loss | |
Deutsche Bank AG (London) (continued) | | AUD | | | 3,300,000 | | | USD | | | 2,405,162 | | | | 12/20/18 | | | $ | (66,958 | ) |
| | BRL | | | 12,590,286 | | | USD | | | 3,390,000 | | | | 12/20/18 | | | | (22,068 | ) |
| | CAD | | | 4,079,362 | | | AUD | | | 4,400,000 | | | | 11/15/18 | | | | (16,822 | ) |
| | CAD | | | 2,200,000 | | | JPY | | | 190,964,340 | | | | 11/15/18 | | | | (22,645 | ) |
| | CAD | | | 10,300,000 | | | USD | | | 7,918,363 | | | | 11/15/18 | | | | (92,262 | ) |
| | CHF | | | 160,347 | | | GBP | | | 125,000 | | | | 11/15/18 | | | | (457 | ) |
| | CHF | | | 4,500,000 | | | JPY | | | 509,615,400 | | | | 11/15/18 | | | | (47,273 | ) |
| | CHF | | | 2,375,000 | | | USD | | | 2,401,721 | | | | 11/15/18 | | | | (40,424 | ) |
| | CHF | | | 1,375,948 | | | USD | | | 1,442,408 | | | | 12/20/18 | | | | (68,958 | ) |
| | CLP | | | 204,942,000 | | | USD | | | 300,000 | | | | 11/05/18 | | | | (5,535 | ) |
| | CLP | | | 337,638,525 | | | USD | | | 500,000 | | | | 11/13/18 | | | | (14,827 | ) |
| | CLP | | | 138,852,000 | | | USD | | | 200,000 | | | | 11/26/18 | | | | (440 | ) |
| | CLP | | | 14,437,701,600 | | | USD | | | 21,495,000 | | | | 12/20/18 | | | | (734,919 | ) |
| | CNH | | | 15,247,864 | | | USD | | | 2,200,000 | | | | 11/15/18 | | | | (15,875 | ) |
| | CNH | | | 21,114,204 | | | USD | | | 3,052,000 | | | | 12/20/18 | | | | (32,678 | ) |
| | COP | | | 311,498,000 | | | USD | | | 100,000 | | | | 11/23/18 | | | | (3,351 | ) |
| | COP | | | 319,762,000 | | | USD | | | 100,000 | | | | 11/26/18 | | | | (803 | ) |
| | EUR | | | 1,000,000 | | | AUD | | | 1,618,907 | | | | 11/15/18 | | | | (12,633 | ) |
| | EUR | | | 700,000 | | | GBP | | | 622,531 | | | | 11/15/18 | | | | (2,444 | ) |
| | EUR | | | 8,500,000 | | | JPY | | | 1,099,984,169 | | | | 11/15/18 | | | | (120,153 | ) |
| | EUR | | | 1,375,000 | | | SEK | | | 14,374,971 | | | | 11/15/18 | | | | (13,500 | ) |
| | EUR | | | 2,125,000 | | | USD | | | 2,447,716 | | | | 11/15/18 | | | | (37,986 | ) |
| | EUR | | | 2,999,000 | | | USD | | | 3,472,806 | | | | 12/20/18 | | | | (60,093 | ) |
| | GBP | | | 1,125,000 | | | AUD | | | 2,081,048 | | | | 11/15/18 | | | | (35,030 | ) |
| | GBP | | | 125,000 | | | CHF | | | 163,519 | | | | 11/15/18 | | | | (2,696 | ) |
| | GBP | | | 1,410,631 | | | EUR | | | 1,600,000 | | | | 11/15/18 | | | | (10,141 | ) |
| | GBP | | | 1,000,000 | | | JPY | | | 148,596,465 | | | | 11/15/18 | | | | (39,316 | ) |
| | GBP | | | 9,316,376 | | | USD | | | 12,192,530 | | | | 11/15/18 | | | | (276,581 | ) |
| | GBP | | | 1,975,000 | | | USD | | | 2,602,728 | | | | 12/20/18 | | | | (71,530 | ) |
| | HUF | | | 57,271,120 | | | USD | | | 200,000 | | | | 11/15/18 | | | | (17 | ) |
| | INR | | | 177,462,000 | | | USD | | | 2,400,000 | | | | 11/13/18 | | | | (6,681 | ) |
| | INR | | | 177,102,000 | | | USD | | | 2,400,000 | | | | 11/19/18 | | | | (13,593 | ) |
| | INR | | | 177,066,000 | | | USD | | | 2,400,000 | | | | 11/26/18 | | | | (16,473 | ) |
| | INR | | | 36,758,677 | | | USD | | | 500,000 | | | | 11/29/18 | | | | (5,396 | ) |
| | INR | | | 37,102,696 | | | USD | | | 500,000 | | | | 12/03/18 | | | | (1,054 | ) |
| | JPY | | | 34,145,960 | | | CAD | | | 400,000 | | | | 11/15/18 | | | | (983 | ) |
| | JPY | | | 17,956,496 | | | GBP | | | 125,000 | | | | 11/15/18 | | | | (569 | ) |
| | JPY | | | 278,171,160 | | | NZD | | | 3,800,000 | | | | 11/15/18 | | | | (12,154 | ) |
| | JPY | | | 625,000,000 | | | USD | | | 5,581,138 | | | | 11/15/18 | | | | (36,134 | ) |
| | JPY | | | 2,607,711,893 | | | USD | | | 23,314,809 | | | | 12/20/18 | | | | (99,186 | ) |
| | KRW | | | 1,466,217,735 | | | USD | | | 1,300,000 | | | | 11/13/18 | | | | (15,198 | ) |
| | KRW | | | 887,541,509 | | | USD | | | 788,609 | | | | 11/16/18 | | | | (10,799 | ) |
| | KRW | | | 1,361,220,000 | | | USD | | | 1,200,000 | | | | 11/19/18 | | | | (6,946 | ) |
| | KRW | | | 1,367,292,000 | | | USD | | | 1,200,000 | | | | 11/26/18 | | | | (1,321 | ) |
| | KRW | | | 2,671,371,500 | | | USD | | | 2,363,000 | | | | 12/20/18 | | | | (19,006 | ) |
| | MXN | | | 500,000 | | | USD | | | 24,609 | | | | 11/05/18 | | | | (17 | ) |
| | MXN | | | 46,500,000 | | | USD | | | 2,416,718 | | | | 11/15/18 | | | | (133,456 | ) |
| | MXN | | | 109,243,762 | | | USD | | | 5,701,500 | | | | 12/20/18 | | | | (369,129 | ) |
| | NOK | | | 4,748,890 | | | EUR | | | 500,000 | | | | 11/15/18 | | | | (3,298 | ) |
| | NOK | | | 25,500,000 | | | SEK | | | 27,965,297 | | | | 11/15/18 | | | | (32,749 | ) |
| | NOK | | | 2,512,025 | | | USD | | | 300,000 | | | | 11/15/18 | | | | (1,820 | ) |
| | NZD | | | 3,035,272 | | | AUD | | | 2,800,000 | | | | 11/15/18 | | | | (2,168 | ) |
| | NZD | | | 600,000 | | | JPY | | | 44,478,240 | | | | 11/15/18 | | | | (3,018 | ) |
| | |
| 22 | | The accompanying notes are an integral part of these financial statements. |
GOLDMAN SACHS MULTI-MANAGER ALTERNATIVES FUND
|
| ADDITIONAL INVESTMENT INFORMATION (continued) |
FORWARD FOREIGN CURRENCY EXCHANGE CONTRACTS WITH UNREALIZED LOSS (continued)
| | | | | | | | | | | | | | | | | | | | |
| Counterparty | | Currency
Purchased | | | Currency
Sold | | | Settlement
Date | | | Unrealized
Loss | |
Deutsche Bank AG (London) (continued) | | NZD | | | 1,400,000 | | | USD | | | 919,132 | | | | 11/15/18 | | | $ | (5,415 | ) |
| | PLN | | | 379,492 | | | USD | | | 100,000 | | | | 11/15/18 | | | | (1,071 | ) |
| | RUB | | | 85,252,340 | | | USD | | | 1,300,000 | | | | 11/15/18 | | | | (8,412 | ) |
| | SEK | | | 3,631,282 | | | USD | | | 400,000 | | | | 11/15/18 | | | | (2,709 | ) |
| | TRY | | | 553,054 | | | USD | | | 100,000 | | | | 11/15/18 | | | | (1,987 | ) |
| | TWD | | | 24,611,200 | | | USD | | | 800,000 | | | | 11/15/18 | | | | (4,238 | ) |
| | TWD | | | 24,623,829 | | | USD | | | 800,000 | | | | 11/16/18 | | | | (3,765 | ) |
| | TWD | | | 15,445,000 | | | USD | | | 500,000 | | | | 11/19/18 | | | | (449 | ) |
| | TWD | | | 15,444,500 | | | USD | | | 500,000 | | | | 11/26/18 | | | | (179 | ) |
| | USD | | | 8,090,000 | | | BRL | | | 32,130,241 | | | | 12/20/18 | | | | (504,919 | ) |
| | USD | | | 39,541 | | | CAD | | | 52,000 | | | | 12/20/18 | | | | (2 | ) |
| | USD | | | 920,140 | | | CHF | | | 924,000 | | | | 12/20/18 | | | | (2,181 | ) |
| | USD | | | 2,324,127 | | | EUR | | | 2,047,000 | | | | 12/20/18 | | | | (5,258 | ) |
| | USD | | | 2,400,000 | | | INR | | | 179,322,000 | | | | 11/13/18 | | | | (18,404 | ) |
| | USD | | | 208,422 | | | JPY | | | 23,552,387 | | | | 11/02/18 | | | | (340 | ) |
| | USD | | | 3,096,555 | | | JPY | | | 350,000,000 | | | | 11/15/18 | | | | (8,648 | ) |
| | USD | | | 6,801,885 | | | JPY | | | 767,841,993 | | | | 12/20/18 | | | | (33,968 | ) |
| | USD | | | 1,500,000 | | | KRW | | | 1,713,225,000 | | | | 12/20/18 | | | | (3,269 | ) |
| | USD | | | 2,207,114 | | | NZD | | | 3,400,000 | | | | 11/15/18 | | | | (11,913 | ) |
| | USD | | | 1,300,000 | | | RUB | | | 86,615,920 | | | | 11/15/18 | | | | (12,246 | ) |
| | USD | | | 800,000 | | | TWD | | | 24,848,588 | | | | 11/15/18 | | | | (3,437 | ) |
| | USD | | | 945,000 | | | ZAR | | | 14,087,438 | | | | 12/20/18 | | | | (3,897 | ) |
| | ZAR | | | 1,461,698 | | | USD | | | 100,000 | | | | 11/15/18 | | | | (1,102 | ) |
| | ZAR | | | 241,997,168 | | | USD | | | 16,639,000 | | | | 12/20/18 | | | | (338,642 | ) |
HSBC Bank PLC | | MXN | | | 29,969,250 | | | USD | | | 1,500,000 | | | | 11/01/18 | | | | (24,915 | ) |
JPMorgan Securities, Inc. | | AUD | | | 44,235,922 | | | USD | | | 31,670,083 | | | | 12/19/18 | | | | (327,232 | ) |
| | BRL | | | 6,440,966 | | | USD | | | 1,726,639 | | | | 12/04/18 | | | | (1,583 | ) |
| | CAD | | | 45,370,537 | | | USD | | | 34,867,146 | | | | 12/19/18 | | | | (366,235 | ) |
| | EUR | | | 29,593,503 | | | USD | | | 34,146,475 | | | | 12/19/18 | | | | (474,367 | ) |
| | GBP | | | 35,638,915 | | | USD | | | 46,695,968 | | | | 12/19/18 | | | | (1,023,513 | ) |
| | JPY | | | 3,909,433,457 | | | USD | | | 35,014,577 | | | | 12/19/18 | | | | (214,232 | ) |
| | NOK | | | 109,044,248 | | | USD | | | 13,293,136 | | | | 12/19/18 | | | | (326,942 | ) |
| | NZD | | | 23,206,869 | | | USD | | | 15,278,746 | | | | 12/19/18 | | | | (126,878 | ) |
| | SEK | | | 213,941,987 | | | USD | | | 23,802,301 | | | | 12/19/18 | | | | (308,731 | ) |
| | USD | | | 30,434,731 | | | AUD | | | 43,047,677 | | | | 12/19/18 | | | | (66,199 | ) |
| | USD | | | 459,843 | | | GBP | | | 361,208 | | | | 12/19/18 | | | | (3,057 | ) |
| | USD | | | 4,587,735 | | | JPY | | | 518,891,563 | | | | 12/19/18 | | | | (31,247 | ) |
| | USD | | | 7,788,612 | | | NZD | | | 11,958,991 | | | | 12/19/18 | | | | (19,467 | ) |
| | USD | | | 1,522,322 | | | SEK | | | 13,874,342 | | | | 12/19/18 | | | | (1,259 | ) |
MS & Co. Int. PLC | | AUD | | | 4,700,000 | | | USD | | | 3,414,630 | | | | 12/20/18 | | | | (84,461 | ) |
| | CHF | | | 2,290,248 | | | USD | | | 2,400,000 | | | | 12/20/18 | | | | (113,913 | ) |
| | CNH | | | 22,927,086 | | | USD | | | 3,308,000 | | | | 12/20/18 | | | | (29,439 | ) |
| | CNH | | | 79,917,300 | | | USD | | | 11,600,000 | | | | 06/28/19 | | | | (246,570 | ) |
| | EUR | | | 967,000 | | | USD | | | 1,120,327 | | | | 12/19/18 | | | | (20,054 | ) |
| | GBP | | | 707,000 | | | USD | | | 927,557 | | | | 12/19/18 | | | | (21,513 | ) |
| | JPY | | | 2,093,054,760 | | | USD | | | 18,800,000 | | | | 12/20/18 | | | | (166,205 | ) |
| | MXN | | | 82,001,900 | | | USD | | | 4,300,000 | | | | 12/20/18 | | | | (297,350 | ) |
| | SEK | | | 1,029,000 | | | USD | | | 116,244 | | | | 12/19/18 | | | | (3,247 | ) |
| | USD | | | 15,700,000 | | | BRL | | | 64,795,655 | | | | 12/20/18 | | | | (1,632,999 | ) |
| | USD | | | 73,743 | | | EUR | | | 65,000 | | | | 12/19/18 | | | | (216 | ) |
| | USD | | | 10,345,000 | | | JPY | | | 1,165,014,279 | | | | 12/20/18 | | | | (26,749 | ) |
| | USD | | | 8,500,000 | | | ZAR | | | 129,826,050 | | | | 12/20/18 | | | | (244,776 | ) |
| | | ZAR | | | 27,589,900 | | | USD | | | 1,900,000 | | | | 12/20/18 | | | | (41,610 | ) |
| TOTAL | | | | | | | | | | | | | | | | | | $ | (10,271,283 | ) |
| | |
| The accompanying notes are an integral part of these financial statements. | | 23 |
GOLDMAN SACHS MULTI-MANAGER ALTERNATIVES FUND
Consolidated Schedule of Investments (continued)
October 31, 2018
|
| ADDITIONAL INVESTMENT INFORMATION (continued) |
FUTURES CONTRACTS — At October 31, 2018, the Fund had the following futures contracts:
| | | | | | | | | | | | | | | | |
| Description | | Number of
Contracts | | | Expiration
Date | | | Notional
Amount | | | Unrealized
Appreciation/
(Depreciation) | |
Long position contracts: | | | | | | | | | | | | | | | | |
10 Year German Euro-Bund | | | 13 | | | | 12/06/18 | | | $ | 2,359,741 | | | $ | (4,014 | ) |
10 Year Korea Treasury Bond | | | 36 | | | | 12/18/18 | | | | 3,931,868 | | | | 13,228 | |
10 Year U.K. Long Gilt | | | 42 | | | | 12/27/18 | | | | 6,571,509 | | | | (19,435 | ) |
10 Year U.S. Treasury Notes | | | 415 | | | | 12/19/18 | | | | 49,151,562 | | | | (2,008 | ) |
2 Year German Euro-Schatz | | | 38 | | | | 12/06/18 | | | | 4,819,484 | | | | 1,363 | |
2 Year U.S. Treasury Notes | | | 4 | | | | 12/31/18 | | | | 842,625 | | | | (1,253 | ) |
20 Year U.S. Treasury Long Bond | | | 18 | | | | 12/19/18 | | | | 2,486,250 | | | | (19,801 | ) |
3 Month Euribor Interest Rate | | | 2 | | | | 03/18/19 | | | | 567,996 | | | | 27 | |
3 Month Euribor Interest Rate | | | 10 | | | | 12/16/19 | | | | 2,835,732 | | | | 264 | |
3 Month Euribor Interest Rate | | | 4 | | | | 12/14/20 | | | | 1,130,272 | | | | 1,187 | |
3 Month Euribor Interest Rate | | | 3 | | | | 12/13/21 | | | | 844,646 | | | | 423 | |
3 Month Sterling Interest Rate | | | 284 | | | | 09/18/19 | | | | 44,886,048 | | | | (22,381 | ) |
3 Year Korea Treasury Bond | | | 24 | | | | 12/18/18 | | | | 2,289,746 | | | | 3,448 | |
5 Year German Euro-Bobl | | | 64 | | | | 12/06/18 | | | | 9,528,036 | | | | 3,170 | |
5 Year U.S. Treasury Notes | | | 16 | | | | 12/31/18 | | | | 1,798,125 | | | | (4,262 | ) |
ASX 90 Day Bank Accepted Bills | | | 2 | | | | 03/07/19 | | | | 1,409,627 | | | | 32 | |
Australian 10 Year Government Bonds | | | 474 | | | | 12/17/18 | | | | 43,439,067 | | | | 234,935 | |
Australian 3 Year Government Bonds | | | 368 | | | | 12/17/18 | | | | 29,040,196 | | | | (2,070 | ) |
Brent Crude | | | 3 | | | | 11/30/18 | | | | 225,120 | | | | (1,823 | ) |
Brent Crude Oil Last Day | | | 2 | | | | 11/30/18 | | | | 150,080 | | | | (2,412 | ) |
Brent Crude | | | 1 | | | | 12/28/18 | | | | 75,060 | | | | (3,071 | ) |
Brent Crude | | | 2 | | | | 01/31/19 | | | | 150,180 | | | | 278 | |
Brent Crude | | | 1 | | | | 10/31/19 | | | | 73,800 | | | | (1,041 | ) |
CAC40 Index | | | 5 | | | | 11/16/18 | | | | 288,260 | | | | 999 | |
Canada 10 Year Government Bonds | | | 13 | | | | 12/18/18 | | | | 1,304,987 | | | | (5,353 | ) |
Canadian Canola | | | 1 | | | | 01/14/19 | | | | 7,383 | | | | (175 | ) |
Canadian Dollar | | | 7 | | | | 12/18/18 | | | | 531,965 | | | | (1,499 | ) |
CBOE Volatility Index | | | 29 | | | | 11/21/18 | | | | 587,975 | | | | 4,227 | |
CBOE Volatility Index | | | 28 | | | | 12/19/18 | | | | 553,700 | | | | (10,546 | ) |
CBOE Volatility Index | | | 1 | | | | 03/19/19 | | | | 19,675 | | | | 1,573 | |
CBOE Volatility Index | | | 2 | | | | 04/17/19 | | | | 38,950 | | | | 2,147 | |
Coffee | | | 2 | | | | 12/18/18 | | | | 84,525 | | | | (4,073 | ) |
Copper | | | 1 | | | | 11/02/18 | | | | 150,912 | | | | (2,303 | ) |
Copper | | | 1 | | | | 11/06/18 | | | | 150,787 | | | | (2,403 | ) |
Copper | | | 5 | | | | 11/15/18 | | | | 752,062 | | | | 1,122 | |
Copper | | | 2 | | | | 11/16/18 | | | | 300,700 | | | | 6,219 | |
Copper | | | 2 | | | | 11/20/18 | | | | 300,450 | | | | 394 | |
Copper | | | 1 | | | | 12/05/18 | | | | 150,062 | | | | 610 | |
Copper | | | 1 | | | | 12/13/18 | | | | 150,071 | | | | (1,145 | ) |
Copper | | | 1 | | | | 12/19/18 | | | | 150,025 | | | | (2,428 | ) |
Copper | | | 1 | | | | 12/21/18 | | | | 149,975 | | | | (5,728 | ) |
Copper | | | 1 | | | | 12/27/18 | | | | 149,875 | | | | (7,353 | ) |
Copper | | | 2 | | | | 01/03/19 | | | | 299,960 | | | | (13,771 | ) |
Copper | | | 2 | | | | 01/08/19 | | | | 300,060 | | | | (11,998 | ) |
Copper | | | 2 | | | | 01/09/19 | | | | 300,080 | | | | (11,998 | ) |
Copper | | | 1 | | | | 01/10/19 | | | | 150,050 | | | | (6,703 | ) |
Copper | | | 2 | | | | 01/18/19 | | | | 299,650 | | | | (11,380 | ) |
Copper | | | 1 | | | | 01/22/19 | | | | 149,822 | | | | (6,568 | ) |
Copper | | | 1 | | | | 01/23/19 | | | | 149,819 | | | | (1,019 | ) |
Copper | | | 1 | | | | 01/24/19 | | | | 149,816 | | | | (5,687 | ) |
| | |
| 24 | | The accompanying notes are an integral part of these financial statements. |
GOLDMAN SACHS MULTI-MANAGER ALTERNATIVES FUND
|
| ADDITIONAL INVESTMENT INFORMATION (continued) |
FUTURES CONTRACTS (continued)
| | | | | | | | | | | | | | | | |
| Description | | Number of
Contracts | | | Expiration
Date | | | Notional
Amount | | | Unrealized
Appreciation/
(Depreciation) | |
Long position contracts: (continued) | | | | | | | | | | | | | | | | |
Copper | | | 1 | | | | 01/30/19 | | | $ | 149,803 | | | $ | (1,010 | ) |
Copper | | | 1 | | | | 01/31/19 | | | | 149,800 | | | | (140 | ) |
Crude Oil | | | 4 | | | | 11/19/18 | | | | 261,240 | | | | (10,756 | ) |
Crude Oil | | | 2 | | | | 12/19/18 | | | | 130,880 | | | | (4,743 | ) |
Crude Oil | | | 2 | | | | 03/29/19 | | | | 46,289 | | | | 884 | |
DAX Index | | | 27 | | | | 12/21/18 | | | | 8,759,705 | | | | (397,463 | ) |
DJIA E-Mini Index | | | 10 | | | | 12/21/18 | | | | 1,253,850 | | | | (6,838 | ) |
E-mini Energy Select Sector | | | 3 | | | | 12/21/18 | | | | 202,590 | | | | (1,058 | ) |
E-mini Industrial Select Sector | | | 1 | | | | 12/21/18 | | | | 69,920 | | | | (5,131 | ) |
E-mini Russell 2000 Index | | | 4 | | | | 12/21/18 | | | | 302,380 | | | | (31,823 | ) |
E-mini S&P 500 | | | 10 | | | | 03/18/19 | | | | 2,500,621 | | | | 237 | |
E-mini S&P MidCap 400 | | | 1 | | | | 12/21/18 | | | | 182,480 | | | | (23,191 | ) |
E-mini Utilities Select Sector | | | 1 | | | | 12/21/18 | | | | 54,060 | | | | (331 | ) |
Euro Buxl 30 Year Bonds | | | 8 | | | | 12/06/18 | | | | 1,602,927 | | | | 2,466 | |
Euro Stoxx 50 Index | | | 8 | | | | 12/21/18 | | | | 289,415 | | | | 1,956 | |
Euro Stoxx 50 Index Dividend | | | 186 | | | | 12/21/18 | | | | 2,639,732 | | | | (20,000 | ) |
Euro Stoxx 50 Index Dividend | | | 56 | | | | 12/16/22 | | | | 697,078 | | | | (70,962 | ) |
Eurodollars | | | 5 | | | | 12/16/19 | | | | 1,209,937 | | | | (1,095 | ) |
French 10 Year Government Bonds | | | 36 | | | | 12/06/18 | | | | 6,196,232 | | | | (3,445 | ) |
FTSE 100 Index | | | 96 | | | | 12/21/18 | | | | 8,725,711 | | | | (140,397 | ) |
FTSE China A50 Index | | | 2 | | | | 11/29/18 | | | | 22,345 | | | | 103 | |
FTSE/MIB Index | | | 1 | | | | 12/21/18 | | | | 107,517 | | | | (483 | ) |
Gasoline RBOB | | | 16 | | | | 11/30/18 | | | | 1,176,941 | | | | (91,482 | ) |
Gasoline RBOB | | | 1 | | | | 12/31/18 | | | | 73,597 | | | | (2,051 | ) |
Hscei | | | 3 | | | | 11/29/18 | | | | 193,823 | | | | (136 | ) |
Italian 10 Year Government Bonds | | | 1 | | | | 12/06/18 | | | | 137,776 | | | | (1,631 | ) |
Japan 10 Year Government Bonds | | | 4 | | | | 12/13/18 | | | | 5,339,832 | | | | 13,382 | |
Kospi 200 Index | | | 5 | | | | 12/13/18 | | | | 289,698 | | | | 666 | |
Lead | | | 1 | | | | 11/02/18 | | | | 47,538 | | | | (5,302 | ) |
Lead | | | 1 | | | | 11/28/18 | | | | 47,902 | | | | (4,514 | ) |
Lead | | | 1 | | | | 12/19/18 | | | | 48,075 | | | | (2,159 | ) |
Lead | | | 2 | | | | 12/20/18 | | | | 96,050 | | | | (4,143 | ) |
Lead | | | 2 | | | | 12/21/18 | | | | 96,057 | | | | (4,230 | ) |
Lead | | | 1 | | | | 12/24/18 | | | | 48,039 | | | | (3,039 | ) |
Lead | | | 1 | | | | 01/02/19 | | | | 48,069 | | | | (2,259 | ) |
Lead | | | 2 | | | | 01/03/19 | | | | 96,145 | | | | (5,692 | ) |
Lead | | | 1 | | | | 01/04/19 | | | | 48,076 | | | | (2,477 | ) |
Lead | | | 1 | | | | 01/08/19 | | | | 48,090 | | | | (3,250 | ) |
Lead | | | 1 | | | | 01/16/19 | | | | 48,075 | | | | (4,378 | ) |
Lead | | | 1 | | | | 01/18/19 | | | | 48,075 | | | | (2,071 | ) |
Live Cattle | | | 1 | | | | 12/31/18 | | | | 46,780 | | | | (392 | ) |
Live Cattle | | | 1 | | | | 04/30/19 | | | | 49,340 | | | | 218 | |
Low Sulphur Gas Oil | | | 1 | | | | 12/12/18 | | | | 69,900 | | | | 1,799 | |
Low Sulphur Gas Oil | | | 1 | | | | 01/10/19 | | | | 69,400 | | | | 299 | |
Mexican Peso | | | 3 | | | | 12/17/18 | | | | 73,380 | | | | (769 | ) |
MSCI Emerging Markets Index | | | 1 | | | | 12/21/18 | | | | 47,835 | | | | 1,784 | |
Natural Gas | | | 14 | | | | 11/28/18 | | | | 456,540 | | | | (1,394 | ) |
Natural Gas | | | 5 | | | | 12/27/18 | | | | 165,100 | | | | (2,939 | ) |
Natural Gas | | | 2 | | | | 01/29/19 | | | | 64,200 | | | | (1,153 | ) |
Natural Gas | | | 7 | | | | 09/26/19 | | | | 190,960 | | | | 3,308 | |
| | |
| The accompanying notes are an integral part of these financial statements. | | 25 |
GOLDMAN SACHS MULTI-MANAGER ALTERNATIVES FUND
Consolidated Schedule of Investments (continued)
October 31, 2018
|
| ADDITIONAL INVESTMENT INFORMATION (continued) |
FUTURES CONTRACTS (continued)
| | | | | | | | | | | | | | | | |
| Description | | Number of
Contracts | | | Expiration
Date | | | Notional
Amount | | | Unrealized
Appreciation/
(Depreciation) | |
Long position contracts: (continued) | | | | | | | | | | | | | | | | |
New Zealand Dollar | | | 3 | | | | 12/17/18 | | | $ | 195,690 | | | $ | (1,364 | ) |
Nickel | | | 1 | | | | 11/01/18 | | | | 70,140 | | | | (13,143 | ) |
Nickel | | | 4 | | | | 11/02/18 | | | | 274,212 | | | | (42,509 | ) |
Nickel | | | 1 | | | | 11/06/18 | | | | 68,572 | | | | (12,705 | ) |
Nickel | | | 1 | | | | 11/07/18 | | | | 68,577 | | | | (14,736 | ) |
Nickel | | | 3 | | | | 11/13/18 | | | | 205,815 | | | | (38,144 | ) |
Nickel | | | 1 | | | | 11/15/18 | | | | 68,615 | | | | (10,108 | ) |
Nickel | | | 1 | | | | 11/16/18 | | | | 68,619 | | | | (11,904 | ) |
Nickel | | | 1 | | | | 12/06/18 | | | | 68,727 | | | | (5,417 | ) |
Nickel | | | 1 | | | | 12/24/18 | | | | 68,825 | | | | (9,598 | ) |
Nickel | | | 1 | | | | 01/02/19 | | | | 68,872 | | | | (6,853 | ) |
Nickel | | | 1 | | | | 01/09/19 | | | | 68,909 | | | | (8,704 | ) |
Nickel | | | 1 | | | | 01/10/19 | | | | 68,914 | | | | (8,518 | ) |
Nickel | | | 1 | | | | 01/11/19 | | | | 68,920 | | | | (6,771 | ) |
Nickel | | | 1 | | | | 01/18/19 | | | | 68,953 | | | | (5,275 | ) |
Nikkei 225 Index | | | 7 | | | | 12/13/18 | | | | 980,978 | | | | (33,007 | ) |
Nikkei 225 Mini | | | 18 | | | | 12/13/18 | | | | 349,041 | | | | (10,333 | ) |
NY Harbor ULSD | | | 3 | | | | 11/30/18 | | | | 283,676 | | | | (484 | ) |
NY Harbor ULSD | | | 1 | | | | 12/31/18 | | | | 94,437 | | | | (1,816 | ) |
NY Harbor ULSD | | | 1 | | | | 01/31/19 | | | | 94,198 | | | | (1,934 | ) |
NYMEX Light Sweet E-mini Crude Oil | | | 2 | | | | 11/16/18 | | | | 65,310 | | | | (3,080 | ) |
Nymex Palladium | | | 1 | | | | 12/27/18 | | | | 106,850 | | | | (5,692 | ) |
OMXS 30 Index | | | 3 | | | | 11/16/18 | | | | 50,223 | | | | (387 | ) |
Primary Aluminum | | | 1 | | | | 11/02/18 | | | | 48,369 | | | | (3,350 | ) |
Primary Aluminum | | | 1 | | | | 11/06/18 | | | | 48,433 | | | | (2,670 | ) |
Primary Aluminum | | | 2 | | | | 11/09/18 | | | | 96,963 | | | | (9,705 | ) |
Primary Aluminum | | | 1 | | | | 11/13/18 | | | | 48,546 | | | | (3,657 | ) |
Primary Aluminum | | | 1 | | | | 11/15/18 | | | | 48,578 | | | | (3,341 | ) |
Primary Aluminum | | | 1 | | | | 11/23/18 | | | | 48,663 | | | | (3,721 | ) |
Primary Aluminum | | | 2 | | | | 11/28/18 | | | | 97,440 | | | | (9,078 | ) |
Primary Aluminum | | | 1 | | | | 11/29/18 | | | | 48,732 | | | | (5,146 | ) |
Primary Aluminum | | | 5 | | | | 11/30/18 | | | | 243,716 | | | | (20,828 | ) |
Primary Aluminum | | | 1 | | | | 12/04/18 | | | | 48,790 | | | | (2,742 | ) |
Primary Aluminum | | | 1 | | | | 12/05/18 | | | | 48,801 | | | | (3,077 | ) |
Primary Aluminum | | | 2 | | | | 12/07/18 | | | | 97,648 | | | | (5,257 | ) |
Primary Aluminum | | | 1 | | | | 12/18/18 | | | | 48,951 | | | | (3,613 | ) |
Primary Aluminum | | | 1 | | | | 12/24/18 | | | | 48,862 | | | | (2,815 | ) |
Primary Aluminum | | | 2 | | | | 12/27/18 | | | | 97,778 | | | | (7,343 | ) |
Primary Aluminum | | | 2 | | | | 12/28/18 | | | | 97,796 | | | | (6,655 | ) |
Primary Aluminum | | | 2 | | | | 01/02/19 | | | | 97,875 | | | | (7,056 | ) |
Primary Aluminum | | | 9 | | | | 01/03/19 | | | | 440,494 | | | | (30,804 | ) |
Primary Aluminum | | | 5 | | | | 01/04/19 | | | | 244,750 | | | | (16,750 | ) |
Primary Aluminum | | | 7 | | | | 01/08/19 | | | | 343,023 | | | | (19,422 | ) |
Primary Aluminum | | | 1 | | | | 01/11/19 | | | | 48,900 | | | | (1,631 | ) |
Primary Aluminum | | | 1 | | | | 01/17/19 | | | | 48,713 | | | | (1,632 | ) |
Primary Aluminum | | | 1 | | | | 01/18/19 | | | | 48,713 | | | | (1,628 | ) |
Primary Aluminum | | | 1 | | | | 01/22/19 | | | | 48,751 | | | | (1,839 | ) |
Robusta Coffee | | | 1 | | | | 01/25/19 | | | | 16,750 | | | | 449 | |
S&P 500 E-Mini Index | | | 49 | | | | 12/21/18 | | | | 6,642,195 | | | | 28,445 | |
S&P Toronto Stock Exchange 60 Index | | | 1 | | | | 12/20/18 | | | | 135,850 | | | | (2,113 | ) |
| | |
| 26 | | The accompanying notes are an integral part of these financial statements. |
GOLDMAN SACHS MULTI-MANAGER ALTERNATIVES FUND
|
| ADDITIONAL INVESTMENT INFORMATION (continued) |
FUTURES CONTRACTS (continued)
| | | | | | | | | | | | | | | | |
| Description | | Number of
Contracts | | | Expiration
Date | | | Notional
Amount | | | Unrealized
Appreciation/
(Depreciation) | |
Long position contracts: (continued) | | | | | | | | | | | | | | | | |
Sugar No. 11 | | | 19 | | | | 02/28/19 | | | $ | 280,683 | | | $ | (5,384 | ) |
Sugar No. 11 | | | 2 | | | | 04/30/19 | | | | 29,792 | | | | (1,012 | ) |
Swiss Franc | | | 2 | | | | 12/17/18 | | | | 248,950 | | | | (753 | ) |
The EURO STOXX Banks Index | | | 1 | | | | 12/10/18 | | | | 11,242 | | | | (327 | ) |
The EURO STOXX Banks Index | | | 2 | | | | 03/11/19 | | | | 22,880 | | | | (385 | ) |
The EURO STOXX Banks Index | | | 1 | | | | 05/10/19 | | | | 11,511 | | | | (214 | ) |
The Tokyo Price Index | | | 23 | | | | 12/13/18 | | | | 3,344,973 | | | | (151,205 | ) |
Tocom Platinum Index | | | 1 | | | | 08/27/19 | | | | 13,396 | | | | 66 | |
U.S. Dollar Index | | | 2 | | | | 11/19/18 | | | | 19,994 | | | | 16 | |
U.S. Dollar Index | | | 4 | | | | 12/17/18 | | | | 387,604 | | | | 8,159 | |
UK Natural Gas | | | 5 | | | | 11/29/18 | | | | 135,079 | | | | (3,351 | ) |
Ultra 10 Year U.S. Treasury Notes | | | 6 | | | | 12/19/18 | | | | 750,656 | | | | (958 | ) |
VSTOXX Index | | | 3 | | | | 11/21/18 | | | | 6,575 | | | | (171 | ) |
VSTOXX Index | | | 3 | | | | 12/19/18 | | | | 6,167 | | | | 163 | |
White Sugar | | | 1 | | | | 11/15/18 | | | | 17,785 | | | | 544 | |
White Sugar | | | 2 | | | | 02/13/19 | | | | 35,590 | | | | 1,779 | |
Yen Denominated Nikkei 225 Index | | | 241 | | | | 12/13/18 | | | | 23,248,859 | | | | (1,649,305 | ) |
Zinc | | | 1 | | | | 11/01/18 | | | | 65,062 | | | | 1,060 | |
Zinc | | | 1 | | | | 11/06/18 | | | | 63,719 | | | | (584 | ) |
Zinc | | | 1 | | | | 11/15/18 | | | | 63,719 | | | | 3,000 | |
Zinc | | | 1 | | | | 11/16/18 | | | | 63,694 | | | | 3,028 | |
Zinc | | | 1 | | | | 11/20/18 | | | | 63,677 | | | | (2,530 | ) |
Zinc | | | 1 | | | | 11/21/18 | | | | 63,669 | | | | 2,916 | |
Zinc | | | 1 | | | | 12/07/18 | | | | 63,152 | | | | (2,622 | ) |
Zinc | | | 2 | | | | 12/24/18 | | | | 125,237 | | | | (4,086 | ) |
Zinc | | | 2 | | | | 12/28/18 | | | | 125,129 | | | | (5,239 | ) |
Zinc | | | 1 | | | | 01/02/19 | | | | 62,556 | | | | (3,984 | ) |
Zinc | | | 1 | | | | 01/09/19 | | | | 62,485 | | | | (2,699 | ) |
Zinc | | | 1 | | | | 01/11/19 | | | | 62,456 | | | | (3,447 | ) |
| Total | | | | | | | | | | | | | | $ | (2,974,266 | ) |
Short position contracts: | | | | | | | | | | | | | | | | |
10 Year German Euro-Bund | | | (32 | ) | | | 12/06/18 | | | | (5,808,593 | ) | | | 11,380 | |
10 Year U.K. Long Gilt | | | (2 | ) | | | 12/27/18 | | | | (312,929 | ) | | | 434 | |
10 Year U.S. Treasury Notes | | | (26 | ) | | | 12/19/18 | | | | (3,079,375 | ) | | | 28,775 | |
2 Year German Euro-Schatz | | | (8 | ) | | | 12/06/18 | | | | (1,014,628 | ) | | | (143 | ) |
2 Year U.S. Treasury Notes | | | (96 | ) | | | 12/31/18 | | | | (20,223,000 | ) | | | 28,853 | |
20 Year U.S. Treasury Long Bond | | | (20 | ) | | | 12/19/18 | | | | (2,762,500 | ) | | | 40,727 | |
3 Month Euribor Interest Rate | | | (84 | ) | | | 12/17/18 | | | | (18,600,080 | ) | | | (7,507 | ) |
3 Month Euribor Interest Rate | | | (396 | ) | | | 09/16/19 | | | | (112,384,682 | ) | | | (34,034 | ) |
3 Month Euroyen | | | (23 | ) | | | 03/18/19 | | | | (5,091,860 | ) | | | (73 | ) |
3 Month Sterling Interest Rate | | | (10 | ) | | | 06/19/19 | | | | (1,581,613 | ) | | | (69 | ) |
5 Year U.S. Treasury Notes | | | (64 | ) | | | 12/31/18 | | | | (7,192,500 | ) | | | 32,941 | |
Amsterdam Exchanges Index | | | (3 | ) | | | 11/16/18 | | | | (351,212 | ) | | | 4,071 | |
Australian Dollar | | | (2 | ) | | | 12/17/18 | | | | (141,540 | ) | | | 287 | |
Bank Accept Index | | | (323 | ) | | | 03/18/19 | | | | (59,775,058 | ) | | | 16,324 | |
Bank Accept Index | | | (1 | ) | | | 06/17/19 | | | | (184,806 | ) | | | 502 | |
Bank Accept Index | | | (1 | ) | | | 12/16/19 | | | | (184,502 | ) | | | 227 | |
BIST National-30 Index | | | (108 | ) | | | 12/31/18 | | | | (225,773 | ) | | | (2,358 | ) |
Brent Crude | | | (1 | ) | | | 12/28/18 | | | | (75,060 | ) | | | 1,529 | |
| | |
| The accompanying notes are an integral part of these financial statements. | | 27 |
GOLDMAN SACHS MULTI-MANAGER ALTERNATIVES FUND
Consolidated Schedule of Investments (continued)
October 31, 2018
|
| ADDITIONAL INVESTMENT INFORMATION (continued) |
FUTURES CONTRACTS (continued)
| | | | | | | | | | | | | | | | |
| Description | | Number of
Contracts | | | Expiration
Date | | | Notional
Amount | | | Unrealized
Appreciation/
(Depreciation) | |
Short position contracts: (continued) | | | | | | | | | | | | | | | | |
British Pound | | | (1 | ) | | | 12/17/18 | | | $ | (79,975 | ) | | $ | 1,299 | |
Canada 10 Year Government Bonds | | | (293 | ) | | | 12/18/18 | | | | (29,412,397 | ) | | | 41,898 | |
Canadian Canola | | | (1 | ) | | | 01/14/19 | | | | (7,383 | ) | | | 312 | |
CBOE Volatility Index | | | (1 | ) | | | 11/21/18 | | | | (20,275 | ) | | | 423 | |
Chicago SRW Wheat | | | (23 | ) | | | 12/14/18 | | | | (575,575 | ) | | | 1,365 | |
Chicago SRW Wheat | | | (3 | ) | | | 03/14/19 | | | | (77,400 | ) | | | 2,806 | |
Chicago SRW Wheat | | | (1 | ) | | | 05/14/19 | | | | (26,375 | ) | | | (15 | ) |
Cocoa | | | (3 | ) | | | 12/13/18 | | | | (67,020 | ) | | | (4,317 | ) |
Coffee | | | (1 | ) | | | 03/19/19 | | | | (43,669 | ) | | | (2,027 | ) |
Copper | | | (1 | ) | | | 11/02/18 | | | | (150,913 | ) | | | 4,230 | |
Copper | | | (1 | ) | | | 11/06/18 | | | | (150,788 | ) | | | (2,398 | ) |
Copper | | | (5 | ) | | | 11/15/18 | | | | (752,063 | ) | | | (17,277 | ) |
Copper | | | (2 | ) | | | 11/16/18 | | | | (300,700 | ) | | | (3,815 | ) |
Copper | | | (2 | ) | | | 11/20/18 | | | | (300,450 | ) | | | 4,947 | |
Copper | | | (1 | ) | | | 12/05/18 | | | | (150,063 | ) | | | (3,715 | ) |
Copper | | | (1 | ) | | | 12/13/18 | | | | (150,071 | ) | | | (554 | ) |
Copper | | | (1 | ) | | | 12/21/18 | | | | (149,975 | ) | | | 8,035 | |
Copper | | | (1 | ) | | | 12/27/18 | | | | (66,475 | ) | | | 423 | |
Copper | | | (1 | ) | | | 12/27/18 | | | | (149,875 | ) | | | 6,026 | |
Copper | | | (2 | ) | | | 01/03/19 | | | | (299,960 | ) | | | 11,978 | |
Copper | | | (2 | ) | | | 01/08/19 | | | | (300,060 | ) | | | 7,897 | |
Copper | | | (2 | ) | | | 01/09/19 | | | | (300,080 | ) | | | 12,364 | |
Copper | | | (1 | ) | | | 01/10/19 | | | | (150,050 | ) | | | 5,988 | |
Copper | | | (2 | ) | | | 01/18/19 | | | | (299,650 | ) | | | 4,702 | |
Copper | | | (1 | ) | | | 01/22/19 | | | | (149,822 | ) | | | 5,657 | |
Copper | | | (1 | ) | | | 01/23/19 | | | | (149,819 | ) | | | 4,241 | |
Copper | | | (1 | ) | | | 01/24/19 | | | | (149,816 | ) | | | 991 | |
Copper | | | (3 | ) | | | 01/30/19 | | | | (449,410 | ) | | | 3,794 | |
Corn | | | (21 | ) | | | 12/14/18 | | | | (381,413 | ) | | | 2,957 | |
Corn | | | (4 | ) | | | 03/14/19 | | | | (75,150 | ) | | | 367 | |
Cotton No. 2 | | | (2 | ) | | | 12/06/18 | | | | (76,860 | ) | | | 5,545 | |
Crude Palm Oil | | | (6 | ) | | | 02/15/19 | | | | (79,149 | ) | | | 2,915 | |
Crude soybean oil | | | (8 | ) | | | 12/14/18 | | | | (134,496 | ) | | | 10,105 | |
Crude soybean oil | | | (1 | ) | | | 01/14/19 | | | | (16,944 | ) | | | (38 | ) |
DAX Index | | | (1 | ) | | | 12/21/18 | | | | (324,434 | ) | | | 2,986 | |
DJIA E-Mini Index | | | (5 | ) | | | 12/21/18 | | | | (626,925 | ) | | | (9,036 | ) |
E-mini Financial Select Sector | | | (1 | ) | | | 12/21/18 | | | | (80,812 | ) | | | (2,176 | ) |
E-mini Russell 2000 Index | | | (6 | ) | | | 12/21/18 | | | | (453,570 | ) | | | 25,451 | |
E-mini Utilities Select Sector | | | (5 | ) | | | 12/21/18 | | | | (270,300 | ) | | | (1,556 | ) |
Euro Buxl 30 Year Bonds | | | (1 | ) | | | 12/06/18 | | | | (200,366 | ) | | | (613 | ) |
Euro FX | | | (1 | ) | | | 12/17/18 | | | | (141,944 | ) | | | (8 | ) |
Euro Stoxx 50 Index | | | (47 | ) | | | 12/21/18 | | | | (1,700,312 | ) | | | 31,169 | |
Euro Stoxx 50 Index Dividend | | | (56 | ) | | | 12/18/20 | | | | (763,678 | ) | | | 45,158 | |
Eurodollars | | | (15 | ) | | | 03/18/19 | | | | (3,641,438 | ) | | | 4,580 | |
Eurodollars | | | (2,187 | ) | | | 09/16/19 | | | | (529,609,388 | ) | | | 283,801 | |
Eurodollars | | | (28 | ) | | | 12/16/19 | | | | (6,775,650 | ) | | | 2,409 | |
Eurodollars | | | (9 | ) | | | 12/14/20 | | | | (2,177,888 | ) | | | 3,512 | |
Eurodollars | | | (3 | ) | | | 12/13/21 | | | | (726,225 | ) | | | 1,796 | |
Eurodollars | | | (2 | ) | | | 12/19/22 | | | | (484,025 | ) | | | 385 | |
FTSE 100 Index | | | (5 | ) | | | 12/21/18 | | | | (454,464 | ) | | | (1,549 | ) |
| | |
| 28 | | The accompanying notes are an integral part of these financial statements. |
GOLDMAN SACHS MULTI-MANAGER ALTERNATIVES FUND
|
| ADDITIONAL INVESTMENT INFORMATION (continued) |
FUTURES CONTRACTS (continued)
| | | | | | | | | | | | | | | | |
| Description | | Number of
Contracts | | | Expiration
Date | | | Notional
Amount | | | Unrealized
Appreciation/
(Depreciation) | |
Short position contracts: (continued) | | | | | | | | | | | | | | | | |
FTSE China A50 Index | | | (6 | ) | | | 11/29/18 | | | $ | (67,035 | ) | | $ | (1,251 | ) |
FTSE/JSE Top 40 Index | | | (5 | ) | | | 12/20/18 | | | | (157,238 | ) | | | 7,905 | |
FTSE/MIB Index | | | (9 | ) | | | 12/21/18 | | | | (967,652 | ) | | | 24,309 | |
Gasoline RBOB | | | (1 | ) | | | 11/30/18 | | | | (73,559 | ) | | | 3,762 | |
Gasoline RBOB | | | (1 | ) | | | 01/31/19 | | | | (74,033 | ) | | | 6,412 | |
Gold 100 Oz | | | (12 | ) | | | 12/27/18 | | | | (1,458,000 | ) | | | 15,671 | |
Hang Seng Index | | | (7 | ) | | | 11/29/18 | | | | (1,111,822 | ) | | | (3,502 | ) |
Hscei | | | (3 | ) | | | 11/29/18 | | | | (193,823 | ) | | | (1,610 | ) |
IBEX 35 Index | | | (2 | ) | | | 11/16/18 | | | | (201,304 | ) | | | (579 | ) |
Italian 10 Year Government Bonds | | | (8 | ) | | | 12/06/18 | | | | (1,102,205 | ) | | | 6,316 | |
Japan 10 Year Government Bonds | | | (6 | ) | | | 12/13/18 | | | | (8,009,749 | ) | | | (2,047 | ) |
Kospi 200 Index | | | (8 | ) | | | 12/13/18 | | | | (463,516 | ) | | | 21,768 | |
Lead | | | (1 | ) | | | 11/02/18 | | | | (47,537 | ) | | | 4,960 | |
Lead | | | (1 | ) | | | 11/28/18 | | | | (47,902 | ) | | | 2,162 | |
Lead | | | (1 | ) | | | 12/19/18 | | | | (48,075 | ) | | | 3,510 | |
Lead | | | (2 | ) | | | 12/20/18 | | | | (96,050 | ) | | | 4,395 | |
Lead | | | (1 | ) | | | 12/21/18 | | | | (48,028 | ) | | | 2,856 | |
Lead | | | (1 | ) | | | 12/24/18 | | | | (48,039 | ) | | | 2,178 | |
Lead | | | (1 | ) | | | 01/02/19 | | | | (48,069 | ) | | | 2,065 | |
Lead | | | (2 | ) | | | 01/03/19 | | | | (96,145 | ) | | | 5,593 | |
Lead | | | (1 | ) | | | 01/04/19 | | | | (48,076 | ) | | | 2,066 | |
Lead | | | (1 | ) | | | 01/08/19 | | | | (48,090 | ) | | | 1,445 | |
Lead | | | (1 | ) | | | 01/18/19 | | | | (48,075 | ) | | | 1,722 | |
Lead | | | (1 | ) | | | 01/29/19 | | | | (48,094 | ) | | | 1,403 | |
Lead | | | (1 | ) | | | 01/31/19 | | | | (48,100 | ) | | | (515 | ) |
Lean Hogs | | | (1 | ) | | | 12/14/18 | | | | (23,380 | ) | | | (622 | ) |
Lean Hogs | | | (1 | ) | | | 02/14/19 | | | | (26,130 | ) | | | (632 | ) |
Live Cattle | | | (4 | ) | | | 12/31/18 | | | | (187,120 | ) | | | 691 | |
Low Sulphur Gas Oil | | | (10 | ) | | | 12/12/18 | | | | (699,000 | ) | | | (1,284 | ) |
Mini FTSE/MIB Index | | | (3 | ) | | | 12/21/18 | | | | (64,510 | ) | | | 3,374 | |
Mini H-shares Index | | | (4 | ) | | | 11/29/18 | | | | (51,686 | ) | | | (421 | ) |
Mini MSCI EAFE Index | | | (6 | ) | | | 12/21/18 | | | | (543,750 | ) | | | 4,532 | |
Mini Tokyo Price Index | | | (2 | ) | | | 12/13/18 | | | | (29,087 | ) | | | (530 | ) |
Mini-Hang Seng Index | | | (6 | ) | | | 11/29/18 | | | | (190,598 | ) | | | (416 | ) |
MSCI Emerging Markets Index | | | (6 | ) | | | 12/21/18 | | | | (287,010 | ) | | | 13,092 | |
MSCI Singapore Index | | | (16 | ) | | | 11/29/18 | | | | (396,203 | ) | | | (4,061 | ) |
MSCI Taiwan Index | | | (1 | ) | | | 11/29/18 | | | | (36,490 | ) | | | (1,441 | ) |
Nasdaq 100 E-Mini Index | | | (4 | ) | | | 12/21/18 | | | | (558,040 | ) | | | (10,553 | ) |
Natural Gas | | | (4 | ) | | | 12/27/18 | | | | (132,080 | ) | | | (457 | ) |
Nickel | | | (1 | ) | | | 11/01/18 | | | | (70,140 | ) | | | 3,765 | |
Nickel | | | (4 | ) | | | 11/02/18 | | | | (274,212 | ) | | | 56,254 | |
Nickel | | | (1 | ) | | | 11/06/18 | | | | (68,572 | ) | | | 13,535 | |
Nickel | | | (1 | ) | | | 11/07/18 | | | | (68,577 | ) | | | 12,695 | |
Nickel | | | (3 | ) | | | 11/13/18 | | | | (205,815 | ) | | | 37,356 | |
Nickel | | | (1 | ) | | | 11/15/18 | | | | (68,615 | ) | | | 12,707 | |
Nickel | | | (1 | ) | | | 11/16/18 | | | | (68,619 | ) | | | 12,702 | |
Nickel | | | (1 | ) | | | 12/05/18 | | | | (68,721 | ) | | | 6,216 | |
Nickel | | | (1 | ) | | | 12/06/18 | | | | (68,727 | ) | | | 6,481 | |
Nickel | | | (1 | ) | | | 12/24/18 | | | | (68,825 | ) | | | 6,826 | |
Nickel | | | (1 | ) | | | 01/02/19 | | | | (68,872 | ) | | | 5,705 | |
| | |
| The accompanying notes are an integral part of these financial statements. | | 29 |
GOLDMAN SACHS MULTI-MANAGER ALTERNATIVES FUND
Consolidated Schedule of Investments (continued)
October 31, 2018
|
| ADDITIONAL INVESTMENT INFORMATION (continued) |
FUTURES CONTRACTS (continued)
| | | | | | | | | | | | | | | | |
| Description | | Number of
Contracts | | | Expiration
Date | | | Notional
Amount | | | Unrealized
Appreciation/
(Depreciation) | |
Short position contracts: (continued) | | | | | | | | | | | | | | | | |
Nickel | | | (1 | ) | | | 01/09/19 | | | $ | (68,909 | ) | | $ | 6,748 | |
Nickel | | | (1 | ) | | | 01/10/19 | | | | (68,914 | ) | | | 5,181 | |
Nickel | | | (2 | ) | | | 01/11/19 | | | | (137,840 | ) | | | 13,475 | |
Nickel | | | (1 | ) | | | 01/18/19 | | | | (68,953 | ) | | | 4,484 | |
Nikkei 225 Index | | | (2 | ) | | | 12/13/18 | | | | (387,823 | ) | | | (2,307 | ) |
Nikkei 225 Index | | | (208 | ) | | | 12/13/18 | | | | (22,666,800 | ) | | | 1,537,929 | |
Nikkei 225 Mini | | | (34 | ) | | | 12/13/18 | | | | (659,299 | ) | | | (3,420 | ) |
NY Harbor ULSD | | | (9 | ) | | | 11/30/18 | | | | (851,029 | ) | | | 15,323 | |
Nymex Palladium | | | (1 | ) | | | 12/27/18 | | | | (106,850 | ) | | | (7,712 | ) |
OMXS 30 Index | | | (192 | ) | | | 11/16/18 | | | | (3,214,285 | ) | | | (41,566 | ) |
Primary Aluminum | | | (1 | ) | | | 11/02/18 | | | | (48,369 | ) | | | 2,316 | |
Primary Aluminum | | | (1 | ) | | | 11/06/18 | | | | (48,433 | ) | | | 3,456 | |
Primary Aluminum | | | (2 | ) | | | 11/09/18 | | | | (96,963 | ) | | | 8,087 | |
Primary Aluminum | | | (1 | ) | | | 11/13/18 | | | | (48,546 | ) | | | 3,858 | |
Primary Aluminum | | | (1 | ) | | | 11/15/18 | | | | (48,578 | ) | | | 2,131 | |
Primary Aluminum | | | (1 | ) | | | 11/23/18 | | | | (48,662 | ) | | | 3,435 | |
Primary Aluminum | | | (2 | ) | | | 11/28/18 | | | | (97,440 | ) | | | 7,342 | |
Primary Aluminum | | | (2 | ) | | | 11/29/18 | | | | (97,463 | ) | | | 7,332 | |
Primary Aluminum | | | (5 | ) | | | 11/30/18 | | | | (243,716 | ) | | | 22,620 | |
Primary Aluminum | | | (1 | ) | | | 12/04/18 | | | | (48,789 | ) | | | 3,045 | |
Primary Aluminum | | | (1 | ) | | | 12/05/18 | | | | (48,801 | ) | | | 2,720 | |
Primary Aluminum | | | (2 | ) | | | 12/07/18 | | | | (97,648 | ) | | | 5,915 | |
Primary Aluminum | | | (1 | ) | | | 12/18/18 | | | | (48,951 | ) | | | 2,296 | |
Primary Aluminum | | | (1 | ) | | | 12/24/18 | | | | (48,862 | ) | | | 1,936 | |
Primary Aluminum | | | (2 | ) | | | 12/27/18 | | | | (97,778 | ) | | | 6,126 | |
Primary Aluminum | | | (2 | ) | | | 12/28/18 | | | | (97,796 | ) | | | 5,751 | |
Primary Aluminum | | | (2 | ) | | | 01/02/19 | | | | (97,875 | ) | | | 4,658 | |
Primary Aluminum | | | (9 | ) | | | 01/03/19 | | | | (440,494 | ) | | | 41,101 | |
Primary Aluminum | | | (5 | ) | | | 01/04/19 | | | | (244,750 | ) | | | 27,552 | |
Primary Aluminum | | | (7 | ) | | | 01/08/19 | | | | (343,023 | ) | | | 15,579 | |
Primary Aluminum | | | (2 | ) | | | 01/11/19 | | | | (97,800 | ) | | | 3,694 | |
Primary Aluminum | | | (1 | ) | | | 01/17/19 | | | | (48,712 | ) | | | 1,760 | |
Primary Aluminum | | | (1 | ) | | | 01/29/19 | | | | (48,818 | ) | | | 991 | |
Primary Aluminum | | | (1 | ) | | | 01/31/19 | | | | (48,837 | ) | | | 135 | |
S&P 500 E-Mini Index | | | (141 | ) | | | 12/21/18 | | | | (19,113,255 | ) | | | 1,109,033 | |
S&P Toronto Stock Exchange 60 Index | | | (8 | ) | | | 12/20/18 | | | | (1,086,802 | ) | | | (11,194 | ) |
SET50 Index | | | (2 | ) | | | 12/27/18 | | | | (13,262 | ) | | | (129 | ) |
Short Euro-BTP | | | (10 | ) | | | 12/06/18 | | | | (1,237,874 | ) | | | (14,117 | ) |
Silver | | | (13 | ) | | | 12/27/18 | | | | (928,330 | ) | | | 21,158 | |
Silver | | | (1 | ) | | | 03/27/19 | | | | (71,995 | ) | | | 703 | |
Soybean | | | (10 | ) | | | 01/14/19 | | | | (425,875 | ) | | | 4,342 | |
Soybean | | | (1 | ) | | | 03/14/19 | | | | (43,250 | ) | | | 423 | |
Soybean | | | (3 | ) | | | 11/14/19 | | | | (135,562 | ) | | | 1,369 | |
Soybean Meal | | | (7 | ) | | | 12/14/18 | | | | (214,480 | ) | | | 575 | |
Soybean Meal | | | (1 | ) | | | 01/14/19 | | | | (30,820 | ) | | | (72 | ) |
SPI 200 Index | | | (25 | ) | | | 12/20/18 | | | | (2,566,159 | ) | | | (18,220 | ) |
STOXX 600 Banks Index | | | (10 | ) | | | 12/21/18 | | | | (204,217 | ) | | | (4,037 | ) |
STOXX 600 Banks Index | | | (4 | ) | | | 12/21/18 | | | | (32,620 | ) | | | 1,057 | |
The EURO STOXX Banks Index | | | (2 | ) | | | 12/10/18 | | | | (22,483 | ) | | | 875 | |
The Tokyo Price Index | | | (4 | ) | | | 12/13/18 | | | | (581,734 | ) | | | (2,706 | ) |
| | |
| 30 | | The accompanying notes are an integral part of these financial statements. |
GOLDMAN SACHS MULTI-MANAGER ALTERNATIVES FUND
|
| ADDITIONAL INVESTMENT INFORMATION (continued) |
FUTURES CONTRACTS (continued)
| | | | | | | | | | | | | | | | |
| Description | | Number of
Contracts | | | Expiration
Date | | | Notional
Amount | | | Unrealized
Appreciation/
(Depreciation) | |
Short position contracts: (continued) | | | | | | | | | | | | | | | | |
TOCOM Gold | | | (2 | ) | | | 08/27/19 | | | $ | (78,344 | ) | | $ | (551 | ) |
TOCOM Gold Mini | | | (3 | ) | | | 08/26/19 | | | | (11,752 | ) | | | (10 | ) |
TOCOM Kerosene | | | (1 | ) | | | 03/25/19 | | | | (30,168 | ) | | | 801 | |
TOCOM Rubber | | | (1 | ) | | | 04/22/19 | | | | (7,223 | ) | | | (63 | ) |
Ultra 10 Year U.S. Treasury Notes | | | (145 | ) | | | 12/19/18 | | | | (18,140,859 | ) | | | 25,413 | |
Ultra Long U.S. Treasury Bonds | | | (5 | ) | | | 12/19/18 | | | | (746,094 | ) | | | 32,433 | |
Wheat | | | (5 | ) | | | 12/14/18 | | | | (123,312 | ) | | | 6,089 | |
Wheat | | | (1 | ) | | | 03/14/19 | | | | (25,900 | ) | | | 1,248 | |
WIG20 Index | | | (4 | ) | | | 12/21/18 | | | | (44,637 | ) | | | (1 | ) |
Zinc | | | (1 | ) | | | 11/01/18 | | | | (65,062 | ) | | | 271 | |
Zinc | | | (1 | ) | | | 11/06/18 | | | | (63,719 | ) | | | (3,026 | ) |
Zinc | | | (1 | ) | | | 11/15/18 | | | | (63,719 | ) | | | (4,197 | ) |
Zinc | | | (1 | ) | | | 11/16/18 | | | | (63,694 | ) | | | (4,159 | ) |
Zinc | | | (1 | ) | | | 11/20/18 | | | | (63,677 | ) | | | (3,025 | ) |
Zinc | | | (1 | ) | | | 11/21/18 | | | | (63,669 | ) | | | (3,070 | ) |
Zinc | | | (1 | ) | | | 12/04/18 | | | | (63,258 | ) | | | (3,692 | ) |
Zinc | | | (1 | ) | | | 12/07/18 | | | | (63,152 | ) | | | (2,939 | ) |
Zinc | | | (1 | ) | | | 12/24/18 | | | | (62,619 | ) | | | 916 | |
Zinc | | | (1 | ) | | | 12/27/18 | | | | (62,569 | ) | | | 1,266 | |
Zinc | | | (2 | ) | | | 12/28/18 | | | | (125,129 | ) | | | 5,367 | |
Zinc | | | (1 | ) | | | 01/02/19 | | | | (62,556 | ) | | | 3,053 | |
Zinc | | | (1 | ) | | | 01/09/19 | | | | (62,485 | ) | | | 4,512 | |
Zinc | | | (2 | ) | | | 01/11/19 | | | | (124,912 | ) | | | 6,257 | |
| Total | | | $ | 3,775,716 | |
| TOTAL FUTURES CONTRACTS | | | $ | 801,450 | |
SWAP CONTRACTS — At October 31, 2018, the Fund had the following swap contracts:
CENTRALLY CLEARED INTEREST RATE SWAP CONTRACTS
| | | | | | | | | | | | | | | | | | | | | | | | | | |
| Payments Made by the Fund | | Payments
Received
by Fund | | | Termination
Date | | | | | Notional
Amount
(000s) | | | Market
Value | | | Upfront
Premium
(Received)
Paid | | | Unrealized
Appreciation/
(Depreciation) | |
2.04%(a) | | | 3M NZDOR | | | 10/19/20 | | | NZD | | | | 57,300 | | | $ | (24,516 | ) | | $ | (1,496 | ) | | $ | (23,020 | ) |
1M BID Avg(b) | | | 8.345% | | | 01/04/21 | | | BRL | | | | 20,149 | | | | 24,678 | | | | — | | | | 24,678 | |
3M SHIBOR(c) | | | 3.130 | | | 08/08/23 | | | CNY | | | | 52,300 | | | | 28,647 | | | | (1,973 | ) | | | 30,620 | |
Mexico Interbank TIIE 28 Days(d) | | | 7.890 | | | 09/13/23 | | | MXN | | | | 11,385 | | | | (21,100 | ) | | | — | | | | (21,100 | ) |
Mexico Interbank TIIE 28 Days(d) | | | 7.910 | | | 09/13/23 | | | | | | | 10,108 | | | | (18,328 | ) | | | — | | | | (18,328 | ) |
Mexico Interbank TIIE 28 Days(d) | | | 7.945 | | | 09/13/23 | | | | | | | 15,365 | | | | (26,781 | ) | | | — | | | | (26,781 | ) |
| | | Mexico Interbank | | | | | | | | | | | | | | | | | | | | | | | |
7.890(d) | | | TIIE 28 Days | | | 09/13/23 | | | | | | | 4,841 | | | | 10,048 | | | | 4,641 | | | | 5,407 | |
Mexico Interbank TIIE 28 Days(d) | | | 8.067 | | | 12/13/25 | | | | | | | 20,038 | (f) | | | (31,313 | ) | | | — | | | | (31,313 | ) |
6M BUBOR(e) | | | 3.420 | | | 12/19/28 | | | HUF | | | | 178,232 | (f) | | | (6,961 | ) | | | — | | | | (6,961 | ) |
6M BUBOR(e) | | | 3.430 | | | 12/19/28 | | | | | | | 235,521 | (f) | | | (9,908 | ) | | | — | | | | (9,908 | ) |
1.318(a) | | | 6M GBP | | | 08/30/67 | | | GBP | | | | 1,681 | | | | 250,555 | | | | — | | | | 250,555 | |
| TOTAL | | | | | | | | | | | | | | | | $ | 175,021 | | | $ | 1,172 | | | $ | 173,849 | |
| | |
| The accompanying notes are an integral part of these financial statements. | | 31 |
GOLDMAN SACHS MULTI-MANAGER ALTERNATIVES FUND
Consolidated Schedule of Investments (continued)
October 31, 2018
|
| ADDITIONAL INVESTMENT INFORMATION (continued) |
| | (a) | | Payments made semi-annually. |
| | (b) | | Payments made at maturity. |
| | (c) | | Payments made quarterly. |
| | (d) | | Payments made monthly. |
| | (e) | | Payments made annually. |
| | (f) | | Represents forward starting interest rate swaps whose effective dates of commencement of accruals and cash flows occur subsequent to October 31, 2018. |
CENTRALLY CLEARED CREDIT DEFAULT SWAP CONTRACTS
| | | | | | | | | | | | | | | | | | | | | | | | | | | | |
| Reference Obligation/Index | | Financing
Rate Paid by
the Fund (%)(a) | | | Credit
Spread at
October 31,
2018(b) | | | Termination
Date | | | Notional
Amount
(000s) | | | Value | | | Upfront
Premiums
(Received)
Paid | | | Unrealized
Appreciation/
(Depreciation) | |
Protection Purchased: | | | | | | | | | | | | | | | | | | | | | | | | | | | | |
Republic of Korea, 7.125%, 04/16/19 | | | (1.000)% | | | | 0.325% | | | | 12/20/22 | | | $ | 1,405 | | | $ | (38,611 | ) | | $ | 152 | | | $ | (38,763 | ) |
Republic of South Africa, 5.500%, 03/09/20 | | | (1.000) | | | | 2.004 | | | | 06/20/22 | | | | 2,020 | | | | 65,529 | | | | 218 | | | | 65,311 | |
Republic of South Africa, 5.500%, 03/09/20 | | | (1.000) | | | | 2.092 | | | | 12/20/22 | | | | 238 | | | | 9,475 | | | | 345 | | | | 9,130 | |
Republic of Turkey, 11.875%, 01/15/30 | | | (1.000) | | | | 3.630 | | | | 06/20/22 | | | | 2,652 | | | | 221,676 | | | | 1,356 | | | | 220,320 | |
Republic of Turkey, 11.875%, 01/15/30 | | | (1.000) | | | | 3.781 | | | | 06/20/23 | | | | 280 | | | | 30,455 | | | | 39,744 | | | | (9,289 | ) |
United Mexican States, 4.150%, 03/28/27 | | | (1.000) | | | | 1.323 | | | | 06/20/23 | | | | 1,227 | | | | 15,330 | | | | 2,076 | | | | 13,254 | |
| TOTAL | | | | | | | | | | | | | | | | | | $ | 303,854 | | | $ | 43,891 | | | $ | 259,963 | |
| | (a) | | Payments made quarterly. |
| | (b) | | Credit spread on the referenced obligation, together with the term of the swap contract, are indicators of payment/performance risk. The likelihood of a credit event occurring which would require a fund or its counterparty to make a payment or otherwise be required to perform under the swap contract is generally greater as the credit spread and the term of the swap contract increase. |
OVER THE COUNTER TOTAL RETURN SWAP CONTRACTS#
| | | | | | | | | | | | | | | | | | | | | | |
| Reference Obligation/Index(a) | | Financing Rate
Paid (Received)
by the Fund | | Counterparty | | Termination
Date | | Notional
Amount
(000s) | | | Value | | | Upfront
Premiums
(Received)
Paid | | | Unrealized
Appreciation/
(Depreciation) | |
Novus Barclays Public Ownership HF Conviction | | 1M USD LIBOR | | Barclays Bank PLC | | 05/11/19 | | $ | 36 | | | $ | (137,769 | ) | | $ | — | | | $ | (137,769 | ) |
Edenred SA | | 1M EUR LIBOR | | Deutsche Bank AG (London) | | 05/10/20 | | | 4 | | | | 8,040 | | | | — | | | | 8,040 | |
Guidewire Software, Inc. | | 1M USD LIBOR | | Deutsche Bank AG (London) | | 05/10/20 | | | — | * | | | (190 | ) | | | — | | | | (190 | ) |
iShares PHLX Semiconductor ETF | | 1M USD LIBOR | | Deutsche Bank AG (London) | | 05/10/20 | | | 1,156 | | | | 36,617 | | | | — | | | | 36,617 | |
iShares S&P NA Technology-Multimedia Networking ETF | | 1M USD LIBOR | | Deutsche Bank AG (London) | | 05/10/20 | | | 348 | | | | (3,424 | ) | | | — | | | | (3,424 | ) |
iShares S&P NA Technology-Software ETF | | 1M USD LIBOR | | Deutsche Bank AG (London) | | 05/10/20 | | | 345 | | | | (2,698 | ) | | | — | | | | (2,698 | ) |
iShares U.S. Technology ETF | | 1M USD LIBOR | | Deutsche Bank AG (London) | | 05/10/20 | | | 327 | | | | 1,814 | | | | — | | | | 1,814 | |
2U, Inc. | | 1.890% | | JPMorgan Securities, Inc. | | 09/08/20 - 10/15/20 | | | 4 | | | | (15 | ) | | | — | | | | (15 | ) |
3-D Systems Corp. | | 0.890 | | JPMorgan Securities, Inc. | | 10/01/20 | | | 7 | | | | 33,170 | | | | — | | | | 33,170 | |
AAK AB | | 1.690 | | JPMorgan Securities, Inc. | | 10/16/20 - 10/26/20 | | | 18 | | | | 2,670 | | | | — | | | | 2,670 | |
AAON Co., Inc. | | 1.890 | | JPMorgan Securities, Inc. | | 08/24/20 - 09/18/20 | | | 5 | | | | (13,552 | ) | | | — | | | | (13,552 | ) |
ABIOMED, Inc. | | 2.680 | | JPMorgan Securities, Inc. | | 07/09/20 - 07/31/20 | | | — | * | | | (11,151 | ) | | | — | | | | (11,151 | ) |
Accenture PLC | | 1M USD LIBOR | | JPMorgan Securities, Inc. | | 11/23/18 | | | 960 | | | | 54,212 | | | | — | | | | 54,212 | |
Adient PLC | | 1.890 | | JPMorgan Securities, Inc. | | 01/31/20 - 10/15/20 | | | 8 | | | | 8,391 | | | | — | | | | 8,391 | |
Advanced Disposal Services, Inc. | | 2.680 | | JPMorgan Securities, Inc. | | 10/15/20 - 10/26/20 | | | 4 | | | | 4,981 | | | | — | | | | 4,981 | |
Advanced Micro Devices, Inc. | | 1M USD LIBOR | | JPMorgan Securities, Inc. | | 05/05/20 | | | 2 | | | | (15,788 | ) | | | — | | | | (15,788 | ) |
| | |
| 32 | | The accompanying notes are an integral part of these financial statements. |
GOLDMAN SACHS MULTI-MANAGER ALTERNATIVES FUND
|
| ADDITIONAL INVESTMENT INFORMATION (continued) |
OVER THE COUNTER TOTAL RETURN SWAP CONTRACTS# (continued)
| | | | | | | | | | | | | | | | | | | | | | |
| Reference Obligation/Index(a) | | Financing Rate
Paid (Received)
by the Fund | | Counterparty | | Termination
Date | | Notional
Amount
(000s) | | | Value | | | Upfront
Premiums
(Received)
Paid | | | Unrealized
Appreciation/
(Depreciation) | |
Aerie Pharmaceuticals, Inc. | | 1.890% | | JPMorgan Securities, Inc. | | 04/23/20 - 10/15/20 | | $ | 5 | | | $ | (3,056 | ) | | $ | — | | | $ | (3,056 | ) |
Aerovironment Co., Inc. | | 2.680 | | JPMorgan Securities, Inc. | | 09/18/20 - 10/15/20 | | | 2 | | | | (2,811 | ) | | | — | | | | (2,811 | ) |
Afterpay Touch Group Ltd. | | (3.560) | | JPMorgan Securities, Inc. | | 10/26/20 | | | 16 | | | | 1,352 | | | | — | | | | 1,352 | |
Aggreko PLC | | 2.655 | | JPMorgan Securities, Inc. | | 09/21/20 - 10/26/20 | | | 27 | | | | 5,106 | | | | — | | | | 5,106 | |
Air France – KLM | | 1.840 | | JPMorgan Securities, Inc. | | 06/26/20 - 08/03/20 | | | 15 | | | | (6,683 | ) | | | — | | | | (6,683 | ) |
Aker ASA Class A | | 2.680 | | JPMorgan Securities, Inc. | | 06/26/20 - 10/26/20 | | | 4 | | | | (27,291 | ) | | | — | | | | (27,291 | ) |
Aker BP ASA | | 2.680 | | JPMorgan Securities, Inc. | | 02/10/20 - 03/30/20 | | | 9 | | | | (39,805 | ) | | | — | | | | (39,805 | ) |
Albemarle Corp | | 1.890 | | JPMorgan Securities, Inc. | | 10/26/20 | | | 3 | | | | (11,472 | ) | | | — | | | | (11,472 | ) |
Alcoa Corp. | | 1.890 | | JPMorgan Securities, Inc. | | 10/26/20 | | | 6 | | | | 11,836 | | | | — | | | | 11,836 | |
Alliance Data Systems Corp. | | 2.680 | | JPMorgan Securities, Inc. | | 10/01/20 - 10/15/20 | | | 1 | | | | (7,592 | ) | | | — | | | | (7,592 | ) |
Almirall SA | | 2.680 | | JPMorgan Securities, Inc. | | 10/02/20 | | | 12 | | | | (646 | ) | | | — | | | | (646 | ) |
Alta Mesa Resources, Inc. Class A | | 1.890 | | JPMorgan Securities, Inc. | | 03/16/20 | | | 44 | | | | 27,072 | | | | — | | | | 27,072 | |
Altium Ltd. | | 2.680 | | JPMorgan Securities, Inc. | | 06/26/20 - 07/20/20 | | | 12 | | | | (2,145 | ) | | | — | | | | (2,145 | ) |
Altran Technologies SA | | 1.440 | | JPMorgan Securities, Inc. | | 02/03/20 - 10/16/20 | | | 30 | | | | (50,172 | ) | | | — | | | | (50,172 | ) |
Alumina Ltd. | | 2.680 | | JPMorgan Securities, Inc. | | 06/26/20 - 10/16/20 | | | 152 | | | | (8,349 | ) | | | — | | | | (8,349 | ) |
Ambu A/S | | 1.690 | | JPMorgan Securities, Inc. | | 02/24/20 - 10/16/20 | | | 7 | | | | (1,964 | ) | | | — | | | | (1,964 | ) |
Amcor Ltd. | | 1.690 | | JPMorgan Securities, Inc. | | 08/13/20 - 10/16/20 | | | 8 | | | | 656 | | | | — | | | | 656 | |
Amedisys, Inc. | | 2.680 | | JPMorgan Securities, Inc. | | 04/23/20 - 10/26/20 | | | 3 | | | | (8,011 | ) | | | — | | | | (8,011 | ) |
Amer Sports Corp. Class A | | 2.680 | | JPMorgan Securities, Inc. | | 06/12/20 | | | 7 | | | | (14,867 | ) | | | — | | | | (14,867 | ) |
American Eagle Outfitters, Inc. | | 2.680 | | JPMorgan Securities, Inc. | | 07/20/20 - 10/15/20 | | | 12 | | | | 26,436 | | | | — | | | | 26,436 | |
American Equity Life Holding Co. | | 2.680 | | JPMorgan Securities, Inc. | | 10/01/20 - 10/26/20 | | | 9 | | | | (14,733 | ) | | | — | | | | (14,733 | ) |
AMP Ltd. | | 1.690 | | JPMorgan Securities, Inc. | | 05/04/20 - 10/16/20 | | | 134 | | | | 54,467 | | | | — | | | | 54,467 | |
ANDRITZ AG | | 2.680 | | JPMorgan Securities, Inc. | | 08/24/20 - 10/16/20 | | | 5 | | | | (11,424 | ) | | | — | | | | (11,424 | ) |
ANGI Homeservices, Inc. Class A | | 0.640 | | JPMorgan Securities, Inc. | | 08/10/20 - 10/15/20 | | | 10 | | | | (2,608 | ) | | | — | | | | (2,608 | ) |
Anheuser Busch Inbev SA | | 1.740 | | JPMorgan Securities, Inc. | | 09/21/20 - 10/26/20 | | | 3 | | | | 38,614 | | | | — | | | | 38,614 | |
Antero Midstream GP LP | | 0.740 | | JPMorgan Securities, Inc. | | 08/10/20 - 10/01/20 | | | 17 | | | | 32,748 | | | | — | | | | 32,748 | |
Ap Moeller – Maersk A/S Class B | | 1.690 | | JPMorgan Securities, Inc. | | 07/20/20 - 10/26/20 | | | — | * | | | 1,384 | | | | — | | | | 1,384 | |
Appfolio, Inc. Class A | | 2.680 | | JPMorgan Securities, Inc. | | 06/11/20 | | | 3 | | | | (19,173 | ) | | | — | | | | (19,173 | ) |
Appian Corp. Class A | | (0.410) | | JPMorgan Securities, Inc. | | 06/11/20 - 08/24/20 | | | 1 | | | | (2,744 | ) | | | — | | | | (2,744 | ) |
Aqua America, Inc. | | 1.890 | | JPMorgan Securities, Inc. | | 01/31/20 | | | 9 | | | | 36,884 | | | | — | | | | 36,884 | |
Arch Capital Group Ltd. | | 1.890 | | JPMorgan Securities, Inc. | | 07/31/20 - 10/26/20 | | | 11 | | | | (10,919 | ) | | | — | | | | (10,919 | ) |
Ares Managment LP | | 1.890 | | JPMorgan Securities, Inc. | | 10/26/20 | | | 14 | | | | 1,781 | | | | — | | | | 1,781 | |
Aristocrat Leisure Ltd. | | 2.680 | | JPMorgan Securities, Inc. | | 07/10/20 - 10/02/20 | | | 14 | | | | (7,498 | ) | | | — | | | | (7,498 | ) |
Aryzta AG | | 1.840 | | JPMorgan Securities, Inc. | | 04/29/19 - 02/03/20 | | | 16 | | | | 13,550 | | | | — | | | | 13,550 | |
Asgn, Inc. | | 2.680 | | JPMorgan Securities, Inc. | | 10/15/20 | | | 4 | | | | 10,155 | | | | — | | | | 10,155 | |
ASM International NV | | 1.840 | | JPMorgan Securities, Inc. | | 05/29/20 - 10/16/20 | | | 6 | | | | 19,240 | | | | — | | | | 19,240 | |
ASM Pacific Technology Ltd. | | 1.690 | | JPMorgan Securities, Inc. | | 10/27/20 | | | 8 | | | | 6,127 | | | | — | | | | 6,127 | |
ASOS PLC | | 1.890 | | JPMorgan Securities, Inc. | | 07/10/20 - 10/16/20 | | | 3 | | | | (17,774 | ) | | | — | | | | (17,774 | ) |
Aspen Technology, Inc. | | 2.680 | | JPMorgan Securities, Inc. | | 10/01/20 - 10/15/20 | | | 3 | | | | (44,738 | ) | | | — | | | | (44,738 | ) |
ASR Nederland NV | | 2.680 | | JPMorgan Securities, Inc. | | 06/12/20 | | | 3 | | | | 931 | | | | — | | | | 931 | |
AT Home Group Co., Inc. | | 1.890 | | JPMorgan Securities, Inc. | | 09/18/20 | | | 5 | | | | (613 | ) | | | — | | | | (613 | ) |
Atento SA | | 1M USD LIBOR | | JPMorgan Securities, Inc. | | 05/05/20 | | | 15 | | | | (22,837 | ) | | | — | | | | (22,837 | ) |
Atos SE | | 2.680 | | JPMorgan Securities, Inc. | | 06/22/20 - 10/26/20 | | | 3 | | | | (63,782 | ) | | | — | | | | (63,782 | ) |
Autogrill SpA | | 2.680 | | JPMorgan Securities, Inc. | | 06/17/19 - 11/12/19 | | | 27 | | | | 1,292 | | | | — | | | | 1,292 | |
| | |
| The accompanying notes are an integral part of these financial statements. | | 33 |
GOLDMAN SACHS MULTI-MANAGER ALTERNATIVES FUND
Consolidated Schedule of Investments (continued)
October 31, 2018
|
| ADDITIONAL INVESTMENT INFORMATION (continued) |
OVER THE COUNTER TOTAL RETURN SWAP CONTRACTS# (continued)
| | | | | | | | | | | | | | | | | | | | | | |
| Reference Obligation/Index(a) | | Financing Rate
Paid (Received)
by the Fund | | Counterparty | | Termination
Date | | Notional
Amount
(000s) | | | Value | | | Upfront
Premiums
(Received)
Paid | | | Unrealized
Appreciation/
(Depreciation) | |
Autoliv Co., Inc. | | 1.490% | | JPMorgan Securities, Inc. | | 09/18/20 - 10/15/20 | | $ | 4 | | | $ | (10,112 | ) | | $ | — | | | $ | (10,112 | ) |
Avalara Co., Inc. | | (0.310) | | JPMorgan Securities, Inc. | | 09/18/20 - 10/15/20 | | | 5 | | | | (4,362 | ) | | | — | | | | (4,362 | ) |
AXA Equitable Holdings Co., Inc. | | 2.680 | | JPMorgan Securities, Inc. | | 10/01/20 - 10/26/20 | | | 14 | | | | (3,673 | ) | | | — | | | | (3,673 | ) |
Axogen, Inc. | | 1.890 | | JPMorgan Securities, Inc. | | 06/25/20 | | | 3 | | | | (15,619 | ) | | | — | | | | (15,619 | ) |
AXOS Financial Co., Inc | | 1.890 | | JPMorgan Securities, Inc. | | 09/08/20 - 10/15/20 | | | 8 | | | | 30,704 | | | | — | | | | 30,704 | |
Bakkafrost PF Navne Aktier | | 2.680 | | JPMorgan Securities, Inc. | | 08/24/20 - 10/16/20 | | | 5 | | | | (20,630 | ) | | | — | | | | (20,630 | ) |
Banca Generali SpA | | 2.680 | | JPMorgan Securities, Inc. | | 10/02/20 - 10/26/20 | | | 13 | | | | (42,647 | ) | | | — | | | | (42,647 | ) |
Banca Mediolanum SpA | | 2.680 | | JPMorgan Securities, Inc. | | 10/16/20 - 10/26/20 | | | 49 | | | | (21,888 | ) | | | — | | | | (21,888 | ) |
Banco BPM SpA | | 1.390 | | JPMorgan Securities, Inc. | | 06/26/20 - 10/16/20 | | | 110 | | | | 28,188 | | | | — | | | | 28,188 | |
Bank Leumi Le-Israel BM | | 3.280 | | JPMorgan Securities, Inc. | | 12/17/18 - 07/27/20 | | | 54 | | | | (8,194 | ) | | | — | | | | (8,194 | ) |
Bank Ozk Co. | | 1.890 | | JPMorgan Securities, Inc. | | 08/24/20 - 10/15/20 | | | 8 | | | | 70,701 | | | | — | | | | 70,701 | |
Bankia SA | | 1.690 | | JPMorgan Securities, Inc. | | 06/26/20 - 10/26/20 | | | 89 | | | | 45,358 | | | | — | | | | 45,358 | |
Bausch Health Co., Inc. | | 2.730 | | JPMorgan Securities, Inc. | | 10/15/20 | | | 9 | | | | (10,017 | ) | | | — | | | | (10,017 | ) |
BBA Aviation PLC | | 1.890 | | JPMorgan Securities, Inc. | | 08/03/20 - 10/26/20 | | | 88 | | | | 29,897 | | | | — | | | | 29,897 | |
BCA Marketplace | | 2.655 | | JPMorgan Securities, Inc. | | 06/22/20 | | | 107 | | | | 913 | | | | — | | | | 913 | |
Beach Petroleum Ltd. | | 2.680 | | JPMorgan Securities, Inc. | | 06/22/20 | | | 215 | | | | (12,541 | ) | | | — | | | | (12,541 | ) |
Best Buy Co., Inc. | | 2.680 | | JPMorgan Securities, Inc. | | 10/01/20 - 10/15/20 | | | 4 | | | | (2,785 | ) | | | — | | | | (2,785 | ) |
BGC Partners, Inc. Class A | | 1.890 | | JPMorgan Securities, Inc. | | 05/29/20 - 10/01/20 | | | 25 | | | | 4,702 | | | | — | | | | 4,702 | |
BIO Rad Laboratories, Inc. Class A | | 2.680 | | JPMorgan Securities, Inc. | | 02/10/20 | | | — | * | | | (399 | ) | | | — | | | | (399 | ) |
BJ’S Wholesale Club Holdings Co., Inc. | | 2.680 | | JPMorgan Securities, Inc. | | 10/01/20 - 10/26/20 | | | 10 | | | | (17,439 | ) | | | — | | | | (17,439 | ) |
BlackBerry Ltd. | | 2.680 | | JPMorgan Securities, Inc. | | 10/15/20 | | | 2 | | | | (438 | ) | | | — | | | | (438 | ) |
Block H&R, Inc. | | 2.680 | | JPMorgan Securities, Inc. | | 10/15/20 | | | 11 | | | | 5,856 | | | | — | | | | 5,856 | |
Bloom Energy Corp. Class A | | (6.510) | | JPMorgan Securities, Inc. | | 10/26/20 | | | 6 | | | | (1,824 | ) | | | — | | | | (1,824 | ) |
Blue Prism Group PLC | | (6.010) | | JPMorgan Securities, Inc. | | 09/08/20 | | | 6 | | | | 8,256 | | | | — | | | | 8,256 | |
BORR Drilling Ltd. | | 0.340 | | JPMorgan Securities, Inc. | | 10/02/20 | | | 60 | | | | 34,585 | | | | — | | | | 34,585 | |
Bpost SA | | 1.740 | | JPMorgan Securities, Inc. | | 08/24/20 - 10/16/20 | | | 19 | | | | (9,365 | ) | | | — | | | | (9,365 | ) |
Brady Corp. Class A | | 2.680 | | JPMorgan Securities, Inc. | | 10/01/20 - 10/15/20 | | | 7 | | | | 1,935 | | | | — | | | | 1,935 | |
Brembo SpA | | 1.840 | | JPMorgan Securities, Inc. | | 04/14/20 - 10/16/20 | | | 25 | | | | 10,066 | | | | — | | | | 10,066 | |
Broadcom, Inc. | | 1M USD LIBOR | | JPMorgan Securities, Inc. | | 05/05/20 | | | 1 | | | | (10,669 | ) | | | — | | | | (10,669 | ) |
Broadridge Financial Solutions, Inc. | | 2.680 | | JPMorgan Securities, Inc. | | 10/15/20 | | | 2 | | | | 2,596 | | | | — | | | | 2,596 | |
BRP, Inc./CA Sub Voting | | 2.730 | | JPMorgan Securities, Inc. | | 10/17/19 - 10/30/19 | | | 6 | | | | (11,550 | ) | | | — | | | | (11,550 | ) |
Bruker Corp. | | 2.680 | | JPMorgan Securities, Inc. | | 10/01/20 | | | 9 | | | | 4,588 | | | | — | | | | 4,588 | |
BT Group PLC | | 2.655 | | JPMorgan Securities, Inc. | | 10/02/20 | | | 96 | | | | (5,888 | ) | | | — | | | | (5,888 | ) |
BTG PLC | | 2.655 | | JPMorgan Securities, Inc. | | 05/10/19 - 08/17/20 | | | 43 | | | | (6,945 | ) | | | — | | | | (6,945 | ) |
Burberry Group PLC | | 2.655 | | JPMorgan Securities, Inc. | | 04/14/20 - 10/26/20 | | | 13 | | | | 1,836 | | | | — | | | | 1,836 | |
Burlington Stores, Inc. | | 2.680 | | JPMorgan Securities, Inc. | | 09/18/20 - 10/15/20 | | | 2 | | | | 40,123 | | | | — | | | | 40,123 | |
Buzzi Unicem SpA | | 1.840 | | JPMorgan Securities, Inc. | | 06/26/20 - 10/26/20 | | | 16 | | | | 11,360 | | | | — | | | | 11,360 | |
CACI International, Inc. Class A | | 2.680 | | JPMorgan Securities, Inc. | | 12/05/18 - 12/24/18 | | | 2 | | | | 4,356 | | | | — | | | | 4,356 | |
Cactus, Inc. Class A | | 2.680 | | JPMorgan Securities, Inc. | | 07/20/20 - 09/08/20 | | | 6 | | | | (21,790 | ) | | | — | | | | (21,790 | ) |
Cadence Design Systems, Inc. | | 2.680 | | JPMorgan Securities, Inc. | | 10/01/20 | | | 6 | | | | 34,208 | | | | — | | | | 34,208 | |
CAE Co., Inc. | | 1.890 | | JPMorgan Securities, Inc. | | 10/01/20 | | | 10 | | | | 8,690 | | | | — | | | | 8,690 | |
California Resources Corp. | | 2.680 | | JPMorgan Securities, Inc. | | 10/01/20 | | | 3 | | | | (23,494 | ) | | | — | | | | (23,494 | ) |
Caltex Australia Ltd. | | 2.680 | | JPMorgan Securities, Inc. | | 10/02/20 | | | 5 | | | | (4,179 | ) | | | — | | | | (4,179 | ) |
Cambrex Corp. | | 2.680 | | JPMorgan Securities, Inc. | | 10/01/20 | | | 4 | | | | (28,723 | ) | | | — | | | | (28,723 | ) |
| | |
| 34 | | The accompanying notes are an integral part of these financial statements. |
GOLDMAN SACHS MULTI-MANAGER ALTERNATIVES FUND
|
| ADDITIONAL INVESTMENT INFORMATION (continued) |
OVER THE COUNTER TOTAL RETURN SWAP CONTRACTS# (continued)
| | | | | | | | | | | | | | | | | | | | | | |
| Reference Obligation/Index(a) | | Financing Rate
Paid (Received)
by the Fund | | Counterparty | | Termination
Date | | Notional
Amount
(000s) | | | Value | | | Upfront
Premiums
(Received)
Paid | | | Unrealized
Appreciation/
(Depreciation) | |
Canada Goose Holdings, Inc. | | 0.990% | | JPMorgan Securities, Inc. | | 10/01/20 - 10/15/20 | | $ | 4 | | | $ | (30,396 | ) | | $ | — | | | $ | (30,396 | ) |
Canadian Tire Ltd. Class A | | 1.890 | | JPMorgan Securities, Inc. | | 09/08/20 - 10/15/20 | | | 3 | | | | (2,838 | ) | | | — | | | | (2,838 | ) |
Canadian Utilities Ltd. Class A | | 1.890 | | JPMorgan Securities, Inc. | | 06/22/20 | | | 14 | | | | (17,390 | ) | | | — | | | | (17,390 | ) |
Capita PLC | | 1.890 | | JPMorgan Securities, Inc. | | 06/26/20 - 10/16/20 | | | 144 | | | | 80 | | | | — | | | | 80 | |
Carrefour SA | | 2.680 | | JPMorgan Securities, Inc. | | 08/24/20 - 10/16/20 | | | 16 | | | | 20,336 | | | | — | | | | 20,336 | |
Carvana Co. Class A | | 0.940 | | JPMorgan Securities, Inc. | | 05/18/20 | | | 4 | | | | 21,835 | | | | — | | | | 21,835 | |
Cavco Industries, Inc. | | 2.680 | | JPMorgan Securities, Inc. | | 08/24/20 | | | — | * | | | (2,448 | ) | | | — | | | | (2,448 | ) |
CCL Industries, Inc. Class B | | 1.690 | | JPMorgan Securities, Inc. | | 08/10/20 - 10/15/20 | | | 7 | | | | (3,431 | ) | | | — | | | | (3,431 | ) |
Central Garden & Pet Co. Class A | | 2.680 | | JPMorgan Securities, Inc. | | 07/20/20 - 09/08/20 | | | 6 | | | | (8,931 | ) | | | — | | | | (8,931 | ) |
CF Industries Holding, Inc. | | 2.680 | | JPMorgan Securities, Inc. | | 03/06/20 - 06/11/20 | | | 7 | | | | (21,764 | ) | | | — | | | | (21,764 | ) |
CGG ACT | | 2.680 | | JPMorgan Securities, Inc. | | 08/13/20 - 10/02/20 | | | 80 | | | | (8,632 | ) | | | — | | | | (8,632 | ) |
Challenger Ltd. | | 1.690 | | JPMorgan Securities, Inc. | | 08/13/20 - 10/16/20 | | | 39 | | | | 4,937 | | | | — | | | | 4,937 | |
Chemed Corp. | | 2.681 | | JPMorgan Securities, Inc. | | 10/26/20 | | | — | * | | | 1,045 | | | | — | | | | 1,045 | |
CHR. Hansen Holding A/S | | 1.690 | | JPMorgan Securities, Inc. | | 03/16/20 - 05/18/20 | | | 3 | | | | (28,201 | ) | | | — | | | | (28,201 | ) |
Cia de Distribucion Integral Logista Holdings SA | | 2.680 | | JPMorgan Securities, Inc. | | 08/24/20 | | | — | * | | | (4 | ) | | | — | | | | (4 | ) |
Cimpress NV | | 1.890 | | JPMorgan Securities, Inc. | | 09/08/20 - 10/15/20 | | | 2 | | | | (23,848 | ) | | | — | | | | (23,848 | ) |
Cirrus Logic, Inc. | | 2.680 | | JPMorgan Securities, Inc. | | 09/08/20 - 10/15/20 | | | 8 | | | | 20,823 | | | | — | | | | 20,823 | |
Clean Harbors, Inc. | | 2.680 | | JPMorgan Securities, Inc. | | 07/31/20 - 10/26/20 | | | 4 | | | | 8,967 | | | | — | | | | 8,967 | |
Clearway Energy, Inc. Class A | | 2.680 | | JPMorgan Securities, Inc. | | 10/15/20 | | | — | * | | | 43 | | | | — | | | | 43 | |
CNP Assurances Act | | 2.680 | | JPMorgan Securities, Inc. | | 06/26/20 - 08/13/20 | | | 9 | | | | (5,129 | ) | | | — | | | | (5,129 | ) |
Coca Cola Amatil Ltd. | | 1.690 | | JPMorgan Securities, Inc. | | 09/21/20 - 10/02/20 | | | 40 | | | | (837 | ) | | | — | | | | (837 | ) |
Cogent Communications Holdings Co. | | 1.890 | | JPMorgan Securities, Inc. | | 09/18/20 | | | 1 | | | | (2,824 | ) | | | — | | | | (2,824 | ) |
Cognex Corp | | 1.890 | | JPMorgan Securities, Inc. | | 09/18/20 - 10/15/20 | | | 4 | | | | 3,751 | | | | — | | | | 3,751 | |
Coherent, Inc. | | 1.890 | | JPMorgan Securities, Inc. | | 07/20/20 - 10/26/20 | | | 1 | | | | 12,567 | | | | — | | | | 12,567 | |
Columbia BKG System, Inc. | | 1.890 | | JPMorgan Securities, Inc. | | 07/09/20 - 10/01/20 | | | 7 | | | | 4,152 | | | | — | | | | 4,152 | |
Comfort System USA, Inc. | | 2.680 | | JPMorgan Securities, Inc. | | 08/10/20 - 10/01/20 | | | 5 | | | | 3,977 | | | | — | | | | 3,977 | |
Commvault Systems, Inc. | | 2.680 | | JPMorgan Securities, Inc. | | 10/15/20 | | | 4 | | | | (5,254 | ) | | | — | | | | (5,254 | ) |
Computacenter | | 2.655 | | JPMorgan Securities, Inc. | | 07/10/20 | | | 11 | | | | (13,993 | ) | | | — | | | | (13,993 | ) |
Constellation Software, Inc. | | 2.730 | | JPMorgan Securities, Inc. | | 06/29/20 - 10/01/20 | | | — | * | | | 3,374 | | | | — | | | | 3,374 | |
Consumer Discretionary Select Sector SPDR Fund | | 1M USD LIBOR | | JPMorgan Securities, Inc. | | 11/23/18 | | | 1,455 | | | | 46,938 | | | | — | | | | 46,938 | |
Corcept Therapeutics, Inc. | | 2.680 | | JPMorgan Securities, Inc. | | 05/29/20 - 06/11/20 | | | 16 | | | | (19,196 | ) | | | — | | | | (19,196 | ) |
Core Laboratories NV | | 1.140 | | JPMorgan Securities, Inc. | | 01/21/20 - 10/26/20 | | | 3 | | | | 63,789 | | | | — | | | | 63,789 | |
CoreLogic, Inc. | | 2.680 | | JPMorgan Securities, Inc. | | 10/01/20 | | | 6 | | | | (25,088 | ) | | | — | | | | (25,088 | ) |
Coty, Inc. Class A | | 1.890 | | JPMorgan Securities, Inc. | | 07/31/20 - 10/15/20 | | | 5 | | | | 3,046 | | | | — | | | | 3,046 | |
Criteo SA ADS | | 2.680 | | JPMorgan Securities, Inc. | | 07/09/20 - 07/31/20 | | | 3 | | | | 2,810 | | | | — | | | | 2,810 | |
CTS Eventim AG & Co. KGaA | | 2.680 | | JPMorgan Securities, Inc. | | 12/04/19 | | | 6 | | | | (12,438 | ) | | | — | | | | (12,438 | ) |
Cyberark Software Ltd. | | 2.680 | | JPMorgan Securities, Inc. | | 08/13/20 | | | 1 | | | | 478 | | | | — | | | | 478 | |
Dana Holding Corp. | | 1.890 | | JPMorgan Securities, Inc. | | 10/15/20 | | | 12 | | | | 13,109 | | | | — | | | | 13,109 | |
Davide Campari-Milano SpA | | 1.840 | | JPMorgan Securities, Inc. | | 03/30/20 | | | 40 | | | | (6,880 | ) | | | — | | | | (6,880 | ) |
Deckers Outdoor Corp. | | 2.680 | | JPMorgan Securities, Inc. | | 02/10/20 - 10/15/20 | | | 3 | | | | 65,817 | | | | — | | | | 65,817 | |
Dentsply Sirona, Inc. | | | | JPMorgan Securities, Inc. | | 07/09/20 - 10/15/20 | | | 6 | | | | 6,443 | | | | — | | | | 6,443 | |
Deutsche Bank AG | | 1.840 | | JPMorgan Securities, Inc. | | 06/26/20 - 10/16/20 | | | 26 | | | | 30,342 | | | | — | | | | 30,342 | |
Deutsche Lufthansa | | 2.680 | | JPMorgan Securities, Inc. | | 07/11/19 - 10/26/20 | | | 14 | | | | (23,629 | ) | | | — | | | | (23,629 | ) |
| | |
| The accompanying notes are an integral part of these financial statements. | | 35 |
GOLDMAN SACHS MULTI-MANAGER ALTERNATIVES FUND
Consolidated Schedule of Investments (continued)
October 31, 2018
|
| ADDITIONAL INVESTMENT INFORMATION (continued) |
OVER THE COUNTER TOTAL RETURN SWAP CONTRACTS# (continued)
| | | | | | | | | | | | | | | | | | | | | | |
| Reference Obligation/Index(a) | | Financing Rate
Paid (Received)
by the Fund | | Counterparty | | Termination
Date | | Notional
Amount
(000s) | | | Value | | | Upfront
Premiums
(Received)
Paid | | | Unrealized
Appreciation/
(Depreciation) | |
Dick’s Sporting Goods, Inc. | | 2.680% | | JPMorgan Securities, Inc. | | 06/11/20 - 10/15/20 | | $ | 9 | | | $ | 17,440 | | | $ | — | | | $ | 17,440 | |
Distribuidora Internacional de Alimentacion SA | | 1.690 | | JPMorgan Securities, Inc. | | 06/12/20 | | | 7 | | | | 9,630 | | | | — | | | | 9,630 | |
DNA Oyj NPV | | 2.680 | | JPMorgan Securities, Inc. | | 08/24/20 | | | 4 | | | | (7,673 | ) | | | — | | | | (7,673 | ) |
DNO ASA Class A | | 2.680 | | JPMorgan Securities, Inc. | | 04/24/20 - 05/18/20 | | | 145 | | | | 7,174 | | | | — | | | | 7,174 | |
Dominion Energy, Inc. | | 1.890 | | JPMorgan Securities, Inc. | | 09/18/20 - 10/15/20 | | | 4 | | | | 1,679 | | | | — | | | | 1,679 | |
Domino’s Pizza Enterprises Ltd. | | 1.690 | | JPMorgan Securities, Inc. | | 12/05/18 - 10/19/20 | | | 8 | | | | (10,733 | ) | | | — | | | | (10,733 | ) |
Domino’S Pizza Group PLC | | 1.890 | | JPMorgan Securities, Inc. | | 04/24/20 | | | 73 | | | | (7,813 | ) | | | — | | | | (7,813 | ) |
Domtar Corp. | | 2.680 | | JPMorgan Securities, Inc. | | 05/18/20 - 10/15/20 | | | 6 | | | | 9,533 | | | | — | | | | 9,533 | |
Dormakaba Holding Ltd. | | 1.840 | | JPMorgan Securities, Inc. | | 08/13/20 - 10/16/20 | | | — | * | | | (13,314 | ) | | | — | | | | (13,314 | ) |
DRAX Group PLC | | 2.669 | | JPMorgan Securities, Inc. | | 10/26/20 | | | 55 | | | | (5,897 | ) | | | — | | | | (5,897 | ) |
Dril-Quip, Inc. | | 1.890 | | JPMorgan Securities, Inc. | | 07/20/20 | | | 2 | | | | 6,769 | | | | — | | | | 6,769 | |
DSW, Inc. Class A | | 2.680 | | JPMorgan Securities, Inc. | | 09/08/20 - 10/26/20 | | | 7 | | | | (6,122 | ) | | | — | | | | (6,122 | ) |
Duerr AG | | (0.110) | | JPMorgan Securities, Inc. | | 08/13/20 - 10/16/20 | | | 7 | | | | 11,902 | | | | — | | | | 11,902 | |
Eisai Co. Ltd. | | 2.630 | | JPMorgan Securities, Inc. | | 08/27/20 | | | 1 | | | | (5,682 | ) | | | — | | | | (5,682 | ) |
Elekta AB Class B | | 2.680 | | JPMorgan Securities, Inc. | | 03/30/20 - 04/24/20 | | | 24 | | | | 13,372 | | | | — | | | | 13,372 | |
Elis SA | | 1.840 | | JPMorgan Securities, Inc. | | 09/08/20 - 10/26/20 | | | 15 | | | | (2,213 | ) | | | — | | | | (2,213 | ) |
Empire Co. Ltd. Class A | | 2.730 | | JPMorgan Securities, Inc. | | 07/11/19 | | | 17 | | | | 11,431 | | | | — | | | | 11,431 | |
EMS-Chemie Holding AG | | 1.840 | | JPMorgan Securities, Inc. | | 08/13/20 - 10/16/20 | | | 1 | | | | (5,753 | ) | | | — | | | | (5,753 | ) |
Encompass Health Corp. | | 2.680 | | JPMorgan Securities, Inc. | | 07/31/20 | | | 3 | | | | (19,091 | ) | | | — | | | | (19,091 | ) |
Endo International PLC | | 2.680 | | JPMorgan Securities, Inc. | | 08/24/20 - 10/01/20 | | | 9 | | | | 1,116 | | | | — | | | | 1,116 | |
EnLink Midstream LLC | | 2.680 | | JPMorgan Securities, Inc. | | 05/18/20 - 10/26/20 | | | 18 | | | | (47,364 | ) | | | — | | | | (47,364 | ) |
Ensign Group, Inc. | | 2.680 | | JPMorgan Securities, Inc. | | 09/08/20 | | | — | * | | | 14 | | | | — | | | | 14 | |
Enstar Group Ltd. | | 1.890 | | JPMorgan Securities, Inc. | | 10/01/20 | | | — | * | | | 5,560 | | | | — | | | | 5,560 | |
Entegris, Inc. | | 1.890 | | JPMorgan Securities, Inc. | | 10/26/20 | | | 10 | | | | (860 | ) | | | — | | | | (860 | ) |
Epiroc Aktiebolag AK | | 2.680 | | JPMorgan Securities, Inc. | | 08/13/20 - 10/26/20 | | | 29 | | | | (48,604 | ) | | | — | | | | (48,604 | ) |
Eramet SA | | 2.680 | | JPMorgan Securities, Inc. | | 01/22/20 - 03/09/20 | | | — | * | | | 508 | | | | — | | | | 508 | |
Essity Aktiebolag | | 1.690 | | JPMorgan Securities, Inc. | | 08/24/20 - 10/02/20 | | | 11 | | | | 16,058 | | | | — | | | | 16,058 | |
Eurazeo SA | | 2.680 | | JPMorgan Securities, Inc. | | 10/02/20 - 10/16/20 | | | 4 | | | | (6,757 | ) | | | — | | | | (6,757 | ) |
Eutelsat Communications | | 2.680 | | JPMorgan Securities, Inc. | | 08/13/20 - 10/02/20 | | | 12 | | | | (54,457 | ) | | | — | | | | (54,457 | ) |
Evolent Health, Inc. Class A | | 1.890 | | JPMorgan Securities, Inc. | | 09/08/20 - 10/01/20 | | | 9 | | | | 23,310 | | | | — | | | | 23,310 | |
Evraz PLC | | 2.655 | | JPMorgan Securities, Inc. | | 01/23/19 - 04/29/19 | | | 40 | | | | 5,277 | | | | — | | | | 5,277 | |
F5 Networks, Inc. | | 2.680 | | JPMorgan Securities, Inc. | | 12/02/19 - 12/09/19 | | | 1 | | | | 6,289 | | | | — | | | | 6,289 | |
Fair Isaac Corp. | | 2.680 | | JPMorgan Securities, Inc. | | 10/01/20 | | | — | * | | | (3,561 | ) | | | — | | | | (3,561 | ) |
FANUC Corp. | | 1.890 | | JPMorgan Securities, Inc. | | 06/29/20 - 10/19/20 | | | 2 | | | | 2,021 | | | | — | | | | 2,021 | |
Ferguson PLC | | 2.655 | | JPMorgan Securities, Inc. | | 10/16/20 - 10/26/20 | | | 4 | | | | (18,097 | ) | | | — | | | | (18,097 | ) |
Ferrovial SA | | 1.690 | | JPMorgan Securities, Inc. | | 07/10/20 - 10/26/20 | | | 14 | | | | 1,957 | | | | — | | | | 1,957 | |
Fevertree Drinks PLC | | 2.655 | | JPMorgan Securities, Inc. | | 10/16/20 - 10/19/20 | | | 4 | | | | (10,095 | ) | | | — | | | | (10,095 | ) |
First Data Corp. Class A | | 2.680 | | JPMorgan Securities, Inc. | | 10/01/20 | | | 6 | | | | (21,986 | ) | | | — | | | | (21,986 | ) |
First Pacific Co. Ltd. | | 2.680 | | JPMorgan Securities, Inc. | | 06/12/20 - 06/26/20 | | | 310 | | | | (12,112 | ) | | | — | | | | (12,112 | ) |
Fletcher Building Ltd. | | 1.440 | | JPMorgan Securities, Inc. | | 10/15/19 - 05/04/20 | | | 44 | | | | 2,561 | | | | — | | | | 2,561 | |
Flextronics Ltd. | | 1M USD LIBOR | | JPMorgan Securities, Inc. | | 05/05/20 | | | 9 | | | | (41,140 | ) | | | — | | | | (41,140 | ) |
Floor & Decor Holdings, Inc. Class A | | 1.890 | | JPMorgan Securities, Inc. | | 07/09/20 - 10/15/20 | | | 7 | | | | 20,271 | | | | — | | | | 20,271 | |
Focus Financial Partners Inc. Class A | | 1.890 | | JPMorgan Securities, Inc. | | 10/26/20 | | | 6 | | | | 11,556 | | | | — | | | | 11,556 | |
Foot Locker, Inc. | | 2.680 | | JPMorgan Securities, Inc. | | 10/01/20 | | | 6 | | | | (4,073 | ) | | | — | | | | (4,073 | ) |
Forbo Holding AG | | 2.680 | | JPMorgan Securities, Inc. | | 08/13/20 - 08/24/20 | | | — | * | | | (1,430 | ) | | | — | | | | (1,430 | ) |
Fortescue Metals Group Ltd. | | 2.680 | | JPMorgan Securities, Inc. | | 10/02/20 - 10/19/20 | | | 86 | | | | 13,200 | | | | — | | | | 13,200 | |
| | |
| 36 | | The accompanying notes are an integral part of these financial statements. |
GOLDMAN SACHS MULTI-MANAGER ALTERNATIVES FUND
|
| ADDITIONAL INVESTMENT INFORMATION (continued) |
OVER THE COUNTER TOTAL RETURN SWAP CONTRACTS# (continued)
| | | | | | | | | | | | | | | | | | | | | | |
| Reference Obligation/Index(a) | | Financing Rate
Paid (Received)
by the Fund | | Counterparty | | Termination
Date | | Notional
Amount
(000s) | | | Value | | | Upfront
Premiums
(Received)
Paid | | | Unrealized
Appreciation/
(Depreciation) | |
Fortinet, Inc. | | 2.680% | | JPMorgan Securities, Inc. | | 07/20/20 - 10/15/20 | | $ | 3 | | | $ | 15,205 | | | $ | — | | | $ | 15,205 | |
Fortis, Inc. | | 1.690 | | JPMorgan Securities, Inc. | | 05/19/20 | | | 11 | | | | (17,005 | ) | | | — | | | | (17,005 | ) |
Fortune Brands Home & Securities, Inc. | | 1.890 | | JPMorgan Securities, Inc. | | 10/15/20 - 10/26/20 | | | 6 | | | | 19,586 | | | | — | | | | 19,586 | |
FTI Consulting, Inc. | | 2.680 | | JPMorgan Securities, Inc. | | 07/09/20 - 10/15/20 | | | 4 | | | | 5,642 | | | | — | | | | 5,642 | |
G-III Apparel Group Ltd. | | 2.680 | | JPMorgan Securities, Inc. | | 07/09/20 - 10/01/20 | | | 5 | | | | 16,785 | | | | — | | | | 16,785 | |
G4S PLC | | | | JPMorgan Securities, Inc. | | 08/24/20 - 10/26/20 | | | 105 | | | | 9,100 | | | | — | | | | 9,100 | |
GCI Liberty, Inc. Class A | | 1.890 | | JPMorgan Securities, Inc. | | 04/23/20 - 10/15/20 | | | 6 | | | | (4,789 | ) | | | — | | | | (4,789 | ) |
Gea Group AG | | 1.840 | | JPMorgan Securities, Inc. | | 08/03/20 - 10/26/20 | | | 10 | | | | (2,538 | ) | | | — | | | | (2,538 | ) |
Genpact Ltd. | | 1M USD LIBOR | | JPMorgan Securities, Inc. | | 05/05/20 | | | 27 | | | | (68,145 | ) | | | — | | | | (68,145 | ) |
Gentex Corp. | | 1.890 | | JPMorgan Securities, Inc. | | 10/01/20 - 10/15/20 | | | 15 | | | | (27,492 | ) | | | — | | | | (27,492 | ) |
Genting Singapore Ltd. | | 2.630 | | JPMorgan Securities, Inc. | | 10/05/20 - 10/29/20 | | | 384 | | | | (19,576 | ) | | | — | | | | (19,576 | ) |
Gjensidige Forsikring ASA | | 1.690 | | JPMorgan Securities, Inc. | | 10/26/20 | | | 4 | | | | (2,672 | ) | | | — | | | | (2,672 | ) |
GN Store Nord A/S | | 2.680 | | JPMorgan Securities, Inc. | | 03/04/19 - 10/31/19 | | | 6 | | | | 8,730 | | | | — | | | | 8,730 | |
Golar LNG Ltd. | | 1.395 | | JPMorgan Securities, Inc. | | 01/08/20 - 10/15/20 | | | 11 | | | | (18,512 | ) | | | — | | | | (18,512 | ) |
Grainger (W.W.), Inc. | | 2.680 | | JPMorgan Securities, Inc. | | 09/08/20 - 10/15/20 | | | 1 | | | | (23,311 | ) | | | — | | | | (23,311 | ) |
Granite Construction, Inc. | | | | JPMorgan Securities, Inc. | | 08/24/20 - 10/01/20 | | | 6 | | | | (16,842 | ) | | | — | | | | (16,842 | ) |
Great Canadian Gaming Corp. | | 2.730 | | JPMorgan Securities, Inc. | | 08/24/20 - 10/15/20 | | | 9 | | | | (15,720 | ) | | | — | | | | (15,720 | ) |
Green Dot Corp. Class A | | 2.680 | | JPMorgan Securities, Inc. | | 07/20/20 - 10/26/20 | | | 4 | | | | 4,287 | | | | — | | | | 4,287 | |
Greene King PLC | | 2.655 | | JPMorgan Securities, Inc. | | 09/21/20 - 10/16/20 | | | 45 | | | | (17,664 | ) | | | — | | | | (17,664 | ) |
Greensky, Inc. Class A | | 2.680 | | JPMorgan Securities, Inc. | | 08/24/20 - 10/26/20 | | | 10 | | | | (21,345 | ) | | | — | | | | (21,345 | ) |
Grenkeleasing AG | | 1.840 | | JPMorgan Securities, Inc. | | 10/02/20 - 10/26/20 | | | 3 | | | | 24,167 | | | | — | | | | 24,167 | |
GTT Communications, Inc. | | (6.810) | | JPMorgan Securities, Inc. | | 04/23/20 - 05/04/20 | | | 6 | | | | 3,347 | | | | — | | | | 3,347 | |
Guidewire Software, Inc. | | 1M USD LIBOR | | JPMorgan Securities, Inc. | | 05/05/20 | | | 6 | | | | (51,040 | ) | | | — | | | | (51,040 | ) |
Gulfport Energy Corp. | | 2.680 | | JPMorgan Securities, Inc. | | 08/10/20 - 09/08/20 | | | 3 | | | | (4,588 | ) | | | — | | | | (4,588 | ) |
Hanesbrands, Inc. | | 1.890 | | JPMorgan Securities, Inc. | | 02/24/20 - 05/18/20 | | | 16 | | | | (15,322 | ) | | | — | | | | (15,322 | ) |
Hargreaves Lansdown PLC | | 1.890 | | JPMorgan Securities, Inc. | | 10/26/20 | | | 12 | | | | (13,965 | ) | | | — | | | | (13,965 | ) |
Harvey Norman Holdings Ltd. | | 0.940 | | JPMorgan Securities, Inc. | | 03/09/20 - 08/13/20 | | | 73 | | | | 2,608 | | | | — | | | | 2,608 | |
Haseko Corp. | | 2.630 | | JPMorgan Securities, Inc. | | 06/28/19 - 07/24/19 | | | 7 | | | | (1,997 | ) | | | — | | | | (1,997 | ) |
Healthcare Services Group, Inc. | | 1.890 | | JPMorgan Securities, Inc. | | 05/04/20 - 10/15/20 | | | 7 | | | | 2,009 | | | | — | | | | 2,009 | |
Helen of Troy Corp. Ltd. | | 2.680 | | JPMorgan Securities, Inc. | | 07/31/20 - 10/15/20 | | | 2 | | | | 14,916 | | | | — | | | | 14,916 | |
Hera SpA | | 2.680 | | JPMorgan Securities, Inc. | | 10/18/19 - 11/12/19 | | | 104 | | | | (13,706 | ) | | | — | | | | (13,706 | ) |
Herbalife Ltd | | 2.680 | | JPMorgan Securities, Inc. | | 10/01/20 - 10/15/20 | | | 6 | | | | 6,795 | | | | — | | | | 6,795 | |
Hexagon AB Class B | | 2.680 | | JPMorgan Securities, Inc. | | 10/02/20 | | | 1 | | | | (2,853 | ) | | | — | | | | (2,853 | ) |
Hiscox Ltd. | | 2.655 | | JPMorgan Securities, Inc. | | 08/13/20 | | | 4 | | | | (4,214 | ) | | | — | | | | (4,214 | ) |
HollyFrontier Corp. | | 2.680 | | JPMorgan Securities, Inc. | | 03/27/20 - 10/15/20 | | | 4 | | | | 5,798 | | | | — | | | | 5,798 | |
Hologic, Inc. | | 1.890 | | JPMorgan Securities, Inc. | | 07/31/20 - 10/15/20 | | | 7 | | | | 2,754 | | | | — | | | | 2,754 | |
Horizon Pharma PLC | | 2.680 | | JPMorgan Securities, Inc. | | 10/15/20 | | | 13 | | | | 1,807 | | | | — | | | | 1,807 | |
Huhtamaki Oyj Class I | | 1.690 | | JPMorgan Securities, Inc. | | 02/03/20 - 10/16/20 | | | 10 | | | | 14,999 | | | | — | | | | 14,999 | |
Humana, Inc. | | 2.680 | | JPMorgan Securities, Inc. | | 10/15/20 | | | 1 | | | | 84 | | | | — | | | | 84 | |
Huntsman Corp. | | 2.680 | | JPMorgan Securities, Inc. | | 07/09/20 - 10/15/20 | | | 7 | | | | (12,730 | ) | | | — | | | | (12,730 | ) |
Husky Energy, Inc. | | 2.730 | | JPMorgan Securities, Inc. | | 10/30/19 - 12/02/19 | | | 21 | | | | (23,574 | ) | | | — | | | | (23,574 | ) |
Husqvarna AB Shares B | | 1.690 | | JPMorgan Securities, Inc. | | 08/03/20 - 10/26/20 | | | 41 | | | | (1,930 | ) | | | — | | | | (1,930 | ) |
II VI, Inc. | | 1.890 | | JPMorgan Securities, Inc. | | 09/18/20 - 10/01/20 | | | 5 | | | | 1,702 | | | | — | | | | 1,702 | |
Iliad SA | | 1.840 | | JPMorgan Securities, Inc. | | 02/10/20 - 10/16/20 | | | 2 | | | | 8,153 | | | | — | | | | 8,153 | |
Illumina, Inc. | | 2.680 | | JPMorgan Securities, Inc. | | 07/09/20 - 10/01/20 | | | 1 | | | | 2,612 | | | | — | | | | 2,612 | |
Iluka Resources Ltd. | | 2.680 | | JPMorgan Securities, Inc. | | 04/14/20 - 10/16/20 | | | 45 | | | | (21,374 | ) | | | — | | | | (21,374 | ) |
Imerys | | 1.840 | | JPMorgan Securities, Inc. | | 09/08/20 - 10/26/20 | | | 5 | | | | 17,001 | | | | — | | | | 17,001 | |
| | |
| The accompanying notes are an integral part of these financial statements. | | 37 |
GOLDMAN SACHS MULTI-MANAGER ALTERNATIVES FUND
Consolidated Schedule of Investments (continued)
October 31, 2018
|
| ADDITIONAL INVESTMENT INFORMATION (continued) |
OVER THE COUNTER TOTAL RETURN SWAP CONTRACTS# (continued)
| | | | | | | | | | | | | | | | | | | | | | |
| Reference Obligation/Index(a) | | Financing Rate
Paid (Received)
by the Fund | | Counterparty | | Termination
Date | | Notional
Amount
(000s) | | | Value | | | Upfront
Premiums
(Received)
Paid | | | Unrealized
Appreciation/
(Depreciation) | |
Imperial Oil Ltd. | | 2.730% | | JPMorgan Securities, Inc. | | 09/08/20 - 10/01/20 | | $ | 9 | | | $ | (10,946 | ) | | $ | — | | | $ | (10,946 | ) |
Incitec Pivot Ltd. | | 2.680 | | JPMorgan Securities, Inc. | | 10/02/20 | | | 99 | | | | (293 | ) | | | — | | | | (293 | ) |
Indra Sistemas SA | | 2.680 | | JPMorgan Securities, Inc. | | 10/02/20 | | | 25 | | | | (12,974 | ) | | | — | | | | (12,974 | ) |
Industrial Select Sector SPDR Fund | | 1M USD LIBOR | | JPMorgan Securities, Inc. | | 11/23/18 | | | 198 | | | | 18,655 | | | | — | | | | 18,655 | |
Ingenico Group SA | | 1.840 | | JPMorgan Securities, Inc. | | 08/13/20 - 10/16/20 | | | 4 | | | | 29,751 | | | | — | | | | 29,751 | |
Inmarsat PLC | | 2.655 | | JPMorgan Securities, Inc. | | 10/02/20 - 10/26/20 | | | 47 | | | | (27,062 | ) | | | — | | | | (27,062 | ) |
Inogen, Inc. | | 2.680 | | JPMorgan Securities, Inc. | | 04/23/20 - 06/11/20 | | | 1 | | | | (11,972 | ) | | | — | | | | (11,972 | ) |
Insperity, Inc. | | 2.680 | | JPMorgan Securities, Inc. | | 07/09/20 - 10/15/20 | | | 3 | | | | 6,818 | | | | — | | | | 6,818 | |
Insurance Australia Group | | 2.769 | | JPMorgan Securities, Inc. | | 10/16/20 | | | 57 | | | | (14,411 | ) | | | — | | | | (14,411 | ) |
Inter Parfums, Inc. | | 2.680 | | JPMorgan Securities, Inc. | | 10/01/20 | | | 4 | | | | 7,079 | | | | — | | | | 7,079 | |
Inter Pipeline Ltd. | | 1.890 | | JPMorgan Securities, Inc. | | 10/01/20 - 10/15/20 | | | 17 | | | | 7,057 | | | | — | | | | 7,057 | |
Interactive Brokers Group, Inc. | | 1.890 | | JPMorgan Securities, Inc. | | 10/01/20 | | | 5 | | | | 6,370 | | | | — | | | | 6,370 | |
International Game Technologies | | 1.290 | | JPMorgan Securities, Inc. | | 05/29/20 - 10/15/20 | | | 14 | | | | (20,551 | ) | | | — | | | | (20,551 | ) |
Interxion Holding NV | | 1.890 | | JPMorgan Securities, Inc. | | 05/10/19 - 10/15/20 | | | 5 | | | | 5,080 | | | | — | | | | 5,080 | |
Intuit, Inc. | | 2.680 | | JPMorgan Securities, Inc. | | 10/01/20 | | | 1 | | | | 13,515 | | | | — | | | | 13,515 | |
Ioof Holdings Ltd. | | 1.690 | | JPMorgan Securities, Inc. | | 04/24/20 - 10/02/20 | | | 49 | | | | 35,196 | | | | — | | | | 35,196 | |
Irhythm Technologies, Inc. | | 1.890 | | JPMorgan Securities, Inc. | | 07/09/20 - 10/01/20 | | | 2 | | | | 11,200 | | | | — | | | | 11,200 | |
Iridium Communications, Inc. | | 1.890 | | JPMorgan Securities, Inc. | | 09/08/20 - 10/15/20 | | | 12 | | | | (10,909 | ) | | | — | | | | (10,909 | ) |
Irobot Corp. | | 0.790 | | JPMorgan Securities, Inc. | | 07/20/20 - 10/26/20 | | | 2 | | | | (1,624 | ) | | | — | | | | (1,624 | ) |
iShares MSCI Taiwan ETF | | 1M USD LIBOR | | JPMorgan Securities, Inc. | | 05/05/20 | | | 2,637 | | | | 76,943 | | | | — | | | | 76,943 | |
iShares PHLX Semiconductor ETF | | 1M USD LIBOR | | JPMorgan Securities, Inc. | | 05/05/20 | | | 254 | | | | 22,099 | | | | — | | | | 22,099 | |
iShares S&P NA Technology-Software ETF | | 1M USD LIBOR | | JPMorgan Securities, Inc. | | 05/05/20 | | | 197 | | | | 13,340 | | | | — | | | | 13,340 | |
Itochu Corp. | | 2.630 | | JPMorgan Securities, Inc. | | 06/29/20 - 10/29/20 | | | 16 | | | | (14,461 | ) | | | — | | | | (14,461 | ) |
Itron, Inc. | | 1.890 | | JPMorgan Securities, Inc. | | 05/29/20 - 10/26/20 | | | 5 | | | | 7,677 | | | | — | | | | 7,677 | |
ITV PLC | | 1.890 | | JPMorgan Securities, Inc. | | 09/27/19 - 10/02/20 | | | 138 | | | | 17,177 | | | | — | | | | 17,177 | |
IWG PLC | | 1.890 | | JPMorgan Securities, Inc. | | 08/24/20 - 10/26/20 | | | 68 | | | | (7,780 | ) | | | — | | | | (7,780 | ) |
Jagged Peak Energy, Inc. | | (0.810) | | JPMorgan Securities, Inc. | | 04/23/20 - 06/11/20 | | | 22 | | | | 21,577 | | | | — | | | | 21,577 | |
Japan Exchange Group, Inc. | | 2.630 | | JPMorgan Securities, Inc. | | 06/15/20 - 06/29/20 | | | 10 | | | | 5,297 | | | | — | | | | 5,297 | |
JD Sports Fashion PLC | | 2.655 | | JPMorgan Securities, Inc. | | 11/28/18 - 09/27/19 | | | 54 | | | | (17,223 | ) | | | — | | | | (17,223 | ) |
Jeld-Wen Holding, Inc. | | 1.890 | | JPMorgan Securities, Inc. | | 07/31/20 - 10/15/20 | | | 11 | | | | 57,609 | | | | — | | | | 57,609 | |
Jenoptik AG | | 2.680 | | JPMorgan Securities, Inc. | | 06/12/20 - 07/10/20 | | | 4 | | | | 1,766 | | | | — | | | | 1,766 | |
John Bean Technologies Corp. | | 1.890 | | JPMorgan Securities, Inc. | | 10/01/20 - 10/15/20 | | | 2 | | | | 4,448 | | | | — | | | | 4,448 | |
Johnson Matthey PLC | | 2.655 | | JPMorgan Securities, Inc. | | 06/12/20 | | | 3 | | | | (8,982 | ) | | | — | | | | (8,982 | ) |
Just Eat PLC | | 1.890 | | JPMorgan Securities, Inc. | | 08/03/20 - 10/16/20 | | | 36 | | | | 10,696 | | | | — | | | | 10,696 | |
K&S AG | | (1.260) | | JPMorgan Securities, Inc. | | 09/08/20 - 10/26/20 | | | 15 | | | | 22,756 | | | | — | | | | 22,756 | |
Kakaku.com, Inc. | | 2.630 | | JPMorgan Securities, Inc. | | 10/21/19 - 12/24/19 | | | 13 | | | | (9,746 | ) | | | — | | | | (9,746 | ) |
Kansai Paint Co. Ltd. | | 1.890 | | JPMorgan Securities, Inc. | | 12/12/19 - 04/13/20 | | | 9 | | | | 14,715 | | | | — | | | | 14,715 | |
KAZ Minerals PLC | | 1.890 | | JPMorgan Securities, Inc. | | 09/21/20 | | | 5 | | | | (1,506 | ) | | | — | | | | (1,506 | ) |
KB Home Co. | | 2.680 | | JPMorgan Securities, Inc. | | 10/01/20 | | | 12 | | | | (11,365 | ) | | | — | | | | (11,365 | ) |
Keihan Holdings Co. Ltd. | | 1.790 | | JPMorgan Securities, Inc. | | 10/02/19 | | | 9 | | | | 10,406 | | | | — | | | | 10,406 | |
Keikyu Corp. | | 1.790 | | JPMorgan Securities, Inc. | | 01/14/20 | | | 5 | | | | 9,463 | | | | — | | | | 9,463 | |
Keyera Corp. | | 1.890 | | JPMorgan Securities, Inc. | | 10/01/20 | | | 11 | | | | 11,713 | | | | — | | | | 11,713 | |
Kindred Group PLC | | 2.680 | | JPMorgan Securities, Inc. | | 12/04/19 - 10/16/20 | | | 29 | | | | 19,333 | | | | — | | | | 19,333 | |
Kohl’s Corp. | | 2.680 | | JPMorgan Securities, Inc. | | 03/27/20 - 10/15/20 | | | 4 | | | | 19,494 | | | | — | | | | 19,494 | |
| | |
| 38 | | The accompanying notes are an integral part of these financial statements. |
GOLDMAN SACHS MULTI-MANAGER ALTERNATIVES FUND
|
| ADDITIONAL INVESTMENT INFORMATION (continued) |
OVER THE COUNTER TOTAL RETURN SWAP CONTRACTS# (continued)
| | | | | | | | | | | | | | | | | | | | | | |
| Reference Obligation/Index(a) | | Financing Rate
Paid (Received)
by the Fund | | Counterparty | | Termination
Date | | Notional
Amount
(000s) | | | Value | | | Upfront
Premiums
(Received)
Paid | | | Unrealized
Appreciation/
(Depreciation) | |
Koninklijke Boskalis Westms | | 1.840% | | JPMorgan Securities, Inc. | | 04/14/20 - 06/05/20 | | $ | 11 | | | $ | (8,421 | ) | | $ | — | | | $ | (8,421 | ) |
Korn/Ferry International Co. | | 2.680 | | JPMorgan Securities, Inc. | | 10/01/20 | | | 4 | | | | 783 | | | | — | | | | 783 | |
Kyowa Hakko Kogyo Co. Ltd. | | 1.890 | | JPMorgan Securities, Inc. | | 10/29/20 | | | 16 | | | | (20,580 | ) | | | — | | | | (20,580 | ) |
Lafargeholcim Ltd. | | 1.840 | | JPMorgan Securities, Inc. | | 10/02/20 - 10/26/20 | | | 7 | | | | (8,406 | ) | | | — | | | | (8,406 | ) |
LAM Research Corp. | | 1.890 | | JPMorgan Securities, Inc. | | 10/26/20 | | | — | * | | | 1,182 | | | | — | | | | 1,182 | |
Las Vegas Sands Corp | | 1.890 | | JPMorgan Securities, Inc. | | 10/15/20 - 10/26/20 | | | 5 | | | | 23,592 | | | | — | | | | 23,592 | |
Leggett & Platt, Inc. | | 1.890 | | JPMorgan Securities, Inc. | | 09/18/20 - 10/26/20 | | | 8 | | | | 20,634 | | | | — | | | | 20,634 | |
LendingTree, Inc. | | 1.490 | | JPMorgan Securities, Inc. | | 01/21/20 - 10/15/20 | | | 1 | | | | 6,279 | | | | — | | | | 6,279 | |
Liberty Broadband Corp. Class C | | 1.890 | | JPMorgan Securities, Inc. | | 06/25/20 - 10/15/20 | | | 4 | | | | (17,538 | ) | | | — | | | | (17,538 | ) |
Liberty Expedia Holdings, Inc. Class A | | 2.680 | | JPMorgan Securities, Inc. | | 05/29/20 - 10/15/20 | | | 7 | | | | 17,396 | | | | — | | | | 17,396 | |
Lifestyle International Holdings Ltd. | | 2.680 | | JPMorgan Securities, Inc. | | 07/10/20 | | | 24 | | | | (3,196 | ) | | | — | | | | (3,196 | ) |
Linamar Corp. | | 2.730 | | JPMorgan Securities, Inc. | | 07/22/19 - 09/09/19 | | | 7 | | | | (4,769 | ) | | | — | | | | (4,769 | ) |
LINE Corp. | | 1.190 | | JPMorgan Securities, Inc. | | 07/23/20 - 08/14/20 | | | 4 | | | | 16,403 | | | | — | | | | 16,403 | |
Lithia Mtrs, Inc. Class A | | 1.890 | | JPMorgan Securities, Inc. | | 05/18/20 - 10/01/20 | | | 3 | | | | (34,496 | ) | | | — | | | | (34,496 | ) |
London STK Exchange Group PLC | | 2.655 | | JPMorgan Securities, Inc. | | 06/12/20 | | | 4 | | | | 5,217 | | | | — | | | | 5,217 | |
Louisiana-Pacific Corp. | | 2.680 | | JPMorgan Securities, Inc. | | 09/08/20 | | | — | * | | | (639 | ) | | | — | | | | (639 | ) |
Lululemon Athletica, Inc. | | 2.680 | | JPMorgan Securities, Inc. | | 08/24/20 - 10/01/20 | | | — | * | | | 20 | | | | — | | | | 20 | |
Lundin Petroleum AB | | 2.680 | | JPMorgan Securities, Inc. | | 07/10/20 - 10/26/20 | | | 9 | | | | (13,175 | ) | | | — | | | | (13,175 | ) |
M3, Inc. | | 1.890 | | JPMorgan Securities, Inc. | | 02/26/20 - 10/01/20 | | | 7 | | | | 32,503 | | | | — | | | | 32,503 | |
MACOM Technology Solutions Holdings, Inc. | | 1.890 | | JPMorgan Securities, Inc. | | 04/15/19 | | | 10 | | | | 13,596 | | | | — | | | | 13,596 | |
Madden Steven Ltd. | | 2.680 | | JPMorgan Securities, Inc. | | 10/16/20 | | | 8 | | | | 8,840 | | | | — | | | | 8,840 | |
Magnolia Oil & Gas Corp. Class A | | 1.890 | | JPMorgan Securities, Inc. | | 08/24/20 - 10/26/20 | | | 21 | | | | 26,071 | | | | — | | | | 26,071 | |
Man Wah Holdings Ltd. | | 0.440 | | JPMorgan Securities, Inc. | | 06/26/20 - 07/20/20 | | | 210 | | | | 13,990 | | | | — | | | | 13,990 | |
Manhattan Associates, Inc. | | 2.680 | | JPMorgan Securities, Inc. | | 12/09/19 - 10/15/20 | | | 6 | | | | 7,805 | | | | — | | | | 7,805 | |
ManpowerGroup, Inc. | | 2.680 | | JPMorgan Securities, Inc. | | 10/01/20 | | | 3 | | | | 1,055 | | | | — | | | | 1,055 | |
Maple Leaf Foods, Inc. | | 2.730 | | JPMorgan Securities, Inc. | | 03/18/19 - 06/11/20 | | | 3 | | | | (4,046 | ) | | | — | | | | (4,046 | ) |
Marubeni Corp. | | 2.630 | | JPMorgan Securities, Inc. | | 07/13/20 - 10/29/20 | | | 36 | | | | (35,373 | ) | | | — | | | | (35,373 | ) |
Marui Group Co. Ltd. | | 1.790 | | JPMorgan Securities, Inc. | | 11/14/18 - 10/22/20 | | | 16 | | | | 15,914 | | | | — | | | | 15,914 | |
Matador Res Co. | | 1.890 | | JPMorgan Securities, Inc. | | 07/20/20 - 10/01/20 | | | 8 | | | | 11,848 | | | | — | | | | 11,848 | |
Mattel, Inc. | | 1.890 | | JPMorgan Securities, Inc. | | 02/04/19 - 10/15/20 | | | 21 | | | | 8,801 | | | | — | | | | 8,801 | |
Medibank Private Ltd. | | 1.690 | | JPMorgan Securities, Inc. | | 10/02/20 | | | 136 | | | | 435 | | | | — | | | | 435 | |
Mediclinic International PLC | | 1.890 | | JPMorgan Securities, Inc. | | 08/24/20 - 10/02/20 | | | 49 | | | | 54,016 | | | | — | | | | 54,016 | |
Medifast, Inc. | | 2.680 | | JPMorgan Securities, Inc. | | 09/18/20 | | | — | * | | | 4,697 | | | | — | | | | 4,697 | |
Meg Energy Corp. | | 2.730 | | JPMorgan Securities, Inc. | | 05/29/20 | | | 34 | | | | (4,554 | ) | | | — | | | | (4,554 | ) |
Melco Resort Entertainment | | 1.890 | | JPMorgan Securities, Inc. | | 10/01/20 - 10/26/20 | | | 13 | | | | 19,698 | | | | — | | | | 19,698 | |
Mellanox Technologies Ltd. | | 2.680 | | JPMorgan Securities, Inc. | | 04/23/20 - 10/15/20 | | | 4 | | | | 61,128 | | | | — | | | | 61,128 | |
Mercury Systems, Inc. | | 1.890 | | JPMorgan Securities, Inc. | | 10/01/20 - 10/15/20 | | | 4 | | | | 13,958 | | | | — | | | | 13,958 | |
Methanex Corp. | | 2.730 | | JPMorgan Securities, Inc. | | 04/23/20 - 10/15/20 | | | 4 | | | | (34,539 | ) | | | — | | | | (34,539 | ) |
Metro Bank PLC | | 0.690 | | JPMorgan Securities, Inc. | | 07/11/19 - 10/29/20 | | | 9 | | | | 63,102 | | | | — | | | | 63,102 | |
Metsa Brd Corp. Class B | | 2.694 | | JPMorgan Securities, Inc. | | 10/26/20 | | | 19 | | | | 7,270 | | | | — | | | | 7,270 | |
MGM China Holdings Ltd. | | 0.940 | | JPMorgan Securities, Inc. | | 07/10/20 - 10/16/20 | | | 134 | | | | 9,615 | | | | — | | | | 9,615 | |
Michael Kors Holdings Ltd. | | 2.680 | | JPMorgan Securities, Inc. | | 10/01/20 | | | 4 | | | | (27,800 | ) | | | — | | | | (27,800 | ) |
Micro Focus International PLC | | 1.890 | | JPMorgan Securities, Inc. | | 10/16/20 | | | 5 | | | | 11,952 | | | | — | | | | 11,952 | |
| | |
| The accompanying notes are an integral part of these financial statements. | | 39 |
GOLDMAN SACHS MULTI-MANAGER ALTERNATIVES FUND
Consolidated Schedule of Investments (continued)
October 31, 2018
|
| ADDITIONAL INVESTMENT INFORMATION (continued) |
OVER THE COUNTER TOTAL RETURN SWAP CONTRACTS# (continued)
| | | | | | | | | | | | | | | | | | | | | | |
| Reference Obligation/Index(a) | | Financing Rate
Paid (Received)
by the Fund | | Counterparty | | Termination
Date | | Notional
Amount
(000s) | | | Value | | | Upfront
Premiums
(Received)
Paid | | | Unrealized
Appreciation/
(Depreciation) | |
Micro Focus International PLC ADR | | 1.890% | | JPMorgan Securities, Inc. | | 09/26/19 - 10/11/19 | | $ | 11 | | | $ | 25,163 | | | $ | — | | | $ | 25,163 | |
Miller Herman, Inc. | | 2.680 | | JPMorgan Securities, Inc. | | 07/20/20 - 10/15/20 | | | 8 | | | | (14,451 | ) | | | — | | | | (14,451 | ) |
Minth Group Ltd. | | 1.690 | | JPMorgan Securities, Inc. | | 03/30/20 - 06/12/20 | | | 51 | | | | 6,056 | | | | — | | | | 6,056 | |
Mitsubishi Gas Chemical Co., Inc. | | 2.630 | | JPMorgan Securities, Inc. | | 06/28/19 | | | 1 | | | | (1,562 | ) | | | — | | | | (1,562 | ) |
Mitsubishi Motors Corp. | | 2.630 | | JPMorgan Securities, Inc. | | 06/29/20 - 10/05/20 | | | 32 | | | | (7,396 | ) | | | — | | | | (7,396 | ) |
Mixi, Inc. | | 2.630 | | JPMorgan Securities, Inc. | | 01/15/19 | | | 9 | | | | (18,577 | ) | | | — | | | | (18,577 | ) |
Mohawk Industries, Inc. | | 1.890 | | JPMorgan Securities, Inc. | | 09/08/20 - 10/26/20 | | | 2 | | | | 52,251 | | | | — | | | | 52,251 | |
Molina Healthcare, Inc. | | 2.680 | | JPMorgan Securities, Inc. | | 07/09/20 - 10/26/20 | | | 2 | | | | (19,818 | ) | | | — | | | | (19,818 | ) |
Mondi PLC | | 2.655 | | JPMorgan Securities, Inc. | | 06/26/20 - 10/16/20 | | | 12 | | | | 719 | | | | — | | | | 719 | |
Moneysupermarket Co. Group PLC | | 2.655 | | JPMorgan Securities, Inc. | | 04/24/20 - 05/29/20 | | | 76 | | | | 8,296 | | | | — | | | | 8,296 | |
Mongodb, Inc. Class A | | 1.290 | | JPMorgan Securities, Inc. | | 06/11/20 | | | 4 | | | | (69,444 | ) | | | — | | | | (69,444 | ) |
MonotaRO Co. Ltd. | | 1.190 | | JPMorgan Securities, Inc. | | 07/17/20 - 10/22/20 | | | 12 | | | | 55,195 | | | | — | | | | 55,195 | |
Monro, Inc. | | 1.890 | | JPMorgan Securities, Inc. | | 10/01/20 | | | 4 | | | | (36,102 | ) | | | — | | | | (36,102 | ) |
Motorola Solutions, Inc. | | 1M USD LIBOR | | JPMorgan Securities, Inc. | | 05/05/20 | | | 2 | | | | (5,585 | ) | | | — | | | | (5,585 | ) |
MSG Network, Inc. Class A | | 2.681 | | JPMorgan Securities, Inc. | | 10/26/20 | | | 9 | | | | (18,131 | ) | | | — | | | | (18,131 | ) |
Murata Manufacturing Co. Ltd. | | 1.890 | | JPMorgan Securities, Inc. | | 08/14/20 - 10/19/20 | | | 2 | | | | (8,879 | ) | | | — | | | | (8,879 | ) |
Nabors Industries Ltd. | | 1.890 | | JPMorgan Securities, Inc. | | 07/31/20 - 10/26/20 | | | 40 | | | | 31,122 | | | | — | | | | 31,122 | |
National Vision Holdings, Inc. | | 1.890 | | JPMorgan Securities, Inc. | | 04/23/20 - 05/04/20 | | | 6 | | | | (9,077 | ) | | | — | | | | (9,077 | ) |
Natixis SA | | 1.840 | | JPMorgan Securities, Inc. | | 09/21/20 - 10/16/20 | | | 45 | | | | 18,060 | | | | — | | | | 18,060 | |
Navigator Co. NPV | | 2.680 | | JPMorgan Securities, Inc. | | 10/16/20 - 10/26/20 | | | 57 | | | | 16,278 | | | | — | | | | 16,278 | |
Navistar International Corp. | | 2.680 | | JPMorgan Securities, Inc. | | 06/11/20 - 10/15/20 | | | 7 | | | | (11,045 | ) | | | — | | | | (11,045 | ) |
Nemetschek AG | | 2.680 | | JPMorgan Securities, Inc. | | 08/13/20 - 10/16/20 | | | 1 | | | | 2,462 | | | | — | | | | 2,462 | |
Neste Oil | | 2.680 | | JPMorgan Securities, Inc. | | 06/12/20 - 10/26/20 | | | 4 | | | | 8,528 | | | | — | | | | 8,528 | |
NetApp, Inc. | | 2.681 | | JPMorgan Securities, Inc. | | 10/26/20 | | | 3 | | | | 5,246 | | | | — | | | | 5,246 | |
Netflix, Inc. | | 1.890 | | JPMorgan Securities, Inc. | | 09/18/20 - 10/15/20 | | | 1 | | | | 14,508 | | | | — | | | | 14,508 | |
Netgear, Inc. | | 2.680 | | JPMorgan Securities, Inc. | | 06/25/20 | | | 1 | | | | 277 | | | | — | | | | 277 | |
Nevro Corp. | | 1.890 | | JPMorgan Securities, Inc. | | 05/04/20 - 05/29/20 | | | 4 | | | | 7,141 | | | | — | | | | 7,141 | |
Newell Brands, Inc. | | 1.890 | | JPMorgan Securities, Inc. | | 12/09/19 - 10/15/20 | | | 13 | | | | 23,895 | | | | — | | | | 23,895 | |
Newfield Exploration Co. | | 2.680 | | JPMorgan Securities, Inc. | | 10/15/20 - 10/26/20 | | | 12 | | | | (57,775 | ) | | | — | | | | (57,775 | ) |
Nextdc Ltd. | | 1.690 | | JPMorgan Securities, Inc. | | 06/26/20 | | | 33 | | | | 9,633 | | | | — | | | | 9,633 | |
NIB Holdings Ltd. | | 1.690 | | JPMorgan Securities, Inc. | | 09/08/20 | | | 43 | | | | (4,861 | ) | | | — | | | | (4,861 | ) |
Nice Ltd. ADR | | 2.680 | | JPMorgan Securities, Inc. | | 08/10/20 | | | 1 | | | | 831 | | | | — | | | | 831 | |
Nifco, Inc. | | 1.790 | | JPMorgan Securities, Inc. | | 07/24/19 - 11/25/19 | | | 11 | | | | 23,089 | | | | — | | | | 23,089 | |
Nitto Denko Corp. | | 1.890 | | JPMorgan Securities, Inc. | | 10/05/20 - 10/19/20 | | | 4 | | | | 47,981 | | | | — | | | | 47,981 | |
NMC Health PLC | | 1.890 | | JPMorgan Securities, Inc. | | 03/09/20 - 06/12/20 | | | 7 | | | | (24,347 | ) | | | — | | | | (24,347 | ) |
Nokia Corp. Class A | | 1.690 | | JPMorgan Securities, Inc. | | 10/16/20 - 10/26/20 | | | 52 | | | | (23,213 | ) | | | — | | | | (23,213 | ) |
Nolato AB Class B | | 2.680 | | JPMorgan Securities, Inc. | | 06/29/20 - 07/10/20 | | | 3 | | | | (27,172 | ) | | | — | | | | (27,172 | ) |
Nordea Bank Abp | | 1.690 | | JPMorgan Securities, Inc. | | 10/26/20 | | | 11 | | | | 3,101 | | | | — | | | | 3,101 | |
Nordson Corp. | | 1.890 | | JPMorgan Securities, Inc. | | 10/01/20 - 10/15/20 | | | 2 | | | | 5,323 | | | | — | | | | 5,323 | |
Nordstrom, Inc. | | 2.680 | | JPMorgan Securities, Inc. | | 09/08/20 - 10/01/20 | | | 4 | | | | 25,511 | | | | — | | | | 25,511 | |
Novocure Ltd. | | 1.890 | | JPMorgan Securities, Inc. | | 05/04/20 - 06/11/20 | | | 7 | | | | 70,020 | | | | — | | | | 70,020 | |
NU Skin Enterprises, Inc. Class A | | 2.680 | | JPMorgan Securities, Inc. | | 07/09/20 - 10/15/20 | | | 4 | | | | 12,332 | | | | — | | | | 12,332 | |
Nufarm Ltd. | | 2.680 | | JPMorgan Securities, Inc. | | 06/26/20 | | | 4 | | | | 27 | | | | — | | | | 27 | |
Nvent Electric PLC | | 2.680 | | JPMorgan Securities, Inc. | | 05/29/20 - 10/26/20 | | | 12 | | | | 2,619 | | | | — | | | | 2,619 | |
Ocado Group PLC | | 1.040 | | JPMorgan Securities, Inc. | | 07/20/20 - 10/16/20 | | | 29 | | | | (16,193 | ) | | | — | | | | (16,193 | ) |
OCI NV | | 1.290 | | JPMorgan Securities, Inc. | | 08/24/20 - 10/09/20 | | | 5 | | | | 14,578 | | | | — | | | | 14,578 | |
Oil States International, Inc. | | 1.890 | | JPMorgan Securities, Inc. | | 09/08/20 | | | 6 | | | | 42,917 | | | | — | | | | 42,917 | |
Onex Corp. | | 1.690 | | JPMorgan Securities, Inc. | | 06/11/20 - 10/15/20 | | | 4 | | | | (9,704 | ) | | | — | | | | (9,704 | ) |
| | |
| 40 | | The accompanying notes are an integral part of these financial statements. |
GOLDMAN SACHS MULTI-MANAGER ALTERNATIVES FUND
|
| ADDITIONAL INVESTMENT INFORMATION (continued) |
OVER THE COUNTER TOTAL RETURN SWAP CONTRACTS# (continued)
| | | | | | | | | | | | | | | | | | | | | | |
| Reference Obligation/Index(a) | | Financing Rate
Paid (Received)
by the Fund | | Counterparty | | Termination
Date | | Notional
Amount
(000s) | | | Value | | | Upfront
Premiums
(Received)
Paid | | | Unrealized
Appreciation/
(Depreciation) | |
Open Text Corp. | | 1.890% | | JPMorgan Securities, Inc. | | 10/15/20 | | $ | 8 | | | $ | 890 | | | $ | — | | | $ | 890 | |
Oracle Corp. | | 2.630 | | JPMorgan Securities, Inc. | | 08/14/20 | | | 1 | | | | (10,035 | ) | | | — | | | | (10,035 | ) |
Orica Ltd. | | 1.690 | | JPMorgan Securities, Inc. | | 08/13/20 - 10/16/20 | | | 25 | | | | (14,071 | ) | | | — | | | | (14,071 | ) |
Oriflame Holding Ltd. | | 2.680 | | JPMorgan Securities, Inc. | | 05/18/20 - 05/29/20 | | | 8 | | | | (454 | ) | | | — | | | | (454 | ) |
Ormat Technologies, Inc. | | 1.890 | | JPMorgan Securities, Inc. | | 06/11/20 | | | 6 | | | | (9,024 | ) | | | — | | | | (9,024 | ) |
Orora Ltd. | | 2.680 | | JPMorgan Securities, Inc. | | 10/31/19 - 11/12/19 | | | 35 | | | | 4,411 | | | | — | | | | 4,411 | |
Orpea | | 1.840 | | JPMorgan Securities, Inc. | | 08/24/20 - 10/16/20 | | | 3 | | | | (14,807 | ) | | | — | | | | (14,807 | ) |
Osram Licht AG | | 1.840 | | JPMorgan Securities, Inc. | | 06/26/20 - 10/16/20 | | | 8 | | | | (43,856 | ) | | | — | | | | (43,856 | ) |
Outokumpu Oyj | | 1.690 | | JPMorgan Securities, Inc. | | 04/24/20 - 10/26/20 | | | 55 | | | | 51,485 | | | | — | | | | 51,485 | |
Owens Corning | | 1.890 | | JPMorgan Securities, Inc. | | 10/01/20 - 10/26/20 | | | 6 | | | | 22,484 | | | | — | | | | 22,484 | |
OZ Minerals Ltd. | | 2.680 | | JPMorgan Securities, Inc. | | 09/21/20 - 10/26/20 | | | 45 | | | | 13,958 | | | | — | | | | 13,958 | |
Paddy Power PLC | | 1.690 | | JPMorgan Securities, Inc. | | 08/24/20 - 10/02/20 | | | 3 | | | | (24,035 | ) | | | — | | | | (24,035 | ) |
Panalpina Welttransport Holding AG | | 1.140 | | JPMorgan Securities, Inc. | | 05/04/20 - 07/10/20 | | | — | * | | | 1,833 | | | | — | | | | 1,833 | |
Pandora A/S | | 1.690 | | JPMorgan Securities, Inc. | | 10/16/20 | | | 2 | | | | 4,427 | | | | — | | | | 4,427 | |
PBF Energy, Inc. | | 2.680 | | JPMorgan Securities, Inc. | | 08/10/20 - 10/01/20 | | | 6 | | | | (45,854 | ) | | | — | | | | (45,854 | ) |
Peabody Energy Corp. | | 2.680 | | JPMorgan Securities, Inc. | | 10/15/20 | | | 8 | | | | 3,345 | | | | — | | | | 3,345 | |
Pearl Group Ltd. | | 1.890 | | JPMorgan Securities, Inc. | | 09/21/20 - 10/26/20 | | | 37 | | | | 19,978 | | | | — | | | | 19,978 | |
Pembina Pipeline Corp. | | 1.690 | | JPMorgan Securities, Inc. | | 07/31/20 - 10/01/20 | | | 8 | | | | 5,465 | | | | — | | | | 5,465 | |
Pentair PLC | | 1.890 | | JPMorgan Securities, Inc. | | 10/15/20 | | | 7 | | | | (7,813 | ) | | | — | | | | (7,813 | ) |
Perspecta, Inc. | | 2.680 | | JPMorgan Securities, Inc. | | 10/01/20 - 10/15/20 | | | 12 | | | | (2,445 | ) | | | — | | | | (2,445 | ) |
Peugeot SA | | 2.680 | | JPMorgan Securities, Inc. | | 02/10/20 - 10/26/20 | | | 13 | | | | 1,560 | | | | — | | | | 1,560 | |
Pinduoduo, Inc. | | (4.660) | | JPMorgan Securities, Inc. | | 10/26/20 | | | 7 | | | | 3,073 | | | | — | | | | 3,073 | |
Pluralsight, Inc. Class A | | 1.890 | | JPMorgan Securities, Inc. | | 09/18/20 | | | 1 | | | | 727 | | | | — | | | | 727 | |
PrairieSky Royalty Ltd. | | 1.840 | | JPMorgan Securities, Inc. | | 06/29/20 - 07/16/20 | | | 18 | | | | 23,588 | | | | — | | | | 23,588 | |
Pricesmart, Inc. | | 1.890 | | JPMorgan Securities, Inc. | | 04/23/20 - 10/15/20 | | | 4 | | | | 21,992 | | | | — | | | | 21,992 | |
Provident Financial PLC | | 1.890 | | JPMorgan Securities, Inc. | | 10/31/18 - 10/30/20 | | | 40 | | | | 21,412 | | | | — | | | | 21,412 | |
Proximus SA | | 2.680 | | JPMorgan Securities, Inc. | | 10/02/20 - 10/16/20 | | | 11 | | | | 2,933 | | | | — | | | | 2,933 | |
Prudential PLC | | 2.669 | | JPMorgan Securities, Inc. | | 10/26/20 | | | 14 | | | | 8,738 | | | | — | | | | 8,738 | |
Qantas Airways Ltd. | | 2.680 | | JPMorgan Securities, Inc. | | 11/13/18 - 10/16/20 | | | 77 | | | | 7,442 | | | | — | | | | 7,442 | |
Qinetiq Group PLC | | 2.655 | | JPMorgan Securities, Inc. | | 07/20/20 | | | 54 | | | | (5,303 | ) | | | — | | | | (5,303 | ) |
Quaker Chemical Corp. | | 2.680 | | JPMorgan Securities, Inc. | | 08/24/20 - 10/15/20 | | | 2 | | | | (11,449 | ) | | | — | | | | (11,449 | ) |
Qualcomm, Inc. | | 1M USD LIBOR | | JPMorgan Securities, Inc. | | 05/05/20 | | | 7 | | | | (58,339 | ) | | | — | | | | (58,339 | ) |
Qube Holdings Ltd. | | 1.190 | | JPMorgan Securities, Inc. | | 06/28/19 - 09/30/19 | | | 180 | | | | (662 | ) | | | — | | | | (662 | ) |
Quebecor, Inc. Class B | | 2.730 | | JPMorgan Securities, Inc. | | 06/11/20 | | | 1 | | | | (64 | ) | | | — | | | | (64 | ) |
Raiffeisen Bank International AG | | 2.680 | | JPMorgan Securities, Inc. | | 04/24/20 - 10/16/20 | | | 10 | | | | (2,903 | ) | | | — | | | | (2,903 | ) |
Ramsay Health Care Ltd. | | 1.690 | | JPMorgan Securities, Inc. | | 07/10/20 - 10/16/20 | | | 8 | | | | (14,773 | ) | | | — | | | | (14,773 | ) |
REA Group Ltd. | | 1.690 | | JPMorgan Securities, Inc. | | 10/02/20 - 10/26/20 | | | 6 | | | | 20,911 | | | | — | | | | 20,911 | |
Reckitt Benckiser Group PLC | | 2.655 | | JPMorgan Securities, Inc. | | 08/13/20 - 10/26/20 | | | 3 | | | | (16,094 | ) | | | — | | | | (16,094 | ) |
Red Rock Resorts, Inc. Class A | | 1.890 | | JPMorgan Securities, Inc. | | 10/01/20 - 10/15/20 | | | 12 | | | | 7,735 | | | | — | | | | 7,735 | |
Robert Half International, Inc. | | 2.680 | | JPMorgan Securities, Inc. | | 09/18/20 - 10/26/20 | | | 5 | | | | (17,846 | ) | | | — | | | | (17,846 | ) |
Rockwool International AS Class B | | 2.680 | | JPMorgan Securities, Inc. | | 07/10/20 - 10/26/20 | | | 1 | | | | (21,045 | ) | | | — | | | | (21,045 | ) |
Roku, Inc. Class A | | 1.390 | | JPMorgan Securities, Inc. | | 08/24/20 - 10/15/20 | | | 3 | | | | 1,375 | | | | — | | | | 1,375 | |
RPC Group PLC | | 2.655 | | JPMorgan Securities, Inc. | | 08/24/20 - 09/08/20 | | | 22 | | | | (5,043 | ) | | | — | | | | (5,043 | ) |
RPC, Inc. | | 1.890 | | JPMorgan Securities, Inc. | | 07/20/20 - 10/26/20 | | | 17 | | | | 7,937 | | | | — | | | | 7,937 | |
Saga PLC | | 2.655 | | JPMorgan Securities, Inc. | | 10/16/20 | | | 102 | | | | (20,879 | ) | | | — | | | | (20,879 | ) |
Sage Group PLC | | 1.890 | | JPMorgan Securities, Inc. | | 03/30/20 - 10/26/20 | | | 41 | | | | 15,673 | | | | — | | | | 15,673 | |
Sailpoint Technlgies Holdings, Inc. | | 2.680 | | JPMorgan Securities, Inc. | | 07/31/20 - 10/15/20 | | | 8 | | | | (728 | ) | | | — | | | | (728 | ) |
| | |
| The accompanying notes are an integral part of these financial statements. | | 41 |
GOLDMAN SACHS MULTI-MANAGER ALTERNATIVES FUND
Consolidated Schedule of Investments (continued)
October 31, 2018
|
| ADDITIONAL INVESTMENT INFORMATION (continued) |
OVER THE COUNTER TOTAL RETURN SWAP CONTRACTS# (continued)
| | | | | | | | | | | | | | | | | | | | | | |
| Reference Obligation/Index(a) | | Financing Rate
Paid (Received)
by the Fund | | Counterparty | | Termination
Date | | Notional
Amount
(000s) | | | Value | | | Upfront
Premiums
(Received)
Paid | | | Unrealized
Appreciation/
(Depreciation) | |
Salmar ASA | | 2.680% | | JPMorgan Securities, Inc. | | 07/10/20 - 10/02/20 | | $ | 6 | | | $ | 12,112 | | | $ | — | | | $ | 12,112 | |
Salvatore Ferragamo SpA | | (0.110) | | JPMorgan Securities, Inc. | | 10/26/20 | | | 12 | | | | (490 | ) | | | — | | | | (490 | ) |
Salzgitter AG | | 2.680 | | JPMorgan Securities, Inc. | | 06/26/20 - 10/26/20 | | | 7 | | | | (36,819 | ) | | | — | | | | (36,819 | ) |
Santander Consumer USA Holding, Inc. | | 2.680 | | JPMorgan Securities, Inc. | | 05/18/20 | | | 16 | | | | (2,995 | ) | | | — | | | | (2,995 | ) |
Santos Ltd. | | 2.680 | | JPMorgan Securities, Inc. | | 08/13/20 - 08/24/20 | | | 44 | | | | (9,927 | ) | | | — | | | | (9,927 | ) |
SBI Holdings, Inc. | | 2.630 | | JPMorgan Securities, Inc. | | 02/13/20 | | | 8 | | | | (27,372 | ) | | | — | | | | (27,372 | ) |
Scientific Games Corp. | | 1.890 | | JPMorgan Securities, Inc. | | 06/11/20 - 10/26/20 | | | 7 | | | | 9,788 | | | | — | | | | 9,788 | |
Sea Ltd. ADR | | 1.890 | | JPMorgan Securities, Inc. | | 01/21/20 - 05/04/20 | | | 16 | | | | (18,609 | ) | | | — | | | | (18,609 | ) |
Seibu Holdings, Inc. | | 1.790 | | JPMorgan Securities, Inc. | | 12/19/18 - 09/18/20 | | | 17 | | | | 20,948 | | | | — | | | | 20,948 | |
Sempra Energy Co. | | 1.890 | | JPMorgan Securities, Inc. | | 03/27/20 - 10/01/20 | | | 3 | | | | 10,105 | | | | — | | | | 10,105 | |
Ses Global SA | | 2.680 | | JPMorgan Securities, Inc. | | 08/03/20 - 10/02/20 | | | 11 | | | | (6,667 | ) | | | — | | | | (6,667 | ) |
Seven Bank Ltd. | | 1.790 | | JPMorgan Securities, Inc. | | 11/14/18 - 07/27/20 | | | 96 | | | | (10,300 | ) | | | — | | | | (10,300 | ) |
Seven Group Holdings | | 1.440 | | JPMorgan Securities, Inc. | | 08/24/20 - 10/26/20 | | | 13 | | | | 14,658 | | | | — | | | | 14,658 | |
Shopify, Inc. Class A | | 1.890 | | JPMorgan Securities, Inc. | | 02/04/19 - 03/18/19 | | | 2 | | | | (18,647 | ) | | | — | | | | (18,647 | ) |
Sias | | 2.680 | | JPMorgan Securities, Inc. | | 09/21/20 | | | 10 | | | | 421 | | | | — | | | | 421 | |
Sika AG | | 1.840 | | JPMorgan Securities, Inc. | | 08/13/20 - 10/26/20 | | | 2 | | | | (413 | ) | | | — | | | | (413 | ) |
Siltronic AG | | 2.680 | | JPMorgan Securities, Inc. | | 10/15/19 - 10/16/20 | | | 2 | | | | (28,831 | ) | | | — | | | | (28,831 | ) |
Singapore Exchange Ltd. | | 2.630 | | JPMorgan Securities, Inc. | | 04/13/20 - 10/05/20 | | | 53 | | | | (4,541 | ) | | | — | | | | (4,541 | ) |
Singapore Technologies Engineering Ltd. | | 2.630 | | JPMorgan Securities, Inc. | | 09/21/20 - 10/05/20 | | | 110 | | | | 3,849 | | | | — | | | | 3,849 | |
Sjm Holdings Ltd. | | 2.680 | | JPMorgan Securities, Inc. | | 08/03/20 - 09/21/20 | | | 144 | | | | (1,296 | ) | | | — | | | | (1,296 | ) |
Sm Energy Co. | | 2.680 | | JPMorgan Securities, Inc. | | 10/15/20 | | | 4 | | | | (16,814 | ) | | | — | | | | (16,814 | ) |
Smiths Group | | 1.890 | | JPMorgan Securities, Inc. | | 10/02/20 - 10/26/20 | | | 17 | | | | (7,820 | ) | | | — | | | | (7,820 | ) |
Snam SpA | | 2.680 | | JPMorgan Securities, Inc. | | 09/21/20 | | | 47 | | | | 862 | | | | — | | | | 862 | |
Snap, Inc. Class A | | 1.010 | | JPMorgan Securities, Inc. | | 08/14/19 - 10/15/20 | | | 39 | | | | 7,871 | | | | — | | | | 7,871 | |
Sodexo SA | | 2.680 | | JPMorgan Securities, Inc. | | 10/16/20 | | | 3 | | | | 2,147 | | | | — | | | | 2,147 | |
South Jersey Industry, Inc. | | 1.890 | | JPMorgan Securities, Inc. | | 08/24/20 - 10/26/20 | | | 9 | | | | 49,966 | | | | — | | | | 49,966 | |
South32 Ltd. | | 2.680 | | JPMorgan Securities, Inc. | | 08/26/19 - 06/29/20 | | | 122 | | | | (15,912 | ) | | | — | | | | (15,912 | ) |
Southwestern Energy Co. | | 2.681 | | JPMorgan Securities, Inc. | | 10/26/20 | | | 37 | | | | 3,304 | | | | — | | | | 3,304 | |
SPDR S&P 500 ETF | | 1M USD LIBOR | | JPMorgan Securities, Inc. | | 11/23/18 | | | 2,525 | | | | 196,731 | | | | 4,174 | | | | 192,557 | |
Spie SA | | 1.840 | | JPMorgan Securities, Inc. | | 08/13/20 - 10/16/20 | | | 16 | | | | 27,392 | | | | — | | | | 27,392 | |
Spirax Sarco Engineering PLC | | 1.890 | | JPMorgan Securities, Inc. | | 10/02/20 | | | 3 | | | | (1,872 | ) | | | — | | | | (1,872 | ) |
Spirit Airlines, Inc. | | 1.890 | | JPMorgan Securities, Inc. | | 10/15/20 | | | 5 | | | | (26,863 | ) | | | — | | | | (26,863 | ) |
Spotify Technology SA | | 1.490 | | JPMorgan Securities, Inc. | | 06/11/20 - 10/15/20 | | | 2 | | | | 4,806 | | | | — | | | | 4,806 | |
Spx Flow, Inc. | | 2.680 | | JPMorgan Securities, Inc. | | 08/10/20 - 10/01/20 | | | 5 | | | | (48,310 | ) | | | — | | | | (48,310 | ) |
Square, Inc. Class A | | 1.890 | | JPMorgan Securities, Inc. | | 12/16/19 | | | 1 | | | | (5,418 | ) | | | — | | | | (5,418 | ) |
SSAB AB Class B | | 2.680 | | JPMorgan Securities, Inc. | | 07/10/20 - 10/26/20 | | | 81 | | | | (37,341 | ) | | | — | | | | (37,341 | ) |
SSP Group PLC | | 2.655 | | JPMorgan Securities, Inc. | | 04/16/20 - 10/16/20 | | | 33 | | | | (5,102 | ) | | | — | | | | (5,102 | ) |
ST James S Place Capital PLC | | 2.655 | | JPMorgan Securities, Inc. | | 08/13/20 - 10/16/20 | | | 20 | | | | (20,947 | ) | | | — | | | | (20,947 | ) |
Staar Surgical Co. | | 2.680 | | JPMorgan Securities, Inc. | | 09/08/20 | | | 2 | | | | (1,203 | ) | | | — | | | | (1,203 | ) |
Star Entertainment Group Ltd. | | 1.690 | | JPMorgan Securities, Inc. | | 08/24/20 | | | 13 | | | | 1,596 | | | | — | | | | 1,596 | |
Starhub Ltd. | | (0.810) | | JPMorgan Securities, Inc. | | 07/13/20 | | | 34 | �� | | | 813 | | | | — | | | | 813 | |
Steelcase, Inc. Class A | | 2.680 | | JPMorgan Securities, Inc. | | 10/01/20 - 10/15/20 | | | 13 | | | | 771 | | | | — | | | | 771 | |
Stella Jones, Inc. | | 1.890 | | JPMorgan Securities, Inc. | | 10/26/20 | | | 9 | | | | 1,328 | | | | — | | | | 1,328 | |
Sterling Bancorp | | 1.890 | | JPMorgan Securities, Inc. | | 03/06/20 - 10/26/20 | | | 15 | | | | 44,040 | | | | — | | | | 44,040 | |
Subsea 7 SA | | 2.680 | | JPMorgan Securities, Inc. | | 06/22/20 | | | 5 | | | | (5,965 | ) | | | — | | | | (5,965 | ) |
Suez SA | | 1.840 | | JPMorgan Securities, Inc. | | 10/26/20 | | | 19 | | | | (5,451 | ) | | | — | | | | (5,451 | ) |
Sumitomo Corp. | | 2.630 | | JPMorgan Securities, Inc. | | 10/05/20 - 10/29/20 | | | 19 | | | | (30,771 | ) | | | — | | | | (30,771 | ) |
Sumitomo Heavy Industries Ltd. | | 2.630 | | JPMorgan Securities, Inc. | | 12/12/19 - 03/19/20 | | | 4 | | | | (10,250 | ) | | | — | | | | (10,250 | ) |
Sumitomo Metal Mining Co. Ltd. | | 1.790 | | JPMorgan Securities, Inc. | | 10/15/19 - 05/29/20 | | | 9 | | | | 19,330 | | | | — | | | | 19,330 | |
| | |
| 42 | | The accompanying notes are an integral part of these financial statements. |
GOLDMAN SACHS MULTI-MANAGER ALTERNATIVES FUND
|
| ADDITIONAL INVESTMENT INFORMATION (continued) |
OVER THE COUNTER TOTAL RETURN SWAP CONTRACTS# (continued)
| | | | | | | | | | | | | | | | | | | | | | |
| Reference Obligation/Index(a) | | Financing Rate
Paid (Received)
by the Fund | | Counterparty | | Termination
Date | | Notional
Amount
(000s) | | | Value | | | Upfront
Premiums
(Received)
Paid | | | Unrealized
Appreciation/
(Depreciation) | |
Supernus Pharmaceuticals, Inc. | | 2.680% | | JPMorgan Securities, Inc. | | 05/04/20 - 10/26/20 | | $ | 5 | | | $ | (527 | ) | | $ | — | | | $ | (527 | ) |
Suzuken Co. Ltd. | | 2.630 | | JPMorgan Securities, Inc. | | 11/14/18 - 09/18/20 | | | 8 | | | | 20,551 | | | | — | | | | 20,551 | |
Switch, Inc. Class A | | 1.390 | | JPMorgan Securities, Inc. | | 02/10/20 - 03/06/20 | | | 21 | | | | 3,520 | | | | — | | | | 3,520 | |
Taisei Corp. | | 2.630 | | JPMorgan Securities, Inc. | | 04/13/20 - 07/13/20 | | | 4 | | | | (7,924 | ) | | | — | | | | (7,924 | ) |
Taiwan Semicondt Manufacturing Co. Ltd. | | 1M USD LIBOR | | JPMorgan Securities, Inc. | | 05/05/20 | | | 16 | | | | (59,627 | ) | | | — | | | | (59,627 | ) |
Taiwan Semiconductor Manufacturing Co. Ltd. | | 1M USD LIBOR | | JPMorgan Securities, Inc. | | 05/05/20 | | | 5 | | | | (16,989 | ) | | | — | | | | (16,989 | ) |
Tate & Lyle PLC | | 2.655 | | JPMorgan Securities, Inc. | | 03/16/20 - 10/16/20 | | | 34 | | | | 7,422 | | | | — | | | | 7,422 | |
TCF Financial Corp. | | 2.681 | | JPMorgan Securities, Inc. | | 10/26/20 | | | 13 | | | | (2,745 | ) | | | — | | | | (2,745 | ) |
Technology Select Sector SPDR Fund | | 1M USD LIBOR | | JPMorgan Securities, Inc. | | 11/23/18 | | | 2,421 | | | | 42,843 | | | | — | | | | 42,843 | |
Techtronic Industries Ltd. | | 2.680 | | JPMorgan Securities, Inc. | | 08/24/20 - 10/16/20 | | | 51 | | | | (52,969 | ) | | | — | | | | (52,969 | ) |
Teck Resources Ltd. | | 2.730 | | JPMorgan Securities, Inc. | | 10/15/20 | | | 13 | | | | (34,558 | ) | | | — | | | | (34,558 | ) |
Teladoc, Inc. | | 1.090 | | JPMorgan Securities, Inc. | | 04/23/20 | | | 4 | | | | (26,811 | ) | | | — | | | | (26,811 | ) |
Telenet Group Holding NV | | 1.740 | | JPMorgan Securities, Inc. | | 06/26/20 - 10/16/20 | | | 2 | | | | 4,665 | | | | — | | | | 4,665 | |
Telephone & Data Systems, Inc. | | 2.680 | | JPMorgan Securities, Inc. | | 06/05/19 - 10/15/20 | | | 9 | | | | (81 | ) | | | — | | | | (81 | ) |
Tellurian, Inc. | | (1.610) | | JPMorgan Securities, Inc. | | 09/08/20 - 10/01/20 | | | 21 | | | | 12,070 | | | | — | | | | 12,070 | |
Telstra Corp. Ltd. | | 2.680 | | JPMorgan Securities, Inc. | | 10/16/20 | | | 76 | | | | (740 | ) | | | — | | | | (740 | ) |
Tenable Holdings, Inc. | | 2.681 | | JPMorgan Securities, Inc. | | 10/26/20 | | | 5 | | | | (2,334 | ) | | | — | | | | (2,334 | ) |
Tenet Healthcare Corp. | | 2.680 | | JPMorgan Securities, Inc. | | 04/23/20 - 10/26/20 | | | 8 | | | | 2,013 | | | | — | | | | 2,013 | |
Tenneco, Inc. | | 1.890 | | JPMorgan Securities, Inc. | | 10/26/20 | | | 9 | | | | 2,771 | | | | — | | | | 2,771 | |
Tesla Motors, Inc. | | 0.190 | | JPMorgan Securities, Inc. | | 01/08/20 | | | 1 | | | | (62,015 | ) | | | — | | | | (62,015 | ) |
Tetra Technology, Inc. | | 2.680 | | JPMorgan Securities, Inc. | | 08/10/20 - 10/15/20 | | | 4 | | | | 8,006 | | | | — | | | | 8,006 | |
Teva Pharmaceutical Industries Ltd. ADR | | 2.680 | | JPMorgan Securities, Inc. | | 10/15/20 - 10/26/20 | | | 14 | | | | (8,557 | ) | | | — | | | | (8,557 | ) |
TFI International, Inc. | | 2.730 | | JPMorgan Securities, Inc. | | 07/09/20 - 10/15/20 | | | 9 | | | | 3,887 | | | | — | | | | 3,887 | |
TGS Nopec Geophysical Co. Class A | | 2.680 | | JPMorgan Securities, Inc. | | 06/22/20 | | | 9 | | | | (22,974 | ) | | | — | | | | (22,974 | ) |
The Bank of Kyoto Ltd. | | 2.630 | | JPMorgan Securities, Inc. | | 07/12/19 - 07/24/19 | | | 7 | | | | (40,594 | ) | | | — | | | | (40,594 | ) |
The Cooper Cos., Inc. | | 1.890 | | JPMorgan Securities, Inc. | | 07/20/20 - 10/15/20 | | | 1 | | | | (8,614 | ) | | | — | | | | (8,614 | ) |
The Hain Celestial Group, Inc. | | 1.890 | | JPMorgan Securities, Inc. | | 07/09/20 - 10/15/20 | | | 7 | | | | 2,484 | | | | — | | | | 2,484 | |
The Medicines Co. | | 1.890 | | JPMorgan Securities, Inc. | | 05/10/19 - 10/01/20 | | | 9 | | | | 28,184 | | | | — | | | | 28,184 | |
The Middleby Corp. | | 1.890 | | JPMorgan Securities, Inc. | | 10/31/18 - 10/30/20 | | | 3 | | | | 3,899 | | | | — | | | | 3,899 | |
The Mosaic Co. | | 2.680 | | JPMorgan Securities, Inc. | | 10/01/20 - 10/15/20 | | | 9 | | | | (16,085 | ) | | | — | | | | (16,085 | ) |
The Weir Group PLC | | 1.890 | | JPMorgan Securities, Inc. | | 07/10/20 - 10/26/20 | | | 13 | | | | 8,654 | | | | — | | | | 8,654 | |
Thomson Reuters Corp. | | 1.890 | | JPMorgan Securities, Inc. | | 10/01/20 | | | 1 | | | | (1,570 | ) | | | — | | | | (1,570 | ) |
Thor Industries, Inc. | | 1.890 | | JPMorgan Securities, Inc. | | 07/31/20 - 10/15/20 | | | 3 | | | | 26,070 | | | | — | | | | 26,070 | |
TIS, Inc. | | 2.630 | | JPMorgan Securities, Inc. | | 01/14/20 - 03/30/20 | | | 4 | | | | (10,243 | ) | | | — | | | | (10,243 | ) |
TMX Group, Inc. | | 2.731 | | JPMorgan Securities, Inc. | | 10/26/20 | | | 5 | | | | 3,321 | | | | — | | | | 3,321 | |
Tokyo Electric Power Co. Holdings, Inc. | | 2.630 | | JPMorgan Securities, Inc. | | 07/02/20 - 07/27/20 | | | 72 | | | | (5,792 | ) | | | — | | | | (5,792 | ) |
Tomra Systems | | 2.694 | | JPMorgan Securities, Inc. | | 10/26/20 - 10/29/20 | | | 12 | | | | (317 | ) | | | — | | | | (317 | ) |
Tomtom NV | | 2.680 | | JPMorgan Securities, Inc. | | 08/03/20 - 09/21/20 | | | 19 | | | | 4,490 | | | | — | | | | 4,490 | |
Toyoda Boshoku Cirp | | 2.630 | | JPMorgan Securities, Inc. | | 03/30/20 - 04/13/20 | | | 7 | | | | (8,478 | ) | | | — | | | | (8,478 | ) |
TPG Telecom Ltd. | | 2.680 | | JPMorgan Securities, Inc. | | 09/08/20 - 10/16/20 | | | 29 | | | | (9,878 | ) | | | — | | | | (9,878 | ) |
Transcanada Corp. | | 1.690 | | JPMorgan Securities, Inc. | | 06/25/20 - 10/15/20 | | | 7 | | | | 8,392 | | | | — | | | | 8,392 | |
Transcontinental, Inc. Class A | | 2.730 | | JPMorgan Securities, Inc. | | 07/09/20 | | | 9 | | | | 4,524 | | | | — | | | | 4,524 | |
Transurban Group | | 1.690 | | JPMorgan Securities, Inc. | | 08/13/20 - 10/16/20 | | | 37 | | | | (12,311 | ) | | | — | | | | (12,311 | ) |
Travelport Worldwide Ltd. | | 2.680 | | JPMorgan Securities, Inc. | | 04/23/20 - 10/01/20 | | | 17 | | | | (151 | ) | | | — | | | | (151 | ) |
Trex, Inc. | | 1.890 | | JPMorgan Securities, Inc. | | 10/15/20 | | | 3 | | | | 10,332 | | | | — | | | | 10,332 | |
| | |
| The accompanying notes are an integral part of these financial statements. | | 43 |
GOLDMAN SACHS MULTI-MANAGER ALTERNATIVES FUND
Consolidated Schedule of Investments (continued)
October 31, 2018
|
| ADDITIONAL INVESTMENT INFORMATION (continued) |
OVER THE COUNTER TOTAL RETURN SWAP CONTRACTS# (continued)
| | | | | | | | | | | | | | | | | | | | | | |
| Reference Obligation/Index(a) | | Financing Rate
Paid (Received)
by the Fund | | Counterparty | | Termination
Date | | Notional
Amount
(000s) | | | Value | | | Upfront
Premiums
(Received)
Paid | | | Unrealized
Appreciation/
(Depreciation) | |
TriNet Group, Inc. | | 2.680% | | JPMorgan Securities, Inc. | | 12/09/19 - 03/27/20 | | $ | 2 | | | $ | (3,775 | ) | | $ | — | | | $ | (3,775 | ) |
Trinseo SA | | 2.680 | | JPMorgan Securities, Inc. | | 08/10/20 - 09/18/20 | | | 3 | | | | (14,765 | ) | | | — | | | | (14,765 | ) |
Tryg A/S | | 1.690 | | JPMorgan Securities, Inc. | | 02/03/20 - 04/24/20 | | | 14 | | | | (2,652 | ) | | | — | | | | (2,652 | ) |
TS Tech Co. Ltd. | | 2.630 | | JPMorgan Securities, Inc. | | 01/23/20 | | | 3 | | | | (8,046 | ) | | | — | | | | (8,046 | ) |
Tullow Oil PLC | | 2.655 | | JPMorgan Securities, Inc. | | 06/22/20 | | | 99 | | | | (27,385 | ) | | | — | | | | (27,385 | ) |
Twitter, Inc. | | 1.890 | | JPMorgan Securities, Inc. | | 10/15/20 | | | 6 | | | | (49,871 | ) | | | — | | | | (49,871 | ) |
Ubisoft Entertainment SA | | 2.680 | | JPMorgan Securities, Inc. | | 06/22/20 - 10/16/20 | | | 3 | | | | (29,911 | ) | | | — | | | | (29,911 | ) |
Under Armour, Inc. Class A | | 1.490 | | JPMorgan Securities, Inc. | | 10/15/20 | | | 13 | | | | (51,369 | ) | | | — | | | | (51,369 | ) |
Unione di Banche Italiane SpA | | 1.840 | | JPMorgan Securities, Inc. | | 06/26/20 - 10/16/20 | | | 65 | | | | 27,240 | | | | — | | | | 27,240 | |
Unipolsai SpA | | 2.680 | | JPMorgan Securities, Inc. | | 10/02/20 | | | 93 | | | | (2,129 | ) | | | — | | | | (2,129 | ) |
United Internet AG | | 1.840 | | JPMorgan Securities, Inc. | | 08/24/20 - 10/16/20 | | | 7 | | | | 3,912 | | | | — | | | | 3,912 | |
United States Cellular Corp. | | 2.680 | | JPMorgan Securities, Inc. | | 12/24/18 - 05/23/19 | | | 7 | | | | 14,472 | | | | — | | | | 14,472 | |
Universal Display Corp. | | 1.390 | | JPMorgan Securities, Inc. | | 12/16/19 | | | 2 | | | | (33,170 | ) | | | — | | | | (33,170 | ) |
| | 1M USD LIBOR | | JPMorgan Securities, Inc. | | 05/05/20 | | | 3 | | | | 18,313 | | | | — | | | | 18,313 | |
Universal Entertainment Corp. | | (0.060) | | JPMorgan Securities, Inc. | | 01/14/20 - 01/23/20 | | | 3 | | | | 2,385 | | | | — | | | | 2,385 | |
Urban Outfitters, Inc. | | 2.680 | | JPMorgan Securities, Inc. | | 10/01/20 - 10/26/20 | | | 7 | | | | 9,142 | | | | — | | | | 9,142 | |
Valmet Oyj | | 2.680 | | JPMorgan Securities, Inc. | | 10/31/19 - 01/22/20 | | | 16 | | | | 18,834 | | | | — | | | | 18,834 | |
Valvoline, Inc. | | 1.890 | | JPMorgan Securities, Inc. | | 11/21/19 - 12/02/19 | | | 15 | | | | (3,886 | ) | | | — | | | | (3,886 | ) |
Veeva Systems, Inc. Class A | | 2.680 | | JPMorgan Securities, Inc. | | 03/09/20 - 10/26/20 | | | 3 | | | | 5,797 | | | | — | | | | 5,797 | |
Veoneer, Inc. | | 1.890 | | JPMorgan Securities, Inc. | | 07/06/20 - 10/26/20 | | | 5 | | | | 59,236 | | | | — | | | | 59,236 | |
Verbund AG | | 2.680 | | JPMorgan Securities, Inc. | | 10/02/20 | | | 6 | | | | (27,411 | ) | | | — | | | | (27,411 | ) |
Verint System, Inc. | | 2.681 | | JPMorgan Securities, Inc. | | 10/26/20 | | | 6 | | | | 1,038 | | | | — | | | | 1,038 | |
Vermilion Energy, Inc. | | 1.890 | | JPMorgan Securities, Inc. | | 02/10/20 - 10/26/20 | | | 10 | | | | 35,463 | | | | — | | | | 35,463 | |
ViaSat, Inc. | | 1.240 | | JPMorgan Securities, Inc. | | 12/05/18 - 10/19/20 | | | 5 | | | | (6,306 | ) | | | — | | | | (6,306 | ) |
Visteon Corp. | | 1.890 | | JPMorgan Securities, Inc. | | 10/26/20 | | | — | * | | | 153 | | | | — | | | | 153 | |
Voya Financial, Inc. | | 2.680 | | JPMorgan Securities, Inc. | | 12/05/18 - 07/02/20 | | | 7 | | | | (24,331 | ) | | | — | | | | (24,331 | ) |
Wabtec Corp. | | 1.890 | | JPMorgan Securities, Inc. | | 08/24/20 - 10/26/20 | | | 3 | | | | 40,601 | | | | — | | | | 40,601 | |
Wall-Mart Stores, Inc. | | 1M USD LIBOR | | JPMorgan Securities, Inc. | | 11/23/18 | | | 699 | | | | (37,027 | ) | | | — | | | | (37,027 | ) |
Wartsila Corp. Class B | | 1.690 | | JPMorgan Securities, Inc. | | 08/13/20 - 10/26/20 | | | 18 | | | | (5,288 | ) | | | — | | | | (5,288 | ) |
Wayfair, Inc. Class A | | 1.530 | | JPMorgan Securities, Inc. | | 11/21/19 - 10/01/20 | | | 2 | | | | 9,807 | | | | — | | | | 9,807 | |
Weatherford International PLC | | 1.890 | | JPMorgan Securities, Inc. | | 03/04/19 - 10/26/20 | | | 90 | | | | 107,058 | | | | — | | | | 107,058 | |
Welbilt, Inc. | | 1.890 | | JPMorgan Securities, Inc. | | 08/24/20 - 10/15/20 | | | 16 | | | | 4,940 | | | | — | | | | 4,940 | |
WellCare Health Plans, Inc. | | 2.680 | | JPMorgan Securities, Inc. | | 06/29/20 - 08/06/20 | | | 1 | | | | (31,287 | ) | | | — | | | | (31,287 | ) |
Wesco International, Inc. | | 2.680 | | JPMorgan Securities, Inc. | | 12/16/19 - 01/08/20 | | | 6 | | | | (11,574 | ) | | | — | | | | (11,574 | ) |
West Fraser Timber Co. Ltd. | | 2.730 | | JPMorgan Securities, Inc. | | 06/11/20 | | | 3 | | | | 2,013 | | | | — | | | | 2,013 | |
Westpac BKG Corp. | | 1.690 | | JPMorgan Securities, Inc. | | 10/16/20 | | | 11 | | | | (2,900 | ) | | | — | | | | (2,900 | ) |
Whiting Pete Corp. | | 2.680 | | JPMorgan Securities, Inc. | | 10/15/20 | | | 3 | | | | (16,492 | ) | | | — | | | | (16,492 | ) |
Wingstop, Inc. | | 2.681 | | JPMorgan Securities, Inc. | | 10/26/20 | | | 3 | | | | (20,586 | ) | | | — | | | | (20,586 | ) |
Wisetech Global | | 0.940 | | JPMorgan Securities, Inc. | | 10/02/20 - 10/16/20 | | | 12 | | | | 11,277 | | | | — | | | | 11,277 | |
Wix.com Ltd. | | 2.680 | | JPMorgan Securities, Inc. | | 02/24/20 - 10/01/20 | | | 2 | | | | 9,562 | | | | — | | | | 9,562 | |
Woodside Petroleum Ltd | | 2.680 | | JPMorgan Securities, Inc. | | 10/02/20 | | | 10 | | | | (12,582 | ) | | | — | | | | (12,582 | ) |
Wright Medical Group NV | | 1.890 | | JPMorgan Securities, Inc. | | 04/23/20 | | | 12 | | | | (2,542 | ) | | | — | | | | (2,542 | ) |
WSP Global, Inc. | | 2.730 | | JPMorgan Securities, Inc. | | 07/31/20 - 10/15/20 | | | 6 | | | | 431 | | | | — | | | | 431 | |
Wynn Macau Ltd. | | 1.690 | | JPMorgan Securities, Inc. | | 10/05/20 - 10/16/20 | | | 98 | | | | (2,339 | ) | | | — | | | | (2,339 | ) |
Wynn Resorts Ltd. | | 1.890 | | JPMorgan Securities, Inc. | | 07/20/20 - 10/15/20 | | | 2 | | | | 37,138 | | | | — | | | | 37,138 | |
Xero Ltd. | | 2.680 | | JPMorgan Securities, Inc. | | 10/02/20 | | | 2 | | | | (4,426 | ) | | | — | | | | (4,426 | ) |
Yahoo Japan Corp. | | 1.890 | | JPMorgan Securities, Inc. | | 10/19/20 | | | 23 | | | | 5,404 | | | | — | | | | 5,404 | |
Yara International ASA | | 1.690 | | JPMorgan Securities, Inc. | | 06/26/20 - 10/16/20 | | | 5 | | | | 19,044 | | | | — | | | | 19,044 | |
Yelp, Inc. | | 2.680 | | JPMorgan Securities, Inc. | | 08/24/20 | | | 2 | | | | 1,978 | | | | — | | | | 1,978 | |
Zebra Technologies Corp. Class A | | 2.680 | | JPMorgan Securities, Inc. | | 03/16/20 - 04/23/20 | | | 2 | | | | 27,272 | | | | — | | | | 27,272 | |
| | |
| 44 | | The accompanying notes are an integral part of these financial statements. |
GOLDMAN SACHS MULTI-MANAGER ALTERNATIVES FUND
|
| ADDITIONAL INVESTMENT INFORMATION (continued) |
OVER THE COUNTER TOTAL RETURN SWAP CONTRACTS# (continued)
| | | | | | | | | | | | | | | | | | | | | | |
| Reference Obligation/Index(a) | | Financing Rate
Paid (Received)
by the Fund | | Counterparty | | Termination
Date | | Notional
Amount
(000s) | | | Value | | | Upfront
Premiums
(Received)
Paid | | | Unrealized
Appreciation/
(Depreciation) | |
Zillow Group, Inc. Class C | | 1.890% | | JPMorgan Securities, Inc. | | 06/11/20 - 10/15/20 | | $ | 5 | | | $ | (11,049 | ) | | $ | — | | | $ | (11,049 | ) |
Zogenix, Inc. | | 1.890 | | JPMorgan Securities, Inc. | | 07/20/20 - 10/01/20 | | | 3 | | | | (8,121 | ) | | | — | | | | (8,121 | ) |
Zscaler, Inc. | | | | | | | | | | | | | | | | | | | | | | |
| | 1M USD LIBOR | | JPMorgan Securities, Inc. | | 05/05/20 | | | 5 | | | | (3,787 | ) | | | — | | | | (3,787 | ) |
| | 0.490 | | JPMorgan Securities, Inc. | | 06/25/20 - 06/26/20 | | | 3 | | | | (4,758 | ) | | | — | | | | (4,758 | ) |
Accenture PLC Class A | | 1M USD LIBOR | | MS & Co. Int. PLC | | 05/15/20 | | | — | * | | | (303 | ) | | | — | | | | (303 | ) |
Adobe Systems, Inc. | | 1M USD LIBOR | | MS & Co. Int. PLC | | 05/15/20 | | | 1 | | | | 7,108 | | | | — | | | | 7,108 | |
Advanced Micro Devices, Inc. | | 1M USD LIBOR | | MS & Co. Int. PLC | | 05/15/20 | | | 1 | | | | (4,315 | ) | | | — | | | | (4,315 | ) |
Aetna, Inc. | | 2.200 | | MS & Co. Int. PLC | | 02/03/20 | | | 19 | | | | (5,228 | ) | | | — | | | | (5,228 | ) |
Alliance Data Systems Corp. | | 1M USD LIBOR | | MS & Co. Int. PLC | | 05/15/20 | | | 7 | | | | (31,285 | ) | | | — | | | | (31,285 | ) |
Alphabet, Inc. Class A | | 1M USD LIBOR | | MS & Co. Int. PLC | | 05/15/20 | | | 1 | | | | (10,503 | ) | | | — | | | | (10,503 | ) |
Alphabet, Inc. Class C | | 1M USD LIBOR | | MS & Co. Int. PLC | | 05/15/20 | | | 1 | | | | (14,088 | ) | | | — | | | | (14,088 | ) |
Amazon.com, Inc. | | 1M USD LIBOR | | MS & Co. Int. PLC | | 05/15/20 | | | 1 | | | | (189,560 | ) | | | — | | | | (189,560 | ) |
Amgen | | 1M USD LIBOR | | MS & Co. Int. PLC | | 05/31/19 | | | 529 | | | | 14,741 | | | | — | | | | 14,741 | |
Atento SA | | 1M USD LIBOR | | MS & Co. Int. PLC | | 05/15/20 | | | 30 | | | | (25,647 | ) | | | — | | | | (25,647 | ) |
Atlassian Corp. PLC Class A | | 1M USD LIBOR | | MS & Co. Int. PLC | | 05/15/20 | | | 3 | | | | (10,387 | ) | | | — | | | | (10,387 | ) |
Automatic Data Processing, Inc. | | 1M USD LIBOR | | MS & Co. Int. PLC | | 05/15/20 | | | 1 | | | | 1,848 | | | | — | | | | 1,848 | |
Blackbaud, Inc. | | 1M USD LIBOR | | MS & Co. Int. PLC | | 05/15/20 | | | 1 | | | | (465 | ) | | | — | | | | (465 | ) |
Booking Holdings, Inc. | | 1M USD LIBOR | | MS & Co. Int. PLC | | 05/15/20 | | | — | * | | | 19,998 | | | | — | | | | 19,998 | |
Broadcom, Inc. | | 1M USD LIBOR | | MS & Co. Int. PLC | | 05/15/20 | | | 1 | | | | (9,723 | ) | | | — | | | | (9,723 | ) |
Chroma Ate, Inc. | | 1M USD LIBOR | | MS & Co. Int. PLC | | 05/15/20 | | | 67 | | | | (45,427 | ) | | | — | | | | (45,427 | ) |
Consumer Discretionary Select Sector SPDR ETF | | 1M USD LIBOR | | MS & Co. Int. PLC | | 05/15/20 | | | 483 | | | | 13,428 | | | | — | | | | 13,428 | |
CoStar Group, Inc. | | 1M USD LIBOR | | MS & Co. Int. PLC | | 05/15/20 | | | 1 | | | | (27,135 | ) | | | — | | | | (27,135 | ) |
CVS Corp. | | 2.200 | | MS & Co. Int. PLC | | 02/03/20 | | | 16 | | | | 3,649 | | | | — | | | | 3,649 | |
Edenred SA | | 1M EUR LIBOR | | MS & Co. Int. PLC | | 05/15/20 | | | 1 | | | | 4,031 | | | | — | | | | 4,031 | |
EPAM Systems, Inc. | | 1M USD LIBOR | | MS & Co. Int. PLC | | 05/15/20 | | | 6 | | | | 5,042 | | | | — | | | | 5,042 | |
Equifax, Inc. | | 1M USD LIBOR | | MS & Co. Int. PLC | | 05/15/20 | | | 13 | | | | (289,961 | ) | | | — | | | | (289,961 | ) |
ETFMG Prime Cyber Security ETF | | 1M USD LIBOR | | MS & Co. Int. PLC | | 05/15/20 | | | 1,731 | | | | 13,345 | | | | — | | | | 13,345 | |
Exlservice Holdings, Inc. | | 1M USD LIBOR | | MS & Co. Int. PLC | | 05/15/20 | | | 17 | | | | 70,333 | | | | — | | | | 70,333 | |
Expedia Group, Inc | | 1M USD LIBOR | | MS & Co. Int. PLC | | 05/15/20 | | | 6 | | | | 40,130 | | | | — | | | | 40,130 | |
Experian PLC | | 1M GBP LIBOR | | MS & Co. Int. PLC | | 05/15/20 | | | 32 | | | | 28,112 | | | | — | | | | 28,112 | |
Exxon Mobil Corp. | | 1M USD LIBOR | | MS & Co. Int. PLC | | 11/23/18 | | | 470 | | | | 4,934 | | | | — | | | | 4,934 | |
Facebook, Inc. Class A | | 1M USD LIBOR | | MS & Co. Int. PLC | | 05/15/20 | | | 5 | | | | (9,902 | ) | | | — | | | | (9,902 | ) |
FleetCor Technologies, Inc. | | 1M USD LIBOR | | MS & Co. Int. PLC | | 05/15/20 | | | 10 | | | | (90,209 | ) | | | — | | | | (90,209 | ) |
Flex Ltd. | | 1M USD LIBOR | | MS & Co. Int. PLC | | 05/15/20 | | | 78 | | | | (319,710 | ) | | | — | | | | (319,710 | ) |
FormFactor, Inc. | | 1M USD LIBOR | | MS & Co. Int. PLC | | 05/15/20 | | | 37 | | | | (6,904 | ) | | | — | | | | (6,904 | ) |
Genpact Ltd. | | 1M USD LIBOR | | MS & Co. Int. PLC | | 05/15/20 | | | 28 | | | | (20,285 | ) | | | — | | | | (20,285 | ) |
Global Payments, Inc. | | 1M USD LIBOR | | MS & Co. Int. PLC | | 05/15/20 | | | 19 | | | | (28,431 | ) | | | — | | | | (28,431 | ) |
GoDaddy, Inc. Class A | | 1M USD LIBOR | | MS & Co. Int. PLC | | 05/15/20 | | | 12 | | | | (22,709 | ) | | | — | | | | (22,709 | ) |
Guidewire Software, Inc. | | 1M USD LIBOR | | MS & Co. Int. PLC | | 05/15/20 | | | 2 | | | | 257 | | | | — | | | | 257 | |
Harris Corp. | | 1M USD LIBOR | | MS & Co. Int. PLC | | 05/15/20 | | | 6 | | | | (146,721 | ) | | | — | | | | (146,721 | ) |
HubSpot, Inc. | | 1M USD LIBOR | | MS & Co. Int. PLC | | 05/15/20 | | | 4 | | | | 22,795 | | | | — | | | | 22,795 | |
Huron Consulting Group, Inc. | | 1M USD LIBOR | | MS & Co. Int. PLC | | 05/15/20 | | | 6 | | | | 47,203 | | | | — | | | | 47,203 | |
Intuit, Inc. | | 1M USD LIBOR | | MS & Co. Int. PLC | | 05/15/20 | | | — | * | | | 817 | | | | — | | | | 817 | |
Invesco QQQ Trust Series 1 ETF | | 1M USD LIBOR | | MS & Co. Int. PLC | | 05/15/20 | | | 2,775 | | | | 42,545 | | | | — | | | | 42,545 | |
iShares Core S&P Small-Capital ETF | | 1M USD LIBOR | | MS & Co. Int. PLC | | 05/15/20 | | | 2,149 | | | | 46,275 | | | | — | | | | 46,275 | |
iShares Edge MSCI USA Momentum Factor ETF | | 1M USD LIBOR | | MS & Co. Int. PLC | | 05/15/20 | | | 2,352 | | | | 47,456 | | | | — | | | | 47,456 | |
| | |
| The accompanying notes are an integral part of these financial statements. | | 45 |
GOLDMAN SACHS MULTI-MANAGER ALTERNATIVES FUND
Consolidated Schedule of Investments (continued)
October 31, 2018
|
| ADDITIONAL INVESTMENT INFORMATION (continued) |
OVER THE COUNTER TOTAL RETURN SWAP CONTRACTS# (continued)
| | | | | | | | | | | | | | | | | | | | | | |
| Reference Obligation/Index(a) | | Financing Rate
Paid (Received)
by the Fund | | Counterparty | | Termination
Date | | Notional
Amount
(000s) | | | Value | | | Upfront
Premiums
(Received)
Paid | | | Unrealized
Appreciation/
(Depreciation) | |
iShares North America Technology ETF | | 1M USD LIBOR | | MS & Co. Int. PLC | | 05/15/20 | | $ | 539 | | | $ | 9,502 | | | $ | — | | | $ | 9,502 | |
iShares North American Technology-Multimedia Networking ETF | | 1M USD LIBOR | | MS & Co. Int. PLC | | 05/15/20 | | | 847 | | | | 11,648 | | | | — | | | | 11,648 | |
iShares PHLX Semiconductor ETF | | 1M USD LIBOR | | MS & Co. Int. PLC | | 05/15/20 | | | 4,781 | | | | 150,667 | | | | — | | | | 150,667 | |
iShares Russell 1000 ETF | | 1M USD LIBOR | | MS & Co. Int. PLC | | 11/23/18 | | | 2,098 | | | | 140,040 | | | | — | | | | 140,040 | |
iShares Russell 2000 Growth ETF | | 1M USD LIBOR | | MS & Co. Int. PLC | | 05/15/20 | | | 2,678 | | | | 70,481 | | | | — | | | | 70,481 | |
iShares Russell Mid-Capital Growth ETF | | 1M USD LIBOR | | MS & Co. Int. PLC | | 05/15/20 | | | 923 | | | | 13,976 | | | | — | | | | 13,976 | |
iShares S&P NA Technology ETF | | 1M USD LIBOR | | MS & Co. Int. PLC | | 05/15/20 | | | 2,926 | | | | 51,639 | | | | — | | | | 51,639 | |
iShares S&P NA Technology-Multimedia Networking ETF | | 1M USD LIBOR | | MS & Co. Int. PLC | | 05/15/20 | | | 1,813 | | | | (13,731 | ) | | | (5,728 | ) | | | (8,003 | ) |
iShares S&P NA Technology-Software ETF | | 1M USD LIBOR | | MS & Co. Int. PLC | | 05/15/20 | | | 1,661 | | | | 11,681 | | | | — | | | | 11,681 | |
iShares S&P Small-Capital 600 Growth ETF | | 1M USD LIBOR | | MS & Co. Int. PLC | | 05/15/20 | | | 1,152 | | | | 16,846 | | | | — | | | | 16,846 | |
iShares U.S. Real Estate ETF | | 1M USD LIBOR | | MS & Co. Int. PLC | | 11/23/18 | | | 382 | | | | 21,096 | | | | 764 | | | | 20,332 | |
iShares U.S. Technology ETF | | 1M USD LIBOR | | MS & Co. Int. PLC | | 05/15/20 | | | 1,962 | | | | 20,545 | | | | — | | | | 20,545 | |
Just Eat PLC | | 1M GBP LIBOR | | MS & Co. Int. PLC | | 05/15/20 | | | 9 | | | | (1,615 | ) | | | — | | | | (1,615 | ) |
Marvell Technology Group Ltd. | | 1M USD LIBOR | | MS & Co. Int. PLC | | 05/15/20 | | | 57 | | | | (96,464 | ) | | | — | | | | (96,464 | ) |
Mastercard, Inc. Class A | | 1M USD LIBOR | | MS & Co. Int. PLC | | 05/15/20 | | | 5 | | | | (12,697 | ) | | | — | | | | (12,697 | ) |
Microchip Technology, Inc. | | 1M USD LIBOR | | MS & Co. Int. PLC | | 05/15/20 | | | — | * | | | (365 | ) | | | — | | | | (365 | ) |
Microsoft Corp. | | 1M USD LIBOR | | MS & Co. Int. PLC | | 05/15/20 | | | 1 | | | | (517 | ) | | | — | | | | (517 | ) |
Motorola Solutions, Inc. | | 1M USD LIBOR | | MS & Co. Int. PLC | | 05/15/20 | | | 5 | | | | 10,554 | | | | — | | | | 10,554 | |
Netflix, Inc. | | 1M USD LIBOR | | MS & Co. Int. PLC | | 05/15/20 | | | 2 | | | | (77,009 | ) | | | — | | | | (77,009 | ) |
Nex Group PLC | | 0.720% | | MS & Co. Int. PLC | | 12/20/19 | | | 210 | | | | 160,505 | | | | — | | | | 160,505 | |
PayPal Holdings, Inc. | | 1M USD LIBOR | | MS & Co. Int. PLC | | 05/15/20 | | | 17 | | | | 122,273 | | | | — | | | | 122,273 | |
Salesforce.com, Inc. | | 1M USD LIBOR | | MS & Co. Int. PLC | | 05/15/20 | | | 7 | | | | (35,155 | ) | | | — | | | | (35,155 | ) |
Scor SE | | (0.340) | | MS & Co. Int. PLC | | 12/20/19 | | | 6 | | | | (5,603 | ) | | | — | | | | (5,603 | ) |
ServiceNow, Inc. | | 1M USD LIBOR | | MS & Co. Int. PLC | | 05/15/20 | | | 4 | | | | (899 | ) | | | — | | | | (899 | ) |
SPDR S&P 500 ETF | | 1M USD LIBOR | | MS & Co. Int. PLC | | 05/15/20 | | | 141 | | | | 2,132 | | | | — | | | | 2,132 | |
SPDR S&P MidCap 400 ETF | | 1M USD LIBOR | | MS & Co. Int. PLC | | 05/15/20 | | | 1,271 | | | | 37,790 | | | | — | | | | 37,790 | |
SPDR S&P Regional Banking ETF | | 1M USD LIBOR | | MS & Co. Int. PLC | | 11/23/18 | | | 507 | | | | 76,247 | | | | 1,452 | | | | 74,795 | |
Spotify Technology SA | | 1M USD LIBOR | | MS & Co. Int. PLC | | 05/15/20 | | | 1 | | | | (6,072 | ) | | | — | | | | (6,072 | ) |
Total System Services, Inc. | | 1M USD LIBOR | | MS & Co. Int. PLC | | 05/15/20 | | | 14 | | | | (21,296 | ) | | | — | | | | (21,296 | ) |
TransUnion | | 1M USD LIBOR | | MS & Co. Int. PLC | | 05/15/20 | | | 14 | | | | (32,083 | ) | | | — | | | | (32,083 | ) |
TriNet Group, Inc. | | 1M USD LIBOR | | MS & Co. Int. PLC | | 05/15/20 | | | 29 | | | | (49,464 | ) | | | — | | | | (49,464 | ) |
Trupanion, Inc. | | 1M USD LIBOR | | MS & Co. Int. PLC | | 05/15/20 | | | 19 | | | | (54,826 | ) | | | — | | | | (54,826 | ) |
Universal Display Corp. | | 1M USD LIBOR | | MS & Co. Int. PLC | | 05/15/20 | | | 1 | | | | 7,360 | | | | — | | | | 7,360 | |
Vanguard Small-Capital Growth ETF | | 1M USD LIBOR | | MS & Co. Int. PLC | | 05/15/20 | | | 2,657 | | | | 67,342 | | | | — | | | | 67,342 | |
VeriSign, Inc. | | 1M USD LIBOR | | MS & Co. Int. PLC | | 05/15/20 | | | 6 | | | | (1,600 | ) | | | — | | | | (1,600 | ) |
Visa, Inc. Class A | | 1M USD LIBOR | | MS & Co. Int. PLC | | 05/15/20 | | | 11 | | | | 4,150 | | | | — | | | | 4,150 | |
WEX, Inc. | | 1M USD LIBOR | | MS & Co. Int. PLC | | 05/15/20 | | | 11 | | | | (84,509 | ) | | | — | | | | (84,509 | ) |
Workday, Inc. Class A | | 1M USD LIBOR | | MS & Co. Int. PLC | | 05/15/20 | | | 1 | | | | 3,972 | | | | — | | | | 3,972 | |
2U, Inc. | | 2.173 | | UBS AG (London) | | 12/14/18 | | | 11 | | | | (40,065 | ) | | | — | | | | (40,065 | ) |
| | |
| 46 | | The accompanying notes are an integral part of these financial statements. |
GOLDMAN SACHS MULTI-MANAGER ALTERNATIVES FUND
|
| ADDITIONAL INVESTMENT INFORMATION (continued) |
OVER THE COUNTER TOTAL RETURN SWAP CONTRACTS# (continued)
| | | | | | | | | | | | | | | | | | | | | | |
| Reference Obligation/Index(a) | | Financing Rate
Paid (Received)
by the Fund | | Counterparty | | Termination
Date | | Notional
Amount
(000s) | | | Value | | | Upfront
Premiums
(Received)
Paid | | | Unrealized
Appreciation/
(Depreciation) | |
AAC Technologies Holding, Inc. | | 1.019% | | UBS AG (London) | | 12/14/18 | | $ | 65 | | | $ | (14,474 | ) | | $ | — | | | $ | (14,474 | ) |
Accor SA | | (0.456) | | UBS AG (London) | | 12/14/18 | | | 12 | | | | (3,320 | ) | | | — | | | | (3,320 | ) |
Acs Actividades De Construccion Y Servicios SA | | (0.456) | | UBS AG (London) | | 05/02/19 | | | 17 | | | | (4,095 | ) | | | — | | | | (4,095 | ) |
Adidas AG | | (0.456) | | UBS AG (London) | | 12/14/18 | | | 3 | | | | 4,808 | | | | — | | | | 4,808 | |
AEON Co. Ltd. | | (0.101) | | UBS AG (London) | | 12/14/18 | | | 27 | | | | (4,762 | ) | | | — | | | | (4,762 | ) |
Aeon Mall Co. Ltd. | | (0.101) | | UBS AG (London) | | 12/14/18 | | | 39 | | | | 21,101 | | | | — | | | | 21,101 | |
Agco Corp. | | 2.307 | | UBS AG (London) | | 12/14/18 | | | 9 | | | | 37,605 | | | | — | | | | 37,605 | |
Ageas SA | | (0.456) | | UBS AG (London) | | 12/14/18 | | | 12 | | | | 7,356 | | | | — | | | | 7,356 | |
Agilent Technologies, Inc. | | 2.307 | | UBS AG (London) | | 12/14/18 | | | 10 | | | | 25,850 | | | | — | | | | 25,850 | |
Air Lease Corp. | | 2.173 | | UBS AG (London) | | 12/14/18 | | | 15 | | | | (17,942 | ) | | | — | | | | (17,942 | ) |
Airbus SE | | (0.456) | | UBS AG (London) | | 12/14/18 | | | 6 | | | | (9,038 | ) | | | — | | | | (9,038 | ) |
Aisin SEiki Co. Ltd. | | (0.101) | | UBS AG (London) | | 12/14/18 | | | 15 | | | | (5,661 | ) | | | — | | | | (5,661 | ) |
Allison Transmission Holdings, Inc. | | 2.307 | | UBS AG (London) | | 12/14/18 | | | 13 | | | | 1,957 | | | | — | | | | 1,957 | |
Alphabet, Inc. Class A | | 2.307 | | UBS AG (London) | | 12/14/18 | | | 1 | | | | 31,344 | | | | — | | | | 31,344 | |
ALS Ltd. | | 1.850 | | UBS AG (London) | | 12/14/18 | | | 95 | | | | 18,289 | | | | — | | | | 18,289 | |
Altice USA, Inc. | | 2.307 | | UBS AG (London) | | 12/14/18 | | | 35 | | | | 59,983 | | | | — | | | | 59,983 | |
Amern Eagle Outfitters, Inc. | | 2.307 | | UBS AG (London) | | 12/14/18 | | | 29 | | | | (5,782 | ) | | | — | | | | (5,782 | ) |
Ametek, Inc. | | 2.307 | | UBS AG (London) | | 12/14/18 | | | 9 | | | | 12,217 | | | | — | | | | 12,217 | |
Amorepacific Corp. | | 2.307 | | UBS AG (London) | | 12/14/18 | | | 2 | | | | 8,987 | | | | — | | | | 8,987 | |
AMP Ltd. | | 1.850 | | UBS AG (London) | | 12/14/18 | | | 370 | | | | (32,652 | ) | | | — | | | | (32,652 | ) |
Analog Devices | | 2.173 | | UBS AG (London) | | 12/14/18 | | | 7 | | | | (22,903 | ) | | | — | | | | (22,903 | ) |
Andritz AG | | (0.456) | | UBS AG (London) | | 12/14/18 | | | 12 | | | | (14,297 | ) | | | — | | | | (14,297 | ) |
Anhui Conch Cement Co. Ltd. | | 1.019 | | UBS AG (London) | | 12/14/18 | | | 130 | | | | 18,135 | | | | — | | | | 18,135 | |
Ap Moeller – Maersk A/S | | (0.405) | | UBS AG (London) | | 12/14/18 | | | — | * | | | (4,357 | ) | | | — | | | | (4,357 | ) |
Aperam SA | | (0.456) | | UBS AG (London) | | 12/14/18 | | | 10 | | | | (10,920 | ) | | | — | | | | (10,920 | ) |
Archer-Daniels-Midland Co. | | 2.307 | | UBS AG (London) | | 12/14/18 | | | 13 | | | | 3,050 | | | | — | | | | 3,050 | |
Aristocrat Leisure Ltd. | | 1.850 | | UBS AG (London) | | 12/14/18 | | | 28 | | | | 6,240 | | | | — | | | | 6,240 | |
Ashtead Group PLC | | 0.691 | | UBS AG (London) | | 12/14/18 | | | 22 | | | | 22,681 | | | | — | | | | 22,681 | |
ASM Pacific Technology Ltd. | | 1.189 | | UBS AG (London) | | 12/14/18 | | | 9 | | | | (4,784 | ) | | | — | | | | (4,784 | ) |
ASML Holding NV | | (0.456) | | UBS AG (London) | | 12/14/18 | | | 3 | | | | 18,542 | | | | — | | | | 18,542 | |
Astellas Pharma, Inc. | | (0.068) | | UBS AG (London) | | 12/14/18 | | | 39 | | | | 10,026 | | | | — | | | | 10,026 | |
Astrazeneca PLC | | 0.691 | | UBS AG (London) | | 12/14/18 | | | 9 | | | | (13,806 | ) | | | — | | | | (13,806 | ) |
Asustek Computer, Inc. | | 2.307 | | UBS AG (London) | | 12/14/18 | | | 78 | | | | (1,214 | ) | | | — | | | | (1,214 | ) |
Athenahealth, Inc. | | 2.307 | | UBS AG (London) | | 12/14/18 | | | 1 | | | | 4,115 | | | | — | | | | 4,115 | |
Atos SE | | (0.456) | | UBS AG (London) | | 12/14/18 | | | 2 | | | | (1,986 | ) | | | — | | | | (1,986 | ) |
Axfood AB | | (0.462) | | UBS AG (London) | | 12/14/18 | | | 45 | | | | 11,103 | | | | — | | | | 11,103 | |
Axon Enterprise, Inc. | | 2.173 | | UBS AG (London) | | 12/14/18 | | | 11 | | | | (62,176 | ) | | | — | | | | (62,176 | ) |
Babcock International Group | | 0.691 | | UBS AG (London) | | 12/14/18 | | | 65 | | | | (4,001 | ) | | | — | | | | (4,001 | ) |
BAE Systems PLC | | 0.691 | | UBS AG (London) | | 12/14/18 | | | 81 | | | | (12,339 | ) | | | — | | | | (12,339 | ) |
Ball Corp. | | 2.173 | | UBS AG (London) | | 12/14/18 | | | 17 | | | | (16,132 | ) | | | — | | | | (16,132 | ) |
Bankinter | | (0.456) | | UBS AG (London) | | 05/02/19 | | | 9 | | | | 1,103 | | | | — | | | | 1,103 | |
Bayerische Motoren Werke AG | | (0.456) | | UBS AG (London) | | 12/14/18 | | | 7 | | | | 4,333 | | | | — | | | | 4,333 | |
Beacon Roofing Supply, Inc. | | 2.173 | | UBS AG (London) | | 12/14/18 | | | 13 | | | | (34,030 | ) | | | — | | | | (34,030 | ) |
Becton Dickinson & Co. | | 2.173 | | UBS AG (London) | | 12/14/18 | | | 2 | | | | (4,721 | ) | | | — | | | | (4,721 | ) |
Beiersdorf AG | | (0.456) | | UBS AG (London) | | 12/14/18 | | | 5 | | | | (10,940 | ) | | | — | | | | (10,940 | ) |
Beijing Enterprises Holdings | | 0.000 | | UBS AG (London) | | 12/14/18 | | | 19 | | | | 960 | | | | — | | | | 960 | |
Berkeley Group Holdings PLC | | 0.691 | | UBS AG (London) | | 12/14/18 | | | 13 | | | | 19,126 | | | | — | | | | 19,126 | |
BIO Rad Laboratories, Inc. Class A | | 2.307 | | UBS AG (London) | | 12/14/18 | | | 2 | | | | 15,231 | | | | — | | | | 15,231 | |
| | |
| The accompanying notes are an integral part of these financial statements. | | 47 |
GOLDMAN SACHS MULTI-MANAGER ALTERNATIVES FUND
Consolidated Schedule of Investments (continued)
October 31, 2018
|
| ADDITIONAL INVESTMENT INFORMATION (continued) |
OVER THE COUNTER TOTAL RETURN SWAP CONTRACTS# (continued)
| | | | | | | | | | | | | | | | | | | | | | |
| Reference Obligation/Index(a) | | Financing Rate
Paid (Received)
by the Fund | | Counterparty | | Termination
Date | | Notional
Amount
(000s) | | | Value | | | Upfront
Premiums
(Received)
Paid | | | Unrealized
Appreciation/
(Depreciation) | |
Block H & R, Inc. | | 2.307% | | UBS AG (London) | | 12/14/18 | | $ | 25 | | | $ | 20,205 | | | $ | — | | | $ | 20,205 | |
Blueprint Medicines Corp. | | 2.307 | | UBS AG (London) | | 12/14/18 | | | 4 | | | | (3,291 | ) | | | — | | | | (3,291 | ) |
Bluescope Steel Ltd. | | 1.850 | | UBS AG (London) | | 12/14/18 | | | 62 | | | | 11,195 | | | | — | | | | 11,195 | |
BOC Aviation Ltd. | | 1.019 | | UBS AG (London) | | 12/14/18 | | | 66 | | | | (12,592 | ) | | | — | | | | (12,592 | ) |
Boliden AB | | (0.462) | | UBS AG (London) | | 12/14/18 | | | 15 | | | | 17,318 | | | | — | | | | 17,318 | |
Bridgestone Corp. | | (0.101) | | UBS AG (London) | | 12/14/18 | | | 9 | | | | (7,444 | ) | | | — | | | | (7,444 | ) |
Brilliance China Automotive | | 1.019 | | UBS AG (London) | | 12/14/18 | | | 762 | | | | (44,397 | ) | | | — | | | | (44,397 | ) |
Brother Industries Ltd. | | (0.101) | | UBS AG (London) | | 12/14/18 | | | 34 | | | | 31,746 | | | | — | | | | 31,746 | |
Brunswick Corp. | | 2.307 | | UBS AG (London) | | 12/14/18 | | | 10 | | | | 30,240 | | | | — | | | | 30,240 | |
Bucher Industries AG | | (0.782) | | UBS AG (London) | | 12/14/18 | | | 1 | | | | 5,692 | | | | — | | | | 5,692 | |
Burberry Group PLC | | 0.691 | | UBS AG (London) | | 12/14/18 | | | 27 | | | | 24,567 | | | | — | | | | 24,567 | |
Burlington Stores, Inc. | | 2.307 | | UBS AG (London) | | 12/14/18 | | | 2 | | | | (1,001 | ) | | | — | | | | (1,001 | ) |
BWX Technologies, Inc. | | 2.173 | | UBS AG (London) | | 12/14/18 | | | 7 | | | | (16,037 | ) | | | — | | | | (16,037 | ) |
Byd Co. Ltd. | | 1.019 | | UBS AG (London) | | 12/14/18 | | | 103 | | | | (9,109 | ) | | | — | | | | (9,109 | ) |
Caesars Entertainment Corp. | | 2.173 | | UBS AG (London) | | 12/14/18 | | | 36 | | | | (13,606 | ) | | | — | | | | (13,606 | ) |
Campbell Soup Co. | | 2.173 | | UBS AG (London) | | 12/14/18 | | | 15 | | | | 2,814 | | | | — | | | | 2,814 | |
Carlsberg A/S | | (0.405) | | UBS AG (London) | | 12/14/18 | | | 5 | | | | 915 | | | | — | | | | 915 | |
Carnival Corp. | | 0.691 | | UBS AG (London) | | 12/14/18 | | | 10 | | | | 12,833 | | | | — | | | | 12,833 | |
Carrefour SA | | (0.456) | | UBS AG (London) | | 12/14/18 | | | 35 | | | | 1,539 | | | | — | | | | 1,539 | |
Carter’S, Inc. | | 0.000 | | UBS AG (London) | | 12/14/18 | | | 4 | | | | 11,933 | | | | — | | | | 11,933 | |
Catcher Technology Co. Ltd. | | 2.307 | | UBS AG (London) | | 12/14/18 | | | 61 | | | | (26,863 | ) | | | — | | | | (26,863 | ) |
Cathay General Bancorp | | 2.307 | | UBS AG (London) | | 12/14/18 | | | 15 | | | | 2,164 | | | | — | | | | 2,164 | |
CBS Corp. | | 2.307 | | UBS AG (London) | | 12/14/18 | | | 4 | | | | 12,301 | | | | — | | | | 12,301 | |
Celanese Corp. | | 2.307 | | UBS AG (London) | | 12/14/18 | | | 3 | | | | 9,706 | | | | — | | | | 9,706 | |
Cellnex Telecom SA | | (0.456) | | UBS AG (London) | | 05/02/19 | | | 22 | | | | (16,241 | ) | | | — | | | | (16,241 | ) |
Central Japan Railway Corp. | | (0.101) | | UBS AG (London) | | 12/14/18 | | | 3 | | | | 9,987 | | | | — | | | | 9,987 | |
CF Industries Holding, Inc. | | 2.173 | | UBS AG (London) | | 12/14/18 | | | 14 | | | | (45,786 | ) | | | — | | | | (45,786 | ) |
Cheng Shin Rubber Industry | | 2.307 | | UBS AG (London) | | 12/14/18 | | | 448 | | | | (30,942 | ) | | | — | | | | (30,942 | ) |
Cheniere Energy, Inc. | | 2.173 | | UBS AG (London) | | 12/14/18 | | | 1 | | | | (4,111 | ) | | | — | | | | (4,111 | ) |
China Conch Venture Holdings | | 0.000 | | UBS AG (London) | | 12/14/18 | | | 38 | | | | 791 | | | | — | | | | 791 | |
China Mengniu Dairy Co. | | 1.019 | | UBS AG (London) | | 12/14/18 | | | 195 | | | | 7,387 | | | | — | | | | 7,387 | |
China Merchants Holdings (International) | | 1.019 | | UBS AG (London) | | 12/14/18 | | | 328 | | | | (11,834 | ) | | | — | | | | (11,834 | ) |
China Petroleum & Chem Corp. | | 1.019 | | UBS AG (London) | | 12/14/18 | | | 712 | | | | (4,623 | ) | | | — | | | | (4,623 | ) |
China Resources Beer Holdings | | 1.019 | | UBS AG (London) | | 12/14/18 | | | 176 | | | | 16,754 | | | | — | | | | 16,754 | |
CHN Industrial NV | | (0.456) | | UBS AG (London) | | 12/14/18 | | | 51 | | | | 3,621 | | | | — | | | | 3,621 | |
Cie Financiere Richemont AG | | (0.782) | | UBS AG (London) | | 12/14/18 | | | 2 | | | | (4,872 | ) | | | — | | | | (4,872 | ) |
Cigna Corp. | | 2.307 | | UBS AG (London) | | 12/14/18 | | | 3 | | | | 22,197 | | | | — | | | | 22,197 | |
Cimic Group Ltd. | | 1.850 | | UBS AG (London) | | 12/14/18 | | | 21 | | | | 21,650 | | | | — | | | | 21,650 | |
Cimpress NV | | 2.173 | | UBS AG (London) | | 12/14/18 | | | 4 | | | | (16,135 | ) | | | — | | | | (16,135 | ) |
Cinemark Holdings, Inc. | | 2.307 | | UBS AG (London) | | 12/14/18 | | | 8 | | | | 7,754 | | | | — | | | | 7,754 | |
CJ Corp. | | 2.307 | | UBS AG (London) | | 12/14/18 | | | 4 | | | | 3,367 | | | | — | | | | 3,367 | |
Cobham PLC | | 0.691 | | UBS AG (London) | | 12/14/18 | | | 300 | | | | (4,687 | ) | | | — | | | | (4,687 | ) |
Coca-Cola Bottlers Japan Holding | | 2.173 | | UBS AG (London) | | 12/14/18 | | | 4 | | | | (202 | ) | | | — | | | | (202 | ) |
Coca-Cola Co. | | 2.173 | | UBS AG (London) | | 12/14/18 | | | 14 | | | | (19,905 | ) | | | — | | | | (19,905 | ) |
Coca-Cola European Partners | | 2.173 | | UBS AG (London) | | 12/14/18 | | | 9 | | | | 4,664 | | | | — | | | | 4,664 | |
Coca-Cola HBC AG | | 0.691 | | UBS AG (London) | | 12/14/18 | | | 18 | | | | (5,150 | ) | | | — | | | | (5,150 | ) |
Cochlear Ltd. | | 1.850 | | UBS AG (London) | | 12/14/18 | | | 5 | | | | 16,856 | | | | — | | | | 16,856 | |
Cognex Corp. | | 2.173 | | UBS AG (London) | | 12/14/18 | | | 14 | | | | (43,583 | ) | | | — | | | | (43,583 | ) |
Colruyt SA | | (0.456) | | UBS AG (London) | | 12/14/18 | | | 5 | | | | 2,121 | | | | — | | | | 2,121 | |
| | |
| 48 | | The accompanying notes are an integral part of these financial statements. |
GOLDMAN SACHS MULTI-MANAGER ALTERNATIVES FUND
|
| ADDITIONAL INVESTMENT INFORMATION (continued) |
OVER THE COUNTER TOTAL RETURN SWAP CONTRACTS# (continued)
| | | | | | | | | | | | | | | | | | | | | | |
| Reference Obligation/Index(a) | | Financing Rate
Paid (Received)
by the Fund | | Counterparty | | Termination
Date | | Notional
Amount
(000s) | | | Value | | | Upfront
Premiums
(Received)
Paid | | | Unrealized
Appreciation/
(Depreciation) | |
Computershare Ltd. | | 1.850% | | UBS AG (London) | | 12/14/18 | | $ | 49 | | | $ | 15,756 | | | $ | — | | | $ | 15,756 | |
Conocophillips | | 2.307 | | UBS AG (London) | | 12/14/18 | | | 9 | | | | 25,642 | | | | — | | | | 25,642 | |
Costar Group, Inc. | | 2.173 | | UBS AG (London) | | 12/14/18 | | | 2 | | | | (19,764 | ) | | | — | | | | (19,764 | ) |
Crane Co. | | 2.307 | | UBS AG (London) | | 12/14/18 | | | 7 | | | | 13,955 | | | | — | | | | 13,955 | |
Cree, Inc. | | 2.173 | | UBS AG (London) | | 12/14/18 | | | 17 | | | | (39,232 | ) | | | — | | | | (39,232 | ) |
CSL Ltd. | | 1.850 | | UBS AG (London) | | 12/14/18 | | | 1 | | | | 4,382 | | | | — | | | | 4,382 | |
CTS Eventim AG & Co. KGaA | | (0.456) | | UBS AG (London) | | 12/14/18 | | | 11 | | | | 8,615 | | | | — | | | | 8,615 | |
Cummins, Inc. | | 2.307 | | UBS AG (London) | | 12/14/18 | | | 5 | | | | 24,344 | | | | — | | | | 24,344 | |
Curtiss-Wright Corp. | | 2.307 | | UBS AG (London) | | 12/14/18 | | | 6 | | | | 11,546 | | | | — | | | | 11,546 | |
CVR Energy, Inc. | | 2.307 | | UBS AG (London) | | 12/14/18 | | | 10 | | | | 22,355 | | | | — | | | | 22,355 | |
CVS Health Corp. | | 2.173 | | UBS AG (London) | | 12/14/18 | | | 8 | | | | (17,792 | ) | | | — | | | | (17,792 | ) |
Daifuku Co. Ltd. | | (0.101) | | UBS AG (London) | | 12/14/18 | | | 3 | | | | (9,349 | ) | | | — | | | | (9,349 | ) |
Daiichi Sankyo Co. Ltd. | | (0.101) | | UBS AG (London) | | 12/14/18 | | | 16 | | | | 8,900 | | | | — | | | | 8,900 | |
Daikin Industries Ltd. | | (0.101) | | UBS AG (London) | | 12/14/18 | | | 5 | | | | 19,841 | | | | — | | | | 19,841 | |
Daimler AG | | (0.456) | | UBS AG (London) | | 12/14/18 | | | 10 | | | | 3,689 | | | | — | | | | 3,689 | |
Daiwa House Industry Co. | | (0.101) | | UBS AG (London) | | 12/14/18 | | | 20 | | | | 27,079 | | | | — | | | | 27,079 | |
Danske Bank A/S | | (0.405) | | UBS AG (London) | | 12/14/18 | | | 25 | | | | 9,426 | | | | — | | | | 9,426 | |
Darling Ingredients, Inc. | | 2.173 | | UBS AG (London) | | 12/14/18 | | | 19 | | | | (15,010 | ) | | | — | | | | (15,010 | ) |
Dassault Aviation SA | | (0.456) | | UBS AG (London) | | 12/14/18 | | | — | * | | | 19,679 | | | | — | | | | 19,679 | |
Deere & Co. | | 2.173 | | UBS AG (London) | | 12/14/18 | | | 4 | | | | (23,321 | ) | | | — | | | | (23,321 | ) |
Dell Technologies, Inc. | | 2.307 | | UBS AG (London) | | 12/14/18 | | | 7 | | | | 24,260 | | | | — | | | | 24,260 | |
Deutsche Bank AG | | (0.456) | | UBS AG (London) | | 12/14/18 | | | 58 | | | | (941 | ) | | | — | | | | (941 | ) |
Diamondback Energy, Inc. | | 2.173 | | UBS AG (London) | | 12/14/18 | | | 4 | | | | (16,716 | ) | | | — | | | | (16,716 | ) |
Disco Corp. | | (0.101) | | UBS AG (London) | | 12/14/18 | | | 4 | | | | 43,319 | | | | — | | | | 43,319 | |
DKSH Holding AG | | (0.782) | | UBS AG (London) | | 12/14/18 | | | 6 | | | | (3,042 | ) | | | — | | | | (3,042 | ) |
Dollar Tree, Inc. | | 2.173 | | UBS AG (London) | | 12/14/18 | | | 8 | | | | (3,993 | ) | | | — | | | | (3,993 | ) |
Domino’s Pizza Enterprises Ltd. | | 1.850 | | UBS AG (London) | | 12/14/18 | | | 18 | | | | (19,805 | ) | | | — | | | | (19,805 | ) |
Doosan Bobcat, Inc. | | 2.307 | | UBS AG (London) | | 12/14/18 | | | 20 | | | | 10,932 | | | | — | | | | 10,932 | |
Dunkin’ Brands Group, Inc. | | 2.173 | | UBS AG (London) | | 12/14/18 | | | 6 | | | | (9,755 | ) | | | — | | | | (9,755 | ) |
Dycom Industries, Inc. | | 2.173 | | UBS AG (London) | | 12/14/18 | | | 6 | | | | (3,182 | ) | | | — | | | | (3,182 | ) |
E.On SE | | (0.456) | | UBS AG (London) | | 12/14/18 | | | 59 | | | | (3,208 | ) | | | — | | | | (3,208 | ) |
Eagle Materials, Inc. | | 2.307 | | UBS AG (London) | | 12/14/18 | | | 5 | | | | 16,215 | | | | — | | | | 16,215 | |
Eclat Textile Co. Ltd. | | 2.307 | | UBS AG (London) | | 12/14/18 | | | 55 | | | | (40,299 | ) | | | — | | | | (40,299 | ) |
Edenred SA | | (0.456) | | UBS AG (London) | | 12/14/18 | | | 18 | | | | 7,497 | | | | — | | | | 7,497 | |
Edison International | | 2.173 | | UBS AG (London) | | 12/14/18 | | | 1 | | | | (1,208 | ) | | | — | | | | (1,208 | ) |
Eisai Co. Ltd. | | (0.101) | | UBS AG (London) | | 12/14/18 | | | 5 | | | | (3,504 | ) | | | — | | | | (3,504 | ) |
Eldorado Resorts, Inc. | | 2.173 | | UBS AG (London) | | 12/14/18 | | | 7 | | | | (18,565 | ) | | | — | | | | (18,565 | ) |
Electrocomponents PLC | | 0.691 | | UBS AG (London) | | 12/14/18 | | | 75 | | | | 19,457 | | | | — | | | | 19,457 | |
Electrolux AB | | (0.462) | | UBS AG (London) | | 12/14/18 | | | 29 | | | | (28,541 | ) | | | — | | | | (28,541 | ) |
Elis SA | | (0.456) | | UBS AG (London) | | 12/14/18 | | | 17 | | | | (7,026 | ) | | | — | | | | (7,026 | ) |
Enagas SA | | (0.456) | | UBS AG (London) | | 05/02/19 | | | 20 | | | | (264 | ) | | | — | | | | (264 | ) |
Endo International PLC | | 2.307 | | UBS AG (London) | | 12/14/18 | | | 11 | | | | 4,881 | | | | — | | | | 4,881 | |
EnLink Midstream LLC | | 2.307 | | UBS AG (London) | | 12/14/18 | | | 10 | | | | 1,331 | | | | — | | | | 1,331 | |
Enn Energy Holdings Ltd. | | 1.019 | | UBS AG (London) | | 12/14/18 | | | 22 | | | | (988 | ) | | | — | | | | (988 | ) |
Equifax, Inc. | | 2.173 | | UBS AG (London) | | 12/14/18 | | | 7 | | | | (28,520 | ) | | | — | | | | (28,520 | ) |
Eurofins Scientific | | (0.456) | | UBS AG (London) | | 12/14/18 | | | — | * | | | (4,606 | ) | | | — | | | | (4,606 | ) |
EXOR SpA | | (0.456) | | UBS AG (London) | | 12/14/18 | | | 8 | | | | (3,828 | ) | | | — | | | | (3,828 | ) |
Expeditors International Wash, Inc. | | 2.307 | | UBS AG (London) | | 12/14/18 | | | 7 | | | | 9,922 | | | | — | | | | 9,922 | |
Experian PLC | | 0.691 | | UBS AG (London) | | 12/14/18 | | | 26 | | | | 6,495 | | | | — | | | | 6,495 | |
| | |
| The accompanying notes are an integral part of these financial statements. | | 49 |
GOLDMAN SACHS MULTI-MANAGER ALTERNATIVES FUND
Consolidated Schedule of Investments (continued)
October 31, 2018
|
| ADDITIONAL INVESTMENT INFORMATION (continued) |
OVER THE COUNTER TOTAL RETURN SWAP CONTRACTS# (continued)
| | | | | | | | | | | | | | | | | | | | | | |
| Reference Obligation/Index(a) | | Financing Rate
Paid (Received)
by the Fund | | Counterparty | | Termination
Date | | Notional
Amount
(000s) | | | Value | | | Upfront
Premiums
(Received)
Paid | | | Unrealized
Appreciation/
(Depreciation) | |
Far Eastern Corp. | | 2.307% | | UBS AG (London) | | 12/14/18 | | $ | 641 | | | $ | 23,211 | | | $ | — | | | $ | 23,211 | |
Faurecia SA | | (0.456) | | UBS AG (London) | | 12/14/18 | | | 13 | | | | (5,376 | ) | | | — | | | | (5,376 | ) |
Feng Tay Entrprise Co. Ltd. | | 2.307 | | UBS AG (London) | | 12/14/18 | | | 110 | | | | (21,678 | ) | | | — | | | | (21,678 | ) |
Fielmann AG | | (0.456) | | UBS AG (London) | | 12/14/18 | | | 10 | | | | 1,833 | | | | — | | | | 1,833 | |
Fireeye, Inc. | | 2.173 | | UBS AG (London) | | 12/14/18 | | | 39 | | | | (80,646 | ) | | | — | | | | (80,646 | ) |
First Financial Bankshares, Inc. | | 2.173 | | UBS AG (London) | | 12/14/18 | | | 8 | | | | (5,770 | ) | | | — | | | | (5,770 | ) |
First Solar, Inc. | | 2.173 | | UBS AG (London) | | 12/14/18 | | | 10 | | | | (49,123 | ) | | | — | | | | (49,123 | ) |
Fleetcor Technologies, Inc. | | 2.173 | | UBS AG (London) | | 12/14/18 | | | 1 | | | | (9,754 | ) | | | — | | | | (9,754 | ) |
Flex Ltd. | | 2.173 | | UBS AG (London) | | 12/14/18 | | | 31 | | | | (28,751 | ) | | | — | | | | (28,751 | ) |
Fortescue Metals Group Ltd. | | 1.850 | | UBS AG (London) | | 12/14/18 | | | 242 | | | | (19,107 | ) | | | — | | | | (19,107 | ) |
Fortive Corp. | | 0.000 | | UBS AG (London) | | 12/14/18 | | | 9 | | | | (23,817 | ) | | | — | | | | (23,817 | ) |
Foxconn Technology Co. Ltd. | | 2.307 | | UBS AG (London) | | 12/14/18 | | | 257 | | | | (11,091 | ) | | | — | | | | (11,091 | ) |
Fuji Media Holdings, Inc. | | (0.101) | | UBS AG (London) | | 12/14/18 | | | 36 | | | | (120 | ) | | | — | | | | (120 | ) |
Fujifilm Holdings Corp. | | (0.101) | | UBS AG (London) | | 12/14/18 | | | 14 | | | | 4,440 | | | | — | | | | 4,440 | |
G4S PLC | | 0.691 | | UBS AG (London) | | 12/14/18 | | | 204 | | | | (3,775 | ) | | | — | | | | (3,775 | ) |
Galapagos NV | | (0.456) | | UBS AG (London) | | 12/14/18 | | | 7 | | | | (12,312 | ) | | | — | | | | (12,312 | ) |
Gartner, Inc. | | 2.173 | | UBS AG (London) | | 12/14/18 | | | 2 | | | | (11,161 | ) | | | — | | | | (11,161 | ) |
Gea Group AG | | (0.456) | | UBS AG (London) | | 12/14/18 | | | 19 | | | | (3,063 | ) | | | — | | | | (3,063 | ) |
Geely Automobile Holdings Ltd. | | 1.019 | | UBS AG (London) | | 12/14/18 | | | 346 | | | | 60,788 | | | | — | | | | 60,788 | |
Generac Holdings, Inc. | | 2.307 | | UBS AG (London) | | 12/14/18 | | | 7 | | | | 10,967 | | | | — | | | | 10,967 | |
Genting Singapore Ltd. | | 1.516 | | UBS AG (London) | | 12/14/18 | | | 616 | | | | 5,207 | | | | — | | | | 5,207 | |
Georg Fischer AG | | (0.782) | | UBS AG (London) | | 12/14/18 | | | — | * | | | 9,136 | | | | — | | | | 9,136 | |
GlaxoSmithKline PLC | | 0.691 | | UBS AG (London) | | 12/14/18 | | | 32 | | | | 9,290 | | | | — | | | | 9,290 | |
Globalwafers Co. Ltd. | | 2.307 | | UBS AG (London) | | 12/14/18 | | | 87 | | | | 71,301 | | | | — | | | | 71,301 | |
GN Store Nord A/S | | (0.405) | | UBS AG (London) | | 12/14/18 | | | 21 | | | | 13,510 | | | | — | | | | 13,510 | |
Grace (W R) & Co. | | 2.307 | | UBS AG (London) | | 12/14/18 | | | 9 | | | | 12,860 | | | | — | | | | 12,860 | |
Grand Canyon Education, Inc. | | 2.173 | | UBS AG (London) | | 12/14/18 | | | 5 | | | | (18,808 | ) | | | — | | | | (18,808 | ) |
Groupe Eurotunnel SE | | (0.456) | | UBS AG (London) | | 12/14/18 | | | 57 | | | | 2,776 | | | | — | | | | 2,776 | |
Guidewire Software, Inc. | | 2.173 | | UBS AG (London) | | 12/14/18 | | | 5 | | | | (34,394 | ) | | | — | | | | (34,394 | ) |
Hana Financial Holdings | | 2.307 | | UBS AG (London) | | 12/14/18 | | | 9 | | | | (16,842 | ) | | | — | | | | (16,842 | ) |
Hankook Tire Co. Ltd. | | 2.307 | | UBS AG (London) | | 12/14/18 | | | 17 | | | | (33,886 | ) | | | — | | | | (33,886 | ) |
Hanmi Pharm Co. Ltd. | | 2.307 | | UBS AG (London) | | 12/14/18 | | | 2 | | | | (13,178 | ) | | | — | | | | (13,178 | ) |
Hanssem Co. Ltd. | | 2.307 | | UBS AG (London) | | 12/14/18 | | | 6 | | | | (23,745 | ) | | | — | | | | (23,745 | ) |
Hanwha Corp. | | 2.307 | | UBS AG (London) | | 12/14/18 | | | 17 | | | | 24,886 | | | | — | | | | 24,886 | |
Hasbro, Inc. | | 2.173 | | UBS AG (London) | | 12/14/18 | | | 7 | | | | (2,235 | ) | | | — | | | | (2,235 | ) |
Heidelbergcement AG | | (0.456) | | UBS AG (London) | | 12/14/18 | | | 6 | | | | (16,492 | ) | | | — | | | | (16,492 | ) |
Hella Gmbh & Co. KGaA | | (0.456) | | UBS AG (London) | | 12/14/18 | | | 4 | | | | 996 | | | | — | | | | 996 | |
Herbalife Ltd | | 2.307 | | UBS AG (London) | | 12/14/18 | | | 12 | | | | (11,940 | ) | | | — | | | | (11,940 | ) |
Hillenbrand, Inc. | | 2.307 | | UBS AG (London) | | 12/14/18 | | | 12 | | | | 7,960 | | | | — | | | | 7,960 | |
Hitachi Chemical Co. Ltd. | | (0.101) | | UBS AG (London) | | 12/14/18 | | | 28 | | | | 1,512 | | | | — | | | | 1,512 | |
Hitachi Ltd. | | (0.101) | | UBS AG (London) | | 12/14/18 | | | 7 | | | | 5,011 | | | | — | | | | 5,011 | |
Hiwin Technologies Corp. | | 2.307 | | UBS AG (London) | | 12/14/18 | | | 20 | | | | 5,986 | | | | — | | | | 5,986 | |
HLB Co. Ltd. | | 2.307 | | UBS AG (London) | | 12/14/18 | | | 7 | | | | (10,503 | ) | | | — | | | | (10,503 | ) |
Hochtief AG | | (0.456) | | UBS AG (London) | | 12/14/18 | | | 4 | | | | (895 | ) | | | — | | | | (895 | ) |
Hotel Shilla Ltd. | | 2.307 | | UBS AG (London) | | 12/14/18 | | | 4 | | | | (5,054 | ) | | | — | | | | (5,054 | ) |
Howden Joinery Group PLC | | 0.691 | | UBS AG (London) | | 12/14/18 | | | 84 | | | | 22,063 | | | | — | | | | 22,063 | |
HP, Inc. | | 2.307 | | UBS AG (London) | | 12/14/18 | | | 22 | | | | 24,535 | | | | — | | | | 24,535 | |
Hugo Boss AG | | (0.456) | | UBS AG (London) | | 12/14/18 | | | 8 | | | | 13,902 | | | | — | | | | 13,902 | |
Husqvarna AB | | (0.462) | | UBS AG (London) | | 12/14/18 | | | 84 | | | | (20,668 | ) | | | — | | | | (20,668 | ) |
Hyundai Engneering & Construction Co. | | 2.307 | | UBS AG (London) | | 12/14/18 | | | 10 | | | | 15,641 | | | | — | | | | 15,641 | |
| | |
| 50 | | The accompanying notes are an integral part of these financial statements. |
GOLDMAN SACHS MULTI-MANAGER ALTERNATIVES FUND
|
| ADDITIONAL INVESTMENT INFORMATION (continued) |
OVER THE COUNTER TOTAL RETURN SWAP CONTRACTS# (continued)
| | | | | | | | | | | | | | | | | | | | | | |
| Reference Obligation/Index(a) | | Financing Rate
Paid (Received)
by the Fund | | Counterparty | | Termination
Date | | Notional
Amount
(000s) | | | Value | | | Upfront
Premiums
(Received)
Paid | | | Unrealized
Appreciation/
(Depreciation) | |
Hyundai Steel Co. | | 2.307% | | UBS AG (London) | | 12/14/18 | | $ | 9 | | | $ | 3,493 | | | $ | — | | | $ | 3,493 | |
ICA Gruppen AB | | (0.462) | | UBS AG (London) | | 12/14/18 | | | 20 | | | | (22,869 | ) | | | — | | | | (22,869 | ) |
IDEXX Laboratories, Inc. | | 2.307 | | UBS AG (London) | | 12/14/18 | | | 3 | | | | 24,584 | | | | — | | | | 24,584 | |
IHI Corp. | | (0.101) | | UBS AG (London) | | 12/14/18 | | | 19 | | | | 426 | | | | — | | | | 426 | |
Iida Group Holdings Co. Ltd. | | (0.101) | | UBS AG (London) | | 12/14/18 | | | 34 | | | | (10,647 | ) | | | — | | | | (10,647 | ) |
Iliad | | (0.456) | | UBS AG (London) | | 12/14/18 | | | 5 | | | | (1,015 | ) | | | — | | | | (1,015 | ) |
Imperial Brands PLC | | 0.691 | | UBS AG (London) | | 12/14/18 | | | 18 | | | | (8,762 | ) | | | — | | | | (8,762 | ) |
Incitec Pivot Ltd. | | 1.850 | | UBS AG (London) | | 12/14/18 | | | 239 | | | | (18,784 | ) | | | — | | | | (18,784 | ) |
Ingenico Group | | (0.456) | | UBS AG (London) | | 12/14/18 | | | 10 | | | | 38,994 | | | | — | | | | 38,994 | |
Innolux Corp. | | 2.307 | | UBS AG (London) | | 12/14/18 | | | 1,719 | | | | (6,083 | ) | | | — | | | | (6,083 | ) |
Insperity, Inc. | | 2.307 | | UBS AG (London) | | 12/14/18 | | | 6 | | | | 20,533 | | | | — | | | | 20,533 | |
Insulet Corp. | | 2.173 | | UBS AG (London) | | 12/14/18 | | | 7 | | | | (34,771 | ) | | | — | | | | (34,771 | ) |
Intercontinental Hotels Group | | 0.691 | | UBS AG (London) | | 12/14/18 | | | 10 | | | | 7,240 | | | | — | | | | 7,240 | |
International Game Technology PLC | | 2.173 | | UBS AG (London) | | 12/14/18 | | | 18 | | | | (54,385 | ) | | | — | | | | (54,385 | ) |
Intertek Group PLC | | 0.691 | | UBS AG (London) | | 12/14/18 | | | 10 | | | | 15,387 | | | | — | | | | 15,387 | |
Inventec Co. Ltd. | | 2.307 | | UBS AG (London) | | 12/14/18 | | | 762 | | | | 11,111 | | | | — | | | | 11,111 | |
Ipsen SA | | (0.456) | | UBS AG (London) | | 12/14/18 | | | 4 | | | | 954 | | | | — | | | | 954 | |
Iss A/S | | (0.405) | | UBS AG (London) | | 12/14/18 | | | 19 | | | | (6,261 | ) | | | — | | | | (6,261 | ) |
ITT, Inc. | | 2.307 | | UBS AG (London) | | 12/14/18 | | | 13 | | | | 13,166 | | | | — | | | | 13,166 | |
Jacobs Engineering Group, Inc. | | 2.307 | | UBS AG (London) | | 12/14/18 | | | 4 | | | | 9,611 | | | | — | | | | 9,611 | |
James Hardie Industries PLC | | 1.850 | | UBS AG (London) | | 12/14/18 | | | 25 | | | | (1,172 | ) | | | — | | | | (1,172 | ) |
Jardine Cycle & Carriage Ltd. | | 1.516 | | UBS AG (London) | | 12/14/18 | | | 18 | | | | 19,002 | | | | — | | | | 19,002 | |
JD Sports Fashion PLC | | 0.691 | | UBS AG (London) | | 12/14/18 | | | 59 | | | | 16,025 | | | | — | | | | 16,025 | |
JGC Corp. | | (0.101) | | UBS AG (London) | | 12/14/18 | | | 12 | | | | 5,398 | | | | — | | | | 5,398 | |
Jtekt Corp. | | (0.101) | | UBS AG (London) | | 12/14/18 | | | 48 | | | | (9,172 | ) | | | — | | | | (9,172 | ) |
Kakaku.com, Inc. | | (0.101) | | UBS AG (London) | | 12/14/18 | | | 31 | | | | 11,238 | | | | — | | | | 11,238 | |
Kangwon Land, Inc. | | 2.307 | | UBS AG (London) | | 12/14/18 | | | 20 | | | | (11,524 | ) | | | — | | | | (11,524 | ) |
Kansai Paint Co. Ltd. | | (0.101) | | UBS AG (London) | | 12/14/18 | | | 42 | | | | (12,163 | ) | | | — | | | | (12,163 | ) |
Kao Corp. | | (0.101) | | UBS AG (London) | | 12/14/18 | | | 10 | | | | 17,147 | | | | — | | | | 17,147 | |
Keihan Holdings Co. Ltd. | | (0.101) | | UBS AG (London) | | 12/14/18 | | | 18 | | | | (12,084 | ) | | | — | | | | (12,084 | ) |
Keikyu Corp. | | (0.101) | | UBS AG (London) | | 12/14/18 | | | 39 | | | | (5,531 | ) | | | — | | | | (5,531 | ) |
Kennametal, Inc. | | 2.307 | | UBS AG (London) | | 12/14/18 | | | 16 | | | | 18,619 | | | | — | | | | 18,619 | |
Kering | | (0.456) | | UBS AG (London) | | 12/14/18 | | | 1 | | | | 14,034 | | | | — | | | | 14,034 | |
Keysight Technologies, Inc. | | 2.307 | | UBS AG (London) | | 12/14/18 | | | 3 | | | | 1,419 | | | | — | | | | 1,419 | |
KIA Motors Corp. | | 2.307 | | UBS AG (London) | | 12/14/18 | | | 25 | | | | 10,071 | | | | — | | | | 10,071 | |
Kingfisher PLC | | 0.691 | | UBS AG (London) | | 12/14/18 | | | 180 | | | | (18,074 | ) | | | — | | | | (18,074 | ) |
Kingsoft Co. Ltd. | | 1.019 | | UBS AG (London) | | 12/14/18 | | | 300 | | | | (26,750 | ) | | | — | | | | (26,750 | ) |
Kion Group Gmbh | | (0.456) | | UBS AG (London) | | 12/14/18 | | | 11 | | | | (25,365 | ) | | | — | | | | (25,365 | ) |
Kirby Corp. | | 2.173 | | UBS AG (London) | | 12/14/18 | | | 9 | | | | (15,792 | ) | | | — | | | | (15,792 | ) |
Kobayashi Pharmaceutical Co. | | (0.101) | | UBS AG (London) | | 12/14/18 | | | 10 | | | | 32,003 | | | | — | | | | 32,003 | |
Konica Minolta, Inc. | | (0.101) | | UBS AG (London) | | 12/14/18 | | | 61 | | | | 3 | | | | — | | | | 3 | |
Koninklijke Ahold Delhaize | | (0.456) | | UBS AG (London) | | 12/14/18 | | | 8 | | | | 2,068 | | | | — | | | | 2,068 | |
Koninklijke Boskalis Westminster NV | | (0.456) | | UBS AG (London) | | 12/14/18 | | | 26 | | | | 2,396 | | | | — | | | | 2,396 | |
Koninklijke Philips NV | | (0.456) | | UBS AG (London) | | 12/14/18 | | | 16 | | | | 13,316 | | | | — | | | | 13,316 | |
Korea Aerospace Industries Ltd. | | 2.307 | | UBS AG (London) | | 12/14/18 | | | 21 | | | | (22,401 | ) | | | — | | | | (22,401 | ) |
Korea Zinc Co. Ltd. | | 2.307 | | UBS AG (London) | | 12/14/18 | | | 1 | | | | 6,440 | | | | — | | | | 6,440 | |
Kose Corp. | | (0.101) | | UBS AG (London) | | 12/14/18 | | | 1 | | | | 5,760 | | | | — | | | | 5,760 | |
Kumho Petrochemical Co. Ltd. | | 2.307 | | UBS AG (London) | | 12/14/18 | | | 3 | | | | 17,305 | | | | — | | | | 17,305 | |
Kyushu Railway Co. | | (0.101) | | UBS AG (London) | | 12/14/18 | | | 20 | | | | (12,509 | ) | | | — | | | | (12,509 | ) |
| | |
| The accompanying notes are an integral part of these financial statements. | | 51 |
GOLDMAN SACHS MULTI-MANAGER ALTERNATIVES FUND
Consolidated Schedule of Investments (continued)
October 31, 2018
|
| ADDITIONAL INVESTMENT INFORMATION (continued) |
OVER THE COUNTER TOTAL RETURN SWAP CONTRACTS# (continued)
| | | | | | | | | | | | | | | | | | | | | | |
| Reference Obligation/Index(a) | | Financing Rate
Paid (Received)
by the Fund | | Counterparty | | Termination
Date | | Notional
Amount
(000s) | | | Value | | | Upfront
Premiums
(Received)
Paid | | | Unrealized
Appreciation/
(Depreciation) | |
Lafargeholcim Ltd. | | (0.782)% | | UBS AG (London) | | 12/14/18 | | $ | 14 | | | $ | (23,145 | ) | | $ | — | | | $ | (23,145 | ) |
Landstar System, Inc. | | 2.307 | | UBS AG (London) | | 12/14/18 | | | 6 | | | | 2,359 | | | | — | | | | 2,359 | |
Lauder (Estee) Cos., Inc. Class A | | 2.307 | | UBS AG (London) | | 12/14/18 | | | 5 | | | | 50,277 | | | | — | | | | 50,277 | |
Legal & Gen Group PLC | | 0.691 | | UBS AG (London) | | 12/14/18 | | | 97 | | | | 4,093 | | | | — | | | | 4,093 | |
LendingTree, Inc. | | 2.173 | | UBS AG (London) | | 12/14/18 | | | — | * | | | (6,988 | ) | | | — | | | | (6,988 | ) |
Lenovo Group Ltd. | | 1.019 | | UBS AG (London) | | 12/14/18 | | | 948 | | | | 10,803 | | | | — | | | | 10,803 | |
Leonardo SpA | | (0.456) | | UBS AG (London) | | 12/14/18 | | | 26 | | | | (368 | ) | | | — | | | | (368 | ) |
LG Chemical Ltd. | | 2.307 | | UBS AG (London) | | 12/14/18 | | | 1 | | | | (4,633 | ) | | | — | | | | (4,633 | ) |
LG Innotek Co. Ltd. | | 2.307 | | UBS AG (London) | | 12/14/18 | | | 5 | | | | (6,170 | ) | | | — | | | | (6,170 | ) |
LG Uplus Corp. | | 2.307 | | UBS AG (London) | | 12/14/18 | | | 46 | | | | (11,507 | ) | | | — | | | | (11,507 | ) |
Li & Fung Ltd. | | 1.019 | | UBS AG (London) | | 12/14/18 | | | 566 | | | | (9,375 | ) | | | — | | | | (9,375 | ) |
Liberty Broadband Corp. | | 2.173 | | UBS AG (London) | | 12/14/18 | | | 8 | | | | (40,462 | ) | | | — | | | | (40,462 | ) |
LION Corp. | | (0.101) | | UBS AG (London) | | 12/14/18 | | | 17 | | | | (7,311 | ) | | | — | | | | (7,311 | ) |
Live Nation Entertainment | | 2.307 | | UBS AG (London) | | 12/14/18 | | | 6 | | | | 17,885 | | | | — | | | | 17,885 | |
Logitech International SA | | (0.782) | | UBS AG (London) | | 12/14/18 | | | 8 | | | | 8,737 | | | | — | | | | 8,737 | |
Lululemon Athletica, Inc. | | 2.307 | | UBS AG (London) | | 12/14/18 | | | 4 | | | | 19,931 | | | | — | | | | 19,931 | |
Luxottica Group Spa | | (0.456) | | UBS AG (London) | | 12/14/18 | | | 8 | | | | 585 | | | | — | | | | 585 | |
Lyondellbasell Industires Co. | | 2.307 | | UBS AG (London) | | 12/14/18 | | | 7 | | | | 5,911 | | | | — | | | | 5,911 | |
M/Acom Technology Solutions | | 2.173 | | UBS AG (London) | | 12/14/18 | | | 16 | | | | (6,235 | ) | | | — | | | | (6,235 | ) |
M3, Inc. | | (0.101) | | UBS AG (London) | | 12/14/18 | | | 17 | | | | (3,352 | ) | | | — | | | | (3,352 | ) |
Macquarie Group Ltd. | | 0.000 | | UBS AG (London) | | 12/14/18 | | | 3 | | | | 5,118 | | | | — | | | | 5,118 | |
Madison Square Garden Co. | | 2.173 | | UBS AG (London) | | 12/14/18 | | | 2 | | | | (8,676 | ) | | | — | | | | (8,676 | ) |
Marathon Oil Corp. | | 2.307 | | UBS AG (London) | | 12/14/18 | | | 33 | | | | 27,982 | | | | — | | | | 27,982 | |
Marine Harvest ASA | | 0.750 | | UBS AG (London) | | 12/14/18 | | | 25 | | | | (5,277 | ) | | | — | | | | (5,277 | ) |
Marks & Spencer Group PLC | | 0.691 | | UBS AG (London) | | 12/14/18 | | | 166 | | | | (660 | ) | | | — | | | | (660 | ) |
Martin Marietta Materials | | 2.173 | | UBS AG (London) | | 12/14/18 | | | 3 | | | | (56,391 | ) | | | — | | | | (56,391 | ) |
Marvell Technology Group Ltd. | | 2.173 | | UBS AG (London) | | 12/14/18 | | | 32 | | | | (25,534 | ) | | | — | | | | (25,534 | ) |
Masco Corp. | | 2.307 | | UBS AG (London) | | 12/14/18 | | | 23 | | | | 54,992 | | | | — | | | | 54,992 | |
Masimo Corp. | | 2.307 | | UBS AG (London) | | 12/14/18 | | | 4 | | | | 10,212 | | | | — | | | | 10,212 | |
Mattel, Inc. | | 2.173 | | UBS AG (London) | | 12/14/18 | | | 30 | | | | (7,108 | ) | | | — | | | | (7,108 | ) |
Mcdonald’S Holdings Co. Japan Ltd. | | (0.101) | | UBS AG (London) | | 12/14/18 | | | 14 | | | | 4,438 | | | | — | | | | 4,438 | |
MDU Resources Group, Inc. | | 2.307 | | UBS AG (London) | | 12/14/18 | | | 6 | | | | (3,251 | ) | | | — | | | | (3,251 | ) |
Mediaset Espana Comunicacion SA | | (0.456) | | UBS AG (London) | | 05/02/19 | | | 77 | | | | 15,956 | | | | — | | | | 15,956 | |
Medicines Co. | | 2.173 | | UBS AG (London) | | 12/14/18 | | | 16 | | | | 12,537 | | | | — | | | | 12,537 | |
Mediclinic International PLC | | 0.691 | | UBS AG (London) | | 12/14/18 | | | 39 | | | | (8,928 | ) | | | — | | | | (8,928 | ) |
Medipal Holdings Corp. | | (0.101) | | UBS AG (London) | | 12/14/18 | | | 16 | | | | 15,133 | | | | — | | | | 15,133 | |
Mednax, Inc. | | 2.307 | | UBS AG (London) | | 12/14/18 | | | 14 | | | | 3,823 | | | | — | | | | 3,823 | |
Medy-Tox, Inc. | | 2.307 | | UBS AG (London) | | 12/14/18 | | | — | * | | | 1,731 | | | | — | | | | 1,731 | |
Meggitt PLC | | 0.691 | | UBS AG (London) | | 12/14/18 | | | 87 | | | | 10,332 | | | | — | | | | 10,332 | |
Melco International Development Ltd. | | 1.019 | | UBS AG (London) | | 12/14/18 | | | 154 | | | | 9,779 | | | | — | | | | 9,779 | |
Mellanox Technologies Ltd. | | 2.307 | | UBS AG (London) | | 12/14/18 | | | 9 | | | | 35,142 | | | | — | | | | 35,142 | |
Melrose Industries PLC | | 0.691 | | UBS AG (London) | | 12/14/18 | | | 264 | | | | (22,734 | ) | | | — | | | | (22,734 | ) |
Merlin Entertainments PLC | | 0.691 | | UBS AG (London) | | 12/14/18 | | | 133 | | | | (1,478 | ) | | | — | | | | (1,478 | ) |
MGM Resorts International | | 2.173 | | UBS AG (London) | | 12/14/18 | | | 23 | | | | (56,296 | ) | | | — | | | | (56,296 | ) |
Micro Focus International PLC ADR | | 0.691 | | UBS AG (London) | | 12/14/18 | | | 40 | | | | (13,677 | ) | | | — | | | | (13,677 | ) |
Microchip Technology, Inc. | | 2.173 | | UBS AG (London) | | 12/14/18 | | | 8 | | | | (27,930 | ) | | | — | | | | (27,930 | ) |
Micron Technology, Inc. | | 2.307 | | UBS AG (London) | | 12/14/18 | | | 18 | | | | 51,503 | | | | — | | | | 51,503 | |
| | |
| 52 | | The accompanying notes are an integral part of these financial statements. |
GOLDMAN SACHS MULTI-MANAGER ALTERNATIVES FUND
|
| ADDITIONAL INVESTMENT INFORMATION (continued) |
OVER THE COUNTER TOTAL RETURN SWAP CONTRACTS# (continued)
| | | | | | | | | | | | | | | | | | | | | | |
| Reference Obligation/Index(a) | | Financing Rate
Paid (Received)
by the Fund | | Counterparty | | Termination
Date | | Notional
Amount
(000s) | | | Value | | | Upfront
Premiums
(Received)
Paid | | | Unrealized
Appreciation/
(Depreciation) | |
Middleby Corp. | | 2.173% | | UBS AG (London) | | 12/14/18 | | $ | 6 | | | $ | (4,864 | ) | | $ | — | | | $ | (4,864 | ) |
Minth Group Ltd. | | 1.019 | | UBS AG (London) | | 12/14/18 | | | 198 | | | | (25,582 | ) | | | — | | | | (25,582 | ) |
Mitsubishi Motors Corp. | | (0.101) | | UBS AG (London) | | 12/14/18 | | | 93 | | | | (27,755 | ) | | | — | | | | (27,755 | ) |
Mohawk Industries, Inc. | | 2.173 | | UBS AG (London) | | 12/14/18 | | | 1 | | | | (9,118 | ) | | | — | | | | (9,118 | ) |
Monolithic Power Systems, Inc. | | 2.173 | | UBS AG (London) | | 12/14/18 | | | 5 | | | | (32,502 | ) | | | — | | | | (32,502 | ) |
MTR Corp. Ltd. | | 1.019 | | UBS AG (London) | | 12/14/18 | | | 118 | | | | (719 | ) | | | — | | | | (719 | ) |
MTU Aero Engines AG | | (0.456) | | UBS AG (London) | | 12/14/18 | | | 3 | | | | 14,159 | | | | — | | | | 14,159 | |
Murphy Oil Corp. | | 2.307 | | UBS AG (London) | | 12/14/18 | | | 15 | | | | 19,528 | | | | — | | | | 19,528 | |
Mylan NV | | 2.173 | | UBS AG (London) | | 12/14/18 | | | 11 | | | | (730 | ) | | | — | | | | (730 | ) |
Nagoya Railroad Co. Ltd. | | (0.101) | | UBS AG (London) | | 12/14/18 | | | 26 | | | | (9,649 | ) | | | — | | | | (9,649 | ) |
National Instruments Corp. | | 2.307 | | UBS AG (London) | | 12/14/18 | | | 15 | | | | 20,744 | | | | — | | | | 20,744 | |
Neogen Corp. | | 2.173 | | UBS AG (London) | | 12/14/18 | | | 9 | | | | 13,586 | | | | — | | | | 13,586 | |
New Relic, Inc. | | 2.307 | | UBS AG (London) | | 12/14/18 | | | 7 | | | | 33,845 | | | | — | | | | 33,845 | |
New York Times Co. Class A | | 2.173 | | UBS AG (London) | | 12/14/18 | | | 27 | | | | (44,999 | ) | | | — | | | | (44,999 | ) |
Newcrest Mining Ltd. | | 1.850 | | UBS AG (London) | | 12/14/18 | | | 41 | | | | 12,815 | | | | — | | | | 12,815 | |
Newfield Exploration Co. | | 2.307 | | UBS AG (London) | | 12/14/18 | | | 21 | | | | 23,577 | | | | — | | | | 23,577 | |
Nexon Co. Ltd. | | (0.101) | | UBS AG (London) | | 12/14/18 | | | 38 | | | | (8,533 | ) | | | — | | | | (8,533 | ) |
Next PLC | | 0.691 | | UBS AG (London) | | 12/14/18 | | | 8 | | | | (5,054 | ) | | | — | | | | (5,054 | ) |
Nice Ltd. | | 0.107 | | UBS AG (London) | | 10/05/20 | | | 6 | | | | 1,441 | | | | — | | | | 1,441 | |
Nielsen Holdings PLC | | 2.173 | | UBS AG (London) | | 12/14/18 | | | 21 | | | | (23,860 | ) | | | — | | | | (23,860 | ) |
Nike, Inc. | | 2.307 | | UBS AG (London) | | 12/14/18 | | | 8 | | | | 21,887 | | | | — | | | | 21,887 | |
Nikon Corp. | | (0.101) | | UBS AG (London) | | 12/14/18 | | | 37 | | | | 23,047 | | | | — | | | | 23,047 | |
Nitto Denko Corp. | | (0.101) | | UBS AG (London) | | 12/14/18 | | | 10 | | | | 21,869 | | | | — | | | | 21,869 | |
Noble Energy, Inc. | | 2.173 | | UBS AG (London) | | 12/14/18 | | | 4 | | | | (2,687 | ) | | | — | | | | (2,687 | ) |
Nokia OYJ | | (0.456) | | UBS AG (London) | | 12/14/18 | | | 112 | | | | (7,959 | ) | | | — | | | | (7,959 | ) |
Nokian Tyres Oyj | | (0.456) | | UBS AG (London) | | 12/14/18 | | | 15 | | | | (63,481 | ) | | | — | | | | (63,481 | ) |
Novo Nordisk A/S | | (0.405) | | UBS AG (London) | | 12/14/18 | | | 13 | | | | 5,291 | | | | — | | | | 5,291 | |
Novocure Ltd. | | 2.173 | | UBS AG (London) | | 12/14/18 | | | 20 | | | | (39,801 | ) | | | — | | | | (39,801 | ) |
Nvr, Inc. | | 2.307 | | UBS AG (London) | | 12/14/18 | | | — | * | | | 13,582 | | | | — | | | | 13,582 | |
Omron Corp. | | (0.101) | | UBS AG (London) | | 12/14/18 | | | 16 | | | | 43,261 | | | | — | | | | 43,261 | |
Oracle Corp. | | (0.101) | | UBS AG (London) | | 12/14/18 | | | 8 | | | | 9,229 | | | | — | | | | 9,229 | |
Orkla ASA | | 0.750 | | UBS AG (London) | | 12/14/18 | | | 36 | | | | (6,112 | ) | | | — | | | | (6,112 | ) |
Orpea | | (0.456) | | UBS AG (London) | | 12/14/18 | | | 6 | | | | (10,688 | ) | | | — | | | | (10,688 | ) |
Osram Licht AG | | (0.456) | | UBS AG (London) | | 12/14/18 | | | 17 | | | | (3,125 | ) | | | — | | | | (3,125 | ) |
Otsuka Holdings Co. Ltd. | | (0.101) | | UBS AG (London) | | 12/14/18 | | | 13 | | | | (4,176 | ) | | | — | | | | (4,176 | ) |
Paccar, Inc. | | 2.307 | | UBS AG (London) | | 12/14/18 | | | 9 | | | | 13,211 | | | | — | | | | 13,211 | |
Packaging Corp. of America | | 2.307 | | UBS AG (London) | | 12/14/18 | | | 8 | | | | 18,518 | | | | — | | | | 18,518 | |
Paypal Holdings, Inc. | | 2.173 | | UBS AG (London) | | 12/14/18 | | | 5 | | | | (15,260 | ) | | | — | | | | (15,260 | ) |
PDC Energy, Inc. | | 2.173 | | UBS AG (London) | | 12/14/18 | | | 11 | | | | (8,908 | ) | | | — | | | | (8,908 | ) |
Pegatron Corp. | | 2.307 | | UBS AG (London) | | 12/14/18 | | | 334 | | | | (12,048 | ) | | | — | | | | (12,048 | ) |
Penumbra, Inc. | | 2.173 | | UBS AG (London) | | 12/14/18 | | | 5 | | | | 6,326 | | | | — | | | | 6,326 | |
Petrochina Co. Ltd. | | 1.019 | | UBS AG (London) | | 12/14/18 | | | 878 | | | | 28,969 | | | | — | | | | 28,969 | |
Peugeot SA | | (0.456) | | UBS AG (London) | | 12/14/18 | | | 27 | | | | 1,867 | | | | — | | | | 1,867 | |
Plastic Omnium SA | | (0.456) | | UBS AG (London) | | 12/14/18 | | | 17 | | | | 12,465 | | | | — | | | | 12,465 | |
Polaris Industries, Inc. | | 0.000 | | UBS AG (London) | | 12/14/18 | | | 6 | | | | 2,629 | | | | — | | | | 2,629 | |
Porsche Automobil Holding SE | | (0.456) | | UBS AG (London) | | 12/14/18 | | | 10 | | | | 27,662 | | | | — | | | | 27,662 | |
Posco | | 2.307 | | UBS AG (London) | | 12/14/18 | | | 3 | | | | (4,427 | ) | | | — | | | | (4,427 | ) |
Posco Chemtech Co. Ltd. | | 2.307 | | UBS AG (London) | | 12/14/18 | | | 10 | | | | 2,228 | | | | — | | | | 2,228 | |
Pou Chen Corp. | | 2.307 | | UBS AG (London) | | 12/14/18 | | | 483 | | | | 15,817 | | | | — | | | | 15,817 | |
Pure Storage, Inc. | | 2.307 | | UBS AG (London) | | 12/14/18 | | | 15 | | | | 23,547 | | | | — | | | | 23,547 | |
Qantas Airways Ltd. | | 1.850 | | UBS AG (London) | | 12/14/18 | | | 151 | | | | 13,454 | | | | — | | | | 13,454 | |
| | |
| The accompanying notes are an integral part of these financial statements. | | 53 |
GOLDMAN SACHS MULTI-MANAGER ALTERNATIVES FUND
Consolidated Schedule of Investments (continued)
October 31, 2018
|
| ADDITIONAL INVESTMENT INFORMATION (continued) |
OVER THE COUNTER TOTAL RETURN SWAP CONTRACTS# (continued)
| | | | | | | | | | | | | | | | | | | | | | |
| Reference Obligation/Index(a) | | Financing Rate
Paid (Received)
by the Fund | | Counterparty | | Termination
Date | | Notional
Amount
(000s) | | | Value | | | Upfront
Premiums
(Received)
Paid | | | Unrealized
Appreciation/
(Depreciation) | |
QBA Insurance Group Ltd. | | 1.850% | | UBS AG (London) | | 12/14/18 | | $ | 73 | | | $ | (21,355 | ) | | $ | — | | | $ | (21,355 | ) |
Ramsay Health Care Ltd. | | 1.850 | | UBS AG (London) | | 12/14/18 | | | 16 | | | | (19,151 | ) | | | — | | | | (19,151 | ) |
Reckitt Benckiser Group PLC | | 0.691 | | UBS AG (London) | | 12/14/18 | | | 6 | | | | 23,952 | | | | — | | | | 23,952 | |
Recordati SpA | | (0.456) | | UBS AG (London) | | 12/14/18 | | | 11 | | | | (6,503 | ) | | | — | | | | (6,503 | ) |
Regal Beloit Corp. | | 2.307 | | UBS AG (London) | | 12/14/18 | | | 8 | | | | 17,941 | | | | — | | | | 17,941 | |
Reliance Steel & Aluminum Co. | | 2.307 | | UBS AG (London) | | 12/14/18 | | | 8 | | | | 26,593 | | | | — | | | | 26,593 | |
RELX PLC | | 0.691 | | UBS AG (London) | | 12/14/18 | | | 29 | | | | (7,085 | ) | | | — | | | | (7,085 | ) |
Renault SA | | (0.456) | | UBS AG (London) | | 12/14/18 | | | 7 | | | | (658 | ) | | | — | | | | (658 | ) |
Renishaw PLC | | 0.691 | | UBS AG (London) | | 12/14/18 | | | 5 | | | | 17,114 | | | | — | | | | 17,114 | |
Rexel SA | | (0.456) | | UBS AG (London) | | 12/14/18 | | | 48 | | | | 1,454 | | | | — | | | | 1,454 | |
Robert Half International, Inc. | | 2.307 | | UBS AG (London) | | 12/14/18 | | | 10 | | | | 16,785 | | | | — | | | | 16,785 | |
Rockwell Automation | | 2.307 | | UBS AG (London) | | 12/14/18 | | | 2 | | | | 14,858 | | | | — | | | | 14,858 | |
Rolls-Royce Holdings PLC | | 0.691 | | UBS AG (London) | | 12/14/18 | | | 464 | | | | 3,370 | | | | — | | | | 3,370 | |
RSA Insurance Group PLC | | 0.691 | | UBS AG (London) | | 12/14/18 | | | 85 | | | | (15,755 | ) | | | — | | | | (15,755 | ) |
RWE AG | | (0.456) | | UBS AG (London) | | 12/14/18 | | | 29 | | | | 5,424 | | | | — | | | | 5,424 | |
S-Oil Corp. | | 2.307 | | UBS AG (London) | | 12/14/18 | | | 6 | | | | (27,151 | ) | | | — | | | | (27,151 | ) |
Salmar ASA | | 0.750 | | UBS AG (London) | | 12/14/18 | | | 22 | | | | 28,060 | | | | — | | | | 28,060 | |
Samsung Biologics Co. Ltd. | | 2.307 | | UBS AG (London) | | 12/14/18 | | | 2 | | | | (37,582 | ) | | | — | | | | (37,582 | ) |
Samsung Electronics Co. Ltd. | | 2.307 | | UBS AG (London) | | 12/14/18 | | | 19 | | | | 47,660 | | | | — | | | | 47,660 | |
Sartorius AG | | (0.456) | | UBS AG (London) | | 12/14/18 | | | 2 | | | | (14,378 | ) | | | — | | | | (14,378 | ) |
Schneider Electric SE | | (0.456) | | UBS AG (London) | | 12/14/18 | | | 9 | | | | 14,531 | | | | — | | | | 14,531 | |
Scotts Miracle-Gro Co. | | 2.173 | | UBS AG (London) | | 12/14/18 | | | 10 | | | | (4,307 | ) | | | — | | | | (4,307 | ) |
Seagate Technology PLC | | 2.307 | | UBS AG (London) | | 12/14/18 | | | 17 | | | | 37,162 | | | | — | | | | 37,162 | |
Seb SA | | (0.456) | | UBS AG (London) | | 12/14/18 | | | 4 | | | | (31,797 | ) | | | — | | | | (31,797 | ) |
Securitas AB | | (0.462) | | UBS AG (London) | | 12/14/18 | | | 38 | | | | (3,824 | ) | | | — | | | | (3,824 | ) |
Seek Ltd. | | 1.850 | | UBS AG (London) | | 12/14/18 | | | 48 | | | | 7,125 | | | | — | | | | 7,125 | |
Seibu Holdings, Inc. | | (0.101) | | UBS AG (London) | | 12/14/18 | | | 39 | | | | (8,381 | ) | | | — | | | | (8,381 | ) |
Sekisui Chemical Co. Ltd. | | (0.101) | | UBS AG (London) | | 12/14/18 | | | 41 | | | | 31,045 | | | | — | | | | 31,045 | |
Semiconductor MFG International Corp. | | 1.019 | | UBS AG (London) | | 12/14/18 | | | 809 | | | | (49,153 | ) | | | — | | | | (49,153 | ) |
Sempra Energy Co. | | 2.173 | | UBS AG (London) | | 12/14/18 | | | 2 | | | | 5,081 | | | | — | | | | 5,081 | |
Sensient Technologies Corp. | | 2.173 | | UBS AG (London) | | 12/14/18 | | | 6 | | | | (5,061 | ) | | | — | | | | (5,061 | ) |
Shenzhen International Holdings Ltd. | | 1.019 | | UBS AG (London) | | 12/14/18 | | | 129 | | | | 10,455 | | | | — | | | | 10,455 | |
Shinsegae Co. Ltd. | | 2.307 | | UBS AG (London) | | 12/14/18 | | | 1 | | | | 7,893 | | | | — | | | | 7,893 | |
Shionogi & Co. Ltd. | | (0.101) | | UBS AG (London) | | 12/14/18 | | | 10 | | | | 12,331 | | | | — | | | | 12,331 | |
Shiseido Co. Ltd. | | (0.101) | | UBS AG (London) | | 12/14/18 | | | 10 | | | | (34,360 | ) | | | — | | | | (34,360 | ) |
Shutterfly, Inc. | | 2.173 | | UBS AG (London) | | 12/14/18 | | | 3 | | | | 25,152 | | | | — | | | | 25,152 | |
Siemens AG | | (0.456) | | UBS AG (London) | | 12/14/18 | | | 4 | | | | 1,719 | | | | — | | | | 1,719 | |
Siemens Gamesa Renewable Energy SA | | (0.456) | | UBS AG (London) | | 05/02/19 | | | 47 | | | | 16,404 | | | | — | | | | 16,404 | |
Signet Jewelers Ltd. | | 2.173 | | UBS AG (London) | | 12/14/18 | | | 3 | | | | (4,185 | ) | | | — | | | | (4,185 | ) |
Simpson Manufacturing, Inc. | | 2.307 | | UBS AG (London) | | 12/14/18 | | | 9 | | | | 18,212 | | | | — | | | | 18,212 | |
Singapore Airlines Ltd. | | 1.500 | | UBS AG (London) | | 12/14/18 | | | 88 | | | | (9,778 | ) | | | — | | | | (9,778 | ) |
Singapore Technologies Engineering Ltd. | | 1.516 | | UBS AG (London) | | 12/14/18 | | | 215 | | | | 19,669 | | | | — | | | | 19,669 | |
Singapore Telecommunications | | 1.516 | | UBS AG (London) | | 12/14/18 | | | 114 | | | | (3,185 | ) | | | — | | | | (3,185 | ) |
SK Hynix, Inc. | | 2.307 | | UBS AG (London) | | 12/14/18 | | | 11 | | | | 11,901 | | | | — | | | | 11,901 | |
Skandinaviska Enskilda Bank | | (0.462) | | UBS AG (London) | | 12/14/18 | | | 60 | | | | 12,353 | | | | — | | | | 12,353 | |
Skanska AB | | (0.462) | | UBS AG (London) | | 12/14/18 | | | 38 | | | | (13,055 | ) | | | — | | | | (13,055 | ) |
Skechers U.S.A. Inc | | 2.307 | | UBS AG (London) | | 12/14/18 | | | 21 | | | | 36,771 | | | | — | | | | 36,771 | |
| | |
| 54 | | The accompanying notes are an integral part of these financial statements. |
GOLDMAN SACHS MULTI-MANAGER ALTERNATIVES FUND
|
| ADDITIONAL INVESTMENT INFORMATION (continued) |
OVER THE COUNTER TOTAL RETURN SWAP CONTRACTS# (continued)
| | | | | | | | | | | | | | | | | | | | | | |
| Reference Obligation/Index(a) | | Financing Rate
Paid (Received)
by the Fund | | Counterparty | | Termination
Date | | Notional
Amount
(000s) | | | Value | | | Upfront
Premiums
(Received)
Paid | | | Unrealized
Appreciation/
(Depreciation) | |
SKF AB | | (0.462)% | | UBS AG (London) | | 12/14/18 | | $ | 34 | | | $ | 21,257 | | | $ | — | | | $ | 21,257 | |
Societe Generale | | (0.456) | | UBS AG (London) | | 12/14/18 | | | 14 | | | | (4,978 | ) | | | — | | | | (4,978 | ) |
SSP Group PLC | | 0.691 | | UBS AG (London) | | 12/14/18 | | | 86 | | | | (1,106 | ) | | | — | | | | (1,106 | ) |
SSY Group Ltd. | | 1.019 | | UBS AG (London) | | 12/14/18 | | | 94 | | | | 4,425 | | | | — | | | | 4,425 | |
Stericycle, Inc. | | 2.173 | | UBS AG (London) | | 12/14/18 | | | 13 | | | | (10,941 | ) | | | — | | | | (10,941 | ) |
Stmicroelectronics NV | | (0.456) | | UBS AG (London) | | 12/14/18 | | | 32 | | | | 18,042 | | | | — | | | | 18,042 | |
Subsea 7 SA | | 0.750 | | UBS AG (London) | | 12/14/18 | | | 17 | | | | (4,859 | ) | | | — | | | | (4,859 | ) |
Sulzer Ltd. | | (0.782) | | UBS AG (London) | | 12/14/18 | | | 1 | | | | (2,712 | ) | | | — | | | | (2,712 | ) |
Sumitomo Electric Industries Ltd. | | (0.101) | | UBS AG (London) | | 12/14/18 | | | 43 | | | | 6,253 | | | | — | | | | 6,253 | |
Sumitomo Realty & Developmnt | | (0.101) | | UBS AG (London) | | 12/14/18 | | | 18 | | | | (13,814 | ) | | | — | | | | (13,814 | ) |
Sunny Optical Technology Group Co. | | 1.019 | | UBS AG (London) | | 12/14/18 | | | 64 | | | | (36,515 | ) | | | — | | | | (36,515 | ) |
Swedish Match AB | | (0.462) | | UBS AG (London) | | 12/14/18 | | | 12 | | | | 21,615 | | | | — | | | | 21,615 | |
Swedish Orphan Biovitrum AB | | (0.462) | | UBS AG (London) | | 12/14/18 | | | 38 | | | | (97,329 | ) | | | — | | | | (97,329 | ) |
Swiss Life Holding AG | | (0.782) | | UBS AG (London) | | 12/14/18 | | | 2 | | | | 11,644 | | | | — | | | | 11,644 | |
Swiss Prime Site AG | | (0.782) | | UBS AG (London) | | 12/14/18 | | | 8 | | | | (4,201 | ) | | | — | | | | (4,201 | ) |
Synopsys, Inc. | | 2.307 | | UBS AG (London) | | 12/14/18 | | | 5 | | | | 12,788 | | | | — | | | | 12,788 | |
Tabcorp Holdings Ltd. | | 1.850 | | UBS AG (London) | | 12/14/18 | | | 131 | | | | (4,932 | ) | | | — | | | | (4,932 | ) |
Tate & Lyle PLC | | 0.691 | | UBS AG (London) | | 12/14/18 | | | 56 | | | | 344 | | | | — | | | | 344 | |
Teladoc, Inc. | | 2.173 | | UBS AG (London) | | 12/14/18 | | | 4 | | | | (22,457 | ) | | | — | | | | (22,457 | ) |
Tele2 AB | | (0.462) | | UBS AG (London) | | 12/14/18 | | | 40 | | | | (7,844 | ) | | | — | | | | (7,844 | ) |
Telefonica Deutschland | | (0.456) | | UBS AG (London) | | 12/14/18 | | | 151 | | | | (35,636 | ) | | | — | | | | (35,636 | ) |
Telia Co. AB | | (0.462) | | UBS AG (London) | | 12/14/18 | | | 111 | | | | (7,574 | ) | | | — | | | | (7,574 | ) |
Tempur Sealy International, Inc. | | 2.173 | | UBS AG (London) | | 12/14/18 | | | 12 | | | | (28,073 | ) | | | — | | | | (28,073 | ) |
Tenaris SA | | (0.456) | | UBS AG (London) | | 12/14/18 | | | 36 | | | | (7,090 | ) | | | — | | | | (7,090 | ) |
Tenneco, Inc. | | 2.307 | | UBS AG (London) | | 12/14/18 | | | 13 | | | | 10,829 | | | | — | | | | 10,829 | |
Terex Corp. | | 2.307 | | UBS AG (London) | | 12/14/18 | | | 18 | | | | 44,744 | | | | — | | | | 44,744 | |
Tesla Motors, Inc. | | 2.173 | | UBS AG (London) | | 12/14/18 | | | 1 | | | | (1,938 | ) | | | — | | | | (1,938 | ) |
Teva Pharmaceutical Industries Ltd. ADR | | 2.173 | | UBS AG (London) | | 12/14/18 | | | 27 | | | | (10,605 | ) | | | — | | | | (10,605 | ) |
Thyssenkrupp AG | | (0.456) | | UBS AG (London) | | 12/14/18 | | | 25 | | | | (5,771 | ) | | | — | | | | (5,771 | ) |
Timken Co. | | 2.307 | | UBS AG (London) | | 12/14/18 | | | 17 | | | | 38,625 | | | | — | | | | 38,625 | |
Tingyi (Cayman Island) Holding | | 1.019 | | UBS AG (London) | | 12/14/18 | | | 370 | | | | 11,254 | | | | — | | | | 11,254 | |
TJX Cos., Inc. | | 2.307 | | UBS AG (London) | | 12/14/18 | | | 3 | | | | 3,906 | | | | — | | | | 3,906 | |
Toll Brothers, Inc. | | 2.307 | | UBS AG (London) | | 12/14/18 | | | 20 | | | | 62,959 | | | | — | | | | 62,959 | |
Toshiba Corp. | | (0.101) | | UBS AG (London) | | 12/14/18 | | | 22 | | | | (28,330 | ) | | | — | | | | (28,330 | ) |
Toyota Industries Corp. | | (0.101) | | UBS AG (London) | | 12/14/18 | | | 12 | | | | 4,994 | | | | — | | | | 4,994 | |
Transdigm Group, Inc. | | 2.173 | | UBS AG (London) | | 12/14/18 | | | 2 | | | | (37,260 | ) | | | — | | | | (37,260 | ) |
Travis Perkins PLC | | 0.691 | | UBS AG (London) | | 12/14/18 | | | 45 | | | | (51,319 | ) | | | — | | | | (51,319 | ) |
Treasury Wine Estates Ltd. | | 1.850 | | UBS AG (London) | | 12/14/18 | | | 49 | | | | (24,908 | ) | | | — | | | | (24,908 | ) |
Trend Micro, Inc. | | (0.101) | | UBS AG (London) | | 12/14/18 | | | 11 | | | | (27,801 | ) | | | — | | | | (27,801 | ) |
Trinity Industries, Inc. | | 2.173 | | UBS AG (London) | | 12/14/18 | | | 23 | | | | (24,265 | ) | | | — | | | | (24,265 | ) |
Tyler Technologies, Inc. | | 2.173 | | UBS AG (London) | | 12/14/18 | | | 3 | | | | (18,200 | ) | | | — | | | | (18,200 | ) |
Ubisoft Entertainment SA | | (0.456) | | UBS AG (London) | | 12/14/18 | | | 6 | | | | (32,515 | ) | | | — | | | | (32,515 | ) |
Ucb SA-NV | | (0.456) | | UBS AG (London) | | 12/14/18 | | | 4 | | | | 11,847 | | | | — | | | | 11,847 | |
Under Armour, Inc. | | 2.173 | | UBS AG (London) | | 12/14/18 | | | 24 | | | | (93,186 | ) | | | — | | | | (93,186 | ) |
Uni-President Enterprise Co. | | 2.307 | | UBS AG (London) | | 12/14/18 | | | 184 | | | | (9,751 | ) | | | — | | | | (9,751 | ) |
United Internet AG | | (0.456) | | UBS AG (London) | | 12/14/18 | | | 13 | | | | (1,865 | ) | | | — | | | | (1,865 | ) |
United Microelectronics Corp. | | 2.081 | | UBS AG (London) | | 12/14/18 | | | 1,479 | | | | (8,005 | ) | | | — | | | | (8,005 | ) |
Univar, Inc. | | 2.307 | | UBS AG (London) | | 12/14/18 | | | 23 | | | | 25,436 | | | | — | | | | 25,436 | |
| | |
| The accompanying notes are an integral part of these financial statements. | | 55 |
GOLDMAN SACHS MULTI-MANAGER ALTERNATIVES FUND
Consolidated Schedule of Investments (continued)
October 31, 2018
|
| ADDITIONAL INVESTMENT INFORMATION (continued) |
OVER THE COUNTER TOTAL RETURN SWAP CONTRACTS# (continued)
| | | | | | | | | | | | | | | | | | | | | | | | | | |
| Reference Obligation/Index(a) | | Financing Rate
Paid (Received)
by the Fund | | | Counterparty | | Termination
Date | | | Notional
Amount
(000s) | | | Value | | | Upfront
Premiums
(Received)
Paid | | | Unrealized
Appreciation/
(Depreciation) | |
Universal Display Corp. | | | 2.173% | | | UBS AG (London) | | | 12/14/18 | | | $ | 3 | | | $ | (74,167 | ) | | $ | — | | | $ | (74,167 | ) |
Upm-Kymmene Corp. | | | (0.456) | | | UBS AG (London) | | | 12/14/18 | | | | 16 | | | | 13,674 | | | | — | | | | 13,674 | |
Urban Outfitters, Inc. | | | 2.307 | | | UBS AG (London) | | | 12/14/18 | | | | 12 | | | | 5,966 | | | | — | | | | 5,966 | |
Valero Energy Corp. | | | 2.307 | | | UBS AG (London) | | | 12/14/18 | | | | 6 | | | | 21,007 | | | | — | | | | 21,007 | |
Valmet Corp. | | | (0.456) | | | UBS AG (London) | | | 12/14/18 | | | | 5 | | | | 2,701 | | | | — | | | | 2,701 | |
Valmont Industries, Inc. | | | 2.173 | | | UBS AG (London) | | | 12/14/18 | | | | 5 | | | | (38,399 | ) | | | — | | | | (38,399 | ) |
Venture Corp Ltd. | | | 1.516 | | | UBS AG (London) | | | 12/14/18 | | | | 50 | | | | (8,181 | ) | | | — | | | | (8,181 | ) |
Veoneer, Inc. | | | 0.000 | | | UBS AG (London) | | | 12/14/18 | | | | 12 | | | | (6,880 | ) | | | — | | | | (6,880 | ) |
Versum Materials, Inc. | | | 2.307 | | | UBS AG (London) | | | 12/14/18 | | | | 16 | | | | 18,278 | | | | — | | | | 18,278 | |
Vestas Wind Systems A/S | | | (0.405) | | | UBS AG (London) | | | 12/14/18 | | | | 10 | | | | 18,720 | | | | — | | | | 18,720 | |
Viacom, Inc. | | | 2.307 | | | UBS AG (London) | | | 12/14/18 | | | | 22 | | | | 32,706 | | | | — | | | | 32,706 | |
Viasat, Inc. | | | 2.173 | | | UBS AG (London) | | | 12/14/18 | | | | 9 | | | | (36,386 | ) | | | — | | | | (36,386 | ) |
Volkswagen AG | | | (0.456) | | | UBS AG (London) | | | 12/14/18 | | | | 4 | | | | (28,139 | ) | | | — | | | | (28,139 | ) |
Want Want China Holdings Ltd. | | | 1.019 | | | UBS AG (London) | | | 12/14/18 | | | | 623 | | | | 3,998 | | | | — | | | | 3,998 | |
Wartsila Oyj Abp | | | (0.456) | | | UBS AG (London) | | | 12/14/18 | | | | 33 | | | | (4,159 | ) | | | — | | | | (4,159 | ) |
Waste Connections, Inc. | | | 2.173 | | | UBS AG (London) | | | 12/14/18 | | | | 8 | | | | (31,703 | ) | | | — | | | | (31,703 | ) |
Weight Watchers International, Inc. | | | 2.307 | | | UBS AG (London) | | | 12/14/18 | | | | 1 | | | | 4,702 | | | | — | | | | 4,702 | |
Weir Group PLC | | | 0.691 | | | UBS AG (London) | | | 12/14/18 | | | | 27 | | | | (27,594 | ) | | | — | | | | (27,594 | ) |
Welbilt, Inc. | | | 2.173 | | | UBS AG (London) | | | 12/14/18 | | | | 29 | | | | (4,063 | ) | | | — | | | | (4,063 | ) |
Wesco International, Inc. | | | 2.307 | | | UBS AG (London) | | | 12/14/18 | | | | 11 | | | | 17,299 | | | | — | | | | 17,299 | |
Westinghouse Air Brake Technologies Corp. | | | 2.173 | | | UBS AG (London) | | | 12/14/18 | | | | 7 | | | | 54,749 | | | | — | | | | 54,749 | |
Westrock Co. | | | 2.307 | | | UBS AG (London) | | | 12/14/18 | | | | 15 | | | | 30,512 | | | | — | | | | 30,512 | |
Wex, Inc. | | | 2.173 | | | UBS AG (London) | | | 12/14/18 | | | | 4 | | | | (31,174 | ) | | | — | | | | (31,174 | ) |
Whirlpool Corp. | | | 2.173 | | | UBS AG (London) | | | 12/14/18 | | | | 5 | | | | (28,034 | ) | | | — | | | | (28,034 | ) |
Whitbread PLC | | | 0.691 | | | UBS AG (London) | | | 12/14/18 | | | | 9 | | | | (5,675 | ) | | | — | | | | (5,675 | ) |
Williams Cos., Inc. | | | 2.173 | | | UBS AG (London) | | | 12/14/18 | | | | 20 | | | | (5,908 | ) | | | — | | | | (5,908 | ) |
Williams-Sonoma, Inc. | | | 2.307 | | | UBS AG (London) | | | 12/14/18 | | | | 9 | | | | 28,498 | | | | — | | | | 28,498 | |
Wilmar International Ltd. | | | 1.500 | | | UBS AG (London) | | | 12/14/18 | | | | 228 | | | | (2,983 | ) | | | — | | | | (2,983 | ) |
Win Semiconductors Corp. | | | 2.307 | | | UBS AG (London) | | | 12/14/18 | | | | 48 | | | | (5,573 | ) | | | — | | | | (5,573 | ) |
Wirecard AG | | | (0.456) | | | UBS AG (London) | | | 12/14/18 | | | | 3 | | | | 16,909 | | | | — | | | | 16,909 | |
Wm Morrison Supermarkets PLC | | | 0.691 | | | UBS AG (London) | | | 12/14/18 | | | | 37 | | | | (148 | ) | | | — | | | | (148 | ) |
Wolters Kluwer NV | | | (0.456) | | | UBS AG (London) | | | 12/14/18 | | | | 12 | | | | (13,088 | ) | | | — | | | | (13,088 | ) |
Woodward, Inc. | | | 2.173 | | | UBS AG (London) | | | 12/14/18 | | | | 8 | | | | (6,324 | ) | | | — | | | | (6,324 | ) |
Wynn Resorts Ltd. | | | 2.173 | | | UBS AG (London) | | | 12/14/18 | | | | 5 | | | | (30,062 | ) | | | — | | | | (30,062 | ) |
Yahoo Japan Corp. | | | (0.101) | | | UBS AG (London) | | | 12/14/18 | | | | 174 | | | | 12,774 | | | | — | | | | 12,774 | |
Yamaha Motor Co. Ltd. | | | (0.101) | | | UBS AG (London) | | | 12/14/18 | | | | 25 | | | | (21,445 | ) | | | — | | | | (21,445 | ) |
Yamazaki Baking Co. Ltd. | | | (0.037) | | | UBS AG (London) | | | 12/14/18 | | | | 14 | | | | 1,389 | | | | — | | | | 1,389 | |
Yangzijiang Shipbuilding Holdings Ltd. | | | 1.516 | | | UBS AG (London) | | | 12/14/18 | | | | 787 | | | | 48,633 | | | | — | | | | 48,633 | |
Yara International ASA | | | 0.750 | | | UBS AG (London) | | | 12/14/18 | | | | 2 | | | | (1,898 | ) | | | — | | | | (1,898 | ) |
Zalando SE | | | (0.456) | | | UBS AG (London) | | | 12/14/18 | | | | 16 | | | | (9,666 | ) | | | — | | | | (9,666 | ) |
Zebra Technologies Corp. Class A | | | 2.307 | | | UBS AG (London) | | | 12/14/18 | | | | 1 | | | | 11,608 | | | | — | | | | 11,608 | |
Zillow Group, Inc. | | | 2.173 | | | UBS AG (London) | | | 12/14/18 | | | | 12 | | | | (37,220 | ) | | | — | | | | (37,220 | ) |
Zoetis, Inc. | | | 2.307 | | | UBS AG (London) | | | 12/14/18 | | | | 7 | | | | 3,248 | | | | — | | | | 3,248 | |
| TOTAL | | | | | | | | | | | | | | | | $ | (611,367 | ) | | $ | 662 | | | $ | (612,029 | ) |
| | |
| 56 | | The accompanying notes are an integral part of these financial statements. |
GOLDMAN SACHS MULTI-MANAGER ALTERNATIVES FUND
|
| ADDITIONAL INVESTMENT INFORMATION (continued) |
OVER THE COUNTER TOTAL RETURN SWAP CONTRACTS# (continued)
| | # | | The Fund pays/receives annual coupon payments in accordance with the swap contract(s). On the termination date of the swap contract(s), the Fund will either receive from or pay to the counterparty an amount equal to the net of the accrued financing fees and the value of the reference security subtracted from the original notional cost (notional multiplied by the price change of the reference security, converted to U.S. Dollars). |
| | * | | Rounds to less than 1,000. |
| | (a) | | Payments made monthly. |
WRITTEN AND PURCHASED OPTIONS CONTRACTS — At October 31, 2018, the Fund had the following written and purchased options:
OVER-THE-COUNTER OPTIONS ON EQUITIES
| | | | | | | | | | | | | | | | | | | | | | | | | | | | | | |
| Description | | Counterparty | | Exercise
Price | | | Expiration
Date | | | Number of
Contracts | | | Notional
Amount | | | Market
Value | | | Premiums
Paid (Received)
by Fund | | | Unrealized
Appreciation/
(Depreciation) | |
Purchased option contracts | | | | | | | | | | | | | | | | | | | | | | | | | | | | | | |
Calls | | | | | | | | | | | | | | | | | | | | | | | | | | | | | | |
Shire PLC | | MS & Co. Int. PLC | | | 200.00 | | | | 04/19/2019 | | | | 46 | | | $ | 4,600 | | | $ | 12,977 | | | $ | 12,977 | | | $ | — | |
Written option contracts | | | | | | | | | | | | | | | | | | | | | | | | | | | | | | |
Calls | | | | | | | | | | | | | | | | | | | | | | | | | | | | | | |
Red Hat, Inc. | | MS & Co. Int. PLC | | | 180.00 | | | | 12/21/2018 | | | | (15) | | | | (1,500 | ) | | | (2,220 | ) | | | (2,220 | ) | | | — | |
| TOTAL | | | | | | | | | | | | | 31 | | | $ | 3,100 | | | $ | 10,757 | | | $ | 10,757 | | | $ | — | |
|
|
Abbreviations: |
1M BID Avg—1 month Brazilian Interbank Deposit Average MS & Co. Int. PLC—Morgan Stanley & Co. International PLC |
|
| | |
| The accompanying notes are an integral part of these financial statements. | | 57 |
GOLDMAN SACHS MULTI-MANAGER ALTERNATIVES FUND
Consolidated Schedule of Investments
October 31, 2018
|
| ADDITIONAL INVESTMENT INFORMATION |
JOINT REPURCHASE AGREEMENT ACCOUNT II — At October 31, 2018, the Fund had undivided interests in the Joint Repurchase Agreement Account II, with a maturity date of November 1, 2018, as follows:
| | | | |
| Principal Amount | | Maturity Value | | Collateral Allocation Value |
| $ 62,100,000 | | $ 62,103,830 | | $ 63,342,000 |
REPURCHASE AGREEMENTS — At October 31, 2018, the Principal Amount of the Fund’s interest in the Joint Repurchase Agreement Account II was as follows:
| | | | | | | | |
| Counterparty | | Interest Rate | | | Principal Amount | |
Merrill Lynch & Co., Inc. | | | 2.220 | % | | $ | 62,100,000 | |
At October 31, 2018, the Joint Repurchase Agreement Account II was fully collateralized by:
| | | | | | | | |
| Issuer | | Interest Rates | | | Maturity Dates | |
Government National Mortgage Association | | | 4.000 | % | | | 04/20/47 | |
| | |
| 58 | | The accompanying notes are an integral part of these financial statements. |
GOLDMAN SACHS MULTI-MANAGER ALTERNATIVES FUND
Consolidated Statement of Assets and Liabilities(a)
October 31, 2018
| | | | | | |
| | | | | | |
| | Assets: | | | | |
| | Investments, at value (cost $221,214,913) | | $ | 218,590,682 | |
| | Investments of affiliated issuers, at value (cost and $187,779,673) | | | 187,779,673 | |
| | Repurchase agreement, at value which equals cost | | | 62,100,000 | |
| | Purchased options, at value (cost $12,977) | | | 12,977 | |
| | Cash | | | 4,415,887 | |
| | Foreign currencies, at value (cost $198,974) | | | 181,782 | |
| | Unrealized gain on forward foreign currency exchange contracts | | | 9,921,411 | |
| | Unrealized gain on swap contracts | | | 9,541,620 | |
| | Variation margin on futures contracts | | | 1,014,454 | |
| | Variation margin on swaps contracts | | | 87,101 | |
| | Investments sold | | | 5,387,957 | |
| | Receivables: | | | | |
| | Collateral on certain derivative contracts(b) | | | 75,504,637 | |
| | Fund shares sold | | | 953,357 | |
| | Dividends and interest | | | 812,307 | |
| | Foreign tax reclaims | | | 46,154 | |
| | Upfront payments made on swap contracts | | | 6,390 | |
| | Reimbursement from investment adviser | | | 4,876 | |
| | Other assets | | | 103,117 | |
| | Total assets | | | 576,464,382 | |
| | | | | | |
| | Liabilities: | | | | |
| | Due to custodian | | | 10,888 | |
| | Securities sold short, at value (proceeds received $13,718,648) | | | 13,394,891 | |
| | Written option contracts, at value (premium received $2,220) | | | 2,220 | |
| | Unrealized loss on forward foreign currency exchange contracts | | | 10,271,283 | |
| | Unrealized loss on swap contracts | | | 10,153,649 | |
| | Variation margin on futures contracts | | | 357,814 | |
| | Payables: | | | | |
| | Investments purchased | | | 4,454,834 | |
| | Fund shares redeemed | | | 1,720,395 | |
| | Management fees | | | 703,537 | |
| | Due to broker — upfront payment | | | 618,806 | |
| | Investments purchased on an extended settlement basis | | | 199,172 | |
| | Distribution and service fees and transfer agency fees | | | 68,975 | |
| | Dividend expense payable on securities sold short | | | 37,194 | |
| | Upfront payments received on swap contracts | | | 5,728 | |
| | Accrued expenses and other liabilities | | | 1,914,321 | |
| | Total liabilities | | | 43,913,707 | |
| | | | | | |
| | Net Assets: | | | | |
| | Paid-in capital | | | 608,406,745 | |
| | Distributable earnings (loss) | | | (75,856,070 | ) |
| | | NET ASSETS | | $ | 532,550,675 | |
| | | Net Assets: | |
| | | Class A | | $ | 19,154,923 | |
| | | Class C | | | 12,332,992 | |
| | | Institutional | | | 361,962,372 | |
| | | Investor | | | 30,347,197 | |
| | | Class P | | | 108,718,002 | |
| | | Class R | | | 25,397 | |
| | | Class R6 | | | 9,792 | |
| | | Total Net Assets | | $ | 532,550,675 | |
| | | Shares Outstanding $0.001 par value (unlimited number of shares authorized): | | | | |
| | | Class A | | | 1,933,748 | |
| | | Class C | | | 1,281,370 | |
| | | Institutional | | | 36,185,415 | |
| | | Investor | | | 3,048,612 | |
| | | Class P | | | 10,870,606 | |
| | | Class R | | | 2,586 | |
| | | Class R6 | | | 978 | |
| | | Net asset value, offering and redemption price per share:(c) | | | | |
| | | Class A | | $ | 9.91 | |
| | | Class C | | | 9.62 | |
| | | Institutional | | | 10.00 | |
| | | Investor | | | 9.95 | |
| | | Class P | | | 10.00 | |
| | | Class R | | | 9.82 | |
| | | Class R6 | | | 10.01 | |
| | (a) | | Statement of Assets and Liabilities for the Fund is consolidated and includes the balances of two wholly-owned subsidiaries, Cayman Commodity — MMA IV, Ltd. and Cayman Commodity — MMA V, Ltd. Accordingly, all interfund balances and transactions have been eliminated. |
| | (b) | | Includes segregated cash of $7,930,324, $4,617,061 and $62,957,252 relating to initial margin requirements and/or collateral on futures, forwards, and swaps transactions. |
| | (c) | | Maximum public offering price per share for Class A Shares is $10.49. At redemption, Class C shares may be subject to a contingent deferred sales charge, assessed on the amount equal to the lesser of the current net asset value (“NAV”) or the original purchase price of the shares. |
| | |
| The accompanying notes are an integral part of these financial statements. | | 59 |
GOLDMAN SACHS MULTI-MANAGER ALTERNATIVES FUND
Consolidated Statement of Operations(a)
For the Fiscal Year Ended October 31, 2018
| | | | | | |
| | | | | | |
| | Investment income: | | | | |
| | Interest | | $ | 7,479,186 | |
| | Dividends — affiliated issuers | | | 3,409,415 | |
| | Dividends — unaffiliated issuers (net of foreign withholding taxes of $43,763) | | | 2,231,528 | |
| | Total investment income | | | 13,120,129 | |
| | | | | | |
| | Expenses: | | | | |
| | Management fees | | | 13,294,866 | |
| | Custody, accounting and administrative services | | | 2,234,512 | |
| | Professional fees | | | 754,751 | |
| | Transfer Agency fees(b) | | | 415,714 | |
| | Dividend expense for securities sold short | | | 313,881 | |
| | Prime broker fees | | | 253,581 | |
| | Printing and mailing costs | | | 288,116 | |
| | Distribution and Service fees(b) | | | 267,130 | |
| | Trustee fees | | | 44,507 | |
| | Other | | | 167,460 | |
| | Total expenses | | | 18,034,518 | |
| | Less — expense reductions | | | (3,956,509 | ) |
| | Net expenses | | | 14,078,009 | |
| | NET INVESTMENT LOSS | | | (957,880 | ) |
| | | | | | |
| | Realized and unrealized gain (loss): | | | | |
| | Net realized gain (loss) from: | | | | |
| | Investments (including commission recapture of $3,104) | | | 23,585,076 | |
| | Securities short sales | | | (3,491,025 | ) |
| | Purchased options | | | (3,198,410 | ) |
| | Futures contracts | | | 7,694,345 | |
| | Written options | | | 3,278,535 | |
| | Swap contracts | | | (17,682,860 | ) |
| | Forward foreign currency exchange contracts | | | (2,869,236 | ) |
| | Foreign currency transactions | | | 1,359,535 | |
| | Net change in unrealized gain (loss) on: | | | | |
| | Investments | | | (28,043,553 | ) |
| | Securities short sales | | | 3,190,558 | |
| | Purchased options | | | 144,668 | |
| | Futures contracts | | | (2,938,222 | ) |
| | Unfunded loan commitments | | | 1,263 | |
| | Written options | | | (49,584 | ) |
| | Swap contracts | | | 1,497,139 | |
| | Forward foreign currency exchange contracts | | | 1,511,497 | |
| | Foreign currency translation | | | (199,101 | ) |
| | Net realized and unrealized loss | | | (16,209,375 | ) |
| | NET DECREASE IN NET ASSETS RESULTING FROM OPERATIONS | | $ | (17,167,255 | ) |
| | (a) | | Statement of Operations for the Fund is consolidated and includes the balances of four wholly-owned subsidiaries, Cayman Commodity — MMA, Ltd., Cayman Commodity — MMA II, Ltd., Cayman Commodity — MMA IV, Ltd. and Cayman Commodity — MMA V, Ltd. Accordingly, all interfund balances and transactions have been eliminated. |
| | (b) | | Class specific Distribution and Service, and Transfer Agency fees were as follows: |
| | | | | | | | | | | | | | | | | | | | | | | | | | | | | | | | | | | | | | |
| Distribution and Service Fees | | | Transfer Agency Fees | |
Class A | | | Class C | | | Class R | | | Class A | | | Class C | | | Institutional | | | Investor | | | Class P(c) | | | Class R | | | Class R6(d) | |
| $ | 66,571 | | | $ | 200,172 | | | $ | 387 | | | $ | 47,682 | | | $ | 35,832 | | | $ | 223,686 | | | $ | 95,494 | | | $ | 12,879 | | | $ | 139 | | | $ | 2 | |
| | (c) | | Commenced operations on April 16, 2018. |
| | (d) | | Commenced operations on February 28, 2018. |
| | |
| 60 | | The accompanying notes are an integral part of these financial statements. |
GOLDMAN SACHS MULTI-MANAGER ALTERNATIVES FUND
Consolidated Statements of Changes in Net Assets(a)
| | | | | | | | | | |
| | | | | For the Fiscal
Year Ended
October 31, 2018 | | | For the Fiscal
Year Ended
October 31, 2017 | |
| | From operations: | |
| | Net investment loss | | $ | (957,880 | ) | | $ | (612,843 | ) |
| | Net realized gain (loss) | | | 8,675,960 | | | | (1,207,201 | ) |
| | Net change in unrealized gain (loss) | | | (24,885,335 | ) | | | 17,303,945 | |
| | Net increase (decrease) in net assets resulting from operations | | | (17,167,255 | ) | | | 15,483,901 | |
| | | | | | | | | | |
| | Distributions to shareholders: | | | | | | | | |
| | From distributable earnings: | | | | | | | | |
| | Class A Shares | | | — | | | | (1,610,383 | )(b) |
| | Class C Shares | | | — | | | | (200,238 | )(b) |
| | Institutional Shares | | | — | | | | (17,692,086 | )(b) |
| | Investor Shares | | | — | | | | (1,952,133 | )(b) |
| | Class R Shares | | | — | | | | (1,227 | )(b) |
| | Total distributions to shareholders | | | — | | | | (21,456,067 | ) |
| | | | | | | | | | |
| | From share transactions: | | | | | | | | |
| | Proceeds from sales of shares | | | 263,366,454 | | | | 479,385,280 | |
| | Reinvestment of distributions | | | — | | | | 19,961,361 | |
| | Cost of shares redeemed | | | (684,149,192 | ) | | | (719,905,857 | ) |
| | Net decrease in net assets resulting from share transactions | | | (420,782,738 | ) | | | (220,559,216 | ) |
| | TOTAL DECREASE | | | (437,949,993 | ) | | | (226,531,382 | ) |
| | | | | | | | | | |
| | Net assets(c) | | | | | | | | |
| | Beginning of year | | | 970,500,668 | | | | 1,197,032,050 | |
| | End of year | | $ | 532,550,675 | | | $ | 970,500,668 | |
| | (a) | | Statements of Changes in Net Assets for the Fund is consolidated and includes the balances of four wholly-owned subsidiaries, Cayman Commodity — MMA, Ltd., Cayman Commodity — MMA II, Ltd., Cayman Commodity — MMA IV, Ltd. and Cayman Commodity — MMA V, Ltd. Accordingly, all interfund balances and transactions have been eliminated. |
| | (b) | | Prior year information has been revised to conform to current year presentation. Distributions to shareholders for the Fund consisted solely of net investment income for the fiscal year ended October 31, 2017. |
| | (c) | | Prior fiscal year information has been revised to conform with current year presentation. Distributions in excess of net investment income was $(570,495) as of October 31, 2017. |
| | |
| The accompanying notes are an integral part of these financial statements. | | 61 |
GOLDMAN SACHS MULTI-MANAGER ALTERNATIVES FUND
Consolidated Financial Highlights
Selected Share Data for a Share Outstanding Throughout Each Period
| | | | | | | | | | | | | | | | | | | | | | | | | | |
| | | | | Goldman Sachs Multi-Manager Alternatives Fund | |
| | | | | Class A Shares | |
| | | | | Year Ended October 31, | | | Period Ended January 1 –
October 31 2015 | | | Year Ended
December 31, 2014 | | | Period Ended
December 31, 2013(e) | |
| | | | | 2018 | | | 2017 | | | 2016 | |
| | Per Share Data | | | | | | | | | | | | | | | | | | | | | | | | |
| | Net asset value, beginning of period | | $ | 10.22 | | | $ | 10.25 | | | $ | 10.33 | | | $ | 10.58 | | | $ | 10.46 | | | $ | 10.00 | |
| | Net investment income (loss)(a) | | | (0.04 | ) | | | (0.02 | ) | | | 0.04 | | | | (0.03 | ) | | | (0.06 | ) | | | (0.03 | ) |
| | Net realized and unrealized gain (loss) | | | (0.27 | ) | | | 0.13 | | | | (0.06 | ) | | | (0.22 | ) | | | 0.33 | | | | 0.55 | |
| | Total from investment operations | | | (0.31 | ) | | | 0.11 | | | | (0.02 | ) | | | (0.25 | ) | | | 0.27 | | | | 0.52 | |
| | Distributions to shareholders from net investment income | | | — | | | | (0.14 | ) | | | (0.01 | ) | | | — | | | | (0.03 | ) | | | — | |
| | Distributions to shareholder from net realized gains | | | — | | | | — | | | | (0.05 | ) | | | — | | | | (0.12 | ) | | | (0.06 | ) |
| | Total distributions | | | — | | | | (0.14 | ) | | | (0.06 | ) | | | — | | | | (0.15 | ) | | | (0.06 | ) |
| | Net asset value, end of period | | $ | 9.91 | | | $ | 10.22 | | | $ | 10.25 | | | $ | 10.33 | | | $ | 10.58 | | | $ | 10.46 | |
| | Total return(b) | | | (3.03 | )% | | | 1.08 | % | | | (0.23 | )% | | | (2.36 | )% | | | 2.61 | % | | | 5.20 | % |
| | Net assets, end of year (in 000s) | | $ | 19,155 | | | $ | 37,077 | | | $ | 134,843 | | | $ | 217,307 | | | $ | 116,593 | | | $ | 25,304 | |
| | Ratio of net expenses to average net assets (including dividend and interest payments and other expenses relating to securities sold short) | | | 2.31 | % | | | 2.51 | % | | | 2.65 | % | | | 2.89 | %(c) | | | 2.85 | % | | | 2.55 | %(c) |
| | Ratio of net expenses to average net assets (excluding dividend and interest payments and other expenses relating to securities sold short) | | | 2.23 | % | | | 2.38 | % | | | 2.41 | % | | | 2.56 | %(c) | | | 2.56 | % | | | 2.55 | %(c) |
| | Ratio of total expenses to average net assets (including dividend and interest payments and other expenses relating to securities sold short) | | | 2.91 | % | | | 2.74 | % | | | 2.85 | % | | | 2.97 | %(c) | | | 3.23 | % | | | 3.88 | %(c) |
| | Ratio of total expenses to average net assets (excluding dividend and interest payments and other expenses relating to securities sold short) | | | 2.82 | % | | | 2.62 | % | | | 2.60 | % | | | 2.63 | %(c) | | | 2.94 | % | | | 3.88 | %(c) |
| | Ratio of net investment income (loss) to average net assets | | | (0.43 | )% | | | (0.22 | )% | | | 0.39 | % | | | (0.29 | )%(c) | | | (0.53 | )% | | | (0.42 | )%(c) |
| | Portfolio turnover rate(d) | | | 232 | % | | | 112 | % | | | 73 | % | | | 130 | % | | | 144 | % | | | 102 | % |
| | (a) | | Calculated based on the average shares outstanding methodology. |
| | (b) | | Assumes investment at the NAV at the beginning of the period, reinvestment of all dividends and distributions, a complete redemption of the investment at the NAV at the end of the period and no sales or redemption charges. Total returns would be reduced if a sales or redemption charge was taken into account. Returns do not reflect the impact of taxes to shareholders relating to Fund distributions or the redemption of Fund shares. Total returns for periods less than one full year are not annualized. |
| | (d) | | The Fund’s portfolio turnover rate is calculated in accordance with regulatory requirements, without regard to transactions involving short term investments and certain derivatives. If such transactions were included, the Fund’s portfolio turnover rate may be higher. |
| | (e) | | Commenced operations on April 30, 2013. |
| | |
| 62 | | The accompanying notes are an integral part of these financial statements. |
GOLDMAN SACHS MULTI-MANAGER ALTERNATIVES FUND
Consolidated Financial Highlights (continued)
Selected Share Data for a Share Outstanding Throughout Each Period
| | | | | | | | | | | | | | | | | | | | | | | | | | |
| | | | | Goldman Sachs Multi-Manager Alternatives Fund | |
| | | | | Class C Shares | |
| | | | | Year Ended October 31, | | | Period Ended January 1 –
October 31 2015 | | | Year Ended
December 31, 2014 | | | Period Ended
December 31, 2013(f) | |
| | | | | 2018 | | | 2017 | | | 2016 | |
| | Per Share Data | | | | | | | | | | | | | | | | | | | | | | | | |
| | Net asset value, beginning of period | | $ | 10.00 | | | $ | 10.02 | | | $ | 10.16 | | | $ | 10.47 | | | $ | 10.40 | | | $ | 10.00 | |
| | Net investment loss(a) | | | (0.12 | ) | | | (0.11 | ) | | | (0.04 | ) | | | (0.09 | ) | | | (0.14 | ) | | | (0.08 | ) |
| | Net realized and unrealized gain (loss) | | | (0.26 | ) | | | 0.13 | | | | (0.05 | ) | | | (0.22 | ) | | | 0.33 | | | | 0.54 | |
| | Total from investment operations | | | (0.38 | ) | | | 0.02 | | | | (0.09 | ) | | | (0.31 | ) | | | 0.19 | | | | 0.46 | |
| | Distributions to shareholders from net investment income | | | — | | | | (0.04 | ) | | | — | | | | — | | | | — | (b) | | | — | |
| | Distributions to shareholders from net realized gains | | | — | | | | — | | | | (0.05 | ) | | | — | | | | (0.12 | ) | | | (0.06 | ) |
| | Total Distributions | | | — | | | | (0.04 | ) | | | (0.05 | ) | | | — | | | | (0.12 | ) | | | (0.06 | ) |
| | Net asset value, end of period | | $ | 9.62 | | | $ | 10.00 | | | $ | 10.02 | | | $ | 10.16 | | | $ | 10.47 | | | $ | 10.40 | |
| | Total return(c) | | | (3.70 | )% | | | 0.23 | % | | | (1.02 | )% | | | (2.87 | )% | | | 1.84 | % | | | 4.60 | % |
| | Net assets, end of year (in 000s) | | $ | 12,333 | | | $ | 29,758 | | | $ | 49,334 | | | $ | 79,891 | | | $ | 38,207 | | | $ | 1,427 | |
| | Ratio of net expenses to average net assets (including dividend and interest payments and other expenses relating to securities sold short) | | | 3.07 | % | | | 3.26 | % | | | 3.40 | % | | | 3.64 | %(d) | | | 3.64 | % | | | 3.30 | %(d) |
| | Ratio of net expenses to average net assets (excluding dividend and interest payments and other expenses relating to securities sold short) | | | 2.99 | % | | | 3.13 | % | | | 3.16 | % | | | 3.31 | %(d) | | | 3.31 | % | | | 3.30 | %(d) |
| | Ratio of total expenses to average net assets (including dividend and interest payments and other expenses relating to securities sold short) | | | 3.65 | % | | | 3.54 | % | | | 3.60 | % | | | 3.72 | %(d) | | | 3.99 | % | | | 4.72 | %(d) |
| | Ratio of total expenses to average net assets (excluding dividend and interest payments and other expenses relating to securities sold short) | | | 3.57 | % | | | 3.41 | % | | | 3.36 | % | | | 3.38 | %(d) | | | 3.66 | % | | | 4.72 | %(d) |
| | Ratio of net investment loss to average net assets | | | (1.23 | )% | | | (1.07 | )% | | | (0.35 | )% | | | (1.04 | )%(d) | | | (1.33 | )% | | | (1.19 | )%(d) |
| | Portfolio turnover rate(e) | | | 232 | % | | | 112 | % | | | 73 | % | | | 130 | % | | | 144 | % | | | 102 | % |
| | (a) | | Calculated based on the average shares outstanding methodology. |
| | (b) | | Amount is less than $0.005 per share. |
| | (c) | | Assumes investment at the NAV at the beginning of the period, reinvestment of all dividends and distributions, a complete redemption of the investment at the NAV at the end of the period and no sales or redemption charges. Total returns would be reduced if a sales or redemption charge was taken into account. Returns do not reflect the impact of taxes to shareholders relating to Fund distributions or the redemption of Fund shares. |
| | (e) | | The Fund’s portfolio turnover rate is calculated in accordance with regulatory requirements, without regard to transactions involving short term investments and certain derivatives. If such transactions were included, the Fund’s portfolio turnover rate may be higher. |
| | (f) | | Commenced operations on April 30, 2013. |
| | |
| The accompanying notes are an integral part of these financial statements. | | 63 |
GOLDMAN SACHS MULTI-MANAGER ALTERNATIVES FUND
Consolidated Financial Highlights (continued)
Selected Share Data for a Share Outstanding Throughout Each Period
| | | | | | | | | | | | | | | | | | | | | | | | | | |
| | | | | Goldman Sachs Multi-Manager Alternatives Fund | |
| | | | | Institutional Shares | |
| | | | | Year Ended October 31, | | | Period Ended January 1 –
October 31 2015 | | | Year Ended
December 31, 2014 | | | Period Ended December 31, 2013(f) | |
| | | | | 2018 | | | 2017 | | | 2016 | |
| | Per Share Data | | | | | | | | | | | | | | | | | | | | | | | | |
| | Net asset value, beginning of period | | $ | 10.28 | | | $ | 10.33 | | | $ | 10.40 | | | $ | 10.61 | | | $ | 10.49 | | | $ | 10.00 | |
| | Net investment income (loss)(a) | | | (0.01 | ) | | | — | (b) | | | 0.08 | | | | 0.01 | | | | (0.01 | ) | | | (0.01 | ) |
| | Net realized and unrealized gain (loss) | | | (0.27 | ) | | | 0.15 | | | | (0.07 | ) | | | (0.22 | ) | | | 0.31 | | | | 0.56 | |
| | Total from investment operations | | | (0.28 | ) | | | 0.15 | | | | 0.01 | | | | (0.21 | ) | | | 0.30 | | | | 0.55 | |
| | Distributions to shareholders from net investment income | | | — | | | | (0.20 | ) | | | (0.03 | ) | | | — | | | | (0.06 | ) | | | — | |
| | Distributions to shareholders from net realized gains | | | — | | | | — | | | | (0.05 | ) | | | — | | | | (0.12 | ) | | | (0.06 | ) |
| | Total Distributions | | | — | | | | (0.20 | ) | | | (0.08 | ) | | | — | | | | (0.18 | ) | | | (0.06 | ) |
| | Net asset value, end of period | | $ | 10.00 | | | $ | 10.28 | | | $ | 10.33 | | | $ | 10.40 | | | $ | 10.61 | | | $ | 10.49 | |
| | Total return(c) | | | (2.72 | )% | | | 1.47 | % | | | 0.13 | % | | | (1.98 | )% | | | 3.00 | % | | | 5.40 | % |
| | Net assets, end of year (in 000s) | | $ | 361,962 | | | $ | 807,918 | | | $ | 903,812 | | | $ | 1,236,592 | | | $ | 628,397 | | | $ | 156,849 | |
| | Ratio of net expenses to average net assets (including dividend and interest payments and other expenses relating to securities sold short) | | | 1.97 | % | | | 2.11 | % | | | 2.25 | % | | | 2.49 | %(d) | | | 2.45 | % | | | 2.15 | %(d) |
| | Ratio of net expenses to average net assets (excluding dividend and interest payments and other expenses relating to securities sold short) | | | 1.89 | % | | | 1.98 | % | | | 2.01 | % | | | 2.16 | %(d) | | | 2.16 | % | | | 2.15 | %(d) |
| | Ratio of total expenses to average net assets (including dividend and interest payments and other expenses relating to securities sold short) | | | 2.51 | % | | | 2.40 | % | | | 2.45 | % | | | 2.57 | %(d) | | | 2.82 | % | | | 3.64 | %(d) |
| | Ratio of total expenses to average net assets (excluding dividend and interest payments and other expenses relating to securities sold short) | | | 2.43 | % | | | 2.28 | % | | | 2.21 | % | | | 2.24 | %(d) | | | 2.53 | % | | | 3.64 | %(d) |
| | Ratio of net investment income (loss) to average net assets | | | (0.12 | )% | | | 0.02 | % | | | 0.81 | % | | | 0.11 | %(d) | | | (0.11 | )% | | | (0.17 | )%(d) |
| | Portfolio turnover rate(e) | | | 232 | % | | | 112 | % | | | 73 | % | | | 130 | % | | | 144 | % | | | 102 | % |
| | (a) | | Calculated based on the average shares outstanding methodology. |
| | (b) | | Amount is less than $0.005 per share. |
| | (c) | | Assumes investment at the NAV at the beginning of the period, reinvestment of all dividends and distributions, a complete redemption of the investment at the NAV at the end of the period and no sales or redemption charges. Total returns would be reduced if a sales or redemption charge was taken into account. Returns do not reflect the impact of taxes to shareholders relating to Fund distributions or the redemption of Fund shares. Total returns for periods less than one full year are not annualized. |
| | (e) | | The Fund’s portfolio turnover rate is calculated in accordance with regulatory requirements, without regard to transactions involving short term investments and certain derivatives. If such transactions were included, the Fund’s portfolio turnover rate may be higher. |
| | (f) | | Commenced operations on April 30, 2013. |
| | |
| 64 | | The accompanying notes are an integral part of these financial statements. |
GOLDMAN SACHS MULTI-MANAGER ALTERNATIVES FUND
Consolidated Financial Highlights (continued)
Selected Share Data for a Share Outstanding Throughout Each Period
| | | | | | | | | | | | | | | | | | | | | | | | | | |
| | | | | Goldman Sachs Multi-Manager Alternatives Fund | |
| | | | | Investor Shares | |
| | | | | Year Ended October 31, | | | Period Ended January 1 –
October 31 2015 | | | Year Ended
December 31, 2014 | | | Period Ended December 31, 2013(f) | |
| | | | | 2018 | | | 2017 | | | 2016 | |
| | Per Share Data | | | | | | | | | | | | | | | | | | | | | | | | |
| | Net asset value, beginning of period | | $ | 10.24 | | | $ | 10.30 | | | $ | 10.37 | | | $ | 10.60 | | | $ | 10.48 | | | $ | 10.00 | |
| | Net investment income (loss)(a) | | | (0.03 | ) | | | (0.01 | ) | | | 0.07 | | | | — | (b) | | | (0.03 | ) | | | (0.01 | ) |
| | Net realized and unrealized gain (loss) | | | (0.26 | ) | | | 0.14 | | | | (0.07 | ) | | | (0.23 | ) | | | 0.33 | | | | 0.55 | |
| | Total from investment operations | | | (0.29 | ) | | | 0.13 | | | | — | | | | (0.23 | ) | | | 0.30 | | | | 0.54 | |
| | Distributions to shareholders from net investment income | | | — | | | | (0.19 | ) | | | (0.02 | ) | | | — | | | | (0.06 | ) | | | — | |
| | Distributions to shareholders from net realized gains | | | — | | | | — | | | | (0.05 | ) | | | — | | | | (0.12 | ) | | | (0.06 | ) |
| | Total distributions | | | — | | | | (0.19 | ) | | | (0.07 | ) | | | — | | | | (0.18 | ) | | | (0.06 | ) |
| | Net asset value, end of period | | $ | 9.95 | | | $ | 10.24 | | | $ | 10.30 | | | $ | 10.37 | | | $ | 10.60 | | | $ | 10.48 | |
| | Total return(c) | | | (2.73 | )% | | | 1.23 | % | | | (0.06 | )% | | | (2.08 | )% | | | 2.85 | % | | | 5.40 | % |
| | Net assets, end of Year (in 000s) | | $ | 30,347 | | | $ | 95,628 | | | $ | 108,924 | | | $ | 119,570 | | | $ | 42,894 | | | $ | 7,051 | |
| | Ratio of net expenses to average net assets (including dividend and interest payments and other expenses relating to securities sold short) | | | 2.09 | % | | | 2.26 | % | | | 2.39 | % | | | 2.64 | %(d) | | | 2.62 | % | | | 2.30 | %(d) |
| | Ratio of net expenses to average net assets (excluding dividend and interest payments and other expenses relating to securities sold short) | | | 2.01 | % | | | 2.13 | % | | | 2.16 | % | | | 2.31 | %(d) | | | 2.31 | % | | | 2.30 | %(d) |
| | Ratio of total expenses to average net assets (including dividend and interest payments and other expenses relating to securities sold short) | | | 2.64 | % | | | 2.54 | % | | | 2.61 | % | | | 2.72 | %(d) | | | 3.06 | % | | | 3.62 | %(d) |
| | Ratio of total expenses to average net assets (excluding dividend and interest payments and other expenses relating to securities sold short) | | | 2.56 | % | | | 2.42 | % | | | 2.38 | % | | | 2.38 | %(d) | | | 2.73 | % | | | 3.62 | %(d) |
| | Ratio of net investment income to average net assets | | | (0.26 | )% | | | (0.13 | )% | | | 0.70 | % | | | (0.02 | )%(d) | | | (0.27 | )% | | | (0.19 | )%(d) |
| | Portfolio turnover rate(e) | | | 232 | % | | | 112 | % | | | 73 | % | | | 130 | % | | | 144 | % | | | 102 | % |
| | (a) | | Calculated based on the average shares outstanding methodology. |
| | (b) | | Amount is less than $0.005 per share. |
| | (c) | | Assumes investment at the NAV at the beginning of the period, reinvestment of all dividends and distributions, a complete redemption of the investment at the NAV at the end of the period and no sales or redemption charges. Total returns would be reduced if a sales or redemption charge was taken into account. Returns do not reflect the impact of taxes to shareholders relating to Fund distributions or the redemption of Fund shares. Total returns for periods less than one full year are not annualized. |
| | (e) | | The Fund’s portfolio turnover rate is calculated in accordance with regulatory requirements, without regard to transactions involving short term investments and certain derivatives. If such transactions were included, the Fund’s portfolio turnover rate may be higher. |
| | (f) | | Commenced operations on April 30, 2013. |
| | |
| The accompanying notes are an integral part of these financial statements. | | 65 |
GOLDMAN SACHS MULTI-MANAGER ALTERNATIVES FUND
Consolidated Financial Highlights (continued)
Selected Share Data for a Share Outstanding Throughout the Period
| | | | | | |
| | | | | Goldman Sachs Multi-Manager
Alternatives Fund | |
| | | | | Class P Shares | |
| | | | | Period Ended October 31, | |
| | | | | 2018(a) | |
| | Per Share Data | | | | |
| | Net asset value, beginning of period | | $ | 10.21 | |
| | Net investment income(b) | | | 0.02 | |
| | Net realized and unrealized loss | | | (0.23 | ) |
| | Total from investment operations | | | (0.21 | ) |
| | Net asset value, end of period | | $ | 10.00 | |
| | Total return(c) | | | (2.06 | )% |
| | Net assets, end of period (in 000s) | | $ | 108,718 | |
| | Ratio of net expenses to average net assets (including dividend and interest payments and other expenses relating to securities sold short) | | | 1.83 | %(d) |
| | Ratio of net expenses to average net assets (excluding dividend and interest payments and other expenses relating to securities sold short) | | | 1.74 | %(d) |
| | Ratio of total expenses to average net assets (including dividend and interest payments and other expenses relating to securities sold short) | | | 2.68 | %(d) |
| | Ratio of total expenses to average net assets (excluding dividend and interest payments and other expenses relating to securities sold short) | | | 2.58 | %(d) |
| | Ratio of net investment income to average net assets | | | 0.45 | %(d) |
| | Portfolio turnover rate(e) | | | 232 | % |
| | (a) | | Commenced operations on April 16, 2018. |
| | (b) | | Calculated based on the average shares outstanding methodology. |
| | (c) | | Assumes investment at the NAV at the beginning of the period, reinvestment of all dividends and distributions, a complete redemption of the investment at the NAV at the end of the period and no sales or redemption charges. Total returns would be reduced if a sales or redemption charge was taken into account. Returns do not reflect the impact of taxes to shareholders relating to Fund distributions or the redemption of Fund shares. Total returns for periods less than one full year are not annualized. |
| | (e) | | The Fund’s portfolio turnover rate is calculated in accordance with regulatory requirements, without regard to transactions involving short term investments and certain derivatives. If such transactions were included, the Fund’s portfolio turnover rate may be higher. |
| | |
| 66 | | The accompanying notes are an integral part of these financial statements. |
GOLDMAN SACHS MULTI-MANAGER ALTERNATIVES FUND
Consolidated Financial Highlights (continued)
Selected Share Data for a Share Outstanding Throughout Each Period
| | | | | | | | | | | | | | | | | | | | | | | | | | |
| | | | | Goldman Sachs Multi-Manager Alternatives Fund | |
| | | | | Class R Shares | |
| | | | | Year Ended October 31, | | | Period Ended January 1 – October 31 2015 | | | Year Ended
December 31, 2014 | | | Period Ended December 31, 2013(f) | |
| | | | | 2018 | | | 2017 | | | 2016 | |
| | Per Share Data | | | | | | | | | | | | | | | | | | | | | | | | |
| | Net asset value, beginning of period | | $ | 10.15 | | | $ | 10.18 | | | $ | 10.29 | | | $ | 10.56 | | | $ | 10.44 | | | $ | 10.00 | |
| | Net investment income (loss)(a) | | | (0.09 | ) | | | (0.06 | ) | | | 0.01 | | | | (0.04 | ) | | | (0.07 | ) | | | (0.06 | ) |
| | Net realized and unrealized gain (loss) | | | (0.24 | ) | | | 0.14 | | | | (0.05 | ) | | | (0.23 | ) | | | 0.31 | | | | 0.56 | |
| | Total from investment operations | | | (0.33 | ) | | | 0.08 | | | | (0.04 | ) | | | (0.27 | ) | | | 0.24 | | | | 0.50 | |
| | Distributions to shareholders from net investment income | | | — | | | | (0.11 | ) | | | (0.02 | ) | | | — | | | | — | (b) | | | — | |
| | Distributions to shareholders from net realized gains | | | — | | | | — | | | | (0.05 | ) | | | — | | | | (0.12 | ) | | | (0.06 | ) |
| | Total distributions | | | — | | | | (0.11 | ) | | | (0.07 | ) | | | — | | | | (0.12 | ) | | | (0.06 | ) |
| | Net asset value, end of period | | $ | 9.82 | | | $ | 10.15 | | | $ | 10.18 | | | $ | 10.29 | | | $ | 10.56 | | | $ | 10.44 | |
| | Total return(c) | | | (3.25 | )% | | | 0.73 | % | | | (0.40 | )% | | | (2.56 | )% | | | 2.30 | % | | | 5.00 | % |
| | Net assets, end of Year (in 000s) | | $ | 25 | | | $ | 120 | | | $ | 119 | | | $ | 87 | | | $ | 30 | | | $ | 26 | |
| | Ratio of net expenses to average net assets (including dividend and interest payments and other expenses relating to securities sold short) | | | 2.61 | % | | | 2.76 | % | | | 2.91 | % | | | 3.14 | %(d) | | | 3.05 | % | | | 2.79 | %(d) |
| | Ratio of net expenses to average net assets (excluding dividend and interest payments and other expenses relating to securities sold short) | | | 2.53 | % | | | 2.63 | % | | | 2.66 | % | | | 2.81 | %(d) | | | 2.81 | % | | | 2.79 | %(d) |
| | Ratio of total expenses to average net assets (including dividend and interest payments and other expenses relating to securities sold short) | | | 3.12 | % | | | 3.07 | % | | | 3.11 | % | | | 3.24 | %(d) | | | 3.46 | % | | | 4.36 | %(d) |
| | Ratio of total expenses to average net assets (excluding dividend and interest payments and other expenses relating to securities sold short) | | | 3.04 | % | | | 2.94 | % | | | 2.85 | % | | | 2.90 | %(d) | | | 3.22 | % | | | 4.36 | %(d) |
| | Ratio of net investment income (loss) to average net assets | | | (0.91 | )% | | | (0.63 | )% | | | 0.07 | % | | | (0.49 | )%(d) | | | (0.69 | )% | | | (0.90 | )%(d) |
| | Portfolio turnover rate(e) | | | 232 | % | | | 112 | % | | | 73 | % | | | 130 | % | | | 144 | % | | | 102 | % |
| | (a) | | Calculated based on the average shares outstanding methodology. |
| | (b) | | Amount is less than $0.005 per share. |
| | (c) | | Assumes investment at the NAV at the beginning of the period, reinvestment of all dividends and distributions, a complete redemption of the investment at the NAV at the end of the period and no sales or redemption charges. Total returns would be reduced if a sales or redemption charge was taken into account. Returns do not reflect the impact of taxes to shareholders relating to Fund distributions or the redemption of Fund shares. Total returns for periods less than one full year are not annualized. |
| | (e) | | The Fund’s portfolio turnover rate is calculated in accordance with regulatory requirements, without regard to transactions involving short term investments and certain derivatives. If such transactions were included, the Fund’s portfolio turnover rate may be higher. |
| | (f) | | Commenced operations on April 30, 2013. |
| | |
| The accompanying notes are an integral part of these financial statements. | | 67 |
GOLDMAN SACHS MULTI-MANAGER ALTERNATIVES FUND
Consolidated Financial Highlights (continued)
Selected Share Data for a Share Outstanding Throughout the Period
| | | | | | |
| | | | | Goldman Sachs Multi-
Manager Alternatives
Fund | |
| | | | | Class R6 Shares | |
| | | | | Period Ended
October 31, | |
| | | | | 2018(a) | |
| | Per Share Data | | | | |
| | Net asset value, beginning of period | | $ | 10.22 | |
| | Net investment income(b) | | | 0.01 | |
| | Net realized and unrealized loss | | | (0.22 | ) |
| | Total from investment operations | | | (0.21 | ) |
| | Net asset value, end of period | | $ | 10.01 | |
| | Total return(c) | | | (2.05 | )% |
| | Net assets, end of Year (in 000s) | | $ | 10 | |
| | Ratio of net expenses to average net assets (including dividend and interest payments and other expenses relating to securities sold short) | | | 1.90 | %(d) |
| | Ratio of net expenses to average net assets (excluding dividend and interest payments and other expenses relating to securities sold short) | | | 1.81 | %(d) |
| | Ratio of total expenses to average net assets (including dividend and interest payments and other expenses relating to securities sold short) | | | 2.63 | %(d) |
| | Ratio of total expenses to average net assets (excluding dividend and interest payments and other expenses relating to securities sold short) | | | 2.54 | %(d) |
| | Ratio of net investment income to average net assets | | | 0.13 | %(d) |
| | Portfolio turnover rate(e) | | | 232 | % |
| | (a) | | Commenced operations on February 28, 2018. |
| | (b) | | Calculated based on the average shares outstanding methodology. |
| | (c) | | Assumes investment at the NAV at the beginning of the period, reinvestment of all dividends and distributions, a complete redemption of the investment at the NAV at the end of the period and no sales or redemption charges. Total returns would be reduced if a sales or redemption charge was taken into account. Returns do not reflect the impact of taxes to shareholders relating to Fund distributions or the redemption of Fund shares. Total returns for periods less than one full year are not annualized. |
| | (e) | | The Fund’s portfolio turnover rate is calculated in accordance with regulatory requirements, without regard to transactions involving short term investments and certain derivatives. If such transactions were included, the Fund’s portfolio turnover rate may be higher. |
| | |
| 68 | | The accompanying notes are an integral part of these financial statements. |
GOLDMAN SACHS MULTI-MANAGER ALTERNATIVES FUND
Consolidated Notes to Financial Statements
October 31, 2018
Goldman Sachs Trust II (the “Trust”) is a Delaware statutory trust registered under the Investment Company Act of 1940, as amended (the “Act”), as an open-end management investment company. The Trust includes the Goldman Sachs Multi-Manager Alternatives Fund (the “Fund”). The Fund is a diversified portfolio and currently offers seven classes of shares: Class A, Class C, Institutional, Investor, Class P, Class R and Class R6 Shares. Effective April 16, 2018 and February 28, 2018, the Fund launched Class P and Class R6 Shares, respectively.
Class A Shares are sold with a front-end sales charge of up to 5.50%. Class C Shares are sold with a contingent deferred sales charge (“CDSC”) of 1.00%, which is imposed on redemptions made within 12 months of purchase. Institutional, Investor, Class P, Class R and Class R6 Shares are not subject to a sales charge.
Goldman Sachs Asset Management, L.P. (“GSAM”), an affiliate of Goldman Sachs & Co. LLC (“Goldman Sachs”), serves as investment adviser to the Fund pursuant to a management agreement (the “Agreement”) with the Trust. As of October 31, 2018, GSAM had sub-advisory agreements (the “Sub-Advisory Agreements”) for the Fund with Acadian Asset Management LLC (“Acadian”), Algert Global LLC (“Algert”), Ares Capital Management II LLC (“Ares”), Bardin Hill Arbitrage IC Management LP (“Bardin Hill”) (formerly known as Halcyon Arbitrage IC Management LP prior to October 23, 2018), Brigade Capital Management, LP (“Brigade”), Crabel Capital Management, LLC (“Crabel”), Emso Asset Management Limited (“Emso”), First Pacific Advisors, LP (“FPA”), GQG Partners LLC (“GQG Partners”), One River Asset Management, LLC (“One River”), QMS Capital Management LP (“QMS”), River Canyon Fund Management LLC (“River Canyon”), Russell Investments Commodity Advisor, LLC (“RICA”), Sirios Capital Management, L.P. (“Sirios”) and Wellington Management Company LLP (“Wellington”) (the “Underlying Managers”). Each of Crabel and One River also serves as an Underlying Manager for a Subsidiary (as defined below). Pursuant to the terms of the Sub-Advisory Agreements, the Underlying Managers are responsible for making investment decisions and managing the investments of the Fund. GSAM compensates the Underlying Managers directly in accordance with the terms of the Sub-Advisory Agreements. The Fund is not charged any separate or additional investment advisory fees by the Underlying Managers.
As of October 31, 2018, GSAM no longer had sub-advisory agreements for the Fund with New Mountain Vantage Advisers, L.L.C. (“New Mountain”), Graham Capital Management, L.P. (“GCM”), and Atreaus Capital, LP (“Atreaus”).
|
| 2. SIGNIFICANT ACCOUNTING POLICIES |
The financial statements have been prepared in accordance with accounting principles generally accepted in the United States of America (“GAAP”) and require management to make estimates and assumptions that may affect the reported amounts and disclosures. Actual results may differ from those estimates and assumptions.
A. Basis of Consolidation for the Goldman Sachs Multi-Manager Alternatives Fund — The Cayman Commodity — MMA, Ltd., the Cayman Commodity — MMA II, Ltd., the Cayman Commodity — MMA IV, Ltd., and the Cayman Commodity — MMA V, Ltd. (each a “Subsidiary” and together the “Subsidiaries”), Cayman Islands exempted companies, respectively, are wholly-owned subsidiaries of the Fund. The Subsidiaries act as investment vehicles for the Fund to enable the Fund to gain exposure to certain types of commodity-linked derivative instruments. The Fund is the sole shareholder of the Subsidiaries and it is intended that the Fund will remain the sole shareholder and will continue to control the Subsidiaries. Under the Memorandum and Articles of Association of each Subsidiary, shares issued by the Subsidiary confer upon a shareholder the right to vote at general meetings of the Subsidiary and certain rights in connection with any winding-up or repayment of capital, as well as the right to participate in the profits or assets of the Subsidiary. All inter-fund balances and transactions have been eliminated in consolidation. As of October 31, 2018, the Fund’s net assets were $532,550,675 of which, $2,987,597, or 0.6%, represented the Cayman Commodity — MMA IV, Ltd.’s net assets and $3,141,554, or 0.6%, represented the Cayman Commodity — MMA V, Ltd.’s net assets. As of October 31, 2018, the Cayman Commodity — MMA, Ltd. and the Cayman Commodity — MMA II, Ltd. did not hold any assets.
B. Investment Valuation — The Fund’s valuation policy is to value investments at fair value.
C. Investment Income and Investments — Investment income includes interest income, dividend income and securities lending income, if any. Interest income is accrued daily and adjusted for amortization of premiums and accretion of discounts. Dividend income is recognized on ex-dividend date or, for certain foreign securities, as soon as such information is obtained subsequent to the ex-dividend date. Investment transactions are reflected on trade date. Realized gains and losses are calculated
69
GOLDMAN SACHS MULTI-MANAGER ALTERNATIVES FUND
Consolidated Notes to Financial Statements (continued)
October 31, 2018
|
| 2. SIGNIFICANT ACCOUNTING POLICIES (continued) |
using identified cost. Investment transactions are recorded on the following business day for daily net asset value (“NAV”) calculations. Investment income is recorded net of any foreign withholding taxes, less any amounts reclaimable. The Fund may file withholding tax reclaims in certain jurisdictions to recover a portion of amounts previously withheld. Any foreign capital gains tax is accrued daily based upon net unrealized gains, and is payable upon sale of such investments. Distributions received from the Fund’s investments in U.S. real estate investment trusts (“REITs”) may be characterized as ordinary income, net capital gain or a return of capital. A return of capital is recorded by the Fund as a reduction to the cost basis of the REIT.
For derivative contracts, realized gains and losses are recorded upon settlement of the contract. Upfront payments, if any, are made or received upon entering into a swap agreement and are reflected in the Consolidated Statement of Assets and Liabilities. Upfront payments are recognized over the contract’s term/event as realized gains or losses, with the exception of forward starting swap contracts whose realized gains or losses are recognized from the effective start date. For securities with paydown provisions, principal payments received are treated as a proportionate reduction to the cost basis of the securities, and excess or shortfall amounts are recorded as income. For treasury inflation protected securities (“TIPS”), adjustments to principal due to inflation/deflation are reflected as increases/decreases to interest income with a corresponding adjustment to cost.
D. Class Allocations and Expenses — Investment income, realized and unrealized gain (loss), if any, and non-class specific expenses of the Fund are allocated daily based upon the proportion of net assets of each class. Non-class specific expenses directly incurred by the Fund are charged to the Fund, while such expenses incurred by the Trust are allocated across the Fund on a straight-line and/or pro-rata basis depending upon the nature of the expenses. Class specific expenses, where applicable, are borne by the respective share classes and include Distribution and Service, Transfer Agency and Service and Shareholder Administration fees.
E. Federal Taxes and Distributions to Shareholders — It is the Fund’s policy to comply with the requirements of the Internal Revenue Code of 1986, as amended (the “Code”), applicable to regulated investment companies and to distribute each year substantially all of its investment company taxable income and capital gains to its shareholders. Accordingly, the Fund is not required to make any provisions for the payment of federal income tax. Distributions to shareholders are recorded on the ex-dividend date. Income and capital gains distributions, if any, are declared and paid annually.
Net capital losses, if any, are carried forward to future fiscal years and may be used to the extent allowed by the Code to offset any future capital gains. Losses that are carried forward will retain their character as either short-term or long-term capital losses. Utilization of capital loss carryforwards will reduce the requirement of future capital gains distributions.
The characterization of distributions to shareholders for financial reporting purposes is determined in accordance with federal income tax rules, which may differ from GAAP. The source of the Fund’s distributions may be shown in the accompanying financial statements as either from distributable earnings or capital. Certain components of the Fund’s net assets on the Consolidated Statement of Assets and Liabilities reflect permanent GAAP/tax differences based on the appropriate tax character.
F. Foreign Currency Translation — The accounting records and reporting currency of the Fund are maintained in U.S. dollars. Assets and liabilities denominated in foreign currencies are translated into U.S. dollars using the current exchange rates at the close of each business day. The effect of changes in foreign currency exchange rates on investments is included within net realized and unrealized gain (loss) on investments. Changes in the value of other assets and liabilities as a result of fluctuations in foreign exchange rates are included in the Consolidated Statement of Operations within net change in unrealized gain (loss) on foreign currency translation. Transactions denominated in foreign currencies are translated into U.S. dollars on the date the transaction occurred, the effects of which are included within net realized gain (loss) on foreign currency transactions.
G. Commission Recapture — GSAM, on behalf of the Fund, may direct portfolio trades, subject to seeking best execution, to various brokers who have agreed to rebate a portion of the commissions generated. Such rebates are made directly to the Fund as cash payments and are included in net realized gain (loss) from investments on the Consolidated Statement of Operations.
| | |
| 3. INVESTMENTS AND FAIR VALUE MEASUREMENTS | | |
U.S. GAAP defines the fair value of a financial instrument as the amount that would be received to sell an asset or paid to transfer a liability in an orderly transaction between market participants at the measurement date (i.e., the exit price); the Fund’s policy is to
use the market approach. GAAP establishes a fair value hierarchy that prioritizes the inputs to valuation techniques used to
70
GOLDMAN SACHS MULTI-MANAGER ALTERNATIVES FUND
|
| 3. INVESTMENTS AND FAIR VALUE MEASUREMENTS (continued) |
measure fair value. The hierarchy gives the highest priority to unadjusted quoted prices in active markets for identical assets or liabilities (Level 1 measurements) and the lowest priority to unobservable inputs (Level 3 measurements). The levels used for classifying investments are not necessarily an indication of the risk associated with investing in these investments. The three levels of the fair value hierarchy are described below:
Level 1 — Unadjusted quoted prices in active markets that are accessible at the measurement date for identical, unrestricted assets or liabilities;
Level 2 — Quoted prices in markets that are not active or financial instruments for which significant inputs are observable (including, but not limited to, quoted prices for similar investments, interest rates, foreign exchange rates, volatility and credit spreads), either directly or indirectly;
Level 3 — Prices or valuations that require significant unobservable inputs (including GSAM’s assumptions in determining fair value measurement).
Changes in valuation techniques may result in transfers into or out of an assigned level within the hierarchy. In accordance with the Fund’s policy, transfers between different levels of the fair value hierarchy resulting from such changes are deemed to have occurred as of the beginning of the reporting period.
The Board of Trustees (“Trustees”) has approved Valuation Procedures that govern the valuation of the portfolio investments held by the Fund, including investments for which market quotations are not readily available. The Trustees have delegated to GSAM day-to-day responsibility for implementing and maintaining internal controls and procedures related to the valuation of the Fund’s investments. To assess the continuing appropriateness of pricing sources and methodologies, GSAM regularly performs price verification procedures and issues challenges as necessary to third party pricing vendors or brokers, and any differences are reviewed in accordance with the Valuation Procedures.
A. Level 1 and Level 2 Fair Value Investments — The valuation techniques and significant inputs used in determining the fair values for investments classified as Level 1 and Level 2 are as follows:
Equity Securities — Equity securities traded on a United States (“U.S.”) securities exchange or the NASDAQ system, or those located on certain foreign exchanges, including but not limited to the Americas, are valued daily at their last sale price or official closing price on the principal exchange or system on which they are traded. If there is no sale or official closing price or such price is believed by GSAM to not represent fair value, equity securities are valued at the last bid price for long positions and at the last ask price for short positions. To the extent these investments are actively traded, they are classified as Level 1 of the fair value hierarchy, otherwise they are generally classified as Level 2.
Unlisted equity securities for which market quotations are available are valued at the last sale price on the valuation date, or if no sale occurs, at the last bid price, and are generally classified as Level 2. Securities traded on certain foreign securities exchanges are valued daily at fair value determined by an independent fair value service (if available) under Valuation Procedures approved by the Trustees and consistent with applicable regulatory guidance. The independent fair value service takes into account multiple factors including, but not limited to, movements in the securities markets, certain depositary receipts, futures contracts and foreign currency exchange rates that have occurred subsequent to the close of the foreign securities exchange. These investments are generally classified as Level 2 of the fair value hierarchy.
Underlying Funds (including Money Market Funds) — Underlying Funds (“Underlying Funds”) include other investment companies and exchange-traded funds (“ETFs”). Investments in the Underlying Funds (except ETFs) are valued at the NAV per share of the Institutional Share class on the day of valuation. ETFs are valued daily at the last sale price or official closing price on the principal exchange or system on which the investment is traded. Because the Fund invests in Underlying Funds that fluctuate in value, the Fund’s shares will correspondingly fluctuate in value. To the extent these investments are actively traded, they are classified as Level 1 of the fair value hierarchy, otherwise they are generally classified as Level 2. For information regarding an Underlying Fund’s accounting policies and investment holdings, please see the Underlying Fund’s shareholder report.
Debt Securities — Debt securities for which market quotations are readily available are valued daily on the basis of quotations supplied by dealers or an independent pricing service approved by the Trustees. The pricing services may use valuation models or matrix pricing, which consider: (i) yield or price with respect to bonds that are considered comparable in characteristics such as rating, interest rate and maturity date or (ii) quotations from securities dealers to determine current value. With the exception of
71
GOLDMAN SACHS MULTI-MANAGER ALTERNATIVES FUND
Consolidated Notes to Financial Statements (continued)
October 31, 2018
|
| 3. INVESTMENTS AND FAIR VALUE MEASUREMENTS (continued) |
treasury securities of G8 countries, which are generally classified as Level 1, these investments are generally classified as Level 2 of the fair value hierarchy.
i. Bank Loans — Bank loans (“Loans”) are interests in amounts owed by corporate, governmental, or other borrowers to lenders or lending syndicates. Loans are arranged through private negotiations between the borrower and one or more financial institutions (“Lenders”). The Fund’s investments in Loans are in the form of either participations in Loans (“Participations”) or assignments of all or a portion of Loans from third parties (“Assignments”). With respect to Participations, the Fund has the right to receive payments of principal, interest and any fees to which it is entitled from the Lender selling the Participations and only upon receipt by the Lender of the payments from the borrower. The Fund generally has no right to enforce compliance by the borrower with the terms of the loan agreement with respect to Participations. Conversely, assignments result in the Fund having a direct contractual relationship with the borrower, and the Fund may be permitted to enforce compliance by the borrower with the terms of the loan agreement.
ii. Mortgage-Backed and Asset-Backed Securities — Mortgage-backed securities represent direct or indirect participations in, or are collateralized by and payable from, mortgage loans secured by residential and/or commercial real estate property. Asset-backed securities include securities whose principal and interest payments are collateralized by pools of other assets or receivables. The value of certain mortgage-backed and asset-backed securities (including adjustable rate mortgage loans) may be particularly sensitive to changes in prevailing interest rates. The value of these securities may also fluctuate in response to the market’s perception of the creditworthiness of the issuers.
Asset-backed securities may present credit risks that are not presented by mortgage-backed securities because they generally do not have the benefit of a security interest in collateral that is comparable to mortgage assets. Some asset-backed securities may only have a subordinated claim on collateral.
Stripped mortgage-backed securities are usually structured with two different classes: one that receives substantially all interest payments (interest-only, or “IO” and/or high coupon rate with relatively low principal amount, or “IOette”), and the other that receives substantially all principal payments (principal-only, or “PO”) from a pool of mortgage loans. Little to no principal will be received at the maturity of an IO; as a result, periodic adjustments are recorded to reduce the cost of the security until maturity. These adjustments are included in interest income.
iii. Repurchase Agreements — Repurchase agreements involve the purchase of securities subject to the seller’s agreement to repurchase the securities at a mutually agreed upon date and price, under the terms of a Master Repurchase Agreement (“MRA”). During the term of a repurchase agreement, the value of the underlying securities held as collateral on behalf of the Fund, including accrued interest, is required to exceed the value of the repurchase agreement, including accrued interest. The gross value of repurchase agreements is included in the Consolidated Statement of Assets and Liabilities for financial reporting purposes. The underlying securities for all repurchase agreements are held at the Fund’s custodian or designated subcustodians under tri-party repurchase agreements.
An MRA governs transactions between the Fund and select counterparties. An MRA contains provisions for, among other things, initiation of the transaction, income payments, events of default, and maintenance of securities for repurchase agreements. An MRA also permits offsetting with collateral to create one single net payment in the event of default or similar events, including the bankruptcy or insolvency of a counterparty.
If the seller defaults, the Fund could suffer a loss to the extent that the proceeds from the sale of the underlying securities and other collateral held by the Fund are less than the repurchase price and the Fund’s costs associated with delay and enforcement of the repurchase agreement. In addition, in the event of default or insolvency of the seller, a court could determine that the Fund’s interest in the collateral is not enforceable, resulting in additional losses to the Fund.
Pursuant to exemptive relief granted by the Securities and Exchange Commission (“SEC”) and terms and conditions contained therein, the Fund, together with other funds of the Trust and registered investment companies having management agreements with GSAM or its affiliates, may transfer uninvested cash into joint accounts, the daily aggregate balance of which is invested in one or more repurchase agreements. Under these joint accounts, the Fund maintains pro-rata credit exposure to the underlying repurchase agreements’ counterparties. With the exception of certain transaction fees, the Fund is not subject to any expenses in relation to these investments.
72
GOLDMAN SACHS MULTI-MANAGER ALTERNATIVES FUND
|
| 3. INVESTMENTS AND FAIR VALUE MEASUREMENTS (continued) |
Securities Sold Short — Securities sold short are those securities which the Fund has sold but which it does not own. When the Fund sells a security it does not own, it must borrow the security that was sold and generally delivers the proceeds from the short sale to the broker through which it made the short sale. In addition, cash and certain investments in securities may be used to collateralize the securities sold short. Each day the securities sold short transaction is open, the liability to replace the borrowed security is marked to market and an unrealized gain or loss is recorded. While the transaction remains open, the Fund may also incur expenses for any dividends or interest which will be paid to the lender of the securities as well as a fee to borrow the delivered security. During the term of the short sale, the value of the securities pledged as collateral on short sales is required to exceed the value of the securities sold short. The market value of securities pledged as collateral is included in the Consolidated Schedule of Investments.
Derivative Contracts — A derivative is an instrument whose value is derived from underlying assets, indices, reference rates or a combination of these factors. The Fund enters into derivative transactions to hedge against changes in interest rates, securities prices, and/or currency exchange rates, to increase total return, or to gain access to certain markets or attain exposure to other underliers.
Exchange-traded derivatives, including futures and options contracts, are generally valued at the last sale or settlement price on the exchange where they are principally traded. Exchange-traded options without settlement prices are generally valued at the midpoint of the bid and ask prices on the exchange where they are principally traded (or, in the absence of two-way trading, at the last bid price for long positions and the last ask price for short positions). Exchange-traded derivatives typically fall within Level 1 of the fair value hierarchy. Over-the-counter (“OTC”) and centrally cleared derivatives are valued using market transactions and other market evidence, including market-based inputs to models, calibration to market-clearing transactions, broker or dealer quotations, or other alternative pricing sources. Where models are used, the selection of a particular model to value OTC and centrally cleared derivatives depends upon the contractual terms of, and specific risks inherent in, the instrument, as well as the availability of pricing information in the market. Valuation models require a variety of inputs, including contractual terms, market prices, yield curves, credit curves, measures of volatility, voluntary and involuntary prepayment rates, loss severity rates and correlations of such inputs. For OTC and centrally cleared derivatives that trade in liquid markets, model inputs can generally be verified and model selection does not involve significant management judgment. OTC and centrally cleared derivatives are classified within Level 2 of the fair value hierarchy when significant inputs are corroborated by market evidence.
i. Forward Contracts — A forward contract is a contract between two parties to buy or sell an asset at a specified price on a future date. A forward contract settlement can occur on a cash or delivery basis. Forward contracts are marked-to-market daily using independent vendor prices, and the change in value, if any, is recorded as an unrealized gain or loss. Cash and certain investments may be used to collateralize forward contracts.
A forward foreign currency exchange contract is a forward contract in which the Fund agrees to receive or deliver a fixed quantity of one currency for another, at a pre-determined price at a future date. All forward foreign currency exchange contracts are marked-to-market daily at the applicable forward rate. Non-deliverable forward foreign currency exchange contracts are settled with the counterparty in cash without the delivery of foreign currency.
ii. Futures Contracts — Futures contracts are contracts to buy or sell a standardized quantity of a specified commodity or security and are valued based on exchanged settlement prices or independent market quotes. Upon entering into a futures contract, the Fund deposits cash or securities in an account on behalf of the broker in an amount sufficient to meet the initial margin requirement. Subsequent payments are made or received by the Fund equal to the daily change in the contract value and are recorded as variation margin receivable or payable with a corresponding offset to unrealized gains or losses. For financial reporting purposes, cash collateral that has been pledged to cover obligations of the Fund and cash collateral received, if any, is reported separately on the Consolidated Statement of Assets and Liabilities as receivables/payables for collateral on certain derivative contracts. Non-cash collateral pledged by the Fund, if any, is noted in the Consolidated Schedule of Investments.
iii. Options — When the Fund writes call or put options, an amount equal to the premium received is recorded as a liability and is subsequently marked-to-market to reflect the current value of the option written. Swaptions are options on interest rate swap contracts.
73
GOLDMAN SACHS MULTI-MANAGER ALTERNATIVES FUND
Consolidated Notes to Financial Statements (continued)
October 31, 2018
|
| 3. INVESTMENTS AND FAIR VALUE MEASUREMENTS (continued) |
Upon the purchase of a call option or a put option by the Fund the premium paid is recorded as an investment and subsequently marked-to-market to reflect the current value of the option. Certain options may be purchased with premiums to be determined on a future date. The premiums for these options are based upon implied volatility parameters at specified terms.
iv. Swap Contracts — Bilateral swap contracts are agreements in which the Fund and a counterparty agree to exchange periodic payments on a specified notional amount or make a net payment upon termination. Bilateral swap transactions are privately negotiated in the OTC market and payments are settled through direct payments between the Fund and the counterparty. By contrast, certain swap transactions are subject to mandatory central clearing. These swaps are executed through a derivatives clearing member (“DCM”), acting in an agency capacity, and submitted to a central counterparty (“CCP”) (“centrally cleared swaps”), in which case all payments are settled with the CCP through the DCM. Swaps are marked-to-market daily using pricing vendor quotations, counterparty prices or model prices, and the change in value, if any, is recorded as an unrealized gain or loss. Upon entering into a swap contract, the Fund is required to satisfy an initial margin requirement by delivering cash or securities to the counterparty (or in some cases, segregated in a triparty account on behalf of the counterparty), which can be adjusted by any mark-to-market gains or losses pursuant to bilateral or centrally cleared arrangements. For centrally cleared swaps the daily change in valuation, if any, is recorded as a receivable or payable for variation margin.
An interest rate swap is an agreement that obligates two parties to exchange a series of cash flows at specified intervals, based upon or calculated by reference to changes in interest rates on a specified notional principal amount. The payment flows are usually netted against each other, with the difference being paid by one party to the other.
A credit default swap is an agreement that involves one party (the buyer of protection) making a stream of payments to another party (the seller of protection) in exchange for the right to receive protection on a reference security or obligation, including a group of assets or exposure to the performance of an index. The Fund’s investment in credit default swaps may involve greater risks than if the Fund had invested in the referenced obligation directly. Credit events are contract specific but may include bankruptcy, failure to pay, restructuring and obligation acceleration. If the Fund buys protection through a credit default swap and no credit event occurs, its payments are limited to the periodic payments previously made to the counterparty. Upon the occurrence of a specified credit event, the Fund, as a buyer of credit protection, is entitled to receive an amount equal to the notional amount of the swap and deliver to the seller the defaulted reference obligation in a physically settled trade. The Fund may also receive a net settlement amount in the form of cash or securities equal to the notional amount of the swap reduced by the recovery value of the reference obligation in a cash settled trade.
As a seller of protection, the Fund generally receives a payment stream throughout the term of the swap, provided that there is no credit event. In addition, if the Fund sells protection through a credit default swap, the Fund could suffer a loss because the value of the referenced obligation and the premium payments received may be less than the notional amount of the swap paid to the buyer of protection. Upon the occurrence of a specified credit event, the Fund, as a seller of credit protection, may be required to take possession of the defaulted reference obligation and pay the buyer an amount equal to the notional amount of the swap in a physically settled trade. The Fund may also pay a net settlement amount in the form of cash or securities equal to the notional amount of the swap reduced by the recovery value of the reference obligation in a cash settled trade. Recovery values are at times established through the credit event auction process in which market participants are ensured that a transparent price has been set for the defaulted security or obligation. In addition, the Fund is entitled to a return of any assets, which have been pledged as collateral to the counterparty upon settlement.
The maximum potential amount of future payments (undiscounted) that the Fund as seller of protection could be required to make under a credit default swap would be an amount equal to the notional amount of the agreement. These potential amounts would be partially offset by any recovery values of the respective referenced obligations or net amounts received from a settlement of a credit default swap for the same reference security or obligation where the Fund bought credit protection.
A total return swap is an agreement that gives the Fund the right to receive the appreciation in the value of a specified security, basket of investments or indices, index or other instrument in return for a fee paid to the counterparty, which will
74
GOLDMAN SACHS MULTI-MANAGER ALTERNATIVES FUND
|
| 3. INVESTMENTS AND FAIR VALUE MEASUREMENTS (continued) |
typically be an agreed upon interest rate. If the underlying asset declines in value over the term of the swap, the Fund may also be required to pay the dollar value of that decline to the counterparty.
B. Level 3 Fair Value Investments — To the extent that significant inputs to valuation models and other alternative pricing sources are unobservable, or if quotations are not readily available, or if GSAM believes that such quotations do not accurately reflect fair value, the fair value of the Fund’s investments may be determined under Valuation Procedures approved by the Trustees. GSAM, consistent with its procedures and applicable regulatory guidance, may make an adjustment to the most recent valuation prices of either domestic or foreign securities in light of significant events to reflect what it believes to be the fair value of the securities at the time of determining the Fund’s NAV. Significant events which could affect a large number of securities in a particular market may include, but are not limited to: significant fluctuations in U.S. or foreign markets; market dislocations; market disruptions; or unscheduled market closings. Significant events which could also affect a single issuer may include, but are not limited to: corporate actions such as reorganizations, mergers and buy-outs; ratings downgrades; and bankruptcies.
C. Fair Value Hierarchy — The following is a summary of the Fund’s investments and derivatives classified in the fair value hierarchy as of October 31, 2018:
| | | | | | | | | | | | |
|
| MULTI-MANAGER ALTERNATIVES | |
| | | |
| Investment Type | | Level 1 | | | Level 2 | | | Level 3 | |
| Assets | | | | | | | | | | | | |
Fixed Income | | | | | | | | | | | | |
Corporate Obligations | | $ | — | | | $ | 6,692,964 | | | $ | — | |
Mortgage-Backed Obligations | | | — | | | | 12,027,880 | | | | — | |
Asset-Backed Securities | | | — | | | | 40,272,563 | | | | 12,677 | |
Foreign Debt Obligations | | | — | | | | 15,519,587 | | | | — | |
Common Stock and/or Other Equity Investments(a) | |
Asia | | | 5,522,767 | | | | 8,213,675 | | | | — | |
Australia and Oceania | | | — | | | | 2,739,397 | | | | — | |
Europe | | | 6,278,501 | | | | 29,096,613 | | | | — | |
North America | | | 90,445,320 | | | | 1,576,394 | | | | — | |
South America | | | 192,344 | | | | — | | | | — | |
Investment Company | | | 187,779,673 | | | | — | | | | — | |
Short-term Investments | | | — | | | | 62,100,000 | | | | — | |
| Total | | $ | 290,218,605 | | | $ | 178,239,073 | | | $ | 12,677 | |
| Liabilities | | | | | | | | | | | | |
Common Stock and/or Other Equity Investments | | | | | | | | | | | | |
North America | | $ | (10,292,643 | ) | | $ | — | | | $ | — | |
Europe | | | (1,462,524 | ) | | | — | | | | — | |
Asia | | | — | | | | (1,639,724 | ) | | | — | |
| Total | | $ | (11,755,167 | ) | | $ | (1,639,724 | ) | | $ | — | |
75
GOLDMAN SACHS MULTI-MANAGER ALTERNATIVES FUND
Consolidated Notes to Financial Statements (continued)
October 31, 2018
|
| 3. INVESTMENTS AND FAIR VALUE MEASUREMENTS (continued) |
| | | | | | | | | | | | |
| | | |
| MULTI-MANAGER ALTERNATIVES (continued) | | | | | | | | | | | | |
| | | |
| Derivative Type | | Level 1 | | | Level 2 | | | Level 3 | |
| Assets | | | | | | | | | | | | |
Forward Foreign Currency Exchange Contracts(b) | | $ | — | | | $ | 9,921,411 | | | $ | — | |
Futures Contracts(b) | | | 4,381,501 | | | | — | | | | — | |
Interest Rate Swap Contracts(b) | | | — | | | | 311,260 | | | | — | |
Credit Default Swap Contracts(b) | | | — | | | | 308,015 | | | | — | |
Total Return Swap Contracts(b) | | | — | | | | 9,541,620 | | | | — | |
Options Purchased | | | — | | | | 12,977 | | | | — | |
| Total | | $ | 4,381,501 | | | $ | 20,095,283 | | | $ | — | |
| Liabilities | | | | | | | | | | | | |
Forward Foreign Currency Exchange Contracts(b) | | $ | — | | | $ | (10,271,283 | ) | | $ | — | |
Futures Contracts(b) | | | (3,580,051 | ) | | | — | | | | — | |
Interest Rate Swap Contracts(b) | | | — | | | | (137,411 | ) | | | — | |
Credit Default Swap Contracts(b) | | | — | | | | (48,052 | ) | | | — | |
Total Return Swap Contracts(b) | | | — | | | | (10,153,649 | ) | | | — | |
Written option contracts | | | — | | | | (2,220 | ) | | | — | |
| Total | | $ | (3,580,051 | ) | | $ | (20,612,615 | ) | | $ | — | |
| (a) | | Amounts are disclosed by continent to highlight the impact of time zone differences between local market close and the calculation of net asset value. Security valuations are based on the principal exchange or system on which they are traded, which may differ from country of domicile. The Fund utilizes fair value model prices provided by an independent fair value service for international equities, resulting in a Level 2 classification. |
| (b) | | Amount shown represents unrealized gain (loss) at period end. |
For further information regarding security characteristics, see the Consolidated Schedule of Investments.
|
| 4. INVESTMENTS IN DERIVATIVES |
The following tables set forth, by certain risk types, the gross value of derivative contracts (not considered to be hedging instruments for accounting disclosure purposes) as of October 31, 2018. These instruments were used as part of the Fund’s investment strategies and to obtain and/or manage exposure related to the risks below. The values in the tables below exclude the effects of cash collateral received or posted pursuant to these derivative contracts, and therefore are not representative of the Fund’s net exposure.
| | | | | | | | | | | | |
| Risk | | Consolidated Statement of Assets and Liabilities | | Assets | | | Consolidated Statement of Assets and Liabilities | | Liabilities | |
Interest rate | | Unrealized gain on swap contracts; Variation margin on swap contracts; and Variation margin on futures contracts | | $ | 1,130,838 | (a) | | Variation margin on swap contracts; and Variation margin on futures contracts | | $ | (283,720) | (a) |
Credit | | Variation margin on swap contracts | | | 308,015 | (a) | | Variation margin on swap contracts | | | (48,052) | (a) |
Equity | | Unrealized gain on swap contracts; Variation margin on futures contracts; and Options Purchased | | | 12,455,323 | (a) | | Unrealized loss on swap contracts; Variation margin on futures contracts; and Written option contracts | | | (12,839,374) | (a)(b) |
Currency | | Receivable for unrealized gain on forward foreign currency exchange contracts; and Variation margin on futures contracts | | | 9,922,997 | (a) | | Payable for unrealized gain on forward foreign currency exchange contracts; and Variation margin on futures contracts | | | (10,275,676) | (a) |
76
GOLDMAN SACHS MULTI-MANAGER ALTERNATIVES FUND
|
| 4. INVESTMENTS IN DERIVATIVES (continued) |
| | | | | | | | | | | | |
| | | | |
| Risk | | Consolidated Statement of Assets and Liabilities | | Assets | | | Consolidated Statement of Assets and Liabilities | | Liabilities | |
Commodity | | Variation margin on futures contracts | | $ | 659,611 | (a) | | Variation margin on futures contracts; | | $ | (745,844) | (a) |
| Total | | | | $ | 24,476,784 | | | | | $ | (24,192,666) | |
| (a) | | Includes unrealized gain (loss) on futures contracts described in the Additional Investment Information sections of the Consolidated Schedule of Investments. Only current day’s variation margin is reported within the Consolidated Statement of Assets and Liabilities. |
| (b) | | Aggregate of amounts include $10,153,649, which represents the payments to be made pursuant to bilateral agreements should counterparties exercise their “right to terminate” provisions based on, among others, the Fund’s performance, their failure to pay on their obligations or failure to pledge collateral. Such amount does not include incremental charges directly associated with the close-out of the agreements. It also does not reflect the fair value of any assets pledged as collateral which, through the daily margining process, substantially offsets the aforementioned amounts and for which the Fund is entitled to a full return. |
The following tables set forth, by certain risk types, the Fund’s gains (losses) related to these derivatives and their indicative volumes for the fiscal year ended October 31, 2018. These gains (losses) should be considered in the context that these derivative contracts may have been executed to create investment opportunities and/or economically hedge certain investments, and accordingly, certain gains (losses) on such derivative contracts may offset certain (losses) gains attributable to investments. These gains (losses) are included in “Net realized gain (loss)” or “Net change in unrealized gain (loss)” on the Consolidated Statement of Operations:
| | | | | | | | | | | | | | |
| Risk | | Consolidated Statement of Operations | | Net Realized
Gain (Loss) | | | Net Change in
Unrealized
Gain (Loss) | | | Average
Number of
Contracts(a) | |
| Interest rate | | Net realized gain (loss) from purchased options, futures contracts, and swap contracts/Net change in unrealized gain (loss) on futures contracts and swap contracts | | $ | 6,104,180 | | | $ | 1,884,631 | | | | 10,105 | |
| Credit | | Net realized gain (loss) from swap contracts/Net change in unrealized gain (loss) on swap contracts | | | (244,777 | ) | | | 317,967 | | | | 8 | |
| Currency | | Net realized gain (loss) from purchased options, forward foreign currency exchange contracts, futures contracts, swaps contracts and written options/Net change in unrealized gain (loss) on purchased options, forward foreign currency exchange contracts, futures contracts, swaps contracts and written options | | | (3,505,844 | ) | | | 2,516,988 | | | | 1,348 | |
| Equity | | Net realized gain (loss) from purchased options, futures contracts, swaps contracts/Net change in unrealized gain (loss) on purchase options, futures contracts, swaps contracts and written options | | | (16,225,187 | ) | | | (3,338,746 | ) | | | 3,571 | |
| Commodity | | Net realized gain (loss) from futures contracts/Net change in unrealized gain (loss) on futures contracts | | | 1,094,002 | | | | (1,215,342 | ) | | | 800 | |
| Total | | | | $ | (12,777,626 | ) | | $ | 165,498 | | | | 15,832 | |
| (a) | | Average number of contracts is based on the average of month end balances for the fiscal year ended October 31, 2018. |
In order to better define its contractual rights and to secure rights that will help the Fund mitigate its counterparty risk, the Fund may enter into an International Swaps and Derivatives Association, Inc. Master Agreement (“ISDA Master Agreement”) or similar agreement with its derivatives counterparties. An ISDA Master Agreement is a bilateral agreement between the Fund and a counterparty that governs OTC derivatives (including forward foreign currency exchange contracts, and certain options and swaps) and typically contains, among other things, collateral posting terms and netting provisions in the event of a default and/or termination event. The provisions of the ISDA Master Agreement typically permit a single net payment in the event of a default (close-out netting) or similar event, including the bankruptcy or insolvency of the counterparty.
Collateral and margin requirements differ between exchange traded derivatives and OTC derivatives. Margin requirements are established by the broker or clearing house for exchange-traded and centrally cleared derivatives (financial futures contracts, options and centrally cleared swaps) pursuant to governing agreements for those instrument types. Brokers can ask for margin in excess of the minimum in certain circumstances. Collateral terms are contract-specific for OTC derivatives. For derivatives traded under an ISDA Master Agreement, the collateral requirements are typically calculated by netting the marked to market amount for
77
GOLDMAN SACHS MULTI-MANAGER ALTERNATIVES FUND
Consolidated Notes to Financial Statements (continued)
October 31, 2018
|
| 4. INVESTMENTS IN DERIVATIVES (continued) |
each transaction under such agreement and comparing that amount to the value of any collateral currently pledged by the Fund and the counterparty. Additionally, the Fund may be required to post initial margin to the counterparty, the terms of which would be outlined in the confirmation of the OTC transaction.
For financial reporting purposes, cash collateral that has been pledged to cover obligations of the Fund and cash collateral received from the counterparty, if any, is reported separately on the Consolidated Statement of Assets and Liabilities as receivables/payables for collateral on certain derivative contracts. Non-cash collateral pledged by the Fund, if any, is noted in the Consolidated Schedule of Investments. Generally, the amount of collateral due from or to a counterparty must exceed a minimum transfer amount threshold before a transfer is required to be made. To the extent amounts due to the Fund from its counterparties are not fully collateralized, contractually or otherwise, the Fund bears the risk of loss from counterparty nonperformance. The Fund attempts to mitigate counterparty risk by only entering into agreements with counterparties that the Underlying Managers believe to be of good standing and by monitoring the financial stability of those counterparties.
Additionally, the netting of assets and liabilities and the offsetting of collateral pledged or received are based on contractual netting/set-off provisions in the ISDA Master Agreement or similar agreements. However, in the event of a default or insolvency of a counterparty, a court could determine that such rights are not enforceable due to the restrictions or prohibitions against the right of setoff that may be imposed in accordance with a particular jurisdiction’s bankruptcy or insolvency laws.
The following table sets forth the Fund’s net exposure for derivative instruments that are subject to enforceable master netting arrangements or similar agreements as of October 31, 2018:
| | | | | | | | | | | | | | | | | | | | | | | | | | | | | | | | | | | | | | | | | | | | |
| | | Derivative Assets(1) | | | Derivative Liabilities(1) | | | | |
| Counterparty | | Options
Purchased | | | Swaps | | | Forward
Currency
Contracts | | | Total | | | Swaps | | | Forward
Currency
Contracts | | | Options
Written | | | Total | | | Net
Derivative
Asset
(Liabilities) | | | Collateral
(Received)
Pledged(1) | | | Net
Amount(2) | |
Barclays Bank PLC | | $ | — | | | $ | — | | | $ | 299,546 | | | $ | 299,546 | | | $ | (137,769 | ) | | $ | (352,179 | ) | | $ | — | | | $ | (489,948 | ) | | $ | (190,402 | ) | | $ | 190,402 | | | $ | — | |
Deutsche Bank AG (London) | | | — | | | | 46,471 | | | | 3,545,902 | | | | 3,592,373 | | | | (6,312 | ) | | | (3,674,145 | ) | | | — | | | | (3,680,457 | ) | | | (88,084 | ) | | | 88,084 | | | | — | |
HSBC Bank PLC | | | — | | | | — | | | | — | | | | — | | | | — | | | | (24,915 | ) | | | — | | | | (24,915 | ) | | | (24,915 | ) | | | — | | | | (24,915 | ) |
JPMorgan Securities, Inc. | | | — | | | | 4,378,180 | | | | 3,251,656 | | | | 7,629,836 | | | | (4,190,052 | ) | | | (3,290,942 | ) | | | — | | | | (7,480,994 | ) | | | 148,842 | | | | — | | | | 148,842 | |
MS & Co. Int. PLC | | | 12,977 | | | | 1,442,277 | | | | 2,824,307 | | | | 4,279,561 | | | | (1,797,075 | ) | | | (2,929,102 | ) | | | (2,220 | ) | | | (4,728,397 | ) | | | (448,836 | ) | | | 448,836 | | | | — | |
UBS AG (London) | | | — | | | | 3,674,692 | | | | — | | | | 3,674,692 | | | | (4,022,441 | ) | | | — | | | | — | | | | (4,022,441 | ) | | | (347,749 | ) | | | 347,749 | | | | — | |
Total | | $ | 12,977 | | | $ | 9,541,620 | | | $ | 9,921,411 | | | $ | 19,476,008 | | | $ | (10,153,649 | ) | | $ | (10,271,283 | ) | | $ | (2,220 | ) | | $ | (20,427,152 | ) | | $ | (951,144 | ) | | $ | 1,075,071 | | | $ | 123,927 | |
| (1) | | Gross amounts available for offset but not netted in the Consolidated Statement of Assets and Liabilities. |
| (2) | | Net amount represents the net amount due (to) from counterparty in the event of a default based on the contractual set-off rights under the agreement. Net amount excludes any over-collateralized amounts. |
|
| 5. AGREEMENTS AND AFFILIATED TRANSACTIONS |
A. Management Agreement — Under the Agreement, GSAM manages the Fund, subject to the general supervision of the Trustees.
As compensation for the services rendered pursuant to the Agreement, the assumption of the expenses related thereto and administration of the Fund’s business affairs, including providing facilities, GSAM is entitled to a management fee, accrued daily
78
GOLDMAN SACHS MULTI-MANAGER ALTERNATIVES FUND
|
| 5. AGREEMENTS AND AFFILIATED TRANSACTIONS (continued) |
and paid monthly, equal to an annual percentage rate of the Fund’s average daily net assets. For the fiscal year ended October 31, 2018, contractual and effective net management fees with GSAM were at the following rates:
| | | | | | | | | | | | | | | | | | | | | | |
| Contractual Management Rate | | | Effective Net
Management
Fee Rate*^(a) | |
First
$2 billion | | | Next
$3 billion | | | Next
$3 billion | | | Over
$8 billion | | | Effective Fee
Rate | |
| | 1.90% | | | | 1.80% | | | | 1.71% | | | | 1.68% | | | | 1.90% | | | | 1.70% | |
| * | | Effective June 1, 2018 GSAM has agreed to waive a portion of its management fee in order to achieve a net management fee rate of 1.57% as an annual percentage of the average daily net assets of the Fund as defined in the Fund’s most recent prospectus. This arrangement will be effective through at least May 31, 2019, and prior to such date GSAM may not terminate the arrangement without the approval of the Trustees. Prior to June 1, 2018, GSAM had agreed to waive a portion of its management fee in order to achieve a net management fee rate of 1.83% as an annual percentage of the average daily net assets of the Fund. |
| ^ | | Effective Net Management Rate includes the impact of management fee waivers of affiliated Underlying Funds if any. |
| (a) | | Reflects combined management fees paid to GSAM under the Agreement and the Subsidiary Agreements as defined below after waivers. |
The Fund invests in Institutional Shares of the Goldman Sachs Financial Square Government Fund, which is an affiliated Underlying Fund. GSAM has agreed to waive a portion of its management fee payable by the Fund in an amount equal to the management fee it earns as an investment adviser to the affiliated Underlying Fund in which the Fund invests. For the fiscal year ended October 31, 2018, GSAM waived $329,186 of the Fund’s management fee.
GSAM also provides management services to the Subsidiaries pursuant to Subsidiary Management Agreements (the “Subsidiary Agreements”) and is entitled to a management fee accrued daily and paid monthly, equal to an annual percentage rate of 0.42% of each Subsidiary’s average daily net assets. In consideration of the Subsidiaries’ management fee, and for as long as the Subsidiary Agreements remains in effect, GSAM has contractually agreed to waive irrevocably a portion of the Fund’s management fee in an amount equal to the management fee accrued and paid to GSAM by the Subsidiaries under the Subsidiary Agreements. For the fiscal year ended ended October 31, 2018, GSAM waived $50,062 of the Fund’s management fee. This waiver represents an inter-fund transaction and, accordingly, has been eliminated in consolidation.
B. Distribution and/or Service (12b-1) Plans — The Trust, on behalf of Class A and Class R Shares of the Fund, has adopted Distribution and Service Plans subject to Rule 12b-1 under the Act. Under the Distribution and Service Plans, Goldman Sachs, which serves as distributor (the “Distributor”), is entitled to a fee accrued daily and paid monthly, for distribution services and personal and account maintenance services, which may then be paid by Goldman Sachs to authorized dealers. These fees are equal to an annual percentage rate of the average daily net assets attributable to Class A or Class R Shares of the Fund, as applicable, as set forth below.
The Trust, on behalf of Class C Shares of the Fund, has adopted a Distribution Plan subject to Rule 12b-1 under the Act. Under the Distribution Plan, Goldman Sachs as Distributor is entitled to a fee accrued daily and paid monthly for distribution services, which may then be paid by Goldman Sachs to authorized dealers. These fees are equal to an annual percentage rate of the average daily net assets attributable to Class C Shares of the Fund, as set forth below.
| | | | | | | | | | | | |
| | | Distribution and/or Service Plan Rates | |
| | | Class A* | | | Class C | | | Class R* | |
Distribution and/or Service Plan | | | 0.25 | % | | | 0.75 | % | | | 0.50 | % |
| * | | With respect to Class A and Class R Shares, the Distributor at its discretion may use compensation for distribution services paid under the Distribution and Service Plans to compensate service organizations for personal and account maintenance services and expenses as long as such total compensation does not exceed the maximum cap on “service fees” imposed by the Financial Industry Regulatory Authority. |
C. Distribution Agreement — Goldman Sachs, as Distributor of the shares of the Fund pursuant to a Distribution Agreement, may retain a portion of the Class A Shares’ front end sales charge and Class C Shares’ CDSC. For the fiscal year ended October 31, 2018, Goldman Sachs advised that it retained $475 and $0, respectively.
D. Service Plan — The Trust, on behalf of the Fund has adopted a Service Plan to allow Class C Shares to compensate service organizations (including Goldman Sachs) for providing varying levels of personal and account maintenance services to their customers who are beneficial owners of such shares. The Service Plan provides for compensation to the service organizations equal to an annual percentage rate of 0.25% of the average daily net assets attributable to Class C Shares of the Fund.
79
GOLDMAN SACHS MULTI-MANAGER ALTERNATIVES FUND
Consolidated Notes to Financial Statements (continued)
October 31, 2018
|
| 5. AGREEMENTS AND AFFILIATED TRANSACTIONS (continued) |
E. Transfer Agency Agreement — Goldman Sachs also serves as the transfer agent of the Fund for a fee pursuant to the Transfer Agency Agreement. The fees charged for such transfer agency services are accrued daily and paid monthly at annual rates as follows: 0.18% of the average daily net assets of Class A, Class C, Investor and Class R Shares; 0.04% of the average daily net assets of Institutional Shares; and 0.03% of the average daily net assets of Class P and Class R6 Shares.
Effective February 28, 2018, Goldman Sachs has agreed to waive a portion of the transfer agency fees equal to 0.06% of the average daily net assets attributable to Class A, Class C, Investor and Class R Shares of the Fund through at least May 31, 2019. Prior to such date, Goldman Sachs may not terminate the arrangement without approval of the Board of Trustees.
F. Other Expense Agreements and Affiliated Transactions — Effective June 1, 2018, GSAM has agreed to limit certain “Other Expenses” of the Fund (excluding acquired fund fees and expenses, dividend and interest payments on securities sold short, transfer agency fees and expenses, service fees and shareholder administration fees (as applicable), taxes, interest, brokerage fees, expenses of shareholder meetings, litigation and indemnification, and extraordinary expenses) to 0.194% of the average daily net assets of the Fund and limit the Fund’s total annual operating expenses (excluding acquired fund fees and expenses, dividend and interest payments on securities sold short, transfer agency fees and expenses, service fees and shareholder administration fees (as applicable), taxes, interest, brokerage fees, expenses of shareholder meetings, litigation and indemnification, and extraordinary expenses) of Class A, Class C, Institutional, Investor, Class P, Class R and Class R6 Shares to (after the application of the TA Fee Waiver described above) 2.13%, 2.88%, 1.80%, 1.88%, 1.79%, 2.38%, and 1.79%, respectively. These Other Expense limitations will remain in place through at least May 31, 2019, and prior to such date GSAM may not terminate the arrangements without the approval of the Trustees.
Prior to June 1, 2018, GSAM had agreed to limit certain “Other Expenses” of the Fund (excluding acquired fund fees and expenses, transfer agency fees and expenses, service fees, taxes, dividend and interest payments on securities sold short, interest, brokerage fees, expenses of shareholder meetings, litigation and indemnification, and extraordinary expenses) to 0.114% of the average daily net assets of the Fund. Such Other Expense reimbursements, if any, are accrued daily and paid monthly. In addition, the Fund is not obligated to reimburse GSAM for prior fiscal year expense reimbursements, if any. For the period February 28, 2018 through May 31, 2018, GSAM had also agreed to limit the Fund’s total annual operating expenses (excluding acquired fund fees and expenses, taxes, dividend and interest payments on securities sold short, interest, brokerage fees, expenses of shareholder meetings, litigation and indemnification, and extraordinary expenses) of Class A, Class C, Institutional, Investor, Class P, Class R and Class R6 Shares to (after the application of the TA Fee Waiver described above) 2.31%, 3.06%, 1.98%, 2.06%, 1.97%, 2.56%, 1.97%, respectively.
Prior to February 28, 2018, the Fund’s total annual operating expenses (excluding acquired fund fees and expenses, taxes, dividend and interest payments on securities sold short, interest, brokerage fees, expenses of shareholder meetings, litigation and indemnification, and extraordinary expenses) of Class A, Class C, Institutional, Investor, Class R and Class R6 Shares were limited to 2.38%, 3.13%, 1.98%, 2.13%, 2.63% and 2.38%, respectively.
In addition, the Fund has entered into certain offset arrangements with the transfer agent, which may result in a reduction of the Fund’s expenses and are received irrespective of the application of the “Other Expense” limitations described above. For the fiscal year ended October 31, 2018, these expense reductions, including any fee waiver and Other Expense reimbursements, were as follows:
| | | | | | | | | | | | | | |
Management
Fee Waiver | | | Transfer Agency Waivers/Credits | | | Other Expense
Reimbursements | | | Total Annual Operating
Expense Reductions | |
| $ | 1,438,563 | | | $ | 31,785 | | | $ | 2,486,161 | | | $ | 3,956,509 | |
G. Line of Credit Facility — As of October 31, 2018, the Fund participated in a $770,000,000 committed, unsecured revolving line of credit facility (the “facility”) together with other funds of the Trust and certain registered investment companies having management agreements with GSAM or its affiliates. This facility is to be used for temporary emergency purposes, or to allow for an orderly liquidation of securities to meet redemption requests. The interest rate on borrowings is based on the federal funds rate. The facility also requires a fee to be paid by the Fund based on the amount of the commitment that has not been utilized. For the fiscal year ended October 31, 2018, the Fund did not have any borrowings under the facility.
80
GOLDMAN SACHS MULTI-MANAGER ALTERNATIVES FUND
|
| 5. AGREEMENTS AND AFFILIATED TRANSACTIONS (continued) |
H. Other Transactions with Affiliates — For the fiscal year ended October 31, 2018 , Goldman Sachs earned $14,594, in brokerage commissions from portfolio transactions, including futures transactions executed with Goldman Sachs as the Futures Commission Merchant, on behalf of the Fund.
As of October 31, 2018, The Goldman Sachs Group, Inc. was the beneficial owner of approximately 100% of Class R and Class R6 Shares of the Fund.
The table below shows the transaction in and earnings from investments in the Goldman Sachs Financial Square Government Fund for the fiscal year ended October 31, 2018:
| | | | | | | | | | | | | | | | | | | | | | |
Underlying Fund | | Beginning
Value as of
October 31, 2017 | | Purchases at Cost | | | Proceeds from Sales | | | Ending
Value as of
October 31, 2018 | | | Shares as of
October 31, 2018 | | | Dividend Income | |
Goldman Sachs Financial Square Government Fund — Institutional Shares | | $15,046,238 | | $ | 1,673,767,930 | | | $ | (1,501,034,495 | ) | | $ | 187,779,673 | | | | 187,779,673 | | | $ | 3,409,415 | |
| | |
| 6. PORTFOLIO SECURITIES TRANSACTIONS | | |
The cost of purchases and proceeds from sales and maturities of long-term securities for the fiscal year ended October 31, 2018, were $523,547,830 and $524,965,596, respectively. In these amounts are the cost of purchases and proceeds from sales and maturities of U.S. Government and agency obligations in the amounts of $7,032,782 and $0, respectively.
The following table sets forth the Fund’s net exposure for short securities that are subject to enforceable master netting arrangements or similar agreements as of October 31, 2018:
| | | | | | | | | | | | |
| Counterparty | | Securities Sold Short(1) | | | Collateral Pledged | | | Net Amount(2) | |
| State Street Bank & Trust | | $ | (13,394,891 | ) | | $ | 13,394,891 | | | $ | — | |
| (1) | | Gross amounts available for offset but not netted in the Consolidated Statement of Assets and Liabilities. |
| (2) | | Net amount represents the net amount due (to) from counterparty in the event of a default based on the contractual set-off rights under the agreement. Net amount excludes any over-collateralized amounts. |
There were no distributions by the Fund during the fiscal year ended October 31, 2018. The tax character of distributions paid during the fiscal year ended October 31, 2017, in the amount of $21,456,067 was from ordinary income.
As of October 31, 2018, the components of accumulated earnings (losses) on a tax basis were as follows:
| | | | |
Capital loss carryforwards:(1) | | | | |
Perpetual Short-Term | | $ | (58,588,114 | ) |
Perpetual Long-Term | | | (10,828,651 | ) |
Total capital loss carryforwards | | $ | (69,416,765 | ) |
Timing differences (Qualified Late Year Loss Deferral/Straddle Loss Deferral) | | $ | (3,305,523 | ) |
Unrealized gains (losses) — net | | | (3,133,782 | ) |
Total accumulated earnings (losses) net | | $ | (75,856,070 | ) |
| (1) | | The Fund utilized $12,498,980 of capital losses in the current fiscal year. |
81
GOLDMAN SACHS MULTI-MANAGER ALTERNATIVES FUND
Consolidated Notes to Financial Statements (continued)
October 31, 2018
|
| 7. TAX INFORMATION (continued) |
As of October 31, 2018, the Fund’s aggregate security unrealized gains and losses based on cost for U.S. federal income tax purposes were as follows:
| | | | |
Tax Cost | | $ | 472,404,352 | |
Gross unrealized gain | | | 10,502,625 | |
Gross unrealized loss | | | (13,636,407 | ) |
Net unrealized gains (losses) | | $ | (3,133,782 | ) |
The difference between GAAP-basis and tax basis unrealized gains (losses) is attributable primarily to wash sales and net mark to market gains (losses) on regulated futures contracts, foreign currency contracts, differences in the tax treatment of underlying fund investments, and swap transactions.
The Fund reclassed $4,542,141 from paid in capital to distributable earnings for the year ended October 31, 2018. In order to present certain components of the Fund’s capital accounts on a tax-basis, certain reclassifications have been recorded to the Fund’s accounts. These reclassifications have no impact on the net asset value of the Fund’s and result primarily from net operating losses, and differences in the tax treatment of swaps transactions and underlying fund investments.
GSAM has reviewed the Fund’s tax positions for all open tax years (the current and prior three years, as applicable) and has concluded that no provision for income tax is required in the Fund’s financial statements. Such open tax years remain subject to examination and adjustment by tax authorities.
The Fund’s risks include, but are not limited to, the following:
Derivatives Risk — The Fund’s use of derivatives may result in loss. Derivative instruments, which may pose risks in addition to and greater than those associated with investing directly in securities, currencies or other instruments, may be illiquid or less liquid, volatile, difficult to price and leveraged so that small changes in the value of the underlying instruments may produce disproportionate losses to the Fund. Derivatives are also subject to counterparty risk, which is the risk that the other party in the transaction will not fulfill its contractual obligation. The use of derivatives is a highly specialized activity that involves investment techniques and risks different from those associated with investments in more traditional securities and instruments. Losses from derivatives can also result from a lack of correlation between changes in the value of derivative instruments and the portfolio assets being hedged, if any.
Foreign Custody Risk — If the Fund invests in foreign securities may hold such securities and cash with foreign banks, agents, and securities depositories appointed by the Fund’s custodian (each a “Foreign Custodian”). Some foreign custodians may be recently organized or new to the foreign custody business. In some countries, Foreign Custodians may be subject to little or no regulatory oversight over, or independent evaluation of, their operations. Further, the laws of certain countries may place limitations on the Fund’s ability to recover its assets if a Foreign Custodian enters bankruptcy. Investments in emerging markets may be subject to even greater custody risks than investments in more developed markets. Custody services in emerging market countries are very often undeveloped and may be considerably less well regulated than in more developed countries, and thus may not afford the same level of investor protection as would apply in developed countries.
Foreign and Emerging Countries Risk — Investing in foreign markets may involve special risks and considerations not typically associated with investing in the United States. Foreign securities may be subject to risk of loss because of more or less foreign government regulation, less public information and less economic, political and social stability in the countries in which the Fund invests. The imposition of exchange controls (including repatriation restrictions), confiscations, trade restrictions (including tariffs) and other government restrictions by the United States or other governments, or from problems in share registration, settlement or custody, may also result in losses. Foreign risk also involves the risk of negative foreign currency rate fluctuations, which may cause the value of securities denominated in such foreign currency (or other instruments through which the Fund has
82
GOLDMAN SACHS MULTI-MANAGER ALTERNATIVES FUND
|
| 8. OTHER RISKS (continued) |
exposure to foreign currencies) to decline in value. Currency exchange rates may fluctuate significantly over short periods of time. To the extent that the Fund also invests in securities of issuers located in emerging markets, these risks may be more pronounced.
Interest Rate Risk — When interest rates increase, fixed income securities or instruments held by the Fund will generally decline in value. Long-term fixed income securities or instruments will normally have more price volatility because of this risk than short-term fixed income securities or instruments. The risks associated with changing interest rates may have unpredictable effects on the markets and the Fund’s investments. Fluctuations in interest rates may also affect the liquidity of fixed income securities and instruments held by the Fund.
Investments in Other Investment Companies Risk — As a shareholder of another investment company, including an exchange-traded fund (“ETF”), the Fund will indirectly bear its proportionate share of any net management fees and other expenses paid by such other investment companies, in addition to the fees and expenses regularly borne by the Fund. ETFs are subject to risks that do not apply to conventional mutual funds, including but not limited to the following: (i) the market price of the ETF’s shares may trade at a premium or a discount to their NAV; and (ii) an active trading market for an ETF’s shares may not develop or be maintained.
Large Shareholder Transactions Risk — The Fund may experience adverse effects when certain large shareholders, such as other funds, institutional investors (including those trading by use of non-discretionary mathematical formulas), financial intermediaries (who may make investment decisions on behalf of underlying clients and/or include the Fund in their investment model), individuals, accounts and Goldman Sachs affiliates, purchase or redeem large amounts of shares of a Fund. Such large shareholder redemptions may cause the Fund to sell portfolio securities at times when it would not otherwise do so, which may negatively impact the Fund’s NAV and liquidity. These transactions may also accelerate the realization of taxable income to shareholders if such sales of investments resulted in gains, and may also increase transaction costs. In addition, a large redemption could result in the Fund’s current expenses being allocated over a smaller asset base, leading to an increase in the Fund’s expense ratio. Similarly, large Fund share purchases may adversely affect the Fund’s performance to the extent that the Fund is delayed in investing new cash and is required to maintain a larger cash position than it ordinarily would.
Leverage Risk — Leverage creates exposure to potential gains and losses in excess of the initial amount invested. Borrowing and the use of derivatives may result in leverage and may make the Fund more volatile. When the Fund uses leverage, the sum of that Fund’s investment exposure may significantly exceed the amount of assets invested in the Fund, although these exposures may vary over time. Relatively small market movements may result in large changes in the value of a leveraged investment. The Fund will identify liquid assets on its books or otherwise cover transactions that may give rise to such risk, to the extent required by applicable law. The use of leverage may cause the Fund to liquidate portfolio positions to satisfy its obligations or to meet segregation requirements when it may not be advantageous to do so. The use of leverage by the Fund can substantially increase the adverse impact to which the Fund’s investment portfolio may be subject.
Liquidity Risk — The Fund may make investments that are illiquid or that may become less liquid in response to market developments or adverse investor perceptions. Illiquid investments may be more difficult to value. Liquidity risk may also refer to the risk that the Fund will not be able to pay redemption proceeds within the allowable time period because of unusual market conditions, an unusually high volume of redemption requests, or other reasons. To meet redemption requests, the Fund may be forced to sell investments at an unfavorable time and/or under unfavorable conditions. Liquidity risk may be the result of, among other things, the reduced number and capacity of traditional market participants to make a market in fixed income securities or the lack of an active market. The potential for liquidity risk may be magnified by a rising interest rate environment or other circumstances where investor redemptions from fixed income mutual funds may be higher than normal, potentially causing increased supply in the market due to selling activity. These risks may be more pronounced in connection with the Fund’s investments in securities of issuers located in emerging market countries.
Loan-Related Investments Risk — In addition to risks generally associated with debt investments, loan-related investments such as loan participations and assignments are subject to other risks. Although a loan obligation may be fully collateralized at the time of acquisition, the collateral may decline in value, be relatively illiquid, or lose all or substantially all of its value subsequent to
83
GOLDMAN SACHS MULTI-MANAGER ALTERNATIVES FUND
Consolidated Notes to Financial Statements (continued)
October 31, 2018
|
| 8. OTHER RISKS (continued) |
investment. Many loan investments are subject to legal or contractual restrictions on resale and may be relatively illiquid and difficult to value. There is less readily available, reliable information about most loan investments than is the case for many other types of securities. Substantial increases in interest rates may cause an increase in loan obligation defaults. With respect to loan participations, the Fund may not always have direct recourse against a borrower if the borrower fails to pay scheduled principal and/or interest; may be subject to greater delays, expenses and risks than if the Fund had purchased a direct obligation of the borrower; and may be regarded as the creditor of the agent lender (rather than the borrower), subjecting the Fund to the creditworthiness of that lender as well. Investors in loans, such as the Fund, may not be entitled to rely on the anti-fraud protections of the federal securities laws, although they may be entitled to certain contractual remedies. The market for loan obligations may be subject to irregular trading activity, wide bid/ask spreads and extended trade settlement periods. Because transactions in many loans are subject to extended trade settlement periods, the Fund may not receive the proceeds from the sale of a loan for a period after the sale. As a result, sale proceeds related to the sale of loans may not be available to make additional investments or to meet the Fund’s redemption obligations for a period after the sale of the loans, and, as a result, the Fund may have to sell other investments or engage in borrowing transactions, such as borrowing from its credit facility, if necessary to raise cash to meet its obligations.
Senior Loans hold the most senior position in the capital structure of a business entity, and are typically secured with specific collateral, but are nevertheless usually rated below investment grade. Because Second Lien Loans are subordinated or unsecured and thus lower in priority of payment to Senior Loans, they are subject to the additional risk that the cash flow of the borrower and property securing the loan or debt, if any, may be insufficient to meet scheduled payments after giving effect to the senior secured obligations of the borrower. Second Lien Loans generally have greater price volatility than Senior Loans and may be less liquid.
Market and Credit Risks — In the normal course of business, the Fund trades financial instruments and enters into financial transactions where risk of potential loss exists due to changes in the market (market risk). Additionally, the Fund may also be exposed to credit risk in the event that an issuer or guarantor fails to perform or that an institution or entity with which the Fund has unsettled or open transactions defaults.
Multi-Manager Approach Risk — The Fund’s performance depends on the ability of the Investment Adviser in selecting, overseeing, and allocating Fund assets to the Underlying Managers. The Underlying Managers’ investment styles may not always be complementary. The Fund’s multi-manager approach may result in the Fund investing a significant percentage of its assets in certain types of investments, which could be beneficial or detrimental to the Fund’s performance depending on the performance of those investments and the overall market environment. The Fund’s Underlying Managers may underperform the market generally or underperform other investment managers that could have been selected for the Fund. Because the Fund’s Underlying Managers may trade with counterparties, prime brokers, clearing brokers or futures commission merchants on terms that are different than those on which the Investment Adviser would trade, and because each Underlying Manager applies its own risk analysis in evaluating potential counterparties for the Fund, the Fund may be subject to greater counterparty risk than if it was managed directly by the Investment Adviser.
Short Position Risk — The Fund may enter into a short position through a futures contract, an option or swap agreement or through short sales of any instrument that the Fund may purchase for investment. Taking short positions involves leverage of a Fund’s assets and presents various risks, including counterparty risk. If the value of the underlying instrument or market in which the Fund has taken a short position increases, then the Fund will incur a loss equal to the increase in value from the time that the short position was entered into plus any related interest payments or other fees. Taking short positions involves the risk that losses may be disproportionate, may exceed the amount invested, and may be unlimited. To the extent that the Fund uses the proceeds it receives from a short position to take additional long positions, the risks associated with the short position, including leverage risks, may be heightened, because doing so increases the exposure of the Fund to the markets and therefore could magnify changes to the Fund’s NAV.
Tax Risk — The Fund will seek to gain exposure to the commodity markets primarily through investments in the Subsidiary and/or commodity index-linked structured notes, as applicable. Historically, the Internal Revenue Service (“IRS”) issued private letter rulings (“PLRs”) in which the IRS specifically concluded that income and gains from investments in commodity index-linked structured notes or a wholly-owned foreign subsidiary that invests in commodity-linked instruments are “qualifying income” for
84
GOLDMAN SACHS MULTI-MANAGER ALTERNATIVES FUND
|
| 8. OTHER RISKS (continued) |
purposes of compliance with Subchapter M of the Code. However, the Fund has not received a PLR, and is not able to rely on PLRs issued to other taxpayers. Additionally, the IRS has suspended the granting of such PLRs, pending review of its position on this matter. The IRS also recently issued proposed regulations that, if finalized, would generally treat the Fund’s income inclusion with respect to a subsidiary as qualifying income only if there is a distribution out of the earnings and profits of a subsidiary that are attributable to such income inclusion. The proposed regulations, if adopted, would apply to taxable years beginning on or after 90 days after the regulations are published as final.
The IRS also recently issued a revenue procedure, which states that the IRS will not in the future issue PLRs that would require a determination of whether an asset (such as a commodity index-linked note) is a “security” under the Investment Company Act of 1940. The Fund has obtained an opinion of counsel that the Fund’s income from such investments should constitute “qualifying income.” However, no assurances can be provided that the IRS would not be able to successfully assert that the Fund’s income from such investments was not “qualifying income,” in which case the Fund would fail to qualify as a regulated investment company (“RIC”) under Subchapter M of the Code if over 10% of its gross income were derived from these investments. If the Fund failed to qualify as a RIC, it would be subject to federal and state income tax on all of its taxable income at regular corporate tax rates. This would significantly adversely affect the returns to, and could cause substantial losses for, Fund shareholders.
Under the Trust’s organizational documents, its Trustees, officers, employees and agents are indemnified, to the extent permitted by the Act and state law, against certain liabilities that may arise out of performance of their duties to the Fund. Additionally, in the course of business, the Fund enters into contracts that contain a variety of indemnification clauses. The Fund’s maximum exposure under these arrangements is unknown, as this would involve future claims that may be made against the Fund that have not yet occurred. However, GSAM believes the risk of loss under these arrangements to be remote.
In March 2017, the Financial Accounting Standards Board issued Accounting Standards Update (ASU) 2017-08 — Receivables —Nonrefundable Fees and Other Costs (Subtopic 310-20): Premium Amortization on Purchased Callable Debt Securities. The amendments in the ASU shorten the amortization period for certain callable debt securities held at a premium, by requiring amortization to the earliest call date. The ASU is effective for fiscal years, and interim periods within those fiscal years, beginning after December 15, 2018. GSAM is currently evaluating the impact, if any, of the amendments.
In September 2018, the Financial Accounting Standards Board issued Accounting Standards Update (ASU) 2018-13 — Fair Value Measurement (Topic 820) Disclosure Framework — Changes to the Disclosure Requirements for Fair Value Measurement. The amendments in the ASU modify fair value measurement disclosures. The amendments are effective for the Fund’s fiscal year beginning after December 15, 2019. GSAM is currently evaluating the impact, if any, of the amendments.
Subsequent events after the Consolidated Statement of Assets and Liabilities date have been evaluated through the date the financial statements were issued.
On November 19, 2018, the Trustees approved ADG Capital Management LLP (“ADG”) and Artisan Partners Limited Partnership (“Artisan Partners”) to serve as additional Underlying Managers of the Fund, and ADG will serve as an Underlying Manager of an existing wholly-owned subsidiary of the Fund, organized as a company under the laws of the Cayman Islands.
Other than the above, GSAM has concluded that there is no impact requiring adjustment or disclosure in the financial statements.
85
GOLDMAN SACHS MULTI-MANAGER ALTERNATIVES FUND
Consolidated Notes to Financial Statements (continued)
October 31, 2018
|
| 12. SUMMARY OF SHARE TRANSACTIONS |
Share activity is as follows:
| | | | | | | | | | | | | | | | |
| | | Multi Manager Alternatives Fund | |
| | | | |
| | | For the Fiscal Year Ended
October 31, 2018 | | | For the Fiscal Year Ended
October 31, 2017 | |
| | | | |
| | | Shares | | | Dollars | | | Shares | | | Dollars | |
| | | | |
| Class A Shares | | | | | | | | | | | | | | | | |
Shares sold | | | 454,553 | | | $ | 4,610,532 | | | | 1,948,203 | | | $ | 20,056,006 | |
Reinvestment of distributions | | | — | | | | — | | | | 154,896 | | | | 1,590,786 | |
Shares redeemed | | | (2,149,466 | ) | | | (21,824,927 | ) | | | (11,631,278 | ) | | | (119,824,067 | ) |
| | | | (1,694,913 | ) | | | (17,214,395 | ) | | | (9,528,179 | ) | | | (98,177,275 | ) |
| Class C Shares | | | | | | | | | | | | | | | | |
Shares sold | | | 30,626 | | | | 304,279 | | | | 148,662 | | | | 1,504,715 | |
Reinvestment of distributions | | | — | | | | — | | | | 18,706 | | | | 189,309 | |
Shares redeemed | | | (1,724,298 | ) | | | (17,082,932 | ) | | | (2,117,804 | ) | | | (21,373,746 | ) |
| | | | (1,693,672 | ) | | | (16,778,653 | ) | | | (1,950,436 | ) | | | (19,679,722 | ) |
| Institutional Shares | | | | | | | | | | | | | | | | |
Shares sold | | | 11,823,203 | | | | 121,296,620 | | | | 37,196,779 | | | | 385,171,982 | |
Reinvestment of distributions | | | — | | | | — | | | | 1,575,525 | | | | 16,227,907 | |
Shares redeemed | | | (54,218,713 | ) | | | (554,562,273 | ) | | | (47,658,370 | ) | | | (491,697,316 | ) |
| | | | (42,395,510 | ) | | | (433,265,653 | ) | | | (8,886,066 | ) | | | (90,297,427 | ) |
| Investor Shares | | | | | | | | | | | | | | | | |
Shares sold | | | 651,113 | | | | 6,644,464 | | | | 7,028,214 | | | | 72,652,577 | |
Reinvestment of distributions | | | — | | | | — | | | | 189,896 | | | | 1,952,132 | |
Shares redeemed | | | (6,937,409 | ) | | | (70,702,314 | ) | | | (8,459,818 | ) | | | (87,010,728 | ) |
| | | | (6,286,296 | ) | | | (64,057,850 | ) | | | (1,241,708 | ) | | | (12,406,019 | ) |
| Class P Shares(a) | | | | | | | | | | | | | | | | |
Shares sold | | | 12,829,464 | | | | 130,500,559 | | | | — | | | | — | |
Shares redeemed | | | (1,958,858 | ) | | | (19,883,699 | ) | | | — | | | | — | |
| | | | 10,870,606 | | | | 110,616,860 | | | | — | | | | — | |
| Class R Shares | | | | | | | | | | | | | | | | |
Reinvestment of distributions | | | — | | | | — | | | | 120 | | | | 1,227 | |
Shares redeemed | | | (9,220 | ) | | | (93,047 | ) | | | — | | | | — | |
| | | | (9,220 | ) | | | (93,047 | ) | | | 120 | | | | 1,227 | |
| Class R6 Shares(b) | | | | | | | | | | | | | | | | |
Shares sold | | | 978 | | | | 10,000 | | | | — | | | | — | |
| | | | 978 | | | | 10,000 | | | | — | | | | — | |
NET DECREASE | | | (41,208,027 | ) | | $ | (420,782,738 | ) | | | (21,606,269 | ) | | $ | (220,559,216 | ) |
| (a) | | Commenced operations on April 16, 2018. |
| (b) | | Commenced operations on February 28, 2018. |
86
Report of Independent Registered Public
Accounting Firm
To the Board of Trustees of Goldman Sachs Trust II and Shareholders of
Goldman Sachs Multi-Manager Alternatives Fund
Opinion on the Consolidated Financial Statements
We have audited the accompanying consolidated statement of assets and liabilities, including the consolidated schedule of investments, of Goldman Sachs Multi-Manager Alternatives Fund and its subsidiaries (one of the funds constituting Goldman Sachs Trust II, referred to hereafter as the “Fund”) as of October 31, 2018, the related consolidated statement of operations for the year ended October 31, 2018, the consolidated statements of changes in net assets for each of the two years in the period ended October 31, 2018, including the related notes, and the consolidated financial highlights for each of the periods indicated therein (collectively referred to as the “consolidated financial statements”). In our opinion, the consolidated financial statements present fairly, in all material respects, the financial position of the Fund as of October 31, 2018, the results of their operations for the year then ended, the changes in their net assets for each of the two years in the period ended October 31, 2018 and the consolidated financial highlights for each of the periods indicated therein in conformity with accounting principles generally accepted in the United States of America.
Basis for Opinion
These consolidated financial statements are the responsibility of the Fund’s management. Our responsibility is to express an opinion on the Fund’s consolidated financial statements based on our audits. We are a public accounting firm registered with the Public Company Accounting Oversight Board (United States) (“PCAOB”) and are required to be independent with respect to the Fund in accordance with the U.S. federal securities laws and the applicable rules and regulations of the Securities and Exchange Commission and the PCAOB.
We conducted our audits of these consolidated financial statements in accordance with the standards of the PCAOB. Those standards require that we plan and perform the audit to obtain reasonable assurance about whether the consolidated financial statements are free of material misstatement, whether due to error or fraud.
Our audits included performing procedures to assess the risks of material misstatement of the consolidated financial statements, whether due to error or fraud, and performing procedures that respond to those risks. Such procedures included examining, on a test basis, evidence regarding the amounts and disclosures in the consolidated financial statements. Our audits also included evaluating the accounting principles used and significant estimates made by management, as well as evaluating the overall presentation of the consolidated financial statements. Our procedures included confirmation of securities owned as of October 31, 2018 by correspondence with the custodian, transfer agent and brokers; when replies were not received from brokers, we performed other auditing procedures. We believe that our audits provide a reasonable basis for our opinion.
PricewaterhouseCoopers LLP
Boston, Massachusetts
December 27, 2018
We have served as the auditor of one or more investment companies in the Goldman Sachs fund complex since 2000.
87
GOLDMAN SACHS MULTI-MANAGER ALTERNATIVES FUND
| | |
Fund Expenses — Six Month Period Ended October 31, 2018 (Unaudited) | | |
As a shareholder of Class A, Class C, Institutional, Service, Investor, Class P, Class R or Class R6 Shares of the Fund, you incur two types of costs: (1) transaction costs, including sales charges on purchase payments (with respect to Class A Shares), contingent deferred sales charges on redemptions (with respect to Class C Shares), and (2) ongoing costs, including management fees; distribution and service (12b-1) fees (with respect to Class A and Class R Shares); and other Fund expenses. This example is intended to help you understand your ongoing costs (in dollars) of investing in Class A, Class C, Institutional, Service, Investor, Class P, Class R or Class R6 Shares of the Fund and to compare these costs with the ongoing costs of investing in other mutual funds.
The example is based on an investment of $1,000 invested at the beginning of the period and held for the entire period from May 1, 2018 through October 31, 2018, which represents a period of 184 days of a 365 day year.
Actual Expenses — The first line under each share class in the table below provides information about actual account values and actual expenses. You may use the information in this line, together with the amount you invested, to estimate the expenses that you paid over the period. Simply divide your account value by $1,000 (for example, an $8,600 account value divided by $1,000=8.6), then multiply the result by the number in the first line under the heading entitled “Expenses Paid” to estimate the expenses you paid on your account during this period.
Hypothetical Example for Comparison Purposes — The second line under each share class in the table below provides information about hypothetical account values and hypothetical expenses based on the Fund’s actual net expense ratios and an assumed rate of return of 5% per year before expenses, which is not the Fund’s actual return. The hypothetical account values and expenses may not be used to estimate the actual ending account balance or expenses you paid for the period. You may use this information to compare the ongoing costs of investing in the Fund and other funds. To do so, compare this 5% hypothetical example with the 5% hypothetical examples that appear in the shareholder reports of the other funds.
Please note that the expenses shown in the table are meant to highlight your ongoing costs only and do not reflect any transactional costs, such as sales charges, redemption fees, or exchange fees. Therefore, the second line of the table is useful in comparing ongoing costs only, and will not help you determine the relative total costs of owning different funds. In addition, if these transactional costs were included, your costs would have been higher.
| | | | | | | | | | | | |
| | | Multi Manager Alternatives Fund | |
| Share Class | | Beginning
Account Value
5/1/18 | | | Ending
Account Value
10/31/18 | | | Expenses Paid for the 6 months ended
10/31/18* | |
| Class A | | | | | | | | | | | | |
Actual | | $ | 1,000.00 | | | $ | 980.20 | | | $ | 11.13 | |
Hypothetical 5% return | | | 1,000.00 | | | | 1,013.96 | + | | | 11.32 | |
| Class C | | | | | | | | | | | | |
Actual | | | 1,000.00 | | | | 976.70 | | | | 14.90 | |
Hypothetical 5% return | | | 1,000.00 | | | | 1,010.13 | + | | | 15.15 | |
| Institutional | | | | | | | | | | | | |
Actual | | | 1,000.00 | | | | 981.40 | | | | 9.54 | |
Hypothetical 5% return | | | 1,000.00 | | | | 1,015.58 | + | | | 9.70 | |
| Investor | | | | | | | | | | | | |
Actual | | | 1,000.00 | | | | 981.30 | | | | 9.99 | |
Hypothetical 5% return | | | 1,000.00 | | | | 1,015.12 | + | | | 10.16 | |
| Class P(a) | | | | | | | | | | | | |
Actual | | | 1,000.00 | | | | 981.40 | | | | 9.14 | |
Hypothethical 5% return | | | 1,000.00 | | | | 1,015.98 | + | | | 9.30 | |
| Class R | | | | | | | | | | | | |
Actual | | | 1,000.00 | | | | 979.10 | | | | 12.82 | |
Hypothetical 5% return | | | 1,000.00 | | | | 1,012.25 | + | | | 13.03 | |
| Class R6(b) | | | | | | | | | | | | |
Actual | | | 1,000.00 | | | | 981.40 | | | | 9.29 | |
Hypothethical 5% return | | | 1,000.00 | | | | 1,015.83 | + | | | 9.45 | |
| | + | | Hypothetical expenses are based on the Fund’s actual annualized net expense ratios and an assumed rate of return of 5% per year before expenses. | |
| | * | | Expenses for each share class are calculated using the Fund’s annualized net expense ratio for each class, which represents the ongoing expenses as a percentage of net assets for the six months ended October 31, 2018. Expenses are calculated by multiplying the annualized net expense ratio by the average account value for the period; then multiplying the result by the number of days in the most recent fiscal half year; and then dividing that result by the number of days in the fiscal year. The annualized net expense ratios for the period were as follows: | |
| | | | | | | | | | | | | | | | | | | | | | | | | | | | |
| Fund | | Class A | | | Class C | | | Institutional | | | Investor | | | Class P(a) | | | Class R | | | Class R6(b) | |
Multi Manager Alternatives+ | | | 2.04 | % | | | 2.78 | % | | | 1.70 | % | | | 1.77 | % | | | 1.74 | % | | | 2.23 | % | | | 1.86 | % |
| | (a) | | Commenced operations on April 16, 2018. | |
| | (b) | | Commenced operations on February 28, 2018. | |
88
GOLDMAN SACHS MULTI-MANAGER ALTERNATIVES FUND
Statement Regarding Basis for Approval of Management Agreement and Sub-Advisory Agreements (Unaudited)
Background
The Goldman Sachs Multi-Manager Alternatives Fund (the “Fund”) is an investment portfolio of Goldman Sachs Trust II (the “Trust”). The Board of Trustees oversees the management of the Trust and reviews the investment performance and expenses of the Fund at regularly scheduled meetings held throughout the year. The Fund employs a “manager of managers” structure, whereby Goldman Sachs Asset Management, L.P. (the “Investment Adviser”) is responsible for selecting sub-advisers (subject to Board approval), allocating the Fund’s assets among them, and overseeing their day-to-day management of Fund assets. The Board of Trustees determines annually whether to approve the continuance of the Trust’s investment management agreement (the “Management Agreement”) with the Investment Adviser on behalf of the Fund.
The Management Agreement was most recently approved for continuation until August 31, 2019 by the Board of Trustees, including those Trustees who are not parties to the Management Agreement or “interested persons” (as defined in the Investment Company Act of 1940, as amended) of any party thereto (the “Independent Trustees”), at a meeting held on August 7-8, 2018 (the “Annual Meeting”). At the Annual Meeting, the Board also considered the sub-advisory agreements (each a “Designated Sub-Advisory Agreement” and, together with the Management Agreement, the “Agreements”) between the Investment Adviser and each of Acadian Asset Management LLC, Algert Global LLC, Ares Capital Management II LLC, Atreaus Capital, LP, Brigade Capital Management, LP, Emso Asset Management Limited, First Pacific Advisors, LLC, One River Asset Management LLC, QMS Capital Management LP, Russell Investments Commodity Advisor, LLC, Sirios Capital Management, L.P., and Wellington Management Company LLP (each a “Designated Sub-Adviser” and collectively, the “Designated Sub-Advisers”).
The review process undertaken by the Trustees spans the course of the year and culminates with the Annual Meeting. To assist the Trustees in their deliberations, the Trustees have established a Contract Review Committee (the “Committee”), comprised of the Independent Trustees. The Committee held five meetings over the course of the year since the Management Agreement was last approved. At those Committee meetings, regularly scheduled Board or other committee meetings, and/or the Annual Meeting, matters relevant to the renewal of the Management Agreement and the Designated Sub-Advisory Agreements were considered by the Board, or the Independent Trustees, as applicable. With respect to the Fund, such matters included:
| | (a) | | the nature and quality of the advisory, administrative, and other services provided to the Fund by the Investment Adviser and its affiliates, and the Designated Sub-Advisers, including, as applicable, information about: |
| | (i) | | the structure, staff, and capabilities of the Investment Adviser and the Designated Sub-Advisers and the Designated Sub-Advisers’ portfolio management teams; |
| | (ii) | | the groups within the Investment Adviser and its affiliates that support the portfolio management teams or provide other types of necessary services, including fund services groups (e.g., accounting and financial reporting, tax, shareholder services, and operations); controls and risk management groups (e.g., legal, compliance, valuation oversight, credit risk management, internal audit, compliance testing, market risk analysis, finance, and central funding); sales and distribution support groups, and others (e.g., information technology and training); |
| | (iii) | | trends in employee headcount; |
| | (iv) | | the Investment Adviser’s financial resources and ability to hire and retain talented personnel and strengthen its operations; and |
| | (v) | | the parent company’s support of the Investment Adviser and its mutual fund business, as expressed by the firm’s senior management; |
| | (b) | | information on the investment performance of the Fund, including comparisons to the performance of similar mutual funds, as provided by a third-party mutual fund data provider engaged as part of the contract review process (the “Outside Data Provider”), benchmark performance indices, and commingled investment vehicles with comparable investment strategies managed by the Investment Adviser, as well as general investment outlooks in the markets in which the Fund invests; |
| | (c) | | information provided by the Investment Adviser indicating the Investment Adviser’s views on whether the Fund’s peer group and/or benchmark index had high, medium, or low relevance given the Fund’s particular investment strategy; |
| | (d) | | the terms of the Agreements and other agreements with affiliated service providers entered into by the Trust on behalf of the Fund; |
| | (e) | | fee and expense information for the Fund, including: |
| | (i) | | the relative management fee and expense levels of the Fund as compared to those of comparable funds managed by other advisers, as provided by the Outside Data Provider; |
| | (ii) | | the Fund’s expense trends over time; and |
| | (iii) | | comparative information on the advisory fees charged and services provided by the Investment Adviser to certain collective investment vehicles that it manages with comparable investment strategies; |
89
GOLDMAN SACHS MULTI-MANAGER ALTERNATIVES FUND
Statement Regarding Basis for Approval of Management Agreement and Sub-Advisory Agreements (Unaudited) (continued)
| | (f) | | with respect to the extensive investment performance and expense comparison data provided by the Outside Data Provider, its processes in producing that data for the Fund; |
| | (g) | | the undertakings of the Investment Adviser and its affiliates to implement fee waivers and/or expense limitations; |
| | (h) | | information relating to the profitability of the Management Agreement and the transfer agency, distribution and service arrangements of the Fund to the Investment Adviser and its affiliates; |
| | (i) | | whether the Fund’s existing management fee schedule adequately addressed any economies of scale; (j) a summary of the “fall-out” benefits derived by the Investment Adviser and its affiliates from their relationships with the Fund, including the fees received by the Investment Adviser’s affiliates from the Fund for transfer agency, portfolio trading, distribution and other services; |
| | (k) | | a summary of potential benefits derived by the Fund as a result of its relationship with the Investment Adviser; |
| | (l) | | with respect to the Investment Adviser, portfolio manager ownership of Fund shares and the manner in which portfolio manager compensation is determined; information on the Designated Sub-Advisers’ compensation arrangements; and the number and types of accounts managed by the portfolio managers; |
| | (m) | | the nature and quality of the services provided to the Fund by its unaffiliated service providers (including the Designated Sub-Advisers), and the Investment Adviser’s general oversight and evaluation (including reports on due diligence) of those service providers as part of the services provided under the Management Agreement; and |
| | (n) | | the Investment Adviser’s and Designated Sub-Advisers’ processes and policies addressing various types of potential conflicts of interest; their approaches to risk management; the annual review of the effectiveness of the Fund’s compliance program; and periodic compliance reports. |
The Trustees also received an overview of the Fund’s distribution arrangements. They received information regarding the Fund’s assets, share purchase and redemption activity, and payment of distribution and service fees. Information was also provided to the Trustees relating to revenue sharing payments made by and services provided by the Investment Adviser and its affiliates to intermediaries that promote the sale, distribution, and/or servicing of Fund shares.
The presentations made at the Board and Committee meetings and at the Annual Meeting encompassed the Fund and other mutual funds for which the Board of Trustees has responsibility. In evaluating the Agreements at the Annual Meeting, the Trustees relied upon their knowledge, resulting from their meetings and other interactions throughout the year, of the Fund and the respective services of the Investment Adviser and its affiliates, and the Designated Sub-Advisers. In conjunction with these meetings, the Trustees received written materials and oral presentations on the topics covered, and the Investment Adviser addressed the questions and concerns of the Trustees, including concerns regarding the investment performance of certain of the funds they oversee. In addition, the Independent Trustees periodically received written materials and oral presentations from the funds’ various sub-advisers, including the Designated Sub-Advisers. The Independent Trustees were advised by their independent legal counsel regarding their responsibilities and other regulatory requirements related to the approval and continuation of mutual fund investment management agreements under applicable law. In addition, the Investment Adviser and its affiliates provided the Independent Trustees with a written response to a formal request for information sent on behalf of the Independent Trustees by their independent legal counsel. The Independent Trustees reviewed a written response prepared by each Designated Sub-Adviser to a similar request for information submitted to the Designated Sub-Adviser by the Investment Adviser. During the course of their deliberations, the Independent Trustees met in executive sessions with their independent legal counsel, without representatives of the Investment Adviser or its affiliates present.
Nature, Extent, and Quality of the Services Provided Under the Management Agreement
As part of their review, the Trustees considered the nature, extent, and quality of the services provided to the Fund by the Investment Adviser. In this regard, the Trustees considered both the investment advisory services and non-advisory services that are provided by the Investment Adviser and its affiliates. They also recalled presentations received during the past year, which described portfolio manager changes for the Fund. The Trustees noted the ongoing recruitment efforts aimed at bringing high quality investment talent to the Investment Adviser. They also noted the Investment Adviser’s commitment to maintaining high quality systems and expending substantial resources to respond to ongoing changes to the regulatory and control environment in which the Fund and its service providers operate, as well as the efforts of the Investment Adviser and its affiliates to combat cyber security risks. The Trustees concluded that the Investment Adviser continued to commit substantial financial and operational resources to the Fund and expressed confidence that the Investment Adviser would continue to do so in the future. The Trustees also recognized that the Investment Adviser had made significant commitments to address regulatory compliance requirements applicable to the Fund and the Investment Adviser and its affiliates. In addition, the Trustees reviewed the Sub-Adviser oversight process that the Investment Adviser had employed, which included areas such as investment analytics, risk management and compliance.
90
GOLDMAN SACHS MULTI-MANAGER ALTERNATIVES FUND
Statement Regarding Basis for Approval of Management Agreement and Sub-Advisory Agreements (Unaudited) (continued)
Investment Performance
The Trustees considered the investment performance of the Fund. In this regard, they compared the investment performance of the Fund to its peers using rankings and ratings compiled by the Outside Data Provider, and updated performance information prepared by the Investment Adviser using the peer groups identified by the Outside Data Provider. The Trustees also reviewed the Fund’s investment performance relative to its performance benchmarks. As part of this review, they considered the investment performance trends of the Fund over time, and reviewed the investment performance of the Fund in light of its investment objective and policies and market conditions. The Trustees considered the Investment Adviser’s representations that the Fund had significant differences from its Outside Data Provider peer group and benchmark indices that caused them to be imperfect bases for comparison. The Trustees also compared the investment performance of the Fund to the performance of comparable unregistered funds for which the Investment Adviser also serves as investment adviser. They considered that the unregistered funds provide an imperfect performance comparison because they are not subject to the requirements of the Investment Company Act of 1940, as amended.
In addition, the Trustees considered materials prepared and presentations made by the Investment Adviser’s senior management and the Sub-Advisers’ portfolio management personnel in which Fund performance was assessed. The Trustees also considered the Investment Adviser’s periodic reports with respect to the Fund’s risk profiles, and how the Investment Adviser’s approach to risk monitoring and management influences portfolio management.
The Trustees noted that the Fund’s Institutional Shares had placed in the fourth quartile of the Fund’s performance peer group, and had underperformed the Fund’s primary benchmark index for the one- and three-year periods ended May 31, 2018.
Costs of Services Provided and Competitive Information
The Trustees considered the contractual terms of the Management Agreement, the fee rates payable by the Fund thereunder, and the net amount retained by the Investment Adviser after payment of sub-advisory fees. In this regard, the Trustees considered information on the services rendered by the Investment Adviser to the Fund, which included both advisory and administrative services that were directed to the needs and operations of the Fund as a registered mutual fund.
In particular, the Trustees reviewed the analyses prepared by the Outside Data Provider regarding the expense rankings of the Fund, as well as additional information provided by the Investment Adviser throughout the year. The analyses provided a comparison of the Fund’s management fee and breakpoints to those of a relevant peer group and category universe; an expense analysis which compared the Fund’s overall net and gross expenses to a peer group and a category universe; and data comparing the Fund’s net expenses to the peer and category medians. The analyses also compared the Fund’s transfer agency, custody, and distribution fees, other expenses and fee waivers/reimbursements to those of the peer group and category medians. The Trustees also considered comparative fee information for services provided by the Investment Adviser to collective investment vehicles having investment objectives and policies similar to those of the Fund. They also noted that, in some cases, these collective investment vehicles have a compensation structure that includes performance fees and also pay additional asset-based fees and performance fees to the managers of underlying hedge funds. The Trustees considered that services provided to the Fund differed in various significant respects from the services provided to these collective investment vehicles, which generally operated under less stringent regulatory and financial reporting requirements, required fewer services from the Investment Adviser to a smaller number of client contact points, and were less time-sensitive. The Trustees concluded that the comparisons provided by the Outside Data Provider and the Investment Adviser were useful in evaluating the reasonableness of the management fees and total expenses paid by the Fund.
The Trustees considered the Investment Adviser’s undertakings to implement fee waivers and/or expense limitations. The Trustees noted that the Investment Adviser had agreed to waive a portion of its management fee in an amount equal to the aggregate management fees paid to the Investment Adviser as the investment adviser to the Fund’s wholly-owned subsidiaries. The Trustees recognized that, in May 2018, the Investment Adviser had increased the amount of the management fee waiver for the Fund, while increasing the cap on the “other expenses” ratio.
In addition, the Trustees noted that shareholders are able to redeem their Fund shares at any time if shareholders believe that the Fund fees and expenses are too high or if they are dissatisfied with the performance of the Fund.
The Investment Adviser’s Profitability
The Trustees reviewed the Fund’s contribution to the Investment Adviser’s revenues and pre-tax profit margins. In this regard the Trustees noted that they had received, among other things, profitability analyses and summaries, revenue and expense schedules by Fund and by function (i.e., investment management, transfer agency, and distribution and service), and information on the Investment Adviser’s expense allocation methodology. They observed that the profitability and expense figures are
91
GOLDMAN SACHS MULTI-MANAGER ALTERNATIVES FUND
Statement Regarding Basis for Approval of Management Agreement and Sub-Advisory Agreements (Unaudited) (continued)
substantially similar to those used by the Investment Adviser for many internal purposes, including compensation decisions among various business groups, and are thus subject to a vigorous internal debate about how certain revenue and expenses should be allocated. The Trustees also noted that the internal audit group within the Goldman Sachs organization had audited the expense allocation methodology and that the internal audit group was satisfied with the reasonableness, consistency, and accuracy of the Investment Adviser’s expense allocation methodology and profitability analysis calculations. Profitability data for the Fund was provided for 2017 and 2016, and the Trustees considered this information in relation to the Investment Adviser’s overall profitability.
Economies of Scale
The Trustees considered the information that had been provided regarding whether there have been economies of scale with respect to the management of the Fund. The Trustees also considered the breakpoints in the fee rate payable under the Management Agreement for the Fund at the following annual percentage rates of the average daily net assets of the Fund:
| | | | |
| Average Daily Net Assets | | Management Fee Annual Rate | |
First $2 billion | | | 1.90 | % |
Next $3 billion | | | 1.80 | % |
Next $3 billion | | | 1.71 | % |
Over $8 billion | | | 1.68 | % |
The Trustees noted that the breakpoints were designed to share potential economies of scale, if any, with the Fund and its shareholders as assets under management reach those asset levels. The Trustees considered the amounts of assets in the Fund; the Fund’s recent share purchase and redemption activity; the information provided by the Investment Adviser relating to the costs of the services provided by the Investment Adviser and its affiliates and their realized profits; information comparing fee rates charged by the Investment Adviser with fee rates charged to other funds in the peer group; and the Investment Adviser’s undertakings to waive a portion of its management fee and to limit certain expenses of the Fund that exceed specified levels. The Independent Trustees also considered the relationship between the advisory and sub-advisory fee rate schedules. Upon reviewing these matters at the Annual Meeting, the Trustees concluded that the fee breakpoints represented a means of assuring that benefits of scalability, if any, would be passed along to shareholders at the specified asset levels.
Other Benefits to the Investment Adviser and Its Affiliates
The Trustees also considered the other benefits derived by the Investment Adviser and its affiliates from their relationships with the Fund, including: (a) transfer agency fees received by Goldman Sachs & Co. LLC (“Goldman Sachs”); (b) brokerage and futures commissions earned by Goldman Sachs for executing securities transactions (in its capacity as clearing broker) and futures transactions on behalf of the Fund; (c) the Investment Adviser’s ability to leverage the infrastructure designed to service the Fund on behalf of the Investment Adviser’s other clients; (d) the Investment Adviser’s ability to cross-market other products and services to Fund shareholders; (e) Goldman Sachs’ retention of certain fees as Fund distributor; (f) the Investment Adviser’s ability to negotiate better pricing with the Fund’s custodian on behalf of its other clients, as a result of the relationship with the Fund; and (g) the possibility that the working relationship between the Investment Adviser and the Fund’s third-party service providers (including the Sub-Advisers) may cause those service providers to be more likely to do business with other areas of Goldman Sachs. In the course of considering the foregoing, the Independent Trustees requested and received further information quantifying certain of these fall-out benefits.
Other Benefits to the Fund and Its Shareholders
The Trustees also noted that the Fund receives certain potential benefits as a result of its relationship with the Investment Adviser, including: (a) enhanced servicing from vendors because of the volume of business generated by the Investment Adviser and its affiliates; (b) the advantages received from the Investment Adviser’s knowledge and experience gained from managing other accounts and products; (c) the Investment Adviser’s ability to hire and retain qualified personnel to provide services to the Fund because of the reputation of the Goldman Sachs organization; (d) the Fund’s access, through the Investment Adviser, to certain firm-wide resources (e.g., proprietary risk management systems and databases), subject to certain restrictions; and (e) access to certain affiliated distribution channels.
92
GOLDMAN SACHS MULTI-MANAGER ALTERNATIVES FUND
Statement Regarding Basis for Approval of Management Agreement and Sub-Advisory Agreements (Unaudited) (continued)
Conclusion
In connection with their consideration of the Management Agreement, the Trustees gave weight to various factors, but did not identify any particular factor as controlling their decision. After deliberation and consideration of the information provided, including the factors described above, the Trustees, including the Independent Trustees, unanimously concluded, in the exercise of their business judgment, that the investment management fees paid by the Fund were reasonable in light of the factors considered, and that the Management Agreement, and the terms thereof, should be approved and continued with respect to the Fund until August 31, 2019.
Designated Sub-Advisory Agreements
Nature, Extent, and Quality of the Services Provided Under the Designated Sub-Advisory Agreements and Performance
In evaluating the Designated Sub-Advisory Agreements, the Trustees relied upon materials furnished and presentations made by the Investment Adviser and the Designated Sub-Advisers. In evaluating the nature, extent, and quality of services provided by each Designated Sub-Adviser, the Trustees considered information on the services provided to the Fund by each Designated Sub-Adviser, including information about each Designated Sub-Adviser’s (a) personnel and compensation structure; (b) track record in managing the Fund and, if applicable, other funds and/or accounts with investment strategies similar to those employed on behalf of the Fund; (c) policies and procedures in place to address potential conflicts of interest; and (d) compliance program and code of ethics. In this regard, they also considered assessments provided by the Investment Adviser of each Designated Sub-Adviser, the Designated Sub-Adviser’s investment strategies and personnel, and its compliance program. The Trustees also reviewed the operations and investment performance of each Designated Sub-Adviser’s respective sleeve of the Fund since its inception, including a comparison of each Designated Sub-Adviser to relevant benchmark indices based on various metrics, including realized beta, excess return, alpha, and volatility.
Costs of Services Provided
The Trustees reviewed the terms of each Designated Sub-Advisory Agreement, including the schedule of fees payable to the Designated Sub-Advisers. They considered any breakpoints in the sub-advisory fee rate payable under each Designated Sub-Advisory Agreement. The Trustees noted that the compensation paid to each Designated Sub-Adviser is paid by the Investment Adviser, not by the Fund, and that the retention of the Designated Sub-Advisers does not directly increase the fees incurred by the Fund for advisory services. They considered the Investment Adviser’s belief that the relationship between the management fees paid by the Fund and the sub-advisory fees paid by the Investment Adviser is appropriate given the level of services the Investment Adviser provides to the Fund and significant differences in cost drivers and risks associated with the respective services offered by the Investment Adviser and each Designated Sub-Adviser. They also considered the management fee waivers and expense limitations that substantially reduce the fees retained by the Investment Adviser. The Trustees considered that certain Designated Sub-Advisers had agreed to reduce their sub-advisory fee rate. The Trustees reviewed the blended average of all sub-advisory fees paid by the Investment Adviser with respect to the Fund in light of the overall management fee paid by the Fund.
Conclusion
In connection with their consideration of the Designated Sub-Advisory Agreements, the Trustees gave weight to various factors, but did not identify any particular factor as controlling their decision. After deliberation and consideration of the information provided, including the factors described above, the Trustees, including the Independent Trustees, unanimously concluded, in the exercise of their business judgment, that the sub-advisory fees paid by the Investment Adviser to each Designated Sub-Adviser were reasonable in light of the factors considered, and that each Designated Sub-Advisory Agreement should be approved and continued until August 31, 2019.
New Sub-Advisory Agreement
In addition to the actions taken by the Trustees to approve the continuation of the Management Agreement and the Designated Sub-Advisory Agreements, upon the recommendation of the Investment Adviser, at a meeting held on May 8-9, 2018, the Trustees, including all of the Independent Trustees present, approved a sub-advisory agreement (the “New Sub-Advisory Agreement”) between the Investment Adviser and GQG Partners LLC (the “New Sub-Adviser”) on behalf of the Fund. In connection with their evaluation of the New Sub-Advisory Agreement, the Trustees received written materials and oral presentations prepared by the Investment Adviser and the New Sub-Adviser on the topics covered, and were advised by their independent legal counsel. In addition, the Trustees received information prepared by the New Sub-Adviser in a written response to a formal request from the Investment Adviser.
93
GOLDMAN SACHS MULTI-MANAGER ALTERNATIVES FUND
Statement Regarding Basis for Approval of Management Agreement and Sub-Advisory Agreements (Unaudited) (continued)
Nature, Extent, and Quality of the Services to be Provided Under the New Sub-Advisory Agreement
In evaluating the New Sub-Advisory Agreement, the Trustees relied upon materials furnished and presentations made by the Investment Adviser and the New Sub-Adviser. In evaluating the nature, extent, and quality of services to be provided by the New Sub-Adviser, the Trustees considered information on the services to be provided to the Fund by the New Sub-Adviser, including information about the New Sub-Adviser’s (a) personnel and compensation structure; (b) track record in managing the Goldman Sachs GQG Partners International Opportunities Fund and a composite of funds or accounts, which have investment strategies similar to those to be employed on behalf of the Fund; (c) policies and procedures in place to address potential conflicts of interest; and (d) compliance program and code of ethics. In this regard, they also considered assessments provided by the Investment Adviser of the New Sub-Adviser, the New Sub-Adviser’s investment strategies and personnel, and its compliance program. They noted that, because the New Sub-Adviser had not previously provided services to the Fund, there was no performance information to evaluate with respect to the Fund.
Costs of Services to be Provided
The Trustees reviewed the terms of the New Sub-Advisory Agreement and the proposed fee schedule. They noted that the compensation paid to the New Sub-Adviser would be paid by the Investment Adviser, not by the Fund. They also noted that the terms of the New Sub-Advisory Agreement were the result of arm’s length negotiations between the Investment Adviser and the New Sub-Adviser. The Trustees reviewed the anticipated blended average of all sub-advisory fees to be paid by the Investment Adviser with respect to the Fund and how it would change upon hiring the New Sub-Adviser. They considered this information in light of the overall management fee expected to be retained by the Investment Adviser.
Conclusion
In connection with their consideration of the New Sub-Advisory Agreement, the Trustees gave weight to various factors, but did not identify any particular factor as controlling their decision. After deliberation and consideration of the information provided, including the factors described above, the Trustees, including the Independent Trustees, unanimously concluded, in the exercise of their business judgment, that the sub-advisory fees to be paid by the Investment Adviser to the New Sub-Adviser were reasonable in light of the factors considered, and that the New Sub-Advisory Agreement, and the terms thereof, should be approved for a period of two years from its effective date.
94
GOLDMAN SACHS MULTI-MANAGER ALTERNATIVES FUND
Trustees and Officers (Unaudited)
Independent Trustees
| | | | | | | | | | |
Name,
Address and Age1 | | Position(s) Held
with the Trust | | Term of
Office and
Length of
Time Served2 | | Principal Occupation(s)
During Past 5 Years | | Number of
Portfolios in
Fund Complex
Overseen by
Trustee3 | | Other
Directorships
Held by Trustee4 |
Cheryl K. Beebe Age: 62 | | Chair of the Board of Trustees | | Since 2017 (Trustee since 2015) | | Ms. Beebe is retired. She is Director, Convergys Corporation (2015-Present); Director, Packaging Corporation of America (2008-Present); and was formerly Executive Vice President, (2010-2014); and Chief Financial Officer, Ingredion, Inc. (a leading global ingredient solutions company) (2004-2014). Chair of the Board of Trustees — Goldman Sachs Trust II. | | 19 | | Convergys Corporation (a global leader in customer experience outsourcing); Packaging Corporation of America (producer of container board) |
Lawrence Hughes Age: 60 | | Trustee | | Since 2016 | | Mr. Hughes is retired. Formerly, he held senior management positions with BNY Mellon Wealth Management, a division of The Bank of New York Mellon Corporation (a financial services company) (1991-2015), most recently as Chief Executive Officer (2010-2015). He serves as Chairman of the Board of Directors, Ellis Memorial and Eldredge House (a not-for-profit organization) (2012-Present). Previously, Mr. Hughes served as an Advisory Board Member of Goldman Sachs Trust II (February 2016-April 2016). Trustee — Goldman Sachs Trust II. | | 19 | | None |
John F. Killian Age: 63 | | Trustee | | Since 2015 | | Mr. Killian is retired. He is Director, Consolidated Edison, Inc. (2007-Present); Director, Houghton Mifflin Harcourt Publishing Company (2011-Present); and formerly held senior management positions with Verizon Communications, Inc., including Executive Vice President and Chief Financial Officer (2009- 2010); and President, Verizon Business, Verizon Communications, Inc. (2005-2009). Trustee — Goldman Sachs Trust II. | | 19 | | Consolidated Edison, Inc. (a utility holding company); Houghton Mifflin Harcourt Publishing Company |
Steven D. Krichmar Age: 60 | | Trustee | | Since 2018 | | Mr. Krichmar is retired. Formerly, he held senior management and governance positions with Putnam Investments, LLC, a financial services company (2001-2016). He was most recently Chief of Operations and a member of the Operating Committee of Putnam Investments, LLC and Principal Financial Officer of The Putnam Funds. Previously, Mr. Krichmar served as an Audit Partner with PricewaterhouseCoopers LLP and its predecessor company (1990-2001). Trustee — Goldman Sachs Trust II. | | 19 | | None |
| | | | | | | | | | |
95
GOLDMAN SACHS MULTI-MANAGER ALTERNATIVES FUND
Trustees and Officers (Unaudited) (continued)
Interested Trustee*
| | | | | | | | | | |
Name,
Address and Age1 | | Position(s) Held
with the Trust | | Term of
Office and
Length of
Time Served2 | | Principal Occupation(s)
During Past 5 Years | | Number of
Portfolios in
Fund Complex
Overseen by
Trustee3 | | Other
Directorships
Held by Trustee4 |
| James A. McNamara Age: 56 | | President and Trustee | | Since 2012 | | Advisory Director, Goldman Sachs (January 2018-Present); Managing Director, Goldman Sachs (January 2000-December 2017); Director of Institutional Fund Sales, GSAM (April 1998-December 2000); and Senior Vice President and Manager, Dreyfus Institutional Service Corporation (January 1993- April 1998). President and Trustee — Goldman Sachs Trust II; Goldman Sachs Trust; Goldman Sachs Variable Insurance Trust; Goldman Sachs MLP Income Opportunities Fund; Goldman Sachs MLP and Energy Renaissance Fund; Goldman Sachs ETF Trust; Goldman Sachs Private Markets Fund 2018 LLC; Goldman Sachs Private Markets Fund 2018 (A) LLC; and Goldman Sachs Private Markets Fund 2018 (B) LLC. | | 154 | | None |
| | | | | | | | | | |
| * | | Mr. McNamara is considered to be an “Interested Trustee” because he holds positions with Goldman Sachs and owns securities issued by The Goldman Sachs Group, Inc. He holds comparable positions with certain other companies of which Goldman Sachs, GSAM or an affiliate thereof is the investment adviser, administrator and/or distributor. |
| 1 | | Each Trustee may be contacted by writing to the Trustee, c/o Goldman Sachs, 200 West Street, New York, New York, 10282, Attn: Caroline Kraus. Information is provided as of October 31, 2018. |
| 2 | | Subject to such policies as may be adopted by the Board from time-to-time, each Trustee holds office for an indefinite term, until the earliest of: (a) the election of his or her successor; (b) the date the Trustee resigns or is removed by the Board or shareholders, in accordance with the Trust’s Declaration of Trust; or (c) the termination of the Trust. The Board has adopted policies which provide that (a) no Trustee shall hold office for more than 15 years and (b) a Trustee shall retire as of December 31st of the calendar year in which he or she reaches his or her 74th birthday, unless a waiver of such requirement shall have been adopted by a majority of the other Trustees. These policies may be changed by the Trustees without shareholder vote. |
| 3 | | The Goldman Sachs Fund Complex includes certain other companies listed above for each respective Trustee. As of October 31, 2018, Goldman Sachs Trust II consisted of 19 portfolios (17 of which offered shares to the public); Goldman Sachs Trust consisted of 89 portfolios (88 of which offered shares to the public); Goldman Sachs Variable Insurance Trust consisted of 13 portfolios; Goldman Sachs MLP Income Opportunities Fund, Goldman Sachs MLP and Energy Renaissance Fund, Goldman Sachs Private Markets Fund 2018 LLC, Goldman Sachs Private Markets Fund 2018 (A) LLC and Goldman Sachs Private Markets Fund 2018 (B) LLC each consisted of one portfolio; and Goldman Sachs ETF Trust consisted of 28 portfolios (14 of which offered shares to the public). |
| 4 | | This column includes only directorships of companies required to report to the Securities and Exchange Commission under the Securities Exchange Act of 1934 (i.e., “public companies”) or other investment companies registered under the Act. |
Additional information about the Trustees is available in the Fund’s Statement of Additional Information, which can be obtained from Goldman Sachs free of charge by calling this toll-free number (in the United States of America): 1-800-526-7384.
96
GOLDMAN SACHS MULTI-MANAGER ALTERNATIVES FUND
Trustees and Officers (Unaudited) (continued)
Officers of the Trust*
| | | | | | |
| Name, Address and Age1 | | Position(s) Held
with the Trust | | Term of
Office and
Length of
Time Served2 | | Principal Occupation(s) During Past 5 Years |
James A. McNamara 200 West Street New York, NY 10282 Age: 56 | | Trustee and President | | Since 2012 | | Advisory Director, Goldman Sachs (January 2018-Present); Managing Director, Goldman Sachs (January 2000-December 2017); Director of Institutional Fund Sales, GSAM (April 1998-December 2000); and Senior Vice President and Manager, Dreyfus Institutional Service Corporation (January 1993-April 1998). President and Trustee — Goldman Sachs Trust II; Goldman Sachs Trust; Goldman Sachs Variable Insurance Trust; Goldman Sachs MLP Income Opportunities Fund; Goldman Sachs MLP and Energy Renaissance Fund; Goldman Sachs ETF Trust; Goldman Sachs Private Markets Fund 2018 LLC; Goldman Sachs Private Markets Fund 2018 (A) LLC; and Goldman Sachs Private Markets Fund 2018 (B) LLC. |
Caroline L. Kraus 200 West Street New York, NY 10282 Age: 41 | | Secretary | | Since 2012 | | Managing Director, Goldman Sachs (January 2016-Present); Vice President, Goldman Sachs (August 2006-December 2015); Associate General Counsel, Goldman Sachs (2012-Present); Assistant General Counsel, Goldman Sachs (August 2006-December 2011); and Associate, Weil, Gotshal & Manges, LLP (2002-2006). Secretary — Goldman Sachs Trust II; Goldman Sachs Trust (previously Assistant Secretary (2012)); Goldman Sachs Variable Insurance Trust (previously Assistant Secretary (2012)); Goldman Sachs BDC, Inc.; Goldman Sachs Private Middle Market Credit LLC; Goldman Sachs Middle Market Lending Corp.; Goldman Sachs MLP Income Opportunities Fund; Goldman Sachs MLP and Energy Renaissance Fund; Goldman Sachs ETF Trust; Goldman Sachs Private Markets Fund 2018 LLC; Goldman Sachs Private Markets Fund 2018 (A) LLC; and Goldman Sachs Private Markets Fund 2018 (B) LLC. |
Scott M. McHugh 200 West Street New York, NY 10282 Age: 47 | | Treasurer, Senior Vice President and Principal Financial Officer | | Since 2012 (Principal Financial Officer since 2013) | | Managing Director, Goldman Sachs (January 2016-Present); Vice President, Goldman Sachs (February 2007-December 2015); Assistant Treasurer of certain mutual funds administered by DWS Scudder (2005-2007); and Director (2005-2007), Vice President (2000-2005), and Assistant Vice President (1998-2000), Deutsche Asset Management or its predecessor (1998-2007). Treasurer, Senior Vice President and Principal Financial Officer — Goldman Sachs Trust II; Goldman Sachs Trust; Goldman Sachs Variable Insurance Trust; Goldman Sachs MLP Income Opportunities Fund; Goldman Sachs MLP and Energy Renaissance Fund; Goldman Sachs ETF Trust; Goldman Sachs Private Markets Fund 2018 LLC; Goldman Sachs Private Markets Fund 2018 (A) LLC; and Goldman Sachs Private Markets Fund 2018 (B) LLC. |
Joseph F. DiMaria 30 Hudson Street Jersey City, NJ 07302 Age: 50 | | Assistant Treasurer and Principal Accounting Officer | | Since 2017 | | Managing Director, Goldman Sachs (November 2015-Present) and Vice President — Mutual Fund Administration, Columbia Management Investment Advisers, LLC (May 2010-October 2015). Assistant Treasurer and Principal Accounting Officer — Goldman Sachs Trust II; Goldman Sachs Trust; Goldman Sachs Variable Insurance Trust; Goldman Sachs MLP Income Opportunities Fund; Goldman Sachs MLP and Energy Renaissance Fund; Goldman Sachs ETF Trust; Goldman Sachs Private Markets Fund 2018 LLC; Goldman Sachs Private Markets Fund 2018 (A) LLC; and Goldman Sachs Private Markets Fund 2018 (B) LLC. |
| | | | | | |
| * | | Represents a partial list of officers of the Trust. Additional information about all the officers is available in the Fund’s Statement of Additional Information, which can be obtained from Goldman Sachs free of charge by calling this toll-free number (in the United States): 1-800-526-7384. |
| 1 | | Information is provided as of October 31, 2018. |
| 2 | | Officers hold office at the pleasure of the Board of Trustees or until their successors are duly elected and qualified. Each officer holds comparable positions with certain other companies of which Goldman Sachs, GSAM or an affiliate thereof is the investment adviser, administrator and/or distributor. |
97
FUNDS PROFILE
Goldman Sachs Funds
Goldman Sachs is a premier financial services firm, known since 1869 for creating thoughtful and customized investment solutions in complex global markets.
Today, the Investment Management Division of Goldman Sachs serves a diverse set of clients worldwide, including private institutions, public entities and individuals. With approximately $1.34 trillion in assets under supervision as of September 30, 2018, Goldman Sachs Asset Management (“GSAM”) has portfolio management teams located around the world and our investment professionals bring firsthand knowledge of local markets to every investment decision. Assets under supervision includes assets under management and other client assets for which Goldman Sachs does not have full discretion. GSAM leverages the resources of Goldman Sachs & Co. LLC subject to legal, internal and regulatory restrictions.
Money Market
Financial Square FundsSM
| ∎ | | Financial Square Treasury Solutions Fund1 |
| ∎ | | Financial Square Government Fund1 |
| ∎ | | Financial Square Money Market Fund2 |
| ∎ | | Financial Square Prime Obligations Fund2 |
| ∎ | | Financial Square Treasury Instruments Fund1 |
| ∎ | | Financial Square Treasury Obligations Fund1 |
| ∎ | | Financial Square Federal Instruments Fund1 |
Investor FundsSM
| ∎ | | Investor Money Market Fund3 |
| ∎ | | Investor Tax-Exempt Money Market Fund3 |
Fixed Income
Short Duration and Government
| ∎ | | High Quality Floating Rate Fund |
| ∎ | | Short-Term Conservative Income Fund |
| ∎ | | Short Duration Government Fund |
| ∎ | | Short Duration Income Fund |
| ∎ | | Inflation Protected Securities Fund |
Multi-Sector
Municipal and Tax-Free
| ∎ | | High Yield Municipal Fund |
| ∎ | | Dynamic Municipal Income Fund |
| ∎ | | Short Duration Tax-Free Fund |
Single Sector
| ∎ | | Investment Grade Credit Fund |
| ∎ | | High Yield Floating Rate Fund |
| ∎ | | Emerging Markets Debt Fund |
| ∎ | | Local Emerging Markets Debt Fund |
| ∎ | | Total Emerging Markets Income Fund |
Fixed Income Alternatives
| ∎ | | Long Short Credit Strategies Fund |
Fundamental Equity
| ∎ | | Small/Mid Cap Value Fund |
| ∎ | | Small/Mid Cap Growth Fund |
| ∎ | | Concentrated Growth Fund |
| ∎ | | Technology Opportunities Fund |
| ∎ | | Growth Opportunities Fund |
| ∎ | | Rising Dividend Growth Fund |
Tax-Advantaged Equity
| ∎ | | U.S. Tax-Managed Equity Fund |
| ∎ | | International Tax-Managed Equity Fund |
| ∎ | | U.S. Equity Dividend and Premium Fund |
| ∎ | | International Equity Dividend and Premium Fund |
Equity Insights
| ∎ | | Small Cap Equity Insights Fund |
| ∎ | | U.S. Equity Insights Fund |
| ∎ | | Small Cap Growth Insights Fund |
| ∎ | | Large Cap Growth Insights Fund |
| ∎ | | Large Cap Value Insights Fund |
| ∎ | | Small Cap Value Insights Fund |
| ∎ | | International Small Cap Insights Fund |
| ∎ | | International Equity Insights Fund |
| ∎ | | Emerging Markets Equity Insights Fund |
Fundamental Equity International
| ∎ | | International Equity Income Fund4 |
| ∎ | | International Equity ESG Fund5 |
| ∎ | | Emerging Markets Equity Fund |
| ∎ | | ESG Emerging Markets Equity Fund |
Select Satellite
| ∎ | | Real Estate Securities Fund |
| ∎ | | International Real Estate Securities Fund |
| ∎ | | Commodity Strategy Fund |
| ∎ | | Global Real Estate Securities Fund |
| ∎ | | Alternative Premia Fund |
| ∎ | | Absolute Return Tracker Fund |
| ∎ | | Managed Futures Strategy Fund |
| ∎ | | MLP Energy Infrastructure Fund |
| ∎ | | Multi-Manager Alternatives Fund |
| ∎ | | Absolute Return Multi-Asset Fund |
| ∎ | | Global Infrastructure Fund |
Total Portfolio Solutions
| ∎ | | Global Managed Beta Fund |
| ∎ | | Multi-Manager Non-Core Fixed Income Fund |
| ∎ | | Multi-Manager U.S. Dynamic Equity Fund |
| ∎ | | Multi-Manager Global Equity Fund |
| ∎ | | Multi-Manager International Equity Fund |
| ∎ | | Tactical Tilt Overlay Fund |
| ∎ | | Balanced Strategy Portfolio |
| ∎ | | Multi-Manager U.S. Small Cap Equity Fund |
| ∎ | | Multi-Manager Real Assets Strategy Fund |
| ∎ | | Growth and Income Strategy Portfolio |
| ∎ | | Growth Strategy Portfolio |
| ∎ | | Equity Growth Strategy Portfolio |
| ∎ | | Satellite Strategies Portfolio |
| ∎ | | Enhanced Dividend Global Equity Portfolio |
| ∎ | | Tax-Advantaged Global Equity Portfolio |
| ∎ | | Strategic Factor Allocation Fund |
| ∎ | | Target Date 2020 Portfolio |
| ∎ | | Target Date 2025 Portfolio |
| ∎ | | Target Date 2030 Portfolio |
| ∎ | | Target Date 2035 Portfolio |
| ∎ | | Target Date 2040 Portfolio |
| ∎ | | Target Date 2045 Portfolio |
| ∎ | | Target Date 2050 Portfolio |
| ∎ | | Target Date 2055 Portfolio |
| ∎ | | Target Date 2060 Portfolio |
| ∎ | | GQG Partners International Opportunities Fund |
| 1 | | You could lose money by investing in the Fund. Although the Fund seeks to preserve the value of your investment at $1.00 per share, it cannot guarantee it will do so. An investment in the Fund is not a deposit of a bank and is not insured or guaranteed by the Federal Deposit Insurance Corporation or any other government agency. The Fund’s sponsor has no legal obligation to provide financial support to the Fund, and you should not expect that the sponsor will provide financial support to the Fund at any time. |
| 2 | | You could lose money by investing in the Fund. Because the share price of the Fund will fluctuate, when you sell your shares they may be worth more or less than what you originally paid for them. The Fund may impose a fee upon sale of your shares or may temporarily suspend your ability to sell shares if the Fund’s liquidity falls below required minimums because of market conditions or other factors. An investment in the Fund is not a deposit of a bank and is not insured or guaranteed by the Federal Deposit Insurance Corporation or any other government agency. The Fund’s sponsor has no legal obligation to provide financial support to the Fund, and you should not expect that the sponsor will provide financial support to the Fund at any time. |
| 3 | | You could lose money by investing in the Fund. Although the Fund seeks to preserve the value of your investment at $1.00 per share, it cannot guarantee it will do so. The Fund may impose a fee upon sale of your shares or may temporarily suspend your ability to sell shares if the Fund’s liquidity falls below required minimums because of market conditions or other factors. An investment in the Fund is not a deposit of a bank and is not insured or guaranteed by the Federal Deposit Insurance Corporation or any other government agency. The Fund’s sponsor has no legal obligation to provide financial support to the Fund, and you should not expect that the sponsor will provide financial support to the Fund at any time. |
| 4 | | Effective after the close of business on February 27, 2018, the Goldman Sachs Strategic International Equity Fund was renamed the Goldman Sachs International Equity Income Fund. |
| 5 | | Effective after the close of business on February 27, 2018, the Goldman Sachs Focused International Equity Fund was renamed the Goldman Sachs International Equity ESG Fund. |
| | | Financial Square FundsSM and Investor FundsSM are registered service marks of Goldman Sachs & Co. LLC. |
| *This | | list covers open-end funds only. Please visit our website at www.GSAMFUNDS.com to learn about our closed-end funds and exchange-traded funds. |
| | |
TRUSTEES Cheryl K. Beebe, Chair Lawrence Hughes John F. Killian Steven D. Krichmar James A. McNamara | | OFFICERS James A. McNamara, President Scott M. McHugh Treasurer, Senior Vice President and Principal Financial Officer Joseph F. DiMaria, Assistant Treasurer and Principal Accounting Officer Caroline L. Kraus, Secretary |
| |
GOLDMAN SACHS & CO. LLC Distributor and Transfer Agent | | GOLDMAN SACHS ASSET MANAGEMENT, L.P. Investment Adviser |
Visit our web site at www.GSAMFUNDS.com to obtain the most recent month-end returns.
Goldman Sachs Asset Management, L.P. 200 West Street, New York, New York 10282
The reports concerning the Fund included in this shareholder report may contain certain forward-looking statements about the factors that may affect the performance of the Fund in the future. These statements are based on Fund management’s predictions and expectations concerning certain future events and their expected impact on the Fund, such as performance of the economy as a whole and of specific industry sectors, changes in the levels of interest rates, the impact of developing world events, and other factors that may influence the future performance of the Fund. Management believes these forward-looking statements to be reasonable, although they are inherently uncertain and difficult to predict. Actual events may cause adjustments in portfolio management strategies from those currently expected to be employed.
A description of the policies and procedures that the Fund uses to determine how to vote proxies relating to portfolio securities and information regarding how the Fund voted proxies relating to portfolio securities during the most recent 12-month period ended June 30 is available (I) without charge, upon request by calling 1-800-526-7384 (for Retail Shareholders) or 1-800-621-2550 (for Institutional Shareholders); and (II) on the Securities and Exchange Commission (“SEC”) web site at http://www.sec.gov.
The Fund files its complete schedule of portfolio holdings with the SEC for the first and third quarters of each fiscal year on Form N-Qs. The Fund’s Form N-Qs are available on the SEC’s web site at http://www.sec.gov within 60 days after the Fund’s first and third fiscal quarters. Form N-Qs may be obtained upon request and without charge by calling 1-800-526-7384 (for Retail Shareholders) or 1-800-621-2550 (for Institutional Shareholders).
Fund holdings and allocations shown are unaudited, and may not be representative of current or future investments. Fund holdings and allocations may not include the Fund’s entire investment portfolio, which may change at any time. Fund holdings should not be relied on in making investment decisions and should not be construed as research or investment advice regarding particular securities. Current and future holdings are subject to risk.
Economic and market forecasts presented herein reflect our judgment as of the date of this presentation and are subject to change without notice. These forecasts do not take into account the specific investment objectives, restrictions, tax and financial situation or other needs of any specific client. Actual data will vary and may not be reflected here. These forecasts are subject to high levels of uncertainty that may affect actual performance. Accordingly, these forecasts should be viewed as merely representative of a broad range of possible outcomes. These forecasts are estimated, based on assumptions, and are subject to significant revision and may change materially as economic and market conditions change. Goldman Sachs has no obligation to provide updates or changes to these forecasts. Case studies and examples are for illustrative purposes only.
The portfolio risk management process includes an effort to monitor and manage risk, but does not imply low risk. Past correlations are not indicative of future correlations, which may vary.
This material is not authorized for distribution to prospective investors unless preceded or accompanied by a current Prospectus or summary prospectus, if applicable. Investors should consider the Fund’s objective, risks, and charges and expenses, and read the summary prospectus, if available, and/or the Prospectus carefully before investing or sending money. The summary prospectus, if available, and the Prospectus contain this and other information about the Fund and may be obtained from your authorized dealer or from Goldman Sachs & Co. LLC by calling (retail – 1-800-526-7384) (institutional – 1-800-621-2550).
© 2018 Goldman Sachs. All rights reserved. 150950-OTU-888686 MMALTAR-18/4.4K
Goldman Sachs Funds

| | | | |
| | |
| Annual Report | | | | October 31, 2018 |
| | |
| | | | Strategic Multi-Asset Class Funds |
| | | | Multi-Manager Global Equity |
| | | | Multi-Manager Non-Core Fixed Income |
| | | | Multi-Manager Real Assets Strategy |

Goldman Sachs Strategic
Multi-Asset Class Funds
| ∎ | | MULTI-MANAGER GLOBAL EQUITY |
| ∎ | | MULTI-MANAGER NON-CORE FIXED INCOME |
| ∎ | | MULTI-MANAGER REAL ASSETS STRATEGY |
| | | | |
| | | |
| NOT FDIC-INSURED | | May Lose Value | | No Bank Guarantee |
MARKET REVIEW
Goldman Sachs Strategic Multi-Asset Class Funds
Market Review
The capital markets experienced mixed results during the 12 months ended October 31, 2018 (the “Reporting Period”) amidst a resurgence of volatility.
When the Reporting Period began in November 2017, global equity markets marched higher, extending their record highs of the calendar year on the heels of strong corporate earnings growth and positive business sentiment. Bullish market sentiment was further augmented by the passage of a U.S. tax reform bill in December 2017. The U.S. Federal Reserve’s (“Fed”) decision in the same month to raise short-term interest rates by a quarter of a percentage point did little to temper the rally, as the rate hike was largely driven by the Fed’s positive outlook for U.S. economic growth and a strong jobs market. In late January 2018, the U.S. dollar fell to a three-year low versus other developed markets currencies based on concerns about rhetoric from the U.S. Treasury Secretary, who said he favored a weak U.S. dollar, as well as by what investors perceived as the erosion of the U.S. dollar’s yield relative to those of other currencies. During February 2018, volatility returned to the capital markets amid bond market jitters and a significant sell-off in the global equity markets, which was largely influenced by a rise in the 10-year U.S. Treasury yield. The U.S. Administration’s announcement of steel and aluminum tariffs compounded equity investors’ concerns. In March 2018, at Jerome Powell’s first policy meeting as Fed chair, the U.S. central bank raised short-term interest rates by another quarter percentage point. Fed policymakers went on to raise short-term rates by the same amount on two more occasions — in June and September 2018, and the capital markets anticipated a fourth hike before calendar year end. The Fed’s interest rate hikes led to higher U.S. bond yields, which, in addition to strong corporate earnings growth and a relatively stable macroeconomic picture, helped keep global equity markets rather range bound between March and September 2018. Then, in October, global equities sold off significantly, largely erasing earlier gains. The sell-off was triggered by the continued rise in U.S. bond yields and emerging signs of a slowdown in global economic growth, which sparked investors’ rotation out of growth- and momentum-oriented sectors, such as consumer discretionary and information technology, into value-oriented sectors, such as energy, and traditionally defensive sectors, such as utilities. Global equities finished the Reporting Period with modest losses, as positive returns in the U.S. were offset by the negative performance of European and emerging markets stocks. From a sector perspective, gains overall in health care and information technology were offset by declines in financials and industrials. In commodities, energy prices broadly moved higher during the Reporting Period overall on a combination of U.S. sanctions on Russia, trade disputes and continuing tightness in crude oil supplies. However, metals lagged, particularly in the closing months of the Reporting Period, as the outlook for global economic growth became a focal point for investors.
Credit markets generally sold off during the Reporting Period overall, as a more hawkish Fed continued to forecast additional interest rate hikes against the backdrop of strong U.S. economic growth and increasing signs of inflation. (Hawkish tends to suggest higher interest rates; opposite of dovish.) Credit spreads, or yield differentials between corporate bonds and U.S. Treasury securities of comparable maturity, widened slightly, with concerns about U.S.-China trade tensions weighing on investor sentiment for corporate bonds. Floating-rate bank loans were the best performing sector in the U.S. fixed income markets during the Reporting Period, as each increase in LIBOR boosted coupon payments, fueling investor demand. (LIBOR is London interbank offered rates, which are floating interest rates widely used as reference rates in bank, corporate and government lending agreements.) Demand for floating-rate bank loans came at the expense of fixed-rate investment grade bonds and fixed-rate high
1
MARKET REVIEW
yield corporate bonds. That said, high yield corporate bonds recorded a positive return for the Reporting Period overall, as their higher yields generally offset the negative effects of their greater duration and the widening of credit spreads. (Duration measures sensitivity to changes in interest rates.) Outside the U.S., emerging markets credit spreads also widened, as rising U.S. interest rates proved to be a headwind for emerging markets debt. Meanwhile, a strong U.S. dollar dampened the performance of local emerging markets bonds. As a result, U.S. dollar-denominated emerging markets debt and local emerging markets debt were among the worst performing fixed income sectors during the Reporting Period overall.
Public real estate markets were driven primarily by fundamentals during the Reporting Period overall, as investors’ search for yield continued to decrease at the margin. Dispersion among returns across yield quintiles, or market segments, remained modest, with lower yielding, higher quality real estate investment trusts (“REITs”) slightly outperforming. Global real estate markets were up modestly for the Reporting Period as a whole, largely because of a rally in industrial REITs, which benefited from ongoing e-commerce demand and higher barriers to entry for competitive new supply. That said, the performance of the global real estate markets varied during 2018, as a weak first quarter was offset by a rebounding second quarter and a rather muted third quarter. Among market segments, health care REITs struggled on weaker supply/demand dynamics, though more defensive securities performed well during the market volatility in October 2018. Self-storage REITs performed particularly well in the first half of 2018 but had an unusually poor third calendar quarter due to concerns about a potential moderation in 2019 earnings growth. Regionally, North American property stocks experienced a material reversal during the Reporting Period, going from being the worst performing region in the first quarter of 2018 to being the best performing region in the second calendar quarter, with modest additional gains during the third calendar quarter. Japan and North America generally drove real estate markets during the Reporting Period overall, while Asia (ex-Japan) real estate lagged due in large part to a sell-off in Hong Kong listed companies. Real estate stocks broadly continued to price in further Fed interest rate hikes as well as elevated investor concerns surrounding U.S. tariffs and trade policy for more economically sensitive property types. In addition, mergers and acquisition activity picked up during the Reporting Period.
Looking Ahead
At the end of the Reporting Period, investors appeared to be monitoring political developments in the U.S. with a focus on the midterm elections. A key issue was whether the Democrats would be able to win a majority in the House of Representatives, a result that could create political gridlock in the second half of the President’s term in office, in our view. (On November 6, 2018, after the end of the Reporting Period, the Democratic Party won a majority in the House of Representatives.) Additionally, U.S. trade policy remained a concern at the end of the Reporting Period, as investors monitored whether U.S.-China trade tensions would ease. On the economic front, investors continued to watch for any increase in U.S. inflation, as this could drive the Fed’s schedule for interest rate hikes. Finally, signs of slowing economic growth in China and Europe were drawing significant market attention, with investors looking to discern whether the global economic cycle had plateaued, which could potentially drive strong shifts in market performance.
2
PORTFOLIO RESULTS
Goldman Sachs Multi-Manager
Global Equity Fund
Investment Objective
The Fund seeks to provide long-term capital growth.
Portfolio Management Discussion and Analysis
Below, the Goldman Sachs Global Portfolio Solutions (“GPS”) and Alternative Investments & Manager Selection (“AIMS”) Groups discuss the Goldman Sachs Multi-Manager Global Equity Fund’s (the “Fund”) performance and positioning for the 12-month period ended October 31, 2018 (the “Reporting Period”).
| Q | | How did the Fund perform during the Reporting Period? |
| A | | During the Reporting Period, the Fund’s Class R6 Shares generated an average annual total return of -3.43%. This return compares to the -0.18% average annual total return of the Fund’s benchmark, the MSCI All Country World Index Investable Market Index (“MSCI ACWI IMI”) (Net, USD, 50% Non-U.S. Developed Hedged to USD) (the “Index”), during the same time period. |
| Q | | What key factors were responsible for the Fund’s performance during the Reporting Period? |
| A | | The Fund uses a multi-manager approach and generally seeks to achieve its investment objective by dynamically allocating its assets among unaffiliated investment managers (“Underlying Managers”) that employ a mix of international, global and U.S.-focused equity investment strategies. The GPS Group is responsible for the Fund’s asset allocation, wherein it applies a risk-based approach that draws from both fundamental and quantitative disciplines with the intention of dynamically accessing a diversified set of risks and returns in a market cycle aware manner. The AIMS Group is responsible for making recommendations with respect to hiring, terminating or replacing the Fund’s Underlying Managers and applying a multifaceted process for manager due diligence, portfolio construction and risk management. |
| | | During the Reporting Period, the Fund recorded a negative absolute return and underperformed the Index. The Fund’s relative underperformance can be attributed to the performance of the Fund’s Underlying Managers. On the positive side, strategic asset allocation outperformed the Index during the Reporting Period. |
| | | The Fund had capital allocated to 13 Underlying Managers during the Reporting Period — Boston Partners Global Investors, Inc. (“Boston Partners”), Causeway Capital Management LLC (“Causeway”), Fisher Asset Management, LLC (“Fisher”), GW&K Investment Management, LLC (“GW&K”), Legal & General Investment Management America, Inc. (“LGIMA”), Parametric Portfolio Associates LLC (“Parametric”), Principal Global Investors, LLC (“Principal”), Quantitative Management Associates LLC (“QMA”), Scharf Investments, LLC (“Scharf”), Vaughan Nelson Investment Management, L.P. (“Vaughan Nelson”), Vulcan Value Partners, LLC (“Vulcan”), WCM Investment Management (“WCM”) and Wellington Management Company LLP (“Wellington”). |
| | | These 13 Underlying Managers represented five market segments across global equity as part of the Fund’s top-level strategy allocation — U.S. large cap (QMA, Scharf, Vaughan Nelson and Vulcan); Europe, Australasia and Far East (“EAFE”) large cap (Causeway and WCM); U.S. small cap (Boston Partners and GW&K); EAFE small cap (Principal); and emerging markets (Fisher, Parametric and Wellington). LGIMA manages a diversified beta strategy. |
| | | During November 2017, Parametric was redeemed and the capital was reallocated to Wellington, which became a new emerging markets Underlying Manager for the Fund. Scharf was redeemed during June 2018, and the funds were reallocated to the Vanguard S&P 500® ETF, which we had purchased in March to provide the Fund with passive U.S. large cap exposure, and to Vulcan. QMA and Vaughan Nelson were added as new Underlying Managers in August 2018 and were allocated capital in October. |
| | | Thus, nine Underlying Managers had capital allocated to them for the majority of the Reporting Period. Of these nine Underlying Managers, two generated positive absolute returns and seven generated negative absolute returns during the Reporting Period. On a relative basis, one of these Underlying Managers outperformed its benchmark index and |
3
PORTFOLIO RESULTS
| | eight underperformed their respective benchmark indices. Among the other three Underlying Managers, Scharf underperformed its benchmark index between the beginning of the Reporting Period and June 4, 2018, when it was redeemed. QMA and Vaughan Nelson underperformed their respective benchmark indices between October 2, 2018, when they were allocated capital, and the end of the Reporting Period. |
| | | The Fund additionally uses Russell Investments Implementation Services, LLC (“RIIS”) for a currency overlay program given the hedged nature of the Fund’s benchmark index. |
| | | As mentioned earlier, the Fund’s performance relative to the Index was driven mainly by manager selection, which detracted from returns overall during the Reporting Period. The most significant underperformance came from diversified beta manager LGIMA, which lagged the MSCI ACWI Index. In addition, U.S. large cap Underlying Managers Scharf and Vulcan both underperformed the S&P 500® Index. On the positive side, EAFE large cap Underlying Manager WCM outperformed the MSCI ACWI ex-U.S. Index during the Reporting Period. |
| | | Strategic asset allocation, which reflects a longer-term perspective to diversify and invest across global equity markets, outperformed the Index during the Reporting Period. An underweight in EAFE equities contributed positively to results amid weaker European economic activity and concerns around Italy’s budget negotiations. Positioning among style factors also helped performance. (Style factors are drivers of return within an asset class, which can include value, size, momentum, quality, yields and low volatility.) Conversely, an underweight in U.S. large cap equities pressured performance, as 2018 saw significant divergence between the economic growth of the U.S. and that of the rest of the world. Additionally, our long-term and medium-term views to overweight emerging markets equities detracted during the Reporting Period, as emerging markets assets sold off due to U.S. dollar strength, escalating trade tensions and slowing global economic growth. |
| Q | | Which global equity asset classes most significantly affected Fund performance? |
| A | | Diversified beta manager LGIMA, which we measure against the MSCI ACWI Index, underperformed during the Reporting Period because of an underweight position and poor stock selection in the information technology and consumer discretionary sectors. |
| | | In U.S. large cap, which we measure relative to the S&P 500® Index, Underlying Manager Scharf underperformed the benchmark index due to poor stock selection in information technology, consumer discretionary and health care. (Effective in early June 2018, Scharf was no longer an Underlying Manager of the Fund.) As for Underlying Manager Vulcan, it lagged the benchmark index because of a significant overweight in the financials sector and weak stock selection in the information technology sector. |
| | | In U.S. small cap, both Underlying Managers underperformed their respective benchmark indices in a strong absolute return environment for small cap equities. GW&K underperformed the Russell 2000® Index because of poor stock selection in information technology, particularly among software companies, and weak selection in the financials and health care sectors. Boston Partners, the value-oriented Underlying Manager, underperformed the Russell 2000® Value Index due to an overweight position and weak stock selection in the materials sector as well as poor selection among consumer discretionary stocks. |
| | | In EAFE large cap, Underlying Manager WCM outpaced its benchmark index, the MSCI ACWI Ex USA Index, because of effective stock selection in the information technology and consumer discretionary sectors. However, Underlying Manager Causeway underperformed its benchmark index, the MSCI EAFE Index, due to an underweight and weak stock selection in consumer staples along with poor stock selection in the information technology sector. |
| | | In EAFE small cap, Underlying Manager Principal underperformed its benchmark index, the MSCI World ex-U.S. Small Cap Index, as a result of weak stock selection in the industrials, information technology and consumer staples sectors. Regionally, negative performance was due primarily to poor stock selection in Japan. |
| | | In emerging markets, which we measure relative to the MSCI Emerging Markets Index, Underlying Manager Fisher underperformed. Fisher’s underperformance can be attributed to weak stock selection within consumer discretionary and health care. An underweight and negative stock selection in energy also detracted from performance. Underlying Manager Wellington also underperformed its benchmark index, driven by weak stock selection in the health care, consumer discretionary and utilities sectors. |
| Q | | How did the Fund use derivatives and similar instruments during the Reporting Period? |
| A | | RIIS manages a currency overlay allocation that seeks to minimize unintended currency exposures that either reduce |
4
PORTFOLIO RESULTS
| | performance or increase risk of the Fund’s portfolio. RIIS uses currency forwards as part of this strategy. LGIMA uses futures to manage exposure and tracking error to its benchmark index during certain market events, such as dividend accrual periods or small corporate actions. Overall, the use of derivatives by the Underlying Managers did not materially impact the Fund’s performance during the Reporting Period. |
| Q | | Were there any notable changes in the Fund’s allocations during the Reporting Period? |
| A | | As mentioned previously, Parametric was redeemed early in the Reporting Period and the capital was reallocated to Wellington, which became an emerging markets Underlying Manager for the Fund in November 2017. Wellington, a systematic emerging markets investment manager, seeks to exploit behavioral inefficiencies based on value, quality, momentum and special situation factors using quantitative techniques. |
| | | In March 2018, we funded the Vanguard S&P 500® ETF to provide the Fund with passive U.S. large cap exposure as we looked to adjust the lineup of U.S. large cap Underlying Managers. |
| | | As mentioned earlier, Scharf was redeemed during June 2018, and the capital was reallocated to the Vanguard S&P 500® ETF and Vulcan. In August 2018, QMA and Vaughan Nelson were added as Underlying Managers for the Fund, as we sought to create an equity allocation that was more balanced among style factors. QMA pursues a systematic, long-only U.S. equity strategy, with a process focused on providing exposure to three primary factors that QMA believes lead to improved performance: valuation, growth and quality. Vaughan Nelson pursues a dynamic equity strategy, with a bias toward mid- to large-cap equity securities, that seeks to generate returns by investing in companies that are earning above their cost of capital, that have stable to improving returns, and where the valuation is considered by Vaughan Nelson to be attractive. QMA and Vaughan Nelson were allocated assets in October 2018. |
| | | In August 2018, DWS Investment Management Americas, Inc. (“DIMA”) was added as a new Underlying Manager for the Fund but was not allocated capital during the Reporting Period. DIMA pursues an index-based equity strategy that seeks to closely track all or a subset of the securities of the MSCI ACWI Diversified Multi-Factor Index. |
| | | The Fund’s strategic asset allocation remained consistent throughout the Reporting Period. At the beginning and end of the Reporting Period, the Fund’s assets were allocated 38% to U.S. large cap, 26% to EAFE large cap, 10% to U.S. small cap, 7% to EAFE small cap and 17% to emerging markets, with the remainder in cash and cash equivalents. |
| Q | | What is the Fund’s tactical view and strategy for the months ahead? |
| A | | Overall, we intend to continue to position the Fund in alignment with our longer-term strategic views within the equity complex as a complement to additional strategic market exposures. We further intend to continue to monitor allocations and Underlying Manager performance as we seek to generate long-term capital growth. |
5
PORTFOLIO RESULTS
Index Definitions
MSCI Emerging Markets Index captures large-cap and mid-cap representation across 24 emerging markets countries. The index covers approximately 85% of the free float-adjusted market capitalization in each country. Emerging markets countries in the index include Brazil, Chile, China, Colombia, Czech Republic, Egypt, Greece, Hungary, India, Indonesia, South Korea, Malaysia, Mexico, Pakistan, Peru, the Philippines, Poland, Russia, Qatar, South Africa, Taiwan, Thailand, Turkey and United Arab Emirates.
S&P 500® Index is the Standard & Poor’s 500 composite index of 500 stocks, an unmanaged index of common stock prices.
Russell 2000® Index is an unmanaged index of common stock prices that measures the performance of the 2000 smallest companies in the Russell 3000® Index. The Index is constructed to provide a comprehensive and unbiased small-cap barometer and is completely reconstituted annually to ensure larger stocks do not distort the performance and characteristics of the true small-cap opportunity set.
Russell 2000® Value Index measures the performance of small-cap value segment of the U.S. equity universe. It includes those Russell 2000 companies with lower price-to-book ratios and lower forecasted growth values. The Index is completely reconstituted annually to ensure larger stocks do not distort the performance and characteristics of the true small-cap opportunity set and that the represented companies continue to reflect value characteristics.
MSCI ACWI ex USA Index is a market-capitalization weighted index maintained by MSCI and designed to provide a broad measure of stock performance throughout the world, with the exception of U.S.-based companies. It includes both developed and emerging markets. It holds 22 countries classified as developed markets and 24 classified as emerging markets. Developed countries include Australia, Austria, Belgium, Canada, Denmark, Finland, France, Germany, Hong Kong, Ireland, Israel, Italy, Japan, the Netherlands, New Zealand, Norway, Portugal, Singapore, Spain, Sweden, Switzerland, and the U.K. Emerging markets countries include: Brazil, Chile, China, Colombia, Czech Republic, Egypt, Greece, Hungary, India, Indonesia, Korea, Malaysia, Mexico, Pakistan, Peru, the Philippines, Poland, Qatar, Russia, South Africa, Taiwan, Thailand, Turkey and United Arab Emirates.
MSCI EAFE Index is a stock market index that is designed to measure the equity market performance of developed markets in Europe, Australasia and the Far East, excluding the U.S. and Canada.
MSCI World ex-U.S. Small Cap Index is an unmanaged index maintained by MSCI and considered representative of small-cap stocks of global developed markets, excluding those of the U.S.
MSCI ACWI Diversified Multiple-Factor Index is based on MSCI ACWI Index, which includes large and mid cap stocks across 23 developed markets and 24 emerging markets countries. It aims to maximize exposure to four factors — Value, Momentum, Quality and Low Size — while maintaining a risk profile similar to that of the underlying parent index.
It is not possible to invest directly in an unmanaged index.
6
FUND BASICS
Multi-Manager Global Equity Fund
as of October 31, 2018
| | | | | | | | | | |
| | PERFORMANCE REVIEW | |
| | | November 1, 2017–October 31, 2018 | | Fund Total Return
(based on NAV)1 | | | MSCI ACWI IMI
(Net, USD, 50% Non-U.S.
Developed Hedged to USD)2 | |
| | | Class R6 Shares | | | -3.43 | % | | | -0.18 | % |
| | 1�� | | The net asset value (“NAV”) represents the net assets of the class of the Fund (ex-dividend) divided by the total number of shares of the class outstanding. The Fund’s performance reflects the reinvestment of dividends and other distributions. The Fund’s performance does not reflect the deduction of any applicable sales charges. |
| | 2 | | The MSCI ACWI IMI (Net, USD, 50% Non-U.S. Developed Hedged to USD) is a custom index that comprises the MSCI ACWI IMI (which covers 8,870 securities and includes large, mid, small and micro cap size segments for all developed markets countries in the index together with large, mid and small cap size segments for the emerging markets countries) and a currency hedge on 50% of the non-U.S. developed markets exposures back to U.S. dollars. As of September 28, 2018, the 23 developed markets in the MSCI ACWI IMI include Australia, Austria, Belgium, Canada, Denmark, Finland, France, Germany, Hong Kong, Ireland, Israel, Italy, Japan, Netherlands, New Zealand, Norway, Portugal, Singapore, Spain, Sweden, Switzerland, the U.K. and the U.S. The 24 emerging markets include Brazil, Chile, China, Colombia, Czech Republic, Egypt, Greece, Hungary, India, Indonesia, Korea, Malaysia, Mexico, Pakistan, Peru, Philippines, Poland, Russia, Qatar, South Africa, Taiwan, Thailand, Turkey and United Arab Emirates. The Index figures do not reflect any deductions for fees or expenses. It is not possible to invest directly in an index. |
| | | | | | | | | | | | | | | | |
| | STANDARDIZED TOTAL RETURNS3 |
| | | For the period ended 9/30/18 | | | | | One Year | | | Since Inception | | | Inception Date |
| | | Class R6 Shares | | | | | | | 6.53 | % | | | 6.16 | % | | 6/24/2015 |
| | 3 | | The Standardized Total Returns are average annual total returns or cumulative total returns (only if the performance period is one year or less) as of the most recent calendar quarter-end. They assume reinvestment of all distributions at NAV. Because Class R6 Shares do not involve a sales charge, such a charge is not applied to their Standardized Total Returns. |
The returns set forth in the tables above represent past performance. Past performance does not guarantee future results. The Fund’s investment return and principal value will fluctuate so that an investor’s shares, when redeemed, may be worth more or less than their original cost. Current performance may be lower or higher than the performance quoted above. Please visit our web site at www.GSAMFUNDS.com to obtain the most recent month-end returns. Performance reflects applicable fee waivers and/or expense limitations in effect during the periods shown. In their absence, performance would be reduced. Returns do not reflect the deduction of taxes that a shareholder would pay on Fund distributions or the redemption of Fund shares.
| | | | | | | | |
| | EXPENSE RATIOS4 |
| | | | | Net Expense Ratio (Current) | | | Gross Expense Ratio (Before Waivers) |
| | | Class R6 Shares | | | 0.85 | % | | 1.47% |
| | 4 | | The expense ratios of the Fund, both current (net of applicable fee waivers and/or expense limitations) and before waivers (gross of applicable fee waivers and/or expense limitations) are as set forth above according to the most recent publicly available Prospectus for the Fund and may differ from the expense ratios disclosed in the Financial Highlights in this report. Pursuant to a contractual arrangement, the Fund’s waivers and/or expense limitations will remain in place through at least February 28, 2019, and prior to such date the Investment Adviser may not terminate the arrangements without the approval of the Fund’s Board of Trustees. If these arrangements are discontinued in the future, the expense ratios may change without shareholder approval. |
7
FUND BASICS
| | | | | | | | |
| | TOP TEN HOLDINGS AS OF 10/31/185 |
| | | Holding | | % of Net Assets | | | Line of Business |
| | Microsoft Corp. | | | 0.7 | % | | Software |
| | UnitedHealth Group, Inc. | | | 0.6 | | | Health Care Providers & Services |
| | Mastercard, Inc. Class A | | | 0.6 | | | IT Services |
| | Tencent Holdings Ltd. | | | 0.6 | | | Interactive Media & Services |
| | Berkshire Hathaway, Inc. Class B | | | 0.5 | | | Diversified Financial Services |
| | Oracle Corp. | | | 0.5 | | | Software |
| | Apple, Inc. | | | 0.5 | | | Technology Hardware, Storage &
Peripherals |
| | AT&T, Inc. | | | 0.5 | | | Diversified Telecommunication
Services |
| | China Mobile Ltd. | | | 0.5 | | | Wireless Telecommunication
Services |
| | | The Home Depot, Inc. | | | 0.5 | | | Specialty Retail |
| | 5 | | The top 10 holdings may not be representative of the Fund’s future investments. |
| | 6 | | The Fund’s overall top 10 holdings differ from the table above due to the exclusion of the Goldman Sachs Financial Square Government Fund (a short-term investment fund), which represents approximately 3.8% of the Fund’s net assets as of 10/31/18. |
| | 7The | | percentage shown for each investment category reflects the value of investments in that category as a percentage of net assets. Short-term investments represent repurchase agreements. Figures in the graph may not sum to 100% due to the exclusion of other assets and liabilities. Underlying compositions of investment companies held by the Fund are not reflected in the graph above. The graph depicts the Fund’s investments but may not represent the Fund’s market exposure due to the exclusion of certain derivatives, if any, as listed in the Additional Investment Information section of the Schedule of Investments. |
8
GOLDMAN SACHS MULTI-MANAGER GLOBAL EQUITY FUND
Performance Summary
October 31, 2018
The following graph shows the value, as of October 31, 2018, of a $1,000,000 investment made on June 24, 2015 (commencement of operations) in Class R6 Shares at NAV. For comparative purposes, the performance of the Fund’s benchmark, the MSCI ACWI IMI (Net, USD, 50% Non-U.S. Developed Hedged to USD) is shown. This performance data represents past performance and should not be considered indicative of future performance, which will fluctuate with changes in market conditions. These performance fluctuations may cause an investor’s shares, when redeemed, to be worth more or less than their original cost. Performance reflects applicable fee waivers and/or expense limitations in effect during the periods shown and in their absence, performance would be reduced. Returns do not reflect the deduction of taxes that a shareholder would pay on Fund distributions or the redemption of Fund shares. In addition to the Underlying Managers’ decisions regarding issuer/industry investment selection and allocation, other factors may affect Fund performance. These factors include, but are not limited to, Fund operating fees and expenses, portfolio turnover and subscription and redemption cash flows affecting the Fund.
|
| Goldman Sachs Multi-Manager Global Equity Fund’s Lifetime Performance |
Performance of a $1,000,000 Investment, with distributions reinvested, from June 24, 2015 through October 31, 2018.
| | | | |
| Average Annual Total Return through October 31, 2018 | | One Year | | Since Inception |
| | | | |
Class R6 (Commenced June 24, 2015)* | | (3.43)% | | 3.41% |
| | | | |
| * | | Effective January 16, 2018, Institutional Shares were redesignated as Class R6 Shares. |
9
PORTFOLIO RESULTS
Goldman Sachs Multi-Manager Non-Core Fixed Income Fund
Investment Objective
The Fund seeks a total return consisting of income and capital appreciation.
Portfolio Management Discussion and Analysis
Effective October 1, 2018, the Goldman Sachs Multi-Manager Non-Core Fixed Income Fund’s (the “Fund”) performance benchmark changed from the Multi-Manager Non-Core Fixed Income Composite Index to the Multi-Manager Non-Core Fixed Income Composite Dynamic Index. The Investment Adviser believes that the Multi-Manager Non-Core Fixed Income Composite Dynamic Index is a more appropriate index against which to measure performance of the Fund. No modifications in the Fund’s investment objective, strategy and policies were made in connection with this change.
Below, the Goldman Sachs Global Portfolio Solutions (“GPS”) and Alternative Investments & Manager Selection (“AIMS”) Groups discuss the Fund’s performance and positioning for the 12-month period ended October 31, 2018 (the “Reporting Period”).
| Q | | How did the Fund perform during the Reporting Period? |
| A | | During the Reporting Period, the Fund’s Class R6 Shares generated an average annual total return of -2.84%. This return compares to the -1.03% average annual total return of the Fund’s new benchmark, the Multi-Manager Non-Core Fixed Income Composite Dynamic Index (the “Index”), during the same time period. |
| | The Index is comprised of the Bloomberg Barclays Global High Yield Corporate Index (Gross, USD, Unhedged) (the “Bloomberg Barclays Index”), the Credit Suisse Leveraged Loan Index (Gross, USD, Unhedged) (the “Credit Suisse Index”) , the J.P. Morgan Emerging Market Bond Index (“EMBISM”) Global Diversified Index (Gross, USD, Unhedged) (the “J.P. Morgan EMBISM Index”) and the J.P. Morgan Government Bond Index — Emerging Markets (“GBI-EMSM”) Global Diversified Index (Gross, USD, Unhedged) (the “J.P. Morgan GBI-EMSM Index”), which are weighted in accordance with the relative market capitalizations of each constituent index (as determined by the constituent index providers) as of the last business day of the previous calendar year. During the Reporting Period, the Bloomberg Barclays Index, the Credit Suisse Index, the J.P. Morgan EMBISM Index and the J.P. Morgan GBI-EMSM Index returned -0.87%, 4.89%, -4.39% and -6.58%, respectively. |
| | To compare, the Fund’s previous benchmark index, the Multi-Manager Non-Core Fixed Income Composite Index, returned -0.81% during the Reporting Period. The Multi-Manager Non-Core Fixed Income Composite Index is comprised 40% of the Bloomberg Barclays U.S. High-Yield 2% Issuer Capped Bond Index (Gross, USD, Unhedged) (“the Bloomberg Barclays U.S. High Yield Index”), 20% of the Credit Suisse Index, 20% of the J.P. Morgan EMBISM Index and 20% of the J.P. Morgan GBI-EMSM Index). For reference, the Bloomberg Barclays U.S. High Yield Index returned 0.98% during the Reporting Period. |
| Q | | What key factors were responsible for the Fund’s performance during the Reporting Period? |
| A | | The Fund uses a multi-manager approach and generally seeks to achieve its investment objective by dynamically allocating its assets among unaffiliated investment managers (“Underlying Managers”) that employ a non-core fixed income investment strategy. (Non-core fixed income includes non-investment grade securities, bank loans and emerging markets debt). The GPS Group is responsible for the Fund’s asset allocation, wherein it applies a risk-based approach that draws from both fundamental and quantitative disciplines with the intention of dynamically accessing a diversified set of risks and returns in a market cycle aware manner. The AIMS Group is responsible for making recommendations with respect to hiring, terminating or replacing the Fund’s Underlying Managers and applying a multifaceted process for manager due diligence, portfolio construction and risk management. |
| | During the Reporting Period, the Fund recorded a negative absolute return and underperformed the Index. The Fund’s relative underperformance can be attributed to the performance of the Underlying Managers. On the positive |
10
PORTFOLIO RESULTS
| | side, strategic asset allocation outperformed the Index during the Reporting Period. |
| | The Fund had capital allocated to six Underlying Managers during the Reporting Period — Ares Capital Management II LLC (“Ares”), BlueBay Asset Management LLP (“BlueBay”), Brigade Capital Management, LP (“Brigade”), Lazard Asset Management LLC (“Lazard”), Symphony Asset Management LLC (“Symphony”) and TCW Investment Management Company LLC (“TCW”). |
| | These six Underlying Managers represented four sectors across non-core fixed income as part of the Fund’s top-level strategy allocation — high yield (Ares, Blue Bay and Brigade), bank loans (Symphony), external emerging markets debt (Lazard) and local emerging markets debt (BlueBay and TCW). |
| | In May 2018, TCW became a new Underlying Manager of the Fund, as we sought to adjust the lineup of emerging markets debt Underlying Managers, and it was allocated assets in June. During August, BlueBay was eliminated as an Underlying Manager of local emerging markets debt, and in October, it was provided capital to manage an allocation of global high yield debt. Also during October, high yield Underlying Manager Ares was redeemed. |
| | Of the three Underlying Managers managing allocations during the entire Reporting Period, Symphony and Brigade recorded positive absolute returns and Lazard recorded a negative return. TCW posted a negative absolute return between June 14, 2018, when it was allocated capital, and the end of the Reporting Period. BlueBay, as a high yield Underlying Manager, generated a positive absolute return between October 1, 2018, when it was allocated capital, and the end of the Reporting Period. As a local emerging markets debt Underlying Manager, BlueBay recorded a negative absolute return from the start of the Reporting Period until August 8, 2018, when the allocation was redeemed. Ares posted a negative absolute return between the beginning of the Reporting Period until October 16, 2018, when it was redeemed. |
| | As mentioned earlier, the Fund’s underperformance relative to the Index was mainly driven by manager selection. All of the Underlying Managers underperformed their respective benchmark indices, except for Underlying Manager Brigade, which performed in line with the Bloomberg Barclays U.S. High-Yield 2% Issuer Capped Bond Index during the Reporting Period. |
| | Strategic asset allocation, which reflects a longer-term perspective to diversify and invest in non-core fixed income sectors, outperformed the Index during the Reporting Period. An overweight in high yield corporate bonds and an underweight in local emerging markets debt contributed positively. This was offset somewhat by an underweight in bank loans, which detracted from returns, as bank loans outperformed other fixed income asset classes during the Reporting Period. |
| Q | | Which non-core fixed income Underlying Managers most significantly affected Fund performance? |
| A | | Ares, a high yield Underlying Manager, underperformed the Bloomberg Barclays U.S. High-Yield 2% Issuer Capped Bond Index during the Reporting Period. Weak security selection in the media content and telecommunication industries detracted, though this was partially offset by positive security selection in specialty retailing. |
| | Brigade, another high yield Underlying Manager, performed in line with the Bloomberg Barclays U.S. High-Yield 2% Issuer Capped Bond Index. Weak security selection in energy and media was offset by positive security selection in retail and B-rated high yield corporate bonds. |
| | Symphony, the bank loans Underlying Manager, lagged the Credit Suisse Leveraged Loan Index. This underperformance was largely driven by defensive cash positioning, as the broader bank loan market performed strongly during the Reporting Period. Challenged credit selection among retailers also detracted from returns. Conversely, effective security selection in the media/telecommunications industry partially offset these negative results. |
| | BlueBay, as a local emerging markets debt Underlying Manager, underperformed the J.P. Morgan GBI-EMSM Global Diversified Index during the Reporting Period because of overall currency positioning, especially in Argentina, Turkey and South Africa. These results were partly offset by duration positioning in Egyptian local interest rates, which added to performance. (Duration measures sensitivity to changes in interest rates.) |
| | Lazard, the external emerging markets debt Underlying Manager, underperformed the J.P. Morgan EMBISM Diversified Index during the Reporting Period. The underperformance was driven by negative country selection in sovereign hard currencies, especially an overweight in the Argentinian peso. Overweight positions in several relatively higher yielding countries, including Lebanon and Sri Lanka, |
11
PORTFOLIO RESULTS
| | also detracted from relative performance. On the other hand, an overweight in Angola, another higher yielding country, added to returns. |
| | TCW, a local emerging markets debt Underlying Manager, and BlueBay, as a high yield Underlying Manager, did not have a significant impact on Fund performance during the Reporting Period. |
| Q | | How did the Fund use derivatives and similar instruments during the Reporting Period? |
| A | | The Fund’s Underlying Managers used currency forwards, interest rate swaps, credit default swaps and options on foreign currency during the Reporting Period to implement their strategies. BlueBay used futures during the Reporting Period to gain exposure to emerging markets as well as to hedge risks such as U.S. interest rate duration. Overall, the use of derivatives by the Underlying Managers did not materially impact the Fund’s performance during the Reporting Period. |
| Q | | Were there any notable changes in the Fund’s allocations during the Reporting Period? |
| A | | In May 2018, we funded the VanEck Vectors J.P. Morgan EM Local Currency Bond ETF to gain exposure to local emerging markets debt. We eliminated this position in July 2018 after Underlying Manager TCW was provided assets to manage an allocation of local emerging markets debt. |
| | As mentioned previously, TCW was added as a new Underlying Manager of the Fund in May 2018, as we sought to adjust the lineup of Underlying Managers focused on emerging markets debt. TCW was allocated assets during June. |
| | In August 2018, due to personnel turnover, BlueBay was eliminated as a local emerging markets debt Underlying Manager. |
| | In addition, as mentioned earlier, Ares was eliminated as a high yield Underlying Manager in October 2018. The assets were reallocated to BlueBay, as we sought to refocus the Fund’s investments on global, rather than U.S.-only, high yield corporate bonds. |
| | Regarding the Fund’s strategic asset allocation, the Fund’s assets were allocated 12% to local emerging markets debt, 18% to external emerging markets debt, 13% to bank loans and 54% to high yield corporate bonds, with the remainder in cash and cash equivalents, at the beginning of the Reporting Period. In June 2018, our cycle aware view that the U.S. was nearing the latter stages of the economic cycle led to a change in the Fund’s strategic exposures. That month, we used a pullback in the performance of emerging markets assets to trim the Fund’s overweight in high yield corporate bonds and its underweight in local emerging markets debt. However, emerging markets assets subsequently sold off, as currency crises in Argentina and Turkey sparked investor fears of global contagion and U.S.-China trade tensions re-intensified. In September 2018, after market concerns about global contagion subsided, local emerging markets debt rebounded, recovering some of its losses. As the Reporting Period came to an end, we maintained the view that the difference between emerging markets economic growth and developed markets economic growth would ultimately widen, which we believed would lead to outperformance of emerging markets assets versus developed markets assets. In our opinion, a key underlying driver of the sell-off in emerging markets assets during the Reporting Period was disappointing emerging markets economic growth in the context of strong U.S. economic growth. At the conclusion of the Reporting Period, emerging markets economic data, while still uncertain, appeared to have stabilized, in our view. We believed the eventual impact of tariffs would be manageable, and we thought investors had overreacted to the threat of a trade war. In due course, the combination of stabilizing economic data and decreasing trade war worries should lead to positive market surprises, in our opinion. Accordingly, at the end of the Reporting Period, the Fund’s assets were allocated 25% to local emerging markets debt, 18% to external emerging markets debt, 13% to bank loans and 42% to high yield corporate bonds, with the remainder in cash and cash equivalents. |
| Q | | What is the Fund’s tactical view and strategy for the months ahead? |
| A | | Overall, we intend to continue to position the Fund in alignment with our longer-term strategic views on the non-core fixed income market as a complement to additional strategic market exposures. We further intend to continue to monitor allocations and Underlying Manager performance as we seek to generate total return consisting of income and capital appreciation. |
12
PORTFOLIO RESULTS
Index Definitions
Bloomberg Barclays Global High Yield Corporate Index is a multi-currency measure of the global high yield debt market.
Credit Suisse Leveraged Loan Index is designed to mirror the investable universe of the U.S. dollar-denominated leveraged loan market.
J.P. Morgan Emerging Market Bond Index (“EMBISM”) Global Diversified Index tracks total returns for U.S. dollar-denominated debt instruments issued by emerging market sovereign and quasi-sovereign entities.
J.P. Morgan Government Bond Index — Emerging Markets (“GBI-EMSM”) Global Diversified Index is a comprehensive local emerging markets index, consisting of regularly traded, fixed-rate, local currency government bonds.
Bloomberg Barclays U.S. High-Yield 2% Issuer Capped Bond Index is an issuer-constrained version of the U.S. Corporate High-Yield Index that measures the market of U.S. dollar-denominated, non-investment grade, fixed-rate, taxable corporate bonds. The index follows the same rules as the uncapped index but limits the exposure of each issuer to 2% of the total market value and redistributes any excess market value index-wide on a pro-rata basis.
It is not possible to invest directly in an unmanaged index.
13
FUND BASICS
Multi-Manager Non-Core Fixed Income Fund
as of October 31, 2018
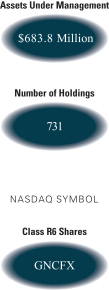
| | | | | | | | | | | | | | | | | | | | | | | | | | | | | | | | | | |
| | PERFORMANCE REVIEW | |
| | | November 1, 2017–
October 31, 2018 | | Fund Total
Return
(based on
NAV)1 | | | Multi-
Manager
Non-Core
Fixed
Income
Composite
Dynamic
Index2 | | | Multi-
Manager
Non-Core
Fixed
Income
Composite
Index3 | | | Bloomberg
Barclays
Global
High Yield
Corporate
Index
(Gross,
USD,
Unhedged) | | | Bloomberg
Barclays
U.S.
High-Yield
2% Issuer
Capped
Bond Index
(Gross, USD,
Unhedged) | | | Credit
Suisse
Leveraged
Loan Index
(Gross,
USD,
Unhedged) | | | J.P.
Morgan
EMBISM
Global
Diversified
Index
(Gross,
USD,
Unhedged) | | | J.P.
Morgan
GBI-EMSM
Global
Diversified
Index
(Gross,
USD,
Unhedged) | |
| | | Class R6 Shares | | | -2.84 | % | | | -1.03 | % | | | -0.81 | % | | | -0.87 | % | | | 0.98 | % | | | 4.89 | % | | | -4.39 | % | | | -6.58 | % |
| | 1 | | The net asset value (“NAV”) represents the net assets of the class of the Fund (ex-dividend) divided by the total number of shares of the class outstanding. The Fund’s performance reflects the reinvestment of dividends and other distributions. The Fund’s performance does not reflect the deduction of any applicable sales charges. |
| | 2 | | The Multi-Manager Non-Core Fixed Income Composite Dynamic Index, which is comprised of the Bloomberg Barclays Global High Yield Corporate Index (Gross, USD, Unhedged), the Credit Suisse Leveraged Loan Index (Gross, USD, Unhedged), the J.P. Morgan Emerging Market Bond Index (EMBISM) Global Diversified Index (Gross, USD, Unhedged) and the J.P. Morgan Government Bond Index — Emerging Markets (GBI-EMSM) Global Diversified Index (Gross, USD, Unhedged). The index figures do not reflect any deductions for fees, expenses or taxes. It is not possible to invest directly in an index. |
| | 3 | | The Multi-Manager Non-Core Fixed Income Composite Index is comprised of the Bloomberg Barclays U.S. High-Yield 2% Issuer Capped Bond Index (Gross, USD, Unhedged) (40%), the Credit Suisse Leveraged Loan Index (Gross, USD, Unhedged) (20%), the J.P. Morgan EMBISM Global Diversified Index (Gross, USD, Unhedged) (20%), and the J.P. Morgan GBI-EMSM Global Diversified Index (Gross, USD, Unhedged) (20%). The index figures do not reflect any deductions for fees, expenses or taxes. It is not possible to invest directly in an index. |
| | | | | | | | | | | | |
| | STANDARDIZED TOTAL RETURNS4 |
| | | For the period ended 9/30/18 | | One Year | | | Since Inception | | | Inception Date |
| | | Class R6 Shares | | | -1.03 | % | | | 2.17 | % | | 3/31/2015 |
| | 4 | | The Standardized Total Returns are average annual total returns or cumulative total returns (only if the performance period is one year or less) as of the most recent calendar quarter-end. They assume reinvestment of all distributions at NAV. Because Class R6 Shares do not involve a sales charge, such a charge is not applied to their Standardized Total Returns. |
The returns set forth in the tables above represent past performance. Past performance does not guarantee future results. The Fund’s investment return and principal value will fluctuate so that an investor’s shares, when redeemed, may be worth more or less than their original cost. Current performance may be lower or higher than the performance quoted above. Please visit our web site at www.GSAMFUNDS.com to obtain the most recent month-end returns. Performance reflects applicable fee waivers and/or expense limitations in effect during the periods shown. In their absence, performance would be reduced. Returns do not reflect the deduction of taxes that a shareholder would pay on Fund distributions or the redemption of Fund shares.
14
FUND BASICS
| | | | | | | | | | |
| | EXPENSE RATIOS5 | |
| | | | | Net Expense Ratio (Current) | | | Gross Expense Ratio (Before Waivers) | |
| | | Class R6 Shares | | | 0.70 | % | | | 1.12 | % |
| | 5 | | The expense ratios of the Fund, both current (net of applicable fee waivers and/or expense limitations) and before waivers (gross of applicable fee waivers and/or expense limitations) are as set forth above according to the most recent publicly available Prospectus for the Fund and may differ from the expense ratios disclosed in the Financial Highlights in this report. Pursuant to a contractual arrangement, the Fund’s waivers and/or expense limitations will remain in place through at least February 28, 2019, and prior to such date the Investment Adviser may not terminate the arrangements without the approval of the Fund’s Board of Trustees. If these arrangements are discontinued in the future, the expense ratios may change without shareholder approval. |
| | | | | | | | |
| | TOP TEN HOLDINGS AS OF 10/31/186 |
| | | Holding | | % of Net Assets | | | Line of Business |
| | Brazil Notas do Tesouro Nacional | | | 1.9 | % | | Foreign Debt Obligations |
| | Hungary Government Bond | | | 1.1 | | | Foreign Debt Obligations |
| | U.S. Treasury Note | | | 1.0 | | | Foreign Debt Obligations |
| | Thailand Government Bond | | | 0.8 | | | Foreign Debt Obligations |
| | Brazil Notas do Tesouro Nacional | | | 0.7 | | | Foreign Debt Obligations |
| | Republic of Colombia | | | 0.6 | | | Foreign Debt Obligations |
| | Bonos de la Tesoreria de la Republica | | | 0.6 | | | Foreign Debt Obligations |
| | Republic of South Africa | | | 0.6 | | | Foreign Debt Obligations |
| | Republic of Indonesia | | | 0.6 | | | Foreign Debt Obligations |
| | | United Mexican States | | | 0.6 | | | Foreign Debt Obligations |
| | 6 | | The Fund’s overall top 10 holdings differ from the table above due to the exclusion of the Goldman Sachs Financial Square Government Fund (a short-term investment fund), which represents approximately 8.2% of the Fund’s net assets as of 10/31/18. The top 10 holdings may not be representative of the Fund’s future investments. |
15
FUND BASICS
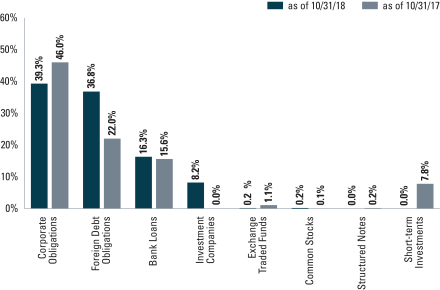
| | 7 | | The percentage shown for each investment category reflects the value of investments in that category as a percentage of net assets. Short-term investments represent repurchase agreements. Figures in the graph may not sum to 100% due to the exclusion of other assets and liabilities. Underlying compositions of exchange traded funds and investment companies held by the Fund are not reflected in the graph above. The graph depicts the Fund’s investments but may not represent the Fund’s market exposure due to the exclusion of certain derivatives, if any, as listed in the Additional Investment Information section of the Schedule of Investments. |
16
GOLDMAN SACHS MULTI-MANAGER NON-CORE FIXED INCOME FUND
Performance Summary
October 31, 2018
The following graph shows the value, as of October 31, 2018, of a $1,000,000 investment made on March 31, 2015 (commencement of operations) in Class R6 Shares at NAV. For comparative purposes, the performance of the Fund’s current benchmark, the Multi-Manager Non-Core Fixed Income Composite Dynamic Index, which is comprised of the Bloomberg Barclays Global High Yield Corporate Index (Gross, USD, Unhedged), the Credit Suisse Leveraged Loan Index (Gross, USD, Unhedged), the J.P. Morgan EMBISM Global Diversified Index (Gross, USD, Unhedged) and the J.P. Morgan GBI-EMSM Global Diversified Index (Gross, USD, Unhedged), is shown. The performance of the Fund’s former benchmark, the Multi-Manager Non-Core Fixed Income Composite Index, which is comprised of the Bloomberg Barclays U.S. High-Yield 2% Issuer Capped Bond Index (Gross, USD, Unhedged) (40%), the Credit Suisse Leveraged Loan Index (Gross, USD, Unhedged) (20%), the J.P. Morgan EMBISM Global Diversified Index (Gross, USD, Unhedged) (20%), and the J.P. Morgan GBI-EMSM Global Diversified Index (Gross, USD, Unhedged) (20%), is also shown. The Investment Adviser believes that the Multi-Manager Non-Core Fixed Income Composite Dynamic Index is a more appropriate benchmark against which to measure the performance of the Fund, as compared to the Multi-Manager Non-Core Fixed Income Composite Index. This performance data represents past performance and should not be considered indicative of future performance, which will fluctuate with changes in market conditions. These performance fluctuations may cause an investor’s shares, when redeemed, to be worth more or less than their original cost. Performance reflects applicable fee waivers and/or expense limitations in effect during the periods shown and in their absence, performance would be reduced. Returns do not reflect the deduction of taxes that a shareholder would pay on Fund distributions or the redemption of Fund shares. In addition to the Underlying Managers’ decisions regarding issuer/industry investment selection and allocation, other factors may affect Fund performance. These factors include, but are not limited to, Fund operating fees and expenses, portfolio turnover and subscription and redemption cash flows affecting the Fund.
|
| Goldman Sachs Non-Core Fixed Income Fund’s Lifetime Performance |
Performance of a $1,000,000 Investment, with distributions reinvested, from March 31, 2015 through October 31, 2018.
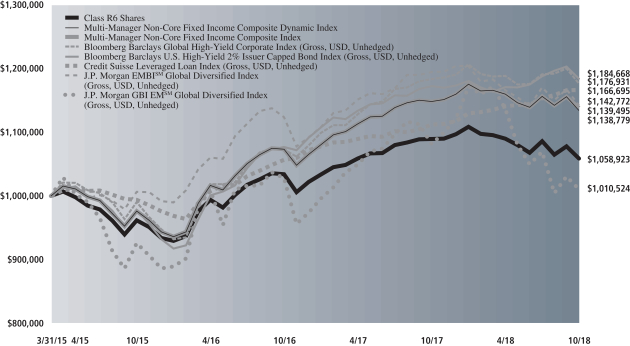
| | | | |
| Average Annual Total Return through October 31, 2018 | | One year | | Since Inception |
| | | | |
Class R6 (Commenced March 31, 2015)* | | (2.84)% | | 1.61% |
| | | | |
| * | | Effective January 16, 2018, Institutional Shares were redesignated as Class R6 Shares. |
17
PORTFOLIO RESULTS
Goldman Sachs Multi-Manager
Real Assets Strategy Fund
Investment Objective
The Fund seeks to provide long-term capital growth through investments related to real assets.
Portfolio Management Discussion and Analysis
Effective September 17, 2018, the Goldman Sachs Multi-Manager Real Assets Strategy Fund’s (the “Fund”) performance benchmark changed from the Multi-Manager Real Assets Strategy Composite Index to the Multi-Manager Real Assets Strategy Composite Dynamic Index. The Investment Adviser believes that the Multi-Manager Real Assets Strategy Composite Dynamic Index is a more appropriate index against which to measure performance of the Fund. No modifications in the Fund’s investment objective, strategy and policies were made in connection with this change.
Below, the Goldman Sachs Global Portfolio Solutions (“GPS”) and Alternative Investments & Manager Selection (“AIMS”) Groups discuss the Fund’s performance and positioning for the 12-month period ended October 31, 2018 (the “Reporting Period”).
| Q | | How did the Fund perform during the Reporting Period? |
| A | | During the Reporting Period, the Fund’s Class R6 Shares generated an average annual total return of -1.88%. This return compares to the -1.22% average annual total return of the Fund’s new benchmark, the Multi-Manager Real Assets Strategy Composite Dynamic Index (the “Index”), during the same time period. |
| | The Index is comprised of the FTSE EPRA/NAREIT Developed Index (Net, USD, Unhedged) (the “FTSE Index”) and the Dow Jones Brookfield Global Infrastructure Index (Net, USD, Unhedged) (the “Dow Jones Brookfield Index”), which are weighted in accordance with the relative market capitalizations of each constituent index (as determined by the constituent index providers) as of the last business day of the previous calendar year. During the Reporting Period, the FTSE Index and the Dow Jones Brookfield Index returned 0.48% and -3.99%, respectively. |
| | To compare, the Fund’s previous benchmark index, the Multi-Manager Real Assets Strategy Composite Index, returned -1.75% during the Reporting Period. The Multi-Manager Real Assets Strategy Composite Index is comprised 50% of the FTSE Index and 50% of the Dow Jones Brookfield Index. |
| Q | | What key factors were responsible for the Fund’s performance during the Reporting Period? |
| A | | The Fund uses a multi-manager approach and generally seeks to achieve its investment objective by dynamically allocating its assets among unaffiliated investment managers (“Underlying Managers”) that invest primarily in real assets. (Real assets are defined broadly by the Fund and include any assets that have physical properties or inflation sensitive characteristics, such as energy, real estate, infrastructure, commodities and inflation linked or floating rate fixed income securities. Inflation is a sustained increase in prices that erodes the purchasing power of money. Assets with inflation sensitive characteristics are assets that benefit from rising real cash flows in times of rising inflation.) The GPS Group is responsible for the Fund’s asset allocation, wherein it applies a risk-based approach that draws from both fundamental and quantitative disciplines with the intention of dynamically accessing a diversified set of risks and returns in a market cycle aware manner. The AIMS Group is responsible for making recommendations with respect to hiring, terminating or replacing the Fund’s Underlying Managers and applying a multifaceted process for manager due diligence, portfolio construction and risk management. |
| | During the Reporting Period, the Fund posted a negative absolute return but outperformed the Index on a relative basis. The Fund’s relative outperformance can be attributed to the Fund’s strategic asset allocation as well as to the performance of the Underlying Managers. |
| | The Fund allocated capital to four Underlying Managers during the Reporting Period — PGIM Real Estate, a business unit of PGIM, Inc. (“PGIM Real Estate”), Presima Inc. (“Presima”), RARE Infrastructure (North America) Pty Limited (“RARE”) and RREEF America L.L.C. (“RREEF”). These four Underlying Managers represented two sectors of real assets as part of the Fund’s top-level strategy allocation — global real estate (PGIM Real Estate and Presima) and global infrastructure (RARE and RREEF). |
| | Of the four Underlying Managers with allocated capital during the Reporting Period, three generated negative |
18
PORTFOLIO RESULTS
| | absolute returns and one generated a positive absolute return. On a relative basis, one of the Underlying Managers outperformed its benchmark index, two underperformed their respective benchmark indices, and one performed in line with its benchmark index during the Reporting Period. |
| | Strategic asset allocation, which reflects a longer-term perspective to diversify and invest across real assets, contributed positively to relative returns during the Reporting Period. An overweight in global real estate securities relative to the Index added to performance, though this was offset somewhat by an overweight in global infrastructure securities, which detracted. Global infrastructure securities faced headwinds in the rising interest rate environment, while global real estate securities were buoyed by positive macroeconomic growth, particularly in the U.S. Real estate market fundamentals also remained strong, with solid rental demand and occupancy levels. Meanwhile, supply was kept in check by tighter real estate lending, increasing construction costs and a tightening construction labor market. |
| | From a manager selection perspective, the Fund’s performance relative to the Index was driven by global infrastructure Underlying Manager RREEF, which outperformed the Dow Jones Brookfield Global Infrastructure Index. RARE, the other global infrastructure Underlying Manager, underperformed the Dow Jones Brookfield Global Infrastructure Index. Global real estate Underlying Manager Presima underperformed the FTSE EPRA/NAREIT Developed Index. PGIM Real Estate, the other global real estate Underlying Manager, performed in line with the FTSE EPRA/NAREIT Developed Index during the Reporting Period. |
| Q | | Which real assets asset classes most significantly affected Fund performance? |
| A | | In global infrastructure, which we measure against the Dow Jones Brookfield Global Infrastructure Index, Underlying Manager RREEF outperformed the benchmark index during the Reporting Period because of an underweight position and strong stock selection in European transport companies. Effective stock selection among midstream energy companies also aided returns. (The midstream component of the energy industry is usually defined as those companies providing products or services that help link the supply side, i.e. energy producers, and the demand side, i.e. energy end-users, for any type of energy commodity. Such midstream businesses can include, but are not limited to, those that process, store, market and transport various energy commodities.) |
| | Global infrastructure Underlying Manager RARE underperformed the Dow Jones Brookfield Global Infrastructure Index during the Reporting Period due to an overweight position and negative stock selection in toll road companies, particularly within Europe. Additionally, an overweight and weak stock selection in port companies hurt its performance. |
| | In global real estate, which we measure against the FTSE EPRA/NAREIT Developed Index, Underlying Manager PGIM Real Estate performed in line with its benchmark index during the Reporting Period. An overweight and strong stock selection in industrial real estate investment trusts (“REITs”) added to performance as did selection among health care REITs. These positive results were offset by an underweight and poor selection in mall REITs, which detracted. |
| | Global real estate Underlying Manager Presima underperformed the FTSE EPRA/NAREIT Developed Index during the Reporting Period. Weak stock selection among U.S. office and health care REITs detracted from returns. Stock selection among Canadian REITs also diminished performance. |
| Q | | How did the Fund use derivatives and similar instruments during the Reporting Period? |
| A | | The Fund used forward foreign currency exchange contracts to facilitate equity transactions settling in foreign currencies. During the Reporting Period, these transactions detracted from the Fund’s results. |
| Q | | Were there any notable changes in the Fund’s allocations during the Reporting Period? |
| A | | In early July 2018, we added passive exposure to global real estate securities through investments in the SPDR® Dow Jones REIT ETF and the SPDR® Dow Jones International Real Estate ETF, as we sought to diversify the Fund’s potential risk amidst a portfolio management change at PGIM Real Estate. Both ETFs were redeemed on July 19, 2018. |
| | The Fund’s strategic asset allocation remained consistent throughout the Reporting Period. At the beginning and end of the Reporting Period, the Fund’s assets were allocated 60% to global real estate and 39% to global infrastructure with the remainder in cash and cash equivalents. |
| Q | | What is the Fund’s tactical view and strategy for the months ahead? |
| A | | Overall, we intend to continue to position the Fund in alignment with our longer-term strategic views on the real assets complex as a complement to additional strategic market exposures. We further intend to continue to monitor allocations and Underlying Manager performance as we seek to generate long-term capital growth through investments related to real assets. |
19
PORTFOLIO RESULTS
Index Definitions:
FTSE EPRA/NAREIT Developed Index is designed to track the performance of listed real estate companies and real estate investment trusts (“REITs”) worldwide. The index incorporates REITs and real estate holding & development companies.
Dow Jones Brookfield Global Infrastructure Index intends to measure the stock performance of pure-play infrastructure companies domiciled globally. The index covers all sectors of the infrastructure market. Components are required to have more than 70% of cash flows derived from infrastructure lines of business.
It is not possible to invest directly in an unmanaged index.
20
FUND BASICS
Multi-Manager Real Assets Strategy Fund
as of October 31, 2018
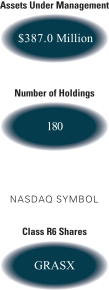
| | | | | | | | | | | | | | | | | | | | | | |
| | PERFORMANCE REVIEW | |
| | | November 1, 2017–
October 31, 2018 | | Fund Total
Return
(based on NAV)1 | | | Multi-Manager
Real Assets
Strategy
Composite
Dynamic
Index2 | | | Multi-Manager
Real Assets
Strategy
Composite
Index3 | | | Dow Jones
Brookfield Global
Infrastructure
Index (Net, USD,
Unhedged) | | | FTSE EPRA/NAREIT
Developed Index
(Net, USD,
Unhedged) | |
| | | Class R6 Shares | | | -1.88 | % | | | -1.22 | % | | | -1.75 | % | | | -3.99 | % | | | 0.48 | % |
| | 1 | | The net asset value (“NAV”) represents the net assets of the class of the Fund (ex-dividend) divided by the total number of shares of the class outstanding. The Fund’s performance reflects the reinvestment of dividends and other distributions. The Fund’s performance does not reflect the deduction of any applicable sales charges. |
| | 2 | | The Multi-Manager Real Assets Strategy Composite Dynamic Index is comprised of the FTSE EPRA/NAREIT Developed Index (Net, USD, Unhedged) and the Dow Jones Brookfield Global Infrastructure Index (Net, USD, Unhedged). The constituent indexes of the Multi-Manager Real Assets Strategy Composite Dynamic Index are weighted in accordance with the relative market capitalizations of each constituent index (as determined by the constituent index providers) as of the last business day of the previous calendar year. The index figures do not reflect any deductions for fees, expenses or taxes. It is not possible to invest directly in an index. |
| | 3 | | The Multi-Manager Real Assets Strategy Composite Index is composed of the FTSE EPRA/NAREIT Developed Index (Net, USD, Unhedged) (50%) and the Dow Jones Brookfield Global Infrastructure Index (Net, USD, Unhedged) (50%). The index figures do not reflect any deductions for fees, expenses or taxes. It is not possible to invest directly in an index. |
| | | | | | | | | | | | |
| | STANDARDIZED TOTAL RETURNS4 |
| | | For the period ended 3/31/18 | | One Year | | | Since Inception | | | Inception Date |
| | | Class R6 Shares | | | 1.84 | % | | | 1.23 | % | | 6/30/2015 |
| | 4 | | The Standardized Total Returns are average annual total returns or cumulative total returns (only if the performance period is one year or less) as of the most recent calendar quarter-end. They assume reinvestment of all distributions at NAV. Because Class R6 Shares do not involve a sales charge, such a charge is not applied to their Standardized Total Returns. |
The returns set forth in the tables above represent past performance. Past performance does not guarantee future results. The Fund’s investment return and principal value will fluctuate so that an investor’s shares, when redeemed, may be worth more or less than their original cost. Current performance may be lower or higher than the performance quoted above. Please visit our web site at www.GSAMFUNDS.com to obtain the most recent month-end returns. Performance reflects applicable fee waivers and/or expense limitations in effect during the periods shown. In their absence, performance would be reduced. Returns do not reflect the deduction of taxes that a shareholder would pay on Fund distributions or the redemption of Fund shares.
21
FUND BASICS
| | | | | | | | | | |
| | EXPENSE RATIOS5 | | | | | | | | |
| | | | | Net Expense Ratio (Current) | | | Gross Expense Ratio (Before Waivers) | |
| | | Class R6 Shares | | | 0.90 | % | | | 1.33 | % |
| | 5 | | The expense ratios of the Fund, both current (net of applicable fee waivers and/or expense limitations) and before waivers (gross of applicable fee waivers and/or expense limitations) are as set forth above according to the most recent publicly available Prospectus for the Fund and may differ from the expense ratios disclosed in the Financial Highlights in this report. Pursuant to a contractual arrangement, the Fund’s waivers and/or expense limitations will remain in place through at least February 28, 2019, and prior to such date the Investment Adviser may not terminate the arrangements without the approval of the Fund’s Board of Trustees. If these arrangements are discontinued in the future, the expense ratios may change without shareholder approval. |
| | | | | | | | |
| | TOP TEN EQUITY HOLDINGS AS OF 10/31/186 |
| | | Holding | | % of Net Assets | | | Line of Business |
| | Prologis, Inc. | | | 3.5 | % | | Equity Real Estate Investment Trusts
(REITs) |
| | AvalonBay Communities, Inc. | | | 2.8 | | | Equity Real Estate Investment Trusts
(REITs) |
| | Crown Castle International Corp. | | | 2.5 | | | Equity Real Estate Investment Trusts
(REITs) |
| | SPDR Dow Jones REIT ETF | | | 2.2 | | | Equity Real Estate Investment Trust
(REITs) |
| | Mitsui Fudosan Co. Ltd. | | | 2.1 | | | Real Estate Management &
Development |
| | Welltower, Inc. | | | 1.9 | | | Equity Real Estate Investment Trusts
(REITs) |
| | SPDR Dow Jones International Real Estate ETF | | | 1.9 | | | Equity Real Estate Investment
Trust(REITs) |
| | Digital Realty Trust, Inc. | | | 1.8 | | | Equity Real Estate Investment Trusts
(REITs) |
| | Vonovia SE | | | 1.8 | | | Real Estate Management &
Development |
| | | The Macerich Co. | | | 1.7 | | | Equity Real Estate Investment Trusts
(REITs) |
| | 6 | | The top 10 holdings may not be representative of the Fund’s future investments. |
22
FUND BASICS
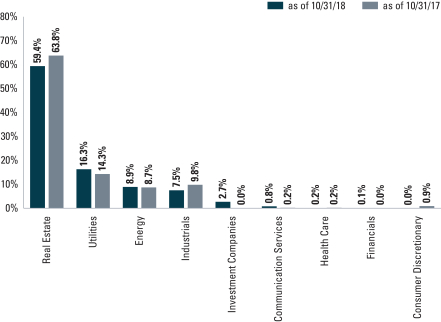
| | 7 | | The Fund is actively managed and, as such, its composition may differ over time. Consequently, the Fund’s overall sector allocations may differ from the percentages contained in the graph above. The graph generally categorizes investments using the Global Industry Classification Standard (“GICS”); however, the sector classifications used by the portfolio management team may differ from GICS. Underlying sector allocations of Exchange Traded Funds held by the Fund are not reflected in the graph above. The percentage shown for each investment category reflects the value of investments in that category as a percentage of market value. Figures in the graph may not sum to 100% due to the exclusion of other assets and liabilities. The graph depicts the Fund’s investments but may not represent the Fund’s market exposure due to the exclusion of certain derivatives, if any, as listed in the Additional Investment Information section of the Schedule of Investments. |
23
GOLDMAN SACHS MULTI-MANAGER REAL ASSETS STRATEGY FUND
Performance Summary
October 31, 2018
The following graph shows the value, as of October 31, 2018, of a $1,000,000 investment made on June 30, 2015 (commencement of operations) in Class R6 Shares at NAV. For comparative purposes, the performance of the Fund’s current benchmark, the Multi-Manager Real Assets Strategy Composite Dynamic Index, which is comprised of the FTSE EPRA/NAREIT Developed Index (Net, USD, Unhedged) and the Dow Jones Brookfield Global Infrastructure Index (Net, USD, Unhedged), is shown. The Fund’s former benchmark, the Multi-Manager Real Assets Strategy Composite Index, which is comprised of the FTSE EPRA/NAREIT Developed Index (Net, USD, Unhedged) (50%) and the Dow Jones Brookfield Global Infrastructure Index (Net, USD, Unhedged) (50%), is also shown. The Investment Adviser believes that the Multi-Manager Real Assets Strategy Composite Dynamic Index is a more appropriate benchmark against which to measure the performance of the Fund, as compared to the Multi-Manager Real Assets Strategy Composite Index. Until December 31, 2015, the S&P GSCI® (Net, USD, Unhedged) comprised 20% of the Fund’s former benchmark, the Multi-Manager Real Assets Strategy Composite Index (with each other index comprising 40% of the Index.). This performance data represents past performance and should not be considered indicative of future performance, which will fluctuate with changes in market conditions. These performance fluctuations may cause an investor’s shares, when redeemed, to be worth more or less than their original cost. Performance reflects applicable fee waivers and/or expense limitations in effect during the periods shown and in their absence, performance would be reduced. Returns do not reflect the deduction of taxes that a shareholder would pay on Fund distributions or the redemption of Fund shares. In addition to the Underlying Managers’ decisions regarding issuer/industry investment selection and allocation, other factors may affect Fund performance. These factors include, but are not limited to, Fund operating fees and expenses, portfolio turnover and subscription and redemption cash flows affecting the Fund.
|
| Goldman Sachs Multi-Manager Real Assets Strategy Fund’s Lifetime Performance |
Performance of a $1,000,000 Investment, with distributions reinvested, from June 30, 2015 through October 31, 2018.
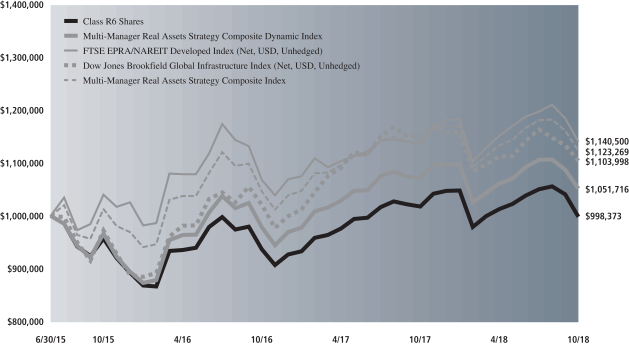
| | | | |
| Average Annual Total Return through October 31, 2018 | | One Year | | Since Inception |
| | | | |
Class R6 (Commenced June 30, 2015)* | | (1.88)% | | (0.16)% |
| | | | |
| * | | Effective January 16, 2018, Institutional Shares were redesignated as Class R6 Shares. |
24
GOLDMAN SACHS MULTI-MANAGER GLOBAL EQUITY FUND
Schedule of Investments
October 31, 2018
| | | | | | | | |
| Shares | | | Description | |
Value | |
| Common Stocks – 94.6% | |
| Australia – 1.1% | |
| | 2,930 | | | AGL Energy Ltd. (Multi-Utilities) | | $ | 37,417 | |
| | 7,254 | | | ALS Ltd. (Professional Services) | | | 42,068 | |
| | 123,318 | | | Alumina Ltd. (Metals & Mining) | | | 223,802 | |
| | 4,828 | | | Amcor Ltd. (Containers & Packaging) | | | 45,558 | |
| | 5,374 | | | Ansell Ltd. (Health Care Equipment & Supplies) | | | 88,597 | |
| | 13,167 | | | Appen Ltd. (IT Services) | | | 99,966 | |
| | 2,156 | | | Aristocrat Leisure Ltd. (Hotels, Restaurants & Leisure) | | | 40,628 | |
| | 21,426 | | | Aurizon Holdings Ltd. (Road & Rail) | | | 63,835 | |
| | 56,210 | | | AusNet Services (Electric Utilities) | | | 68,178 | |
| | 3,970 | | | Bank of Queensland Ltd. (Banks) | | | 27,214 | |
| | 4,521 | | | Bendigo & Adelaide Bank Ltd. (Banks) | | | 32,852 | |
| | 2,342 | | | BHP Billiton Ltd. (Metals & Mining) | | | 54,038 | |
| | 8,275 | | | BlueScope Steel Ltd. (Metals & Mining) | | | 84,824 | |
| | 10,749 | | | Boral Ltd. (Construction Materials) | | | 42,822 | |
| | 7,248 | | | Brambles Ltd. (Commercial Services & Supplies) | | | 54,599 | |
| | 1,938 | | | CIMIC Group Ltd. (Construction & Engineering) | | | 65,068 | |
| | 56,025 | | | Coca-Cola Amatil Ltd. (Beverages) | | | 394,287 | |
| | 253 | | | Cochlear Ltd. (Health Care Equipment & Supplies) | | | 31,881 | |
| | 6,105 | | | Computershare Ltd. (IT Services) | | | 85,731 | |
| | 5,985 | | | Crown Resorts Ltd. (Hotels, Restaurants & Leisure) | | | 53,254 | |
| | 14,297 | | | CSL Ltd. (Biotechnology) | | | 1,908,609 | |
| | 5,665 | | | Dexus (Equity Real Estate Investment Trusts (REITs)) | | | 40,931 | |
| | 53,905 | | | Downer EDI Ltd. (Commercial Services & Supplies) | | | 265,394 | |
| | 425,000 | | | Fairfax Media Ltd. (Media) | | | 193,416 | |
| | 16,247 | | | Fortescue Metals Group Ltd. (Metals & Mining) | | | 46,244 | |
| | 9,455 | | | Goodman Group (Equity Real Estate Investment Trusts (REITs)) | | | 69,489 | |
| | 14,183 | | | Healthscope Ltd. (Health Care Providers & Services) | | | 21,279 | |
| | 6,460 | | | Iluka Resources Ltd. (Metals & Mining) | | | 37,101 | |
| | 61,602 | | | Incitec Pivot Ltd. (Chemicals) | | | 170,691 | |
| | 8,398 | | | Insurance Australia Group Ltd. ADR (Insurance) | | | 40,621 | |
| | 4,551 | | | LendLease Group (Real Estate Management & Development) | | | 56,835 | |
| | 7,481 | | | Link Administration Holdings Ltd. (IT Services) | | | 39,867 | |
| | 1,031 | | | Macquarie Group Ltd. (Capital Markets) | | | 85,977 | |
| | 10,326 | | | Medibank Pvt. Ltd. (Insurance) | | | 20,474 | |
| | 35,542 | | | Mirvac Group (Equity Real Estate Investment Trusts (REITs)) | | | 54,672 | |
| | 1,517 | | | National Australia Bank Ltd. (Banks) | | | 27,169 | |
| | 3,887 | | | Newcrest Mining Ltd. (Metals & Mining) | | | 56,899 | |
| | 50,771 | | | Northern Star Resources Ltd. (Metals & Mining) | | | 317,178 | |
| | 1,683 | | | Orica Ltd. (Chemicals) | | | 20,505 | |
| | |
| Common Stocks – (continued) | |
| Australia – (continued) | |
| | 8,981 | | | Origin Energy Ltd.* (Oil, Gas & Consumable Fuels) | | | 46,542 | |
| | 36,646 | | | Orora Ltd. (Containers & Packaging) | | | 87,334 | |
| | 738 | | | Ramsay Health Care Ltd. (Health Care Providers & Services) | | | 29,457 | |
| | 806 | | | Rio Tinto Ltd. (Metals & Mining) | | | 43,856 | |
| | 23,910 | | | Santos Ltd. (Oil, Gas & Consumable Fuels) | | | 112,223 | |
| | 14,622 | | | Scentre Group (Equity Real Estate Investment Trusts (REITs)) | | | 41,194 | |
| | 3,398 | | | SEEK Ltd. (Professional Services) | | | 43,172 | |
| | 24,799 | | | Seven Network Ltd. (Trading Companies & Distributors) | | | 313,295 | |
| | 1,538 | | | Sonic Healthcare Ltd. (Health Care Providers & Services) | | | 24,615 | |
| | 48,724 | | | South32 Ltd. (Metals & Mining) | | | 125,667 | |
| | 62,032 | | | Spark Infrastructure Group (Electric Utilities) | | | 101,133 | |
| | 14,531 | | | Stockland (Equity Real Estate Investment Trusts (REITs)) | | | 37,172 | |
| | 1,931 | | | Suncorp Group Ltd. (Insurance) | | | 19,200 | |
| | 12,930 | | | Tabcorp Holdings Ltd. (Hotels, Restaurants & Leisure) | | | 42,432 | |
| | 12,396 | | | Telstra Corp. Ltd. (Diversified Telecommunication Services) | | | 27,115 | |
| | 82,004 | | | The GPT Group (Equity Real Estate Investment Trusts (REITs)) | | | 299,907 | |
| | 17,024 | | | The Star Entertainment Grp Ltd. (Hotels, Restaurants & Leisure) | | | 57,408 | |
| | 5,446 | | | Treasury Wine Estates Ltd. (Beverages) | | | 58,618 | |
| | 17,958 | | | Vicinity Centres (Equity Real Estate Investment Trusts (REITs)) | | | 33,687 | |
| | 1,813 | | | Wesfarmers Ltd. (Food & Staples Retailing) | | | 60,042 | |
| | 1,186 | | | Woodside Petroleum Ltd. (Oil, Gas & Consumable Fuels) | | | 29,200 | |
| | 1,681 | | | Woolworths Group Ltd. (Food & Staples Retailing) | | | 33,928 | |
| | | | | | | | |
| | | | | | | 6,777,167 | |
| | |
| Austria – 0.2% | |
| | 1,432 | | | ANDRITZ AG (Machinery) | | | 74,221 | |
| | 4,923 | | | CA Immobilien Anlagen AG (Real Estate Management & Development) | | | 160,255 | |
| | 2,735 | | | Erste Groupe Bank AG* (Banks) | | | 111,335 | |
| | 3,464 | | | OMV AG (Oil, Gas & Consumable Fuels) | | | 192,365 | |
| | 5,686 | | | Raiffeisen Bank International AG (Banks) | | | 154,965 | |
| | 11,584 | | | S&T AG* (Technology Hardware, Storage & Peripherals) | | | 287,892 | |
| | 4,400 | | | voestalpine AG (Metals & Mining) | | | 156,156 | |
| | | | | | | | |
| | | | | | | 1,137,189 | |
| | |
| | |
| The accompanying notes are an integral part of these financial statements. | | 25 |
GOLDMAN SACHS MULTI-MANAGER GLOBAL EQUITY FUND
Schedule of Investments (continued)
October 31, 2018
| | | | | | | | |
| Shares | | | Description | |
Value | |
| Common Stocks – (continued) | |
| Belgium – 0.2% | |
| | 652 | | | Ackermans & van Haaren NV (Diversified Financial Services) | | $ | 102,649 | |
| | 5,158 | | | Ageas (Insurance) | | | 258,081 | |
| | 1,651 | | | Groupe Bruxelles Lambert SA (Diversified Financial Services) | | | 153,548 | |
| | 11,383 | | | Proximus SADP (Diversified Telecommunication Services) | | | 290,014 | |
| | 576 | | | Solvay SA (Chemicals) | | | 65,611 | |
| | 2,503 | | | UCB SA (Pharmaceuticals) | | | 210,202 | |
| | | | | | | | |
| | | | | | | 1,080,105 | |
| | |
| Brazil – 1.3% | |
| | 5,800 | | | Ambev SA (Beverages) | | | 25,466 | |
| | 96,786 | | | Ambev SA ADR (Beverages) | | | 419,083 | |
| | 63,290 | | | B3 SA – Brasil Bolsa Balcao (Capital Markets) | | | 451,355 | |
| | 69,930 | | | Banco Bradesco SA ADR (Banks) | | | 641,258 | |
| | 80,928 | | | Banco do Brasil SA (Banks) | | | 929,645 | |
| | 26,326 | | | Banco Santander Brasil SA (Banks) | | | 298,524 | |
| | 13,364 | | | BR Malls Participacoes SA* (Real Estate Management & Development) | | | 45,606 | |
| | 4,400 | | | Cia de Saneamento Basico do Estado de Sao Paulo (Water Utilities) | | | 33,046 | |
| | 18,000 | | | Cia Siderurgica Nacional SA* (Metals & Mining) | | | 46,288 | |
| | 1,700 | | | Cosan SA (Oil, Gas & Consumable Fuels) | | | 14,732 | |
| | 1,800 | | | CVC Brasil Operadora e Agencia de Viagens SA (Hotels, Restaurants & Leisure) | | | 27,376 | |
| | 8,500 | | | Embraer SA (Aerospace & Defense) | | | 47,805 | |
| | 480 | | | Engie Brasil Energia SA (Independent Power and Renewable Electricity Producers) | | | 5,133 | |
| | 3,417 | | | Equatorial Energia SA (Electric Utilities) | | | 62,427 | |
| | 32,552 | | | Estacio Participacoes SA (Diversified Consumer Services) | | | 202,318 | |
| | 4,700 | | | Hypera SA (Pharmaceuticals) | | | 37,610 | |
| | 4,560 | | | IRB Brasil Resseguros S/A (Insurance) | | | 88,786 | |
| | 49,359 | | | Itau Unibanco Holding SA ADR (Banks) | | | 650,058 | |
| | 46,544 | | | JBS SA (Food Products) | | | 128,195 | |
| | 6,242 | | | Kroton Educacional SA (Diversified Consumer Services) | | | 19,155 | |
| | 18,300 | | | Lojas Renner SA (Multiline Retail) | | | 184,893 | |
| | 2,646 | | | Magazine Luiza SA (Multiline Retail) | | | 120,017 | |
| | 59,657 | | | Petroleo Brasileiro SA ADR (Oil, Gas & Consumable Fuels) | | | 969,426 | |
| | 15,376 | | | Porto Seguro SA (Insurance) | | | 224,680 | |
| | 24,492 | | | Qualicorp Consultoria e Corretora de Seguros SA (Health Care Providers & Services) | | | 94,770 | |
| | 36,100 | | | Raia Drogasil SA (Food & Staples Retailing) | | | 609,379 | |
| | 4,345 | | | SLC Agricola SA (Food Products) | | | 66,643 | |
| | 8,538 | | | Sul America SA (Insurance) | | | 56,897 | |
| | |
| Common Stocks – (continued) | |
| Brazil – (continued) | |
| | 10,910 | | | TIM Participacoes SA (Wireless Telecommunication Services) | | | 33,977 | |
| | 1,800 | | | Ultrapar Participacoes SA (Oil, Gas & Consumable Fuels) | | | 21,403 | |
| | 56,992 | | | Vale SA (Metals & Mining) | | | 868,471 | |
| | 51,747 | | | Vale SA ADR (Metals & Mining) | | | 781,380 | |
| | 9,194 | | | WEG SA (Machinery) | | | 44,469 | |
| | | | | | | | |
| | | | | | | 8,250,271 | |
| | |
| Canada – 3.4% | |
| | 9,400 | | | Air Canada* (Airlines) | | | 178,368 | |
| | 5,500 | | | Allied Properties Real Estate Investment Trust (Equity Real Estate Investment Trusts (REITs)) | | | 176,725 | |
| | 6,055 | | | AltaGas Ltd. (Gas Utilities) | | | 76,122 | |
| | 7,754 | | | ARC Resources Ltd. (Oil, Gas & Consumable Fuels) | | | 72,212 | |
| | 9,400 | | | ATS Automation Tooling Systems, Inc.* (Machinery) | | | 138,238 | |
| | 5,100 | | | Badger Daylighting Ltd. (Construction & Engineering) | | | 103,050 | |
| | 859 | | | Bank of Montreal (Banks) | | | 64,227 | |
| | 4,143 | | | Barrick Gold Corp. (Metals & Mining) | | | 51,896 | |
| | 643 | | | BCE, Inc. (Diversified Telecommunication Services) | | | 24,886 | |
| | 4,022 | | | BlackBerry Ltd.* (Software) | | | 37,121 | |
| | 777 | | | Brookfield Asset Management, Inc. Class A (Capital Markets) | | | 31,707 | |
| | 16,721 | | | CAE, Inc. (Aerospace & Defense) | | | 294,931 | |
| | 142,960 | | | Cameco Corp. | | | 1,532,447 | |
| | 9,340 | | | Canadian Apartment Properties REIT (Equity Real Estate Investment Trusts (REITs)) | | | 332,109 | |
| | 2,690 | | | Canadian Imperial Bank of Commerce (Banks) | | | 232,291 | |
| | 244 | | | Canadian National Railway Co. (Road & Rail) | | | 20,859 | |
| | 1,268 | | | Canadian Natural Resources Ltd. (Oil, Gas & Consumable Fuels) | | | 34,791 | |
| | 13,150 | | | Canadian Pacific Railway Ltd. | | | 2,696,056 | |
| | 1,055 | | | Canadian Tire Corp. Ltd. Class A (Multiline Retail) | | | 118,719 | |
| | 3,204 | | | CGI Group, Inc. Class A* (IT Services) | | | 197,869 | |
| | 6,752 | | | CI Financial Corp. (Capital Markets) | | | 99,861 | |
| | 2,600 | | | Colliers International Group, Inc. (Real Estate Management & Development) | | | 176,566 | |
| | 131 | | | Constellation Software, Inc. (Software) | | | 90,157 | |
| | 6,438 | | | Crescent Point Energy Corp. (Oil, Gas & Consumable Fuels) | | | 30,418 | |
| | 26,000 | | | Detour Gold Corp.* (Metals & Mining) | | | 191,773 | |
| | 23,861 | | | Dollarama, Inc. (Multiline Retail) | | | 659,941 | |
| | 14,500 | | | Dream Global Real Estate Investment Trust (Equity Real Estate Investment Trusts (REITs)) | | | 147,814 | |
| | 4,754 | | | Emera, Inc. (Electric Utilities) | | | 146,688 | |
| | |
| | |
| 26 | | The accompanying notes are an integral part of these financial statements. |
GOLDMAN SACHS MULTI-MANAGER GLOBAL EQUITY FUND
| | | | | | | | |
| Shares | | | Description | |
Value | |
| Common Stocks – (continued) | |
| Canada – (continued) | |
| | 21,569 | | | Empire Co. Ltd. Class A (Food & Staples Retailing) | | $ | 392,402 | |
| | 123,914 | | | Encana Corp. (Oil, Gas & Consumable Fuels) | | | 1,265,072 | |
| | 53,335 | | | Enerplus Corp. | | | 495,953 | |
| | 191 | | | Fairfax Financial Holdings Ltd. (Insurance) | | | 92,812 | |
| | 5,110 | | | Finning International, Inc. (Trading Companies & Distributors) | | | 106,124 | |
| | 7,407 | | | First Quantum Minerals Ltd. (Metals & Mining) | | | 73,932 | |
| | 4,718 | | | Fortis, Inc. (Electric Utilities) | | | 155,899 | |
| | 782 | | | George Weston Ltd. (Food & Staples Retailing) | | | 56,878 | |
| | 31,029 | | | Gildan Activewear, Inc. (Textiles, Apparel & Luxury Goods) | | | 927,488 | |
| | 7,112 | | | Great-West Lifeco, Inc. (Insurance) | | | 163,207 | |
| | 21,512 | | | H&R Real Estate Investment Trust (Equity Real Estate Investment Trusts (REITs)) | | | 325,348 | |
| | 9,231 | | | Husky Energy, Inc. (Oil, Gas & Consumable Fuels) | | | 130,494 | |
| | 10,557 | | | Hydro One Ltd.(a) (Electric Utilities) | | | 153,570 | |
| | 4,449 | | | Imperial Oil Ltd. (Oil, Gas & Consumable Fuels) | | | 138,967 | |
| | 1,941 | | | Intact Financial Corp. (Insurance) | | | 153,354 | |
| | 4,500 | | | Kinaxis, Inc.* (Software) | | | 303,817 | |
| | 29,686 | | | Kinross Gold Corp.* (Metals & Mining) | | | 77,121 | |
| | 16,600 | | | Kirkland Lake Gold Ltd. (Metals & Mining) | | | 325,708 | |
| | 18,195 | | | Lundin Mining Corp. (Metals & Mining) | | | 74,773 | |
| | 1,638 | | | Magna International, Inc. (Auto Components) | | | 80,640 | |
| | 110,498 | | | Manulife Financial Corp. (Insurance) | | | 1,740,000 | |
| | 1,429 | | | Methanex Corp. (Chemicals) | | | 92,538 | |
| | 1,673 | | | Metro, Inc. (Food & Staples Retailing) | | | 52,498 | |
| | 1,543 | | | National Bank of Canada (Banks) | | | 70,044 | |
| | 9,600 | | | NFI Group, Inc. (Machinery) | | | 323,853 | |
| | 6,100 | | | Northview Apartment Real Estate Investment Trust (Equity Real Estate Investment Trusts (REITs)) | | | 117,278 | |
| | 842 | | | Nutrien Ltd. (Chemicals) | | | 44,574 | |
| | 63,200 | | | OceanaGold Corp. (Metals & Mining) | | | 181,950 | |
| | 922 | | | Onex Corp. (Diversified Financial Services) | | | 60,617 | |
| | 9,975 | | | Open Text Corp. (Software) | | | 336,731 | |
| | 17,000 | | | Parex Resources, Inc.* (Oil, Gas & Consumable Fuels) | | | 247,552 | |
| | 6,652 | | | Power Corp. of Canada (Insurance) | | | 137,340 | |
| | 7,107 | | | Power Financial Corp. (Insurance) | | | 153,051 | |
| | 2,666 | | | PrairieSky Royalty Ltd. (Oil, Gas & Consumable Fuels) | | | 40,503 | |
| | 5,663 | | | RioCan Real Estate Investment Trust (Equity Real Estate Investment Trusts (REITs)) | | | 103,241 | |
| | |
| Common Stocks – (continued) | |
| Canada – (continued) | |
| | 18,110 | | | Ritchie Bros. Auctioneers, Inc. (Commercial Services & Supplies) | | | 608,677 | |
| | 2,657 | | | Rogers Communications, Inc. Class B (Wireless Telecommunication Services) | | | 136,821 | |
| | 1,104 | | | Royal Bank of Canada (Banks) | | | 80,440 | |
| | 1,677 | | | Saputo, Inc. (Food Products) | | | 51,095 | |
| | 4,854 | | | Shaw Communications, Inc. Class B (Media) | | | 90,373 | |
| | 10,295 | | | Shopify, Inc. Class A* (IT Services) | | | 1,422,254 | |
| | 2,980 | | | SNC-Lavalin Group, Inc. (Construction & Engineering) | | | 106,392 | |
| | 4,287 | | | Sun Life Financial, Inc. (Insurance) | | | 156,995 | |
| | 3,482 | | | Suncor Energy, Inc. (Oil, Gas & Consumable Fuels) | | | 116,803 | |
| | 34,300 | | | Tamarack Valley Energy Ltd.* (Oil, Gas & Consumable Fuels) | | | 92,495 | |
| | 4,749 | | | Teck Resources Ltd. Class B (Metals & Mining) | | | 98,158 | |
| | 4,905 | | | TELUS Corp. (Diversified Telecommunication Services) | | | 167,965 | |
| | 11,200 | | | TFI International, Inc. (Road & Rail) | | | 372,724 | |
| | 1,396 | | | The Bank of Nova Scotia (Banks) | | | 74,919 | |
| | 12,700 | | | The Stars Group, Inc.* (Hotels, Restaurants & Leisure) | | | 264,139 | |
| | 1,223 | | | The Toronto-Dominion Bank (Banks) | | | 67,846 | |
| | 860 | | | Thomson Reuters Corp. (Capital Markets) | | | 40,026 | |
| | 21,400 | | | TORC Oil & Gas Ltd. (Oil, Gas & Consumable Fuels) | | | 87,944 | |
| | 4,237 | | | Toromont Industries Ltd. (Trading Companies & Distributors) | | | 199,483 | |
| | 3,570 | | | Tourmaline Oil Corp. (Oil, Gas & Consumable Fuels) | | | 52,067 | |
| | 666 | | | Vermilion Energy, Inc. (Oil, Gas & Consumable Fuels) | | | 17,661 | |
| | 1,106 | | | West Fraser Timber Co. Ltd. (Paper & Forest Products) | | | 55,567 | |
| | 39,500 | | | Whitecap Resources, Inc. (Oil, Gas & Consumable Fuels) | | | 193,232 | |
| | 2,110 | | | WSP Global, Inc. (Construction & Engineering) | | | 105,336 | |
| | | | | | | | |
| | | | | | | 21,812,583 | |
| | |
| Chile – 0.1% | |
| | 27,444 | | | Aguas Andinas SA Class A (Water Utilities) | | | 14,274 | |
| | 1,906 | | | Banco de Chile (Banks) | | | 264 | |
| | 8,260 | | | Cencosud SA (Food & Staples Retailing) | | | 17,193 | |
| | 3,152 | | | Cia Cervecerias Unidas SA (Beverages) | | | 39,183 | |
| | 3,239 | | | Cia Cervecerias Unidas SA ADR (Beverages) | | | 81,202 | |
| | 71,245 | | | Empresas CMPC SA (Paper & Forest Products) | | | 243,900 | |
| | 1,887 | | | Empresas COPEC SA (Oil, Gas & Consumable Fuels) | | | 26,390 | |
| | |
| | |
| The accompanying notes are an integral part of these financial statements. | | 27 |
GOLDMAN SACHS MULTI-MANAGER GLOBAL EQUITY FUND
Schedule of Investments (continued)
October 31, 2018
| | | | | | | | |
| Shares | | | Description | |
Value | |
| Common Stocks – (continued) | |
| Chile – (continued) | |
| | 248,995 | | | Enel Americas SA (Electric Utilities) | | $ | 39,241 | |
| | 534,612 | | | Enel Chile SA (Electric Utilities) | | | 46,532 | |
| | 2,450,448 | | | Itau CorpBanca (Banks) | | | 22,709 | |
| | 2,557 | | | Latam Airlines Group SA (Airlines) | | | 23,254 | |
| | 5,762 | | | Parque Arauco SA (Real Estate Management & Development) | | | 13,071 | |
| | 606 | | | SACI Falabella (Multiline Retail) | | | 4,567 | |
| | | | | | | | |
| | | | | | | 571,780 | |
| | |
| China – 3.6% | |
| | 64,000 | | | 3SBio, Inc.(a) (Biotechnology) | | | 93,566 | |
| | 4,105 | | | 51job, Inc. ADR* (Professional Services) | | | 252,088 | |
| | 2,497 | | | 58.Com, Inc. ADR* (Interactive Media & Services) | | | 163,778 | |
| | 244,000 | | | Agricultural Bank of China Ltd. Class H (Banks) | | | 107,404 | |
| | 16,917 | | | Alibaba Group Holding Ltd. ADR* (Internet & Direct Marketing Retail) | | | 2,406,951 | |
| | 166,322 | | | Angang Steel Co. Ltd. Class H (Metals & Mining) | | | 142,231 | |
| | 72,283 | | | Anhui Conch Cement Co. Ltd. Class H (Construction Materials) | | | 374,653 | |
| | 91,879 | | | ANTA Sports Products Ltd. (Textiles, Apparel & Luxury Goods) | | | 379,326 | |
| | 3,536 | | | Autohome, Inc. ADR (Interactive Media & Services) | | | 255,936 | |
| | 13,077 | | | Baidu, Inc. ADR* (Interactive Media & Services) | | | 2,485,415 | |
| | 480,292 | | | Bank of China Ltd. Class H (Banks) | | | 204,624 | |
| | 1,007,263 | | | Bank of Communications Co. Ltd. Class H (Banks) | | | 756,713 | |
| | 202,000 | | | CGN Power Co. Ltd. Class H(a) (Independent Power and Renewable Electricity Producers) | | | 46,456 | |
| | 375,627 | | | China Cinda Asset Management Co. Ltd. (Capital Markets) | | | 92,210 | |
| | 524,823 | | | China CITIC Bank Corp. Ltd. Series H (Banks) | | | 325,303 | |
| | 103,541 | | | China Communications Construction Co. Ltd. Class H (Construction & Engineering) | | | 94,937 | |
| | 52,500 | | | China Conch Venture Holdings Ltd. (Machinery) | | | 147,713 | |
| | 416,066 | | | China Construction Bank Corp. Class H (Banks) | | | 330,168 | |
| | 353,445 | | | China Everbright Bank Co. Ltd. Class H (Banks) | | | 157,761 | |
| | 87,613 | | | China Evergrande Group (Real Estate Management & Development) | | | 210,076 | |
| | 113,000 | | | China Huishan Dairy Holdings Co. Ltd.*(b) (Food Products) | | | — | |
| | 62,000 | | | China Longyuan Power Group Corp. Ltd. Class H (Independent Power and Renewable Electricity Producers) | | | 47,182 | |
| | |
| Common Stocks – (continued) | |
| China – (continued) | |
| | 46,975 | | | China Medical System Holdings Ltd. (Pharmaceuticals) | | | 56,109 | |
| | 29,000 | | | China Mengniu Dairy Co. Ltd.* (Food Products) | | | 85,808 | |
| | 20,500 | | | China Merchants Bank Co. Ltd. Class H (Banks) | | | 79,158 | |
| | 227,947 | | | China Minsheng Banking Corp. Ltd. Class H (Banks) | | | 168,315 | |
| | 100,987 | | | China National Building Material Co. Ltd. Class H (Construction Materials) | | | 72,606 | |
| | 61,265 | | | China Oriental Group Co. Ltd. (Metals & Mining) | | | 48,610 | |
| | 77,800 | | | China Pacific Insurance Group Co. Ltd. Class H (Insurance) | | | 290,459 | |
| | 1,519,995 | | | China Petroleum & Chemical Corp. Class H (Oil, Gas & Consumable Fuels) | | | 1,238,151 | |
| | 111,444 | | | China Railway Group Ltd. Class H (Construction & Engineering) | | | 99,599 | |
| | 45,500 | | | China Shenhua Energy Co. Ltd. Class H (Oil, Gas & Consumable Fuels) | | | 102,941 | |
| | 41,245 | | | China Shineway Pharmaceutical Group Ltd. (Pharmaceuticals) | | | 48,167 | |
| | 768,782 | | | China Telecom Corp. Ltd. Class H (Diversified Telecommunication Services) | | | 363,735 | |
| | 84,595 | | | China Yuhua Education Corp. Ltd.(a) (Diversified Consumer Services) | | | 34,111 | |
| | 14,107 | | | Chlitina Holding Ltd. (Personal Products) | | | 94,308 | |
| | 128,990 | | | Chongqing Rural Commercial Bank Co. Ltd. Class H (Banks) | | | 71,253 | |
| | 124,500 | | | CITIC Securities Co. Ltd. Class H (Capital Markets) | | | 219,805 | |
| | 71,418 | | | Country Garden Holdings Co. Ltd. (Real Estate Management & Development) | | | 76,857 | |
| | 84,000 | | | CRRC Corp. Ltd. Class H (Machinery) | | | 73,775 | |
| | 17,518 | | | Ctrip.com International Ltd. ADR* (Internet & Direct Marketing Retail) | | | 582,999 | |
| | 1,265 | | | Daqo New Energy Corp. ADR* (Semiconductors & Semiconductor Equipment) | | | 27,008 | |
| | 290,714 | | | Dongfeng Motor Group Co. Ltd. Class H (Automobiles) | | | 287,258 | |
| | 12,769 | | | ENN Energy Holdings Ltd. (Gas Utilities) | | | 108,952 | |
| | 180,986 | | | Future Land Development Holdings, Ltd. (Real Estate Management & Development) | | | 104,398 | |
| | 37,984 | | | Geely Automobile Holdings Ltd. (Automobiles) | | | 73,195 | |
| | 94,000 | | | Genscript Biotech Corp.* (Life Sciences Tools & Services) | | | 145,317 | |
| | |
| | |
| 28 | | The accompanying notes are an integral part of these financial statements. |
GOLDMAN SACHS MULTI-MANAGER GLOBAL EQUITY FUND
| | | | | | | | |
| Shares | | | Description | |
Value | |
| Common Stocks – (continued) | |
| China – (continued) | |
| | 64,500 | | | Great Wall Motor Co. Ltd. Class H (Automobiles) | | $ | 38,314 | |
| | 27,755 | | | Guangzhou Automobile Group Co. Ltd. Class H (Automobiles) | | | 28,131 | |
| | 68,271 | | | Guangzhou R&F Properties Co. Ltd. Class H (Real Estate Management & Development) | | | 107,797 | |
| | 56,400 | | | Haitong Securities Co. Ltd. Class H (Capital Markets) | | | 56,822 | |
| | 12,000 | | | Hengan International Group Co. Ltd. (Personal Products) | | | 95,393 | |
| | 72,000 | | | Huaneng Power International, Inc. Class H (Independent Power and Renewable Electricity Producers) | | | 40,133 | |
| | 21,000 | | | Huatai Securities Co. Ltd.(a) (Capital Markets) | | | 33,809 | |
| | 374,734 | | | Industrial and Commercial Bank of China Ltd. Class H (Banks) | | | 254,247 | |
| | 19,466 | | | JD.com, Inc. ADR* (Internet & Direct Marketing Retail) | | | 457,840 | |
| | 18,500 | | | Longfor Group Holdings Ltd. (Real Estate Management & Development) | | | 44,958 | |
| | 238,390 | | | Lonking Holdings Ltd. (Machinery) | | | 53,749 | |
| | 248,927 | | | Luye Pharma Group Ltd.(a) (Pharmaceuticals) | | | 193,222 | |
| | 236,516 | | | Maanshan Iron & Steel Co. Ltd. Class H (Metals & Mining) | | | 127,371 | |
| | 20,000 | | | Minth Group Ltd. (Auto Components) | | | 64,983 | |
| | 5,392 | | | Momo, Inc. ADR* (Interactive Media & Services) | | | 181,009 | |
| | 2,775 | | | NetEase, Inc. ADR (Entertainment) | | | 576,784 | |
| | 817 | | | New Oriental Education & Technology Group, Inc. ADR* (Diversified Consumer Services) | | | 47,803 | |
| | 124,000 | | | PetroChina Co. Ltd. Class H (Oil, Gas & Consumable Fuels) | | | 89,159 | |
| | 36,000 | | | PICC Property and Casualty Co. Ltd. Class H (Insurance) | | | 34,993 | |
| | 111,520 | | | Ping An Insurance Group Co. of China Ltd. Class H (Insurance) | | | 1,054,313 | |
| | 723,267 | | | Postal Savings Bank of China Co. Ltd. Class H(a) (Banks) | | | 432,737 | |
| | 49,500 | | | Semiconductor Manufacturing International Corp.* (Semiconductors & Semiconductor Equipment) | | | 40,889 | |
| | 39,500 | | | Shanghai Fosun Pharmaceutical Group Co. Ltd. Class H (Pharmaceuticals) | | | 118,778 | |
| | 107,120 | | | Sihuan Pharmaceutical Holdings Group Ltd. (Pharmaceuticals) | | | 21,811 | |
| | 43,401 | | | Sinopec Shanghai Petrochemical Co. Ltd. Class H (Chemicals) | | | 19,072 | |
| | 74,096 | | | Sinotruk Hong Kong Ltd. (Machinery) | | | 107,141 | |
| | 64,799 | | | Sunac China Holdings Ltd. (Real Estate Management & Development) | | | 177,353 | |
| | 4,700 | | | Sunny Optical Technology Group Co. Ltd. (Electronic Equipment, Instruments & Components) | | | 41,035 | |
| | |
| Common Stocks – (continued) | |
| China – (continued) | |
| | 2,091 | | | TAL Education Group ADR* (Diversified Consumer Services) | | | 60,597 | |
| | 101,706 | | | Tencent Holdings Ltd. (Interactive Media & Services) | | | 3,484,372 | |
| | 472,236 | | | The People’s Insurance Co. Group of China Ltd. Class H (Insurance) | | | 193,145 | |
| | 91,996 | | | Tianneng Power International Ltd. (Auto Components) | | | 73,828 | |
| | 211,066 | | | Tingyi Cayman Islands Holding Corp. (Food Products) | | | 312,726 | |
| | 4,000 | | | Tsingtao Brewery Co. Ltd. Class H (Beverages) | | | 15,818 | |
| | 204,200 | | | Want Want China Holdings Ltd. (Food Products) | | | 146,089 | |
| | 16,000 | | | Wuxi Biologics Cayman, Inc.*(a) (Life Sciences Tools & Services) | | | 114,479 | |
| | 23,209 | | | YiChang HEC ChangJiang Pharmaceutical Co. Ltd. Class H(a) (Pharmaceuticals) | | | 79,546 | |
| | 56,482 | | | Yihai International Holding Ltd. (Food Products) | | | 124,116 | |
| | 839 | | | YY, Inc. ADR* (Interactive Media & Services) | | | 53,612 | |
| | 8,800 | | | Zhuzhou CRRC Times Electric Co. Ltd. Class H (Electrical Equipment) | | | 47,174 | |
| | | | | | | | |
| | | | | | | 22,872,533 | |
| | |
| Colombia – 0.1% | |
| | 54,396 | | | Ecopetrol SA (Oil, Gas & Consumable Fuels) | | | 63,190 | |
| | 19,002 | | | Ecopetrol SA ADR (Oil, Gas & Consumable Fuels) | | | 441,986 | |
| | 4,530 | | | Grupo Argos SA (Construction Materials) | | | 21,106 | |
| | 1,613 | | | Grupo de Inversiones Suramericana SA (Diversified Financial Services) | | | 15,732 | |
| | 12,424 | | | Interconexion Electrica SA ESP (Electric Utilities) | | | 46,153 | |
| | | | | | | | |
| | | | | | | 588,167 | |
| | |
| Czech Republic – 0.1% | |
| | 17,896 | | | CEZ AS (Electric Utilities) | | | 425,810 | |
| | 1,152 | | | Komercni banka AS (Banks) | | | 43,717 | |
| | | | | | | | |
| | | | | | | 469,527 | |
| | |
| Denmark – 0.5% | |
| | 57 | | | AP Moller – Maersk A/S Class B (Marine) | | | 71,946 | |
| | 785 | | | Carlsberg A/S Class B (Beverages) | | | 86,599 | |
| | 14,834 | �� | | Chr Hansen Holding A/S (Chemicals) | | | 1,497,374 | |
| | 3,558 | | | Danske Bank A/S (Banks) | | | 68,095 | |
| | 1,096 | | | DSV A/S (Road & Rail) | | | 87,926 | |
| | 2,105 | | | GN Store Nord A/S (Health Care Equipment & Supplies) | | | 89,291 | |
| | 3,892 | | | ISS A/S (Commercial Services & Supplies) | | | 127,818 | |
| | |
| | |
| The accompanying notes are an integral part of these financial statements. | | 29 |
GOLDMAN SACHS MULTI-MANAGER GLOBAL EQUITY FUND
Schedule of Investments (continued)
October 31, 2018
| | | | | | | | |
| Shares | | | Description | |
Value | |
| Common Stocks – (continued) | |
| Denmark – (continued) | |
| | 2,104 | | | Jyske Bank A/S (Banks) | | $ | 85,908 | |
| | 5,487 | | | Orsted A/S(a) (Electric Utilities) | | | 347,935 | |
| | 782 | | | Rockwool International A/S Class B (Building Products) | | | 267,177 | |
| | 4,734 | | | Royal Unibrew A/S (Beverages) | | | 335,935 | |
| | | | | | | | |
| | | | | | | 3,066,004 | |
| | |
| Finland – 0.3% | |
| | 2,371 | | | Elisa Oyj (Diversified Telecommunication Services) | | | 94,333 | |
| | 10,417 | | | Fortum Oyj (Electric Utilities) | | | 219,285 | |
| | 2,516 | | | Kesko Oyj Class B (Food & Staples Retailing) | | | 146,941 | |
| | 1,198 | | | Kone Oyj Class B (Machinery) | | | 58,312 | |
| | 28,982 | | | Metsa Board OYJ (Paper & Forest Products) | | | 253,463 | |
| | 2,581 | | | Neste Oyj (Oil, Gas & Consumable Fuels) | | | 211,939 | |
| | 2,623 | | | Nokian Renkaat Oyj (Auto Components) | | | 83,433 | |
| | 1,353 | | | Sampo Oyj Class A (Insurance) | | | 62,221 | |
| | 10,589 | | | Stora Enso Oyj Class R (Paper & Forest Products) | | | 159,102 | |
| | 5,596 | | | UPM-Kymmene Oyj (Paper & Forest Products) | | | 179,904 | |
| | 8,529 | | | Wartsila Oyj Abp (Machinery) | | | 145,126 | |
| | | | | | | | |
| | | | | | | 1,614,059 | |
| | |
| France – 2.1% | |
| | 583 | | | Aeroports de Paris (Transportation Infrastructure) | | | 121,936 | |
| | 3,411 | | | Alstom SA (Machinery) | | | 148,968 | |
| | 1,066 | | | Amundi SA(a) (Capital Markets) | | | 63,327 | |
| | 1,338 | | | Arkema SA (Chemicals) | | | 140,374 | |
| | 1,190 | | | AXA SA (Insurance) | | | 29,782 | |
| | 23,231 | | | BNP Paribas SA (Banks) | | | 1,210,661 | |
| | 22,831 | | | Bollore SA (Air Freight & Logistics) | | | 96,593 | |
| | 3,739 | | | Bouygues SA (Construction & Engineering) | | | 136,214 | |
| | 4,255 | | | Bureau Veritas SA (Professional Services) | | | 95,993 | |
| | 883 | | | Capgemini SE (IT Services) | | | 107,819 | |
| | 5,330 | | | Carrefour SA (Food & Staples Retailing) | | | 103,369 | |
| | 232 | | | Christian Dior SE (Textiles, Apparel & Luxury Goods) | | | 89,753 | |
| | 1,639 | | | Cie de Saint-Gobain (Building Products) | | | 61,744 | |
| | 1,236 | | | Cie Generale des Etablissements Michelin SCA (Auto Components) | | | 126,535 | |
| | 7,322 | | | Cie Plastic Omnium SA (Auto Components) | | | 203,568 | |
| | 6,195 | | | CNP Assurances (Insurance) | | | 138,071 | |
| | 3,505 | | | Covivio (Equity Real Estate Investment Trusts (REITs)) | | | 351,696 | |
| | 4,958 | | | Credit Agricole SA (Banks) | | | 63,499 | |
| | 577 | | | Danone SA (Food Products) | | | 40,859 | |
| | 19 | | | Dassault Aviation SA (Aerospace & Defense) | | | 31,527 | |
| | |
| Common Stocks – (continued) | |
| France – (continued) | |
| | 1,196 | | | Dassault Systemes SE (Software) | | | 149,721 | |
| | 1,654 | | | Eiffage SA (Construction & Engineering) | | | 161,533 | |
| | 11,167 | | | Electricite de France SA (Electric Utilities) | | | 185,015 | |
| | 42,741 | | | Engie SA (Multi-Utilities) | | | 567,908 | |
| | 7,853 | | | EssilorLuxottica SA (Health Care Equipment & Supplies) | | | 1,072,551 | |
| | 1,285 | | | Eurazeo SE (Diversified Financial Services) | | | 93,840 | |
| | 1,239 | | | Faurecia SA (Auto Components) | | | 60,065 | |
| | 1,293 | | | Gecina SA (Equity Real Estate Investment Trusts (REITs)) | | | 189,635 | |
| | 271 | | | Hermes International (Textiles, Apparel & Luxury Goods) | | | 154,714 | |
| | 2,616 | | | ICADE (Equity Real Estate Investment Trusts (REITs)) | | | 221,930 | |
| | 329 | | | Iliad SA (Diversified Telecommunication Services) | | | 38,028 | |
| | 702 | | | Ipsen SA (Pharmaceuticals) | | | 97,335 | |
| | 108 | | | Kering SA (Textiles, Apparel & Luxury Goods) | | | 48,005 | |
| | 3,526 | | | Klepierre SA (Equity Real Estate Investment Trusts (REITs)) | | | 119,487 | |
| | 5,028 | | | Korian SA (Health Care Providers & Services) | | | 198,103 | |
| | 67 | | | L’Oreal SA (Personal Products) | | | 15,096 | |
| | 399 | | | Legrand SA (Electrical Equipment) | | | 26,055 | |
| | 5,326 | | | LVMH Moet Hennessy Louis Vuitton SE (Textiles, Apparel & Luxury Goods) | | | 1,615,937 | |
| | 3,632 | | | Nexity SA (Real Estate Management & Development) | | | 173,685 | |
| | 5,427 | | | Orange SA (Diversified Telecommunication Services) | | | 84,707 | |
| | 2,927 | | | Orpea (Health Care Providers & Services) | | | 360,351 | |
| | 9,186 | | | Pernod Ricard SA (Beverages) | | | 1,400,742 | |
| | 4,057 | | | Peugeot SA (Automobiles) | | | 96,438 | |
| | 2,620 | | | Publicis Groupe SA (Media) | | | 151,664 | |
| | 987 | | | Renault SA (Automobiles) | | | 73,703 | |
| | 5,994 | | | Rexel SA (Trading Companies & Distributors) | | | 76,407 | |
| | 9,285 | | | Rubis SCA (Gas Utilities) | | | 479,051 | |
| | 740 | | | Safran SA (Aerospace & Defense) | | | 95,629 | |
| | 1,679 | | | Sanofi (Pharmaceuticals) | | | 150,036 | |
| | 1,401 | | | Sartorius Stedim Biotech (Life Sciences Tools & Services) | | | 173,599 | |
| | 1,740 | | | Schneider Electric SE (Electrical Equipment) | | | 125,821 | |
| | 3,442 | | | SCOR SE (Insurance) | | | 159,058 | |
| | 2,579 | | | Societe Generale SA (Banks) | | | 94,540 | |
| | 8,391 | | | Suez (Multi-Utilities) | | | 121,034 | |
| | 2,301 | | | Teleperformance (Professional Services) | | | 378,957 | |
| | 458 | | | Thales SA (Aerospace & Defense) | | | 58,495 | |
| | 2,724 | | | TOTAL SA (Oil, Gas & Consumable Fuels) | | | 159,832 | |
| | 1,751 | | | Ubisoft Entertainment SA* (Entertainment) | | | 157,069 | |
| | |
| | |
| 30 | | The accompanying notes are an integral part of these financial statements. |
GOLDMAN SACHS MULTI-MANAGER GLOBAL EQUITY FUND
| | | | | | | | |
| Shares | | | Description | |
Value | |
| Common Stocks – (continued) | |
| France – (continued) | |
| | 388 | | | Unibail-Rodamco-Westfield* (Equity Real Estate Investment Trusts (REITs)) | | $ | 70,438 | |
| | 3,237 | | | Veolia Environnement SA (Multi-Utilities) | | | 64,512 | |
| | 5,092 | | | Vivendi SA (Entertainment) | | | 122,810 | |
| | 353 | | | Wendel SA (Diversified Financial Services) | | | 45,740 | |
| | | | | | | | |
| | | | | | | 13,251,564 | |
| | |
| Germany – 1.8% | |
| | 7,580 | | | Aareal Bank AG (Thrifts & Mortgage Finance) | | | 281,986 | |
| | 6,852 | | | adidas AG (Textiles, Apparel & Luxury Goods) | | | 1,611,343 | |
| | 383 | | | Allianz SE (Insurance) | | | 79,787 | |
| | 4,323 | | | Aurubis AG (Metals & Mining) | | | 262,404 | |
| | 1,674 | | | Axel Springer SE (Media) | | | 111,165 | |
| | 25,301 | | | BASF SE (Chemicals) | | | 1,941,561 | |
| | 261 | | | Bayer AG (Pharmaceuticals) | | | 20,006 | |
| | 606 | | | Bayerische Motoren Werke AG (Automobiles) | | | 52,183 | |
| | 2,554 | | | Bechtle AG (IT Services) | | | 226,814 | |
| | 454 | | | Beiersdorf AG (Personal Products) | | | 46,942 | |
| | 927 | | | Brenntag AG (Trading Companies & Distributors) | | | 48,412 | |
| | 4,122 | | | Carl Zeiss Meditec AG (Health Care Equipment & Supplies) | | | 337,648 | |
| | 14,906 | | | Commerzbank AG* (Banks) | | | 140,354 | |
| | 385 | | | Continental AG (Auto Components) | | | 63,443 | |
| | 1,857 | | | Covestro AG(a) (Chemicals) | | | 119,756 | |
| | 1,159 | | | Daimler AG (Automobiles) | | | 68,655 | |
| | 8,750 | | | Deutsche Lufthansa AG (Airlines) | | | 175,640 | |
| | 31,364 | | | Deutsche Post AG (Air Freight & Logistics) | | | 990,327 | |
| | 1,709 | | | Deutsche Telekom AG (Diversified Telecommunication Services) | | | 28,031 | |
| | 5,190 | | | Deutsche Wohnen SE (Real Estate Management & Development) | | | 237,391 | |
| | 25,380 | | | Deutz AG (Machinery) | | | 188,770 | |
| | 2,914 | | | Evonik Industries AG (Chemicals) | | | 90,147 | |
| | 1,377 | | | Fraport AG Frankfurt Airport Services Worldwide (Transportation Infrastructure) | | | 106,340 | |
| | 1,349 | | | GEA Group AG (Machinery) | | | 40,991 | |
| | 1,266 | | | Hannover Rueck SE (Insurance) | | | 170,253 | |
| | 1,511 | | | HeidelbergCement AG (Construction Materials) | | | 102,543 | |
| | 1,636 | | | HUGO BOSS AG (Textiles, Apparel & Luxury Goods) | | | 116,914 | |
| | 1,784 | | | Infineon Technologies AG (Semiconductors & Semiconductor Equipment) | | | 35,746 | |
| | 1,192 | | | Innogy SE* (Multi-Utilities) | | | 49,711 | |
| | 2,443 | | | K&S AG (Chemicals) | | | 45,494 | |
| | 4,710 | | | LEG Immobilien AG (Real Estate Management & Development) | | | 514,845 | |
| | |
| Common Stocks – (continued) | |
| Germany – (continued) | |
| | 972 | | | MAN SE (Machinery) | | | 101,255 | |
| | 601 | | | Merck KGaA (Pharmaceuticals) | | | 64,309 | |
| | 382 | | | Muenchener Rueckversicherungs-Gesellschaft AG in Muenchen (Insurance) | | | 82,048 | |
| | 2,271 | | | OSRAM Licht AG (Electrical Equipment) | | | 92,013 | |
| | 610 | | | Puma SE (Textiles, Apparel & Luxury Goods) | | | 313,674 | |
| | 4,847 | | | Rheinmetall AG (Industrial Conglomerates) | | | 419,477 | |
| | 9,071 | | | RWE AG (Multi-Utilities) | | | 176,469 | |
| | 7,291 | | | SAP SE (Software) | | | 780,673 | |
| | 5,271 | | | Scout24 AG(a) (Interactive Media & Services) | | | 218,448 | |
| | 1,824 | | | Siemens Healthineers AG*(a) (Health Care Equipment & Supplies) | | | 75,489 | |
| | 1,505 | | | Siltronic AG (Semiconductors & Semiconductor Equipment) | | | 137,835 | |
| | 1,962 | | | Sixt SE (Road & Rail) | | | 199,447 | |
| | 3,629 | | | Stroeer SE & Co. KGaA (Media) | | | 189,691 | |
| | 449 | | | Symrise AG (Chemicals) | | | 37,611 | |
| | 12,162 | | | TUI AG (Hotels, Restaurants & Leisure) | | | 201,783 | |
| | 1,989 | | | United Internet AG (Diversified Telecommunication Services) | | | 82,307 | |
| | 4,358 | | | Vonovia SE (Real Estate Management & Development) | | | 199,145 | |
| | | | | | | | |
| | | | | | | 11,677,276 | |
| | |
| Greece – 0.0% | |
| | 7,236 | | | Alpha Bank AE* (Banks) | | | 10,920 | |
| | 21,672 | | | Eurobank Ergasias SA* (Banks) | | | 14,609 | |
| | 1,337 | | | Hellenic Telecommunications Organization SA (Diversified Telecommunication Services) | | | 14,900 | |
| | 1,804 | | | JUMBO SA (Specialty Retail) | | | 26,267 | |
| | 1,472 | | | Motor Oil Hellas Corinth Refineries SA (Oil, Gas & Consumable Fuels) | | | 34,846 | |
| | 6,963 | | | National Bank of Greece SA* (Banks) | | | 12,051 | |
| | 2,638 | | | OPAP SA (Hotels, Restaurants & Leisure) | | | 24,784 | |
| | 1,292 | | | Titan Cement Co. SA (Construction Materials) | | | 28,448 | |
| | | | | | | | |
| | | | | | | 166,825 | |
| | |
| Hong Kong – 2.1% | |
| | 178,608 | | | AIA Group Ltd. (Insurance) | | | 1,358,679 | |
| | 14,500 | | | Beijing Enterprises Holdings Ltd. (Gas Utilities) | | | 78,618 | |
| | 32,000 | | | BOC Hong Kong Holdings Ltd. (Banks) | | | 119,799 | |
| | 34,400 | | | China Gas Holdings Ltd. (Gas Utilities) | | | 109,199 | |
| | 114,000 | | | China Jinmao Holdings Group Ltd. (Real Estate Management & Development) | | | 48,034 | |
| | 189,800 | | | China Merchants Port Holdings Co. Ltd. (Transportation Infrastructure) | | | 323,292 | |
| | |
| | |
| The accompanying notes are an integral part of these financial statements. | | 31 |
GOLDMAN SACHS MULTI-MANAGER GLOBAL EQUITY FUND
Schedule of Investments (continued)
October 31, 2018
| | | | | | | | |
| Shares | | | Description | |
Value | |
| Common Stocks – (continued) | |
| Hong Kong – (continued) | |
| | 325,663 | | | China Mobile Ltd. (Wireless Telecommunication Services) | | $ | 3,050,771 | |
| | 73,667 | | | China Overseas Land & Investment Ltd. (Real Estate Management & Development) | | | 231,597 | |
| | 30,000 | | | China Resources Beer Holdings Co. Ltd. (Beverages) | | | 104,539 | |
| | 146,143 | | | China Resources Cement Holdings Ltd. (Construction Materials) | | | 129,728 | |
| | 156,852 | | | China Resources Gas Group Ltd. (Gas Utilities) | | | 601,206 | |
| | 162,574 | | | China Resources Land Ltd. (Real Estate Management & Development) | | | 552,947 | |
| | 39,000 | | | China Resources Pharmaceutical Group Ltd.(a) (Pharmaceuticals) | | | 57,299 | |
| | 58,000 | | | China Resources Power Holdings Co. Ltd. (Independent Power and Renewable Electricity Producers) | | | 102,048 | |
| | 404,892 | | | China South City Holdings Ltd. (Real Estate Management & Development) | | | 59,511 | |
| | 37,806 | | | China Taiping Insurance Holdings Co. Ltd. (Insurance) | | | 126,990 | |
| | 96,000 | | | China Unicom Hong Kong Ltd. (Diversified Telecommunication Services) | | | 100,411 | |
| | 304,388 | | | CITIC Ltd. (Industrial Conglomerates) | | | 457,346 | |
| | 9,000 | | | CK Asset Holdings Ltd. (Real Estate Management & Development) | | | 58,570 | |
| | 6,000 | | | CK Hutchison Holdings Ltd. (Industrial Conglomerates) | | | 60,433 | |
| | 10,500 | | | CLP Holdings Ltd. (Electric Utilities) | | | 117,657 | |
| | 838,869 | | | CNOOC Ltd. (Oil, Gas & Consumable Fuels) | | | 1,428,576 | |
| | 91,119 | | | CSPC Pharmaceutical Group Ltd. (Pharmaceuticals) | | | 194,157 | |
| | 6,900 | | | Dairy Farm International Holdings Ltd. (Food & Staples Retailing) | | | 62,336 | |
| | 106,187 | | | Far East Horizon Ltd. (Diversified Financial Services) | | | 102,911 | |
| | 41,500 | | | Fosun International Ltd. (Industrial Conglomerates) | | | 60,886 | |
| | 8,000 | | | Galaxy Entertainment Group Ltd. (Hotels, Restaurants & Leisure) | | | 43,433 | |
| | 12,000 | | | Guangdong Investment Ltd. (Water Utilities) | | | 21,483 | |
| | 17,000 | | | Haier Electronics Group Co. Ltd.* (Household Durables) | | | 35,700 | |
| | 13,000 | | | Hang Lung Group Ltd. (Real Estate Management & Development) | | | 32,005 | |
| | 19,000 | | | Hang Lung Properties Ltd. (Real Estate Management & Development) | | | 34,441 | |
| | 2,700 | | | Hang Seng Bank Ltd. (Banks) | | | 63,308 | |
| | 11,510 | | | Henderson Land Development Co. Ltd. (Real Estate Management & Development) | | | 53,684 | |
| | 71,530 | | | Hong Kong & China Gas Co. Ltd. (Gas Utilities) | | | 136,632 | |
| | |
| Common Stocks – (continued) | |
| Hong Kong – (continued) | |
| | 25,689 | | | Hua Hong Semiconductor Ltd.(a) (Semiconductors & Semiconductor Equipment) | | | 44,840 | |
| | 74,000 | | | Hysan Development Co. Ltd. (Real Estate Management & Development) | | | 347,037 | |
| | 800 | | | Jardine Matheson Holdings Ltd. (Industrial Conglomerates) | | | 46,195 | |
| | 1,100 | | | Jardine Strategic Holdings Ltd. (Industrial Conglomerates) | | | 36,952 | |
| | 44,577 | | | Kingboard Holdings Ltd. (Electronic Equipment, Instruments & Components) | | | 119,744 | |
| | 175,624 | | | Kingboard Laminates Holdings Ltd. (Electronic Equipment, Instruments & Components) | | | 134,825 | |
| | 96,000 | | | Kunlun Energy Co. Ltd. (Oil, Gas & Consumable Fuels) | | | 109,227 | |
| | 226,000 | | | Lenovo Group Ltd. (Technology Hardware, Storage & Peripherals) | | | 144,141 | |
| | 206,000 | | | Li & Fung Ltd. (Textiles, Apparel & Luxury Goods) | | | 40,883 | |
| | 13,500 | | | Link REIT (Equity Real Estate Investment Trusts (REITs)) | | | 119,976 | |
| | 89,000 | | | Melco International Development Ltd. (Hotels, Restaurants & Leisure) | | | 152,749 | |
| | 7,724 | | | MTR Corp. Ltd. (Road & Rail) | | | 37,479 | |
| | 35,071 | | | New World Development Co. Ltd. (Real Estate Management & Development) | | | 44,616 | |
| | 57,945 | | | NWS Holdings Ltd. (Industrial Conglomerates) | | | 115,010 | |
| | 113,000 | | | PCCW Ltd. (Diversified Telecommunication Services) | | | 62,045 | |
| | 15,500 | | | Power Assets Holdings Ltd. (Electric Utilities) | | | 103,508 | |
| | 86,000 | | | Sands China Ltd. (Hotels, Restaurants & Leisure) | | | 340,087 | |
| | 24,785 | | | Shanghai Industrial Holdings Ltd. (Industrial Conglomerates) | | | 52,197 | |
| | 33,518 | | | Shimao Property Holdings Ltd. (Real Estate Management & Development) | | | 66,045 | |
| | 310,658 | | | Sino Biopharmaceutical Ltd. (Pharmaceuticals) | | | 280,397 | |
| | 20,651 | | | Sino Land Co. Ltd. (Real Estate Management & Development) | | | 32,443 | |
| | 154,148 | | | Skyworth Digital Holdings Ltd. (Household Durables) | | | 35,697 | |
| | 31,026 | | | SSY Group Ltd. (Pharmaceuticals) | | | 26,213 | |
| | 3,000 | | | Sun Hung Kai Properties Ltd. (Real Estate Management & Development) | | | 38,989 | |
| | 6,500 | | | Swire Pacific Ltd. Class A (Real Estate Management & Development) | | | 67,526 | |
| | 37,600 | | | Swire Properties Ltd. (Real Estate Management & Development) | | | 128,491 | |
| | 13,500 | | | Techtronic Industries Co. Ltd. (Household Durables) | | | 63,568 | |
| | 15,746 | | | The Bank of East Asia Ltd. (Banks) | | | 51,053 | |
| | 34,000 | | | The Wharf Holdings Ltd. (Real Estate Management & Development) | | | 84,993 | |
| | |
| | |
| 32 | | The accompanying notes are an integral part of these financial statements. |
GOLDMAN SACHS MULTI-MANAGER GLOBAL EQUITY FUND
| | | | | | | | |
| Shares | | | Description | |
Value | |
| Common Stocks – (continued) | |
| Hong Kong – (continued) | |
| | 3,600 | | | VTech Holdings Ltd. (Communications Equipment) | | $ | 42,294 | |
| | 87,000 | | | WH Group Ltd.(a) (Food Products) | | | 61,097 | |
| | 3,000 | | | Wharf Real Estate Investment Co. Ltd. (Real Estate Management & Development) | | | 18,642 | |
| | 6,000 | | | Wheelock & Co. Ltd. (Real Estate Management & Development) | | | 32,076 | |
| | 26,800 | | | Wynn Macau Ltd. (Hotels, Restaurants & Leisure) | | | 55,828 | |
| | 290,000 | | | Xinyi Glass Holdings Ltd. (Auto Components) | | | 287,939 | |
| | 25,044 | | | Yue Yuen Industrial Holdings Ltd. (Textiles, Apparel & Luxury Goods) | | | 68,765 | |
| | | | | | | | |
| | | | | | | 13,611,793 | |
| | |
| Hungary – 0.1% | |
| | 26,476 | | | MOL Hungarian Oil & Gas PLC (Oil, Gas & Consumable Fuels) | | | 277,607 | |
| | 9,147 | | | OTP Bank Nyrt (Banks) | | | 328,610 | |
| | 6,492 | | | Richter Gedeon Nyrt (Pharmaceuticals) | | | 120,592 | |
| | | | | | | | |
| | | | | | | 726,809 | |
| | |
| India – 1.5% | |
| | 9,970 | | | Ambuja Cements Ltd. (Construction Materials) | | | 26,611 | |
| | 1,148 | | | Apollo Hospitals Enterprise Ltd. (Health Care Providers & Services) | | | 17,736 | |
| | 18,062 | | | Ashok Leyland Ltd. (Machinery) | | | 28,010 | |
| | 1,540 | | | Asian Paints Ltd. (Chemicals) | | | 25,632 | |
| | 546 | | | Aurobindo Pharma Ltd. (Pharmaceuticals) | | | 5,851 | |
| | 3,437 | | | Axis Bank Ltd.* (Banks) | | | 27,058 | |
| | 895 | | | Bajaj Auto Ltd. (Automobiles) | | | 31,386 | |
| | 24,844 | | | Balrampur Chini Mills Ltd.* (Food Products) | | | 36,003 | |
| | 7,056 | | | Bata India Ltd. (Textiles, Apparel & Luxury Goods) | | | 92,999 | |
| | 3,528 | | | Bharat Forge Ltd. (Auto Components) | | | 27,910 | |
| | 3,408 | | | Bharat Petroleum Corp. Ltd. (Oil, Gas & Consumable Fuels) | | | 12,710 | |
| | 10,377 | | | Bharti Airtel Ltd. (Wireless Telecommunication Services) | | | 41,073 | |
| | 69 | | | Bosch Ltd. (Auto Components) | | | 18,420 | |
| | 503 | | | Britannia Industries Ltd. (Food Products) | | | 38,346 | |
| | 7,953 | | | Cipla Ltd. (Pharmaceuticals) | | | 67,799 | |
| | 4,456 | | | Coal India Ltd. (Oil, Gas & Consumable Fuels) | | | 16,060 | |
| | 12,596 | | | Dabur India Ltd. (Personal Products) | | | 65,546 | |
| | 6,865 | | | Dewan Housing Finance Corp. Ltd. (Thrifts & Mortgage Finance) | | | 20,878 | |
| | 46,413 | | | DLF Ltd. (Real Estate Management & Development) | | | 103,413 | |
| | 693 | | | Dr Reddy’s Laboratories Ltd. (Pharmaceuticals) | | | 23,807 | |
| | |
| Common Stocks – (continued) | |
| India – (continued) | |
| | 27 | | | Eicher Motors Ltd. (Automobiles) | | | 7,997 | |
| | 22,462 | | | Escorts Ltd. (Machinery) | | | 190,684 | |
| | 9,724 | | | Federal Bank Ltd. (Banks) | | | 10,888 | |
| | 166,671 | | | Firstsource Solutions Ltd. (IT Services) | | | 137,917 | |
| | 71,882 | | | GAIL India Ltd. (Gas Utilities) | | | 364,188 | |
| | 2,625 | | | Godrej Consumer Products Ltd. (Personal Products) | | | 25,787 | |
| | 6,302 | | | Graphite India Ltd. (Electrical Equipment) | | | 81,140 | |
| | 1,352 | | | Grasim Industries Ltd. (Construction Materials) | | | 15,254 | |
| | 6,601 | | | Gujarat Narmada Valley Fertilizers & Chemicals Ltd. (Chemicals) | | | 29,688 | |
| | 3,303 | | | Havells India Ltd. (Electrical Equipment) | | | 28,917 | |
| | 37,925 | | | HCL Technologies Ltd. (IT Services) | | | 542,178 | |
| | 22,907 | | | HDFC Bank Ltd. ADR (Banks) | | | 2,036,661 | |
| | 1,465 | | | HEG Ltd. (Electrical Equipment) | | | 85,194 | |
| | 333 | | | Hero MotoCorp Ltd. (Automobiles) | | | 12,432 | |
| | 29,069 | | | Hindalco Industries Ltd. (Metals & Mining) | | | 86,671 | |
| | 19,348 | | | Hindustan Petroleum Corp. Ltd. (Oil, Gas & Consumable Fuels) | | | 58,879 | |
| | 1,068 | | | Hindustan Unilever Ltd. (Household Products) | | | 23,447 | |
| | 999 | | | Housing Development Finance Corp. Ltd. (Thrifts & Mortgage Finance) | | | 23,900 | |
| | 509 | | | Indiabulls Housing Finance Ltd. (Thrifts & Mortgage Finance) | | | 5,741 | |
| | 42,275 | | | Indiabulls Real Estate Ltd.* (Real Estate Management & Development) | | | 42,955 | |
| | 15,384 | | | Indian Oil Corp. Ltd. (Oil, Gas & Consumable Fuels) | | | 28,864 | |
| | 14,604 | | | Infosys Ltd. (IT Services) | | | 134,956 | |
| | 109,960 | | | Infosys Ltd. ADR (IT Services) | | | 1,041,321 | |
| | 23,567 | | | ITC Ltd. (Tobacco) | | | 89,308 | |
| | 26,831 | | | JSW Steel Ltd. (Metals & Mining) | | | 123,184 | |
| | 16,925 | | | Jubilant Foodworks Ltd. (Hotels, Restaurants & Leisure) | | | 248,457 | |
| | 7,681 | | | Jubilant Life Sciences Ltd. (Pharmaceuticals) | | | 69,026 | |
| | 29,225 | | | KPIT Cummins Infosystems Ltd. (Software) | | | 87,606 | |
| | 22,961 | | | L&T Finance Holdings Ltd. (Diversified Financial Services) | | | 39,684 | |
| | 1,595 | | | Larsen & Toubro Ltd. (Construction & Engineering) | | | 28,029 | |
| | 426 | | | LIC Housing Finance Ltd. (Thrifts & Mortgage Finance) | | | 2,367 | |
| | 3,090 | | | Lupin Ltd. (Pharmaceuticals) | | | 37,034 | |
| | 4,079 | | | Mahindra & Mahindra Ltd. (Automobiles) | | | 42,288 | |
| | 7,587 | | | Marico Ltd. (Personal Products) | | | 32,978 | |
| | 322 | | | Maruti Suzuki India Ltd. (Automobiles) | | | 28,812 | |
| | 4,463 | | | Mindtree Ltd. (IT Services) | | | 51,429 | |
| | 2,292 | | | Motherson Sumi Systems Ltd. | | | 5,062 | |
| | |
| | |
| The accompanying notes are an integral part of these financial statements. | | 33 |
GOLDMAN SACHS MULTI-MANAGER GLOBAL EQUITY FUND
Schedule of Investments (continued)
October 31, 2018
| | | | | | | | |
| Shares | | | Description | |
Value | |
| Common Stocks – (continued) | |
| India – (continued) | |
| | 10,139 | | | Muthoot Finance Ltd. (Consumer Finance) | | $ | 56,112 | |
| | 67,485 | | | National Aluminium Co. Ltd. (Metals & Mining) | | | 62,312 | |
| | 62,389 | | | NCC Ltd. (Construction & Engineering) | | | 63,390 | |
| | 411 | | | Nestle India Ltd. (Food Products) | | | 56,365 | |
| | 8,006 | | | NIIT Technologies Ltd. (Software) | | | 132,963 | |
| | 14,425 | | | NTPC Ltd. (Independent Power and Renewable Electricity Producers) | | | 31,145 | |
| | 168,847 | | | Oil & Natural Gas Corp. Ltd. (Oil, Gas & Consumable Fuels) | | | 349,758 | |
| | 341 | | | Page Industries Ltd. (Textiles, Apparel & Luxury Goods) | | | 135,935 | |
| | 15,865 | | | Phillips Carbon Black Ltd. (Chemicals) | | | 48,594 | |
| | 40,733 | | | Power Finance Corp. (Diversified Financial Services) | | | 52,614 | |
| | 11,681 | | | Power Grid Corp. of India Ltd. (Electric Utilities) | | | 29,362 | |
| | 10,659 | | | Radico Khaitan Ltd. (Beverages) | | | 56,710 | |
| | 7,842 | | | Rajesh Exports Ltd. (Textiles, Apparel & Luxury Goods) | | | 60,388 | |
| | 72,844 | | | REC Ltd. (Diversified Financial Services) | | | 114,674 | |
| | 4,155 | | | Reliance Industries Ltd. (Oil, Gas & Consumable Fuels) | | | 59,650 | |
| | 26 | | | Shree Cement Ltd. (Construction Materials) | | | 4,907 | |
| | 7,318 | | | Shriram Transport Finance Co. Ltd. (Consumer Finance) | | | 115,593 | |
| | 6,073 | | | State Bank of India* (Banks) | | | 23,112 | |
| | 2,957 | | | Sun Pharmaceutical Industries Ltd. (Pharmaceuticals) | | | 23,214 | |
| | 4,972 | | | Sun TV Network Ltd. (Media) | | | 43,727 | |
| | 19,602 | | | Tata Consultancy Services Ltd. (IT Services) | | | 513,875 | |
| | 6,019 | | | Tata Elxsi Ltd. (Software) | | | 84,391 | |
| | 57,408 | | | Tata Global Beverages Ltd. GDR (Food Products) | | | 169,075 | |
| | 5,179 | | | Tata Motors Ltd.* (Automobiles) | | | 12,549 | |
| | 7,249 | | | Tata Steel Ltd. (Metals & Mining) | | | 54,357 | |
| | 7,400 | | | Tech Mahindra Ltd. (IT Services) | | | 74,535 | |
| | 1,246 | | | Titan Co. Ltd. (Textiles, Apparel & Luxury Goods) | | | 14,256 | |
| | 6,037 | | | United Breweries Ltd. (Beverages) | | | 99,656 | |
| | 3,940 | | | United Spirits Ltd.* (Beverages) | | | 30,722 | |
| | 670 | | | UPL Ltd. (Chemicals) | | | 6,112 | |
| | 7,329 | | | Vedanta Ltd. (Metals & Mining) | | | 20,969 | |
| | 422 | | | Venky’s India Ltd. (Food Products) | | | 14,247 | |
| | 22,897 | | | Wipro Ltd. (IT Services) | | | 102,504 | |
| | | | | | | | |
| | | | | | | 9,345,944 | |
| | |
| Indonesia – 0.4% | |
| | 580,842 | | | Adaro Energy Tbk PT (Oil, Gas & Consumable Fuels) | | | 63,118 | |
| | 15,800 | | | Bank Central Asia Tbk PT (Banks) | | | 24,602 | |
| | 849,000 | | | Bank Mandiri Persero Tbk PT (Banks) | | | 381,474 | |
| | |
| Common Stocks – (continued) | |
| Indonesia – (continued) | |
| | 1,168,167 | | | Bank Negara Indonesia Persero Tbk PT (Banks) | | | 564,046 | |
| | 2,001,800 | | | Bank Rakyat Indonesia Persero Tbk PT (Banks) | | | 415,469 | |
| | 507,927 | | | Bukit Asam Tbk PT (Oil, Gas & Consumable Fuels) | | | 142,650 | |
| | 73,000 | | | Charoen Pokphand Indonesia Tbk PT (Food Products) | | | 26,442 | |
| | 304,634 | | | Erajaya Swasembada Tbk PT (Electronic Equipment, Instruments & Components) | | | 34,073 | |
| | 25,182 | | | Gudang Garam Tbk PT (Tobacco) | | | 120,042 | |
| | 85,900 | | | Hanjaya Mandala Sampoerna Tbk PT (Tobacco) | | | 21,141 | |
| | 82,043 | | | Indah Kiat Pulp & Paper Corp. Tbk PT (Paper & Forest Products) | | | 68,757 | |
| | 4,100 | | | Indocement Tunggal Prakarsa Tbk PT (Construction Materials) | | | 4,678 | |
| | 26,100 | | | Indofood CBP Sukses Makmur Tbk PT (Food Products) | | | 15,335 | |
| | 32,258 | | | Indofood Sukses Makmur Tbk PT (Food Products) | | | 12,691 | |
| | 112,600 | | | Perusahaan Gas Negara Persero Tbk (Gas Utilities) | | | 16,491 | |
| | 118,100 | | | Semen Indonesia Persero Tbk PT (Construction Materials) | | | 70,023 | |
| | 1,558,200 | | | Telekomunikasi Indonesia Persero Tbk PT (Diversified Telecommunication Services) | | | 394,729 | |
| | 9,100 | | | Unilever Indonesia Tbk PT (Household Products) | | | 25,921 | |
| | 66,039 | | | United Tractors Tbk PT (Oil, Gas & Consumable Fuels) | | | 145,803 | |
| | | | | | | | |
| | | | | | | 2,547,485 | |
| | |
| Ireland – 1.7% | |
| | 13,441 | | | Accenture PLC Class A (IT Services) | | | 2,118,571 | |
| | 2,502 | | | Allergan PLC (Pharmaceuticals) | | | 395,341 | |
| | 10,260 | | | Bank of Ireland Group PLC (Banks) | | | 72,493 | |
| | 1,181 | | | CRH PLC (Construction Materials) | | | 35,227 | |
| | 3,642 | | | DCC PLC (Industrial Conglomerates) | | | 312,159 | |
| | 2,339 | | | Eaton Corp. PLC (Electrical Equipment) | | | 167,636 | |
| | 21,140 | | | Glanbia PLC (Food Products) | | | 373,763 | |
| | 13,057 | | | ICON PLC* (Life Sciences Tools & Services) | | | 1,802,911 | |
| | 2,610 | | | Ingersoll-Rand PLC (Machinery) | | | 250,403 | |
| | 3,462 | | | Johnson Controls International PLC (Building Products) | | | 110,680 | |
| | 2,377 | | | Kerry Group PLC Class A (Food Products) | | | 243,654 | |
| | 3,509 | | | Kingspan Group PLC (Building Products) | | | 152,620 | |
| | 15,191 | | | Linde PLC* (Chemicals) | | | 2,492,230 | |
| | 5,593 | | | Medtronic PLC (Health Care Equipment & Supplies) | | | 502,363 | |
| | |
| | |
| 34 | | The accompanying notes are an integral part of these financial statements. |
GOLDMAN SACHS MULTI-MANAGER GLOBAL EQUITY FUND
| | | | | | | | |
| Shares | | | Description | |
Value | |
| Common Stocks – (continued) | |
| Ireland – (continued) | |
| | 1,010 | | | Paddy Power Betfair PLC (Hotels, Restaurants & Leisure) | | $ | 87,171 | |
| | 5,618 | | | Pentair PLC (Machinery) | | | 225,563 | |
| | 3,028 | | | Perrigo Co. PLC (Pharmaceuticals) | | | 212,868 | |
| | 7,689 | | | Ryanair Holdings PLC ADR* (Airlines) | | | 636,649 | |
| | 5,596 | | | Seagate Technology PLC (Technology Hardware, Storage & Peripherals) | | | 225,127 | |
| | 2,502 | | | Smurfit Kappa Group PLC (Containers & Packaging) | | | 81,342 | |
| | 1,619 | | | Willis Towers Watson PLC (Insurance) | | | 231,776 | |
| | | | | | | | |
| | | | | | | 10,730,547 | |
| | |
| Israel – 0.3% | |
| | 24,976 | | | Bank Hapoalim BM (Banks) | | | 168,966 | |
| | 21,659 | | | Bank Leumi Le-Israel BM (Banks) | | | 135,059 | |
| | 10,711 | | | Bezeq The Israeli Telecommunication Corp. Ltd. (Diversified Telecommunication Services) | | | 12,299 | |
| | 3,752 | | | Check Point Software Technologies Ltd.* (Software) | | | 416,472 | |
| | 31,846 | | | Israel Chemicals Ltd. (Chemicals) | | | 183,433 | |
| | 100,577 | | | Israel Discount Bank Ltd. Class A (Banks) | | | 328,682 | |
| | 14,448 | | | Mizrahi Tefahot Bank Ltd. (Banks) | | | 243,168 | |
| | 751 | | | Nice Ltd.* (Software) | | | 79,687 | |
| | 4,814 | | | Orbotech Ltd.* (Electronic Equipment, Instruments & Components) | | | 269,295 | |
| | 2,904 | | | Wix.com Ltd.* (IT Services) | | | 282,704 | |
| | | | | | | | |
| | | | | | | 2,119,765 | |
| | |
| Italy – 0.9% | |
| | 19,947 | | | Amplifon SpA (Health Care Providers & Services) | | | 353,347 | |
| | 6,781 | | | Assicurazioni Generali SpA (Insurance) | | | 109,424 | |
| | 18,664 | | | Autogrill SpA (Hotels, Restaurants & Leisure) | | | 183,496 | |
| | 10,780 | | | Buzzi Unicem SpA (Construction Materials) | | | 207,000 | |
| | 7,384 | | | Davide Campari-Milano SpA (Beverages) | | | 56,829 | |
| | 26,801 | | | Enel SpA (Electric Utilities) | | | 131,407 | |
| | 7,354 | | | Eni SpA (Oil, Gas & Consumable Fuels) | | | 130,605 | |
| | 77,726 | | | Hera SpA (Multi-Utilities) | | | 214,514 | |
| | 63,994 | | | Intesa Sanpaolo SpA (Banks) | | | 141,752 | |
| | 116,664 | | | Iren SpA (Multi-Utilities) | | | 252,783 | |
| | 6,641 | | | Leonardo SpA (Aerospace & Defense) | | | 71,993 | |
| | 15,022 | | | Luxottica Group SpA (Textiles, Apparel & Luxury Goods) | | | 943,431 | |
| | 41,195 | | | Mediobanca Banca di Credito Finanziario SpA (Banks) | | | 360,777 | |
| | 2,590 | | | Moncler SpA (Textiles, Apparel & Luxury Goods) | | | 89,945 | |
| | 19,305 | | | Poste Italiane SpA(a) (Insurance) | | | 138,521 | |
| | 1,292 | | | Prysmian SpA (Electrical Equipment) | | | 25,099 | |
| | 31,261 | | | Snam SpA (Oil, Gas & Consumable Fuels) | | | 129,250 | |
| | |
| Common Stocks – (continued) | |
| Italy – (continued) | |
| | 72,069 | | | Telecom Italia SpA* (Diversified Telecommunication Services) | | | 42,388 | |
| | 14,643 | | | Terna Rete Elettrica Nazionale SpA (Electric Utilities) | | | 75,638 | |
| | 167,190 | | | UniCredit SpA (Banks) | | | 2,137,550 | |
| | 39,328 | | | Unione di Banche Italiane SpA (Banks) | | | 120,035 | |
| | | | | | | | |
| | | | | | | 5,915,784 | |
| | |
| Japan – 6.2% | |
| | 4,300 | | | AEON Co. Ltd. (Food & Staples Retailing) | | | 98,694 | |
| | 900 | | | AGC, Inc. (Building Products) | | | 29,479 | |
| | 3,600 | | | Air Water, Inc. (Chemicals) | | | 58,316 | |
| | 3,000 | | | Aisin Seiki Co. Ltd. (Auto Components) | | | 117,334 | |
| | 2,200 | | | Ajinomoto Co., Inc. (Food Products) | | | 35,542 | |
| | 3,400 | | | Alfresa Holdings Corp. (Health Care Providers & Services) | | | 90,684 | |
| | 6,700 | | | Amada Holdings Co. Ltd. (Machinery) | | | 63,120 | |
| | 2,700 | | | ANA Holdings, Inc. (Airlines) | | | 90,789 | |
| | 1,900 | | | Aozora Bank Ltd. (Banks) | | | 65,562 | |
| | 2,100 | | | Asahi Group Holdings Ltd. (Beverages) | | | 92,285 | |
| | 10,100 | | | Asahi Kasei Corp. (Chemicals) | | | 121,184 | |
| | 1,100 | | | Asics Corp. (Textiles, Apparel & Luxury Goods) | | | 15,921 | |
| | 3,200 | | | Astellas Pharma, Inc. (Pharmaceuticals) | | | 49,441 | |
| | 600 | | | Bandai Namco Holdings, Inc. (Leisure Products) | | | 21,345 | |
| | 900 | | | Bridgestone Corp. (Auto Components) | | | 34,703 | |
| | 1,400 | | | Brother Industries Ltd. (Technology Hardware, Storage & Peripherals) | | | 25,622 | |
| | 1,500 | | | Calbee, Inc. (Food Products) | | | 49,766 | |
| | 2,500 | | | Canon, Inc. (Technology Hardware, Storage & Peripherals) | | | 71,209 | |
| | 2,000 | | | Casio Computer Co. Ltd. (Household Durables) | | | 30,186 | |
| | 200 | | | Central Japan Railway Co. (Road & Rail) | | | 38,382 | |
| | 6,200 | | | Chubu Electric Power Co., Inc. (Electric Utilities) | | | 89,408 | |
| | 700 | | | Chugai Pharmaceutical Co. Ltd. (Pharmaceuticals) | | | 40,983 | |
| | 42,800 | | | Citizen Watch Co. Ltd. (Electronic Equipment, Instruments & Components) | | | 246,355 | |
| | 19,700 | | | CMK Corp. (Electronic Equipment, Instruments & Components) | | | 126,272 | |
| | 7,100 | | | Coca-Cola Bottlers Japan Holdings, Inc. (Beverages) | | | 185,815 | |
| | 8,900 | | | Concordia Financial Group Ltd. (Banks) | | | 40,733 | |
| | 8,200 | | | Cosmo Energy Holdings Co. Ltd. (Oil, Gas & Consumable Fuels) | | | 301,584 | |
| | 2,200 | | | Credit Saison Co. Ltd. (Consumer Finance) | | | 34,936 | |
| | 500 | | | CyberAgent, Inc. (Media) | | | 21,277 | |
| | 2,100 | | | Dai Nippon Printing Co. Ltd. (Commercial Services & Supplies) | | | 47,119 | |
| | 2,200 | | | Dai-ichi Life Holdings, Inc. (Insurance) | | | 41,284 | |
| | |
| | |
| The accompanying notes are an integral part of these financial statements. | | 35 |
GOLDMAN SACHS MULTI-MANAGER GLOBAL EQUITY FUND
Schedule of Investments (continued)
October 31, 2018
| | | | | | | | |
| Shares | | | Description | |
Value | |
| Common Stocks – (continued) | |
| Japan – (continued) | |
| | 3,600 | | | Daicel Corp. (Chemicals) | | $ | 38,084 | |
| | 2,900 | | | Daiichi Sankyo Co. Ltd. (Pharmaceuticals) | | | 110,847 | |
| | 400 | | | Daikin Industries Ltd. (Building Products) | | | 46,365 | |
| | 200 | | | Daito Trust Construction Co. Ltd. (Real Estate Management & Development) | | | 26,368 | |
| | 700 | | | Daiwa House Industry Co. Ltd. (Real Estate Management & Development) | | | 21,136 | |
| | 7,200 | | | Daiwa Securities Group, Inc. (Capital Markets) | | | 41,290 | |
| | 8,900 | | | Denka Co. Ltd (Chemicals) | | | 289,452 | |
| | 1,900 | | | Denso Corp. (Auto Components) | | | 84,751 | |
| | 5,200 | | | DIC Corp. (Chemicals) | | | 153,453 | |
| | 1,200 | | | Don Quijote Holdings Co. Ltd. (Multiline Retail) | | | 71,685 | |
| | 6,500 | | | DTS Corp. (IT Services) | | | 225,829 | |
| | 14,500 | | | East Japan Railway Co. (Road & Rail) | | | 1,266,396 | |
| | 6,600 | | | Ebara Corp. (Machinery) | | | 192,233 | |
| | 500 | | | Eisai Co. Ltd. (Pharmaceuticals) | | | 41,640 | |
| | 4,300 | | | Eizo Corp. (Technology Hardware, Storage & Peripherals) | | | 175,017 | |
| | 3,300 | | | Electric Power Development Co. Ltd. (Independent Power and Renewable Electricity Producers) | | | 89,844 | |
| | 900 | | | Ezaki Glico Co. Ltd. (Food Products) | | | 44,865 | |
| | 600 | | | FamilyMart UNY Holdings Co. Ltd. (Food & Staples Retailing) | | | 69,546 | |
| | 10,500 | | | FANUC Corp. (Machinery) | | | 1,826,652 | |
| | 9,400 | | | FCC Co. Ltd. (Auto Components) | | | 232,800 | |
| | 3,000 | | | Fuji Electric Co. Ltd. (Electrical Equipment) | | | 91,576 | |
| | 1,200 | | | FUJIFILM Holdings Corp. (Technology Hardware, Storage & Peripherals) | | | 51,900 | |
| | 800 | | | Fujitsu Ltd. (IT Services) | | | 48,671 | |
| | 800 | | | Fukuoka Financial Group, Inc. (Banks) | | | 19,657 | |
| | 2,900 | | | Hakuhodo DY Holdings, Inc. (Media) | | | 48,368 | |
| | 3,000 | | | Hamamatsu Photonics KK (Electronic Equipment, Instruments & Components) | | | 100,289 | |
| | 1,300 | | | Hankyu Hanshin Holdings, Inc. (Road & Rail) | | | 42,940 | |
| | 30,500 | | | Haseko Corp. (Household Durables) | | | 386,484 | |
| | 7,200 | | | Hino Motors Ltd. (Machinery) | | | 68,920 | |
| | 210 | | | Hirose Electric Co. Ltd. (Electronic Equipment, Instruments & Components) | | | 20,015 | |
| | 900 | | | Hisamitsu Pharmaceutical Co., Inc. (Pharmaceuticals) | | | 50,713 | |
| | 1,600 | | | Hitachi Ltd. (Electronic Equipment, Instruments & Components) | | | 48,912 | |
| | 3,400 | | | Honda Motor Co. Ltd. (Automobiles) | | | 97,055 | |
| | 200 | | | Hoshizaki Corp. (Machinery) | | | 16,144 | |
| | 2,200 | | | Hoya Corp. (Health Care Equipment & Supplies) | | | 124,467 | |
| | 4,400 | | | Idemitsu Kosan Co. Ltd. (Oil, Gas & Consumable Fuels) | | | 199,332 | |
| | 15,800 | | | Inpex Corp. (Oil, Gas & Consumable Fuels) | | | 179,908 | |
| | |
| Common Stocks – (continued) | |
| Japan – (continued) | |
| | 6,600 | | | Isetan Mitsukoshi Holdings Ltd. (Multiline Retail) | | | 77,136 | |
| | 5,800 | | | Isuzu Motors Ltd. (Automobiles) | | | 76,041 | |
| | 7,000 | | | Itochu Corp. (Trading Companies & Distributors) | | | 129,822 | |
| | 3,800 | | | J. Front Retailing Co. Ltd. (Multiline Retail) | | | 49,796 | |
| | 6,100 | | | Jafco Co. Ltd. (Capital Markets) | | | 235,035 | |
| | 26,700 | | | Japan Airlines Co. Ltd. (Airlines) | | | 947,614 | |
| | 500 | | | Japan Airport Terminal Co. Ltd. (Transportation Infrastructure) | | | 19,259 | |
| | 7,100 | | | Japan Lifeline Co. Ltd. (Health Care Providers & Services) | | | 103,511 | |
| | 6,200 | | | Japan Post Bank Co. Ltd. (Banks) | | | 72,284 | |
| | 4,700 | | | Japan Post Holdings Co. Ltd. (Insurance) | | | 55,735 | |
| | 16 | | | Japan Prime Realty Investment Corp. (Equity Real Estate Investment Trusts (REITs)) | | | 57,090 | |
| | 50 | | | Japan Retail Fund Investment Corp. (Equity Real Estate Investment Trusts (REITs)) | | | 92,350 | |
| | 6,600 | | | JFE Holdings, Inc. (Metals & Mining) | | | 124,024 | |
| | 1,800 | | | JGC Corp. (Construction & Engineering) | | | 34,842 | |
| | 6,300 | | | JSR Corp. (Chemicals) | | | 93,890 | |
| | 3,800 | | | JTEKT Corp. (Machinery) | | | 47,278 | |
| | 12,200 | | | Juki Corp. (Machinery) | | | 136,621 | |
| | 26,300 | | | JXTG Holdings, Inc. (Oil, Gas & Consumable Fuels) | | | 177,709 | |
| | 28,000 | | | K’s Holdings Corp. (Specialty Retail) | | | 353,722 | |
| | 5,000 | | | Kajima Corp. (Construction & Engineering) | | | 64,383 | |
| | 7,800 | | | Kanamoto Co. Ltd. (Trading Companies & Distributors) | | | 260,642 | |
| | 1,400 | | | Kaneka Corp. (Chemicals) | | | 58,514 | |
| | 1,300 | | | Kao Corp. (Personal Products) | | | 86,479 | |
| | 1,900 | | | KAWADA TECHNOLOGIES, Inc. (Construction & Engineering) | | | 109,325 | |
| | 4,600 | | | Kawasaki Heavy Industries Ltd. (Machinery) | | | 109,013 | |
| | 61,400 | | | KDDI Corp. (Wireless Telecommunication Services) | | | 1,485,870 | |
| | 1,000 | | | Keihan Holdings Co. Ltd. (Industrial Conglomerates) | | | 37,946 | |
| | 2,400 | | | Keisei Electric Railway Co. Ltd. (Road & Rail) | | | 73,963 | |
| | 44 | | | Kenedix Office Investment Corp. (Equity Real Estate Investment Trusts (REITs)) | | | 272,665 | |
| | 1,700 | | | Kewpie Corp. (Food Products) | | | 39,077 | |
| | 3,410 | | | Keyence Corp. (Electronic Equipment, Instruments & Components) | | | 1,665,852 | |
| | 800 | | | Kikkoman Corp. (Food Products) | | | 43,830 | |
| | 4,400 | | | Kirin Holdings Co. Ltd. (Beverages) | | | 104,995 | |
| | 1,100 | | | Kobayashi Pharmaceutical Co. Ltd. (Personal Products) | | | 71,744 | |
| | 7,100 | | | Kobe Steel Ltd. (Metals & Mining) | | | 57,086 | |
| | 400 | | | Koito Manufacturing Co. Ltd. (Auto Components) | | | 19,042 | |
| | |
| | |
| 36 | | The accompanying notes are an integral part of these financial statements. |
GOLDMAN SACHS MULTI-MANAGER GLOBAL EQUITY FUND
| | | | | | | | |
| Shares | | | Description | |
Value | |
| Common Stocks – (continued) | |
| Japan – (continued) | |
| | 5,200 | | | Komatsu Ltd. (Machinery) | | $ | 135,421 | |
| | 32,100 | | | Konica Minolta, Inc. (Technology Hardware, Storage & Peripherals) | | | 317,738 | |
| | 400 | | | Kose Corp. (Personal Products) | | | 59,779 | |
| | 5,200 | | | Kuraray Co. Ltd. (Chemicals) | | | 71,425 | |
| | 3,200 | | | Kurita Water Industries Ltd. (Machinery) | | | 78,816 | |
| | 500 | | | Kyocera Corp. (Electronic Equipment, Instruments & Components) | | | 27,061 | |
| | 10,800 | | | Kyowa Exeo Corp. (Construction & Engineering) | | | 291,121 | |
| | 2,600 | | | Kyowa Hakko Kirin Co. Ltd. (Pharmaceuticals) | | | 50,354 | |
| | 4,600 | | | Kyudenko Corp. (Construction & Engineering) | | | 167,364 | |
| | 3,600 | | | Kyushu Electric Power Co., Inc. (Electric Utilities) | | | 41,821 | |
| | 5,600 | | | LAC Co. Ltd. (IT Services) | | | 87,844 | |
| | 1,100 | | | Lawson, Inc. (Food & Staples Retailing) | | | 69,825 | |
| | 5,400 | | | Lintec Corp. (Chemicals) | | | 127,801 | |
| | 2,800 | | | Lion Corp. (Household Products) | | | 52,642 | |
| | 4,100 | | | LIXIL Group Corp. (Building Products) | | | 64,455 | |
| | 1,600 | | | M3, Inc. (Health Care Technology) | | | 25,931 | |
| | 21,000 | | | Maeda Corp. (Construction & Engineering) | | | 237,293 | |
| | 7,400 | | | Makino Milling Machine Co. Ltd. (Machinery) | | | 281,629 | |
| | 1,500 | | | Makita Corp. (Machinery) | | | 51,858 | |
| | 12,900 | | | Marubeni Corp. (Trading Companies & Distributors) | | | 104,602 | |
| | 400 | | | Marui Group Co. Ltd. (Multiline Retail) | | | 8,613 | |
| | 7,900 | | | Matsumotokiyoshi Holdings Co. Ltd. (Food & Staples Retailing) | | | 285,615 | |
| | 3,400 | | | Mazda Motor Corp. (Automobiles) | | | 36,214 | |
| | 244 | | | MCUBS MidCity Investment Corp. (Equity Real Estate Investment Trusts (REITs)) | | | 186,762 | |
| | 75,800 | | | Mebuki Financial Group, Inc. (Banks) | | | 230,838 | |
| | 5,800 | | | Medipal Holdings Corp. (Health Care Providers & Services) | | | 124,155 | |
| | 10,700 | | | Meidensha Corp. (Machinery) | | | 151,586 | |
| | 400 | | | MEIJI Holdings Co. Ltd. (Food Products) | | | 26,540 | |
| | 3,500 | | | MISUMI Group, Inc. (Machinery) | | | 70,143 | |
| | 8,500 | | | Mitsubishi Chemical Holdings Corp. (Chemicals) | | | 66,261 | |
| | 9,200 | | | Mitsubishi Corp. (Trading Companies & Distributors) | | | 258,937 | |
| | 3,200 | | | Mitsubishi Electric Corp. (Electrical Equipment) | | | 40,510 | |
| | 4,900 | | | Mitsubishi Gas Chemical Co., Inc. (Chemicals) | | | 82,252 | |
| | 500 | | | Mitsubishi Heavy Industries Ltd. (Machinery) | | | 17,626 | |
| | 4,900 | | | Mitsubishi Materials Corp. (Metals & Mining) | | | 135,656 | |
| | 20,700 | | | Mitsubishi Motors Corp. (Automobiles) | | | 130,022 | |
| | 7,000 | | | Mitsubishi Tanabe Pharma Corp. (Pharmaceuticals) | | | 103,396 | |
| | |
| Common Stocks – (continued) | |
| Japan – (continued) | |
| | 5,500 | | | Mitsubishi UFJ Financial Group, Inc. (Banks) | | | 33,289 | |
| | 56,700 | | | Mitsubishi UFJ Lease & Finance Co. Ltd. (Diversified Financial Services) | | | 291,393 | |
| | 12,900 | | | Mitsui & Co. Ltd. (Trading Companies & Distributors) | | | 215,541 | |
| | 3,600 | | | Mitsui Chemicals, Inc. (Chemicals) | | | 80,727 | |
| | 3,500 | | | Mitsui OSK Lines Ltd. (Marine) | | | 85,066 | |
| | 27,600 | | | Mizuho Financial Group, Inc. (Banks) | | | 47,399 | |
| | 9,100 | | | Morinaga Milk Industry Co. Ltd. (Food Products) | | | 242,566 | |
| | 2,700 | | | Nabtesco Corp. (Machinery) | | | 59,267 | |
| | 3,600 | | | Nagoya Railroad Co. Ltd. (Road & Rail) | | | 86,945 | |
| | 1,400 | | | Nankai Electric Railway Co. Ltd. (Road & Rail) | | | 34,286 | |
| | 3,200 | | | NEC Corp. (Technology Hardware, Storage & Peripherals) | | | 91,857 | |
| | 6,900 | | | Nexon Co. Ltd.* (Entertainment) | | | 78,710 | |
| | 2,900 | | | NH Foods Ltd. (Food Products) | | | 100,009 | |
| | 3,600 | | | Nichiha Corp. (Building Products) | | | 79,503 | |
| | 11,200 | | | Nichirei Corp. (Food Products) | | | 269,002 | |
| | 8,400 | | | Nikon Corp. (Household Durables) | | | 146,434 | |
| | 9 | | | Nippon Building Fund, Inc. (Equity Real Estate Investment Trusts (REITs)) | | | 51,432 | |
| | 1,400 | | | Nippon Express Co. Ltd. (Road & Rail) | | | 88,352 | |
| | 3,700 | | | Nippon Shinyaku Co. Ltd. (Pharmaceuticals) | | | 212,570 | |
| | 3,100 | | | Nippon Steel & Sumitomo Metal Corp. (Metals & Mining) | | | 57,183 | |
| | 2,500 | | | Nippon Telegraph & Telephone Corp. (Diversified Telecommunication Services) | | | 103,096 | |
| | 3,300 | | | Nippon Yusen KK (Marine) | | | 53,215 | |
| | 5,500 | | | Nishio Rent All Co. Ltd. (Trading Companies & Distributors) | | | 177,219 | |
| | 1,500 | | | Nissan Chemical Corp. (Chemicals) | | | 70,727 | |
| | 2,800 | | | Nissan Motor Co. Ltd. (Automobiles) | | | 25,474 | |
| | 4,900 | | | Nisshin Seifun Group, Inc. (Food Products) | | | 97,500 | |
| | 1,600 | | | Nissin Foods Holdings Co. Ltd. (Food Products) | | | 103,167 | |
| | 1,100 | | | Nitori Holdings Co. Ltd. (Specialty Retail) | | | 143,631 | |
| | 28 | | | Nomura Real Estate Master Fund, Inc. (Equity Real Estate Investment Trusts (REITs)) | | | 36,268 | |
| | 1,600 | | | Nomura Research Institute Ltd. (IT Services) | | | 70,934 | |
| | 7,500 | | | NSK Ltd. (Machinery) | | | 74,100 | |
| | 1,300 | | | NTT DOCOMO, Inc. (Wireless Telecommunication Services) | | | 32,238 | |
| | 5,400 | | | Obayashi Corp. (Construction & Engineering) | | | 47,672 | |
| | 14,000 | | | Oji Holdings Corp. (Paper & Forest Products) | | | 99,416 | |
| | 1,000 | | | Omron Corp. (Electronic Equipment, Instruments & Components) | | | 40,484 | |
| | |
| | |
| The accompanying notes are an integral part of these financial statements. | | 37 |
GOLDMAN SACHS MULTI-MANAGER GLOBAL EQUITY FUND
Schedule of Investments (continued)
October 31, 2018
| | | | | | | | |
| Shares | | | Description | |
Value | |
| Common Stocks – (continued) | |
| Japan – (continued) | |
| | 6,600 | | | Open House Co. Ltd. (Real Estate Management & Development) | | $ | 260,870 | |
| | 500 | | | Oriental Land Co. Ltd. (Hotels, Restaurants & Leisure) | | | 47,037 | |
| | 800 | | | ORIX Corp. (Diversified Financial Services) | | | 13,033 | |
| | 4,900 | | | Osaka Gas Co. Ltd. (Gas Utilities) | | | 89,601 | |
| | 2,600 | | | Otsuka Corp. (IT Services) | | | 86,239 | |
| | 1,600 | | | Otsuka Holdings Co. Ltd. (Pharmaceuticals) | | | 76,525 | |
| | 3,900 | | | Panasonic Corp. (Household Durables) | | | 41,853 | |
| | 3,500 | | | Persol Holdings Co. Ltd. (Professional Services) | | | 66,401 | |
| | 2,000 | | | Pigeon Corp. (Household Products) | | | 84,584 | |
| | 3,900 | | | Recruit Holdings Co. Ltd. (Professional Services) | | | 104,674 | |
| | 13,700 | | | Ricoh Co. Ltd. (Technology Hardware, Storage & Peripherals) | | | 136,757 | |
| | 500 | | | Rinnai Corp. (Household Durables) | | | 36,322 | |
| | 1,400 | | | Rohm Co. Ltd. (Semiconductors & Semiconductor Equipment) | | | 98,426 | |
| | 300 | | | Ryohin Keikaku Co. Ltd. (Multiline Retail) | | | 79,299 | |
| | 4,900 | | | Sankyu, Inc. (Road & Rail) | | | 230,959 | |
| | 2,500 | | | Santen Pharmaceutical Co. Ltd. (Pharmaceuticals) | | | 37,030 | |
| | 5,300 | | | Sawai Pharmaceutical Co. Ltd. (Pharmaceuticals) | | | 268,668 | |
| | 12,300 | | | SBI Holdings, Inc. (Capital Markets) | | | 321,190 | |
| | 3,400 | | | SCREEN Holdings Co. Ltd. (Semiconductors & Semiconductor Equipment) | | | 184,833 | |
| | 8,200 | | | Sega Sammy Holdings, Inc. (Leisure Products) | | | 105,290 | |
| | 3,500 | | | Seiko Epson Corp. (Technology Hardware, Storage & Peripherals) | | | 56,389 | |
| | 16,600 | | | Seino Holdings Co. Ltd. (Road & Rail) | | | 229,883 | |
| | 2,800 | | | Sekisui Chemical Co. Ltd. (Household Durables) | | | 44,033 | |
| | 1,600 | | | Sekisui House Ltd. (Household Durables) | | | 23,483 | |
| | 700 | | | Seven & i Holdings Co. Ltd. (Food & Staples Retailing) | | | 30,310 | |
| | 1,800 | | | Shimadzu Corp. (Electronic Equipment, Instruments & Components) | | | 45,491 | |
| | 700 | | | Shimamura Co. Ltd. (Specialty Retail) | | | 58,880 | |
| | 4,900 | | | Shimizu Corp. (Construction & Engineering) | | | 39,775 | |
| | 3,500 | | | Shinsei Bank Ltd. (Banks) | | | 53,315 | |
| | 1,300 | | | Shiseido Co. Ltd. (Personal Products) | | | 82,024 | |
| | 3,000 | | | Sogo Medical Holdings Co. Ltd. (Food & Staples Retailing) | | | 64,366 | |
| | 600 | | | Sohgo Security Services Co. Ltd. (Commercial Services & Supplies) | | | 26,725 | |
| | 35,500 | | | Sojitz Corp. (Trading Companies & Distributors) | | | 119,385 | |
| | 22,900 | | | Sompo Holdings, Inc. (Insurance) | | | 944,522 | |
| | |
| Common Stocks – (continued) | |
| Japan – (continued) | |
| | 1,800 | | | Square Enix Co. Ltd. (Entertainment) | | | 64,515 | |
| | 3,200 | | | Stanley Electric Co. Ltd. (Auto Components) | | | 94,657 | |
| | 10,000 | | | Sumitomo Chemical Co. Ltd. (Chemicals) | | | 50,094 | |
| | 5,500 | | | Sumitomo Corp. (Trading Companies & Distributors) | | | 83,417 | |
| | 4,000 | | | Sumitomo Dainippon Pharma Co. Ltd. (Pharmaceuticals) | | | 83,575 | |
| | 1,000 | | | Sumitomo Electric Industries Ltd. (Auto Components) | | | 13,638 | |
| | 21,700 | | | Sumitomo Forestry Co. Ltd. (Household Durables) | | | 322,002 | |
| | 12,500 | | | Sumitomo Heavy Industries Ltd. (Machinery) | | | 393,135 | |
| | 3,700 | | | Sumitomo Metal Mining Co. Ltd. (Metals & Mining) | | | 116,498 | |
| | 22,500 | | | Sumitomo Mitsui Financial Group, Inc. (Banks) | | | 876,040 | |
| | 5,400 | | | Sumitomo Rubber Industries Ltd. (Auto Components) | | | 77,461 | |
| | 700 | | | Suntory Beverage & Food Ltd. (Beverages) | | | 28,528 | |
| | 3,900 | | | Sushiro Global Holdings Ltd. (Hotels, Restaurants & Leisure) | | | 205,425 | |
| | 2,000 | | | Suzuken Co. Ltd. (Health Care Providers & Services) | | | 101,231 | |
| | 2,200 | | | Suzuki Motor Corp. (Automobiles) | | | 109,707 | |
| | 12,251 | | | Sysmex Corp. (Health Care Equipment & Supplies) | | | 859,279 | |
| | 4,100 | | | T&D Holdings, Inc. (Insurance) | | | 65,541 | |
| | 3,000 | | | Taiheiyo Cement Corp. (Construction Materials) | | | 88,280 | |
| | 1,100 | | | Taisei Corp. (Construction & Engineering) | | | 47,045 | |
| | 1,200 | | | Taisho Pharmaceutical Holdings Co. Ltd. (Pharmaceuticals) | | | 127,952 | |
| | 46,300 | | | Takeda Pharmaceutical Co. Ltd. (Pharmaceuticals) | | | 1,919,576 | |
| | 2,500 | | | Teijin Ltd. (Chemicals) | | | 43,342 | |
| | 900 | | | Terumo Corp. (Health Care Equipment & Supplies) | | | 48,584 | |
| | 10,900 | | | The 77 Bank Ltd. (Banks) | | | 225,146 | |
| | 1,900 | | | The Bank of Kyoto Ltd. (Banks) | | | 85,314 | |
| | 14,200 | | | The Chiba Bank Ltd. (Banks) | | | 89,834 | |
| | 6,200 | | | The Chugoku Electric Power Co., Inc. (Electric Utilities) | | | 79,749 | |
| | 3,200 | | | The Kansai Electric Power Co., Inc. (Electric Utilities) | | | 48,978 | |
| | 7,200 | | | The Shizuoka Bank Ltd. (Banks) | | | 62,993 | |
| | 1,200 | | | THK Co. Ltd. (Machinery) | | | 26,502 | |
| | 6,400 | | | TIS, Inc. (IT Services) | | | 285,869 | |
| | 2,600 | | | Tobu Railway Co. Ltd. (Road & Rail) | | | 72,313 | |
| | 33,300 | | | Toda Corp. (Construction & Engineering) | | | 224,082 | |
| | 1,800 | | | Toho Co. Ltd. (Entertainment) | | | 58,726 | |
| | 2,200 | | | Toho Gas Co. Ltd. (Gas Utilities) | | | 75,751 | |
| | |
| | |
| 38 | | The accompanying notes are an integral part of these financial statements. |
GOLDMAN SACHS MULTI-MANAGER GLOBAL EQUITY FUND
| | | | | | | | |
| Shares | | | Description | |
Value | |
| Common Stocks – (continued) | |
| Japan – (continued) | |
| | 3,700 | | | Tohoku Electric Power Co., Inc. (Electric Utilities) | | $ | 46,748 | |
| | 12,800 | | | Tokai Carbon Co. Ltd. (Chemicals) | | | 200,408 | |
| | 5,500 | | | Tokyo Electric Power Co. Holdings., Inc* (Electric Utilities) | | | 28,150 | |
| | 300 | | | Tokyo Electron Ltd. (Semiconductors & Semiconductor Equipment) | | | 40,485 | |
| | 2,100 | | | Tokyo Gas Co. Ltd. (Gas Utilities) | | | 51,645 | |
| | 2,300 | | | Tokyo Tatemono Co. Ltd. (Real Estate Management & Development) | | | 24,737 | |
| | 8,900 | | | Tokyu Fudosan Holdings Corp. (Real Estate Management & Development) | | | 50,146 | |
| | 3,500 | | | Toppan Printing Co. Ltd. (Commercial Services & Supplies) | | | 49,481 | |
| | 16,300 | | | Toray Industries, Inc. (Chemicals) | | | 115,621 | |
| | 6,100 | | | Tosoh Corp. (Chemicals) | | | 80,311 | |
| | 700 | | | TOTO Ltd. (Building Products) | | | 25,043 | |
| | 1,500 | | | Towa Pharmaceutical Co. Ltd. (Pharmaceuticals) | | | 115,305 | |
| | 3,700 | | | Toyo Seikan Group Holdings Ltd. (Containers & Packaging) | | | 75,487 | |
| | 2,200 | | | Toyo Suisan Kaisha Ltd. (Food Products) | | | 75,624 | |
| | 13,500 | | | Toyo Tire & Rubber Co. Ltd. (Auto Components) | | | 225,201 | |
| | 9,000 | | | Toyoda Gosei Co. Ltd. (Auto Components) | | | 194,109 | |
| | 13,500 | | | Toyota Boshoku Corp. (Auto Components) | | | 225,150 | |
| | 700 | | | Toyota Industries Corp. (Auto Components) | | | 34,385 | |
| | 1,900 | | | Toyota Motor Corp. (Automobiles) | | | 111,304 | |
| | 2,200 | | | Toyota Tsusho Corp. (Trading Companies & Distributors) | | | 79,395 | |
| | 1,800 | | | Trend Micro, Inc. (Software) | | | 103,618 | |
| | 5,500 | | | Tsumura & Co. (Pharmaceuticals) | | | 171,066 | |
| | 2,300 | | | Tsuruha Holdings, Inc. (Food & Staples Retailing) | | | 240,051 | |
| | 4,400 | | | Ulvac, Inc. (Semiconductors & Semiconductor Equipment) | | | 143,296 | |
| | 47 | | | United Urban Investment Corp. (Equity Real Estate Investment Trusts (REITs)) | | | 71,452 | |
| | 900 | | | West Japan Railway Co. (Road & Rail) | | | 60,532 | |
| | 400 | | | Yakult Honsha Co. Ltd. (Food Products) | | | 28,325 | |
| | 21,600 | | | Yamada Denki Co. Ltd. (Specialty Retail) | | | 101,852 | |
| | 2,300 | | | Yamaha Corp. (Leisure Products) | | | 101,072 | |
| | 4,200 | | | Yamaha Motor Co. Ltd. (Automobiles) | | | 99,329 | |
| | 2,000 | | | Yamazaki Baking Co. Ltd. (Food Products) | | | 36,050 | |
| | 900 | | | Yaskawa Electric Corp. (Electronic Equipment, Instruments & Components) | | | 26,013 | |
| | 6,100 | | | Yokogawa Bridge Holdings Corp. (Construction & Engineering) | | | 98,959 | |
| | 2,900 | | | Yokogawa Electric Corp. (Electronic Equipment, Instruments & Components) | | | 56,939 | |
| | 6,600 | | | Zenkoku Hosho Co. Ltd. (Diversified Financial Services) | | | 239,279 | |
| | 10,700 | | | Zeon Corp. (Chemicals) | | | 103,339 | |
| | | | | | | | |
| | | | | | | 39,162,555 | |
| | |
| Common Stocks – (continued) | |
| Liberia – 0.1% | |
| | 4,234 | | | Royal Caribbean Cruises Ltd. (Hotels, Restaurants & Leisure) | | | 443,427 | |
| | |
| Luxembourg – 0.2% | |
| | 3,256 | | | ADO Properties SA(a) (Real Estate Management & Development) | | | 192,044 | |
| | 4,554 | | | ArcelorMittal (Metals & Mining) | | | 113,636 | |
| | 70,544 | | | B&M European Value Retail SA (Multiline Retail) | | | 375,382 | |
| | 5,474 | | | Subsea 7 SA (Energy Equipment & Services) | | | 68,706 | |
| | 8,262 | | | Tenaris SA (Energy Equipment & Services) | | | 121,622 | |
| | 4,320 | | | Trinseo SA (Chemicals) | | | 232,761 | |
| | | | | | | | |
| | | | | | | 1,104,151 | |
| | |
| Malaysia – 0.2% | |
| | 44,200 | | | AirAsia Group Bhd (Airlines) | | | 27,771 | |
| | 14,454 | | | Axiata Group Bhd (Wireless Telecommunication Services) | | | 11,788 | |
| | 32,390 | | | CIMB Group Holdings Bhd (Banks) | | | 44,319 | |
| | 28,900 | | | DiGi.Com Bhd (Wireless Telecommunication Services) | | | 29,778 | |
| | 29,300 | | | Gamuda Bhd (Construction & Engineering) | | | 16,763 | |
| | 153,380 | | | Genting Bhd (Hotels, Restaurants & Leisure) | | | 269,172 | |
| | 85,280 | | | Hartalega Holdings Bhd (Health Care Equipment & Supplies) | | | 127,590 | |
| | 15,500 | | | Hong Leong Bank Bhd (Banks) | | | 76,755 | |
| | 3,400 | | | IHH Healthcare Bhd (Health Care Providers & Services) | | | 4,064 | |
| | 47,400 | | | IJM Corp. Bhd (Construction & Engineering) | | | 18,478 | |
| | 17,900 | | | IOI Corp. Bhd (Food Products) | | | 19,253 | |
| | 5,800 | | | Kuala Lumpur Kepong Bhd (Food Products) | | | 34,538 | |
| | 13,598 | | | Malayan Banking Bhd (Banks) | | | 30,864 | |
| | 46,055 | | | Malaysia Airports Holdings Bhd (Transportation Infrastructure) | | | 91,543 | |
| | 24,700 | | | Maxis Bhd (Wireless Telecommunication Services) | | | 30,883 | |
| | 22,100 | | | MISC Bhd (Marine) | | | 32,174 | |
| | 1,300 | | | Nestle Malaysia Bhd (Food Products) | | | 44,674 | |
| | 11,900 | | | Petronas Chemicals Group Bhd (Chemicals) | | | 26,608 | |
| | 4,300 | | | Petronas Dagangan Bhd (Oil, Gas & Consumable Fuels) | | | 26,762 | |
| | 4,500 | | | Petronas Gas Bhd (Gas Utilities) | | | 19,684 | |
| | 12,720 | | | PPB Group Bhd (Food Products) | | | 50,970 | |
| | 8,100 | | | Public Bank Bhd (Banks) | | | 47,648 | |
| | 24,800 | | | RHB Bank Bhd (Banks) | | | 31,026 | |
| | 227,172 | | | Sime Darby Bhd (Industrial Conglomerates) | | | 119,496 | |
| | 24,000 | | | Sime Darby Plantation Bhd (Food Products) | | | 30,206 | |
| | |
| | |
| The accompanying notes are an integral part of these financial statements. | | 39 |
GOLDMAN SACHS MULTI-MANAGER GLOBAL EQUITY FUND
Schedule of Investments (continued)
October 31, 2018
| | | | | | | | |
| Shares | | | Description | |
Value | |
| Common Stocks – (continued) | |
| Malaysia – (continued) | |
| | 24,000 | | | Telekom Malaysia Bhd (Diversified Telecommunication Services) | | $ | 13,660 | |
| | 25,100 | | | Tenaga Nasional Berhad (Electric Utilities) | | | 88,230 | |
| | 30,400 | | | Top Glove Corp. BHD (Health Care Equipment & Supplies) | | | 43,224 | |
| | 116,382 | | | YTL Corp. Bhd (Multi-Utilities) | | | 29,534 | |
| | | | | | | | |
| | | | | | | 1,437,455 | |
| | |
| Mexico – 0.8% | |
| | 14,000 | | | Alsea SAB de CV (Hotels, Restaurants & Leisure) | | | 35,797 | |
| | 26,778 | | | America Movil SAB de CV ADR Class L (Wireless Telecommunication Services) | | | 385,335 | |
| | 595,578 | | | America Movil SAB de CV Class L (Wireless Telecommunication Services) | | | 431,293 | |
| | 8,200 | | | Arca Continental SAB de CV (Beverages) | | | 41,236 | |
| | 16,500 | | | Banco del Bajio SA(a) (Banks) | | | 32,434 | |
| | 113,185 | | | Banco Santander Mexico SA Institucion de Banca Multiple Grupo Financiero Santand Class B (Banks) | | | 141,138 | |
| | 724,789 | | | Cemex SAB de CV* (Construction Materials) | | | 361,801 | |
| | 26,717 | | | Fibra Uno Administracion SA de CV (Equity Real Estate Investment Trusts (REITs)) | | | 28,712 | |
| | 23,300 | | | Fomento Economico Mexicano SAB de CV (Beverages) | | | 198,081 | |
| | 2,760 | | | Gruma SAB de CV Class B (Food Products) | | | 28,805 | |
| | 65,200 | | | Grupo Bimbo SAB de CV Series A (Food Products) | | | 122,130 | |
| | 152,084 | | | Grupo Financiero Banorte SAB de CV Class O (Banks) | | | 836,740 | |
| | 7,700 | | | Grupo Mexico SAB de CV Series B (Metals & Mining) | | | 17,767 | |
| | 19,832 | | | Grupo Televisa SAB ADR (Media) | | | 285,184 | |
| | 7,600 | | | Infraestructura Energetica Nova SAB de CV (Gas Utilities) | | | 29,793 | |
| | 4,600 | | | Megacable Holdings SAB de CV (Media) | | | 20,397 | |
| | 36,500 | | | Mexichem SAB de CV (Chemicals) | | | 96,419 | |
| | 783,643 | | | Wal-Mart de Mexico SAB de CV (Food & Staples Retailing) | | | 2,001,423 | |
| | | | | | | | |
| | | | | | | 5,094,485 | |
| | |
| Netherlands – 1.2% | |
| | 9,297 | | | Aalberts Industries NV (Machinery) | | | 340,810 | |
| | 7,748 | | | ABN AMRO Group NV(a) (Banks) | | | 190,040 | |
| | 28,296 | | | Aegon NV (Insurance) | | | 173,529 | |
| | 7,251 | | | Airbus SE* | | | 800,462 | |
| | 20,998 | | | Akzo Nobel NV (Chemicals) | | | 1,763,097 | |
| | 16,278 | | | ASR Nederland NV (Insurance) | | | 738,976 | |
| | 9,198 | | | Core Laboratories NV (Energy Equipment & Services) | | | 784,038 | |
| | |
| Common Stocks – (continued) | |
| Netherlands – (continued) | |
| | 4,669 | | | Euronext NV(a) (Capital Markets) | | | 287,295 | |
| | 2,021 | | | EXOR NV (Diversified Financial Services) | | | 114,298 | |
| | 435 | | | Ferrari NV (Automobiles) | | | 50,939 | |
| | 6,538 | | | Fiat Chrysler Automobiles NV* (Automobiles) | | | 99,498 | |
| | 1,782 | | | Gemalto NV* (Software) | | | 101,646 | |
| | 506 | | | Heineken NV (Beverages) | | | 45,524 | |
| | 36,026 | | | ING Groep NV (Banks) | | | 426,223 | |
| | 10,964 | | | Koninklijke Ahold Delhaize NV (Food & Staples Retailing) | | | 250,972 | |
| | 1,257 | | | Koninklijke DSM NV (Chemicals) | | | 109,747 | |
| | 12,527 | | | Koninklijke KPN NV (Diversified Telecommunication Services) | | | 33,053 | |
| | 3,222 | | | Koninklijke Philips NV (Health Care Equipment & Supplies) | | | 120,167 | |
| | 6,124 | | | NN Group NV (Insurance) | | | 262,953 | |
| | 728 | | | Randstad NV (Professional Services) | | | 36,628 | |
| | 4,367 | | | Rhi Magnesita NV (Construction Materials) | | | 211,443 | |
| | 9,346 | | | Signify NV(a) (Electrical Equipment) | | | 230,234 | |
| | 2,782 | | | STMicroelectronics NV (Semiconductors & Semiconductor Equipment) | | | 42,290 | |
| | 2,400 | | | Wolters Kluwer NV (Professional Services) | | | 136,163 | |
| | 19,588 | | | Wright Medical Group NV* (Health Care Equipment & Supplies) | | | 528,484 | |
| | | | | | | | |
| | | | | | | 7,878,509 | |
| | |
| New Zealand – 0.1% | |
| | 32,730 | | | Contact Energy Ltd. (Electric Utilities) | | | 119,671 | |
| | 12,387 | | | Fisher & Paykel Healthcare Corp. Ltd. (Health Care Equipment & Supplies) | | | 110,187 | |
| | 18,700 | | | Fletcher Building Ltd.* (Construction Materials) | | | 74,069 | |
| | 16,998 | | | Meridian Energy Ltd. (Independent Power and Renewable Electricity Producers) | | | 34,870 | |
| | 139,437 | | | Spark New Zealand Ltd. (Diversified Telecommunication Services) | | | 360,112 | |
| | 1,151 | | | Xero Ltd.* (Software) | | | 32,629 | |
| | | | | | | | |
| | | | | | | 731,538 | |
| | |
| Norway – 0.2% | |
| | 6,824 | | | DNB ASA (Banks) | | | 123,285 | |
| | 8,997 | | | Entra ASA(a) (Real Estate Management & Development) | | | 121,742 | |
| | 7,696 | | | Equinor ASA (Oil, Gas & Consumable Fuels) | | | 199,067 | |
| | 10,485 | | | Marine Harvest ASA (Food Products) | | | 253,845 | |
| | 29,379 | | | Norsk Hydro ASA (Metals & Mining) | | | 152,353 | |
| | 17,246 | | | Orkla ASA (Food Products) | | | 148,821 | |
| | 2,809 | | | Telenor ASA (Diversified Telecommunication Services) | | | 51,504 | |
| | 2,798 | | | Yara International ASA (Chemicals) | | | 120,155 | |
| | | | | | | | |
| | | | | | | 1,170,772 | |
| | |
| | |
| 40 | | The accompanying notes are an integral part of these financial statements. |
GOLDMAN SACHS MULTI-MANAGER GLOBAL EQUITY FUND
| | | | | | | | |
| Shares | | | Description | |
Value | |
| Common Stocks – (continued) | |
| Panama – 0.0% | |
| | 4,240 | | | Carnival Corp. (Hotels, Restaurants & Leisure) | | $ | 237,610 | |
| | |
| Peru – 0.1% | |
| | 6,102 | | | Cia de Minas Buenaventura SAA ADR (Metals & Mining) | | | 84,452 | |
| | 1,650 | | | Credicorp Ltd. (Banks) | | | 372,421 | |
| | | | | | | | |
| | | | | | | 456,873 | |
| | |
| Philippines – 0.1% | |
| | 995 | | | Ayala Corp. (Diversified Financial Services) | | | 17,129 | |
| | 138,300 | | | Ayala Land, Inc. (Real Estate Management & Development) | | | 102,619 | |
| | 6,616 | | | BDO Unibank, Inc. (Banks) | | | 15,155 | |
| | 962 | | | GT Capital Holdings, Inc. (Diversified Financial Services) | | | 13,664 | |
| | 12,180 | | | Jollibee Foods Corp. (Hotels, Restaurants & Leisure) | | | 62,899 | |
| | 7,760 | | | Manila Electric Co. (Electric Utilities) | | | 53,414 | |
| | 180,900 | | | Metro Pacific Investments Corp. (Diversified Financial Services) | | | 16,250 | |
| | 11,684 | | | Metropolitan Bank & Trust Co. (Banks) | | | 14,334 | |
| | 1,400 | | | PLDT, Inc. (Wireless Telecommunication Services) | | | 36,130 | |
| | 9,010 | | | SM Investments Corp. (Industrial Conglomerates) | | | 151,888 | |
| | 159,500 | | | SM Prime Holdings, Inc. (Real Estate Management & Development) | | | 100,840 | |
| | 6,190 | | | Universal Robina Corp. (Food Products) | | | 15,057 | |
| | | | | | | | |
| | | | | | | 599,379 | |
| | |
| Poland – 0.4% | |
| | 8,949 | | | Bank Millennium SA* (Banks) | | | 20,601 | |
| | 8,726 | | | Bank Polska Kasa Opieki SA (Banks) | | | 237,891 | |
| | 249 | | | CCC SA (Textiles, Apparel & Luxury Goods) | | | 10,830 | |
| | 593 | | | CD Projekt SA* (Entertainment) | | | 24,412 | |
| | 4,231 | | | Cyfrowy Polsat SA* (Media) | | | 24,329 | |
| | 4,753 | | | Grupa Lotos SA (Oil, Gas & Consumable Fuels) | | | 85,702 | |
| | 6,811 | | | Jastrzebska Spolka Weglowa SA* (Metals & Mining) | | | 130,941 | |
| | 226 | | | KGHM Polska Miedz SA* (Metals & Mining) | | | 5,109 | |
| | 11 | | | LPP SA (Textiles, Apparel & Luxury Goods) | | | 22,489 | |
| | 238 | | | mBank SA (Banks) | | | 23,145 | |
| | 11,610 | | | PGE Polska Grupa Energetyczna SA* (Electric Utilities) | | | 31,768 | |
| | 9,342 | | | Polski Koncern Naftowy ORLEN SA (Oil, Gas & Consumable Fuels) | | | 224,651 | |
| | 17,286 | | | Polskie Gornictwo Naftowe i Gazownictwo SA* (Oil, Gas & Consumable Fuels) | | | 28,198 | |
| | 63,732 | | | Powszechna Kasa Oszczednosci Bank Polski SA (Banks) | | | 661,883 | |
| | |
| Common Stocks – (continued) | |
| Poland – (continued) | |
| | 62,470 | | | Powszechny Zaklad Ubezpieczen SA (Insurance) | | | 636,630 | |
| | 3,334 | | | Santander Bank Polska SA (Banks) | | | 295,413 | |
| | | | | | | | |
| | | | | | | 2,463,992 | |
| | |
| Portugal – 0.0% | |
| | 31,663 | | | EDP – Energias de Portugal SA (Electric Utilities) | | | 111,319 | |
| | 8,826 | | | Galp Energia SGPS SA (Oil, Gas & Consumable Fuels) | | | 153,469 | |
| | 2,956 | | | Jeronimo Martins SGPS SA (Food & Staples Retailing) | | | 36,282 | |
| | | | | | | | |
| | | | | | | 301,070 | |
| | |
| Russia – 0.2% | |
| | 7,368 | | | Aeroflot PJSC* (Airlines) | | | 10,879 | |
| | 23,000 | | | Gazprom PJSC (Oil, Gas & Consumable Fuels) | | | 54,186 | |
| | 44,549 | | | Gazprom PJSC ADR (Oil, Gas & Consumable Fuels) | | | 209,380 | |
| | 659,058 | | | Inter Rao Ues PJSC* (Electric Utilities) | | | 39,875 | |
| | 629 | | | Lukoil PJSC (Oil, Gas & Consumable Fuels) | | | 47,156 | |
| | 5,578 | | | Lukoil PJSC ADR (Oil, Gas & Consumable Fuels) | | | 416,342 | |
| | 867 | | | Mail.Ru Group Ltd. GDR* (Interactive Media & Services) | | | 23,097 | |
| | 146 | | | MMC Norilsk Nickel PJSC (Metals & Mining) | | | 24,393 | |
| | 1,599 | | | Mobile Telesystems PJSC ADR (Wireless Telecommunication Services) | | | 12,808 | |
| | 4,734 | | | Novolipetsk Steel PJSC GDR (Metals & Mining) | | | 114,373 | |
| | 1,465 | | | PhosAgro PJSC GDR (Chemicals) | | | 19,191 | |
| | 6,730 | | | Rosneft Oil Co. PJSC (Oil, Gas & Consumable Fuels) | | | 46,932 | |
| | 2,599,426 | | | RusHydro PJSC* (Electric Utilities) | | | 21,695 | |
| | 9,270 | | | Sberbank of Russia PJSC (Banks) | | | 26,645 | |
| | 1,384 | | | Sberbank of Russia PJSC ADR (Banks) | | | 16,179 | |
| | 2,547 | | | Severstal PJSC (Metals & Mining) | | | 39,796 | |
| | 9,600 | | | Surgutneftegas PJSC (Oil, Gas & Consumable Fuels) | | | 3,861 | |
| | 7,422 | | | Surgutneftegas PJSC ADR (Oil, Gas & Consumable Fuels) | | | 29,539 | |
| | 2,550 | | | Tatneft PJSC (Oil, Gas & Consumable Fuels) | | | 30,151 | |
| | 2,256 | | | Uralkali PJSC GDR* (Chemicals) | | | 14,436 | |
| | 27,347,553 | | | VTB Bank PJSC (Banks) | | | 15,205 | |
| | | | | | | | |
| | | | | | | 1,216,119 | |
| | |
| | |
| The accompanying notes are an integral part of these financial statements. | | 41 |
GOLDMAN SACHS MULTI-MANAGER GLOBAL EQUITY FUND
Schedule of Investments (continued)
October 31, 2018
| | | | | | | | |
| Shares | | | Description | |
Value | |
| Common Stocks – (continued) | |
| Singapore – 0.4% | |
| | 40,800 | | | Ascendas Real Estate Investment Trust (Equity Real Estate Investment Trusts (REITs)) | | $ | 74,292 | |
| | 84,588 | | | CapitaLand Commercial Trust (Equity Real Estate Investment Trusts (REITs)) | | | 105,697 | |
| | 28,200 | | | CapitaLand Ltd. (Real Estate Management & Development) | | | 64,056 | |
| | 95,900 | | | CapitaLand Mall Trust (Equity Real Estate Investment Trusts (REITs)) | | | 146,066 | |
| | 7,500 | | | City Developments Ltd. (Real Estate Management & Development) | | | 42,862 | |
| | 226,100 | | | ComfortDelGro Corp. Ltd. (Road & Rail) | | | 368,150 | |
| | 4,836 | | | DBS Group Holdings Ltd. (Banks) | | | 82,054 | |
| | 120,200 | | | Genting Singapore Ltd. (Hotels, Restaurants & Leisure) | | | 76,491 | |
| | 158,222 | | | IGG, Inc. (Entertainment) | | | 167,732 | |
| | 15,200 | | | Keppel Corp. Ltd. (Industrial Conglomerates) | | | 68,103 | |
| | 306,921 | | | Mapletree Commercial Trust (Equity Real Estate Investment Trusts (REITs)) | | | 356,882 | |
| | 232,200 | | | Mapletree North Asia Commercial Trust (Equity Real Estate Investment Trusts (REITs)) | | | 189,676 | |
| | 6,730 | | | Oversea-Chinese Banking Corp. Ltd. (Banks) | | | 52,282 | |
| | 28,000 | | | SATS Ltd. (Transportation Infrastructure) | | | 100,771 | |
| | 14,300 | | | Singapore Airlines Ltd. (Airlines) | | | 98,028 | |
| | 14,300 | | | Singapore Exchange Ltd. (Capital Markets) | | | 70,739 | |
| | 1,900 | | | Singapore Press Holdings Ltd. (Media) | | | 3,641 | |
| | 18,000 | | | Singapore Technologies Engineering Ltd. (Aerospace & Defense) | | | 46,190 | |
| | 79,000 | | | Suntec Real Estate Investment Trust (Equity Real Estate Investment Trusts (REITs)) | | | 101,104 | |
| | 3,569 | | | United Overseas Bank Ltd. (Banks) | | | 63,102 | |
| | 59,341 | | | UOL Group Ltd. (Real Estate Management & Development) | | | 258,468 | |
| | 11,700 | | | Venture Corp. Ltd. (Electronic Equipment, Instruments & Components) | | | 129,521 | |
| | 41,800 | | | Wilmar International Ltd. (Food Products) | | | 95,484 | |
| | | | | | | | |
| | | | | | | 2,761,391 | |
| | |
| South Africa – 0.7% | |
| | 3,124 | | | Absa Group Ltd. (Banks) | | | 31,566 | |
| | 262 | | | Anglo American Platinum Ltd. (Metals & Mining) | | | 8,530 | |
| | 15,030 | | | Aspen Pharmacare Holdings Ltd. (Pharmaceuticals) | | | 158,942 | |
| | 3,574 | | | AVI Ltd. (Food Products) | | | 24,226 | |
| | 10,664 | | | Barloworld Ltd. (Trading Companies & Distributors) | | | 86,921 | |
| | 3,173 | | | Bid Corp. Ltd. (Food & Staples Retailing) | | | 59,411 | |
| | |
| Common Stocks – (continued) | |
| South Africa – (continued) | |
| | 11,660 | | | Clicks Group Ltd. (Food & Staples Retailing) | | | 148,590 | |
| | 30,870 | | | Exxaro Resources Ltd. (Oil, Gas & Consumable Fuels) | | | 315,734 | |
| | 27,444 | | | FirstRand Ltd. (Diversified Financial Services) | | | 119,866 | |
| | 34,585 | | | Fortress REIT Ltd. Class A (Equity Real Estate Investment Trusts (REITs)) | | | 39,679 | |
| | 7,899 | | | Gold Fields Ltd. (Metals & Mining) | | | 20,883 | |
| | 66,166 | | | Growthpoint Properties Ltd. (Equity Real Estate Investment Trusts (REITs)) | | | 101,587 | |
| | 3,948 | | | Hyprop Investments Ltd. (Equity Real Estate Investment Trusts (REITs)) | | | 24,158 | |
| | 391 | | | Imperial Holdings Ltd. (Distributors) | | | 4,338 | |
| | 4,341 | | | Investec Ltd. (Capital Markets) | | | 27,004 | |
| | 7,028 | | | Kumba Iron Ore Ltd. (Metals & Mining) | | | 137,796 | |
| | 1,469 | | | Liberty Holdings Ltd. (Insurance) | | | 10,753 | |
| | 1,761 | | | Massmart Holdings Ltd. (Food & Staples Retailing) | | | 11,464 | |
| | 11,708 | | | MMI Holdings Ltd.* (Insurance) | | | 14,166 | |
| | 17,045 | | | Mondi Ltd. (Paper & Forest Products) | | | 407,948 | |
| | 913 | | | Mr Price Group Ltd. (Specialty Retail) | | | 14,295 | |
| | 26,572 | | | MTN Group Ltd. (Wireless Telecommunication Services) | | | 154,302 | |
| | 8,669 | | | Naspers Ltd. (Media) | | | 1,520,550 | |
| | 9,612 | | | Nedbank Group Ltd. (Banks) | | | 162,492 | |
| | 13,983 | | | Netcare Ltd. (Health Care Providers & Services) | | | 23,470 | |
| | 270,121 | | | Old Mutual Ltd. (Insurance) | | | 407,239 | |
| | 4,641 | | | Pick n Pay Stores Ltd. (Food & Staples Retailing) | | | 21,433 | |
| | 1,550 | | | Pioneer Foods Group Ltd. (Food Products) | | | 8,508 | |
| | 1,740 | | | Rand Merchant Investment Holdings Ltd. (Insurance) | | | 4,043 | |
| | 40,863 | | | Redefine Properties Ltd. (Equity Real Estate Investment Trusts (REITs)) | | | 26,563 | |
| | 1,756 | | | Remgro Ltd. (Diversified Financial Services) | | | 22,638 | |
| | 10,333 | | | RMB Holdings Ltd. (Diversified Financial Services) | | | 52,191 | |
| | 21,563 | | | Sappi Ltd. (Paper & Forest Products) | | | 121,153 | |
| | 755 | | | Sasol Ltd. (Chemicals) | | | 24,673 | |
| | 2,084 | | | Shoprite Holdings Ltd. (Food & Staples Retailing) | | | 25,442 | |
| | 10,121 | | | Standard Bank Group Ltd. (Banks) | | | 112,133 | |
| | 50,757 | | | Telkom SA SOC Ltd. (Diversified Telecommunication Services) | | | 184,587 | |
| | 1,370 | | | The Bidvest Group Ltd. (Industrial Conglomerates) | | | 17,097 | |
| | 434 | | | The Foschini Group Ltd. (Specialty Retail) | | | 4,751 | |
| | 520 | | | The SPAR Group Ltd. (Food & Staples Retailing) | | | 6,198 | |
| | 2,036 | | | Truworths International Ltd. (Specialty Retail) | | | 11,153 | |
| | 3,232 | | | Woolworths Holdings Ltd. (Multiline Retail) | | | 11,162 | |
| | | | | | | | |
| | | | | | | 4,689,635 | |
| | |
| | |
| 42 | | The accompanying notes are an integral part of these financial statements. |
GOLDMAN SACHS MULTI-MANAGER GLOBAL EQUITY FUND
| | | | | | | | |
| Shares | | | Description | |
Value | |
| Common Stocks – (continued) | |
| South Korea – 2.8% | |
| | 9,199 | | | Asiana Airlines, Inc.* (Airlines) | | $ | 29,549 | |
| | 14,396 | | | BS Financial Group, Inc. (Banks) | | | 96,154 | |
| | 1,766 | | | Celltrion, Inc.* (Biotechnology) | | | 337,864 | |
| | 163 | | | CJ CheilJedang Corp. (Food Products) | | | 46,496 | |
| | 258 | | | CJ Corp. (Industrial Conglomerates) | | | 24,809 | |
| | 1,526 | | | Daelim Industrial Co. Ltd. (Construction & Engineering) | | | 102,162 | |
| | 800 | | | DB Insurance Co. Ltd. (Insurance) | | | 50,406 | |
| | 3,290 | | | DGB Financial Group, Inc. (Banks) | | | 27,212 | |
| | 1,665 | | | Doosan Infracore Co. Ltd.* (Machinery) | | | 11,320 | |
| | 221 | | | E-MART, Inc. (Food & Staples Retailing) | | | 39,757 | |
| | 7,123 | | | Fila Korea Ltd. (Textiles, Apparel & Luxury Goods) | | | 263,797 | |
| | 757 | | | GS Engineering & Construction Corp. (Construction & Engineering) | | | 27,914 | |
| | 601 | | | GS Holdings Corp. (Oil, Gas & Consumable Fuels) | | | 25,650 | |
| | 7,463 | | | Hana Financial Group, Inc. (Banks) | | | 251,396 | |
| | 861 | | | Hankook Tire Co. Ltd. (Auto Components) | | | 31,280 | |
| | 120 | | | Hanmi Pharm Co. Ltd. (Pharmaceuticals) | | | 41,180 | |
| | 764 | | | Hanwha Chemical Corp. (Chemicals) | | | 10,880 | |
| | 3,405 | | | Hanwha Corp. (Industrial Conglomerates) | | | 84,335 | |
| | 7,022 | | | Hanwha Life Insurance Co. Ltd. (Insurance) | | | 27,690 | |
| | 355 | | | Himart Co. Ltd. (Specialty Retail) | | | 17,532 | |
| | 2,048 | | | Hotel Shilla Co. Ltd. (Specialty Retail) | | | 129,072 | |
| | 359 | | | Hyundai Department Store Co. Ltd. (Multiline Retail) | | | 27,461 | |
| | 421 | | | Hyundai Engineering & Construction Co. Ltd. (Construction & Engineering) | | | 17,014 | |
| | 145 | | | Hyundai Glovis Co. Ltd. (Air Freight & Logistics) | | | 14,560 | |
| | 46 | | | Hyundai Heavy Industries Holdings Co. Ltd.* (Machinery) | | | 14,455 | |
| | 985 | | | Hyundai Marine & Fire Insurance Co. Ltd. (Insurance) | | | 36,240 | |
| | 161 | | | Hyundai Mobis Co. Ltd. (Auto Components) | | | 26,894 | |
| | 322 | | | Hyundai Motor Co. (Automobiles) | | | 30,159 | |
| | 375 | | | Hyundai Steel Co. (Metals & Mining) | | | 13,761 | |
| | 25,231 | | | Industrial Bank of Korea (Banks) | | | 329,479 | |
| | 970 | | | Kakao Corp. (Interactive Media & Services) | | | 78,409 | |
| | 630 | | | Kangwon Land, Inc. (Hotels, Restaurants & Leisure) | | | 15,953 | |
| | 12,838 | | | KB Financial Group, Inc. (Banks) | | | 534,628 | |
| | 3,511 | | | KB Financial Group, Inc. ADR (Banks) | | | 145,882 | |
| | 80 | | | KCC Corp. (Building Products) | | | 17,397 | |
| | 10,702 | | | Kia Motors Corp. (Automobiles) | | | 267,504 | |
| | 1,201 | | | Korea Electric Power Corp. (Electric Utilities) | | | 28,688 | |
| | 6,612 | | | Korea Gas Corp.* (Gas Utilities) | | | 303,320 | |
| | 332 | | | Korea Investment Holdings Co. Ltd. (Capital Markets) | | | 17,362 | |
| | |
| Common Stocks – (continued) | |
| South Korea – (continued) | |
| | 140 | | | Korea Zinc Co. Ltd. (Metals & Mining) | | | 46,693 | |
| | 925 | | | Korean Air Lines Co. Ltd. (Airlines) | | | 22,392 | |
| | 12,055 | | | KT Corp. ADR (Diversified Telecommunication Services) | | | 166,841 | |
| | 197 | | | KT&G Corp. (Tobacco) | | | 17,567 | |
| | 593 | | | Kumho Petrochemical Co. Ltd. (Chemicals) | | | 45,049 | |
| | 1,630 | | | LG Chem Ltd. (Chemicals) | | | 498,088 | |
| | 1,543 | | | LG Corp. (Industrial Conglomerates) | | | 89,899 | |
| | 1,129 | | | LG Display Co. Ltd. (Electronic Equipment, Instruments & Components) | | | 16,474 | |
| | 605 | | | LG Electronics, Inc. (Household Durables) | | | 33,822 | |
| | 222 | | | LG Household & Health Care Ltd. (Personal Products) | | | 204,152 | |
| | 6,757 | | | LG Uplus Corp. (Diversified Telecommunication Services) | | | 96,032 | |
| | 195 | | | Lotte Chemical Corp. (Chemicals) | | | 45,053 | |
| | 102 | | | Lotte Food Co. Ltd. (Food Products) | | | 58,718 | |
| | 205 | | | Lotte Shopping Co. Ltd. (Multiline Retail) | | | 34,998 | |
| | 384 | | | LS Corp. (Electrical Equipment) | | | 17,082 | |
| | 230 | | | Medy-Tox, Inc. (Biotechnology) | | | 94,224 | |
| | 5,800 | | | NAVER Corp. (Interactive Media & Services) | | | 584,085 | |
| | 1,433 | | | NH Investment & Securities Co. Ltd. (Capital Markets) | | | 15,383 | |
| | 362 | | | OCI Co. Ltd. (Chemicals) | | | 27,197 | |
| | 162 | | | Orion Corp. (Food Products) | | | 13,562 | |
| | 2,336 | | | POSCO (Metals & Mining) | | | 534,694 | |
| | 405 | | | S-1 Corp. (Commercial Services & Supplies) | | | 34,296 | |
| | 271 | | | S-Oil Corp. (Oil, Gas & Consumable Fuels) | | | 29,572 | |
| | 1,233 | | | Samsung Biologics Co. Ltd.*(a) (Life Sciences Tools & Services) | | | 422,030 | |
| | 163 | | | Samsung C&T Corp. (Industrial Conglomerates) | | | 15,600 | |
| | 711 | | | Samsung Electro-Mechanics Co. Ltd. (Electronic Equipment, Instruments & Components) | | | 74,217 | |
| | 68,093 | | | Samsung Electronics Co. Ltd. (Technology Hardware, Storage & Peripherals) | | | 2,549,115 | |
| | 2,538 | | | Samsung Electronics Co. Ltd. GDR | | | 2,369,622 | |
| | 221 | | | Samsung Fire & Marine Insurance Co. Ltd. (Insurance) | | | 54,011 | |
| | 342 | | | Samsung Life Insurance Co. Ltd. (Insurance) | | | 27,670 | |
| | 223 | | | Samsung SDI Co. Ltd. (Electronic Equipment, Instruments & Components) | | | 46,376 | |
| | 56 | | | Samsung SDS Co. Ltd. (IT Services) | | | 9,526 | |
| | 1,217 | | | Samsung Securities Co. Ltd. (Capital Markets) | | | 28,752 | |
| | 14,164 | | | Shinhan Financial Group Co. Ltd. (Banks) | | | 527,550 | |
| | |
| | |
| The accompanying notes are an integral part of these financial statements. | | 43 |
GOLDMAN SACHS MULTI-MANAGER GLOBAL EQUITY FUND
Schedule of Investments (continued)
October 31, 2018
| | | | | | | | |
| Shares | | | Description | |
Value | |
| Common Stocks – (continued) | |
| South Korea – (continued) | |
| | 3,361 | | | Shinhan Financial Group Co. Ltd. ADR (Banks) | | $ | 124,391 | |
| | 800 | | | Shinsegae International, Inc. (Specialty Retail) | | | 103,887 | |
| | 418 | | | Shinsegae, Inc. (Multiline Retail) | | | 95,438 | |
| | 145 | | | SK Holdings Co. Ltd. (Industrial Conglomerates) | | | 33,387 | |
| | 27,915 | | | SK Hynix, Inc. (Semiconductors & Semiconductor Equipment) | | | 1,681,191 | |
| | 3,618 | | | SK Innovation Co. Ltd. (Oil, Gas & Consumable Fuels) | | | 678,990 | |
| | 1,923 | | | SK Telecom Co. Ltd. (Wireless Telecommunication Services) | | | 451,829 | |
| | 59,312 | | | SK Telecom Co. Ltd. ADR (Wireless Telecommunication Services) | | | 1,536,774 | |
| | 26,710 | | | Woori Bank (Banks) | | | 370,093 | |
| | 107 | | | Yuhan Corp. (Pharmaceuticals) | | | 15,776 | |
| | | | | | | | |
| | | | | | | 17,537,719 | |
| | |
| Spain – 0.6% | |
| | 827 | | | ACS Actividades de Construccion y Servicios SA (Construction & Engineering) | | | 30,964 | |
| | 623 | | | Aena SME SA(a) (Transportation Infrastructure) | | | 99,544 | |
| | 12,593 | | | Amadeus IT Group SA (IT Services) | | | 1,014,046 | |
| | 4,741 | | | Banco Bilbao Vizcaya Argentaria SA (Banks) | | | 26,166 | |
| | 5,792 | | | Bankinter SA (Banks) | | | 47,454 | |
| | 165,382 | | | CaixaBank SA (Banks) | | | 669,253 | |
| | 1,810 | | | Enagas SA (Oil, Gas & Consumable Fuels) | | | 47,989 | |
| | 29,867 | | | Ence Energia y Celulosa SA (Paper & Forest Products) | | | 250,878 | |
| | 2,029 | | | Endesa SA (Electric Utilities) | | | 42,425 | |
| | 5,465 | | | Ferrovial SA (Construction & Engineering) | | | 109,415 | |
| | 8,841 | | | Iberdrola SA (Electric Utilities) | | | 62,557 | |
| | 14,411 | | | Industria de Diseno Textil SA (Specialty Retail) | | | 406,170 | |
| | 20,104 | | | Inmobiliaria Colonial Socimi SA (Equity Real Estate Investment Trusts (REITs)) | | | 201,855 | |
| | 23,177 | | | International Consolidated Airlines Group SA (Airlines) | | | 178,683 | |
| | 28,699 | | | Merlin Properties Socimi SA (Equity Real Estate Investment Trusts (REITs)) | | | 359,601 | |
| | 4,820 | | | Naturgy Energy Group SA (Gas Utilities) | | | 118,464 | |
| | 8,116 | | | Repsol SA (Oil, Gas & Consumable Fuels) | | | 145,023 | |
| | 4,655 | | | Telefonica SA (Diversified Telecommunication Services) | | | 38,185 | |
| | | | | | | | |
| | | | | | | 3,848,672 | |
| | |
| Common Stocks – (continued) | |
| Sweden – 0.8% | |
| | 2,943 | | | Alfa Laval AB (Machinery) | | | 75,091 | |
| | 30,337 | | | Atlas Copco AB Class A (Machinery) | | | 749,984 | |
| | 7,050 | | | Boliden AB (Metals & Mining) | | | 160,999 | |
| | 32,126 | | | Castellum AB (Real Estate Management & Development) | | | 553,779 | |
| | 2,259 | | | Electrolux AB Series B (Household Durables) | | | 46,941 | |
| | 21,673 | | | Hemfosa Fastigheter AB (Real Estate Management & Development) | | | 267,755 | |
| | 24,310 | | | Hexagon AB Class B (Electronic Equipment, Instruments & Components) | | | 1,189,819 | |
| | 5,372 | | | Husqvarna AB Class B (Household Durables) | | | 40,534 | |
| | 2,661 | | | ICA Gruppen AB (Food & Staples Retailing) | | | 94,145 | |
| | 3,033 | | | Industrivarden AB Class C (Diversified Financial Services) | | | 62,999 | |
| | 1,516 | | | Investor AB Class B (Diversified Financial Services) | | | 65,683 | |
| | 4,487 | | | Kinnevik AB Class B (Diversified Financial Services) | | | 124,396 | |
| | 7,215 | | | Loomis AB Class B (Commercial Services & Supplies) | | | 223,085 | |
| | 13,565 | | | Mycronic AB (Electronic Equipment, Instruments & Components) | | | 170,143 | |
| | 3,581 | | | Sandvik AB (Machinery) | | | 56,611 | |
| | 2,359 | | | Securitas AB Class B (Commercial Services & Supplies) | | | 40,430 | |
| | 2,384 | | | SKF AB Class B (Machinery) | | | 38,221 | |
| | 6,795 | | | Svenska Cellulosa AB SCA Class B (Paper & Forest Products) | | | 64,236 | |
| | 3,693 | | | Swedbank AB Class A (Banks) | | | 83,072 | |
| | 3,895 | | | Swedish Match AB (Tobacco) | | | 198,406 | |
| | 11,113 | | | Tele2 AB Class B (Wireless Telecommunication Services) | | | 126,191 | |
| | 10,907 | | | Telefonaktiebolaget LM Ericsson Class B (Communications Equipment) | | | 94,965 | |
| | 25,393 | | | Telia Co. AB (Diversified Telecommunication Services) | | | 114,306 | |
| | 16,189 | | | Trelleborg AB Class B (Machinery) | | | 292,088 | |
| | | | | | | | |
| | | | | | | 4,933,879 | |
| | |
| Switzerland – 2.7% | |
| | 91,210 | | | ABB Ltd. (Electrical Equipment) | | | 1,835,286 | |
| | 761 | | | Adecco Group AG (Professional Services) | | | 37,266 | |
| | 16,736 | | | Aryzta AG* (Food Products) | | | 156,095 | |
| | 1,108 | | | Baloise Holding AG (Insurance) | | | 158,370 | |
| | 30 | | | Barry Callebaut AG (Food Products) | | | 58,637 | |
| | 833 | | | Bucher Industries AG (Machinery) | | | 229,733 | |
| | 1 | | | Chocoladefabriken Lindt & Spruengli AG (Food Products) | | | 79,829 | |
| | 12,971 | | | Chubb Ltd. (Insurance) | | | 1,620,208 | |
| | 17,243 | | | Cie Financiere Richemont SA (Textiles, Apparel & Luxury Goods) | | | 1,260,301 | |
| | 8,227 | | | Clariant AG* (Chemicals) | | | 177,316 | |
| | |
| | |
| 44 | | The accompanying notes are an integral part of these financial statements. |
GOLDMAN SACHS MULTI-MANAGER GLOBAL EQUITY FUND
| | | | | | | | |
| Shares | | | Description | |
Value | |
| Common Stocks – (continued) | |
| Switzerland – (continued) | |
| | 3,741 | | | Coca-Cola HBC AG* (Beverages) | | $ | 110,504 | |
| | 8,426 | | | Credit Suisse Group AG* (Capital Markets) | | | 110,159 | |
| | 744 | | | Dufry AG* (Specialty Retail) | | | 83,834 | |
| | 113 | | | EMS-Chemie Holding AG (Chemicals) | | | 62,260 | |
| | 1,329 | | | Ferguson PLC (Trading Companies & Distributors) | | | 89,601 | |
| | 78 | | | Geberit AG (Building Products) | | | 30,540 | |
| | 389 | | | Georg Fischer AG (Machinery) | | | 361,904 | |
| | 394 | | | Givaudan SA (Chemicals) | | | 955,023 | |
| | 28,138 | | | Glencore PLC* (Metals & Mining) | | | 114,512 | |
| | 284 | | | Helvetia Holding AG (Insurance) | | | 173,957 | |
| | 150 | | | Kuehne & Nagel International AG (Marine) | | | 20,848 | |
| | 798 | | | LafargeHolcim Ltd.* (Construction Materials) | | | 36,956 | |
| | 2,586 | | | Logitech International SA (Technology Hardware, Storage & Peripherals) | | | 95,745 | |
| | 18,333 | | | Nestle SA (Food Products) | | | 1,547,728 | |
| | 18,962 | | | Novartis AG (Pharmaceuticals) | | | 1,660,546 | |
| | 1,563 | | | Pargesa Holding SA (Diversified Financial Services) | | | 114,740 | |
| | 229 | | | Partners Group Holding AG (Capital Markets) | | | 163,038 | |
| | 1,200 | | | PSP Swiss Property AG (Real Estate Management & Development) | | | 115,784 | |
| | 5,330 | | | Roche Holding AG (Pharmaceuticals) | | | 1,297,122 | |
| | 160 | | | Schindler Holding AG (Machinery) | | | 33,738 | |
| | 20 | | | SGS SA (Professional Services) | | | 47,501 | |
| | 7,315 | | | Sika AG (Chemicals) | | | 937,947 | |
| | 716 | | | Sonova Holding AG (Health Care Equipment & Supplies) | | | 116,768 | |
| | 82 | | | Straumann Holding AG (Health Care Equipment & Supplies) | | | 55,974 | |
| | 493 | | | Swiss Life Holding AG* (Insurance) | | | 185,967 | |
| | 1,154 | | | Swiss Prime Site AG* (Real Estate Management & Development) | | | 93,639 | |
| | 19,647 | | | Swiss Re AG | | | 1,771,605 | |
| | 176 | | | Swisscom AG (Diversified Telecommunication Services) | | | 80,587 | |
| | 3,239 | | | TE Connectivity Ltd. (Electronic Equipment, Instruments & Components) | | | 244,285 | |
| | 1,357 | | | Temenos AG* (Software) | | | 186,502 | |
| | 350 | | | The Swatch Group AG (Textiles, Apparel & Luxury Goods) | | | 118,221 | |
| | 775 | | | Valora Holding AG* (Specialty Retail) | | | 193,878 | |
| | 3,635 | | | Wizz Air Holdings PLC*(a) (Airlines) | | | 119,224 | |
| | 280 | | | Zurich Insurance Group AG (Insurance) | | | 86,935 | |
| | | | | | | | |
| | | | | | | 17,030,613 | |
| | |
| Taiwan – 1.9% | |
| | 43,000 | | | Acer, Inc.* (Technology Hardware, Storage & Peripherals) | | | 30,257 | |
| | 4,000 | | | Advantech Co. Ltd. (Technology Hardware, Storage & Peripherals) | | | 27,600 | |
| | 36,000 | | | Airtac International Group (Machinery) | | | 310,580 | |
| | |
| Common Stocks – (continued) | |
| Taiwan – (continued) | |
| | 109,103 | | | ASE Technology Holding Co. Ltd. ADR* (Semiconductors & Semiconductor Equipment) | | | 417,865 | |
| | 259,384 | | | Asia Cement Corp. (Construction Materials) | | | 275,018 | |
| | 3,000 | | | Asustek Computer, Inc. (Technology Hardware, Storage & Peripherals) | | | 22,246 | |
| | 517,111 | | | AU Optronics Corp. (Electronic Equipment, Instruments & Components) | | | 202,038 | |
| | 19,182 | | | Catcher Technology Co. Ltd. (Technology Hardware, Storage & Peripherals) | | | 193,953 | |
| | 285,542 | | | Cathay Financial Holding Co. Ltd. (Insurance) | | | 453,347 | |
| | 37,209 | | | Chailease Holding Co. Ltd. (Diversified Financial Services) | | | 106,721 | |
| | 80,080 | | | Chang Hwa Commercial Bank Ltd. (Banks) | | | 45,493 | |
| | 8,040 | | | Chicony Electronics Co. Ltd. (Technology Hardware, Storage & Peripherals) | | | 16,114 | |
| | 90,000 | | | China Development Financial Holding Corp. (Banks) | | | 28,978 | |
| | 81,053 | | | China Life Insurance Co. Ltd. (Insurance) | | | 77,037 | |
| | 29,000 | | | China Steel Corp. (Metals & Mining) | | | 22,904 | |
| | 3,000 | | | Chroma ATE, Inc. (Electronic Equipment, Instruments & Components) | | | 10,568 | |
| | 8,000 | | | Chunghwa Telecom Co. Ltd. (Diversified Telecommunication Services) | | | 28,257 | |
| | 67,000 | | | Compal Electronics, Inc. (Technology Hardware, Storage & Peripherals) | | | 37,009 | |
| | 261,640 | | | CTBC Financial Holding Co. Ltd. (Banks) | | | 175,202 | |
| | 23,228 | | | Darfon Electronics Corp. (Technology Hardware, Storage & Peripherals) | | | 26,781 | |
| | 5,000 | | | Delta Electronics, Inc. (Electronic Equipment, Instruments & Components) | | | 21,046 | |
| | 36,082 | | | E.Sun Financial Holding Co. Ltd. (Banks) | | | 23,957 | |
| | 3,000 | | | Eclat Textile Co. Ltd. (Textiles, Apparel & Luxury Goods) | | | 35,720 | |
| | 27,000 | | | Epistar Corp. (Semiconductors & Semiconductor Equipment) | | | 24,482 | |
| | 245,064 | | | Far Eastern New Century Corp. (Industrial Conglomerates) | | | 246,490 | |
| | 1,000 | | | Far EasTone Telecommunications Co. Ltd. (Wireless Telecommunication Services) | | | 2,383 | |
| | 8,432 | | | Feng TAY Enterprise Co. Ltd. (Textiles, Apparel & Luxury Goods) | | | 50,724 | |
| | 63,780 | | | First Financial Holding Co. Ltd. (Banks) | | | 40,350 | |
| | 96,093 | | | Formosa Chemicals & Fibre Corp. (Chemicals) | | | 348,727 | |
| | 7,000 | | | Formosa Petrochemical Corp. (Oil, Gas & Consumable Fuels) | | | 27,634 | |
| | |
| | |
| The accompanying notes are an integral part of these financial statements. | | 45 |
GOLDMAN SACHS MULTI-MANAGER GLOBAL EQUITY FUND
Schedule of Investments (continued)
October 31, 2018
| | | | | | | | |
| Shares | | | Description | |
Value | |
| Common Stocks – (continued) | |
| Taiwan – (continued) | |
| | 10,000 | | | Formosa Plastic Corp. (Chemicals) | | $ | 32,701 | |
| | 67,732 | | | Foxconn Technology Co. Ltd. (Electronic Equipment, Instruments & Components) | | | 143,827 | |
| | 405,570 | | | Fubon Financial Holding Co. Ltd. (Diversified Financial Services) | | | 636,301 | |
| | 56,415 | | | Gigabyte Technology Co. Ltd. (Technology Hardware, Storage & Peripherals) | | | 74,174 | |
| | 13,573 | | | Grand Pacific Petrochemical (Chemicals) | | | 9,187 | |
| | 236,989 | | | HannStar Display Corp. (Electronic Equipment, Instruments & Components) | | | 52,287 | |
| | 15,000 | | | Highwealth Construction Corp. (Real Estate Management & Development) | | | 22,034 | |
| | 29,570 | | | Hiwin Technologies Corp. (Machinery) | | | 191,912 | |
| | 40,800 | | | Hon Hai Precision Industry Co. Ltd. (Electronic Equipment, Instruments & Components) | | | 103,858 | |
| | 18,665 | | | Hon Hai Precision Industry Co. Ltd. GDR (Electronic Equipment, Instruments & Components) | | | 97,805 | |
| | 10,000 | | | HTC Corp.* (Technology Hardware, Storage & Peripherals) | | | 10,885 | |
| | 86,735 | | | Hua Nan Financial Holdings Co. Ltd. (Banks) | | | 48,991 | |
| | 383,097 | | | Innolux Corp. (Electronic Equipment, Instruments & Components) | | | 116,325 | |
| | 38,000 | | | Inventec Corp. (Technology Hardware, Storage & Peripherals) | | | 30,712 | |
| | 45,000 | | | Lite-On Technology Corp. (Technology Hardware, Storage & Peripherals) | | | 51,738 | |
| | 22,440 | | | Macronix International (Semiconductors & Semiconductor Equipment) | | | 12,495 | |
| | 2,000 | | | MediaTek, Inc. (Semiconductors & Semiconductor Equipment) | | | 14,773 | |
| | 216,788 | | | Mega Financial Holding Co. Ltd. (Banks) | | | 183,575 | |
| | 11,000 | | | Micro-Star International Co. Ltd. (Technology Hardware, Storage & Peripherals) | | | 24,504 | |
| | 13,000 | | | Nan Ya Plastics Corp. (Chemicals) | | | 32,383 | |
| | 7,000 | | | Nanya Technology Corp. (Semiconductors & Semiconductor Equipment) | | | 11,688 | |
| | 56,096 | | | Novatek Microelectronics Corp. (Semiconductors & Semiconductor Equipment) | | | 248,164 | |
| | 77,691 | | | Oriental Union Chemical Corp. (Chemicals) | | | 70,501 | |
| | 15,000 | | | Pegatron Corp. (Technology Hardware, Storage & Peripherals) | | | 27,409 | |
| | 33,000 | | | Pou Chen Corp. (Textiles, Apparel & Luxury Goods) | | | 33,487 | |
| | 10,000 | | | Powertech Technology, Inc. (Semiconductors & Semiconductor Equipment) | | | 21,935 | |
| | |
| Common Stocks – (continued) | |
| Taiwan – (continued) | |
| | 3,000 | | | President Chain Store Corp. (Food & Staples Retailing) | | | 33,936 | |
| | 58,488 | | | Radiant Opto-Electronics Corp. (Semiconductors & Semiconductor Equipment) | | | 153,708 | |
| | 10,000 | | | Realtek Semiconductor Corp. (Semiconductors & Semiconductor Equipment) | | | 40,267 | |
| | 12,600 | | | Ruentex Development Co. Ltd. (Real Estate Management & Development) | | | 17,487 | |
| | 13,800 | | | Ruentex Industries Ltd. (Textiles, Apparel & Luxury Goods) | | | 34,675 | |
| | 785,767 | | | Shin Kong Financial Holding Co. Ltd. (Insurance) | | | 259,070 | |
| | 4,246 | | | Simplo Technology Co. Ltd. (Electronic Equipment, Instruments & Components) | | | 24,694 | |
| | 673,800 | | | SinoPac Financial Holdings Co. Ltd. (Banks) | | | 229,208 | |
| | 33,000 | | | Synnex Technology International Corp. (Electronic Equipment, Instruments & Components) | | | 35,612 | |
| | 86,297 | | | Taishin Financial Holding Co. Ltd. | | | 37,856 | |
| | 81,120 | | | Taiwan Business Bank (Banks) | | | 26,779 | |
| | 214,570 | | | Taiwan Cement Corp. (Construction Materials) | | | 241,195 | |
| | 92,700 | | | Taiwan Cooperative Financial Holding Co. Ltd. (Banks) | | | 52,211 | |
| | 2,000 | | | Taiwan Mobile Co. Ltd. (Wireless Telecommunication Services) | | | 7,147 | |
| | 161,365 | | | Taiwan Semiconductor Manufacturing Co. Ltd. (Semiconductors & Semiconductor Equipment) | | | 1,211,429 | |
| | 74,618 | | | Taiwan Semiconductor Manufacturing Co. Ltd. ADR (Semiconductors & Semiconductor Equipment) | | | 2,842,946 | |
| | 13,137 | | | TCI Co. Ltd. (Personal Products) | | | 184,034 | |
| | 58,000 | | | Teco Electric and Machinery Co. Ltd. (Electrical Equipment) | | | 33,371 | |
| | 244,724 | | | Uni-President Enterprises Corp. (Food Products) | | | 593,175 | |
| | 544,720 | | | United Microelectronics Corp. (Semiconductors & Semiconductor Equipment) | | | 207,583 | |
| | 233,175 | | | Walsin Lihwa Corp. (Electrical Equipment) | | | 115,973 | |
| | 7,553 | | | Walsin Technology Corp. (Electronic Equipment, Instruments & Components) | | | 31,917 | |
| | 50,000 | | | Winbond Electronics Corp. (Semiconductors & Semiconductor Equipment) | | | 21,783 | |
| | 62,791 | | | Wistron Corp. (Technology Hardware, Storage & Peripherals) | | | 38,494 | |
| | 35,880 | | | WPG Holdings Ltd. (Electronic Equipment, Instruments & Components) | | | 42,733 | |
| | 4,865 | | | Yageo Corp. (Electronic Equipment, Instruments & Components) | | | 49,886 | |
| | 204,152 | | | Yuanta Financial Holding Co. Ltd. (Capital Markets) | | | 99,279 | |
| | | | | | | | |
| | | | | | | 12,299,580 | |
| | |
| | |
| 46 | | The accompanying notes are an integral part of these financial statements. |
GOLDMAN SACHS MULTI-MANAGER GLOBAL EQUITY FUND
| | | | | | | | |
| Shares | | | Description | |
Value | |
| Common Stocks – (continued) | |
| Thailand – 0.5% | |
| | 5,100 | | | Advanced Info Service PCL NVDR (Wireless Telecommunication Services) | | $ | 30,178 | |
| | 120,700 | | | Airports of Thailand PCL NVDR (Transportation Infrastructure) | | | 233,268 | |
| | 17,186 | | | Bangkok Bank PCL (Banks) | | | 110,068 | |
| | 7,475 | | | Bangkok Bank PCL ADR (Banks) | | | 233,600 | |
| | 78,500 | | | Bangkok Dusit Medical Services PCL NVDR (Health Care Providers & Services) | | | 58,219 | |
| | 18,200 | | | Berli Jucker PCL NVDR (Food & Staples Retailing) | | | 30,685 | |
| | 8,800 | | | Bumrungrad Hospital PCL NVDR (Health Care Providers & Services) | | | 51,371 | |
| | 73,300 | | | Charoen Pokphand Foods PCL NVDR (Food Products) | | | 55,866 | |
| | 23,400 | | | CP ALL PCL NVDR (Food & Staples Retailing) | | | 47,542 | |
| | 2,600 | | | Electricity Generating PCL (Independent Power and Renewable Electricity Producers) | | | 18,138 | |
| | 116,100 | | | Home Product Center PCL NVDR (Specialty Retail) | | | 52,284 | |
| | 19,100 | | | Indorama Ventures PCL NVDR (Chemicals) | | | 31,333 | |
| | 370,700 | | | IRPC PCL NVDR (Oil, Gas & Consumable Fuels) | | | 68,261 | |
| | 16,283 | | | Kiatnakin Bank PCL (Banks) | | | 35,037 | |
| | 109,780 | | | Krung Thai Bank PCL (Banks) | | | 66,646 | |
| | 71,800 | | | Krung Thai Bank PCL NVDR (Banks) | | | 43,589 | |
| | 24,120 | | | Krungthai Card PCL (Consumer Finance) | | | 25,335 | |
| | 53,700 | | | Minor International PCL NVDR (Hotels, Restaurants & Leisure) | | | 59,303 | |
| | 49,791 | | | PTT Exploration & Production PCL (Oil, Gas & Consumable Fuels) | | | 208,545 | |
| | 20,500 | | | PTT Exploration & Production PCL NVDR (Oil, Gas & Consumable Fuels) | | | 85,862 | |
| | 59,575 | | | PTT Global Chemical PCL (Chemicals) | | | 139,176 | |
| | 32,800 | | | PTT Global Chemical PCL NVDR (Chemicals) | | | 76,625 | |
| | 252,591 | | | PTT PCL (Oil, Gas & Consumable Fuels) | | | 388,414 | |
| | 347,600 | | | PTT PCL NVDR (Oil, Gas & Consumable Fuels) | | | 534,527 | |
| | 1,066,889 | | | Quality Houses PCL (Real Estate Management & Development) | | | 101,201 | |
| | 152,500 | | | Thai Beverage PCL (Beverages) | | | 68,880 | |
| | 25,600 | | | Thai Oil PCL NVDR (Oil, Gas & Consumable Fuels) | | | 65,472 | |
| | 57,701 | | | Thanachart Capital PCL (Banks) | | | 91,817 | |
| | 16,151 | | | Tisco Financial Group PCL (Banks) | | | 38,426 | |
| | 779,800 | | | TMB Bank PCL NVDR (Banks) | | | 53,758 | |
| | |
| Common Stocks – (continued) | |
| Thailand – (continued) | |
| | 37,859 | | | Total Access Communication PCL (Wireless Telecommunication Services) | | | 54,443 | |
| | 89,100 | | | True Corp. PCL NVDR (Diversified Telecommunication Services) | | | 15,890 | |
| | | | | | | | |
| | | | | | | 3,173,759 | |
| | |
| Turkey – 0.2% | |
| | 196,674 | | | Akbank T.A.S. (Banks) | | | 232,584 | |
| | 4,428 | | | Anadolu Efes Biracilik Ve Malt Sanayii AS (Beverages) | | | 14,888 | |
| | 794 | | | BIM Birlesik Magazalar AS (Food & Staples Retailing) | | | 11,287 | |
| | 61,124 | | | Emlak Konut Gayrimenkul Yatirim Ortakligi AS (Equity Real Estate Investment Trusts (REITs)) | | | 18,307 | |
| | 59,442 | | | Eregli Demir ve Celik Fabrikalari TAS (Metals & Mining) | | | 96,463 | |
| | 16,196 | | | Ford Otomotiv Sanayi AS (Automobiles) | | | 173,928 | |
| | 45,317 | | | Haci Omer Sabanci Holding AS (Diversified Financial Services) | | | 57,804 | |
| | 8,847 | | | KOC Holding AS (Industrial Conglomerates) | | | 24,714 | |
| | 10,323 | | | Petkim Petrokimya Holding AS (Chemicals) | | | 9,396 | |
| | 16,044 | | | TAV Havalimanlari Holding AS (Transportation Infrastructure) | | | 66,796 | |
| | 31,896 | | | Tekfen Holding AS (Construction & Engineering) | | | 121,432 | |
| | 1,216 | | | Tupras Turkiye Petrol Rafinerileri AS (Oil, Gas & Consumable Fuels) | | | 28,690 | |
| | 37,310 | | | Turk Hava Yollari AO* (Airlines) | | | 93,980 | |
| | 14,418 | | | Turkcell Iletisim Hizmetleri AS (Wireless Telecommunication Services) | | | 29,340 | |
| | 9,969 | | | Turkiye Garanti Bankasi AS (Banks) | | | 12,540 | |
| | 9,929 | | | Turkiye Is Bankasi AS Class C (Banks) | | | 7,106 | |
| | 109,503 | | | Turkiye Sise ve Cam Fabrikalari AS (Industrial Conglomerates) | | | 92,738 | |
| | | | | | | | |
| | | | | | | 1,091,993 | |
| | |
| United Arab Emirates – 0.1% | |
| | 34,212 | | | Abu Dhabi Commercial Bank PJSC (Banks) | | | 75,368 | |
| | 362,483 | | | Aldar Properties PJSC (Real Estate Management & Development) | | | 170,724 | |
| | 48,412 | | | DAMAC Properties Dubai Co. PJSC (Real Estate Management & Development) | | | 26,650 | |
| | 1,527 | | | DP World Ltd. (Transportation Infrastructure) | | | 27,471 | |
| | 42,018 | | | Dubai Islamic Bank PJSC (Banks) | | | 60,170 | |
| | 25,556 | | | Emaar Malls PJSC (Real Estate Management & Development) | | | 12,724 | |
| | 40,593 | | | Emaar Properties PJSC (Real Estate Management & Development) | | | 56,322 | |
| | 20,455 | | | First Abu Dhabi Bank PJSC (Banks) | | | 77,006 | |
| | | | | | | | |
| | | | | | | 506,435 | |
| | |
| | |
| The accompanying notes are an integral part of these financial statements. | | 47 |
GOLDMAN SACHS MULTI-MANAGER GLOBAL EQUITY FUND
Schedule of Investments (continued)
October 31, 2018
| | | | | | | | |
| Shares | | | Description | |
Value | |
| Common Stocks – (continued) | |
| United Kingdom – 6.5% | |
| | 12,038 | | | 3i Group PLC (Capital Markets) | | $ | 134,793 | |
| | 16,845 | | | Abcam PLC (Biotechnology) | | | 258,224 | |
| | 9,721 | | | Anglo American PLC (Metals & Mining) | | | 207,479 | |
| | 1,571 | | | Aon PLC (Insurance) | | | 245,359 | |
| | 1,482 | | | Aptiv PLC (Auto Components) | | | 113,818 | |
| | 2,817 | | | Ashtead Group PLC (Trading Companies & Distributors) | | | 69,543 | |
| | 19,008 | | | AstraZeneca PLC (Pharmaceuticals) | | | 1,453,915 | |
| | 23,579 | | | Auto Trader Group PLC(a) (Interactive Media & Services) | | | 123,209 | |
| | 233,303 | | | Aviva PLC (Insurance) | | | 1,274,974 | |
| | 7,548 | | | Babcock International Group PLC (Commercial Services & Supplies) | | | 58,861 | |
| | 6,839 | | | BAE Systems PLC (Aerospace & Defense) | | | 45,857 | |
| | 154,105 | | | Balfour Beatty PLC (Construction & Engineering) | | | 517,716 | |
| | 844,784 | | | Barclays PLC (Banks) | | | 1,861,317 | |
| | 18,078 | | | Barratt Developments PLC (Household Durables) | | | 118,573 | |
| | 32,183 | | | Beazley PLC (Insurance) | | | 216,088 | |
| | 3,325 | | | Bellway PLC (Household Durables) | | | 121,953 | |
| | 3,754 | | | Berkeley Group Holdings PLC (Household Durables) | | | 167,779 | |
| | 30,778 | | | BHP Billiton PLC (Metals & Mining) | | | 613,981 | |
| | 96,844 | | | Boohoo Group PLC* (Internet & Direct Marketing Retail) | | | 262,169 | |
| | 251,581 | | | BP PLC (Oil, Gas & Consumable Fuels) | | | 1,817,350 | |
| | 48,676 | | | British American Tobacco PLC (Tobacco) | | | 2,110,117 | |
| | 3,012 | | | Bunzl PLC (Trading Companies & Distributors) | | | 88,854 | |
| | 4,579 | | | Burberry Group PLC (Textiles, Apparel & Luxury Goods) | | | 105,955 | |
| | 13,824 | | | Burford Capital Ltd. (Capital Markets) | | | 293,027 | |
| | 70,302 | | | Cairn Energy PLC* (Oil, Gas & Consumable Fuels) | | | 176,545 | |
| | 19,525 | | | Carnival PLC (Hotels, Restaurants & Leisure) | | | 1,064,219 | |
| | 13,567 | | | Clinigen Healthcare Ltd.* (Life Sciences Tools & Services) | | | 156,748 | |
| | 592,238 | | | Cobham PLC* (Aerospace & Defense) | | | 812,936 | |
| | 3,001 | | | Coca-Cola European Partners PLC (Beverages) | | | 135,929 | |
| | 73,273 | | | Compass Group PLC (Hotels, Restaurants & Leisure) | | | 1,441,191 | |
| | 7,358 | | | Computacenter PLC (IT Services) | | | 103,267 | |
| | 3,093 | | | Croda International PLC (Chemicals) | | | 190,515 | |
| | 4,912 | | | Dechra Pharmaceuticals PLC (Pharmaceuticals) | | | 143,519 | |
| | 23,479 | | | Diageo PLC (Beverages) | | | 811,705 | |
| | 119,903 | | | Direct Line Insurance Group PLC (Insurance) | | | 503,866 | |
| | 68,204 | | | DS Smith PLC (Containers & Packaging) | | | 342,220 | |
| | |
| Common Stocks – (continued) | |
| United Kingdom – (continued) | |
| | 71,578 | | | Experian PLC (Professional Services) | | | 1,646,236 | |
| | 17,112 | | | Ferroglobe PLC (Metals & Mining) | | | 104,212 | |
| | 43,346 | | | GlaxoSmithKline PLC (Pharmaceuticals) | | | 839,515 | |
| | 18,680 | | | GVC Holdings PLC (Hotels, Restaurants & Leisure) | | | 223,756 | |
| | 9,587 | | | Halma PLC (Electronic Equipment, Instruments & Components) | | | 162,695 | |
| | 15,855 | | | Hammerson PLC (Equity Real Estate Investment Trusts (REITs)) | | | 88,518 | |
| | 5,269 | | | Hargreaves Lansdown PLC (Capital Markets) | | | 125,612 | |
| | 127,668 | | | Hays PLC (Professional Services) | | | 267,354 | |
| | 19,246 | | | HSBC Holdings PLC (Banks) | | | 158,387 | |
| | 51,375 | | | Ibstock PLC(a) (Construction Materials) | | | 147,292 | |
| | 4,113 | | | IHS Markit Ltd.* (Professional Services) | | | 216,056 | |
| | 30,764 | | | Inchcape PLC (Distributors) | | | 212,477 | |
| | 25,508 | | | Informa PLC (Media) | | | 232,775 | |
| | 1,925 | | | InterContinental Hotels Group PLC (Hotels, Restaurants & Leisure) | | | 101,004 | |
| | 29,968 | | | Intermediate Capital Group PLC (Capital Markets) | | | 363,980 | |
| | 1,249 | | | Intertek Group PLC (Professional Services) | | | 74,836 | |
| | 165,792 | | | IQE PLC* (Semiconductors & Semiconductor Equipment) | | | 191,897 | |
| | 86,476 | | | J Sainsbury PLC (Food & Staples Retailing) | | | 343,575 | |
| | 54,553 | | | JD Sports Fashion PLC (Specialty Retail) | | | 284,318 | |
| | 12,119 | | | Johnson Matthey PLC (Chemicals) | | | 459,476 | |
| | 16,746 | | | Just Eat PLC* (Internet & Direct Marketing Retail) | | | 129,907 | |
| | 15,402 | | | KAZ Minerals PLC (Metals & Mining) | | | 101,695 | |
| | 9,784 | | | Keywords Studios PLC (IT Services) | | | 171,331 | |
| | 46,184 | | | Kingfisher PLC (Specialty Retail) | | | 149,967 | |
| | 11,467 | | | Land Securities Group PLC (Equity Real Estate Investment Trusts (REITs)) | | | 124,739 | |
| | 1,136,524 | | | Lloyds Banking Group PLC (Banks) | | | 829,365 | |
| | 39,464 | | | Marks & Spencer Group PLC (Multiline Retail) | | | 149,260 | |
| | 32,813 | | | Meggitt PLC (Aerospace & Defense) | | | 222,000 | |
| | 51,194 | | | Micro Focus International PLC (Software) | | | 793,620 | |
| | 4,296 | | | Mondi PLC (Paper & Forest Products) | | | 101,166 | |
| | 48,567 | | | National Express Group PLC (Road & Rail) | | | 248,162 | |
| | 14,828 | | | National Grid PLC (Multi-Utilities) | | | 156,644 | |
| | 2,847 | | | Next PLC (Multiline Retail) | | | 189,134 | |
| | 4,478 | | | NMC Health PLC (Health Care Providers & Services) | | | 201,911 | |
| | 29,425 | | | Paragon Banking Group PLC (Thrifts & Mortgage Finance) | | | 159,909 | |
| | |
| | |
| 48 | | The accompanying notes are an integral part of these financial statements. |
GOLDMAN SACHS MULTI-MANAGER GLOBAL EQUITY FUND
| | | | | | | | |
| Shares | | | Description | |
Value | |
| Common Stocks – (continued) | |
| United Kingdom – (continued) | |
| | 24,171 | | | Pearson PLC (Media) | | $ | 277,675 | |
| | 12,948 | | | Pennon Group PLC (Water Utilities) | | | 123,350 | |
| | 4,177 | | | Persimmon PLC (Household Durables) | | | 122,249 | |
| | 140,949 | | | Premier Oil PLC* (Oil, Gas & Consumable Fuels) | | | 193,362 | |
| | 98,825 | | | Prudential PLC (Insurance) | | | 1,978,835 | |
| | 139,472 | | | Rentokil Initial PLC (Commercial Services & Supplies) | | | 562,439 | |
| | 12,651 | | | Rightmove PLC (Interactive Media & Services) | | | 73,029 | |
| | 5,307 | | | Rio Tinto PLC (Metals & Mining) | | | 257,659 | |
| | 103,483 | | | Rolls-Royce Holdings PLC* (Aerospace & Defense) | | | 1,109,771 | |
| | 79,207 | | | Royal Bank of Scotland Group PLC (Banks) | | | 238,452 | |
| | 11,892 | | | Royal Dutch Shell PLC Class A (Oil, Gas & Consumable Fuels) | | | 378,857 | |
| | 51,593 | | | Royal Dutch Shell PLC Class B (Oil, Gas & Consumable Fuels) | | | 1,682,599 | |
| | 39,110 | | | Royal Mail PLC (Air Freight & Logistics) | | | 179,551 | |
| | 22,694 | | | RPC Group PLC (Containers & Packaging) | | | 221,202 | |
| | 28,855 | | | RSA Insurance Group PLC (Insurance) | | | 207,527 | |
| | 2,189 | | | Schroders PLC (Capital Markets) | | | 74,913 | |
| | 21,417 | | | Segro PLC (Equity Real Estate Investment Trusts (REITs)) | | | 167,907 | |
| | 39,955 | | | Senior PLC (Aerospace & Defense) | | | 139,162 | |
| | 12,188 | | | Smith & Nephew PLC (Health Care Equipment & Supplies) | | | 198,114 | |
| | 5,663 | | | Smiths Group PLC (Industrial Conglomerates) | | | 100,946 | |
| | 12,276 | | | Softcat PLC (IT Services) | | | 101,262 | |
| | 1,002 | | | Spirax-Sarco Engineering PLC (Machinery) | | | 82,765 | |
| | 105,386 | | | SSE PLC (Electric Utilities) | | | 1,536,046 | |
| | 35,255 | | | SSP Group PLC (Hotels, Restaurants & Leisure) | | | 300,578 | |
| | 23,887 | | | Standard Chartered PLC (Banks) | | | 167,417 | |
| | 84,324 | | | Taylor Wimpey PLC (Household Durables) | | | 173,625 | |
| | 17,757 | | | Tesco PLC (Food & Staples Retailing) | | | 48,360 | |
| | 27,647 | | | The British Land Co. PLC (Equity Real Estate Investment Trusts (REITs)) | | | 208,799 | |
| | 1,629 | | | The Weir Group PLC (Machinery) | | | 32,965 | |
| | 7,296 | | | Travis Perkins PLC (Trading Companies & Distributors) | | | 103,047 | |
| | 12,080 | | | United Utilities Group PLC (Water Utilities) | | | 111,942 | |
| | 32,961 | | | Vesuvius PLC (Machinery) | | | 228,686 | |
| | 597,422 | | | Vodafone Group PLC (Wireless Telecommunication Services) | | | 1,123,475 | |
| | 82,569 | | | William Hill PLC (Hotels, Restaurants & Leisure) | | | 221,961 | |
| | 49,040 | | | Wm Morrison Supermarkets PLC (Food & Staples Retailing) | | | 155,368 | |
| | | | | | | | |
| | | | | | | 41,020,247 | |
| | |
| Common Stocks – (continued) | |
| United States – 45.8% | |
| | 11,659 | | | AAR Corp. (Aerospace & Defense) | | | 554,735 | |
| | 13,458 | | | Abbott Laboratories (Health Care Equipment & Supplies) | | | 927,795 | |
| | 16,725 | | | AbbVie, Inc. (Biotechnology) | | | 1,302,041 | |
| | 5,184 | | | ABM Industries, Inc. (Commercial Services & Supplies) | | | 159,408 | |
| | 16,391 | | | ACCO Brands Corp. (Commercial Services & Supplies) | | | 132,275 | |
| | 6,200 | | | Activision Blizzard, Inc. (Entertainment) | | | 428,110 | |
| | 10,450 | | | Acuity Brands, Inc. (Electrical Equipment) | | | 1,312,938 | |
| | 3,729 | | | Adobe, Inc.* (Software) | | | 916,439 | |
| | 1,411 | | | Advance Auto Parts, Inc. (Specialty Retail) | | | 225,421 | |
| | 9,668 | | | Aegion Corp.* (Construction & Engineering) | | | 187,172 | |
| | 20,600 | | | AES Corp. (Independent Power and Renewable Electricity Producers) | | | 300,348 | |
| | 3,145 | | | Aetna, Inc. (Health Care Providers & Services) | | | 623,968 | |
| | 980 | | | Affiliated Managers Group, Inc. (Capital Markets) | | | 111,387 | |
| | 8,583 | | | Aflac, Inc. (Insurance) | | | 369,670 | |
| | 4,614 | | | Agilent Technologies, Inc. (Life Sciences Tools & Services) | | | 298,941 | |
| | 9,649 | | | Air Lease Corp. (Trading Companies & Distributors) | | | 367,627 | |
| | 1,349 | | | Air Products & Chemicals, Inc. (Chemicals) | | | 208,218 | |
| | 5,916 | | | Akamai Technologies, Inc.* (IT Services) | | | 427,431 | |
| | 4,436 | | | Alamo Group, Inc. (Machinery) | | | 380,254 | |
| | 1,053 | | | Albemarle Corp. (Chemicals) | | | 104,479 | |
| | 1,000 | | | Alcoa Corp.* (Metals & Mining) | | | 34,990 | |
| | 514 | | | Alexandria Real Estate Equities, Inc. (Equity Real Estate Investment Trusts (REITs)) | | | 62,826 | |
| | 951 | | | Alexion Pharmaceuticals, Inc.* (Biotechnology) | | | 106,579 | |
| | 1,387 | | | Align Technology, Inc.* (Health Care Equipment & Supplies) | | | 306,804 | |
| | 323 | | | Alleghany Corp. (Insurance) | | | 194,020 | |
| | 3,085 | | | Allegiant Travel Co. (Airlines) | | | 352,122 | |
| | 8,863 | | | Alliant Energy Corp. (Electric Utilities) | | | 380,932 | |
| | 11,428 | | | Ally Financial, Inc. (Consumer Finance) | | | 290,385 | |
| | 810 | | | Alphabet, Inc. Class A* (Interactive Media & Services) | | | 883,370 | |
| | 2,456 | | | Alphabet, Inc. Class C* (Interactive Media & Services) | | | 2,644,547 | |
| | 1,275 | | | Amazon.com, Inc.* (Internet & Direct Marketing Retail) | | | 2,037,463 | |
| | 5,938 | | | AMC Networks, Inc. Class A* (Media) | | | 347,848 | |
| | 3,251 | | | Amdocs Ltd. (IT Services) | | | 205,691 | |
| | 7,635 | | | Ameren Corp. (Multi-Utilities) | | | 493,068 | |
| | 2,930 | | | American Electric Power Co., Inc. (Electric Utilities) | | | 214,945 | |
| | 700 | | | American Equity Investment Life Holding Co. (Insurance) | | | 21,854 | |
| | |
| | |
| The accompanying notes are an integral part of these financial statements. | | 49 |
GOLDMAN SACHS MULTI-MANAGER GLOBAL EQUITY FUND
Schedule of Investments (continued)
October 31, 2018
| | | | | | | | |
| Shares | | | Description | |
Value | |
| Common Stocks – (continued) | |
| United States – (continued) | |
| | 4,225 | | | American Express Co. (Consumer Finance) | | $ | 434,034 | |
| | 11,843 | | | American International Group, Inc. (Insurance) | | | 488,997 | |
| | 5,307 | | | American Water Works Co., Inc. (Water Utilities) | | | 469,829 | |
| | 2,600 | | | Ameriprise Financial, Inc. (Capital Markets) | | | 330,824 | |
| | 12,118 | | | Ameris Bancorp (Banks) | | | 519,741 | |
| | 8,625 | | | AMERISAFE, Inc. (Insurance) | | | 561,401 | |
| | 11,289 | | | AmerisourceBergen Corp. (Health Care Providers & Services) | | | 993,432 | |
| | 3,600 | | | AMETEK, Inc. (Electrical Equipment) | | | 241,488 | |
| | 1,170 | | | Amgen, Inc. (Biotechnology) | | | 225,564 | |
| | 19,499 | | | Amneal Pharmaceuticals, Inc.* (Pharmaceuticals) | | | 359,757 | |
| | 2,359 | | | Amphenol Corp. Class A (Electronic Equipment, Instruments & Components) | | | 211,131 | |
| | 10,525 | | | Anadarko Petroleum Corp. (Oil, Gas & Consumable Fuels) | | | 559,930 | |
| | 3,600 | | | Analog Devices, Inc. (Semiconductors & Semiconductor Equipment) | | | 301,356 | |
| | 2,487 | | | Anixter International, Inc.* (Electronic Equipment, Instruments & Components) | | | 163,371 | |
| | 36,786 | | | Annaly Capital Management, Inc. (Mortgage Real Estate Investment Trusts (REITs)) | | | 363,078 | |
| | 1,686 | | | ANSYS, Inc.* (Software) | | | 252,141 | |
| | 3,222 | | | Anthem, Inc. (Health Care Providers & Services) | | | 887,887 | |
| | 7,433 | | | Apache Corp. (Oil, Gas & Consumable Fuels) | | | 281,190 | |
| | 14,880 | | | Apple, Inc. (Technology Hardware, Storage & Peripherals) | | | 3,256,637 | |
| | 12,814 | | | Arch Capital Group Ltd.* (Insurance) | | | 363,533 | |
| | 14,404 | | | Archer-Daniels-Midland Co. (Food Products) | | | 680,589 | |
| | 16,295 | | | Arconic, Inc. (Aerospace & Defense) | | | 331,277 | |
| | 96,250 | | | Ares Capital Corp. (Capital Markets) | | | 1,651,650 | |
| | 14,042 | | | Ares Commercial Real Estate Corp. (Mortgage Real Estate Investment Trusts (REITs)) | | | 203,188 | |
| | 960 | | | Arista Networks, Inc.* (Communications Equipment) | | | 221,136 | |
| | 2,800 | | | Armstrong World Industries, Inc.* (Building Products) | | | 172,900 | |
| | 3,371 | | | Arthur J. Gallagher & Co. (Insurance) | | | 249,488 | |
| | 3,248 | | | ASGN, Inc.* (Professional Services) | | | 217,876 | |
| | 2,902 | | | Aspen Insurance Holdings Ltd. (Insurance) | | | 121,536 | |
| | 1,600 | | | Aspen Technology, Inc.* (Software) | | | 135,824 | |
| | 11,340 | | | Assured Guaranty Ltd. (Insurance) | | | 453,373 | |
| | 102,875 | | | AT&T, Inc. (Diversified Telecommunication Services) | | | 3,156,205 | |
| | 6,133 | | | AtriCure, Inc.* (Health Care Equipment & Supplies) | | | 195,091 | |
| | |
| Common Stocks – (continued) | |
| United States – (continued) | |
| | 2,124 | | | Autodesk, Inc.* (Software) | | | 274,527 | |
| | 3,566 | | | Autoliv, Inc. (Auto Components) | | | 297,190 | |
| | 400 | | | Automatic Data Processing, Inc. (IT Services) | | | 57,632 | |
| | 1,155 | | | AvalonBay Communities, Inc. (Equity Real Estate Investment Trusts (REITs)) | | | 202,564 | |
| | 3,200 | | | Avery Dennison Corp. (Containers & Packaging) | | | 290,304 | |
| | 5,100 | | | Avnet, Inc. (Electronic Equipment, Instruments & Components) | | | 204,357 | |
| | 6,500 | | | AVX Corp. (Electronic Equipment, Instruments & Components) | | | 108,420 | |
| | 17,889 | | | Axis Capital Holdings Ltd. (Insurance) | | | 998,027 | |
| | 4,939 | | | Balchem Corp. (Chemicals) | | | 462,537 | |
| | 39,021 | | | Bank of America Corp. (Banks) | | | 1,073,077 | |
| | 7,953 | | | BankUnited, Inc. (Banks) | | | 263,244 | |
| | 4,544 | | | Bausch Health Cos, Inc.* (Pharmaceuticals) | | | 103,965 | |
| | 8,195 | | | Baxter International, Inc. (Health Care Equipment & Supplies) | | | 512,269 | |
| | 8,901 | | | BB&T Corp. (Banks) | | | 437,573 | |
| | 721 | | | Becton Dickinson & Co. (Health Care Equipment & Supplies) | | | 166,191 | |
| | 5,493 | | | Belden, Inc. (Electronic Equipment, Instruments & Components) | | | 296,897 | |
| | 16,642 | | | Berkshire Hathaway, Inc. Class B* (Diversified Financial Services) | | | 3,416,270 | |
| | 4,496 | | | Best Buy Co., Inc. (Specialty Retail) | | | 315,439 | |
| | 840 | | | Biogen, Inc.* (Biotechnology) | | | 255,587 | |
| | 7,407 | | | Blackbaud, Inc. (Software) | | | 531,230 | |
| | 1,917 | | | BlackRock, Inc. (Capital Markets) | | | 788,692 | |
| | 8,825 | | | Blackstone Mortgage Trust, Inc. Class A (Mortgage Real Estate Investment Trusts (REITs)) | | | 297,756 | |
| | 14,181 | | | BMC Stock Holdings, Inc.* (Trading Companies & Distributors) | | | 237,390 | |
| | 140 | | | Booking Holdings, Inc.* (Internet & Direct Marketing Retail) | | | 262,441 | |
| | 2,161 | | | Booz Allen Hamilton Holding Corp. (IT Services) | | | 107,056 | |
| | 6,204 | | | BorgWarner, Inc. (Auto Components) | | | 244,500 | |
| | 4,125 | | | Boston Scientific Corp.* (Health Care Equipment & Supplies) | | | 149,078 | |
| | 10,000 | | | Bristol-Myers Squibb Co. (Pharmaceuticals) | | | 505,400 | |
| | 4,000 | | | Brixmor Property Group, Inc. (Equity Real Estate Investment Trusts (REITs)) | | | 64,800 | |
| | 3,000 | | | Broadcom, Inc. (Semiconductors & Semiconductor Equipment) | | | 670,470 | |
| | 2,348 | | | Broadridge Financial Solutions, Inc. (IT Services) | | | 274,575 | |
| | 8,506 | | | Brooks Automation, Inc. (Semiconductors & Semiconductor Equipment) | | | 263,941 | |
| | 7,167 | | | Brown-Forman Corp. Class B (Beverages) | | | 332,119 | |
| | |
| | |
| 50 | | The accompanying notes are an integral part of these financial statements. |
GOLDMAN SACHS MULTI-MANAGER GLOBAL EQUITY FUND
| | | | | | | | |
| Shares | | | Description | |
Value | |
| Common Stocks – (continued) | |
| United States – (continued) | |
| | 4,337 | | | Bunge Ltd. (Food Products) | | $ | 268,027 | |
| | 2,176 | | | C.H. Robinson Worldwide, Inc. (Air Freight & Logistics) | | | 193,729 | |
| | 5,976 | | | CA, Inc. (Software) | | | 265,095 | |
| | 5,765 | | | Cabot Oil & Gas Corp. (Oil, Gas & Consumable Fuels) | | | 139,686 | |
| | 4,305 | | | Cactus, Inc. Class A* (Energy Equipment & Services) | | | 144,045 | |
| | 7,189 | | | Cadence BanCorp (Banks) | | | 158,589 | |
| | 8,640 | | | Cadence Design Systems, Inc.* (Software) | | | 385,085 | |
| | 9,296 | | | Cambrex Corp.* (Life Sciences Tools & Services) | | | 495,384 | |
| | 3,544 | | | Campbell Soup Co. (Food Products) | | | 132,581 | |
| | 6,343 | | | Cantel Medical Corp. (Health Care Equipment & Supplies) | | | 502,048 | |
| | 7,211 | | | Capital One Financial Corp. (Consumer Finance) | | | 643,942 | |
| | 18,170 | | | Catalent, Inc.* (Pharmaceuticals) | | | 732,978 | |
| | 1,478 | | | Caterpillar, Inc. (Machinery) | | | 179,311 | |
| | 14,297 | | | Cathay General Bancorp (Banks) | | | 538,568 | |
| | 690 | | | Cavco Industries, Inc.* (Household Durables) | | | 138,421 | |
| | 6,836 | | | CBRE Group, Inc. Class A* (Real Estate Management & Development) | | | 275,422 | |
| | 981 | | | CDK Global, Inc. (Software) | | | 56,152 | |
| | 2,361 | | | CDW Corp. (Electronic Equipment, Instruments & Components) | | | 212,514 | |
| | 3,037 | | | Celanese Corp. Series A (Chemicals) | | | 294,407 | |
| | 5,800 | | | Celgene Corp.* (Biotechnology) | | | 415,280 | |
| | 6,572 | | | Centene Corp.* (Health Care Providers & Services) | | | 856,463 | |
| | 8,798 | | | CenterPoint Energy, Inc. (Multi-Utilities) | | | 237,634 | |
| | 3,956 | | | CenterState Bank Corp. (Banks) | | | 97,238 | |
| | 7,638 | | | Central Garden & Pet Co.* (Household Products) | | | 248,082 | |
| | 9,831 | | | Central Garden & Pet Co. Class A* (Household Products) | | | 291,489 | |
| | 3,656 | | | CenturyLink, Inc. (Diversified Telecommunication Services) | | | 75,460 | |
| | 1,999 | | | Cerner Corp.* (Health Care Technology) | | | 114,503 | |
| | 3,913 | | | Chatham Lodging Trust (Equity Real Estate Investment Trusts (REITs)) | | | 76,304 | |
| | 1,068 | | | Chemed Corp. (Health Care Providers & Services) | | | 325,024 | |
| | 10,162 | | | Chevron Corp. (Oil, Gas & Consumable Fuels) | | | 1,134,587 | |
| | 376 | | | Chipotle Mexican Grill, Inc.* (Hotels, Restaurants & Leisure) | | | 173,084 | |
| | 1,486 | | | Church & Dwight Co., Inc. (Household Products) | | | 88,224 | |
| | 7,282 | | | Chuy’s Holdings, Inc.* (Hotels, Restaurants & Leisure) | | | 177,462 | |
| | 12,776 | | | Ciena Corp.* (Communications Equipment) | | | 399,378 | |
| | 1,129 | | | Cigna Corp. (Health Care Providers & Services) | | | 241,391 | |
| | |
| Common Stocks – (continued) | |
| United States – (continued) | |
| | 1,478 | | | Cimarex Energy Co. (Oil, Gas & Consumable Fuels) | | | 117,457 | |
| | 3,006 | | | Cincinnati Financial Corp. (Insurance) | | | 236,392 | |
| | 1,488 | | | Cintas Corp. (Commercial Services & Supplies) | | | 270,623 | |
| | 21,275 | | | Cisco Systems, Inc. (Communications Equipment) | | | 973,331 | |
| | 4,629 | | | CIT Group, Inc. (Banks) | | | 219,322 | |
| | 34,399 | | | Citigroup, Inc. (Banks) | | | 2,251,759 | |
| | 14,755 | | | Citizens Financial Group, Inc. (Banks) | | | 551,099 | |
| | 2,499 | | | Citrix Systems, Inc.* (Software) | | | 256,073 | |
| | 4,125 | | | CME Group, Inc. (Capital Markets) | | | 755,865 | |
| | 9,392 | | | CMS Energy Corp. (Multi-Utilities) | | | 465,092 | |
| | 14,207 | | | Cognizant Technology Solutions Corp. Class A (IT Services) | | | 980,709 | |
| | 9,571 | | | Cohen & Steers, Inc. (Capital Markets) | | | 367,431 | |
| | 1,693 | | | Colgate-Palmolive Co. (Household Products) | | | 100,818 | |
| | 4,834 | | | Columbia Banking System, Inc. (Banks) | | | 179,293 | |
| | 23,253 | | | Comcast Corp. Class A (Media) | | | 886,869 | |
| | 5,768 | | | Comerica, Inc. (Banks) | | | 470,438 | |
| | 2,000 | | | Commercial Metals Co. (Metals & Mining) | | | 38,120 | |
| | 11,400 | | | CommScope Holding Co., Inc.* (Communications Equipment) | | | 274,284 | |
| | 4,008 | | | Compass Minerals International, Inc. (Metals & Mining) | | | 194,428 | |
| | 4,050 | | | Conagra Brands, Inc. (Food Products) | | | 144,180 | |
| | 3,287 | | | Concho Resources, Inc.* (Oil, Gas & Consumable Fuels) | | | 457,189 | |
| | 17,233 | | | ConocoPhillips (Oil, Gas & Consumable Fuels) | | | 1,204,587 | |
| | 5,085 | | | Consolidated Edison, Inc. (Multi-Utilities) | | | 386,460 | |
| | 1,998 | | | Constellation Brands, Inc. Class A (Beverages) | | | 398,062 | |
| | 5,832 | | | Cooper Tire & Rubber Co. (Auto Components) | | | 180,150 | |
| | 4,116 | | | Copart, Inc.* (Commercial Services & Supplies) | | | 201,314 | |
| | 1,200 | | | CoreCivic, Inc. (Equity Real Estate Investment Trusts (REITs)) | | | 26,952 | |
| | 5,912 | | | Corning, Inc. (Electronic Equipment, Instruments & Components) | | | 188,888 | |
| | 276 | | | CoStar Group, Inc.* (Professional Services) | | | 99,752 | |
| | 404 | | | Costco Wholesale Corp. (Food & Staples Retailing) | | | 92,367 | |
| | 11,841 | | | Coty, Inc. Class A (Personal Products) | | | 124,923 | |
| | 800 | | | Crown Castle International Corp. (Equity Real Estate Investment Trusts (REITs)) | | | 86,992 | |
| | 9,913 | | | CSX Corp. (Road & Rail) | | | 682,609 | |
| | 1,481 | | | Cummins, Inc. (Machinery) | | | 202,438 | |
| | 12,062 | | | CVS Health Corp. (Health Care Providers & Services) | | | 873,168 | |
| | 3,900 | | | Cypress Semiconductor Corp. (Semiconductors & Semiconductor Equipment) | | | 50,466 | |
| | |
| | |
| The accompanying notes are an integral part of these financial statements. | | 51 |
GOLDMAN SACHS MULTI-MANAGER GLOBAL EQUITY FUND
Schedule of Investments (continued)
October 31, 2018
| | | | | | | | |
| Shares | | | Description | |
Value | |
| Common Stocks – (continued) | |
| United States – (continued) | |
| | 10,078 | | | D.R. Horton, Inc. (Household Durables) | | $ | 362,405 | |
| | 4,234 | | | Danaher Corp. (Health Care Equipment & Supplies) | | | 420,860 | |
| | 4,053 | | | Darden Restaurants, Inc. (Hotels, Restaurants & Leisure) | | | 431,847 | |
| | 3,185 | | | DaVita, Inc.* (Health Care Providers & Services) | | | 214,478 | |
| | 4,256 | | | Delta Air Lines, Inc. (Airlines) | | | 232,931 | |
| | 5,627 | | | DENTSPLY SIRONA, Inc. (Health Care Equipment & Supplies) | | | 194,863 | |
| | 20,715 | | | Diplomat Pharmacy, Inc.* (Health Care Providers & Services) | | | 410,986 | |
| | 5,537 | | | Dollar General Corp. (Multiline Retail) | | | 616,711 | |
| | 4,481 | | | Dollar Tree, Inc.* (Multiline Retail) | | | 377,748 | |
| | 800 | | | Dominion Energy, Inc. (Multi-Utilities) | | | 57,136 | |
| | 4,755 | | | Dover Corp. (Machinery) | | | 393,904 | |
| | 1,939 | | | DowDuPont, Inc. (Chemicals) | | | 104,551 | |
| | 8,286 | | | Dril-Quip, Inc.* (Energy Equipment & Services) | | | 352,652 | |
| | 4,172 | | | DTE Energy Co. (Multi-Utilities) | | | 468,933 | |
| | 4,058 | | | Duke Energy Corp. (Electric Utilities) | | | 335,313 | |
| | 7,946 | | | Duke Realty Corp. (Equity Real Estate Investment Trusts (REITs)) | | | 219,071 | |
| | 7,095 | | | DXC Technology Co. (IT Services) | | | 516,729 | |
| | 5,899 | | | Eastman Chemical Co. (Chemicals) | | | 462,187 | |
| | 10,733 | | | Ecolab, Inc. (Chemicals) | | | 1,643,759 | |
| | 4,286 | | | Edison International (Electric Utilities) | | | 297,406 | |
| | 3,751 | | | Edwards Lifesciences Corp.* (Health Care Equipment & Supplies) | | | 553,648 | |
| | 13,725 | | | Electronic Arts, Inc.* (Entertainment) | | | 1,248,700 | |
| | 4,681 | | | Eli Lilly & Co. (Pharmaceuticals) | | | 507,608 | |
| | 3,900 | | | EMCOR Group, Inc. (Construction & Engineering) | | | 276,822 | |
| | 8,335 | | | Emerson Electric Co. (Electrical Equipment) | | | 565,780 | |
| | 2,773 | | | Energizer Holdings, Inc. (Household Products) | | | 162,969 | |
| | 6,548 | | | EnerSys (Electrical Equipment) | | | 521,024 | |
| | 3,355 | | | Engility Holdings, Inc.* (Aerospace & Defense) | | | 104,106 | |
| | 13,166 | | | Entercom Communications Corp. Class A (Media) | | | 85,447 | |
| | 5,114 | | | Entergy Corp. (Electric Utilities) | | | 429,320 | |
| | 1,983 | | | EOG Resources, Inc. (Oil, Gas & Consumable Fuels) | | | 208,889 | |
| | 6,892 | | | EPAM Systems, Inc.* (IT Services) | | | 823,387 | |
| | 2,950 | | | Equity Residential (Equity Real Estate Investment Trusts (REITs)) | | | 191,632 | |
| | 8,113 | | | Essent Group Ltd.* (Thrifts & Mortgage Finance) | | | 319,814 | |
| | 1,032 | | | Essex Property Trust, Inc. (Equity Real Estate Investment Trusts (REITs)) | | | 258,805 | |
| | 1,600 | | | Evercore, Inc. Class A (Capital Markets) | | | 130,704 | |
| | 6,157 | | | Everest Re Group Ltd. (Insurance) | | | 1,341,364 | |
| | 7,649 | | | Evergy, Inc. (Electric Utilities) | | | 428,268 | |
| | 5,869 | | | Eversource Energy (Electric Utilities) | | | 371,273 | |
| | |
| Common Stocks – (continued) | |
| United States – (continued) | |
| | 25,336 | | | Exelon Corp. (Electric Utilities) | | | 1,109,970 | |
| | 7,690 | | | ExlService Holdings, Inc.* (IT Services) | | | 492,929 | |
| | 614 | | | Expedia Group, Inc. (Internet & Direct Marketing Retail) | | | 77,014 | |
| | 3,707 | | | Expeditors International of Washington, Inc. (Air Freight & Logistics) | | | 249,036 | |
| | 3,988 | | | Express Scripts Holding Co.* (Health Care Providers & Services) | | | 386,716 | |
| | 16,500 | | | Extended Stay America, Inc. (Hotels, Restaurants & Leisure) | | | 268,620 | |
| | 12,705 | | | Extraction Oil & Gas, Inc.* (Oil, Gas & Consumable Fuels) | | | 101,513 | |
| | 8,558 | | | Exxon Mobil Corp. (Oil, Gas & Consumable Fuels) | | | 681,901 | |
| | 1,654 | | | F5 Networks, Inc.* (Communications Equipment) | | | 289,913 | |
| | 13,219 | | | Facebook, Inc. Class A* (Interactive Media & Services) | | | 2,006,512 | |
| | 1,293 | | | Fastenal Co. (Trading Companies & Distributors) | | | 66,473 | |
| | 4,596 | | | FCB Financial Holdings, Inc. Class A* (Banks) | | | 179,841 | |
| | 1,189 | | | FedEx Corp. (Air Freight & Logistics) | | | 261,984 | |
| | 5,266 | | | Ferro Corp.* (Chemicals) | | | 89,206 | |
| | 17,993 | | | Ferroglobe Representation & Warranty Insurance Trust*(b) (Metals & Mining) | | | — | |
| | 8,147 | | | Fidelity National Financial, Inc. (Insurance) | | | 272,517 | |
| | 3,953 | | | Fidelity National Information Services, Inc. (IT Services) | | | 411,507 | |
| | 20,658 | | | Fifth Third Bancorp (Banks) | | | 557,559 | |
| | 720 | | | First Citizens BancShares, Inc. Class A (Banks) | | | 307,174 | |
| | 4,109 | | | First Merchants Corp. (Banks) | | | 170,975 | |
| | 5,192 | | | First Midwest Bancorp, Inc. (Banks) | | | 119,208 | |
| | 3,709 | | | FirstCash, Inc. (Consumer Finance) | | | 298,204 | |
| | 17,890 | | | FirstEnergy Corp. (Electric Utilities) | | | 666,939 | |
| | 4,830 | | | Fiserv, Inc.* (IT Services) | | | 383,019 | |
| | 7,587 | | | Five Below, Inc.* (Specialty Retail) | | | 863,552 | |
| | 1,400 | | | Foot Locker, Inc. (Specialty Retail) | | | 65,996 | |
| | 8,859 | | | Ford Motor Co. (Automobiles) | | | 84,603 | |
| | 1,900 | | | Fortinet, Inc.* (Software) | | | 156,142 | |
| | 4,072 | | | Fortive Corp. (Machinery) | | | 302,346 | |
| | 1,707 | | | Fortune Brands Home & Security, Inc. (Building Products) | | | 76,525 | |
| | 24,638 | | | Forum Energy Technologies, Inc.* (Energy Equipment & Services) | | | 220,756 | |
| | 1,000 | | | Forward Air Corp. (Air Freight & Logistics) | | | 59,990 | |
| | 4,348 | | | Franklin Resources, Inc. (Capital Markets) | | | 132,614 | |
| | 49,356 | | | Freeport-McMoRan, Inc. (Metals & Mining) | | | 574,997 | |
| | 4,188 | | | Fresh Del Monte Produce, Inc. (Food Products) | | | 138,330 | |
| | 4,719 | | | FTI Consulting, Inc.* (Professional Services) | | | 326,130 | |
| | |
| | |
| 52 | | The accompanying notes are an integral part of these financial statements. |
GOLDMAN SACHS MULTI-MANAGER GLOBAL EQUITY FUND
| | | | | | | | |
| Shares | | | Description | |
Value | |
| Common Stocks – (continued) | |
| United States – (continued) | |
| | 12,819 | | | General Dynamics Corp. (Aerospace & Defense) | | $ | 2,212,303 | |
| | 1,600 | | | General Mills, Inc. (Food Products) | | | 70,080 | |
| | 9,690 | | | General Motors Co. (Automobiles) | | | 354,557 | |
| | 2,764 | | | Genuine Parts Co. (Distributors) | | | 270,651 | |
| | 7,700 | | | Gilead Sciences, Inc. (Biotechnology) | | | 524,986 | |
| | 15,082 | | | Glacier Bancorp, Inc. (Banks) | | | 639,477 | |
| | 4,546 | | | Global Indemnity Ltd. (Insurance) | | | 162,747 | |
| | 17,268 | | | Globus Medical, Inc. Class A* (Health Care Equipment & Supplies) | | | 912,614 | |
| | 10,429 | | | Grand Canyon Education, Inc.* (Diversified Consumer Services) | | | 1,300,496 | |
| | 3,748 | | | Granite Construction, Inc. (Construction & Engineering) | | | 171,359 | |
| | 45,325 | | | Graphic Packaging Holding Co. (Containers & Packaging) | | | 499,028 | |
| | 1,228 | | | Group 1 Automotive, Inc. (Specialty Retail) | | | 70,905 | |
| | 8,092 | | | Gulfport Energy Corp.* (Oil, Gas & Consumable Fuels) | | | 73,718 | |
| | 6,541 | | | Hanmi Financial Corp. (Banks) | | | 137,230 | |
| | 3,364 | | | Harris Corp. (Aerospace & Defense) | | | 500,260 | |
| | 1,837 | | | Hasbro, Inc. (Leisure Products) | | | 168,471 | |
| | 400 | | | HCA Healthcare, Inc. (Health Care Providers & Services) | | | 53,412 | |
| | 7,734 | | | HCP, Inc. (Equity Real Estate Investment Trusts (REITs)) | | | 213,072 | |
| | 13,491 | | | Healthcare Services Group, Inc. (Commercial Services & Supplies) | | | 547,600 | |
| | 20,254 | | | Heartland Express, Inc. (Road & Rail) | | | 394,345 | |
| | 2,870 | | | Helen of Troy Ltd.* (Household Durables) | | | 356,224 | |
| | 1,320 | | | Henry Schein, Inc.* (Health Care Providers & Services) | | | 109,560 | |
| | 1,800 | | | Herbalife Nutrition Ltd.* (Personal Products) | | | 95,868 | |
| | 9,620 | | | Hess Corp. (Oil, Gas & Consumable Fuels) | | | 552,188 | |
| | 52,673 | | | Hewlett Packard Enterprise Co. (Technology Hardware, Storage & Peripherals) | | | 803,263 | |
| | 2,169 | | | Hillenbrand, Inc. (Machinery) | | | 103,895 | |
| | 3,900 | | | Hilton Grand Vacations, Inc.* (Hotels, Restaurants & Leisure) | | | 104,793 | |
| | 32,034 | | | Hilton Worldwide Holdings, Inc. (Hotels, Restaurants & Leisure) | | | 2,279,860 | |
| | 4,490 | | | Hologic, Inc.* (Health Care Equipment & Supplies) | | | 175,065 | |
| | 5,691 | | | Honeywell International, Inc. (Industrial Conglomerates) | | | 824,171 | |
| | 5,659 | | | Hormel Foods Corp. (Food Products) | | | 246,959 | |
| | 18,729 | | | Host Hotels & Resorts, Inc. (Equity Real Estate Investment Trusts (REITs)) | | | 357,911 | |
| | 22,656 | | | HP, Inc. (Technology Hardware, Storage & Peripherals) | | | 546,916 | |
| | 5,666 | | | HubSpot, Inc.* (Software) | | | 768,593 | |
| | |
| Common Stocks – (continued) | |
| United States – (continued) | |
| | 2,120 | | | Humana, Inc. (Health Care Providers & Services) | | | 679,269 | |
| | 931 | | | Huntington Ingalls Industries, Inc. (Aerospace & Defense) | | | 203,405 | |
| | 3,768 | | | Huron Consulting Group, Inc.* (Professional Services) | | | 205,318 | |
| | 2,485 | | | IAC/InterActiveCorp.* (Interactive Media & Services) | | | 488,526 | |
| | 4,815 | | | IBERIABANK Corp. (Banks) | | | 358,669 | |
| | 7,123 | | | ICF International, Inc. (Professional Services) | | | 524,538 | |
| | 4,401 | | | ICU Medical, Inc.* (Health Care Equipment & Supplies) | | | 1,121,067 | |
| | 5,131 | | | IDACORP, Inc. (Electric Utilities) | | | 478,517 | |
| | 1,569 | | | IDEXX Laboratories, Inc.* (Health Care Equipment & Supplies) | | | 332,816 | |
| | 1,350 | | | Illumina, Inc.* (Life Sciences Tools & Services) | | | 420,053 | |
| | 1,748 | | | Ingredion, Inc. (Food Products) | | | 176,863 | |
| | 360 | | | Inogen, Inc.* (Health Care Equipment & Supplies) | | | 68,245 | |
| | 6,642 | | | Insight Enterprises, Inc.* (Electronic Equipment, Instruments & Components) | | | 343,325 | |
| | 8,492 | | | Installed Building Products, Inc.* (Household Durables) | | | 258,666 | |
| | 1,618 | | | Integra LifeSciences Holdings Corp.* (Health Care Equipment & Supplies) | | | 86,676 | |
| | 24,545 | | | Intel Corp. (Semiconductors & Semiconductor Equipment) | | | 1,150,670 | |
| | 3,858 | | | Intercontinental Exchange, Inc. (Capital Markets) | | | 297,220 | |
| | 700 | | | International Business Machines Corp. (IT Services) | | | 80,801 | |
| | 1,348 | | | International Flavors & Fragrances, Inc. (Chemicals) | | | 195,002 | |
| | 949 | | | Intuit, Inc. (Software) | | | 200,239 | |
| | 1,029 | | | Intuitive Surgical, Inc.* (Health Care Equipment & Supplies) | | | 536,294 | |
| | 2,518 | | | IQVIA Holdings, Inc.* (Life Sciences Tools & Services) | | | 309,538 | |
| | 2,582 | | | J.B. Hunt Transport Services, Inc. (Road & Rail) | | | 285,595 | |
| | 14,363 | | | Jagged Peak Energy, Inc.* (Oil, Gas & Consumable Fuels) | | | 176,952 | |
| | 16,300 | | | Jefferies Financial Group, Inc. (Diversified Financial Services) | | | 349,961 | |
| | 3,688 | | | John Bean Technologies Corp. (Machinery) | | | 383,441 | |
| | 8,100 | | | Johnson & Johnson (Pharmaceuticals) | | | 1,133,919 | |
| | 15,810 | | | JPMorgan Chase & Co. (Banks) | | | 1,723,606 | |
| | 7,374 | | | Juniper Networks, Inc. (Communications Equipment) | | | 215,837 | |
| | 4,737 | | | Kansas City Southern (Road & Rail) | | | 482,985 | |
| | 1,626 | | | Kellogg Co. (Food Products) | | | 106,470 | |
| | 666 | | | Kimberly-Clark Corp. (Household Products) | | | 69,464 | |
| | |
| | |
| The accompanying notes are an integral part of these financial statements. | | 53 |
GOLDMAN SACHS MULTI-MANAGER GLOBAL EQUITY FUND
Schedule of Investments (continued)
October 31, 2018
| | | | | | | | |
| Shares | | | Description | |
Value | |
| Common Stocks – (continued) | |
| United States – (continued) | |
| | 29,594 | | | Kinder Morgan, Inc. (Oil, Gas & Consumable Fuels) | | $ | 503,690 | |
| | 74,336 | | | KKR & Co, Inc. Class A (Capital Markets) | | | 1,758,046 | |
| | 1,166 | | | KLA-Tencor Corp. (Semiconductors & Semiconductor Equipment) | | | 106,736 | |
| | 41,275 | | | Knight-Swift Transportation Holdings, Inc. (Road & Rail) | | | 1,320,800 | |
| | 5,100 | | | Kohl’s Corp. (Multiline Retail) | | | 386,223 | |
| | 2,800 | | | Korn/Ferry International (Professional Services) | | | 126,392 | |
| | 277,370 | | | Kosmos Energy Ltd.* (Oil, Gas & Consumable Fuels) | | | 1,800,131 | |
| | 1,338 | | | L3 Technologies, Inc. (Aerospace & Defense) | | | 253,511 | |
| | 5,803 | | | La-Z-Boy, Inc. (Household Durables) | | | 161,323 | |
| | 3,295 | | | Laboratory Corp. of America Holdings* (Health Care Providers & Services) | | | 529,012 | |
| | 1,432 | | | Lam Research Corp. (Semiconductors & Semiconductor Equipment) | | | 202,957 | |
| | 3,964 | | | Las Vegas Sands Corp. (Hotels, Restaurants & Leisure) | | | 202,283 | |
| | 2,964 | | | LCI Industries (Auto Components) | | | 205,553 | |
| | 1,910 | | | Lear Corp. (Auto Components) | | | 253,839 | |
| | 5,242 | | | Lennar Corp. Class A (Household Durables) | | | 225,301 | |
| | 4,620 | | | LHC Group, Inc.* (Health Care Providers & Services) | | | 422,407 | |
| | 5,822 | | | LifePoint Health, Inc.* (Health Care Providers & Services) | | | 377,615 | |
| | 8,470 | | | Lincoln National Corp. (Insurance) | | | 509,809 | |
| | 11,522 | | | Lithia Motors, Inc. Class A (Specialty Retail) | | | 1,026,380 | |
| | 4,669 | | | LKQ Corp.* (Distributors) | | | 127,324 | |
| | 1,630 | | | Lockheed Martin Corp. (Aerospace & Defense) | | | 478,975 | |
| | 6,840 | | | Loews Corp. (Insurance) | | | 318,470 | |
| | 400 | | | Lowe’s Cos., Inc. (Specialty Retail) | | | 38,088 | |
| | 2,804 | | | LyondellBasell Industries NV Class A (Chemicals) | | | 250,313 | |
| | 3,531 | | | M&T Bank Corp. (Banks) | | | 584,063 | |
| | 11,150 | | | MACOM Technology Solutions Holdings, Inc.* (Semiconductors & Semiconductor Equipment) | | | 156,881 | |
| | 4,300 | | | Macquarie Infrastructure Corp. (Transportation Infrastructure) | | | 158,885 | |
| | 10,373 | | | Macy’s, Inc. (Multiline Retail) | | | 355,690 | |
| | 26,892 | | | Marathon Oil Corp. (Oil, Gas & Consumable Fuels) | | | 510,679 | |
| | 10,980 | | | Marathon Petroleum Corp. (Oil, Gas & Consumable Fuels) | | | 773,541 | |
| | 415 | | | Markel Corp.* (Insurance) | | | 453,695 | |
| | 2,771 | | | Marsh & McLennan Cos., Inc. (Insurance) | | | 234,842 | |
| | 10,294 | | | Marvell Technology Group Ltd. (Semiconductors & Semiconductor Equipment) | | | 168,925 | |
| | |
| Common Stocks – (continued) | |
| United States – (continued) | |
| | 5,833 | | | Masco Corp. (Building Products) | | | 174,990 | |
| | 17,971 | | | Mastercard, Inc. Class A (IT Services) | | | 3,552,328 | |
| | 26,790 | | | Matador Resources Co.* (Oil, Gas & Consumable Fuels) | | | 772,624 | |
| | 7,359 | | | Maxim Integrated Products, Inc. (Semiconductors & Semiconductor Equipment) | | | 368,097 | |
| | 2,868 | | | MAXIMUS, Inc. (IT Services) | | | 186,334 | |
| | 898 | | | McCormick & Co., Inc. (Food Products) | | | 129,312 | |
| | 1,202 | | | McDonald’s Corp. (Hotels, Restaurants & Leisure) | | | 212,634 | |
| | 14,292 | | | McKesson Corp. (Health Care Providers & Services) | | | 1,783,070 | |
| | 4,500 | | | MDU Resources Group, Inc. (Multi-Utilities) | | | 112,320 | |
| | 8,069 | | | Medidata Solutions, Inc.* (Health Care Technology) | | | 567,251 | |
| | 2,200 | | | Medpace Holdings, Inc.* (Life Sciences Tools & Services) | | | 114,620 | |
| | 8,467 | | | Merck & Co., Inc. (Pharmaceuticals) | | | 623,256 | |
| | 14,850 | | | Meridian Bancorp, Inc. (Thrifts & Mortgage Finance) | | | 235,224 | |
| | 12,907 | | | MetLife, Inc. (Insurance) | | | 531,639 | |
| | 2,548 | | | Mettler-Toledo International, Inc.* (Life Sciences Tools & Services) | | | 1,393,297 | |
| | 37,836 | | | MFA Financial, Inc. (Mortgage Real Estate Investment Trusts (REITs)) | | | 262,203 | |
| | 8,372 | | | MGM Resorts International (Hotels, Restaurants & Leisure) | | | 223,365 | |
| | 10,735 | | | Micron Technology, Inc.* (Semiconductors & Semiconductor Equipment) | | | 404,924 | |
| | 44,108 | | | Microsoft Corp. (Software) | | | 4,711,175 | |
| | 1,221 | | | Mid-America Apartment Communities, Inc. (Equity Real Estate Investment Trusts (REITs)) | | | 119,304 | |
| | 3,847 | | | Minerals Technologies, Inc. (Chemicals) | | | 210,623 | |
| | 8,365 | | | Mobile Mini, Inc. (Commercial Services & Supplies) | | | 343,969 | |
| | 1,276 | | | Mohawk Industries, Inc.* (Household Durables) | | | 159,155 | |
| | 400 | | | Molina Healthcare, Inc.* (Health Care Providers & Services) | | | 50,708 | |
| | 2,580 | | | Molson Coors Brewing Co. Class B (Beverages) | | | 165,120 | |
| | 4,590 | | | Mondelez International, Inc. Class A (Food Products) | | | 192,688 | |
| | 4,443 | | | Monster Beverage Corp.* (Beverages) | | | 234,813 | |
| | 6,776 | | | Moody’s Corp. (Capital Markets) | | | 985,772 | |
| | 14,649 | | | Morgan Stanley (Capital Markets) | | | 668,873 | |
| | 4,048 | | | Motorola Solutions, Inc. (Communications Equipment) | | | 496,123 | |
| | 1,755 | | | MSCI, Inc. (Capital Markets) | | | 263,917 | |
| | 2,900 | | | Murphy Oil Corp. (Oil, Gas & Consumable Fuels) | | | 92,394 | |
| | 2,561 | | | Nasdaq, Inc. (Capital Markets) | | | 222,064 | |
| | |
| | |
| 54 | | The accompanying notes are an integral part of these financial statements. |
GOLDMAN SACHS MULTI-MANAGER GLOBAL EQUITY FUND
| | | | | | | | |
| Shares | | | Description | |
Value | |
| Common Stocks – (continued) | |
| United States – (continued) | |
| | 11,896 | | | National General Holdings Corp. (Insurance) | | $ | 331,423 | |
| | 5,444 | | | National Health Investors, Inc. (Equity Real Estate Investment Trusts (REITs)) | | | 399,916 | |
| | 55,027 | | | National Oilwell Varco, Inc. (Energy Equipment & Services) | | | 2,024,994 | |
| | 30,442 | | | Navient Corp. (Consumer Finance) | | | 352,518 | |
| | 10,305 | | | Navigant Consulting, Inc. (Professional Services) | | | 222,588 | |
| | 6,352 | | | NCR Corp.* (Technology Hardware, Storage & Peripherals) | | | 170,551 | |
| | 4,167 | | | Nektar Therapeutics* (Pharmaceuticals) | | | 161,180 | |
| | 8,716 | | | Nelnet, Inc. Class A (Consumer Finance) | | | 490,624 | |
| | 8,637 | | | NetApp, Inc. (Technology Hardware, Storage & Peripherals) | | | 677,918 | |
| | 2,960 | | | NETGEAR, Inc.* (Communications Equipment) | | | 164,221 | |
| | 17,328 | | | Newmont Mining Corp. (Metals & Mining) | | | 535,782 | |
| | 7,252 | | | NextEra Energy, Inc. (Electric Utilities) | | | 1,250,970 | |
| | 11,594 | | | NIKE, Inc. Class B (Textiles, Apparel & Luxury Goods) | | | 870,014 | |
| | 11,482 | | | NiSource, Inc. (Multi-Utilities) | | | 291,184 | |
| | 4,683 | | | NMI Holdings, Inc.* (Thrifts & Mortgage Finance) | | | 98,999 | |
| | 9,276 | | | Noble Energy, Inc. (Oil, Gas & Consumable Fuels) | | | 230,509 | |
| | 4,125 | | | Norfolk Southern Corp. (Road & Rail) | | | 692,299 | |
| | 10,943 | | | Northern Trust Corp. (Capital Markets) | | | 1,029,408 | |
| | 1,356 | | | Northrop Grumman Corp. (Aerospace & Defense) | | | 355,204 | |
| | 9,309 | | | NorthWestern Corp. (Multi-Utilities) | | | 546,997 | |
| | 6,662 | | | Norwegian Cruise Line Holdings Ltd.* (Hotels, Restaurants & Leisure) | | | 293,594 | |
| | 6,000 | | | NRG Energy, Inc. (Independent Power and Renewable Electricity Producers) | | | 217,140 | |
| | 400 | | | Nu Skin Enterprises, Inc. Class A (Personal Products) | | | 28,088 | |
| | 3,900 | | | Nuance Communications, Inc.* (Software) | | | 67,821 | |
| | 1,895 | | | Nucor Corp. (Metals & Mining) | | | 112,032 | |
| | 1,103 | | | NVIDIA Corp. (Semiconductors & Semiconductor Equipment) | | | 232,545 | |
| | 70 | | | NVR, Inc.* (Household Durables) | | | 156,732 | |
| | 10,787 | | | Occidental Petroleum Corp. (Oil, Gas & Consumable Fuels) | | | 723,484 | |
| | 10,400 | | | OneMain Holdings, Inc.* (Consumer Finance) | | | 296,608 | |
| | 69,258 | | | Oracle Corp. (Software) | | | 3,382,561 | |
| | 10,056 | | | Owens-Illinois, Inc.* (Containers & Packaging) | | | 157,578 | |
| | 4,942 | | | Oxford Industries, Inc. (Textiles, Apparel & Luxury Goods) | | | 439,739 | |
| | 15,405 | | | Pacific Premier Bancorp, Inc.* (Banks) | | | 450,288 | |
| | 1,389 | | | Packaging Corp. of America (Containers & Packaging) | | | 127,524 | |
| | |
| Common Stocks – (continued) | |
| United States – (continued) | |
| | 7,426 | | | Parker-Hannifin Corp. (Machinery) | | | 1,126,004 | |
| | 9,067 | | | Patrick Industries, Inc.* (Building Products) | | | 394,505 | |
| | 3,757 | | | Patterson Cos., Inc. (Health Care Providers & Services) | | | 84,833 | |
| | 1,896 | | | Paychex, Inc. (IT Services) | | | 124,169 | |
| | 7,445 | | | Paylocity Holding Corp.* (Software) | | | 489,807 | |
| | 900 | | | PBF Energy, Inc. Class A (Oil, Gas & Consumable Fuels) | | | 37,665 | |
| | 2,607 | | | Peapack Gladstone Financial Corp. (Banks) | | | 70,363 | |
| | 12,592 | | | Pebblebrook Hotel Trust (Equity Real Estate Investment Trusts (REITs)) | | | 424,476 | |
| | 7,569 | | | PepsiCo, Inc. (Beverages) | | | 850,604 | |
| | 20,780 | | | Performance Food Group Co.* (Food & Staples Retailing) | | | 609,270 | |
| | 16,840 | | | Pfizer, Inc. (Pharmaceuticals) | | | 725,130 | |
| | 7,524 | | | PG&E Corp. (Electric Utilities) | | | 352,198 | |
| | 6,300 | | | Philip Morris International, Inc. (Tobacco) | | | 554,841 | |
| | 9,079 | | | Phillips 66 (Oil, Gas & Consumable Fuels) | | | 933,503 | |
| | 3,799 | | | Pinnacle West Capital Corp. (Electric Utilities) | | | 312,468 | |
| | 16,409 | | | PolyOne Corp. (Chemicals) | | | 530,175 | |
| | 2,705 | | | Portland General Electric Co. (Electric Utilities) | | | 121,941 | |
| | 6,433 | | | Power Integrations, Inc. (Semiconductors & Semiconductor Equipment) | | | 362,307 | |
| | 615 | | | PPG Industries, Inc. (Chemicals) | | | 64,630 | |
| | 9,639 | | | PPL Corp. (Electric Utilities) | | | 293,026 | |
| | 12,531 | | | PQ Group Holdings, Inc.* (Chemicals) | | | 201,123 | |
| | 13,853 | | | PRA Group, Inc.* (Consumer Finance) | | | 427,227 | |
| | 2,191 | | | Preferred Bank (Banks) | | | 112,639 | |
| | 20,915 | | | Primoris Services Corp. (Construction & Engineering) | | | 442,771 | |
| | 1,312 | | | Principal Financial Group, Inc. (Insurance) | | | 61,756 | |
| | 9,123 | | | ProAssurance Corp. (Insurance) | | | 400,682 | |
| | 11,321 | | | Prologis, Inc. (Equity Real Estate Investment Trusts (REITs)) | | | 729,865 | |
| | 4,215 | | | Proofpoint, Inc.* (Software) | | | 383,354 | |
| | 1,012 | | | Prudential Financial, Inc. (Insurance) | | | 94,905 | |
| | 8,813 | | | Public Service Enterprise Group, Inc. (Multi-Utilities) | | | 470,879 | |
| | 3,016 | | | PVH Corp. (Textiles, Apparel & Luxury Goods) | | | 364,303 | |
| | 32,604 | | | Qorvo, Inc.* (Semiconductors & Semiconductor Equipment) | | | 2,396,720 | |
| | 11,288 | | | QTS Realty Trust, Inc. Class A (Equity Real Estate Investment Trusts (REITs)) | | | 432,556 | |
| | 6,100 | | | Quanta Services, Inc.* (Construction & Engineering) | | | 190,320 | |
| | 2,071 | | | Quest Diagnostics, Inc. (Health Care Providers & Services) | | | 194,902 | |
| | 9,601 | | | Qurate Retail, Inc.* (Internet & Direct Marketing Retail) | | | 210,646 | |
| | |
| | |
| The accompanying notes are an integral part of these financial statements. | | 55 |
GOLDMAN SACHS MULTI-MANAGER GLOBAL EQUITY FUND
Schedule of Investments (continued)
October 31, 2018
| | | | | | | | |
| Shares | | | Description | |
Value | |
| Common Stocks – (continued) | |
| United States – (continued) | |
| | 25,715 | | | Radian Group, Inc. (Thrifts & Mortgage Finance) | | $ | 493,471 | |
| | 4,604 | | | Raymond James Financial, Inc. (Capital Markets) | | | 353,081 | |
| | 5,087 | | | Raytheon Co. (Aerospace & Defense) | | | 890,428 | |
| | 4,313 | | | RBC Bearings, Inc.* (Machinery) | | | 636,944 | |
| | 10,676 | | | Realogy Holdings Corp. (Real Estate Management & Development) | | | 203,591 | |
| | 2,499 | | | Realty Income Corp. (Equity Real Estate Investment Trusts (REITs)) | | | 150,615 | |
| | 1,106 | | | Red Hat, Inc.* (Software) | | | 189,834 | |
| | 37,246 | | | Regions Financial Corp. (Banks) | | | 632,065 | |
| | 3,575 | | | Republic Services, Inc. (Commercial Services & Supplies) | | | 259,831 | |
| | 683 | | | Resideo Technologies, Inc.* (Building Products) | | | 14,384 | |
| | 3,705 | | | ResMed, Inc. (Health Care Equipment & Supplies) | | | 392,434 | |
| | 471 | | | Rockwell Automation, Inc. (Electrical Equipment) | | | 77,588 | |
| | 1,917 | | | Rockwell Collins, Inc. (Aerospace & Defense) | | | 245,414 | |
| | 3,301 | | | Rogers Corp.* (Electronic Equipment, Instruments & Components) | | | 406,221 | |
| | 8,905 | | | Roper Technologies, Inc. (Industrial Conglomerates) | | | 2,519,224 | |
| | 4,000 | | | Ross Stores, Inc. (Specialty Retail) | | | 396,000 | |
| | 5,101 | | | S&P Global, Inc. (Capital Markets) | | | 930,014 | |
| | 2,507 | | | salesforce.com, Inc.* (Software) | | | 344,061 | |
| | 3,407 | | | Scholastic Corp. (Media) | | | 147,796 | |
| | 6,652 | | | Schweitzer-Mauduit International, Inc. (Paper & Forest Products) | | | 212,332 | |
| | 2,545 | | | Sealed Air Corp. (Containers & Packaging) | | | 82,356 | |
| | 3,894 | | | Sempra Energy (Multi-Utilities) | | | 428,807 | |
| | 1,660 | | | ServiceNow, Inc.* (Software) | | | 300,526 | |
| | 19,973 | | | Silgan Holdings, Inc. (Containers & Packaging) | | | 479,951 | |
| | 6,809 | | | Silicon Laboratories, Inc.* (Semiconductors & Semiconductor Equipment) | | | 555,138 | |
| | 37,918 | | | Sirius XM Holdings, Inc. (Media) | | | 228,266 | |
| | 8,099 | | | Skechers U.S.A., Inc. Class A* (Textiles, Apparel & Luxury Goods) | | | 231,388 | |
| | 11,935 | | | Skyline Champion Corp. (Household Durables) | | | 284,411 | |
| | 23,712 | | | Skyworks Solutions, Inc. (Semiconductors & Semiconductor Equipment) | | | 2,057,253 | |
| | 2,025 | | | SL Green Realty Corp. (Equity Real Estate Investment Trusts (REITs)) | | | 184,802 | |
| | 65,849 | | | SLM Corp.* (Consumer Finance) | | | 667,709 | |
| | 13,542 | | | Snap-on, Inc. (Machinery) | | | 2,084,655 | |
| | 10,253 | | | Southern Copper Corp. (Metals & Mining) | | | 393,100 | |
| | 2,600 | | | Spectrum Brands Holdings, Inc. (Household Products) | | | 168,870 | |
| | |
| Common Stocks – (continued) | |
| United States – (continued) | |
| | 14,100 | | | Spirit Realty Capital, Inc. (Equity Real Estate Investment Trusts (REITs)) | | | 110,262 | |
| | 5,100 | | | SPX FLOW, Inc.* (Machinery) | | | 174,573 | |
| | 18,965 | | | STAG Industrial, Inc. (Equity Real Estate Investment Trusts (REITs)) | | | 501,814 | |
| | 1,685 | | | Standard Motor Products, Inc. (Auto Components) | | | 91,175 | |
| | 1,315 | | | Stanley Black & Decker, Inc. (Machinery) | | | 153,224 | |
| | 2,099 | | | Starbucks Corp. (Hotels, Restaurants & Leisure) | | | 122,309 | |
| | 15,248 | | | Starwood Property Trust, Inc. (Mortgage Real Estate Investment Trusts (REITs)) | | | 331,187 | |
| | 31,813 | | | State Street Corp. (Capital Markets) | | | 2,187,144 | |
| | 8,016 | | | Steel Dynamics, Inc. (Metals & Mining) | | | 317,434 | |
| | 8,220 | | | Steven Madden Ltd. (Textiles, Apparel & Luxury Goods) | | | 257,039 | |
| | 15,045 | | | Stifel Financial Corp. (Capital Markets) | | | 687,857 | |
| | 3,990 | | | Stryker Corp. (Health Care Equipment & Supplies) | | | 647,258 | |
| | 10,527 | | | Sun Hydraulics Corp. (Machinery) | | | 488,453 | |
| | 26,935 | | | SunCoke Energy, Inc.* (Metals & Mining) | | | 301,672 | |
| | 5,683 | | | SunTrust Banks, Inc. (Banks) | | | 356,097 | |
| | 12,934 | | | Superior Energy Services, Inc.* (Energy Equipment & Services) | | | 101,273 | |
| | 9,336 | | | Sykes Enterprises, Inc.* (IT Services) | | | 286,335 | |
| | 18,578 | | | Syneos Health, Inc.* (Life Sciences Tools & Services) | | | 847,714 | |
| | 3,421 | | | SYNNEX Corp. (Electronic Equipment, Instruments & Components) | | | 265,504 | |
| | 6,586 | | | Synopsys, Inc.* (Software) | | | 589,645 | |
| | 1,344 | | | Sysco Corp. (Food & Staples Retailing) | | | 95,868 | |
| | 5,172 | | | T-Mobile US, Inc.* (Wireless Telecommunication Services) | | | 354,541 | |
| | 1,839 | | | T. Rowe Price Group, Inc. (Capital Markets) | | | 178,365 | |
| | 6,379 | | | Tapestry, Inc. (Textiles, Apparel & Luxury Goods) | | | 269,895 | |
| | 5,159 | | | Targa Resources Corp. (Oil, Gas & Consumable Fuels) | | | 266,566 | |
| | 8,927 | | | Target Corp. (Multiline Retail) | | | 746,565 | |
| | 34,889 | | | Teradyne, Inc. (Semiconductors & Semiconductor Equipment) | | | 1,201,926 | |
| | 6,909 | | | Tetra Tech, Inc. (Commercial Services & Supplies) | | | 456,270 | |
| | 7,414 | | | Texas Capital Bancshares, Inc.* (Banks) | | | 483,615 | |
| | 18,783 | | | Texas Instruments, Inc. (Semiconductors & Semiconductor Equipment) | | | 1,743,626 | |
| | 12,157 | | | Texas Roadhouse, Inc. (Hotels, Restaurants & Leisure) | | | 735,012 | |
| | 4,631 | | | Textron, Inc. (Aerospace & Defense) | | | 248,361 | |
| | 3,621 | | | The Allstate Corp. (Insurance) | | | 346,602 | |
| | 38,084 | | | The Bank of New York Mellon Corp. (Capital Markets) | | | 1,802,516 | |
| | 930 | | | The Boeing Co. (Aerospace & Defense) | | | 330,020 | |
| | |
| | |
| 56 | | The accompanying notes are an integral part of these financial statements. |
GOLDMAN SACHS MULTI-MANAGER GLOBAL EQUITY FUND
| | | | | | | | |
| Shares | | | Description | |
Value | |
| Common Stocks – (continued) | |
| United States – (continued) | |
| | 1,806 | | | The Clorox Co. (Household Products) | | $ | 268,101 | |
| | 1,655 | | | The Coca-Cola Co. (Beverages) | | | 79,241 | |
| | 1,341 | | | The Cooper Cos., Inc. (Health Care Equipment & Supplies) | | | 346,394 | |
| | 11,476 | | | The Estee Lauder Cos., Inc. Class A (Personal Products) | | | 1,577,261 | |
| | 1,000 | | | The Gap, Inc. (Specialty Retail) | | | 27,300 | |
| | 10,400 | | | The Geo Group, Inc. (Equity Real Estate Investment Trusts (REITs)) | | | 229,944 | |
| | 2,156 | | | The Hanover Insurance Group, Inc. (Insurance) | | | 240,135 | |
| | 6,027 | | | The Hartford Financial Services Group, Inc. (Insurance) | | | 273,746 | |
| | 2,688 | | | The Hershey Co. (Food Products) | | | 288,019 | |
| | 17,219 | | | The Home Depot, Inc. (Specialty Retail) | | | 3,028,478 | |
| | 3,679 | | | The Interpublic Group of Cos., Inc. (Media) | | | 85,206 | |
| | 2,245 | | | The J.M. Smucker Co. (Food Products) | | | 243,178 | |
| | 8,370 | | | The Kraft Heinz Co. (Food Products) | | | 460,099 | |
| | 8,271 | | | The Kroger Co. (Food & Staples Retailing) | | | 246,145 | |
| | 2,046 | | | The Macerich Co. (Equity Real Estate Investment Trusts (REITs)) | | | 105,615 | |
| | 12,224 | | | The Mosaic Co. (Chemicals) | | | 378,211 | |
| | 2,238 | | | The Navigators Group, Inc. (Insurance) | | | 154,758 | |
| | 4,847 | | | The PNC Financial Services Group, Inc. (Banks) | | | 622,791 | |
| | 8,547 | | | The Procter & Gamble Co. (Household Products) | | | 757,948 | |
| | 3,490 | | | The Progressive Corp. (Insurance) | | | 243,253 | |
| | 6,610 | | | The Sherwin-Williams Co. (Chemicals) | | | 2,600,837 | |
| | 13,110 | | | The Southern Co. (Electric Utilities) | | | 590,343 | |
| | 3,644 | | | The Timken Co. (Machinery) | | | 144,120 | |
| | 5,833 | | | The TJX Cos., Inc. (Specialty Retail) | | | 640,930 | |
| | 1,386 | | | The Travelers Cos., Inc. (Insurance) | | | 173,430 | |
| | 16,658 | | | The Walt Disney Co. (Entertainment) | | | 1,912,838 | |
| | 2,000 | | | The Williams Cos., Inc. (Oil, Gas & Consumable Fuels) | | | 48,660 | |
| | 7,606 | | | Thermo Fisher Scientific, Inc. (Life Sciences Tools & Services) | | | 1,777,142 | |
| | 4,100 | | | Tiffany & Co. (Specialty Retail) | | | 456,330 | |
| | 5,300 | | | Toll Brothers, Inc. (Household Durables) | | | 178,398 | |
| | 3,069 | | | Torchmark Corp. (Insurance) | | | 259,822 | |
| | 3,911 | | | Total System Services, Inc. (IT Services) | | | 356,488 | |
| | 2,593 | | | Tractor Supply Co. (Specialty Retail) | | | 238,271 | |
| | 8,900 | | | Tribune Media Co. Class A (Media) | | | 338,289 | |
| | 500 | | | TriNet Group, Inc.* (Professional Services) | | | 23,495 | |
| | 8,718 | | | TTEC Holdings, Inc. (IT Services) | | | 217,253 | |
| | 5,154 | | | Tupperware Brands Corp. (Household Durables) | | | 180,905 | |
| | 7,421 | | | Tutor Perini Corp.* (Construction & Engineering) | | | 115,026 | |
| | 9,769 | | | Twenty-First Century Fox, Inc. Class A (Entertainment) | | | 444,685 | |
| | |
| Common Stocks – (continued) | |
| United States – (continued) | |
| | 38,112 | | | Two Harbors Investment Corp. (Mortgage Real Estate Investment Trusts (REITs)) | | | 559,865 | |
| | 12,705 | | | Tyson Foods, Inc. Class A (Food Products) | | | 761,284 | |
| | 4,712 | | | U.S. Bancorp (Banks) | | | 246,296 | |
| | 3,552 | | | UDR, Inc. (Equity Real Estate Investment Trusts (REITs)) | | | 139,203 | |
| | 527 | | | Ulta Salon, Cosmetics & Fragrance, Inc.* (Specialty Retail) | | | 144,672 | |
| | 1,857 | | | Union Pacific Corp. (Road & Rail) | | | 271,531 | |
| | 8,725 | | | United Bankshares, Inc. (Banks) | | | 289,408 | |
| | 14,429 | | | United Parcel Service, Inc. Class B (Air Freight & Logistics) | | | 1,537,266 | |
| | 814 | | | United Rentals, Inc.* (Trading Companies & Distributors) | | | 97,737 | |
| | 1,000 | | | United States Steel Corp. (Metals & Mining) | | | 26,530 | |
| | 4,993 | | | United Technologies Corp. (Aerospace & Defense) | | | 620,181 | |
| | 13,729 | | | UnitedHealth Group, Inc. (Health Care Providers & Services) | | | 3,588,074 | |
| | 3,270 | | | Universal Corp. (Tobacco) | | | 221,902 | |
| | 13,217 | | | Universal Forest Products, Inc. (Building Products) | | | 373,645 | |
| | 2,762 | | | Universal Health Services, Inc. Class B (Health Care Providers & Services) | | | 335,749 | |
| | 4,993 | | | Unum Group (Insurance) | | | 181,046 | |
| | 7,499 | | | US Ecology, Inc. (Commercial Services & Supplies) | | | 524,405 | |
| | 8,953 | | | Valero Energy Corp. (Oil, Gas & Consumable Fuels) | | | 815,529 | |
| | 15,939 | | | Valvoline, Inc. (Chemicals) | | | 317,505 | |
| | 1,857 | | | Varian Medical Systems, Inc.* (Health Care Equipment & Supplies) | | | 221,670 | |
| | 3,005 | | | Ventas, Inc. (Equity Real Estate Investment Trusts (REITs)) | | | 174,410 | |
| | 3,797 | | | VeriSign, Inc.* (IT Services) | | | 541,224 | |
| | 3,179 | | | Verisk Analytics, Inc.* (Professional Services) | | | 380,971 | |
| | 18,925 | | | Verizon Communications, Inc. (Diversified Telecommunication Services) | | | 1,080,428 | |
| | 2,852 | | | Versum Materials, Inc. (Semiconductors & Semiconductor Equipment) | | | 90,009 | |
| | 2,160 | | | Vertex Pharmaceuticals, Inc.* (Biotechnology) | | | 366,034 | |
| | 6,422 | | | VF Corp. (Textiles, Apparel & Luxury Goods) | | | 532,255 | |
| | 7,698 | | | Viacom, Inc. Class B (Entertainment) | | | 246,182 | |
| | 16,625 | | | Visa, Inc. Class A (IT Services) | | | 2,291,756 | |
| | 1,144 | | | W.W. Grainger, Inc. (Trading Companies & Distributors) | | | 324,862 | |
| | 9,691 | | | Walgreens Boots Alliance, Inc. (Food & Staples Retailing) | | | 773,051 | |
| | |
| | |
| The accompanying notes are an integral part of these financial statements. | | 57 |
GOLDMAN SACHS MULTI-MANAGER GLOBAL EQUITY FUND
Schedule of Investments (continued)
October 31, 2018
| | | | | | | | |
| Shares | | | Description | |
Value | |
| Common Stocks – (continued) | |
| United States – (continued) | |
| | 6,739 | | | Walker & Dunlop, Inc. (Thrifts & Mortgage Finance) | | $ | 282,768 | |
| | 12,460 | | | Walmart, Inc. (Food & Staples Retailing) | | | 1,249,489 | |
| | 8,843 | | | Washington Federal, Inc. (Thrifts & Mortgage Finance) | | | 249,019 | |
| | 3,344 | | | Waste Management, Inc. (Commercial Services & Supplies) | | | 299,188 | |
| | 539 | | | Waters Corp.* (Life Sciences Tools & Services) | | | 102,243 | |
| | 2,095 | | | WD-40 Co. (Household Products) | | | 350,033 | |
| | 9,774 | | | Webster Financial Corp. (Banks) | | | 575,102 | |
| | 9,024 | | | WEC Energy Group, Inc. (Multi-Utilities) | | | 617,242 | |
| | 479 | | | WellCare Health Plans, Inc.* (Health Care Providers & Services) | | | 132,199 | |
| | 18,600 | | | Wells Fargo & Co. (Banks) | | | 990,078 | |
| | 3,124 | | | Welltower, Inc. (Equity Real Estate Investment Trusts (REITs)) | | | 206,403 | |
| | 9,995 | | | WESCO International, Inc.* (Trading Companies & Distributors) | | | 501,549 | |
| | 10,746 | | | WestRock Co. (Containers & Packaging) | | | 461,756 | |
| | 3,500 | | | Weyerhaeuser Co. (Equity Real Estate Investment Trusts (REITs)) | | | 93,205 | |
| | 1,007 | | | Whirlpool Corp. (Household Durables) | | | 110,528 | |
| | 219 | | | White Mountains Insurance Group Ltd. (Insurance) | | | 194,181 | |
| | 10,216 | | | WildHorse Resource Development Corp.* (Oil, Gas & Consumable Fuels) | | | 216,681 | |
| | 12,204 | | | Wolverine World Wide, Inc. (Textiles, Apparel & Luxury Goods) | | | 429,215 | |
| | 17,267 | | | World Fuel Services Corp. (Oil, Gas & Consumable Fuels) | | | 552,544 | |
| | 6,574 | | | Worldpay, Inc. Class A* (IT Services) | | | 603,756 | |
| | 400 | | | WP Carey, Inc. (Equity Real Estate Investment Trusts (REITs)) | | | 26,404 | |
| | 3,011 | | | Wyndham Destinations, Inc. (Hotels, Restaurants & Leisure) | | | 108,035 | |
| | 2,021 | | | Wynn Resorts Ltd. (Hotels, Restaurants & Leisure) | | | 203,313 | |
| | 8,368 | | | Xcel Energy, Inc. (Electric Utilities) | | | 410,116 | |
| | 15,100 | | | Xenia Hotels & Resorts, Inc. (Equity Real Estate Investment Trusts (REITs)) | | | 310,305 | |
| | 1,903 | | | Xilinx, Inc. (Semiconductors & Semiconductor Equipment) | | | 162,459 | |
| | 3,503 | | | XPO Logistics, Inc.* (Air Freight & Logistics) | | | 313,098 | |
| | 3,761 | | | Xylem, Inc. (Machinery) | | | 246,646 | |
| | 2,839 | | | Yum! Brands, Inc. (Hotels, Restaurants & Leisure) | | | 256,674 | |
| | 1,485 | | | Zimmer Biomet Holdings, Inc. (Health Care Equipment & Supplies) | | | 168,681 | |
| | 6,716 | | | Zions Bancorp NA (Banks) | | | 315,988 | |
| | 2,583 | | | Zoetis, Inc. (Pharmaceuticals) | | | 232,857 | |
| | | | | | | | |
| | | | | | | 290,101,783 | |
| | |
| | TOTAL COMMON STOCKS | |
| | (Cost $601,396,103) | | $ | 599,626,818 | |
| | |
| | | | | | | | | | |
| Shares | | | Dividend rate | | | Value | |
| Preferred Stocks – 0.8% | |
| Brazil – 0.3% | |
| | Banco Bradesco SA (Banks) | |
| | 4,726 | | | | 3.100 | % | | $ | 43,558 | |
| | Banco do Estado do Rio Grande do Sul SA (Banks) | |
| | 22,900 | | | | 9.380 | | | | 122,207 | |
| | Bradespar SA (Metals & Mining) | |
| | 7,500 | | | | 7.080 | | | | 69,649 | |
| | Braskem SA Class A (Chemicals) | |
| | 4,200 | | | | 3.700 | | | | 58,855 | |
| | Cia Brasileira de Distribuicao (Food & Staples Retailing) | |
| | 1,200 | | | | 2.020 | | | | 25,222 | |
| | Cia Energetica de Minas Gerais (Electric Utilities) | |
| | 8,366 | | | | 4.030 | | | | 24,796 | |
| | Gerdau SA (Metals & Mining) | |
| | 9,200 | | | | 2.370 | | | | 40,197 | |
| | Itau Unibanco Holding SA (Banks) | |
| | 2,700 | | | | 6.210 | | | | 35,732 | |
| | Itausa – Investimentos Itau SA (Banks) | |
| | 178,400 | | | | 4.710 | | | | 538,819 | |
| | Petroleo Brasileiro SA (Oil, Gas & Consumable Fuels) | |
| | 91,400 | | | | 0.780 | | | | 678,347 | |
| | Telefonica Brasil SA (Diversified Telecommunication Services) | |
| | 4,470 | | | | 9.010 | | | | 51,913 | |
| | | | | | | | | | |
| | | | | | | | | 1,689,295 | |
| | |
| Chile – 0.0% | |
| | Embotelladora Andina SA (Beverages) | |
| | 14,895 | | | | 3.750 | | | | 51,488 | |
| | Sociedad Quimica y Minera de Chile SA (Chemicals) | |
| | 539 | | | | 5.230 | | | | 23,258 | |
| | | | | | | | | | |
| | | | | | | | | 74,746 | |
| | |
| Colombia – 0.0% | |
| | Bancolombia SA (Banks) | |
| | 2,018 | | | | 2.970 | | | | 18,867 | |
| | Grupo Aval Acciones y Valores SA (Banks) | |
| | 11,947 | | | | 4.810 | | | | 4,193 | |
| | | | | | | | | | |
| | | | | | | | | 23,060 | |
| | |
| Germany – 0.5% | |
| | FUCHS PETROLUB SE (Chemicals) | |
| | 1,240 | | | | 2.560 | | | | 57,399 | |
| | Henkel AG & Co. KGaA (Household Products) | |
| | 236 | | | | 1.780 | | | | 25,784 | |
| | Porsche Automobil Holding SE (Automobiles) | |
| | 779 | | | | 3.170 | | | | 49,541 | |
| | Volkswagen AG (Automobiles) | |
| | 16,698 | | | | 2.670 | | | | 2,805,313 | |
| | | | | | | | | | |
| | | | | | | | | 2,938,037 | |
| | |
| Russia – 0.0% | |
| | Transneft PJSC (Oil, Gas & Consumable Fuels) | |
| | 13 | | | | 0.000 | | | | 33,746 | |
| | |
| United Kingdom – 0.0% | |
| | Rolls-Royce Holdings PLC ADR (Aerospace & Defense) | |
| | 4,760,218 | | | | 0.000 | | | | 6,084 | |
| | |
| | TOTAL PREFERRED STOCKS – 0.8% | |
| | (Cost $3,872,270) | | | $ | 4,764,968 | |
| | |
| | |
| 58 | | The accompanying notes are an integral part of these financial statements. |
GOLDMAN SACHS MULTI-MANAGER GLOBAL EQUITY FUND
| | | | | | | | | | | | | | |
| Shares | | | Description | | | Expiration
Date | | | Value | |
| Right* – 0.0% | |
| Chile – 0.0% | | | | |
| | SACI Falabella (Multiline Retail) | | | | | |
| | 20 | | | | | | | | 11/18/13 | | | $ | 2 | |
| | (Cost $—) | | | | | |
| | |
| | | | | | | | |
| Shares | | | Description | | Value | |
| Exchange Traded Fund – 0.0% | |
| | 4,802 | | | iShares MSCI Emerging Markets ETF (Cost $214,332) | | $ | 188,046 | |
| | |
| | | | | | | | |
| Shares | | | Dividend Rate | | Value | |
| Investment Company(c) – 3.8% | |
| Goldman Sachs Financial Square Government Fund –
Institutional Shares |
|
| | 23,766,349 | | | 2.102% | | $ | 23,766,349 | |
| (Cost $23,766,349) | |
| | |
| | | | | | | | | | | | | | |
Principal Amount | | | Interest
Rate | | | Maturity Date | | | Value | |
| Short-term Investment(d) – 0.1% | |
| Repurchase Agreements – 0.1% | |
| | Joint Repurchase Agreement Account II | |
| $ | 700,000 | | | | 2.220 | % | | | 11/01/18 | | | $ | 700,000 | |
| | (Cost $700,000) | |
| | |
| | TOTAL INVESTMENTS – 99.3% | |
| | (Cost $629,949,054) | | | $ | 629,046,183 | |
| | |
| OTHER ASSETS IN EXCESS OF
LIABILITIES – 0.7% |
| | | 4,530,573 | |
| | |
| | NET ASSETS – 100.0% | | | $ | 633,576,756 | |
| | |
| | |
| The percentage shown for each investment category reflects the value of investments in that category as a percentage of net assets. |
* | | Non-income producing security. |
(a) | | Exempt from registration under Rule 144A of the Securities Act of 1933. Under procedures approved by the Board of Trustees, such securities may be deemed liquid by the investment Adviser and may be resold, normally to qualified institutional buyers in transactions exempt from registration. Total market value of Rule 144A securities amounts to $4,273,296, which represents approximately 0.7% of the Fund’s net assets as of October 31, 2018. The liquidity determination is unaudited. |
(b) | | Significant unobservable inputs were used in the valuation of this portfolio security; i.e. Level 3. |
(c) | | Represents an affiliated issuer. |
(d) | | Joint repurchase agreement was entered into on October 31, 2018. Additional information appears on page 82. |
| | |
|
Currency Abbreviations: |
AUD | | —Australian Dollar |
CHF | | —Swiss Franc |
DKK | | —Danish Krone |
EUR | | —Euro |
GBP | | —British Pound |
HKD | | —Hong Kong Dollar |
ILS | | —Israeli Shekel |
JPY | | —Japanese Yen |
NOK | | —Norwegian Krone |
NZD | | —New Zealand Dollar |
SEK | | —Swedish Krona |
SGD | | —Singapore Dollar |
USD | | —U.S. Dollar |
ZAR | | —South African Rand |
| | |
Investment Abbreviations: |
ADR | | —American Depositary Receipt |
ETF | | —Exchange Traded Fund |
GDR | | —Global Depository Receipt |
PLC | | —Public Limited Company |
REIT | | —Real Estate Investment Trust |
|
| | |
| The accompanying notes are an integral part of these financial statements. | | 59 |
GOLDMAN SACHS MULTI-MANAGER GLOBAL EQUITY FUND
Schedule of Investments (continued)
October 31, 2018
|
| ADDITIONAL INVESTMENT INFORMATION |
FORWARD FOREIGN CURRENCY EXCHANGE CONTRACTS — At October 31, 2018, the Fund had the following forward foreign currency exchange contracts:
FORWARD FOREIGN CURRENCY EXCHANGE CONTRACTS WITH UNREALIZED GAIN
| | | | | | | | | | | | | | | | | | | | |
| Counterparty | | Currency Purchased | | | Currency Sold | | | Settlement
Date | | | Unrealized
Gain | |
Bank of America Securities LLC | | EUR | | | 3,745,450 | | | USD | | | 4,259,532 | | | | 12/19/18 | | | $ | 2,120 | |
| | GBP | | | 1,528,850 | | | USD | | | 1,957,598 | | | | 12/19/18 | | | | 1,674 | |
| | USD | | | 4,075,951 | | | AUD | | | 5,729,905 | | | | 12/19/18 | | | | 16,093 | |
| | USD | | | 4,329,974 | | | CHF | | | 4,186,050 | | | | 12/19/18 | | | | 152,071 | |
| | USD | | | 1,096,691 | | | DKK | | | 6,998,485 | | | | 12/19/18 | | | | 29,044 | |
| | USD | | | 18,659,573 | | | EUR | | | 15,972,790 | | | | 12/19/18 | | | | 485,398 | |
| | USD | | | 9,487,625 | | | GBP | | | 7,251,690 | | | | 12/19/18 | | | | 194,345 | |
| | USD | | | 273,040 | | | ILS | | | 971,410 | | | | 12/19/18 | | | | 10,871 | |
| | USD | | | 15,916,330 | | | JPY | | | 1,757,433,420 | | | | 12/19/18 | | | | 272,300 | |
| | USD | | | 608,952 | | | NOK | | | 5,089,460 | | | | 12/19/18 | | | | 3,777 | |
| | USD | | | 2,079,026 | | | SEK | | | 18,686,465 | | | | 12/19/18 | | | | 27,013 | |
| | USD | | | 767,291 | | | SGD | | | 1,056,320 | | | | 12/19/18 | | | | 3,894 | |
Commonwealth Bank of Australia | | DKK | | | 1,407,400 | | | USD | | | 214,598 | | | | 12/19/18 | | | | 107 | |
| | ILS | | | 216,660 | | | USD | | | 58,431 | | | | 12/19/18 | | | | 42 | |
| | JPY | | | 402,892,500 | | | USD | | | 3,582,053 | | | | 12/19/18 | | | | 4,349 | |
| | USD | | | 3,956,583 | | | AUD | | | 5,562,115 | | | | 12/19/18 | | | | 15,611 | |
| | USD | | | 4,853,790 | | | CHF | | | 4,692,470 | | | | 12/19/18 | | | | 170,453 | |
| | USD | | | 1,010,717 | | | DKK | | | 6,448,475 | | | | 12/19/18 | | | | 26,977 | |
| | USD | | | 18,501,981 | | | EUR | | | 15,834,840 | | | | 12/19/18 | | | | 484,769 | |
| | USD | | | 11,474,321 | | | GBP | | | 8,768,840 | | | | 12/19/18 | | | | 236,763 | |
| | USD | | | 265,440 | | | ILS | | | 944,810 | | | | 12/19/18 | | | | 10,450 | |
| | USD | | | 13,718,921 | | | JPY | | | 1,515,069,590 | | | | 12/19/18 | | | | 232,325 | |
| | USD | | | 507,562 | | | NOK | | | 4,234,210 | | | | 12/19/18 | | | | 4,082 | |
| | USD | | | 1,606,585 | | | SEK | | | 14,442,555 | | | | 12/19/18 | | | | 20,607 | |
| | USD | | | 754,690 | | | SGD | | | 1,038,900 | | | | 12/19/18 | | | | 3,883 | |
State Street Bank and Trust | | EUR | | | 1,748 | | | USD | | | 1,977 | | | | 11/05/18 | | | | 3 | |
| | JPY | | | 22,916,557 | | | USD | | | 202,715 | | | | 11/05/18 | | | | 456 | |
| | USD | | | 28,059 | | | JPY | | | 3,154,963 | | | | 11/01/18 | | | | 92 | |
| | | ZAR | | | 463,001 | | | USD | | | 31,205 | | | | 11/05/18 | | | | 160 | |
| TOTAL | | | | | | | | | | | | | | | | | | $ | 2,409,729 | |
FORWARD FOREIGN CURRENCY EXCHANGE CONTRACTS WITH UNREALIZED LOSS
| | | | | | | | | | | | | | | | | | | | |
| Counterparty | | Currency Purchased | | | Currency Sold | | | Settlement
Date | | | Unrealized
Loss | |
Bank of America Securities LLC | | USD | | | 5,621,750 | | | HKD | | | 44,052,315 | | | | 12/19/18 | | | $ | (3,738 | ) |
| | USD | | | 198,037 | | | NZD | | | 303,520 | | | | 12/19/18 | | | | (133 | ) |
Commonwealth Bank of Australia | | AUD | | | 1,108,090 | | | USD | | | 789,563 | | | | 12/19/18 | | | | (4,439 | ) |
| | CHF | | | 476,680 | | | USD | | | 475,887 | | | | 12/19/18 | | | | (134 | ) |
| | DKK | | | 585,750 | | | USD | | | 91,884 | | | | 12/19/18 | | | | (2,526 | ) |
| | EUR | | | 130,830 | | | USD | | | 152,899 | | | | 12/19/18 | | | | (4,037 | ) |
| | HKD | | | 15,813,830 | | | USD | | | 2,020,568 | | | | 12/19/18 | | | | (1,139 | ) |
| | NOK | | | 897,300 | | | USD | | | 106,972 | | | | 12/19/18 | | | | (276 | ) |
| | NZD | | | 60,620 | | | USD | | | 39,720 | | | | 12/19/18 | | | | (140 | ) |
| | SEK | | | 3,809,460 | | | USD | | | 418,485 | | | | 12/19/18 | | | | (157 | ) |
| | SGD | | | 203,680 | | | USD | | | 147,243 | | | | 12/19/18 | | | | (44 | ) |
| | USD | | | 6,976,543 | | | HKD | | | 54,675,165 | | | | 12/19/18 | | | | (5,485 | ) |
| | USD | | | 1,075,608 | | | JPY | | | 121,495,150 | | | | 12/19/18 | | | | (5,898 | ) |
| | |
| 60 | | The accompanying notes are an integral part of these financial statements. |
GOLDMAN SACHS MULTI-MANAGER GLOBAL EQUITY FUND
|
| ADDITIONAL INVESTMENT INFORMATION (continued) |
FORWARD FOREIGN CURRENCY EXCHANGE CONTRACTS WITH UNREALIZED LOSS (continued)
| | | | | | | | | | | | | | | | | | | | |
| Counterparty | | Currency Purchased | | | Currency Sold | | | Settlement
Date | | | Unrealized
Loss | |
Commonwealth Bank of Australia (continued) | | USD | | | 174,715 | | | NZD | | | 267,840 | | | | 12/19/18 | | | $ | (159 | ) |
State Street Bank and Trust | | SGD | | | 27,330 | | | USD | | | 19,745 | | | | 11/05/18 | | | | (12 | ) |
| | USD | | | 51,023 | | | JPY | | | 5,763,549 | | | | 11/02/18 | | | | (63 | ) |
| | | USD | | | 127,331 | | | JPY | | | 14,388,744 | | | | 11/05/18 | | | | (233 | ) |
| TOTAL | | | | | | | | | | | | | | | | | | $ | (28,613 | ) |
FUTURES CONTRACTS — At October 31, 2018, the Fund had the following futures contracts:
| | | | | | | | | | | | | | | | |
| Description | | Number of
Contracts | | | Expiration
Date | | | Notional
Amount | | | Unrealized
Appreciation/
(Depreciation) | |
Long position contracts: | | | | | | | | | | | | | | | | |
Mini MSCI EAFE Index | | | 6 | | | | 12/21/18 | | | $ | 543,750 | | | $ | (37,972 | ) |
MSCI Emerging Markets Index | | | 4 | | | | 12/21/18 | | | | 191,340 | | | | (11,489 | ) |
S&P 500 E-Mini Index | | | 6 | | | | 12/21/18 | | | | 813,330 | | | | (51,988 | ) |
| TOTAL FUTURES CONTRACTS | | | | | | | | | | | | | | $ | (101,449 | ) |
| | |
| The accompanying notes are an integral part of these financial statements. | | 61 |
GOLDMAN SACHS MULTI-MANAGER NON-CORE FIXED INCOME FUND
Schedule of Investments
October 31, 2018
| | | | | | | | | | | | | | |
Principal Amount | | | Interest Rate | | | Maturity
Date | | | Value | |
| Foreign Debt Obligations – 36.8% | |
| Sovereign – 36.8% | |
| | Argentina Treasury Bill(a) | |
| ARS | 21,300,000 | | | | 0.000 | % | | | 02/28/19 | | | $ | 626,244 | |
| | Banque Centrale de Tunisie International Bond | |
| $ | 170,000 | | | | 5.750 | | | | 01/30/25 | | | | 143,650 | |
| | Bonos De La Nacion Argentina En Moneda Dua | |
| | 1,330,000 | | | | 4.500 | | | | 06/21/19 | | | | 1,322,020 | |
| | Bonos de la Tesoreria de la Republica | |
| CLP | 3,058,679,150 | | | | 2.000 | | | | 03/01/35 | | | | 4,381,771 | |
| | Brazil Notas do Tesouro Nacional | |
| BRL | 112 | | | | 6.000 | | | | 05/15/23 | | | | 32 | |
| | 5,137,000 | | | | 10.000 | | | | 01/01/21 | | | | 1,428,262 | |
| | 48,327,000 | | | | 10.000 | | | | 01/01/23 | | | | 13,329,049 | |
| | 18,690,000 | | | | 10.000 | | | | 01/01/25 | | | | 5,103,535 | |
| | 7,350,000 | | | | 10.000 | | | | 01/01/27 | | | | 1,977,242 | |
| | Corp. Financiera de Desarrollo SA | |
| $ | 290,000 | | | | 4.750 | | | | 07/15/25 | | | | 288,767 | |
| | Dominican Republic | |
| | 640,000 | | | | 5.950 | | | | 01/25/27 | | | | 636,000 | |
| | 390,000 | | | | 6.000 | (b) | | | 07/19/28 | | | | 385,612 | |
| | 540,000 | | | | 6.500 | (b) | | | 02/15/48 | | | | 507,600 | |
| | 980,000 | | | | 6.850 | | | | 01/27/45 | | | | 957,950 | |
| | 2,755,000 | | | | 6.875 | | | | 01/29/26 | | | | 2,892,750 | |
| | Ecuador Government International Bond | |
| | 860,000 | | | | 10.750 | | | | 03/28/22 | | | | 887,950 | |
| | Ecuador Government International Bond | |
| | 1,720,000 | | | | 7.950 | | | | 06/20/24 | | | | 1,548,000 | |
| | 750,000 | | | | 7.950 | | | | 06/20/24 | | | | 675,000 | |
| | 600,000 | | | | 9.625 | | | | 06/02/27 | | | | 555,000 | |
| | 200,000 | | | | 10.500 | | | | 03/24/20 | | | | 204,500 | |
| | 255,000 | | | | 10.750 | | | | 03/28/22 | | | | 263,288 | |
| | Egypt Treasury Bills(a) | |
| EGP | 17,025,000 | | | | 0.000 | | | | 12/04/18 | | | | 935,387 | |
| | 8,000,000 | | | | 0.000 | | | | 12/11/18 | | | | 438,009 | |
| | 42,000,000 | | | | 0.000 | | | | 12/25/18 | | | | 2,282,578 | |
| | 12,500,000 | | | | 0.000 | | | | 01/01/19 | | | | 676,681 | |
| | 45,000,000 | | | | 0.000 | | | | 01/22/19 | | | | 2,406,018 | |
| | El Salvador Government International Bond | |
| $ | 614,000 | | | | 5.875 | | | | 01/30/25 | | | | 548,762 | |
| | 205,000 | | | | 6.375 | | | | 01/18/27 | | | | 183,219 | |
| | 250,000 | | | | 7.625 | | | | 02/01/41 | | | | 226,875 | |
| | 470,000 | | | | 8.625 | | | | 02/28/29 | | | | 477,428 | |
| | Export Credit Bank of Turkey | |
| | 210,000 | | | | 5.375 | | | | 02/08/21 | | | | 199,290 | |
| | 135,000 | | | | 5.375 | | | | 02/08/21 | | | | 128,115 | |
| | Federal Republic of Brazil | |
| | 2,426,000 | | | | 4.625 | (c) | | | 01/13/28 | | | | 2,280,440 | |
| | 565,000 | | | | 5.000 | | | | 01/27/45 | | | | 471,069 | |
| | 685,000 | | | | 5.625 | | | | 02/21/47 | | | | 619,069 | |
| | 250,000 | | | | 6.000 | | | | 04/07/26 | | | | 261,875 | |
| | 95,000 | | | | 8.250 | | | | 01/20/34 | | | | 113,288 | |
| | Government of Jamaica | |
| | 800,000 | | | | 6.750 | | | | 04/28/28 | | | | 865,000 | |
| | 120,000 | | | | 7.875 | | | | 07/28/45 | | | | 139,050 | |
| | 310,000 | | | | 8.000 | | | | 03/15/39 | | | | 359,600 | |
| | |
| Foreign Debt Obligations – (continued) | |
| Sovereign – (continued) | |
| | Hungary Government Bond | |
| HUF | 2,199,180,000 | | | | 3.000 | % | | | 10/27/27 | | | $ | 7,279,269 | |
| | 399,470,000 | | | | 5.500 | | | | 06/24/25 | | | | 1,586,535 | |
| $ | 410,000 | | | | 7.625 | | | | 03/29/41 | | | | 555,558 | |
| | Indonesia Treasury Bond | |
| IDR | 28,500,000,000 | | | | 6.625 | | | | 05/15/33 | | | | 1,541,934 | |
| | 30,827,000,000 | | | | 7.500 | | | | 08/15/32 | | | | 1,807,747 | |
| | 40,984,000,000 | | | | 8.250 | | | | 05/15/29 | | | | 2,640,216 | |
| | Islamic Republic of Pakistan | |
| $ | 1,225,000 | | | | 8.250 | | | | 04/15/24 | | | | 1,249,500 | |
| | Kingdom of Jordan | |
| | 315,000 | | | | 5.750 | | | | 01/31/27 | | | | 289,406 | |
| | 460,000 | | | | 5.750 | | | | 01/31/27 | | | | 422,625 | |
| | Malaysia Government Bond | |
| MYR | 9,500,000 | | | | 3.480 | | | | 03/15/23 | | | | 2,234,914 | |
| | 6,915,000 | | | | 3.800 | | | | 08/17/23 | | | | 1,643,779 | |
| | 3,400,000 | | | | 3.899 | | | | 11/16/27 | | | | 793,677 | |
| | 3,570,000 | | | | 4.048 | | | | 09/30/21 | | | | 861,698 | |
| | 3,220,000 | | | | 4.181 | | | | 07/15/24 | | | | 775,720 | |
| | 2,200,000 | | | | 4.893 | | | | 06/08/38 | | | | 529,803 | |
| | 1,700,000 | | | | 4.921 | | | | 07/06/48 | | | | 404,596 | |
| | Nigeria T – Bill(a) | |
| NGN | 591,000,000 | | | | 0.000 | | | | 01/31/19 | | | | 1,572,937 | |
| | Oman Government International Bond | |
| $ | 915,000 | | | | 3.625 | | | | 06/15/21 | | | | 892,125 | |
| | 705,000 | | | | 4.750 | | | | 06/15/26 | | | | 648,600 | |
| | 385,000 | | | | 6.500 | | | | 03/08/47 | �� | | | 343,612 | |
| | 885,000 | | | | 6.500 | | | | 03/08/47 | | | | 789,862 | |
| | Perusahaan Penerbit SBSN | |
| | 480,000 | | | | 4.150 | | | | 03/29/27 | | | | 449,400 | |
| | Poland Government Bond | |
| PLN | 11,746,000 | | | | 2.500 | | | | 07/25/27 | | | | 2,914,529 | |
| | Qatar Government International Bond(b) | |
| $ | 500,000 | | | | 5.103 | | | | 04/23/48 | | | | 507,500 | |
| | Republic of Angola | |
| | 3,480,000 | | | | 9.500 | | | | 11/12/25 | | | | 3,832,350 | |
| | Republic of Argentina | |
| | 390,000 | | | | 4.625 | | | | 01/11/23 | | | | 328,965 | |
| | 1,265,000 | | | | 5.625 | | | | 01/26/22 | | | | 1,138,500 | |
| | 915,000 | | | | 5.875 | | | | 01/11/28 | | | | 710,497 | |
| | 240,000 | | | | 6.875 | | | | 04/22/21 | | | | 229,800 | |
| | 2,195,000 | | | | 6.875 | | | | 01/26/27 | | | | 1,832,825 | |
| | 975,000 | | | | 7.125 | | | | 07/06/36 | | | | 748,312 | |
| | 615,000 | | | | 7.125 | (d) | | | 06/28/17 | | | | 458,175 | |
| | 697,000 | | | | 7.625 | | | | 04/22/46 | | | | 548,887 | |
| | Republic of Azerbaijan | |
| | 1,285,000 | | | | 4.750 | | | | 03/18/24 | | | | 1,264,119 | |
| | Republic of Belarus | |
| | 220,000 | | | | 6.200 | (b) | | | 02/28/30 | | | | 208,450 | |
| | 205,000 | | | | 6.875 | | | | 02/28/23 | | | | 211,150 | |
| | Republic of Belize(e) | |
| | 73,000 | | | | 4.938 | | | | 02/20/34 | | | | 41,336 | |
| | Republic of Colombia | |
| | 2,175,000 | | | | 4.500 | (c) | | | 01/28/26 | | | | 2,174,456 | |
| | 1,770,000 | | | | 5.000 | (c) | | | 06/15/45 | | | | 1,678,845 | |
| | |
| | |
| 62 | | The accompanying notes are an integral part of these financial statements. |
GOLDMAN SACHS MULTI-MANAGER NON-CORE FIXED INCOME FUND
| | | | | | | | | | | | | | |
Principal Amount | | | Interest Rate | | | Maturity
Date | | | Value | |
| Foreign Debt Obligations – (continued) | |
| Sovereign – (continued) | |
| | Republic of Colombia – (continued) | |
| COP | 10,005,500,000 | | | | 7.000 | % | | | 05/04/22 | | | $ | 3,208,748 | |
| | 13,868,800,000 | | | | 7.500 | | | | 08/26/26 | | | | 4,435,080 | |
| | 10,183,000,000 | | | | 10.000 | | | | 07/24/24 | | | | 3,675,078 | |
| | Republic of Costa Rica | |
| $ | 940,000 | | | | 4.250 | | | | 01/26/23 | | | | 818,975 | |
| | 415,000 | | | | 7.158 | | | | 03/12/45 | | | | 346,006 | |
| | Republic of Croatia | |
| | 940,000 | | | | 6.000 | | | | 01/26/24 | | | | 1,010,500 | |
| | Republic of Egypt | |
| | 170,000 | | | | 5.577 | (b) | | | 02/21/23 | | | | 162,988 | |
| | 440,000 | | | | 5.875 | | | | 06/11/25 | | | | 411,400 | |
| | 2,075,000 | | | | 5.875 | | | | 06/11/25 | | | | 1,940,125 | |
| | 300,000 | | | | 6.125 | | | | 01/31/22 | | | | 296,250 | |
| | 140,000 | | | | 6.588 | (b) | | | 02/21/28 | | | | 128,450 | |
| | 475,000 | | | | 6.588 | | | | 02/21/28 | | | | 435,812 | |
| | 655,000 | | | | 7.500 | | | | 01/31/27 | | | | 640,262 | |
| | 180,000 | | | | 7.903 | (b) | | | 02/21/48 | | | | 161,325 | |
| | 2,805,000 | | | | 8.500 | | | | 01/31/47 | | | | 2,647,219 | |
| | Republic of Gabon | |
| | 400,000 | | | | 6.375 | | | | 12/12/24 | | | | 364,000 | |
| | Republic of Ghana | |
| | 240,000 | | | | 7.625 | (b) | | | 05/16/29 | | | | 228,600 | |
| | 360,000 | | | | 8.125 | | | | 01/18/26 | | | | 361,350 | |
| | 1,760,000 | | | | 8.125 | | | | 01/18/26 | | | | 1,766,600 | |
| | 240,000 | | | | 8.627 | (b) | | | 06/16/49 | | | | 225,000 | |
| | Republic of Honduras | |
| | 570,000 | | | | 6.250 | | | | 01/19/27 | | | | 560,025 | |
| | Republic of Indonesia | |
| | 1,875,000 | | | | 4.100 | | | | 04/24/28 | | | | 1,760,156 | |
| | 910,000 | | | | 4.750 | | | | 01/08/26 | | | | 897,487 | |
| | 540,000 | | | | 5.125 | | | | 01/15/45 | | | | 506,925 | |
| | 265,000 | | | | 5.250 | | | | 01/17/42 | | | | 254,069 | |
| IDR | 14,729,000,000 | | | | 6.125 | | | | 05/15/28 | | | | 816,744 | |
| $ | 710,000 | | | | 6.750 | | | | 01/15/44 | | | | 815,612 | |
| IDR | 12,900,000,000 | | | | 7.000 | | | | 05/15/22 | | | | 817,573 | |
| | 1,900,000,000 | | | | 7.000 | | | | 05/15/27 | | | | 112,277 | |
| | 27,551,000,000 | | | | 8.375 | | | | 03/15/24 | | | | 1,796,863 | |
| | 61,932,000,000 | | | | 8.375 | | | | 09/15/26 | | | | 4,022,087 | |
| | Republic of Iraq | |
| $ | 380,000 | | | | 5.800 | (c) | | | 01/15/28 | | | | 348,650 | |
| | 535,000 | | | | 5.800 | (c) | | | 01/15/28 | | | | 490,862 | |
| | 200,000 | | | | 6.752 | (b) | | | 03/09/23 | | | | 194,750 | |
| | Republic of Ivory Coast(c)(e) | |
| | 1,521,625 | | | | 5.750 | | | | 12/31/32 | | | | 1,375,169 | |
| | 626,225 | | | | 5.750 | | | | 12/31/32 | | | | 565,951 | |
| | Republic of Kazakhstan | |
| | 625,000 | | | | 4.875 | | | | 10/14/44 | | | | 612,500 | |
| | 225,000 | | | | 5.125 | | | | 07/21/25 | | | | 236,813 | |
| | 150,000 | | | | 5.125 | | | | 07/21/25 | | | | 157,875 | |
| | 600,000 | | | | 6.500 | | | | 07/21/45 | | | | 714,000 | |
| | Republic of Kenya | |
| | 280,000 | | | | 6.875 | | | | 06/24/24 | | | | 272,650 | |
| | 465,000 | | | | 6.875 | | | | 06/24/24 | | | | 452,794 | |
| | 1,750,000 | | | | 8.250 | | | | 02/28/48 | | | | 1,596,875 | |
| | |
| Foreign Debt Obligations – (continued) | |
| Sovereign – (continued) | |
| | Republic of Lebanon | |
| 760,000 | | | | 6.000 | | | | 01/27/23 | | | | 651,700 | |
| | 117,000 | | | | 6.250 | | | | 11/04/24 | | | | 96,379 | |
| | 375,000 | | | | 6.250 | | | | 11/04/24 | | | | 308,906 | |
| | 340,000 | | | | 6.375 | | | | 03/09/20 | | | | 325,975 | |
| | 642,000 | | | | 6.600 | | | | 11/27/26 | | | | 516,810 | |
| | 1,079,000 | | | | 6.650 | | | | 11/03/28 | | | | 851,061 | |
| | 400,000 | | | | 6.850 | | | | 03/23/27 | | | | 322,500 | |
| | Republic of Mongolia | |
| | 205,000 | | | | 5.125 | | | | 12/05/22 | | | | 193,725 | |
| | 110,000 | | | | 5.625 | (b) | | | 05/01/23 | | | | 104,225 | |
| | 305,000 | | | | 8.750 | | | | 03/09/24 | | | | 326,731 | |
| | 70,000 | | | | 10.875 | | | | 04/06/21 | | | | 77,613 | |
| | Republic of Morocco | |
| | 550,000 | | | | 4.250 | | | | 12/11/22 | | | | 545,875 | |
| | 275,000 | | | | 5.500 | | | | 12/11/42 | | | | 278,438 | |
| | Republic of Namibia | |
| | 255,000 | | | | 5.250 | | | | 10/29/25 | | | | 229,181 | |
| | Republic of Nigeria | |
| | 210,000 | | | | 6.500 | (b) | | | 11/28/27 | | | | 192,675 | |
| | 625,000 | | | | 6.500 | | | | 11/28/27 | | | | 573,437 | |
| | 390,000 | | | | 7.625 | (b) | | | 11/28/47 | | | | 344,175 | |
| | 240,000 | | | | 7.875 | | | | 02/16/32 | | | | 231,000 | |
| | 1,205,000 | | | | 7.875 | | | | 02/16/32 | | | | 1,159,812 | |
| | Republic of Panama | |
| | 395,000 | | | | 3.875 | (c) | | | 03/17/28 | | | | 378,410 | |
| | 505,000 | | | | 6.700 | | | | 01/26/36 | | | | 606,757 | |
| | Republic of Paraguay | |
| | 1,600,000 | | | | 5.600 | | | | 03/13/48 | | | | 1,523,200 | |
| | Republic of Peru | |
| | 700,000 | | | | 4.125 | | | | 08/25/27 | | | | 704,375 | |
| | 355,000 | | | | 5.625 | | | | 11/18/50 | | | | 397,511 | |
| PEN | 2,860,000 | | | | 6.150 | (b) | | | 08/12/32 | | | | 837,673 | |
| | 6,790,000 | | | | 6.350 | | | | 08/12/28 | | | | 2,073,344 | |
| | 5,028,000 | | | | 6.950 | | | | 08/12/31 | | | | 1,587,233 | |
| | Republic of Philippines | |
| $ | 475,000 | | | | 3.700 | | | | 03/01/41 | | | | 422,750 | |
| | Republic of Romania | |
| RON | 1,155,000 | | | | 3.250 | | | | 04/29/24 | | | | 260,156 | |
| | 6,685,000 | | | | 4.250 | | | | 06/28/23 | | | | 1,595,237 | |
| | 7,150,000 | | | | 4.750 | | | | 02/24/25 | | | | 1,732,333 | |
| | 15,030,000 | | | | 5.850 | | | | 04/26/23 | | | | 3,829,956 | |
| | Republic of Senegal | |
| $ | 400,000 | | | | 6.250 | | | | 07/30/24 | | | | 389,500 | |
| | Republic of South Africa | |
| | 1,090,000 | | | | 5.375 | | | | 07/24/44 | | | | 904,700 | |
| | 1,880,000 | | | | 5.875 | | | | 09/16/25 | | | | 1,854,150 | |
| ZAR | 40,750,000 | | | | 8.000 | | | | 01/31/30 | | | | 2,422,996 | |
| | 62,242,000 | | | | 8.750 | | | | 01/31/44 | | | | 3,637,886 | |
| | 71,854,467 | | | | 8.750 | | | | 02/28/48 | | | | 4,189,810 | |
| | 11,700,000 | | | | 8.875 | | | | 02/28/35 | | | | 714,675 | |
| | 30,012,042 | | | | 10.500 | | | | 12/21/26 | | | | 2,162,095 | |
| | Republic of Sri Lanka | |
| $ | 100,000 | | | | 5.750 | (b) | | | 01/18/22 | | | | 92,807 | |
| | 215,000 | | | | 6.200 | | | | 05/11/27 | | | | 184,094 | |
| | 390,000 | | | | 6.750 | (b) | | | 04/18/28 | | | | 341,209 | |
| | 3,820,000 | | | | 6.850 | | | | 11/03/25 | | | | 3,452,325 | |
| | |
| | |
| The accompanying notes are an integral part of these financial statements. | | 63 |
GOLDMAN SACHS MULTI-MANAGER NON-CORE FIXED INCOME FUND
Schedule of Investments (continued)
October 31, 2018
| | | | | | | | | | | | | | |
Principal Amount | | | Interest Rate | | | Maturity
Date | | | Value | |
| Foreign Debt Obligations – (continued) | |
| Sovereign – (continued) | |
| | Republic of Suriname | |
| $ | 65,000 | | | | 9.250 | % | | | 10/26/26 | | | $ | 63,700 | |
| | Republic of Tajikistan(b) | |
| | 90,000 | | | | 7.125 | | | | 09/14/27 | | | | 79,875 | |
| | Republic of Turkey | |
| | 285,000 | | | | 4.875 | | | | 10/09/26 | | | | 241,894 | |
| | 200,000 | | | | 4.875 | | | | 04/16/43 | | | | 142,500 | |
| | 450,000 | | | | 5.125 | | | | 03/25/22 | | | | 424,125 | |
| | 1,655,000 | | | | 5.125 | | | | 02/17/28 | | | | 1,396,406 | |
| | 590,000 | | | | 5.625 | | | | 03/30/21 | | | | 575,250 | |
| | 730,000 | | | | 5.750 | | | | 05/11/47 | | | | 556,625 | |
| | 1,140,000 | | | | 6.000 | | | | 03/25/27 | | | | 1,031,700 | |
| | 160,000 | | | | 6.125 | | | | 10/24/28 | | | | 143,400 | |
| | 430,000 | | | | 6.250 | | | | 09/26/22 | | | | 417,100 | |
| | 709,000 | | | | 6.625 | | | | 02/17/45 | | | | 600,877 | |
| TRY | 3,090,000 | | | | 8.500 | | | | 07/10/19 | | | | 501,954 | |
| | 7,200,000 | | | | 9.200 | | | | 09/22/21 | | | | 968,656 | |
| | 9,272,678 | | | | 10.600 | | | | 02/11/26 | | | | 1,154,606 | |
| | 15,300,000 | | | | 10.700 | | | | 02/17/21 | | | | 2,159,672 | |
| | 4,563,100 | | | | 11.000 | | | | 03/02/22 | | | | 628,594 | |
| | 1,756,103 | | | | 11.000 | | | | 02/24/27 | | | | 215,837 | |
| | Republic of Uruguay | |
| $ | 2,220,000 | | | | 4.375 | | | | 10/27/27 | | | | 2,192,250 | |
| | 566,000 | | | | 5.100 | | | | 06/18/50 | | | | 534,870 | |
| UYU | 9,718,000 | | | | 9.875 | | | | 06/20/22 | | | | 291,115 | |
| | Republic of Venezuela(f) | |
| $ | 85,000 | | | | 6.000 | | | | 12/09/20 | | | | 20,613 | |
| | 190,000 | | | | 7.000 | | | | 03/31/38 | | | | 45,600 | |
| | 199,000 | | | | 7.650 | | | | 04/21/25 | | | | 48,755 | |
| | 110,000 | | | | 7.750 | | | | 10/13/19 | | | | 26,950 | |
| | 175,000 | | | | 8.250 | | | | 10/13/24 | | | | 44,188 | |
| | 203,000 | | | | 9.000 | | | | 05/07/23 | | | | 50,750 | |
| | 165,000 | | | | 9.250 | | | | 09/15/27 | | | | 41,250 | |
| | 145,000 | | | | 9.250 | | | | 05/07/28 | | | | 36,250 | |
| | 152,000 | | | | 9.375 | | | | 01/13/34 | | | | 43,320 | |
| | 205,000 | | | | 11.750 | | | | 10/21/26 | | | | 52,531 | |
| | 205,000 | | | | 11.950 | | | | 08/05/31 | | | | 52,275 | |
| | 140,000 | | | | 12.750 | | | | 08/23/22 | | | | 35,805 | |
| | Republic of Zambia | |
| | 410,000 | | | | 8.500 | | | | 04/14/24 | | | | 279,313 | |
| | 465,000 | | | | 8.500 | | | | 04/14/24 | | | | 316,781 | |
| | Russian Federation Bond | |
| | 2,800,000 | | | | 4.750 | | | | 05/27/26 | | | | 2,758,000 | |
| | 600,000 | | | | 4.750 | | | | 05/27/26 | | | | 591,000 | |
| | 400,000 | | | | 5.875 | | | | 09/16/43 | | | | 419,500 | |
| RUB | 164,000,000 | | | | 7.000 | | | | 08/16/23 | | | | 2,374,964 | |
| | 206,660,000 | | | | 7.100 | | | | 10/16/24 | | | | 2,955,129 | |
| | 98,700,000 | | | | 7.400 | | | | 12/07/22 | | | | 1,460,638 | |
| | 156,000,000 | | | | 7.600 | | | | 07/20/22 | | | | 2,332,407 | |
| | 180,876,000 | | | | 7.750 | | | | 09/16/26 | | | | 2,641,101 | |
| | 88,450,000 | | | | 8.150 | | | | 02/03/27 | | | | 1,319,746 | |
| | Thailand Government Bond | |
| THB | 185,000,000 | | | | 3.400 | | | | 06/17/36 | | | | 5,676,902 | |
| | U.S. Treasury Note | |
| $ | 7,000,000 | | | | 1.750 | | | | 11/30/19 | | | | 6,926,172 | |
| | |
| Foreign Debt Obligations – (continued) | |
| Sovereign – (continued) | |
| | Ukraine Government Bond | |
| 640,000 | | | | 7.375 | | | | 09/25/32 | | | | 533,120 | |
| | 775,000 | | | | 7.750 | | | | 09/01/21 | | | | 762,600 | |
| | 960,000 | | | | 7.750 | | | | 09/01/23 | | | | 915,360 | |
| | 440,000 | | | | 7.750 | | | | 09/01/27 | | | | 393,360 | |
| | 705,000 | | | | 7.750 | | | | 09/01/27 | | | | 630,270 | |
| | United Mexican States | |
| | 435,000 | | | | 4.125 | | | | 01/21/26 | | | | 418,905 | |
| | 900,000 | | | | 4.150 | | | | 03/28/27 | | | | 857,700 | |
| | 330,000 | | | | 4.350 | | | | 01/15/47 | | | | 276,375 | |
| MXN | 51,010,000 | | | | 5.750 | | | | 03/05/26 | | | | 2,114,745 | |
| $ | 270,000 | | | | 5.750 | (g) | | | 10/12/10 | | | | 250,088 | |
| MXN | 40,210,000 | | | | 6.500 | | | | 06/10/21 | | | | 1,884,401 | |
| | 81,400,000 | | | | 6.500 | | | | 06/09/22 | | | | 3,750,373 | |
| | 81,100,000 | | | | 8.000 | | | | 12/07/23 | | | | 3,892,656 | |
| | 76,050,000 | | | | 10.000 | | | | 12/05/24 | | | | 3,983,918 | |
| | |
| | TOTAL FOREIGN DEBT OBLIGATIONS | |
| | (Cost $265,578,733) | | | $ | 251,670,876 | |
| | |
| | |
| Corporate Obligations – 39.3% | |
| Aerospace & Defense(c) – 0.0% | |
| | TransDigm, Inc. | |
| $ | 194,000 | | | | 6.000 | % | | | 07/15/22 | | | $ | 194,970 | |
| | |
| Agriculture – 0.2% | |
| | JBS Investments II GmbH(b)(c) | |
| | 580,000 | | | | 7.000 | | | | 01/15/26 | | | | 572,750 | |
| | Vector Group Ltd. | |
| | 725,000 | | | | 10.500 | | | | 11/01/26 | | | | 724,094 | |
| | | | | | | | | | | | | | |
| | | | | | | | | | | | | 1,296,844 | |
| | |
| Automotive – 0.4% | |
| | BCD Acquisition, Inc.(b)(c) | |
| | 625,000 | | | | 9.625 | | | | 09/15/23 | | | | 659,375 | |
| | Delphi Technologies PLC(b) | |
| | 1,055,000 | | | | 5.000 | | | | 10/01/25 | | | | 949,983 | |
| | Tenneco, Inc.(c) | |
| EUR | 650,000 | | | | 5.000 | | | | 07/15/24 | | | | 774,175 | |
| | Titan International, Inc.(c) | |
| $ | 700,000 | | | | 6.500 | | | | 11/30/23 | | | | 658,000 | |
| | | | | | | | | | | | | | |
| | | | | | | | | | | | | 3,041,533 | |
| | |
| Banks – 1.6% | |
| | ABN AMRO Bank NV(c)(h)(5 year EUR Swap + 3.898%) | |
| EUR | 700,000 | | | | 4.750 | | | | 12/31/99 | | | | 748,725 | |
| Banca Monte dei Paschi di Siena SpA(c)(h)(5 year EUR
Swap + 5.005%) |
|
| | 750,000 | | | | 5.375 | | | | 01/18/28 | | | | 558,258 | |
| | Banco de Sabadell SA(c)(h)(5 year EUR Swap + 6.051%) | |
| | 600,000 | | | | 6.125 | | | | 12/31/99 | | | | 647,310 | |
| | Banco Santander SA(c)(h)(5 year EUR Swap + 4.097%) | |
| EUR | 400,000 | | | | 4.750 | | | | 12/31/99 | | | | 395,997 | |
| | Caixa Economica Federal | |
| $ | 315,000 | | | | 3.500 | | | | 11/07/22 | | | | 300,825 | |
| | |
| | |
| 64 | | The accompanying notes are an integral part of these financial statements. |
GOLDMAN SACHS MULTI-MANAGER NON-CORE FIXED INCOME FUND
| | | | | | | | | | | | | | |
Principal Amount | | | Interest Rate | | | Maturity
Date | | | Value | |
| Corporate Obligations – (continued) | |
| Banks – (continued) | |
| | CaixaBank SA(c)(h)(5 year EUR Swap + 4.504%) | |
| EUR | 1,400,000 | | | | 5.250 | % | | | 12/31/99 | | | $ | 1,442,299 | |
| | Freedom Mortgage Corp.(b)(c) | |
| $ | 2,750,000 | | | | 8.250 | | | | 04/15/25 | | | | 2,533,437 | |
| IKB Deutsche Industriebank AG(c)(h)(5 year EUR Swap
+ 3.617%) |
|
| EUR | 700,000 | | | | 4.000 | | | | 01/31/28 | | | | 781,811 | |
| | Intesa Sanpaolo SpA(c)(h) | |
| | (5 year EUR Swap + 7.192%) | |
| | 900,000 | | | | 7.750 | | | | 12/29/49 | | | | 1,043,392 | |
| | (5 year USD Swap + 5.461%) | |
| $ | 500,000 | | | | 7.700 | (b) | | | 12/29/49 | | | | 452,211 | |
| | Turkiye Is Bankasi AS | |
| | 200,000 | | | | 5.000 | | | | 04/30/20 | | | | 189,250 | |
| | UniCredit SpA(c)(h) | |
| | (5 year EUR Swap + 6.387%) | |
| EUR | 650,000 | | | | 6.625 | | | | 12/31/99 | | | | 688,965 | |
| | (5 year USD ICE Swap + 3.703%) | |
| $ | 900,000 | | | | 5.861 | (b) | | | 06/19/32 | | | | 772,142 | |
| | (5 year USD Swap + 5.180%) | |
| | 400,000 | | | | 8.000 | | | | 04/03/49 | | | | 359,000 | |
| | | | | | | | | | | | | | |
| | | | | | | | | | | | | 10,913,622 | |
| | |
| Building Materials – 0.5% | |
| | Builders FirstSource, Inc.(b)(c) | |
| | 819,000 | | | | 5.625 | | | | 09/01/24 | | | | 761,670 | |
| | James Hardie International Finance Ltd. | |
| EUR | 1,220,000 | | | | 3.625 | | | | 10/01/26 | | | | 1,375,380 | |
| | Jeld-Wen, Inc.(b)(c) | |
| $ | 530,000 | | | | 4.625 | | | | 12/15/25 | | | | 475,013 | |
| | Standard Industries, Inc.(b)(c) | |
| | 85,000 | | | | 6.000 | | | | 10/15/25 | | | | 83,619 | |
| | 500,000 | | | | 4.750 | | | | 01/15/28 | | | | 446,875 | |
| | | | | | | | | | | | | | |
| | | | | | | | | | | | | 3,142,557 | |
| | |
| Chemicals(c) – 1.4% | |
| | Alpha 3 BV/Alpha US Bidco, Inc.(b) | |
| | 415,000 | | | | 6.250 | | | | 02/01/25 | | | | 396,844 | |
| | Cornerstone Chemical Co.(b) | |
| | 1,310,000 | | | | 6.750 | | | | 08/15/24 | | | | 1,260,875 | |
| | Hexion, Inc. | |
| | 1,560,000 | | | | 6.625 | | | | 04/15/20 | | | | 1,380,600 | |
| | Momentive Performance Materials, Inc. | |
| | 2,950,000 | | | | 3.880 | | | | 10/24/21 | | | | 3,163,875 | |
| | 600,000 | | | | 4.690 | | | | 04/24/22 | | | | 658,500 | |
| | Rain CII Carbon LLC/CII Carbon Corp.(b) | |
| | 1,340,000 | | | | 7.250 | | | | 04/01/25 | | | | 1,343,350 | |
| | Starfruit Finco B.V./Starfruit US Holdco LLC(b) | |
| | 275,000 | | | | 8.000 | | | | 10/01/26 | | | | 266,750 | |
| | TPC Group, Inc.(b) | |
| | 960,000 | | | | 8.750 | | | | 12/15/20 | | | | 940,800 | |
| | | | | | | | | | | | | | |
| | | | | | | | | | | | | 9,411,594 | |
| | |
| Coal(b)(c) – 0.3% | |
| | Murray Energy Corp. | |
| | 381,000 | | | | 11.250 | | | | 04/15/21 | | | | 246,698 | |
| | |
| Corporate Obligations – (continued) | |
| Coal(b)(c) – (continued) | |
| | (PIK 3.000%, Cash 9.000%) | |
| 1,018,921 | | | | 12.000 | %(i) | | | 04/15/24 | | | | 647,015 | |
| SunCoke Energy Partners LP/SunCoke Energy Partners
Finance Corp. |
|
| | 946,000 | | | | 7.500 | | | | 06/15/25 | | | | 959,007 | |
| | | | | | | | | | | | | | |
| | | | | | | | | | | | | 1,852,720 | |
| | |
| Commercial Services – 1.3% | |
| | AA Bond Co, Ltd.(c) | |
| GBP | 600,000 | | | | 4.875 | | | | 07/31/24 | | | | 765,586 | |
| | Global A&T Electronics Ltd.(c) | |
| $ | 1,929,000 | | | | 8.500 | | | | 01/12/23 | | | | 1,828,000 | |
| | Laureate Education, Inc.(b)(c) | |
| | 700,000 | | | | 8.250 | | | | 05/01/25 | | | | 749,000 | |
| | Monitronics International, Inc.(c) | |
| | 1,525,000 | | | | 9.125 | | | | 04/01/20 | | | | 1,136,125 | |
| | Prime Security Services Borrower LLC/Prime Finance, Inc.(b)(c) | |
| | 531,000 | | | | 9.250 | | | | 05/15/23 | | | | 560,869 | |
| | Refinitiv US Holdings, Inc.(b)(c) | |
| | 305,000 | | | | 6.250 | | | | 05/15/26 | | | | 302,713 | |
| | RR Donnelley & Sons Co. | |
| | 525,000 | | | | 6.000 | | | | 04/01/24 | | | | 504,000 | |
| | United Rentals North America, Inc.(c) | |
| | 570,000 | | | | 6.500 | | | | 12/15/26 | | | | 577,125 | |
| | Verisure Midholding AB(c) | |
| EUR | 1,400,000 | | | | 5.750 | | | | 12/01/23 | | | | 1,598,586 | |
| | Verscend Escrow Corp.(b)(c) | |
| $ | 600,000 | | | | 9.750 | | | | 08/15/26 | | | | 601,500 | |
| | | | | | | | | | | | | | |
| | | | | | | | | | | | | 8,623,504 | |
| | |
| Computers(b)(c) – 0.7% | |
| | Banff Merger Sub, Inc. | |
| EUR | 700,000 | | | | 8.375 | | | | 09/01/26 | | | | 784,689 | |
| $ | 1,000,000 | | | | 9.750 | | | | 09/01/26 | | | | 968,750 | |
| | Dell International LLC/EMC Corp. | |
| | 1,500,000 | | | | 5.875 | | | | 06/15/21 | | | | 1,522,500 | |
| | 440,000 | | | | 7.125 | | | | 06/15/24 | | | | 465,300 | |
| | 180,000 | | | | 8.100 | | | | 07/15/36 | | | | 203,423 | |
| | Unisys Corp. | |
| | 600,000 | | | | 10.750 | | | | 04/15/22 | | | | 672,000 | |
| | | | | | | | | | | | | | |
| | | | | | | | | | | | | 4,616,662 | |
| | |
| Distribution & Wholesale(b)(c)(f) – 0.0% | |
| | American Tire Distributors, Inc. | |
| | 60,000 | | | | 10.250 | | | | 03/01/22 | | | | 10,350 | |
| | |
| Diversified Financial Services – 2.2% | |
| | Ally Financial, Inc. | |
| | 340,000 | | | | 5.125 | | | | 09/30/24 | | | | 345,525 | |
| | Amigo Luxembourg SA(c) | |
| GBP | 550,000 | | | | 7.625 | | | | 01/15/24 | | | | 709,126 | |
| | Avation Capital SA(b)(c) | |
| $ | 1,500,000 | | | | 6.500 | | | | 05/15/21 | | | | 1,500,000 | |
| | BOC Aviation, Ltd.(c) | |
| | 900,000 | | | | 3.500 | | | | 09/18/27 | | | | 817,290 | |
| | Credit Acceptance Corp.(c) | |
| | 420,000 | | | | 7.375 | | | | 03/15/23 | | | | 432,600 | |
| | |
| | |
| The accompanying notes are an integral part of these financial statements. | | 65 |
GOLDMAN SACHS MULTI-MANAGER NON-CORE FIXED INCOME FUND
Schedule of Investments (continued)
October 31, 2018
| | | | | | | | | | | | | | |
Principal Amount | | | Interest Rate | | | Maturity
Date | | | Value | |
| Corporate Obligations – (continued) | |
| Diversified Financial Services – (continued) | |
| | Intrepid Aviation Group Holdings LLC/Intrepid Finance Co.(b)(c) | |
| $ | 1,500,000 | | | | 8.500 | % | | | 08/15/21 | | | $ | 1,503,750 | |
| | Jerrold Finco PLC(c) | |
| GBP | 850,000 | | | | 6.125 | | | | 01/15/24 | | | | 1,086,894 | |
| | Mulhacen Pte Ltd.(c)(i)(PIK 7.250%, Cash 6.500%) | |
| EUR | 1,350,000 | | | | 6.500 | | | | 08/01/23 | | | | 1,523,696 | |
| | Nationstar Mortgage Holdings, Inc.(b)(c) | |
| $ | 550,000 | | | | 8.125 | | | | 07/15/23 | | | | 558,250 | |
| | 800,000 | | | | 9.125 | | | | 07/15/26 | | | | 815,000 | |
| | Nationstar Mortgage LLC/Nationstar Capital Corp.(c) | |
| | 1,110,000 | | | | 6.500 | | | | 07/01/21 | | | | 1,105,837 | |
| | Springleaf Finance Corp. | |
| | 2,850,000 | | | | 6.875 | | | | 03/15/25 | | | | 2,721,750 | |
| | 920,000 | | | | 7.125 | | | | 03/15/26 | | | | 869,400 | |
| | Vantiv LLC/Vantiv Issuer Corp.(c) | |
| GBP | 850,000 | | | | 3.875 | | | | 11/15/25 | | | | 1,060,547 | |
| | | | | | | | | | | | | | |
| | | | | | | | | | | | | 15,049,665 | |
| | |
| Electrical – 1.3% | |
| | Cemig Geracao e Transmissao SA(b)(c) | |
| $ | 525,000 | | | | 9.250 | | | | 12/05/24 | | | | 558,889 | |
| | Centrais Eletricas Brasileiras SA | |
| | 200,000 | | | | 5.750 | | | | 10/27/21 | | | | 200,800 | |
| | Comision Federal de Electricidad | |
| | 145,000 | | | | 4.750 | | | | 02/23/27 | | | | 137,025 | |
| | Consorcio Transmantaro SA | |
| | 200,000 | | | | 4.375 | | | | 05/07/23 | | | | 197,500 | |
| | Drax Finco PLC(b)(c) | |
| | 750,000 | | | | 6.625 | | | | 11/01/25 | | | | 751,875 | |
| | Empresa Distribuidora Y Comercializadora Norte(c) | |
| | 125,000 | | | | 9.750 | | | | 10/25/22 | | | | 121,250 | |
| | Empresa Electrica Angamos SA | |
| | 813,025 | | | | 4.875 | | | | 05/25/29 | | | | 791,277 | |
| | Enel Chile SA | |
| | 200,000 | | | | 4.875 | | | | 06/12/28 | | | | 196,500 | |
| | Eskom Holdings SOC Ltd. | |
| | 860,000 | | | | 5.750 | | | | 01/26/21 | | | | 824,740 | |
| | 390,000 | | | | 6.750 | | | | 08/06/23 | | | | 365,157 | |
| Generacion Mediterranea SA/Generacion Frias SA/Central
Termica Roca SA(b)(c) |
|
| | 300,000 | | | | 9.625 | | | | 07/27/23 | | | | 255,030 | |
| | Kallpa Generacion SA(c) | |
| | 1,125,000 | | | | 4.125 | | | | 08/16/27 | | | | 1,026,563 | |
| | NRG Energy, Inc.(c) | |
| | 820,000 | | | | 6.250 | | | | 05/01/24 | | | | 840,500 | |
| | 810,000 | | | | 7.250 | | | | 05/15/26 | | | | 862,650 | |
| | Perusahaan Listrik Negara PT | |
| | 1,450,000 | | | | 4.125 | | | | 05/15/27 | | | | 1,310,437 | |
| | 130,000 | | | | 5.250 | (b) | | | 05/15/47 | | | | 113,699 | |
| | Viridian Group FinanceCo PLC/Viridian Power & Energy(c) | |
| EUR | 600,000 | | | | 4.000 | | | | 09/15/25 | | | | 658,237 | |
| | | | | | | | | | | | | | |
| | | | | | | | | | | | | 9,212,129 | |
| | |
| Electrical Components & Equipment(c) – 0.2% | |
| | Energizer Gamma Acquisition BV | |
| EUR | 1,100,000 | | | | 4.625 | | | | 07/15/26 | | | | 1,275,344 | |
| | |
| Corporate Obligations – (continued) | |
| Energy – Exploration & Production(f)(j) – 0.0% | |
| | Midstates Petroleum Co., Inc./Midstates Petroleum Co. LLC | |
| $ | 700,000 | | | | 10.000 | | | | 06/01/20 | | | | — | |
| | 72,000 | | | | 10.750 | | | | 10/01/20 | | | | — | |
| | 300,000 | | | | 9.250 | | | | 06/01/21 | | | | — | |
| | | | | | | | | | | | | | |
| | | | | | | | | | | | | — | |
| | |
| Engineering & Construction(c) – 0.8% | |
| | Aeropuerto Internacional de Tocumen SA | |
| | 990,000 | | | | 5.625 | | | | 05/18/36 | | | | 1,014,750 | |
| | frontdoor, Inc.(b) | |
| | 400,000 | | | | 6.750 | | | | 08/15/26 | | | | 408,000 | |
| | New Enterprise Stone & Lime Co., Inc.(b) | |
| | 565,000 | | | | 6.250 | | | | 03/15/26 | | | | 553,700 | |
| | Promontoria Holding 264 BV | |
| EUR | 600,000 | | | | 6.750 | | | | 08/15/23 | | | | 687,976 | |
| | Tutor Perini Corp.(b) | |
| $ | 1,600,000 | | | | 6.875 | | | | 05/01/25 | | | | 1,600,000 | |
| | Weekley Homes LLC/Weekley Finance Corp. | |
| | 1,005,000 | | | | 6.625 | | | | 08/15/25 | | | | 949,725 | |
| | | | | | | | | | | | | | |
| | | | | | | | | | | | | 5,214,151 | |
| | |
| Entertainment(c) – 1.4% | |
| | AMC Entertainment Holdings, Inc. | |
| GBP | 600,000 | | | | 6.375 | | | | 11/15/24 | | | | 767,074 | |
| | Caesars Resort Collection LLC/CRC Finco, Inc.(b) | |
| $ | 1,000,000 | | | | 5.250 | | | | 10/15/25 | | | | 930,000 | |
| | Eldorado Resorts, Inc. | |
| | 850,000 | | | | 6.000 | | | | 04/01/25 | | | | 839,375 | |
| | 335,000 | | | | 6.000 | (b) | | | 09/15/26 | | | | 328,300 | |
| | International Game Technology PLC | |
| EUR | 660,000 | | | | 3.500 | | | | 07/15/24 | | | | 747,190 | |
| $ | 600,000 | | | | 6.250 | (b) | | | 01/15/27 | | | | 588,000 | |
| | LHMC Finco Sarl | |
| EUR | 650,000 | | | | 6.250 | | | | 12/20/23 | | | | 760,496 | |
| $ | 595,000 | | | | 7.875 | (b) | | | 12/20/23 | | | | 598,719 | |
| | Rivers Pittsburgh Borrower LP/Rivers Pittsburgh Finance Corp.(b) | |
| | 845,000 | | | | 6.125 | | | | 08/15/21 | | | | 839,719 | |
| | Scientific Games International, Inc. | |
| | 1,450,000 | | | | 10.000 | | | | 12/01/22 | | | | 1,515,250 | |
| EUR | 1,083,000 | | | | 5.500 | | | | 02/15/26 | | | | 1,061,270 | |
| | Stars Group Holdings BV/Stars Group US Co-Borrower LLC(b) | |
| $ | 595,000 | | | | 7.000 | | | | 07/15/26 | | | | 602,437 | |
| | | | | | | | | | | | | | |
| | | | | | | | | | | | | 9,577,830 | |
| | |
| Environmental(b)(c) – 0.1% | |
| | GFL Environmental, Inc. | |
| | 695,000 | | | | 5.375 | | | | 03/01/23 | | | | 634,187 | |
| | |
| Finance(c) – 0.1% | |
| | Icahn Enterprises LP/Icahn Enterprises Finance Corp. | |
| | 500,000 | | | | 5.875 | | | | 02/01/22 | | | | 499,375 | |
| | 250,000 | | | | 6.250 | | | | 02/01/22 | | | | 251,875 | |
| | 200,000 | | | | 6.750 | | | | 02/01/24 | | | | 200,750 | |
| | | | | | | | | | | | | | |
| | | | | | | | | | | | | 952,000 | |
| | |
| | |
| 66 | | The accompanying notes are an integral part of these financial statements. |
GOLDMAN SACHS MULTI-MANAGER NON-CORE FIXED INCOME FUND
| | | | | | | | | | | | | | |
Principal Amount | | | Interest Rate | | | Maturity
Date | | | Value | |
| Corporate Obligations – (continued) | |
| Food & Drug Retailing – 0.9% | |
| Albertsons Cos. LLC/Safeway, Inc./New Albertsons
LP/Albertson's LLC(c) |
|
| $ | 900,000 | | | | 5.750 | % | | | 03/15/25 | | | $ | 794,250 | |
| | New Albertsons LP | |
| | 1,870,000 | | | | 7.450 | | | | 08/01/29 | | | | 1,561,450 | |
| | 725,000 | | | | 8.700 | | | | 05/01/30 | | | | 651,594 | |
| | 1,085,000 | | | | 8.000 | | | | 05/01/31 | | | | 927,675 | |
| | Pilgrim's Pride Corp.(b)(c) | |
| | 380,000 | | | | 5.750 | | | | 03/15/25 | | | | 354,350 | |
| | 1,490,000 | | | | 5.875 | | | | 09/30/27 | | | | 1,355,900 | |
| | Post Holdings, Inc.(b)(c) | |
| | 590,000 | | | | 5.000 | | | | 08/15/26 | | | | 542,800 | |
| | Simmons Foods, Inc.(b)(c) | |
| | 290,000 | | | | 5.750 | | | | 11/01/24 | | | | 210,612 | |
| | | | | | | | | | | | | | |
| | | | | | | | | | | | | 6,398,631 | |
| | |
| Forest Products & Paper(c) – 0.5% | |
| | Eldorado Intl. Finance GmbH | |
| | 2,100,000 | | | | 8.625 | | | | 06/16/21 | | | | 2,173,500 | |
| | Schweitzer-Mauduit International, Inc.(b) | |
| | 1,050,000 | | | | 6.875 | | | | 10/01/26 | | | | 1,063,125 | |
| | | | | | | | | | | | | | |
| | | | | | | | | | | | | 3,236,625 | |
| | |
| Gas(b)(c) – 0.1% | |
| | LBC Tank Terminals Holding Netherlands BV | |
| | 750,000 | | | | 6.875 | | | | 05/15/23 | | | | 738,750 | |
| | |
| Healthcare Providers & Services – 1.6% | |
| | Centene Corp.(b)(c) | |
| | 1,585,000 | | | | 5.375 | | | | 06/01/26 | | | | 1,608,775 | |
| | Charles River Laboratories International, Inc.(b)(c) | |
| | 395,000 | | | | 5.500 | | | | 04/01/26 | | | | 396,975 | |
| | CHS/Community Health Systems, Inc.(b)(c) | |
| | 535,000 | | | | 8.625 | | | | 01/15/24 | | | | 540,350 | |
| | HCA, Inc. | |
| | 850,000 | | | | 5.875 | | | | 05/01/23 | | | | 879,750 | |
| | 900,000 | | | | 5.250 | | | | 04/15/25 | | | | 919,125 | |
| | 133,000 | | | | 7.690 | | | | 06/15/25 | | | | 146,300 | |
| | RegionalCare Hospital Partners Holdings, Inc.(b)(c) | |
| | 220,000 | | | | 8.250 | | | | 05/01/23 | | | | 232,925 | |
| | Synlab Bondco PLC(c) | |
| EUR | 650,000 | | | | 6.250 | | | | 07/01/22 | | | | 759,156 | |
| | Tenet Healthcare Corp. | |
| $ | 1,400,000 | | | | 6.000 | | | | 10/01/20 | | | | 1,431,500 | |
| | 485,000 | | | | 8.125 | | | | 04/01/22 | | | | 504,400 | |
| | 250,000 | | | | 6.750 | | | | 06/15/23 | | | | 248,125 | |
| | 700,000 | | | | 4.625 | (c) | | | 07/15/24 | | | | 672,875 | |
| | 250,000 | | | | 5.125 | (c) | | | 05/01/25 | | | | 240,000 | |
| | 655,000 | | | | 7.000 | (c) | | | 08/01/25 | | | | 641,900 | |
| | WellCare Health Plans, Inc.(c) | |
| | 1,725,000 | | | | 5.250 | | | | 04/01/25 | | | | 1,720,688 | |
| | | | | | | | | | | | | | |
| | | | | | | | | | | | | 10,942,844 | |
| | |
| Home Builders(c) – 0.3% | |
| | Century Communities, Inc. | |
| | 710,000 | | | | 6.875 | | | | 05/15/22 | | | | 706,450 | |
| | M/I Homes, Inc. | |
| | 730,000 | | | | 5.625 | | | | 08/01/25 | | | | 669,775 | |
| | |
| Corporate Obligations – (continued) | |
| Home Builders(c) – (continued) | |
| | Mattamy Group Corp.(b) | |
| 450,000 | | | | 6.500 | | | | 10/01/25 | | | | 423,000 | |
| Taylor Morrison Communities, Inc./Taylor Morrison Holdings II,
Inc.(b) |
|
| | 375,000 | | | | 5.625 | | | | 03/01/24 | | | | 363,750 | |
| | | | | | | | | | | | | | |
| | | | | | | | | | | | | 2,162,975 | |
| | |
| Insurance – 0.4% | |
| | Fidelity & Guaranty Life Holdings, Inc.(b)(c) | |
| | 2,090,000 | | | | 5.500 | | | | 05/01/25 | | | | 2,061,262 | |
| | MGIC Investment Corp. | |
| | 500,000 | | | | 5.750 | | | | 08/15/23 | | | | 513,750 | |
| | 350,000 | | | | 9.000 | (b) | | | 04/01/63 | | | | 467,749 | |
| | | | | | | | | | | | | | |
| | | | | | | | | | | | | 3,042,761 | |
| | |
| Internet(b)(c) – 0.1% | |
| | Symantec Corp. | |
| | 575,000 | | | | 5.000 | | | | 04/15/25 | | | | 546,087 | |
| | |
| Iron/Steel(c) – 0.8% | |
| | Baffinland Iron Mines Corp./Baffinland Iron Mines LP(b) | |
| | 2,750,000 | | | | 8.750 | | | | 07/15/26 | | | | 2,770,625 | |
| | Big River Steel LLC/BRS Finance Corp.(b) | |
| | 600,000 | | | | 7.250 | | | | 09/01/25 | | | | 630,000 | |
| | Cleveland-Cliffs, Inc. | |
| | 800,000 | | | | 5.750 | | | | 03/01/25 | | | | 756,000 | |
| | United States Steel Corp. | |
| | 700,000 | | | | 6.875 | | | | 08/15/25 | | | | 684,250 | |
| | 500,000 | | | | 6.250 | | | | 03/15/26 | | | | 471,250 | |
| | | | | | | | | | | | | | |
| | | | | | | | | | | | | 5,312,125 | |
| | |
| Leisure Time(b)(c) – 0.3% | |
| | Silversea Cruise Finance Ltd. | |
| | 655,000 | | | | 7.250 | | | | 02/01/25 | | | | 704,944 | |
| | Viking Cruises Ltd. | |
| | 1,000,000 | | | | 6.250 | | | | 05/15/25 | | | | 1,000,000 | |
| | | | | | | | | | | | | | |
| | | | | | | | | | | | | 1,704,944 | |
| | |
| Lodging – 1.0% | |
| | Diamond Resorts International, Inc.(b)(c) | |
| | 890,000 | | | | 10.750 | | | | 09/01/24 | | | | 869,975 | |
| Inn of the Mountain Gods Resort & Casino(c)(i)(PIK 9.250% or
Cash 9.250%) |
|
| | 966,127 | | | | 9.250 | | | | 11/30/20 | | | | 932,313 | |
| | MGM Resorts International | |
| | 2,100,000 | | | | 6.000 | | | | 03/15/23 | | | | 2,126,250 | |
| | Station Casinos LLC(b)(c) | |
| | 1,765,000 | | | | 5.000 | | | | 10/01/25 | | | | 1,645,862 | |
| Sugarhouse HSP Gaming Prop Mezz LP/Sugarhouse HSP
Gaming Finance Corp.(b)(c) |
|
| | 1,425,000 | | | | 5.875 | | | | 05/15/25 | | | | 1,346,625 | |
| | | | | | | | | | | | | | |
| | | | | | | | | | | | | 6,921,025 | |
| | |
| Machinery – Construction & Mining(b)(c) – 0.1% | |
| | Vertiv Group Corp. | |
| | 565,000 | | | | 9.250 | | | | 10/15/24 | | | | 562,175 | |
| | |
| | |
| The accompanying notes are an integral part of these financial statements. | | 67 |
GOLDMAN SACHS MULTI-MANAGER NON-CORE FIXED INCOME FUND
Schedule of Investments (continued)
October 31, 2018
| | | | | | | | | | | | | | |
Principal Amount | | | Interest Rate | | | Maturity
Date | | | Value | |
| Corporate Obligations – (continued) | |
| Media – 4.4% | |
| | Altice Financing SA(b)(c) | |
| $ | 1,090,000 | | | | 7.500 | % | | | 05/15/26 | | | $ | 1,027,325 | |
| | Altice Finco SA(c) | |
| | 650,000 | | | | 8.125 | (b) | | | 01/15/24 | | | | 637,000 | |
| | 600,000 | | | | 7.625 | (b) | | | 02/15/25 | | | | 532,500 | |
| EUR | 600,000 | | | | 4.750 | | | | 01/15/28 | | | | 562,606 | |
| | Altice France SA(b)(c) | |
| $ | 1,000,000 | | | | 6.250 | | | | 05/15/24 | | | | 957,500 | |
| | 2,135,000 | | | | 7.375 | | | | 05/01/26 | | | | 2,049,600 | |
| | 1,400,000 | | | | 8.125 | | | | 02/01/27 | | | | 1,393,000 | |
| | Altice Luxembourg SA(b)(c) | |
| | 1,686,000 | | | | 7.625 | | | | 02/15/25 | | | | 1,437,315 | |
| | CCO Holdings LLC/CCO Holdings Capital Corp.(b)(c) | |
| | 715,000 | | | | 5.375 | | | | 05/01/25 | | | | 700,700 | |
| | 1,255,000 | | | | 5.125 | | | | 05/01/27 | | | | 1,179,700 | |
| | Cengage Learning, Inc.(b)(c) | |
| | 1,045,000 | | | | 9.500 | | | | 06/15/24 | | | | 897,394 | |
| Cequel Communications Holdings I LLC/Cequel Capital
Corp.(b)(c) |
|
| | 570,000 | | | | 7.500 | | | | 04/01/28 | | | | 589,950 | |
| | CSC Holdings LLC | |
| | 1,100,000 | | | | 6.750 | | | | 11/15/21 | | | | 1,149,500 | |
| | 215,000 | | | | 10.125 | (b)(c) | | | 01/15/23 | | | | 233,544 | |
| | 525,000 | | | | 10.875 | (b)(c) | | | 10/15/25 | | | | 605,063 | |
| | DISH DBS Corp. | |
| | 1,100,000 | | | | 5.125 | | | | 05/01/20 | | | | 1,102,750 | |
| | 1,030,000 | | | | 5.000 | | | | 03/15/23 | | | | 901,250 | |
| | 955,000 | | | | 5.875 | | | | 11/15/24 | | | | 816,525 | |
| | 600,000 | | | | 7.750 | | | | 07/01/26 | | | | 535,500 | |
| | iHeartCommunications, Inc.(c)(f) | |
| | 375,000 | | | | 9.000 | | | | 12/15/19 | | | | 270,000 | |
| | 930,000 | | | | 9.000 | | | | 03/01/21 | | | | 664,950 | |
| | Liberty Interactive LLC(c) | |
| | 2,252,935 | | | | 4.000 | | | | 11/15/29 | | | | 1,554,525 | |
| | 895,139 | | | | 3.750 | | | | 02/15/30 | | | | 613,170 | |
| | Meredith Corp.(b)(c) | |
| | 550,000 | | | | 6.875 | | | | 02/01/26 | | | | 550,000 | |
| | Salem Media Group, Inc.(b)(c) | |
| | 930,000 | | | | 6.750 | | | | 06/01/24 | | | | 832,350 | |
| | The McClatchy Co.(b)(c) | |
| | 725,000 | | | | 9.000 | | | | 07/15/26 | | | | 741,312 | |
| | Unitymedia GmbH(c) | |
| EUR | 950,000 | | | | 3.750 | | | | 01/15/27 | | | | 1,131,314 | |
| | Urban One, Inc.(b)(c) | |
| $ | 720,000 | | | | 9.250 | | | | 02/15/20 | | | | 694,800 | |
| | 825,000 | | | | 7.375 | | | | 04/15/22 | | | | 808,500 | |
| | Virgin Media Receivables Financing Notes I DAC(c) | |
| GBP | 1,250,000 | | | | 5.500 | | | | 09/15/24 | | | | 1,586,886 | |
| | Virgin Media Secured Finance PLC(b)(c) | |
| $ | 750,000 | | | | 5.250 | | | | 01/15/26 | | | | 695,625 | |
| | VTR Finance B.V.(c) | |
| | 179,000 | | | | 6.875 | | | | 01/15/24 | | | | 180,790 | |
| | Ziggo BV(b)(c) | |
| | 2,385,000 | | | | 5.500 | | | | 01/15/27 | | | | 2,191,219 | |
| | | | | | | | | | | | | | |
| | | | | | | | | | | | | 29,824,163 | |
| | |
| Corporate Obligations – (continued) | |
| Metal Fabricate/Hardware – 0.0% | |
| | TMK OAO Via TMK Capital SA | |
| 200,000 | | | | 6.750 | | | | 04/03/20 | | | | 200,000 | |
| | |
| Mining – 1.7% | |
| | Corp. Nacional del Cobre de Chile | |
| | 2,815,000 | | | | 4.500 | | | | 09/16/25 | | | | 2,798,321 | |
| | 405,000 | | | | 4.500 | (c) | | | 08/01/47 | | | | 373,088 | |
| | Eldorado Gold Corp.(b)(c) | |
| | 645,000 | | | | 6.125 | | | | 12/15/20 | | | | 603,075 | |
| | First Quantum Minerals Ltd.(b)(c) | |
| | 200,000 | | | | 7.250 | | | | 05/15/22 | | | | 190,500 | |
| | 685,000 | | | | 7.250 | | | | 04/01/23 | | | | 633,625 | |
| | 70,000 | | | | 6.500 | | | | 03/01/24 | | | | 61,075 | |
| | 705,000 | | | | 7.500 | | | | 04/01/25 | | | | 633,865 | |
| | 445,000 | | | | 6.875 | | | | 03/01/26 | | | | 384,925 | |
| | FMG Resources August 2006 Pty Ltd.(b)(c) | |
| | 2,000,000 | | | | 4.750 | | | | 05/15/22 | | | | 1,932,500 | |
| | Freeport-McMoRan, Inc. | |
| | 345,000 | | | | 4.000 | | | | 11/14/21 | | | | 336,375 | |
| | 247,000 | | | | 3.875 | (c) | | | 03/15/23 | | | | 229,093 | |
| | 1,550,000 | | | | 5.450 | (c) | | | 03/15/43 | | | | 1,313,625 | |
| | KME AG(c) | |
| EUR | 614,000 | | | | 6.750 | | | | 02/01/23 | | | | 648,971 | |
| | Mountain Province Diamonds, Inc.(b)(c) | |
| $ | 450,000 | | | | 8.000 | | | | 12/15/22 | | | | 456,750 | |
| | Northwest Acquisitions ULC/Dominion Finco, Inc.(b)(c) | |
| | 880,000 | | | | 7.125 | | | | 11/01/22 | | | | 886,600 | |
| | Vedanta Resources PLC(b) | |
| | 300,000 | | | | 6.375 | | | | 07/30/22 | | | | 280,244 | |
| | | | | | | | | | | | | | |
| | | | | | | | | | | | | 11,762,632 | |
| | |
| Miscellaneous Manufacturing(b)(c) – 0.1% | |
| | LSB Industries, Inc. | |
| | 550,000 | | | | 9.625 | | | | 05/01/23 | | | | 570,625 | |
| | |
| Oil Field Services – 5.2% | |
| | Ascent Resources Utica Holdings LLC/ARU Finance Corp.(b)(c) | |
| | 1,300,000 | | | | 7.000 | | | | 11/01/26 | | | | 1,257,750 | |
| | Bruin E&P Partners LLC(b)(c) | |
| | 982,000 | | | | 8.875 | | | | 08/01/23 | | | | 967,270 | |
| | California Resources Corp.(b)(c) | |
| | 1,108,000 | | | | 8.000 | | | | 12/15/22 | | | | 983,350 | |
| | Citgo Holding, Inc.(b) | |
| | 3,100,000 | | | | 10.750 | | | | 02/15/20 | | | | 3,224,000 | |
| | CITGO Petroleum Corp.(b)(c) | |
| | 795,000 | | | | 6.250 | | | | 08/15/22 | | | | 781,087 | |
| | Delek & Avner Tamar Bond Ltd.(b) | |
| | 485,000 | | | | 5.082 | | | | 12/30/23 | | | | 484,345 | |
| | 60,000 | | | | 5.412 | | | | 12/30/25 | | | | 59,919 | |
| | Energy Ventures Gom LLC/EnVen Finance Corp.(b)(c) | |
| | 750,000 | | | | 11.000 | | | | 02/15/23 | | | | 828,750 | |
| | EnQuest PLC(b)(c)(i)(PIK 7.000%) | |
| | 469,000 | | | | 7.000 | | | | 10/15/23 | | | | 423,859 | |
| | Ensco PLC(c) | |
| | 350,000 | | | | 5.750 | | | | 10/01/44 | | | | 245,000 | |
| | EP Energy LLC/Everest Acquisition Finance, Inc.(b)(c) | |
| | 500,000 | | | | 9.375 | | | | 05/01/24 | | | | 380,000 | |
| | 1,050,000 | | | | 7.750 | | | | 05/15/26 | | | | 1,047,375 | |
| | |
| | |
| 68 | | The accompanying notes are an integral part of these financial statements. |
GOLDMAN SACHS MULTI-MANAGER NON-CORE FIXED INCOME FUND
| | | | | | | | | | | | |
Principal Amount | | | Interest Rate | | Maturity
Date | | | Value | |
| Corporate Obligations – (continued) | |
| Oil Field Services – (continued) | |
| | FTS International, Inc.(c) | |
| $ | 2,381,000 | | | 6.250 % | | | 05/01/22 | | | $ | 2,261,950 | |
| | Halcon Resources Corp.(c) | |
| | 1,200,000 | | | 6.750 | | | 02/15/25 | | | | 1,089,000 | |
| | Jupiter Resources, Inc.(b)(c) | |
| | 1,370,000 | | | 8.500 | | | 10/01/22 | | | | 506,900 | |
| | KazMunayGas National Co. JSC | |
| | 500,000 | | | 5.375(b) | | | 04/24/30 | | | | 496,250 | |
| | 475,000 | | | 5.750 | | | 04/19/47 | | | | 452,438 | |
| | KCA Deutag UK Finance PLC(b)(c) | |
| | 1,320,000 | | | 9.875 | | | 04/01/22 | | | | 1,273,800 | |
| McDermott Technology Americas, Inc./McDermott Technology
US, Inc.(b)(c) |
|
| | 675,000 | | | 10.625 | | | 05/01/24 | | | | 607,500 | |
| | Noble Holding International Ltd.(c) | |
| | 895,000 | | | 7.750 | | | 01/15/24 | | | | 834,587 | |
| | 830,000 | | | 8.950 | | | 04/01/45 | | | | 778,125 | |
| | Parker Drilling Co.(c) | |
| | 795,000 | | | 6.750 | | | 07/15/22 | | | | 536,625 | |
| | Parsley Energy LLC/Parsley Finance Corp.(b)(c) | |
| | 850,000 | | | 5.375 | | | 01/15/25 | | | | 828,750 | |
| | 675,000 | | | 5.250 | | | 08/15/25 | | | | 654,750 | |
| | 665,000 | | | 5.625 | | | 10/15/27 | | | | 651,700 | |
| | Pertamina Persero PT | |
| | 665,000 | | | 6.450 | | | 05/30/44 | | | | 661,675 | |
| | Petrobras Global Finance BV | |
| | 900,000 | | | 5.299 | | | 01/27/25 | | | | 859,500 | |
| | 1,700,000 | | | 5.750 | | | 02/01/29 | | | | 1,576,750 | |
| | Petroleos de Venezuela SA(f) | |
| | 700,000 | | | 6.000 | | | 11/15/26 | | | | 120,750 | |
| | Petroleos del Peru SA | |
| | 575,000 | | | 5.625 | | | 06/19/47 | | | | 544,094 | |
| | Petroleos Mexicanos | |
| | 1,450,000 | | | 6.875 | | | 08/04/26 | | | | 1,444,200 | |
| | 100,000 | | | 6.500 | | | 03/13/27 | | | | 96,800 | |
| | 285,000 | | | 5.625 | | | 01/23/46 | | | | 220,847 | |
| | 475,000 | | | 6.750 | | | 09/21/47 | | | | 407,693 | |
| | (3M USD LIBOR + 3.650%) | |
| | 660,000 | | | 5.981(h) | | | 03/11/22 | | | | 684,750 | |
| | Pride International LLC | |
| | 230,000 | | | 7.875 | | | 08/15/40 | | | | 205,850 | |
| | Rowan Cos., Inc.(c) | |
| | 1,231,000 | | | 7.375 | | | 06/15/25 | | | | 1,169,450 | |
| | 85,000 | | | 5.400 | | | 12/01/42 | | | | 60,775 | |
| | 350,000 | | | 5.850 | | | 01/15/44 | | | | 259,000 | |
| | Southwestern Energy Co.(c) | |
| | 595,000 | | | 6.700 | | | 01/23/25 | | | | 578,637 | |
| | State Oil Co. of the Azerbaijan Republic | |
| | 200,000 | | | 4.750 | | | 03/13/23 | | | | 197,500 | |
| | Tengizchevroil Finance Co. International Ltd. | |
| | 525,000 | | | 4.000 | | | 08/15/26 | | | | 489,563 | |
| | Transocean Guardian Ltd.(b)(c) | |
| | 800,000 | | | 5.875 | | | 01/15/24 | | | | 792,000 | |
| | Transocean, Inc.(c) | |
| | 780,000 | | | 5.800 | | | 10/15/22 | | | | 750,750 | |
| | |
| Corporate Obligations – (continued) | |
| Oil Field Services – (continued) | |
| | Tullow Oil PLC(b)(c) | |
| $ | 1,550,000 | | | | 7.000 | % | | | 03/01/25 | | | | 1,513,187 | |
| USA Compression Partners LP/USA Compression Finance
Corp.(b)(c) |
|
| | 625,000 | | | | 6.875 | | | | 04/01/26 | | | | 628,125 | |
| | Weatherford International Ltd.(c) | |
| | 665,000 | | | | 9.875 | | | | 02/15/24 | | | | 518,700 | |
| | 450,000 | | | | 5.950 | | | | 04/15/42 | | | | 289,125 | |
| | | | | | | | | | | | | | |
| | | | | | | | | | | | | 35,724,801 | |
| | |
| Packaging(b)(c) – 0.1% | |
| | Intertape Polymer Group, Inc. | |
| | 735,000 | | | | 7.000 | | | | 10/15/26 | | | | 735,919 | |
| | |
| Pharmaceuticals(b)(c) – 1.1% | |
| | Bausch Health Cos., Inc. | |
| | 1,105,000 | | | | 5.625 | | | | 12/01/21 | | | | 1,088,425 | |
| | 1,335,000 | | | | 5.500 | | | | 03/01/23 | | | | 1,261,575 | |
| | 120,000 | | | | 5.875 | | | | 05/15/23 | | | | 114,600 | |
| | 215,000 | | | | 7.000 | | | | 03/15/24 | | | | 224,944 | |
| | 300,000 | | | | 9.000 | | | | 12/15/25 | | | | 312,750 | |
| | 1,095,000 | | | | 9.250 | | | | 04/01/26 | | | | 1,148,381 | |
| | 1,500,000 | | | | 8.500 | | | | 01/31/27 | | | | 1,533,750 | |
| | Endo Dac/Endo Finance LLC/Endo Finco, Inc. | |
| | 825,000 | | | | 6.000 | | | | 07/15/23 | | | | 709,500 | |
| | Rossini Sarl | |
| EUR | 1,220,000 | | | | 6.750 | | | | 10/30/25 | | | | 1,406,361 | |
| | | | | | | | | | | | | | |
| | | | | | | | | | | | | 7,800,286 | |
| | |
| Pipelines – 1.0% | |
| | AI Candelaria Spain SLU(b)(c) | |
| $ | 450,000 | | | | 7.500 | | | | 12/15/28 | | | | 442,125 | |
| | Blue Racer Midstream LLC/Blue Racer Finance Corp.(b)(c) | |
| | 1,350,000 | | | | 6.625 | | | | 07/15/26 | | | | 1,370,250 | |
| | Cheniere Corpus Christi Holdings LLC(c) | |
| | 425,000 | | | | 5.875 | | | | 03/31/25 | | | | 436,687 | |
| | CNX Midstream Partners LP/CNX Midstream Finance Corp.(b)(c) | |
| | 900,000 | | | | 6.500 | | | | 03/15/26 | | | | 882,000 | |
| Crestwood Midstream Partners LP/Crestwood Midstream Finance
Corp.(c) |
|
| | 980,000 | | | | 5.750 | | | | 04/01/25 | | | | 980,000 | |
| | DCP Midstream Operating LP | |
| | 375,000 | | | | 8.125 | | | | 08/16/30 | | | | 433,125 | |
| | Peru LNG Srl(b) | |
| | 225,000 | | | | 5.375 | | | | 03/22/30 | | | | 222,469 | |
| | Sabine Pass Liquefaction LLC(c) | |
| | 175,000 | | | | 6.250 | | | | 03/15/22 | | | | 186,464 | |
| | 175,000 | | | | 5.750 | | | | 05/15/24 | | | | 185,346 | |
| | SemGroup Corp./Rose Rock Finance Corp.(c) | |
| | 925,000 | | | | 5.625 | | | | 07/15/22 | | | | 897,250 | |
| | Transportadora de Gas Internacional SA ESP(c) | |
| | 950,000 | | | | 5.700 | | | | 03/20/22 | | | | 964,250 | |
| | | | | | | | | | | | | | |
| | | | | | | | | | | | | 6,999,966 | |
| | |
| Real Estate(b) – 0.7% | |
| | Realogy Group LLC/Realogy Co-Issuer Corp.(c) | |
| | 1,865,000 | | | | 4.875 | | | | 06/01/23 | | | | 1,690,156 | |
| | |
| | |
| The accompanying notes are an integral part of these financial statements. | | 69 |
GOLDMAN SACHS MULTI-MANAGER NON-CORE FIXED INCOME FUND
Schedule of Investments (continued)
October 31, 2018
| | | | | | | | | | | | | | |
Principal Amount | | | Interest Rate | | | Maturity
Date | | | Value | |
| Corporate Obligations – (continued) | |
| Real Estate(b) – (continued) | |
| | WeWork Cos., Inc. | |
| $ | 3,097,000 | | | | 7.875 | % | | | 05/01/25 | | | $ | 2,849,240 | |
| | | | | | | | | | | | | | |
| | | | | | | | | | | | | 4,539,396 | |
| | |
| Real Estate Investment Trust(c) – 0.2% | |
| | CTR Partnership LP/CareTrust Capital Corp. | |
| | 770,000 | | | | 5.250 | | | | 06/01/25 | | | | 750,750 | |
| MGM Growth Properties Operating Partnership LP/MGP Finance
Co-Issuer, Inc. |
|
| | 805,000 | | | | 4.500 | | | | 09/01/26 | | | | 735,569 | |
| | | | | | | | | | | | | | |
| | | | | | | | | | | | | 1,486,319 | |
| | |
| Retailing – 1.3% | |
| | 1011778 BC ULC/New Red Finance Inc(b)(c) | |
| | 778,000 | | | | 5.000 | | | | 10/15/25 | | | | 729,375 | |
| | 1011778 BC ULC/New Red Finance, Inc.(b)(c) | |
| | 645,000 | | | | 4.250 | | | | 05/15/24 | | | | 606,300 | |
| | Eurotorg LLC Via Bonitron DAC(b) | |
| | 200,000 | | | | 8.750 | | | | 10/30/22 | | | | 201,500 | |
| | Guitar Center Escrow Issuer, Inc.(b)(c) | |
| | 1,545,000 | | | | 9.500 | | | | 10/15/21 | | | | 1,510,237 | |
| | Guitar Center, Inc.(b)(c)(i)(PIK 8.000%, Cash 5.000%) | |
| | 1,715,632 | | | | 13.000 | | | | 04/15/22 | | | | 1,415,396 | |
| KFC Holding Co./Pizza Hut Holdings LLC/Taco Bell of America
LLC(b)(c) |
|
| | 1,720,000 | | | | 4.750 | | | | 06/01/27 | | | | 1,612,500 | |
| | Neiman Marcus Group Ltd. LLC(b)(c) | |
| | 260,000 | | | | 8.000 | | | | 10/15/21 | | | | 156,000 | |
| | PetSmart, Inc.(b)(c) | |
| | 657,000 | | | | 5.875 | | | | 06/01/25 | | | | 515,745 | |
| | Rite Aid Corp. | |
| | 1,095,000 | | | | 6.125 | (b)(c) | | | 04/01/23 | | | | 928,013 | |
| | 835,000 | | | | 7.700 | | | | 02/15/27 | | | | 584,500 | |
| | 390,000 | | | | 6.875 | (b) | | | 12/15/28 | | | | 265,200 | |
| | Yum! Brands, Inc. | |
| | 615,000 | | | | 6.875 | | | | 11/15/37 | | | | 618,844 | |
| | | | | | | | | | | | | | |
| | | | | | | | | | | | | 9,143,610 | |
| | |
| Semiconductors – 0.0% | |
| | Advanced Micro Devices, Inc. | |
| | 235,000 | | | | 7.500 | | | | 08/15/22 | | | | 256,738 | |
| | |
| Software(c) – 0.7% | |
| | Blackboard, Inc.(b) | |
| | 900,000 | | | | 9.750 | | | | 10/15/21 | | | | 652,500 | |
| | InterXion Holding NV | |
| EUR | 1,250,000 | | | | 4.750 | | | | 06/15/25 | | | | 1,474,201 | |
| | Rackspace Hosting, Inc.(b) | |
| $ | 940,000 | | | | 8.625 | | | | 11/15/24 | | | | 881,250 | |
| | Solera LLC/Solera Finance, Inc.(b) | |
| | 1,500,000 | | | | 10.500 | | | | 03/01/24 | | | | 1,623,750 | |
| | | | | | | | | | | | | | |
| | | | | | | | | | | | | 4,631,701 | |
| | |
| Sovereign – 0.2% | |
| | Instituto Costarricense de Electricidad | |
| | 200,000 | | | | 6.950 | | | | 11/10/21 | | | | 190,500 | |
| | 525,000 | | | | 6.375 | | | | 05/15/43 | | | | 372,259 | |
| | |
| Corporate Obligations – (continued) | |
| Sovereign – (continued) | |
| | Ukreximbank Via Biz Finance PLC | |
| 720,000 | | | | 9.625 | | | | 04/27/22 | | | | 726,300 | |
| | | | | | | | | | | | | | |
| | | | | | | | | | | | | 1,289,059 | |
| | |
| Storage/Warehousing(c) – 0.2% | |
| | Algeco Global Finance PLC | |
| EUR | 900,000 | | | | 6.500 | | | | 02/15/23 | | | | 1,052,597 | |
| | |
| Telecommunication Services – 3.2% | |
| | Axtel SAB de CV(b)(c) | |
| $ | 225,000 | | | | 6.375 | | | | 11/14/24 | | | | 212,625 | |
| | C&W Senior Financing DAC(b)(c) | |
| | 300,000 | | | | 6.875 | | | | 09/15/27 | | | | 285,750 | |
| | CenturyLink, Inc. | |
| | 685,000 | | | | 6.750 | | | | 12/01/23 | | | | 696,988 | |
| | 510,000 | | | | 7.500 | (c) | | | 04/01/24 | | | | 534,225 | |
| | 670,000 | | | | 5.625 | (c) | | | 04/01/25 | | | | 639,850 | |
| | Comunicaciones Celulares SA Via Comcel Trust(c) | |
| | 330,000 | | | | 6.875 | | | | 02/06/24 | | | | 337,549 | |
| | Digicel Ltd.(b)(c) | |
| | 1,250,000 | | | | 6.000 | | | | 04/15/21 | | | | 1,134,375 | |
| | 210,000 | | | | 6.750 | | | | 03/01/23 | | | | 168,525 | |
| | Frontier Communications Corp. | |
| | 370,000 | | | | 6.250 | (c) | | | 09/15/21 | | | | 318,200 | |
| | 575,000 | | | | 10.500 | (c) | | | 09/15/22 | | | | 479,406 | |
| | 445,000 | | | | 7.125 | | | | 01/15/23 | | | | 295,925 | |
| | 915,000 | | | | 6.875 | (c) | | | 01/15/25 | | | | 516,975 | |
| | 609,000 | | | | 11.000 | (c) | | | 09/15/25 | | | | 447,615 | |
| | 1,958,000 | | | | 8.500 | (b)(c) | | | 04/01/26 | | | | 1,816,045 | |
| | Intelsat Jackson Holdings SA(b)(c) | |
| | 1,000,000 | | | | 8.500 | | | | 10/15/24 | | | | 985,000 | |
| | Level 3 Financing, Inc.(c) | |
| | 650,000 | | | | 5.375 | | | | 01/15/24 | | | | 643,500 | |
| | Liquid Telecommunications Financing PLC(c) | |
| | 400,000 | | | | 8.500 | | | | 07/13/22 | | | | 408,084 | |
| | Sprint Capital Corp. | |
| | 150,000 | | | | 6.875 | | | | 11/15/28 | | | | 147,375 | |
| | 950,000 | | | | 8.750 | | | | 03/15/32 | | | | 1,036,687 | |
| | Sprint Corp. | |
| | 1,050,000 | | | | 7.250 | | | | 09/15/21 | | | | 1,098,562 | |
| | 2,485,000 | | | | 7.875 | | | | 09/15/23 | | | | 2,652,737 | |
| | 350,000 | | | | 7.125 | | | | 06/15/24 | | | | 357,875 | |
| | 1,412,000 | | | | 7.625 | (c) | | | 02/15/25 | | | | 1,464,950 | |
| | T-Mobile USA, Inc.(c) | |
| | 300,000 | | | | 6.000 | | | | 04/15/24 | | | | 307,875 | |
| | 100,000 | | | | 6.375 | | | | 03/01/25 | | | | 102,875 | |
| | Telecom Italia Finance SA | |
| EUR | 850,000 | | | | 7.750 | | | | 01/24/33 | | | | 1,227,962 | |
| | Telesat Canada/Telesat LLC(b)(c) | |
| $ | 1,950,000 | | | | 8.875 | | | | 11/15/24 | | | | 2,081,625 | |
| | Wind Tre SpA(c) | |
| EUR | 450,000 | | | | 3.125 | | | | 01/20/25 | | | | 464,065 | |
| $ | 655,000 | | | | 5.000 | (b) | | | 01/20/26 | | | | 555,113 | |
| | Windstream Services LLC/Windstream Finance Corp.(c) | |
| | 820,000 | | | | 6.375 | (b) | | | 08/01/23 | | | | 397,700 | |
| | 265,000 | | | | 6.375 | | | | 08/01/23 | | | | 128,525 | |
| | | | | | | | | | | | | | |
| | | | | | | | | | | | | 21,944,563 | |
| | |
| | |
| 70 | | The accompanying notes are an integral part of these financial statements. |
GOLDMAN SACHS MULTI-MANAGER NON-CORE FIXED INCOME FUND
| | | | | | | | | | | | | | |
Principal Amount | | | Interest Rate | | | Maturity
Date | | | Value | |
| Corporate Obligations – (continued) | |
| Textiles(b)(c) – 0.2% | |
| | Eagle Intermediate Global Holding BV/Ruyi US Finance LLC | |
| $ | 1,450,000 | | | | 7.500 % | | | | 05/01/25 | | | $ | 1,404,687 | |
| | |
| Transportation(b)(c) – 0.1% | |
| | The Kenan Advantage Group, Inc. | |
| | 750,000 | | | | 7.875 | | | | 07/31/23 | | | | 755,625 | |
| | |
| Trucking & Leasing(b)(c) – 0.3% | |
| | Avolon Holdings Funding Ltd. | |
| | 1,500,000 | | | | 5.125 | | | | 10/01/23 | | | | 1,471,875 | |
| | Fortress Transportation & Infrastructure Investors LLC | |
| | 370,000 | | | | 6.750 | | | | 03/15/22 | | | | 379,250 | |
| | 245,000 | | | | 6.500 | | | | 10/01/25 | | | | 240,712 | |
| | | | | | | | | | | | | | |
| | | | | 2,091,837 | |
| | |
| | TOTAL CORPORATE OBLIGATIONS | |
| | (Cost $278,665,028) | | | $ | 268,803,128 | |
| | |
| | | | | | | | | | | | | | |
| Bank Loans(k) – 16.4% | |
| Aerospace & Defense(h) – 0.2% | |
| | Sequa Corp.(3M LIBOR + 5.000%) | |
| $ | 247,494 | | | | 7.399 | | | | 11/28/21 | | | $ | 244,091 | |
| | Sequa Mezzanine Holdings LLC(3M LIBOR + 9.000%) | |
| | 250,000 | | | | 11.520 | | | | 04/28/22 | | | | 244,375 | |
| | TransDigm, Inc. | |
| | (1M LIBOR + 2.500%) | |
| | 248,750 | | | | 4.802 | | | | 06/09/23 | | | | 247,417 | |
| | (1M LIBOR + 2.500%) | |
| | 621,711 | | | | 4.802 | | | | 08/22/24 | | | | 618,459 | |
| | | | | | | | | | | | | | |
| | | | | | | | | | | | | 1,354,342 | |
| | |
| Airlines(h) – 0.4% | |
| | American Airlines, Inc.(1M LIBOR + 2.000%) | |
| | 2,167,538 | | | | 4.295 | | | | 04/28/23 | | | | 2,149,656 | |
| | United Airlines, Inc.(1M LIBOR + 1.750%) | |
| | 498,734 | | | | 4.052 | | | | 04/01/24 | | | | 497,178 | |
| | | | | | | | | | | | | | |
| | | | | | | | | | | | | 2,646,834 | |
| | |
| Automotive – Parts(h) – 0.6% | |
| | Capital Automotive LP(1M LIBOR + 2.500%) | |
| | 1,237,979 | | | | 4.810 | | | | 03/24/24 | | | | 1,237,359 | |
| | Evergreen Skills Lux S.a.r.l.(1M LIBOR + 4.750%) | |
| | 941,880 | | | | 7.052 | | | | 04/28/21 | | | | 868,545 | |
| | Gates Global LLC(1M LIBOR + 2.750%) | |
| | 495,000 | | | | 5.052 | | | | 04/01/24 | | | | 495,223 | |
| | Jaguar Holding Company II(1M LIBOR + 2.500%) | |
| | 998,711 | | | | 4.802 | | | | 08/18/22 | | | | 994,966 | |
| | Navistar International Corp.(1M LIBOR + 3.500%) | |
| | 496,250 | | | | 5.780 | | | | 11/06/24 | | | | 496,662 | |
| | | | | | | | | | | | | | |
| | | | | | | | | | | | | 4,092,755 | |
| | |
| Building Materials(h) – 0.1% | |
| | Quikrete Holdings, Inc.(1M LIBOR + 2.750%) | |
| | 968,805 | | | | 5.052 | | | | 11/15/23 | | | | 964,329 | |
| | |
| Chemicals(h) – 0.1% | |
| | Univar, Inc.(1M LIBOR + 2.250%) | |
| | 574,050 | | | | 4.552 | | | | 07/01/24 | | | | 573,551 | |
| | |
| Bank Loans(k) – (continued) | |
| Commercial Services(h) – 0.1% | |
| | Monitronics International, Inc.(3M LIBOR + 5.500%) | |
| $ | 540,980 | | | | 7.886 | % | | | 09/30/22 | | | | 529,149 | |
| | |
| Consumer Cyclical Services(h) – 0.1% | |
| | First Data Corp.(1M LIBOR + 2.000%) | |
| | 742,523 | | | | 4.287 | | | | 04/26/24 | | | | 738,194 | |
| | |
| Consumer Cyclical Services – Business(h) – 0.3% | |
| | First Data Corp.(1M LIBOR + 2.000%) | |
| | 1,332,611 | | | | 4.287 | | | | 07/08/22 | | | | 1,327,787 | |
| | Prime Security Services Borrower LLC(1M LIBOR + 2.750%) | |
| | 395,990 | | | | 5.052 | | | | 05/02/22 | | | | 395,812 | |
| | | | | | | | | | | | | | |
| | | | | | | | | | | | | 1,723,599 | |
| | |
| Consumer Noncyclical – 0.2% | |
| | Jacobs Douwe Egberts International B.V.(m) | |
| | 500,000 | | | | 2.250 | | | | 07/01/22 | | | | 499,845 | |
| | Lifescan Global Corp.(h)(3M LIBOR + 6.000%) | |
| | 600,000 | | | | 8.396 | | | | 09/27/24 | | | | 585,252 | |
| | NeuStar, Inc.(h)(1M LIBOR + 8.000%) | |
| | 224,563 | | | | 10.302 | | | | 08/08/25 | | | | 222,131 | |
| | | | | | | | | | | | | | |
| | | | | | | | | | | | | 1,307,228 | |
| | |
| Consumer Products – Household & Leisure(h) – 0.2% | |
| | Coty, Inc.(1M LIBOR + 2.250%) | |
| | 997,500 | | | | 4.531 | | | | 04/07/25 | | | | 975,884 | |
| | Revlon Consumer Products Corp.(3M LIBOR + 3.500%) | |
| | 771,508 | | | | 5.837 | | | | 09/07/23 | | | | 563,417 | |
| | | | | | | | | | | | | | |
| | | | | | | | | | | | | 1,539,301 | |
| | |
| Consumer Products – Non Durable(h) – 0.0% | |
| | Alphabet Holding Co., Inc.(1M LIBOR + 3.500%) | |
| | 249,370 | | | | 5.802 | | | | 09/26/24 | | | | 238,283 | |
| | |
| Distribution & Wholesale(h) – 0.0% | |
| | American Tire Distributors Holdings, Inc.(3M LIBOR + 4.250%) | |
| | 300,072 | | | | 6.636 | | | | 09/01/21 | | | | 265,189 | |
| | |
| Electrical(h) – 0.1% | |
| | Vistra Energy Corp.(1M LIBOR + 2.000%) | |
| | 748,125 | | | | 4.296 | | | | 12/31/25 | | | | 745,402 | |
| | |
| Energy(h) – 0.2% | |
| | Epic Y-Grade Services, LP(1M LIBOR + 5.500%) | |
| | 575,155 | | | | 7.802 | | | | 06/13/24 | | | | 566,527 | |
| | Peabody Energy Corp.(1M LIBOR + 2.750%) | |
| | 497,500 | | | | 5.052 | | | | 03/31/25 | | | | 496,097 | |
| | Seadrill Partners Finco LLC(3M LIBOR + 6.000%) | |
| | 516,657 | | | | 8.386 | | | | 02/21/21 | | | | 478,265 | |
| | | | | | | | | | | | | | |
| | | | | | | | | | | | | 1,540,889 | |
| | |
| Energy – Exploration & Production(h) – 0.3% | |
| | Fieldwood Energy LLC | |
| | (1M LIBOR + 5.250%) | |
| | 401,985 | | | | 7.552 | | | | 04/11/22 | | | | 403,746 | |
| | (1M LIBOR + 7.250%) | |
| | 1,737,440 | | | | 9.552 | | | | 04/11/23 | | | | 1,673,728 | |
| | | | | | | | | | | | | | |
| | | | | | | | | | | | | 2,077,474 | |
| | |
| | |
| The accompanying notes are an integral part of these financial statements. | | 71 |
GOLDMAN SACHS MULTI-MANAGER NON-CORE FIXED INCOME FUND
Schedule of Investments (continued)
October 31, 2018
| | | | | | | | | | | | |
Principal Amount | | | Interest Rate | | Maturity
Date | | | Value | |
| Bank Loans(k) – (continued) | |
| Entertainment(h) – 0.2% | |
| | Delta 2 (LUX) S.A.R.L.(1M LIBOR + 2.500%) | |
| $ | 1,000,000 | | | 4.802 % | | | 02/01/24 | | | $ | 988,750 | |
| | LTF Merger Sub, Inc.(3M LIBOR + 2.750%) | |
| | 496,241 | | | 5.063 | | | 06/10/22 | | | | 495,313 | |
| | | | | | | | | | | | |
| | | | | | | | | | | 1,484,063 | |
| | |
| Environmental(h) – 0.2% | |
| | Advanced Disposal Services, Inc.(1 Week LIBOR + 2.250%) | |
| | 1,439,362 | | | 4.460 | | | 11/10/23 | | | | 1,438,470 | |
| | |
| Financial Services(h) – 0.3% | |
| | RPI Finance Trust(3M LIBOR + 2.000%) | |
| | 1,491,703 | | | 4.386 | | | 03/27/23 | | | | 1,491,971 | |
| | Walter Investment Management Corp.(1M LIBOR + 6.000%) | |
| | 637,788 | | | 8.302 | | | 06/30/22 | | | | 590,911 | |
| | | | | | | | | | | | |
| | | | | | | | | | | 2,082,882 | |
| | |
| Food & Beverage(h) – 0.2% | |
| | 8th Avenue Food & Provisions, Inc.(3M LIBOR + 3.750%) | |
| | 500,000 | | | 6.006 | | | 10/01/25 | | | | 503,750 | |
| | US Foods, Inc.(1M LIBOR + 2.000%) | |
| | 994,911 | | | 4.302 | | | 06/27/23 | | | | 992,802 | |
| | | | | | | | | | | | |
| | | | | | | | | | | 1,496,552 | |
| | |
| Food & Drug Retailers(h) – 0.1% | |
| | Albertsons LLC(3M LIBOR + 3.000%) | |
| | 624,417 | | | 5.311 | | | 06/22/23 | | | | 621,295 | |
| | |
| Gaming – 1.0% | |
| | Caesars Resort Collection LLC(h)(1M LIBOR + 2.750%) | |
| | 992,500 | | | 5.052 | | | 12/22/24 | | | | 992,361 | |
| | Fantasy Springs Resort(j) | |
| | 210,494 | | | 9.000 | | | 12/17/21 | | | | 213,125 | |
| | Mashantucket (Western) Pequot Tribe(h)(1M LIBOR + 8.125%) | |
| | 1,515,531 | | | 10.427 | | | 06/30/20 | | | | 1,485,221 | |
| | Mohegan Tribal Gaming Authority(h)(1M LIBOR + 4.000%) | |
| | 582,956 | | | 6.302 | | | 10/13/23 | | | | 546,107 | |
| | Scientific Games International, Inc.(h)(2M LIBOR + 2.750%) | |
| | 1,991,247 | | | 5.048 | | | 08/14/24 | | | | 1,970,618 | |
| | The Stars Group, Inc. | |
| | 1,497,500 | | | 5.886 | | | 07/10/25 | | | | 1,502,906 | |
| | | | | | | | | | | | |
| | | | | | | | | | | 6,710,338 | |
| | |
| Health Care – Medical Products(h) – 0.2% | |
| | Carestream Dental Equiment, Inc(3M LIBOR + 3.250%) | |
| | 346,500 | | | 5.636 | | | 09/01/24 | | | | 344,986 | |
| | Carestream Health, Inc. | |
| | (1M LIBOR + 4.000%) | |
| | 155,382 | | | 6.302 | | | 06/07/19 | | | | 154,838 | |
| | (1M LIBOR + 8.500%) | |
| | 193,550 | | | 10.802 | | | 12/07/19 | | | | 192,582 | |
| | MedPlast Holdings, Inc.(3M LIBOR + 3.750%) | |
| | 400,000 | | | 6.148 | | | 07/02/25 | | | | 402,000 | |
| | | | | | | | | | | | |
| | | | | | | | | | | 1,094,406 | |
| | |
| Health Care – Pharmaceuticals(h) – 0.7% | |
| | Concordia International Corp.(1M LIBOR + 5.500%) | |
| | 1,288,000 | | | 7.781 | | | 09/06/24 | | | | 1,259,020 | |
| | |
| Bank Loans(k) – (continued) | |
| Health Care – Pharmaceuticals(h) – (continued) | |
| Grifols Worldwide Operations USA, Inc.(1 Week
LIBOR + 2.250%) |
|
| 1,492,500 | | | | 4.467 | | | | 01/31/25 | | | | 1,493,171 | |
| | PharMerica Corp.(1M LIBOR + 3.500%) | |
| | 248,750 | | | | 5.780 | | | | 12/06/24 | | | | 249,295 | |
| Valeant Pharmaceuticals International, Inc.(1M
LIBOR + 3.000%) |
|
| | 1,865,000 | | | | 5.274 | | | | 06/01/25 | | | | 1,864,571 | |
| | | | | | | | | | | | | | |
| | | | | | | | | | | | | 4,866,057 | |
| | |
| Health Care – Services(h) – 0.8% | |
| | AHP Health Partners, Inc.(1M LIBOR + 4.500%) | |
| | 349,125 | | | | 6.802 | | | | 06/30/25 | | | | 350,326 | |
| | Air Medical Group Holdings, Inc.(1M LIBOR + 4.250%) | |
| | 114,969 | | | | 6.530 | | | | 03/14/25 | | | | 112,669 | |
| | Change Healthcare Holdings, Inc.(1M LIBOR + 2.750%) | |
| | 975,000 | | | | 5.052 | | | | 03/01/24 | | | | 973,420 | |
| | Community Health Systems, Inc.(3M LIBOR + 3.250%) | |
| | 262,179 | | | | 5.563 | | | | 01/27/21 | | | | 256,341 | |
| | Gentiva Health Services, Inc.(1M LIBOR + 3.750%) | |
| | 1,086,425 | | | | 6.063 | | | | 07/02/25 | | | | 1,090,499 | |
| | HCA, Inc.(1M LIBOR + 1.750%) | |
| | 551,325 | | | | 4.052 | | | | 03/18/23 | | | | 553,095 | |
| | IQVIA, Inc.(3M LIBOR + 1.750%) | |
| | 498,750 | | | | 4.136 | | | | 06/11/25 | | | | 496,880 | |
| | Parexel International Corp.(1M LIBOR + 2.750%) | |
| | 995,000 | | | | 5.052 | | | | 09/27/24 | | | | 979,458 | |
| | Quorum Health Corp.(1M LIBOR + 6.750%) | |
| | 71,348 | | | | 9.052 | | | | 04/29/22 | | | | 71,950 | |
| | Verscend Holding Corp.(1M LIBOR + 4.500%) | |
| | 250,000 | | | | 6.802 | | | | 08/27/25 | | | | 251,798 | |
| | | | | | | | | | | | | | |
| | | | | | | | | | | | | 5,136,436 | |
| | |
| Hotels, Restaurants & Leisure(h) – 0.1% | |
| | Caesars Entertainment Operating Co., Inc.(1M LIBOR + 2.000%) | |
| | 745,619 | | | | 4.302 | | | | 10/06/24 | | | | 741,518 | |
| | |
| Lodging(h) – 0.3% | |
| | Hilton Worldwide Finance LLC(1M LIBOR + 1.750%) | |
| | 750,000 | | | | 4.031 | | | | 10/25/23 | | | | 750,472 | |
| | Las Vegas Sands LLC(1M LIBOR + 1.750%) | |
| | 497,500 | | | | 4.052 | | | | 03/27/25 | | | | 495,411 | |
| | Station Casinos LLC(1M LIBOR + 2.500%) | |
| | 497,433 | | | | 4.810 | | | | 06/08/23 | | | | 496,762 | |
| | | | | | | | | | | | | | |
| | | | | | | | | | | | | 1,742,645 | |
| | |
| Machinery-Diversified – 0.2% | |
| | Gardner Denver, Inc.(h)(1M LIBOR + 2.750%) | |
| | 598,518 | | | | 5.052 | | | | 07/30/24 | | | | 599,344 | |
| | NN, Inc.(m) | |
| | 346,316 | | | | 3.250 | | | | 04/02/21 | | | | 345,450 | |
| | North American Lifting Holdings, Inc.(h)(3M LIBOR + 4.500%) | |
| | 597,521 | | | | 6.886 | | | | 11/27/20 | | | | 567,645 | |
| | | | | | | | | | | | | | |
| | | | | | | | | | | | | 1,512,439 | |
| | |
| Media(h) – 0.5% | |
| | Altice France SA(1M LIBOR + 4.000%) | |
| | 500,000 | | | | 6.280 | | | | 08/14/26 | | | | 489,065 | |
| | |
| | |
| 72 | | The accompanying notes are an integral part of these financial statements. |
GOLDMAN SACHS MULTI-MANAGER NON-CORE FIXED INCOME FUND
| | | | | | | | | | | | | | |
Principal Amount | | | Interest Rate | | | Maturity
Date | | | Value | |
| Bank Loans(k) – (continued) | |
| Media(h) – (continued) | |
| | CSC Holdings LLC(1M LIBOR + 2.250%) | |
| $ | 496,222 | | | | 4.530 | % | | | 07/17/25 | | | $ | 494,629 | |
| | Cumulus Media Holdings, Inc.(1M LIBOR + 4.500%) | |
| | 1,597,387 | | | | 6.810 | | | | 05/15/22 | | | | 1,576,429 | |
| | Sinclair Television Group, Inc.(1M LIBOR + 2.250%) | |
| | 497,468 | | | | 4.560 | | | | 01/03/24 | | | | 498,244 | |
| | | | | | | | | | | | | | |
| | | | | | | | | | | | | 3,058,367 | |
| | |
| Media – Broadcasting & Radio – 0.8% | |
| | Communications Sales & Leasing, Inc.(h)(1M LIBOR + 3.000%) | |
| | 517,295 | | | | 5.302 | | | | 10/24/22 | | | | 488,326 | |
| | Getty Images, Inc.(h)(1M LIBOR + 3.500%) | |
| | 347,237 | | | | 5.802 | | | | 10/18/19 | | | | 342,896 | |
| | iHeart Communications, Inc. | |
| | 3,350,000 | | | | 0.000 | | | | 01/30/19 | | | | 2,412,938 | |
| | 250,000 | | | | 0.000 | | | | 07/30/19 | | | | 179,653 | |
| | Meredith Corp.(h)(1M LIBOR + 2.750%) | |
| | 576,153 | | | | 5.242 | | | | 01/31/25 | | | | 574,805 | |
| | Metro-Goldwyn-Mayer, Inc.(h)(1M LIBOR + 2.500%) | |
| | 500,000 | | | | 4.810 | | | | 07/03/25 | | | | 501,250 | |
| | Radio One, Inc.(h)(1M LIBOR + 4.000%) | |
| | 536,560 | | | | 6.310 | | | | 04/18/23 | | | | 524,488 | |
| | Tribune Media Co.(h)(1M LIBOR + 3.000%) | |
| | 342,824 | | | | 5.302 | | | | 12/27/20 | | | | 343,359 | |
| | | | | | | | | | | | | | |
| | | | | | | | | | | | | 5,367,715 | |
| | |
| Media – Cable(h) – 0.5% | |
| | Charter Communications Operating LLC(1M LIBOR + 2.000%) | |
| | 3,219,297 | | | | 4.310 | | | | 04/30/25 | | | | 3,218,911 | |
| | Ziggo Secured Finance BV(1M LIBOR + 2.500%) | |
| | 500,000 | | | | 4.780 | | | | 04/15/25 | | | | 490,085 | |
| | | | | | | | | | | | | | |
| | | | | | | | | | | | | 3,708,996 | |
| | |
| Media – Non Cable(h) – 0.6% | |
| | Advantage Sales & Marketing, Inc.(1M LIBOR + 3.250%) | |
| | 241,206 | | | | 5.552 | | | | 07/23/21 | | | | 218,895 | |
| | Cengage Learning Acquisitions, Inc.(1M LIBOR + 4.250%) | |
| | 2,540,965 | | | | 6.530 | | | | 06/07/23 | | | | 2,351,180 | |
| | EMI Music Publishing Ltd.(1M LIBOR + 2.250%) | |
| | 466,388 | | | | 4.530 | | | | 08/20/23 | | | | 466,304 | |
| | Houghton Mifflin Harcourt Publishing Co.(1M LIBOR + 3.000%) | |
| | 294,670 | | | | 5.295 | | | | 05/31/21 | | | | 269,991 | |
| McGraw-Hill Global Education Holdings LLC(1M
LIBOR + 4.000%) |
|
| | 689,125 | | | | 6.302 | | | | 05/04/22 | | | | 660,271 | |
| | | | | | | | | | | | | | |
| | | | | | | | | | | | | 3,966,641 | |
| | |
| Metals & Mining(h) – 0.0% | |
| | Unimin Corp.(3M LIBOR + 3.750%) | |
| | 153,778 | | | | 6.136 | | | | 06/01/25 | | | | 128,117 | |
| | |
| Noncaptive – Financial(h) – 0.3% | |
| | Avolon TLB Borrower 1 (US) LLC(1M LIBOR + 2.000%) | |
| | 1,745,625 | | | | 4.280 | | | | 01/15/25 | | | | 1,740,091 | |
| | |
| Oil & Gas Services(h) – 0.1% | |
| | EG Finco Ltd.(3M LIBOR + 4.000%) | |
| | 298,500 | | | | 6.386 | | | | 02/07/25 | | | | 298,425 | |
| | |
| Bank Loans(k) – (continued) | |
| Oil & Gas Services(h) – (continued) | |
| | McDermott Technology Americas, Inc.(1M LIBOR + 5.000%) | |
| 348,250 | | | 7.302 | | | 05/10/25 | | | | 343,462 | |
| | | | | | | | | | | | |
| | | | | | | | | | | 641,887 | |
| | |
| Oil Field Services(h) – 0.3% | |
| | California Resources Corp.(1M LIBOR + 4.750%) | |
| | 1,750,000 | | | 7.037 | | | 12/31/22 | | | | 1,773,327 | |
| | |
| Packaging(h) – 0.2% | |
| | Reynolds Group Holdings, Inc.(1M LIBOR + 2.750%) | |
| | 1,134,628 | | | 5.052 | | | 02/05/23 | | | | 1,134,628 | |
| | |
| Pharmaceuticals(h) – 0.0% | |
| | Alphabet Holding Co., Inc.(1M LIBOR + 7.750%) | |
| | 350,000 | | | 10.052 | | | 09/26/25 | | | | 310,478 | |
| | |
| Pipelines(h) – 0.0% | |
| | Traverse Midstream Partners LLC(6M LIBOR + 4.000%) | |
| | 218,750 | | | 6.600 | | | 09/27/24 | | | | 219,981 | |
| | |
| Real Estate(h) – 0.2% | |
| | Empire Generating Co. LLC | |
| | (3M LIBOR + 4.250%) | |
| | 2,442 | | | 6.640 | | | 03/14/21 | | | | 1,825 | |
| | (3M LIBOR + 4.250%) | |
| | 24,696 | | | 6.640 | | | 03/14/21 | | | | 18,460 | |
| | GGP, Inc.(1M LIBOR + 2.500%) | |
| | 550,000 | | | 4.795 | | | 08/27/25 | | | | 540,672 | |
| | MGM Growth Properties LLC(1M LIBOR + 2.000%) | |
| | 500,000 | | | 2.000 | | | 03/21/25 | | | | 498,215 | |
| | Realogy Corp.(1M LIBOR + 2.250%) | |
| | 496,250 | | | 4.530 | | | 02/08/25 | | | | 494,543 | |
| | | | | | | | | | | | |
| | | | | | | | | | | 1,553,715 | |
| | |
| Restaurants(h) – 0.4% | |
| | 1011778 B.C. Unlimited Liability Co.(1M LIBOR + 2.250%) | |
| | 2,963,089 | | | 4.552 | | | 02/16/24 | | | | 2,950,495 | |
| | |
| Retailers(h) – 0.6% | |
| | Academy Ltd.(1M LIBOR + 4.000%) | |
| | 1,509,807 | | | 6.259 | | | 07/01/22 | | | | 1,121,983 | |
| | Neiman Marcus Group Ltd., Inc.(1M LIBOR + 3.250%) | |
| | 951,611 | | | 5.531 | | | 10/25/20 | | | | 865,433 | |
| | Petco Animal Supplies, Inc.(3M LIBOR + 3.250%) | |
| | 984,028 | | | 5.777 | | | 01/26/23 | | | | 759,178 | |
| | PetSmart, Inc.(1M LIBOR + 3.000%) | |
| | 989,151 | | | 5.280 | | | 03/11/22 | | | | 836,169 | |
| | Serta Simmons Bedding LLC | |
| | (1M LIBOR + 3.500%) | |
| | 691,703 | | | 5.775 | | | 11/08/23 | | | | 622,284 | |
| | (3M LIBOR + 8.000%) | |
| | 250,000 | | | 10.277 | | | 11/08/24 | | | | 193,515 | |
| | | | | | | | | | | | |
| | | | | | | | | | | 4,398,562 | |
| | |
| Semiconductors(h) – 0.0% | |
| | Bright Bidco BV(3M LIBOR + 3.500%) | |
| | 198,798 | | | 5.830 | | | 06/30/24 | | | | 194,160 | |
| | |
| | |
| The accompanying notes are an integral part of these financial statements. | | 73 |
GOLDMAN SACHS MULTI-MANAGER NON-CORE FIXED INCOME FUND
Schedule of Investments (continued)
October 31, 2018
| | | | | | | | | | | | |
Principal Amount | | | Interest Rate | | Maturity
Date | | | Value | |
| Bank Loans(k) – (continued) | |
| Services Cyclical – Business Services – 0.4% | |
| | Global Payments, Inc.(m) | |
| $ | 500,000 | | | 1.750 % | | | 10/17/25 | | | $ | 498,440 | |
| | Tempo Acquisition LLC(h)(1M LIBOR + 3.000%) | |
| | 493,750 | | | 5.302 | | | 05/01/24 | | | | 493,627 | |
| | Trans Union LLC(h)(1M LIBOR + 2.000%) | |
| | 497,487 | | | 4.302 | | | 04/10/23 | | | | 496,298 | |
| | Vantiv LLC(h)(1M LIBOR + 1.750%) | |
| | 1,250,000 | | | 4.030 | | | 08/09/24 | | | | 1,246,425 | |
| | | | | | | | | | | | |
| | | | | | | | | | | 2,734,790 | |
| | |
| Technology – Software/Services(h) – 1.9% | |
| | Almonde, Inc.(3M LIBOR + 7.250%) | |
| | 61,134 | | | 9.636 | | | 06/13/25 | | | | 60,090 | |
| | Blackboard, Inc.(3M LIBOR + 5.000%) | |
| | 998,728 | | | 7.445 | | | 06/30/21 | | | | 951,388 | |
| | BMC Software Finance, Inc.(m)(3M LIBOR + 4.250%) | |
| | 1,000,000 | | | 4.250 | | | 10/02/25 | | | | 1,002,400 | |
| | Ceridian HCM Holding, Inc.(1M LIBOR + 3.250%) | |
| | 750,000 | | | 5.552 | | | 04/30/25 | | | | 750,937 | |
| | Dell, Inc.(1M LIBOR + 2.000%) | |
| | 2,331,466 | | | 4.310 | | | 09/07/23 | | | | 2,327,968 | |
| | Greeneden U.S. Holdings II, LLC(1M LIBOR + 3.500%) | |
| | 497,494 | | | 5.802 | | | 12/01/23 | | | | 499,111 | |
| | Infor (US), Inc.(3M LIBOR + 2.750%) | |
| | 743,750 | | | 5.136 | | | 02/01/22 | | | | 740,589 | |
| | Informatica Corp.(1M LIBOR + 3.250%) | |
| | 496,240 | | | 5.552 | | | 08/05/22 | | | | 497,947 | |
| | MA FinanceCo. LLC(1M LIBOR + 2.500%) | |
| | 192,660 | | | 4.802 | | | 06/21/24 | | | | 191,997 | |
| | Mavenir Systems, Inc.(j)(1M LIBOR + 6.000%) | |
| | 598,496 | | | 8.280 | | | 05/08/25 | | | | 599,992 | |
| | McAfee LLC(1M LIBOR + 4.500%) | |
| | 495,000 | | | 6.143 | | | 09/30/24 | | | | 496,148 | |
| | MModal, Inc.(3M LIBOR + 4.750%) | |
| | 298,833 | | | 7.527 | | | 01/31/20 | | | | 298,334 | |
| | Seattle SpinCo, Inc.(1M LIBOR + 2.500%) | |
| | 1,301,078 | | | 4.802 | | | 06/21/24 | | | | 1,296,602 | |
| | Sophia L.P.(3M LIBOR + 3.250%) | |
| | 496,161 | | | 5.636 | | | 09/30/22 | | | | 496,782 | |
| SS&C Technologies Holdings Europe S.a.r.l.(1M
LIBOR + 2.250%) |
|
| | 314,865 | | | 4.552 | | | 04/16/25 | | | | 313,114 | |
| | SS&C Technologies, Inc.(1M LIBOR + 2.250%) | |
| | 812,345 | | | 4.552 | | | 04/16/25 | | | | 807,828 | |
| | Syniverse Holdings, Inc.(1M LIBOR + 5.000%) | |
| | 497,500 | | | 7.280 | | | 03/09/23 | | | | 499,988 | |
| | TIBCO Software, Inc.(3M LIBOR + 3.500%) | |
| | 493,718 | | | 5.800 | | | 12/04/20 | | | | 494,232 | |
| | Veritas Bermuda Ltd.(1M LIBOR + 4.500%) | |
| | 372,363 | | | 6.844 | | | 01/27/23 | | | | 354,263 | |
| | Western Digital Corp.(1M LIBOR + 1.750%) | |
| | 498,747 | | | 4.044 | | | 04/29/23 | | | | 495,161 | |
| | | | | | | | | | | | |
| | | | | | | | | | | 13,174,871 | |
| | |
| Bank Loans(k) – (continued) | |
| Telecommunication Services(h) – 0.5% | |
| | Frontier Communications Corp.(1M LIBOR + 3.750%) | |
| 388,745 | | | 6.060 | | | 06/15/24 | | | | 375,527 | |
| | GTT Communications, Inc.(1M LIBOR + 2.750%) | |
| | 748,125 | | | 5.050 | | | 05/31/25 | | | | 737,330 | |
| | Intelsat Jackson Holdings SA(1M LIBOR + 3.750%) | |
| | 2,000,000 | | | 6.045 | | | 11/27/23 | | | | 2,000,000 | |
| | Plantronics, Inc.(1M LIBOR + 2.500%) | |
| | 350,000 | | | 4.802 | | | 07/02/25 | | | | 348,688 | |
| | Windstream Corp.(1M LIBOR + 3.250%) | |
| | 198,309 | | | 5.540 | | | 02/17/24 | | | | 171,827 | |
| | | | | | | | | | | | |
| | | | | | | | | | | 3,633,372 | |
| | |
| Telecommunications – Internet & Data(h) – 0.2% | |
| | Avaya, Inc.(1M LIBOR + 4.250%) | |
| | 994,987 | | | 6.530 | | | 12/15/24 | | | | 997,943 | |
| | |
| Telecommunications – Satellites(h) – 0.4% | |
| | CenturyLink, Inc.(1M LIBOR + 2.750%) | |
| | 2,153,351 | | | 5.052 | | | 01/31/25 | | | | 2,129,126 | |
| | West Corp.(3M LIBOR + 4.000%) | |
| | 319,367 | | | 6.414 | | | 10/10/24 | | | | 317,549 | |
| | Windstream Corp.(1M LIBOR + 4.000%) | |
| | 260,041 | | | 6.290 | | | 03/29/21 | | | | 243,417 | |
| | | | | | | | | | | | |
| | | | | | | | | | | 2,690,092 | |
| | |
| Textiles(h) – 0.1% | |
| | Boardriders, Inc.(1M LIBOR + 6.500%) | |
| | 462,675 | | | 8.802 | | | 03/21/24 | | | | 470,388 | |
| | Nine West Holdings, Inc.(3M LIBOR + 5.250%) | |
| | 314,719 | | | 7.599 | | | 01/08/20 | | | | 230,793 | |
| | | | | | | | | | | | |
| | | | | | | | | | | 701,181 | |
| | |
| Transportation – 0.2% | |
| | HGIM Corp.(m) | |
| | 186,235 | | | 7.000 | | | 07/03/23 | | | | 187,166 | |
| | Savage Enterprises LLC(h)(1M LIBOR + 4.500%) | |
| | 389,545 | | | 6.770 | | | 08/01/25 | | | | 391,980 | |
| | Uber Technologies(m) | |
| | 500,000 | | | 5.000 | | | 04/04/25 | | | | 499,585 | |
| | (1M LIBOR + 3.500%) | |
| | 497,462 | | | 5.780(h) | | | 07/13/23 | | | | 497,154 | |
| | | | | | | | | | | | |
| | | | | | | | | | | 1,575,885 | |
| | |
| Utilities(h) – 0.1% | |
| | TEX Operations Co. LLC(1M LIBOR + 2.000%) | |
| | 681,692 | | | 4.302 | | | 08/04/23 | | | | 679,797 | |
| | |
| Utilities – Electric(h) – 0.4% | |
| | Calpine Corp.(3M LIBOR + 2.500%) | |
| | 1,240,434 | | | 4.890 | | | 01/15/23 | | | | 1,237,643 | |
| | NRG Energy, Inc.(3M LIBOR + 1.750%) | |
| | 1,496,178 | | | 4.136 | | | 06/30/23 | | | | 1,489,789 | |
| | | | | | | | | | | | |
| | | | | | | | | | | 2,727,432 | |
| | |
| Wireless Telecommunications(h) – 0.3% | |
| | Sprint Communications, Inc.(1M LIBOR + 2.500%) | |
| | 1,738,101 | | | 4.813 | | | 02/02/24 | | | | 1,736,467 | |
| | |
| | |
| 74 | | The accompanying notes are an integral part of these financial statements. |
GOLDMAN SACHS MULTI-MANAGER NON-CORE FIXED INCOME FUND
| | | | | | | | | | | | |
Principal Amount | | | Interest Rate | | Maturity
Date | | | Value | |
| Bank Loans(k) – (continued) | |
| Wirelines Telecommunications(h) – 0.1% | |
| | Level 3 Financing, Inc.(1M LIBOR + 2.250%) | |
| $ | 500,000 | | | 4.530 % | | | 02/22/24 | | | $ | 500,235 | |
| | |
| | TOTAL BANK LOANS | |
| | (Cost $113,249,977) | | | $ | 111,562,845 | |
| | |
| | | | | | | | |
| Shares | | | Description | | Value | |
| Common Stocks – 0.2% | |
| Automobiles – 0.0% | |
| | 438 | | | HGIM Corp. | | $ | 23,214 | |
| | |
| Commercial Services & Supplies(f) – 0.1% | |
| | 10,879 | | | Cenveo, Inc. | | | 315,491 | |
| | |
| Diversified Consumer Services – 0.0% | |
| | 4,333 | | | Gymboree Holding Corp. | | | 20,582 | |
| | |
| Media(f) – 0.0% | |
| | 19,908 | | | Cumulus Media, Inc. Class A | | | 308,574 | |
| | |
| Software(f) – 0.1% | |
| | 21,550 | | | Avaya Holdings Corp.(f) | | | 353,851 | |
| | 2,776 | | | MModal, Inc.(j) | | | 143,888 | |
| | | | | | | | |
| | | | | | | 497,739 | |
| | |
| | TOTAL COMMON STOCKS | |
| | (Cost $1,265,434) | | $ | 1,165,600 | |
| | |
| | | | | | | | |
| Shares | | | Dividend
Rate | | Value | |
| Preferred Stock – 0.0% | |
| Post Secondary Education (j) – 0.0% | |
| | Te Holdcorp LLC/Te Holdcorp | |
| | 26,384 | | | 0.000% | | $ | 131,918 | |
| | (Cost $160,674) | |
| | |
| | | | | | | | | | | | |
| Units | | | Description | | Expiration
Date | | | Value | |
| Warrants – 0.0% | |
| Automobiles – 0.0% | | | | |
| | HGIM Corp. | | | | | |
| | 1,958 | | | | | | 07/02/43 | | | $ | 103,774 | |
| | |
| Specialty Retail(j) – 0.0% | | | | |
| | Guitar Center, Inc. | | | | | |
| | 7,134 | | | | | | 04/16/25 | | | | — | |
| | |
| | TOTAL WARRANTS | |
| | (Cost $75,229) | | | | | | $ | 103,774 | |
| | |
| | | | | | | | |
| Shares | | | Description | | Value | |
| Exchange Traded Fund – 0.2% | |
| | 17,218 | | | iShares iBoxx High Yield Corporate Bond ETF
(Cost $1,474,894) | | $ | 1,452,338 | |
| | |
| | | | | | | | |
| Shares | | | Dividend
Rate | | Value | |
| Investment Company(l) – 8.2% | |
| Goldman Sachs Financial Square Government Fund –
Institutional Shares |
|
| | 56,198,365 | | | 2.102% | | $ | 56,198,365 | |
| | (Cost $56,198,365) | |
| | |
| | TOTAL INVESTMENTS – 101.1% | |
| | (Cost $716,668,334) | | $ | 691,088,844 | |
| | |
| LIABILITIES IN EXCESS OF OTHER
ASSETS – (1.1)% | | | (7,259,169 | ) |
| | |
| | NET ASSETS – 100.0% | | $ | 683,829,675 | |
| | |
| | |
| The percentage shown for each investment category reflects the value of investments in that category as a percentage of net assets. |
(a) | | Issued with a zero coupon. Income is recognized through the accretion of discount. |
(b) | | Exempt from registration under Rule 144A of the Securities Act of 1933. Under procedures approved by the Board of Trustees, such securities may be deemed liquid by the investment Adviser and may be resold, normally to qualified institutional buyers in transactions exempt from registration. Total market value of Rule 144A securities amounts to $141,646,559, which represents approximately 20.7% of the Fund’s net assets as of October 31, 2018. The liquidity determination is unaudited. |
(c) | | Security with “Call” features with resetting interest rates. Maturity dates disclosed are the final maturity dates. |
(d) | | Actual maturity date is 06/28/2117. |
(e) | | Coupon changes periodically based upon a predetermined schedule. Interest rate disclosed is that which is in effect on October 31, 2018. |
(f) | | Security is currently in default and/or non-income producing. |
(g) | | Actual maturity date is 10/12/2110. |
(h) | | Variable rate security. Except for floating rate notes (for which final maturity is disclosed), maturity date disclosed is the next interest reset date. Interest rate disclosed is that which is in effect on October 31, 2018. |
(i) | | Pay-in-kind securities. |
(j) | | Significant unobservable inputs were used in the valuation of this portfolio security; i.e. Level 3. |
(k) | | Bank Loans often require prepayments from excess cash flows or permit the borrower to repay at its election. The degree to which borrowers repay, whether as a contractual requirement or at their election, cannot be predicted with accuracy. As a result, the actual remaining maturity may be substantially less than the stated maturities shown. As bank loan positions may involve multiple underlying tranches for which the aggregate position is presented, the stated interest rate represents the weighted average interest rate of all contracts on October 31, 2018. Bank Loans typically have rates of interest which are predetermined either daily, monthly, quarterly or semi-annually by reference to a base lending rate, plus a premium. These base lending rates are primarily the London-Interbank Offered Rate (“LIBOR”), and secondarily the prime rate offered by one or more major United States banks (the “Prime Rate”) and the certificate of deposit (“CD”) rate or other base lending rates used by commercial lenders. |
(l) | | Represents an affiliated issuer. |
(m) | | This position represents an unsettled loan commitment at period end. Certain details associated with this purchase are not known prior to the settlement date, including coupon rate. |
| | |
| The accompanying notes are an integral part of these financial statements. | | 75 |
GOLDMAN SACHS MULTI-MANAGER NON-CORE FIXED INCOME FUND
Schedule of Investments (continued)
October 31, 2018
| | |
|
Currency Abbreviations: |
ARS | | —Argentine Peso |
BRL | | —Brazilian Real |
CLP | | —Chilean Peso |
CNH | | —Chinese Yuan Renminbi Offshore |
COP | | —Colombian Peso |
CZK | | —Czech Koruna |
EGP | | —Egyptian Pound |
EUR | | —Euro |
GBP | | —British Pound |
HUF | | —Hungarian Forint |
IDR | | —Indonesian Rupiah |
INR | | —Indian Rupee |
KRW | | —South Korean Won |
MXN | | —Mexican Peso |
MYR | | —Malaysian Ringgit |
NGN | | —Nigerian Naira |
OMR | | —Omani Riyal |
PEN | | —Peruvian Nuevo Sol |
PLN | | —Polish Zloty |
PHP | | —Philippine Peso |
RON | | —New Romanian Leu |
RUB | | —Russian Ruble |
THB | | —Thai Baht |
TRY | | —Turkish Lira |
USD | | —U.S. Dollar |
UYU | | —Uruguayan Peso |
ZAR | | —South African Rand |
| | |
Investment Abbreviations: |
ETF | | —Exchange Traded Fund |
LIBOR | | —London Interbank Offered Rate |
LLC | | —Limited Liability Company |
LP | | —Limited Partnership |
PLC | | —Public Limited Company |
|
|
| ADDITIONAL INVESTMENT INFORMATION |
FORWARD FOREIGN CURRENCY EXCHANGE CONTRACTS — At October 31, 2018, the Fund had the following forward foreign currency exchange contracts:
FORWARD FOREIGN CURRENCY EXCHANGE CONTRACTS WITH UNREALIZED GAIN
| | | | | | | | | | | | | | | | | | | | |
| Counterparty | | Currency
Purchased | | | Currency
Sold | | | Settlement
Date | | | Unrealized
Gain | |
Citibank NA (London) | | ARS | | | 24,064,015 | | | USD | | | 590,000 | | | | 01/22/19 | | | $ | 12,876 | |
| | BRL | | | 21,416,769 | | | USD | | | 5,622,396 | | | | 11/07/18 | | | | 126,918 | |
| | IDR | | | 14,229,800,000 | | | USD | | | 925,000 | | | | 12/10/18 | | | | 4,090 | |
| | OMR | | | 8,887 | | | USD | | | 23,000 | | | | 11/14/18 | | | | 85 | |
| | PHP | | | 26,690,000 | | | USD | | | 500,000 | | | | 11/13/18 | | | | 16 | |
| | USD | | | 61,000 | | | CNH | | | 394,231 | | | | 02/28/19 | | | | 4,796 | |
| | USD | | | 697,682 | | | COP | | | 2,190,730,000 | | | | 12/26/18 | | | | 18,824 | |
| | USD | | | 1,422,285 | | | CZK | | | 32,000,000 | | | | 12/20/18 | | | | 17,570 | |
| | USD | | | 1,694,663 | | | EUR | | | 1,435,000 | | | | 01/11/19 | | | | 58,137 | |
| | USD | | | 29,018,880 | | | EUR | | | 25,000,000 | | | | 01/23/19 | | | | 475,562 | |
| | USD | | | 7,254,724 | | | GBP | | | 5,500,000 | | | | 01/23/19 | | | | 192,315 | |
| | USD | | | 1,560,000 | | | INR | | | 115,050,000 | | | | 12/27/18 | | | | 18,147 | |
| | USD | | | 4,192,293 | | | KRW | | | 4,758,760,237 | | | | 01/10/19 | | | | 13,237 | |
| | USD | | | 1,650,000 | | | PLN | | | 6,105,825 | | | | 11/19/18 | | | | 58,148 | |
| | USD | | | 1,000,000 | | | THB | | | 32,730,000 | | | | 01/04/19 | | | | 10,348 | |
| | | USD | | | 1,660,000 | | | ZAR | | | 23,688,449 | | | | 11/14/18 | | | | 57,042 | |
| TOTAL | | | | | | | | | | | | | | | | | | $ | 1,068,111 | |
| | |
| 76 | | The accompanying notes are an integral part of these financial statements. |
GOLDMAN SACHS MULTI-MANAGER NON-CORE FIXED INCOME FUND
|
| ADDITIONAL INVESTMENT INFORMATION (continued) |
FORWARD FOREIGN CURRENCY EXCHANGE CONTRACTS WITH UNREALIZED LOSS
| | | | | | | | | | | | | | | | | | | | |
| Counterparty | | Currency
Purchased | | | Currency
Sold | | | Settlement
Date | | | Unrealized
Loss | |
Citibank NA (London) | | CNH | | | 394,231 | | | USD | | | 57,739 | | | | 02/28/19 | | | $ | (1,536 | ) |
| | COP | | | 2,190,730,000 | | | USD | | | 730,000 | | | | 12/26/18 | | | | (51,140 | ) |
| | CZK | | | 195,075,000 | | | USD | | | 9,000,000 | | | | 12/20/18 | | | | (436,724 | ) |
| | EUR | | | 1,435,000 | | | USD | | | 1,661,569 | | | | 01/11/19 | | | | (25,043 | ) |
| | EUR | | | 333,000 | | | USD | | | 381,649 | | | | 01/23/19 | | | | (1,452 | ) |
| | IDR | | | 8,024,625,000 | | | USD | | | 525,000 | | | | 12/10/18 | | | | (1,057 | ) |
| | INR | | | 115,050,000 | | | USD | | | 1,544,088 | | | | 12/27/18 | | | | (2,235 | ) |
| | INR | | | 104,847,700 | | | USD | | | 1,402,270 | | | | 01/14/19 | | | | (725 | ) |
| | PLN | | | 34,630,198 | | | USD | | | 9,380,000 | | | | 11/19/18 | | | | (351,550 | ) |
| | THB | | | 292,462,150 | | | USD | | | 9,070,000 | | | | 01/04/19 | | | | (226,867 | ) |
| | USD | | | 5,232,000 | | | BRL | | | 21,416,769 | | | | 11/07/18 | | | | (517,313 | ) |
| | USD | | | 2,450,000 | | | BRL | | | 9,197,300 | | | | 01/29/19 | | | | (2,302 | ) |
| | USD | | | 1,390,000 | | | INR | | | 104,847,700 | | | | 01/14/19 | | | | (11,545 | ) |
| | USD | | | 1,119,000 | | | OMR | | | 436,948 | | | | 11/14/18 | | | | (16,007 | ) |
| | | ZAR | | | 23,688,449 | | | USD | | | 1,660,017 | | | | 11/14/18 | | | | (57,057 | ) |
| TOTAL | | | | | | | | | | | | | | | | | | $ | (1,702,553 | ) |
SWAP CONTRACTS — At October 31, 2018, the Fund had the following swap contracts:
CENTRALLY CLEARED CREDIT DEFAULT SWAP CONTRACT
| | | | | | | | | | | | | | | | | | | | | | | | | | |
| Referenced Obligation/Index | | Financing Rate
Received/(Paid)
by the Fund(a) | | Credit
Spread at
October 31,
2018(b) | | | Termination
Date | | | Notional
Amount
(000s) | | | Value | | | Upfront
Premiums
(Received)
Paid | | | Unrealized
Appreciation/
(Depreciation) | |
Protection Sold: | | | | | | | | | | | | | | | | | | | | | | | | | | |
CDX.NA.HY Index 31 | | 5.000% | | | 1.047% | | | | 12/20/23 | | | $ | 7,300 | | | $ | 430,217 | | | $ | 345,467 | | | $ | 84,750 | |
| | (a) | | Payments made quarterly. |
| | (b) | | Credit spread on the referenced obligation, together with the term of the swap contract, are indicators of payment/performance risk. The likelihood of a credit event occurring which would require a fund or its counterparty to make a payment or otherwise be required to perform under the swap contract is generally greater as the credit spread and the term of the swap contract increase. |
PURCHASED OPTIONS CONTRACTS — At October 31, 2018, the Fund had the following purchased options:
OVER-THE-COUNTER OPTIONS ON FOREIGN CURRENCY
| | | | | | | | | | | | | | | | | | | | | | | | | | | | | | |
| Description | | Counterparty | | Exercise
Price | | | Expiration
Date | | | Number of
Contracts | | | Notional
Amount | | | Market
Value | | | Premiums
Paid (Received)
by Portfolio | | | Unrealized
Appreciation/
(Depreciation) | |
Purchased option contracts | | | | | | | | | | | | | | | | | | | | | | | | | | | | | | |
Puts | | | | | | | | | | | | | | | | | | | | | | | | | | | | | | |
Put USD/Call ZAR | | BNP Paribas SA | | | $14.55 | | | | 12/20/2018 | | | | 1,630,000 | | | $ | 1,630,000 | | | $ | 44,251 | | | $ | 44,173 | | | $ | 78 | |
| | |
| The accompanying notes are an integral part of these financial statements. | | 77 |
GOLDMAN SACHS MULTI-MANAGER REAL ASSETS STRATEGY FUND
Schedule of Investments
October 31, 2018
| | | | | | | | |
Shares | | | Description | | Value | |
| Common Stocks – 92.9% | |
| Argentina* – 0.0% | |
| | 22,680 | | | Corp. America Airports SA (Transportation Infrastructure) | | $ | 179,852 | |
| | |
| Australia – 4.6% | |
| | 253,559 | | | APA Group (Gas Utilities) | | | 1,726,735 | |
| | 377,842 | | | Atlas Arteria, Ltd. (Transportation Infrastructure) | | | 1,830,332 | |
| | 167,125 | | | Dexus (Equity Real Estate Investment Trusts (REITs)) | | | 1,207,531 | |
| | 574,466 | | | Goodman Group (Equity Real Estate Investment Trusts (REITs)) | | | 4,222,006 | |
| | 1,411,400 | | | Mirvac Group (Equity Real Estate Investment Trusts (REITs)) | | | 2,171,066 | |
| | 228,567 | | | Scentre Group (Equity Real Estate Investment Trusts (REITs)) | | | 643,932 | |
| | 759,307 | | | Spark Infrastructure Group (Electric Utilities) | | | 1,237,932 | |
| | 419,060 | | | Stockland (Equity Real Estate Investment Trusts (REITs)) | | | 1,072,003 | |
| | 197,588 | | | Sydney Airport (Transportation Infrastructure) | | | 903,090 | |
| | 260,039 | | | Transurban Group (Transportation Infrastructure) | | | 2,091,585 | |
| | 383,139 | | | Vicinity Centres (Equity Real Estate Investment Trusts (REITs)) | | | 718,721 | |
| | | | | | | | |
| | | | | | | 17,824,933 | |
| | |
| Belgium* – 0.1% | |
| | 15,123 | | | Shurgard Self Storage Europe S.a.r.l. (Real Estate Management & Development) | | | 424,544 | |
| | |
| Brazil – 0.1% | |
| | 87,800 | | | Transmissora Alianca de Energia Eletrica SA (Electric Utilities) | | | 525,172 | |
| | |
| Canada – 6.5% | |
| | 23,216 | | | Allied Properties Real Estate Investment Trust (Equity Real Estate Investment Trusts (REITs)) | | | 745,974 | |
| | 26,962 | | | Canadian Apartment Properties REIT (Equity Real Estate Investment Trusts (REITs)) | | | 958,708 | |
| | 63,887 | | | Chartwell Retirement Residences (Health Care Providers & Services) | | | 685,726 | |
| | 59,192 | | | Emera, Inc. (Electric Utilities) | | | 1,826,411 | |
| | 190,943 | | | Enbridge, Inc. (Oil, Gas & Consumable Fuels) | | | 5,949,700 | |
| | 205,343 | | | First Capital Realty, Inc. (Real Estate Management & Development) | | | 3,063,494 | |
| | 79,706 | | | Keyera Corp. (Oil, Gas & Consumable Fuels) | | | 1,985,914 | |
| | 126,625 | | | Pembina Pipeline Corp. (Oil, Gas & Consumable Fuels) | | | 4,095,630 | |
| | 157,928 | | | TransCanada Corp. (Oil, Gas & Consumable Fuels) | | | 5,955,065 | |
| | | | | | | | |
| | | | | | | 25,266,622 | |
| | |
| Common Stocks – (continued) | |
| China – 0.5% | |
| | 960,000 | | | Beijing Capital International Airport Co. Ltd. Class H (Transportation Infrastructure) | | | 1,042,222 | |
| | 89,737 | | | ENN Energy Holdings Ltd. (Gas Utilities) | | | 765,687 | |
| | | | | | | | |
| | | | | | | 1,807,909 | |
| | |
| Denmark(a) – 0.3% | |
| | 18,194 | | | Orsted A/S (Electric Utilities) | | | 1,153,695 | |
| | |
| France – 4.7% | |
| | 7,335 | | | Aeroports de Paris (Transportation Infrastructure) | | | 1,534,137 | |
| | 15,809 | | | Carmila SA (Real Estate Management & Development) | | | 348,452 | |
| | 8,017 | | | Covivio (Equity Real Estate Investment Trusts (REITs)) | | | 804,434 | |
| | 17,583 | | | Eutelsat Communications SA (Media) | | | 356,136 | |
| | 19,900 | | | Gecina SA (Equity Real Estate Investment Trusts (REITs)) | | | 2,918,590 | |
| | 105,050 | | | Getlink (Transportation Infrastructure) | | | 1,321,351 | |
| | 24,071 | | | Klepierre SA (Equity Real Estate Investment Trusts (REITs)) | | | 815,704 | |
| | 29,279 | | | Unibail-Rodamco-Westfield (Equity Real Estate Investment Trusts (REITs)) | | | 5,298,298 | |
| | 52,066 | | | Vinci SA (Construction & Engineering) | | | 4,633,843 | |
| | | | | | | | |
| | | | | | | 18,030,945 | |
| | |
| Germany – 2.3% | |
| | 10,127 | | | ADO Properties SA(a) (Real Estate Management & Development) | | | 597,306 | |
| | 21,344 | | | alstria office REIT AG (Equity Real Estate Investment Trusts (REITs)) | | | 307,262 | |
| | 6,964 | | | LEG Immobilien AG (Real Estate Management & Development) | | | 761,228 | |
| | 13,510 | | | TLG Immobilien AG (Real Estate Management & Development) | | | 343,011 | |
| | 149,102 | | | Vonovia SE (Real Estate Management & Development) | | | 6,813,436 | |
| | | | | | | | |
| | | | | | | 8,822,243 | |
| | |
| Hong Kong – 4.9% | |
| | 660,000 | | | China Merchants Port Holdings Co. Ltd. (Transportation Infrastructure) | | | 1,124,197 | |
| | 826,309 | | | CK Asset Holdings Ltd. (Real Estate Management & Development) | | | 5,377,408 | |
| | 177,728 | | | Henderson Land Development Co. Ltd. (Real Estate Management & Development) | | | 828,938 | |
| | 1,366,395 | | | Hong Kong & China Gas Co. Ltd. (Gas Utilities) | | | 2,610,003 | |
| | 231,700 | | | Hongkong Land Holdings Ltd. (Real Estate Management & Development) | | | 1,372,118 | |
| | |
| | |
| 78 | | The accompanying notes are an integral part of these financial statements. |
GOLDMAN SACHS MULTI-MANAGER REAL ASSETS STRATEGY FUND
| | | | | | | | |
Shares | | | Description | | Value | |
| Common Stocks – (continued) | |
| Hong Kong – (continued) | |
| | 445,181 | | | Link REIT (Equity Real Estate Investment Trusts (REITs)) | | $ | 3,956,363 | |
| | 173,777 | | | Sun Hung Kai Properties Ltd. (Real Estate Management & Development) | | | 2,258,437 | |
| | 199,011 | | | Swire Properties Ltd. (Real Estate Management & Development) | | | 680,085 | |
| | 124,574 | | | Wharf Real Estate Investment Co. Ltd. (Real Estate Management & Development) | | | 774,119 | |
| | | | | | | | |
| | | | | | | 18,981,668 | |
| | |
| Ireland – 0.5% | |
| | 365,344 | | | Green REIT PLC (Equity Real Estate Investment Trusts (REITs)) | | | 603,331 | |
| | 495,736 | | | Hibernia REIT PLC (Equity Real Estate Investment Trusts (REITs)) | | | 780,479 | |
| | 224,862 | | | Irish Residential Properties REIT PLC (Equity Real Estate Investment Trusts (REITs)) | | | 362,169 | |
| | | | | | | | |
| | | | | | | 1,745,979 | |
| | |
| Italy – 1.1% | |
| | 135,860 | | | Atlantia SpA (Transportation Infrastructure) | | | 2,729,955 | |
| | 318,870 | | | Terna Rete Elettrica Nazionale SpA (Electric Utilities) | | | 1,647,120 | |
| | | | | | | | |
| | | | | | | 4,377,075 | |
| | |
| Japan – 6.5% | |
| | 143 | | | Activia Properties, Inc. (Equity Real Estate Investment Trusts (REITs)) | | | 593,488 | |
| | 96 | | | Daiwa Office Investment Corp. (Equity Real Estate Investment Trusts (REITs)) | | | 586,344 | |
| | 1,506 | | | Invincible Investment Corp. (Equity Real Estate Investment Trusts (REITs)) | | | 623,783 | |
| | 31,100 | | | Japan Airport Terminal Co. Ltd. (Transportation Infrastructure) | | | 1,197,904 | |
| | 705 | | | Japan Hotel REIT Investment Corp. (Equity Real Estate Investment Trusts (REITs)) | | | 501,539 | |
| | 206 | | | Japan Real Estate Investment Corp. (Equity Real Estate Investment Trusts (REITs)) | | | 1,063,133 | |
| | 368 | | | Kenedix Office Investment Corp. (Equity Real Estate Investment Trusts (REITs)) | | | 2,280,473 | |
| | 376 | | | Kenedix Retail REIT Corp. (Equity Real Estate Investment Trusts (REITs)) | | | 799,482 | |
| | 2,056 | | | LaSalle Logiport REIT (Equity Real Estate Investment Trusts (REITs)) | | | 1,893,244 | |
| | 55,366 | | | Mitsubishi Estate Co. Ltd. (Real Estate Management & Development) | | | 884,848 | |
| | 363,405 | | | Mitsui Fudosan Co. Ltd. (Real Estate Management & Development) | | | 8,184,691 | |
| | |
| Common Stocks – (continued) | |
| Japan – (continued) | |
| | 171 | | | Nippon Building Fund, Inc. (Equity Real Estate Investment Trusts (REITs)) | | | 977,203 | |
| | 1,520 | | | Orix JREIT, Inc. (Equity Real Estate Investment Trusts (REITs)) | | | 2,325,301 | |
| | 58,695 | | | Sumitomo Realty & Development Co. Ltd. (Real Estate Management & Development) | | | 2,016,763 | |
| | 188,000 | | | Tokyu Fudosan Holdings Corp. (Real Estate Management & Development) | | | 1,059,256 | |
| | | | | | | | |
| | | | | | | 24,987,452 | |
| | |
| Luxembourg – 0.5% | |
| | 230,100 | | | Aroundtown SA (Real Estate Management & Development) | | | 1,906,751 | |
| | |
| Mexico – 0.6% | |
| | 451,100 | | | CFE Capital S de RL de CV (Banks) | | | 370,194 | |
| | 576,100 | | | GMexico Transportes SAB de CV(a) (Road & Rail) | | | 788,714 | |
| | 281,600 | | | Infraestructura Energetica Nova SAB de CV (Gas Utilities) | | | 1,103,900 | |
| | 110,426 | | | OHL Mexico SAB de CV (Transportation Infrastructure) | | | 151,832 | |
| | | | | | | | |
| | | | | | | 2,414,640 | |
| | |
| Netherlands – 0.2% | |
| | 15,397 | | | Koninklijke Vopak NV (Oil, Gas & Consumable Fuels) | | | 696,299 | |
| | |
| New Zealand – 0.2% | |
| | 182,740 | | | Auckland International Airport Ltd. (Transportation Infrastructure) | | | 835,683 | |
| | |
| Singapore – 1.4% | |
| | 228,816 | | | Cache Logistics Trust (Equity Real Estate Investment Trusts (REITs)) | | | 113,237 | |
| | 1,093,200 | | | CapitaLand Ltd. (Real Estate Management & Development) | | | 2,483,188 | |
| | 1,846,870 | | | Frasers Logistics & Industrial Trust (Equity Real Estate Investment Trusts (REITs)) | | | 1,359,800 | |
| | 813,912 | | | Keppel REIT (Equity Real Estate Investment Trusts (REITs)) | | | 664,409 | |
| | 703,136 | | | Suntec Real Estate Investment Trust (Equity Real Estate Investment Trusts (REITs)) | | | 899,867 | |
| | | | | | | | |
| | | | | | | 5,520,501 | |
| | |
| Spain – 2.8% | |
| | 110,295 | | | Cellnex Telecom SA(a) (Diversified Telecommunication Services) | | | 2,743,730 | |
| | 260,731 | | | Ferrovial SA (Construction & Engineering) | | | 5,220,102 | |
| | 87,960 | | | Inmobiliaria Colonial Socimi SA (Equity Real Estate Investment Trusts (REITs)) | | | 883,164 | |
| | 102,340 | | | Red Electrica Corp. SA (Electric Utilities) | | | 2,119,100 | |
| | | | | | | | |
| | | | | | | 10,966,096 | |
| | |
| | |
| The accompanying notes are an integral part of these financial statements. | | 79 |
GOLDMAN SACHS MULTI-MANAGER REAL ASSETS STRATEGY FUND
Schedule of Investments (continued)
October 31, 2018
| | | | | | | | |
Shares | | | Description | | Value | |
| Common Stocks – (continued) | |
| Sweden – 0.7% | |
| | 15,282 | | | Atrium Ljungberg AB Class B (Real Estate Management & Development) | | $ | 258,880 | |
| | 20,647 | | | Cibus Nordic Real Estate AB (Real Estate Management & Development) | | | 239,205 | |
| | 42,454 | | | Fabege AB (Real Estate Management & Development) | | | 542,111 | |
| | 106,483 | | | Hufvudstaden AB Class A (Real Estate Management & Development) | | | 1,574,195 | |
| | | | | | | | |
| | | | | | | 2,614,391 | |
| | |
| Switzerland – 0.1% | |
| | 4,280 | | | PSP Swiss Property AG (Real Estate Management & Development) | | | 412,964 | |
| | |
| United Arab Emirates – 0.0% | |
| | 5,782 | | | DP World Ltd. (Transportation Infrastructure) | | | 104,018 | |
| | |
| United Kingdom – 6.2% | |
| | 51,946 | | | Big Yellow Group PLC (Equity Real Estate Investment Trusts (REITs)) | | | 572,677 | |
| | 381,100 | | | Capital & Counties Properties PLC (Real Estate Management & Development) | | | 1,215,955 | |
| | 314,960 | | | Land Securities Group PLC (Equity Real Estate Investment Trusts (REITs)) | | | 3,426,167 | |
| | 455,531 | | | National Grid PLC (Multi-Utilities) | | | 4,812,248 | |
| | 76,409 | | | NewRiver REIT PLC (Equity Real Estate Investment Trusts (REITs)) | | | 246,398 | |
| | 130,201 | | | Pennon Group PLC (Water Utilities) | | | 1,240,368 | |
| | 122,362 | | | Segro PLC (Equity Real Estate Investment Trusts (REITs)) | | | 959,302 | |
| | 157,907 | | | Severn Trent PLC (Water Utilities) | | | 3,752,559 | |
| | 32,337 | | | Shaftesbury PLC (Equity Real Estate Investment Trusts (REITs)) | | | 370,290 | |
| | 47,790 | | | The British Land Co. PLC (Equity Real Estate Investment Trusts (REITs)) | | | 360,926 | |
| | 317,108 | | | Tritax Big Box REIT PLC (Equity Real Estate Investment Trusts (REITs)) | | | 578,931 | |
| | 287,838 | | | Tritax EuroBox PLC*(a) (Equity Real Estate Investment Trusts (REITs)) | | | 366,772 | |
| | 143,900 | | | UNITE Group PLC (Equity Real Estate Investment Trusts (REITs)) | | | 1,566,809 | |
| | 451,015 | | | United Utilities Group PLC (Water Utilities) | | | 4,179,421 | |
| | 133,566 | | | Warehouse REIT PLC (Equity Real Estate Investment Trusts (REITs)) | | | 164,749 | |
| | | | | | | | |
| | | | | | | 23,813,572 | |
| | |
| United States – 48.1% | |
| | 37,420 | | | Ameren Corp. (Multi-Utilities) | | | 2,416,584 | |
| | 30,033 | | | American Assets Trust, Inc. (Equity Real Estate Investment Trusts (REITs)) | | | 1,152,066 | |
| | |
| Common Stocks – (continued) | |
| United States – (continued) | |
| | 45,200 | | | American Campus Communities, Inc. (Equity Real Estate Investment Trusts (REITs)) | | | 1,785,852 | |
| | 20,800 | | | American Electric Power Co., Inc. (Electric Utilities) | | | 1,525,888 | |
| | 35,730 | | | American Homes 4 Rent Class A (Equity Real Estate Investment Trusts (REITs)) | | | 752,831 | |
| | 37,122 | | | American Tower Corp. (Equity Real Estate Investment Trusts (REITs)) | | | 5,783,979 | |
| | 39,952 | | | American Water Works Co., Inc. (Water Utilities) | | | 3,536,951 | |
| | 86,917 | | | Americold Realty Trust (Equity Real Estate Investment Trusts (REITs)) | | | 2,151,196 | |
| | 42,100 | | | Apartment Investment & Management Co. Class A (Equity Real Estate Investment Trusts (REITs)) | | | 1,811,984 | |
| | 12,100 | | | Atmos Energy Corp. (Gas Utilities) | | | 1,126,268 | |
| | 61,942 | | | AvalonBay Communities, Inc. (Equity Real Estate Investment Trusts (REITs)) | | | 10,863,388 | |
| | 156,200 | | | Brixmor Property Group, Inc. (Equity Real Estate Investment Trusts (REITs)) | | | 2,530,440 | |
| | 92,578 | | | Brookfield Property REIT, Inc. Class A (Equity Real Estate Investment Trusts (REITs)) | | | 1,785,830 | |
| | 2,119 | | | Camden Property Trust (Equity Real Estate Investment Trusts (REITs)) | | | 191,282 | |
| | 63,029 | | | Cheniere Energy, Inc.* (Oil, Gas & Consumable Fuels) | | | 3,807,582 | |
| | 1,438 | | | Clearway Energy, Inc. Class C (Independent Power and Renewable Electricity Producers) | | | 28,199 | |
| | 46,778 | | | Columbia Property Trust, Inc. (Equity Real Estate Investment Trusts (REITs)) | | | 1,050,166 | |
| | 27,126 | | | Community Healthcare Trust, Inc. (Equity Real Estate Investment Trusts (REITs)) | | | 806,185 | |
| | 23,056 | | | Consolidated Edison, Inc. (Multi-Utilities) | | | 1,752,256 | |
| | 2,541 | | | CoreSite Realty Corp. (Equity Real Estate Investment Trusts (REITs)) | | | 238,498 | |
| | 89,930 | | | Crown Castle International Corp. (Equity Real Estate Investment Trusts (REITs)) | | | 9,778,988 | |
| | 80,900 | | | CubeSmart (Equity Real Estate Investment Trusts (REITs)) | | | 2,344,482 | |
| | 136,387 | | | DiamondRock Hospitality Co. (Equity Real Estate Investment Trusts (REITs)) | | | 1,425,244 | |
| | 66,500 | | | Digital Realty Trust, Inc. (Equity Real Estate Investment Trusts (REITs)) | | | 6,866,790 | |
| | |
| | |
| 80 | | The accompanying notes are an integral part of these financial statements. |
GOLDMAN SACHS MULTI-MANAGER REAL ASSETS STRATEGY FUND
| | | | | | | | |
Shares | | | Description | | Value | |
| Common Stocks – (continued) | |
| United States – (continued) | |
| | 7,344 | | | Dominion Energy, Inc. (Multi-Utilities) | | $ | 524,508 | |
| | 55,280 | | | Duke Realty Corp. (Equity Real Estate Investment Trusts (REITs)) | | | 1,524,070 | |
| | 39,127 | | | Easterly Government Properties, Inc. (Equity Real Estate Investment Trusts (REITs)) | | | 710,938 | |
| | 53,314 | | | Edison International (Electric Utilities) | | | 3,699,458 | |
| | 90,987 | | | Empire State Realty Trust, Inc. Class A (Equity Real Estate Investment Trusts (REITs)) | | | 1,443,054 | |
| | 25,312 | | | Equity LifeStyle Properties, Inc. (Equity Real Estate Investment Trusts (REITs)) | | | 2,396,793 | |
| | 1,664 | | | Essex Property Trust, Inc. (Equity Real Estate Investment Trusts (REITs)) | | | 417,298 | |
| | 40,162 | | | Evergy, Inc. (Electric Utilities) | | | 2,248,670 | |
| | 23,693 | | | Extra Space Storage, Inc. (Equity Real Estate Investment Trusts (REITs)) | | | 2,133,792 | |
| | 29,014 | | | Federal Realty Investment Trust (Equity Real Estate Investment Trusts (REITs)) | | | 3,599,187 | |
| | 21,506 | | | FirstEnergy Corp. (Electric Utilities) | | | 801,744 | |
| | 45,872 | | | Four Corners Property Trust, Inc. (Equity Real Estate Investment Trusts (REITs)) | | | 1,196,342 | |
| | 17,806 | | | Genesee & Wyoming, Inc. Class A* (Road & Rail) | | | 1,410,769 | |
| | 139,164 | | | Healthcare Trust of America, Inc. Class A (Equity Real Estate Investment Trusts (REITs)) | | | 3,654,447 | |
| | 3,090 | | | Highwoods Properties, Inc. (Equity Real Estate Investment Trusts (REITs)) | | | 131,758 | |
| | 34,412 | | | Host Hotels & Resorts, Inc. (Equity Real Estate Investment Trusts (REITs)) | | | 657,613 | |
| | 204,683 | | | Hudson Pacific Properties, Inc. (Equity Real Estate Investment Trusts (REITs)) | | | 6,201,895 | |
| | 226,000 | | | Invitation Homes, Inc. (Equity Real Estate Investment Trusts (REITs)) | | | 4,944,880 | |
| | 38,224 | | | JBG SMITH Properties (Equity Real Estate Investment Trusts (REITs)) | | | 1,432,635 | |
| | 30,991 | | | Kilroy Realty Corp. (Equity Real Estate Investment Trusts (REITs)) | | | 2,134,660 | |
| | 34,698 | | | Kimco Realty Corp. (Equity Real Estate Investment Trusts (REITs)) | | | 558,291 | |
| | 316,310 | | | Kinder Morgan, Inc. (Oil, Gas & Consumable Fuels) | | | 5,383,596 | |
| | 44,249 | | | MedEquities Realty Trust, Inc. (Equity Real Estate Investment Trusts (REITs)) | | | 365,939 | |
| | |
| Common Stocks – (continued) | |
| United States – (continued) | |
| | 51,279 | | | Medical Properties Trust, Inc. (Equity Real Estate Investment Trusts (REITs)) | | | 762,006 | |
| | 41,524 | | | MGM Growth Properties LLC Class A (Equity Real Estate Investment Trusts (REITs)) | | | 1,174,714 | |
| | 3,070 | | | NextEra Energy, Inc. (Electric Utilities) | | | 529,575 | |
| | 134,109 | | | NiSource, Inc. (Multi-Utilities) | | | 3,401,004 | |
| | 12,608 | | | ONEOK, Inc. (Oil, Gas & Consumable Fuels) | | | 827,085 | |
| | 359,100 | | | Paramount Group, Inc. (Equity Real Estate Investment Trusts (REITs)) | | | 5,131,539 | |
| | 9,170 | | | Park Hotels & Resorts, Inc. (Equity Real Estate Investment Trusts (REITs)) | | | 266,572 | |
| | 39,360 | | | Pattern Energy Group, Inc. Class A (Independent Power and Renewable Electricity Producers) | | | 705,331 | |
| | 155,500 | | | Pennsylvania Real Estate Investment Trust (Equity Real Estate Investment Trusts (REITs)) | | | 1,391,725 | |
| | 85,001 | | | PG&E Corp. (Electric Utilities) | | | 3,978,897 | |
| | 210,858 | | | Prologis, Inc. (Equity Real Estate Investment Trusts (REITs)) | | | 13,594,015 | |
| | 1,529 | | | Public Storage (Equity Real Estate Investment Trusts (REITs)) | | | 314,164 | |
| | 39,612 | | | Rexford Industrial Realty, Inc. (Equity Real Estate Investment Trusts (REITs)) | | | 1,254,512 | |
| | 15,728 | | | SBA Communications Corp.* (Equity Real Estate Investment Trusts (REITs)) | | | 2,550,610 | |
| | 48,981 | | | SCANA Corp. (Multi-Utilities) | | | 1,961,689 | |
| | 55,170 | | | Sempra Energy (Multi-Utilities) | | | 6,075,320 | |
| | 14,466 | | | Simon Property Group, Inc. (Equity Real Estate Investment Trusts (REITs)) | | | 2,654,800 | |
| | 61,679 | | | STAG Industrial, Inc. (Equity Real Estate Investment Trusts (REITs)) | | | 1,632,026 | |
| | 75,647 | | | Sunstone Hotel Investors, Inc. (Equity Real Estate Investment Trusts (REITs)) | | | 1,094,612 | |
| | 126,972 | | | The Macerich Co. (Equity Real Estate Investment Trusts (REITs)) | | | 6,554,295 | |
| | 228,482 | | | The Williams Cos., Inc. (Oil, Gas & Consumable Fuels) | | | 5,558,967 | |
| | 56,807 | | | UDR, Inc. (Equity Real Estate Investment Trusts (REITs)) | | | 2,226,266 | |
| | 12,708 | | | Union Pacific Corp. (Road & Rail) | | | 1,858,164 | |
| | 113,508 | | | Welltower, Inc. (Equity Real Estate Investment Trusts (REITs)) | | | 7,499,473 | |
| | | | | | | | |
| | | | | | | 186,082,627 | |
| | |
| | TOTAL COMMON STOCKS | |
| | (Cost $358,004,398) | | $ | 359,495,631 | |
| | |
| | |
| The accompanying notes are an integral part of these financial statements. | | 81 |
GOLDMAN SACHS MULTI-MANAGER REAL ASSETS STRATEGY FUND
Schedule of Investments (continued)
October 31, 2018
| | | | | | | | |
Shares | | | Description | | Value | |
| Exchange Traded Funds – 4.1% | |
| United States – 4.1% | |
| | 199,000 | | | SPDR Dow Jones International Real Estate ETF (Equity Real Estate Investment Trusts (REITs)) | | $ | 7,251,560 | |
| | 93,000 | | | SPDR Dow Jones REIT ETF (Equity Real Estate Investment Trusts (REITs)) | | | 8,451,840 | |
| | |
| | TOTAL EXCHANGE TRADED FUNDS | |
| | (Cost $16,623,947) | | $ | 15,703,400 | |
| | |
| | | | | | | | |
| Shares | | | Dividend Rate | | Value | |
| Investment Company(b) – 2.7% | |
| Goldman Sachs Financial Square Government Fund –
Institutional Shares |
|
| | 10,604,129 | | | 2.102% | | $ | 10,604,129 | |
| | (Cost $10,604,129) | |
| | |
| | TOTAL INVESTMENTS – 99.7% | |
| | (Cost $385,232,474) | | $ | 385,803,160 | |
| | |
| OTHER ASSETS IN EXCESS OF
LIABILITIES – 0.3% | | | 1,205,004 | |
| | |
| | NET ASSETS – 100.0% | | $ | 387,008,164 | |
| | |
| | |
| The percentage shown for each investment category reflects the value of investments in that category as a percentage of net assets. |
* | | Non-income producing security. |
(a) | | Exempt from registration under Rule 144A of the Securities Act of 1933. Under procedures approved by the Board of Trustees, such securities may be deemed liquid by the Investment Adviser and may be resold, normally to qualified institutional buyers in transactions exempt from registration. Total market value of Rule 144A securities amounts to $5,650,217, which represents approximately 1.5% of the Fund’s net assets as of October 31, 2018. The liquidity determination is unaudited. |
(b) | | Represents an affiliated issuer. |
| | |
|
Currency Abbreviations: |
BRL | | —Brazilian Real |
USD | | —U.S. Dollar |
| | |
Investment Abbreviations: |
ETF | | —Exchange Traded Fund |
LLC | | —Limited Liability Company |
PLC | | —Public Limited Company |
REIT | | —Real Estate Investment Trust |
|
|
| ADDITIONAL INVESTMENT INFORMATION |
FORWARD FOREIGN CURRENCY EXCHANGE CONTRACTS — At October 31, 2018, the Fund had the following forward foreign currency exchange contracts:
FORWARD FOREIGN CURRENCY EXCHANGE CONTRACTS WITH UNREALIZED GAIN
| | | | | | | | | | | | | | | | | | | | |
| Counterparty | | Currency
Purchased | | | Currency Sold | | | Settlement
Date | | | Unrealized
Gain | |
State Street Bank and Trust | | USD | | | 17,598 | | | BRL | | | 65,365 | | | | 11/05/18 | | | $ | 46 | |
| | |
| 82 | | The accompanying notes are an integral part of these financial statements. |
GOLDMAN SACHS MULTI-MANAGER REAL ASSETS STRATEGY FUND
|
| ADDITIONAL INVESTMENT INFORMATION (continued) |
JOINT REPURCHASE AGREEMENT ACCOUNT II — At October 31, 2018, the Funds had undivided interests in the Joint Repurchase Agreement Account II, with a maturity date of November 1, 2018, as follows:
| | | | | | | | | | |
| Fund | | Principal Amount | | | Maturity Value | | | Collateral Allocation Value |
Multi-Manager Global Equity Fund | | $ | 700,000 | | | $ | 700,043 | | | $714,000 |
REPURCHASE AGREEMENTS — At October 31, 2018, the Principal Amounts of the Funds’ interest in the Joint Repurchase Agreement Account II were as follows:
| | | | | | | | |
| Counterparty | | Interest Rate | | | Multi-Manager Real
Assets Strategy | |
Merrill Lynch & Co., Inc. | | | 2.220 | % | | $ | 700,000 | |
At October 31, 2018, the Joint Repurchase Agreement Account II was fully collateralized by:
| | | | | | | | |
| Issuer | | Interest Rates | | | Maturity Dates | |
Government National Mortgage Association | | | 4.000 | % | | | 04/20/47 | |
| | |
| The accompanying notes are an integral part of these financial statements. | | 83 |
GOLDMAN SACHS STRATEGIC MULTI-ASSET CLASS FUNDS
Statements of Assets and Liabilities
October 31, 2018
| | | | | | | | | | | | | | |
| | | | | Multi-Manager
Global Equity
Fund | | | Multi-Manager
Non-Core Fixed
Income Fund | | | Multi-Manager
Real Assets
Strategy Fund | |
| | Assets: | | | | | | | | | | | | |
| | Investments, at value (cost $606,182,705, $660,469,969 and $374,628,345, respectively) | | $ | 605,279,834 | | | $ | 634,890,479 | | | $ | 375,199,031 | |
| | Investments of affiliated issuers, at value (cost $23,766,349, $56,198,365 and $10,604,129, respectively) | | | 23,766,349 | | | | 56,198,365 | | | | 10,604,129 | |
| | Foreign currencies, at value (cost $628,204, $4,409,470 and $0, respectively) | | | 615,790 | | | | 4,363,176 | | | | — | |
| | Purchased options, at value (cost $0, $44,173, $0, respectively) | | | — | | | �� | 44,251 | | | | — | |
| | Cash | | | 1,285,750 | | | | 1,370,141 | | | | 844,467 | |
| | Variation margin on swaps contracts | | | — | | | | 49,471 | | | | — | |
| | Variation margin on futures contracts | | | 14,323 | | | | — | | | | — | |
| | Unrealized gain on forward foreign currency exchange contracts | | | 2,409,729 | | | | 1,068,111 | | | | 46 | |
| | Receivables: | | | | | | | | | | | | |
| | Fund shares sold | | | 4,100,000 | | | | — | | | | — | |
| | Investments sold | | | 2,006,300 | | | | 1,485,956 | | | | 1,529,127 | |
| | Dividends and interest | | | 955,517 | | | | 9,558,815 | | | | 450,566 | |
| | Foreign tax reclaims | | | 306,784 | | | | 75,265 | | | | 53,406 | |
| | Collateral on certain derivative contracts(a) | | | 73,400 | | | | 1,487,213 | | | | — | |
| | Due from custodian | | | 52,459 | | | | 209,442 | | | | — | |
| | Investments sold on an extended settlement basis | | | — | | | | 2,526,402 | | | | — | |
| | Reimbursement from investment adviser | | | — | | | | 152,682 | | | | — | |
| | Other assets | | | 28,198 | | | | 19,446 | | | | 19,848 | |
| | Total assets | | | 640,894,433 | | | | 713,499,215 | | | | 388,700,620 | |
| | | | | | | | | | | | | | |
| | Liabilities: | | | | | | | | | | | | |
| | Unrealized loss on forward foreign currency exchange contracts | | | 28,613 | | | | 1,702,553 | | | | — | |
| | Due to custodian | | | — | | | | 262,256 | | | | — | |
| | Foreign currency overdraft, at value (identified cost $0, $0 and $61,614, respectively) | | | — | | | | — | | | | 61,787 | |
| | Payables: | | | | | | | | | | | | |
| | Investments purchased | | | 6,177,940 | | | | 6,222,229 | | | | 1,067,590 | |
| | Management fees | | | 296,196 | | | | 310,744 | | | | 198,579 | |
| | Investments purchased on an extended settlement basis | | | 96,520 | | | | 17,182,861 | | | | — | |
| | Transfer agency fees | | | 10,963 | | | | 12,062 | | | | 6,657 | |
| | Collateral on certain derivative contracts(b) | | | — | | | | 530,000 | | | | — | |
| | Fund shares redeemed | | | — | | | | 2,920,000 | | | | — | |
| | Accrued expenses and other liabilities | | | 707,445 | | | | 526,835 | | | | 357,843 | |
| | Total liabilities | | | 7,317,677 | | | | 29,669,540 | | | | 1,692,456 | |
| | | | | | | | | | | | | | |
| | Net Assets: | | | | | | | | | | | | |
| | Paid-in capital | | | 595,681,715 | | | | 724,687,593 | | | | 387,391,992 | |
| | Total distributable earnings (loss) | | | 37,895,041 | | | | (40,857,918 | ) | | | (383,828 | ) |
| | NET ASSETS | | $ | 633,576,756 | | | $ | 683,829,675 | | | $ | 387,008,164 | |
| | Shares Outstanding $0.001 par value (unlimited number of shares authorized): | | | 59,668,445 | | | | 77,465,895 | | | | 41,863,130 | |
| | Net asset value, offering and redemption price per share: | | $ | 10.62 | | | $ | 8.83 | | | $ | 9.24 | |
| | (a) | | Segregated for initial margin and/or collateral as follows: |
| | | | | | | | |
| Fund | | Futures | | | Swaps | |
Multi-Manager Global Equity Fund | | $ | 73,400 | | | $ | — | |
Multi-Manager Non-Core Fixed Income Fund | | | — | | | | 1,487,213 | |
| | (b) | | Segregated for initial margin and/or collateral as follows: |
| | | | |
| Fund | | Forward Foreign
Currencies | |
Multi-Manager Non-Core Fixed Income Fund | | $ | 530,000 | |
| | |
| 84 | | The accompanying notes are an integral part of these financial statements. |
GOLDMAN SACHS STRATEGIC MULTI-ASSET CLASS FUNDS
Statements of Operations
For the Fiscal Year Ended October 31, 2018
| | | | | | | | | | | | | | |
| | | | | Multi-Manager
Global Equity Fund | | | Multi-Manager
Non-Core Fixed
Income Fund | | | Multi-Manager
Real Assets
Strategy Fund | |
| | Investment income: | | | | | | | | | | | | |
| | Dividends — unaffiliated issuers (net of foreign withholding taxes of $815,634, $0 and $532,965, respectively) | | $ | 11,549,562 | | | $ | 989,076 | | | $ | 7,830,158 | |
| | Non-cash dividends — unaffiliated issuers | | | — | | | | — | | | | 1,248,993 | |
| | Dividends — affiliated issuers | | | 169,442 | | | | 461,773 | | | | 67,056 | |
| | Interest | | | — | | | | 33,058,364 | | | | 31,235 | |
| | Total investment income | | | 11,719,004 | | | | 34,509,213 | | | | 9,177,442 | |
| | | | | | | | | | | | | | |
| | Expenses: | | | | | | | | | | | | |
| | Management fees | | | 5,774,394 | | | | 4,716,606 | | | | 2,809,876 | |
| | Custody, accounting and administrative services | | | 1,312,672 | | | | 648,998 | | | | 378,354 | |
| | Professional fees | | | 350,221 | | | | 290,397 | | | | 330,847 | |
| | Transfer Agency fees | | | 112,124 | | | | 110,979 | | | | 56,198 | |
| | Prime broker fees | | | — | | | | 3,248 | | | | — | |
| | Printing and mailing costs | | | 48,010 | | | | 42,281 | | | | 29,613 | |
| | Trustee fees | | | 43,298 | | | | 43,898 | | | | 34,345 | |
| | Registration fees | | | 8,878 | | | | 33,308 | | | | 15,438 | |
| | Other | | | 136,456 | | | | 84,431 | | | | 55,658 | |
| | Total expenses | | | 7,786,053 | | | | 5,974,146 | | | | 3,710,329 | |
| | Less — expense reductions | | | (3,293,121 | ) | | | (2,101,080 | ) | | | (1,187,541 | ) |
| | Net expenses | | | 4,492,932 | | | | 3,873,066 | | | | 2,522,788 | |
| | NET INVESTMENT INCOME | | | 7,226,072 | | | | 30,636,147 | | | | 6,654,654 | |
| | | | |
| | | | | | | | | | | | | | |
| | Realized and unrealized gain (loss): | |
| | Net realized gain (loss) from: | | | | | | | | | | | | |
| | Investments — unaffiliated issuers (including commission recapture of $1,567, $0, $0) | | | 31,681,312 | | | | (19,324,238 | ) | | | (288,645 | ) |
| | Futures contracts | | | 209,427 | | | | 183,579 | | | | — | |
| | Swap contracts | | | — | | | | (130,738 | ) | | | — | |
| | Forward foreign currency exchange contracts | | | 4,899,908 | | | | (551,629 | ) | | | (40,669 | ) |
| | Foreign currency transactions | | | (160,523 | ) | | | (726,308 | ) | | | (164,955 | ) |
| | Net change in unrealized gain (loss) on: | | | | | | | | | | | | |
| | Investments — unaffiliated issuers | | | (71,843,924 | ) | | | (28,066,261 | ) | | | (16,748,717 | ) |
| | Purchased options | | | — | | | | 78 | | | | — | |
| | Futures contracts | | | (140,865 | ) | | | (20,614 | ) | | | — | |
| | Swap contracts | | | — | | | | 59,878 | | | | — | |
| | Forward foreign currency exchange contracts | | | (121,307 | ) | | | (791,331 | ) | | | (283 | ) |
| | Foreign currency translation | | | (20,028 | ) | | | 23,632 | | | | 281 | |
| | Net realized and unrealized loss | | | (35,496,000 | ) | | | (49,343,952 | ) | | | (17,242,988 | ) |
| | NET DECREASE IN NET ASSETS RESULTING FROM OPERATIONS | | $ | (28,269,928 | ) | | $ | (18,707,805 | ) | | $ | (10,588,334 | ) |
| | |
| The accompanying notes are an integral part of these financial statements. | | 85 |
GOLDMAN SACHS STRATEGIC MULTI-ASSET CLASS FUNDS
Statements of Changes in Net Assets
| | | | | | | | | | | | | | | | | | | | | | |
| | | | | Multi-Manager Global
Equity Fund | | | | | | Multi-Manager Non-Core Fixed
Income Fund | |
| | | | | For the Fiscal
Year Ended
October 31, 2018 | | | For the Fiscal
Year Ended
October 31, 2017 | | | | | | For the Fiscal
Year Ended
October 31, 2018 | | | For the Fiscal
Year Ended
October 31, 2017 | |
| | From operations: | | | | | | | | | | | | | |
| | Net investment income | | $ | 7,226,072 | | | $ | 4,835,781 | | | | | | | $ | 30,636,147 | | | $ | 17,045,986 | |
| | Net realized gain (loss) | | | 36,630,124 | | | | 29,542,042 | | | | | | | | (20,549,334 | ) | | | 2,454,821 | |
| | Net change in unrealized gain (loss) | | | (72,126,124 | ) | | | 60,298,475 | | | | | | | | (28,794,618 | ) | | | (1,778,127 | ) |
| | Net increase (decrease) in net assets resulting from operations | | | (28,269,928 | ) | | | 94,676,298 | | | | | | | | (18,707,805 | ) | | | 17,722,680 | |
| | | | | | | | | | | | | | | | | | | | | | |
| | Distributions to shareholders: | | | | | | | | | | | | | |
| | From distributable earnings | | | (16,134,908 | ) | | | (9,419,142 | )(a) | | | | | | | (23,374,598 | ) | | | (15,978,609 | )(a) |
| | From return of capital | | | — | | | | — | | | | | | | | (7,036,890 | ) | | | (1,059,637 | ) |
| | Total distributions to shareholders | | | (16,134,908 | ) | | | (9,419,142 | ) | | | | | | | (30,411,488 | ) | | | (17,038,246 | ) |
| | | | | | | | | | | | | | | | | | | | | | |
| | From share transactions: | | | | | | | | | | | | | | | | | | | | |
| | Proceeds from sales of shares | | | 224,350,010 | | | | 124,275,010 | | | | | | | | 343,095,015 | | | | 156,040,015 | |
| | Reinvestment of distributions | | | 16,134,908 | | | | 9,419,142 | | | | | | | | 30,411,488 | | | | 16,839,680 | |
| | Cost of shares redeemed | | | (53,000,010 | ) | | | (333,507,466 | ) | | | | | | | (42,240,015 | ) | | | (75,927,513 | ) |
| | Net increase (decrease) in net assets resulting from share transactions | | | 187,484,908 | | | | (199,813,314 | ) | | | | | | | 331,266,488 | | | | 96,952,182 | |
| | TOTAL INCREASE (DECREASE) | | | 143,080,072 | | | | (114,556,158 | ) | | | | | | | 282,147,195 | | | | 97,636,616 | |
| | | | | | | | | | | | | | | | | | | | | | |
| | Net assets:(b) | | | | | | | | | | | | | |
| | Beginning of year | | | 490,496,684 | | | | 605,052,842 | | | | | | | | 401,682,480 | | | | 304,045,864 | |
| | End of year | | $ | 633,576,756 | | | $ | 490,496,684 | | | | | | | $ | 683,829,675 | | | $ | 401,682,480 | |
| | (a) | | Prior year information has been revised to conform to current year presentation. Distributions to share holders for Multi-Manager Global Equity Fund and Multi-Manager Non-Core Fixed Income Fund consisted solely of net investment income for the fiscal year ended October 31, 2017. |
| | (b) | | Prior fiscal year information has been revised to conform with current year presentation. Undistributed (distributions in excess of) net investment income was $2,926,404 and $(1,062,911) for Multi-Manager Global Equity Fund and Multi-Manager Non-Core Fixed Income Fund respectively, as of October 31, 2017. |
| | |
| 86 | | The accompanying notes are an integral part of these financial statements. |
GOLDMAN SACHS STRATEGIC MULTI-ASSET CLASS FUNDS
Statements of Changes in Net Assets (continued)
| | | | | | | | | | |
| | | | | Multi-Manager Real Assets Strategy Fund | |
| | | | | For the Fiscal
Year Ended
October 31, 2018 | | | For the Fiscal
Year Ended
October 31, 2017 | |
| | From operations: | |
| | Net investment income | | $ | 6,654,654 | | | $ | 4,667,070 | |
| | Net realized gain (loss) | | | (494,269 | ) | | | 5,945,104 | |
| | Net change in unrealized gain (loss) | | | (16,748,719 | ) | | | 6,298,956 | |
| | Net increase (decrease) in net assets resulting from operations | | | (10,588,334 | ) | | | 16,911,130 | |
| | | | | | | | | | |
| | Distributions to shareholders: | |
| | From distributable earnings | | | (5,483,013 | ) | | | (7,119,599 | )(a) |
| | | | | | | | | | |
| | From share transactions: | |
| | Proceeds from sales of shares | | | 272,441,005 | | | | 41,100,000 | |
| | Reinvestment of distributions | | | 5,483,013 | | | | 7,119,599 | |
| | Cost of shares redeemed | | | (87,285,114 | ) | | | (153,945,693 | ) |
| | Net increase (decrease) in net assets resulting from share transactions | | | 190,638,904 | | | | (105,726,094 | ) |
| | TOTAL INCREASE (DECREASE) | | | 174,567,557 | | | | (95,934,563 | ) |
| | | | | | | | | | |
| | Net assets:(b) | |
| | Beginning of year | | | 212,440,607 | | | | 308,375,170 | |
| | End of year | | $ | 387,008,164 | | | $ | 212,440,607 | |
| | (a) | | Prior year information has been revised to conform to current year presentation. Distributions to share holders for Multi-Manager Real Assets Strategy Fund consisted solely of net investment income for the fiscal year ended October 31, 2017. |
| | (b) | | Prior fiscal year information has been revised to conform with current year presentation. Distributions in excess of net investment income was $(1,666,912) as of October 31, 2017. |
| | |
| The accompanying notes are an integral part of these financial statements. | | 87 |
GOLDMAN SACHS MULTI-MANAGER GLOBAL EQUITY FUND
Financial Highlights
Selected Data for a Share Outstanding Throughout Each Period
| | | | | | | | | | | | | | | | | | |
| | | | | Goldman Sachs Multi-Manager Global Equity Fund | |
| | | | | Class R6 Shares(a) | |
| | | | | Year Ended October 31, | | | For the
period ended,
October 31, 2015(b) | |
| | | | | 2018 | | | 2017 | | | 2016 | |
| | Per Share Data | | | | | | | | | | | | | | | | |
| | Net asset value, beginning of period | | $ | 11.36 | | | $ | 9.49 | | | $ | 9.46 | | | $ | 10.00 | |
| | Net investment income(c) | | | 0.15 | | | | 0.11 | | | | 0.11 | | | | 0.02 | |
| | Net realized and unrealized gain (loss) | | | (0.52 | ) | | | 1.91 | | | | (0.04 | ) | | | (0.56 | ) |
| | Total from investment operations | | | (0.37 | ) | | | 2.02 | | | | 0.07 | | | | (0.54 | ) |
| | Distributions to shareholders from net investment income | | | (0.15 | ) | | | (0.15 | ) | | | (0.04 | ) | | | — | |
| | Distributions to shareholder from net realized gains | | | (0.22 | ) | | | — | | | | — | | | | — | |
| | Total distributions | | | (0.37 | ) | | | (0.15 | ) | | | (0.04 | ) | | | — | |
| | Net asset value, end of period | | $ | 10.62 | | | $ | 11.36 | | | $ | 9.49 | | | $ | 9.46 | |
| | Total return(d) | | | (3.43 | )% | | | 21.63 | % | | | 0.74 | % | | | (5.40 | )% |
| | Net assets, end of year (in 000s) | | $ | 633,577 | | | $ | 490,497 | | | $ | 605,053 | | | $ | 439,155 | |
| | Ratio of net expenses to average net assets | | | 0.80 | % | | | 0.85 | % | | | 0.85 | % | | | 0.85 | %(e) |
| | Ratio of total expenses to average net assets | | | 1.39 | % | | | 1.47 | % | | | 1.31 | % | | | 1.34 | %(e) |
| | Ratio of net investment income to average net assets | | | 1.29 | % | | | 1.03 | % | | | 1.19 | % | | | 0.74 | %(e) |
| | Portfolio turnover rate(f) | | | 76 | % | | | 88 | % | | | 47 | % | | | 10 | % |
| | (a) | | Effective January 16, 2018, Institutional Shares were redesignated as Class R6 Shares. |
| | (b) | | Commenced operations on June 24, 2015. |
| | (c) | | Calculated based on the average shares outstanding methodology. |
| | (d) | | Assumes reinvestment of all dividends and distributions. Returns do not reflect the impact of taxes to shareholders relating to Fund distributions or the redemption of Fund shares. Total returns for periods less than one full year are not annualized. |
| | (f) | | The Fund’s portfolio turnover rate is calculated in accordance with regulatory requirements, without regard to transactions involving short term investments and certain derivatives. If such transactions were included, the Fund’s portfolio turnover rate may be higher. |
| | |
| 88 | | The accompanying notes are an integral part of these financial statements. |
GOLDMAN SACHS MULTI-MANAGER NON-CORE FIXED INCOME FUND
Financial Highlights (continued)
Selected Data for a Share Outstanding Throughout Each Period
| | | | | | | | | | | | | | | | | | |
| | | | | Goldman Sachs Multi-Manager Non-Core Fixed Income Fund | |
| | | | | Class R6 Shares(a) | |
| | | | | Year Ended October 31, | | | For the
period ended,
October 31, 2015(b) | |
| | | | | 2018 | | | 2017 | | | 2016 | |
| | Per Share Data | | | | | | | | | | | | | | | | |
| | Net asset value, beginning of period | | $ | 9.60 | | | $ | 9.60 | | | $ | 9.37 | | | $ | 10.00 | |
| | Net investment income(c) | | | 0.51 | | | | 0.50 | | | | 0.46 | | | | 0.25 | |
| | Net realized and unrealized gain (loss) | | | (0.77 | ) | | | — | | | | 0.23 | | | | (0.63 | ) |
| | Total from investment operations | | | (0.26 | ) | | | 0.50 | | | | 0.69 | | | | (0.38 | ) |
| | Distributions to shareholders from net investment income | | | (0.39 | ) | | | (0.47 | ) | | | (0.43 | ) | | | (0.24 | ) |
| | Distributions to shareholder from capital | | | (0.12 | ) | | | (0.03 | ) | | | (0.03 | ) | | | (0.01 | ) |
| | Total distributions | | | (0.51 | ) | | | (0.50 | ) | | | (0.46 | ) | | | (0.25 | ) |
| | Net asset value, end of period | | $ | 8.83 | | | $ | 9.60 | | | $ | 9.60 | | | $ | 9.37 | |
| | Total return(d) | | | (2.84 | )% | | | 5.38 | % | | | 7.54 | % | | | (3.84 | )% |
| | Net assets, end of year (in 000s) | | $ | 683,830 | | | $ | 401,682 | | | $ | 304,046 | | | $ | 270,687 | |
| | Ratio of net expenses to average net assets | | | 0.70 | % | | | 0.70 | % | | | 0.70 | % | | | 0.70 | %(e) |
| | Ratio of total expenses to average net assets | | | 1.08 | % | | | 1.12 | % | | | 1.20 | % | | | 1.19 | %(e) |
| | Ratio of net investment income to average net assets | | | 5.52 | % | | | 5.26 | % | | | 4.91 | % | | | 4.45 | %(e) |
| | Portfolio turnover rate(f) | | | 123 | % | | | 152 | % | | | 96 | % | | | 82 | % |
| | (a) | | Effective January 16, 2018, Institutional Shares were redesignated as Class R6 Shares. |
| | (b) | | Commenced operations March 31, 2015. |
| | (c) | | Calculated based on the average shares outstanding methodology. |
| | (d) | | Assumes reinvestment of all dividends and distributions. Returns do not reflect the impact of taxes to shareholders relating to Fund distributions or the redemption of Fund shares. Total returns for periods less than one full year are not annualized. |
| | (f) | | The Fund’s portfolio turnover rate is calculated in accordance with regulatory requirements, without regard to transactions involving short term investments and certain derivatives. If such transactions were included, the Fund’s portfolio turnover rate may be higher. |
| | |
| The accompanying notes are an integral part of these financial statements. | | 89 |
GOLDMAN SACHS MULTI-MANAGER REAL ASSETS STRATEGY FUND
Financial Highlights (continued)
Selected Data for a Share Outstanding Throughout Each Period
| | | | | | | | | | | | | | | | | | |
| | | | | Goldman Sachs Multi-Manager Real Assets Strategy Fund | |
| | | | | Class R6 Shares(a) | |
| | | | | Year Ended October 31, | | | For the
period ended,
October 31, 2015(b) | |
| | | | | 2018 | | | 2017 | | | 2016 | |
| | Per Share Data | | | | | | | | | | | | | | | | |
| | Net asset value, beginning of period | | $ | 9.66 | | | $ | 9.17 | | | $ | 9.57 | | | $ | 10.00 | |
| | Net investment income(c) | | | 0.23 | (g) | | | 0.20 | | | | 0.18 | | | | 0.02 | |
| | Net realized and unrealized gain (loss) | | | (0.41 | ) | | | 0.58 | | | | (0.38 | ) | | | (0.45 | ) |
| | Total from investment operations | | | (0.18 | ) | | | 0.78 | | | | (0.20 | ) | | | (0.43 | ) |
| | Distributions to shareholders from net investment income | | | (0.05 | ) | | | (0.29 | ) | | | (0.20 | ) | | | — | |
| | Distributions to shareholders from net realized gains | | | (0.19 | ) | | | — | | | | — | | | | — | |
| | Total distributions | | | (0.24 | ) | | | (0.29 | ) | | | (0.20 | ) | | | — | |
| | Net asset value, end of period | | $ | 9.24 | | | $ | 9.66 | | | $ | 9.17 | | | $ | 9.57 | |
| | Total return(d) | | | (1.88 | )% | | | 8.65 | % | | | (2.14 | )% | | | (4.30 | )% |
| | Net assets, end of year (in 000s) | | $ | 387,008 | | | $ | 212,441 | | | $ | 308,375 | | | $ | 197,429 | |
| | Ratio of net expenses to average net assets | | | 0.90 | % | | | 0.90 | % | | | 0.87 | % | | | 0.90 | %(e) |
| | Ratio of total expenses to average net assets | | | 1.32 | % | | | 1.32 | % | | | 1.33 | % | | | 1.42 | %(e) |
| | Ratio of net investment income to average net assets | | | 2.37 | %(g) | | | 2.10 | % | | | 1.96 | % | | | 0.67 | %(e) |
| | Portfolio turnover rate(f) | | | 86 | % | | | 131 | % | | | 93 | % | | | 35 | % |
| | (a) | | Effective January 16, 2018, Institutional Shares were redesignated as Class R6 Shares. |
| | (b) | | Commenced operations on June 30, 2015. |
| | (c) | | Calculated based on the average shares outstanding methodology. |
| | (d) | | Assumes reinvestment of all dividends and distributions. Returns do not reflect the impact of taxes to shareholders relating to Fund distributions or the redemption of Fund shares. Total returns for periods less than one full year are not annualized. |
| | (f) | | The Fund’s portfolio turnover rate is calculated in accordance with regulatory requirements, without regard to transactions involving short term investments and certain derivatives. If such transactions were included, the Fund’s portfolio turnover rate may be higher. |
| | (g) | | Reflects income recognized from special dividends which amounted to $0.04 per share and 0.45% of average net assets. |
| | |
| 90 | | The accompanying notes are an integral part of these financial statements. |
GOLDMAN SACHS STRATEGIC MULTI-ASSET CLASS FUNDS
Notes to Financial Statements
October 31, 2018
Goldman Sachs Trust II (the “Trust”) is a Delaware statutory trust registered under the Investment Company Act of 1940, as amended (the “Act”), as an open-end management investment company. The following table lists those series of the Trust that are included in this report (collectively, the “Funds” or individually a “Fund”), along with their corresponding share classes and respective diversification status under the Act:
| | | | |
| Fund | | Share Classes Offered | | Diversified/
Non-diversified |
Multi-Manager Global Equity Fund | | Class R6 (formerly Institutional)(a) | | Diversified |
Multi-Manager Non-Core Fixed Income Fund | | Class R6 (formerly Institutional)(a) | | Diversified(b) |
Mutli-Manager Real Assets Strategy Fund | | Class R6 (formerly Institutional)(a) | | Diversified |
| (a) | | Effective January 16, 2018, Institutional Shares were redesignated as Class R6 Shares. |
| (b) | | The Multi-Manager Non-Core Fixed Income Fund was previously registered as a non-diversified investment company. Pursuant to current positions of the SEC staff, the Multi-Manager Non-Core Fixed Income Fund’s classification has changed from non diversified to diversified, and the Fund will not be able to become non-diversified unless it seeks and obtains the approval of shareholders. Accordingly, the Multi-Manager Non-Core Fixed Fund may not make any investment inconsistent with the Fund’s classification as a diversified company under the Act. |
Goldman Sachs Asset Management, L.P. (“GSAM”), an affiliate of Goldman Sachs & Co. LLC (“Goldman Sachs”), serves as investment adviser to the Funds pursuant to management agreements (the “Agreement”) with the Trust. As of October 31, 2018, GSAM had sub-advisory agreements (the “Sub-Advisory Agreements”) for the Multi-Manager Global Equity Fund with Boston Partners Global Investors, Inc., Causeway Capital Management LLC, Fisher Asset Management, LLC, GW&K Investment Management, LLC, Legal & General Investment Management America, Inc., Principal Global Investors, LLC, Quantitative Management Associates LLC, Russell Investments Implementation Services, LLC, Vaughan Nelson Investment Management, L.P., Vulcan Value Partners, LLC, WCM Investment Management and Wellington Management Company LLP; for the Multi-Manager Non-Core Fixed Income Fund with Ares Capital Management II LLC, BlueBay Asset Management LLP, Brigade Capital Management, LP, Lazard Asset Management LLC, Symphony Asset Management LLC, and TCW Investment Management Company LLC; and for the Multi-Manager Real Assets Strategy Fund with PGIM Real Estate, a business unit of PGIM, Inc., Presima Inc., RARE Infrastructure (North America) Pty Limited and RREEF America L.L.C. (the “Underlying Managers”). Pursuant to the terms of the Sub-Advisory Agreements, the Underlying Managers are responsible for making investment decisions and managing the investments of the Fund. GSAM compensates the Underlying Managers directly in accordance with the terms of the Sub-Advisory Agreements. The Funds are not charged any separate or additional investment advisory fees by the Underlying Managers.
|
| 2. SIGNIFICANT ACCOUNTING POLICIES |
The financial statements have been prepared in accordance with accounting principles generally accepted in the United States of America (“GAAP”) and require management to make estimates and assumptions that may affect the reported amounts and disclosures. Actual results may differ from those estimates and assumptions.
A. Investment Valuation — The Funds’ valuation policy is to value investments at fair value.
B. Investment Income and Investments — Investment income includes interest income, dividend income, and securities lending income, if any. Interest income is accrued daily and adjusted for amortization of premiums and accretion of discounts. Dividend income is recognized on ex-dividend date or, for certain foreign securities, as soon as such information is obtained subsequent to the ex-dividend date. Investment transactions are reflected on trade date. Realized gains and losses are calculated using identified cost. Investment transactions are recorded on the following business day for daily net asset value (“NAV”) calculations. Investment income is recorded net of any foreign withholding taxes, less any amounts reclaimable. The Funds may file withholding tax reclaims in certain jurisdictions to recover a portion of amounts previously withheld. Any foreign capital gains tax is accrued daily based upon net unrealized gains, and is payable upon sale of such investments. Distributions received from the
91
GOLDMAN SACHS STRATEGIC MULTI-ASSET CLASS FUNDS
Notes to Financial Statements (continued)
October 31, 2018
|
| 2. SIGNIFICANT ACCOUNTING POLICIES (continued) |
Funds’ investments in U.S. real estate investment trusts (“REITs”) may be characterized as ordinary income, net capital gain or a return of capital. A return of capital is recorded by the Funds as a reduction to the cost basis of the REIT.
For derivative contracts, realized gains and losses are recorded upon settlement of the contract. Upfront payments, if any, are made or received upon entering into a swap agreement and are reflected in the Statements of Assets and Liabilities. Upfront payments are recognized over the contract’s term/event as realized gains or losses, with the exception of forward starting swap contracts whose realized gains or losses are recognized from the effective start date.
C. Expenses — Expenses incurred directly by a Fund are charged to the Fund, and certain expenses incurred by the Trust are allocated across the applicable Funds on a straight-line and/or pro-rata basis, depending upon the nature of the expenses, and are accrued daily.
D. Federal Taxes and Distributions to Shareholders — It is each Fund’s policy to comply with the requirements of the Internal Revenue Code of 1986, as amended (the “Code”), applicable to regulated investment companies and to distribute each year substantially all of its investment company taxable income and capital gains to its shareholders. Accordingly, each Fund is not required to make any provisions for the payment of federal income tax. Distributions to shareholders are recorded on the ex-dividend date. Income and capital gains distributions, if any, are declared and paid according to the following schedule:
| | | | | | |
| Fund | | | | Income Distributions Declared/Paid | | Capital Gains Distributions Declared/Paid |
Multi-Manager Global Equity | | | | Annually | | Annually |
Multi-Manager Non-Core Fixed Income | | | | Daily/Monthly | | Annually |
Multi-Manager Real Assets Strategy | | | | Annually* | | Annually |
| * | | The Multi-Manager Real Assets Strategy Fund changed from quarterly to an annual distribution as of February 2018. |
Net capital losses, if any, are carried forward to future fiscal years and may be used to the extent allowed by the Code to offset any future capital gains. Losses that are carried forward will retain their character as either short-term or long-term capital losses. Utilization of capital loss carryforwards will reduce the requirement of future capital gains distributions.
The characterization of distributions to shareholders for financial reporting purposes is determined in accordance with federal income tax rules, which may differ from GAAP. The source of each Fund’s distributions may be shown in the accompanying financial statements as either from distributable earnings or capital. Certain components of the Funds’ net assets on the Statements of Assets and Liabilities reflect permanent GAAP/tax differences based on the appropriate tax character.
E. Foreign Currency Translation — The accounting records and reporting currency of a Fund are maintained in U.S. dollars. Assets and liabilities denominated in foreign currencies are translated into U.S. dollars using the current exchange rates at the close of each business day. The effect of changes in foreign currency exchange rates on investments is included within net realized and unrealized gain (loss) on investments. Changes in the value of other assets and liabilities as a result of fluctuations in foreign exchange rates are included in the Statements of Operations within net change in unrealized gain (loss) on foreign currency translation. Transactions denominated in foreign currencies are translated into U.S. dollars on the date the transaction occurred, the effects of which are included within net realized gain (loss) on foreign currency transactions.
F. Commission Recapture — GSAM, on behalf of certain Funds, may direct portfolio trades, subject to seeking best execution, to various brokers who have agreed to rebate a portion of the commissions generated. Such rebates are made directly to a Fund as cash payments and are included in net realized gain (loss) from investments on the Statement of Operations.
|
| 3. INVESTMENTS AND FAIR VALUE MEASUREMENTS |
U.S. GAAP defines the fair value of a financial instrument as the amount that would be received to sell an asset or paid to transfer a liability in an orderly transaction between market participants at the measurement date (i.e., the exit price); the Funds’ policy is to
92
GOLDMAN SACHS STRATEGIC MULTI-ASSET CLASS FUNDS
|
| 3. INVESTMENTS AND FAIR VALUE MEASUREMENTS (continued) |
use the market approach. GAAP establishes a fair value hierarchy that prioritizes the inputs to valuation techniques used to measure fair value. The hierarchy gives the highest priority to unadjusted quoted prices in active markets for identical assets or liabilities (Level 1 measurements) and the lowest priority to unobservable inputs (Level 3 measurements). The levels used for classifying investments are not necessarily an indication of the risk associated with investing in these investments. The three levels of the fair value hierarchy are described below:
Level 1 — Unadjusted quoted prices in active markets that are accessible at the measurement date for identical, unrestricted assets or liabilities;
Level 2 — Quoted prices in markets that are not active or financial instruments for which significant inputs are observable (including, but not limited to, quoted prices for similar investments, interest rates, foreign exchange rates, volatility and credit spreads), either directly or indirectly;
Level 3 — Prices or valuations that require significant unobservable inputs (including GSAM’s assumptions in determining fair value measurement).
Changes in valuation techniques may result in transfers into or out of an assigned level within the hierarchy. In accordance with the Funds’ policy, transfers between different levels of the fair value hierarchy resulting from such changes are deemed to have occurred as of the beginning of the reporting period.
The Board of Trustees (“Trustees”) has approved Valuation Procedures that govern the valuation of the portfolio investments held by the Funds, including investments for which market quotations are not readily available. The Trustees have delegated to GSAM day-to-day responsibility for implementing and maintaining internal controls and procedures related to the valuation of the Funds’ investments. To assess the continuing appropriateness of pricing sources and methodologies, GSAM regularly performs price verification procedures and issues challenges as necessary to third party pricing vendors or brokers, and any differences are reviewed in accordance with the Valuation Procedures.
A. Level 1 and Level 2 Fair Value Investments — The valuation techniques and significant inputs used in determining the fair values for investments classified as Level 1 and Level 2 are as follows:
Equity Securities — Equity securities traded on a United States (“U.S.”) securities exchange or the NASDAQ system, or those located on certain foreign exchanges, including but not limited to the Americas, are valued daily at their last sale price or official closing price on the principal exchange or system on which they are traded. If there is no sale or official closing price or such price is believed by GSAM to not represent fair value, equity securities are valued at the last bid price for long positions and at the last ask price for short positions. To the extent these investments are actively traded, they are classified as Level 1 of the fair value hierarchy, otherwise they are generally classified as Level 2.
Unlisted equity securities for which market quotations are available are valued at the last sale price on the valuation date, or if no sale occurs, at the last bid price, and are generally classified as Level 2. Securities traded on certain foreign securities exchanges are valued daily at fair value determined by an independent fair value service (if available) under Valuation Procedures approved by the Trustees and consistent with applicable regulatory guidance. The independent fair value service takes into account multiple factors including, but not limited to, movements in the securities markets, certain depositary receipts, futures contracts and foreign currency exchange rates that have occurred subsequent to the close of the foreign securities exchange. These investments are generally classified as Level 2 of the fair value hierarchy.
Private Investments — Private investments may include, but are not limited to, investments in private equity or debt instruments. The investment manager estimates the fair value of private investments based upon various factors, including, but not limited to, transactions in similar instruments, completed or pending third-party transactions in underlying investments or comparable entities, subsequent rounds of financing, recapitalizations, and other transactions across the capital structure, offerings in equity or debt capital markets, and changes in current and projected financial ratios or cash flows.
Underlying Funds (including Money Market Funds) — Underlying Funds (“Underlying Funds”) include other investment companies and exchange-traded funds (“ETFs”). Investments in the Underlying Funds (except ETFs) are valued at the NAV per share of the Institutional Share class on the day of valuation. ETFs are valued daily at the last sale price or official closing price on
93
GOLDMAN SACHS STRATEGIC MULTI-ASSET CLASS FUNDS
Notes to Financial Statements (continued)
October 31, 2018
|
| 3. INVESTMENTS AND FAIR VALUE MEASUREMENTS (continued) |
the principal exchange or system on which the investment is traded. Because the Funds invest in Underlying Funds that fluctuate in value, the Funds’ shares will correspondingly fluctuate in value. To the extent these investments are actively traded, they are classified as Level 1 of the fair value hierarchy, otherwise they are generally classified as Level 2. For information regarding an Underlying Fund’s accounting policies and investment holdings, please see the Underlying Fund’s shareholder report.
Debt Securities — Debt securities for which market quotations are readily available are valued daily on the basis of quotations supplied by dealers or an independent pricing service approved by the Trustees. The pricing services may use valuation models or matrix pricing, which consider: (i) yield or price with respect to bonds that are considered comparable in characteristics such as rating, interest rate and maturity date or (ii) quotations from securities dealers to determine current value. With the exception of treasury securities of G8 countries, which are generally classified as Level 1, these investments are generally classified as Level 2 of the fair value hierarchy.
i. Bank Loans — Bank loans (“Loans”) are interests in amounts owed by corporate, governmental, or other borrowers to lenders or lending syndicates. Loans are arranged through private negotiations between the borrower and one or more financial institutions (“Lenders”). A Fund’s investments in Loans are in the form of either participations in Loans (“Participations”) or assignments of all or a portion of Loans from third parties (“Assignments”). With respect to Participations, a Fund has the right to receive payments of principal, interest and any fees to which it is entitled from the Lender selling the Participations and only upon receipt by the Lender of the payments from the borrower. A Fund generally has no right to enforce compliance by the borrower with the terms of the loan agreement with respect to Participations. Conversely, assignments result in a Fund having a direct contractual relationship with the borrower, and the Fund may be permitted to enforce compliance by the borrower with the terms of the loan agreement.
ii. Repurchase Agreements — Repurchase agreements involve the purchase of securities subject to the seller’s agreement to repurchase the securities at a mutually agreed upon date and price, under the terms of a Master Repurchase Agreement (“MRA”). During the term of a repurchase agreement, the value of the underlying securities held as collateral on behalf of a Fund, including accrued interest, is required to exceed the value of the repurchase agreement, including accrued interest. The gross value of repurchase agreements is included in the Statements of Assets and Liabilities for financial reporting purposes. The underlying securities for all repurchase agreements are held at the Funds’ custodian or designated sub-custodians under tri-party repurchase agreements.
An MRA governs transactions between a Fund and select counterparties. An MRA contains provisions for, among other things, initiation of the transaction, income payments, events of default and maintenance of securities for repurchase agreements. An MRA also permits offsetting with collateral to create one single net payment in the event of default or similar events, including the bankruptcy or insolvency of a counterparty.
If the seller defaults, a Fund could suffer a loss to the extent that the proceeds from the sale of the underlying securities and other collateral held by the Fund are less than the repurchase price and the Fund’s costs associated with delay and enforcement of the repurchase agreement. In addition, in the event of default or insolvency of the seller, a court could determine that a Fund’s interest in the collateral is not enforceable, resulting in additional losses to the Fund.
Pursuant to exemptive relief granted by the Securities and Exchange Commission (“SEC”) and terms and conditions contained therein, the Funds, together with other funds of the Trust and registered investment companies having management agreements with GSAM or its affiliates, may transfer uninvested cash into joint accounts, the daily aggregate balance of which is invested in one or more repurchase agreements. Under these joint accounts, the Funds maintain pro-rata credit exposure to the underlying repurchase agreements’ counterparties. With the exception of certain transaction fees, the Funds are not subject to any expenses in relation to these investments.
Derivative Contracts — A derivative is an instrument whose value is derived from underlying assets, indices, reference rates or a combination of these factors. A Fund enters into derivative transactions to hedge against changes in interest rates, securities prices, and/or currency exchange rates, to increase total return, or to gain access to certain markets or attain exposure to other underliers.
Exchange-traded derivatives, including futures and options contracts, are generally valued at the last sale or settlement price on the exchange where they are principally traded. Exchange-traded options without settlement prices are generally valued at the
94
GOLDMAN SACHS STRATEGIC MULTI-ASSET CLASS FUNDS
|
| 3. INVESTMENTS AND FAIR VALUE MEASUREMENTS (continued) |
last bid price for long positions and the last ask price on short positions on the exchange where they are principally traded. Exchange-traded derivatives typically fall within Level 1 of the fair value hierarchy. Over-the-counter (“OTC”) and centrally cleared derivatives are valued using market transactions and other market evidence, including market-based inputs to models, calibration to market-clearing transactions, broker or dealer quotations, or other alternative pricing sources. Where models are used, the selection of a particular model to value OTC and centrally cleared derivatives depends upon the contractual terms of, and specific risks inherent in, the instrument, as well as the availability of pricing information in the market. Valuation models require a variety of inputs, including contractual terms, market prices, yield curves, credit curves, measures of volatility, voluntary and involuntary prepayment rates, loss severity rates and correlations of such inputs. For OTC and centrally cleared derivatives that trade in liquid markets, model inputs can generally be verified and model selection does not involve significant management judgment. OTC and centrally cleared derivatives are classified within Level 2 of the fair value hierarchy when significant inputs are corroborated by market evidence.
i. Forward Contracts — A forward contract is a contract between two parties to buy or sell an asset at a specified price on a future date. A forward contract settlement can occur on a cash or delivery basis. Forward contracts are marked-to-market daily using independent vendor prices, and the change in value, if any, is recorded as an unrealized gain or loss. Cash and certain investments may be used to collateralize forward contracts.
A forward foreign currency exchange contract is a forward contract in which a Fund agrees to receive or deliver a fixed quantity of one currency for another, at a pre-determined price at a future date. All forward foreign currency exchange contracts are marked-to-market daily at the applicable forward rate. Non-deliverable forward foreign currency exchange contracts are settled with the counterparty in cash without the delivery of foreign currency.
ii. Futures Contracts — Futures contracts are contracts to buy or sell a standardized quantity of a specified commodity or security. Upon entering into a futures contract, a Fund deposits cash or securities in an account on behalf of the broker in an amount sufficient to meet the initial margin requirement. Subsequent payments are made or received by a Fund equal to the daily change in the contract value and are recorded as variation margin receivable or payable with a corresponding offset to unrealized gains or losses. For financial reporting purposes, cash collateral that has been pledged to cover obligations of a Fund and cash collateral received, if any, is reported separately on the Statements of Assets and Liabilities as receivables/payables for collateral on certain derivative contracts. Non-cash collateral pledged by a Fund, if any, is noted in the Schedules of Investments.
iii. Options — When the Fund writes call or put options, an amount equal to the premium received is recorded as a liability and is subsequently marked-to-market to reflect the current value of the option written. Swaptions are options on interest rate swap contracts.
Upon the purchase of a call option or a put option by a Fund, the premium paid is recorded as an investment and subsequently marked-to-market to reflect the current value of the option. Certain options may be purchased with premiums to be determined on a future date. The premiums for these options are based upon implied volatility parameters at specified terms.
iv. Swap Contracts — Bilateral swap contracts are agreements in which a Fund and a counterparty agree to exchange periodic payments on a specified notional amount or make a net payment upon termination. Bilateral swap transactions are privately negotiated in the OTC market and payments are settled through direct payments between a Fund and the counterparty. By contrast, certain swap transactions are subject to mandatory central clearing. These swaps are executed through a derivatives clearing member (“DCM”), acting in an agency capacity, and submitted to a central counterparty (“CCP”) (“centrally cleared swaps”), in which case all payments are settled with the CCP through the DCM. Swaps are marked-to-market daily using pricing vendor quotations, counterparty or clearinghouse prices or model prices, and the change in value, if any, is recorded as an unrealized gain or loss. Upon entering into a swap contract, a Fund is required to satisfy an initial margin requirement by delivering cash or securities to the counterparty (or in some cases, segregated in a triparty account on behalf of the counterparty), which can be adjusted by any mark-to-market gains or losses pursuant to bilateral or centrally cleared arrangements. For centrally cleared swaps the daily change in valuation, if any, is recorded as a receivable or payable for variation margin.
95
GOLDMAN SACHS STRATEGIC MULTI-ASSET CLASS FUNDS
Notes to Financial Statements (continued)
October 31, 2018
|
| 3. INVESTMENTS AND FAIR VALUE MEASUREMENTS (continued) |
A credit default swap is an agreement that involves one party (the buyer of protection) making a stream of payments to another party (the seller of protection) in exchange for the right to receive protection on a reference security or obligation, including a group of assets or exposure to the performance of an index. A Fund’s investment in credit default swaps may involve greater risks than if the Fund had invested in the referenced obligation directly. Credit events are contract specific but may include bankruptcy, failure to pay, restructuring and obligation acceleration. If a Fund buys protection through a credit default swap and no credit event occurs, its payments are limited to the periodic payments previously made to the counterparty. Upon the occurrence of a specified credit event, a Fund, as a buyer of credit protection, is entitled to receive an amount equal to the notional amount of the swap and deliver to the seller the defaulted reference obligation in a physically settled trade. A Fund may also receive a net settlement amount in the form of cash or securities equal to the notional amount of the swap reduced by the recovery value of the reference obligation in a cash settled trade.
An interest rate swap is an agreement that obligates two parties to exchange a series of cash flows at specified intervals, based upon or calculated by reference to changes in interest rates on a specified notional principal amount. The payment flows are usually netted against each other, with the difference being paid by one party to the other.
B. Level 3 Fair Value Investments — To the extent that significant inputs to valuation models and other alternative pricing sources are unobservable, or if quotations are not readily available, or if GSAM believes that such quotations do not accurately reflect fair value, the fair value of a Fund’s investments may be determined under Valuation Procedures approved by the Trustees. GSAM, consistent with its procedures and applicable regulatory guidance, may make an adjustment to the most recent valuation prices of either domestic or foreign securities in light of significant events to reflect what it believes to be the fair value of the securities at the time of determining a Fund’s NAV. Significant events which could affect a large number of securities in a particular market may include, but are not limited to: significant fluctuations in U.S. or foreign markets; market dislocations; market disruptions; or unscheduled market closings. Significant events which could also affect a single issuer may include, but are not limited to: corporate actions such as reorganizations, mergers and buy-outs; ratings downgrades; and bankruptcies.
C. Fair Value Hierarchy — The following is a summary of the Funds’ investments and derivatives classified in the fair value hierarchy as of October 31, 2018:
| | | | | | | | | | | | |
|
MULTI-MANAGER GLOBAL EQUITY
| |
| | | |
| Investment Type | | Level 1 | | | Level 2 | | | Level 3 | |
| Assets | | | | | | | | | | | | |
Common Stock and/or Other Equity Investments(a) | | | | | | | | | | | | |
Africa | | $ | 609,237 | | | $ | 4,181,564 | | | $ | — | |
Asia | | | 17,493,596 | | | | 110,776,846 | | | | — | |
Australia and Oceania | | | 222,571 | | | | 8,038,209 | | | | — | |
Europe | | | 16,019,674 | | | | 115,445,955 | | | | — | |
North America | | | 318,199,596 | | | | 1,357,246 | | | | — | |
South America | | | 10,228,970 | | | | 1,818,322 | | | | — | |
Rights | | | — | | | | 2 | | | | — | |
Exchange Traded Fund | | | 188,046 | | | | — | | | | — | |
Investment Company | | | 23,766,349 | | | | — | | | | — | |
Short-term Investments | | | — | | | | 700,000 | | | | — | |
| Total | | $ | 386,728,039 | | | $ | 242,318,144 | | | $ | — | |
96
GOLDMAN SACHS STRATEGIC MULTI-ASSET CLASS FUNDS
|
| 3. INVESTMENTS AND FAIR VALUE MEASUREMENTS (continued) |
| | | | | | | | | | | | |
|
| MULTI-MANAGER GLOBAL EQUITY (continued) | |
| | | |
| Derivative Type | | Level 1 | | | Level 2 | | | Level 3 | |
| Assets(b) | | | | | | | | | | | | |
Forward Foreign Currency Exchange Contracts | | $ | — | | | $ | 2,409,729 | | | $ | — | |
| Liabilities(b) | | | | | | | | | | | | |
Forward Foreign Currency Exchange Contracts | | $ | — | | | $ | (28,613 | ) | | $ | — | |
Futures Contracts | | | (101,449 | ) | | | — | | | | — | |
| Total | | $ | (101,449 | ) | | $ | (28,613 | ) | | $ | — | |
| | | |
MULTI-MANAGER NON-CORE FIXED INCOME
| | | | | | | | | | | | |
| | | |
| Investment Type | | Level 1 | | | Level 2 | | | Level 3 | |
| Assets | | | | | | | | | | | | |
Fixed Income | |
Foreign Debt Obligations | | $ | 6,926,172 | | | $ | 244,744,704 | | | $ | — | |
Corporate Obligations | | | — | | | | 268,803,128 | | | | — | |
Bank Loans | | | — | | | | 110,749,728 | | | | 957,005 | |
Common Stock and/or Other Equity Investments(a) | |
North America | | | 353,851 | | | | 667,861 | | | | 131,918 | |
Warrants | | | — | | | | 103,774 | | | | — | |
Exchange Traded Fund | | | 1,452,338 | | | | — | | | | — | |
Investment Company | | | 56,198,365 | | | | — | | | | — | |
| Total | | $ | 64,930,726 | | | $ | 625,069,195 | | | $ | 1,088,923 | |
| | | |
| Derivative Type | | | | | | | | | |
| Assets | | | | | | | | | | | | |
Forward Foreign Currency Exchange Contracts(b) | | $ | — | | | $ | 1,068,111 | | | $ | — | |
Credit Default Swap Contracts(b) | | | — | | | | 84,750 | | | | — | |
Options Purchased | | | — | | | | 44,251 | | | | — | |
| Total | | $ | — | | | $ | 1,197,112 | | | $ | — | |
| Liabilities(b) | | | | | | | | | | | | |
Forward Foreign Currency Exchange Contracts | | $ | — | | | $ | (1,702,553 | ) | | $ | — | |
97
GOLDMAN SACHS STRATEGIC MULTI-ASSET CLASS FUNDS
Notes to Financial Statements (continued)
October 31, 2018
|
| 3. INVESTMENTS AND FAIR VALUE MEASUREMENTS (continued) |
| | | | | | | | | | | | |
|
| MULTI-MANAGER REAL ASSETS STRATEGY | |
| | | |
| Investment Type | | Level 1 | | | Level 2 | | | Level 3 | |
| Assets | | | | | | | | | | | | |
Common Stock and/or Other Equity Investments(a) | |
Asia | | $ | 104,018 | | | $ | 51,297,530 | | | $ | — | |
Australia and Oceania | | | — | | | | 18,660,616 | | | | — | |
Europe | | | 3,862,378 | | | | 71,102,176 | | | | — | |
North America | | | 213,763,889 | | | | — | | | | — | |
South America | | | 705,024 | | | | — | | | | — | |
Exchange Traded Funds | | | 15,703,400 | | | | — | | | | — | |
Investment Company | | | 10,604,129 | | | | — | | | | — | |
| Total | | $ | 244,742,838 | | | $ | 141,060,322 | | | $ | — | |
| | | |
| Derivative Type | | | | | | | | | |
| Assets(b) | | | | | | | | | | | | |
Forward Foreign Currency Exchange Contracts | | $ | — | | | $ | 46 | | | $ | — | |
| (a) | | Amounts are disclosed by continent to highlight the impact of time zone differences between local market close and the calculation of NAV. Security valuations are based on the principal exchange or system on which they are traded, which may differ from country of domicile. The Funds utilize fair value model prices provided by an independent fair value service for international equities, resulting in a Level 2 classification. |
| (b) | | Amount shown represents unrealized gain (loss) at period end. |
For further information regarding security characteristics, see the Schedules of Investments.
|
| 4. INVESTMENTS IN DERIVATIVES |
The following tables set forth, by certain risk types, the gross value of derivative contracts (not considered to be hedging instruments for accounting disclosure purposes) as of October 31, 2018. These instruments were used as part of the Funds’ investment strategies and to obtain and/or manage exposure related to the risks below. The values in the tables below exclude the effects of cash collateral received or posted pursuant to these derivative contracts, and therefore are not representative of the Funds’ net exposure.
| | | | | | | | | | | | |
| | | |
| Multi-Manager Global Equity | | | | | | | | | | |
| Risk | | Statements of Assets
and Liabilities | | Assets | | | Statements of Assets
and Liabilities | | Liabilities | |
Currency | | Receivable for unrealized gain on forward foreign currency exchange contracts. | | $ | 2,409,729 | | | Payable for unrealized loss on forward foreign currency exchange contracts | | $ | (28,613) | |
Equity | | — | | | — | | | Variation margin on futures contracts | | | (101,449) | (a) |
| Total | | | | $ | 2,409,729 | | | | | $ | (130,062) | |
98
GOLDMAN SACHS STRATEGIC MULTI-ASSET CLASS FUNDS
|
| 4. INVESTMENTS IN DERIVATIVES (continued) |
| | | | | | | | | | | | |
| | | |
| Multi-Manager Non-Core Fixed Income | | | | | | | | | | |
| Risk | | Statements of Assets
and Liabilities | | Assets | | | Statements of Assets
and Liabilities | | Liabilities | |
Credit | | Variation margin on swap contracts | | $ | 84,750 | (a) | | — | | $ | — | |
Currency | | Receivable for unrealized gain on forward foreign currency exchange contracts; Purchased options, at value | | | 1,112,362 | | | Payable for unrealized loss on forward foreign currency exchange contracts. | | | (1,702,553) | |
| Total | | | | $ | 1,197,112 | | | | | $ | (1,702,553) | |
| | | |
| Multi-Manager Real Assets Strategy | | | | | | | | | | |
| Risk | | Statement of Assets
and Liabilities | | Assets | | | Statement of Assets
and Liabilities | | Liabilities | |
Currency | | Receivable for unrealized gain on forward foreign currency exchange contracts. | | $ | 46 | | | — | | $ | — | |
| (a) | | Includes unrealized gain (loss) on futures contracts and centrally cleared swaps described in the Additional Investment Information sections of the Schedules of Investments. Only current day’s variation margin is reported within the Statements of Assets and Liabilities. |
The following tables set forth, by certain risk types, the Funds’ gains (losses) related to these derivatives and their indicative volumes for the fiscal year ended October 31, 2018. These gains (losses) should be considered in the context that these derivative contracts may have been executed to create investment opportunities and/or economically hedge certain investments, and accordingly, certain gains (losses) on such derivative contracts may offset certain (losses) gains attributable to investments. These gains (losses) are included in “Net realized gain (loss)” or “Net change in unrealized gain (loss)” on the Statements of Operations:
| | | | | | | | | | | | | | |
|
| Multi-Manager Global Equity | |
| Risk | | Statements of Operations | | Net Realized
Gain (Loss) | | | Net Change in
Unrealized
Gain (Loss) | | | Average
Number of
Contracts(a) | |
| Currency | | Net realized gain (loss) from forward foreign currency exchange contracts/Net change in unrealized gain (loss) on forward foreign currency exchange contracts | | $ | 4,899,908 | | | $ | (121,307 | ) | | | 75 | |
| Equity | | Net realized gain (loss) from futures contracts/Net change in unrealized gain (loss) on futures contracts | | | 209,427 | | | | (140,865 | ) | | | 21 | |
| Total | | | | $ | 5,109,335 | | | $ | (262,172 | ) | | | 96 | |
|
| Multi-Manager Non-Core Fixed Income | |
| Risk | | Statements of Operations | | Net Realized
Gain (Loss) | | | Net Change in
Unrealized
Gain (Loss) | | | Average
Number of
Contracts(a) | |
| Interest rate | | Net realized gain (loss) from futures contracts and swap contracts, /Net change in unrealized gain (loss) on purchased options, futures contracts and swap contracts | | $ | 105,822 | | | $ | (45,486 | ) | | | 16 | |
| Credit | | Net realized gain (loss) from swap contracts/Net change in unrealized gain (loss) on swap contracts | | | (37,650 | ) | | | 84,750 | | | | — | |
| Currency | | Net realized gain (loss) from forward foreign currency exchange/ Net change in unrealized gain (loss) on forward foreign currency exchange | | | (566,960 | ) | | | (791,253 | ) | | | 121 | |
| Total | | | | $ | (498,788 | ) | | $ | (751,989 | ) | | | 137 | |
99
GOLDMAN SACHS STRATEGIC MULTI-ASSET CLASS FUNDS
Notes to Financial Statements (continued)
October 31, 2018
|
| 4. INVESTMENTS IN DERIVATIVES (continued) |
| | | | | | | | | | | | | | |
|
| Multi-Manager Real Assets Strategy | |
| Risk | | Statements of Operations | | Net Realized
Gain (Loss) | | | Net Change in
Unrealized
Gain (Loss) | | | Average
Number of
Contracts(a) | |
| Currency | | Net realized gain (loss) from forward foreign currency exchange/ Net change in unrealized gain (loss) on forward foreign currency exchange | | $ | (40,669 | ) | | $ | (283 | ) | | | 1 | |
| Total | | | | $ | (40,669 | ) | | $ | (283 | ) | | | 1 | |
| (a) | | Average number of contracts is based on the average of month end balances for the fiscal year ended October 31, 2018. |
In order to better define its contractual rights and to secure rights that will help a Fund mitigate its counterparty risk, a Fund may enter into an International Swaps and Derivatives Association, Inc. Master Agreement (“ISDA Master Agreement”) or similar agreement with its derivatives counterparties. An ISDA Master Agreement is a bilateral agreement between a Fund and a counterparty that governs OTC derivatives (including forward foreign currency exchange contracts, and certain options and swaps), and typically contains, among other things, collateral posting terms and netting provisions in the event of a default and/or termination event. The provisions of the ISDA Master Agreement typically permit a single net payment in the event of a default (close-out netting) or similar event, including the bankruptcy or insolvency of the counterparty.
Collateral and margin requirements differ between exchange traded derivatives and OTC derivatives. Margin requirements are established by the broker or clearing house for exchange-traded and centrally cleared derivatives (financial futures contracts, options and centrally cleared swaps) pursuant to governing agreements for those instrument types. Brokers can ask for margin in excess of the minimum in certain circumstances. Collateral terms are contract-specific for OTC derivatives. For derivatives traded under an ISDA Master Agreement, the collateral requirements are typically calculated by netting the marked to market amount for each transaction under such agreement and comparing that amount to the value of any collateral currently pledged by a Fund and the counterparty. Additionally, a Fund may be required to post initial margin to the counterparty, the terms of which would be outlined in the confirmation of the OTC transaction.
For financial reporting purposes, cash collateral that has been pledged to cover obligations of a Fund and cash collateral received from the counterparty, if any, is reported separately on the Statements of Assets and Liabilities as receivables/payables for collateral on certain derivative contracts. Non-cash collateral pledged by a Fund, if any, is noted in the Schedules of Investments. Generally, the amount of collateral due from or to a counterparty must exceed a minimum transfer amount threshold before a transfer is required to be made. To the extent amounts due to a Fund from its counterparties are not fully collateralized, contractually or otherwise, the Fund bears the risk of loss from counterparty nonperformance. A Fund attempts to mitigate counterparty risk by only entering into agreements with counterparties that the Underlying Managers believe to be of good standing and by monitoring the financial stability of those counterparties.
Additionally, the netting of assets and liabilities and the offsetting of collateral pledged or received are based on contractual netting/set-off provisions in the ISDA Master Agreement or similar agreements. However, in the event of a default or insolvency of a counterparty, a court could determine that such rights are not enforceable due to the restrictions or prohibitions against the right of setoff that may be imposed in accordance with a particular jurisdiction’s bankruptcy or insolvency laws.
|
| 5. AGREEMENTS AND AFFILIATED TRANSACTIONS |
A. Management Agreement — Under the Agreement, GSAM manages the Funds, subject to the general supervision of the Trustees.
As compensation for the services rendered pursuant to the Agreement, the assumption of the expenses related thereto and administration of the Funds’ business affairs, including providing facilities, GSAM is entitled to a management fee, accrued daily and paid monthly, equal to an annual percentage rate of each Fund’s average daily net assets.
100
GOLDMAN SACHS STRATEGIC MULTI-ASSET CLASS FUNDS
|
| 5. AGREEMENTS AND AFFILIATED TRANSACTIONS (continued) |
For the fiscal year ended October 31, 2018 , contractual and effective net management fees with GSAM were at the following rates:
| | | | | | | | | | | | | | | | | | | | | | | | | | | | | | |
| | | | | Contractual Management Rate | | | | | | Effective Net
Management
Rate*^ | |
| Fund | | | | First $1 billion | | | Next $1 billion | | | Next $3 billion | | | Next $3 billion | | | Over $8 billion | | | Effective Rate | |
Multi-Manager Global Equity | | | | | 1.03 | % | | | 0.93 | % | | | 0.89 | % | | | 0.87 | % | | | 0.84 | % | | | 1.03 | % | | | 0.44 | % |
Multi-Manager Non-Core Fixed Income | | | | | 0.85 | | | | 0.85 | | | | 0.77 | | | | 0.73 | | | | 0.71 | | | | 0.85 | | | | 0.50 | |
Multi-Manager Real Asset Strategy | | | | | 1.00 | | | | 0.90 | | | | 0.86 | | | | 0.84 | | | | 0.82 | | | | 1.00 | | | | 0.60 | |
| * | | GSAM has agreed to waive a portion of its management fee for each Fund in order to achieve an effective net management fee rate that is equal to the actual cost of fees paid to the Fund’s Underlying Managers. These arrangements will remain in effect through at least February 28, 2019, and prior to such date GSAM may not terminate the arrangements without the approval of the Board of Trustees. |
| ^ | | Effective Net Management Rate includes the impact of management fee waivers of affiliated underlying funds, if any. |
The Multi-Manager Global Equity, Multi-Manager Non-Core Fixed Income and Multi-Manager Real Assets Strategy Funds invest in Institutional Shares of the Goldman Sachs Financial Square Government Fund, which is an affiliated Underlying Fund. GSAM has agreed to waive a portion of its management fee payable by the Funds in an amount equal to the management fee it earns as an investment adviser to the affiliated Underlying Fund in which the Funds invest. For the Fiscal year ended October 31, 2018, GSAM waived $15,437, $41,023, $6,100 of the Fund’s management fee for the Multi-Manager Global Equity, Multi-Manager Non-Core Fixed Income and Multi-Manager Real Assets Strategy Funds, respectively.
B. Transfer Agency Agreement — Goldman Sachs also serves as the transfer agent of the Funds for a fee pursuant to the Transfer Agency Agreement. The fees charged for such transfer agency services are accrued daily and paid monthly at annual rates of 0.02% of the average daily net assets of Class R6 Shares.
C. Other Expense Agreements and Affiliated Transactions — GSAM has agreed to limit certain “Other Expenses” of the Funds (excluding acquired fund fees and expenses, transfer agency fees and expenses, service fees and shareholder administration fees (as applicable), taxes, interest, brokerage fees, expenses of shareholder meetings, litigation and indemnification, and extraordinary expenses) to the extent such expenses exceed, on an annual basis, a percentage rate of the average daily net assets of each Fund. Such Other Expense reimbursements, if any, are accrued daily and paid monthly. In addition, the Funds are not obligated to reimburse GSAM for prior fiscal year expense reimbursements, if any. The Other Expense limitations as an annual percentage rate of average daily net assets for the Multi-Manager Global Equity Fund, Multi-Manager Non-Core Fixed Income Fund and Multi-Manager Real Assets Strategy Fund are 0.85%, 0.70%, and 0.90% respectively. These Other Expense limitations will remain in place through at least February 28, 2019, and prior to such date GSAM may not terminate the arrangements without the approval of the Trustees. In addition, the Funds have entered into certain offset arrangements with the transfer agent, which may result in a reduction of the Funds’ expenses and are received irrespective of the application of the “Other Expense” limitations described above.
For the fiscal year ended October 31, 2018, these expense reductions, including any fee waivers and Other Expense reimbursements, were as follows:
| | | | | | | | | | | | | | |
| Fund | | | | Management
Fee Waiver | | | Other
Expense
Reimbursements | | | Total Annual
Operating
Expense
Reductions | |
Multi-Manager Global Equity | | | | $ | 3,323,002 | | | $ | (29,881 | ) | | $ | 3,293,121 | |
Multi-Manager Non-Core Fixed Income | | | | | 1,946,739 | | | | 154,341 | | | | 2,101,080 | |
Multi-Manager Real Assets Strategy | | | | | 1,136,177 | | | | 51,364 | | | | 1,187,541 | |
101
GOLDMAN SACHS STRATEGIC MULTI-ASSET CLASS FUNDS
Notes to Financial Statements (continued)
October 31, 2018
|
| 5. AGREEMENTS AND AFFILIATED TRANSACTIONS (continued) |
D. Line of Credit Facility — As of October 31, 2018, the Funds participated in a $770,000,000 committed, unsecured revolving line of credit facility (the “facility”) together with other funds of the Trust and certain registered investment companies having management agreements with GSAM or its affiliates. This facility is to be used for temporary emergency purposes, or to allow for an orderly liquidation of securities to meet redemption requests. The interest rate on borrowings is based on the federal funds rate. The facility also requires a fee to be paid by the Funds based on the amount of the commitment that has not been utilized. For the fiscal year ended October 31, 2018, the Funds did not have any borrowings under the facility.
E. Other Transactions with Affiliates — For the fiscal year ended October 31, 2018 , Goldman Sachs earned $83, $4,238 and $6,496 in brokerage commissions from portfolio transactions, including futures transactions executed with Goldman Sachs as the Futures Commission Merchant, on behalf of the Multi-Manager Global Equity Fund, Multi-Manager Non-Core Fixed Income and Multi-Manager Real Assets Strategy Fund, respectively.
The following table provides information about the Funds’ investments in the Goldman Sachs Financial Square Government Fund as of and for the fiscal year ended October 31, 2018:
| | | | | | | | | | | | | | | | | | | | | | | | |
| Fund | | Market
Value as of
October 31,
2017 | | | Purchases
at Cost | | | Proceeds
from Sales | | | Market Value
as of
October 31,
2018 | | | Shares as of
October 31,
2018 | | | Dividend
Income from Affiliated Investment Companies | |
Multi-Manager Global Equity | | $ | — | | | $ | 136,022,682 | | | $ | (112,256,333 | ) | | $ | 23,766,349 | | | | 23,766,349 | | | $ | 169,442 | |
Multi-Manager Non-Core Fixed Income | | | — | | | | 563,465,902 | | | | (507,267,537 | ) | | | 56,198,365 | | | | 56,198,365 | | | | 461,773 | |
Multi-Manager Real Asset Strategy | | | — | | | | 86,905,729 | | | | (76,301,600 | ) | | | 10,604,129 | | | | 10,604,129 | | | | 67,056 | |
|
| 6. PORTFOLIO SECURITIES TRANSACTIONS |
The cost of purchases and proceeds from sales and maturities of long-term securities for the fiscal year ended October 31, 2018, were as follows:
| | | | | | | | | | | | | | | | | | |
| Fund | | | | Purchases of Government Securities | | | Purchases Excluding Government Securities | | | Sales of Government Securities | | | Sales Excluding Government Securities | |
Multi-Manager Global Equity | | | | $ | — | | | $ | 588,138,866 | | | $ | — | | | $ | 408,481,383 | |
Multi-Manager Non-Core Fixed Income | | | | | 6,924,578 | | | | 935,145,449 | | | | — | | | | 610,775,768 | |
Multi-Manager Real Asset Strategy | | | | | — | | | | 430,233,297 | | | | — | | | | 233,971,421 | |
The tax character of distributions paid during the fiscal year ended October 31, 2018 was as follows:
| | | | | | | | | | | | |
| | | Multi-Manager
Global Equity | | | Multi-Manager
Non Core
Fixed Income | | | Multi-Manager
Real Assets
Strategy | |
Distribution paid from: | | | | | | | | | | | | |
Ordinary income | | $ | 6,769,105 | | | $ | 23,374,598 | | | $ | 2,894,587 | |
Net long-term capital gains | | | 9,365,803 | | | | — | | | | 2,588,426 | |
Total taxable distributions | | $ | 16,134,908 | | | $ | 23,374,598 | | | $ | 5,483,013 | |
Tax return of capital | | $ | — | | | $ | 7,036,890 | | | $ | — | |
102
GOLDMAN SACHS STRATEGIC MULTI-ASSET CLASS FUNDS
|
| 7. TAX INFORMATION (continued) |
The tax character of distributions paid during the fiscal year ended October 31, 2017 was as follows:
| | | | | | | | | | | | |
| | | Multi-Manager
Global Equity | | | Multi-Manager
Non Core
Fixed Income | | | Multi-Manager
Real Assets
Strategy | |
Distribution paid from: | | | | | | | | | | | | |
Ordinary income | | $ | 9,419,142 | | | $ | 15,159,106 | | | $ | 7,077,825 | |
Net long-term capital gains | | | — | | | | 819,503 | | | | 41,774 | |
Total taxable distributions | | $ | 9,419,142 | | | $ | 15,978,609 | | | $ | 7,119,599 | |
Tax return of capital | | $ | — | | | $ | 1,059,637 | | | $ | — | |
As of October 31, 2018, the components of accumulated earnings (losses) on a tax basis were as follows:
| | | | | | | | | | | | |
| | | Multi-Manager
Global Equity
Fund | | | Multi-Manager
Non Core Fixed
Income | | | Multi-Manager
Real Assets
Strategy | |
Undistributed ordinary income — net | | $ | 19,416,273 | | | $ | — | | | $ | 5,795,133 | |
Undistributed long-term capital gains | | | 24,319,130 | | | | — | | | | 2,242,399 | |
Total undistributed earnings | | $ | 43,735,403 | | | $ | — | | | $ | 8,037,532 | |
Capital loss carryforwards | | $ | — | | | $ | (11,618,344 | ) | | $ | — | |
Timing differences (Straddle Loss Deferral) | | | (63,904 | ) | | | (1,588,041 | ) | | | — | |
Unrealized gains (losses) — net | | | (5,776,458 | ) | | | (27,651,533 | ) | | | (8,421,360 | ) |
Total accumulated earnings (losses) net | | $ | 37,895,041 | | | $ | (40,857,918 | ) | | $ | (383,828 | ) |
| | | | | | | | | | | | |
| | | Multi-Manager Global Equity Fund | | | Multi-Manager Non Core Fixed Income | | | Multi-Manager Real Assets Strategy | |
Capital loss carryforward(1): | | | | | | | | | | | | |
Perpetual short-term | | $ | — | | | $ | (9,329,203 | ) | | $ | — | |
Perpetual long-term | | | — | | | | (2,289,141 | ) | | | — | |
Total capital loss carryforwards: | | $ | — | | | $ | (11,618,344 | ) | | $ | — | |
| (1) | | Up to $539,048 of the capital loss carryforward for the Multi-Manager Non-Core Fixed Income Fund may be limited under section 382 of the Internal Revenue Code. |
As of October 31, 2018, the Funds’ aggregate security unrealized gains and losses based on cost for U.S. federal income tax purposes were as follows:
| | | | | | | | | | | | |
| | | Multi-Manager
Global Equity
Fund | | | Multi-Manager
Non Core Fixed
Income | | | Multi-Manager
Real Assets
Strategy | |
Tax Cost | | $ | 637,064,090 | | | $ | 718,131,776 | | | $ | 394,220,159 | |
Gross unrealized gain | | | 44,088,693 | | | | 3,378,372 | | | | 14,762,938 | |
Gross unrealized loss | | | (49,865,151 | ) | | | (31,029,905 | ) | | | (23,184,298 | ) |
Net unrealized gains (losses) on securities | | $ | (5,776,458) | | | $ | (27,651,533 | ) | | $ | (8,421,360) | |
103
GOLDMAN SACHS STRATEGIC MULTI-ASSET CLASS FUNDS
Notes to Financial Statements (continued)
October 31, 2018
|
| 7. TAX INFORMATION (continued) |
The difference between GAAP-basis and tax basis unrealized gains (losses) is attributable primarily to wash sales, net mark to market gains (losses) on regulated futures contracts, net mark to market gains (losses) on foreign currency contracts, and differences in the tax treatment of underlying fund investments, partnership investments, passive foreign investment company investments and swap transactions.
GSAM has reviewed the Funds’ tax positions for all open tax years (the current and prior three years, as applicable) and has concluded that no provision for income tax is required in the Funds’ financial statements. Such open tax years remain subject to examination and adjustment by tax authorities.
The Funds’ risks include, but are not limited to, the following:
Derivatives Risk — The Funds’ use of derivatives may result in loss. Derivative instruments, which may pose risks in addition to and greater than those associated with investing directly in securities, currencies or other instruments, may be illiquid or less liquid, volatile, difficult to price and leveraged so that small changes in the value of the underlying instruments may produce disproportionate losses to the Funds. Derivatives are also subject to counterparty risk, which is the risk that the other party in the transaction will not fulfill its contractual obligation. The use of derivatives is a highly specialized activity that involves investment techniques and risks different from those associated with investments in more traditional securities and instruments. Losses from derivatives can also result from a lack of correlation between changes in the value of derivative instruments and the portfolio assets (if any) being hedged.
Foreign and Emerging Countries Risk — Investing in foreign markets may involve special risks and considerations not typically associated with investing in the United States. Foreign securities may be subject to risk of loss because of more or less foreign government regulation, less public information and less economic, political and social stability in the countries in which the Funds invest. The imposition of exchange controls (including repatriation restrictions), confiscations, trade restrictions (including tariffs) and other government restrictions by the United States or other governments, or from problems in share registration, settlement or custody, may also result in losses. Foreign risk also involves the risk of negative foreign currency rate fluctuations, which may cause the value of securities denominated in such foreign currency (or other instruments through which the Funds have exposure to foreign currencies) to decline in value. Currency exchange rates may fluctuate significantly over short periods of time. To the extent that the Funds also invest in securities of issuers located in emerging markets, these risks may be more pronounced.
Foreign Custody Risk — If a Fund invests in foreign securities, the Fund may hold such securities and cash with foreign banks, agents, and securities depositories appointed by the Fund’s custodian (each a “Foreign Custodian”). Some foreign custodians may be recently organized or new to the foreign custody business. In some countries, Foreign Custodians may be subject to little or no regulatory oversight over, or independent evaluation of, their operations. Further, the laws of certain countries may place limitations on a Fund’s ability to recover its assets if a Foreign Custodian enters bankruptcy. Investments in emerging markets may be subject to even greater custody risks than investments in more developed markets. Custody services in emerging market countries are very often undeveloped and may be considerably less well regulated than in more developed countries, and thus may not afford the same level of investor protection as would apply in developed countries.
Industry Concentration Risk — Concentrating Fund investments in a limited number of issuers conducting business in the same industry or group of industries will subject a Fund to a greater risk of loss as a result of adverse economic, business, political, environmental or other developments than if its investments were diversified across different industries.
Interest Rate Risk — When interest rates increase, fixed income securities or instruments held by the Funds will generally decline in value. Long-term fixed income securities or instruments will normally have more price volatility because of this risk than short-term fixed income securities or instruments. The risks associated with changing interest rates may have unpredictable effects on the markets and a Fund’s investments. Fluctuations in interest rates may also affect the liquidity of fixed income securities and instruments held by the Funds.
104
GOLDMAN SACHS STRATEGIC MULTI-ASSET CLASS FUNDS
|
| 8. OTHER RISKS (continued) |
Investments in Other Investment Companies Risk — As a shareholder of another investment company, including an exchange-traded fund (“ETF”), a Fund will indirectly bear its proportionate share of any net management fees and other expenses paid by such other investment companies, in addition to the fees and expenses regularly borne by the Fund. ETFs are subject to risks that do not apply to conventional mutual funds, including but not limited to the following: (i) the market price of the ETF’s shares may trade at a premium or a discount to their NAV; and (ii) an active trading market for an ETF’s shares may not develop or be maintained.
Large Shareholder Transactions Risk — A Fund may experience adverse effects when certain large shareholders, such as other funds, institutional investors (including those trading by use of non-discretionary mathematical formulas), financial intermediaries (who may make investment decisions on behalf of underlying clients and/or include a Fund in their investment model), individuals, accounts and Goldman Sachs affiliates, purchase or redeem large amounts of shares of a Fund. Such large shareholder redemptions may cause a Fund to sell portfolio securities at times when it would not otherwise do so, which may negatively impact a Fund’s NAV and liquidity. These transactions may also accelerate the realization of taxable income to shareholders if such sales of investments resulted in gains, and may also increase transaction costs. In addition, a large redemption could result in a Fund’s current expenses being allocated over a smaller asset base, leading to an increase in the Fund’s expense ratio. Similarly, large Fund share purchases may adversely affect a Fund’s performance to the extent that the Fund is delayed in investing new cash and is required to maintain a larger cash position than it ordinarily would.
Liquidity Risk — A Fund may make investments that are illiquid or that may become less liquid in response to market developments or adverse investor perceptions. Illiquid investments may be more difficult to value. Liquidity risk may also refer to the risk that a Fund will not be able to pay redemption proceeds within the allowable time period because of unusual market conditions, an unusually high volume of redemption requests, or other reasons. To meet redemption requests, a Fund may be forced to sell investments at an unfavorable time and/or under unfavorable conditions. Liquidity risk may be the result of, among other things, the reduced number and capacity of traditional market participants to make a market in fixed income securities or the lack of an active market. The potential for liquidity risk may be magnified by a rising interest rate environment or other circumstances where investor redemptions from fixed income mutual funds may be higher than normal, potentially causing increased supply in the market due to selling activity.
Loan-Related Investments Risk — In addition to risks generally associated with debt investments, loan-related investments such as loan participations and assignments are subject to other risks. Although a loan obligation may be fully collateralized at the time of acquisition, the collateral may decline in value, be relatively illiquid, or lose all or substantially all of its value subsequent to investment. Many loan investments are subject to legal or contractual restrictions on resale and may be relatively illiquid and difficult to value. There is less readily available, reliable information about most loan investments than is the case for many other types of securities. Substantial increases in interest rates may cause an increase in loan obligation defaults. With respect to loan participations, a Fund may not always have direct recourse against a borrower if the borrower fails to pay scheduled principal and/or interest; may be subject to greater delays, expenses and risks than if the Fund had purchased a direct obligation of the borrower; and may be regarded as the creditor of the agent lender (rather than the borrower), subjecting the Fund to the creditworthiness of that lender as well. Investors in loans, such as a Fund, may not be entitled to rely on the anti-fraud protections of the federal securities laws, although they may be entitled to certain contractual remedies. The market for loan obligations may be subject to irregular trading activity, wide bid/ask spreads and extended trade settlement periods. Because transactions in many loans are subject to extended trade settlement periods, a Fund may not receive the proceeds from the sale of a loan for a period after the sale. As a result, sale proceeds related to the sale of loans may not be available to make additional investments or to meet a Fund’s redemption obligations for a period after the sale of the loans, and, as a result, the Fund may have to sell other investments or engage in borrowing transactions, such as borrowing from its credit facility, if necessary to raise cash to meet its obligations.
Senior Loans hold the most senior position in the capital structure of a business entity, and are typically secured with specific collateral, but are nevertheless usually rated below investment grade. Because Second Lien Loans are subordinated or unsecured and thus lower in priority of payment to Senior Loans, they are subject to the additional risk that the cash flow of the borrower and
105
GOLDMAN SACHS STRATEGIC MULTI-ASSET CLASS FUNDS
Notes to Financial Statements (continued)
October 31, 2018
|
| 8. OTHER RISKS (continued) |
property securing the loan or debt, if any, may be insufficient to meet scheduled payments after giving effect to the senior secured obligations of the borrower. Second Lien Loans generally have greater price volatility than Senior Loans and may be less liquid.
Market and Credit Risks — In the normal course of business, a Fund trades financial instruments and enters into financial transactions where risk of potential loss exists due to changes in the market (market risk). Additionally, the Funds may also be exposed to credit risk in the event that an issuer or guarantor fails to perform or that an institution or entity with which the Funds have unsettled or open transactions defaults.
Multi-Manager Approach Risk — The Funds’ performance depends on the ability of the Investment Adviser in selecting, overseeing, and allocating Fund assets to the Underlying Managers. The Underlying Managers’ investment styles may not always be complementary. The Funds’ multi-manager approach may result in the Fund investing a significant percentage of its assets in certain types of investments, which could be beneficial or detrimental to the Funds’ performance depending on the performance of those investments and the overall market environment. The Funds’ Underlying Managers may underperform the market generally or underperform other investment managers that could have been selected for the Funds. Because the Funds’ Underlying Managers may trade with counterparties, prime brokers, clearing brokers or futures commission merchants on terms that are different than those on which the Investment Adviser would trade, and because each Underlying Manager applies its own risk analysis in evaluating potential counterparties for the Funds, the Funds may be subject to greater counterparty risk than if they were managed directly by the Investment Adviser.
Under the Trust’s organizational documents, its Trustees, officers, employees and agents are indemnified, to the extent permitted by the Act and state law, against certain liabilities that may arise out of performance of their duties to the Funds. Additionally, in the course of business, the Funds enter into contracts that contain a variety of indemnification clauses. The Funds maximum exposure under these arrangements is unknown, as this would involve future claims that may be made against the Funds that have not yet occurred. However, GSAM believes the risk of loss under these arrangements to be remote.
In March 2017, the Financial Accounting Standards Board issued Accounting Standards Update (ASU) 2017-08 — Receivables — Nonrefundable Fees and Other Costs (Subtopic 310-20): Premium Amortization on Purchased Callable Debt Securities. The amendments in the ASU shorten the amortization period for certain callable debt securities held at a premium, by requiring amortization to the earliest call date. The ASU is effective for fiscal years, and interim periods within those fiscal years, beginning after December 15, 2018. GSAM is currently evaluating the impact, if any, of the amendments.
In September 2018, the Financial Accounting Standards Board issued Accounting Standards Update (ASU) 2018-13 — Fair Value Measurement (Topic 820) Disclosure Framework — Changes to the Disclosure Requirements for Fair Value Measurement. The amendments in the ASU modify fair value measurement disclosures. The amendments are effective for the Fund’s fiscal years
beginning after December 15, 2019. GSAM is currently evaluating the impact, if any, of the amendments.
Subsequent events after the Statements of Assets and Liabilities date have been evaluated, and GSAM has concluded that there is no impact requiring adjustment or disclosure in the financial statements.
106
GOLDMAN SACHS STRATEGIC MULTI-ASSET CLASS FUNDS
|
| 12. SUMMARY OF SHARE TRANSACTIONS |
Share activity is as follows:
| | | | | | | | | | | | | | | | |
| | | Multi-Manager Global Equity Fund | |
| | | | |
| | | For the Fiscal Year Ended
October 31, 2018
| | | For the Fiscal Year Ended
October 31, 2017
| |
| | | | |
| | | Shares | | | Dollars | | | Shares | | | Dollars | |
| | | | |
| Class R6 Shares(a) | | | | | | | | | | | | | | | | |
Shares sold | | | 19,647,160 | | | $ | 224,350,010 | | | | 11,205,777 | | | $ | 124,275,010 | |
Reinvestment of distributions | | | 1,422,831 | | | | 16,134,908 | | | | 978,104 | | | | 9,419,142 | |
Shares redeemed | | | (4,562,894 | ) | | | (53,000,010 | ) | | | (32,784,675 | ) | | | (333,507,466 | ) |
NET INCREASE (DECREASE) | | | 16,507,097 | | | $ | 187,484,908 | | | | (20,600,794 | ) | | $ | (199,813,314 | ) |
| | | | | | | | | | | | | | | | |
| | | Multi-Manager Non-Core Fixed Income Fund | |
| | | | |
| | | For the Fiscal Year Ended
October 31, 2018
| | | For the Fiscal Year Ended
October 31, 2017
| |
| | | | |
| | | Shares | | | Dollars | | | Shares | | | Dollars | |
| | | | |
| Class R6 Shares(a) | | | | | | | | | | | | | | | | |
Shares sold | | | 37,020,923 | | | $ | 343,095,015 | | | | 16,314,787 | | | $ | 156,040,015 | |
Reinvestment of distributions | | | 3,298,557 | | | | 30,411,488 | | | | 1,761,790 | | | | 16,839,680 | |
Shares redeemed | | | (4,695,828 | ) | | | (42,240,015 | ) | | | (7,919,941 | ) | | | (75,927,513 | ) |
NET INCREASE (DECREASE) | | | 35,623,652 | | | $ | 331,266,488 | | | | 10,156,636 | | | $ | 96,952,182 | |
| | | | | | | | | | | | | | | | |
| | | Multi-Manager Real Assets Strategy Fund | |
| | | | |
| | | For the Fiscal Year Ended
October 31, 2018
| | | For the Fiscal Year Ended
October 31, 2017
| |
| | | | |
| | | Shares | | | Dollars | | | Shares | | | Dollars | |
| | | | |
| Class R6 Shares(a) | | | | | | | | | | | | | | | | |
Shares sold | | | 28,269,374 | | | $ | 272,441,005 | | | | 4,307,024 | | | $ | 41,100,000 | |
Reinvestment of distributions | | | 567,208 | | | | 5,483,013 | | | | 778,245 | | | | 7,119,599 | |
Shares redeemed | | | (8,958,849 | ) | | | (87,285,114 | ) | | | (16,749,658 | ) | | | (153,945,693 | ) |
NET INCREASE (DECREASE) | | | 19,877,733 | | | $ | 190,638,904 | | | | (11,664,389 | ) | | $ | (105,726,094 | ) |
| (a) | | Effective January 16, 2018, Institutional Shares were redesignated as Class R6 Shares. |
107
Report of Independent Registered Public
Accounting Firm
To the Board of Trustees of Goldman Sachs Trust II and Shareholders of Goldman Sachs Multi-Manager Global Equity Fund, Goldman Sachs Multi-Manager Non-Core Fixed Income Fund and Goldman Sachs Multi-Manager Real Assets Strategy Fund:
Opinions on the Financial Statements
We have audited the accompanying statements of assets and liabilities, including the schedules of investments, of Goldman Sachs Multi-Manager Global Equity Fund, Goldman Sachs Multi-Manager Non-Core Fixed Income Fund and Goldman Sachs Multi-Manager Real Assets Strategy Fund (three of the funds constituting Goldman Sachs Trust II, hereafter collectively referred to as the “Funds”) as of October 31, 2018, the related statements of operations for the year ended October 31, 2018, the statements of changes in net assets for each of the two years in the period ended October 31, 2018, including the related notes, and the financial highlights for each of the periods indicated therein (collectively referred to as the “financial statements”). In our opinion, the financial statements present fairly, in all material respects, the financial position of each of the Funds as of October 31, 2018, the results of each of their operations for the year then ended, the changes in each of their net assets for each of the two years in the period ended October 31, 2018 and the financial highlights for each of the periods indicated therein in conformity with accounting principles generally accepted in the United States of America.
Basis for Opinions
These financial statements are the responsibility of the Funds’ management. Our responsibility is to express an opinion on the Funds’ financial statements based on our audits. We are a public accounting firm registered with the Public Company Accounting Oversight Board (United States) (“PCAOB”) and are required to be independent with respect to the Funds in accordance with the U.S. federal securities laws and the applicable rules and regulations of the Securities and Exchange Commission and the PCAOB.
We conducted our audits of these financial statements in accordance with the standards of the PCAOB. Those standards require that we plan and perform the audit to obtain reasonable assurance about whether the financial statements are free of material misstatement, whether due to error or fraud.
Our audits included performing procedures to assess the risks of material misstatement of the financial statements, whether due to error or fraud, and performing procedures that respond to those risks. Such procedures included examining, on a test basis, evidence regarding the amounts and disclosures in the financial statements. Our audits also included evaluating the accounting principles used and significant estimates made by management, as well as evaluating the overall presentation of the financial statements. Our procedures included confirmation of securities owned as of October 31, 2018 by correspondence with the custodian, transfer agent and brokers; when replies were not received from brokers, we performed other auditing procedures. We believe that our audits provide a reasonable basis for our opinions.
PricewaterhouseCoopers LLP
Boston, Massachusetts
December 27, 2018
We have served as the auditor of one or more investment companies in the Goldman Sachs fund complex since 2000.
108
GOLDMAN SACHS STRATEGIC MULTI-ASSET CLASS FUNDS
Fund Expenses — Six Months Ended October 31, 2018
As a shareholder of Class R6 Shares of the Funds, you incur two types of costs: (1) transaction costs, including sales charges on purchase payments, and (2) ongoing costs, including management fees; and other Fund expenses. This example is intended to help you understand your ongoing costs (in dollars) of investing in the Funds and to compare these costs with the ongoing costs of investing in other mutual funds.
The example is based on an investment of $1,000 invested at the beginning of the period and held for the entire period from May 1, 2018 through October 31, 2018, which represents a period of 184 days in a 365-day year.
Actual Expenses — The first line under each share class in the table below provides information about actual account values and actual expenses. You may use the information in this line, together with the amount you invested, to estimate the expenses that you paid over the period. Simply divide your account value by $1,000 (for example, an $8,600 account value divided by $1,000=8.6), then multiply the result by the number in the first line under the heading entitled “Expenses Paid” to estimate the expenses you paid on your account during this period.
Hypothetical Example for Comparison Purposes — The second line under each share class in the table below provides information about hypothetical account values and hypothetical expenses based on the Funds’ actual net expense ratios and an assumed rate of return of 5% per year before expenses, which is not the Funds’ actual return. The hypothetical account values and expenses may not be used to estimate the actual ending account balance or expenses you paid for the period. You may use this information to compare the ongoing costs of investing in the Funds and other funds. To do so, compare this 5% hypothetical example with the 5% hypothetical examples that appear in the shareholder reports of the other funds.
Please note that the expenses shown in the table are meant to highlight your ongoing costs only and do not reflect any transactional costs, such as sales charges, redemption fees, or exchange fees. Therefore, the second line of the table is useful in comparing ongoing costs only, and will not help you determine the relative total costs of owning different funds. In addition, if these transactional costs were included, your costs would have been higher.
| | | | | | | | | | | | | | | | | | | | | | | | | | | | | | | | | | | | |
| | | Multi-Manager Global Equity Fund | | | Multi-Manager Non-Core Fixed Income Fund | | | Multi-Manager Real Assets Strategy Fund | |
| Share Class | | Beginning
Account
Value
5/1/18 | | | Ending
Account
Value
10/31/18 | | | Expenses
Paid for the
6 months ended
10/31/18* | | | Beginning
Account
Value
5/1/18 | | | Ending
Account
Value
10/31/18 | | | Expenses
Paid for the
6 months ended
10/31/18* | | | Beginning
Account
Value
5/1/18 | | | Ending
Account
Value
10/31/18 | | | Expenses
Paid for the
6 months ended
10/31/18* | |
| Class R6(a) | | | | | | | | | | | | | | | | | | | | | | | | | | | | | | | | | | | | |
Actual | | $ | 1,000.00 | | | $ | 938.20 | | | $ | 3.71 | | | $ | 1,000.00 | | | $ | 971.20 | | | $ | 3.48 | | | $ | 1,000.00 | | | $ | 986.10 | | | $ | 4.51 | |
Hypothethical 5% return | | | 1,000.00 | | | | 1,021.37 | + | | | 3.87 | | | | 1,000.00 | | | | 1,021.68 | + | | | 3.57 | | | | 1,000.00 | | | | 1,020.67 | + | | | 4.58 | |
| + | | Hypothetical expenses are based on each Fund’s actual annualized net expense ratios and an assumed rate of return of 5% per year before expenses. |
| * | | Expenses for each share class are calculated using each Fund’s annualized net expense ratio for each class, which represents the ongoing expenses as a percentage of net assets for the six months ended October 31, 2018. Expenses are calculated by multiplying the annualized net expense ratio by the average account value for the period; then multiplying the result by the number of days in the most recent fiscal half year; and then dividing that result by the number of days in the fiscal year. The annualized net expense ratios for the period were as follows: |
| | | | |
| Fund | | Class R6 | |
Multi-Manager Global Equity | | | 0.80 | % |
Multi-Manager Non-Core Fixed Income | | | 0.70 | |
Multi-Manager Real Assets Strategy | | | 0.90 | |
| (a) | | Effective January 16, 2018, Institutional Shares were redesignated as Class R6 Shares. |
109
GOLDMAN SACHS STRATEGIC MULTI-ASSET CLASS FUNDS
Statement Regarding Basis for Approval of Management Agreement and Sub-Advisory Agreements (Unaudited)
Background
The Goldman Sachs Multi-Manager Global Equity Fund, Goldman Sachs Multi-Manager Non-Core Fixed Income Fund, and Goldman Sachs Multi-Manager Real Assets Strategy Fund (the “Funds”) are investment portfolios of Goldman Sachs Trust II (the “Trust”). The Board of Trustees oversees the management of the Trust and reviews the investment performance and expenses of the Funds at regularly scheduled meetings held throughout the year. Each Fund employs a “manager of managers” structure, whereby Goldman Sachs Asset Management, L.P. (the “Investment Adviser”) is responsible for selecting sub-advisers (subject to Board approval), allocating the Fund’s assets among them, and overseeing their day-to-day management of Fund assets. The Board of Trustees determines annually whether to approve the continuance of the Trust’s investment management agreement (the “Management Agreement”) with the Investment Adviser on behalf of the Funds.
The Management Agreement was most recently approved for continuation until August 31, 2019 by the Board of Trustees, including those Trustees who are not parties to the Management Agreement or “interested persons” (as defined in the Investment Company Act of 1940, as amended) of any party thereto (the “Independent Trustees”), at a meeting held on August 7-8, 2018 (the “Annual Meeting”). At the Annual Meeting, the Board also considered the sub-advisory agreements (each a “Designated Sub-Advisory Agreement” and, together with the Management Agreement, the “Agreements”) between the Investment Adviser and (i) each of Boston Partners Global Investors, Inc., Causeway Capital Management LLC, Fisher Asset Management, LLC, GW&K Investment Management, LLC, Legal & General Investment Management Americas, Inc., Principal Global Investors, LLC, Russell Investment Implementation Services, LLC, Vulcan Value Partners, LLC, and WCM Investment Management (on behalf of Goldman Sachs Multi-Manager Global Equity Fund); (ii) each of Ares Capital Management II LLC, BlueBay Asset Management LLP, Brigade Capital Management, LP, Lazard Asset Management LLC, and Symphony Asset Management LLC (on behalf of Goldman Sachs Multi-Manager Non-Core Fixed Income Fund); and (iii) each of PGIM Real Estate (a business unit of PGIM, Inc.), Presima Inc., RARE Infrastructure (North America) Pty Limited, and RREEF America L.L.C. (on behalf of Goldman Sachs Multi-Manager Real Assets Strategy Fund) (each, a “Designated Sub-Adviser” and collectively, the “Designated Sub-Advisers”).
The review process undertaken by the Trustees spans the course of the year and culminates with the Annual Meeting. To assist the Trustees in their deliberations, the Trustees have established a Contract Review Committee (the “Committee”), comprised of the Independent Trustees. The Committee held five meetings over the course of the year since the Management Agreement was last approved. At those Committee meetings, regularly scheduled Board or other committee meetings, and/or the Annual Meeting, matters relevant to the renewal of the Management Agreement and the Designated Sub-Advisory Agreements were considered by the Board, or the Independent Trustees, as applicable. With respect to each Fund, such matters included:
| | (a) | | the nature and quality of the advisory, administrative, and other services provided to the Fund by the Investment Adviser and its affiliates, and the Designated Sub-Advisers, including, as applicable, information about: |
| | (i) | | the structure, staff, and capabilities of the Investment Adviser and the Designated Sub-Advisers and the Designated Sub-Advisers’ portfolio management teams; |
| | (ii) | | the groups within the Investment Adviser and its affiliates that support the portfolio management teams or provide other types of necessary services, including fund services groups (e.g., accounting and financial reporting, tax, shareholder services, and operations); controls and risk management groups (e.g., legal, compliance, valuation oversight, credit risk management, internal audit, compliance testing, market risk analysis, finance, and central funding); sales and distribution support groups, and others (e.g., information technology and training); |
| | (iii) | | trends in employee headcount; |
| | (iv) | | the Investment Adviser’s financial resources and ability to hire and retain talented personnel and strengthen its operations; and |
| | (v) | | the parent company’s support of the Investment Adviser and its mutual fund business, as expressed by the firm’s senior management; |
| | (b) | | information on the investment performance of the Fund, including comparisons to the performance of similar mutual funds, as provided by a third-party mutual fund data provider engaged as part of the contract review process (the “Outside Data Provider”), benchmark performance indices, and, with respect to the Goldman Sachs Multi-Manager Global Equity Fund, commingled investment vehicles with comparable investment strategies managed by the Investment Adviser, as well as general investment outlooks in the markets in which the Fund invests; |
| | (c) | | information provided by the Investment Adviser indicating the Investment Adviser’s views on whether the Fund’s peer group and/or benchmark index had high, medium, or low relevance given the Fund’s particular investment strategy; |
| | (d) | | the terms of the Agreements and other agreements with affiliated service providers entered into by the Trust on behalf of the Fund; |
| | (e) | | fee and expense information for the Fund, including: |
110
GOLDMAN SACHS STRATEGIC MULTI-ASSET CLASS FUNDS
Statement Regarding Basis for Approval of Management Agreement and Sub-Advisory Agreements (Unaudited) (continued)
| | (i) | | the relative management fee and expense levels of the Fund as compared to those of comparable funds managed by other advisers, as provided by the Outside Data Provider; |
| | (ii) | | the Fund’s expense trends over time; and |
| | (iii) | | with respect to the Goldman Sachs Multi-Manager Global Equity Fund, comparative information on the advisory fees charged and services provided by the Investment Adviser to certain collective investment vehicles that it manages with comparable investment strategies; |
| | (f) | | with respect to the extensive investment performance and expense comparison data provided by the Outside Data Provider, its processes in producing that data for the Fund; |
| | (g) | | the undertakings of the Investment Adviser and its affiliates to implement fee waivers and/or expense limitations; |
| | (h) | | information relating to the profitability of the Management Agreement and the transfer agency arrangements of the Fund to the Investment Adviser and its affiliates; |
| | (i) | | whether the Fund’s existing management fee schedule adequately addressed any economies of scale; |
| | (j) | | a summary of the “fall-out” benefits derived by the Investment Adviser and its affiliates from their relationships with the Fund, including the fees received by the Investment Adviser’s affiliates from the Fund for transfer agency, portfolio trading, and other services; |
| | (k) | | a summary of potential benefits derived by the Fund as a result of its relationship with the Investment Adviser; |
| | (l) | | with respect to the Investment Adviser, portfolio manager ownership of Fund shares and the manner in which portfolio manager compensation is determined; information on the Designated Sub-Advisers’ compensation arrangements; and the number and types of accounts managed by the portfolio managers; |
| | (m) | | the nature and quality of the services provided to the Fund by its unaffiliated service providers (including the Designated Sub-Advisers), and the Investment Adviser’s general oversight and evaluation (including reports on due diligence) of those service providers as part of the services provided under the Management Agreement; and |
| | (n) | | the Investment Adviser’s and Designated Sub-Advisers’ processes and policies addressing various types of potential conflicts of interest; their approaches to risk management; the annual review of the effectiveness of the Fund’s compliance program; and periodic compliance reports. |
The Trustees also received an overview of the Funds’ distribution arrangements. They received information regarding the Funds’ assets and share purchase and redemption activity.
The presentations made at the Board and Committee meetings and at the Annual Meeting encompassed the Funds and other mutual funds for which the Board of Trustees has responsibility. In evaluating the Agreements at the Annual Meeting, the Trustees relied upon their knowledge, resulting from their meetings and other interactions throughout the year, of the Funds and the respective services of the Investment Adviser and its affiliates, and the Designated Sub-Advisers. In conjunction with these meetings, the Trustees received written materials and oral presentations on the topics covered, and the Investment Adviser addressed the questions and concerns of the Trustees, including concerns regarding the investment performance of certain of the funds they oversee. In addition, the Independent Trustees periodically received written materials and oral presentations from the funds’ various sub-advisers, including the Designated Sub-Advisers. The Independent Trustees were advised by their independent legal counsel regarding their responsibilities and other regulatory requirements related to the approval and continuation of mutual fund investment management agreements under applicable law. In addition, the Investment Adviser and its affiliates provided the Independent Trustees with a written response to a formal request for information sent on behalf of the Independent Trustees by their independent legal counsel. The Independent Trustees reviewed a written response prepared by each Designated Sub-Adviser to a similar request for information submitted to the Designated Sub-Adviser by the Investment Adviser. During the course of their deliberations, the Independent Trustees met in executive sessions with their independent legal counsel, without representatives of the Investment Adviser or its affiliates present.
Nature, Extent, and Quality of the Services Provided Under the Management Agreement
As part of their review, the Trustees considered the nature, extent, and quality of the services provided to the Funds by the Investment Adviser. In this regard, the Trustees considered both the investment advisory services and non-advisory services that are provided by the Investment Adviser and its affiliates. The Trustees noted the ongoing recruitment efforts aimed at bringing high quality investment talent to the Investment Adviser. They also noted the Investment Adviser’s commitment to maintaining high quality systems and expending substantial resources to respond to ongoing changes to the regulatory and control environment in which the Funds and their service providers operate, as well as the efforts of the Investment Adviser and its affiliates to combat cyber security risks. The Trustees concluded that the Investment Adviser continued to commit substantial financial and operational resources to the Funds and expressed confidence that the Investment Adviser would continue to do so in the future. The Trustees
111
GOLDMAN SACHS STRATEGIC MULTI-ASSET CLASS FUNDS
Statement Regarding Basis for Approval of Management Agreement and Sub-Advisory Agreements (Unaudited) (continued)
also recognized that the Investment Adviser had made significant commitments to address regulatory compliance requirements applicable to the Funds and the Investment Adviser and its affiliates. In addition, the Trustees reviewed the Sub-Adviser oversight process that the Investment Adviser had employed, which included areas such as investment analytics, risk management and compliance.
Investment Performance
The Trustees considered the investment performance of the Funds. In this regard, they compared the investment performance of each Fund to its peers using rankings and ratings compiled by the Outside Data Provider, and updated performance information prepared by the Investment Adviser using the peer groups identified by the Outside Data Provider. The Trustees also reviewed each Fund’s investment performance relative to its performance benchmark. As part of this review, they considered the investment performance trends of the Funds over time, and reviewed the investment performance of each Fund in light of its investment objective and policies and market conditions. The Trustees considered the Investment Adviser’s representations that each Fund had significant differences from its Outside Data Provider peer group that caused them to be imperfect bases for comparison. The Trustees also compared the investment performance of the Goldman Sachs Multi-Manager Global Equity Fund to the performance of comparable unregistered funds for which the Investment Adviser also serves as investment adviser. They considered that the unregistered funds provide an imperfect performance comparison because they are not subject to the requirements of the Investment Company Act of 1940, as amended.
In addition, the Trustees considered materials prepared and presentations made by the Investment Adviser’s senior management and the Sub-Advisers’ portfolio management personnel in which Fund performance was assessed. The Trustees also considered the Investment Adviser’s periodic reports with respect to the Funds’ risk profiles, and how the Investment Adviser’s approach to risk monitoring and management influences portfolio management.
The Trustees noted that the Goldman Sachs Multi-Manager Global Equity Fund’s Institutional Shares had placed in the third quartile of the Fund’s performance peer group, and had underperformed the Fund’s benchmark index for the one-year period ended March 31, 2018. They noted that Goldman Sachs Multi-Manager Non-Core Fixed Income Fund’s Institutional Shares had placed in the second quartile of the Fund’s performance peer group, and had underperformed the Fund’s composite benchmark index for the one-year period ended March 31, 2018. They noted that the Goldman Sachs Real Assets Strategy Fund’s Institutional Shares had placed in the fourth quartile of the Fund’s performance peer group, and had outperformed the Fund’s composite benchmark index for the one-year period ended March 31, 2018.
Costs of Services Provided and Competitive Information
The Trustees considered the contractual terms of the Management Agreement, the fee rates payable by each Fund thereunder, and the net amount retained by the Investment Adviser after payment of sub-advisory fees. In this regard, the Trustees considered information on the services rendered by the Investment Adviser to the Funds, which included both advisory and administrative services that were directed to the needs and operations of the Funds as registered mutual funds.
In particular, the Trustees reviewed the analyses prepared by the Outside Data Provider regarding the expense rankings of the Funds, as well as additional information provided by the Investment Adviser throughout the year. The analyses provided a comparison of each Fund’s management fee to those of a relevant peer group and category universe; an expense analysis which compared each Fund’s overall net and gross expenses to a peer group and a category universe; and data comparing each Fund’s net expenses to the peer and category medians. The analyses also compared each Fund’s transfer agency and custody fees, other expenses, and fee waivers/reimbursements to those of the peer group and category medians. With respect to the Goldman Sachs Multi-Manager Global Equity Fund, the Trustees also considered comparative fee information for services provided by the Investment Adviser to collective investment vehicles having investment objectives and policies similar to those of the Fund. They also noted that, in some cases, collective investment vehicles have a compensation structure that includes performance fees and also pay additional asset-based fees and performance fees to the managers of underlying hedge funds. The Trustees considered that services provided to the Funds differed in various significant respects from the services provided to these collective investment vehicles, which generally operated under less stringent regulatory and financial reporting requirements, required fewer services from the Investment Adviser to a smaller number of client contact points, and were less time-sensitive. The Trustees concluded that the comparisons provided by the Outside Data Provider and the Investment Adviser were useful in evaluating the reasonableness of the management fees and total expenses paid by the Funds.
The Trustees considered the Investment Adviser’s undertaking to waive a portion of the management fee payable by each Fund. In this regard, the Trustees noted that the Investment Adviser’s institutional clients that are invested in the Funds pay a single management fee for the Investment Adviser’s management of their accounts, and that the Investment Adviser waives a
112
GOLDMAN SACHS STRATEGIC MULTI-ASSET CLASS FUNDS
Statement Regarding Basis for Approval of Management Agreement and Sub-Advisory Agreements (Unaudited) (continued)
portion of the management fee with respect to each Fund in order to achieve an effective net management fee rate that is equal to the actual cost of fees paid to the Fund’s sub-advisers. They also considered the Investment Adviser’s undertaking to limit each Fund’s “other expenses” ratio (excluding certain expenses) to a specified level. In addition, the Trustees noted that shareholders are able to redeem their Fund shares at any time if shareholders believe that the Fund fees and expenses are too high or if they are dissatisfied with the performance of the Fund.
The Investment Adviser’s Profitability
The Trustees reviewed each Fund’s contribution to the Investment Adviser’s revenues and pre-tax profit margins. In this regard the Trustees noted that they had received, among other things, profitability analyses and summaries, revenue and expense schedules by Fund and by function (i.e., investment management, transfer agency, and distribution and service), and information on the Investment Adviser’s expense allocation methodology. They observed that the profitability and expense figures are substantially similar to those used by the Investment Adviser for many internal purposes, including compensation decisions among various business groups, and are thus subject to a vigorous internal debate about how certain revenue and expenses should be allocated.
The Trustees also noted that the internal audit group within the Goldman Sachs organization had audited the expense allocation methodology and that the internal audit group was satisfied with the reasonableness, consistency, and accuracy of the Investment Adviser’s expense allocation methodology and profitability analysis calculations. Profitability data for each Fund was provided for 2017 and 2016, and the Trustees considered this information in relation to the Investment Adviser’s overall profitability.
Economies of Scale
The Trustees considered the information that had been provided regarding whether there have been economies of scale with respect to the management of the Funds. The Trustees considered that the Funds are offered to the Investment Adviser’s institutional clients as part of an investment model whereby the Funds and other funds act as core “building blocks” with which the client and the Investment Adviser form an investment strategy for the client’s portfolio. The Trustees considered the Investment Adviser’s representations that its clients benefit from this investment model with increased liquidity, increased investment oversight, access to new investment strategies, economies of scale, and reduced complexity in managing client portfolios. The Trustees noted that, pursuant to the model, clients pay a management fee for the Investment Adviser’s management of their accounts, and that the fund-level management fee in excess of the weighted average sub-advisory fees are waived in order to avoid charging two layers of management fees. The Trustees also considered the breakpoints in the fee rate payable under the Management Agreement for each of the Funds at the following annual percentage rates of the average daily net assets of the Funds:
| | | | | | | | | | | | |
Average Daily Net Assets | | Goldman Sachs
Multi-Manager
Global Equity
Fund | | | Goldman Sachs
Multi-Manager
Non-Core Fixed
Income Fund Fund | | | Goldman Sachs
Multi-Manager
Real Assets
Strategy Fund | |
First $1 billion | | | 1.03 | % | | | 0.85 | % | | | 1.00 | % |
Next $1 billion | | | 0.93 | | | | 0.85 | | | | 0.90 | |
Next $3 billion | | | 0.89 | | | | 0.77 | | | | 0.86 | |
Next $3 billion | | | 0.87 | | | | 0.73 | | | | 0.84 | |
Over $8 billion | | | 0.84 | | | | 0.71 | | | | 0.82 | |
The Trustees noted that the breakpoints were designed to share potential economies of scale, if any, with the Funds and their shareholders as assets under management reach those asset levels. The Trustees considered the amounts of assets in the Funds; the Funds’ recent share purchase and redemption activity; the information provided by the Investment Adviser relating to the costs of the services provided by the Investment Adviser and its affiliates and their realized profits (if any); information comparing fee rates charged by the Investment Adviser with fee rates charged to other funds in the peer groups; and the Investment Adviser’s undertakings to waive a portion of its management fee and to limit certain expenses of the Funds that exceed specified levels. The Independent Trustees also considered the relationship between the advisory and sub-advisory fee rate schedules. Upon reviewing these matters at the Annual Meeting, the Trustees concluded that the fee breakpoints represented a means of assuring that benefits of scalability, if any, would be passed along to shareholders at the specified asset levels.
113
GOLDMAN SACHS STRATEGIC MULTI-ASSET CLASS FUNDS
Statement Regarding Basis for Approval of Management Agreement and Sub-Advisory Agreements (Unaudited) (continued)
Other Benefits to the Investment Adviser and Its Affiliates
The Trustees also considered the other benefits derived by the Investment Adviser and its affiliates from their relationships with the Funds, including: (a) transfer agency fees received by Goldman Sachs & Co. LLC (“Goldman Sachs”); (b) brokerage and futures commissions earned by Goldman Sachs for executing securities transactions (in its capacity as clearing broker) and futures transactions on behalf of the Funds; (c) the Investment Adviser’s ability to leverage the infrastructure designed to service the Funds on behalf of the Investment Adviser’s other clients; (d) the Investment Adviser’s ability to cross-market other products and services to Fund shareholders; (e) the Investment Adviser’s ability to negotiate better pricing with the Funds’ custodian on behalf of its other clients, as a result of the relationship with the Funds; and (f) the possibility that the working relationship between the Investment Adviser and the Funds’ third-party service providers (including the Sub-Advisers) may cause those service providers to be more likely to do business with other areas of Goldman Sachs. In the course of considering the foregoing, the Independent Trustees requested and received further information quantifying certain of these fall-out benefits.
Other Benefits to the Funds and Their Shareholders
The Trustees also noted that the Funds receive certain potential benefits as a result of their relationship with the Investment Adviser, including: (a) enhanced servicing from vendors because of the volume of business generated by the Investment Adviser and its affiliates; (b) the advantages received from the Investment Adviser’s knowledge and experience gained from managing other accounts and products; (c) the Investment Adviser’s ability to hire and retain qualified personnel to provide services to the Funds because of the reputation of the Goldman Sachs organization; (d) the Funds’ access, through the Investment Adviser, to certain firm-wide resources (e.g., proprietary risk management systems and databases), subject to certain restrictions; and (e) access to certain affiliated distribution channels.
Conclusion
In connection with their consideration of the Management Agreement, the Trustees gave weight to various factors, but did not identify any particular factor as controlling their decision. After deliberation and consideration of the information provided, including the factors described above, the Trustees, including the Independent Trustees, unanimously concluded, in the exercise of their business judgment, that the investment management fees paid by each Fund were reasonable in light of the factors considered, and that the Management Agreement, and the terms thereof, should be approved and continued with respect to each Fund until August 31, 2019.
Designated Sub-Advisory Agreements
Nature, Extent, and Quality of the Services Provided Under the Designated Sub-Advisory Agreements and Performance
In evaluating the Designated Sub-Advisory Agreements, the Trustees relied upon materials furnished and presentations made by the Investment Adviser and the Designated Sub-Advisers. In evaluating the nature, extent, and quality of services provided by each Designated Sub-Adviser, the Trustees considered information on the services provided to the Funds by their respective Designated Sub-Advisers, including information about each Designated Sub-Adviser’s (a) personnel and compensation structure; (b) track record in managing the Fund and, if applicable, other funds and/or accounts with investment strategies similar to those employed on behalf of the Funds; (c) policies and procedures in place to address potential conflicts of interest; and (d) compliance program and code of ethics. In this regard, they also considered assessments provided by the Investment Adviser of each Designated Sub-Adviser, the Designated Sub-Adviser’s investment strategies and personnel, and its compliance program. The Trustees also reviewed the operations and investment performance of each Designated Sub-Adviser’s respective sleeve of the applicable Fund since its inception, including a comparison of each Designated Sub-Adviser to relevant benchmark indices based on various metrics, including realized beta, excess return, alpha, and volatility.
Costs of Services Provided
The Trustees reviewed the terms of each Designated Sub-Advisory Agreement, including the schedule of fees payable to the Designated Sub-Advisers. They considered any breakpoints in the sub-advisory fee rate payable under each Designated Sub-Advisory Agreement. The Trustees noted that the compensation paid to each Designated Sub-Adviser is paid by the Investment Adviser, not by the Funds. The Trustees considered that certain Designated Sub-Advisers had agreed to reduce their sub-advisory fee rate, which benefited shareholders of those Funds in light of the existing management fee waiver arrangement. The Trustees reviewed the blended average of all sub-advisory fees paid by the Investment Adviser with respect to each Fund in light of the overall management fee paid by each Fund.
114
GOLDMAN SACHS STRATEGIC MULTI-ASSET CLASS FUNDS
Statement Regarding Basis for Approval of Management Agreement and Sub-Advisory Agreements (Unaudited) (continued)
Conclusion
In connection with their consideration of the Designated Sub-Advisory Agreements, the Trustees gave weight to various factors, but did not identify any particular factor as controlling their decision. After deliberation and consideration of the information provided, including the factors described above, the Trustees, including the Independent Trustees, unanimously concluded, in the exercise of their business judgment, that the sub-advisory fees paid by the Investment Adviser to each Designated Sub-Adviser were reasonable in light of the factors considered, and that each Designated Sub-Advisory Agreement should be approved and continued until August 31, 2019.
New Sub-Advisory Agreements
In addition to the actions taken by the Trustees to approve the continuation of the Management Agreement and the Designated Sub-Advisory Agreements, upon the recommendation of the Investment Adviser, at meetings held on May 8-9, 2018 and August 7-8, 2018, the Trustees, including all of the Independent Trustees present, approved sub-advisory agreements (the “New Sub-Advisory Agreements”) between the Investment Adviser and TCW Investment Management Company, LLC on behalf of the Goldman Sachs Multi-Manager Non-Core Fixed Income Fund and DWS Investment Management Americas, Inc., Quantitative Management Associates LLC, and Vaughan Nelson Investment Management, L.P. (each a “New Sub-Adviser” and collectively the “New Sub-Advisers”) on behalf of Goldman Sachs Multi-Manager Global Equity Fund (the “New Sub-Advisory Agreements”). In connection with their evaluation of the New Sub-Advisory Agreements, the Trustees received written materials and oral presentations prepared by the Investment Adviser and each New Sub-Adviser on the topics covered, and were advised by their independent legal counsel. In addition, the Trustees received information prepared by each New Sub-Adviser in a written response to a formal request from the Investment Adviser.
Nature, Extent, and Quality of the Services to be Provided Under the New Sub-Advisory Agreement
In evaluating the New Sub-Advisory Agreements, the Trustees relied upon materials furnished and presentations made by the Investment Adviser and the New Sub-Advisers. In evaluating the nature, extent, and quality of services to be provided by each New Sub-Adviser, the Trustees considered information on the services to be provided to the Funds by the New Sub-Advisers, including information about the New Sub-Advisers’ (a) personnel and compensation structure; (b) track record in managing other funds and accounts, which have investment strategies similar to those to be employed on behalf of the Funds; (c) policies and procedures in place to address potential conflicts of interest; and (d) compliance program and code of ethics. In this regard, they also considered assessments provided by the Investment Adviser of the New Sub-Advisers, the New Sub-Advisers’ investment strategies and personnel, and their compliance programs. They noted that, because the New Sub-Advisers had not previously provided services to the Funds, there was no performance information to evaluate with respect to the Funds.
Costs of Services to be Provided
The Trustees reviewed the terms of the New Sub-Advisory Agreements and the proposed fee schedules, including any breakpoints. They noted that the compensation paid to each New Sub-Adviser would be paid by the Investment Adviser, not by the Fund. They also noted that the terms of the New Sub-Advisory Agreements were the result of arm’s length negotiations between the Investment Adviser and each New Sub-Adviser. The Trustees reviewed the anticipated blended average of all sub-advisory fees to be paid by the Investment Adviser with respect to the Fund and how it would change upon hiring the New Sub-Advisers. They considered this information in light of the overall management fee expected to be retained by the Investment Adviser. They considered the Investment Adviser’s undertaking to waive the portion of its management fee which is in excess of the weighted average of the Funds’ sub-advisory fees.
Conclusion
In connection with their consideration of the New Sub-Advisory Agreements, the Trustees gave weight to various factors, but did not identify any particular factor as controlling their decision. After deliberation and consideration of the information provided, including the factors described above, the Trustees, including the Independent Trustees, unanimously concluded, in the exercise of their business judgment, that the sub-advisory fees to be paid by the Investment Adviser to the New Sub-Advisers were reasonable in light of the factors considered, and that each New Sub-Advisory Agreement, and the terms thereof, should be approved for a period of two years from its effective date.
115
GOLDMAN SACHS STRATEGIC MULTI-ASSET CLASS FUNDS
Trustees and Officers (Unaudited)
Independent Trustees
| | | | | | | | | | |
Name,
Address and Age1 | | Position(s) Held
with the Trust | | Term of
Office and
Length of
Time Served2 | | Principal Occupation(s)
During Past 5 Years | | Number of
Portfolios in
Fund Complex
Overseen by
Trustee3 | | Other
Directorships
Held by Trustee4 |
Cheryl K. Beebe Age: 62 | | Chair of the Board of Trustees | | Since 2017 (Trustee since 2015) | | Ms. Beebe is retired. She is Director, Convergys Corporation (2015-Present); Director, Packaging Corporation of America (2008-Present); and was formerly Executive Vice President, (2010-2014); and Chief Financial Officer, Ingredion, Inc. (a leading global ingredient solutions company) (2004-2014). Chair of the Board of Trustees — Goldman Sachs Trust II. | | 19 | | Convergys Corporation (a global leader in customer experience outsourcing); Packaging Corporation of America (producer of container board) |
Lawrence Hughes Age: 60 | | Trustee | | Since 2016 | | Mr. Hughes is retired. Formerly, he held senior management positions with BNY Mellon Wealth Management, a division of The Bank of New York Mellon Corporation (a financial services company) (1991-2015), most recently as Chief Executive Officer (2010-2015). He serves as Chairman of the Board of Directors, Ellis Memorial and Eldredge House (a not-for-profit organization) (2012-Present). Previously, Mr. Hughes served as an Advisory Board Member of Goldman Sachs Trust II (February 2016-April 2016). Trustee — Goldman Sachs Trust II. | | 19 | | None |
John F. Killian Age: 63 | | Trustee | | Since 2015 | | Mr. Killian is retired. He is Director, Consolidated Edison, Inc. (2007-Present); Director, Houghton Mifflin Harcourt Publishing Company (2011-Present); and formerly held senior management positions with Verizon Communications, Inc., including Executive Vice President and Chief Financial Officer (2009- 2010); and President, Verizon Business, Verizon Communications, Inc. (2005-2009). Trustee — Goldman Sachs Trust II. | | 19 | | Consolidated Edison, Inc. (a utility holding company); Houghton Mifflin Harcourt Publishing Company |
Steven D. Krichmar Age: 60 | | Trustee | | Since 2018 | | Mr. Krichmar is retired. Formerly, he held senior management and governance positions with Putnam Investments, LLC, a financial services company (2001-2016). He was most recently Chief of Operations and a member of the Operating Committee of Putnam Investments, LLC and Principal Financial Officer of The Putnam Funds. Previously, Mr. Krichmar served as an Audit Partner with PricewaterhouseCoopers LLP and its predecessor company (1990-2001). Trustee — Goldman Sachs Trust II. | | 19 | | None |
| | | | | | | | | | |
116
GOLDMAN SACHS STRATEGIC MULTI-ASSET CLASS FUNDS
Trustees and Officers (Unaudited) (continued)
Interested Trustee*
| | | | | | | | | | |
Name,
Address and Age1 | | Position(s) Held
with the Trust | | Term of
Office and
Length of
Time Served2 | | Principal Occupation(s)
During Past 5 Years | | Number of
Portfolios in
Fund Complex
Overseen by
Trustee3 | | Other
Directorships
Held by Trustee4 |
| James A. McNamara Age: 56 | | President and Trustee | | Since 2012 | | Advisory Director, Goldman Sachs (January 2018-Present); Managing Director, Goldman Sachs (January 2000-December 2017); Director of Institutional Fund Sales, GSAM (April 1998-December 2000); and Senior Vice President and Manager, Dreyfus Institutional Service Corporation (January 1993- April 1998). President and Trustee — Goldman Sachs Trust II; Goldman Sachs Trust; Goldman Sachs Variable Insurance Trust; Goldman Sachs MLP Income Opportunities Fund; Goldman Sachs MLP and Energy Renaissance Fund; Goldman Sachs ETF Trust; Goldman Sachs Private Markets Fund 2018 LLC; Goldman Sachs Private Markets Fund 2018 (A) LLC; and Goldman Sachs Private Markets Fund 2018 (B) LLC. | | 154 | | None |
| | | | | | | | | | |
| * | | Mr. McNamara is considered to be an “Interested Trustee” because he holds positions with Goldman Sachs and owns securities issued by The Goldman Sachs Group, Inc. He holds comparable positions with certain other companies of which Goldman Sachs, GSAM or an affiliate thereof is the investment adviser, administrator and/or distributor. |
| 1 | | Each Trustee may be contacted by writing to the Trustee, c/o Goldman Sachs, 200 West Street, New York, New York, 10282, Attn: Caroline Kraus. Information is provided as of October 31, 2018. |
| 2 | | Subject to such policies as may be adopted by the Board from time-to-time, each Trustee holds office for an indefinite term, until the earliest of: (a) the election of his or her successor; (b) the date the Trustee resigns or is removed by the Board or shareholders, in accordance with the Trust’s Declaration of Trust; or (c) the termination of the Trust. The Board has adopted policies which provide that (a) no Trustee shall hold office for more than 15 years and (b) a Trustee shall retire as of December 31st of the calendar year in which he or she reaches his or her 74th birthday, unless a waiver of such requirement shall have been adopted by a majority of the other Trustees. These policies may be changed by the Trustees without shareholder vote. |
| 3 | | The Goldman Sachs Fund Complex includes certain other companies listed above for each respective Trustee. As of October 31, 2018, Goldman Sachs Trust II consisted of 19 portfolios (17 of which offered shares to the public); Goldman Sachs Trust consisted of 89 portfolios (88 of which offered shares to the public); Goldman Sachs Variable Insurance Trust consisted of 13 portfolios; Goldman Sachs MLP Income Opportunities Fund, Goldman Sachs MLP and Energy Renaissance Fund, Goldman Sachs Private Markets Fund 2018 LLC, Goldman Sachs Private Markets Fund 2018 (A) LLC and Goldman Sachs Private Markets Fund 2018 (B) LLC each consisted of one portfolio; and Goldman Sachs ETF Trust consisted of 28 portfolios (14 of which offered shares to the public). |
| 4 | | This column includes only directorships of companies required to report to the Securities and Exchange Commission under the Securities Exchange Act of 1934 (i.e., “public companies”) or other investment companies registered under the Act. |
Additional information about the Trustees is available in the Funds’ Statement of Additional Information, which can be obtained from Goldman Sachs free of charge by calling this toll-free number (in the United States of America): 1-800-526-7384.
117
GOLDMAN SACHS STRATEGIC MULTI-ASSET CLASS FUNDS
Trustees and Officers (Unaudited) (continued)
Officers of the Trust*
| | | | | | |
| Name, Address and Age1 | | Position(s) Held
with the Trust | | Term of
Office and
Length of
Time Served2 | | Principal Occupation(s) During Past 5 Years |
James A. McNamara 200 West Street New York, NY 10282 Age: 56 | | Trustee and President | | Since 2012 | | Advisory Director, Goldman Sachs (January 2018-Present); Managing Director, Goldman Sachs (January 2000-December 2017); Director of Institutional Fund Sales, GSAM (April 1998-December 2000); and Senior Vice President and Manager, Dreyfus Institutional Service Corporation (January 1993-April 1998). President and Trustee — Goldman Sachs Trust II; Goldman Sachs Trust; Goldman Sachs Variable Insurance Trust; Goldman Sachs MLP Income Opportunities Fund; Goldman Sachs MLP and Energy Renaissance Fund; Goldman Sachs ETF Trust; Goldman Sachs Private Markets Fund 2018 LLC; Goldman Sachs Private Markets Fund 2018 (A) LLC; and Goldman Sachs Private Markets Fund 2018 (B) LLC. |
Caroline L. Kraus 200 West Street New York, NY 10282 Age: 41 | | Secretary | | Since 2012 | | Managing Director, Goldman Sachs (January 2016-Present); Vice President, Goldman Sachs (August 2006-December 2015); Associate General Counsel, Goldman Sachs (2012-Present); Assistant General Counsel, Goldman Sachs (August 2006-December 2011); and Associate, Weil, Gotshal & Manges, LLP (2002-2006). Secretary — Goldman Sachs Trust II; Goldman Sachs Trust (previously Assistant Secretary (2012)); Goldman Sachs Variable Insurance Trust (previously Assistant Secretary (2012)); Goldman Sachs BDC, Inc.; Goldman Sachs Private Middle Market Credit LLC; Goldman Sachs Middle Market Lending Corp.; Goldman Sachs MLP Income Opportunities Fund; Goldman Sachs MLP and Energy Renaissance Fund; Goldman Sachs ETF Trust; Goldman Sachs Private Markets Fund 2018 LLC; Goldman Sachs Private Markets Fund 2018 (A) LLC; and Goldman Sachs Private Markets Fund 2018 (B) LLC. |
Scott M. McHugh 200 West Street New York, NY 10282 Age: 47 | | Treasurer, Senior Vice President and Principal Financial Officer | | Since 2012 (Principal Financial Officer since 2013) | | Managing Director, Goldman Sachs (January 2016-Present); Vice President, Goldman Sachs (February 2007-December 2015); Assistant Treasurer of certain mutual funds administered by DWS Scudder (2005-2007); and Director (2005-2007), Vice President (2000-2005), and Assistant Vice President (1998-2000), Deutsche Asset Management or its predecessor (1998-2007). Treasurer, Senior Vice President and Principal Financial Officer — Goldman Sachs Trust II; Goldman Sachs Trust; Goldman Sachs Variable Insurance Trust; Goldman Sachs MLP Income Opportunities Fund; Goldman Sachs MLP and Energy Renaissance Fund; Goldman Sachs ETF Trust; Goldman Sachs Private Markets Fund 2018 LLC; Goldman Sachs Private Markets Fund 2018 (A) LLC; and Goldman Sachs Private Markets Fund 2018 (B) LLC. |
Joseph F. DiMaria 30 Hudson Street Jersey City, NJ 07302 Age: 50 | | Assistant Treasurer and Principal Accounting Officer | | Since 2017 | | Managing Director, Goldman Sachs (November 2015-Present) and Vice President — Mutual Fund Administration, Columbia Management Investment Advisers, LLC (May 2010-October 2015). Assistant Treasurer and Principal Accounting Officer — Goldman Sachs Trust II; Goldman Sachs Trust; Goldman Sachs Variable Insurance Trust; Goldman Sachs MLP Income Opportunities Fund; Goldman Sachs MLP and Energy Renaissance Fund; Goldman Sachs ETF Trust; Goldman Sachs Private Markets Fund 2018 LLC; Goldman Sachs Private Markets Fund 2018 (A) LLC; and Goldman Sachs Private Markets Fund 2018 (B) LLC. |
| | | | | | |
| * | | Represents a partial list of officers of the Trust. Additional information about all the officers is available in the Funds’ Statement of Additional Information, which can be obtained from Goldman Sachs free of charge by calling this toll-free number (in the United States): 1-800-526-7384. |
| 1 | | Information is provided as of October 31, 2018. |
| 2 | | Officers hold office at the pleasure of the Board of Trustees or until their successors are duly elected and qualified. Each officer holds comparable positions with certain other companies of which Goldman Sachs, GSAM or an affiliate thereof is the investment adviser, administrator and/or distributor. |
Goldman Sachs Trust II — Strategic Multi-Asset Class Funds — Tax Information (Unaudited)
For the year ended October 31, 2018, 27.79% and 10.95% of the dividends paid from net investment company taxable income by the Multi-Manager Global Equity and Multi-Manager Real Assets Strategy Funds, respectively, qualify for the dividends received deduction available to corporations.
For the year ended October 31, 2018, 100% and 44.35% of the dividends paid from net investment company taxable income by the Multi-Manager Global Equity and Multi-Manager Real Assets Strategy Funds, respectively, qualify for the reduced tax rate under the Jobs and Growth Tax Relief and Reconciliation Act of 2003.
Pursuant to Section 852 of the Internal Revenue Code, the Multi-Manager Global Equity and Multi-Manager Real Assets Strategy Funds designate $9,365,803 and $2,588,426, respectively, or if different, the maximum amount allowable, as capital gain dividends paid during the fiscal year ended October 31, 2018.
From distributions paid during the year ended October 31, 2018, the total amount of income received by the Multi-Manager Global Equity Fund from sources within foreign countries and possessions of the United States was $0.0961 per share, all of which is attributable to qualified passive income. The percentage of net investment income dividends paid from foreign sources by the Multi-Manager Global Equity Fund was 56.49%. The total amount of taxes paid by the Multi-Manager Global Equity Fund to such countries was $0.0133 per share.
During the fiscal year ended October 31, 2018, the Multi-Manager Real Assets Strategy Fund designates $1,675,800 as short-term capital gain dividends pursuant to Section 871(k) of the Internal Revenue Code.
118
FUNDS PROFILE
Goldman Sachs Funds
Goldman Sachs is a premier financial services firm, known since 1869 for creating thoughtful and customized investment solutions in complex global markets.
Today, the Investment Management Division of Goldman Sachs serves a diverse set of clients worldwide, including private institutions, public entities and individuals. With approximately $1.34 trillion in assets under supervision as of September 30, 2018, Goldman Sachs Asset Management (“GSAM”) has portfolio management teams located around the world and our investment professionals bring firsthand knowledge of local markets to every investment decision. Assets under supervision includes assets under management and other client assets for which Goldman Sachs does not have full discretion. GSAM leverages the resources of Goldman Sachs & Co. LLC subject to legal, internal and regulatory restrictions.
Money Market
Financial Square FundsSM
| ∎ | | Financial Square Treasury Solutions Fund1 |
| ∎ | | Financial Square Government Fund1 |
| ∎ | | Financial Square Money Market Fund2 |
| ∎ | | Financial Square Prime Obligations Fund2 |
| ∎ | | Financial Square Treasury Instruments Fund1 |
| ∎ | | Financial Square Treasury Obligations Fund1 |
| ∎ | | Financial Square Federal Instruments Fund1 |
Investor FundsSM
| ∎ | | Investor Money Market Fund3 |
| ∎ | | Investor Tax-Exempt Money Market Fund3 |
Fixed Income
Short Duration and Government
| ∎ | | High Quality Floating Rate Fund |
| ∎ | | Short-Term Conservative Income Fund |
| ∎ | | Short Duration Government Fund |
| ∎ | | Short Duration Income Fund |
| ∎ | | Inflation Protected Securities Fund |
Multi-Sector
Municipal and Tax-Free
| ∎ | | High Yield Municipal Fund |
| ∎ | | Dynamic Municipal Income Fund |
| ∎ | | Short Duration Tax-Free Fund |
Single Sector
| ∎ | | Investment Grade Credit Fund |
| ∎ | | High Yield Floating Rate Fund |
| ∎ | | Emerging Markets Debt Fund |
| ∎ | | Local Emerging Markets Debt Fund |
| ∎ | | Total Emerging Markets Income Fund |
Fixed Income Alternatives
| ∎ | | Long Short Credit Strategies Fund |
Fundamental Equity
| ∎ | | Small/Mid Cap Value Fund |
| ∎ | | Small/Mid Cap Growth Fund |
| ∎ | | Concentrated Growth Fund |
| ∎ | | Technology Opportunities Fund |
| ∎ | | Growth Opportunities Fund |
| ∎ | | Rising Dividend Growth Fund |
Tax-Advantaged Equity
| ∎ | | U.S. Tax-Managed Equity Fund |
| ∎ | | International Tax-Managed Equity Fund |
| ∎ | | U.S. Equity Dividend and Premium Fund |
| ∎ | | International Equity Dividend and Premium Fund |
Equity Insights
| ∎ | | Small Cap Equity Insights Fund |
| ∎ | | U.S. Equity Insights Fund |
| ∎ | | Small Cap Growth Insights Fund |
| ∎ | | Large Cap Growth Insights Fund |
| ∎ | | Large Cap Value Insights Fund |
| ∎ | | Small Cap Value Insights Fund |
| ∎ | | International Small Cap Insights Fund |
| ∎ | | International Equity Insights Fund |
| ∎ | | Emerging Markets Equity Insights Fund |
Fundamental Equity International
| ∎ | | International Equity Income Fund4 |
| ∎ | | International Equity ESG Fund5 |
| ∎ | | Emerging Markets Equity Fund |
| ∎ | | ESG Emerging Markets Equity Fund |
Select Satellite
| ∎ | | Real Estate Securities Fund |
| ∎ | | International Real Estate Securities Fund |
| ∎ | | Commodity Strategy Fund |
| ∎ | | Global Real Estate Securities Fund |
| ∎ | | Alternative Premia Fund |
| ∎ | | Absolute Return Tracker Fund |
| ∎ | | Managed Futures Strategy Fund |
| ∎ | | MLP Energy Infrastructure Fund |
| ∎ | | Multi-Manager Alternatives Fund |
| ∎ | | Absolute Return Multi-Asset Fund |
| ∎ | | Global Infrastructure Fund |
Total Portfolio Solutions
| ∎ | | Global Managed Beta Fund |
| ∎ | | Multi-Manager Non-Core Fixed Income Fund |
| ∎ | | Multi-Manager U.S. Dynamic Equity Fund |
| ∎ | | Multi-Manager Global Equity Fund |
| ∎ | | Multi-Manager International Equity Fund |
| ∎ | | Tactical Tilt Overlay Fund |
| ∎ | | Balanced Strategy Portfolio |
| ∎ | | Multi-Manager U.S. Small Cap Equity Fund |
| ∎ | | Multi-Manager Real Assets Strategy Fund |
| ∎ | | Growth and Income Strategy Portfolio |
| ∎ | | Growth Strategy Portfolio |
| ∎ | | Equity Growth Strategy Portfolio |
| ∎ | | Satellite Strategies Portfolio |
| ∎ | | Enhanced Dividend Global Equity Portfolio |
| ∎ | | Tax-Advantaged Global Equity Portfolio |
| ∎ | | Strategic Factor Allocation Fund |
| ∎ | | Target Date 2020 Portfolio |
| ∎ | | Target Date 2025 Portfolio |
| ∎ | | Target Date 2030 Portfolio |
| ∎ | | Target Date 2035 Portfolio |
| ∎ | | Target Date 2040 Portfolio |
| ∎ | | Target Date 2045 Portfolio |
| ∎ | | Target Date 2050 Portfolio |
| ∎ | | Target Date 2055 Portfolio |
| ∎ | | Target Date 2060 Portfolio |
| ∎ | | GQG Partners International Opportunities Fund |
| 1 | | You could lose money by investing in the Fund. Although the Fund seeks to preserve the value of your investment at $1.00 per share, it cannot guarantee it will do so. An investment in the Fund is not a deposit of a bank and is not insured or guaranteed by the Federal Deposit Insurance Corporation or any other government agency. The Fund’s sponsor has no legal obligation to provide financial support to the Fund, and you should not expect that the sponsor will provide financial support to the Fund at any time. |
| 2 | | You could lose money by investing in the Fund. Because the share price of the Fund will fluctuate, when you sell your shares they may be worth more or less than what you originally paid for them. The Fund may impose a fee upon sale of your shares or may temporarily suspend your ability to sell shares if the Fund’s liquidity falls below required minimums because of market conditions or other factors. An investment in the Fund is not a deposit of a bank and is not insured or guaranteed by the Federal Deposit Insurance Corporation or any other government agency. The Fund’s sponsor has no legal obligation to provide financial support to the Fund, and you should not expect that the sponsor will provide financial support to the Fund at any time. |
| 3 | | You could lose money by investing in the Fund. Although the Fund seeks to preserve the value of your investment at $1.00 per share, it cannot guarantee it will do so. The Fund may impose a fee upon sale of your shares or may temporarily suspend your ability to sell shares if the Fund’s liquidity falls below required minimums because of market conditions or other factors. An investment in the Fund is not a deposit of a bank and is not insured or guaranteed by the Federal Deposit Insurance Corporation or any other government agency. The Fund’s sponsor has no legal obligation to provide financial support to the Fund, and you should not expect that the sponsor will provide financial support to the Fund at any time. |
| 4 | | Effective after the close of business on February 27, 2018, the Goldman Sachs Strategic International Equity Fund was renamed the Goldman Sachs International Equity Income Fund. |
| 5Effective | | after the close of business on February 27, 2018, the Goldman Sachs Focused International Equity Fund was renamed the Goldman Sachs International Equity ESG Fund. |
| | | Financial Square FundsSM and Investor FundsSM are registered service marks of Goldman Sachs & Co. LLC. |
| *This | | list covers open-end funds only. Please visit our website at www.GSAMFUNDS.com to learn about our closed-end funds and exchange-traded funds. |
| | |
TRUSTEES Cheryl K. Beebe, Chair Lawrence Hughes John F. Killian Steven D. Krichmar James A. McNamara | | OFFICERS James A. McNamara, President Scott M. McHugh Treasurer, Senior Vice President and Principal Financial Officer Joseph F. DiMaria, Assistant Treasurer and Principal Accounting Officer Caroline L. Kraus, Secretary |
| |
GOLDMAN SACHS & CO. LLC Distributor and Transfer Agent | | GOLDMAN SACHS ASSET MANAGEMENT, L.P. Investment Adviser |
Visit our web site at www.GSAMFUNDS.com to obtain the most recent month-end returns.
Goldman Sachs Asset Management, L.P., 200 West Street, New York, New York 10282
The reports concerning the Funds included in this shareholder report may contain certain forward-looking statements about the factors that may affect the performance of the Funds in the future. These statements are based on Fund management’s predictions and expectations concerning certain future events and their expected impact on the Funds, such as performance of the economy as a whole and of specific industry sectors, changes in the levels of interest rates, the impact of developing world events, and other factors that may influence the future performance of the Funds. Management believes these forward-looking statements to be reasonable, although they are inherently uncertain and difficult to predict. Actual events may cause adjustments in portfolio management strategies from those currently expected to be employed.
A description of the policies and procedures that the Funds use to determine how to vote proxies relating to portfolio securities and information regarding how Funds voted proxies relating to portfolio securities during the most recent 12-month period ended June 30 are available (I) without charge, upon request by calling 1-800-621-2550; and (II) on the Securities and Exchange Commission (’’SEC’’) web site at http://www.sec.gov.
Each Fund files its complete schedule of portfolio holdings with the SEC for the first and third quarters of each fiscal year on Form N-Qs. The Funds’ Form N-Qs are available on the SEC’s web site at http://www.sec.gov within 60 days after the Funds’ first and third fiscal quarters. Form N-Qs may be obtained upon request and without charge by calling 1-800-621-2550.
Fund holdings and allocations shown are as of October 31, 2018 and may not be representative of future investments. Fund holdings should not be relied on in making investment decisions and should not be construed as research or investment advice regarding particular securities. Current and future holdings are subject to risk.
Economic and market forecasts presented herein reflect our judgment as of the date of this presentation and are subject to change without notice. These forecasts do not take into account the specific investment objectives, restrictions, tax and financial situation or other needs of any specific client. Actual data will vary and may not be reflected here. These forecasts are subject to high levels of uncertainty that may affect actual performance. Accordingly, these forecasts should be viewed as merely representative of a broad range of possible outcomes. These forecasts are estimated, based on assumptions, and are subject to significant revision and may change materially as economic and market conditions change. Goldman Sachs has no obligation to provide updates or changes to these forecasts. Case studies and examples are for illustrative purposes only. The Global Industry Classification Standard (GICS) was developed by and is the exclusive property and a service mark of Morgan Stanley Capital International Inc. (MSCI) and Standard & Poor’s, a division of The McGraw-Hill Companies, Inc. (S&P) and is licensed for use by Goldman Sachs. Neither MSCI, S&P nor any other party involved in making or compiling the GICS or any GICS classifications makes any express or implied warranties or representations with respect to such standard or classification (or the results to be obtained by the use thereof), and all such parties hereby expressly disclaim all warranties of originality, accuracy, completeness, merchantability or fitness for a particular purpose with respect to any of such standard or classification. Without limiting any of the foregoing, in no event shall MSCI, S&P, any of their affiliates or any third party involved in making or compiling the GICS or any GICS classifications have any liability for any direct, indirect, special, punitive, consequential or any other damages (including lost profits) even if notified of the possibility of such damages.
The portfolio risk management process includes an effort to monitor and manage risk, but does not imply low risk. Diversification does not protect an investor from market risk and does not ensure a profit. Past correlations are not indicative of future correlations, which may vary.
This material is not authorized for distribution to prospective investors unless preceded or accompanied by a current Prospectus or summary prospectus, if applicable. Investors should consider the Funds’ objective, risks, and charges and expenses, and read the summary prospectus, if available, and/or the Prospectus carefully before investing or sending money. The summary prospectus, if available, and the Prospectus contain this and other information about each Fund and may be obtained from your authorized dealer or from Goldman Sachs & Co. LLC by calling 1-800-621-2550.
© 2018 Goldman Sachs. All rights reserved. 152212-OTU-889466 SMACAR-18/183
(a) As of the end of the period covered by this report, the registrant has adopted a code of ethics that applies to the registrant’s principal executive officer, principal financial officer, principal accounting officer or controller, or persons performing similar functions, regardless of whether these individuals are employed by the registrant or a third party (the “Code of Ethics”).
(b) During the period covered by this report, no amendments were made to the provisions of the Code of Ethics.
(c) During the period covered by this report, the registrant did not grant any waivers, including an implicit waiver, from any provision of the Code of Ethics.
(d) A copy of the Code of Ethics is available as provided in Item 13(a)(1) of this report.
| ITEM 3. | AUDIT COMMITTEE FINANCIAL EXPERT. |
The registrant’s board of trustees has determined that the registrant has at least one “audit committee financial expert” (as defined in Item 3 of Form N-CSR) serving on its audit committee. John F. Killian is the “audit committee financial expert” and is “independent” (as each term is defined in Item 3 of Form N-CSR).
| ITEM 4. | PRINCIPAL ACCOUNTANT FEES AND SERVICES. |
Table 1 — Items 4(a) - 4(d). The accountant fees below reflect the aggregate fees billed by the Funds of the Goldman Sachs Trust II to which this certified shareholder report relates.
| | | | | | | | | | | | |
| | | 2018 | | 2017 | | Description of Services Rendered |
| | | | | | | | | | | | |
| | | |
Audit Fees: | | | | | | | | | | | | |
| | | |
• PricewaterhouseCoopers LLP
(“PwC”) | | | $ | 445,908 | | | | $ | 632,965 | | | Financial Statement audits. |
| | | |
Audit-Related Fees: | | | | | | | | | | | | |
| | | |
• PwC | | | $ | 54,252 | | | | $ | 25,795 | | | |
| | | |
Tax Fees: | | | | | | | | | | | | |
| | | |
• PwC | | | $ | 233,440 | | | | $ | 158,592 | | | |
Table 2 — Items 4(b)(c) & (d). Non-Audit Services to the Goldman Sachs Trust II’s service affiliates * that were pre-approved by the Audit Committee of the Goldman Sachs Trust II pursuant to Rule 2-01(c)(7)(ii) of Regulation S-X.
| | | | | | | | | | | | |
| | | 2018 | | 2017 | | Description of Services Rendered |
| | | | | | | | | | | | |
| | | |
Audit-Related Fees: | | | | | | | | | | | | |
| | | |
• PwC | | | $ | 1,862,076 | | | | $ | 1,560,883 | | | Internal control review performed in accordance with Statement on Standards for Attestation Engagements No. 16 and semi annual updates relating to withholding tax accrual for non-US jurisdictions. These fees are borne by the Funds’ Adviser. |
| * | These include the advisor (excluding sub-advisors) and any entity controlling, controlled by or under common control with the advisor that provides ongoing services to the registrant (hereinafter referred to as “service affiliates”). |
Item 4(e)(1) — Audit Committee Pre-Approval Policies and Procedures
Pre-Approval of Audit and Non-Audit Services Provided to the Funds of the Goldman Sachs Trust II. The Audit and Non-Audit Services Pre-Approval Policy (the “Policy”) adopted by the Audit Committee of Goldman Sachs Trust II (“GST II”) sets forth the procedures and the conditions pursuant to which services performed by an independent auditor for GST II may be pre-approved. Services may be pre-approved specifically by the Audit Committee as a whole or, in certain circumstances, by the Audit Committee Chairman or the person designated as the Audit Committee Financial Expert. In addition, subject to specified cost limitations, certain services may be pre-approved under the provisions of the Policy. The Policy provides that the Audit Committee will consider whether the services provided by an independent auditor are consistent with the Securities and Exchange Commission’s rules on auditor independence. The Policy provides for periodic review and pre-approval by the Audit Committee of the services that may be provided by the independent auditor.
De Minimis Waiver. The pre-approval requirements of the Policy may be waived with respect to the provision of non-audit services that are permissible for an independent auditor to perform, provided (1) the aggregate amount of all such services provided constitutes no more than five percent of the total amount of revenues subject to pre-approval that was paid to the independent auditors during the fiscal year in which the services are provided; (2) such services were not recognized by GST II at the time of the engagement to be non-audit services; and (3) such services are promptly brought to the attention of the Audit Committee and approved prior to the completion of the audit by the Audit Committee or by one or more members of the Audit Committee to whom authority to grant such approvals has been delegated by the Audit Committee, pursuant to the pre-approval provisions of the Policy.
Pre-Approval of Non-Audit Services Provided to GST’s Investment Advisers. The Policy provides that, in addition to requiring pre-approval of audit and non-audit services provided to GST II, the Audit Committee will pre-approve those non-audit services provided to GST II’s investment advisers (and entities controlling, controlled by or under common control with the investment advisers that provide ongoing services to GST II) where the engagement relates directly to the operations or financial reporting of GST II.
Item 4(e)(2) – 0% of the audit-related fees, tax fees and other fees listed in Table 1 were approved by GST II’s Audit Committee pursuant to the “de minimis” exception of Rule 2-01(c)(7)(i)(C) of Regulation S-X. In addition, 0% of the non-audit services to the GST II’s service affiliates listed in Table 2 were approved by GST II’s Audit Committee pursuant to the “de minimis” exception of Rule 2-01(c)(7)(i)(C) of Regulation S-X.
Item 4(f) – Not applicable.
Item 4(g) Aggregate Non-Audit Fees Disclosure
The aggregate non-audit fees billed to GST II by PwC for the twelve months ended October 31, 2018 and October 31, 2017 were $287,692 and $184,387 respectively. The aggregate non-audit fees billed to GST II’s adviser and service affiliates by PwC for the twelve months ended October 31, 2018 and October 31, 2017 were approximately $9.7 million and $11.4 million respectively. With regard to the aggregate non-audit fees billed to GST II’s adviser and service affiliates, the 2018 and 2017 amounts include fees for non-audit services required to be pre-approved [see Table 2] and fees for non-audit services that did not require pre-approval since they did not directly relate to GST II’s operations or financial reporting.
Item 4(h) — GST II’s Audit Committee has considered whether the provision of non-audit services to GST II’s investment adviser and service affiliates that did not require pre-approval pursuant to paragraph (c)(7)(ii) of Rule 2-01 of Regulation S-X is compatible with maintaining the auditors’ independence.
| ITEM 5. | AUDIT COMMITTEE OF LISTED REGISTRANTS. |
| ITEM 6. | SCHEDULE OF INVESTMENTS. |
| | Schedule of Investments is included as part of the Report to Shareholders filed under Item 1. |
| ITEM 7. | DISCLOSURE OF PROXY VOTING POLICIES AND PROCEDURES FOR CLOSED-END MANAGEMENT INVESTMENT COMPANIES. |
| ITEM 8. | PORTFOLIO MANAGERS OF CLOSED-END MANAGEMENT INVESTMENT COMPANIES. |
| ITEM 9. | PURCHASES OF EQUITY SECURITIES BY CLOSED-END MANAGEMENT INVESTMENT COMPANY AND AFFILIATED PURCHASERS. |
| ITEM 10. | SUBMISSION OF MATTERS TO A VOTE OF SECURITY HOLDERS. |
| | There have been no material changes to the procedures by which shareholders may recommend nominees to the registrant’s board of trustees. |
| ITEM 11. | CONTROLS AND PROCEDURES. |
| | (a) | The registrant’s principal executive and principal financial officers, or persons performing similar functions have concluded that the registrant’s disclosure controls and procedures (as defined in Rule 30a-3(c) under the Investment Company Act of 1940, as amended (the “1940 Act”)) are effective as of a date within 90 days of the filing of this report that includes the disclosure required by this paragraph, based on the evaluation of these controls and procedures required by Rule 30a-3(b) under the 1940 Act and 15d-15(b) under the Securities Exchange Act of 1934, as amended. |
| | (b) | There were no changes in the registrant’s internal control over financial reporting (as defined in Rule 30a-3(d) under the 1940 Act) that occurred during the registrant’s last fiscal quarter that have materially affected, or are reasonably likely to materially affect, the registrant’s internal control over financial reporting. |
| ITEM 12. | DISCLOSURE OF SECURITIES LENDING ACTIVITIES FOR CLOSED-END MANAGEMENT INVESTMENT COMPANIES |
| | | | |
| (a)(1) | | Goldman Sachs Trust II’s Code of Ethics for Principal Executive and Senior Financial Officers is incorporated by reference to Exhibit 12(a)(1) of the registrant’s Form N-CSR filed on July 8, 2015 for its Multi-Manager Non-Core Fixed Income Fund. |
| | |
| (a)(2) | | Exhibit 99.CERT | | Certifications pursuant to Section 302 of the Sarbanes-Oxley Act of 2002 filed herewith. |
| |
| (a)(3) | | Not applicable to open-end investment companies. |
| |
| (a)(4) | | There was no change in the registrant’s independent public accountant for the period covered by this report. |
| | |
| (b) | | Exhibit 99.906CERT | | Certifications pursuant to Section 906 of the Sarbanes-Oxley Act of 2002 filed herewith. |
SIGNATURES
Pursuant to the requirements of the Securities Exchange Act of 1934 and the Investment Company Act of 1940, the registrant has duly caused this report to be signed on its behalf by the undersigned, thereunto duly authorized.
| | | | |
| | | | Goldman Sachs Trust II |
| | |
| By: | | | | /s/ James A. McNamara |
| | | | James A. McNamara |
| | | | President/Chief Executive Officer |
| | | | Goldman Sachs Trust II |
| | |
| Date: | | | | January 3, 2019 |
Pursuant to the requirements of the Securities Exchange Act of 1934 and the Investment Company Act of 1940, this report has been signed below by the following persons on behalf of the registrant and in the capacities and on the dates indicated.
| | | | |
| By: | | | | /s/ James A. McNamara |
| | | | James A. McNamara |
| | | | President/Chief Executive Officer |
| | | | Goldman Sachs Trust II |
| | |
| Date: | | | | January 3, 2019 |
| | |
| By: | | | | /s/ Scott McHugh |
| | | | Scott McHugh |
| | | | Principal Financial Officer |
| | | | Goldman Sachs Trust II |
| | |
| Date: | | | | January 3, 2019 |