UNITED STATES
SECURITIES AND EXCHANGE COMMISSION
Washington, D.C. 20549
FORM N-CSR
CERTIFIED SHAREHOLDER REPORT OF REGISTERED
MANAGEMENT INVESTMENT COMPANIES
Investment Company Act file number 811-22781
Goldman Sachs Trust II
(Exact name of registrant as specified in charter)
200 West Street
15th Floor
New York, New York 10282
(Address of principal executive offices) (Zip code)
| | |
Copies to: |
Caroline Kraus | | Geoffrey R.T. Kenyon, Esq. |
Goldman Sachs & Co. LLC | | Dechert LLP |
200 West Street | | 100 Oliver Street |
New York, New York 10282 | | 40th Floor |
| | Boston, MA 02110-2605 |
(Name and address of agents for service)
Registrant’s telephone number, including area code: (212) 902-1000
Date of fiscal year end: August 31
Date of reporting period: August 31, 2020
| ITEM 1. | REPORTS TO STOCKHOLDERS. |
| | The Annual Report to Shareholders is filed herewith. |
Goldman Sachs Funds

| | | | | | | | |
| | |
| Annual Report | | | | August 31, 2020 |
| | |
| | | | Target Date Portfolios |
| | | | *Target Date Retirement | | Target Date 2035 | | Target Date 2050 |
| | | | Target Date 2025 | | Target Date 2040 | | Target Date 2055 |
| | | | Target Date 2030 | | Target Date 2045 | | Target Date 2060 |
It is our intention that beginning on January 1, 2021, paper copies of the Portfolios’ annual and semi-annual shareholder reports will no longer be sent by mail, unless you specifically request paper copies of the reports from a Portfolio or from your financial intermediary. Instead, the reports will be made available on a website, and you will be notified by mail each time a report is posted and provided with a website link to access the report.
If you already elected to receive shareholder reports electronically, you will not be affected by this change and you need not take any action. At any time, you may elect to receive reports and certain communications from a Portfolio electronically by calling the applicable toll-free number below or by contacting your financial intermediary.
You may elect to receive all future shareholder reports in paper free of charge. If you hold shares of a Portfolio directly with the Portfolio’s transfer agent, you can inform the transfer agent that you wish to receive paper copies of reports by calling toll-free 800-621-2550 for Institutional, Service and Class R6, shareholders or 800-526-7384 for all other shareholders. If you hold shares of a Portfolio through a financial intermediary, please contact your financial intermediary to make this election. Your election to receive reports in paper will apply to all Goldman Sachs Funds held in your account if you invest through your financial intermediary or all Goldman Sachs Funds held with the Portfolios’ transfer agent if you invest directly with the transfer agent.
*Effective December 27, 2019 the Target Date 2020 Portfolio was renamed the Target Date Retirement Portfolio.

Goldman Sachs Target Date Portfolios
| | | | |
| | | |
| NOT FDIC-INSURED | | May Lose Value | | No Bank Guarantee |
PORTFOLIO RESULTS
Goldman Sachs Target Date Retirement Portfolio (formerly, the Goldman Sachs Target Date 2020 Portfolio),
Goldman Sachs Target Date 2025 Portfolio,
Goldman Sachs Target Date 2030 Portfolio,
Goldman Sachs Target Date 2035 Portfolio,
Goldman Sachs Target Date 2040 Portfolio,
Goldman Sachs Target Date 2045 Portfolio,
Goldman Sachs Target Date 2050 Portfolio,
Goldman Sachs Target Date 2055 Portfolio and
Goldman Sachs Target Date 2060 Portfolio
Investment Objective and Principal Strategies
The Goldman Sachs Target Date Retirement Portfolio, the Goldman Sachs Target Date 2025 Portfolio, the Goldman Sachs Target Date 2030 Portfolio, the Goldman Sachs Target Date 2035 Portfolio, the Goldman Sachs Target Date 2040 Portfolio, the Goldman Sachs Target Date 2045 Portfolio, the Goldman Sachs Target Date 2050 Portfolio, the Goldman Sachs Target Date 2055 Portfolio and the Goldman Sachs Target Date 2060 Portfolio (collectively, the “Portfolios”) seek to provide capital appreciation and current income consistent with each respective Portfolio’s current asset allocation. The Portfolios employ asset allocation strategies designed for investors who plan to retire and withdraw their investment beginning on approximately the date specified in the Portfolio’s name (the “Target Date”). Each Portfolio is managed for an investor planning to retire at the age of 65 on or around that Portfolio’s Target Date.
Portfolio Management Discussion and Analysis
Effective December 27, 2019, the Goldman Sachs Target Date 2020 Portfolio was renamed the Goldman Sachs Target Date Retirement Portfolio. No changes were made to its investment objective and principal strategy.
Below, the Goldman Sachs Global Portfolio Solutions (“GPS”) Team discusses the Portfolios’ performance and positioning for the 12-month period ended August 31, 2020 (the “Reporting Period”).
| Q | | How did the Portfolios perform during the Reporting Period? |
| A | | Goldman Sachs Target Date Retirement Portfolio — During the Reporting Period, the Target Date Retirement Portfolio’s Class A, Institutional, Service, Investor, Class R6 and Class R Shares generated average annual total returns of 9.25%, 9.57%, 9.09%, 9.46%, 9.69% and 8.97%, respectively. These returns compare to the 8.53% average annual total return of the Portfolio’s benchmark, the S&P Target Date To 2020 Index (Total Return, Unhedged, USD) during the same period. |
| | Goldman Sachs Target Date 2025 Portfolio — During the Reporting Period, the Target Date 2025 Portfolio’s Class A, Institutional, Service, Investor, Class R6 and Class R Shares generated average annual total returns of 9.89%, 10.34%, 9.77%, 10.24%, 10.35% and 9.63%, respectively. These returns compare to the 9.54% average annual total return of the Portfolio’s benchmark, the S&P Target Date To 2025 Index (Total Return, Unhedged, USD) during the same period. |
| | Goldman Sachs Target Date 2030 Portfolio — During the Reporting Period, the Target Date 2030 Portfolio’s Class A, Institutional, Service, Investor, Class R6 and Class R Shares generated average annual total returns of 10.04%, 10.55%, 10.01%, 10.34%, 10.57% and 9.85%, respectively. These returns compare to the 10.30% average annual total return of the Portfolio’s benchmark, the S&P Target Date To 2030 Index (Total Return, Unhedged, USD) during the same period. |
| | Goldman Sachs Target Date 2035 Portfolio — During the Reporting Period, the Target Date 2035 Portfolio’s Class A, Institutional, Service, Investor, Class R6 and Class R Shares generated average annual total returns of 11.13%, 11.44%, 10.89%, 11.25%, 11.44% and 10.66%, respectively. These |
1
PORTFOLIO RESULTS
| | returns compare to the 10.98% average annual total return of the Portfolio’s benchmark, the S&P Target Date To 2035 Index (Total Return, Unhedged, USD) during the same period. |
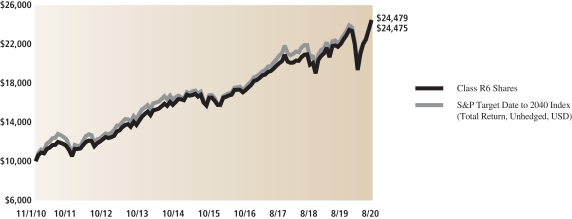
| | Goldman Sachs Target Date 2040 Portfolio — During the Reporting Period, the Target Date 2040 Portfolio’s Class A, Institutional, Service, Investor, Class R6 and Class R Shares generated average annual total returns of 12.04%, 12.57%, 12.00%, 12.35%, 12.58% and 11.90%, respectively. These returns compare to the 11.03% average annual total return of the Portfolio’s benchmark, the S&P Target Date To 2040 Index (Total Return, Unhedged, USD) during the same period. |
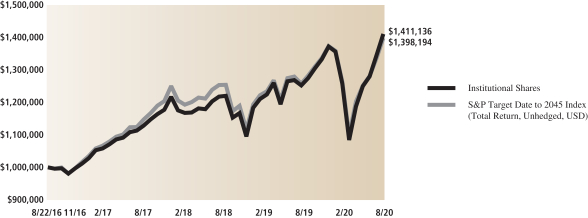
| | Goldman Sachs Target Date 2045 Portfolio — During the Reporting Period, the Target Date 2045 Portfolio’s Class A, Institutional, Service, Investor, Class R6 and Class R Shares generated average annual total returns of 12.26%, 12.63%, 12.18%, 12.55%, 12.74% and 12.05%, respectively. These returns compare to the 11.11% average annual total return of the Portfolio’s benchmark, the S&P Target Date To 2045 Index (Total Return, Unhedged, USD) during the same period. |
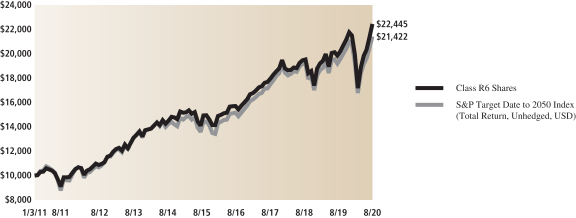
| | Goldman Sachs Target Date 2050 Portfolio — During the Reporting Period, the Target Date 2050 Portfolio’s Class A, Institutional, Service, Investor, Class R6 and Class R Shares generated average annual total returns of 12.42%, 12.88%, 12.33%, 12.68%, 13.01% and 12.22%, respectively. These returns compare to the 11.61% average annual total return of the Portfolio’s benchmark, the S&P Target Date To 2050 Index (Total Return, Unhedged, USD) during the same period. |
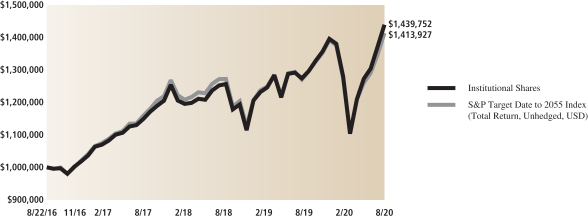
| | Goldman Sachs Target Date 2055 Portfolio — During the Reporting Period, the Target Date 2055 Portfolio’s Class A, Institutional, Service, Investor, Class R6 and Class R Shares generated average annual total returns of 12.61%, 12.96%, 12.31%, 12.77%, 12.95% and 12.22%, respectively. These returns compare to the 11.25% average annual total return of the Portfolio’s benchmark, the S&P Target Date To 2055 Index (Total Return, Unhedged, USD) during the same period. |
| | Goldman Sachs Target Date 2060 Portfolio — During the Reporting Period, the Target Date 2060 Portfolio’s Class A, Institutional, Service, Investor, Class R6 and Class R Shares generated average annual total returns of 13.12%, 13.60%, 13.02%, 13.48%, 13.62% and 12.90%, respectively. These returns compare to the 12.04% average annual total return of the Portfolio’s benchmark, the S&P Target Date To 2060 Index (Total Return, Unhedged, USD) during the same period. |
| Q | | What economic and market factors most influenced the Portfolios and the financial markets during the Reporting Period? |
| A | | During the Reporting Period, the Portfolios and the financial markets were most influenced by the spread of COVID-19, global economic growth data, central bank monetary policy and geopolitics. |
| | When the Reporting Period began in September 2019, the financial markets saw a partial reversal of the risk-off investor sentiment, or reduced risk appetite, that had emerged in August. The improvement was driven by positive developments in the U.S.-China trade dispute. On September 4th, China and the U.S. agreed to hold high-level talks in early October, with both sides seeking a conducive climate for further negotiations. The news pushed up global equities, led by Japanese stocks, with the latter also buoyed by a weaker Japanese yen. European bank stocks rallied on the trade news and improved investor risk sentiment as well as on a monetary policy easing package from the European Central Bank (“ECB”). U.S. equities also advanced, though they underperformed developed markets stocks broadly. The U.S. Federal Reserve (“Fed”) cut short-term interest rates by 25 basis points at its September policy meeting, much as the markets had expected. (A basis point is 1/100th of a percentage point.) The Fed’s dot plot, which shows rate projections of the members of the Fed’s Open Market Committee, indicated no further rate cuts in 2019. In line with the rally in global equities, emerging markets stocks were also up during September. Chinese equities, however, had a volatile month, with weaker domestic macroeconomic data dragging down Chinese risk assets. Regarding fixed income, both the 10-year U.S. Treasury yield and the 10-year German government bond yield rose approximately 17 basis points in September, rebounding from 2019 year-to-date lows in August. Within commodities, the price of West Texas Intermediate (“WTI”) crude oil dropped slightly, -1.9%, during September, a roller coaster month. Crude oil prices had risen about 15% following an attack on two of Saudi Arabia’s oil facilities and then fell back as Saudi Arabia’s oil ministry confirmed that production in those facilities would be back to normal quickly. Gold prices declined approximately 3.7% amid the rally in global equities and rise in the 10-year U.S. Treasury yield. Among currencies, the U.S. dollar was modestly weaker, while |
2
PORTFOLIO RESULTS
| | improving investor risk sentiment and the higher 10-year U.S. Treasury yield weighed on the Japanese yen, which depreciated versus the U.S. dollar during September. |
| | In the fourth quarter of 2019, investors welcomed the successful accomplishment of a “Phase One” deal in U.S.-China trade negotiations. This milestone, accompanied by the Fed’s ongoing accommodative stance, helped propel the U.S. stock market to all-time record highs by calendar year-end. Fed policymakers cut short-term interest rates another 25 basis points during October and signaled they were likely to remain on hold through 2020 unless macroeconomic data deteriorated further. Global equities broadly rallied during the fourth calendar quarter, with emerging markets equities leading the pack, supported by somewhat diminished geopolitical uncertainty and signs of stabilization in global economic growth. The MSCI ACWI Investable Market Index, representing global equities, rose 8.3%, while the MSCI Emerging Markets Index, representing emerging markets stocks, was up 11.9%. In fixed income, the 10-year U.S. Treasury yield increased during the quarter, despite the 25 basis point interest rate cut by the Fed, as investors pivoted toward equities on the back of better global economic data and the announcement of the U.S.-China “Phase One” deal. Crude oil prices generally benefited from the decision of the Organization of the Petroleum Exporting Countries (“OPEC”) to deepen production cuts. |
| | The rather stable pro-growth outlook for the U.S. and global economies at 2019 year-end shifted to a much more challenging and uncertain situation in the first quarter of 2020. Twin shocks — the COVID-19 pandemic and collapsing crude oil prices — forced investors to recalibrate their risk tolerance. A historic level of market volatility, including the quickest transition from an equity bull market to an equity bear market in modern financial market times, further clouded the near-term investing outlook. (A bull market is a market in which securities prices are rising. A bear market is a condition in which securities prices fall 20% or more from recent highs amid widespread pessimism and negative investor sentiment.) As fear spread through the financial markets, risk assets broadly sold off. Global equities, as represented by the MSCI ACWI Investable Market Index, fell 21.0% during the first calendar quarter. Developed markets equities, as represented by the MSCI World Index, were down 19.7% and emerging markets equities, as represented by the MSCI Emerging Markets Index, were down 23.6%. Within developed markets, U.S. equities, as measured by the S&P 500 ® Index, dropped 19.6%, Eurozone equities, as measured by the EURO STOXX 50®, fell 25.3%, and Japanese equities, as represented by TOPIX, declined 17.5%. Within fixed income, the 10-year U.S. Treasury yield plummeted. In response to the economic and financial challenges wrought by the spread of COVID-19, central banks and governments around the world enacted unprecedented levels of monetary and fiscal stimulus. In the U.S., more than $2 trillion of fiscal support, combined with the return of the Fed’s zero interest rate policy, sought to help the country weather the human and economic maelstrom while simultaneously laying the foundation for economic recovery once COVID-19 risks recede. |
| | The fastest quarterly decline in the global equity market since the fourth quarter of 2008 was followed in the second quarter of 2020 by the fastest recovery since the fourth quarter of 1984. The recovery was mainly catalyzed by three factors. First, unprecedented monetary easing and fiscal stimulus globally provided a backstop for risk assets and eased liquidity concerns. The Fed was somewhat more dovish than market expected at its June meeting. (Dovish tends to suggest lower interest rates; opposite of hawkish.) Meanwhile, the European Union announced a €750 billion recovery fund, taking a step closer towards the fiscal integration of the Eurozone. China and Japan also delivered meaningful fiscal action. Second, starting mid-April 2020, the growth rate of new COVID-19 cases showed signs of flattening in hotspots such as the U.S., Europe and China, with daily growth rates falling to low single digits and recovery rates starting to rise. As a result, authorities relaxed lockdown restrictions, gradually re-opened parts of their economies and announced social distancing norms and increased testing. The narrative shifted from COVID-19 infections to therapeutics and vaccines. Third, certain economic indicators started to recover. These included global purchasing manager indices, which inched up; U.S. non-farm payrolls, which provided consecutive positive surprises; and consumer and business sentiment that appeared to be bottoming. Global equities, as represented by the MSCI ACWI Investable Market Index, rose 19.3%. U.S. equities, as measured by the S&P 500® Index, rose 20.5%. Developed markets equities, as represented by the MSCI World Index, and emerging markets equities, as represented by the MSCI Emerging Markets Index, were up approximately 18.7% and 18.2%, respectively. As for fixed income, the 10-year U.S. Treasury yield edged down slightly in its smallest quarterly change on record. |
| | July 2020 was a good month for risk assets. Accommodative monetary policy from major central banks, coupled with |
3
PORTFOLIO RESULTS
| | improving macroeconomic data, was supportive for asset prices and also helped depress financial market volatility. During the month, COVID-19 infection rates fell in many parts of the U.S. compared to their early July peaks, though upticks in a few states meant the reopening of the U.S. economy was uneven. Meanwhile, improvement in the labor market appeared to stall. Both the Fed and the ECB kept interest rates unchanged in July and continued to signal that monetary policy would remain accommodative for a long time. Fed chair Jerome Powell stated that “fundamentally the virus was a disinflationary shock,” and the U.S. economy needed further fiscal support. For the month, developed markets equities, as represented by the MSCI World Index, and emerging markets equities, as represented by the MSCI Emerging Markets Index, were up 3.4% and 8.2% respectively. Within developed markets equities, U.S. stocks, as measured by the S&P 500® Index, rose 5.4%, whereas Eurozone stocks, as measured by the EURO STOXX 50®, declined 1.6%. Japanese stocks, as represented by TOPIX, were the laggards, falling 4%, as a stronger Japanese yen weighed on export-oriented Japanese equities. In fixed income, the 10-year U.S. Treasury yield and the 10-year German government bond yield fell 12 basis points and seven basis points, respectively. As for commodities, July was silver’s strongest month since December 1979, as prices rallied approximately 34%. Gold prices rose 10.9%, generating their biggest monthly gain since February 2016, helped by U.S. dollar weakness. Other commodities also performed well, with copper up 5.7%, Brent crude oil up 5.2% and WTI crude oil up 2.5%. The broader commodity sector, as represented by the S&P GSCI Index, gained 4.1%, benefiting from the reopening of the global economy and firmer investor risk sentiment. As for currencies, the U.S. dollar weakened amid lower U.S. real yields and improving macroeconomic data in China and the Eurozone. The euro and Japanese yen were up versus the U.S. dollar as were emerging markets currencies broadly. |
| | In August 2020, risk assets powered ahead, led by U.S. equities. U.S. economic activity continued to normalize somewhat following the COVID-19 shock, which, coupled with strong fiscal and monetary support from global policymakers, supported risk assets broadly. U.S. corporations reported better than consensus expected second quarter earnings, driving U.S. equities higher. Regarding U.S. monetary policy, Fed Chair Powell’s speech at the annual Jackson Hole symposium indicated the Fed planned to shift to average inflation targeting, i.e., to allow inflation to rise above the Fed’s existing 2% target to compensate for a period when inflation is below 2%. Within the global equity markets, developed markets stocks, as measured by the MSCI World Index, and emerging markets stocks, as measured by the MSCI Emerging Markets Index, were up 6.3% and 2.1% respectively. Within developed markets equities, U.S. equities experienced their best month since 1986, with the S&P 500® Index and the NASDAQ Composite Index rising 7.01% and 9.59%, respectively. Eurozone equities, as represented by the EURO STOXX 50®, which rose 3.2%, lagged developed markets equities broadly, while Japanese equities, as represented by TOPIX, rallied 7.3%. In fixed income, 10-year U.S. Treasury and German government bond yields were up 15 basis points and 13 basis points, respectively. Within commodities, WTI crude oil and copper prices rose 5.8% and 6.4%, respectively. Gold prices were almost flat, while silver prices rose approximately 16%. In currencies, the U.S. dollar weakened as U.S. real yields fell and investor risk sentiment strengthened. |
| Q | | What key factors were responsible for the Portfolios’ performance during the Reporting Period? |
| A | | The GPS Team evaluates and develops global macro investment views across a broad range of asset classes, regions and sectors to establish the Portfolios’ respective strategic asset allocations. We seek to incorporate macroeconomic data and valuation analysis to assess market dislocations that may produce alpha, or value-added, opportunities or manage risk. To adapt to changing market conditions, we also use a dynamic asset allocation process that allows the flexibility to increase or decrease asset class exposures relative to each Portfolio’s glide path based on macro and market views and managed within a set tactical allocation range. The percentage of the Portfolios exposed to any asset class or geographic region will vary from time to time based on our macro and market views. |
| | In general, the Portfolios seek to achieve their investment objective by investing in shares of exchange-traded funds (“ETFs”) for which Goldman Sachs Asset Management, L.P. (“GSAM”) or an affiliate now or in the future acts as investment adviser or principal underwriter, and may also invest in mutual funds for which GSAM or an affiliate now or in the future acts as investment adviser or principal underwriter, as well as unaffiliated ETFs and mutual funds (collectively, the “Underlying Funds”), without considering or canvassing the universe of unaffiliated funds available. |
4
PORTFOLIO RESULTS
| | | During the Reporting Period, all of the Portfolios recorded positive absolute returns and generally outperformed their respective benchmarks. These positive results were driven by strategic asset allocation, mainly the Portfolios’ broad equity exposure, as equities outperformed fixed income during the Reporting Period. Longer-dated Portfolios, which have comparatively greater equity allocations, outperformed shorter-dated Portfolios. Dynamic asset allocation detracted from the Portfolios’ returns, particularly a dynamic view to reduce equity risk by underweighting U.S. large-cap equities in the first two and a half months of the Reporting Period. |
| Q | | How did the Portfolios’ asset allocations affect performance during the Reporting Period? |
| A | In terms of strategic allocations, equities were strong drivers of the Portfolios’ positive returns. Many of the gains came during the second quarter of 2020 when equity markets rallied strongly after a sell-off in the first calendar quarter on the back of the twin shocks of the COVID-19 pandemic and the collapse in global crude oil prices. |
| | Within equities, the Portfolios were helped by their allocations to U.S. large-cap stocks, which posted positive returns during the Reporting Period overall. U.S. large-cap stocks benefited from the remarkable rally that began in the second quarter of 2020, following powerful combined monetary and fiscal stimulus and the beginning of economic reopening. For similar reasons, the Portfolios’ allocations to non-U.S. developed markets equities across the capitalization spectrum bolstered performance. In addition, the Portfolios benefited from allocations to emerging markets equities, which underperformed developed markets stocks but still generated positive returns on news about the U.S.-China “Phase One” trade deal in December 2019, the strong rebound following the first calendar quarter sell-off and the economic reopening of most emerging markets countries. Allocations to U.S. small-cap stocks, which performed well despite their underperformance versus U.S. large-cap equities, contributed positively. Conversely, allocations to U.S. public real estate securities and global infrastructure securities detracted from the Portfolios’ returns, as these assets struggled to recover after a steep decline in the first quarter of 2020. |
| | Within fixed income, strong performance was seen in U.S. corporate credit, specifically in investment grade corporate bonds and longer maturity corporate bonds broadly, as the Fed provided substantial support through its corporate bond purchase programs. Allocations to U.S. Treasury inflation protected securities (“TIPS”) and U.S. high yield corporate bonds also generated gains. However, non-U.S. fixed income, including developed markets bonds and local emerging markets debt, detracted from the Portfolios’ returns. |
| | Dynamic asset allocation detracted overall from the Portfolios’ performance during the Reporting Period. These results were primarily due to our decision to maintain lower allocations to equities than the Portfolios’ respective glide paths and benchmarks implied. In June 2019, we had added a dynamic view to reduce the Portfolio’s equity risk, which was expressed through underweight positions in U.S. large-cap equities. This positioning hurt the Portfolios’ performance in the early part of the Reporting Period, as U.S. large-cap stocks posted strong gains. We removed this dynamic view in mid-November 2019. |
| Q | | How did the Portfolios’ Underlying Funds perform during the Reporting Period? |
| A | | During the Reporting Period, most of the Portfolios’ Underlying Funds generated positive absolute returns, led by the equity-related Underlying Funds. |
| | Among those equity-related Underlying Funds, the strongest performer was the Goldman Sachs ActiveBeta® U.S. Large Cap Equity ETF, followed by the iShares® MSCI EAFE Small Cap ETF and the Goldman Sachs ActiveBeta® Emerging Markets Equity ETF. The Goldman Sachs ActiveBeta® International Equity ETF and the Goldman Sachs ActiveBeta® U.S. Small Cap Equity ETF also generated positive returns. The iShares® Global Infrastructure ETF and the Vanguard U.S. Real Estate ETF posted negative returns during the Reporting Period. |
| | Among the Portfolios’ fixed income-related Underlying Funds, the Goldman Sachs Access Inflation Protected USD Bond ETF and the Goldman Sachs Access Investment Grade Corporate Bond ETF were the strongest performers. The Vanguard Long-Term Corporate Bond ETF and iShares® Core U.S. Aggregate Bond ETF also posted strongly positive returns. The Vanguard Total International Bond ETF and the iShares® Emerging Markets Local Currency ETF delivered negative returns during the Reporting Period. We eliminated the Portfolios’ exposure to the Vanguard Total International Bond ETF in December 2019. |
| Q | | How did the Portfolios use derivatives and similar instruments during the Reporting Period? |
| A | | During the Reporting Period, the Portfolios used Russell 2000® Index futures and S&P 500® Index futures to replicate |
5
PORTFOLIO RESULTS
| | exposure to U.S. small- and large-cap equities. The use of Russell 2000® Index futures and S&P 500® Index futures had a positive impact on the Portfolios’ performance during the Reporting Period. |
| Q | | What changes did you make to the Portfolios’ allocations during the Reporting Period? |
| A | | In June 2019, before the Reporting Period began, we made a risk management move to reduce the Portfolios’ equity risk by reducing exposure to the Goldman Sachs ActiveBeta® U.S. Large Cap Equity ETF. By November 2019, we increased equity risk, as we thought it was too early to position the Portfolios for a recession and expected U.S. large-cap equities to perform strongly. |
| | Near the end of December 2019, we made a number of changes to the Portfolios’ strategic asset allocation. Within equities, we increased the Portfolios’ exposure to developed large-cap equities and reduced their exposures to emerging markets equities and small-cap stocks. We believed there was a low chance of a recession in 2020 and expected developed large-cap equities to continue producing positive returns. Within real assets, we reduced the Portfolios’ exposure to the Vanguard Real Estate ETF and added exposure to a new Underlying Fund, the iShares® Global Infrastructure ETF, to increase the Portfolios’ diversification. Within fixed income, we increased the Portfolios’ exposure to U.S. dollar-denominated and local emerging markets debt. As mentioned previously, we eliminated exposure to the Vanguard Total International Bond ETF. At the same time, we increased exposure to the Vanguard Long-Term Corporate Bond ETF. We also increased the Portfolios’ exposures to TIPS, changing the implementation of this strategic allocation from the iShares® TIPS Bond ETF to the Goldman Sachs Access Inflation Protected USD Bond ETF. |
| | During March 2020, as the financial markets experienced increased levels of volatility and risk assets sold off due to the COVID-19 pandemic, our view was that the Portfolios should be allowed to drift to an underweight in equities. In the second quarter of 2020, we started to gradually increase the Portfolios’ equity risk. |
| | On June 30, 2020, we added the Goldman Sachs MarketBeta® U.S. Equity ETF as a new Underlying Fund in certain Portfolios to diversify their exposure to U.S. large-cap equities. |
| Q | | What is the Portfolios’ tactical view and strategy for the months ahead? |
| A | | At the end of the Reporting Period, there was substantial uncertainty about 1) the path of the COVID-19 pandemic, 2) the degree of medium-term damage to the global economy, and 3) the willingness of investors to continue looking at economic weakness as something temporary. That being said, we have heard positive news on all three fronts since risk assets sold off in March 2020. For example, while the COVID-19 epidemic is still spreading, evidence from Asia and Europe suggests it is possible to normalize a large part of economic activity while keeping the virus in check. Overall, we have seen a fast turnaround in global economic activity since the spring, which we believe supported the rally in risk assets during the Reporting Period. |
| | In terms of positioning, the Portfolios were near their long-term strategic allocation to risk assets at the end of the Reporting Period. If the economic recovery resumes at a fast pace, we think market dynamics suggest further upside. However, risks from the COVID-19 pandemic remain, valuations are high, in our view, and persistently high levels of initial unemployment claims indicate the global economy may experience a slower than consensus expected economic adjustment to the COVID-19 shock. |
| | At the asset class level, we think equities offer an elevated risk premium and see potential for further gains if the swift economic recovery seen toward the end of the Reporting Period continues. We are balancing this view against what we see as high equity valuations and meaningful downside risk if the three areas of uncertainty mentioned earlier are resolved less than favorably. As for corporate credit, it benefited strongly from the Fed’s corporate bond purchase programs during the Reporting Period. But while the improving economic growth backdrop is likely to be supportive, we worry about limited compensation for default risk, as our high yield default model indicates a 12% issuer weighted default rate for the 12 months ending August 2021. In our view, bond yields across all maturities should remain solidly anchored by the Fed’s monetary policy in the near term. |
6
FUND BASICS
Target Date Retirement Portfolio
as of August 31, 2020
| | | | | | | | |
| | TOP TEN HOLDINGS AS OF 8/31/201 |
| | | |
| | | Holding | | % of Net Assets | | | Line of Business |
| | | |
| | Goldman Sachs Access Investment Grade Corporate Bond ETF | | | 22.1 | % | | Exchange Traded Funds |
| | iShares Core U.S. Aggregate Bond ETF | | | 21.2 | | | Exchange Traded Funds |
| | Goldman Sachs ActiveBeta® U.S. Large Cap Equity ETF | | | 18.5 | | | Exchange Traded Funds |
| | Goldman Sachs ActiveBeta® International Equity ETF | | | 8.0 | | | Exchange Traded Funds |
| | Goldman Sachs Access Inflation Protected USD Bond ETF | | | 5.7 | | | Exchange Traded Funds |
| | Vanguard Long-Term Corporate Bond ETF | | | 4.2 | | | Exchange Traded Funds |
| | Goldman Sachs ActiveBeta® Emerging Markets Equity ETF | | | 3.5 | | | Exchange Traded Funds |
| | iShares JP Morgan USD Emerging Markets Bond ETF | | | 3.4 | | | Exchange Traded Funds |
| | Goldman Sachs ActiveBeta® U.S. Small Cap Equity ETF | | | 2.3 | | | Exchange Traded Funds |
| | | iShares JP Morgan EM Local Currency Bond ETF | | | 1.3 | | | Exchange Traded Funds |
| 1 | | The top 10 holdings may not be representative of the Portfolio’s future investments. The top 10 holdings exclude investments in money market funds. |
| | | | | | | | | | |
| | PORTFOLIO COMPOSITION2 | |
| | | |
| | | Holding | | As of August 31, 2020 | | | As of August 31, 2019 | |
| | | |
| | Bond Funds | | | 59.1 | % | | | 59.8 | % |
| | Stock Funds | | | 21.7 | | | | 19.0 | |
| | Foreign Stock Funds | | | 13.4 | | | | 14.9 | |
| | | Investment Companies (other than Exchange-Traded Funds) | | | 4.1 | | | | 4.2 | |
| 2 | | The Portfolio is actively managed and, as such, its composition may differ over time. The percentage shown for each fund type reflects the value of that fund type as a percentage of the Portfolio’s net assets. Figures above may not sum to 100% due to rounding and/or exclusion of other assets and liabilities. |
7
GOLDMAN SACHS TARGET DATE RETIREMENT PORTFOLIO
Performance Summary
August 31, 2020
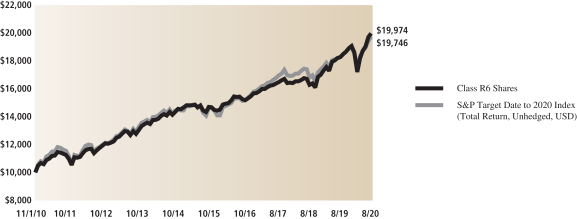
The following graph shows the value, as of August 31, 2020, of a $10,000 investment made on November 1, 2010 in Class R6 Shares. For comparative purposes, the performance of the Portfolio’s benchmark, the S&P Target Date to 2020 Index (Total Return, Unhedged, USD), is shown. Performance reflects applicable fee waivers and/or expense limitations currently in effect during the periods shown and in their absence, performance would be reduced. Returns do not reflect the deduction of taxes that a shareholder would pay on Portfolio distributions or the redemption of Portfolio shares. The returns set forth below represent past performance. Past performance does not guarantee future results. The Portfolio’s investment return and principal value will fluctuate so that an investor’s shares, when redeemed, may be worth more or less than their original cost. Current performance may be lower or higher than the performance quoted below. Please visit our web site at www.GSAMFUNDS.com to obtain the most recent month-end returns.
|
| Target Date Retirement Portfolio’s 10 Year Performance |
Performance of a $10,000 investment, with distributions reinvested, from November 1, 2010 through August 31, 2020.
| | | | | | | | | | | | |
| Average Annual Total Return through August 31, 2020* | | | One Year | | | | Five Years | | | Ten Years | | Since Inception |
Class A (Commenced August 22, 2016) | | | | | | | | | | | | |
Excluding sales charges | | | 9.25% | | | | N/A | | | N/A | | 6.10% |
Including sales charges | | | 3.28% | | | | N/A | | | N/A | | 4.64% |
|
Institutional (Commenced August 22, 2016) | | | 9.57% | | | | N/A | | | N/A | | 6.53% |
|
Service (Commenced August 22, 2016) | | | 9.09% | | | | N/A | | | N/A | | 6.00% |
|
Investor (Commenced August 22, 2016) | | | 9.46% | | | | N/A | | | N/A | | 6.39% |
|
Class R6 | | | 9.69% | | | | 6.69% | | | 7.16% | | — |
|
Class R (Commenced August 22, 2016) | | | 8.97% | | | | N/A | | | N/A | | 5.85% |
|
| * | | These returns assume reinvestment of all distributions at NAV. These returns reflect a maximum initial sales charge of 5.5% for Class A Shares. Because Institutional, Service, Investor, Class R6 and Class R Shares do not involve a sales charge, such a charge is not applied to their Average Annual Total Returns. |
Effective August 22, 2016, the Madison Target Retirement 2020 Fund (the “Predecessor Fund”) was reorganized into the Portfolio. The Portfolio has assumed the Predecessor Fund’s historical performance. The returns for the Predecessor Fund for periods prior to August 29, 2014 reflect the performance of the Madison Target Retirement 2020 Fund’s Class I Shares, a series of Ultra Series Fund (the “Ultra Predecessor Fund”). As of August 29, 2014, the inception date of the Predecessor Fund, the Ultra Predecessor Fund exchanged in kind substantially all of its portfolio holdings for Class R6 shares of the Predecessor Fund. As a result, the Predecessor Fund assumed the performance of the Ultra Predecessor Fund. Performance reflects applicable fee waivers and/or expense limitations in effect during the periods shown. Past performance does not guarantee future results, which may vary. The value of investments and the income derived from investments will fluctuate and can go down as well as up. A loss of principal may occur.
8
FUND BASICS
Target Date 2025 Portfolio
as of August 31, 2020
| | | | | | | | |
| | TOP TEN HOLDINGS AS OF 8/31/201 |
| | | |
| | | Holding | | % of Net Assets | | | Line of Business |
| | | |
| | Goldman Sachs ActiveBeta® U.S. Large Cap Equity ETF | | | 25.9 | % | | Exchange Traded Funds |
| | Goldman Sachs Access Investment Grade Corporate Bond ETF | | | 18.3 | | | Exchange Traded Funds |
| | iShares Core U.S. Aggregate Bond ETF | | | 15.7 | | | Exchange Traded Funds |
| | Goldman Sachs ActiveBeta® International Equity ETF | | | 12.3 | | | Exchange Traded Funds |
| | Goldman Sachs Access Inflation Protected USD Bond ETF | | | 5.6 | | | Exchange Traded Funds |
| | Vanguard Long-Term Corporate Bond ETF | | | 4.8 | | | Exchange Traded Funds |
| | Goldman Sachs ActiveBeta® Emerging Markets Equity ETF | | | 3.9 | | | Exchange Traded Funds |
| | iShares JP Morgan USD Emerging Markets Bond ETF | | | 3.1 | | | Exchange Traded Funds |
| | Goldman Sachs ActiveBeta® U.S. Small Cap Equity ETF | | | 2.7 | | | Exchange Traded Funds |
| | | iShares MSCI EAFE Small-Cap ETF | | | 1.4 | | | Exchange Traded Funds |
| 1 | | The top 10 holdings may not be representative of the Portfolio’s future investments. The top 10 holdings exclude investments in money market funds. |
| | | | | | | | | | |
| | PORTFOLIO COMPOSITION2 | |
| | | |
| | | Holdings | | As of August 31, 2020 | | | As of August 31, 2019 | |
| | | |
| | Bond Funds | | | 49.7 | % | | | 51.7 | % |
| | Stock Funds | | | 29.5 | | | | 25.9 | |
| | Foreign Stock Funds | | | 18.4 | | | | 19.1 | |
| | | Investment Companies (other than Exchange-Traded Funds) | | | 0.9 | | | | 1.8 | |
| 2 | | The Portfolio is actively managed and, as such, its composition may differ over time. The percentage shown for each fund type reflects the value of that fund type as a percentage of the Portfolio’s net assets. Figures above may not sum to 100% due to rounding and/or exclusion of other assets and liabilities. |
9
GOLDMAN SACHS TARGET DATE 2025 PORTFOLIO
Performance Summary
August 31, 2020
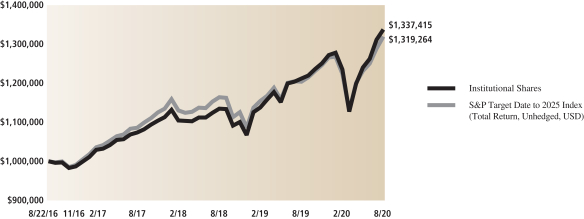
The following graph shows the value, as of August 31, 2020, of a $1,000,000 investment made on August 22, 2016 (commencement of operations) in Institutional Shares. For comparative purposes, the performance of the Portfolio’s benchmark, the S&P Target Date to 2025 Index (Total Return, Unhedged, USD), is shown. Performance reflects applicable fee waivers and/or expense limitations currently in effect during the periods shown and in their absence, performance would be reduced. Returns do not reflect the deduction of taxes that a shareholder would pay on Portfolio distributions or the redemption of Portfolio shares. The returns set forth below represent past performance. Past performance does not guarantee future results. The Portfolio’s investment return and principal value will fluctuate so that an investor’s shares, when redeemed, may be worth more or less than their original cost. Current performance may be lower or higher than the performance quoted below. Please visit our web site at www.GSAMFUNDS.com to obtain the most recent month-end returns.
|
| Target Date 2025 Portfolio’s Lifetime Performance |
Performance of a $1,000,000 investment, with distributions reinvested, from August 22, 2016 through August 31, 2020.
| | | | | | | | |
| Average Annual Total Return through August 31, 2020* | | | One Year | | | | Since Inception | |
Class A (Commenced August 22, 2016) | | | | | | | | |
Excluding sales charges | | | 9.89% | | | | 7.08% | |
Including sales charges | | | 3.85% | | | | 5.60% | |
| |
Institutional (Commenced August 22, 2016) | | | 10.34% | | | | 7.48% | |
| |
Service (Commenced August 22, 2016) | | | 9.77% | | | | 6.95% | |
| |
Investor (Commenced August 22, 2016) | | | 10.24% | | | | 7.34% | |
| |
Class R6 (Commenced August 22, 2016) | | | 10.35% | | | | 7.51% | |
| |
Class R (Commenced August 22, 2016) | | | 9.63% | | | | 6.80% | |
| |
| * | | These returns assume reinvestment of all distributions at NAV. These returns reflect a maximum initial sales charge of 5.5% for Class A Shares. Because Institutional, Service, Investor, Class R6 and Class R Shares do not involve a sales charge, such a charge is not applied to their Average Annual Total Returns. |
10
FUND BASICS
Target Date 2030 Portfolio
as of August 31, 2020
| | | | | | | | |
| | TOP TEN HOLDINGS AS OF 8/31/201 |
| | | |
| | | Holding | | % of Net Assets | | | Line of Business |
| | | |
| | Goldman Sachs ActiveBeta® U.S. Large Cap Equity ETF | | | 31.3 | % | | Exchange Traded Funds |
| | Goldman Sachs Access Investment Grade Corporate Bond ETF | | | 16.2 | | | Exchange Traded Funds |
| | Goldman Sachs ActiveBeta® International Equity ETF | | | 14.4 | | | Exchange Traded Funds |
| | iShares Core U.S. Aggregate Bond ETF | | | 10.0 | | | Exchange Traded Funds |
| | Goldman Sachs Access Inflation Protected USD Bond ETF | | | 5.8 | | | Exchange Traded Funds |
| | Vanguard Long-Term Corporate Bond ETF | | | 4.6 | | | Exchange Traded Funds |
| | Goldman Sachs ActiveBeta® Emerging Markets Equity ETF | | | 4.1 | | | Exchange Traded Funds |
| | iShares JP Morgan USD Emerging Markets Bond ETF | | | 2.9 | | | Exchange Traded Funds |
| | iShares MSCI EAFE Small-Cap ETF | | | 2.0 | | | Exchange Traded Funds |
| | | Goldman Sachs ActiveBeta® U.S. Small Cap Equity ETF | | | 1.6 | | | Exchange Traded Funds |
| 1 | | The top 10 holdings may not be representative of the Portfolio’s future investments. The top 10 holdings exclude investments in money market funds. |
| | | | | | | | | | |
| | PORTFOLIO COMPOSITION2 | |
| | | |
| | | Holding | | As of August 31, 2020 | | | As of August 31, 2019 | |
| | | |
| | Bond Funds | | | 41.9 | % | | | 43.2 | % |
| | Stock Funds | | | 33.9 | | | | 30.5 | |
| | Foreign Stock Funds | | | 21.4 | | | | 22.6 | |
| | | Investment Companies (other than Exchange-Traded Funds) | | | 1.5 | | | | 2.6 | |
| 2 | | The Portfolio is actively managed and, as such, its composition may differ over time. The percentage shown for each fund type reflects the value of that fund type as a percentage of the Portfolio’s net assets. Figures above may not sum to 100% due to rounding and/or exclusion of other assets and liabilities. |
11
GOLDMAN SACHS TARGET DATE 2030 PORTFOLIO
Performance Summary
August 31, 2020
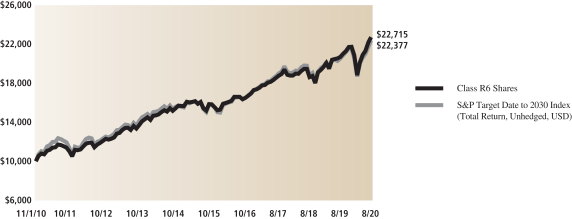
The following graph shows the value, as of August 31, 2020, of a $10,000 investment made on November 1, 2010 in Class R6 Shares. For comparative purposes, the performance of the Portfolio’s benchmark, the S&P Target Date to 2030 Index (Total Return, Unhedged, USD), is shown. Performance reflects applicable fee waivers and/or expense limitations currently in effect during the periods shown and in their absence, performance would be reduced. Returns do not reflect the deduction of taxes that a shareholder would pay on Portfolio distributions or the redemption of Portfolio shares. The returns set forth below represent past performance. Past performance does not guarantee future results. The Portfolio’s investment return and principal value will fluctuate so that an investor’s shares, when redeemed, may be worth more or less than their original cost. Current performance may be lower or higher than the performance quoted below. Please visit our web site at www.GSAMFUNDS.com to obtain the most recent month-end returns.
|
| Target Date 2030 Portfolio’s 10 Year Performance |
Performance of a $10,000 investment, with distributions reinvested, from November 1, 2010 through August 31, 2020.
| | | | | | | | | | | | |
| Average Annual Total Return through August 31, 2020* | | | One Year | | | | Five Years | | | Ten Years | | Since Inception |
Class A (Commenced August 22, 2016) | | | | | | | | | | | | |
Excluding sales charges | | | 10.04% | | | | N/A | | | N/A | | 7.54% |
Including sales charges | | | 4.05% | | | | N/A | | | N/A | | 6.03% |
|
Institutional (Commenced August 22, 2016) | | | 10.55% | | | | N/A | | | N/A | | 7.98% |
|
Service (Commenced August 22, 2016) | | | 10.01% | | | | N/A | | | N/A | | 7.45% |
|
Investor (Commenced August 22, 2016) | | | 10.34% | | | | N/A | | | N/A | | 7.79% |
|
Class R6 | | | 10.57% | | | | 8.00% | | | 8.54% | | — |
|
Class R (Commenced August 22, 2016) | | | 9.85% | | | | N/A | | | N/A | | 7.28% |
|
| * | | These returns assume reinvestment of all distributions at NAV. These returns reflect a maximum initial sales charge of 5.5% for Class A Shares. Because Institutional, Service, Investor, Class R6 and Class R Shares do not involve a sales charge, such a charge is not applied to their Average Annual Total Returns. |
Effective August 22, 2016, the Madison Target Retirement 2030 Fund (the “Predecessor Fund”) was reorganized into the Portfolio. The Portfolio has assumed the Predecessor Fund’s historical performance. The returns for the Predecessor Fund for periods prior to August 29, 2014 reflect the performance of the Madison Target Retirement 2030 Fund’s Class I Shares, a series of Ultra Series Fund (the “Ultra Predecessor Fund”). As of August 29, 2014, the inception date of the Predecessor Fund, the Ultra Predecessor Fund exchanged in kind substantially all of its portfolio holdings for Class R6 shares of the Predecessor Fund. As a result, the Predecessor Fund assumed the performance of the Ultra Predecessor Fund. Performance reflects applicable fee waivers and/or expense limitations in effect during the periods shown. Past performance does not guarantee future results, which may vary. The value of investments and the income derived from investments will fluctuate and can go down as well as up. A loss of principal may occur.
12
FUND BASICS
Target Date 2035 Portfolio
as of August 31, 2020
| | | | | | | | |
| | TOP TEN HOLDINGS AS OF 8/31/201 |
| | | |
| | | Holding | | % of Net Assets | | | Line of Business |
| | | |
| | Goldman Sachs ActiveBeta® U.S. Large Cap Equity ETF | | | 37.3 | % | | Exchange Traded Funds |
| | Goldman Sachs ActiveBeta® International Equity ETF | | | 16.9 | | | Exchange Traded Funds |
| | Goldman Sachs Access Investment Grade Corporate Bond ETF | | | 13.2 | | | Exchange Traded Funds |
| | Goldman Sachs Access Inflation Protected USD Bond ETF | | | 5.8 | | | Exchange Traded Funds |
| | Vanguard Long-Term Corporate Bond ETF | | | 4.8 | | | Exchange Traded Funds |
| | Goldman Sachs ActiveBeta® Emerging Markets Equity ETF | | | 4.7 | | | Exchange Traded Funds |
| | iShares Core U.S. Aggregate Bond ETF | | | 4.2 | | | Exchange Traded Funds |
| | iShares JP Morgan USD Emerging Markets Bond ETF | | | 3.2 | | | Exchange Traded Funds |
| | iShares MSCI EAFE Small-Cap ETF | | | 2.1 | | | Exchange Traded Funds |
| | | Goldman Sachs ActiveBeta® U.S. Small Cap Equity ETF | | | 1.4 | | | Exchange Traded Funds |
| 1 | | The top 10 holdings may not be representative of the Portfolio’s future investments. The top 10 holdings exclude investments in money market funds. |
| | | | | | | | | | |
| | PORTFOLIO COMPOSITION2 | |
| | | |
| | | Holding | | As of August 31, 2020 | | | As of August 31, 2019 | |
| | | |
| | Stock Funds | | | 39.7 | % | | | 36.9 | % |
| | Bond Funds | | | 33.5 | | | | 34.0 | |
| | Foreign Stock Funds | | | 24.6 | | | | 26.1 | |
| | | Investment Companies (other than Exchange-Traded Funds) | | | 0.7 | | | | 1.5 | |
| 2 | | The Portfolio is actively managed and, as such, its composition may differ over time. The percentage shown for each fund type reflects the value of that fund type as a percentage of the Portfolio’s net assets. Figures above may not sum to 100% due to rounding and/or exclusion of other assets and liabilities. |
13
GOLDMAN SACHS TARGET DATE 2035 PORTFOLIO
Performance Summary
August 31, 2020
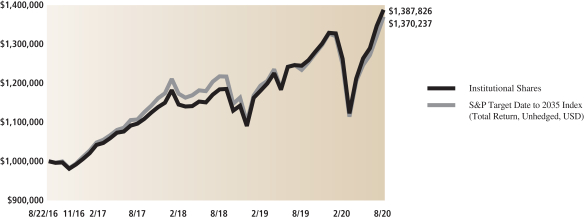
The following graph shows the value, as of August 31, 2020, of a $1,000,000 investment made on August 22, 2016 (commencement of operations) in Institutional Shares. For comparative purposes, the performance of the Portfolio’s benchmark, the S&P Target Date to 2035 Index (Total Return, Unhedged, USD), is shown. Performance reflects applicable fee waivers and/or expense limitations currently in effect during the periods shown and in their absence, performance would be reduced. Returns do not reflect the deduction of taxes that a shareholder would pay on Portfolio distributions or the redemption of Portfolio shares. The returns set forth below represent past performance. Past performance does not guarantee future results. The Portfolio’s investment return and principal value will fluctuate so that an investor’s shares, when redeemed, may be worth more or less than their original cost. Current performance may be lower or higher than the performance quoted below. Please visit our web site at www.GSAMFUNDS.com to obtain the most recent month-end returns.
|
| Target Date 2035 Portfolio’s Lifetime Performance |
Performance of a $1,000,000 investment, with distributions reinvested, from August 22, 2016 through August 31, 2020.
| | | | | | | | |
| Average Annual Total Return through August 31, 2020* | | | One Year | | | | Since Inception | |
Class A (Commenced August 22, 2016) | | | | | | | | |
Excluding sales charges | | | 11.13% | | | | 8.08% | |
Including sales charges | | | 5.03% | | | | 6.58% | |
| |
Institutional (Commenced August 22, 2016) | | | 11.44% | | | | 8.47% | |
| |
Service (Commenced August 22, 2016) | | | 10.89% | | | | 7.92% | |
| |
Investor (Commenced August 22, 2016) | | | 11.25% | | | | 8.29% | |
| |
Class R6 (Commenced August 22, 2016) | | | 11.44% | | | | 8.47% | |
| |
Class R (Commenced August 22, 2016) | | | 10.66% | | | | 7.75% | |
| |
| * | | These returns assume reinvestment of all distributions at NAV. These returns reflect a maximum initial sales charge of 5.5% for Class A Shares. Because Institutional, Service, Investor, Class R6 and Class R Shares do not involve a sales charge, such a charge is not applied to their Average Annual Total Returns. |
14
FUND BASICS
Target Date 2040 Portfolio
as of August 31, 2020
| | | | | | | | |
| | TOP TEN HOLDINGS AS OF 8/31/201 |
| | | |
| | | Holding | | % of Net Assets | | | Line of Business |
| | | |
| | Goldman Sachs ActiveBeta® U.S. Large Cap Equity ETF | | | 32.6 | % | | Exchange Traded Funds |
| | Goldman Sachs ActiveBeta® International Equity ETF | | | 19.8 | | | Exchange Traded Funds |
| | Goldman Sachs MarketBeta U.S. Equity ETF | | | 10.7 | | | Exchange Traded Funds |
| | Goldman Sachs Access Investment Grade Corporate Bond ETF | | | 7.7 | | | Exchange Traded Funds |
| | Goldman Sachs ActiveBeta® Emerging Markets Equity ETF | | | 6.0 | | | Exchange Traded Funds |
| | Vanguard Long-Term Corporate Bond ETF | | | 4.3 | | | Exchange Traded Funds |
| | Goldman Sachs Access Inflation Protected USD Bond ETF | | | 3.5 | | | Exchange Traded Funds |
| | Goldman Sachs ActiveBeta® U.S. Small Cap Equity ETF | | | 3.1 | | | Exchange Traded Funds |
| | iShares Core U.S. Aggregate Bond ETF | | | 2.4 | | | Exchange Traded Funds |
| | | iShares MSCI EAFE Small-Cap ETF | | | 2.4 | | | Exchange Traded Funds |
| 1 | | The top 10 holdings may not be representative of the Portfolio’s future investments. The top 10 holdings exclude investments in money market funds. |
| | | | | | | | | | |
| | PORTFOLIO COMPOSITION2 | |
| | | |
| | | Percentage of Net Assets | | As of August 31, 2020 | | | As of August 31, 2019 | |
| | | |
| | Stock Funds | | | 47.3 | % | | | 43.9 | % |
| | Foreign Stock Funds | | | 28.9 | | | | 30.9 | |
| | Bond Funds | | | 22.3 | | | | 21.5 | |
| | | Investment Companies (other than Exchange-Traded Funds) | | | 0.0 | | | | 2.4 | |
| 2 | | The Portfolio is actively managed and, as such, its composition may differ over time. The percentage shown for each fund type reflects the value of that fund type as a percentage of the Portfolio’s net assets. Figures above may not sum to 100% due to rounding and/or exclusion of other assets and liabilities. |
15
GOLDMAN SACHS TARGET DATE 2040 PORTFOLIO
Performance Summary
August 31, 2020
The following graph shows the value, as of August 31, 2020, of a $10,000 investment made on November 1, 2010 in Class R6 Shares. For comparative purposes, the performance of the Portfolio’s benchmark, the S&P Target Date to 2040 Index (Total Return, Unhedged, USD), is shown. Performance reflects applicable fee waivers and/or expense limitations currently in effect during the periods shown and in their absence, performance would be reduced. Returns do not reflect the deduction of taxes that a shareholder would pay on Portfolio distributions or the redemption of Portfolio shares. The returns set forth below represent past performance. Past performance does not guarantee future results. The Portfolio’s investment return and principal value will fluctuate so that an investor’s shares, when redeemed, may be worth more or less than their original cost. Current performance may be lower or higher than the performance quoted below. Please visit our web site at www.GSAMFUNDS.com to obtain the most recent month-end returns.
|
| Target Date 2040 Portfolio’s 10 Year Performance |
Performance of a $10,000 investment, with distributions reinvested, from November 1, 2010 through August 31, 2020.
| | | | | | | | | | | | |
| Average Annual Total Return through August 31, 2020* | | | One Year | | | | Five Years | | | Ten Years | | Since Inception |
Class A (Commenced August 22, 2016) | | | | | | | | | | | | |
Excluding sales charges | | | 12.04% | | | | N/A | | | N/A | | 8.38% |
Including sales charges | | | 5.88% | | | | N/A | | | N/A | | 6.87% |
|
Institutional (Commenced August 22, 2016) | | | 12.57% | | | | N/A | | | N/A | | 8.83% |
|
Service (Commenced August 22, 2016) | | | 12.00% | | | | N/A | | | N/A | | 8.28% |
|
Investor (Commenced August 22, 2016) | | | 12.35% | | | | N/A | | | N/A | | 8.66% |
|
Class R6 | | | 12.58% | | | | 8.82% | | | 9.36% | | — |
|
Class R (Commenced August 22, 2016) | | | 11.90% | | | | N/A | | | N/A | | 8.13% |
|
| * | | These returns assume reinvestment of all distributions at NAV. These returns reflect a maximum initial sales charge of 5.5% for Class A Shares. Because Institutional, Service, Investor, Class R6 and Class R Shares do not involve a sales charge, such a charge is not applied to their Average Annual Total Returns. |
Effective August 22, 2016, the Madison Target Retirement 2040 Fund (the “Predecessor Fund”) was reorganized into the Portfolio. The Portfolio has assumed the Predecessor Fund’s historical performance. The returns for the Predecessor Fund for periods prior to August 29, 2014 reflect the performance of the Madison Target Retirement 2040 Fund’s Class I Shares, a series of Ultra Series Fund (the “Ultra Predecessor Fund”). As of August 29, 2014, the inception date of the Predecessor Fund, the Ultra Predecessor Fund exchanged in kind substantially all of its portfolio holdings for Class R6 shares of the Predecessor Fund. As a result, the Predecessor Fund assumed the performance of the Ultra Predecessor Fund. Performance reflects applicable fee waivers and/or expense limitations in effect during the periods shown. Past performance does not guarantee future results, which may vary. The value of investments and the income derived from investments will fluctuate and can go down as well as up. A loss of principal may occur.
16
FUND BASICS
Target Date 2045 Portfolio
as of August 31, 2020
| | | | | | | | |
| | TOP TEN HOLDINGS AS OF 8/31/201 |
| | | |
| | | Holding | | % of Net Assets | | | Line of Business |
| | | |
| | Goldman Sachs ActiveBeta® U.S. Large Cap Equity ETF | | | 35.7 | % | | Exchange Traded Funds |
| | Goldman Sachs ActiveBeta® International Equity ETF | | | 22.9 | | | Exchange Traded Funds |
| | Goldman Sachs MarketBeta U.S. Equity ETF | | | 12.6 | | | Exchange Traded Funds |
| | Goldman Sachs ActiveBeta® Emerging Markets Equity ETF | | | 7.9 | | | Exchange Traded Funds |
| | Goldman Sachs ActiveBeta® U.S. Small Cap Equity ETF | | | 3.9 | | | Exchange Traded Funds |
| | Vanguard Long-Term Corporate Bond ETF | | | 3.7 | | | Exchange Traded Funds |
| | iShares MSCI EAFE Small-Cap ETF | | | 3.1 | | | Exchange Traded Funds |
| | iShares JP Morgan USD Emerging Markets Bond ETF | | | 1.9 | | | Exchange Traded Funds |
| | Goldman Sachs Access High Yield Corporate Bond ETF | | | 1.9 | | | Exchange Traded Funds |
| | | Vanguard Real Estate ETF | | | 1.0 | | | Exchange Traded Funds |
| 1 | | The top 10 holdings may not be representative of the Portfolio’s future investments. The top 10 holdings exclude investments in money market funds. |
| | | | | | | | | | |
| | PORTFOLIO COMPOSITION2 | |
| | | |
| | | Percentage of Net Assets | | As of August 31, 2020 | | | As of August 31, 2019 | |
| | | |
| | Stock Funds | | | 53.2 | % | | | 50.3 | % |
| | Foreign Stock Funds | | | 34.7 | | | | 35.9 | |
| | Bond Funds | | | 9.3 | | | | 8.1 | |
| | | Investment Companies (other than Exchange-Traded Funds) | | | 1.1 | | | | 4.0 | |
| 2 | | The Portfolio is actively managed and, as such, its composition may differ over time. The percentage shown for each fund type reflects the value of that fund type as a percentage of the Portfolio’s net assets. Figures above may not sum to 100% due to rounding and/or exclusion of other assets and liabilities. |
17
GOLDMAN SACHS TARGET DATE 2045 PORTFOLIO
Performance Summary
August 31, 2020
The following graph shows the value, as of August 31, 2020, of a $1,000,000 investment made on August 22, 2016 (commencement of operations) in Institutional Shares. For comparative purposes, the performance of the Portfolio’s benchmark, the S&P Target Date to 2045 Index (Total Return, Unhedged, USD), is shown. Performance reflects applicable fee waivers and/or expense limitations currently in effect during the periods shown and in their absence, performance would be reduced. Returns do not reflect the deduction of taxes that a shareholder would pay on Portfolio distributions or the redemption of Portfolio shares. The returns set forth below represent past performance. Past performance does not guarantee future results. The Portfolio’s investment return and principal value will fluctuate so that an investor’s shares, when redeemed, may be worth more or less than their original cost. Current performance may be lower or higher than the performance quoted below. Please visit our web site at www.GSAMFUNDS.com to obtain the most recent month-end returns.
|
| Target Date 2045 Portfolio’s Lifetime Performance |
Performance of a $1,000,000 investment, with distributions reinvested, from August 22, 2016 through August 31, 2020.
| | | | | | | | |
| Average Annual Total Return through August 31, 2020* | | | One Year | | | | Since Inception | |
Class A (Commenced August 22, 2016) | | | | | | | | |
Excluding sales charges | | | 12.26% | | | | 8.51% | |
Including sales charges | | | 6.12% | | | | 7.00% | |
| |
Institutional (Commenced August 22, 2016) | | | 12.63% | | | | 8.92% | |
| |
Service (Commenced August 22, 2016) | | | 12.18% | | | | 8.40% | |
| |
Investor (Commenced August 22, 2016) | | | 12.55% | | | | 8.79% | |
| |
Class R6 (Commenced August 22, 2016) | | | 12.74% | | | | 8.95% | |
| |
Class R (Commenced August 22, 2016) | | | 12.05% | | | | 8.25% | |
| |
| * | | These returns assume reinvestment of all distributions at NAV. These returns reflect a maximum initial sales charge of 5.5% for Class A Shares. Because Institutional, Service, Investor, Class R6 and Class R Shares do not involve a sales charge, such a charge is not applied to their Average Annual Total Returns. |
18
FUND BASICS
Target Date 2050 Portfolio
as of August 31, 2020
| | | | | | | | |
| | TOP TEN HOLDINGS AS OF 8/31/201 |
| | | |
| | | Holding | | % of Net Assets | | | Line of Business |
| | | |
| | Goldman Sachs ActiveBeta® U.S. Large Cap Equity ETF | | | 36.0 | % | | Exchange Traded Funds |
| | Goldman Sachs ActiveBeta® International Equity ETF | | | 23.4 | | | Exchange Traded Funds |
| | Goldman Sachs MarketBeta U.S. Equity ETF | | | 12.8 | | | Exchange Traded Funds |
| | Goldman Sachs ActiveBeta® Emerging Markets Equity ETF | | | 8.0 | | | Exchange Traded Funds |
| | Goldman Sachs ActiveBeta® U.S. Small Cap Equity ETF | | | 3.7 | | | Exchange Traded Funds |
| | Vanguard Long-Term Corporate Bond ETF | | | 3.6 | | | Exchange Traded Funds |
| | iShares MSCI EAFE Small-Cap ETF | | | 3.1 | | | Exchange Traded Funds |
| | Goldman Sachs Access High Yield Corporate Bond ETF | | | 1.9 | | | Exchange Traded Funds |
| | iShares JP Morgan USD Emerging Markets Bond ETF | | | 1.5 | | | Exchange Traded Funds |
| | | Vanguard Real Estate ETF | | | 1.0 | | | Exchange Traded Funds |
| 1 | | The top 10 holdings may not be representative of the Portfolio’s future investments. The top 10 holdings exclude investments in money market funds. |
| | | | | | | | | | |
| | PORTFOLIO COMPOSITION2 | |
| | | |
| | | Percentage of Net Assets | | As of August 31, 2020 | | | As of August 31, 2019 | |
| | | |
| | Stock Funds | | | 53.5 | % | | | 49.8 | % |
| | Foreign Stock Funds | | | 35.4 | | | | 36.1 | |
| | Bond Funds | | | 7.9 | | | | 8.0 | |
| | | Investment Companies (other than Exchange-Traded Funds) | | | 1.5 | | | | 4.5 | |
| 2 | | The Portfolio is actively managed and, as such, its composition may differ over time. The percentage shown for each fund type reflects the value of that fund type as a percentage of the Portfolio’s net assets. Figures above may not sum to 100% due to rounding and/or exclusion of other assets and liabilities. |
19
GOLDMAN SACHS TARGET DATE 2050 PORTFOLIO
Performance Summary
August 31, 2020
The following graph shows the value, as of August 31, 2020, of a $10,000 investment made on January 3, 2011 (commencement of operations of the Ultra Predecessor Fund) in Class R6 Shares. For comparative purposes, the performance of the Portfolio’s benchmark, the S&P Target Date to 2050 Index (Total Return, Unhedged, USD), is shown. Performance reflects applicable fee waivers and/or expense limitations currently in effect during the periods shown and in their absence, performance would be reduced. Returns do not reflect the deduction of taxes that a shareholder would pay on Portfolio distributions or the redemption of Portfolio shares. The returns set forth below represent past performance. Past performance does not guarantee future results. The Portfolio’s investment return and principal value will fluctuate so that an investor’s shares, when redeemed, may be worth more or less than their original cost. Current performance may be lower or higher than the performance quoted below. Please visit our web site at www.GSAMFUNDS.com to obtain the most recent month-end returns.
|
| Target Date 2050 Portfolio’s Lifetime Performance |
Performance of a $10,000 investment, with distributions reinvested, from January 3, 2011 through August 31, 2020.
| | | | | | | | | | |
| Average Annual Total Return through August 31, 2020* | | | One Year | | | | Five Years | | | Since Inception |
Class A (Commenced August 22, 2016) | | | | | | | | | | |
Excluding sales charges | | | 12.42% | | | | N/A | | | 8.73% |
Including sales charges | | | 6.25% | | | | N/A | | | 7.22% |
|
Institutional (Commenced August 22, 2016) | | | 12.88% | | | | N/A | | | 9.15% |
|
Service (Commenced August 22, 2016) | | | 12.33% | | | | N/A | | | 8.61% |
|
Investor (Commenced August 22, 2016) | | | 12.68% | | | | N/A | | | 9.00% |
|
Class R6 (Commenced January 3, 2011) | | | 13.01% | | | | 9.21% | | | 8.72% |
|
Class R (Commenced August 22, 2016) | | | 12.22% | | | | N/A | | | 8.47% |
|
| * | | These returns assume reinvestment of all distributions at NAV. These returns reflect a maximum initial sales charge of 5.5% for Class A Shares. Because Institutional, Service, Investor, Class R6 and Class R Shares do not involve a sales charge, such a charge is not applied to their Average Annual Total Returns. |
Effective August 22, 2016, the Madison Target Retirement 2050 Fund (the “Predecessor Fund”) was reorganized into the Portfolio. The Portfolio has assumed the Predecessor Fund’s historical performance. The returns for the Predecessor Fund for periods prior to August 29, 2014 reflect the performance of the Madison Target Retirement 2050 Fund’s Class I Shares, a series of Ultra Series Fund (the “Ultra Predecessor Fund”). As of August 29, 2014, the inception date of the Predecessor Fund, the Ultra Predecessor Fund exchanged in kind substantially all of its portfolio holdings for Class R6 shares of the Predecessor Fund. As a result, the Predecessor Fund assumed the performance of the Ultra Predecessor Fund. Performance reflects applicable fee waivers and/or expense limitations in effect during the periods shown. Past performance does not guarantee future results, which may vary. The value of investments and the income derived from investments will fluctuate and can go down as well as up. A loss of principal may occur.
20
FUND BASICS
Target Date 2055 Portfolio
as of August 31, 2020
| | | | | | | | |
| | TOP TEN HOLDINGS AS OF 8/31/201 |
| | | |
| | | Holding | | % of Net Assets | | | Line of Business |
| | | |
| | Goldman Sachs ActiveBeta® U.S. Large Cap Equity ETF | | | 35.6 | % | | Exchange Traded Funds |
| | Goldman Sachs ActiveBeta® International Equity ETF | | | 23.3 | | | Exchange Traded Funds |
| | Goldman Sachs MarketBeta U.S. Equity ETF | | | 12.8 | | | Exchange Traded Funds |
| | Goldman Sachs ActiveBeta® Emerging Markets Equity ETF | | | 8.1 | | | Exchange Traded Funds |
| | Goldman Sachs ActiveBeta® U.S. Small Cap Equity ETF | | | 4.1 | | | Exchange Traded Funds |
| | Vanguard Long-Term Corporate Bond ETF | | | 3.7 | | | Exchange Traded Funds |
| | iShares MSCI EAFE Small-Cap ETF | | | 3.0 | | | Exchange Traded Funds |
| | iShares JP Morgan USD Emerging Markets Bond ETF | | | 1.9 | | | Exchange Traded Funds |
| | Goldman Sachs Access High Yield Corporate Bond ETF | | | 1.8 | | | Exchange Traded Funds |
| | | Vanguard Real Estate ETF | | | 0.9 | | | Exchange Traded Funds |
| 1 | | The top 10 holdings may not be representative of the Portfolio’s future investments. The top 10 holdings exclude investments in money market funds. |
| | | | | | | | | | |
| | PORTFOLIO COMPOSITION2 | |
| | | |
| | | Holding | | As of August 31, 2020 | | | As of August 31, 2019 | |
| | | |
| | Stock Funds | | | 53.4 | % | | | 49.8 | % |
| | Foreign Stock Funds | | | 35.2 | | | | 36.2 | |
| | Bond Funds | | | 8.1 | | | | 8.2 | |
| | | Investment Companies (other than Exchange-Traded Funds) | | | 1.6 | | | | 4.1 | |
| 2 | | The Portfolio is actively managed and, as such, its composition may differ over time. The percentage shown for each fund type reflects the value of that fund type as a percentage of the Portfolio’s net assets. Figures above may not sum to 100% due to rounding and/or exclusion of other assets and liabilities. |
21
GOLDMAN SACHS TARGET DATE 2055 PORTFOLIO
Performance Summary
August 31, 2020
The following graph shows the value, as of August 31, 2020, of a $1,000,000 investment made on August 22, 2016 (commencement of operations) in Institutional Shares. For comparative purposes, the performance of the Portfolio’s benchmark, the S&P Target Date to 2055 Index (Total Return, Unhedged, USD), is shown. Performance reflects applicable fee waivers and/or expense limitations currently in effect during the periods shown and in their absence, performance would be reduced. Returns do not reflect the deduction of taxes that a shareholder would pay on Portfolio distributions or the redemption of Portfolio shares. The returns set forth below represent past performance. Past performance does not guarantee future results. The Portfolio’s investment return and principal value will fluctuate so that an investor’s shares, when redeemed, may be worth more or less than their original cost. Current performance may be lower or higher than the performance quoted below. Please visit our web site at www.GSAMFUNDS.com to obtain the most recent month-end returns.
|
| Target Date 2055 Portfolio’s Lifetime Performance |
Performance of a $1,000,000 investment, with distributions reinvested, from August 22, 2016 through August 31, 2020.
| | | | | | | | |
| Average Annual Total Return through August 31, 2020* | | | One Year | | | | Since Inception | |
Class A (Commenced August 22, 2016) | | | | | | | | |
Excluding sales charges | | | 12.61% | | | | 9.05% | |
Including sales charges | | | 6.38% | | | | 7.54% | |
| |
Institutional (Commenced August 22, 2016) | | | 12.96% | | | | 9.47% | |
| |
Service (Commenced August 22, 2016) | | | 12.31% | | | | 8.92% | |
| |
Investor (Commenced August 22, 2016) | | | 12.77% | | | | 9.31% | |
| |
Class R6 (Commenced August 22, 2016) | | | 12.95% | | | | 9.49% | |
| |
Class R (Commenced August 22, 2016) | | | 12.22% | | | | 8.78% | |
| |
| * | | These returns assume reinvestment of all distributions at NAV. These returns reflect a maximum initial sales charge of 5.5% for Class A Shares. Because Institutional, Service, Investor, Class R6 and Class R Shares do not involve a sales charge, such a charge is not applied to their Average Annual Total Returns. |
22
FUND BASICS
Target Date 2060 Portfolio
as of August 31, 2020
| | | | | | | | |
| | TOP TEN HOLDINGS AS OF 8/31/201 |
| | | |
| | | Holding | | % of Net Assets | | | Line of Business |
| | | |
| | Goldman Sachs ActiveBeta® U.S. Large Cap Equity ETF | | | 36.9 | % | | Exchange Traded Funds |
| | Goldman Sachs ActiveBeta® International Equity ETF | | | 23.3 | | | Exchange Traded Funds |
| | Goldman Sachs MarketBeta U.S. Equity ETF | | | 12.8 | | | Exchange Traded Funds |
| | Goldman Sachs ActiveBeta® Emerging Markets Equity ETF | | | 7.7 | | | Exchange Traded Funds |
| | Goldman Sachs ActiveBeta® U.S. Small Cap Equity ETF | | | 4.1 | | | Exchange Traded Funds |
| | Vanguard Long-Term Corporate Bond ETF | | | 3.7 | | | Exchange Traded Funds |
| | iShares MSCI EAFE Small-Cap ETF | | | 2.8 | | | Exchange Traded Funds |
| | iShares JP Morgan USD Emerging Markets Bond ETF | | | 1.7 | | | Exchange Traded Funds |
| | Goldman Sachs Access High Yield Corporate Bond ETF | | | 1.7 | | | Exchange Traded Funds |
| | | Vanguard Real Estate ETF | | | 0.9 | | | Exchange Traded Funds |
| 1 | | The top 10 holdings may not be representative of the Portfolio’s future investments. The top 10 holdings exclude investments in money market funds. |
| | | | | | | | | | |
| | PORTFOLIO COMPOSITION2 | |
| | | |
| | | Holdings | | As of August 31, 2020 | | | As of August 31, 2019 | |
| | | |
| | Stock Funds | | | 54.7 | % | | | 50.3 | % |
| | Foreign Stock Funds | | | 34.5 | | | | 36.0 | |
| | Bond Funds | | | 7.8 | | | | 8.1 | |
| | | Investment Companies (other than Exchange-Traded Funds) | | | 1.6 | | | | 4.3 | |
| 2 | | The Portfolio is actively managed and, as such, its composition may differ over time. The percentage shown for each fund type reflects the value of that fund type as a percentage of the Portfolio’s net assets. Figures above may not sum to 100% due to rounding and/or exclusion of other assets and liabilities. |
23
GOLDMAN SACHS TARGET DATE 2060 PORTFOLIO
Performance Summary
August 31, 2020
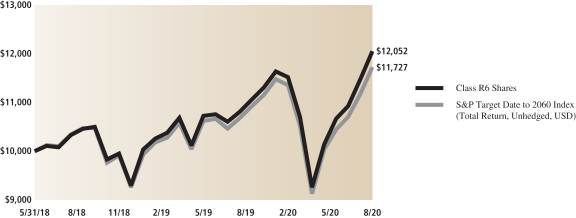
The following graph shows the value, as of August 31, 2020, of a $10,000 investment made on (commencement of operations) in Class R6 Shares. For comparative purposes, the performance of the Portfolio’s benchmark, the S&P Target Date to 2060 Index (Total Return, Unhedged, USD), is shown. Performance reflects applicable fee waivers and/or expense limitations currently in effect during the periods shown and in their absence, performance would be reduced. Returns do not reflect the deduction of taxes that a shareholder would pay on Portfolio distributions or the redemption of Portfolio shares. The returns set forth below represent past performance. Past performance does not guarantee future results. The Portfolio’s investment return and principal value will fluctuate so that an investor’s shares, when redeemed, may be worth more or less than their original cost. Current performance may be lower or higher than the performance quoted below. Please visit our web site at www.GSAMFUNDS.com to obtain the most recent month-end returns.
|
| Target Date 2060 Portfolio’s Lifetime Performance |
Performance of a $10,000 investment, with distributions reinvested, from through August 31, 2020.
| | | | | | | | |
| Average Annual Total Return through August 31, 2020* | | | One Year | | | | Since Inception | |
Class A (Commenced April 30, 2018) | | | | | | | | |
Excluding sales charges | | | 13.12% | | | | 7.86% | |
Including sales charges | | | 6.88% | | | | 5.30% | |
| |
Institutional (Commenced April 30, 2018) | | | 13.60% | | | | 8.28% | |
| |
Service (Commenced April 30, 2018) | | | 13.02% | | | | 7.74% | |
| |
Investor (Commenced April 30, 2018) | | | 13.48% | | | | 8.13% | |
| |
Class R6 (Commenced April 30, 2018) | | | 13.62% | | | | 8.30% | |
| |
Class R (Commenced April 30, 2018) | | | 12.90% | | | | 7.60% | |
| |
| * | | These returns assume reinvestment of all distributions at NAV. These returns reflect a maximum initial sales charge of 5.5% for Class A Shares. Because Institutional, Service, Investor, Class R6 and Class R Shares do not involve a sales charge, such a charge is not applied to their Average Annual Total Returns. |
24
PORTFOLIO RESULTS
Index Definitions
MSCI ACWI Investable Market Index captures large, mid and small cap representation across 23 developed markets and 26 emerging markets countries.
MSCI World Index is a broad global equity index that represents large and mid-cap equity performance across 23 developed markets countries. It covers approximately 85% of the free float-adjusted market capitalization in each country.
MSCI Emerging Markets Index captures large-cap and mid-cap representation across 24 emerging markets countries. The index covers approximately 85% of the free float-adjusted market capitalization in each country.
S&P 500® Index is a U.S. stock market index based on the market capitalizations of 500 large companies having common stock listed on the New York Stock Exchange or NASDAQ. The S&P 500® Index components and their weightings are determined by S&P Dow Jones Indices.
S&P GSCI Index is a composite index of commodities that measures the performance of the commodity market. It is composed of up of 24 exchange-traded futures contracts that cover physical commodities spanning five sectors.
NASDAQ Composite Index is the market capitalization-weighted index of over 2,500 common equities listed on the NASDAQ stock exchange.
TOPIX (or, Tokyo Price Index) is a capitalization-weighted index that lists all large firms on the Tokyo Stock Exchange into one group.
EURO STOXX 50® provides a blue-chip representation of super-sector leaders in the Eurozone. The index covers 50 stocks from 12 Eurozone countries.
Russell 2000® Index measures the performance of the small-cap segment of the U.S. equity universe. The Russell 2000® Index is a subset of the Russell 3000® Index representing approximately 10% of the total market capitalization of that index. The Russell 2000® Index includes approximately 2000 of the smallest securities based on a combination of their market cap and current index membership. The Russell 2000® Index is constructed to provide a comprehensive and unbiased small-cap barometer and is completely reconstituted annually to ensure larger stocks do not distort the performance and characteristics of the true small-cap opportunity set.
The S&P Target Date Index Series is a component of the S&P Target Allocation Index Family, and is related to the S&P Target Risk Index Series. Both series are broadly representative of the investment opportunity available to investors in target date and target risk funds, respectively. The index series reflects the market consensus for asset allocations for different target date horizons. In particular, each index is representative of the investment opportunity available to investors for the corresponding target date horizon, with asset class exposures driven by a survey of available target date funds for that horizon.
It is not possible to invest directly in an unmanaged index.
25
GOLDMAN SACHS TARGET DATE RETIREMENT PORTFOLIO
Schedule of Investments
August 31, 2020
| | | | | | | | |
Shares | | | Description | | Value | |
|
| Exchange Traded Funds – 94.2% | |
| Bond Funds – 59.1% | |
| | 1,864 | | | Goldman Sachs Access High Yield Corporate Bond ETF(a) | | $ | 91,759 | |
| | 7,491 | | | Goldman Sachs Access Inflation Protected USD Bond ETF(a) | | | 426,987 | |
| | 29,925 | | | Goldman Sachs Access Investment Grade Corporate Bond ETF(a) | | | 1,659,940 | |
| | 13,468 | | | iShares Core U.S. Aggregate Bond ETF | | | 1,594,207 | |
| | 2,261 | | | iShares JP Morgan EM Local Currency Bond ETF | | | 95,618 | |
| | 2,263 | | | iShares JP Morgan USD Emerging Markets Bond ETF | | | 257,032 | |
| | 2,919 | | | Vanguard Long-Term Corporate Bond ETF | | | 313,792 | |
| | | | | | | | |
| | | | | | | 4,439,335 | |
| | |
| Foreign Stock Funds – 13.4% | |
| | 7,914 | | | Goldman Sachs ActiveBeta® Emerging Markets Equity ETF(a) | | | 263,378 | |
| | 20,888 | | | Goldman Sachs ActiveBeta® International Equity ETF(a) | | | 598,023 | |
| | 1,586 | | | iShares Global Infrastructure ETF | | | 63,028 | |
| | 1,478 | | | iShares MSCI EAFE Small-Cap ETF | | | 87,365 | |
| | | | | | | | |
| | | | | | | 1,011,794 | |
| | |
| Stock Funds – 21.7% | |
| | 19,671 | | | Goldman Sachs ActiveBeta® U.S. Large Cap Equity ETF(a) | | | 1,388,969 | |
| | 3,981 | | | Goldman Sachs ActiveBeta® U.S. Small Cap Equity ETF(a) | | | 173,691 | |
| | 830 | | | Vanguard Real Estate ETF | | | 67,853 | |
| | | | | | | | |
| | | | | | | 1,630,513 | |
| | |
| | TOTAL EXCHANGE TRADED FUNDS | |
| | (Cost $6,285,812) | | $ | 7,081,642 | |
| | |
| Shares | | | Dividend
Rate | | Value | |
|
| Investment Company(a) – 4.1% | |
| | Goldman Sachs Financial Square Government Fund – Class R6 | |
| | 304,119 | | | 0.027% | | $ | 304,119 | |
| | (Cost $304,119) | | | | |
| | |
| | TOTAL INVESTMENTS – 98.3% | | | | |
| | (Cost $6,589,931) | | $ | 7,385,761 | |
| | |
| OTHER ASSETS IN EXCESS OF
LIABILITIES – 1.7% | | | 130,020 | |
| | |
| | NET ASSETS – 100.0% | | $ | 7,515,781 | |
| | |
| | |
|
| The percentage shown for each investment category reflects the value of investments in that category as a percentage of net assets. |
| |
(a) | | Represents affiliated funds. |
| | |
|
Investment Abbreviation: |
ETF | | —Exchange Traded Fund |
|
|
| ADDITIONAL INVESTMENT INFORMATION |
FUTURES CONTRACTS — At August 31, 2020, the Portfolio had the following futures contracts:
| | | | | | | | | | | | | | | | |
| Description | | Number of
Contracts | | | Expiration
Date | | | Notional
Amount | | | Unrealized
Appreciation/
(Depreciation) | |
Long position contracts: | | | | | | | | | | | | | | | | |
S&P 500 E-Mini Index | | | 2 | | | | 09/18/20 | | | $ | 349,890 | | | $ | 48,741 | |
| | |
| 26 | | The accompanying notes are an integral part of these financial statements. |
GOLDMAN SACHS TARGET DATE 2025 PORTFOLIO
Schedule of Investments
August 31, 2020
| | | | | | | | |
Shares | | | Description | | Value | |
|
| Exchange Traded Funds – 97.6% | |
| Bond Funds – 49.7% | |
| | 1,705 | | | Goldman Sachs Access High Yield Corporate Bond ETF(a) | | $ | 83,932 | |
| | 7,960 | | | Goldman Sachs Access Inflation Protected USD Bond ETF(a) | | | 453,720 | |
| | 26,517 | | | Goldman Sachs Access Investment Grade Corporate Bond ETF(a) | | | 1,470,898 | |
| | 10,698 | | | iShares Core U.S. Aggregate Bond ETF | | | 1,266,322 | |
| | 2,115 | | | iShares JP Morgan EM Local Currency Bond ETF | | | 89,443 | |
| | 2,211 | | | iShares JP Morgan USD Emerging Markets Bond ETF | | | 251,126 | |
| | 3,569 | | | Vanguard Long-Term Corporate Bond ETF | | | 383,668 | |
| | | | | | | | |
| | | | | | | 3,999,109 | |
| | |
| Foreign Stock Funds – 18.4% | |
| | 9,416 | | | Goldman Sachs ActiveBeta® Emerging Markets Equity ETF(a) | | | 313,365 | |
| | 34,683 | | | Goldman Sachs ActiveBeta® International Equity ETF(a) | | | 992,974 | |
| | 1,622 | | | iShares Global Infrastructure ETF | | | 64,458 | |
| | 1,889 | | | iShares MSCI EAFE Small-Cap ETF | | | 111,659 | |
| | | | | | | | |
| | | | | | | 1,482,456 | |
| | |
| Stock Funds – 29.5% | |
| | 29,496 | | | Goldman Sachs ActiveBeta® U.S. Large Cap Equity ETF(a) | | | 2,082,712 | |
| | 5,030 | | | Goldman Sachs ActiveBeta® U.S. Small Cap Equity ETF(a) | | | 219,459 | |
| | 849 | | | Vanguard Real Estate ETF | | | 69,406 | |
| | | | | | | | |
| | | | | | | 2,371,577 | |
| | |
| | TOTAL EXCHANGE TRADED FUNDS | |
| | (Cost $6,932,999) | | $ | 7,853,142 | |
| | |
| Shares | | | Dividend
Rate | | Value | |
|
| Investment Company(a) – 0.9% | |
| | Goldman Sachs Financial Square Government Fund – Class R6 | |
| | 67,738 | | | 0.027% | | $ | 67,738 | |
| | (Cost $67,738) | | | | |
| | |
| | TOTAL INVESTMENTS – 98.5% | | | | |
| | (Cost $7,000,737) | | $ | 7,920,880 | |
| | |
| OTHER ASSETS IN EXCESS OF
LIABILITIES – 1.5% | | | 122,151 | |
| | |
| | NET ASSETS – 100.0% | | $ | 8,043,031 | |
| | |
| | |
|
| The percentage shown for each investment category reflects the value of investments in that category as a percentage of net assets. |
| |
(a) | | Represents affiliated funds. |
| | |
|
Investment Abbreviation: |
ETF | | —Exchange Traded Fund |
|
|
| ADDITIONAL INVESTMENT INFORMATION |
FUTURES CONTRACTS — At August 31, 2020, the Portfolio had the following futures contracts:
| | | | | | | | | | | | | | | | |
| Description | | Number of
Contracts | | | Expiration
Date | | | Notional
Amount | | | Unrealized
Appreciation/
(Depreciation) | |
Long position contracts: | | | | | | | | | | | | | | | | |
S&P 500 E-Mini Index | | | 1 | | | | 09/18/20 | | | $ | 174,945 | | | $ | 24,981 | |
| | |
| The accompanying notes are an integral part of these financial statements. | | 27 |
GOLDMAN SACHS TARGET DATE 2030 PORTFOLIO
Schedule of Investments
August 31, 2020
| | | | | | | | |
Shares | | | Description | | Value | |
|
| Exchange Traded Funds – 97.2% | |
| Bond Funds – 41.9% | |
| | 1,146 | | | Goldman Sachs Access High Yield Corporate Bond ETF(a) | | $ | 56,414 | |
| | 4,995 | | | Goldman Sachs Access Inflation Protected USD Bond ETF(a) | | | 284,715 | |
| | 14,254 | | | Goldman Sachs Access Investment Grade Corporate Bond ETF(a) | | | 790,669 | |
| | 4,127 | | | iShares Core U.S. Aggregate Bond ETF | | | 488,513 | |
| | 1,340 | | | iShares JP Morgan EM Local Currency Bond ETF | | | 56,669 | |
| | 1,241 | | | iShares JP Morgan USD Emerging Markets Bond ETF | | | 140,953 | |
| | 2,088 | | | Vanguard Long-Term Corporate Bond ETF | | | 224,460 | |
| | | | | | | | |
| | | | | | | 2,042,393 | |
| | |
| Foreign Stock Funds – 21.4% | |
| | 6,032 | | | Goldman Sachs ActiveBeta® Emerging Markets Equity ETF(a) | | | 200,745 | |
| | 24,540 | | | Goldman Sachs ActiveBeta® International Equity ETF(a) | | | 702,580 | |
| | 1,112 | | | iShares Global Infrastructure ETF | | | 44,191 | |
| | 1,673 | | | iShares MSCI EAFE Small-Cap ETF | | | 98,891 | |
| | | | | | | | |
| | | | | | | 1,046,407 | |
| | |
| Stock Funds – 33.9% | |
| | 21,646 | | | Goldman Sachs ActiveBeta® U.S. Large Cap Equity ETF(a) | | | 1,528,424 | |
| | 1,752 | | | Goldman Sachs ActiveBeta® U.S. Small Cap Equity ETF(a) | | | 76,440 | |
| | 582 | | | Vanguard Real Estate ETF | | | 47,578 | |
| | | | | | | | |
| | | | | | | 1,652,442 | |
| | |
| | TOTAL EXCHANGE TRADED FUNDS | |
| | (Cost $4,127,294) | | $ | 4,741,242 | |
| | |
| Shares | | | Dividend
Rate | | Value | |
|
| Investment Company(a) – 1.5% | |
| | Goldman Sachs Financial Square Government Fund – Class R6 | |
| | 74,394 | | | 0.027% | | $ | 74,394 | |
| | (Cost $74,394) | | | | |
| | |
| | TOTAL INVESTMENTS – 98.7% | | | | |
| | (Cost $4,201,688) | | $ | 4,815,636 | |
| | |
| OTHER ASSETS IN EXCESS OF
LIABILITIES – 1.3% | | | 63,175 | |
| | |
| | NET ASSETS – 100.0% | | $ | 4,878,811 | |
| | |
| | |
|
| The percentage shown for each investment category reflects the value of investments in that category as a percentage of net assets. |
| |
(a) | | Represents affiliated funds. |
| | |
|
Investment Abbreviation: |
ETF—Exchange Traded Fund |
|
|
| ADDITIONAL INVESTMENT INFORMATION |
FUTURES CONTRACTS — At August 31, 2020, the Portfolio had the following futures contracts:
| | | | | | | | | | | | | | | | |
| Description | | Number of
Contracts | | | Expiration
Date | | | Notional
Amount | | | Unrealized
Appreciation/
(Depreciation) | |
Long position contracts: | | | | | | | | | | | | | | | | |
E-mini Russell 2000 Index | | | 1 | | | | 09/18/20 | | | $ | 78,065 | | | $ | 9,085 | |
| | |
| 28 | | The accompanying notes are an integral part of these financial statements. |
GOLDMAN SACHS TARGET DATE 2035 PORTFOLIO
Schedule of Investments
August 31, 2020
| | | | | | | | |
Shares | | | Description | | Value | |
|
| Exchange Traded Funds – 97.8% | |
| Bond Funds – 33.5% | |
| | 1,685 | | | Goldman Sachs Access High Yield Corporate Bond ETF(a) | | $ | 82,948 | |
| | 7,309 | | | Goldman Sachs Access Inflation Protected USD Bond ETF(a) | | | 416,613 | |
| | 17,028 | | | Goldman Sachs Access Investment Grade Corporate Bond ETF(a) | | | 944,543 | |
| | 2,559 | | | iShares Core U.S. Aggregate Bond ETF | | | 302,909 | |
| | 1,760 | | | iShares JP Morgan EM Local Currency Bond ETF | | | 74,430 | |
| | 2,020 | | | iShares JP Morgan USD Emerging Markets Bond ETF | | | 229,432 | |
| | 3,192 | | | Vanguard Long-Term Corporate Bond ETF | | | 343,140 | |
| | | | | | | | |
| | | | | | | 2,394,015 | |
| | |
| Foreign Stock Funds – 24.6% | |
| | 10,117 | | | Goldman Sachs ActiveBeta® Emerging Markets Equity ETF(a) | | | 336,694 | |
| | 42,221 | | | Goldman Sachs ActiveBeta® International Equity ETF(a) | | | 1,208,787 | |
| | 1,606 | | | iShares Global Infrastructure ETF | | | 63,823 | |
| | 2,493 | | | iShares MSCI EAFE Small-Cap ETF | | | 147,361 | |
| | | | | | | | |
| | | | | | | 1,756,665 | |
| | |
| Stock Funds – 39.7% | |
| | 37,662 | | | Goldman Sachs ActiveBeta® U.S. Large Cap Equity ETF(a) | | | 2,659,314 | |
| | 2,371 | | | Goldman Sachs ActiveBeta® U.S. Small Cap Equity ETF(a) | | | 103,446 | |
| | 840 | | | Vanguard Real Estate ETF | | | 68,670 | |
| | | | | | | | |
| | | | | | | 2,831,430 | |
| | |
| | TOTAL EXCHANGE TRADED FUNDS | |
| | (Cost $6,023,406) | | $ | 6,982,110 | |
| | |
| Shares | | | Dividend
Rate | | Value | |
|
| Investment Company(a) – 0.7% | |
| | Goldman Sachs Financial Square Government Fund – Class R6 | |
| | 47,156 | | | 0.027% | | $ | 47,156 | |
| | (Cost $47,156) | | | | |
| | |
| | TOTAL INVESTMENTS – 98.5% | | | | |
| | (Cost $6,070,562) | | $ | 7,029,266 | |
| | |
| OTHER ASSETS IN EXCESS OF
LIABILITIES – 1.5% | | | 107,754 | |
| | |
| | NET ASSETS – 100.0% | | $ | 7,137,020 | |
| | |
| | |
|
| The percentage shown for each investment category reflects the value of investments in that category as a percentage of net assets. |
| |
(a) | | Represents affiliated funds. |
| | |
|
Investment Abbreviation: |
ETF | | —Exchange Traded Fund |
|
|
| ADDITIONAL INVESTMENT INFORMATION |
FUTURES CONTRACTS — At August 31, 2020, the Portfolio had the following futures contracts:
| | | | | | | | | | | | | | | | |
| Description | | Number of
Contracts | | | Expiration
Date | | | Notional
Amount | | | Unrealized
Appreciation/
(Depreciation) | |
Long position contracts: | | | | | | | | | | | | | | | | |
E-mini Russell 2000 Index | | | 2 | | | | 09/18/20 | | | $ | 156,130 | | | $ | 18,170 | |
| | |
| The accompanying notes are an integral part of these financial statements. | | 29 |
GOLDMAN SACHS TARGET DATE 2040 PORTFOLIO
Schedule of Investments
August 31, 2020
| | | | | | | | |
Shares | | | Description | | Value | |
|
| Exchange Traded Funds – 98.5% | |
| Bond Funds – 22.3% | |
| | 2,126 | | | Goldman Sachs Access High Yield Corporate Bond ETF(a) | | $ | 104,657 | |
| | 4,777 | | | Goldman Sachs Access Inflation Protected USD Bond ETF(a) | | | 272,289 | |
| | 10,774 | | | Goldman Sachs Access Investment Grade Corporate Bond ETF(a) | | | 597,634 | |
| | 1,562 | | | iShares Core U.S. Aggregate Bond ETF | | | 184,894 | |
| | 1,561 | | | iShares JP Morgan EM Local Currency Bond ETF | | | 66,015 | |
| | 1,480 | | | iShares JP Morgan USD Emerging Markets Bond ETF | | | 168,098 | |
| | 3,107 | | | Vanguard Long-Term Corporate Bond ETF | | | 334,003 | |
| | | | | | | | |
| | | | | | | 1,727,590 | |
| | |
| Foreign Stock Funds – 28.9% | |
| | 13,880 | | | Goldman Sachs ActiveBeta® Emerging Markets Equity ETF(a) | | | 461,927 | |
| | 53,629 | | | Goldman Sachs ActiveBeta® International Equity ETF(a) | | | 1,535,398 | |
| | 1,637 | | | iShares Global Infrastructure ETF | | | 65,054 | |
| | 3,101 | | | iShares MSCI EAFE Small-Cap ETF | | | 183,300 | |
| | | | | | | | |
| | | | | | | 2,245,679 | |
| | |
| Stock Funds – 47.3% | |
| | 35,800 | | | Goldman Sachs ActiveBeta® U.S. Large Cap Equity ETF(a) | | | 2,527,838 | |
| | 5,496 | | | Goldman Sachs ActiveBeta® U.S. Small Cap Equity ETF(a) | | | 239,790 | |
| | 17,037 | | | Goldman Sachs MarketBeta U.S. Equity ETF(a) | | | 829,549 | |
| | 856 | | | Vanguard Real Estate ETF | | $ | 69,978 | |
| | | | | | | | |
| | | | | | | 3,667,155 | |
| | |
| | TOTAL INVESTMENTS – 98.5% | |
| | (Cost $6,604,151) | | $ | 7,640,424 | |
| | |
| OTHER ASSETS IN EXCESS OF
LIABILITIES – 1.5% | | | 114,841 | |
| | |
| | NET ASSETS – 100.0% | | $ | 7,755,265 | |
| | |
| | |
|
| The percentage shown for each investment category reflects the value of investments in that category as a percentage of net assets. |
| |
(a) | | Represents affiliated funds. |
| | |
|
Investment Abbreviation: |
ETF | | —Exchange Traded Fund |
|
|
| ADDITIONAL INVESTMENT INFORMATION |
FUTURES CONTRACTS — At August 31, 2020, the Portfolio had the following futures contracts:
| | | | | | | | | | | | | | | | |
| Description | | Number of
Contracts | | | Expiration
Date | | | Notional
Amount | | | Unrealized
Appreciation/
(Depreciation) | |
Long position contracts: | | | | | | | | | | | | | | | | |
E-mini Russell 2000 Index | | | 2 | | | | 09/18/20 | | | $ | 156,130 | | | $ | 18,170 | |
| | |
| 30 | | The accompanying notes are an integral part of these financial statements. |
GOLDMAN SACHS TARGET DATE 2045 PORTFOLIO
Schedule of Investments
August 31, 2020
| | | | | | | | |
Shares | | | Description | | Value | |
|
| Exchange Traded Funds – 97.2% | |
| Bond Funds – 9.3% | |
| | 2,990 | | | Goldman Sachs Access High Yield Corporate Bond ETF(a) | | $ | 147,189 | |
| | 403 | | | Goldman Sachs Access Inflation Protected USD Bond ETF(a) | | | 22,971 | |
| | 1,026 | | | Goldman Sachs Access Investment Grade Corporate Bond ETF(a) | | | 56,912 | |
| | 1,334 | | | iShares JP Morgan EM Local Currency Bond ETF | | | 56,415 | |
| | 1,313 | | | iShares JP Morgan USD Emerging Markets Bond ETF | | | 149,131 | |
| | 2,683 | | | Vanguard Long-Term Corporate Bond ETF | | | 288,422 | |
| | | | | | | | |
| | | | | | | 721,040 | |
| | |
| Foreign Stock Funds – 34.7% | |
| | 18,334 | | | Goldman Sachs ActiveBeta® Emerging Markets Equity ETF(a) | | | 610,155 | |
| | 61,981 | | | Goldman Sachs ActiveBeta® International Equity ETF(a) | | | 1,774,516 | |
| | 1,739 | | | iShares Global Infrastructure ETF | | | 69,108 | |
| | 4,051 | | | iShares MSCI EAFE Small-Cap ETF | | | 239,455 | |
| | | | | | | | |
| | | | | | | 2,693,234 | |
| | |
| Stock Funds – 53.2% | |
| | 39,256 | | | Goldman Sachs ActiveBeta® U.S. Large Cap Equity ETF(a) | | | 2,771,866 | |
| | 6,938 | | | Goldman Sachs ActiveBeta® U.S. Small Cap Equity ETF(a) | | | 302,705 | |
| | 20,084 | | | Goldman Sachs MarketBeta U.S. Equity ETF(a) | | | 977,910 | |
| | 910 | | | Vanguard Real Estate ETF | | | 74,393 | |
| | | | | | | | |
| | | | | | | 4,126,874 | |
| | |
| | TOTAL EXCHANGE TRADED FUNDS | |
| | (Cost $6,527,638) | | $ | 7,541,148 | |
| | |
| Shares | | | Dividend
Rate | | Value | |
|
| Investment Company(a) – 1.1% | |
| | Goldman Sachs Financial Square Government Fund – Class R6 | |
| | 84,073 | | | 0.027% | | $ | 84,073 | |
| | (Cost $84,073) | | | | |
| | |
| | TOTAL INVESTMENTS – 98.3% | | | | |
| | (Cost $6,611,711) | | $ | 7,625,221 | |
| | |
| OTHER ASSETS IN EXCESS OF
LIABILITIES – 1.7% | | | 130,871 | |
| | |
| | NET ASSETS – 100.0% | | $ | 7,756,092 | |
| | |
| | |
|
| The percentage shown for each investment category reflects the value of investments in that category as a percentage of net assets. |
| |
(a) | | Represents affiliated funds. |
| | |
|
Investment Abbreviation: |
ETF | | —Exchange Traded Fund |
|
|
| ADDITIONAL INVESTMENT INFORMATION |
FUTURES CONTRACTS — At August 31, 2020, the Portfolio had the following futures contracts:
| | | | | | | | | | | | | | | | |
| Description | | Number of
Contracts | | | Expiration
Date | | | Notional
Amount | | | Unrealized
Appreciation/
(Depreciation) | |
Long position contracts: | | | | | | | | | | | | | | | | |
E-mini Russell 2000 Index | | | 2 | | | | 09/18/20 | | | $ | 156,130 | | | $ | 18,170 | |
S&P 500 E-Mini Index | | | 1 | | | | 09/18/20 | | | | 174,945 | | | | 21,842 | |
| | | | |
| TOTAL FUTURES CONTRACTS | | | | | | | | | | | | | | $ | 40,012 | |
| | |
| The accompanying notes are an integral part of these financial statements. | | 31 |
GOLDMAN SACHS TARGET DATE 2050 PORTFOLIO
Schedule of Investments
August 31, 2020
| | | | | | | | |
Shares | | | Description | | Value | |
|
| Exchange Traded Funds – 96.8% | |
| Bond Funds – 7.9% | |
| | 2,748 | | | Goldman Sachs Access High Yield Corporate Bond ETF(a) | | $ | 135,276 | |
| | 1,419 | | | iShares JP Morgan EM Local Currency Bond ETF | | | 60,010 | |
| | 944 | | | iShares JP Morgan USD Emerging Markets Bond ETF | | | 107,220 | |
| | 2,391 | | | Vanguard Long-Term Corporate Bond ETF | | | 257,032 | |
| | | | | | | | |
| | | | | | | 559,538 | |
| | |
| Foreign Stock Funds – 35.4% | |
| | 16,982 | | | Goldman Sachs ActiveBeta® Emerging Markets Equity ETF(a) | | | 565,161 | |
| | 57,819 | | | Goldman Sachs ActiveBeta® International Equity ETF(a) | | | 1,655,358 | |
| | 1,598 | | | iShares Global Infrastructure ETF | | | 63,504 | |
| | 3,723 | | | iShares MSCI EAFE Small-Cap ETF | | | 220,067 | |
| | | | | | | | |
| | | | | | | 2,504,090 | |
| | |
| Stock Funds – 53.5% | |
| | 36,155 | | | Goldman Sachs ActiveBeta® U.S. Large Cap Equity ETF(a) | | | 2,552,905 | |
| | 6,050 | | | Goldman Sachs ActiveBeta® U.S. Small Cap Equity ETF(a) | | | 263,961 | |
| | 18,644 | | | Goldman Sachs MarketBeta U.S. Equity ETF(a) | | | 907,795 | |
| | 836 | | | Vanguard Real Estate ETF | | | 68,343 | |
| | | | | | | | |
| | | | | | | 3,793,004 | |
| | |
| | TOTAL EXCHANGE TRADED FUNDS | |
| | (Cost $5,945,689) | | $ | 6,856,632 | |
| | |
| Shares | | | Dividend
Rate | | Value | |
|
| Investment Company(a) – 1.5% | |
| | Goldman Sachs Financial Square Government Fund – Class R6 | |
| | 107,424 | | | 0.027% | | $ | 107,424 | |
| | (Cost $107,424) | | | | |
| | |
| | TOTAL INVESTMENTS – 98.3% | | | | |
| | (Cost $6,053,113) | | $ | 6,964,056 | |
| | |
| OTHER ASSETS IN EXCESS OF
LIABILITIES – 1.7% | | | 118,430 | |
| | |
| | NET ASSETS – 100.0% | | $ | 7,082,486 | |
| | |
| | |
|
| The percentage shown for each investment category reflects the value of investments in that category as a percentage of net assets. |
| |
(a) | | Represents affiliated funds. |
| | |
|
Investment Abbreviation: |
ETF | | —Exchange Traded Fund |
|
|
| ADDITIONAL INVESTMENT INFORMATION |
FUTURES CONTRACTS — At August 31, 2020, the Portfolio had the following futures contracts:
| | | | | | | | | | | | | | | | |
| Description | | Number of
Contracts | | | Expiration
Date | | | Notional
Amount | | | Unrealized
Appreciation/
(Depreciation) | |
Long position contracts: | | | | | | | | | | | | | | | | |
S&P 500 E-Mini Index | | | 1 | | | | 09/18/20 | | | $ | 174,945 | | | $ | 24,979 | |
E-mini Russell 2000 Index | | | 2 | | | | 09/18/20 | | | | 156,130 | | | | 20,766 | |
| | | | |
| TOTAL FUTURES CONTRACTS | | | | | | | | | | | | | | $ | 45,745 | |
| | |
| 32 | | The accompanying notes are an integral part of these financial statements. |
GOLDMAN SACHS TARGET DATE 2055 PORTFOLIO
Schedule of Investments
August 31, 2020
| | | | | | | | |
Shares | | | Description | | Value | |
|
| Exchange Traded Funds – 96.7% | |
| Bond Funds – 8.1% | |
| | 2,798 | | | Goldman Sachs Access High Yield Corporate Bond ETF(a) | | $ | 137,737 | |
| | 1,249 | | | iShares JP Morgan EM Local Currency Bond ETF | | | 52,820 | |
| | 1,229 | | | iShares JP Morgan USD Emerging Markets Bond ETF | | | 139,590 | |
| | 2,538 | | | Vanguard Long-Term Corporate Bond ETF | | | 272,835 | |
| | | | | | | | |
| | | | | | | 602,982 | |
| | |
| Foreign Stock Funds – 35.2% | |
| | 18,071 | | | Goldman Sachs ActiveBeta® Emerging Markets Equity ETF(a) | | | 601,403 | |
| | 60,681 | | | Goldman Sachs ActiveBeta® International Equity ETF(a) | | | 1,737,297 | |
| | 1,627 | | | iShares Global Infrastructure ETF | | | 64,657 | |
| | 3,791 | | | iShares MSCI EAFE Small-Cap ETF | | | 224,086 | |
| | | | | | | | |
| | | | | | | 2,627,443 | |
| | |
| Stock Funds – 53.4% | |
| | 37,601 | | | Goldman Sachs ActiveBeta® U.S. Large Cap Equity ETF(a) | | | 2,655,007 | |
| | 6,941 | | | Goldman Sachs ActiveBeta® U.S. Small Cap Equity ETF(a) | | | 302,836 | |
| | 19,542 | | | Goldman Sachs MarketBeta U.S. Equity ETF(a) | | | 951,519 | |
| | 852 | | | Vanguard Real Estate ETF | | | 69,651 | |
| | | | | | | | |
| | | | | | | 3,979,013 | |
| | |
| | TOTAL EXCHANGE TRADED FUNDS | |
| | (Cost $6,247,019) | | $ | 7,209,438 | |
| | |
| Shares | | | Dividend Rate | | Value | |
|
| Investment Company(a) – 1.6% | |
| | Goldman Sachs Financial Square Government Fund – Class R6 | |
| | 120,710 | | | 0.027% | | $ | 120,710 | |
| | (Cost $120,710) | | | | |
| | |
| | TOTAL INVESTMENTS – 98.3% | | | | |
| | (Cost $6,367,729) | | $ | 7,330,148 | |
| | |
| OTHER ASSETS IN EXCESS OF
LIABILITIES – 1.7% | | | 126,660 | |
| | |
| | NET ASSETS – 100.0% | | $ | 7,456,808 | |
| | |
| | |
|
| The percentage shown for each investment category reflects the value of investments in that category as a percentage of net assets. |
| |
(a) | | Represents affiliated funds. |
| | |
|
Investment Abbreviation: |
ETF | | —Exchange Traded Fund |
|
|
| ADDITIONAL INVESTMENT INFORMATION |
FUTURES CONTRACTS — At August 31, 2020, the Portfolio had the following futures contracts:
| | | | | | | | | | | | | | | | |
| Description | | Number of
Contracts | | | Expiration
Date | | | Notional
Amount | | | Unrealized
Appreciation/
(Depreciation) | |
Long position contracts: | | | | | | | | | | | | | | | | |
E-mini Russell 2000 Index | | | 2 | | | | 09/18/20 | | | $ | 156,130 | | | $ | 20,766 | |
S&P 500 E-Mini Index | | | 1 | | | | 09/18/20 | | | | 174,945 | | | | 24,979 | |
| | | | |
| TOTAL FUTURES CONTRACTS | | | | | | | | | | | | | | $ | 45,745 | |
| | |
| The accompanying notes are an integral part of these financial statements. | | 33 |
GOLDMAN SACHS TARGET DATE 2060 PORTFOLIO
Schedule of Investments
August 31, 2020
| | | | | | | | |
Shares | | | Description | | Value | |
|
| Exchange Traded Funds – 97.0% | |
| Bond Funds – 7.8% | |
| | 2,964 | | | Goldman Sachs Access High Yield Corporate Bond ETF(a) | | $ | 145,909 | |
| | 1,322 | | | iShares JP Morgan EM Local Currency Bond ETF | | | 55,907 | |
| | 1,301 | | | iShares JP Morgan USD Emerging Markets Bond ETF | | | 147,768 | |
| | 2,993 | | | Vanguard Long-Term Corporate Bond ETF | | | 321,748 | |
| | | | | | | | |
| | | | | | | 671,332 | |
| | |
| Foreign Stock Funds – 34.5% | |
| | 19,910 | | | Goldman Sachs ActiveBeta® Emerging Markets Equity ETF(a) | | | 662,605 | |
| | 70,043 | | | Goldman Sachs ActiveBeta® International Equity ETF(a) | | | 2,005,331 | |
| | 1,724 | | | iShares Global Infrastructure ETF | | | 68,512 | |
| | 4,015 | | | iShares MSCI EAFE Small-Cap ETF | | | 237,326 | |
| | | | | | | | |
| | | | | | | 2,973,774 | |
| | |
| Stock Funds – 54.7% | |
| | 44,969 | | | Goldman Sachs ActiveBeta® U.S. Large Cap Equity ETF(a) | | | 3,175,261 | |
| | 8,145 | | | Goldman Sachs ActiveBeta® U.S. Small Cap Equity ETF(a) | | | 355,366 | |
| | 22,645 | | | Goldman Sachs MarketBeta U.S. Equity ETF(a) | | | 1,102,608 | |
| | 902 | | | Vanguard Real Estate ETF | | | 73,739 | |
| | | | | | | | |
| | | | | | | 4,706,974 | |
| | |
| | TOTAL EXCHANGE TRADED FUNDS | |
| | (Cost $7,251,511) | | $ | 8,352,080 | |
| | |
| Shares | | | Dividend
Rate | | Value | |
|
| Investment Company(a) – 1.6% | |
| | Goldman Sachs Financial Square Government Fund – Class R6 | |
| | 136,498 | | | 0.027% | | $ | 136,498 | |
| | (Cost $136,498) | | | | |
| | |
| | TOTAL INVESTMENTS – 98.6% | | | | |
| | (Cost $7,388,009) | | $ | 8,488,578 | |
| | |
| OTHER ASSETS IN EXCESS OF
LIABILITIES – 1.4% | | | 118,131 | |
| | |
| | NET ASSETS – 100.0% | | $ | 8,606,709 | |
| | |
| | |
|
| The percentage shown for each investment category reflects the value of investments in that category as a percentage of net assets. |
| |
(a) | | Represents affiliated funds. |
| | |
|
Investment Abbreviation: |
ETF | | —Exchange Traded Fund |
|
|
| ADDITIONAL INVESTMENT INFORMATION |
FUTURES CONTRACTS — At August 31, 2020, the Portfolio had the following futures contracts:
| | | | | | | | | | | | | | | | |
| Description | | Number of
Contracts | | | Expiration
Date | | | Notional
Amount | | | Unrealized
Appreciation/
(Depreciation) | |
Long position contracts: | | | | | | | | | | | | | | | | |
S&P 500 E-Mini Index | | | 1 | | | | 09/18/20 | | | $ | 174,945 | | | $ | 24,979 | |
E-mini Russell 2000 Index | | | 2 | | | | 09/18/20 | | | | 156,130 | | | | 20,766 | |
| | | | |
| TOTAL FUTURES CONTRACTS | | | | | | | | | | | | | | $ | 45,745 | |
| | |
| 34 | | The accompanying notes are an integral part of these financial statements. |
GOLDMAN SACHS TARGET DATE PORTFOLIOS
Statements of Assets and Liabilities
August 31, 2020
| | | | | | | | | | | | | | |
| | | | |
| | | | | Target Date Retirement
Portfolio | | | Target Date 2025
Portfolio | | | Target Date 2030
Portfolio | |
| | Assets: | |
| | Investments of unaffiliated issuers, at value (cost $2,332,911, $2,105,450 and $1,033,458) | | $ | 2,478,895 | | | $ | 2,236,081 | | | $ | 1,101,255 | |
| | Investments of affiliated issuers, at value (cost $4,257,020, $4,895,287 and $3,168,230) | | | 4,906,866 | | | | 5,684,799 | | | | 3,714,381 | |
| | Cash | | | 115,689 | | | | 121,921 | | | | 73,990 | |
| | Receivables: | | | | | | | | | | | | |
| | Collateral on futures contracts(a) | | | 26,400 | | | | 13,200 | | | | 6,380 | |
| | Reimbursement from investment adviser | | | 21,226 | | | | 18,215 | | | | 21,526 | |
| | Portfolio shares sold | | | 563 | | | | — | | | | 376 | |
| | Other assets | | | 56,961 | | | | 56,963 | | | | 56,798 | |
| | Total assets | | | 7,606,600 | | | | 8,131,179 | | | | 4,974,706 | |
| | | | | | | | | | | | | | |
| | Liabilities: | |
| | Variation margin on futures contracts | | | 521 | | | | 275 | | | | 721 | |
| | Payables: | | | | | | | | | | | | |
| | Management fees | | | 550 | | | | 526 | | | | 288 | |
| | Distribution and Service fees and Transfer Agency fees | | | 266 | | | | 370 | | | | 328 | |
| | Accrued expenses | | | 89,482 | | | | 86,977 | | | | 94,558 | |
| | Total liabilities | | | 90,819 | | | | 88,148 | | | | 95,895 | |
| | | | | | | | | | | | | | |
| | Net Assets: | |
| | Paid-in capital | | | 6,419,087 | | | | 6,944,078 | | | | 4,204,086 | |
| | Total distributable earnings | | | 1,096,694 | | | | 1,098,953 | | | | 674,725 | |
| | | NET ASSETS | | $ | 7,515,781 | | | $ | 8,043,031 | | | $ | 4,878,811 | |
| | | Net Assets: | | | | | | | | | | | | |
| | | Class A | | $ | 160,245 | | | $ | 254,511 | | | $ | 276,360 | |
| | | Institutional | | | 12,940 | | | | 7,216,667 | | | | 16,268 | |
| | | Service | | | 12,648 | | | | 13,109 | | | | 13,356 | |
| | | Investor | | | 505,317 | | | | 36,564 | | | | 1,033,785 | |
| | | Class R6 | | | 6,812,053 | | | | 509,145 | | | | 3,525,769 | |
| | | Class R | | | 12,578 | | | | 13,035 | | | | 13,273 | |
| | | Total Net Assets | | $ | 7,515,781 | | | $ | 8,043,031 | | | $ | 4,878,811 | |
| | | Shares Outstanding $0.001 par value (unlimited number of shares authorized): | |
| | | Class A | | | 15,991 | | | | 22,582 | | | | 31,630 | |
| | | Institutional | | | 1,286 | | | | 640,219 | | | | 1,850 | |
| | | Service | | | 1,262 | | | | 1,169 | | | | 1,496 | |
| | | Investor | | | 50,337 | | | | 3,253 | | | | 117,980 | |
| | | Class R6 | | | 676,413 | | | | 45,057 | | | | 400,863 | |
| | | Class R | | | 1,257 | | | | 1,163 | | | | 1,522 | |
| | | Net asset value, offering and redemption price per share:(b) | | | | | | | | | | | | |
| | | Class A | | | $10.02 | | | | $11.27 | | | | $8.74 | |
| | | Institutional | | | 10.06 | | | | 11.27 | | | | 8.80 | (c) |
| | | Service | | | 10.02 | | | | 11.22 | (c) | | | 8.93 | |
| | | Investor | | | 10.04 | | | | 11.24 | | | | 8.76 | |
| | | Class R6 | | | 10.07 | | | | 11.30 | | | | 8.80 | |
| | | Class R | | | 10.00 | (c) | | | 11.21 | | | | 8.72 | |
| | (a) | | Segregated for initial margin and/or collateral. |
| | (b) | | Maximum public offering price per share for Class A Shares of the Target Date Retirement, Target Date 2025 and Target Date 2030 Portfolios is $10.60, $11.93 and $9.25, respectively. |
| | (c) | | Net asset value may not recalculate due to rounding of fractional shares. |
| | |
| The accompanying notes are an integral part of these financial statements. | | 35 |
GOLDMAN SACHS TARGET DATE PORTFOLIOS
Statements of Assets and Liabilities (continued)
August 31, 2020
| | | | | | | | | | | | | | |
| | | | |
| | | | | Target Date 2035
Portfolio | | | Target Date 2040
Portfolio | | | Target Date 2045
Portfolio | |
| | Assets: | |
| | Investments of unaffiliated issuers, at value (cost $1,150,143, $996,999 and $814,499) | | $ | 1,229,765 | | | $ | 1,071,342 | | | $ | 876,924 | |
| | Investments of affiliated issuers, at value (cost $4,920,419, $5,607,152 and $5,797,212) | | | 5,799,501 | | | | 6,569,082 | | | | 6,748,297 | |
| | Cash | | | 108,429 | | | | 118,380 | | | | 118,907 | |
| | Receivables: | | | | | | | | | | | | |
| | Collateral on futures contracts(a) | | | 12,760 | | | | 12,760 | | | | 25,960 | |
| | Reimbursement from investment adviser | | | 18,166 | | | | 21,127 | | | | 18,256 | |
| | Portfolio shares sold | | | 256 | | | | — | | | | 111 | |
| | Other assets | | | 56,909 | | | | 56,933 | | | | 56,934 | |
| | Total assets | | | 7,225,786 | | | | 7,849,624 | | | | 7,845,389 | |
| | | | | | | | | | | | | | |
| | Liabilities: | |
| | Variation margin on futures contracts | | | 1,442 | | | | 1,442 | | | | 1,715 | |
| | Payables: | | | | | | | | | | | | |
| | Management fees | | | 369 | | | | 394 | | | | 330 | |
| | Distribution and Service fees and Transfer Agency fees | | | 350 | | | | 217 | | | | 369 | |
| | Accrued expenses | | | 86,605 | | | | 92,306 | | | | 86,883 | |
| | Total liabilities | | | 88,766 | | | | 94,359 | | | | 89,297 | |
| | | | | | | | | | | | | | |
| | Net Assets: | |
| | Paid-in capital | | | 6,084,450 | | | | 6,550,249 | | | | 6,699,636 | |
| | Total distributable earnings | | | 1,052,570 | | | | 1,205,016 | | | | 1,056,456 | |
| | | NET ASSETS | | $ | 7,137,020 | | | $ | 7,755,265 | | | $ | 7,756,092 | |
| | | Net Assets: | | | | | | | | | | | | |
| | | Class A | | $ | 276,781 | | | $ | 92,064 | | | $ | 221,264 | |
| | | Institutional | | | 6,473,797 | | | | 14,376 | | | | 6,998,518 | |
| | | Service | | | 13,594 | | | | 13,784 | | | | 13,840 | |
| | | Investor | | | 43,061 | | | | 240,334 | | | | 188,700 | |
| | | Class R6 | | | 316,274 | | | | 7,381,004 | | | | 320,010 | |
| | | Class R | | | 13,513 | | | | 13,703 | | | | 13,760 | |
| | | Total Net Assets | | $ | 7,137,020 | | | $ | 7,755,265 | | | $ | 7,756,092 | |
| | | Shares Outstanding $0.001 par value (unlimited number of shares authorized): | |
| | | Class A | | | 25,187 | | | | 10,688 | | | | 20,463 | |
| | | Institutional | | | 586,038 | | | | 1,656 | | | | 643,018 | |
| | | Service | | | 1,237 | | | | 1,597 | | | | 1,278 | |
| | | Investor | | | 3,915 | | | | 27,776 | | | | 17,389 | |
| | | Class R6 | | | 28,651 | | | | 849,741 | | | | 29,418 | |
| | | Class R | | | 1,231 | | | | 1,594 | | | | 1,274 | |
| | | Net asset value, offering and redemption price per share:(b) | | | | | | | | | | | | |
| | | Class A | | | $10.99 | | | | $8.61 | | | | $10.81 | |
| | | Institutional | | | 11.05 | | | | 8.68 | | | | 10.88 | |
| | | Service | | | 10.99 | | | | 8.63 | | | | 10.83 | |
| | | Investor | | | 11.00 | | | | 8.65 | | | | 10.85 | |
| | | Class R6 | | | 11.04 | | | | 8.69 | | | | 10.88 | |
| | | Class R | | | 10.97 | (c) | | | 8.60 | | | | 10.80 | |
| | (a) | | Segregated for initial margin and/or collateral. |
| | (b) | | Maximum public offering price per share for Class A Shares of the Target Date 2035, Target Date 2040 and Target Date 2045 Portfolios is $11.63, $9.11 and $11.44, respectively. |
| | (c) | | Net asset value may not recalculate due to rounding of fractional shares. |
| | |
| 36 | | The accompanying notes are an integral part of these financial statements. |
GOLDMAN SACHS TARGET DATE PORTFOLIOS
Statements of Assets and Liabilities (continued)
August 31, 2020
| | | | | | | | | | | | | | |
| | | | |
| | | | | Target Date 2050
Portfolio | | | Target Date 2055
Portfolio | | | Target Date 2060
Portfolio | |
| | Assets: | |
| | Investments of unaffiliated issuers, at value (cost $719,348, $765,605 and $844,951) | | $ | 776,176 | | | $ | 823,639 | | | $ | 904,999 | |
| | Investments of affiliated issuers, at value (cost $5,333,765, $5,602,124 and $6,543,058) | | | 6,187,880 | | | | 6,506,509 | | | | 7,583,579 | |
| | Cash | | | 118,170 | | | | 114,409 | | | | 132,113 | |
| | Receivables: | | | | | | | | | | | | |
| | Collateral on futures contracts(a) | | | 25,960 | | | | 25,960 | | | | 25,960 | |
| | Reimbursement from investment adviser | | | 5,882 | | | | 18,319 | | | | 20,578 | |
| | Portfolio shares sold | | | 1,347 | | | | 181 | | | | — | |
| | Other assets | | | 56,900 | | | | 56,921 | | | | 52,632 | |
| | Total assets | | | 7,172,315 | | | | 7,545,938 | | | | 8,719,861 | |
| | | | | | | | | | | | | | |
| | Liabilities: | |
| | Variation margin on futures contracts | | | 1,716 | | | | 1,716 | | | | 1,716 | |
| | Payables: | | | | | | | | | | | | |
| | Management fees | | | 290 | | | | 306 | | | | 359 | |
| | Distribution and Service fees and Transfer Agency fees | | | 388 | | | | 364 | | | | 182 | |
| | Accrued expenses | | | 87,435 | | | | 86,744 | | | | 110,895 | |
| | Total liabilities | | | 89,829 | | | | 89,130 | | | | 113,152 | |
| | | | | | | | | | | | | | |
| | Net Assets: | |
| | Paid-in capital | | | 5,992,932 | | | | 6,533,378 | | | | 7,398,590 | |
| | Total distributable earnings | | | 1,089,554 | | | | 923,430 | | | | 1,208,119 | |
| | | NET ASSETS | | $ | 7,082,486 | | | $ | 7,456,808 | | | $ | 8,606,709 | |
| | | Net Assets: | | | | | | | | | | | | |
| | | Class A | | $ | 686,790 | | | $ | 199,428 | | | $ | 43,668 | |
| | | Institutional | | | 21,281 | | | | 6,920,673 | | | | 12,051 | |
| | | Service | | | 13,952 | | | | 14,113 | | | | 11,911 | |
| | | Investor | | | 145,128 | | | | 273,589 | | | | 12,013 | |
| | | Class R6 | | | 6,201,464 | | | | 34,971 | | | | 8,515,193 | |
| | | Class R | | | 13,871 | | | | 14,034 | | | | 11,873 | |
| | | Total Net Assets | | $ | 7,082,486 | | | $ | 7,456,808 | | | $ | 8,606,709 | |
| | | Shares Outstanding $0.001 par value (unlimited number of shares authorized): | |
| | | Class A | | | 70,711 | | | | 19,056 | | | | 3,780 | |
| | | Institutional | | | 2,173 | | | | 656,678 | | | | 1,040 | |
| | | Service | | | 1,432 | | | | 1,346 | | | | 1,031 | |
| | | Investor | | | 14,864 | | | | 26,045 | | | | 1,037 | |
| | | Class R6 | | | 633,109 | | | | 3,309 | | | | 734,543 | |
| | | Class R | | | 1,426 | | | | 1,346 | | | | 1,029 | |
| | | Net asset value, offering and redemption price per share:(b) | | | | | | | | | | | | |
| | | Class A | | | $9.71 | | | | $10.47 | | | | $11.55 | |
| | | Institutional | | | 9.79 | | | | 10.54 | | | | 11.59 | |
| | | Service | | | 9.74 | | | | 10.48 | (c) | | | 11.55 | |
| | | Investor | | | 9.76 | | | | 10.50 | | | | 11.58 | |
| | | Class R6 | | | 9.80 | | | | 10.57 | | | | 11.59 | |
| | | Class R | | | 9.73 | | | | 10.43 | | | | 11.54 | |
| | (a) | | Segregated for initial margin and/or collateral. |
| | (b) | | Maximum public offering price per share for Class A Shares of the Target Date 2050, Target Date 2055 and Target Date 2060 Portfolios is $10.28, $11.08 and $12.22, respectively. |
| | (c) | | Net asset value may not recalculate due to rounding of fractional shares. |
| | |
| The accompanying notes are an integral part of these financial statements. | | 37 |
GOLDMAN SACHS TARGET DATE PORTFOLIOS
Statements of Operations
For the Fiscal Year Ended August 31, 2020
| | | | | | | | | | | | | | |
| | | | |
| | | | | Target Date Retirement
Portfolio | | | Target Date 2025
Portfolio | | | Target Date 2030
Portfolio | |
| | Investment income: | |
| | | | |
| | Dividends — unaffiliated issuers | | $ | 54,677 | | | $ | 50,185 | | | $ | 27,550 | |
| | | | |
| | Dividends — affiliated issuers | | | 111,101 | | | | 121,478 | | | | 82,962 | |
| | | | |
| | Interest | | | 70 | | | | 66 | | | | 53 | |
| | | | |
| | Total investment income | | | 165,848 | | | | 171,729 | | | | 110,565 | |
| | | | | | | | | | | | | | |
| | Expenses: | |
| | | | |
| | Registration fees | | | 86,896 | | | | 86,869 | | | | 86,782 | |
| | | | |
| | Professional fees | | | 84,577 | | | | 82,938 | | | | 84,577 | |
| | | | |
| | Trustee fees | | | 29,404 | | | | 29,408 | | | | 29,358 | |
| | | | |
| | Printing and mailing costs | | | 23,402 | | | | 24,402 | | | | 22,176 | |
| | | | |
| | Custody, accounting and administrative services | | | 18,441 | | | | 22,943 | | | | 18,821 | |
| | | | |
| | Management fees | | | 17,967 | | | | 18,773 | | | | 11,994 | |
| | | | |
| | Transfer Agency fees(a) | | | 3,371 | | | | 3,640 | | | | 3,491 | |
| | | | |
| | Distribution and Service fees(a) | | | 307 | | | | 701 | | | | 665 | |
| | | | |
| | Other | | | 5,638 | | | | 5,754 | | | | 5,459 | |
| | | | |
| | Total expenses | | | 270,003 | | | | 275,428 | | | | 263,323 | |
| | | | |
| | Less — expense reductions | | | (259,096 | ) | | | (264,409 | ) | | | (255,099 | ) |
| | | | |
| | Net expenses | | | 10,907 | | | | 11,019 | | | | 8,224 | |
| | | | |
| | NET INVESTMENT INCOME | | | 154,941 | | | | 160,710 | | | | 102,341 | |
| | | | | | | | | | | | | | |
| | Realized and unrealized gain (loss): | |
| | | | |
| | Net realized gain from: | | | | | | | | | | | | |
| | | | |
| | Investments — unaffiliated issuers | | | 90,308 | | | | 86,456 | | | | 57,236 | |
| | | | |
| | Investments — affiliated issuers | | | 148,096 | | | | 135,977 | | | | 120,223 | |
| | | | |
| | Futures contracts | | | 25,150 | | | | 2,789 | | | | (1,370 | ) |
| | | | |
| | Net change in unrealized gain (loss) on: | | | | | | | | | | | | |
| | | | |
| | Investments — unaffiliated issuers | | | (35,873 | ) | | | (39,415 | ) | | | (40,857 | ) |
| | | | |
| | Investments — affiliated issuers | | | 238,645 | | | | 381,408 | | | | 268,000 | |
| | | | |
| | Futures contracts | | | 53,253 | | | | 29,493 | | | | 13,597 | |
| | | | |
| | Net realized and unrealized gain | | | 519,579 | | | | 596,708 | | | | 416,829 | |
| | | | |
| | NET INCREASE IN NET ASSETS RESULTING FROM OPERATIONS | | $ | 674,520 | | | $ | 757,418 | | | $ | 519,170 | |
| | (a) | | Class specific Distribution and/or Service and Transfer Agency fees were as follows: |
| | | | | | | | | | | | | | | | | | | | | | | | | | | | | | | | | | | | |
| | | Distribution and/or Service Fees | | | Transfer Agency Fees | |
Portfolio | | Class A | | | Service | | | Class R | | | Class A | | | Institutional | | | Service | | | Investor | | | Class R6 | | | Class R | |
Target Date Retirement | | $ | 189 | | | $ | 59 | | | $ | 59 | | | $ | 128 | | | $ | 5 | | | $ | 5 | | | $ | 1,324 | | | $ | 1,889 | | | $ | 20 | |
Target Date 2025 | | | 580 | | | | 61 | | | | 60 | | | | 394 | | | | 2,678 | | | | 5 | | | | 455 | | | | 87 | | | | 21 | |
Target Date 2030 | | | 541 | | | | 62 | | | | 62 | | | | 368 | | | | 6 | | | | 5 | | | | 2,099 | | | | 992 | | | | 21 | |
| | |
| 38 | | The accompanying notes are an integral part of these financial statements. |
GOLDMAN SACHS TARGET DATE PORTFOLIOS
Statements of Operations (continued)
For the Fiscal Year Ended August 31, 2020
| | | | | | | | | | | | | | |
| | | | |
| | | | | Target Date 2035
Portfolio | | | Target Date 2040
Portfolio | | | Target Date 2045
Portfolio | |
| | Investment income: | |
| | | | |
| | Dividends — unaffiliated issuers | | $ | 33,880 | | | $ | 32,689 | | | $ | 30,154 | |
| | | | |
| | Dividends — affiliated issuers | | | 122,609 | | | | 129,678 | | | | 128,950 | |
| | | | |
| | Interest | | | 65 | | | | 87 | | | | 186 | |
| | | | |
| | Total investment income | | | 156,554 | | | | 162,454 | | | | 159,290 | |
| | | | | | | | | | | | | | |
| | Expenses: | |
| | | | |
| | Registration fees | | | 86,843 | | | | 86,915 | | | | 86,869 | |
| | | | |
| | Professional fees | | | 82,938 | | | | 84,577 | | | | 82,938 | |
| | | | |
| | Trustee fees | | | 29,395 | | | | 29,400 | | | | 29,404 | |
| | | | |
| | Printing and mailing costs | | | 24,849 | | | | 22,581 | | | | 24,856 | |
| | | | |
| | Custody, accounting and administrative services | | | 24,385 | | | | 19,561 | | | | 24,712 | |
| | | | |
| | Management fees | | | 17,238 | | | | 18,105 | | | | 18,460 | |
| | | | |
| | Transfer Agency fees(a) | | | 3,644 | | | | 2,898 | | | | 3,828 | |
| | | | |
| | Distribution and Service fees(a) | | | 735 | | | | 324 | | | | 584 | |
| | | | |
| | Other | | | 5,739 | | | | 5,629 | | | | 5,746 | |
| | | | |
| | Total expenses | | | 275,766 | | | | 269,990 | | | | 277,397 | |
| | | | |
| | Less — expense reductions | | | (266,451 | ) | | | (262,062 | ) | | | (269,277 | ) |
| | | | |
| | Net expenses | | | 9,315 | | | | 7,928 | | | | 8,120 | |
| | | | |
| | NET INVESTMENT INCOME | | | 147,239 | | | | 154,526 | | | | 151,170 | |
| | | | | | | | | | | | | | |
| | Realized and unrealized gain (loss): | |
| | | | |
| | Net realized gain (loss) from: | | | | | | | | | | | | |
| | | | |
| | Investments — unaffiliated issuers | | | 57,898 | | | | 48,102 | | | | 35,889 | |
| | | | |
| | Investments — affiliated issuers | | | 133,226 | | | | 129,702 | | | | 134,867 | |
| | | | |
| | Futures contracts | | | (15,590 | ) | | | (9,208 | ) | | | (16,781 | ) |
| | | | |
| | Net change in unrealized gain (loss) on: | | | | | | | | | | | | |
| | | | |
| | Investments — unaffiliated issuers | | | (47,548 | ) | | | (35,199 | ) | | | (28,954 | ) |
| | | | |
| | Investments — affiliated issuers | | | 502,422 | | | | 600,108 | | | | 648,251 | |
| | | | |
| | Futures contracts | | | 22,682 | | | | 24,938 | | | | 45,277 | |
| | | | |
| | Net realized and unrealized gain | | | 653,090 | | | | 758,443 | | | | 818,549 | |
| | | | |
| | NET INCREASE IN NET ASSETS RESULTING FROM OPERATIONS | | $ | 800,329 | | | $ | 912,969 | | | $ | 969,719 | |
| | (a) | | Class specific Distribution and/or Service and Transfer Agency fees were as follows: |
| | | | | | | | | | | | | | | | | | | | | | | | | | | | | | | | | | | | |
| | | Distribution and/or Service Fees | | | Transfer Agency Fees | |
Portfolio | | Class A | | | Service | | | Class R | | | Class A | | | Institutional | | | Service | | | Investor | | | Class R6 | | | Class R | |
Target Date 2035 | | $ | 610 | | | $ | 63 | | | $ | 62 | | | $ | 415 | | | $ | 2,382 | | | $ | 5 | | | $ | 752 | | | $ | 69 | | | $ | 21 | |
Target Date 2040 | | | 198 | | | | 63 | | | | 63 | | | | 135 | | | | 5 | | | | 5 | | | | 722 | | | | 2,010 | | | | 21 | |
Target Date 2045 | | | 458 | | | | 63 | | | | 63 | | | | 312 | | | | 2,547 | | | | 5 | | | | 850 | | | | 93 | | | | 21 | |
| | |
| The accompanying notes are an integral part of these financial statements. | | 39 |
GOLDMAN SACHS TARGET DATE PORTFOLIOS
Statements of Operations (continued)
For the Fiscal Year Ended August 31, 2020
| | | | | | | | | | | | | | |
| | | | |
| | | | | Target Date 2050
Portfolio | | | Target Date 2055
Portfolio | | | Target Date 2060
Portfolio | |
| | Investment income: | |
| | | | |
| | Dividends — unaffiliated issuers | | $ | 26,772 | | | $ | 28,784 | | | $ | 29,911 | |
| | | | |
| | Dividends — affiliated issuers | | | 117,851 | | | | 121,587 | | | | 132,168 | |
| | | | |
| | Interest | | | 186 | | | | 189 | | | | 188 | |
| | | | |
| | Total investment income | | | 144,809 | | | | 150,560 | | | | 162,267 | |
| | | | | | | | | | | | | | |
| | Expenses: | |
| | | | |
| | Registration fees | | | 86,844 | | | | 86,835 | | | | 90,285 | |
| | | | |
| | Professional fees | | | 84,577 | | | | 82,958 | | | | 92,284 | |
| | | | |
| | Trustee fees | | | 29,390 | | | | 29,396 | | | | 29,413 | |
| | | | |
| | Printing and mailing costs | | | 24,115 | | | | 24,490 | | | | 19,231 | |
| | | | |
| | Custody, accounting and administrative services | | | 21,140 | | | | 23,060 | | | | 32,272 | |
| | | | |
| | Management fees | | | 16,777 | | | | 17,496 | | | | 19,443 | |
| | | | |
| | Transfer Agency fees(a) | | | 3,489 | | | | 3,636 | | | | 2,408 | |
| | | | |
| | Distribution and Service fees(a) | | | 1,390 | | | | 579 | | | | 185 | |
| | | | |
| | Other | | | 5,671 | | | | 5,732 | | | | 1,717 | |
| | | | |
| | Total expenses | | | 273,393 | | | | 274,182 | | | | 287,238 | |
| | | | |
| | Less — expense reductions | | | (265,106 | ) | | | (266,470 | ) | | | (281,504 | ) |
| | | | |
| | Net expenses | | | 8,287 | | | | 7,712 | | | | 5,734 | |
| | | | |
| | NET INVESTMENT INCOME | | | 136,522 | | | | 142,848 | | | | 156,533 | |
| | | | | | | | | | | | | | |
| | Realized and unrealized gain (loss): | |
| | | | |
| | Net realized gain (loss) from: | | | | | | | | | | | | |
| | | | |
| | Investments — unaffiliated issuers | | | 30,579 | | | | 30,681 | | | | 28,262 | |
| | | | |
| | Investments — affiliated issuers | | | 141,747 | | | | 106,364 | | | | 41,596 | |
| | | | |
| | Futures contracts | | | (22,523 | ) | | | (22,523 | ) | | | 10,297 | |
| | | | |
| | Net change in unrealized gain (loss) on: | | | | | | | | | | | | |
| | | | |
| | Investments — unaffiliated issuers | | | (23,131 | ) | | | (22,786 | ) | | | (20,756 | ) |
| | | | |
| | Investments — affiliated issuers | | | 585,503 | | | | 633,491 | | | | 765,242 | |
| | | | |
| | Futures contracts | | | 51,025 | | | | 51,025 | | | | 51,010 | |
| | | | |
| | Net realized and unrealized gain | | | 763,200 | | | | 776,252 | | | | 875,651 | |
| | | | |
| | NET INCREASE IN NET ASSETS RESULTING FROM OPERATIONS | | $ | 899,722 | | | $ | 919,100 | | | $ | 1,032,184 | |
| | (a) | | Class specific Distribution and/or Service and Transfer Agency fees were as follows: |
| | | | | | | | | | | | | | | | | | | | | | | | | | | | | | | | | | | | |
| | | Distribution and/or Service Fees | | | Transfer Agency Fees | |
Portfolio | | Class A | | | Service | | | Class R | | | Class A | | | Institutional | | | Service | | | Investor | | | Class R6 | | | Class R | |
Target Date 2050 | | $ | 1,263 | | | $ | 64 | | | $ | 63 | | | $ | 859 | | | $ | 7 | | | $ | 5 | | | $ | 908 | | | $ | 1,689 | | | $ | 21 | |
Target Date 2055 | | | 451 | | | | 64 | | | | 64 | | | | 306 | | | | 2,515 | | | | 5 | | | | 773 | | | | 15 | | | | 22 | |
Target Date 2060 | | | 77 | | | | 54 | | | | 54 | | | | 52 | | | | 4 | | | | 4 | | | | 19 | | | | 2,311 | | | | 18 | |
| | |
| 40 | | The accompanying notes are an integral part of these financial statements. |
GOLDMAN SACHS TARGET DATE PORTFOLIOS
Statements of Changes in Net Assets
| | | | | | | | | | | | | | | | | | | | | | |
| | | | | Target Date Retirement Portfolio | | | | | | Target Date 2025 Portfolio | |
| | | | | For the Fiscal
Year Ended
August 31, 2020 | | | For the Fiscal
Year Ended
August 31, 2019 | | | | | | For the Fiscal
Year Ended
August 31, 2020 | | | For the Fiscal
Year Ended
August 31, 2019 | |
| | From operations: | |
| | | | | | |
| | Net investment income | | $ | 154,941 | | | $ | 371,708 | | | | | | | $ | 160,710 | | | $ | 200,928 | |
| | | | | | |
| | Net realized gain | | | 263,554 | | | | 387,305 | | | | | | | | 225,222 | | | | 225,679 | |
| | | | | | |
| | Net change in unrealized gain (loss) | | | 256,025 | | | | (1,212,240 | ) | | | | | | | 371,486 | | | | (115,433 | ) |
| | Net increase (decrease) in net assets resulting from operations | | | 674,520 | | | | (453,227 | ) | | | | | | | 757,418 | | | | 311,174 | |
| | | | | | | | | | | | | | | | | | | | | | |
| | Distributions to shareholders: | |
| | | | | | |
| | From distributable earnings: | | | | | | | | | | | | | | | | | | | | |
| | | | | | |
| | Class A Shares | | | (1,140 | ) | | | (3,345 | ) | | | | | | | (12,240 | ) | | | (10,582 | ) |
| | | | | | |
| | Institutional Shares | | | (478 | ) | | | (710 | ) | | | | | | | (387,364 | ) | | | (431,780 | ) |
| | | | | | |
| | Service Shares | | | (415 | ) | | | (650 | ) | | | | | | | (652 | ) | | | (744 | ) |
| | | | | | |
| | Investor Shares | | | (47,136 | ) | | | (60,097 | ) | | | | | | | (34,076 | ) | | | (29,361 | ) |
| | | | | | |
| | Class R6 Shares | | | (245,286 | ) | | | (2,212,945 | ) | | | | | | | (688 | ) | | | (13,097 | ) |
| | | | | | |
| | Class R Shares | | | (399 | ) | | | (734 | ) | | | | | | | (633 | ) | | | (724 | ) |
| | | | | | |
| | Total distributions to shareholders | | | (294,854 | ) | | | (2,278,481 | ) | | | | | | | (435,653 | ) | | | (486,288 | ) |
| | | | | | | | | | | | | | | | | | | | | | |
| | From share transactions: | |
| | | | | | |
| | Proceeds from sales of shares | | | 539,558 | | | | 6,063,428 | | | | | | | | 638,635 | | | | 547,404 | |
| | | | | | |
| | Reinvestment of distributions | | | 294,854 | | | | 2,278,481 | | | | | | | | 435,653 | | | | 486,288 | |
| | | | | | |
| | Cost of shares redeemed in connection with in-kind transactions | | | — | | | | (39,184,399 | ) | | | | | | | — | | | | — | |
| | | | | | |
| | Cost of shares redeemed | | | (1,156,350 | ) | | | (4,853,436 | ) | | | | | | | (1,192,551 | ) | | | (4,433,685 | ) |
| | | | | | |
| | Net decrease in net assets resulting from share transactions | | | (321,938 | ) | | | (35,695,926 | ) | | | | | | | (118,263 | ) | | | (3,399,993 | ) |
| | | | | | |
| | TOTAL INCREASE (DECREASE) | | | 57,728 | | | | (38,427,634 | ) | | | | | | | 203,502 | | | | (3,575,107 | ) |
| | | | | | | | | | | | | | | | | | | | | | |
| | Net assets: | |
| | Beginning of year | | | 7,458,053 | | | | 45,885,687 | | | | | | | | 7,839,529 | | | | 11,414,636 | |
| | | | | | |
| | End of year | | $ | 7,515,781 | | | $ | 7,458,053 | | | | | | | $ | 8,043,031 | | | $ | 7,839,529 | |
| | |
| The accompanying notes are an integral part of these financial statements. | | 41 |
GOLDMAN SACHS TARGET DATE PORTFOLIOS
Statements of Changes in Net Assets (continued)
| | | | | | | | | | | | | | | | | | | | | | |
| | | | | Target Date 2030 Portfolio | | | | | | Target Date 2035 Portfolio | |
| | | | | For the Fiscal
Year Ended
August 31, 2020 | | | For the Fiscal
Year Ended
August 31, 2019 | | | | | | For the Fiscal
Year Ended
August 31, 2020 | | | For the Fiscal
Year Ended
August 31, 2019 | |
| | From operations: | | | | | |
| | | | | | |
| | Net investment income | | $ | 102,341 | | | $ | 404,328 | | | | | | | $ | 147,239 | | | $ | 187,666 | |
| | | | | | |
| | Net realized gain | | | 176,089 | | | | 4,292,784 | | | | | | | | 175,534 | | | | 530,916 | |
| | | | | | |
| | Net change in unrealized gain (loss) | | | 240,740 | | | | (7,324,371 | ) | | | | | | | 477,556 | | | | (608,672 | ) |
| | Net increase (decrease) in net assets resulting from operations | | | 519,170 | | | | (2,627,259 | ) | | | | | | | 800,329 | | | | 109,910 | |
| | | | | | | | | | | | | | | | | | | | | | |
| | Distributions to shareholders: | | | | | |
| | | | | | |
| | From distributable earnings: | | | | | | | | | | | | | | | | | | | | |
| | | | | | |
| | Class A Shares | | | (34,879 | ) | | | (20,039 | ) | | | | | | | (21,487 | ) | | | (11,723 | ) |
| | | | | | |
| | Institutional Shares | | | (2,752 | ) | | | (812 | ) | | | | | | | (547,186 | ) | | | (479,189 | ) |
| | | | | | |
| | Service Shares | | | (1,856 | ) | | | (2,304 | ) | | | | | | | (1,100 | ) | | | (968 | ) |
| | | | | | |
| | Investor Shares | | | (289,355 | ) | | | (86,376 | ) | | | | | | | (94,718 | ) | | | (81,425 | ) |
| | | | | | |
| | Class R6 Shares | | | (560,445 | ) | | | (4,054,743 | ) | | | | | | | (10,110 | ) | | | (23,390 | ) |
| | | | | | |
| | Class R Shares | | | (2,088 | ) | | | (1,772 | ) | | | | | | | (1,079 | ) | | | (955 | ) |
| | | | | | |
| | Total distributions to shareholders | | | (891,375 | ) | | | (4,166,046 | ) | | | | | | | (675,680 | ) | | | (597,650 | ) |
| | | | | | | | | | | | | | | | | | | | | | |
| | From share transactions: | | | | | |
| | | | | | |
| | Proceeds from sales of shares | | | 484,441 | | | | 3,493,800 | | | | | | | | 349,451 | | | | 645,080 | |
| | | | | | |
| | Reinvestment of distributions | | | 891,375 | | | | 4,166,046 | | | | | | | | 675,680 | | | | 597,650 | |
| | | | | | |
| | Cost of shares redeemed in connection with in-kind transactions | | | — | | | | (65,474,000 | ) | | | | | | | — | | | | — | |
| | | | | | |
| | Cost of shares redeemed | | | (1,750,172 | ) | | | (6,463,976 | ) | | | | | | | (1,556,149 | ) | | | (5,700,240 | ) |
| | | | | | |
| | Net decrease in net assets resulting from share transactions | | | (374,356 | ) | | | (64,278,130 | ) | | | | | | | (531,018 | ) | | | (4,457,510 | ) |
| | | | | | |
| | TOTAL DECREASE | | | (746,561 | ) | | | (71,071,435 | ) | | | | | | | (406,369 | ) | | | (4,945,250 | ) |
| | | | | | | | | | | | | | | | | | | | | | |
| | Net assets: | | | | | |
| | Beginning of year | | | 5,625,372 | | | | 76,696,807 | | | | | | | | 7,543,389 | | | | 12,488,639 | |
| | | | | | |
| | End of year | | $ | 4,878,811 | | | $ | 5,625,372 | | | | | | | $ | 7,137,020 | | | $ | 7,543,389 | |
| | |
| 42 | | The accompanying notes are an integral part of these financial statements. |
GOLDMAN SACHS TARGET DATE PORTFOLIOS
Statements of Changes in Net Assets (continued)
| | | | | | | | | | | | | | | | | | | | | | |
| | | | | Target Date 2040 Portfolio | | | | | | Target Date 2045 Portfolio | |
| | | | | For the Fiscal
Year Ended
August 31, 2020 | | | For the Fiscal
Year Ended
August 31, 2019 | | | | | | For the Fiscal
Year Ended
August 31, 2020 | | | For the Fiscal
Year Ended
August 31, 2019 | |
| | From operations: | | | | | |
| | | | | | |
| | Net investment income | | $ | 154,526 | | | $ | 328,242 | | | | | | | $ | 151,170 | | | $ | 181,974 | |
| | | | | | |
| | Net realized gain | | | 168,596 | | | | 3,265,622 | | | | | | | | 153,975 | | | | 635,114 | |
| | | | | | |
| | Net change in unrealized gain (loss) | | | 589,847 | | | | (5,362,396 | ) | | | | | | | 664,574 | | | | (885,598 | ) |
| | Net increase (decrease) in net assets resulting from operations | | | 912,969 | | | | (1,768,532 | ) | | | | | | | 969,719 | | | | (68,510 | ) |
| | | | | | | | | | | | | | | | | | | | | | |
| | Distributions to shareholders: | | | | | |
| | | | | | |
| | From distributable earnings: | | | | | | | | | | | | | | | | | | | | |
| | | | | | |
| | Class A Shares | | | (12,663 | ) | | | (3,694 | ) | | | | | | | (18,008 | ) | | | (10,785 | ) |
| | | | | | |
| | Institutional Shares | | | (2,111 | ) | | | (904 | ) | | | | | | | (682,308 | ) | | | (588,234 | ) |
| | | | | | |
| | Service Shares | | | (2,016 | ) | | | (840 | ) | | | | | | | (1,301 | ) | | | (1,126 | ) |
| | | | | | |
| | Investor Shares | | | (117,436 | ) | | | (48,648 | ) | | | | | | | (104,090 | ) | | | (66,026 | ) |
| | | | | | |
| | Class R6 Shares | | | (1,081,445 | ) | | | (3,240,146 | ) | | | | | | | (27,396 | ) | | | (32,290 | ) |
| | | | | | |
| | Class R Shares | | | (1,994 | ) | | | (2,512 | ) | | | | | | | (1,279 | ) | | | (3,843 | ) |
| | | | | | |
| | Total distributions to shareholders | | | (1,217,665 | ) | | | (3,296,744 | ) | | | | | | | (834,382 | ) | | | (702,304 | ) |
| | | | | | | | | | | | | | | | | | | | | | |
| | From share transactions: | | | | | |
| | | | | | |
| | Proceeds from sales of shares | | | 290,469 | | | | 6,381,873 | | | | | | | | 273,466 | | | | 758,057 | |
| | | | | | |
| | Reinvestment of distributions | | | 1,217,665 | | | | 3,296,744 | | | | | | | | 834,382 | | | | 702,304 | |
| | | | | | |
| | Cost of shares redeemed in connection with in-kind transactions | | | — | | | | (40,635,861 | ) | | | | | | | — | | | | — | |
| | | | | | |
| | Cost of shares redeemed | | | (1,281,436 | ) | | | (6,308,790 | ) | | | | | | | (1,480,861 | ) | | | (5,197,424 | ) |
| | | | | | |
| | Net increase (decrease) in net assets resulting from share transactions | | | 226,698 | | | | (37,266,034 | ) | | | | | | | (373,013 | ) | | | (3,737,063 | ) |
| | | | | | |
| | TOTAL DECREASE | | | (77,998 | ) | | | (42,331,310 | ) | | | | | | | (237,676 | ) | | | (4,507,877 | ) |
| | | | | | | | | | | | | | | | | | | | | | |
| | Net assets: | | | | | |
| | Beginning of year | | | 7,833,263 | | | | 50,164,573 | | | | | | | | 7,993,768 | | | | 12,501,645 | |
| | | | | | |
| | End of year | | $ | 7,755,265 | | | $ | 7,833,263 | | | | | | | $ | 7,756,092 | | | $ | 7,993,768 | |
| | |
| The accompanying notes are an integral part of these financial statements. | | 43 |
GOLDMAN SACHS TARGET DATE PORTFOLIOS
Statements of Changes in Net Assets (continued)
| | | | | | | | | | | | | | | | | | | | | | |
| | | | | Target Date 2050 Portfolio | | | | | | Target Date 2055 Portfolio | |
| | | | | For the Fiscal
Year Ended
August 31, 2020 | | | For the Fiscal
Year Ended
August 31, 2019 | | | | | | For the Fiscal
Year Ended
August 31, 2020 | | | For the Fiscal
Year Ended
August 31, 2019 | |
| | From operations: | | | | | | | | | | | | | | | | | | | | |
| | | | | | |
| | Net investment income | | $ | 136,522 | | | $ | 230,419 | | | | | | | $ | 142,848 | | | $ | 170,346 | |
| | | | | | |
| | Net realized gain | | | 149,803 | | | | 2,307,202 | | | | | | | | 114,522 | | | | 757,011 | |
| | | | | | |
| | Net change in unrealized gain (loss) | | | 613,397 | | | | (3,700,006 | ) | | | | | | | 661,730 | | | | (1,135,912 | ) |
| | Net increase (decrease) in net assets resulting from operations | | | 899,722 | | | | (1,162,385 | ) | | | | | | | 919,100 | | | | (208,555 | ) |
| | | | | | | | | | | | | | | | | | | | | | |
| | Distributions to shareholders: | | | | | |
| | | | | | |
| | From distributable earnings: | | | | | | | | | | | | | | | | | | | | |
| | | | | | |
| | Class A Shares | | | (62,375 | ) | | | (15,098 | ) | | | | | | | (23,251 | ) | | | (13,894 | ) |
| | | | | | |
| | Institutional Shares | | | (2,782 | ) | | | (872 | ) | | | | | | | (818,684 | ) | | | (697,581 | ) |
| | | | | | |
| | Service Shares | | | (1,962 | ) | | | (751 | ) | | | | | | | (1,623 | ) | | | (1,388 | ) |
| | | | | | |
| | Investor Shares | | | (174,877 | ) | | | (58,460 | ) | | | | | | | (101,821 | ) | | | (64,947 | ) |
| | | | | | |
| | Class R6 Shares | | | (881,219 | ) | | | (1,765,302 | ) | | | | | | | (1,811 | ) | | | (22,950 | ) |
| | | | | | |
| | Class R Shares | | | (1,938 | ) | | | (734 | ) | | | | | | | (1,604 | ) | | | (4,246 | ) |
| | | | | | |
| | Total distributions to shareholders | | | (1,125,153 | ) | | | (1,841,217 | ) | | | | | | | (948,794 | ) | | | (805,006 | ) |
| | | | | | | | | | | | | | | | | | | | | | |
| | From share transactions: | | | | | |
| | | | | | |
| | Proceeds from sales of shares | | | 522,755 | | | | 5,794,899 | | | | | | | | 254,128 | | | | 518,657 | |
| | | | | | |
| | Reinvestment of distributions | | | 1,125,153 | | | | 1,841,217 | | | | | | | | 948,794 | | | | 805,006 | |
| | | | | | |
| | Cost of shares redeemed in connection with in-kind transactions | | | — | | | | (23,832,062 | ) | | | | | | | — | | | | — | |
| | | | | | |
| | Cost of shares redeemed | | | (1,524,870 | ) | | | (4,181,735 | ) | | | | | | | (1,144,815 | ) | | | (5,531,329 | ) |
| | | | | | |
| | Net increase (decrease) in net assets resulting from share transactions | | | 123,038 | | | | (20,377,681 | ) | | | | | | | 58,107 | | | | (4,207,666 | ) |
| | | | | | |
| | TOTAL INCREASE (DECREASE) | | | (102,393 | ) | | | (23,381,283 | ) | | | | | | | 28,413 | | | | (5,221,227 | ) |
| | | | | | | | | | | | | | | | | | | | | | |
| | Net assets: | | | | | |
| | Beginning of year | | | 7,184,879 | | | | 30,566,162 | | | | | | | | 7,428,395 | | | | 12,649,622 | |
| | | | | | |
| | End of year | | $ | 7,082,486 | | | $ | 7,184,879 | | | | | | | $ | 7,456,808 | | | $ | 7,428,395 | |
| | |
| 44 | | The accompanying notes are an integral part of these financial statements. |
GOLDMAN SACHS TARGET DATE PORTFOLIOS
Statements of Changes in Net Assets (continued)
| | | | | | | | | | |
| | | | | Target Date 2060 Portfolio | |
| | | | | For the Fiscal
Year Ended
August 31, 2020 | | | For the Fiscal
Year Ended
August 31, 2019 | |
| | From operations: | |
| | | |
| | Net investment income | | $ | 156,533 | | | $ | 152,800 | |
| | | |
| | Net realized gain (loss) | | | 80,155 | | | | (64,879 | ) |
| | | |
| | Net change in unrealized gain | | | 795,496 | | | | 149,826 | |
| | Net increase (decrease) in net assets resulting from operations | | | 1,032,184 | | | | 237,747 | |
| | | | | | | | | | |
| | Distributions to shareholders: | |
| | | |
| | From distributable earnings: | | | | | | | | |
| | | |
| | Class A Shares | | | (476 | ) | | | (125 | ) |
| | | |
| | Institutional Shares | | | (257 | ) | | | (151 | ) |
| | | |
| | Service Shares | | | (204 | ) | | | (118 | ) |
| | | |
| | Investor Shares | | | (243 | ) | | | (142 | ) |
| | | |
| | Class R6 Shares | | | (182,658 | ) | | | (107,558 | ) |
| | | |
| | Class R Shares | | | (190 | ) | | | (108 | ) |
| | | |
| | Total distributions to shareholders | | | (184,028 | ) | | | (108,202 | ) |
| | | | | | | | | | |
| | From share transactions: | |
| | | |
| | Proceeds from sales of shares | | | 56,024 | | | | 2,060,204 | |
| | | |
| | Reinvestment of distributions | | | 184,028 | | | | 108,202 | |
| | | |
| | Cost of shares redeemed | | | (8,539 | ) | | | (1,268 | ) |
| | | |
| | Net increase in net assets resulting from share transactions | | | 231,513 | | | | 2,167,138 | |
| | | |
| | TOTAL INCREASE | | | 1,079,669 | | | | 2,296,683 | |
| | | | | | | | | | |
| | Net assets: | |
| | Beginning of year | | | 7,527,040 | | | | 5,230,357 | |
| | | |
| | End of year | | $ | 8,606,709 | | | $ | 7,527,040 | |
| | |
| The accompanying notes are an integral part of these financial statements. | | 45 |
GOLDMAN SACHS TARGET DATE RETIREMENT PORTFOLIO
Financial Highlights
Selected Share Data for a Share Outstanding Throughout Each Period
| | | | | | | | | | | | | | | | | | | | | | |
| | | | | Goldman Sachs Target Date Retirement Portfolio | |
| | | | | Class A Shares | |
| | | | | Year Ended August 31, | | | Period
November 1, 2016 –
August 31, 2017* | | | Period Ended
October 31, 2016(a) | |
| | | | | 2020 | | | 2019 | | | 2018 | |
| | Per Share Data | |
| | | | | | |
| | Net asset value, beginning of period | | $ | 9.49 | | | $ | 9.38 | | | $ | 9.93 | | | $ | 9.90 | | | $ | 10.05 | |
| | | | | | |
| | Net investment income(b) | | | 0.16 | | | | 0.21 | | | | 0.14 | | | | 0.10 | | | | 0.02 | |
| | | | | | |
| | Net realized and unrealized gain (loss) | | | 0.70 | | | | 0.48 | | | | 0.14 | | | | 0.47 | | | | (0.17 | ) |
| | | | | | |
| | Total from investment operations | | | 0.86 | | | | 0.69 | | | | 0.28 | | | | 0.57 | | | | (0.15 | ) |
| | | | | | |
| | Distributions to shareholders from net investment income | | | (0.18 | ) | | | (0.21 | ) | | | (0.16 | ) | | | (0.16 | ) | | | — | |
| | | | | | |
| | Distributions to shareholders from net realized gains | | | (0.15 | ) | | | (0.37 | ) | | | (0.67 | ) | | | (0.38 | ) | | | — | |
| | | | | | |
| | Total distributions | | | (0.33 | ) | | | (0.58 | ) | | | (0.83 | ) | | | (0.54 | ) | | | — | |
| | | | | | |
| | Net asset value, end of period | | $ | 10.02 | | | $ | 9.49 | | | $ | 9.38 | | | $ | 9.93 | | | $ | 9.90 | |
| | | | | | |
| | Total return(c) | | | 9.25 | % | | | 8.09 | % | | | 2.89 | % | | | 6.06 | % | | | (1.49 | )% |
| | | | | | |
| | Net assets, end of period (in 000s) | | $ | 160 | | | $ | 66 | | | $ | 57 | | | $ | 16 | | | $ | 10 | |
| | | | | | |
| | Ratio of net expenses to average net assets(d) | | | 0.53 | % | | | 0.58 | % | | | 0.70 | % | | | 0.72 | %(e) | | | 0.74 | %(e) |
| | | | | | |
| | Ratio of total expenses to average net assets(d) | | | 3.98 | % | | | 4.95 | % | | | 1.31 | % | | | 1.26 | %(e) | | | 3.01 | %(e) |
| | | | | | |
| | Ratio of net investment income to average net assets | | | 1.67 | % | | | 2.36 | % | | | 1.45 | % | | | 1.21 | %(e) | | | 0.94 | %(e) |
| | | | | | |
| | Portfolio turnover rate(f) | | | 45 | % | | | 180 | % | | | 200 | % | | | 189 | % | | | 204 | % |
| | * | | The Portfolio changed its fiscal year end from October 31 to August 31. |
| | (a) | | Commenced operations on August 22, 2016. |
| | (b) | | Calculated based on the average shares outstanding methodology. |
| | (c) | | Assumes investment at the NAV at the beginning of the period, reinvestment of all dividends and distributions, a complete redemption of the investment at the NAV at the end of the period and no sales or redemption charges (if any). Total returns would be reduced if a sales or redemption charge was taken into account. Returns do not reflect the impact of taxes to shareholders relating to Portfolio distributions or the redemption of Portfolio shares. Total returns for periods less than one full year are not annualized. |
| | (d) | | Expense ratios exclude the expenses of the Underlying Funds in which the Portfolio invests. |
| | (f) | | The Portfolio’s turnover rate is calculated in accordance with regulatory requirements, without regard to transactions involving short term investments. If such transactions were included, the Portfolio’s turnover rate may be higher. |
| | |
| 46 | | The accompanying notes are an integral part of these financial statements. |
GOLDMAN SACHS TARGET DATE RETIREMENT PORTFOLIO
Financial Highlights (continued)
Selected Share Data for a Share Outstanding Throughout Each Period
| | | | | | | | | | | | | | | | | | | | | | |
| | | | | Goldman Sachs Target Date Retirement Portfolio | |
| | | | | Institutional Shares | |
| | | | | Year Ended August 31, | | | Period
November 1, 2016 –
August 31, 2017* | | | Period Ended
October 31, 2016(a) | |
| | | | | 2020 | | | 2019 | | | 2018 | |
| | Per Share Data | |
| | | | | | |
| | Net asset value, beginning of period | | $ | 9.55 | | | $ | 9.42 | | | $ | 9.96 | | | $ | 9.91 | | | $ | 10.05 | |
| | | | | | |
| | Net investment income(b) | | | 0.20 | | | | 0.24 | | | | 0.18 | | | | 0.13 | | | | 0.03 | |
| | | | | | |
| | Net realized and unrealized gain (loss) | | | 0.69 | | | | 0.50 | | | | 0.14 | | | | 0.48 | | | | (0.17 | ) |
| | | | | | |
| | Total from investment operations | | | 0.89 | | | | 0.74 | | | | 0.32 | | | | 0.61 | | | | (0.14 | ) |
| | | | | | |
| | Distributions to shareholders from net investment income | | | (0.23 | ) | | | (0.24 | ) | | | (0.19 | ) | | | (0.18 | ) | | | — | |
| | | | | | |
| | Distributions to shareholders from net realized gains | | | (0.15 | ) | | | (0.37 | ) | | | (0.67 | ) | | | (0.38 | ) | | | — | |
| | | | | | |
| | Total distributions | | | (0.38 | ) | | | (0.61 | ) | | | (0.86 | ) | | | (0.56 | ) | | | — | |
| | | | | | |
| | Net asset value, end of period | | $ | 10.06 | | | $ | 9.55 | | | $ | 9.42 | | | $ | 9.96 | | | $ | 9.91 | |
| | | | | | |
| | Total return(c) | | | 9.57 | % | | | 8.58 | % | | | 3.33 | % | | | 6.42 | % | | | (1.39 | )% |
| | | | | | |
| | Net assets, end of period (in 000s) | | $ | 13 | | | $ | 12 | | | $ | 11 | | | $ | 10 | | | $ | 10 | |
| | | | | | |
| | Ratio of net expenses to average net assets(d) | | | 0.15 | % | | | 0.18 | % | | | 0.30 | % | | | 0.32 | %(e) | | | 0.34 | %(e) |
| | | | | | |
| | Ratio of total expenses to average net assets(d) | | | 3.73 | % | | | 4.73 | % | | | 0.81 | % | | | 0.96 | %(e) | | | 2.61 | %(e) |
| | | | | | |
| | Ratio of net investment income to average net assets | | | 2.15 | % | | | 2.69 | % | | | 1.93 | % | | | 1.66 | %(e) | | | 1.34 | %(e) |
| | | | | | |
| | Portfolio turnover rate(f) | | | 45 | % | | | 180 | % | | | 200 | % | | | 189 | % | | | 204 | % |
| | * | | The Portfolio changed its fiscal year end from October 31 to August 31. |
| | (a) | | Commenced operations on August 22, 2016. |
| | (b) | | Calculated based on the average shares outstanding methodology. |
| | (c) | | Assumes investment at the NAV at the beginning of the period, reinvestment of all dividends and distributions, a complete redemption of the investment at the NAV at the end of the period and no sales or redemption charges (if any). Total returns would be reduced if a sales or redemption charge was taken into account. Returns do not reflect the impact of taxes to shareholders relating to Portfolio distributions or the redemption of Portfolio shares. Total returns for periods less than one full year are not annualized. |
| | (d) | | Expense ratios exclude the expenses of the Underlying Funds in which the Portfolio invests. |
| | (f) | | The Portfolio’s turnover rate is calculated in accordance with regulatory requirements, without regard to transactions involving short term investments. If such transactions were included, the Portfolio’s turnover rate may be higher. |
| | |
| The accompanying notes are an integral part of these financial statements. | | 47 |
GOLDMAN SACHS TARGET DATE RETIREMENT PORTFOLIO
Financial Highlights (continued)
Selected Share Data for a Share Outstanding Throughout Each Period
| | | | | | | | | | | | | | | | | | | | | | |
| | | | | Goldman Sachs Target Date Retirement Portfolio | |
| | | | | Service Shares | |
| | | | | Year Ended August 31, | | | Period
November 1, 2016 –
August 31, 2017* | | | Period Ended
October 31, 2016(a) | |
| | | | | 2020 | | | 2019 | | | 2018 | |
| | Per Share Data | |
| | | | | | |
| | Net asset value, beginning of period | | $ | 9.51 | | | $ | 9.38 | | | $ | 9.93 | | | $ | 9.90 | | | $ | 10.05 | |
| | | | | | |
| | Net investment income(b) | | | 0.16 | | | | 0.20 | | | | 0.14 | | | | 0.09 | | | | 0.02 | |
| | | | | | |
| | Net realized and unrealized gain (loss) | | | 0.69 | | | | 0.49 | | | | 0.12 | | | | 0.48 | | | | (0.17 | ) |
| | | | | | |
| | Total from investment operations | | | 0.85 | | | | 0.69 | | | | 0.26 | | | | 0.57 | | | | (0.15 | ) |
| | | | | | |
| | Distributions to shareholders from net investment income | | | (0.19 | ) | | | (0.19 | ) | | | (0.14 | ) | | | (0.16 | ) | | | — | |
| | | | | | |
| | Distributions to shareholders from net realized gains | | | (0.15 | ) | | | (0.37 | ) | | | (0.67 | ) | | | (0.38 | ) | | | — | |
| | | | | | |
| | Total distributions | | | (0.34 | ) | | | (0.56 | ) | | | (0.81 | ) | | | (0.54 | ) | | | — | |
| | | | | | |
| | Net asset value, end of period | | $ | 10.02 | | | $ | 9.51 | | | $ | 9.38 | | | $ | 9.93 | | | $ | 9.90 | |
| | | | | | |
| | Total return(c) | | | 9.09 | % | | | 8.04 | % | | | 2.73 | % | | | 6.02 | % | | | (1.49 | )% |
| | | | | | |
| | Net assets, end of period (in 000s) | | $ | 13 | | | $ | 12 | | | $ | 11 | | | $ | 10 | | | $ | 10 | |
| | | | | | |
| | Ratio of net expenses to average net assets(d) | | | 0.65 | % | | | 0.69 | % | | | 0.80 | % | | | 0.82 | %(e) | | | 0.84 | %(e) |
| | | | | | |
| | Ratio of total expenses to average net assets(d) | | | 4.24 | % | | | 5.23 | % | | | 1.31 | % | | | 1.46 | %(e) | | | 3.11 | %(e) |
| | | | | | |
| | Ratio of net investment income to average net assets | | | 1.65 | % | | | 2.19 | % | | | 1.43 | % | | | 1.16 | %(e) | | | 0.84 | %(e) |
| | | | | | |
| | Portfolio turnover rate(f) | | | 45 | % | | | 180 | % | | | 200 | % | | | 189 | % | | | 204 | % |
| | * | | The Portfolio changed its fiscal year end from October 31 to August 31. |
| | (a) | | Commenced operations on August 22, 2016. |
| | (b) | | Calculated based on the average shares outstanding methodology. |
| | (c) | | Assumes investment at the NAV at the beginning of the period, reinvestment of all dividends and distributions, a complete redemption of the investment at the NAV at the end of the period and no sales or redemption charges (if any). Total returns would be reduced if a sales or redemption charge was taken into account. Returns do not reflect the impact of taxes to shareholders relating to Portfolio distributions or the redemption of Portfolio shares. Total returns for periods less than one full year are not annualized. |
| | (d) | | Expense ratios exclude the expenses of the Underlying Funds in which the Portfolio invests. |
| | (f) | | The Portfolio’s turnover rate is calculated in accordance with regulatory requirements, without regard to transactions involving short term investments. If such transactions were included, the Portfolio’s turnover rate may be higher. |
| | |
| 48 | | The accompanying notes are an integral part of these financial statements. |
GOLDMAN SACHS TARGET DATE RETIREMENT PORTFOLIO
Financial Highlights (continued)
Selected Share Data for a Share Outstanding Throughout Each Period
| | | | | | | | | | | | | | | | | | | | | | |
| | | | | Goldman Sachs Target Date Retirement Portfolio | |
| | | | | Investor Shares | |
| | | | | Year Ended August 31, | | | Period
November 1, 2016 –
August 31, 2017* | | | Period Ended
October 31, 2016(a) | |
| | | | | 2020 | | | 2019 | | | 2018 | |
| | Per Share Data | |
| | | | | | |
| | Net asset value, beginning of period | | $ | 9.53 | | | $ | 9.40 | | | $ | 9.95 | | | $ | 9.91 | | | $ | 10.05 | |
| | | | | | |
| | Net investment income(b) | | | 0.20 | | | | 0.23 | | | | 0.17 | | | | 0.09 | | | | 0.02 | |
| | | | | | |
| | Net realized and unrealized gain (loss) | | | 0.68 | | | | 0.49 | | | | 0.13 | | | | 0.50 | | | | (0.16 | ) |
| | | | | | |
| | Total from investment operations | | | 0.88 | | | | 0.72 | | | | 0.30 | | | | 0.59 | | | | (0.14 | ) |
| | | | | | |
| | Distributions to shareholders from net investment income | | | (0.22 | ) | | | (0.22 | ) | | | (0.18 | ) | | | (0.17 | ) | | | — | |
| | | | | | |
| | Distributions to shareholders from net realized gains | | | (0.15 | ) | | | (0.37 | ) | | | (0.67 | ) | | | (0.38 | ) | | | — | |
| | | | | | |
| | Total distributions | | | (0.37 | ) | | | (0.59 | ) | | | (0.85 | ) | | | (0.55 | ) | | | — | |
| | | | | | |
| | Net asset value, end of period | | $ | 10.04 | | | $ | 9.53 | | | $ | 9.40 | | | $ | 9.95$ | | | | 9.91 | |
| | | | | | |
| | Total return(c) | | | 9.46 | % | | | 8.44 | % | | | 3.19 | % | | | 6.26 | % | | | (1.39 | )% |
| | | | | | |
| | Net assets, end of period (in 000s) | | $ | 505 | | | $ | 1,180 | | | $ | 894 | | | $ | 323 | | | $ | 10 | |
| | | | | | |
| | Ratio of net expenses to average net assets(d) | | | 0.28 | % | | | 0.32 | % | | | 0.45 | % | | | 0.46 | %(e) | | | 0.48 | %(e) |
| | | | | | |
| | Ratio of total expenses to average net assets(d) | | | 3.97 | % | | | 4.95 | % | | | 0.97 | % | | | 1.07 | %(e) | | | 2.75 | %(e) |
| | | | | | |
| | Ratio of net investment income to average net assets | | | 2.12 | % | | | 2.53 | % | | | 1.78 | % | | | 1.08 | %(e) | | | 1.19 | %(e) |
| | | | | | |
| | Portfolio turnover rate(f) | | | 45 | % | | | 180 | % | | | 200 | % | | | 189 | % | | | 204 | % |
| | * | | The Portfolio changed its fiscal year end from October 31 to August 31. |
| | (a) | | Commenced operations on August 22, 2016. |
| | (b) | | Calculated based on the average shares outstanding methodology. |
| | (c) | | Assumes investment at the NAV at the beginning of the period, reinvestment of all dividends and distributions, a complete redemption of the investment at the NAV at the end of the period and no sales or redemption charges (if any). Total returns would be reduced if a sales or redemption charge was taken into account. Returns do not reflect the impact of taxes to shareholders relating to Portfolio distributions or the redemption of Portfolio shares. Total returns for periods less than one full year are not annualized. |
| | (d) | | Expense ratios exclude the expenses of the Underlying Funds in which the Portfolio invests. |
| | (f) | | The Portfolio’s turnover rate is calculated in accordance with regulatory requirements, without regard to transactions involving short term investments. If such transactions were included, the Portfolio’s turnover rate may be higher. |
| | |
| The accompanying notes are an integral part of these financial statements. | | 49 |
GOLDMAN SACHS TARGET DATE RETIREMENT PORTFOLIO
Financial Highlights (continued)
Selected Share Data for a Share Outstanding Throughout Each Period
| | | | | | | | | | | | | | | | | | | | | | | | | | |
| | | | | Goldman Sachs Target Date Retirement Portfolio | |
| | | | | Class R6 Shares | |
| | | | | Year Ended August 31, | | | Period
November 1, 2016 – August 31, 2017* | | | Year Ended October 31, | |
| | | | | 2020 | | | 2019 | | | 2018 | | | 2016 | | | 2015 | |
| | Per Share Data | |
| | | | | | | |
| | Net asset value, beginning of period | | $ | 9.55 | | | $ | 9.42 | | | $ | 9.96 | | | $ | 9.91 | | | $ | 10.07 | | | $ | 10.00 | |
| | | | | | | |
| | Net investment income(a) | | | 0.21 | | | | 0.22 | | | | 0.19 | | | | 0.14 | | | | 0.18 | | | | 0.16 | |
| | | | | | | |
| | Net realized and unrealized gain | | | 0.69 | | | | 0.52 | | | | 0.13 | | | | 0.47 | | | | 0.16 | | | | 0.10 | |
| | | | | | | |
| | Total from investment operations | | | 0.90 | | | | 0.74 | | | | 0.32 | | | | 0.61 | | | | 0.34 | | | | 0.26 | |
| | | | | | | |
| | Distributions to shareholders from net investment income | | | (0.23 | ) | | | (0.24 | ) | | | (0.19 | ) | | | (0.18 | ) | | | (0.17 | ) | | | (0.09 | ) |
| | | | | | | |
| | Distributions to shareholders from net realized gains | | | (0.15 | ) | | | (0.37 | ) | | | (0.67 | ) | | | (0.38 | ) | | | (0.33 | ) | | | (0.10 | ) |
| | | | | | | |
| | Total distributions | | | (0.38 | ) | | | (0.61 | ) | | | (0.86 | ) | | | (0.56 | ) | | | (0.50 | ) | | | (0.19 | ) |
| | | | | | | |
| | Net asset value, end of period | | $ | 10.07 | | | $ | 9.55 | | | $ | 9.42 | | | $ | 9.96 | | | $ | 9.91 | | | $ | 10.07 | |
| | | | | | | |
| | Total return(b) | | | 9.69 | % | | | 8.58 | % | | | 3.33 | % | | | 6.42 | % | | | 3.65 | % | | | 2.61 | % |
| | | | | | | |
| | Net assets, end of period (in 000s) | | $ | 6,812 | | | $ | 6,176 | | | $ | 44,900 | | | $ | 47,589 | | | $ | 53,671 | | | $ | 53,619 | |
| | | | | | | |
| | Ratio of net expenses to average net assets(c) | | | 0.13 | % | | | 0.24 | % | | | 0.29 | % | | | 0.30 | %(d) | | | 0.31 | % | | | 0.30 | % |
| | | | | | | |
| | Ratio of total expenses to average net assets(c) | | | 3.73 | % | | | 2.46 | % | | | 0.80 | % | | | 0.94 | %(d) | | | 0.76 | % | | | 0.30 | % |
| | | | | | | |
| | Ratio of net investment income to average net assets | | | 2.17 | % | | | 2.44 | % | | | 1.95 | % | | | 1.69 | %(d) | | | 1.79 | % | | | 1.46 | % |
| | | | | | | |
| | Portfolio turnover rate(e) | | | 45 | % | | | 180 | % | | | 200 | % | | | 189 | % | | | 204 | % | | | 207 | % |
| | * | | The Portfolio changed its fiscal year end from October 31 to August 31. |
| | (a) | | Calculated based on the average shares outstanding methodology. |
| | (b) | | Assumes investment at the NAV at the beginning of the period, reinvestment of all dividends and distributions, a complete redemption of the investment at the NAV at the end of the period and no sales or redemption charges (if any). Total returns would be reduced if a sales or redemption charge was taken into account. Returns do not reflect the impact of taxes to shareholders relating to Portfolio distributions or the redemption of Portfolio shares. Total returns for periods less than one full year are not annualized. The Goldman Sachs Target Date Retirement Portfolio’s predecessor was the Madison Target Retirement 2020 Fund (the “Predecessor Fund”). On August 22, 2016, the Predecessor Fund was reorganized as a new series of Goldman Sachs Trust II. Performance prior to August 22, 2016 is that of the Predecessor Fund. Total return information of the Predecessor Fund is included in the above table because the Predecessor Fund is considered the accounting survivor of the reorganization. |
| | (c) | | Expense ratios exclude the expenses of the Underlying Funds in which the Portfolio invests. |
| | (e) | | The Portfolio’s turnover rate is calculated in accordance with regulatory requirements, without regard to transactions involving short term investments. If such transactions were included, the Portfolio’s turnover rate may be higher. |
| | |
| 50 | | The accompanying notes are an integral part of these financial statements. |
GOLDMAN SACHS TARGET DATE RETIREMENT PORTFOLIO
Financial Highlights (continued)
Selected Share Data for a Share Outstanding Throughout Each Period
| | | | | | | | | | | | | | | | | | | | | | |
| | | | | Goldman Sachs Target Date Retirement Portfolio | |
| | | | | Class R Shares | |
| | | | | Year Ended August 31, | | | Period
November 1, 2016 –
August 31, 2017* | | | Period Ended
October 31, 2016(a) | |
| | | | | 2020 | | | 2019 | | | 2018 | |
| | Per Share Data | |
| | | | | | |
| | Net asset value, beginning of period | | $ | 9.49 | | | $ | 9.37 | | | $ | 9.92 | | | $ | 9.90 | | | $ | 10.05 | |
| | | | | | |
| | Net investment income(b) | | | 0.14 | | | | 0.19 | | | | 0.12 | | | | 0.08 | | | | 0.01 | |
| | | | | | |
| | Net realized and unrealized gain (loss) | | | 0.70 | | | | 0.48 | | | | 0.13 | | | | 0.47 | | | | (0.16 | ) |
| | | | | | |
| | Total from investment operations | | | 0.84 | | | | 0.67 | | | | 0.25 | | | | 0.55 | | | | (0.15 | ) |
| | | | | | |
| | Distributions to shareholders from net investment income | | | (0.18 | ) | | | (0.18 | ) | | | (0.13 | ) | | | (0.15 | ) | | | — | |
| | | | | | |
| | Distributions to shareholders from net realized gains | | | (0.15 | ) | | | (0.37 | ) | | | (0.67 | ) | | | (0.38 | ) | | | — | |
| | | | | | |
| | Total distributions | | | (0.33 | ) | | | (0.55 | ) | | | (0.80 | ) | | | (0.53 | ) | | | — | |
| | | | | | |
| | Net asset value, end of period | | $ | 10.00 | | | $ | 9.49 | | | $ | 9.37 | | | $ | 9.92 | | | $ | 9.90 | |
| | | | | | |
| | Total return(c) | | | 8.97 | % | | | 7.82 | % | | | 2.61 | % | | | 5.86 | % | | | (1.49 | )% |
| | | | | | |
| | Net assets, end of period (in 000s) | | $ | 13 | | | $ | 12 | | | $ | 12 | | | $ | 10 | | | $ | 10 | |
| | | | | | |
| | Ratio of net expenses to average net assets(d) | | | 0.78 | % | | | 0.83 | % | | | 0.94 | % | | | 0.97 | %(e) | | | 0.98 | %(e) |
| | | | | | |
| | Ratio of total expenses to average net assets(d) | | | 4.36 | % | | | 5.27 | % | | | 1.45 | % | | | 1.61 | %(e) | | | 3.25 | %(e) |
| | | | | | |
| | Ratio of net investment income to average net assets | | | 1.52 | % | | | 2.10 | % | | | 1.29 | % | | | 1.01 | %(e) | | | 0.69 | %(e) |
| | | | | | |
| | Portfolio turnover rate(f) | | | 45 | % | | | 180 | % | | | 200 | % | | | 189 | % | | | 204 | % |
| | * | | The Portfolio changed its fiscal year end from October 31 to August 31. |
| | (a) | | Commenced operations on August 22, 2016. |
| | (b) | | Calculated based on the average shares outstanding methodology. |
| | (c) | | Assumes investment at the NAV at the beginning of the period, reinvestment of all dividends and distributions, a complete redemption of the investment at the NAV at the end of the period and no sales or redemption charges (if any). Total returns would be reduced if a sales or redemption charge was taken into account. Returns do not reflect the impact of taxes to shareholders relating to Portfolio distributions or the redemption of Portfolio shares. Total returns for periods less than one full year are not annualized. |
| | (d) | | Expense ratios exclude the expenses of the Underlying Funds in which the Portfolio invests. |
| | (f) | | The Portfolio’s turnover rate is calculated in accordance with regulatory requirements, without regard to transactions involving short term investments. If such transactions were included, the Portfolio’s turnover rate may be higher. |
| | |
| The accompanying notes are an integral part of these financial statements. | | 51 |
GOLDMAN SACHS TARGET DATE 2025 PORTFOLIO
Financial Highlights (continued)
Selected Share Data for a Share Outstanding Throughout Each Period
| | | | | | | | | | | | | | | | | | | | | | |
| | | | | Goldman Sachs Target Date 2025 Portfolio | |
| | | | | Class A Shares | |
| | | | | Year Ended August 31, | | | Period
November 1, 2016 –
August 31, 2017* | | | Period Ended
October 31, 2016(a) | |
| | | | | 2020 | | | 2019 | | | 2018 | |
| | Per Share Data | |
| | | | | | |
| | Net asset value, beginning of period | | $ | 10.81 | | | $ | 10.93 | | | $ | 10.61 | | | $ | 9.82 | | | $ | 10.00 | |
| | | | | | |
| | Net investment income(b) | | | 0.19 | | | | 0.22 | | | | 0.15 | | | | 0.12 | | | | 0.02 | |
| | | | | | |
| | Net realized and unrealized gain (loss) | | | 0.85 | | | | 0.38 | | | | 0.42 | | | | 0.75 | | | | (0.20 | ) |
| | | | | | |
| | Total from investment operations | | | 1.04 | | | | 0.60 | | | | 0.57 | | | | 0.87 | | | | (0.18 | ) |
| | | | | | |
| | Distributions to shareholders from net investment income | | | (0.20 | ) | | | (0.29 | ) | | | (0.12 | ) | | | (0.08 | ) | | | — | |
| | | | | | |
| | Distributions to shareholders from net realized gains | | | (0.38 | ) | | | (0.43 | ) | | | (0.13 | ) | | | — | | | | — | |
| | | | | | |
| | Total distributions | | | (0.58 | ) | | | (0.72 | ) | | | (0.25 | ) | | | (0.08 | ) | | | — | |
| | | | | | |
| | Net asset value, end of period | | $ | 11.27 | | | $ | 10.81 | | | $ | 10.93 | | | $ | 10.61 | | | $ | 9.82 | |
| | | | | | |
| | Total return(c) | | | 9.89 | % | | | 6.35 | % | | | 5.42 | % | | | 8.77 | % | | | (1.70 | )% |
| | | | | | |
| | Net assets, end of period (in 000s) | | $ | 255 | | | $ | 411 | | | $ | 152 | | | $ | 75 | | | $ | 10 | |
| | | | | | |
| | Ratio of net expenses to average net assets(d) | | | 0.51 | % | | | 0.52 | % | | | 0.69 | % | | | 0.71 | %(e) | | | 0.75 | %(e) |
| | | | | | |
| | Ratio of total expenses to average net assets(d) | | | 4.03 | % | | | 5.29 | % | | | 2.54 | % | | | 4.54 | %(e) | | | 4.23 | %(e) |
| | | | | | |
| | Ratio of net investment income to average net assets | | | 1.80 | % | | | 2.08 | % | | | 1.42 | % | | | 1.39 | %(e) | | | 1.01 | %(e) |
| | | | | | |
| | Portfolio turnover rate(f) | | | 41 | % | | | 146 | % | | | 177 | % | | | 167 | % | | | 33 | % |
| | * | | The Portfolio changed its fiscal year end from October 31 to August 31. |
| | (a) | | Commenced operations on August 22, 2016. |
| | (b) | | Calculated based on the average shares outstanding methodology. |
| | (c) | | Assumes investment at the NAV at the beginning of the period, reinvestment of all dividends and distributions, a complete redemption of the investment at the NAV at the end of the period and no sales or redemption charges (if any). Total returns would be reduced if a sales or redemption charge was taken into account. Returns do not reflect the impact of taxes to shareholders relating to Portfolio distributions or the redemption of Portfolio shares. Total returns for periods less than one full year are not annualized. |
| | (d) | | Expense ratios exclude the expenses of the Underlying Funds in which the Portfolio invests. |
| | (f) | | The Portfolio’s turnover rate is calculated in accordance with regulatory requirements, without regard to transactions involving short term investments. If such transactions were included, the Portfolio’s turnover rate may be higher. |
| | |
| 52 | | The accompanying notes are an integral part of these financial statements. |
GOLDMAN SACHS TARGET DATE 2025 PORTFOLIO
Financial Highlights (continued)
Selected Share Data for a Share Outstanding Throughout Each Period
| | | | | | | | | | | | | | | | | | | | | | |
| | | | | Goldman Sachs Target Date 2025 Portfolio | |
| | | | | Institutional Shares | |
| | | | | Year Ended August 31, | | | Period
November 1, 2016 –
August 31, 2017* | | | Period Ended
October 31, 2016(a) | |
| | | | | 2020 | | | 2019 | | | 2018 | |
| | Per Share Data | |
| | | | | | |
| | Net asset value, beginning of period | | $ | 10.82 | | | $ | 10.93 | | | $ | 10.65 | | | $ | 9.83 | | | $ | 10.00 | |
| | | | | | |
| | Net investment income(b) | | | 0.23 | | | | 0.26 | | | | 0.20 | | | | 0.14 | | | | 0.03 | |
| | | | | | |
| | Net realized and unrealized gain (loss) | | | 0.85 | | | | 0.38 | | | | 0.40 | | | | 0.76 | | | | (0.20 | ) |
| | | | | | |
| | Total from investment operations | | | 1.08 | | | | 0.64 | | | | 0.60 | | | | 0.90 | | | | (0.17 | ) |
| | | | | | |
| | Distributions to shareholders from net investment income | | | (0.25 | ) | | | (0.32 | ) | | | (0.19 | ) | | | (0.08 | ) | | | — | |
| | | | | | |
| | Distributions to shareholders from net realized gains | | | (0.38 | ) | | | (0.43 | ) | | | (0.13 | ) | | | — | | | | — | |
| | | | | | |
| | Total distributions | | | (0.63 | ) | | | (0.75 | ) | | | (0.32 | ) | | | (0.08 | ) | | | — | |
| | | | | | |
| | Net asset value, end of period | | $ | 11.27 | | | $ | 10.82 | | | $ | 10.93 | | | $ | 10.65 | | | $ | 9.83 | |
| | | | | | |
| | Total return(c) | | | 10.34 | % | | | 6.78 | % | | | 5.70 | % | | | 9.22 | % | | | (1.70 | )% |
| | | | | | |
| | Net assets, end of period (in 000s) | | $ | 7,217 | | | $ | 6,540 | | | $ | 10,655 | | | $ | 10,687 | | | $ | 9,783 | |
| | | | | | |
| | Ratio of net expenses to average net assets(d) | | | 0.13 | % | | | 0.18 | % | | | 0.30 | % | | | 0.32 | %(e) | | | 0.34 | %(e) |
| | | | | | |
| | Ratio of total expenses to average net assets(d) | | | 3.65 | % | | | 4.31 | % | | | 2.18 | % | | | 3.92 | %(e) | | | 3.85 | %(e) |
| | | | | | |
| | Ratio of net investment income to average net assets | | | 2.15 | % | | | 2.52 | % | | | 1.90 | % | | | 1.69 | %(e) | | | 1.42 | %(e) |
| | | | | | |
| | Portfolio turnover rate(f) | | | 41 | % | | | 146 | % | | | 177 | % | | | 167 | % | | | 33 | % |
| | * | | The Portfolio changed its fiscal year end from October 31 to August 31. |
| | (a) | | Commenced operations on August 22, 2016. |
| | (b) | | Calculated based on the average shares outstanding methodology. |
| | (c) | | Assumes investment at the NAV at the beginning of the period, reinvestment of all dividends and distributions, a complete redemption of the investment at the NAV at the end of the period and no sales or redemption charges (if any). Total returns would be reduced if a sales or redemption charge was taken into account. Returns do not reflect the impact of taxes to shareholders relating to Portfolio distributions or the redemption of Portfolio shares. Total returns for periods less than one full year are not annualized. |
| | (d) | | Expense ratios exclude the expenses of the Underlying Funds in which the Portfolio invests. |
| | (f) | | The Portfolio’s turnover rate is calculated in accordance with regulatory requirements, without regard to transactions involving short term investments. If such transactions were included, the Portfolio’s turnover rate may be higher. |
| | |
| The accompanying notes are an integral part of these financial statements. | | 53 |
GOLDMAN SACHS TARGET DATE 2025 PORTFOLIO
Financial Highlights (continued)
Selected Share Data for a Share Outstanding Throughout Each Period
| | | | | | | | | | | | | | | | | | | | | | |
| | | | | Goldman Sachs Target Date 2025 Portfolio | |
| | | | | Service Shares | |
| | | | | Year Ended August 31, | | | Period
November 1, 2016 –
August 31, 2017* | | | Period Ended
October 31, 2016(a) | |
| | | | | 2020 | | | 2019 | | | 2018 | |
| | Per Share Data | |
| | | | | | |
| | Net asset value, beginning of period | | $ | 10.78 | | | $ | 10.90 | | | $ | 10.62 | | | $ | 9.82 | | | $ | 10.00 | |
| | | | | | |
| | Net investment income(b) | | | 0.18 | | | | 0.22 | | | | 0.15 | | | | 0.10 | | | | 0.02 | |
| | | | | | |
| | Net realized and unrealized gain (loss) | | | 0.84 | | | | 0.36 | | | | 0.40 | | | | 0.76 | | | | (0.20 | ) |
| | | | | | |
| | Total from investment operations | | | 1.02 | | | | 0.58 | | | | 0.55 | | | | 0.86 | | | | (0.18 | ) |
| | | | | | |
| | Distributions to shareholders from net investment income | | | (0.20 | ) | | | (0.27 | ) | | | (0.14 | ) | | | (0.06 | ) | | | — | |
| | | | | | |
| | Distributions to shareholders from net realized gains | | | (0.38 | ) | | | (0.43 | ) | | | (0.13 | ) | | | — | | | | — | |
| | | | | | |
| | Total distributions | | | (0.58 | ) | | | (0.70 | ) | | | (0.27 | ) | | | (0.06 | ) | | | — | |
| | | | | | |
| | Net asset value, end of period | | $ | 11.22 | | | $ | 10.78 | | | $ | 10.90 | | | $ | 10.62 | | | $ | 9.82 | |
| | | | | | |
| | Total return(c) | | | 9.77 | % | | | 6.19 | % | | | 5.22 | % | | | 8.83 | % | | | (1.80 | )% |
| | | | | | |
| | Net assets, end of period (in 000s) | | $ | 13 | | | $ | 12 | | | $ | 11 | | | $ | 11 | | | $ | 10 | |
| | | | | | |
| | Ratio of net expenses to average net assets(d) | | | 0.63 | % | | | 0.66 | % | | | 0.80 | % | | | 0.81 | %(e) | | | 0.84 | %(e) |
| | | | | | |
| | Ratio of total expenses to average net assets(d) | | | 4.14 | % | | | 5.09 | % | | | 2.65 | % | | | 4.40 | %(e) | | | 4.32 | %(e) |
| | | | | | |
| | Ratio of net investment income to average net assets | | | 1.65 | % | | | 2.08 | % | | | 1.40 | % | | | 1.20 | %(e) | | | 0.91 | %(e) |
| | | | | | |
| | Portfolio turnover rate(f) | | | 41 | % | | | 146 | % | | | 177 | % | | | 167 | % | | | 33 | % |
| | * | | The Portfolio changed its fiscal year end from October 31 to August 31. |
| | (a) | | Commenced operations on August 22, 2016. |
| | (b) | | Calculated based on the average shares outstanding methodology. |
| | (c) | | Assumes investment at the NAV at the beginning of the period, reinvestment of all dividends and distributions, a complete redemption of the investment at the NAV at the end of the period and no sales or redemption charges (if any). Total returns would be reduced if a sales or redemption charge was taken into account. Returns do not reflect the impact of taxes to shareholders relating to Portfolio distributions or the redemption of Portfolio shares. Total returns for periods less than one full year are not annualized. |
| | (d) | | Expense ratios exclude the expenses of the Underlying Funds in which the Portfolio invests. |
| | (f) | | The Portfolio’s turnover rate is calculated in accordance with regulatory requirements, without regard to transactions involving short term investments. If such transactions were included, the Portfolio’s turnover rate may be higher. |
| | |
| 54 | | The accompanying notes are an integral part of these financial statements. |
GOLDMAN SACHS TARGET DATE 2025 PORTFOLIO
Financial Highlights (continued)
Selected Share Data for a Share Outstanding Throughout Each Period
| | | | | | | | | | | | | | | | | | | | | | |
| | | | | Goldman Sachs Target Date 2025 Portfolio | |
| | | | | Investor Shares | |
| | | | | Year Ended August 31, | | | Period
November 1, 2016 –
August 31, 2017* | | | Period Ended
October 31, 2016(a) | |
| | | | | 2020 | | | 2019 | | | 2018 | |
| | Per Share Data | |
| | | | | | |
| | Net asset value, beginning of period | | $ | 10.79 | | | $ | 10.91 | | | $ | 10.64 | | | $ | 9.83 | | | $ | 10.00 | |
| | | | | | |
| | Net investment income(b) | | | 0.26 | | | | 0.25 | | | | 0.19 | | | | 0.12 | | | | 0.02 | |
| | | | | | |
| | Net realized and unrealized gain (loss) | | | 0.81 | | | | 0.37 | | | | 0.40 | | | | 0.76 | | | | (0.19 | ) |
| | | | | | |
| | Total from investment operations | | | 1.07 | | | | 0.62 | | | | 0.59 | | | | 0.88 | | | | (0.17 | ) |
| | | | | | |
| | Distributions to shareholders from net investment income | | | (0.24 | ) | | | (0.31 | ) | | | (0.19 | ) | | | (0.07 | ) | | | — | |
| | | | | | |
| | Distributions to shareholders from net realized gains | | | (0.38 | ) | | | (0.43 | ) | | | (0.13 | ) | | | — | | | | — | |
| | | | | | |
| | Total distributions | | | (0.62 | ) | | | (0.74 | ) | | | (0.32 | ) | | | (0.07 | ) | | | — | |
| | | | | | |
| | Net asset value, end of period | | $ | 11.24 | | | $ | 10.79 | | | $ | 10.91 | | | $ | 10.64 | | | $ | 9.83 | |
| | | | | | |
| | Total return(c) | | | 10.24 | % | | | 6.59 | % | | | 5.59 | % | | | 9.06 | % | | | (1.70 | )% |
| | | | | | |
| | Net assets, end of period (in 000s) | | $ | 37 | | | $ | 585 | | | $ | 373 | | | $ | 35 | | | $ | 10 | |
| | | | | | |
| | Ratio of net expenses to average net assets(d) | | | 0.26 | % | | | 0.30 | % | | | 0.44 | % | | | 0.46 | %(e) | | | 0.49 | %(e) |
| | | | | | |
| | Ratio of total expenses to average net assets(d) | | | 4.07 | % | | | 4.81 | % | | | 2.30 | % | | | 5.20 | %(e) | | | 3.97 | %(e) |
| | | | | | |
| | Ratio of net investment income to average net assets | | | 2.35 | % | | | 2.40 | % | | | 1.74 | % | | | 1.37 | %(e) | | | 1.27 | %(e) |
| | | | | | |
| | Portfolio turnover rate(f) | | | 41 | % | | | 146 | % | | | 177 | % | | | 167 | % | | | 33 | % |
| | * | | The Portfolio changed its fiscal year end from October 31 to August 31. |
| | (a) | | Commenced operations on August 22, 2016. |
| | (b) | | Calculated based on the average shares outstanding methodology. |
| | (c) | | Assumes investment at the NAV at the beginning of the period, reinvestment of all dividends and distributions, a complete redemption of the investment at the NAV at the end of the period and no sales or redemption charges (if any). Total returns would be reduced if a sales or redemption charge was taken into account. Returns do not reflect the impact of taxes to shareholders relating to Portfolio distributions or the redemption of Portfolio shares. Total returns for periods less than one full year are not annualized. |
| | (d) | | Expense ratios exclude the expenses of the Underlying Funds in which the Portfolio invests. |
| | (f) | | The Portfolio’s turnover rate is calculated in accordance with regulatory requirements, without regard to transactions involving short term investments. If such transactions were included, the Portfolio’s turnover rate may be higher. |
| | |
| The accompanying notes are an integral part of these financial statements. | | 55 |
GOLDMAN SACHS TARGET DATE 2025 PORTFOLIO
Financial Highlights (continued)
Selected Share Data for a Share Outstanding Throughout Each Period
| | | | | | | | | | | | | | | | | | | | | | |
| | | | | Goldman Sachs Target Date 2025 Portfolio | |
| | | | | Class R6 Shares | |
| | | | | Year Ended August 31, | | | Period
November 1, 2016 –
August 31, 2017* | | | Period Ended
October 31, 2016(a) | |
| | | | | 2020 | | | 2019 | | | 2018 | |
| | Per Share Data | |
| | | | | | |
| | Net asset value, beginning of period | | $ | 10.82 | | | $ | 10.93 | | | $ | 10.65 | | | $ | 9.83 | | | $ | 10.00 | |
| | | | | | |
| | Net investment income(b) | | | 0.21 | | | | 0.26 | | | | 0.20 | | | | 0.14 | | | | 0.03 | |
| | | | | | |
| | Net realized and unrealized gain (loss) | | | 0.88 | | | | 0.39 | | | | 0.40 | | | | 0.76 | | | | (0.20 | ) |
| | | | | | |
| | Total from investment operations | | | 1.09 | | | | 0.65 | | | | 0.60 | | | | 0.90 | | | | (0.17 | ) |
| | | | | | |
| | Distributions to shareholders from net investment income | | | (0.23 | ) | | | (0.33 | ) | | | (0.19 | ) | | | (0.08 | ) | | | — | |
| | | | | | |
| | Distributions to shareholders from net realized gains | | | (0.38 | ) | | | (0.43 | ) | | | (0.13 | ) | | | — | | | | — | |
| | | | | | |
| | Total distributions | | | (0.61 | ) | | | (0.76 | ) | | | (0.32 | ) | | | (0.08 | ) | | | — | |
| | | | | | |
| | Net asset value, end of period | | $ | 11.30 | | | $ | 10.82 | | | $ | 10.93 | | | $ | 10.65 | | | $ | 9.83 | |
| | | | | | |
| | Total return(c) | | | 10.35 | % | | | 6.84 | % | | | 5.73 | % | | | 9.22 | % | | | (1.70 | )% |
| | | | | | |
| | Net assets, end of period (in 000s) | | $ | 509 | | | $ | 279 | | | $ | 213 | | | $ | 11 | | | $ | 10 | |
| | | | | | |
| | Ratio of net expenses to average net assets(d) | | | 0.11 | % | | | 0.14 | % | | | 0.28 | % | | | 0.31 | %(e) | | | 0.33 | %(e) |
| | | | | | |
| | Ratio of total expenses to average net assets(d) | | | 3.43 | % | | | 4.57 | % | | | 2.14 | % | | | 3.95 | %(e) | | | 3.92 | %(e) |
| | | | | | |
| | Ratio of net investment income to average net assets | | | 1.97 | % | | | 2.54 | % | | | 1.85 | % | | | 1.69 | %(e) | | | 1.43 | %(e) |
| | | | | | |
| | Portfolio turnover rate(f) | | | 41 | % | | | 146 | % | | | 177 | % | | | 167 | % | | | 33 | % |
| | * | | The Portfolio changed its fiscal year end from October 31 to August 31. |
| | (a) | | Commenced operations on August 22, 2016. |
| | (b) | | Calculated based on the average shares outstanding methodology. |
| | (c) | | Assumes investment at the NAV at the beginning of the period, reinvestment of all dividends and distributions, a complete redemption of the investment at the NAV at the end of the period and no sales or redemption charges (if any). Total returns would be reduced if a sales or redemption charge was taken into account. Returns do not reflect the impact of taxes to shareholders relating to Portfolio distributions or the redemption of Portfolio shares. Total returns for periods less than one full year are not annualized. |
| | (d) | | Expense ratios exclude the expenses of the Underlying Funds in which the Portfolio invests. |
| | (f) | | The Portfolio’s turnover rate is calculated in accordance with regulatory requirements, without regard to transactions involving short term investments. If such transactions were included, the Portfolio’s turnover rate may be higher. |
| | |
| 56 | | The accompanying notes are an integral part of these financial statements. |
GOLDMAN SACHS TARGET DATE 2025 PORTFOLIO
Financial Highlights (continued)
Selected Share Data for a Share Outstanding Throughout Each Period
| | | | | | | | | | | | | | | | | | | | | | |
| | | | | Goldman Sachs Target Date 2025 Portfolio | |
| | | | | Class R Shares | |
| | | | | Year Ended August 31, | | | Period
November 1, 2016 –
August 31, 2017* | | | Period Ended
October 31, 2016(a) | |
| | | | | 2020 | | | 2019 | | | 2018 | |
| | Per Share Data | |
| | | | | | |
| | Net asset value, beginning of period | | $ | 10.77 | | | $ | 10.88 | | | $ | 10.61 | | | $ | 9.82 | | | $ | 10.00 | |
| | | | | | |
| | Net investment income(b) | | | 0.16 | | | | 0.20 | | | | 0.14 | | | | 0.09 | | | | 0.01 | |
| | | | | | |
| | Net realized and unrealized gain (loss) | | | 0.85 | | | | 0.38 | | | | 0.38 | | | | 0.76 | | | | (0.19 | ) |
| | | | | | |
| | Total from investment operations | | | 1.01 | | | | 0.58 | | | | 0.52 | | | | 0.85 | | | | (0.18 | ) |
| | | | | | |
| | Distributions to shareholders from net investment income | | | (0.19 | ) | | | (0.26 | ) | | | (0.12 | ) | | | (0.06 | ) | | | — | |
| | | | | | |
| | Distributions to shareholders from net realized gains | | | (0.38 | ) | | | (0.43 | ) | | | (0.13 | ) | | | — | | | | — | |
| | | | | | |
| | Total distributions | | | (0.57 | ) | | | (0.69 | ) | | | (0.25 | ) | | | (0.06 | ) | | | — | |
| | | | | | |
| | Net asset value, end of period | | $ | 11.21 | | | $ | 10.77 | | | $ | 10.88 | | | $ | 10.61 | | | $ | 9.82 | |
| | | | | | |
| | Total return(c) | | | 9.63 | % | | | 6.11 | % | | | 4.98 | % | | | 8.67 | % | | | (1.80 | )% |
| | | | | | |
| | Net assets, end of period (in 000s) | | $ | 13 | | | $ | 12 | | | $ | 11 | | | $ | 11 | | | $ | 10 | |
| | | | | | |
| | Ratio of net expenses to average net assets(d) | | | 0.75 | % | | | 0.81 | % | | | 0.94 | % | | | 0.95 | %(e) | | | 0.99 | %(e) |
| | | | | | |
| | Ratio of total expenses to average net assets(d) | | | 4.26 | % | | | 5.13 | % | | | 2.80 | % | | | 4.54 | %(e) | | | 4.47 | %(e) |
| | | | | | |
| | Ratio of net investment income to average net assets | | | 1.53 | % | | | 1.94 | % | | | 1.26 | % | | | 1.06 | %(e) | | | 0.77 | %(e) |
| | | | | | |
| | Portfolio turnover rate(f) | | | 41 | % | | | 146 | % | | | 177 | % | | | 167 | % | | | 33 | % |
| | * | | The Portfolio changed its fiscal year end from October 31 to August 31. |
| | (a) | | Commenced operations on August 22, 2016. |
| | (b) | | Calculated based on the average shares outstanding methodology. |
| | (c) | | Assumes investment at the NAV at the beginning of the period, reinvestment of all dividends and distributions, a complete redemption of the investment at the NAV at the end of the period and no sales or redemption charges (if any). Total returns would be reduced if a sales or redemption charge was taken into account. Returns do not reflect the impact of taxes to shareholders relating to Portfolio distributions or the redemption of Portfolio shares. Total returns for periods less than one full year are not annualized. |
| | (d) | | Expense ratios exclude the expenses of the Underlying Funds in which the Portfolio invests. |
| | (f) | | The Portfolio’s turnover rate is calculated in accordance with regulatory requirements, without regard to transactions involving short term investments. If such transactions were included, the Portfolio’s turnover rate may be higher. |
| | |
| The accompanying notes are an integral part of these financial statements. | | 57 |
GOLDMAN SACHS TARGET DATE 2030 PORTFOLIO
Financial Highlights (continued)
Selected Share Data for a Share Outstanding Throughout Each Period
| | | | | | | | | | | | | | | | | | | | | | |
| | | | | Goldman Sachs Target Date 2030 Portfolio | |
| | | | | Class A Shares | |
| | | | | Year Ended August 31, | | | Period
November 1, 2016 –
August 31, 2017* | | | Period Ended
October 31, 2016(a) | |
| | | | | 2020 | | | 2019 | | | 2018 | |
| | Per Share Data | |
| | | | | | |
| | Net asset value, beginning of period | | $ | 9.52 | | | $ | 9.68 | | | $ | 10.22 | | | $ | 9.74 | | | $ | 9.93 | |
| | | | | | |
| | Net investment income(b) | | | 0.14 | | | | 0.16 | | | | 0.13 | | | | 0.08 | | | | 0.02 | |
| | | | | | |
| | Net realized and unrealized gain (loss) | | | 0.72 | | | | 0.28 | | | | 0.54 | | | | 0.90 | | | | (0.21 | ) |
| | | | | | |
| | Total from investment operations | | | 0.86 | | | | 0.44 | | | | 0.67 | | | | 0.98 | | | | (0.19 | ) |
| | | | | | |
| | Distributions to shareholders from net investment income | | | (0.18 | ) | | | (0.16 | ) | | | (0.14 | ) | | | (0.18 | ) | | | — | |
| | | | | | |
| | Distributions to shareholders from net realized gains | | | (1.46 | ) | | | (0.44 | ) | | | (1.07 | ) | | | (0.32 | ) | | | — | |
| | | | | | |
| | Total distributions | | | (1.64 | ) | | | (0.60 | ) | | | (1.21 | ) | | | (0.50 | ) | | | — | |
| | | | | | |
| | Net asset value, end of period | | $ | 8.74 | | | $ | 9.52 | | | $ | 9.68 | | | $ | 10.22 | | | $ | 9.74 | |
| | | | | | |
| | Total return(c) | | | 10.04 | % | | | 5.09 | % | | | 6.93 | % | | | 10.47 | % | | | (1.91 | )% |
| | | | | | |
| | Net assets, end of period (in 000s) | | $ | 276 | | | $ | 204 | | | $ | 362 | | | $ | 205 | | | $ | 10 | |
| | | | | | |
| | Ratio of net expenses to average net assets(d) | | | 0.51 | % | | | 0.58 | % | | | 0.70 | % | | | 0.72 | %(e) | | | 0.74 | %(e) |
| | | | | | |
| | Ratio of total expenses to average net assets(d) | | | 5.78 | % | | | 5.37 | % | | | 0.86 | % | | | 0.99 | %(e) | | | 2.33 | %(e) |
| | | | | | |
| | Ratio of net investment income to average net assets | | | 1.71 | % | | | 1.74 | % | | | 1.34 | % | | | 0.99 | %(e) | | | 1.01 | %(e) |
| | | | | | |
| | Portfolio turnover rate(f) | | | 34 | % | | | 117 | % | | | 156 | % | | | 143 | % | | | 176 | % |
| | * | | The Portfolio changed its fiscal year end from October 31 to August 31. |
| | (a) | | Commenced operations on August 22, 2016. |
| | (b) | | Calculated based on the average shares outstanding methodology. |
| | (c) | | Assumes investment at the NAV at the beginning of the period, reinvestment of all dividends and distributions, a complete redemption of the investment at the NAV at the end of the period and no sales or redemption charges (if any). Total returns would be reduced if a sales or redemption charge was taken into account. Returns do not reflect the impact of taxes to shareholders relating to Portfolio distributions or the redemption of Portfolio shares. Total returns for periods less than one full year are not annualized. |
| | (d) | | Expense ratios exclude the expenses of the Underlying Funds in which the Portfolio invests. |
| | (f) | | The Portfolio’s turnover rate is calculated in accordance with regulatory requirements, without regard to transactions involving short term investments. If such transactions were included, the Portfolio’s turnover rate may be higher. |
| | |
| 58 | | The accompanying notes are an integral part of these financial statements. |
GOLDMAN SACHS TARGET DATE 2030 PORTFOLIO
Financial Highlights (continued)
Selected Share Data for a Share Outstanding Throughout Each Period
| | | | | | | | | | | | | | | | | | | | | | |
| | | | | Goldman Sachs Target Date 2030 Portfolio | |
| | | | | Institutional Shares | |
| | | | | Year Ended August 31, | | | Period
November 1, 2016 –
August 31, 2017* | | | Period Ended
October 31, 2016(a) | |
| | | | | 2020 | | | 2019 | | | 2018 | |
| | Per Share Data | |
| | | | | | |
| | Net asset value, beginning of period | | $ | 9.56 | | | $ | 9.72 | | | $ | 10.26 | | | $ | 9.75 | | | $ | 9.93 | |
| | | | | | |
| | Net investment income(b) | | | 0.18 | | | | 0.23 | | | | 0.18 | | | | 0.14 | | | | 0.03 | |
| | | | | | |
| | Net realized and unrealized gain (loss) | | | 0.73 | | | | 0.24 | | | | 0.52 | | | | 0.88 | | | | (0.21 | ) |
| | | | | | |
| | Total from investment operations | | | 0.91 | | | | 0.47 | | | | 0.70 | | | | 1.02 | | | | (0.18 | ) |
| | | | | | |
| | Distributions to shareholders from net investment income | | | (0.21 | ) | | | (0.19 | ) | | | (0.17 | ) | | | (0.19 | ) | | | — | |
| | | | | | |
| | Distributions to shareholders from net realized gains | | | (1.46 | ) | | | (0.44 | ) | | | (1.07 | ) | | | (0.32 | ) | | | — | |
| | | | | | |
| | Total distributions | | | (1.67 | ) | | | (0.63 | ) | | | (1.24 | ) | | | (0.51 | ) | | | — | |
| | | | | | |
| | Net asset value, end of period | | $ | 8.80 | | | $ | 9.56 | | | $ | 9.72 | | | $ | 10.26 | | | $ | 9.75 | |
| | | | | | |
| | Total return(c) | | | 10.55 | % | | | 5.52 | % | | | 7.29 | % | | | 10.87 | % | | | (1.81 | )% |
| | | | | | |
| | Net assets, end of period (in 000s) | | $ | 16 | | | $ | 15 | | | $ | 12 | | | $ | 11 | | | $ | 10 | |
| | | | | | |
| | Ratio of net expenses to average net assets(d) | | | 0.13 | % | | | 0.17 | % | | | 0.31 | % | | | 0.31 | %(e) | | | 0.34 | %(e) |
| | | | | | |
| | Ratio of total expenses to average net assets(d) | | | 5.42 | % | | | 6.22 | % | | | 0.49 | % | | | 0.75 | %(e) | | | 1.93 | %(e) |
| | | | | | |
| | Ratio of net investment income to average net assets | | | 2.13 | % | | | 2.45 | % | | | 1.84 | % | | | 1.69 | %(e) | | | 1.41 | %(e) |
| | | | | | |
| | Portfolio turnover rate(f) | | | 34 | % | | | 117 | % | | | 156 | % | | | 143 | % | | | 176 | % |
| | * | | The Portfolio changed its fiscal year end from October 31 to August 31. |
| | (a) | | Commenced operations on August 22, 2016. |
| | (b) | | Calculated based on the average shares outstanding methodology. |
| | (c) | | Assumes investment at the NAV at the beginning of the period, reinvestment of all dividends and distributions, a complete redemption of the investment at the NAV at the end of the period and no sales or redemption charges (if any). Total returns would be reduced if a sales or redemption charge was taken into account. Returns do not reflect the impact of taxes to shareholders relating to Portfolio distributions or the redemption of Portfolio shares. Total returns for periods less than one full year are not annualized. |
| | (d) | | Expense ratios exclude the expenses of the Underlying Funds in which the Portfolio invests. |
| | (f) | | The Portfolio’s turnover rate is calculated in accordance with regulatory requirements, without regard to transactions involving short term investments. If such transactions were included, the Portfolio’s turnover rate may be higher. |
| | |
| The accompanying notes are an integral part of these financial statements. | | 59 |
GOLDMAN SACHS TARGET DATE 2030 PORTFOLIO
Financial Highlights (continued)
Selected Share Data for a Share Outstanding Throughout Each Period
| | | | | | | | | | | | | | | | | | | | | | |
| | | | | Goldman Sachs Target Date 2030 Portfolio | |
| | | | | Service Shares | |
| | | | | Year Ended August 31, | | | Period
November 1, 2016 –
August 31, 2017* | | | Period Ended
October 31, 2016(a) | |
| | | | | 2020 | | | 2019 | | | 2018 | |
| | Per Share Data | |
| | | | | | |
| | Net asset value, beginning of period | | $ | 9.52 | | | $ | 9.68 | | | $ | 10.23 | | | $ | 9.74 | | | $ | 9.93 | |
| | | | | | |
| | Net investment income(b) | | | 0.14 | | | | 0.21 | | | | 0.13 | | | | 0.10 | | | | 0.02 | |
| | | | | | |
| | Net realized and unrealized gain (loss) | | | 0.73 | | | | 0.22 | | | | 0.52 | | | | 0.88 | | | | (0.21 | ) |
| | | | | | |
| | Total from investment operations | | | 0.87 | | | | 0.43 | | | | 0.65 | | | | 0.98 | | | | (0.19 | ) |
| | | | | | |
| | Distributions to shareholders from net investment income | | | — | | | | (0.15 | ) | | | (0.13 | ) | | | (0.17 | ) | | | — | |
| | | | | | |
| | Distributions to shareholders from net realized gains | | | (1.46 | ) | | | (0.44 | ) | | | (1.07 | ) | | | (0.32 | ) | | | — | |
| | | | | | |
| | Total distributions | | | (1.46 | ) | | | (0.59 | ) | | | (1.20 | ) | | | (0.49 | ) | | | — | |
| | | | | | |
| | Net asset value, end of period | | $ | 8.93 | | | $ | 9.52 | | | $ | 9.68 | | | $ | 10.23 | | | $ | 9.74 | |
| | | | | | |
| | Total return(c) | | | 10.01 | % | | | 5.01 | % | | | 6.71 | % | | | 10.47 | % | | | (1.91 | )% |
| | | | | | |
| | Net assets, end of period (in 000s) | | $ | 13 | | | $ | 12 | | | $ | 12 | | | $ | 11 | | | $ | 10 | |
| | | | | | |
| | Ratio of net expenses to average net assets(d) | | | 0.64 | % | | | 0.63 | % | | | 0.81 | % | | | 0.82 | %(e) | | | 0.83 | %(e) |
| | | | | | |
| | Ratio of total expenses to average net assets(d) | | | 5.92 | % | | | 8.75 | % | | | 0.99 | % | | | 1.26 | %(e) | | | 2.43 | %(e) |
| | | | | | |
| | Ratio of net investment income to average net assets | | | 1.62 | % | | | 2.31 | % | | | 1.34 | % | | | 1.19 | %(e) | | | 0.92 | %(e) |
| | | | | | |
| | Portfolio turnover rate(f) | | | 34 | % | | | 117 | % | | | 156 | % | | | 143 | % | | | 176 | % |
| | * | | The Portfolio changed its fiscal year end from October 31 to August 31. |
| | (a) | | Commenced operations on August 22, 2016. |
| | (b) | | Calculated based on the average shares outstanding methodology. |
| | (c) | | Assumes investment at the NAV at the beginning of the period, reinvestment of all dividends and distributions, a complete redemption of the investment at the NAV at the end of the period and no sales or redemption charges (if any). Total returns would be reduced if a sales or redemption charge was taken into account. Returns do not reflect the impact of taxes to shareholders relating to Portfolio distributions or the redemption of Portfolio shares. Total returns for periods less than one full year are not annualized. |
| | (d) | | Expense ratios exclude the expenses of the Underlying Funds in which the Portfolio invests. |
| | (f) | | The Portfolio’s turnover rate is calculated in accordance with regulatory requirements, without regard to transactions involving short term investments. If such transactions were included, the Portfolio’s turnover rate may be higher. |
| | |
| 60 | | The accompanying notes are an integral part of these financial statements. |
GOLDMAN SACHS TARGET DATE 2030 PORTFOLIO
Financial Highlights (continued)
Selected Share Data for a Share Outstanding Throughout Each Period
| | | | | | | | | | | | | | | | | | | | | | |
| | | | | Goldman Sachs Target Date 2030 Portfolio | |
| | | | | Investor Shares | |
| | | | | Year Ended August 31, | | | Period
November 1, 2016 –
August 31, 2017* | | | Period Ended
October 31, 2016(a) | |
| | | | | 2020 | | | 2019 | | | 2018 | |
| | Per Share Data | |
| | | | | | |
| | Net asset value, beginning of period | | $ | 9.53 | | | $ | 9.69 | | | $ | 10.25 | | | $ | 9.75 | | | $ | 9.93 | |
| | | | | | |
| | Net investment income(b) | | | 0.18 | | | | 0.21 | | | | 0.16 | | | | 0.11 | | | | 0.02 | |
| | | | | | |
| | Net realized and unrealized gain (loss) | | | 0.71 | | | | 0.25 | | | | 0.52 | | | | 0.90 | | | | (0.20 | ) |
| | | | | | |
| | Total from investment operations | | | 0.89 | | | | 0.46 | | | | 0.68 | | | | 1.01 | | | | (0.18 | ) |
| | | | | | |
| | Distributions to shareholders from net investment income | | | (0.20 | ) | | | (0.18 | ) | | | (0.17 | ) | | | (0.19 | ) | | | — | |
| | | | | | |
| | Distributions to shareholders from net realized gains | | | (1.46 | ) | | | (0.44 | ) | | | (1.07 | ) | | | (0.32 | ) | | | — | |
| | | | | | |
| | Total distributions | | | (1.66 | ) | | | (0.62 | ) | | | (1.24 | ) | | | (0.51 | ) | | | — | |
| | | | | | |
| | Net asset value, end of period | | $ | 8.76 | | | $ | 9.53 | | | $ | 9.69 | | | $ | 10.25 | | | $ | 9.75 | |
| | | | | | |
| | Total return(c) | | | 10.34 | % | | | 5.35 | % | | | 7.06 | % | | | 10.71 | % | | | (1.81 | )% |
| | | | | | |
| | Net assets, end of period (in 000s) | | $ | 1,034 | | | $ | 1,554 | | | $ | 1,330 | | | $ | 625 | | | $ | 10 | |
| | | | | | |
| | Ratio of net expenses to average net assets(d) | | | 0.26 | % | | | 0.31 | % | | | 0.45 | % | | | 0.46 | %(e) | | | 0.48 | %(e) |
| | | | | | |
| | Ratio of total expenses to average net assets(d) | | | 5.60 | % | | | 6.23 | % | | | 0.64 | % | | | 0.82 | %(e) | | | 2.08 | %(e) |
| | | | | | |
| | Ratio of net investment income to average net assets | | | 2.09 | % | | | 2.33 | % | | | 1.69 | % | | | 1.30 | %(e) | | | 1.27 | %(e) |
| | | | | | |
| | Portfolio turnover rate(f) | | | 34 | % | | | 117 | % | | | 156 | % | | | 143 | % | | | 176 | % |
| | * | | The Portfolio changed its fiscal year end from October 31 to August 31. |
| | (a) | | Commenced operations on August 22, 2016. |
| | (b) | | Calculated based on the average shares outstanding methodology. |
| | (c) | | Assumes investment at the NAV at the beginning of the period, reinvestment of all dividends and distributions, a complete redemption of the investment at the NAV at the end of the period and no sales or redemption charges (if any). Total returns would be reduced if a sales or redemption charge was taken into account. Returns do not reflect the impact of taxes to shareholders relating to Portfolio distributions or the redemption of Portfolio shares. Total returns for periods less than one full year are not annualized. |
| | (d) | | Expense ratios exclude the expenses of the Underlying Funds in which the Portfolio invests. |
| | (f) | | The Portfolio’s turnover rate is calculated in accordance with regulatory requirements, without regard to transactions involving short term investments. If such transactions were included, the Portfolio’s turnover rate may be higher. |
| | |
| The accompanying notes are an integral part of these financial statements. | | 61 |
GOLDMAN SACHS TARGET DATE 2030 PORTFOLIO
Financial Highlights (continued)
Selected Share Data for a Share Outstanding Throughout Each Period
| | | | | | | | | | | | | | | | | | | | | | | | | | |
| | | | | Goldman Sachs Target Date 2030 Portfolio | |
| | | | | Class R6 Shares | |
| | | | | Year Ended August 31, | | | Period
November 1, 2016 – August 31, 2017* | | | Year Ended October 31, | |
| | | | | 2020 | | | 2019 | | | 2018 | | | 2016 | | | 2015 | |
| | Per Share Data | |
| | | | | | | |
| | Net asset value, beginning of period | | $ | 9.56 | | | $ | 9.72 | | | $ | 10.26 | | | $ | 9.75 | | | $ | 9.97 | | | $ | 9.99 | |
| | | | | | | |
| | Net investment income(a) | | | 0.19 | | | | 0.19 | | | | 0.18 | | | | 0.14 | | | | 0.19 | | | | 0.15 | |
| | | | | | | |
| | Net realized and unrealized gain | | | 0.72 | | | | 0.28 | | | | 0.52 | | | | 0.88 | | | | 0.11 | | | | 0.12 | |
| | | | | | | |
| | Total from investment operations | | | 0.91 | | | | 0.47 | | | | 0.70 | | | | 1.02 | | | | 0.30 | | | | 0.27 | |
| | | | | | | |
| | Distributions to shareholders from net investment income | | | (0.21 | ) | | | (0.19 | ) | | | (0.17 | ) | | | (0.19 | ) | | | (0.17 | ) | | | (0.09 | ) |
| | | | | | | |
| | Distributions to shareholders from net realized gains | | | (1.46 | ) | | | (0.44 | ) | | | (1.07 | ) | | | (0.32 | ) | | | (0.35 | ) | | | (0.20 | ) |
| | | | | | | |
| | Total distributions | | | (1.67 | ) | | | (0.63 | ) | | | (1.24 | ) | | | (0.51 | ) | | | (0.52 | ) | | | (0.29 | ) |
| | | | | | | |
| | Net asset value, end of period | | $ | 8.80 | | | $ | 9.56 | | | $ | 9.72 | | | $ | 10.26 | | | $ | 9.75 | | | $ | 9.97 | |
| | | | | | | |
| | Total return(b) | | | 10.57 | % | | | 5.53 | % | | | 7.30 | % | | | 10.88 | % | | | 3.23 | % | | | 2.76 | % |
| | | | | | | |
| | Net assets, end of period (in 000s) | | $ | 3,526 | | | $ | 3,828 | | | $ | 74,952 | | | $ | 75,061 | | | $ | 74,224 | | | $ | 79,007 | |
| | | | | | | |
| | Ratio of net expenses to average net assets(c) | | | 0.11 | % | | | 0.27 | % | | | 0.29 | % | | | 0.30 | %(d) | | | 0.31 | % | | | 0.30 | % |
| | | | | | | |
| | Ratio of total expenses to average net assets(c) | | | 5.43 | % | | | 1.70 | % | | | 0.50 | % | | | 0.76 | %(d) | | | 0.62 | % | | | 0.30 | % |
| | | | | | | |
| | Ratio of net investment income to average net assets | | | 2.18 | % | | | 1.98 | % | | | 1.86 | % | | | 1.72 | %(d) | | | 1.91 | % | | | 1.49 | % |
| | | | | | | |
| | Portfolio turnover rate(e) | | | 34 | % | | | 117 | % | | | 156 | % | | | 143 | % | | | 176 | % | | | 156 | % |
| | * | | The Portfolio changed its fiscal year end from October 31 to August 31. |
| | (a) | | Calculated based on the average shares outstanding methodology. |
| | (b) | | Assumes investment at the NAV at the beginning of the period, reinvestment of all dividends and distributions, a complete redemption of the investment at the NAV at the end of the period and no sales or redemption charges (if any). Total returns would be reduced if a sales or redemption charge was taken into account. Returns do not reflect the impact of taxes to shareholders relating to Portfolio distributions or the redemption of Portfolio shares. Total returns for periods less than one full year are not annualized. The Goldman Sachs Target Date 2030 Portfolio’s predecessor was the Madison Target Retirement 2030 Fund (the “Predecessor Fund”). On August 22, 2016, the Predecessor Fund was reorganized as a new series of Goldman Sachs Trust II. Performance prior to August 22, 2016 is that of the Predecessor Fund. Total return information of the Predecessor Fund is included in the above table because the Predecessor Fund is considered the accounting survivor of the reorganization. |
| | (c) | | Expense ratios exclude the expenses of the Underlying Funds in which the Portfolio invests. |
| | (e) | | The Portfolio’s turnover rate is calculated in accordance with regulatory requirements, without regard to transactions involving short term investments. If such transactions were included, the Portfolio’s turnover rate may be higher. |
| | |
| 62 | | The accompanying notes are an integral part of these financial statements. |
GOLDMAN SACHS TARGET DATE 2030 PORTFOLIO
Financial Highlights (continued)
Selected Share Data for a Share Outstanding Throughout Each Period
| | | | | | | | | | | | | | | | | | | | | | |
| | | | | Goldman Sachs Target Date 2030 Portfolio | |
| | | | | Class R Shares | |
| | | | | Year Ended August 31, | | | Period
November 1, 2016 –
August 31, 2017* | | | Period Ended
October 31, 2016(a) | |
| | | | | 2020 | | | 2019 | | | 2018 | |
| | Per Share Data | |
| | | | | | |
| | Net asset value, beginning of period | | $ | 9.49 | | | $ | 9.66 | | | $ | 10.22 | | | $ | 9.74 | | | $ | 9.93 | |
| | | | | | |
| | Net investment income(b) | | | 0.13 | | | | 0.19 | | | | 0.12 | | | | 0.09 | | | | 0.02 | |
| | | | | | |
| | Net realized and unrealized gain (loss) | | | 0.71 | | | | 0.22 | | | | 0.51 | | | | 0.88 | | | | (0.21 | ) |
| | | | | | |
| | Total from investment operations | | | 0.84 | | | | 0.41 | | | | 0.63 | | | | 0.97 | | | | (0.19 | ) |
| | | | | | |
| | Distributions to shareholders from net investment income | | | (0.15 | ) | | | (0.14 | ) | | | (0.12 | ) | | | (0.17 | ) | | | — | |
| | | | | | |
| | Distributions to shareholders from net realized gains | | | (1.46 | ) | | | (0.44 | ) | | | (1.07 | ) | | | (0.32 | ) | | | — | |
| | | | | | |
| | Total distributions | | | (1.61 | ) | | | (0.58 | ) | | | (1.19 | ) | | | (0.49 | ) | | | — | |
| | | | | | |
| | Net asset value, end of period | | $ | 8.72 | | | $ | 9.49 | | | $ | 9.66 | | | $ | 10.22 | | | $ | 9.74 | |
| | | | | | |
| | Total return(c) | | | 9.85 | % | | | 4.75 | % | | | 6.59 | % | | | 10.30 | % | | | (1.91 | )% |
| | | | | | |
| | Net assets, end of period (in 000s) | | $ | 13 | | | $ | 12 | | | $ | 30 | | | $ | 23 | | | $ | 10 | |
| | | | | | |
| | Ratio of net expenses to average net assets(d) | | | 0.77 | % | | | 0.86 | % | | | 0.95 | % | | | 0.97 | %(e) | | | 0.98 | %(e) |
| | | | | | |
| | Ratio of total expenses to average net assets(d) | | | 6.05 | % | | | 5.77 | % | | | 1.14 | % | | | 1.28 | %(e) | | | 2.57 | %(e) |
| | | | | | |
| | Ratio of net investment income to average net assets | | | 1.49 | % | | | 2.04 | % | | | 1.19 | % | | | 1.04 | %(e) | | | 0.77 | %(e) |
| | | | | | |
| | Portfolio turnover rate(f) | | | 34 | % | | | 117 | % | | | 156 | % | | | 143 | % | | | 176 | % |
| | * | | The Portfolio changed its fiscal year end from October 31 to August 31. |
| | (a) | | Commenced operations on August 22, 2016. |
| | (b) | | Calculated based on the average shares outstanding methodology. |
| | (c) | | Assumes investment at the NAV at the beginning of the period, reinvestment of all dividends and distributions, a complete redemption of the investment at the NAV at the end of the period and no sales or redemption charges (if any). Total returns would be reduced if a sales or redemption charge was taken into account. Returns do not reflect the impact of taxes to shareholders relating to Portfolio distributions or the redemption of Portfolio shares. Total returns for periods less than one full year are not annualized. |
| | (d) | | Expense ratios exclude the expenses of the Underlying Funds in which the Portfolio invests. |
| | (f) | | The Portfolio’s turnover rate is calculated in accordance with regulatory requirements, without regard to transactions involving short term investments. If such transactions were included, the Portfolio’s turnover rate may be higher. |
| | |
| The accompanying notes are an integral part of these financial statements. | | 63 |
GOLDMAN SACHS TARGET DATE 2035 PORTFOLIO
Financial Highlights (continued)
Selected Share Data for a Share Outstanding Throughout Each Period
| | | | | | | | | | | | | | | | | | | | | | |
| | | | | Goldman Sachs Target Date 2035 Portfolio
| |
| | | | | Class A Shares | |
| | | | | Year Ended August 31, | | | Period
November 1, 2016 –
August 31, 2017* | | | Period Ended
October 31, 2016(a) | |
| | | | | 2020 | | | 2019 | | | 2018 | |
| | Per Share Data | |
| | | | | | |
| | Net asset value, beginning of period | | $ | 10.81 | | | $ | 11.34 | | | $ | 10.85 | | | $ | 9.81 | | | $ | 10.00 | |
| | | | | | |
| | Net investment income(b) | | | 0.18 | | | | 0.21 | | | | 0.17 | | | | 0.10 | | | | 0.02 | |
| | | | | | |
| | Net realized and unrealized gain (loss) | | | 0.97 | | | | 0.21 | | | | 0.63 | | | | 1.01 | | | | (0.21 | ) |
| | | | | | |
| | Total from investment operations | | | 1.15 | | | | 0.42 | | | | 0.80 | | | | 1.11 | | | | (0.19 | ) |
| | | | | | |
| | Distributions to shareholders from net investment income | | | (0.22 | ) | | | (0.30 | ) | | | (0.14 | ) | | | (0.07 | ) | | | — | |
| | | | | | |
| | Distributions to shareholders from net realized gains | | | (0.75 | ) | | | (0.65 | ) | | | (0.17 | ) | | | — | | | | — | |
| | | | | | |
| | Total distributions | | | (0.97 | ) | | | (0.95 | ) | | | (0.31 | ) | | | (0.07 | ) | | | — | |
| | | | | | |
| | Net asset value, end of period | | $ | 10.99 | | | $ | 10.81 | | | $ | 11.34 | | | $ | 10.85 | | | $ | 9.81 | |
| | | | | | |
| | Total return(c) | | | 11.13 | % | | | 4.70 | % | | | 7.54 | % | | | 11.39 | % | | | (1.90 | )% |
| | | | | | |
| | Net assets, end of period (in 000s) | | $ | 277 | | | $ | 285 | | | $ | 107 | | | $ | 29 | | | $ | 10 | |
| | | | | | |
| | Ratio of net expenses to average net assets(d) | | | 0.49 | % | | | 0.52 | % | | | 0.69 | % | | | 0.71 | %(e) | | | 0.75 | %(e) |
| | | | | | |
| | Ratio of total expenses to average net assets(d) | | | 4.35 | % | | | 5.27 | % | | | 2.31 | % | | | 4.28 | %(e) | | | 4.23 | %(e) |
| | | | | | |
| | Ratio of net investment income to average net assets | | | 1.74 | % | | | 2.00 | % | | | 1.57 | % | | | 1.11 | %(e) | | | 1.03 | %(e) |
| | | | | | |
| | Portfolio turnover rate(f) | | | 27 | % | | | 137 | % | | | 139 | % | | | 137 | % | | | 29 | % |
| | * | | The Portfolio changed its fiscal year end from October 31 to August 31. |
| | (a) | | Commenced operations on August 22, 2016. |
| | (b) | | Calculated based on the average shares outstanding methodology. |
| | (c) | | Assumes investment at the NAV at the beginning of the period, reinvestment of all dividends and distributions, a complete redemption of the investment at the NAV at the end of the period and no sales or redemption charges (if any). Total returns would be reduced if a sales or redemption charge was taken into account. Returns do not reflect the impact of taxes to shareholders relating to Portfolio distributions or the redemption of Portfolio shares. Total returns for periods less than one full year are not annualized. |
| | (d) | | Expense ratios exclude the expenses of the Underlying Funds in which the Portfolio invests. |
| | (f) | | The Portfolio’s turnover rate is calculated in accordance with regulatory requirements, without regard to transactions involving short term investments. If such transactions were included, the Portfolio’s turnover rate may be higher. |
| | |
| 64 | | The accompanying notes are an integral part of these financial statements. |
GOLDMAN SACHS TARGET DATE 2035 PORTFOLIO
Financial Highlights (continued)
Selected Share Data for a Share Outstanding Throughout Each Period
| | | | | | | | | | | | | | | | | | | | | | |
| | | | | Goldman Sachs Target Date 2035 Portfolio
| |
| | | | | Institutional Shares | |
| | | | | Year Ended August 31, | | | Period
November 1, 2016 –
August 31, 2017* | | | Period Ended
October 31, 2016(a) | |
| | | | | 2020 | | | 2019 | | | 2018 | |
| | Per Share Data | |
| | | | | | |
| | Net asset value, beginning of period | | $ | 10.87 | | | $ | 11.37 | | | $ | 10.87 | | | $ | 9.81 | | | $ | 10.00 | |
| | | | | | |
| | Net investment income(b) | | | 0.22 | | | | 0.25 | | | | 0.21 | | | | 0.15 | | | | 0.03 | |
| | | | | | |
| | Net realized and unrealized gain (loss) | | | 0.97 | | | | 0.21 | | | | 0.65 | | | | 1.00 | | | | (0.22 | ) |
| | | | | | |
| | Total from investment operations | | | 1.19 | | | | 0.46 | | | | 0.86 | | | | 1.15 | | | | (0.19 | ) |
| | | | | | |
| | Distributions to shareholders from net investment income | | | (0.26 | ) | | | (0.31 | ) | | | (0.19 | ) | | | (0.09 | ) | | | — | |
| | | | | | |
| | Distributions to shareholders from net realized gains | | | (0.75 | ) | | | (0.65 | ) | | | (0.17 | ) | | | — | | | | — | |
| | | | | | |
| | Total distributions | | | (1.01 | ) | | | (0.96 | ) | | | (0.36 | ) | | | (0.09 | ) | | | — | |
| | | | | | |
| | Net asset value, end of period | | $ | 11.05 | | | $ | 10.87 | | | $ | 11.37 | | | $ | 10.87 | | | $ | 9.81 | |
| | | | | | |
| | Total return(c) | | | 11.44 | % | | | 5.13 | % | | | 8.02 | % | | | 11.75 | % | | | (1.90 | )% |
| | | | | | |
| | Net assets, end of period (in 000s) | | $ | 6,474 | | | $ | 5,811 | | | $ | 11,139 | | | $ | 10,911 | | | $ | 9,765 | |
| | | | | | |
| | Ratio of net expenses to average net assets(d) | | | 0.11 | % | | | 0.18 | % | | | 0.30 | % | | | 0.32 | %(e) | | | 0.34 | %(e) |
| | | | | | |
| | Ratio of total expenses to average net assets(d) | | | 3.97 | % | | | 4.21 | % | | | 2.05 | % | | | 3.86 | %(e) | | | 3.85 | %(e) |
| | | | | | |
| | Ratio of net investment income to average net assets | | | 2.12 | % | | | 2.32 | % | | | 1.85 | % | | | 1.69 | %(e) | | | 1.44 | %(e) |
| | | | | | |
| | Portfolio turnover rate(f) | | | 27 | % | | | 137 | % | | | 139 | % | | | 137 | % | | | 29 | % |
| | * | | The Portfolio changed its fiscal year end from October 31 to August 31. |
| | (a) | | Commenced operations on August 22, 2016. |
| | (b) | | Calculated based on the average shares outstanding methodology. |
| | (c) | | Assumes investment at the NAV at the beginning of the period, reinvestment of all dividends and distributions, a complete redemption of the investment at the NAV at the end of the period and no sales or redemption charges (if any). Total returns would be reduced if a sales or redemption charge was taken into account. Returns do not reflect the impact of taxes to shareholders relating to Portfolio distributions or the redemption of Portfolio shares. Total returns for periods less than one full year are not annualized. |
| | (d) | | Expense ratios exclude the expenses of the Underlying Funds in which the Portfolio invests. |
| | (f) | | The Portfolio’s turnover rate is calculated in accordance with regulatory requirements, without regard to transactions involving short term investments. If such transactions were included, the Portfolio’s turnover rate may be higher. |
| | |
| The accompanying notes are an integral part of these financial statements. | | 65 |
GOLDMAN SACHS TARGET DATE 2035 PORTFOLIO
Financial Highlights (continued)
Selected Share Data for a Share Outstanding Throughout Each Period
| | | | | | | | | | | | | | | | | | | | | | |
| | | | | Goldman Sachs Target Date 2035 Portfolio
| |
| | | | | Service Shares | |
| | | | | Year Ended August 31, | | | Period
November 1, 2016 –
August 31, 2017* | | | Period Ended
October 31, 2016(a) | |
| | | | | 2020 | | | 2019 | | | 2018 | |
| | Per Share Data | |
| | | | | | |
| | Net asset value, beginning of period | | $ | 10.82 | | | $ | 11.33 | | | $ | 10.84 | | | $ | 9.80 | | | $ | 10.00 | |
| | | | | | |
| | Net investment income(b) | | | 0.17 | | | | 0.20 | | | | 0.15 | | | | 0.10 | | | | 0.02 | |
| | | | | | |
| | Net realized and unrealized gain (loss) | | | 0.96 | | | | 0.21 | | | | 0.64 | | | | 1.01 | | | | (0.22 | ) |
| | | | | | |
| | Total from investment operations | | | 1.13 | | | | 0.41 | | | | 0.79 | | | | 1.11 | | | | (0.20 | ) |
| | | | | | |
| | Distributions to shareholders from net investment income | | | (0.21 | ) | | | (0.27 | ) | | | (0.13 | ) | | | (0.07 | ) | | | — | |
| | | | | | |
| | Distributions to shareholders from net realized gains | | | (0.75 | ) | | | (0.65 | ) | | | (0.17 | ) | | | — | | | | — | |
| | | | | | |
| | Total distributions | | | (0.96 | ) | | | (0.92 | ) | | | (0.30 | ) | | | (0.07 | ) | | | — | |
| | | | | | |
| | Net asset value, end of period | | $ | 10.99 | | | $ | 10.82 | | | $ | 11.33 | | | $ | 10.84 | | | $ | 9.80 | |
| | | | | | |
| | Total return(c) | | | 10.89 | % | | | 4.55 | % | | | 7.44 | % | | | 11.36 | % | | | (2.00 | )% |
| | | | | | |
| | Net assets, end of period (in 000s) | | $ | 14 | | | $ | 12 | | | $ | 12 | | | $ | 11 | | | $ | 10 | |
| | | | | | |
| | Ratio of net expenses to average net assets(d) | | | 0.61 | % | | | 0.65 | % | | | 0.80 | % | | | 0.81 | %(e) | | | 0.84 | %(e) |
| | | | | | |
| | Ratio of total expenses to average net assets(d) | | | 4.46 | % | | | 5.12 | % | | | 2.53 | % | | | 4.34 | %(e) | | | 4.33 | %(e) |
| | | | | | |
| | Ratio of net investment income to average net assets | | | 1.62 | % | | | 1.90 | % | | | 1.35 | % | | | 1.20 | %(e) | | | 0.94 | %(e) |
| | | | | | |
| | Portfolio turnover rate(f) | | | 27 | % | | | 137 | % | | | 139 | % | | | 137 | % | | | 29 | % |
| | * | | The Portfolio changed its fiscal year end from October 31 to August 31. |
| | (a) | | Commenced operations on August 22, 2016. |
| | (b) | | Calculated based on the average shares outstanding methodology. |
| | (c) | | Assumes investment at the NAV at the beginning of the period, reinvestment of all dividends and distributions, a complete redemption of the investment at the NAV at the end of the period and no sales or redemption charges (if any). Total returns would be reduced if a sales or redemption charge was taken into account. Returns do not reflect the impact of taxes to shareholders relating to Portfolio distributions or the redemption of Portfolio shares. Total returns for periods less than one full year are not annualized. |
| | (d) | | Expense ratios exclude the expenses of the Underlying Funds in which the Portfolio invests. |
| | (f) | | The Portfolio’s turnover rate is calculated in accordance with regulatory requirements, without regard to transactions involving short term investments. If such transactions were included, the Portfolio’s turnover rate may be higher. |
| | |
| 66 | | The accompanying notes are an integral part of these financial statements. |
GOLDMAN SACHS TARGET DATE 2035 PORTFOLIO
Financial Highlights (continued)
Selected Share Data for a Share Outstanding Throughout Each Period
| | | | | | | | | | | | | | | | | | | | | | |
| | | | | Goldman Sachs Target Date 2035 Portfolio
| |
| | | | | Investor Shares | |
| | | | | Year Ended August 31, | | | Period
November 1, 2016 –
August 31, 2017* | | | Period Ended
October 31, 2016(a) | |
| | | | | 2020 | | | 2019 | | | 2018 | |
| | Per Share Data | |
| | | | | | |
| | Net asset value, beginning of period | | $ | 10.83 | | | $ | 11.34 | | | $ | 10.86 | | | $ | 9.81 | | | $ | 10.00 | |
| | | | | | |
| | Net investment income(b) | | | 0.27 | | | | 0.24 | | | | 0.19 | | | | 0.08 | | | | 0.02 | |
| | | | | | |
| | Net realized and unrealized gain (loss) | | | 0.89 | | | | 0.21 | | | | 0.64 | | | | 1.05 | | | | (0.21 | ) |
| | | | | | |
| | Total from investment operations | | | 1.16 | | | | 0.45 | | | | 0.83 | | | | 1.13 | | | | (0.19 | ) |
| | | | | | |
| | Distributions to shareholders from net investment income | | | (0.24 | ) | | | (0.31 | ) | | | (0.18 | ) | | | (0.08 | ) | | | — | |
| | | | | | |
| | Distributions to shareholders from net realized gains | | | (0.75 | ) | | | (0.65 | ) | | | (0.17 | ) | | | — | | | | — | |
| | | | | | |
| | Total distributions | | | (0.99 | ) | | | (0.96 | ) | | | (0.35 | ) | | | (0.08 | ) | | | — | |
| | | | | | |
| | Net asset value, end of period | | $ | 11.00 | | | $ | 10.83 | | | $ | 11.34 | | | $ | 10.86 | | | $ | 9.81 | |
| | | | | | |
| | Total return(c) | | | 11.25 | % | | | 4.96 | % | | | 7.82 | % | | | 11.59 | % | | | (1.90 | )% |
| | | | | | |
| | Net assets, end of period (in 000s) | | $ | 43 | | | $ | 976 | | | $ | 890 | | | $ | 152 | | | $ | 10 | |
| | | | | | |
| | Ratio of net expenses to average net assets(d) | | | 0.24 | % | | | 0.29 | % | | | 0.44 | % | | | 0.45 | %(e) | | | 0.49 | %(e) |
| | | | | | |
| | Ratio of total expenses to average net assets(d) | | | 4.18 | % | | | 4.81 | % | | | 2.18 | % | | | 7.23 | %(e) | | | 3.97 | %(e) |
| | | | | | |
| | Ratio of net investment income to average net assets | | | 2.46 | % | | | 2.29 | % | | | 1.71 | % | | | 0.89 | %(e) | | | 1.29 | %(e) |
| | | | | | |
| | Portfolio turnover rate(f) | | | 27 | % | | | 137 | % | | | 139 | % | | | 137 | % | | | 29 | % |
| | * | | The Portfolio changed its fiscal year end from October 31 to August 31. |
| | (a) | | Commenced operations on August 22, 2016. |
| | (b) | | Calculated based on the average shares outstanding methodology. |
| | (c) | | Assumes investment at the NAV at the beginning of the period, reinvestment of all dividends and distributions, a complete redemption of the investment at the NAV at the end of the period and no sales or redemption charges (if any). Total returns would be reduced if a sales or redemption charge was taken into account. Returns do not reflect the impact of taxes to shareholders relating to Portfolio distributions or the redemption of Portfolio shares. Total returns for periods less than one full year are not annualized. |
| | (d) | | Expense ratios exclude the expenses of the Underlying Funds in which the Portfolio invests. |
| | (f) | | The Portfolio’s turnover rate is calculated in accordance with regulatory requirements, without regard to transactions involving short term investments. If such transactions were included, the Portfolio’s turnover rate may be higher. |
| | |
| The accompanying notes are an integral part of these financial statements. | | 67 |
GOLDMAN SACHS TARGET DATE 2035 PORTFOLIO
Financial Highlights (continued)
Selected Share Data for a Share Outstanding Throughout Each Period
| | | | | | | | | | | | | | | | | | | | | | |
| | | | | Goldman Sachs Target Date 2035 Portfolio | |
| | | | | Class R6 Shares | |
| | | | | Year Ended August 31, | | | Period
November 1, 2016 –
August 31, 2017* | | | Period Ended
October 31, 2016(a) | |
| | | | | 2020 | | | 2019 | | | 2018 | |
| | Per Share Data | |
| | | | | | |
| | Net asset value, beginning of period | | $ | 10.86 | | | $ | 11.37 | | | $ | 10.87 | | | $ | 9.81 | | | $ | 10.00 | |
| | | | | | |
| | Net investment income(b) | | | 0.24 | | | | 0.25 | | | | 0.20 | | | | 0.14 | | | | 0.03 | |
| | | | | | |
| | Net realized and unrealized gain (loss) | | | 0.94 | | | | 0.21 | | | | 0.66 | | | | 1.01 | | | | (0.22 | ) |
| | | | | | |
| | Total from investment operations | | | 1.18 | | | | 0.46 | | | | 0.86 | | | | 1.15 | | | | (0.19 | ) |
| | | | | | |
| | Distributions to shareholders from net investment income | | | (0.25 | ) | | | (0.32 | ) | | | (0.19 | ) | | | (0.09 | ) | | | — | |
| | | | | | |
| | Distributions to shareholders from net realized gains | | | (0.75 | ) | | | (0.65 | ) | | | (0.17 | ) | | | — | | | | — | |
| | | | | | |
| | Total distributions | | | (1.00 | ) | | | (0.97 | ) | | | (0.36 | ) | | | (0.09 | ) | | | — | |
| | | | | | |
| | Net asset value, end of period | | $ | 11.04 | | | $ | 10.86 | | | $ | 11.37 | | | $ | 10.87 | | | $ | 9.81 | |
| | | | | | |
| | Total return(c) | | | 11.44 | % | | | 5.11 | % | | | 8.05 | % | | | 11.75 | % | | | (1.90 | )% |
| | | | | | |
| | Net assets, end of period (in 000s) | | $ | 316 | | | $ | 446 | | | $ | 330 | | | $ | 35 | | | $ | 10 | |
| | | | | | |
| | Ratio of net expenses to average net assets(d) | | | 0.09 | % | | | 0.13 | % | | | 0.28 | % | | | 0.30 | %(e) | | | 0.32 | %(e) |
| | | | | | |
| | Ratio of total expenses to average net assets(d) | | | 3.93 | % | | | 4.62 | % | | | 2.00 | % | | | 4.22 | %(e) | | | 3.93 | %(e) |
| | | | | | |
| | Ratio of net investment income to average net assets | | | 2.29 | % | | | 2.38 | % | | | 1.77 | % | | | 1.64 | %(e) | | | 1.46 | %(e) |
| | | | | | |
| | Portfolio turnover rate(f) | | | 27 | % | | | 137 | % | | | 139 | % | | | 137 | % | | | 29 | % |
| | * | | The Portfolio changed its fiscal year end from October 31 to August 31. |
| | (a) | | Commenced operations on August 22, 2016. |
| | (b) | | Calculated based on the average shares outstanding methodology. |
| | (c) | | Assumes investment at the NAV at the beginning of the period, reinvestment of all dividends and distributions, a complete redemption of the investment at the NAV at the end of the period and no sales or redemption charges (if any). Total returns would be reduced if a sales or redemption charge was taken into account. Returns do not reflect the impact of taxes to shareholders relating to Portfolio distributions or the redemption of Portfolio shares. Total returns for periods less than one full year are not annualized. |
| | (d) | | Expense ratios exclude the expenses of the Underlying Funds in which the Portfolio invests. |
| | (f) | | The Portfolio’s turnover rate is calculated in accordance with regulatory requirements, without regard to transactions involving short term investments. If such transactions were included, the Portfolio’s turnover rate may be higher. |
| | |
| 68 | | The accompanying notes are an integral part of these financial statements. |
GOLDMAN SACHS TARGET DATE 2035 PORTFOLIO
Financial Highlights (continued)
Selected Share Data for a Share Outstanding Throughout Each Period
| | | | | | | | | | | | | | | | | | | | | | |
| | | | | Goldman Sachs Target Date 2035 Portfolio | |
| | | | | Class R Shares | |
| | | | | Year Ended August 31, | | | Period
November 1, 2016–
August 31, 2017* | | | Period Ended
October 31, 2016(a) | |
| | | | | 2020 | | | 2019 | | | 2018 | |
| | Per Share Data | |
| | | | | | |
| | Net asset value, beginning of period | | $ | 10.81 | | | $ | 11.32 | | | $ | 10.83 | | | $ | 9.80 | | | $ | 10.00 | |
| | | | | | |
| | Net investment income(b) | | | 0.15 | | | | 0.19 | | | | 0.13 | | | | 0.09 | | | | 0.02 | |
| | | | | | |
| | Net realized and unrealized gain (loss) | | | 0.95 | | | | 0.20 | | | | 0.65 | | | | 1.00 | | | | (0.22 | ) |
| | | | | | |
| | Total from investment operations | | | 1.10 | | | | 0.39 | | | | 0.78 | | | | 1.09 | | | | (0.20 | ) |
| | | | | | |
| | Distributions to shareholders from net investment income | | | (0.19 | ) | | | (0.25 | ) | | | (0.12 | ) | | | (0.06 | ) | | | — | |
| | | | | | |
| | Distributions to shareholders from net realized gains | | | (0.75 | ) | | | (0.65 | ) | | | (0.17 | ) | | | — | | | | — | |
| | | | | | |
| | Total distributions | | | (0.94 | ) | | | (0.90 | ) | | | (0.29 | ) | | | (0.06 | ) | | | — | |
| | | | | | |
| | Net asset value, end of period | | $ | 10.97 | | | $ | 10.81 | | | $ | 11.32 | | | $ | 10.83 | | | $ | 9.80 | |
| | | | | | |
| | Total return(c) | | | 10.66 | % | | | 4.39 | % | | | 7.29 | % | | | 11.20 | % | | | (2.00 | )% |
| | | | | | |
| | Net assets, end of period (in 000s) | | $ | 14 | | | $ | 12 | | | $ | 12 | | | $ | 11 | | | $ | 10 | |
| | | | | | |
| | Ratio of net expenses to average net assets(d) | | | 0.74 | % | | | 0.80 | % | | | 0.96 | % | | | 0.98 | %(e) | | | 0.99 | %(e) |
| | | | | | |
| | Ratio of total expenses to average net assets(d) | | | 4.60 | % | | | 5.26 | % | | | 2.69 | % | | | 4.50 | %(e) | | | 4.47 | %(e) |
| | | | | | |
| | Ratio of net investment income to average net assets | | | 1.49 | % | | | 1.75 | % | | | 1.19 | % | | | 1.04 | %(e) | | | 0.79 | %(e) |
| | | | | | |
| | Portfolio turnover rate(f) | | | 27 | % | | | 137 | % | | | 139 | % | | | 137 | % | | | 29 | % |
| | * | | The Portfolio changed its fiscal year end from October 31 to August 31. |
| | (a) | | Commenced operations on August 22, 2016. |
| | (b) | | Calculated based on the average shares outstanding methodology. |
| | (c) | | Assumes investment at the NAV at the beginning of the period, reinvestment of all dividends and distributions, a complete redemption of the investment at the NAV at the end of the period and no sales or redemption charges (if any). Total returns would be reduced if a sales or redemption charge was taken into account. Returns do not reflect the impact of taxes to shareholders relating to Portfolio distributions or the redemption of Portfolio shares. Total returns for periods less than one full year are not annualized. |
| | (d) | | Expense ratios exclude the expenses of the Underlying Funds in which the Portfolio invests. |
| | (f) | | The Portfolio’s turnover rate is calculated in accordance with regulatory requirements, without regard to transactions involving short term investments. If such transactions were included, the Portfolio’s turnover rate may be higher. |
| | |
| The accompanying notes are an integral part of these financial statements. | | 69 |
GOLDMAN SACHS TARGET DATE 2040 PORTFOLIO
Financial Highlights (continued)
Selected Share Data for a Share Outstanding Throughout Each Period
| | | | | | | | | | | | | | | | | | | | | | |
| | | | | Goldman Sachs Target Date 2040 Portfolio | |
| | | | | Class A Shares | |
| | | | | Year Ended August 31, | | | Period
November 1, 2016 –
August 31, 2017* | | | Period Ended
October 31, 2016(a) | |
| | | | | 2020 | | | 2019 | | | 2018 | |
| | Per Share Data | |
| | | | | | |
| | Net asset value, beginning of period | | $ | 9.08 | | | $ | 9.49 | | | $ | 10.09 | | | $ | 9.58 | | | $ | 9.77 | |
| | | | | | |
| | Net investment income(b) | | | 0.14 | | | | 0.17 | | | | 0.13 | | | | 0.10 | | | | 0.02 | |
| | | | | | |
| | Net realized and unrealized gain (loss) | | | 0.87 | | | | 0.10 | | | | 0.64 | | | | 1.03 | | | | (0.21 | ) |
| | | | | | |
| | Total from investment operations | | | 1.01 | | | | 0.27 | | | | 0.77 | | | | 1.13 | | | | (0.19 | ) |
| | | | | | |
| | Distributions to shareholders from net investment income | | | (0.17 | ) | | | (0.15 | ) | | | (0.14 | ) | | | (0.19 | ) | | | — | |
| | | | | | |
| | Distributions to shareholders from net realized gains | | | (1.31 | ) | | | (0.53 | ) | | | (1.23 | ) | | | (0.43 | ) | | | — | |
| | | | | | |
| | Total distributions | | | (1.48 | ) | | | (0.68 | ) | | | (1.37 | ) | | | (0.62 | ) | | | — | |
| | | | | | |
| | Net asset value, end of period | | $ | 8.61 | | | $ | 9.08 | | | $ | 9.49 | | | $ | 10.09 | | | $ | 9.58 | |
| | | | | | |
| | Total return(c) | | | 12.04 | % | | | 3.48 | % | | | 8.23 | % | | | 12.37 | % | | | (1.94 | )% |
| | | | | | |
| | Net assets, end of period (in 000s) | | $ | 92 | | | $ | 80 | | | $ | 51 | | | $ | 13 | | | $ | 13 | |
| | | | | | |
| | Ratio of net expenses to average net assets(d) | | | 0.49 | % | | | 0.53 | % | | | 0.70 | % | | | 0.73 | %(e) | | | 0.74 | %(e) |
| | | | | | |
| | Ratio of total expenses to average net assets(d) | | | 4.09 | % | | | 5.04 | % | | | 1.20 | % | | | 1.41 | %(e) | | | 3.23 | %(e) |
| | | | | | |
| | Ratio of net investment income to average net assets | | | 1.71 | % | | | 1.93 | % | | | 1.40 | % | | | 1.27 | %(e) | | | 0.98 | %(e) |
| | | | | | |
| | Portfolio turnover rate(f) | | | 30 | % | | | 150 | % | | | 143 | % | | | 142 | % | | | 174 | % |
| | * | | The Portfolio changed its fiscal year end from October 31 to August 31. |
| | (a) | | Commenced operations on August 22, 2016. |
| | (b) | | Calculated based on the average shares outstanding methodology. |
| | (c) | | Assumes investment at the NAV at the beginning of the period, reinvestment of all dividends and distributions, a complete redemption of the investment at the NAV at the end of the period and no sales or redemption charges (if any). Total returns would be reduced if a sales or redemption charge was taken into account. Returns do not reflect the impact of taxes to shareholders relating to Portfolio distributions or the redemption of Portfolio shares. Total returns for periods less than one full year are not annualized. |
| | (d) | | Expense ratios exclude the expenses of the Underlying Funds in which the Portfolio invests. |
| | (f) | | The Portfolio’s turnover rate is calculated in accordance with regulatory requirements, without regard to transactions involving short term investments. If such transactions were included, the Portfolio’s turnover rate may be higher. |
| | |
| 70 | | The accompanying notes are an integral part of these financial statements. |
GOLDMAN SACHS TARGET DATE 2040 PORTFOLIO
Financial Highlights (continued)
Selected Share Data for a Share Outstanding Throughout Each Period
| | | | | | | | | | | | | | | | | | | | | | |
| | | | | Goldman Sachs Target Date 2040 Portfolio | |
| | | | | Institutional Shares | |
| | | | | Year Ended August 31, | | | Period
November 1, 2016 –
August 31, 2017* | | | Period Ended
October 31, 2016(a) | |
| | | | | 2020 | | | 2019 | | | 2018 | |
| | Per Share Data | |
| | | | | | |
| | Net asset value, beginning of period | | $ | 9.13 | | | $ | 9.54 | | | $ | 10.12 | | | $ | 9.58 | | | $ | 9.77 | |
| | | | | | |
| | Net investment income(b) | | | 0.17 | | | | 0.20 | | | | 0.17 | | | | 0.14 | | | | 0.03 | |
| | | | | | |
| | Net realized and unrealized gain (loss) | | | 0.88 | | | | 0.10 | | | | 0.65 | | | | 1.03 | | | | (0.22 | ) |
| | | | | | |
| | Total from investment operations | | | 1.05 | | | | 0.30 | | | | 0.82 | | | | 1.17 | | | | (0.19 | ) |
| | | | | | |
| | Distributions to shareholders from net investment income | | | (0.19 | ) | | | (0.18 | ) | | | (0.17 | ) | | | (0.20 | ) | | | — | |
| | | | | | |
| | Distributions to shareholders from net realized gains | | | (1.31 | ) | | | (0.53 | ) | | | (1.23 | ) | | | (0.43 | ) | | | — | |
| | | | | | |
| | Total distributions | | | (1.50 | ) | | | (0.71 | ) | | | (1.40 | ) | | | (0.63 | ) | | | — | |
| | | | | | |
| | Net asset value, end of period | | $ | 8.68 | | | $ | 9.13 | | | $ | 9.54 | | | $ | 10.12 | | | $ | 9.58 | |
| | | | | | |
| | Total return(c) | | | 12.57 | % | | | 3.82 | % | | | 8.71 | % | | | 12.85 | % | | | (1.94 | )% |
| | | | | | |
| | Net assets, end of period (in 000s) | | $ | 14 | | | $ | 12 | | | $ | 12 | | | $ | 11 | | | $ | 10 | |
| | | | | | |
| | Ratio of net expenses to average net assets(d) | | | 0.12 | % | | | 0.16 | % | | | 0.30 | % | | | 0.32 | %(e) | | | 0.34 | %(e) |
| | | | | | |
| | Ratio of total expenses to average net assets(d) | | | 3.70 | % | | | 4.47 | % | | | 0.73 | % | | | 0.98 | %(e) | | | 2.82 | %(e) |
| | | | | | |
| | Ratio of net investment income to average net assets | | | 2.08 | % | | | 2.30 | % | | | 1.82 | % | | | 1.70 | %(e) | | | 1.41 | %(e) |
| | | | | | |
| | Portfolio turnover rate(f) | | | 30 | % | | | 150 | % | | | 143 | % | | | 142 | % | | | 174 | % |
| | * | | The Portfolio changed its fiscal year end from October 31 to August 31. |
| | (a) | | Commenced operations on August 22, 2016. |
| | (b) | | Calculated based on the average shares outstanding methodology. |
| | (c) | | Assumes investment at the NAV at the beginning of the period, reinvestment of all dividends and distributions, a complete redemption of the investment at the NAV at the end of the period and no sales or redemption charges (if any). Total returns would be reduced if a sales or redemption charge was taken into account. Returns do not reflect the impact of taxes to shareholders relating to Portfolio distributions or the redemption of Portfolio shares. Total returns for periods less than one full year are not annualized. |
| | (d) | | Expense ratios exclude the expenses of the Underlying Funds in which the Portfolio invests. |
| | (f) | | The Portfolio’s turnover rate is calculated in accordance with regulatory requirements, without regard to transactions involving short term investments. If such transactions were included, the Portfolio’s turnover rate may be higher. |
| | |
| The accompanying notes are an integral part of these financial statements. | | 71 |
GOLDMAN SACHS TARGET DATE 2040 PORTFOLIO
Financial Highlights (continued)
Selected Share Data for a Share Outstanding Throughout Each Period
| | | | | | | | | | | | | | | | | | | | | | |
| | | | | Goldman Sachs Target Date 2040 Portfolio | |
| | | | | Service Shares | |
| | | | | Year Ended August 31, | | | Period
November 1, 2016 –
August 31, 2017* | | | Period Ended
October 31, 2016(a) | |
| | | | | 2020 | | | 2019 | | | 2018 | |
| | Per Share Data | |
| | | | | | |
| | Net asset value, beginning of period | | $ | 9.09 | | | $ | 9.49 | | | $ | 10.08 | | | $ | 9.58 | | | $ | 9.77 | |
| | | | | | |
| | Net investment income(b) | | | 0.13 | | | | 0.16 | | | | 0.13 | | | | 0.10 | | | | 0.02 | |
| | | | | | |
| | Net realized and unrealized gain (loss) | | | 0.88 | | | | 0.11 | | | | 0.63 | | | | 1.01 | | | | (0.21 | ) |
| | | | | | |
| | Total from investment operations | | | 1.01 | | | | 0.27 | | | | 0.76 | | | | 1.11 | | | | (0.19 | ) |
| | | | | | |
| | Distributions to shareholders from net investment income | | | (0.16 | ) | | | (0.14 | ) | | | (0.12 | ) | | | (0.18 | ) | | | — | |
| | | | | | |
| | Distributions to shareholders from net realized gains | | | (1.31 | ) | | | (0.53 | ) | | | (1.23 | ) | | | (0.43 | ) | | | — | |
| | | | | | |
| | Total distributions | | | (1.47 | ) | | | (0.67 | ) | | | (1.35 | ) | | | (0.61 | ) | | | — | |
| | | | | | |
| | Net asset value, end of period | | $ | 8.63 | | | $ | 9.09 | | | $ | 9.49 | | | $ | 10.08 | | | $ | 9.58 | |
| | | | | | |
| | Total return(c) | | | 12.00 | % | | | 3.39 | % | | | 8.13 | % | | | 12.21 | % | | | (1.94 | )% |
| | | | | | |
| | Net assets, end of period (in 000s) | | $ | 14 | | | $ | 12 | | | $ | 12 | | | $ | 11 | | | $ | 10 | |
| | | | | | |
| | Ratio of net expenses to average net assets(d) | | | 0.62 | % | | | 0.66 | % | | | 0.81 | % | | | 0.82 | %(e) | | | 0.83 | %(e) |
| | | | | | |
| | Ratio of total expenses to average net assets(d) | | | 4.20 | % | | | 4.97 | % | | | 1.24 | % | | | 1.48 | %(e) | | | 3.31 | %(e) |
| | | | | | |
| | Ratio of net investment income to average net assets | | | 1.59 | % | | | 1.81 | % | | | 1.32 | % | | | 1.20 | %(e) | | | 0.92 | %(e) |
| | | | | | |
| | Portfolio turnover rate(f) | | | 30 | % | | | 150 | % | | | 143 | % | | | 142 | % | | | 174 | % |
| | * | | The Portfolio changed its fiscal year end from October 31 to August 31. |
| | (a) | | Commenced operations on August 22, 2016. |
| | (b) | | Calculated based on the average shares outstanding methodology. |
| | (c) | | Assumes investment at the NAV at the beginning of the period, reinvestment of all dividends and distributions, a complete redemption of the investment at the NAV at the end of the period and no sales or redemption charges (if any). Total returns would be reduced if a sales or redemption charge was taken into account. Returns do not reflect the impact of taxes to shareholders relating to Portfolio distributions or the redemption of Portfolio shares. Total returns for periods less than one full year are not annualized. |
| | (d) | | Expense ratios exclude the expenses of the Underlying Funds in which the Portfolio invests. |
| | (f) | | The Portfolio’s turnover rate is calculated in accordance with regulatory requirements, without regard to transactions involving short term investments. If such transactions were included, the Portfolio’s turnover rate may be higher. |
| | |
| 72 | | The accompanying notes are an integral part of these financial statements. |
GOLDMAN SACHS TARGET DATE 2040 PORTFOLIO
Financial Highlights (continued)
Selected Share Data for a Share Outstanding Throughout Each Period
| | | | | | | | | | | | | | | | | | | | | | |
| | | | | Goldman Sachs Target Date 2040 Portfolio | |
| | | | | Investor Shares | |
| | | | | Year Ended August 31, | | | Period
November 1, 2016 –
August 31, 2017* | | | Period Ended
October 31, 2016(a) | |
| | | | | 2020 | | | 2019 | | | 2018 | |
| | Per Share Data | |
| | | | | | |
| | Net asset value, beginning of period | | $ | 9.11 | | | $ | 9.51 | | | $ | 10.11 | | | $ | 9.58 | | | $ | 9.77 | |
| | | | | | |
| | Net investment income(b) | | | 0.19 | | | | 0.19 | | | | 0.16 | | | | 0.09 | | | | 0.02 | |
| | | | | | |
| | Net realized and unrealized gain (loss) | | | 0.84 | | | | 0.11 | | | | 0.64 | | | | 1.06 | | | | (0.21 | ) |
| | | | | | |
| | Total from investment operations | | | 1.03 | | | | 0.30 | | | | 0.80 | | | | 1.15 | | | | (0.19 | ) |
| | | | | | |
| | Distributions to shareholders from net investment income | | | (0.18 | ) | | | (0.17 | ) | | | (0.17 | ) | | | (0.19 | ) | | | — | |
| | | | | | |
| | Distributions to shareholders from net realized gains | | | (1.31 | ) | | | (0.53 | ) | | | (1.23 | ) | | | (0.43 | ) | | | — | |
| | | | | | |
| | Total distributions | | | (1.49 | ) | | | (0.70 | ) | | | (1.40 | ) | | | (0.62 | ) | | | — | |
| | | | | | |
| | Net asset value, end of period | | $ | 8.65 | | | $ | 9.11 | | | $ | 9.51 | | | $ | 10.11 | | | $ | 9.58 | |
| | | | | | |
| | Total return(c) | | | 12.35 | % | | | 3.78 | % | | | 8.46 | % | | | 12.68 | % | | | (1.94 | )% |
| | | | | | |
| | Net assets, end of period (in 000s) | | $ | 240 | | | $ | 667 | | | $ | 636 | | | $ | 130 | | | $ | 10 | |
| | | | | | |
| | Ratio of net expenses to average net assets(d) | | | 0.24 | % | | | 0.29 | % | | | 0.45 | % | | | 0.46 | %(e) | | | 0.48 | %(e) |
| | | | | | |
| | Ratio of total expenses to average net assets(d) | | | 3.94 | % | | | 4.66 | % | | | 0.89 | % | | | 0.98 | %(e) | | | 2.96 | %(e) |
| | | | | | |
| | Ratio of net investment income to average net assets | | | 2.25 | % | | | 2.14 | % | | | 1.67 | % | | | 1.11 | %(e) | | | 1.27 | %(e) |
| | | | | | |
| | Portfolio turnover rate(f) | | | 30 | % | | | 150 | % | | | 143 | % | | | 142 | % | | | 174 | % |
| | * | | The Portfolio changed its fiscal year end from October 31 to August 31. |
| | (a) | | Commenced operations on August 22, 2016. |
| | (b) | | Calculated based on the average shares outstanding methodology. |
| | (c) | | Assumes investment at the NAV at the beginning of the period, reinvestment of all dividends and distributions, a complete redemption of the investment at the NAV at the end of the period and no sales or redemption charges (if any). Total returns would be reduced if a sales or redemption charge was taken into account. Returns do not reflect the impact of taxes to shareholders relating to Portfolio distributions or the redemption of Portfolio shares. Total returns for periods less than one full year are not annualized. |
| | (d) | | Expense ratios exclude the expenses of the Underlying Funds in which the Portfolio invests. |
| | (f) | | The Portfolio’s turnover rate is calculated in accordance with regulatory requirements, without regard to transactions involving short term investments. If such transactions were included, the Portfolio’s turnover rate may be higher. |
| | |
| The accompanying notes are an integral part of these financial statements. | | 73 |
GOLDMAN SACHS TARGET DATE 2040 PORTFOLIO
Financial Highlights (continued)
Selected Share Data for a Share Outstanding Throughout Each Period
| | | | | | | | | | | | | | | | | | | | | | | | | | |
| | | | | Goldman Sachs Target Date 2040 Portfolio | |
| | | | | Class R6 Shares | |
| | | | | Year Ended August 31, | | | Period
November 1, 2016 –
August 31, 2017* | | | Year Ended October 31, | |
| | | | | 2020 | | | 2019 | | | 2018 | | | 2016 | | | 2015 | |
| | Per Share Data | |
| | | | | | | |
| | Net asset value, beginning of period | | $ | 9.14 | | | $ | 9.54 | | | $ | 10.12 | | | $ | 9.59 | | | $ | 9.90 | | | $ | 9.98 | |
| | | | | | | |
| | Net investment income(a) | | | 0.18 | | | | 0.18 | | | | 0.18 | | | | 0.14 | | | | 0.19 | | | | 0.15 | |
| | | | | | | |
| | Net realized and unrealized gain | | | 0.88 | | | | 0.13 | | | | 0.64 | | | | 1.02 | | | | 0.11 | | | | 0.13 | |
| | | | | | | |
| | Total from investment operations | | | 1.06 | | | | 0.31 | | | | 0.82 | | | | 1.16 | | | | 0.30 | | | | 0.28 | |
| | | | | | | |
| | Distributions to shareholders from net investment income | | | (0.20 | ) | | | (0.18 | ) | | | (0.17 | ) | | | (0.20 | ) | | | (0.17 | ) | | | (0.10 | ) |
| | | | | | | |
| | Distributions to shareholders from net realized gains | | | (1.31 | ) | | | (0.53 | ) | | | (1.23 | ) | | | (0.43 | ) | | | (0.44 | ) | | | (0.26 | ) |
| | | | | | | |
| | Total distributions | | | (1.51 | ) | | | (0.71 | ) | | | (1.40 | ) | | | (0.63 | ) | | | (0.61 | ) | | | (0.36 | ) |
| | | | | | | |
| | Net asset value, end of period | | $ | 8.69 | | | $ | 9.14 | | | $ | 9.54 | | | $ | 10.12 | | | $ | 9.59 | | | $ | 9.90 | |
| | | | | | | |
| | Total return(b) | | | 12.58 | % | | | 3.94 | % | | | 8.70 | % | | | 12.73 | % | | | 3.33 | % | | | 2.86 | % |
| | | | | | | |
| | Net assets, end of period (in 000s) | | $ | 7,381 | | | $ | 7,049 | | | $ | 49,418 | | | $ | 48,905 | | | $ | 47,340 | | | $ | 50,029 | |
| | | | | | | |
| | Ratio of net expenses to average net assets(c) | | | 0.09 | % | | | 0.23 | % | | | 0.29 | % | | | 0.30 | %(d) | | | 0.31 | % | | | 0.30 | % |
| | | | | | | |
| | Ratio of total expenses to average net assets(c) | | | 3.71 | % | | | 2.36 | % | | | 0.72 | % | | | 0.98 | %(d) | | | 0.80 | % | | | 0.30 | % |
| | | | | | | |
| | Ratio of net investment income to average net assets | | | 2.13 | % | | | 1.99 | % | | | 1.84 | % | | | 1.73 | %(d) | | | 1.97 | % | | | 1.50 | % |
| | | | | | | |
| | Portfolio turnover rate(e) | | | 30 | % | | | 150 | % | | | 143 | % | | | 142 | % | | | 174 | % | | | 160 | % |
| | * | | The Portfolio changed its fiscal year end from October 31 to August 31. |
| | (a) | | Calculated based on the average shares outstanding methodology. |
| | (b) | | Assumes investment at the NAV at the beginning of the period, reinvestment of all dividends and distributions, a complete redemption of the investment at the NAV at the end of the period and no sales or redemption charges (if any). Total returns would be reduced if a sales or redemption charge was taken into account. Returns do not reflect the impact of taxes to shareholders relating to Portfolio distributions or the redemption of Portfolio shares. Total returns for periods less than one full year are not annualized. The Goldman Sachs Target Date 2040 Portfolio’s predecessor was the Madison Target Retirement 2040 Fund (the “Predecessor Fund”). On August 22, 2016, the Predecessor Fund was reorganized as a new series of Goldman Sachs Trust II. Performance prior to August 22, 2016 is that of the Predecessor Fund. Total return information of the Predecessor Fund is included in the above table because the Predecessor Fund is considered the accounting survivor of the reorganization. |
| | (c) | | Expense ratios exclude the expenses of the Underlying Funds in which the Portfolio invests. |
| | (e) | | The Portfolio’s turnover rate is calculated in accordance with regulatory requirements, without regard to transactions involving short term investments. If such transactions were included, the Portfolio’s turnover rate may be higher. |
| | |
| 74 | | The accompanying notes are an integral part of these financial statements. |
GOLDMAN SACHS TARGET DATE 2040 PORTFOLIO
Financial Highlights (continued)
Selected Share Data for a Share Outstanding Throughout Each Period
| | | | | | | | | | | | | | | | | | | | | | |
| | | | | Goldman Sachs Target Date 2040 Portfolio | |
| | | | | Class R Shares | |
| | | | | Year Ended August 31, | | | Period
November 1, 2016 –
August 31, 2017* | | | Period Ended
October 31, 2016(a) | |
| | | | | 2020 | | | 2019 | | | 2018 | |
| | Per Share Data | |
| | | | | | |
| | Net asset value, beginning of period | | $ | 9.06 | | | $ | 9.47 | | | $ | 10.07 | | | $ | 9.57 | | | $ | 9.77 | |
| | | | | | |
| | Net investment income(b) | | | 0.12 | | | | 0.17 | | | | 0.11 | | | | 0.09 | | | | 0.01 | |
| | | | | | |
| | Net realized and unrealized gain (loss) | | | 0.87 | | | | 0.08 | | | | 0.64 | | | | 1.02 | | | | (0.21 | ) |
| | | | | | |
| | Total from investment operations | | | 0.99 | | | | 0.25 | | | | 0.75 | | | | 1.11 | | | | (0.20 | ) |
| | | | | | |
| | Distributions to shareholders from net investment income | | | (0.14 | ) | | | (0.13 | ) | | | (0.12 | ) | | | (0.18 | ) | | | — | |
| | | | | | |
| | Distributions to shareholders from net realized gains | | | (1.31 | ) | | | (0.53 | ) | | | (1.23 | ) | | | (0.43 | ) | | | — | |
| | | | | | |
| | Total distributions | | | (1.45 | ) | | | (0.66 | ) | | | (1.35 | ) | | | (0.61 | ) | | | — | |
| | | | | | |
| | Net asset value, end of period | | $ | 8.60 | | | $ | 9.06 | | | $ | 9.47 | | | $ | 10.07 | | | $ | 9.57 | |
| | | | | | |
| | Total return(c) | | | 11.90 | % | | | 3.17 | % | | | 8.02 | % | | | 12.16 | % | | | (2.05 | )% |
| | | | | | |
| | Net assets, end of period (in 000s) | | $ | 14 | | | $ | 12 | | | $ | 36 | | | $ | 24 | | | $ | 10 | |
| | | | | | |
| | Ratio of net expenses to average net assets(d) | | | 0.74 | % | | | 0.86 | % | | | 0.95 | % | | | 0.97 | %(e) | | | 0.98 | %(e) |
| | | | | | |
| | Ratio of total expenses to average net assets(d) | | | 4.33 | % | | | 4.30 | % | | | 1.39 | % | | | 1.42 | %(e) | | | 3.46 | %(e) |
| | | | | | |
| | Ratio of net investment income to average net assets | | | 1.46 | % | | | 1.88 | % | | | 1.16 | % | | | 1.05 | %(e) | | | 0.77 | %(e) |
| | | | | | |
| | Portfolio turnover rate(f) | | | 30 | % | | | 150 | % | | | 143 | % | | | 142 | % | | | 174 | % |
| | * | | The Portfolio changed its fiscal year end from October 31 to August 31. |
| | (a) | | Commenced operations on August 22, 2016. |
| | (b) | | Calculated based on the average shares outstanding methodology. |
| | (c) | | Assumes investment at the NAV at the beginning of the period, reinvestment of all dividends and distributions, a complete redemption of the investment at the NAV at the end of the period and no sales or redemption charges (if any). Total returns would be reduced if a sales or redemption charge was taken into account. Returns do not reflect the impact of taxes to shareholders relating to Portfolio distributions or the redemption of Portfolio shares. Total returns for periods less than one full year are not annualized. |
| | (d) | | Expense ratios exclude the expenses of the Underlying Funds in which the Portfolio invests. |
| | (f) | | The Portfolio’s turnover rate is calculated in accordance with regulatory requirements, without regard to transactions involving short term investments. If such transactions were included, the Portfolio’s turnover rate may be higher. |
| | |
| The accompanying notes are an integral part of these financial statements. | | 75 |
GOLDMAN SACHS TARGET DATE 2045 PORTFOLIO
Financial Highlights (continued)
Selected Share Data for a Share Outstanding Throughout Each Period
| | | | | | | | | | | | | | | | | | | | | | |
| | | | | Goldman Sachs Target Date 2045 Portfolio | |
| | | | | Class A Shares | |
| | | | | Year Ended August 31, | | | Period
November 1, 2016 –
August 31, 2017* | | | Period Ended
October 31, 2016(a) | |
| | | | | 2020 | | | 2019 | | | 2018 | |
| | Per Share Data | |
| | | | | | |
| | Net asset value, beginning of period | | $ | 10.68 | | | $ | 11.60 | | | $ | 11.01 | | | $ | 9.80 | | | $ | 10.00 | |
| | | | | | |
| | Net investment income(b) | | | 0.16 | | | | 0.20 | | | | 0.16 | | | | 0.08 | | | | 0.02 | |
| | | | | | |
| | Net realized and unrealized gain (loss) | | | 1.10 | | | | (0.04 | ) | | | 0.81 | | | | 1.20 | | | | (0.22 | ) |
| | | | | | |
| | Total from investment operations | | | 1.26 | | | | 0.16 | | | | 0.97 | | | | 1.28 | | | | (0.20 | ) |
| | | | | | |
| | Distributions to shareholders from net investment income | | | (0.21 | ) | | | (0.26 | ) | | | (0.16 | ) | | | (0.07 | ) | | | — | |
| | | | | | |
| | Distributions to shareholders from net realized gains | | | (0.92 | ) | | | (0.82 | ) | | | (0.22 | ) | | | — | | | | — | |
| | | | | | |
| | Total distributions | | | (1.13 | ) | | | (1.08 | ) | | | (0.38 | ) | | | (0.07 | ) | | | — | |
| | | | | | |
| | Net asset value, end of period | | $ | 10.81 | | | $ | 10.68 | | | $ | 11.60 | | | $ | 11.01 | | | $ | 9.80 | |
| | | | | | |
| | Total return(c) | | | 12.26 | % | | | 2.37 | % | | | 9.02 | % | | | 13.17 | % | | | (2.00 | )% |
| | | | | | |
| | Net assets, end of period (in 000s) | | $ | 221 | | | $ | 165 | | | $ | 106 | | | $ | 84 | | | $ | 10 | |
| | | | | | |
| | Ratio of net expenses to average net assets(d) | | | 0.47 | % | | | 0.52 | % | | | 0.69 | % | | | 0.71 | %(e) | | | 0.75 | %(e) |
| | | | | | |
| | Ratio of total expenses to average net assets(d) | | | 4.10 | % | | | 4.91 | % | | | 2.44 | % | | | 5.43 | %(e) | | | 4.23 | %(e) |
| | | | | | |
| | Ratio of net investment income to average net assets | | | 1.62 | % | | | 1.86 | % | | | 1.42 | % | | | 0.90 | %(e) | | | 1.02 | %(e) |
| | | | | | |
| | Portfolio turnover rate(f) | | | 23 | % | | | 147 | % | | | 145 | % | | | 143 | % | | | 29 | % |
| | * | | The Portfolio changed its fiscal year end from October 31 to August 31. |
| | (a) | | Commenced operations on August 22, 2016. |
| | (b) | | Calculated based on the average shares outstanding methodology. |
| | (c) | | Assumes investment at the NAV at the beginning of the period, reinvestment of all dividends and distributions, a complete redemption of the investment at the NAV at the end of the period and no sales or redemption charges (if any). Total returns would be reduced if a sales or redemption charge was taken into account. Returns do not reflect the impact of taxes to shareholders relating to Portfolio distributions or the redemption of Portfolio shares. Total returns for periods less than one full year are not annualized. |
| | (d) | | Expense ratios exclude the expenses of the Underlying Funds in which the Portfolio invests. |
| | (f) | | The Portfolio’s turnover rate is calculated in accordance with regulatory requirements, without regard to transactions involving short term investments. If such transactions were included, the Portfolio’s turnover rate may be higher. |
| | |
| 76 | | The accompanying notes are an integral part of these financial statements. |
GOLDMAN SACHS TARGET DATE 2045 PORTFOLIO
Financial Highlights (continued)
Selected Share Data for a Share Outstanding Throughout Each Period
| | | | | | | | | | | | | | | | | | | | | | |
| | | | | Goldman Sachs Target Date 2045 Portfolio | |
| | | | | Institutional Shares | |
| | | | | Year Ended August 31, | | | Period
November 1, 2016 –
August 31, 2017* | | | Period Ended
October 31, 2016(a) | |
| | | | | 2020 | | | 2019 | | | 2018 | |
| | Per Share Data | |
| | | | | | |
| | Net asset value, beginning of period | | $ | 10.74 | | | $ | 11.65 | | | $ | 11.04 | | | $ | 9.81 | | | $ | 10.00 | |
| | | | | | |
| | Net investment income(b) | | | 0.21 | | | | 0.23 | | | | 0.21 | | | | 0.15 | | | | 0.03 | |
| | | | | | |
| | Net realized and unrealized gain (loss) | | | 1.09 | | | | (0.02 | ) | | | 0.81 | | | | 1.17 | | | | (0.22 | ) |
| | | | | | |
| | Total from investment operations | | | 1.30 | | | | 0.21 | | | | 1.02 | | | | 1.32 | | | | (0.19 | ) |
| | | | | | |
| | Distributions to shareholders from net investment income | | | (0.24 | ) | | | (0.30 | ) | | | (0.19 | ) | | | (0.09 | ) | | | — | |
| | | | | | |
| | Distributions to shareholders from net realized gains | | | (0.92 | ) | | | (0.82 | ) | | | (0.22 | ) | | | — | | | | — | |
| | | | | | |
| | Total distributions | | | (1.16 | ) | | | (1.12 | ) | | | (0.41 | ) | | | (0.09 | ) | | | — | |
| | | | | | |
| | Net asset value, end of period | | $ | 10.88 | | | $ | 10.74 | | | $ | 11.65 | | | $ | 11.04 | | | $ | 9.81 | |
| | | | | | |
| | Total return(c) | | | 12.63 | % | | | 2.81 | % | | | 9.40 | % | | | 13.52 | % | | | (1.90 | )% |
| | | | | | |
| | Net assets, end of period (in 000s) | | $ | 6,999 | | | $ | 6,205 | | | $ | 11,472 | | | $ | 11,077 | | | $ | 9,756 | |
| | | | | | |
| | Ratio of net expenses to average net assets(d) | | | 0.09 | % | | | 0.16 | % | | | 0.30 | % | | | 0.32 | %(e) | | | 0.34 | %(e) |
| | | | | | |
| | Ratio of total expenses to average net assets(d) | | | 3.73 | % | | | 4.09 | % | | | 2.05 | % | | | 3.82 | %(e) | | | 3.85 | %(e) |
| | | | | | |
| | Ratio of net investment income to average net assets | | | 2.02 | % | | | 2.17 | % | | | 1.83 | % | | | 1.69 | %(e) | | | 1.43 | %(e) |
| | | | | | |
| | Portfolio turnover rate(f) | | | 23 | % | | | 147 | % | | | 145 | % | | | 143 | % | | | 29 | % |
| | * | | The Portfolio changed its fiscal year end from October 31 to August 31. |
| | (a) | | Commenced operations on August 22, 2016. |
| | (b) | | Calculated based on the average shares outstanding methodology. |
| | (c) | | Assumes investment at the NAV at the beginning of the period, reinvestment of all dividends and distributions, a complete redemption of the investment at the NAV at the end of the period and no sales or redemption charges (if any). Total returns would be reduced if a sales or redemption charge was taken into account. Returns do not reflect the impact of taxes to shareholders relating to Portfolio distributions or the redemption of Portfolio shares. Total returns for periods less than one full year are not annualized. |
| | (d) | | Expense ratios exclude the expenses of the Underlying Funds in which the Portfolio invests. |
| | (f) | | The Portfolio’s turnover rate is calculated in accordance with regulatory requirements, without regard to transactions involving short term investments. If such transactions were included, the Portfolio’s turnover rate may be higher. |
| | |
| The accompanying notes are an integral part of these financial statements. | | 77 |
GOLDMAN SACHS TARGET DATE 2045 PORTFOLIO
Financial Highlights (continued)
Selected Share Data for a Share Outstanding Throughout Each Period
| | | | | | | | | | | | | | | | | | | | | | |
| | | | | Goldman Sachs Target Date 2045 Portfolio
| |
| | | | | Service Shares | |
| | | | | Year Ended August 31, | | | Period
November 1, 2016 –
August 31, 2017* | | | Period Ended
October 31, 2016(a) | |
| | | | | 2020 | | | 2019 | | | 2018 | |
| | Per Share Data | |
| | | | | | |
| | Net asset value, beginning of period | | $ | 10.69 | | | $ | 11.60 | | | $ | 11.00 | | | $ | 9.80 | | | $ | 10.00 | |
| | | | | | |
| | Net investment income(b) | | | 0.15 | | | | 0.18 | | | | 0.15 | | | | 0.10 | | | | 0.02 | |
| | | | | | |
| | Net realized and unrealized gain (loss) | | | 1.10 | | | | (0.02 | ) | | | 0.81 | | | | 1.17 | | | | (0.22 | ) |
| | | | | | |
| | Total from investment operations | | | 1.25 | | | | 0.16 | | | | 0.96 | | | | 1.27 | | | | (0.20 | ) |
| | | | | | |
| | Distributions to shareholders from net investment income | | | (0.19 | ) | | | (0.25 | ) | | | (0.14 | ) | | | (0.07 | ) | | | — | |
| | | | | | |
| | Distributions to shareholders from net realized gains | | | (0.92 | ) | | | (0.82 | ) | | | (0.22 | ) | | | — | | | | — | |
| | | | | | |
| | Total distributions | | | (1.11 | ) | | | (1.07 | ) | | | (0.36 | ) | | | (0.07 | ) | | | — | |
| | | | | | |
| | Net asset value, end of period | | $ | 10.83 | | | $ | 10.69 | | | $ | 11.60 | | | $ | 11.00 | | | $ | 9.80 | |
| | | | | | |
| | Total return(c) | | | 12.18 | % | | | 2.30 | % | | | 8.83 | % | | | 13.03 | % | | | (2.00 | )% |
| | | | | | |
| | Net assets, end of period (in 000s) | | $ | 14 | | | $ | 12 | | | $ | 12 | | | $ | 11 | | | $ | 10 | |
| | | | | | |
| | Ratio of net expenses to average net assets(d) | | | 0.60 | % | | | 0.64 | % | | | 0.80 | % | | | 0.81 | %(e) | | | 0.84 | %(e) |
| | | | | | |
| | Ratio of total expenses to average net assets(d) | | | 4.23 | % | | | 4.93 | % | | | 2.53 | % | | | 4.30 | %(e) | | | 4.33 | %(e) |
| | | | | | |
| | Ratio of net investment income to average net assets | | | 1.51 | % | | | 1.74 | % | | | 1.33 | % | | | 1.20 | %(e) | | | 0.93 | %(e) |
| | | | | | |
| | Portfolio turnover rate(f) | | | 23 | % | | | 147 | % | | | 145 | % | | | 143 | % | | | 29 | % |
| | * | | The Portfolio changed its fiscal year end from October 31 to August 31. |
| | (a) | | Commenced operations on August 22, 2016. |
| | (b) | | Calculated based on the average shares outstanding methodology. |
| | (c) | | Assumes investment at the NAV at the beginning of the period, reinvestment of all dividends and distributions, a complete redemption of the investment at the NAV at the end of the period and no sales or redemption charges (if any). Total returns would be reduced if a sales or redemption charge was taken into account. Returns do not reflect the impact of taxes to shareholders relating to Portfolio distributions or the redemption of Portfolio shares. Total returns for periods less than one full year are not annualized. |
| | (d) | | Expense ratios exclude the expenses of the Underlying Funds in which the Portfolio invests. |
| | (f) | | The Portfolio’s turnover rate is calculated in accordance with regulatory requirements, without regard to transactions involving short term investments. If such transactions were included, the Portfolio’s turnover rate may be higher. |
| | |
| 78 | | The accompanying notes are an integral part of these financial statements. |
GOLDMAN SACHS TARGET DATE 2045 PORTFOLIO
Financial Highlights (continued)
Selected Share Data for a Share Outstanding Throughout Each Period
| | | | | | | | | | | | | | | | | | | | | | |
| | | | | Goldman Sachs Target Date 2045 Portfolio
| |
| | | | | Investor Shares | |
| | | | | Year Ended August 31, | | | Period
November 1, 2016 –
August 31, 2017* | | | Period Ended
October 31, 2016(a) | |
| | | | | 2020 | | | 2019 | | | 2018 | |
| | Per Share Data | |
| | | | | | |
| | Net asset value, beginning of period | | $ | 10.71 | | | $ | 11.62 | | | $ | 11.03 | | | $ | 9.80 | | | $ | 10.00 | |
| | | | | | |
| | Net investment income(b) | | | 0.25 | | | | 0.22 | | | | 0.19 | | | | 0.10 | | | | 0.02 | |
| | | | | | |
| | Net realized and unrealized gain (loss) | | | 1.04 | | | | (0.02 | ) | | | 0.80 | | | | 1.21 | | | | (0.22 | ) |
| | | | | | |
| | Total from investment operations | | | 1.29 | | | | 0.20 | | | | 0.99 | | | | 1.31 | | | | (0.20 | ) |
| | | | | | |
| | Distributions to shareholders from net investment income | | | (0.23 | ) | | | (0.29 | ) | | | (0.18 | ) | | | (0.08 | ) | | | — | |
| | | | | | |
| | Distributions to shareholders from net realized gains | | | (0.92 | ) | | | (0.82 | ) | | | (0.22 | ) | | | — | | | | — | |
| | | | | | |
| | Total distributions | | | (1.15 | ) | | | (1.11 | ) | | | (0.40 | ) | | | (0.08 | ) | | | — | |
| | | | | | |
| | Net asset value, end of period | | $ | 10.85 | | | $ | 10.71 | | | $ | 11.62 | | | $ | 11.03 | | | $ | 9.80 | |
| | | | | | |
| | Total return(c) | | | 12.55 | % | | | 2.71 | % | | | 9.19 | % | | | 13.48 | % | | | (2.00 | )% |
| | | | | | |
| | Net assets, end of period (in 000s) | | $ | 189 | | | $ | 857 | | | $ | 600 | | | $ | 97 | | | $ | 10 | |
| | | | | | |
| | Ratio of net expenses to average net assets(d) | | | 0.22 | % | | | 0.27 | % | | | 0.44 | % | | | 0.46 | %(e) | | | 0.49 | %(e) |
| | | | | | |
| | Ratio of total expenses to average net assets(d) | | | 3.91 | % | | | 4.65 | % | | | 2.18 | % | | | 6.16 | %(e) | | | 3.97 | %(e) |
| | | | | | |
| | Ratio of net investment income to average net assets | | | 2.36 | % | | | 2.10 | % | | | 1.69 | % | | | 1.13 | %(e) | | | 1.28 | %(e) |
| | | | | | |
| | Portfolio turnover rate(f) | | | 23 | % | | | 147 | % | | | 145 | % | | | 143 | % | | | 29 | % |
| | * | | The Portfolio changed its fiscal year end from October 31 to August 31. |
| | (a) | | Commenced operations on August 22, 2016. |
| | (b) | | Calculated based on the average shares outstanding methodology. |
| | (c) | | Assumes investment at the NAV at the beginning of the period, reinvestment of all dividends and distributions, a complete redemption of the investment at the NAV at the end of the period and no sales or redemption charges (if any). Total returns would be reduced if a sales or redemption charge was taken into account. Returns do not reflect the impact of taxes to shareholders relating to Portfolio distributions or the redemption of Portfolio shares. Total returns for periods less than one full year are not annualized. |
| | (d) | | Expense ratios exclude the expenses of the Underlying Funds in which the Portfolio invests. |
| | (f) | | The Portfolio’s turnover rate is calculated in accordance with regulatory requirements, without regard to transactions involving short term investments. If such transactions were included, the Portfolio’s turnover rate may be higher. |
| | |
| The accompanying notes are an integral part of these financial statements. | | 79 |
GOLDMAN SACHS TARGET DATE 2045 PORTFOLIO
Financial Highlights (continued)
Selected Share Data for a Share Outstanding Throughout Each Period
| | | | | | | | | | | | | | | | | | | | | | |
| | | | | Goldman Sachs Target Date 2045 Portfolio
| |
| | | | | Class R6 Shares | |
| | | | | Year Ended August 31, | | | Period
November 1, 2016 –
August 31, 2017* | | | Period Ended
October 31, 2016(a) | |
| | | | | 2020 | | | 2019 | | | 2018 | |
| | Per Share Data | |
| | | | | | |
| | Net asset value, beginning of period | | $ | 10.73 | | | $ | 11.64 | | | $ | 11.04 | | | $ | 9.81 | | | $ | 10.00 | |
| | | | | | |
| | Net investment income(b) | | | 0.25 | | | | 0.24 | | | | 0.20 | | | | 0.15 | | | | 0.03 | |
| | | | | | |
| | Net realized and unrealized gain (loss) | | | 1.06 | | | | (0.03 | ) | | | 0.81 | | | | 1.17 | | | | (0.22 | ) |
| | | | | | |
| | Total from investment operations | | | 1.31 | | | | 0.21 | | | | 1.01 | | | | 1.32 | | | | (0.19 | ) |
| | | | | | |
| | Distributions to shareholders from net investment income | | | (0.24 | ) | | | (0.30 | ) | | | (0.19 | ) | | | (0.09 | ) | | | — | |
| | | | | | |
| | Distributions to shareholders from net realized gains | | | (0.92 | ) | | | (0.82 | ) | | | (0.22 | ) | | | — | | | | — | |
| | | | | | |
| | Total distributions | | | (1.16 | ) | | | (1.12 | ) | | | (0.41 | ) | | | (0.09 | ) | | | — | |
| | | | | | |
| | Net asset value, end of period | | $ | 10.88 | | | $ | 10.73 | | | $ | 11.64 | | | $ | 11.04 | | | $ | 9.81 | |
| | | | | | |
| | Total return(c) | | | 12.74 | % | | | 2.87 | % | | | 9.34 | % | | | 13.64 | % | | | (2.00 | )% |
| | | | | | |
| | Net assets, end of period (in 000s) | | $ | 320 | | | $ | 742 | | | $ | 270 | | | $ | 14 | | | $ | 10 | |
| | | | | | |
| | Ratio of net expenses to average net assets(d) | | | 0.07 | % | | | 0.09 | % | | | 0.28 | % | | | 0.31 | %(e) | | | 0.32 | %(e) |
| | | | | | |
| | Ratio of total expenses to average net assets(d) | | | 3.72 | % | | | 4.63 | % | | | 2.03 | % | | | 4.00 | %(e) | | | 3.93 | %(e) |
| | | | | | |
| | Ratio of net investment income to average net assets | | | 2.46 | % | | | 2.23 | % | | | 1.72 | % | | | 1.68 | %(e) | | | 1.45 | %(e) |
| | | | | | |
| | Portfolio turnover rate(f) | | | 23 | % | | | 147 | % | | | 145 | % | | | 143 | % | | | 29 | % |
| | * | | The Portfolio changed its fiscal year end from October 31 to August 31. |
| | (a) | | Commenced operations on August 22, 2016. |
| | (b) | | Calculated based on the average shares outstanding methodology. |
| | (c) | | Assumes investment at the NAV at the beginning of the period, reinvestment of all dividends and distributions, a complete redemption of the investment at the NAV at the end of the period and no sales or redemption charges (if any). Total returns would be reduced if a sales or redemption charge was taken into account. Returns do not reflect the impact of taxes to shareholders relating to Portfolio distributions or the redemption of Portfolio shares. Total returns for periods less than one full year are not annualized. |
| | (d) | | Expense ratios exclude the expenses of the Underlying Funds in which the Portfolio invests. |
| | (f) | | The Portfolio’s turnover rate is calculated in accordance with regulatory requirements, without regard to transactions involving short term investments. If such transactions were included, the Portfolio’s turnover rate may be higher. |
| | |
| 80 | | The accompanying notes are an integral part of these financial statements. |
GOLDMAN SACHS TARGET DATE 2045 PORTFOLIO
Financial Highlights (continued)
Selected Share Data for a Share Outstanding Throughout Each Period
| | | | | | | | | | | | | | | | | | | | | | |
| | | | | Goldman Sachs Target Date 2045 Portfolio
| |
| | | | | Class R Shares | |
| | | | | Year Ended August 31, | | | Period
November 1, 2016 –
August 31, 2017* | | | Period Ended
October 31, 2016(a) | |
| | | | | 2020 | | | 2019 | | | 2018 | |
| | Per Share Data | |
| | | | | | |
| | Net asset value, beginning of period | | $ | 10.66 | | | $ | 11.58 | | | $ | 10.99 | | | $ | 9.79 | | | $ | 10.00 | |
| | | | | | |
| | Net investment income(b) | | | 0.14 | | | | 0.20 | | | | 0.13 | | | | 0.09 | | | | 0.01 | |
| | | | | | |
| | Net realized and unrealized gain (loss) | | | 1.09 | | | | (0.06 | ) | | | 0.81 | | | | 1.17 | | | | (0.22 | ) |
| | | | | | |
| | Total from investment operations | | | 1.23 | | | | 0.14 | | | | 0.94 | | | | 1.26 | | | | (0.21 | ) |
| | | | | | |
| | Distributions to shareholders from net investment income | | | (0.17 | ) | | | (0.24 | ) | | | (0.13 | ) | | | (0.06 | ) | | | — | |
| | | | | | |
| | Distributions to shareholders from net realized gains | | | (0.92 | ) | | | (0.82 | ) | | | (0.22 | ) | | | — | | | | — | |
| | | | | | |
| | Total distributions | | | (1.09 | ) | | | (1.06 | ) | | | (0.35 | ) | | | (0.06 | ) | | | — | |
| | | | | | |
| | Net asset value, end of period | | $ | 10.80 | | | $ | 10.66 | | | $ | 11.58 | | | $ | 10.99 | | | $ | 9.79 | |
| | | | | | |
| | Total return(c) | | | 12.05 | % | | | 2.10 | % | | | 8.74 | % | | | 12.98 | % | | | (2.10 | )% |
| | | | | | |
| | Net assets, end of period (in 000s) | | $ | 14 | | | $ | 12 | | | $ | 41 | | | $ | 29 | | | $ | 10 | |
| | | | | | |
| | Ratio of net expenses to average net assets(d) | | | 0.73 | % | | | 0.84 | % | | | 0.94 | % | | | 0.95 | %(e) | | | 0.99 | %(e) |
| | | | | | |
| | Ratio of total expenses to average net assets(d) | | | 4.36 | % | | | 4.49 | % | | | 2.68 | % | | | 4.63 | %(e) | | | 4.48 | %(e) |
| | | | | | |
| | Ratio of net investment income to average net assets | | | 1.38 | % | | | 1.84 | % | | | 1.17 | % | | | 1.07 | %(e) | | | 0.78 | %(e) |
| | | | | | |
| | Portfolio turnover rate(f) | | | 23 | % | | | 147 | % | | | 145 | % | | | 143 | % | | | 29 | % |
| | * | | The Portfolio changed its fiscal year end from October 31 to August 31. |
| | (a) | | Commenced operations on August 22, 2016. |
| | (b) | | Calculated based on the average shares outstanding methodology. |
| | (c) | | Assumes investment at the NAV at the beginning of the period, reinvestment of all dividends and distributions, a complete redemption of the investment at the NAV at the end of the period and no sales or redemption charges (if any). Total returns would be reduced if a sales or redemption charge was taken into account. Returns do not reflect the impact of taxes to shareholders relating to Portfolio distributions or the redemption of Portfolio shares. Total returns for periods less than one full year are not annualized. |
| | (d) | | Expense ratios exclude the expenses of the Underlying Funds in which the Portfolio invests. |
| | (f) | | The Portfolio’s turnover rate is calculated in accordance with regulatory requirements, without regard to transactions involving short term investments. If such transactions were included, the Portfolio’s turnover rate may be higher. |
| | |
| The accompanying notes are an integral part of these financial statements. | | 81 |
GOLDMAN SACHS TARGET DATE 2050 PORTFOLIO
Financial Highlights (continued)
Selected Share Data for a Share Outstanding Throughout Each Period
| | | | | | | | | | | | | | | | | | | | | | |
| | | | | Goldman Sachs Target Date 2050 Portfolio | |
| | | | | Class A Shares | |
| | | | | Year Ended August 31, | | | Period
November 1, 2016 –
August 31, 2017* | | | Period Ended
October 31, 2016(a) | |
| | | | | 2020 | | | 2019 | | | 2018 | |
| | Per Share Data | |
| | | | | | |
| | Net asset value, beginning of period | | $ | 10.13 | | | $ | 10.69 | | | $ | 10.54 | | | $ | 9.80 | | | $ | 10.00 | |
| | | | | | |
| | Net investment income(b) | | | 0.14 | | | | 0.18 | | | | 0.14 | | | | 0.12 | | | | 0.02 | |
| | | | | | |
| | Net realized and unrealized gain (loss) | | | 1.04 | | | | (0.07 | ) | | | 0.84 | | | | 1.21 | | | | (0.22 | ) |
| | | | | | |
| | Total from investment operations | | | 1.18 | | | | 0.11 | | | | 0.98 | | | | 1.33 | | | | (0.20 | ) |
| | | | | | |
| | Distributions to shareholders from net investment income | | | (0.17 | ) | | | (0.17 | ) | | | (0.16 | ) | | | (0.19 | ) | | | — | |
| | | | | | |
| | Distributions to shareholders from net realized gains | | | (1.43 | ) | | | (0.50 | ) | | | (0.67 | ) | | | (0.40 | ) | | | — | |
| | | | | | |
| | Total distributions | | | (1.60 | ) | | | (0.67 | ) | | | (0.83 | ) | | | (0.59 | ) | | | — | |
| | | | | | |
| | Net asset value, end of period | | $ | 9.71 | | | $ | 10.13 | | | $ | 10.69 | | | $ | 10.54 | | | $ | 9.80 | |
| | | | | | |
| | Total return(c) | | | 12.42 | % | | | 1.51 | % | | | 9.66 | % | | | 14.21 | % | | | (2.00 | )% |
| | | | | | |
| | Net assets, end of period (in 000s) | | $ | 687 | | | $ | 359 | | | $ | 218 | | | $ | 49 | | | $ | 10 | |
| | | | | | |
| | Ratio of net expenses to average net assets(d) | | | 0.48 | % | | | 0.52 | % | | | 0.70 | % | | | 0.71 | %(e) | | | 0.74 | %(e) |
| | | | | | |
| | Ratio of total expenses to average net assets(d) | | | 3.82 | % | | | 5.40 | % | | | 1.57 | % | | | 1.34 | %(e) | | | 6.30 | %(e) |
| | | | | | |
| | Ratio of net investment income to average net assets | | | 1.52 | % | | | 1.81 | % | | | 1.38 | % | | | 1.38 | %(e) | | | 1.04 | %(e) |
| | | | | | |
| | Portfolio turnover rate(f) | | | 26 | % | | | 171 | % | | | 155 | % | | | 139 | % | | | 191 | % |
| | * | | The Portfolio changed its fiscal year end from October 31 to August 31. |
| | (a) | | Commenced operations on August 22, 2016. |
| | (b) | | Calculated based on the average shares outstanding methodology. |
| | (c) | | Assumes investment at the NAV at the beginning of the period, reinvestment of all dividends and distributions, a complete redemption of the investment at the NAV at the end of the period and no sales or redemption charges (if any). Total returns would be reduced if a sales or redemption charge was taken into account. Returns do not reflect the impact of taxes to shareholders relating to Portfolio distributions or the redemption of Portfolio shares. Total returns for periods less than one full year are not annualized. |
| | (d) | | Expense ratios exclude the expenses of the Underlying Funds in which the Portfolio invests. |
| | (f) | | The Portfolio’s turnover rate is calculated in accordance with regulatory requirements, without regard to transactions involving short term investments. If such transactions were included, the Portfolio’s turnover rate may be higher. |
| | |
| 82 | | The accompanying notes are an integral part of these financial statements. |
GOLDMAN SACHS TARGET DATE 2050 PORTFOLIO
Financial Highlights (continued)
Selected Share Data for a Share Outstanding Throughout Each Period
| | | | | | | | | | | | | | | | | | | | | | |
| | | | | Goldman Sachs Target Date 2050 Portfolio | |
| | | | | Institutional Shares | |
| | | | | Year Ended August 31, | | | Period
November 1, 2016 –
August 31, 2017* | | | Period Ended
October 31, 2016(a) | |
| | | | | 2020 | | | 2019 | | | 2018 | |
| | Per Share Data | |
| | | | | | |
| | Net asset value, beginning of period | | $ | 10.19 | | | $ | 10.74 | | | $ | 10.56 | | | $ | 9.80 | | | $ | 10.00 | |
| | | | | | |
| | Net investment income(b) | | | 0.18 | | | | 0.22 | | | | 0.19 | | | | 0.14 | | | | 0.03 | |
| | | | | | |
| | Net realized and unrealized gain (loss) | | | 1.04 | | | | (0.07 | ) | | | 0.84 | | | | 1.22 | | | | (0.23 | ) |
| | | | | | |
| | Total from investment operations | | | 1.22 | | | | 0.15 | | | | 1.03 | | | | 1.36 | | | | (0.20 | ) |
| | | | | | |
| | Distributions to shareholders from net investment income | | | (0.19 | ) | | | (0.20 | ) | | | (0.18 | ) | | | (0.20 | ) | | | — | |
| | | | | | |
| | Distributions to shareholders from net realized gains | | | (1.43 | ) | | | (0.50 | ) | | | (0.67 | ) | | | (0.40 | ) | | | — | |
| | | | | | |
| | Total distributions | | | (1.62 | ) | | | (0.70 | ) | | | (0.85 | ) | | | (0.60 | ) | | | — | |
| | | | | | |
| | Net asset value, end of period | | $ | 9.79 | | | $ | 10.19 | | | $ | 10.74 | | | $ | 10.56 | | | $ | 9.80 | |
| | | | | | |
| | Total return(c) | | | 12.88 | % | | | 1.95 | % | | | 10.10 | % | | | 14.58 | % | | | (2.00 | )% |
| | | | | | |
| | Net assets, end of period (in 000s) | | $ | 21 | | | $ | 16 | | | $ | 12 | | | $ | 11 | | | $ | 10 | |
| | | | | | |
| | Ratio of net expenses to average net assets(d) | | | 0.10 | % | | | 0.14 | % | | | 0.30 | % | | | 0.32 | %(e) | | | 0.34 | %(e) |
| | | | | | |
| | Ratio of total expenses to average net assets(d) | | | 3.83 | % | | | 4.87 | % | | | 1.06 | % | | | 1.63 | %(e) | | | 5.90 | %(e) |
| | | | | | |
| | Ratio of net investment income to average net assets | | | 1.99 | % | | | 2.21 | % | | | 1.81 | % | | | 1.71 | %(e) | | | 1.44 | %(e) |
| | | | | | |
| | Portfolio turnover rate(f) | | | 26 | % | | | 171 | % | | | 155 | % | | | 139 | % | | | 191 | % |
| | * | | The Portfolio changed its fiscal year end from October 31 to August 31. |
| | (a) | | Commenced operations on August 22, 2016. |
| | (b) | | Calculated based on the average shares outstanding methodology. |
| | (c) | | Assumes investment at the NAV at the beginning of the period, reinvestment of all dividends and distributions, a complete redemption of the investment at the NAV at the end of the period and no sales or redemption charges (if any). Total returns would be reduced if a sales or redemption charge was taken into account. Returns do not reflect the impact of taxes to shareholders relating to Portfolio distributions or the redemption of Portfolio shares. Total returns for periods less than one full year are not annualized. |
| | (d) | | Expense ratios exclude the expenses of the Underlying Funds in which the Portfolio invests. |
| | (f) | | The Portfolio’s turnover rate is calculated in accordance with regulatory requirements, without regard to transactions involving short term investments. If such transactions were included, the Portfolio’s turnover rate may be higher. |
| | |
| The accompanying notes are an integral part of these financial statements. | | 83 |
GOLDMAN SACHS TARGET DATE 2050 PORTFOLIO
Financial Highlights (continued)
Selected Share Data for a Share Outstanding Throughout Each Period
| | | | | | | | | | | | | | | | | | | | | | |
| | | | | Goldman Sachs Target Date 2050 Portfolio | |
| | | | | Service Shares | |
| | | | | Year Ended August 31, | | | Period
November 1, 2016 –
August 31, 2017* | | | Period Ended
October 31, 2016(a) | |
| | | | | 2020 | | | 2019 | | | 2018 | |
| | Per Share Data | |
| | | | | | |
| | Net asset value, beginning of period | | $ | 10.15 | | | $ | 10.70 | | | $ | 10.53 | | | $ | 9.79 | | | $ | 10.00 | |
| | | | | | |
| | Net investment income(b) | | | 0.14 | | | | 0.17 | | | | 0.14 | | | | 0.10 | | | | 0.02 | |
| | | | | | |
| | Net realized and unrealized gain (loss) | | | 1.03 | | | | (0.07 | ) | | | 0.83 | | | | 1.22 | | | | (0.23 | ) |
| | | | | | |
| | Total from investment operations | | | 1.17 | | | | 0.10 | | | | 0.97 | | | | 1.32 | | | | (0.21 | ) |
| | | | | | |
| | Distributions to shareholders from net investment income | | | (0.15 | ) | | | (0.15 | ) | | | (0.13 | ) | | | (0.18 | ) | | | — | |
| | | | | | |
| | Distributions to shareholders from net realized gains | | | (1.43 | ) | | | (0.50 | ) | | | (0.67 | ) | | | (0.40 | ) | | | — | |
| | | | | | |
| | Total distributions | | | (1.58 | ) | | | (0.65 | ) | | | (0.80 | ) | | | (0.58 | ) | | | — | |
| | | | | | |
| | Net asset value, end of period | | $ | 9.74 | | | $ | 10.15 | | | $ | 10.70 | | | $ | 10.53 | | | $ | 9.79 | |
| | | | | | |
| | Total return(c) | | | 12.33 | % | | | 1.41 | % | | | 9.53 | % | | | 14.18 | % | | | (2.10 | )% |
| | | | | | |
| | Net assets, end of period (in 000s) | | $ | 14 | | | $ | 12 | | | $ | 12 | | | $ | 11 | | | $ | 10 | |
| | | | | | |
| | Ratio of net expenses to average net assets(d) | | | 0.61 | % | | | 0.65 | % | | | 0.80 | % | | | 0.82 | %(e) | | | 0.83 | %(e) |
| | | | | | |
| | Ratio of total expenses to average net assets(d) | | | 4.42 | % | | | 5.26 | % | | | 1.56 | % | | | 2.13 | %(e) | | | 6.40 | %(e) |
| | | | | | |
| | Ratio of net investment income to average net assets | | | 1.51 | % | | | 1.71 | % | | | 1.32 | % | | | 1.21 | %(e) | | | 0.95 | %(e) |
| | | | | | |
| | Portfolio turnover rate(f) | | | 26 | % | | | 171 | % | | | 155 | % | | | 139 | % | | | 191 | % |
| | * | | The Portfolio changed its fiscal year end from October 31 to August 31. |
| | (a) | | Commenced operations on August 22, 2016. |
| | (b) | | Calculated based on the average shares outstanding methodology. |
| | (c) | | Assumes investment at the NAV at the beginning of the period, reinvestment of all dividends and distributions, a complete redemption of the investment at the NAV at the end of the period and no sales or redemption charges (if any). Total returns would be reduced if a sales or redemption charge was taken into account. Returns do not reflect the impact of taxes to shareholders relating to Portfolio distributions or the redemption of Portfolio shares. Total returns for periods less than one full year are not annualized. |
| | (d) | | Expense ratios exclude the expenses of the Underlying Funds in which the Portfolio invests. |
| | (f) | | The Portfolio’s turnover rate is calculated in accordance with regulatory requirements, without regard to transactions involving short term investments. If such transactions were included, the Portfolio’s turnover rate may be higher. |
| | |
| 84 | | The accompanying notes are an integral part of these financial statements. |
GOLDMAN SACHS TARGET DATE 2050 PORTFOLIO
Financial Highlights (continued)
Selected Share Data for a Share Outstanding Throughout Each Period
| | | | | | | | | | | | | | | | | | | | | | |
| | | | | Goldman Sachs Target Date 2050 Portfolio | |
| | | | | Investor Shares | |
| | | | | Year Ended August 31, | | | Period
November 1, 2016 –
August 31, 2017* | | | Period Ended
October 31, 2016(a) | |
| | | | | 2020 | | | 2019 | | | 2018 | |
| | Per Share Data | |
| | | | | | |
| | Net asset value, beginning of period | | $ | 10.17 | | | $ | 10.72 | | | $ | 10.55 | | | $ | 9.80 | | | $ | 10.00 | |
| | | | | | |
| | Net investment income(b) | | | 0.24 | | | | 0.20 | | | | 0.18 | | | | 0.11 | | | | 0.02 | |
| | | | | | |
| | Net realized and unrealized gain (loss) | | | 0.96 | | | | (0.06 | ) | | | 0.83 | | | | 1.24 | | | | (0.22 | ) |
| | | | | | |
| | Total from investment operations | | | 1.20 | | | | 0.14 | | | | 1.01 | | | | 1.35 | | | | (0.20 | ) |
| | | | | | |
| | Distributions to shareholders from net investment income | | | (0.18 | ) | | | (0.19 | ) | | | (0.17 | ) | | | (0.20 | ) | | | — | |
| | | | | | |
| | Distributions to shareholders from net realized gains | | | (1.43 | ) | | | (0.50 | ) | | | (0.67 | ) | | | (0.40 | ) | | | — | |
| | | | | | |
| | Total distributions | | | (1.61 | ) | | | (0.69 | ) | | | (0.84 | ) | | | (0.60 | ) | | | — | |
| | | | | | |
| | Net asset value, end of period | | $ | 9.76 | | | $ | 10.17 | | | $ | 10.72 | | | $ | 10.55 | | | $ | 9.80 | |
| | | | | | |
| | Total return(c) | | | 12.68 | % | | | 1.80 | % | | | 9.98 | % | | | 14.42 | % | | | (2.00 | )% |
| | | | | | |
| | Net assets, end of period (in 000s) | | $ | 145 | | | $ | 998 | | | $ | 830 | | | $ | 156 | | | $ | 10 | |
| | | | | | |
| | Ratio of net expenses to average net assets(d) | | | 0.22 | % | | | 0.29 | % | | | 0.45 | % | | | 0.47 | %(e) | | | 0.48 | %(e) |
| | | | | | |
| | Ratio of total expenses to average net assets(d) | | | 5.91 | % | | | 4.95 | % | | | 1.21 | % | | | 1.45 | %(e) | | | 6.04 | %(e) |
| | | | | | |
| | Ratio of net investment income to average net assets | | | 2.42 | % | | | 2.06 | % | | | 1.70 | % | | | 1.31 | %(e) | | | 1.30 | %(e) |
| | | | | | |
| | Portfolio turnover rate(f) | | | 26 | % | | | 171 | % | | | 155 | % | | | 139 | % | | | 191 | % |
| | * | | The Portfolio changed its fiscal year end from October 31 to August 31. |
| | (a) | | Commenced operations on August 22, 2016. |
| | (b) | | Calculated based on the average shares outstanding methodology. |
| | (c) | | Assumes investment at the NAV at the beginning of the period, reinvestment of all dividends and distributions, a complete redemption of the investment at the NAV at the end of the period and no sales or redemption charges (if any). Total returns would be reduced if a sales or redemption charge was taken into account. Returns do not reflect the impact of taxes to shareholders relating to Portfolio distributions or the redemption of Portfolio shares. Total returns for periods less than one full year are not annualized. |
| | (d) | | Expense ratios exclude the expenses of the Underlying Funds in which the Portfolio invests. |
| | (f) | | The Portfolio’s turnover rate is calculated in accordance with regulatory requirements, without regard to transactions involving short term investments. If such transactions were included, the Portfolio’s turnover rate may be higher. |
| | |
| The accompanying notes are an integral part of these financial statements. | | 85 |
GOLDMAN SACHS TARGET DATE 2050 PORTFOLIO
Financial Highlights (continued)
Selected Share Data for a Share Outstanding Throughout Each Period
| | | | | | | | | | | | | | | | | | | | | | | | | | |
| | | | | Goldman Sachs Target Date 2050 Portfolio | |
| | | | | Class R6 Shares | |
| | | | | Year Ended August 31, | | | Period
November 1, 2016 –
August 31, 2017* | | | Year Ended October 31, | |
| | | | | 2020 | | | 2019 | | | 2018 | | | 2016 | | | 2015 | |
| | Per Share Data | |
| | | | | | | |
| | Net asset value, beginning of period | | $ | 10.19 | | | $ | 10.74 | | | $ | 10.56 | | | $ | 9.80 | | | $ | 9.95 | | | $ | 9.98 | |
| | | | | | | |
| | Net investment income(a) | | | 0.19 | | | | 0.20 | | | | 0.19 | | | | 0.14 | | | | 0.20 | | | | 0.15 | |
| | | | | | | |
| | Net realized and unrealized gain (loss) | | | 1.05 | | | | (0.04 | ) | | | 0.84 | | | | 1.22 | | | | 0.11 | | | | 0.13 | |
| | | | | | | |
| | Total from investment operations | | | 1.24 | | | | 0.16 | | | | 1.03 | | | | 1.36 | | | | 0.31 | | | | 0.28 | |
| | | | | | | |
| | Distributions to shareholders from net investment income | | | (0.20 | ) | | | (0.21 | ) | | | (0.18 | ) | | | (0.20 | ) | | | (0.16 | ) | | | (0.10 | ) |
| | | | | | | |
| | Distributions to shareholders from net realized gains | | | (1.43 | ) | | | (0.50 | ) | | | (0.67 | ) | | | (0.40 | ) | | | (0.30 | ) | | | (0.21 | ) |
| | | | | | | |
| | Total distributions | | | (1.63 | ) | | | (0.71 | ) | | | (0.85 | ) | | | (0.60 | ) | | | (0.46 | ) | | | (0.31 | ) |
| | | | | | | |
| | Net asset value, end of period | | $ | 9.80 | | | $ | 10.19 | | | $ | 10.74 | | | $ | 10.56 | | | $ | 9.80 | | | $ | 9.95 | |
| | | | | | | |
| | Total return(b) | | | 13.01 | % | | | 1.96 | % | | | 10.11 | % | | | 14.59 | % | | | 3.37 | % | | | 2.87 | % |
| | | | | | | |
| | Net assets, end of period (in 000s) | | $ | 6,201 | | | $ | 5,786 | | | $ | 29,481 | | | $ | 26,154 | | | $ | 21,657 | | | $ | 20,482 | |
| | | | | | | |
| | Ratio of net expenses to average net assets(c) | | | 0.08 | % | | | 0.21 | % | | | 0.29 | % | | | 0.30 | %(d) | | | 0.31 | % | | | 0.30 | % |
| | | | | | | |
| | Ratio of total expenses to average net assets(c) | | | 3.92 | % | | | 3.02 | % | | | 1.06 | % | | | 1.58 | %(d) | | | 1.45 | % | | | 0.30 | % |
| | | | | | | |
| | Ratio of net investment income to average net assets | | | 2.05 | % | | | 1.94 | % | | | 1.82 | % | | | 1.71 | %(d) | | | 2.07 | % | | | 1.51 | % |
| | | | | | | |
| | Portfolio turnover rate(e) | | | 26 | % | | | 171 | % | | | 155 | % | | | 139 | % | | | 191 | % | | | 204 | % |
| | * | | The Portfolio changed its fiscal year end from October 31 to August 31. |
| | (a) | | Calculated based on the average shares outstanding methodology. |
| | (b) | | Assumes investment at the NAV at the beginning of the period, reinvestment of all dividends and distributions, a complete redemption of the investment at the NAV at the end of the period and no sales or redemption charges (if any). Total returns would be reduced if a sales or redemption charge was taken into account. Returns do not reflect the impact of taxes to shareholders relating to Portfolio distributions or the redemption of Portfolio shares. Total returns for periods less than one full year are not annualized. The Goldman Sachs Target Date 2050 Portfolio’s predecessor was the Madison Target Retirement 2050 Fund (the “Predecessor Fund”). On August 22, 2016, the Predecessor Fund was reorganized as a new series of Goldman Sachs Trust II. Performance prior to August 22, 2016 is that of the Predecessor Fund. Total return information of the Predecessor Fund is included in the above table because the Predecessor Fund is considered the accounting survivor of the reorganization. |
| | (c) | | Expense ratios exclude the expenses of the Underlying Funds in which the Portfolio invests. |
| | (e) | | The Portfolio’s turnover rate is calculated in accordance with regulatory requirements, without regard to transactions involving short term investments. If such transactions were included, the Portfolio’s turnover rate may be higher. |
| | |
| 86 | | The accompanying notes are an integral part of these financial statements. |
GOLDMAN SACHS TARGET DATE 2050 PORTFOLIO
Financial Highlights (continued)
Selected Share Data for a Share Outstanding Throughout Each Period
| | | | | | | | | | | | | | | | | | | | | | |
| | | | | Goldman Sachs Target Date 2050 Portfolio | |
| | | | | Class R Shares | |
| | | | | Year Ended August 31, | | | Period
November 1, 2016 –
August 31, 2017* | | | Period Ended
October 31, 2016(a) | |
| | | | | 2020 | | | 2019 | | | 2018 | |
| | Per Share Data | |
| | | | | | |
| | Net asset value, beginning of period | | $ | 10.14 | | | $ | 10.69 | | | $ | 10.52 | | | $ | 9.79 | | | $ | 10.00 | |
| | | | | | |
| | Net investment income(b) | | | 0.13 | | | | 0.16 | | | | 0.12 | | | | 0.09 | | | | 0.02 | |
| | | | | | |
| | Net realized and unrealized gain (loss) | | | 1.03 | | | | (0.07 | ) | | | 0.83 | | | | 1.22 | | | | (0.23 | ) |
| | | | | | |
| | Total from investment operations | | | 1.16 | | | | 0.09 | | | | 0.95 | | | | 1.31 | | | | (0.21 | ) |
| | | | | | |
| | Distributions to shareholders from net investment income | | | (0.14 | ) | | | (0.14 | ) | | | (0.11 | ) | | | (0.18 | ) | | | — | |
| | | | | | |
| | Distributions to shareholders from net realized gains | | | (1.43 | ) | | | (0.50 | ) | | | (0.67 | ) | | | (0.40 | ) | | | — | |
| | | | | | |
| | Total distributions | | | (1.57 | ) | | | (0.64 | ) | | | (0.78 | ) | | | (0.58 | ) | | | — | |
| | | | | | |
| | Net asset value, end of period | | $ | 9.73 | | | $ | 10.14 | | | $ | 10.69 | | | $ | 10.52 | | | $ | 9.79 | |
| | | | | | |
| | Total return(c) | | | 12.22 | % | | | 1.25 | % | | | 9.38 | % | | | 14.02 | % | | | 2.10 | % |
| | | | | | |
| | Net assets, end of period (in 000s) | | $ | 14 | | | $ | 12 | | | $ | 12 | | | $ | 11 | | | $ | 10 | |
| | | | | | |
| | Ratio of net expenses to average net assets(d) | | | 0.74 | % | | | 0.80 | % | | | 0.96 | % | | | 0.98 | %(e) | | | 0.98 | %(e) |
| | | | | | |
| | Ratio of total expenses to average net assets(d) | | | 4.54 | % | | | 5.40 | % | | | 1.71 | % | | | 2.29 | %(e) | | | 6.54 | %(e) |
| | | | | | |
| | Ratio of net investment income to average net assets | | | 1.38 | % | | | 1.57 | % | | | 1.16 | % | | | 1.05 | %(e) | | | 0.80 | %(e) |
| | | | | | |
| | Portfolio turnover rate(f) | | | 26 | % | | | 171 | % | | | 155 | % | | | 139 | % | | | 191 | % |
| | * | | The Portfolio changed its fiscal year end from October 31 to August 31. |
| | (a) | | Commenced operations on August 22, 2016. |
| | (b) | | Calculated based on the average shares outstanding methodology. |
| | (c) | | Assumes investment at the NAV at the beginning of the period, reinvestment of all dividends and distributions, a complete redemption of the investment at the NAV at the end of the period and no sales or redemption charges (if any). Total returns would be reduced if a sales or redemption charge was taken into account. Returns do not reflect the impact of taxes to shareholders relating to Portfolio distributions or the redemption of Portfolio shares. Total returns for periods less than one full year are not annualized. |
| | (d) | | Expense ratios exclude the expenses of the Underlying Funds in which the Portfolio invests. |
| | (f) | | The Portfolio’s turnover rate is calculated in accordance with regulatory requirements, without regard to transactions involving short term investments. If such transactions were included, the Portfolio’s turnover rate may be higher. |
| | |
| The accompanying notes are an integral part of these financial statements. | | 87 |
GOLDMAN SACHS TARGET DATE 2055 PORTFOLIO
Financial Highlights (continued)
Selected Share Data for a Share Outstanding Throughout Each Period
| | | | | | | | | | | | | | | | | | | | | | |
| | | | | Goldman Sachs Target Date 2055 Portfolio | |
| | | | | Class A Shares | |
| | | | | Year Ended August 31, | | | Period
November 1, 2016 –
August 31, 2017* | | | Period Ended October 31, 2016(a) | |
| | | | | 2020 | | | 2019 | | | 2018 | |
| | Per Share Data | |
| | | | | | |
| | Net asset value, beginning of period | | $ | 10.57 | | | $ | 11.86 | | | $ | 11.16 | | | $ | 9.79 | | | $ | 10.00 | |
| | | | | | |
| | Net investment income(b) | | | 0.16 | | | | 0.19 | | | | 0.16 | | | | 0.09 | | | | 0.02 | |
| | | | | | |
| | Net realized and unrealized gain (loss) | | | 1.10 | | | | (0.17 | ) | | | 0.98 | | | | 1.36 | | | | (0.23 | ) |
| | | | | | |
| | Total from investment operations | | | 1.26 | | | | 0.02 | | | | 1.14 | | | | 1.45 | | | | (0.21 | ) |
| | | | | | |
| | Distributions to shareholders from net investment income | | | (0.20 | ) | | | (0.26 | ) | | | (0.16 | ) | | | (0.08 | ) | | | — | |
| | | | | | |
| | Distributions to shareholders from net realized gains | | | (1.16 | ) | | | (1.05 | ) | | | (0.28 | ) | | | — | | | | — | |
| | | | | | |
| | Total distributions | | | (1.36 | ) | | | (1.31 | ) | | | (0.44 | ) | | | (0.08 | ) | | | — | |
| | | | | | |
| | Net asset value, end of period | | $ | 10.47 | | | $ | 10.57 | | | $ | 11.86 | | | $ | 11.16 | | | $ | 9.79 | |
| | | | | | |
| | Total return(c) | | | 12.61 | % | | | 1.39 | % | | | 10.37 | % | | | 14.90 | % | | | (2.10 | )% |
| | | | | | |
| | Net assets, end of period (in 000s) | | $ | 199 | | | $ | 162 | | | $ | 118 | | | $ | 87 | | | $ | 10 | |
| | | | | | |
| | Ratio of net expenses to average net assets(d) | | | 0.47 | % | | | 0.52 | % | | | 0.69 | % | | | 0.71 | %(e) | | | 0.75 | %(e) |
| | | | | | |
| | Ratio of total expenses to average net assets(d) | | | 4.27 | % | | | 5.15 | % | | | 2.46 | % | | | 4.43 | %(e) | | | 4.23 | %(e) |
| | | | | | |
| | Ratio of net investment income to average net assets | | | 1.64 | % | | | 1.80 | % | | | 1.38 | % | | | 1.01 | %(e) | | | 1.02 | %(e) |
| | | | | | |
| | Portfolio turnover rate(f) | | | 23 | % | | | 148 | % | | | 177 | % | | | 182 | % | | | 34 | % |
| | * | | The Portfolio changed its fiscal year end from October 31 to August 31. |
| | (a) | | Commenced operations on August 22, 2016. |
| | (b) | | Calculated based on the average shares outstanding methodology. |
| | (c) | | Assumes investment at the NAV at the beginning of the period, reinvestment of all dividends and distributions, a complete redemption of the investment at the NAV at the end of the period and no sales or redemption charges (if any). Total returns would be reduced if a sales or redemption charge was taken into account. Returns do not reflect the impact of taxes to shareholders relating to Portfolio distributions or the redemption of Portfolio shares. Total returns for periods less than one full year are not annualized. |
| | (d) | | Expense ratios exclude the expenses of the Underlying Funds in which the Portfolio invests. |
| | (f) | | The Portfolio’s turnover rate is calculated in accordance with regulatory requirements, without regard to transactions involving short term investments. If such transactions were included, the Portfolio’s turnover rate may be higher. |
| | |
| 88 | | The accompanying notes are an integral part of these financial statements. |
GOLDMAN SACHS TARGET DATE 2055 PORTFOLIO
Financial Highlights (continued)
Selected Share Data for a Share Outstanding Throughout Each Period
| | | | | | | | | | | | | | | | | | | | | | |
| | | | | Goldman Sachs Target Date 2055 Portfolio | |
| | | | | Institutional Shares | |
| | | | | Year Ended August 31, | | | Period
November 1, 2016 –
August 31, 2017* | | | Period Ended
October 31, 2016(a) | |
| | | | | 2020 | | | 2019 | | | 2018 | |
| | Per Share Data | |
| | | | | | |
| | Net asset value, beginning of period | | $ | 10.63 | | | $ | 11.92 | | | $ | 11.20 | | | $ | 9.80 | | | $ | 10.00 | |
| | | | | | |
| | Net investment income(b) | | | 0.20 | | | | 0.23 | | | | 0.21 | | | | 0.15 | | | | 0.03 | |
| | | | | | |
| | Net realized and unrealized gain (loss) | | | 1.10 | | | | (0.17 | ) | | | 0.98 | | | | 1.34 | | | | (0.23 | ) |
| | | | | | |
| | Total from investment operations | | | 1.30 | | | | 0.06 | | | | 1.19 | | | | 1.49 | | | | (0.20 | ) |
| | | | | | |
| | Distributions to shareholders from net investment income | | | (0.23 | ) | | | (0.30 | ) | | | (0.19 | ) | | | (0.09 | ) | | | — | |
| | | | | | |
| | Distributions to shareholders from net realized gains | | | (1.16 | ) | | | (1.05 | ) | | | (0.28 | ) | | | — | | | | — | |
| | | | | | |
| | Total distributions | | | (1.39 | ) | | | (1.35 | ) | | | (0.47 | ) | | | (0.09 | ) | | | — | |
| | | | | | |
| | Net asset value, end of period | | $ | 10.54 | | | $ | 10.63 | | | $ | 11.92 | | | $ | 11.20 | | | $ | 9.80 | |
| | | | | | |
| | Total return(c) | | | 12.96 | % | | | 1.73 | % | | | 10.82 | % | | | 15.32 | % | | | (2.00 | )% |
| | | | | | |
| | Net assets, end of period (in 000s) | | $ | 6,921 | | | $ | 6,125 | | | $ | 11,811 | | | $ | 11,242 | | | $ | 9,748 | |
| | | | | | |
| | Ratio of net expenses to average net assets(d) | | | 0.09 | % | | | 0.17 | % | | | 0.30 | % | | | 0.32 | %(e) | | | 0.34 | %(e) |
| | | | | | |
| | Ratio of total expenses to average net assets(d) | | | 3.89 | % | | | 4.28 | % | | | 2.05 | % | | | 3.78 | %(e) | | | 3.85 | %(e) |
| | | | | | |
| | Ratio of net investment income to average net assets | | | 2.02 | % | | | 2.11 | % | | | 1.80 | % | | | 1.70 | %(e) | | | 1.43 | %(e) |
| | | | | | |
| | Portfolio turnover rate(f) | | | 23 | % | | | 148 | % | | | 177 | % | | | 182 | % | | | 34 | % |
| | * | | The Portfolio changed its fiscal year end from October 31 to August 31. |
| | (a) | | Commenced operations on August 22, 2016. |
| | (b) | | Calculated based on the average shares outstanding methodology. |
| | (c) | | Assumes investment at the NAV at the beginning of the period, reinvestment of all dividends and distributions, a complete redemption of the investment at the NAV at the end of the period and no sales or redemption charges (if any). Total returns would be reduced if a sales or redemption charge was taken into account. Returns do not reflect the impact of taxes to shareholders relating to Portfolio distributions or the redemption of Portfolio shares. Total returns for periods less than one full year are not annualized. |
| | (d) | | Expense ratios exclude the expenses of the Underlying Funds in which the Portfolio invests. |
| | (f) | | The Portfolio’s turnover rate is calculated in accordance with regulatory requirements, without regard to transactions involving short term investments. If such transactions were included, the Portfolio’s turnover rate may be higher. |
| | |
| The accompanying notes are an integral part of these financial statements. | | 89 |
GOLDMAN SACHS TARGET DATE 2055 PORTFOLIO
Financial Highlights (continued)
Selected Share Data for a Share Outstanding Throughout Each Period
| | | | | | | | | | | | | | | | | | | | | | |
| | | | | Goldman Sachs Target Date 2055 Portfolio | |
| | | | | Service Shares | |
| | | | | Year Ended August 31, | | | Period
November 1, 2016 –
August 31, 2017* | | | Period Ended
October 31, 2016(a) | |
| | | | | 2020 | | | 2019 | | | 2018 | |
| | Per Share Data | |
| | | | | | |
| | Net asset value, beginning of period | | $ | 10.59 | | | $ | 11.87 | | | $ | 11.16 | | | $ | 9.79 | | | $ | 10.00 | |
| | | | | | |
| | Net investment income(b) | | | 0.15 | | | | 0.18 | | | | 0.15 | | | | 0.11 | | | | 0.02 | |
| | | | | | |
| | Net realized and unrealized gain (loss) | | | 1.09 | | | | (0.16 | ) | | | 0.98 | | | | 1.33 | | | | (0.23 | ) |
| | | | | | |
| | Total from investment operations | | | 1.24 | | | | 0.02 | | | | 1.13 | | | | 1.44 | | | | (0.21 | ) |
| | | | | | |
| | Distributions to shareholders from net investment income | | | (0.19 | ) | | | (0.25 | ) | | | (0.14 | ) | | | (0.07 | ) | | | — | |
| | | | | | |
| | Distributions to shareholders from net realized gains | | | (1.16 | ) | | | (1.05 | ) | | | (0.28 | ) | | | — | | | | — | |
| | | | | | |
| | Total distributions | | | (1.35 | ) | | | (1.30 | ) | | | (0.42 | ) | | | (0.07 | ) | | | — | |
| | | | | | |
| | Net asset value, end of period | | $ | 10.48 | | | $ | 10.59 | | | $ | 11.87 | | | $ | 11.16 | | | $ | 9.79 | |
| | | | | | |
| | Total return(c) | | | 12.31 | % | | | 1.33 | % | | | 10.27 | % | | | 14.83 | % | | | (2.10 | )% |
| | | | | | |
| | Net assets, end of period (in 000s) | | $ | 14 | | | $ | 13 | | | $ | 12 | | | $ | 11 | | | $ | 10 | |
| | | | | | |
| | Ratio of net expenses to average net assets(d) | | | 0.60 | % | | | 0.65 | % | | | 0.79 | % | | | 0.81 | %(e) | | | 0.84 | %(e) |
| | | | | | |
| | Ratio of total expenses to average net assets(d) | | | 4.39 | % | | | 5.18 | % | | | 2.52 | % | | | 4.26 | %(e) | | | 4.33 | %(e) |
| | | | | | |
| | Ratio of net investment income to average net assets | | | 1.52 | % | | | 1.70 | % | | | 1.31 | % | | | 1.20 | %(e) | | | 0.92 | %(e) |
| | | | | | |
| | Portfolio turnover rate(f) | | | 23 | % | | | 148 | % | | | 177 | % | | | 182 | % | | | 34 | % |
| | * | | The Portfolio changed its fiscal year end from October 31 to August 31. |
| | (a) | | Commenced operations on August 22, 2016. |
| | (b) | | Calculated based on the average shares outstanding methodology. |
| | (c) | | Assumes investment at the NAV at the beginning of the period, reinvestment of all dividends and distributions, a complete redemption of the investment at the NAV at the end of the period and no sales or redemption charges (if any). Total returns would be reduced if a sales or redemption charge was taken into account. Returns do not reflect the impact of taxes to shareholders relating to Portfolio distributions or the redemption of Portfolio shares. Total returns for periods less than one full year are not annualized. |
| | (d) | | Expense ratios exclude the expenses of the Underlying Funds in which the Portfolio invests. |
| | (f) | | The Portfolio’s turnover rate is calculated in accordance with regulatory requirements, without regard to transactions involving short term investments. If such transactions were included, the Portfolio’s turnover rate may be higher. |
| | |
| 90 | | The accompanying notes are an integral part of these financial statements. |
GOLDMAN SACHS TARGET DATE 2055 PORTFOLIO
Financial Highlights (continued)
Selected Share Data for a Share Outstanding Throughout Each Period
| | | | | | | | | | | | | | | | | | | | | | |
| | | | | Goldman Sachs Target Date 2055 Portfolio | |
| | | | | Investor Shares | |
| | | | | Year Ended August 31, | | | Period
November 1, 2016 –
August 31, 2017* | | | Period Ended
October 31, 2016(a) | |
| | | | | 2020 | | | 2019 | | | 2018 | |
| | Per Share Data | |
| | | | | | |
| | Net asset value, beginning of period | | $ | 10.60 | | | $ | 11.89 | | | $ | 11.19 | | | $ | 9.79 | | | $ | 10.00 | |
| | | | | | |
| | Net investment income(b) | | | 0.23 | | | | 0.22 | | | | 0.19 | | | | 0.07 | | | | 0.02 | |
| | | | | | |
| | Net realized and unrealized gain (loss) | | | 1.05 | | | | (0.17 | ) | | | 0.98 | | | | 1.42 | | | | (0.23 | ) |
| | | | | | |
| | Total from investment operations | | | 1.28 | | | | 0.05 | | | | 1.17 | | | | 1.49 | | | | (0.21 | ) |
| | | | | | |
| | Distributions to shareholders from net investment income | | | (0.22 | ) | | | (0.29 | ) | | | (0.19 | ) | | | (0.09 | ) | | | — | |
| | | | | | |
| | Distributions to shareholders from net realized gains | | | (1.16 | ) | | | (1.05 | ) | | | (0.28 | ) | | | — | | | | — | |
| | | | | | |
| | Total distributions | | | (1.38 | ) | | | (1.34 | ) | | | (0.47 | ) | | | (0.09 | ) | | | — | |
| | | | | | |
| | Net asset value, end of period | | $ | 10.50 | | | $ | 10.60 | | | $ | 11.89 | | | $ | 11.19 | | | $ | 9.79 | |
| | | | | | |
| | Total return(c) | | | 12.77 | % | | | 1.65 | % | | | 10.62 | % | | | 15.16 | % | | | (2.00 | )% |
| | | | | | |
| | Net assets, end of period (in 000s) | | $ | 274 | | | $ | 723 | | | $ | 509 | | | $ | 101 | | | $ | 10 | |
| | | | | | |
| | Ratio of net expenses to average net assets(d) | | | 0.22 | % | | | 0.27 | % | | | 0.44 | % | | | 0.46 | %(e) | | | 0.49 | %(e) |
| | | | | | |
| | Ratio of total expenses to average net assets(d) | | | 4.09 | % | | | 4.91 | % | | | 2.19 | % | | | 6.85 | %(e) | | | 3.97 | %(e) |
| | | | | | |
| | Ratio of net investment income to average net assets | | | 2.26 | % | | | 2.07 | % | | | 1.64 | % | | | 0.77 | %(e) | | | 1.28 | %(e) |
| | | | | | |
| | Portfolio turnover rate(f) | | | 23 | % | | | 148 | % | | | 177 | % | | | 182 | % | | | 34 | % |
| | * | | The Portfolio changed its fiscal year end from October 31 to August 31. |
| | (a) | | Commenced operations on August 22, 2016. |
| | (b) | | Calculated based on the average shares outstanding methodology. |
| | (c) | | Assumes investment at the NAV at the beginning of the period, reinvestment of all dividends and distributions, a complete redemption of the investment at the NAV at the end of the period and no sales or redemption charges (if any). Total returns would be reduced if a sales or redemption charge was taken into account. Returns do not reflect the impact of taxes to shareholders relating to Portfolio distributions or the redemption of Portfolio shares. Total returns for periods less than one full year are not annualized. |
| | (d) | | Expense ratios exclude the expenses of the Underlying Funds in which the Portfolio invests. |
| | (f) | | The Portfolio’s turnover rate is calculated in accordance with regulatory requirements, without regard to transactions involving short term investments. If such transactions were included, the Portfolio’s turnover rate may be higher. |
| | |
| The accompanying notes are an integral part of these financial statements. | | 91 |
GOLDMAN SACHS TARGET DATE 2055 PORTFOLIO
Financial Highlights (continued)
Selected Share Data for a Share Outstanding Throughout Each Period
| | | | | | | | | | | | | | | | | | | | | | |
| | | | | Goldman Sachs Target Date 2055 Portfolio | |
| | | | | Class R6 Shares | |
| | | | | Year Ended August 31, | | | Period
November 1, 2016 –
August 31, 2017* | | | Period Ended
October 31, 2016(a) | |
| | | | | 2020 | | | 2019 | | | 2018 | |
| | Per Share Data | |
| | | | | | |
| | Net asset value, beginning of period | | $ | 10.63 | | | $ | 11.92 | | | $ | 11.20 | | | $ | 9.80 | | | $ | 10.00 | |
| | | | | | |
| | Net investment income(b) | | | 0.43 | | | | 0.24 | | | | 0.20 | | | | 0.15 | | | | 0.03 | |
| | | | | | |
| | Net realized and unrealized gain (loss) | | | 0.87 | | | | (0.18 | ) | | | 0.99 | | | | 1.34 | | | | (0.23 | ) |
| | | | | | |
| | Total from investment operations | | | 1.30 | | | | 0.06 | | | | 1.19 | | | | 1.49 | | | | (0.20 | ) |
| | | | | | |
| | Distributions to shareholders from net investment income | | | (0.20 | ) | | | (0.30 | ) | | | (0.19 | ) | | | (0.09 | ) | | | — | |
| | | | | | |
| | Distributions to shareholders from net realized gains | | | (1.16 | ) | | | (1.05 | ) | | | (0.28 | ) | | | — | | | | — | |
| | | | | | |
| | Total distributions | | | (1.36 | ) | | | (1.35 | ) | | | (0.47 | ) | | | (0.09 | ) | | | — | |
| | | | | | |
| | Net asset value, end of period | | $ | 10.57 | | | $ | 10.63 | | | $ | 11.92 | | | $ | 11.20 | | | $ | 9.80 | |
| | | | | | |
| | Total return(c) | | | 12.95 | % | | | 1.80 | % | | | 10.85 | % | | | 15.32 | % | | | (2.00 | )% |
| | | | | | |
| | Net assets, end of period (in 000s) | | $ | 35 | | | $ | 394 | | | $ | 161 | | | $ | 27 | | | $ | 10 | |
| | | | | | |
| | Ratio of net expenses to average net assets(d) | | | 0.07 | % | | | 0.09 | % | | | 0.28 | % | | | 0.29 | %(e) | | | 0.32 | %(e) |
| | | | | | |
| | Ratio of total expenses to average net assets(d) | | | 3.95 | % | | | 4.92 | % | | | 2.01 | % | | | 3.99 | %(e) | | | 3.92 | %(e) |
| | | | | | |
| | Ratio of net investment income to average net assets | | | 4.12 | % | | | 2.23 | % | | | 1.76 | % | | | 1.68 | %(e) | | | 1.45 | %(e) |
| | | | | | |
| | Portfolio turnover rate(f) | | | 23 | % | | | 148 | % | | | 177 | % | | | 182 | % | | | 34 | % |
| | * | | The Portfolio changed its fiscal year end from October 31 to August 31. |
| | (a) | | Commenced operations on August 22, 2016. |
| | (b) | | Calculated based on the average shares outstanding methodology. |
| | (c) | | Assumes investment at the NAV at the beginning of the period, reinvestment of all dividends and distributions, a complete redemption of the investment at the NAV at the end of the period and no sales or redemption charges (if any). Total returns would be reduced if a sales or redemption charge was taken into account. Returns do not reflect the impact of taxes to shareholders relating to Portfolio distributions or the redemption of Portfolio shares. Total returns for periods less than one full year are not annualized. |
| | (d) | | Expense ratios exclude the expenses of the Underlying Funds in which the Portfolio invests. |
| | (f) | | The Portfolio’s turnover rate is calculated in accordance with regulatory requirements, without regard to transactions involving short term investments. If such transactions were included, the Portfolio’s turnover rate may be higher. |
| | |
| 92 | | The accompanying notes are an integral part of these financial statements. |
GOLDMAN SACHS TARGET DATE 2055 PORTFOLIO
Financial Highlights (continued)
Selected Share Data for a Share Outstanding Throughout Each Period
| | | | | | | | | | | | | | | | | | | | | | |
| | | | | Goldman Sachs Target Date 2055 Portfolio | |
| | | | | Class R Shares | |
| | | | | Year Ended August 31, | | | Period
November 1, 2016 –
August 31, 2017* | | | Period Ended
October 31, 2016(a) | |
| | | | | 2020 | | | 2019 | | | 2018 | |
| | Per Share Data | |
| | | | | | |
| | Net asset value, beginning of period | | $ | 10.54 | | | $ | 11.82 | | | $ | 11.15 | | | $ | 9.79 | | | $ | 10.00 | |
| | | | | | |
| | Net investment income(b) | | | 0.14 | | | | 0.19 | | | | 0.12 | | | | 0.09 | | | | 0.01 | |
| | | | | | |
| | Net realized and unrealized gain (loss) | | | 1.08 | | | | (0.18 | ) | | | 0.98 | | | | 1.34 | | | | (0.22 | ) |
| | | | | | |
| | Total from investment operations | | | 1.22 | | | | 0.01 | | | | 1.10 | | | | 1.43 | | | | (0.21 | ) |
| | | | | | |
| | Distributions to shareholders from net investment income | | | (0.17 | ) | | | (0.24 | ) | | | (0.15 | ) | | | (0.07 | ) | | | — | |
| | | | | | |
| | Distributions to shareholders from net realized gains | | | (1.16 | ) | | | (1.05 | ) | | | (0.28 | ) | | | — | | | | — | |
| | | | | | |
| | Total distributions | | | (1.33 | ) | | | (1.29 | ) | | | (0.43 | ) | | | (0.07 | ) | | | — | |
| | | | | | |
| | Net asset value, end of period | | $ | 10.43 | | | $ | 10.54 | | | $ | 11.82 | | | $ | 11.15 | | | $ | 9.79 | |
| | | | | | |
| | Total return(c) | | | 12.22 | % | | | 1.20 | % | | | 10.09 | % | | | 14.66 | % | | | (2.10 | )% |
| | | | | | |
| | Net assets, end of period (in 000s) | | $ | 14 | | | $ | 13 | | | $ | 38 | | | $ | 11 | | | $ | 10 | |
| | | | | | |
| | Ratio of net expenses to average net assets(d) | | | 0.73 | % | | | 0.84 | % | | | 0.94 | % | | | 0.97 | %(e) | | | 0.99 | %(e) |
| | | | | | |
| | Ratio of total expenses to average net assets(d) | | | 4.52 | % | | | 4.72 | % | | | 2.67 | % | | | 4.42 | %(e) | | | 4.48 | %(e) |
| | | | | | |
| | Ratio of net investment income to average net assets | | | 1.39 | % | | | 1.75 | % | | | 1.06 | % | | | 1.05 | %(e) | | | 0.77 | %(e) |
| | | | | | |
| | Portfolio turnover rate(f) | | | 23 | % | | | 148 | % | | | 177 | % | | | 182 | % | | | 34 | % |
| | * | | The Portfolio changed its fiscal year end from October 31 to August 31. |
| | (a) | | Commenced operations on August 22, 2016. |
| | (b) | | Calculated based on the average shares outstanding methodology. |
| | (c) | | Assumes investment at the NAV at the beginning of the period, reinvestment of all dividends and distributions, a complete redemption of the investment at the NAV at the end of the period and no sales or redemption charges (if any). Total returns would be reduced if a sales or redemption charge was taken into account. Returns do not reflect the impact of taxes to shareholders relating to Portfolio distributions or the redemption of Portfolio shares. Total returns for periods less than one full year are not annualized. |
| | (d) | | Expense ratios exclude the expenses of the Underlying Funds in which the Portfolio invests. |
| | (f) | | The Portfolio’s turnover rate is calculated in accordance with regulatory requirements, without regard to transactions involving short term investments. If such transactions were included, the Portfolio’s turnover rate may be higher. |
| | |
| The accompanying notes are an integral part of these financial statements. | | 93 |
GOLDMAN SACHS TARGET DATE 2060 PORTFOLIO
Financial Highlights (continued)
Selected Share Data for a Share Outstanding Throughout Each Period
| | | | | | | | | | | | | | |
| | | | | Goldman Sachs Target Date 2060 Portfolio
| |
| | | | | Class A Shares | |
| | | | | Year Ended August 31, | | | Period Ended
August 31, 2018(a) | |
| | | | | 2020 | | | 2019 | |
| | Per Share Data | |
| | | | |
| | Net asset value, beginning of period | | $ | 10.41 | | | $ | 10.45 | | | $ | 10.00 | |
| | | | |
| | Net investment income(b) | | | 0.15 | | | | 0.19 | | | | 0.05 | |
| | | | |
| | Net realized and unrealized gain (loss) | | | 1.21 | | | | (0.10 | ) | | | 0.40 | |
| | | | |
| | Total from investment operations | | | 1.36 | | | | 0.09 | | | | 0.45 | |
| | | | |
| | Distributions to shareholders from net investment income | | | (0.22 | ) | | | (0.10 | ) | | | — | |
| | | | |
| | Distributions to shareholders from net realized gains | | | — | | | | (0.03 | ) | | | — | |
| | | | |
| | Total distributions | | | (0.22 | ) | | | (0.13 | ) | | | — | |
| | | | |
| | Net asset value, end of period | | $ | 11.55 | | | $ | 10.41 | | | $ | 10.45 | |
| | | | |
| | Total return(c) | | | 13.12 | % | | | 0.96 | % | | | 4.50 | % |
| | | | |
| | Net assets, end of period (in 000s) | | $ | 44 | | | $ | 20 | | | $ | 10 | |
| | | | |
| | Ratio of net expenses to average net assets(d) | | | 0.48 | % | | | 0.50 | % | | | 0.69 | %(e) |
| | | | |
| | Ratio of total expenses to average net assets(d) | | | 4.06 | % | | | 6.73 | % | | | 8.72 | %(e) |
| | | | |
| | Ratio of net investment income to average net assets | | | 1.47 | % | | | 1.84 | % | | | 1.44 | %(e) |
| | | | |
| | Portfolio turnover rate(f) | | | 16 | % | | | 148 | % | | | 56 | % |
| | (a) | | Commenced operations on April 30, 2018. |
| | (b) | | Calculated based on the average shares outstanding methodology. |
| | (c) | | Assumes investment at the NAV at the beginning of the period, reinvestment of all dividends and distributions, a complete redemption of the investment at the NAV at the end of the period and no sales or redemption charges (if any). Total returns would be reduced if a sales or redemption charge was taken into account. Returns do not reflect the impact of taxes to shareholders relating to Portfolio distributions or the redemption of Portfolio shares. Total returns for periods less than one full year are not annualized. |
| | (d) | | Expense ratios exclude the expenses of the Underlying Funds in which the Portfolio invests. |
| | (f) | | The Portfolio’s turnover rate is calculated in accordance with regulatory requirements, without regard to transactions involving short term investments. If such transactions were included, the Portfolio’s turnover rate may be higher. |
| | |
| 94 | | The accompanying notes are an integral part of these financial statements. |
GOLDMAN SACHS TARGET DATE 2060 PORTFOLIO
Financial Highlights (continued)
Selected Share Data for a Share Outstanding Throughout Each Period
| | | | | | | | | | | | | | |
| | | | | Goldman Sachs Target Date 2060 Portfolio
| |
| | | | | Institutional Shares | |
| | | | | Year Ended August 31, | | | Period Ended
August 31, 2018(a) | |
| | | | | 2020 | | | 2019 | |
| | Per Share Data | |
| | | | |
| | Net asset value, beginning of period | | $ | 10.43 | | | $ | 10.46 | | | $ | 10.00 | |
| | | | |
| | Net investment income(b) | | | 0.21 | | | | 0.22 | | | | 0.06 | |
| | | | |
| | Net realized and unrealized gain (loss) | | | 1.20 | | | | (0.09 | ) | | | 0.40 | |
| | | | |
| | Total from investment operations | | | 1.41 | | | | 0.13 | | | | 0.46 | |
| | | | |
| | Distributions to shareholders from net investment income | | | (0.25 | ) | | | (0.13 | ) | | | — | |
| | | | |
| | Distributions to shareholders from net realized gains | | | — | | | | (0.03 | ) | | | — | |
| | | | |
| | Total distributions | | | (0.25 | ) | | | (0.16 | ) | | | — | |
| | | | |
| | Net asset value, end of period | | $ | 11.59 | | | $ | 10.43 | | | $ | 10.46 | |
| | | | |
| | Total return(c) | | | 13.60 | % | | | 1.36 | % | | | 4.60 | % |
| | | | |
| | Net assets, end of period (in 000s) | | $ | 12 | | | $ | 11 | | | $ | 10 | |
| | | | |
| | Ratio of net expenses to average net assets(d) | | | 0.09 | % | | | 0.14 | % | | | 0.30 | %(e) |
| | | | |
| | Ratio of total expenses to average net assets(d) | | | 3.68 | % | | | 6.56 | % | | | 8.34 | %(e) |
| | | | |
| | Ratio of net investment income to average net assets | | | 2.00 | % | | | 2.18 | % | | | 1.84 | %(e) |
| | | | |
| | Portfolio turnover rate(f) | | | 16 | % | | | 148 | % | | | 56 | % |
| | (a) | | Commenced operations on April 30, 2018. |
| | (b) | | Calculated based on the average shares outstanding methodology. |
| | (c) | | Assumes investment at the NAV at the beginning of the period, reinvestment of all dividends and distributions, a complete redemption of the investment at the NAV at the end of the period and no sales or redemption charges (if any). Total returns would be reduced if a sales or redemption charge was taken into account. Returns do not reflect the impact of taxes to shareholders relating to Portfolio distributions or the redemption of Portfolio shares. Total returns for periods less than one full year are not annualized. |
| | (d) | | Expense ratios exclude the expenses of the Underlying Funds in which the Portfolio invests. |
| | (f) | | The Portfolio’s turnover rate is calculated in accordance with regulatory requirements, without regard to transactions involving short term investments. If such transactions were included, the Portfolio’s turnover rate may be higher. |
| | |
| The accompanying notes are an integral part of these financial statements. | | 95 |
GOLDMAN SACHS TARGET DATE 2060 PORTFOLIO
Financial Highlights (continued)
Selected Share Data for a Share Outstanding Throughout Each Period
| | | | | | | | | | | | | | |
| | | | | Goldman Sachs Target Date 2060 Portfolio
| |
| | | | | Service Shares | |
| | | | | Year Ended August 31, | | | Period Ended
August 31, 2018(a) | |
| | | | | 2020 | | | 2019 | |
| | Per Share Data | |
| | | | |
| | Net asset value, beginning of period | | $ | 10.40 | | | $ | 10.44 | | | $ | 10.00 | |
| | | | |
| | Net investment income(b) | | | 0.16 | | | | 0.17 | | | | 0.05 | |
| | | | |
| | Net realized and unrealized gain (loss) | | | 1.19 | | | | (0.09 | ) | | | 0.39 | |
| | | | |
| | Total from investment operations | | | 1.35 | | | | 0.08 | | | | 0.44 | |
| | | | |
| | Distributions to shareholders from net investment income | | | (0.20 | ) | | | (0.09 | ) | | | — | |
| | | | |
| | Distributions to shareholders from net realized gains | | | — | | | | (0.03 | ) | | | — | |
| | | | |
| | Total distributions | | | (0.20 | ) | | | (0.12 | ) | | | — | |
| | | | |
| | Net asset value, end of period | | $ | 11.55 | | | $ | 10.40 | | | $ | 10.44 | |
| | | | |
| | Total return(c) | | | 13.02 | % | | | 0.89 | % | | | 4.40 | % |
| | | | |
| | Net assets, end of period (in 000s) | | $ | 12 | | | $ | 11 | | | $ | 10 | |
| | | | |
| | Ratio of net expenses to average net assets(d) | | | 0.59 | % | | | 0.64 | % | | | 0.80 | %(e) |
| | | | |
| | Ratio of total expenses to average net assets(d) | | | 4.19 | % | | | 7.06 | % | | | 8.82 | %(e) |
| | | | |
| | Ratio of net investment income to average net assets | | | 1.50 | % | | | 1.68 | % | | | 1.34 | %(e) |
| | | | |
| | Portfolio turnover rate(f) | | | 16 | % | | | 148 | % | | | 56 | % |
| | (a) | | Commenced operations on April 30, 2018. |
| | (b) | | Calculated based on the average shares outstanding methodology. |
| | (c) | | Assumes investment at the NAV at the beginning of the period, reinvestment of all dividends and distributions, a complete redemption of the investment at the NAV at the end of the period and no sales or redemption charges (if any). Total returns would be reduced if a sales or redemption charge was taken into account. Returns do not reflect the impact of taxes to shareholders relating to Portfolio distributions or the redemption of Portfolio shares. Total returns for periods less than one full year are not annualized. |
| | (d) | | Expense ratios exclude the expenses of the Underlying Funds in which the Portfolio invests. |
| | (f) | | The Portfolio’s turnover rate is calculated in accordance with regulatory requirements, without regard to transactions involving short term investments. If such transactions were included, the Portfolio’s turnover rate may be higher. |
| | |
| 96 | | The accompanying notes are an integral part of these financial statements. |
GOLDMAN SACHS TARGET DATE 2060 PORTFOLIO
Financial Highlights (continued)
Selected Share Data for a Share Outstanding Throughout Each Period
| | | | | | | | | | | | | | |
| | | | | Goldman Sachs Target Date 2060 Portfolio
| |
| | | | | Investor Shares | |
| | | | | Year Ended August 31, | | | Period Ended
August 31, 2018(a) | |
| | | | | 2020 | | | 2019 | |
| | Per Share Data | |
| | | | |
| | Net asset value, beginning of period | | $ | 10.43 | | | $ | 10.46 | | | $ | 10.00 | |
| | | | |
| | Net investment income(b) | | | 0.20 | | | | 0.21 | | | | 0.06 | |
| | | | |
| | Net realized and unrealized gain (loss) | | | 1.19 | | | | (0.09 | ) | | | 0.40 | |
| | | | |
| | Total from investment operations | | | 1.39 | | | | 0.12 | | | | 0.46 | |
| | | | |
| | Distributions to shareholders from net investment income | | | (0.24 | ) | | | (0.12 | ) | | | — | |
| | | | |
| | Distributions to shareholders from net realized gains | | | — | | | | (0.03 | ) | | | — | |
| | | | |
| | Total distributions | | | (0.24 | ) | | | (0.15 | ) | | | — | |
| | | | |
| | Net asset value, end of period | | $ | 11.58 | | | $ | 10.43 | | | $ | 10.46 | |
| | | | |
| | Total return(c) | | | 13.48 | % | | | 1.15 | % | | | 4.60 | % |
| | | | |
| | Net assets, end of period (in 000s) | | $ | 12 | | | $ | 11 | | | $ | 10 | |
| | | | |
| | Ratio of net expenses to average net assets(d) | | | 0.22 | % | | | 0.28 | % | | | 0.44 | %(e) |
| | | | |
| | Ratio of total expenses to average net assets(d) | | | 3.82 | % | | | 6.70 | % | | | 8.48 | %(e) |
| | | | |
| | Ratio of net investment income to average net assets | | | 1.87 | % | | | 2.04 | % | | | 1.69 | %(e) |
| | | | |
| | Portfolio turnover rate(f) | | | 16 | % | | | 148 | % | | | 56 | % |
| | (a) | | Commenced operations on April 30, 2018. |
| | (b) | | Calculated based on the average shares outstanding methodology. |
| | (c) | | Assumes investment at the NAV at the beginning of the period, reinvestment of all dividends and distributions, a complete redemption of the investment at the NAV at the end of the period and no sales or redemption charges (if any). Total returns would be reduced if a sales or redemption charge was taken into account. Returns do not reflect the impact of taxes to shareholders relating to Portfolio distributions or the redemption of Portfolio shares. Total returns for periods less than one full year are not annualized. |
| | (d) | | Expense ratios exclude the expenses of the Underlying Funds in which the Portfolio invests. |
| | (f) | | The Portfolio’s turnover rate is calculated in accordance with regulatory requirements, without regard to transactions involving short term investments. If such transactions were included, the Portfolio’s turnover rate may be higher. |
| | |
| The accompanying notes are an integral part of these financial statements. | | 97 |
GOLDMAN SACHS TARGET DATE 2060 PORTFOLIO
Financial Highlights (continued)
Selected Share Data for a Share Outstanding Throughout Each Period
| | | | | | | | | | | | | | |
| | | | | Goldman Sachs Target Date 2060 Portfolio | |
| | | | | Class R6 Shares | |
| | | | | Year Ended August 31, | | | Period Ended
August 31, 2018(a) | |
| | | | | 2020 | | | 2019 | |
| | Per Share Data | |
| | | | |
| | Net asset value, beginning of period | | $ | 10.43 | | | $ | 10.46 | | | $ | 10.00 | |
| | | | |
| | Net investment income(b) | | | 0.21 | | | | 0.23 | | | | 0.06 | |
| | | | |
| | Net realized and unrealized gain (loss) | | | 1.21 | | | | (0.10 | ) | | | 0.40 | |
| | | | |
| | Total from investment operations | | | 1.42 | | | | 0.13 | | | | 0.46 | |
| | | | |
| | Distributions to shareholders from net investment income | | | (0.26 | ) | | | (0.13 | ) | | | — | |
| | | | |
| | Distributions to shareholders from net realized gains | | | — | | | | (0.03 | ) | | | — | |
| | | | |
| | Total distributions | | | (0.26 | ) | | | (0.16 | ) | | | — | |
| | | | |
| | Net asset value, end of period | | $ | 11.59 | | | $ | 10.43 | | | $ | 10.46 | |
| | | | |
| | Total return(c) | | | 13.62 | % | | | 1.37 | % | | | 4.60 | % |
| | | | |
| | Net assets, end of period (in 000s) | | $ | 8,515 | | | $ | 7,465 | | | $ | 5,178 | |
| | | | |
| | Ratio of net expenses to average net assets(d) | | | 0.07 | % | | | 0.11 | % | | | 0.28 | %(e) |
| | | | |
| | Ratio of total expenses to average net assets(d) | | | 3.69 | % | | | 6.49 | % | | | 8.33 | %(e) |
| | | | |
| | Ratio of net investment income to average net assets | | | 2.02 | % | | | 2.24 | % | | | 1.86 | %(e) |
| | | | |
| | Portfolio turnover rate(f) | | | 16 | % | | | 148 | % | | | 56 | % |
| | (a) | | Commenced operations on April 30, 2018. |
| | (b) | | Calculated based on the average shares outstanding methodology. |
| | (c) | | Assumes investment at the NAV at the beginning of the period, reinvestment of all dividends and distributions, a complete redemption of the investment at the NAV at the end of the period and no sales or redemption charges (if any). Total returns would be reduced if a sales or redemption charge was taken into account. Returns do not reflect the impact of taxes to shareholders relating to Portfolio distributions or the redemption of Portfolio shares. Total returns for periods less than one full year are not annualized. |
| | (d) | | Expense ratios exclude the expenses of the Underlying Funds in which the Portfolio invests. |
| | (f) | | The Portfolio’s turnover rate is calculated in accordance with regulatory requirements, without regard to transactions involving short term investments. If such transactions were included, the Portfolio’s turnover rate may be higher. |
| | |
| 98 | | The accompanying notes are an integral part of these financial statements. |
GOLDMAN SACHS TARGET DATE 2060 PORTFOLIO
Financial Highlights (continued)
Selected Share Data for a Share Outstanding Throughout Each Period
| | | | | | | | | | | | | | |
| | | | | Goldman Sachs Target Date 2060 Portfolio
| |
| | | | | Class R Shares | |
| | | | | Year Ended August 31, | | | Period Ended
August 31, 2018(a) | |
| | | | | 2020 | | | 2019 | |
| | Per Share Data | |
| | | | |
| | Net asset value, beginning of period | | $ | 10.39 | | | $ | 10.44 | | | $ | 10.00 | |
| | | | |
| | Net investment income(b) | | | 0.14 | | | | 0.16 | | | | 0.04 | |
| | | | |
| | Net realized and unrealized gain (loss) | | | 1.20 | | | | (0.10 | ) | | | 0.40 | |
| | | | |
| | Total from investment operations | | | 1.34 | | | | 0.06 | | | | 0.44 | |
| | | | |
| | Distributions to shareholders from net investment income | | | (0.19 | ) | | | (0.08 | ) | | | — | |
| | | | |
| | Distributions to shareholders from net realized gains | | | — | | | | (0.03 | ) | | | — | |
| | | | |
| | Total distributions | | | (0.19 | ) | | | (0.11 | ) | | | — | |
| | | | |
| | Net asset value, end of period | | $ | 11.54 | | | $ | 10.39 | | | $ | 10.44 | |
| | | | |
| | Total return(c) | | | 12.90 | % | | | 0.68 | % | | | 4.40 | % |
| | | | |
| | Net assets, end of period (in 000s) | | $ | 12 | | | $ | 11 | | | $ | 10 | |
| | | | |
| | Ratio of net expenses to average net assets(d) | | | 0.72 | % | | | 0.78 | % | | | 0.94 | %(e) |
| | | | |
| | Ratio of total expenses to average net assets(d) | | | 4.33 | % | | | 7.20 | % | | | 8.96 | %(e) |
| | | | |
| | Ratio of net investment income to average net assets | | | 1.37 | % | | | 1.55 | % | | | 1.19 | %(e) |
| | | | |
| | Portfolio turnover rate(f) | | | 16 | % | | | 148 | % | | | 56 | % |
| | (a) | | Commenced operations on April 30, 2018. |
| | (b) | | Calculated based on the average shares outstanding methodology. |
| | (c) | | Assumes investment at the NAV at the beginning of the period, reinvestment of all dividends and distributions, a complete redemption of the investment at the NAV at the end of the period and no sales or redemption charges (if any). Total returns would be reduced if a sales or redemption charge was taken into account. Returns do not reflect the impact of taxes to shareholders relating to Portfolio distributions or the redemption of Portfolio shares. Total returns for periods less than one full year are not annualized. |
| | (d) | | Expense ratios exclude the expenses of the Underlying Funds in which the Portfolio invests. |
| | (f) | | The Portfolio’s turnover rate is calculated in accordance with regulatory requirements, without regard to transactions involving short term investments. If such transactions were included, the Portfolio’s turnover rate may be higher. |
| | |
| The accompanying notes are an integral part of these financial statements. | | 99 |
GOLDMAN SACHS TARGET DATE PORTFOLIOS
Notes to Financial Statements
August 31, 2020
Goldman Sachs Trust II (the “Trust”) is a Delaware statutory trust registered under the Investment Company Act of 1940, as amended (the “Act”), as an open-end management investment company. The following table lists those series of the Trust that are included in this report (collectively, the “Portfolios” or individually a “Portfolio”), along with their corresponding share classes and respective diversification status under the Act:
| | | | |
| Portfolio | | Share Classes Offered | | Diversified/
Non-diversified |
All Portfolios* | | A, Institutional, Service, Investor, R6, R | | Diversified |
| * | | Goldman Sachs Target Date Retirement Portfolio was formerly known as Goldman Sachs Target Date 2020 Portfolio. Effective December 27, 2019, the Portfolio changed its name to the Goldman Sachs Target Date Retirement Portfolio. |
Class A Shares are sold with a front-end sales charge of up to 5.50%. Institutional, Service, Investor, Class R6 and Class R Shares are not subject to a sales charge.
Goldman Sachs Asset Management, L.P. (“GSAM”), an affiliate of Goldman Sachs & Co. LLC (“Goldman Sachs”), serves as investment adviser to the Portfolios pursuant to a management agreement (the “Agreement”) with the Trust.
The Portfolios are expected to primarily invest in shares of exchange-traded funds (“ETFs”) and/or mutual funds for which GSAM or an affiliate now or in the future acts as investment adviser or principal underwriter as well as unaffiliated ETFs and mutual funds.
|
| 2. SIGNIFICANT ACCOUNTING POLICIES |
The financial statements have been prepared in accordance with accounting principles generally accepted in the United States of America (“GAAP”) and require management to make estimates and assumptions that may affect the reported amounts and disclosures. Actual results may differ from those estimates and assumptions. Each Portfolio is an investment company under GAAP and follows the accounting and reporting guidance applicable to investment companies.
A. Investment Valuation — The valuation policy of the Portfolios and underlying funds (“Underlying Funds”) is to value investments at fair value.
B. Investment Income and Investments — Investment income includes interest income, dividend income and securities lending income, if any. Interest income is accrued daily and adjusted for amortization of premiums and accretion of discounts. Dividend income is recognized on ex-dividend date or, for certain foreign securities, as soon as such information is obtained subsequent to the ex-dividend date. Non-cash dividends, if any, are recorded at the fair market value of the securities received. Investment transactions are reflected on trade date. Realized gains and losses are calculated using identified cost. Investment transactions are recorded on the following business day for daily net asset value (“NAV”) calculations. Income distributions are recognized as capital gains or income in the financial statements in accordance with the character that is distributed. For derivative contracts, realized gains and losses are recorded upon settlement of the contract.
C. Class Allocations and Expenses — Investment income, realized and unrealized gain (loss), if any, and non-class specific expenses of each Portfolio are allocated daily based upon the proportion of net assets of each class. Non-class specific expenses directly incurred by a Portfolio are charged to that Portfolio, while such expenses incurred by the Trust are allocated across the applicable Portfolios on a straight-line and/or pro-rata basis depending upon the nature of the expenses. Class specific expenses, where applicable, are borne by the respective share classes and include Distribution and Service, Transfer Agency and Service and Shareholder Administration fees.
Expenses included in the accompanying financial statements reflect the expenses of each Portfolio and do not include any expenses associated with the Underlying Funds (“Underlying Funds”). Because the Underlying Funds have varied expense and fee levels and the Portfolios may own different proportions of the Underlying Funds at different times, the amount of fees and expenses incurred indirectly by each Portfolio will vary.
100
GOLDMAN SACHS TARGET DATE PORTFOLIOS
|
| 2. SIGNIFICANT ACCOUNTING POLICIES (continued) |
D. Federal Taxes and Distributions to Shareholders — It is each Portfolio’s policy to comply with the requirements of the Internal Revenue Code of 1986, as amended (the “Code”), applicable to regulated investment companies and to distribute each year substantially all of its investment company taxable income and capital gains to its shareholders. Accordingly, each Portfolio is not required to make any provisions for the payment of federal income tax. Distributions to shareholders are recorded on the ex-dividend date. Income and capital gains distributions, if any, are declared and paid at least annually.
Net capital losses, if any, are carried forward to future fiscal years and may be used to the extent allowed by the Code to offset any future capital gains. Losses that are carried forward will retain their character as either short-term or long-term capital losses. Utilization of capital loss carryforwards will reduce the requirement of future capital gains distributions.
The characterization of distributions to shareholders for financial reporting purposes is determined in accordance with federal income tax rules, which may differ from GAAP. The source of each Portfolio’s distributions may be shown in the accompanying financial statements as either from distributable earnings or capital. Certain components of the Portfolios’ net assets on the Statements of Assets and Liabilities reflect permanent GAAP/tax differences based on the appropriate tax character.
E. In-Kind Transactions — Each Portfolio may allow investors, under certain circumstances, to purchase shares with securities instead of cash. In addition, the Trust reserves the right to redeem an investor’s shares by distributing securities instead of cash. These are known as in-kind transactions. Securities included as part of in-kind purchases and redemptions of Portfolio shares are valued in the same manner as they are valued for purposes of computing a Portfolio’s NAV, in accordance with each Portfolio’s Valuation Procedures, and such valuations are as of the date the trade is submitted pursuant to the procedures specified in the Portfolios’ prospectus.
| | |
| 3. INVESTMENTS AND FAIR VALUE MEASUREMENTS | | |
U.S. GAAP defines the fair value of a financial instrument as the amount that would be received to sell an asset or paid to transfer a liability in an orderly transaction between market participants at the measurement date (i.e., the exit price); the Portfolios’ policy is to use the market approach. GAAP establishes a fair value hierarchy that prioritizes the inputs to valuation techniques used to measure fair value. The hierarchy gives the highest priority to unadjusted quoted prices in active markets for identical assets or liabilities (Level 1 measurements) and the lowest priority to unobservable inputs (Level 3 measurements). The level in the fair value hierarchy within which the fair value measurement in its entirety falls shall be determined based on the lowest level input that is significant to the fair value measurement in its entirety. The levels used for classifying investments are not necessarily an indication of the risk associated with investing in these investments. The three levels of the fair value hierarchy are described below:
Level 1 — Unadjusted quoted prices in active markets that are accessible at the measurement date for identical, unrestricted assets or liabilities;
Level 2 — Quoted prices in markets that are not active or financial instruments for which significant inputs are observable (including, but not limited to, quoted prices for similar investments, interest rates, foreign exchange rates, volatility and credit spreads), either directly or indirectly;
Level 3 — Prices or valuations that require significant unobservable inputs (including GSAM’s assumptions in determining fair value measurement).
The Board of Trustees (“Trustees”) has approved Valuation Procedures that govern the valuation of the portfolio investments held by the Portfolios, including investments for which market quotations are not readily available. The Trustees have delegated to GSAM day-to-day responsibility for implementing and maintaining internal controls and procedures related to the valuation of the Portfolios’ investments. To assess the continuing appropriateness of pricing sources and methodologies, GSAM regularly performs price verification procedures and issues challenges as necessary to third party pricing vendors or brokers, and any differences are reviewed in accordance with the Valuation Procedures.
101
GOLDMAN SACHS TARGET DATE PORTFOLIOS
Notes to Financial Statements (continued)
August 31, 2020
|
| 3. INVESTMENTS AND FAIR VALUE MEASUREMENTS (continued) |
A. Level 1 and Level 2 Fair Value Investments — The valuation techniques and significant inputs used in determining the fair values for investments classified as Level 1 and Level 2 are as follows:
Underlying Funds (including Money Market Funds) — Underlying Funds include other investment companies and exchange-traded funds (“ETFs”). Investments in the Underlying Funds (except ETFs) are valued at the NAV per share on the day of valuation. ETFs are valued daily at the last sale price or official closing price on the principal exchange or system on which the investment is traded. Because the Portfolios invest in Underlying Funds that fluctuate in value, the Portfolios’ shares will correspondingly fluctuate in value. To the extent these investments are actively traded, they are classified as Level 1 of the fair value hierarchy, otherwise they are generally classified as Level 2. For information regarding an Underlying Fund’s accounting policies and investment holdings, please see the Underlying Fund’s shareholder report.
Derivative Contracts — A derivative is an instrument whose value is derived from underlying assets, indices, reference rates or a combination of these factors. A Portfolio enters into derivative transactions to hedge against changes in interest rates, securities prices, and/or currency exchange rates, to increase total return, or to gain access to certain markets or attain exposure to other underliers. For financial reporting purposes, cash collateral that has been pledged to cover obligations of a Portfolio and cash collateral received, if any, is reported separately on the Statements of Assets and Liabilities as receivables/payables for collateral on certain derivatives contracts. Non-cash collateral pledged by a Portfolio, if any, is noted in the Schedules of Investments.
Exchange-traded derivatives, including futures and options contracts, are generally valued at the last sale or settlement price on the exchange where they are principally traded. Exchange-traded options without settlement prices are generally valued at the midpoint of the bid and ask prices on the exchange where they are principally traded (or, in the absence of two-way trading, at the last bid price for long positions and the last ask price for short positions). Exchange-traded derivatives typically fall within Level 1 of the fair value hierarchy.
i. Futures Contracts — Futures contracts are contracts to buy or sell a standardized quantity of a specified commodity or security. Upon entering into a futures contract, a Portfolio deposits cash or securities in an account on behalf of the broker in an amount sufficient to meet the initial margin requirement. Subsequent payments are made or received by a Portfolio equal to the daily change in the contract value and are recorded as variation margin receivable or payable with a corresponding offset to unrealized gains or losses.
B. Level 3 Fair Value Investments — To the extent that significant inputs to valuation models and other alternative pricing sources are unobservable, or if quotations are not readily available, or if GSAM believes that such quotations do not accurately reflect fair value, the fair value of a Portfolio’s investments may be determined under Valuation Procedures approved by the Trustees. GSAM, consistent with its procedures and applicable regulatory guidance, may make an adjustment to the most recent valuation prices of either domestic or foreign securities in light of significant events to reflect what it believes to be the fair value of the securities at the time of determining a Portfolio’s NAV. To the extent investments are valued using single source broker quotations obtained directly from the broker or passed through from third party pricing vendors, such investments are classified as Level 3 investments.
C. Fair Value Hierarchy — The following is a summary of the Portfolios’ investments and derivatives classified in the fair value hierarchy as of August 31, 2020:
| | | | | | | | | | | | |
| | |
| TARGET DATE RETIREMENT PORTFOLIO | | | | | | | | | |
| | | |
| Investment Type | | Level 1 | | | Level 2 | | | Level 3 | |
| | | |
| Assets | | | | | | | | | | | | |
| | | |
Exchange Traded Funds | | $ | 7,081,642 | | | $ | — | | | $ | — | |
| | | |
Investment Company | | | 304,119 | | | | — | | | | — | |
| | | |
| Total | | $ | 7,385,761 | | | $ | — | | | $ | — | |
102
GOLDMAN SACHS TARGET DATE PORTFOLIOS
|
| 3. INVESTMENTS AND FAIR VALUE MEASUREMENTS (continued) |
| | | | | | | | | | | | |
| | |
| TARGET DATE RETIREMENT PORTFOLIO (continued) | | | | | | | | | |
| | | |
| Derivative Type | | Level 1 | | | Level 2 | | | Level 3 | |
|
| Assets(a) | |
| | | |
Futures Contracts | | $ | 48,741 | | | $ | — | | | $ | — | |
| | |
| TARGET DATE 2025 PORTFOLIO | | | | | | | | | |
| | | |
| Investment Type | | Level 1 | | | Level 2 | | | Level 3 | |
| | | |
| Assets | | | | | | | | | | | | |
| | | |
Exchange Traded Funds | | $ | 7,853,142 | | | $ | — | | | $ | — | |
| | | |
Investment Company | | | 67,738 | | | | — | | | | — | |
| | | |
| Total | | $ | 7,920,880 | | | $ | — | | | $ | — | |
| | | |
| Derivative Type | | | | | | | | | |
|
| Assets(a) | |
| | | |
Futures Contracts | | $ | 24,981 | | | $ | — | | | $ | — | |
| | |
| TARGET DATE 2030 PORTFOLIO | | | | | | | | | |
| | | |
| Investment Type | | Level 1 | | | Level 2 | | | Level 3 | |
| | | |
| Assets | | | | | | | | | | | | |
| | | |
Exchange Traded Funds | | $ | 4,741,242 | | | $ | — | | | $ | — | |
| | | |
Investment Company | | | 74,394 | | | | — | | | | — | |
| | | |
| Total | | $ | 4,815,636 | | | $ | — | | | $ | — | |
| | | |
| Derivative Type | | | | | | | | | |
|
| Assets(a) | |
| | | |
Futures Contracts | | $ | 9,085 | | | $ | — | | | $ | — | |
| | |
| TARGET DATE 2035 PORTFOLIO | | | | | | | | | |
| | | |
| Investment Type | | Level 1 | | | Level 2 | | | Level 3 | |
| | | |
| Assets | | | | | | | | | | | | |
| | | |
Exchange Traded Funds | | $ | 6,982,110 | | | $ | — | | | $ | — | |
| | | |
Investment Company | | | 47,156 | | | | — | | | | — | |
| | | |
| Total | | $ | 7,029,266 | | | $ | — | | | $ | — | |
| | | |
| Derivative Type | | | | | | | | | |
|
| Assets(a) | |
| | | |
Futures Contracts | | $ | 18,170 | | | $ | — | | | $ | — | |
| (a) | | Amount shown represents unrealized gain (loss) at period end. |
103
GOLDMAN SACHS TARGET DATE PORTFOLIOS
Notes to Financial Statements (continued)
August 31, 2020
|
| 3. INVESTMENTS AND FAIR VALUE MEASUREMENTS (continued) |
| | | | | | | | | | | | |
| | |
| TARGET DATE 2040 PORTFOLIO | | | | | | | | | |
| | | |
| Investment Type | | Level 1 | | | Level 2 | | | Level 3 | |
| | | |
| Assets | | | | | | | | | | | | |
| | | |
Exchange Traded Funds | | $ | 7,640,424 | | | $ | — | | | $ | — | |
| | | |
| Total | | $ | 7,640,424 | | | $ | — | | | $ | — | |
| | | |
| Derivative Type | | | | | | | | | |
|
| Assets(a) | |
| | | |
Futures Contracts | | $ | 18,170 | | | $ | — | | | $ | — | |
| | |
| TARGET DATE 2045 PORTFOLIO | | | | | | | | | |
| | | |
| Investment Type | | Level 1 | | | Level 2 | | | Level 3 | |
| | | |
| Assets | | | | | | | | | | | | |
| | | |
Exchange Traded Funds | | $ | 7,541,148 | | | $ | — | | | $ | — | |
| | | |
Investment Company | | | 84,073 | | | | — | | | | — | |
| | | |
| Total | | $ | 7,625,221 | | | $ | — | | | $ | — | |
| | | |
| Derivative Type | | | | | | | | | |
|
| Assets(a) | |
| | | |
Futures Contracts | | $ | 40,012 | | | $ | — | | | $ | — | |
| | |
| TARGET DATE 2050 PORTFOLIO | | | | | | | | | |
| | | |
| Investment Type | | Level 1 | | | Level 2 | | | Level 3 | |
| | | |
| Assets | | | | | | | | | | | | |
| | | |
Exchange Traded Funds | | $ | 6,856,632 | | | $ | — | | | $ | — | |
| | | |
Investment Company | | | 107,424 | | | | — | | | | — | |
| | | |
| Total | | $ | 6,964,056 | | | $ | — | | | $ | — | |
| | | |
| Derivative Type | | | | | | | | | |
|
| Assets(a) | |
| | | |
Futures Contracts | | $ | 45,745 | | | $ | — | | | $ | — | |
| | |
| TARGET DATE 2055 PORTFOLIO | | | | | | | | | |
| | | |
| Investment Type | | Level 1 | | | Level 2 | | | Level 3 | |
| | | |
| Assets | | | | | | | | | | | | |
| | | |
Exchange Traded Funds | | $ | 7,209,438 | | | $ | — | | | $ | — | |
| | | |
Investment Company | | | 120,710 | | | | — | | | | — | |
| | | |
| Total | | $ | 7,330,148 | | | $ | — | | | $ | — | |
| (a) | | Amount shown represents unrealized gain (loss) at period end. |
104
GOLDMAN SACHS TARGET DATE PORTFOLIOS
|
| 3. INVESTMENTS AND FAIR VALUE MEASUREMENTS (continued) |
| | | | | | | | | | | | |
| | |
| TARGET DATE 2055 PORTFOLIO (continued) | | | | | | | | | |
| | | |
| Derivative Type | | Level 1 | | | Level 2 | | | Level 3 | |
|
| Assets(a) | |
| | | |
Futures Contracts | | $ | 45,745 | | | $ | — | | | $ | — | |
| | |
| TARGET DATE 2060 PORTFOLIO | | | | | | | | | |
| | | |
| Investment Type | | Level 1 | | | Level 2 | | | Level 3 | |
| | | |
| Assets | | | | | | | | | | | | |
| | | |
Exchange Traded Funds | | $ | 8,352,080 | | | $ | — | | | $ | — | |
| | | |
Investment Company | | | 136,498 | | | | — | | | | — | |
| | | |
| Total | | $ | 8,488,578 | | | $ | — | | | $ | — | |
| | | |
| Derivative Type | | | | | | | | | |
|
| Assets(a) | |
| | | |
Futures Contracts | | $ | 45,745 | | | $ | — | | | $ | — | |
| (a) | | Amount shown represents unrealized gain (loss) at period end. |
For further information regarding security characteristics, see the Schedules of Investments.
|
| 4. INVESTMENTS IN DERIVATIVES |
The following tables set forth, by certain risk types, the gross value of derivative contracts (not considered to be hedging instruments for accounting disclosure purposes) as of August 31, 2020. These instruments were used as part of the Portfolios’ investment strategies and to obtain and/or manage exposure related to the risks below. The values in the tables below exclude the effects of cash collateral received or posted pursuant to these derivative contracts, and therefore are not representative of the Portfolios’ net exposure.
| | | | | | | | | | | | |
| | | |
| Target Date Retirement Portfolio | | | | | | | | | | |
| Risk | | Statements of Assets
and Liabilities | | Assets | | | Statements of Assets
and Liabilities | | Liabilities | |
| Equity | | Variation margin on futures
contracts | | $ | 48,741 | (a) | | — | | $ | — | |
| | | |
| Target Date 2025 Portfolio | | | | | | | | | | |
| Risk | | Statements of Assets
and Liabilities | | Assets | | | Statements of Assets
and Liabilities | | Liabilities | |
| Equity | | Variation margin on futures
contracts | | $ | 24,981 | (a) | | — | | $ | — | |
| (a) | | Includes unrealized gain (loss) on futures contracts described in the Additional Investment Information sections of the Schedules of Investments. Only current day’s variation margin is reported within the Statements of Assets and Liabilities. |
105
GOLDMAN SACHS TARGET DATE PORTFOLIOS
Notes to Financial Statements (continued)
August 31, 2020
|
| 4. INVESTMENTS IN DERIVATIVES (continued) |
| | | | | | | | | | | | |
| | | |
| Target Date 2030 Portfolio | | | | | | | | | | |
| Risk | | Statements of Assets
and Liabilities | | Assets | | | Statements of Assets
and Liabilities | | Liabilities | |
| Equity | | Variation margin on futures
contracts | | $ | 9,085 | (a) | | — | | $ | — | |
| | | |
| Target Date 2035 Portfolio | | | | | | | | | | |
| Risk | | Statements of Assets
and Liabilities | | Assets | | | Statements of Assets
and Liabilities | | Liabilities | |
| Equity | | Variation margin on futures
contracts | | $ | 18,170 | (a) | | — | | $ | — | |
| | | |
| Target Date 2040 Portfolio | | | | | | | | | | |
| Risk | | Statements of Assets
and Liabilities | | Assets | | | Statements of Assets
and Liabilities | | Liabilities | |
| Equity | | Variation margin on futures
contracts | | $ | 18,170 | (a) | | — | | $ | — | |
| | | |
| Target Date 2045 Portfolio | | | | | | | | | | |
| Risk | | Statements of Assets
and Liabilities | | Assets | | | Statements of Assets
and Liabilities | | Liabilities | |
| Equity | | Variation margin on futures
contracts | | $ | 40,012 | (a) | | — | | $ | — | |
| | | |
| Target Date 2050 Portfolio | | | | | | | | | | |
| Risk | | Statements of Assets
and Liabilities | | Assets | | | Statements of Assets
and Liabilities | | Liabilities | |
| Equity | | Variation margin on futures
contracts | | $ | 45,745 | (a) | | — | | $ | — | |
| | | |
| Target Date 2055 Portfolio | | | | | | | | | | |
| Risk | | Statements of Assets
and Liabilities | | Assets | | | Statements of Assets
and Liabilities | | Liabilities | |
| Equity | | Variation margin on futures
contracts | | $ | 45,745 | (a) | | — | | $ | — | |
| | | |
| Target Date 2060 Portfolio | | | | | | | | | | |
| Risk | | Statements of Assets
and Liabilities | | Assets | | | Statements of Assets
and Liabilities | | Liabilities | |
| Equity | | Variation margin on futures
contracts | | $ | 45,745 | (a) | | — | | $ | — | |
| (a) | | Includes unrealized gain (loss) on futures contracts described in the Additional Investment Information sections of the Schedules of Investments. Only current day’s variation margin is reported within the Statements of Assets and Liabilities. |
The following tables set forth, by certain risk types, the Portfolios’ gains (losses) related to these derivatives and their indicative volumes for the fiscal year ended August 31, 2020. These gains (losses) should be considered in the context that these derivative contracts may have been executed to create investment opportunities and/or economically hedge certain investments, and accordingly, certain gains (losses) on such derivative contracts may offset certain (losses) gains attributable to investments. These gains (losses) are included in “Net realized gain (loss)” or “Net change in unrealized gain (loss)” on the Statements of Operations:
106
GOLDMAN SACHS TARGET DATE PORTFOLIOS
|
| 4. INVESTMENTS IN DERIVATIVES (continued) |
| | | | | | | | | | | | | | |
| | | |
| Target Date Retirement Portfolio | | | | | | | | | | | | |
| Risk | | Statements of Operations | | Net Realized
Gain (Loss) | | | Net Change in
Unrealized
Gain (Loss) | | | Average
Number of
Contracts(a) | |
| Equity | | Net realized gain (loss) from futures contracts/Net change in unrealized gain (loss) on futures contracts | | $ | 25,150 | | | $ | 53,253 | | | | 2 | |
| | | |
| Target Date 2025 Portfolio | | | | | | | | | | | | |
| Risk | | Statements of Operations | | Net Realized
Gain (Loss) | | | Net Change in
Unrealized
Gain (Loss) | | | Average
Number of
Contracts(a) | |
| Equity | | Net realized gain (loss) from futures contracts/Net change in unrealized gain (loss) on futures contracts | | $ | 2,789 | | | $ | 29,493 | | | | 1 | |
| | | |
| Target Date 2030 Portfolio | | | | | | | | | | | | |
| Risk | | Statements of Operations | | Net Realized
Gain (Loss) | | | Net Change in
Unrealized
Gain (Loss) | | | Average
Number of
Contracts(a) | |
| Equity | | Net realized gain (loss) from futures contracts/Net change in unrealized gain (loss) on futures contracts | | $ | (1,370 | ) | | $ | 13,597 | | | | 1 | |
| | | |
| Target Date 2035 Portfolio | | | | | | | | | | | | |
| Risk | | Statements of Operations | | Net Realized
Gain (Loss) | | | Net Change in
Unrealized
Gain (Loss) | | | Average
Number of
Contracts(a) | |
| Equity | | Net realized gain (loss) from futures contracts/Net change in unrealized gain (loss) on futures contracts | | $ | (15,590 | ) | | $ | 22,682 | | | | 2 | |
| | | |
| Target Date 2040 Portfolio | | | | | | | | | | | | |
| Risk | | Statements of Operations | | Net Realized
Gain (Loss) | | | Net Change in
Unrealized
Gain (Loss) | | | Average
Number of
Contracts(a) | |
| Equity | | Net realized gain (loss) from futures contracts/Net change in unrealized gain (loss) on futures contracts | | $ | (9,208 | ) | | $ | 24,938 | | | | 2 | |
| | | |
| Target Date 2045 Portfolio | | | | | | | | | | | | |
| Risk | | Statements of Operations | | Net Realized
Gain (Loss) | | | Net Change in
Unrealized
Gain (Loss) | | | Average
Number of
Contracts(a) | |
| Equity | | Net realized gain (loss) from futures contracts/Net change in unrealized gain (loss) on futures contracts | | $ | (16,781 | ) | | $ | 45,277 | | | | 4 | |
| | | |
| Target Date 2050 Portfolio | | | | | | | | | | | | |
| Risk | | Statements of Operations | | Net Realized
Gain (Loss) | | | Net Change in
Unrealized
Gain (Loss) | | | Average
Number of
Contracts(a) | |
| Equity | | Net realized gain (loss) from futures contracts/Net change in unrealized gain (loss) on futures contracts | | $ | (22,523 | ) | | $ | 51,025 | | | | 4 | |
| (a) | | Average number of contracts is based on the average of month end balances for the period ended August 31, 2020. |
107
GOLDMAN SACHS TARGET DATE PORTFOLIOS
Notes to Financial Statements (continued)
August 31, 2020
|
| 4. INVESTMENTS IN DERIVATIVES (continued) |
| | | | | | | | | | | | | | |
| | | |
| Target Date 2055 Portfolio | | | | | | | | | | | | |
| Risk | | Statements of Operations | | Net Realized
Gain (Loss) | | | Net Change in
Unrealized
Gain (Loss) | | | Average
Number of
Contracts(a) | |
| Equity | | Net realized gain (loss) from futures contracts/Net change in unrealized gain (loss) on futures contracts | | $ | (22,523 | ) | | $ | 51,025 | | | | 4 | |
| | | |
| Target Date 2060 Portfolio | | | | | | | | | | | | |
| Risk | | Statements of Operations | | Net Realized
Gain (Loss) | | | Net Change in
Unrealized
Gain (Loss) | | | Average
Number of
Contracts(a) | |
| Equity | | Net realized gain (loss) from futures contracts/Net change in unrealized gain (loss) on futures contracts | | $ | 10,297 | | | $ | 51,010 | | | | 5 | |
| (a) | | Average number of contracts is based on the average of month end balances for the period ended August 31, 2020. |
|
| 5. AGREEMENTS AND AFFILIATED TRANSACTIONS |
A. Management Agreement — Under the Agreement, GSAM manages the Portfolios, subject to the general supervision of the Trustees.
As compensation for the services rendered pursuant to the Agreement, the assumption of the expenses related thereto and administration of the Portfolios’ business affairs, including providing facilities, GSAM is entitled to a management fee, accrued daily and paid monthly, equal to an annual percentage rate of each Portfolio’s average daily net assets.
For the fiscal year ended August 31, 2020, contractual and effective net management fees with GSAM for Target Date Retirement, Target Date 2025, Target Date 2030, Target Date 2035, Target Date 2040, Target Date 2045, Target Date 2050, Target Date 2055 and Target Date 2060 Portfolios were at the following rates:
| | | | | | | | | | | | | | | | | | | | |
| | | Contractual Management Rate | | | Effective
Rate | | | Effective Net
Management Rate* | |
| Portfolio | | $2 billion | | | Next
$3 billion | | | Over
$5 billion | |
Target Date Retirement Portfolio | | | 0.25 | % | | | 0.23 | % | | | 0.21 | % | | | 0.25 | % | | | 0.09 | % |
Target Date 2025 | | | 0.25 | | | | 0.23 | | | | 0.21 | | | | 0.25 | | | | 0.08 | |
Target Date 2030 | | | 0.25 | | | | 0.23 | | | | 0.21 | | | | 0.25 | | | | 0.07 | |
Target Date 2035 | | | 0.25 | | | | 0.23 | | | | 0.21 | | | | 0.25 | | | | 0.06 | |
Target Date 2040 | | | 0.25 | | | | 0.23 | | | | 0.21 | | | | 0.25 | | | | 0.05 | |
Target Date 2045 | | | 0.25 | | | | 0.23 | | | | 0.21 | | | | 0.25 | | | | 0.04 | |
Target Date 2050 | | | 0.25 | | | | 0.23 | | | | 0.21 | | | | 0.25 | | | | 0.04 | |
Target Date 2055 | | | 0.25 | | | | 0.23 | | | | 0.21 | | | | 0.25 | | | | 0.04 | |
Target Date 2060 | | | 0.25 | | | | 0.23 | | | | 0.21 | | | | 0.25 | | | | 0.04 | |
| * | | The Effective Net Management Rate includes the impact of management fee waivers of affiliated underlying funds, if any. The Effective Net Management Rate may not correlate to the Contractual Management Rate as a result of management fee waivers that may be in effect from time to time. |
108
GOLDMAN SACHS TARGET DATE PORTFOLIOS
|
| 5. AGREEMENTS AND AFFILIATED TRANSACTIONS (continued) |
The Portfolios invest in Class R6 Shares of the Goldman Sachs Financial Square Government Fund (“Government Money Market Fund”), as well as various Goldman Sachs ETFs, all of which are affiliated Underlying Funds. GSAM has agreed to waive a portion of its management fee payable by the Portfolios in an amount equal to the management fee it earns as an investment adviser to the affiliated Underlying Funds in which the Portfolios invest. In addition, the Investment Adviser has agreed to waive a portion of its management fee in order to achieve an effective rate of 0.19% as an annual percentage of average daily net assets of each Portfolio. For the fiscal year ended, August 31, 2020, the management fee waived by GSAM for each Portfolio was as follows:
| | | | | | |
| Portfolio | | | | Management Fee Waived | |
Target Date Retirement Portfolio | | | | $ | 7,521 | |
Target Date 2025 | | | | | 8,588 | |
Target Date 2030 | | | | | 5,867 | |
Target Date 2035 | | | | | 9,108 | |
Target Date 2040 | | | | | 10,122 | |
Target Date 2045 | | | | | 11,322 | |
Target Date 2050 | | | | | 10,388 | |
Target Date 2055 | | | | | 10,774 | |
Target Date 2060 | | | | | 11,955 | |
B. Distribution and/or Service (12b-1) Plans — The Trust, on behalf of Class A and Class R Shares of each Portfolio, has adopted Distribution and Service Plans subject to Rule 12b-1 under the Act. Under the Distribution and Service Plans, Goldman Sachs, which serves as distributor (the “Distributor”), is entitled to a fee accrued daily and paid monthly, for distribution services and personal and account maintenance services, which may then be paid by Goldman Sachs to authorized dealers. These fees are equal to an annual percentage rate of the average daily net assets attributable to Class A or Class R Shares of the Portfolios, as applicable, as set forth below.
The Trust, on behalf of Service Shares of each applicable Portfolio, has adopted a Service Plan subject to Rule 12b-1 under the Act to allow Service Shares to compensate service organizations (including Goldman Sachs) for providing personal and account maintenance services to their customers who are beneficial owners of such shares. The Service Plan provides for compensation to the service organizations equal to an annual percentage rate of the average daily net assets attributable to Service Shares of the Portfolios, as set forth below.
| | | | | | | | | | | | |
| | | Distribution and/or Service Plan Rates | |
| | | Class A* | | | Class R* | | | Service | |
Distribution and/or Service Plan | | | 0.25 | % | | | 0.50 | % | | | 0.25 | % |
| * | | With respect to Class A and Class R Shares, the Distributor at its discretion may use compensation for distribution services paid under the Distribution and Service Plans to compensate service organizations for personal and account maintenance services and expenses as long as such total compensation does not exceed the maximum cap on “service fees” imposed by the Financial Industry Regulatory Authority. |
109
GOLDMAN SACHS TARGET DATE PORTFOLIOS
Notes to Financial Statements (continued)
August 31, 2020
|
| 5. AGREEMENTS AND AFFILIATED TRANSACTIONS (continued) |
C. Distribution Agreement — Goldman Sachs, as Distributor of the shares of the Portfolios pursuant to a Distribution Agreement, may retain a portion of the Class A Shares’ front end sales charge. For the fiscal year ended August 31, 2020, Goldman Sachs retained the following amounts:
| | | | | | |
| | | | | Front End
Sales Charge | |
| Portfolio | | | | Class A | |
Target Date Retirement | | | | $ | 47 | |
Target Date 2025 | | | | | 156 | |
Target Date 2030 | | | | | 475 | |
Target Date 2035 | | | | | 118 | |
Target Date 2040 | | | | | 70 | |
Target Date 2045 | | | | | 156 | |
Target Date 2050 | | | | | 1,805 | |
Target Date 2055 | | | | | 293 | |
Target Date 2060 | | | | | 101 | |
D. Shareholder Administration Plan — The Trust, on behalf of the Portfolios, has adopted a Shareholder Administration Plan to allow Service Shares to compensate service organizations (including Goldman Sachs) for providing varying levels of shareholder administration services to their customers who are beneficial owners of such shares. The Shareholder Administration Plan provides for compensation to the service organizations equal to an annual percentage rate of 0.25% of the average daily net assets attributable to Service Shares of the Portfolios.
E. Transfer Agency Agreement — Goldman Sachs also serves as the transfer agent of the Portfolios for a fee pursuant to the Transfer Agency Agreement. The fees charged for such transfer agency services are accrued daily and paid monthly at annual rates as follows: 0.17% of the average daily net assets of Class A, Investor and Class R Shares; 0.03% of the average daily net assets of Class R6 Shares; and 0.04% of the average daily net assets of Institutional and Service Shares. Goldman Sachs has agreed to waive a portion of its transfer agency fee equal to 0.01% as an annual percentage rate of the average daily net assets attributable to Class R6 Shares of each Portfolio through at least December 27, 2020, and prior to such date, Goldman Sachs may not terminate the arrangements without the approval of the Trustees.
F. Other Expense Agreements and Affiliated Transactions — GSAM has agreed to reduce or limit certain “Other Expenses” of the Portfolios (excluding acquired fund fees and expenses, transfer agency fees and expenses, service fees and shareholder administration fees (as applicable), taxes, interest, brokerage fees, expenses of shareholder meetings, litigation and indemnification, and extraordinary expenses) to the extent such expenses exceed, on an annual basis, a percentage rate of the average daily net assets of each Portfolio. Such Other Expense reimbursements, if any, are accrued daily and paid monthly. In addition, the Portfolios are not obligated to reimburse GSAM for prior fiscal year expense reimbursements, if any. The Other Expense limitation as an annual percentage rate of average daily net assets is 0.024% for each of the Target Date Retirement, Target Date 2030, Target Date 2040 and Target Date 2050 Portfolios and 0.014% for each of the Target Date 2025, Target Date 2035, Target Date 2045, Target Date 2055 and Target Date 2060 Portfolios. These Other Expense limitations will remain in place through at least December 27, 2020, and prior to such date, GSAM may not terminate the arrangements without the approval of the Trustees. In addition, the Portfolios have entered into certain offset arrangements with the transfer agent, which may result in a reduction of the Portfolios’ expenses and are received irrespective of the application of the “Other Expense” limitations described above.
110
GOLDMAN SACHS TARGET DATE PORTFOLIOS
|
| 5. AGREEMENTS AND AFFILIATED TRANSACTIONS (continued) |
For the fiscal year ended August 31, 2020, these expense reductions, including any fee waivers and Other Expense reimbursements, were as follows:
| | | | | | | | | | | | | | | | | | |
| Portfolio | | | | Management Fee Waiver | | | Transfer Agency Waivers/Credits | | | Other
Expense Reimbursements | | | Total Expense Reductions | |
Target Date Retirement | | | | $ | 11,833 | | | $ | 630 | | | $ | 246,633 | | | $ | 259,096 | |
Target Date 2025 | | | | | 13,094 | | | | 51 | | | | 251,264 | | | | 264,409 | |
Target Date 2030 | | | | | 8,746 | | | | 331 | | | | 246,022 | | | | 255,099 | |
Target Date 2035 | | | | | 13,245 | | | | 24 | | | | 253,182 | | | | 266,451 | |
Target Date 2040 | | | | | 14,467 | | | | 670 | | | | 246,925 | | | | 262,062 | |
Target Date 2045 | | | | | 15,753 | | | | 32 | | | | 253,492 | | | | 269,277 | |
Target Date 2050 | | | | | 14,415 | | | | 564 | | | | 250,127 | | | | 265,106 | |
Target Date 2055 | | | | | 14,973 | | | | 5 | | | | 251,492 | | | | 266,470 | |
Target Date 2060 | | | | | 16,621 | | | | 771 | | | | 264,112 | | | | 281,504 | |
G. Line of Credit Facility — As of August 31, 2020, the Portfolios participated in a $700,000,000 committed, unsecured revolving line of credit facility (the “facility”) together with other portfolios of the Trust and certain registered investment companies having management agreements with GSAM or its affiliates. This facility is to be used for temporary emergency purposes, or to allow for an orderly liquidation of securities to meet redemption requests. The interest rate on borrowings is based on the federal funds rate. The facility also requires a fee to be paid by the Portfolios based on the amount of the commitment that has not been utilized. For the fiscal year ended August 31, 2020, the Portfolios did not have any borrowings under the facility. Prior to April 28, 2020, the facility was $580,000,000.
H. Other Transactions with Affiliates — For the fiscal year ended August 31, 2020, Goldman Sachs did not earn any brokerage commissions from portfolio transactions, on behalf of the Portfolios.
The tables below shows the transactions in and earnings from investments in these Underlying Funds for the fiscal year ended August 31, 2020:
| | | | | | | | | | | | | | | | | | | | | | | | | | | | | | | | | | | | |
| |
| Target Date Retirement Portfolio | | | | | |
| Underlying Fund | | Market
Value as of
8/31/2019 | | | Purchases
at Cost | | | Proceeds
from Sales | | | Net
Realized
Gain/(Loss) | | | Change in
Unrealized
Gain/(Loss) | | | Market
Value as of
8/31/2020 | | | Shares
as of
8/31/2020 | | | Dividend
Income | | | Capital Gain
Distributions | |
Goldman Sachs Access High Yield Corporate Bond ETF | | $ | 91,787 | | | $ | — | | | $ | — | | | $ | — | | | $ | (28 | ) | | $ | 91,759 | | | | 1,864 | | | $ | 4,605 | | | $ | — | |
Goldman Sachs Access Inflation Protected USD Bond ETF | | | — | | | | 438,612 | | | | (45,132 | ) | | | 435 | | | | 33,072 | | | | 426,987 | | | | 7,491 | | | | 3,519 | | | | — | |
Goldman Sachs Access Investment Grade Corporate Bond ETF | | | 2,425,992 | | | | 224,678 | | | | (1,064,618 | ) | | | 101,006 | | | | (27,118 | ) | | | 1,659,940 | | | | 29,925 | | | | 57,690 | | | | — | |
Goldman Sachs ActiveBeta® Emerging Markets Equity ETF | | | 300,346 | | | | — | | | | (59,618 | ) | | | 5,723 | | | | 16,927 | | | | 263,378 | | | | 7,914 | | | | 6,932 | | | | — | |
111
GOLDMAN SACHS TARGET DATE PORTFOLIOS
Notes to Financial Statements (continued)
August 31, 2020
|
| 5. AGREEMENTS AND AFFILIATED TRANSACTIONS (continued) |
| | | | | | | | | | | | | | | | | | | | | | | | | | | | | | | | | | | | |
| |
| Target Date Retirement Portfolio (continued) | | | | | |
| Underlying Fund | | Market
Value as of
8/31/2019 | | | Purchases
at Cost | | | Proceeds
from Sales | | | Net
Realized
Gain/(Loss) | | | Change in
Unrealized
Gain/(Loss) | | | Market
Value as of
8/31/2020 | | | Shares
as of
8/31/2020 | | | Dividend
Income | | | Capital Gain
Distributions | |
Goldman Sachs ActiveBeta® International Equity ETF | | $ | 705,257 | | | $ | — | | | $ | (133,915 | ) | | $ | 9,828 | | | $ | 16,853 | | | $ | 598,023 | | | | 20,888 | | | $ | 13,470 | | | $ | — | |
Goldman Sachs ActiveBeta® U.S. Large Cap Equity ETF | | | 1,285,186 | | | | 135,211 | | | | (269,904 | ) | | | 31,104 | | | | 207,372 | | | | 1,388,969 | | | | 19,671 | | | | 21,942 | | | | — | |
Goldman Sachs ActiveBeta® U.S. Small Cap Equity ETF | | | 68,408 | | | | 113,716 | | | | — | | | | — | | | | (8,433 | ) | | | 173,691 | | | | 3,981 | | | | 1,943 | | | | — | |
Goldman Sachs Financial Square Government Fund — Class R6 | | | 313,342 | | | | 1,012,868 | | | | (1,022,091 | ) | | | — | | | | — | | | | 304,119 | | | | 304,119 | | | | 1,000 | | | | — | |
| | | | | | | | | |
Total | | $ | 5,190,318 | | | $ | 1,925,085 | | | $ | (2,595,278 | ) | | $ | 148,096 | | | $ | 238,645 | | | $ | 4,906,866 | | | | | | | $ | 111,101 | | | $ | — | |
| |
| Target Date 2025 Portfolio | | | | | |
| Underlying Fund | | Market
Value as of
8/31/2019 | | | Purchases
at Cost | | | Proceeds
from Sales | | | Net
Realized
Gain/(Loss)
| | | Change in
Unrealized
Gain/(Loss) | | | Market
Value as of
8/31/2020 | | | Shares
as of
8/31/2020 | | | Dividend
Income | | | Capital Gain
Distributions | |
Goldman Sachs Access High Yield Corporate Bond ETF | | $ | 83,958 | | | $ | — | | | $ | — | | | $ | — | | | $ | (26 | ) | | $ | 83,932 | | | | 1,705 | | | $ | 4,212 | | | $ | — | |
Goldman Sachs Access Inflation Protected USD Bond ETF | | | — | | | | 448,406 | | | | (30,097 | ) | | | 280 | | | | 35,131 | | | | 453,720 | | | | 7,960 | | | | 3,671 | | | | — | |
Goldman Sachs Access Investment Grade Corporate Bond ETF | | | 2,256,142 | | | | 180,306 | | | | (1,026,376 | ) | | | 85,990 | | | | (25,164 | ) | | | 1,470,898 | | | | 26,517 | | | | 51,146 | | | | — | |
Goldman Sachs ActiveBeta® Emerging Markets Equity ETF | | | 423,878 | | | | — | | | | (140,970 | ) | | | 9,626 | | | | 20,831 | | | | 313,365 | | | | 9,416 | | | | 8,930 | | | | — | |
Goldman Sachs ActiveBeta® International Equity ETF | | | 945,482 | | | | 154,417 | | | | (153,186 | ) | | | 7,849 | | | | 38,412 | | | | 992,974 | | | | 34,683 | | | | 19,621 | | | | — | |
Goldman Sachs ActiveBeta® U.S. Large Cap Equity ETF | | | 1,751,012 | | | | 330,325 | | | | (350,735 | ) | | | 32,232 | | | | 319,878 | | | | 2,082,712 | | | | 29,496 | | | | 30,734 | | | | — | |
Goldman Sachs ActiveBeta® U.S. Small Cap Equity ETF | | | 112,785 | | | | 114,329 | | | | — | | | | — | | | | (7,654 | ) | | | 219,460 | | | | 5,030 | | | | 2,525 | | | | — | |
Goldman Sachs Financial Square Government Fund — Class R6 | | | 144,893 | | | | 1,015,462 | | | | (1,092,617 | ) | | | — | | | | — | | | | 67,738 | | | | 67,738 | | | | 639 | | | | — | |
| | | | | | | | | |
Total | | $ | 5,718,150 | | | $ | 2,243,245 | | | $ | (2,793,981 | ) | | $ | 135,977 | | | $ | 381,408 | | | $ | 5,684,799 | | | | | | | $ | 121,478 | | | $ | — | |
112
GOLDMAN SACHS TARGET DATE PORTFOLIOS
|
| 5. AGREEMENTS AND AFFILIATED TRANSACTIONS (continued) |
| | | | | | | | | | | | | | | | | | | | | | | | | | | | | | | | | | | | |
| |
| Target Date 2030 Portfolio | | | | | |
| Underlying Fund | | Market
Value as of
8/31/2019 | | | Purchases
at Cost | | | Proceeds
from Sales | | | Net
Realized
Gain/(Loss)
| | | Change in
Unrealized
Gain/(Loss) | | | Market
Value as of
8/31/2020 | | | Shares
as of
8/31/2020 | | | Dividend
Income | | | Capital Gain
Distributions | |
Goldman Sachs Access High Yield Corporate Bond ETF | | $ | 56,431 | | | $ | — | | | $ | — | | | $ | 1 | | | $ | (18 | ) | | $ | 56,414 | | | | 1,164 | | | $ | 2,832 | | | $ | — | |
Goldman Sachs Access Inflation Protected USD Bond ETF | | | — | | | | 307,361 | | | | (45,132 | ) | | | 434 | | | | 22,052 | | | | 284,715 | | | | 4,995 | | | | 2,404 | | | | — | |
Goldman Sachs Access Investment Grade Corporate Bond ETF | | | 1,370,390 | | | | 75,031 | | | | (688,416 | ) | | | 65,873 | | | | (32,209 | ) | | | 790,669 | | | | 14,254 | | | | 28,765 | | | | — | |
Goldman Sachs ActiveBeta® Emerging Markets Equity ETF | | | 356,024 | | | | — | | | | (179,097 | ) | | | 10,831 | | | | 12,987 | | | | 200,745 | | | | 6,032 | | | | 6,994 | | | | — | |
Goldman Sachs ActiveBeta® International Equity ETF | | | 803,172 | | | | 69,410 | | | | (207,860 | ) | | | 11,192 | | | | 26,666 | | | | 702,580 | | | | 24,540 | | | | 15,102 | | | | — | |
Goldman Sachs ActiveBeta® U.S. Large Cap Equity ETF | | | 1,513,610 | | | | 237,175 | | | | (494,161 | ) | | | 32,020 | | | | 239,780 | | | | 1,528,424 | | | | 21,646 | | | | 24,996 | | | | — | |
Goldman Sachs ActiveBeta® U.S. Small Cap Equity ETF | | | 67,380 | | | | 30,240 | | | | (19,794 | ) | | | (128 | ) | | | (1,258 | ) | | | 76,440 | | | | 1,752 | | | | 952 | | | | — | |
Goldman Sachs Financial Square Government Fund — Class R6 | | | 148,406 | | | | 731,603 | | | | (805,615 | ) | | | — | | | | — | | | | 74,394 | | | | 74,394 | | | | 917 | | | | — | |
| | | | | | | | | |
Total | | $ | 4,315,413 | | | $ | 1,450,820 | | | $ | (2,440,075 | ) | | $ | 120,223 | | | $ | 268,000 | | | $ | 3,714,381 | | | | | | | $ | 82,962 | | | $ | — | |
| |
| Target Date 2035 Portfolio | | | | | |
| Underlying Fund | | Market
Value as of
8/31/2019 | | | Purchases
at Cost | | | Proceeds
from Sales | | | Net
Realized
Gain/(Loss) | | | Change in
Unrealized
Gain/(Loss) | | | Market
Value as of
8/31/2020 | | | Shares
as of
8/31/2020 | | | Dividend
Income | | | Capital Gain
Distributions | |
Goldman Sachs Access High Yield Corporate Bond ETF | | $ | 82,973 | | | $ | — | | | $ | — | | | $ | — | | | $ | (25 | ) | | $ | 82,948 | | | | 1,685 | | | $ | 4,163 | | | $ | — | |
Goldman Sachs Access Inflation Protected USD Bond ETF | | | — | | | | 443,929 | | | | (60,145 | ) | | | 565 | | | | 32,264 | | | | 416,613 | | | | 7,309 | | | | 3,494 | | | | — | |
Goldman Sachs Access Investment Grade Corporate Bond ETF | | | 1,498,293 | | | | 75,046 | | | | (668,388 | ) | | | 60,095 | | | | (20,503 | ) | | | 944,543 | | | | 17,028 | | | | 34,209 | | | | — | |
Goldman Sachs ActiveBeta® Emerging Markets Equity ETF | | | 553,389 | | | | — | | | | (257,739 | ) | | | 18,937 | | | | 22,107 | | | | 336,694 | | | | 10,117 | | | | 11,108 | | | | — | |
Goldman Sachs ActiveBeta® International Equity ETF | | | 1,260,717 | | | | 145,181 | | | | (255,902 | ) | | | 13,993 | | | | 44,798 | | | | 1,208,787 | | | | 42,221 | | | | 25,601 | | | | — | |
113
GOLDMAN SACHS TARGET DATE PORTFOLIOS
Notes to Financial Statements (continued)
August 31, 2020
|
| 5. AGREEMENTS AND AFFILIATED TRANSACTIONS (continued) |
| | | | | | | | | | | | | | | | | | | | | | | | | | | | | | | | | | | | |
| |
| Target Date 2035 Portfolio (continued) | | | | | |
| Underlying Fund | | Market
Value as of
8/31/2019 | | | Purchases
at Cost | | | Proceeds
from Sales | | | Net
Realized
Gain/(Loss) | | | Change in
Unrealized
Gain/(Loss) | | | Market
Value as of
8/31/2020 | | | Shares
as of
8/31/2020 | | | Dividend
Income | | | Capital Gain
Distributions | |
Goldman Sachs ActiveBeta® U.S. Large Cap Equity ETF | | $ | 2,365,931 | | | $ | 361,250 | | | $ | (522,026 | ) | | $ | 34,147 | | | $ | 420,012 | | | $ | 2,659,314 | | | | 37,662 | | | $ | 41,562 | | | $ | — | |
Goldman Sachs ActiveBeta® U.S. Small Cap Equity ETF | | | 186,590 | | | | — | | | | (92,402 | ) | | | 5,489 | | | | 3,769 | | | | 103,446 | | | | 2,371 | | | | 1,737 | | | | — | |
Goldman Sachs Financial Square Government Fund — Class R6 | | | 115,949 | | | | 593,099 | | | | (661,892 | ) | | | — | | | | — | | | | 47,156 | | | | 47,156 | | | | 735 | | | | — | |
| | | | | | | | | |
Total | | $ | 6,063,842 | | | $ | 1,618,505 | | | $ | (2,518,494 | ) | | $ | 133,226 | | | $ | 502,422 | | | $ | 5,799,501 | | | | | | | $ | 122,609 | | | $ | — | |
| |
| Target Date 2040 Portfolio | | | | | |
| Underlying Fund | | Market
Value as of
8/31/2019 | | | Purchases
at Cost | | | Proceeds
from Sales | | | Net
Realized
Gain/(Loss) | | | Change in
Unrealized
Gain/(Loss) | | | Market
Value as of
8/31/2020 | | | Shares
as of
8/31/2020 | | | Dividend
Income | | | Capital Gain
Distributions | |
Goldman Sachs Access High Yield Corporate Bond ETF | | $ | 193,571 | | | $ | — | | | $ | (89,747 | ) | | $ | 4,019 | | | $ | (3,186 | ) | | $ | 104,657 | | | | 2,126 | | | $ | 6,442 | | | $ | — | |
Goldman Sachs Access Inflation Protected USD Bond ETF | | | — | | | | 251,207 | | | | — | | | | — | | | | 21,082 | | | | 272,289 | | | | 4,777 | | | | 2,134 | | | | — | |
Goldman Sachs Access Investment Grade Corporate Bond ETF | | | 789,374 | | | | 30,059 | | | | (247,985 | ) | | | 21,722 | | | | 4,464 | | | | 597,634 | | | | 10,774 | | | | 19,638 | | | | — | |
Goldman Sachs ActiveBeta® Emerging Markets Equity ETF | | | 668,576 | | | | — | | | | (254,126 | ) | | | 16,998 | | | | 30,479 | | | | 461,927 | | | | 13,880 | | | | 13,867 | | | | — | |
Goldman Sachs ActiveBeta® International Equity ETF | | | 1,537,906 | | | | 169,038 | | | | (237,866 | ) | | | 7,000 | | | | 59,320 | | | | 1,535,398 | | | | 53,629 | | | | 31,760 | | | | — | |
Goldman Sachs ActiveBeta® U.S. Large Cap Equity ETF | | | 2,936,724 | | | | 361,753 | | | | (1,213,244 | ) | | | 80,218 | | | | 362,387 | | | | 2,527,838 | | | | 35,800 | | | | 51,741 | | | | — | |
Goldman Sachs ActiveBeta® U.S. Small Cap Equity ETF | | | 223,600 | | | | 48,299 | | | | (39,545 | ) | | | (255 | ) | | | 7,691 | | | | 239,790 | | | | 5,496 | | | | 2,815 | | | | — | |
Goldman Sachs MarketBeta US Equity ETF | | | — | | | | 711,678 | | | | — | | | | — | | | | 117,871 | | | | 829,549 | | | | 17,037 | | | | — | | | | — | |
Goldman Sachs Financial Square Government Fund — Class R6 | | | 191,592 | | | | 594,442 | | | | (786,034 | ) | | | — | | | | — | | | | — | | | | — | | | | 1,281 | | | | — | |
| | | | | | | | | |
Total | | $ | 6,541,343 | | | $ | 2,166,476 | | | $ | (2,868,547 | ) | | $ | 129,702 | | | $ | 600,108 | | | $ | 6,569,082 | | | | | | | $ | 129,678 | | | $ | — | |
114
GOLDMAN SACHS TARGET DATE PORTFOLIOS
|
| 5. AGREEMENTS AND AFFILIATED TRANSACTIONS (continued) |
| | | | | | | | | | | | | | | | | | | | | | | | | | | | | | | | | | | | |
| |
| Target Date 2045 Portfolio | | | | | |
| Underlying Fund | | Market
Value as of
8/31/2019 | | | Purchases
at Cost | | | Proceeds
from Sales | | | Net
Realized
Gain/(Loss) | | | Change in
Unrealized
Gain/(Loss) | | | Market
Value as of
8/31/2020 | | | Shares
as of
8/31/2020 | | | Dividend
Income | | | Capital Gain
Distributions | |
Goldman Sachs Access High Yield Corporate Bond ETF | | $ | 290,381 | | | $ | — | | | $ | (145,078 | ) | | $ | 6,725 | | | $ | (4,839 | ) | | $ | 147,189 | | | | 2,990 | | | $ | 9,810 | | | $ | — | |
Goldman Sachs Access Inflation Protected USD Bond ETF | | | — | | | | 22,267 | | | | — | | | | — | | | | 704 | | | | 22,971 | | | | 403 | | | | — | | | | — | |
Goldman Sachs Access Investment Grade Corporate Bond ETF | | | — | | | | 54,143 | | | | — | | | | — | | | | 2,769 | | | | 56,912 | | | | 1,026 | | | | 372 | | | | — | |
Goldman Sachs ActiveBeta® Emerging Markets Equity ETF | | | 793,323 | | | | 23,800 | | | | (266,820 | ) | | | 17,210 | | | | 42,642 | | | | 610,155 | | | | 18,334 | | | | 17,390 | | | | — | |
Goldman Sachs ActiveBeta® International Equity ETF | | | 1,814,152 | | | | 183,161 | | | | (289,125 | ) | | | 536 | | | | 65,792 | | | | 1,774,516 | | | | 61,981 | | | | 38,270 | | | | — | |
Goldman Sachs ActiveBeta® U.S. Large Cap Equity ETF | | | 3,354,940 | | | | 131,211 | | | | (1,209,093 | ) | | | 105,766 | | | | 389,042 | | | | 2,771,866 | | | | 39,256 | | | | 55,580 | | | | — | |
Goldman Sachs ActiveBeta® U.S. Small Cap Equity ETF | | | 332,615 | | | | 46,397 | | | | (94,127 | ) | | | 4,630 | | | | 13,190 | | | | 302,705 | | | | 6,938 | | | | 3,828 | | | | — | |
Goldman Sachs MarketBeta US Equity ETF | | | — | | | | 838,959 | | | | — | | | | — | | | | 138,951 | | | | 977,910 | | | | 20,084 | | | | — | | | | — | |
Goldman Sachs Financial Square Government Fund — Class R6 | | | 319,827 | | | | 1,747,004 | | | | (1,982,758 | ) | | | — | | | | — | | | | 84,073 | | | | 84,073 | | | | 3,700 | | | | — | |
| | | | | | | | | |
Total | | $ | 6,905,238 | | | $ | 3,046,942 | | | $ | (3,987,001 | ) | | $ | 134,867 | | | $ | 648,251 | | | $ | 6,748,297 | | | | | | | $ | 128,950 | | | $ | — | |
| |
| Target Date 2050 Portfolio | | | | | |
| Underlying Fund | | Market
Value as of
8/31/2019 | | | Purchases
at Cost | | | Proceeds
from Sales | | | Net
Realized
Gain/(Loss) | | | Change in
Unrealized
Gain/(Loss) | | | Market
Value as of
8/31/2020 | | | Shares
as of
8/31/2020 | | | Dividend
Income | | | Capital Gain
Distributions | |
Goldman Sachs Access High Yield Corporate Bond ETF | | $ | 269,798 | | | $ | — | | | $ | (136,295 | ) | | $ | 6,314 | | | | (4,541 | ) | | $ | 135,276 | | | | 2,748 | | | $ | 9,065 | | | $ | — | |
Goldman Sachs ActiveBeta® Emerging Markets Equity ETF | | | 710,771 | | | | 42,845 | | | | (245,602 | ) | | | 17,459 | | | | 39,688 | | | | 565,161 | | | | 16,982 | | | | 15,813 | | | | — | |
Goldman Sachs ActiveBeta® International Equity ETF | | | 1,632,326 | | | | 264,182 | | | | (300,351 | ) | | | 5,745 | | | | 53,456 | | | | 1,655,358 | | | | 57,819 | | | | 35,241 | | | | — | |
Goldman Sachs ActiveBeta® U.S. Large Cap Equity ETF | | | 2,994,672 | | | | 260,385 | | | | (1,177,183 | ) | | | 109,376 | | | | 365,655 | | | | 2,552,905 | | | | 36,155 | | | | 50,402 | | | | — | |
115
GOLDMAN SACHS TARGET DATE PORTFOLIOS
Notes to Financial Statements (continued)
August 31, 2020
|
| 5. AGREEMENTS AND AFFILIATED TRANSACTIONS (continued) |
| | | | | | | | | | | | | | | | | | | | | | | | | | | | | | | | | | | | |
| |
| Target Date 2050 Portfolio (continued) | | | | | |
| Underlying Fund | | Market
Value as of
8/31/2019 | | | Purchases
at Cost | | | Proceeds
from Sales | | | Net
Realized
Gain/(Loss) | | | Change in
Unrealized
Gain/(Loss) | | | Market
Value as of
8/31/2020 | | | Shares
as of
8/31/2020 | | | Dividend
Income | | | Capital Gain
Distributions | |
Goldman Sachs ActiveBeta® U.S. Small Cap Equity ETF | | $ | 288,238 | | | $ | 39,976 | | | $ | (69,362 | ) | | $ | 2,853 | | | $ | 2,256 | | | $ | 263,961 | | | | 6,050 | | | $ | 3,456 | | | $ | — | |
Goldman Sachs MarketBeta US Equity ETF | | | — | | | | 778,806 | | | | — | | | | — | | | | 128,989 | | | | 907,795 | | | | 18,644 | | | | — | | | | — | |
Goldman Sachs Financial Square Government Fund — Class R6 | | | 326,573 | | | | 2,038,562 | | | | (2,257,711 | ) | | | — | | | | — | | | | 107,424 | | | | 107,424 | | | | 3,874 | | | | — | |
| | | | | | | | | |
Total | | $ | 6,222,378 | | | $ | 3,424,756 | | | $ | (4,186,504 | ) | | $ | 141,747 | | | $ | 585,503 | | | $ | 6,187,880 | | | | | | | $ | 117,851 | | | $ | — | |
| |
| Target Date 2055 Portfolio | | | | | |
| Underlying Fund | | Market
Value as of
8/31/2019 | | | Purchases
at Cost | | | Proceeds
from Sales | | | Net
Realized
Gain/(Loss)
| | | Change in
Unrealized
Gain/(Loss) | | | Market
Value as of
8/31/2020 | | | Shares
as of
8/31/2020 | | | Dividend
Income | | | Capital Gain
Distributions | |
Goldman Sachs Access High Yield Corporate Bond ETF | | $ | 284,768 | | | $ | — | | | $ | (148,973 | ) | | $ | 6,325 | | | $ | (4,383 | ) | | $ | 137,737 | | | | 2,798 | | | $ | 9,401 | | | $ | — | |
Goldman Sachs ActiveBeta® Emerging Markets Equity ETF | | | 735,869 | | | | 34,219 | | | | (227,393 | ) | | | 15,146 | | | | 43,562 | | | | 601,403 | | | | 18,071 | | | | 16,333 | | | | — | |
Goldman Sachs ActiveBeta® International Equity ETF | | | 1,692,168 | | | | 198,715 | | | | (220,262 | ) | | | (2,165 | ) | | | 68,841 | | | | 1,737,297 | | | | 60,681 | | | | 36,465 | | | | — | |
Goldman Sachs ActiveBeta® U.S. Large Cap Equity ETF | | | 3,105,428 | | | | 175,683 | | | | (1,093,496 | ) | | | 87,180 | | | | 380,212 | | | | 2,655,007 | | | | 37,601 | | | | 52,234 | | | | — | |
Goldman Sachs ActiveBeta® U.S. Small Cap Equity ETF | | | 296,634 | | | | 15,060 | | | | (18,794 | ) | | | (122 | ) | | | 10,058 | | | | 302,836 | | | | 6,941 | | | | 3,693 | | | | — | |
Goldman Sachs MarketBeta US Equity ETF | | | — | | | | 816,318 | | | | — | | | | — | | | | 135,201 | | | | 951,519 | | | | 19,542 | | | | — | | | | — | |
Goldman Sachs Financial Square Government Fund — Class R6 | | | 306,031 | | | | 1,741,529 | | | | (1,926,850 | ) | | | — | | | | — | | | | 120,710 | | | | 120,710 | | | | 3,461 | | | | — | |
| | | | | | | | | |
Total | | $ | 6,420,898 | | | $ | 2,981,524 | | | $ | (3,635,768 | ) | | $ | 106,364 | | | $ | 633,491 | | | $ | 6,506,509 | | | | | | | $ | 121,587 | | | $ | — | |
116
GOLDMAN SACHS TARGET DATE PORTFOLIOS
|
| 5. AGREEMENTS AND AFFILIATED TRANSACTIONS (continued) |
| | | | | | | | | | | | | | | | | | | | | | | | | | | | | | | | | | | | |
| |
| Target Date 2060 Portfolio | | | | | |
| Underlying Fund | | Market
Value as of
8/31/2019 | | | Purchases
at Cost | | | Proceeds
from Sales | | | Net
Realized
Gain/(Loss)
| | | Change in
Unrealized
Gain/
(Loss) | | | Market
Value as of
8/31/2020 | | | Shares
as of
8/31/2020 | | | Dividend
Income | | | Capital Gain
Distributions | |
Goldman Sachs Access High Yield Corporate Bond ETF | | $ | 292,696 | | | $ | — | | | $ | (148,723 | ) | | $ | 6,757 | | | $ | (4,821 | ) | | $ | 145,909 | | | | 2,964 | | | $ | 9,807 | | | $ | — | |
Goldman Sachs ActiveBeta® Emerging Markets Equity ETF | | | 742,689 | | | | 23,800 | | | | (163,328 | ) | | | 14,183 | | | | 45,261 | | | | 662,605 | | | | 19,910 | | | | 17,027 | | | | — | |
Goldman Sachs ActiveBeta® International Equity ETF | | | 1,710,386 | | | | 225,269 | | | | — | | | | — | | | | 69,676 | | | | 2,005,331 | | | | 70,043 | | | | 39,856 | | | | — | |
Goldman Sachs ActiveBeta® U.S. Large Cap Equity ETF | | | 3,176,017 | | | | 101,953 | | | | (612,064 | ) | | | 20,656 | | | | 488,699 | | | | 3,175,261 | | | | 44,969 | | | | 57,289 | | | | — | |
Goldman Sachs ActiveBeta® U.S. Small Cap Equity ETF | | | 317,794 | | | | 27,815 | | | | — | | | | — | | | | 9,757 | | | | 355,366 | | | | 8,145 | | | | 4,185 | | | | — | |
Goldman Sachs MarketBeta US Equity ETF | | | — | | | | 945,939 | | | | — | | | | — | | | | 156,670 | | | | 1,102,609 | | | | 22,645 | | | | — | | | | — | |
Goldman Sachs Financial Square Government Fund — Class R6 | | | 319,090 | | | | 1,078,269 | | | | (1,260,861 | ) | | | — | | | | — | | | | 136,498 | | | | 136,498 | | | | 4,004 | | | | — | |
| | | | | | | | | |
Total | | $ | 6,558,672 | | | $ | 2,403,045 | | | $ | (2,184,976 | ) | | $ | 41,596 | | | $ | 765,242 | | | $ | 7,583,579 | | | | | | | $ | 132,168 | | | $ | — | |
As of August 31, 2020, The Goldman Sachs Group, Inc. was the beneficial owner of 5% or more of total outstanding shares of the following Portfolios:
| | | | | | | | | | | | | | | | | | | | | | | | | | |
| Portfolio | | | | Class A | | | Institutional | | | Service | | | Investor | | | Class R6 | | | Class R | |
Target Date Retirement Portfolio | | | | | 8 | % | | | 100 | % | | | 100 | % | | | — | % | | | 90 | % | | | 100 | % |
Target Date 2025 | | | | | 5 | | | | 100 | | | | 100 | | | | 36 | | | | — | | | | 100 | |
Target Date 2030 | | | | | — | | | | 84 | | | | 100 | | | | — | | | | 86 | | | | 100 | |
Target Date 2035 | | | | | — | | | | 100 | | | | 100 | | | | 32 | | | | — | | | | 100 | |
Target Date 2040 | | | | | 15 | | | | 98 | | | | 100 | | | | 6 | | | | 96 | | | | 100 | |
Target Date 2045 | | | | | 6 | | | | 100 | | | | 100 | | | | 7 | | | | — | | | | 100 | |
Target Date 2050 | | | | | — | | | | 67 | | | | 100 | | | | 10 | | | | 98 | | | | 100 | |
Target Date 2055 | | | | | 7 | | | | 100 | | | | 100 | | | | 5 | | | | 41 | | | | 100 | |
Target Date 2060 | | | | | 27 | | | | 100 | | | | 100 | | | | 100 | | | | 100 | | | | 100 | |
117
GOLDMAN SACHS TARGET DATE PORTFOLIOS
Notes to Financial Statements (continued)
August 31, 2020
|
| 6. PORTFOLIO SECURITIES TRANSACTIONS |
The cost of purchases and proceeds from sales and maturities of long-term securities for the fiscal year ended August 31, 2020, were:
| | | | | | | | | | |
| Portfolio | | | | Purchases | | | Sales and Maturities | |
Target Date Retirement | | | | $ | 3,129,996 | | | $ | 3,544,106 | |
Target Date 2025 | | | | | 3,010,019 | | | | 3,300,382 | |
Target Date 2030 | | | | | 1,593,104 | | | | 2,675,607 | |
Target Date 2035 | | | | | 1,835,806 | | | | 2,813,986 | |
Target Date 2040 | | | | | 2,098,642 | | | | 2,739,782 | |
Target Date 2045 | | | | | 1,593,028 | | | | 2,380,923 | |
Target Date 2050 | | | | | 1,640,099 | | | | 2,260,918 | |
Target Date 2055 | | | | | 1,497,603 | | | | 2,030,602 | |
Target Date 2060 | | | | | 1,622,388 | | | | 1,188,749 | |
The tax character of distributions paid during the period ended August 31, 2020 was as follows:
| | | | | | | | | | | | | | | | | | | | | | | | | | | | | | | | | | | | |
| | | Target
Date Retirement | | | Target
Date 2025 | | | Target
Date 2030 | | | Target
Date 2035 | | | Target
Date 2040 | | | Target
Date 2045 | | | Target
Date 2050 | | | Target
Date 2055 | | | Target
Date 2060 | |
Distribution paid from: | | | | | | | | | | | | | | | | | | | | | | | | | | | | | | | | | | | | |
Ordinary income | | $ | 180,001 | | | $ | 177,960 | | | $ | 128,304 | | | $ | 177,862 | | | $ | 179,718 | | | $ | 185,523 | | | $ | 151,795 | | | $ | 173,944 | | | $ | 184,028 | |
Net long-term capital gains | | | 114,853 | | | | 257,693 | | | | 763,071 | | | | 497,818 | | | | 1,037,947 | | | | 648,859 | | | | 973,358 | | | | 774,850 | | | | — | |
Total taxable distributions | | $ | 294,854 | | | $ | 435,653 | | | $ | 891,375 | | | $ | 675,680 | | | $ | 1,217,665 | | | $ | 834,382 | | | $ | 1,125,153 | | | $ | 948,794 | | | $ | 184,028 | |
The tax character of distributions paid during the fiscal year ended August 31, 2019 was as follows:
| | | | | | | | | | | | | | | | | | | | | | | | | | | | | | | | | | | | |
| | | Target
Date Retirement | | | Target
Date 2025 | | | Target
Date 2030 | | | Target
Date 2035 | | | Target
Date 2040 | | | Target
Date 2045 | | | Target
Date 2050 | | | Target
Date 2055 | | | Target
Date 2060 | |
Distribution paid from: | | | | | | | | | | | | | | | | | | | | | | | | | | | | | | | | | | | | |
Ordinary income | | $ | 950,269 | | | $ | 288,673 | | | $ | 1,417,635 | | | $ | 290,726 | | | $ | 1,088,799 | | | $ | 315,691 | | | $ | 737,758 | | | $ | 337,053 | | | $ | 108,202 | |
Net long-term capital gains | | | 1,328,212 | | | | 197,615 | | | | 2,748,411 | | | | 306,924 | | | | 2,207,945 | | | | 386,613 | | | | 1,103,459 | | | | 467,953 | | | | — | |
Total taxable distributions | | $ | 2,278,481 | | | $ | 486,288 | | | $ | 4,166,046 | | | $ | 597,650 | | | $ | 3,296,744 | | | $ | 702,304 | | | $ | 1,841,217 | | | $ | 805,006 | | | $ | 108,202 | |
118
GOLDMAN SACHS TARGET DATE PORTFOLIOS
|
| 7. TAX INFORMATION (continued) |
As of August 31, 2020, the components of accumulated earnings (losses) on a tax basis were as follows:
| | | | | | | | | | | | | | | | | | | | | | | | | | | | | | | | | | | | |
| | | Target
Date Retirement | | | Target
Date 2025 | | | Target
Date 2030 | | | Target
Date 2035 | | | Target
Date 2040 | | | Target
Date 2045 | | | Target
Date 2050 | | | Target
Date 2055 | | | Target
Date 2060 | |
Undistributed ordinary income — net | | $ | 45,570 | | | $ | 81,660 | | | $ | 41,415 | | | $ | 65,900 | | | $ | 63,107 | | | $ | 59,797 | | | $ | 51,951 | | | $ | 57,147 | | | $ | 66,939 | |
Undistributed long-term capital gains | | | 259,639 | | | | 101,506 | | | | 19,395 | | | | 28,880 | | | | 108,095 | | | | — | | | | 130,674 | | | | — | | | | 48,754 | |
Total undistributed earnings | | $ | 305,209 | | | $ | 183,166 | | | $ | 60,810 | | | $ | 94,780 | | | $ | 171,202 | | | $ | 59,797 | | | $ | 182,625 | | | $ | 57,147 | | | $ | 115,693 | |
Capital loss carryforwards: | | | | | | | | | | | | | | | | | | | | | | | | | | | | | | | | | | | | |
Perpetual Short-Term | | | — | | | | — | | | | — | | | | — | | | | — | | | | (16,851 | ) | | | — | | | | (93,043 | ) | | | — | |
Timing differences (Post October Capital Loss Deferral) | | $ | — | | | $ | — | | | $ | — | | | $ | — | | | $ | — | | | $ | — | | | $ | — | | | $ | — | | | $ | (4,548 | ) |
Unrealized gains (losses) — net | | | 791,485 | | | | 915,787 | | | | 613,915 | | | | 957,790 | | | | 1,033,814 | | | | 1,013,510 | | | | 906,929 | | | | 959,326 | | | | 1,096,974 | |
Total accumulated earnings (losses) net | | $ | 1,096,694 | | | $ | 1,098,953 | | | $ | 674,725 | | | $ | 1,052,570 | | | $ | 1,205,016 | | | $ | 1,056,456 | | | $ | 1,089,554 | | | $ | 923,430 | | | $ | 1,208,119 | |
As of August 31, 2020, the Portfolios’ aggregate security unrealized gains and losses based on cost for U.S. federal income tax purposes were as follows:
| | | | | | | | | | | | | | | | | | | | | | | | | | | | | | | | | | | | |
| | | Target
Date Retirement | | | Target
Date 2025 | | | Target
Date 2030 | | | Target
Date 2035 | | | Target
Date 2040 | | | Target
Date 2045 | | | Target
Date 2050 | | | Target
Date 2055 | | | Target
Date 2060 | |
Tax Cost | | $ | 6,643,017 | | | $ | 7,030,074 | | | $ | 4,210,806 | | | $ | 6,089,646 | | | $ | 6,624,780 | | | $ | 6,651,723 | | | $ | 6,102,872 | | | $ | 6,416,567 | | | $ | 7,437,349 | |
Gross unrealized gain | | | 816,084 | | | | 941,982 | | | | 627,371 | | | | 973,017 | | | | 1,049,108 | | | | 1,029,831 | | | | 926,516 | | | | 975,529 | | | | 1,114,119 | |
Gross unrealized loss | | | (24,599 | ) | | | (26,195 | ) | | | (13,456 | ) | | | (15,227 | ) | | | (15,294 | ) | | | (16,321 | ) | | | (19,587 | ) | | | (16,203 | ) | | | (17,145 | ) |
Net unrealized gains (losses) | | $ | 791,485 | | | $ | 915,787 | | | $ | 613,915 | | | $ | 957,790 | | | $ | 1,033,814 | | | $ | 1,013,510 | | | $ | 906,929 | | | $ | 959,326 | | | $ | 1,096,974 | |
The difference between GAAP-basis and tax basis unrealized gains (losses) is attributable primarily to wash sales and net mark to market gains/(losses) on regulated futures.
GSAM has reviewed the Portfolios’ tax positions for all open tax years (the current and prior three years, as applicable) and has concluded that no provision for income tax is required in the Portfolios’ financial statements. Such open tax years remain subject to examination and adjustment by tax authorities.
The Portfolios’ risks include, but are not limited to, the following:
Derivatives Risk — The Portfolios’ use of derivatives may result in loss. Derivative instruments, which may pose risks in
addition to and greater than those associated with investing directly in securities, currencies or other instruments, may be illiquid or less liquid, volatile, difficult to price and leveraged so that small changes in the value of the underlying instruments may produce disproportionate losses to the Portfolios. Derivatives are also subject to counterparty risk, which is the risk that the other party in the transaction will not fulfill its contractual obligation. The use of derivatives is a highly specialized activity that involves
119
GOLDMAN SACHS TARGET DATE PORTFOLIOS
Notes to Financial Statements (continued)
August 31, 2020
|
| 8. OTHER RISKS (continued) |
investment techniques and risks different from those associated with investments in more traditional securities and instruments. Losses from derivatives can also result from a lack of correlation between changes in the value of derivative instruments and the portfolio assets (if any) being hedged.
Dividend-Paying Investments Risk — A Portfolio’s investments in dividend-paying securities could cause a Portfolio to underperform other portfolios. Securities that pay dividends, as a group, can fall out of favor with the market, causing such securities to underperform securities that do not pay dividends. Depending upon market conditions and political and legislative responses to such conditions, dividend-paying securities that meet a Portfolio’s investment criteria may not be widely available and/or may be highly concentrated in only a few market sectors. In addition, issuers that have paid regular dividends or distributions to shareholders may not continue to do so at the same level or at all in the future. This may limit the ability of a Portfolio to produce current income.
Foreign and Emerging Countries Risk — Investing in foreign markets may involve special risks and considerations not typically associated with investing in the United States. Foreign securities may be subject to risk of loss because of more or less foreign government regulation, less public information and less economic, political and social stability in the countries in which the Portfolio invests. The imposition of exchange controls (including repatriation restrictions), confiscation of assets and property, trade restrictions (including tariffs) and other government restrictions by the United States or other governments, or from problems in share registration, settlement or custody, may also result in losses. Foreign risk also involves the risk of negative foreign currency rate fluctuations, which may cause the value of securities denominated in such foreign currency (or other instruments through which a Portfolio has exposure to foreign currencies) to decline in value. Currency exchange rates may fluctuate significantly over short periods of time. To the extent that the Portfolios also invest in securities of issuers located in emerging markets, these risks may be more pronounced.
Investments in Other Investment Companies Risk — As a shareholder of another investment company, including an ETF, a Portfolio will indirectly bear its proportionate share of any net management fees and other expenses paid by such other investment companies, in addition to the fees and expenses regularly borne by the Portfolio. ETFs are subject to risks that do not apply to conventional mutual funds, including but not limited to the following: (i) the market price of the ETF’s shares may trade at a premium or a discount to their NAV; and (ii) an active trading market for an ETF’s shares may not develop or be maintained.
Large Shareholder Transactions Risk — A Portfolio or an Underlying Fund may experience adverse effects when certain large shareholders, such as other funds, institutional investors (including those trading by use of non-discretionary mathematical formulas), financial intermediaries (who may make investment decisions on behalf of underlying clients and/or include a Portfolio or an Underlying Fund in their investment model), individuals, accounts and Goldman Sachs affiliates, purchase or redeem large amounts of shares of a Portfolio or an Underlying Fund. Such large shareholder redemptions, which may occur rapidly or unexpectedly, may cause a Portfolio or an Underlying Fund to sell portfolio securities at times when it would not otherwise do so, which may negatively impact a Portfolio’s or the Underlying Fund’s NAV and liquidity. These transactions may also accelerate the realization of taxable income to shareholders if such sales of investments resulted in gains, and may also increase transaction costs. In addition, a large redemption could result in a Portfolio’s or an Underlying Fund’s current expenses being allocated over a smaller asset base, leading to an increase in the expense ratio of the Portfolio or the Underlying Fund. Similarly, large Portfolio or Underlying Fund share purchases may adversely affect a Portfolio’s or an Underlying Fund’s performance to the extent that the Portfolio or the Underlying Fund is delayed in investing new cash or otherwise maintains a larger cash position than it ordinarily would.
Liquidity Risk — A Portfolio or Underlying Fund may make investments that are illiquid or that may become less liquid in response to market developments or adverse investor perceptions. Illiquid investments may be more difficult to value. Liquidity risk may also refer to the risk that a Portfolio or Underlying Fund will not be able to pay redemption proceeds within the allowable time period or without significant dilution to remaining investors’ interests because of unusual market conditions, an unusually high volume of redemption requests, or other reasons. To meet redemption requests, a Portfolio or Underlying Fund may be forced to sell investments at an unfavorable time and/or under unfavorable conditions. If a Portfolio or Underlying Fund is forced to sell
120
GOLDMAN SACHS TARGET DATE PORTFOLIOS
|
| 8. OTHER RISKS (continued) |
securities at an unfavorable time and/or under unfavorable conditions, such sales may adversely affect the Portfolio’s or Underlying Fund’s NAV and dilute remaining investors’ interests. These risks may be more pronounced in connection with a Portfolios’ or Underlying Fund’s investments in securities of issuers located in emerging market countries. Redemptions by large shareholders may have a negative impact on a Portfolio’s liquidity.
Market and Credit Risks — In the normal course of business, a Portfolio trades financial instruments and enters into financial transactions where risk of potential loss exists due to changes in the market (market risk). The value of the securities in which a Portfolio or Underlying Fund invests may go up or down in response to the prospects of individual companies, particular sectors or governments and/or general economic conditions throughout the world due to increasingly interconnected global economies and financial markets. Events such as war, acts of terrorism, social unrest, natural disasters, the spread of infectious illness or other public health threats could also significantly impact a Portfolio or Underlying Fund and its investments. Additionally, a Portfolio may also be exposed to credit risk in the event that an issuer or guarantor fails to perform or that an institution or entity with which the Portfolio has unsettled or open transactions defaults.
Under the Trust’s organizational documents, its Trustees, officers, employees and agents are indemnified, to the extent permitted by the Act and state law, against certain liabilities that may arise out of performance of their duties to the Portfolios. Additionally, in the course of business, the Portfolios enter into contracts that contain a variety of indemnification clauses. The Portfolios’ maximum exposure under these arrangements is unknown, as this would involve future claims that may be made against the Portfolios that have not yet occurred. However, GSAM believes the risk of loss under these arrangements to be remote.
Subsequent events after the Statements of Assets and Liabilities date have been evaluated, and GSAM has concluded that there is no impact requiring adjustment or disclosure in the financial statements.
121
GOLDMAN SACHS TARGET DATE PORTFOLIOS
Notes to Financial Statements (continued)
August 31, 2020
|
| 11. SUMMARY OF SHARE TRANSACTIONS |
Share activity is as follows:
| | | | | | | | | | | | | | | | |
| | | Target Date Retirement Portfolio | |
| | | | |
| | | For the Fiscal Year Ended
August 31, 2020 | | | For the Fiscal Year Ended
August 31, 2019 | |
| | | | |
| | | Shares | | | Dollars | | | Shares | | | Dollars | |
| | | | |
| Class A Shares | | | | | | | | | | | | | | | | |
Shares sold | | | 12,735 | | | $ | 112,733 | | | | 5,665 | | | $ | 52,126 | |
Reinvestment of distributions | | | 120 | | | | 1,140 | | | | 387 | | | | 3,345 | |
Shares redeemed | | | (3,858 | ) | | | (36,861 | ) | | | (5,157 | ) | | | (47,388 | ) |
| | | | 8,997 | | | | 77,012 | | | | 895 | | | | 8,083 | |
| Institutional Shares | | | | | | | | | | | | | | | | |
Shares sold | | | — | | | | — | | | | 1 | | | | 6 | |
Reinvestment of distributions | | | 50 | | | | 478 | | | | 82 | | | | 710 | |
Shares redeemed | | | — | | | | — | | | | (1 | ) | | | (6 | ) |
| | | | 50 | | | | 478 | | | | 82 | | | | 710 | |
| Service Shares | | | | | | | | | | | | | | | | |
Reinvestment of distributions | | | 43 | | | | 415 | | | | 75 | | | | 650 | |
| | | | 43 | | | | 415 | | | | 75 | | | | 650 | |
| Investor Shares | | | | | | | | | | | | | | | | |
Shares sold | | | 9,601 | | | | 91,552 | | | | 26,298 | | | | 236,944 | |
Reinvestment of distributions | | | 4,935 | | | | 47,136 | | | | 6,941 | | | | 60,097 | |
Shares redeemed | | | (88,118 | ) | | | (850,671 | ) | | | (4,441 | ) | | | (40,896 | ) |
| | | | (73,582 | ) | | | (711,983 | ) | | | 28,798 | | | | 256,145 | |
| Class R6 Shares | | | | | | | | | | | | | | | | |
Shares sold | | | 34,789 | | | | 335,273 | | | | 631,989 | | | | 5,774,200 | |
Reinvestment of distributions | | | 25,608 | | | | 245,286 | | | | 253,020 | | | | 2,212,945 | |
Shares redeemed in connection with in-kind transactions | | | — | | | | — | | | | (4,478,217 | ) | | | (39,184,399 | ) |
Shares redeemed | | | (30,454 | ) | | | (268,818 | ) | | | (525,143 | ) | | | (4,763,501 | ) |
| | | | 29,943 | | | | 311,741 | | | | (4,118,351 | ) | | | (35,960,755 | ) |
| Class R Shares | | | | | | | | | | | | | | | | |
Shares sold | | | — | | | | — | | | | 17 | | | | 152 | |
Reinvestment of distributions | | | 41 | | | | 399 | | | | 85 | | | | 734 | |
Shares redeemed | | | — | | | | — | | | | (193 | ) | | | (1,645 | ) |
| | | | 41 | | | | 399 | | | | (91 | ) | | | (759 | ) |
| | | | |
NET DECREASE | | | (34,508 | ) | | $ | (321,938 | ) | | | (4,088,592 | ) | | $ | (35,695,926 | ) |
122
GOLDMAN SACHS TARGET DATE PORTFOLIOS
|
| 11. SUMMARY OF SHARE TRANSACTIONS (continued) |
Share activity is as follows:
| | | | | | | | | | | | | | | | |
| | | Target Date 2025 Portfolio | |
| | | | |
| | | For the Fiscal Year Ended
August 31, 2020 | | | For the Fiscal Year Ended
August 31, 2019 | |
| | | | |
| | | Shares | | | Dollars | | | Shares | | | Dollars | |
| | | | |
| Class A Shares | | | | | | | | | | | | | | | | |
Shares sold | | | 4,214 | | | $ | 45,409 | | | | 24,695 | | | $ | 252,106 | |
Reinvestment of distributions | | | 1,138 | | | | 12,240 | | | | 1,080 | | | | 10,582 | |
Shares redeemed | | | (20,838 | ) | | | (225,805 | ) | | | (1,588 | ) | | | (16,684 | ) |
| | | | (15,486 | ) | | | (168,156 | ) | | | 24,187 | | | | 246,004 | |
| Institutional Shares | | | | | | | | | | | | | | | | |
Shares sold | | | — | | | | — | | | | 7 | | | | 73 | |
Reinvestment of distributions | | | 36,011 | | | | 387,364 | | | | 44,071 | | | | 431,780 | |
Shares redeemed | | | — | | | | — | | | | (414,292 | ) | | | (4,350,073 | ) |
| | | | 36,011 | | | | 387,364 | | | | (370,214 | ) | | | (3,918,220 | ) |
| Service Shares | | | | | | | | | | | | | | | | |
Reinvestment of distributions | | | 61 | | | | 652 | | | | 76 | | | | 744 | |
| | | | 61 | | | | 652 | | | | 76 | | | | 744 | |
| Investor Shares | | | | | | | | | | | | | | | | |
Shares sold | | | 6,585 | | | | 71,764 | | | | 17,049 | | | | 177,631 | |
Reinvestment of distributions | | | 3,175 | | | | 34,076 | | | | 3,004 | | | | 29,361 | |
Shares redeemed | | | (60,684 | ) | | | (658,106 | ) | | | (16 | ) | | | (164 | ) |
| | | | (50,924 | ) | | | (552,266 | ) | | | 20,037 | | | | 206,828 | |
| Class R6 Shares | | | | | | | | | | | | | | | | |
Shares sold | | | 48,045 | | | | 521,462 | | | | 10,767 | | | | 111,836 | |
Reinvestment of distributions | | | 63 | | | | 688 | | | | 1,338 | | | | 13,097 | |
Shares redeemed | | | (28,883 | ) | | | (308,640 | ) | | | (5,744 | ) | | | (61,150 | ) |
| | | | 19,225 | | | | 213,510 | | | | 6,361 | | | | 63,783 | |
| Class R Shares | | | | | | | | | | | | | | | | |
Shares sold | | | — | | | | — | | | | 533 | | | | 5,758 | |
Reinvestment of distributions | | | 59 | | | | 633 | | | | 74 | | | | 724 | |
Shares redeemed | | | — | | | | — | | | | (533 | ) | | | (5,614 | ) |
| | | | 59 | | | | 633 | | | | 74 | | | | 868 | |
| | | | |
NET DECREASE | | | (11,054 | ) | | $ | (118,263 | ) | | | (319,479 | ) | | $ | (3,399,993 | ) |
123
GOLDMAN SACHS TARGET DATE PORTFOLIOS
Notes to Financial Statements (continued)
August 31, 2020
|
| 11. SUMMARY OF SHARE TRANSACTIONS (continued) |
Share activity is as follows:
| | | | | | | | | | | | | | | | |
| | | Target Date 2030 Portfolio | |
| | | | |
| | | For the Fiscal Year Ended
August 31, 2020 | | | For the Fiscal Year Ended
August 31, 2019 | |
| | | | |
| | | Shares | | | Dollars | | | Shares | | | Dollars | |
| | | | |
| Class A Shares | | | | | | | | | | | | | | | | |
Shares sold | | | 13,639 | | | $ | 122,108 | | | | 13,649 | | | $ | 120,996 | |
Reinvestment of distributions | | | 4,154 | | | | 34,879 | | | | 2,283 | | | | 20,039 | |
Shares redeemed | | | (7,639 | ) | | | (73,291 | ) | | | (31,881 | ) | | | (280,844 | ) |
| | | | 10,154 | | | | 83,696 | | | | (15,949 | ) | | | (139,809 | ) |
| Institutional Shares | | | | | | | | | | | | | | | | |
Shares sold | | | 70 | | | | 661 | | | | 287 | | | | 2,602 | |
Reinvestment of distributions | | | 326 | | | | 2,752 | | | | 93 | | | | 812 | |
Shares redeemed | | | (125 | ) | | | (1,031 | ) | | | (3 | ) | | | (22 | ) |
| | | | 271 | | | | 2,382 | | | | 377 | | | | 3,392 | |
| Service Shares | | | | | | | | | | | | | | | | |
Shares sold | | | — | | | | — | | | | 15,967 | | | | 140,512 | |
Reinvestment of distributions | | | 221 | | | | 1,856 | | | | 269 | | | | 2,304 | |
Shares redeemed | | | — | | | | — | | | | (16,156 | ) | | | (151,868 | ) |
| | | | 221 | | | | 1,856 | | | | 80 | | | | (9,052 | ) |
| Investor Shares | | | | | | | | | | | | | | | | |
Shares sold | | | 23,481 | | | | 204,069 | | | | 34,278 | | | | 314,744 | |
Reinvestment of distributions | | | 34,353 | | | | 289,355 | | | | 9,876 | | | | 86,376 | |
Shares redeemed | | | (102,868 | ) | | | (872,880 | ) | | | (18,345 | ) | | | (162,065 | ) |
| | | | (45,034 | ) | | | (379,456 | ) | | | 25,809 | | | | 239,055 | |
| Class R6 Shares | | | | | | | | | | | | | | | | |
Shares sold | | | 18,622 | | | | 157,603 | | | | 314,837 | | | | 2,914,696 | |
Reinvestment of distributions | | | 66,304 | | | | 560,445 | | | | 459,899 | | | | 4,054,743 | |
Shares redeemed in connection with in-kind transactions | | | — | | | | — | | | | (7,457,175 | ) | | | (65,474,000 | ) |
Shares redeemed | | | (84,505 | ) | | | (802,970 | ) | | | (628,671 | ) | | | (5,852,081 | ) |
| | | | 421 | | | | (84,922 | ) | | | (7,311,110 | ) | | | (64,356,642 | ) |
| Class R Shares | | | | | | | | | | | | | | | | |
Shares sold | | | — | | | | — | | | | 28 | | | | 250 | |
Reinvestment of distributions | | | 249 | | | | 2,088 | | | | 203 | | | | 1,772 | |
Shares redeemed | | | — | | | | — | | | | (2,016 | ) | | | (17,096 | ) |
| | | | 249 | | | | 2,088 | | | | (1,785 | ) | | | (15,074 | ) |
| | | | |
NET DECREASE | | | (33,718 | ) | | $ | (374,356 | ) | | | (7,302,578 | ) | | $ | (64,278,130 | ) |
124
GOLDMAN SACHS TARGET DATE PORTFOLIOS
|
| 11. SUMMARY OF SHARE TRANSACTIONS (continued) |
Share activity is as follows:
| | | | | | | | | | | | | | | | |
| | | Target Date 2035 Portfolio | |
| | | | |
| | | For the Fiscal Year Ended
August 31, 2020 | | | For the Fiscal Year Ended
August 31, 2019 | |
| | | | |
| | | Shares | | | Dollars | | | Shares | | | Dollars | |
| | | | |
| Class A Shares | | | | | | | | | | | | | | | | |
Shares sold | | | 3,231 | | | $ | 34,521 | | | | 16,221 | | | $ | 167,685 | |
Reinvestment of distributions | | | 2,040 | | | | 21,487 | | | | 1,192 | | | | 11,723 | |
Shares redeemed | | | (6,441 | ) | | | (70,276 | ) | | | (465 | ) | | | (4,986 | ) |
| | | | (1,170 | ) | | | (14,268 | ) | | | 16,948 | | | | 174,422 | |
| Institutional Shares | | | | | | | | | | | | | | | | |
Shares sold | | | 12 | | | | 139 | | | | 1 | | | | 6 | |
Reinvestment of distributions | | | 51,625 | | | | 547,186 | | | | 48,450 | | | | 479,189 | |
Shares redeemed | | | (7 | ) | | | (67 | ) | | | (493,544 | ) | | | (5,350,006 | ) |
| | | | 51,630 | | | | 547,258 | | | | (445,093 | ) | | | (4,870,811 | ) |
| Service Shares | | | | | | | | | | | | | | | | |
Reinvestment of distributions | | | 104 | | | | 1,100 | | | | 98 | | | | 968 | |
| | | | 104 | | | | 1,100 | | | | 98 | | | | 968 | |
| Investor Shares | | | | | | | | | | | | | | | | |
Shares sold | | | 7,331 | | | | 79,677 | | | | 17,051 | | | | 180,359 | |
Reinvestment of distributions | | | 8,974 | | | | 94,718 | | | | 8,255 | | | | 81,425 | |
Shares redeemed | | | (102,529 | ) | | | (1,097,028 | ) | | | (13,617 | ) | | | (145,873 | ) |
| | | | (86,224 | ) | | | (922,633 | ) | | | 11,689 | | | | 115,911 | |
| Class R6 Shares | | | | | | | | | | | | | | | | |
Shares sold | | | 22,102 | | | | 235,114 | | | | 28,174 | | | | 297,030 | |
Reinvestment of distributions | | | 955 | | | | 10,110 | | | | 2,368 | | | | 23,390 | |
Shares redeemed | | | (35,483 | ) | | | (388,778 | ) | | | (18,464 | ) | | | (199,305 | ) |
| | | | (12,426 | ) | | | (143,554 | ) | | | 12,078 | | | | 121,115 | |
| Class R Shares | | | | | | | | | | | | | | | | |
Reinvestment of distributions | | | 102 | | | | 1,079 | | | | 97 | | | | 955 | |
Shares redeemed | | | — | | | | — | | | | (8 | ) | | | (70 | ) |
| | | | 102 | | | | 1,079 | | | | 89 | | | | 885 | |
| | | | |
NET DECREASE | | | (47,984 | ) | | $ | (531,018 | ) | | | (404,191 | ) | | $ | (4,457,510 | ) |
125
GOLDMAN SACHS TARGET DATE PORTFOLIOS
Notes to Financial Statements (continued)
August 31, 2020
|
| 11. SUMMARY OF SHARE TRANSACTIONS (continued) |
Share activity is as follows:
| | | | | | | | | | | | | | | | |
| | | Target Date 2040 Portfolio | |
| | | | |
| | | For the Fiscal Year Ended
August 31, 2020 | | | For the Fiscal Year Ended
August 31, 2019 | |
| | | | |
| | | Shares | | | Dollars | | | Shares | | | Dollars | |
| | | | |
| Class A Shares | | | | | | | | | | | | | | | | |
Shares sold | | | 2,287 | | | $ | 18,455 | | | | 3,856 | | | $ | 33,817 | |
Reinvestment of distributions | | | 1,534 | | | | 12,663 | | | | 438 | | | | 3,694 | |
Shares redeemed | | | (1,914 | ) | | | (16,428 | ) | | | (901 | ) | | | (8,433 | ) |
| | | | 1,907 | | | | 14,690 | | | | 3,393 | | | | 29,078 | |
| Institutional Shares | | | | | | | | | | | | | | | | |
Shares sold | | | 39 | | | | 325 | | | | — | | | | — | |
Reinvestment of distributions | | | 254 | | | | 2,111 | | | | 107 | | | | 904 | |
Shares redeemed | | | (5 | ) | | | (41 | ) | | | — | | | | — | |
| | | | 288 | | | | 2,395 | | | | 107 | | | | 904 | |
| Service Shares | | | | | | | | | | | | | | | | |
Reinvestment of distributions | | | 244 | | | | 2,016 | | | | 99 | | | | 840 | |
| | | | 244 | | | | 2,016 | | | | 99 | | | | 840 | |
| Investor Shares | | | | | | | | | | | | | | | | |
Shares sold | | | 10,363 | | | | 88,800 | | | | 14,683 | | | | 130,541 | |
Reinvestment of distributions | | | 14,163 | | | | 117,436 | | | | 5,765 | | | | 48,648 | |
Shares redeemed | | | (69,990 | ) | | | (587,788 | ) | | | (14,032 | ) | | | (125,063 | ) |
| | | | (45,464 | ) | | | (381,552 | ) | | | 6,416 | | | | 54,126 | |
| Class R6 Shares | | | | | | | | | | | | | | | | |
Shares sold | | | 21,498 | | | | 182,889 | | | | 687,591 | | | | 6,217,119 | |
Reinvestment of distributions | | | 129,849 | | | | 1,081,445 | | | | 379,957 | | | | 3,240,146 | |
Shares redeemed in connection with in-kind transactions | | | — | | | | — | | | | (4,786,320 | ) | | | (40,635,861 | ) |
Shares redeemed | | | (73,071 | ) | | | (677,179 | ) | | | (688,584 | ) | | | (6,152,676 | ) |
| | | | 78,276 | | | | 587,155 | | | | (4,407,356 | ) | | | (37,331,272 | ) |
| Class R Shares | | | | | | | | | | | | | | | | |
Shares sold | | | — | | | | — | | | | 46 | | | | 396 | |
Reinvestment of distributions | | | 243 | | | | 1,994 | | | | 298 | | | | 2,512 | |
Shares redeemed | | | — | | | | — | | | | (2,792 | ) | | | (22,618 | ) |
| | | | 243 | | | | 1,994 | | | | (2,448 | ) | | | (19,710 | ) |
| | | | |
NET INCREASE (DECREASE) | | | 35,494 | | | $ | 226,698 | | | | (4,399,789 | ) | | $ | (37,266,034 | ) |
126
GOLDMAN SACHS TARGET DATE PORTFOLIOS
|
| 11. SUMMARY OF SHARE TRANSACTIONS (continued) |
Share activity is as follows:
| | | | | | | | | | | | | | | | |
| | | Target Date 2045 Portfolio | |
| | | | |
| | | For the Fiscal Year Ended
August 31, 2020 | | | For the Fiscal Year Ended
August 31, 2019 | |
| | | | |
| | | Shares | | | Dollars | | | Shares | | | Dollars | |
| | | | |
| Class A Shares | | | | | | | | | | | | | | | | |
Shares sold | | | 4,282 | | | $ | 42,873 | | | | 5,312 | | | $ | 56,140 | |
Reinvestment of distributions | | | 1,721 | | | | 18,008 | | | | 1,097 | | | | 10,785 | |
Shares redeemed | | | (984 | ) | | | (10,614 | ) | | | (137 | ) | | | (1,463 | ) |
| | | | 5,019 | | | | 50,267 | | | | 6,272 | | | | 65,462 | |
| Institutional Shares | | | | | | | | | | | | | | | | |
Shares sold | | | 266 | | | | 2,887 | | | | 366 | | | | 3,884 | |
Reinvestment of distributions | | | 64,817 | | | | 682,308 | | | | 59,682 | | | | 588,234 | |
Shares redeemed | | | (9 | ) | | | (89 | ) | | | (467,008 | ) | | | (5,151,074 | ) |
| | | | 65,074 | | | | 685,106 | | | | (406,960 | ) | | | (4,558,956 | ) |
| Service Shares | | | | | | | | | | | | | | | | |
Reinvestment of distributions | | | 124 | | | | 1,301 | | | | 115 | | | | 1,126 | |
| | | | 124 | | | | 1,301 | | | | 115 | | | | 1,126 | |
| Investor Shares | | | | | | | | | | | | | | | | |
Shares sold | | | 15,569 | | | | 168,333 | | | | 22,010 | | | | 235,130 | |
Reinvestment of distributions | | | 9,915 | | | | 104,090 | | | | 6,709 | | | | 66,026 | |
Shares redeemed | | | (88,118 | ) | | | (943,436 | ) | | | (352 | ) | | | (3,779 | ) |
| | | | (62,634 | ) | | | (671,013 | ) | | | 28,367 | | | | 297,377 | |
| Class R6 Shares | | | | | | | | | | | | | | | | |
Shares sold | | | 5,773 | | | | 59,373 | | | | 43,981 | | | | 462,517 | |
Reinvestment of distributions | | | 2,604 | | | | 27,396 | | | | 3,279 | | | | 32,290 | |
Shares redeemed | | | (48,116 | ) | | | (526,722 | ) | | | (1,290 | ) | | | (14,047 | ) |
| | | | (39,739 | ) | | | (439,953 | ) | | | 45,970 | | | | 480,760 | |
| Class R Shares | | | | | | | | | | | | | | | | |
Shares sold | | | — | | | | — | | | | 35 | | | | 386 | |
Reinvestment of distributions | | | 122 | | | | 1,279 | | | | 391 | | | | 3,843 | |
Shares redeemed | | | — | | | | — | | | | (2,829 | ) | | | (27,061 | ) |
| | | | 122 | | | | 1,279 | | | | (2,403 | ) | | | (22,832 | ) |
| | | | |
NET DECREASE | | | (32,034 | ) | | $ | (373,013 | ) | | | (328,639 | ) | | $ | (3,737,063 | ) |
127
GOLDMAN SACHS TARGET DATE PORTFOLIOS
Notes to Financial Statements (continued)
August 31, 2020
|
| 11. SUMMARY OF SHARE TRANSACTIONS (continued) |
Share activity is as follows:
| | | | | | | | | | | | | | | | |
| | | Target Date 2050 Portfolio | |
| | | | |
| | | For the Fiscal Year Ended
August 31, 2020 | | | For the Fiscal Year Ended
August 31, 2019 | |
| | | | |
| | | Shares | | | Dollars | | | Shares | | | Dollars | |
| | | | |
| Class A Shares | | | | | | | | | | | | | | | | |
Shares sold | | | 32,024 | | | $ | 300,977 | | | | 14,466 | | | $ | 140,963 | |
Reinvestment of distributions | | | 6,664 | | | | 62,375 | | | | 1,593 | | | | 15,098 | |
Shares redeemed | | | (3,426 | ) | | | (31,559 | ) | | | (1,056 | ) | | | (9,921 | ) |
| | | | 35,262 | | | | 331,793 | | | | 15,003 | | | | 146,140 | |
| Institutional Shares | | | | | | | | | | | | | | | | |
Shares sold | | | 364 | | | | 3,368 | | | | 371 | | | | 3,673 | |
Reinvestment of distributions | | | 295 | | | | 2,782 | | | | 92 | | | | 872 | |
Shares redeemed | | | (97 | ) | | | (893 | ) | | | (3 | ) | | | (30 | ) |
| | | | 562 | | | | 5,257 | | | | 460 | | | | 4,515 | |
| Service Shares | | | | | | | | | | | | | | | | |
Reinvestment of distributions | | | 209 | | | | 1,962 | | | | 79 | | | | 751 | |
| | | | 209 | | | | 1,962 | | | | 79 | | | | 751 | |
| Investor Shares | | | | | | | | | | | | | | | | |
Shares sold | | | 13,096 | | | | 130,529 | | | | 23,759 | | | | 240,540 | |
Reinvestment of distributions | | | 18,589 | | | | 174,877 | | | | 6,151 | | | | 58,460 | |
Shares redeemed | | | (115,025 | ) | | | (1,106,678 | ) | | | (9,159 | ) | | | (89,911 | ) |
| | | | (83,340 | ) | | | (801,272 | ) | | | 20,751 | | | | 209,089 | |
| Class R6 Shares | | | | | | | | | | | | | | | | |
Shares sold | | | 9,121 | | | | 87,881 | | | | 532,889 | | | | 5,409,723 | |
Reinvestment of distributions | | | 93,381 | | | | 881,219 | | | | 183,627 | | | | 1,765,302 | |
Shares redeemed in connection with in-kind transactions | | | — | | | | — | | | | (2,487,689 | ) | | | (23,832,062 | ) |
Shares redeemed | | | (37,078 | ) | | | (385,740 | ) | | | (404,838 | ) | | | (4,081,847 | ) |
| | | | 65,424 | | | | 583,360 | | | | (2,176,011 | ) | | | (20,738,884 | ) |
| Class R Shares | | | | | | | | | | | | | | | | |
Reinvestment of distributions | | | 207 | | | | 1,938 | | | | 77 | | | | 734 | |
Shares redeemed | | | — | | | | — | | | | (3 | ) | | | (26 | ) |
| | | | 207 | | | | 1,938 | | | | 74 | | | | 708 | |
| | | | |
NET INCREASE (DECREASE) | | | 18,324 | | | $ | 123,038 | | | | (2,139,644 | ) | | $ | (20,377,681 | ) |
128
GOLDMAN SACHS TARGET DATE PORTFOLIOS
|
| 11. SUMMARY OF SHARE TRANSACTIONS (continued) |
Share activity is as follows:
| | | | | | | | | | | | | | | | |
| | | Target Date 2055 Portfolio | |
| | | | |
| | | For the Fiscal Year Ended
August 31, 2020 | | | For the Fiscal Year Ended
August 31, 2019 | |
| | | | |
| | | Shares | | | Dollars | | | Shares | | | Dollars | |
| | | | |
| Class A Shares | | | | | | | | | | | | | | | | |
Shares sold | | | 7,363 | | | $ | 72,153 | | | | 4,295 | | | $ | 44,449 | |
Reinvestment of distributions | | | 2,300 | | | | 23,251 | | | | 1,421 | | | | 13,894 | |
Shares redeemed | | | (5,904 | ) | | | (52,809 | ) | | | (390 | ) | | | (3,936 | ) |
| | | | 3,759 | | | | 42,595 | | | | 5,326 | | | | 54,407 | |
| Institutional Shares | | | | | | | | | | | | | | | | |
Shares sold | | | 238 | | | | 2,363 | | | | 259 | | | | 2,718 | |
Reinvestment of distributions | | | 80,456 | | | | 818,684 | | | | 71,059 | | | | 697,581 | |
Shares redeemed | | | (131 | ) | | | (1,412 | ) | | | (486,181 | ) | | | (5,450,081 | ) |
| | | | 80,563 | | | | 819,635 | | | | (414,863 | ) | | | (4,749,782 | ) |
| Service Shares | | | | | | | | | | | | | | | | |
Reinvestment of distributions | | | 160 | | | | 1,623 | | | | 142 | | | | 1,388 | |
| | | | 160 | | | | 1,623 | | | | 142 | | | | 1,388 | |
| Investor Shares | | | | | | | | | | | | | | | | |
Shares sold | | | 14,072 | | | | 144,877 | | | | 20,520 | | | | 218,303 | |
Reinvestment of distributions | | | 10,034 | | | | 101,821 | | | | 6,628 | | | | 64,947 | |
Shares redeemed | | | (66,206 | ) | | | (686,103 | ) | | | (1,799 | ) | | | (19,802 | ) |
| | | | (42,100 | ) | | | (439,405 | ) | | | 25,349 | | | | 263,448 | |
| Class R6 Shares | | | | | | | | | | | | | | | | |
Shares sold | | | 3,395 | | | | 34,735 | | | | 24,316 | | | | 253,002 | |
Reinvestment of distributions | | | 178 | | | | 1,811 | | | | 2,340 | | | | 22,950 | |
Shares redeemed | | | (37,303 | ) | | | (404,491 | ) | | | (3,121 | ) | | | (34,073 | ) |
| | | | (33,730 | ) | | | (367,945 | ) | | | 23,535 | | | | 241,879 | |
| Class R Shares | | | | | | | | | | | | | | | | |
Shares sold | | | — | | | | — | | | | 17 | | | | 185 | |
Reinvestment of distributions | | | 159 | | | | 1,604 | | | | 436 | | | | 4,246 | |
Shares redeemed | | | — | | | | — | | | | (2,480 | ) | | | (23,437 | ) |
| | | | 159 | | | | 1,604 | | | | (2,027 | ) | | | (19,006 | ) |
| | | | |
NET INCREASE (DECREASE) | | | 8,811 | | | $ | 58,107 | | | | (362,538 | ) | | $ | (4,207,666 | ) |
129
GOLDMAN SACHS TARGET DATE PORTFOLIOS
Notes to Financial Statements (continued)
August 31, 2020
|
| 11. SUMMARY OF SHARE TRANSACTIONS (continued) |
Share activity is as follows:
| | | | | | | | | | | | | | | | |
| | | Target Date 2060 Portfolio | |
| | | | |
| | | For the Fiscal Year Ended
August 31, 2020 | | | For the Fiscal Year Ended
August 31, 2019 | |
| | | | |
| | | Shares | | | Dollars | | | Shares | | | Dollars | |
| | | | |
| Class A Shares | | | | | | | | | | | | | | | | |
Shares sold | | | 2,603 | | | $ | 25,602 | | | | 1,009 | | | $ | 10,205 | |
Reinvestment of distributions | | | 43 | | | | 476 | | | | 14 | | | | 125 | |
Shares redeemed | | | (766 | ) | | | (8,461 | ) | | | (123 | ) | | | (1,268 | ) |
| | | | 1,880 | | | | 17,617 | | | | 900 | | | | 9,062 | |
| Institutional Shares | | | | | | | | | | | | | | | | |
Reinvestment of distributions | | | 24 | | | | 257 | | | | 16 | | | | 151 | |
| | | | 24 | | | | 257 | | | | 16 | | | | 151 | |
| Service Shares | | | | | | | | | | | | | | | | |
Reinvestment of distributions | | | 18 | | | | 204 | | | | 13 | | | | 118 | |
| | | | 18 | | | | 204 | | | | 13 | | | | 118 | |
| Investor Shares | | | | | | | | | | | | | | | | |
Reinvestment of distributions | | | 22 | | | | 243 | | | | 15 | | | | 142 | |
| | | | 22 | | | | 243 | | | | 15 | | | | 142 | |
| Class R6 Shares | | | | | | | | | | | | | | | | |
Shares sold | | | 2,717 | | | | 30,422 | | | | 208,758 | | | | 2,049,999 | |
Reinvestment of distributions | | | 16,367 | | | | 182,658 | | | | 11,708 | | | | 107,558 | |
Shares redeemed | | | (7 | ) | | | (78 | ) | | | — | | | | — | |
| | | | 19,077 | | | | 213,002 | | | | 220,466 | | | | 2,157,557 | |
| Class R Shares | | | | | | | | | | | | | | | | |
Reinvestment of distributions | | | 17 | | | | 190 | | | | 12 | | | | 108 | |
| | | | 17 | | | | 190 | | | | 12 | | | | 108 | |
| | | | |
NET INCREASE | | | 21,038 | | | $ | 231,513 | | | | 221,422 | | | $ | 2,167,138 | |
130
Report of Independent Registered Public
Accounting Firm
To the Board of Trustees of Goldman Sachs Trust II and Shareholders of Goldman Sachs Target Date Retirement Portfolio (formerly known as Goldman Sachs Target Date 2020 Portfolio), Goldman Sachs Target Date 2025 Portfolio, Goldman Sachs Target Date 2030 Portfolio, Goldman Sachs Target Date 2035 Portfolio, Goldman Sachs Target Date 2040 Portfolio, Goldman Sachs Target Date 2045 Portfolio, Goldman Sachs Target Date 2050 Portfolio, Goldman Sachs Target Date 2055 Portfolio, and Goldman Sachs Target Date 2060 Portfolio
Opinions on the Financial Statements
We have audited the accompanying statements of assets and liabilities, including the schedules of investments, of Goldman Sachs Target Date Retirement Portfolio (formerly known as Goldman Sachs Target Date 2020 Portfolio), Goldman Sachs Target Date 2025 Portfolio, Goldman Sachs Target Date 2030 Portfolio, Goldman Sachs Target Date 2035 Portfolio, Goldman Sachs Target Date 2040 Portfolio, Goldman Sachs Target Date 2045 Portfolio, Goldman Sachs Target Date 2050 Portfolio, Goldman Sachs Target Date 2055 Portfolio, and Goldman Sachs Target Date 2060 Portfolio (nine of the portfolios constituting Goldman Sachs Trust II, hereafter collectively referred to as the “Portfolios”) as of August 31, 2020, the related statements of operations for the year ended August 31, 2020, the statements of changes in net assets for each of the two years in the period ended August 31, 2020, including the related notes, and the financial highlights for each of the periods indicated therein (collectively referred to as the “financial statements”). In our opinion, the financial statements present fairly, in all material respects, the financial position of each of the Portfolios as of August 31, 2020, the results of each of their operations for the year then ended, the changes in each of their net assets for each of the two years in the period ended August 31, 2020 and each of the financial highlights for each of the periods indicated therein in conformity with accounting principles generally accepted in the United States of America
Basis for Opinions
These financial statements are the responsibility of the Portfolios’ management. Our responsibility is to express an opinion on the Portfolios’ financial statements based on our audits. We are a public accounting firm registered with the Public Company Accounting Oversight Board (United States) (PCAOB) and are required to be independent with respect to the Portfolios in accordance with the U.S. federal securities laws and the applicable rules and regulations of the Securities and Exchange Commission and the PCAOB.
We conducted our audits of these financial statements in accordance with the standards of the PCAOB. Those standards require that we plan and perform the audit to obtain reasonable assurance about whether the financial statements are free of material misstatement, whether due to error or fraud.
Our audits included performing procedures to assess the risks of material misstatement of the financial statements, whether due to error or fraud, and performing procedures that respond to those risks. Such procedures included examining, on a test basis, evidence regarding the amounts and disclosures in the financial statements. Our audits also included evaluating the accounting principles used and significant estimates made by management, as well as evaluating the overall presentation of the financial statements. Our procedures included confirmation of securities owned as of August 31, 2020 by correspondence with the custodian, transfer agent and brokers; when replies were not received from brokers, we performed other auditing procedures. We believe that our audits provide a reasonable basis for our opinions.
/s/ PricewaterhouseCoopers LLP
Boston, Massachusetts
October 26, 2020
We have served as the auditor of one or more investment companies in the Goldman Sachs fund complex since 2000.
131
GOLDMAN SACHS TARGET DATE PORTFOLIOS
Fund Expenses — Period Ended August 31, 2020 (Unaudited)
As a shareholder of Class A, Institutional, Service, Investor, Class R6, and Class R Shares of the Portfolios, you incur two types of costs: (1) transaction costs, including sales charges on purchase payments (with respect to Class A Shares), and (2) ongoing costs, including management fees; distribution and/or service (12b-1) fees (with respect to Class A, Service and Class R Shares); and other Portfolio expenses. This example is intended to help you understand your ongoing costs (in dollars) of investing in Class A, Institutional, Service, Investor, Class R6 or Class R Shares of the Portfolios and to compare these costs with the ongoing costs of investing in other mutual funds.
The example is based on an investment of $1,000 invested at the beginning of the period and held for the entire period from March 1, 2020 through August 31, 2020, which represents a period of 184 days out of a 366 day year. This projection assumes that annualized expense ratios were in effect during the period.
Actual Expenses — The first line under each share class in the table below provides information about actual account values and actual expenses. You may use the information in this line, together with the amount you invested, to estimate the expenses that you paid over the period. Simply divide your account value by $1,000 (for example, an $8,600 account value divided by $1,000=8.6), then multiply the result by the number in the first line under the heading entitled “Expenses Paid” to estimate the expenses you paid on your account during this period.
Hypothetical Example for Comparison Purposes — The second line under each share class in the table below provides information about hypothetical account values and hypothetical expenses based on the Portfolios’ actual net expense ratios and an assumed rate of return of 5% per year before expenses, which is not the Portfolios’ actual return. The hypothetical account values and expenses may not be used to estimate the actual ending account balance or expenses you paid for the period. You may use this information to compare the ongoing costs of investing in the Portfolios and other funds. To do so, compare this 5% hypothetical example with the 5% hypothetical examples that appear in the shareholder reports of the other funds.
Please note that the expenses shown in the table are meant to highlight your ongoing costs only and do not reflect any transactional costs, such as sales charges, redemption fees, or exchange fees and do not include expenses of Underlying Funds in which the Portfolios invest. Therefore, the second line of the table is useful in comparing ongoing costs only, and will not help you determine the relative total costs of owning different funds. In addition, if these transactional costs were included, your costs would have been higher.
| | | | | | | | | | | | | | | | | | | | | | | | | | | | | | | | | | | | |
| | | Target Date Retirement Portfolio | | | Target Date 2025 Portfolio | | | Target Date 2030 Portfolio | |
| Share Class | | Beginning
Account
Value
3/1/20 | | | Ending
Account
Value
8/31/20 | | | Expenses
Paid for the
6 months ended
8/31/20* | | | Beginning
Account
Value
3/1/20 | | | Ending
Account
Value
8/31/20 | | | Expenses
Paid for the
6 months ended
8/31/20* | | | Beginning
Account
Value
3/1/20 | | | Ending
Account
Value
8/31/20 | | | Expenses
Paid for the
6 months ended
8/31/20* | |
| Class A | | | | | | | | | | | | | | | | | | | | | | | | | | | | | | | | | | | | |
Actual | | $ | 1,000.00 | | | $ | 1,071.70 | | | $ | 2.76 | | | $ | 1,000.00 | | | $ | 1,080.50 | | | $ | 2.67 | | | $ | 1,000.00 | | | $ | 1,085.70 | | | $ | 2.73 | |
Hypothetical 5% return | | | 1,000.00 | | | | 1,022.47 | + | | | 2.69 | | | | 1,000.00 | | | | 1,022.47 | + | | | 2.59 | | | | 1,000.00 | | | | 1,022.47 | + | | | 2.64 | |
| Institutional | | | | | | | | | | | | | | | | | | | | | | | | | | | | | | | | | | | | |
Actual | | | 1,000.00 | | | | 1,072.50 | | | | 0.89 | | | | 1,000.00 | | | | 1,082.60 | | | | 0.68 | | | | 1,000.00 | | | | 1,089.10 | | | | 0.74 | |
Hypothetical 5% return | | | 1,000.00 | | | | 1,024.28 | + | | | 0.87 | | | | 1,000.00 | | | | 1,024.48 | + | | | 0.66 | | | | 1,000.00 | | | | 1,024.43 | + | | | 0.71 | |
| Service | | | | | | | | | | | | | | | | | | | | | | | | | | | | | | | | | | | | |
Actual | | | 1,000.00 | | | | 1,070.50 | | | | 3.43 | | | | 1,000.00 | | | | 1,079.90 | | | | 3.40 | | | | 1,000.00 | | | | 1,085.10 | | | | 3.41 | |
Hypothetical 5% return | | | 1,000.00 | | | | 1,021.82 | + | | | 3.35 | | | | 1,000.00 | | | | 1,021.82 | + | | | 3.30 | | | | 1,000.00 | | | | 1,021.82 | + | | | 3.30 | |
| Investor | | | | | | | | | | | | | | | | | | | | | | | | | | | | | | | | | | | | |
Actual | | | 1,000.00 | | | | 1,072.70 | | | | 1.46 | | | | 1,000.00 | | | | 1,081.80 | | | | 1.41 | | | | 1,000.00 | | | | 1,086.80 | | | | 1.42 | |
Hypothetical 5% return | | | 1,000.00 | | | | 1,023.73 | + | | | 1.42 | | | | 1,000.00 | | | | 1,023.78 | + | | | 1.37 | | | | 1,000.00 | | | | 1,023.78 | + | | | 1.37 | |
| Class R6 | | | | | | | | | | | | | | | | | | | | | | | | | | | | | | | | | | | | |
Actual | | | 1,000.00 | | | | 1,073.60 | | | | 0.68 | | | | 1,000.00 | | | | 1,082.40 | | | | 0.58 | | | | 1,000.00 | | | | 1,089.10 | | | | 0.63 | |
Hypothetical 5% return | | | 1,000.00 | | | | 1,024.48 | + | | | 0.66 | | | | 1,000.00 | | | | 1,024.58 | + | | | 0.56 | | | | 1,000.00 | | | | 1,024.53 | + | | | 0.61 | |
| Class R | | | | | | | | | | | | | | | | | | | | | | | | | | | | | | | | | | | | |
Actual | | | 1,000.00 | | | | 1,069.50 | | | | 4.06 | | | | 1,000.00 | | | | 1,078.90 | | | | 3.87 | | | | 1,000.00 | | | | 1,084.60 | | | | 4.09 | |
Hypothetical 5% return | | | 1,000.00 | | | | 1,021.22 | + | | | 3.96 | | | | 1,000.00 | | | | 1,021.22 | + | | | 3.76 | | | | 1,000.00 | | | | 1,021.22 | + | | | 3.96 | |
| * | | Expenses for each share class are calculated using each Portfolio’s annualized net expense ratio for each class, which represents the ongoing expenses as a percentage of net assets for the six months ended August 31, 2020. Expenses are calculated by multiplying the annualized net expense ratio by the average account value for the period; then multiplying the result by the number of days in the most recent fiscal half year; and then dividing that result by the number of days in the fiscal year. The annualized net expense ratios for the period were as follows: |
| | | | | | | | | | | | | | | | | | | | | | | | |
| Portfolios | | Class A | | | Institutional | | | Service | | | Investor | | | Class R6 | | | Class R | |
Target Date Retirement Portfolio | | | 0.53 | % | | | 0.17 | % | | | 0.66 | % | | | 0.28 | % | | | 0.13 | % | | | 0.78 | % |
Target Date 2025 Portfolio | | | 0.51 | | | | 0.13 | | | | 0.65 | | | | 0.27 | | | | 0.11 | | | | 0.74 | |
Target Date 2030 Portfolio | | | 0.52 | | | | 0.14 | | | | 0.65 | | | | 0.27 | | | | 0.12 | | | | 0.78 | |
| + | | Hypothetical expenses are based on each Portfolio’s actual annualized net expense ratios and an assumed rate of return of 5% per year before expenses. |
132
GOLDMAN SACHS TARGET DATE PORTFOLIOS
Fund Expenses — Period Ended August 31, 2020 (Unaudited) (continued)
| | | | | | | | | | | | | | | | | | | | | | | | | | | | | | | | | | | | |
| | | Target Date 2035 Portfolio | | | Target Date 2040 Portfolio | | | Target Date 2045 Portfolio | |
| Share Class | | Beginning
Account
Value
3/1/20 | | | Ending
Account
Value
8/31/20 | | | Expenses
Paid for the
6 months ended
8/31/20* | | | Beginning
Account
Value
3/1/20 | | | Ending
Account
Value
8/31/20 | | | Expenses
Paid for the
6 months ended
8/31/20* | | | Beginning
Account
Value
3/1/20 | | | Ending
Account
Value
8/31/20 | | | Expenses
Paid for the
6 months ended
8/31/20* | |
| Class A | | | | | | | | | | | | | | | | | | | | | | | | | | | | | | | | | | | | |
Actual | | $ | 1,000.00 | | | $ | 1,096.80 | | | $ | 2.64 | | | $ | 1,000.00 | | | $ | 1,109.50 | | | $ | 2.65 | | | $ | 1,000.00 | | | $ | 1,120.20 | | | $ | 2.56 | |
Hypothetical 5% return | | | 1,000.00 | | | | 1,022.62 | + | | | 2.54 | | | | 1,000.00 | | | | 1,022.62 | + | | | 2.54 | | | | 1,000.00 | | | | 1,022.62 | + | | | 2.44 | |
| Institutional | | | | | | | | | | | | | | | | | | | | | | | | | | | | | | | | | | | | |
Actual | | | 1,000.00 | | | | 1,099.50 | | | | 0.63 | | | | 1,000.00 | | | | 1,112.80 | | | | 0.69 | | | | 1,000.00 | | | | 1,121.60 | | | | 0.53 | |
Hypothetical 5% return | | | 1,000.00 | | | | 1,024.53 | + | | | 0.61 | | | | 1,000.00 | | | | 1,024.48 | + | | | 0.66 | | | | 1,000.00 | | | | 1,024.63 | + | | | 0.51 | |
| Service | | | | | | | | | | | | | | | | | | | | | | | | | | | | | | | | | | | | |
Actual | | | 1,000.00 | | | | 1,096.80 | | | | 3.32 | | | | 1,000.00 | | | | 1,109.30 | | | | 3.34 | | | | 1,000.00 | | | | 1,120.00 | | | | 3.25 | |
Hypothetical 5% return | | | 1,000.00 | | | | 1,021.97 | + | | | 3.20 | | | | 1,000.00 | | | | 1,021.97 | + | | | 3.20 | | | | 1,000.00 | | | | 1,021.97 | + | | | 3.10 | |
| Investor | | | | | | | | | | | | | | | | | | | | | | | | | | | | | | | | | | | | |
Actual | | | 1,000.00 | | | | 1,097.80 | | | | 1.32 | | | | 1,000.00 | | | | 1,111.80 | | | | 1.33 | | | | 1,000.00 | | | | 1,120.90 | | | | 1.23 | |
Hypothetical 5% return | | | 1,000.00 | | | | 1,023.88 | + | | | 1.27 | | | | 1,000.00 | | | | 1,023.88 | + | | | 1.27 | | | | 1,000.00 | | | | 1,023.98 | + | | | 1.17 | |
| Class R6 | | | | | | | | | | | | | | | | | | | | | | | | | | | | | | | | | | | | |
Actual | | | 1,000.00 | | | | 1,099.60 | | | | 0.53 | | | | 1,000.00 | | | | 1,112.70 | | | | 0.53 | | | | 1,000.00 | | | | 1,122.80 | | | | 0.43 | |
Hypothetical 5% return | | | 1,000.00 | | | | 1,024.63 | + | | | 0.51 | | | | 1,000.00 | | | | 1,024.63 | + | | | 0.51 | | | | 1,000.00 | | | | 1,024.73 | + | | | 0.41 | |
| Class R | | | | | | | | | | | | | | | | | | | | | | | | | | | | | | | | | | | | |
Actual | | | 1,000.00 | | | | 1,094.80 | | | | 3.90 | | | | 1,000.00 | | | | 1,109.70 | | | | 3.98 | | | | 1,000.00 | | | | 1,119.20 | | | | 3.89 | |
Hypothetical 5% return | | | 1,000.00 | | | | 1,021.37 | + | | | 3.76 | | | | 1,000.00 | | | | 1,021.37 | + | | | 3.81 | | | | 1,000.00 | | | | 1,021.37 | + | | | 3.71 | |
| * | | Expenses for each share class are calculated using each Portfolio’s annualized net expense ratio for each class, which represents the ongoing expenses as a percentage of net assets for the six months ended August 31, 2020. Expenses are calculated by multiplying the annualized net expense ratio by the average account value for the period; then multiplying the result by the number of days in the most recent fiscal half year; and then dividing that result by the number of days in the fiscal year. The annualized net expense ratios for the period were as follows: |
| | | | | | | | | | | | | | | | | | | | | | | | |
| Portfolios | | Class A | | | Institutional | | | Service | | | Investor | | | Class R6 | | | Class R | |
Target Date 2035 Portfolio | | | 0.50 | % | | | 0.12 | % | | | 0.63 | % | | | 0.25 | % | | | 0.10 | % | | | 0.74 | % |
Target Date 2040 Portfolio | | | 0.50 | | | | 0.13 | | | | 0.63 | | | | 0.25 | | | | 0.10 | | | | 0.75 | |
Target Date 2045 Portfolio | | | 0.48 | | | | 0.10 | | | | 0.61 | | | | 0.23 | | | | 0.08 | | | | 0.73 | |
| + | | Hypothetical expenses are based on each Portfolio’s actual annualized net expense ratios and an assumed rate of return of 5% per year before expenses. |
133
GOLDMAN SACHS TARGET DATE PORTFOLIOS
Fund Expenses — Period Ended August 31, 2020 (Unaudited) (continued)
| | | | | | | | | | | | | | | | | | | | | | | | | | | | | | | | | | | | |
| | | Target Date 2050 Portfolio | | | Target Date 2055 Portfolio | | | Target Date 2060 Portfolio | |
| Share Class | | Beginning
Account
Value
3/1/20 | | | Ending
Account
Value
8/31/20 | | | Expenses
Paid for the
6 months ended
8/31/20* | | | Beginning
Account
Value
3/1/20 | | | Ending
Account
Value
8/31/20 | | | Expenses
Paid for the
6 months ended
8/31/20* | | | Beginning
Account
Value
3/1/20 | | | Ending
Account
Value
8/31/20 | | | Expenses
Paid for the
6 months ended
8/31/20* | |
| Class A | | | | | | | | | | | | | | | | | | | | | | | | | | | | | | | | | | | | |
Actual | | $ | 1,000.00 | | | $ | 1,123.80 | | | $ | 2.56 | | | $ | 1,000.00 | | | $ | 1,122.20 | | | $ | 2.56 | | | $ | 1,000.00 | | | $ | 1,124.60 | | | $ | 2.56 | |
Hypothetical 5% return | | | 1,000.00 | | | | 1,022.47 | + | | | 2.44 | | | | 1,000.00 | | | | 1,022.47 | + | | | 2.44 | | | | 1,000.00 | | | | 1,022.47 | + | | | 2.44 | |
| Institutional | | | | | | | | | | | | | | | | | | | | | | | | | | | | | | | | | | | | |
Actual | | | 1,000.00 | | | | 1,125.30 | | | | 0.59 | | | | 1,000.00 | | | | 1,124.90 | | | | 0.53 | | | | 1,000.00 | | | | 1,126.30 | | | | 0.59 | |
Hypothetical 5% return | | | 1,000.00 | | | | 1,024.58 | + | | | 0.56 | | | | 1,000.00 | | | | 1,024.63 | + | | | 0.51 | | | | 1,000.00 | | | | 1,024.58 | + | | | 0.56 | |
| Service | | | | | | | | | | | | | | | | | | | | | | | | | | | | | | | | | | | | |
Actual | | | 1,000.00 | | | | 1,123.40 | | | | 3.31 | | | | 1,000.00 | | | | 1,120.90 | | | | 3.25 | | | | 1,000.00 | | | | 1,123.50 | | | | 3.26 | |
Hypothetical 5% return | | | 1,000.00 | | | | 1,021.82 | + | | | 3.15 | | | | 1,000.00 | | | | 1,021.82 | + | | | 3.10 | | | | 1,000.00 | | | | 1,021.82 | + | | | 3.10 | |
| Investor | | | | | | | | | | | | | | | | | | | | | | | | | | | | | | | | | | | | |
Actual | | | 1,000.00 | | | | 1,124.40 | | | | 1.23 | | | | 1,000.00 | | | | 1,123.00 | | | | 1.23 | | | | 1,000.00 | | | | 1,126.50 | | | | 1.23 | |
Hypothetical 5% return | | | 1,000.00 | | | | 1,023.98 | + | | | 1.17 | | | | 1,000.00 | | | | 1,024.03 | + | | | 1.17 | | | | 1,000.00 | | | | 1,024.03 | + | | | 1.17 | |
| Class R6 | | | | | | | | | | | | | | | | | | | | | | | | | | | | | | | | | | | | |
Actual | | | 1,000.00 | | | | 1,126.40 | | | | 0.43 | | | | 1,000.00 | | | | 1,124.50 | | | | 0.37 | | | | 1,000.00 | | | | 1,126.30 | | | | 0.43 | |
Hypothetical 5% return | | | 1,000.00 | | | | 1,024.73 | + | | | 0.41 | | | | 1,000.00 | | | | 1,024.78 | + | | | 0.36 | | | | 1,000.00 | | | | 1,024.78 | + | | | 0.41 | |
| Class R | | | | | | | | | | | | | | | | | | | | | | | | | | | | | | | | | | | | |
Actual | | | 1,000.00 | | | | 1,123.60 | | | | 3.95 | | | | 1,000.00 | | | | 1,121.50 | | | | 3.89 | | | | 1,000.00 | | | | 1,123.70 | | | | 3.95 | |
Hypothetical 5% return | | | 1,000.00 | | | | 1,021.22 | + | | | 3.76 | | | | 1,000.00 | | | | 1,021.22 | + | | | 3.71 | | | | 1,000.00 | | | | 1,021.22 | + | | | 3.76 | |
| * | | Expenses for each share class are calculated using each Portfolio’s annualized net expense ratio for each class, which represents the ongoing expenses as a percentage of net assets for the six months ended August 31, 2020. Expenses are calculated by multiplying the annualized net expense ratio by the average account value for the period; then multiplying the result by the number of days in the most recent fiscal half year; and then dividing that result by the number of days in the fiscal year. The annualized net expense ratios for the period were as follows: |
| | | | | | | | | | | | | | | | | | | | | | | | |
| Portfolios | | Class A | | | Institutional | | | Service | | | Investor | | | Class R6 | | | Class R | |
Target Date 2050 Portfolio | | | 0.48 | % | | | 0.11 | % | | | 0.62 | % | | | 0.23 | % | | | 0.08 | % | | | 0.74 | % |
Target Date 2055 Portfolio | | | 0.48 | | | | 0.10 | | | | 0.61 | | | | 0.23 | | | | 0.07 | | | | 0.73 | |
Target Date 2060 Portfolio | | | 0.48 | | | | 0.11 | | | | 0.61 | | | | 0.23 | | | | 0.08 | | | | 0.74 | |
| + | | Hypothetical expenses are based on each Portfolio’s actual annualized net expense ratios and an assumed rate of return of 5% per year before expenses. |
134
GOLDMAN SACHS TARGET DATE PORTFOLIOS
Statement Regarding Basis for Approval of Management Agreement (Unaudited)
Background
The Goldman Sachs Target Date Retirement Portfolio, Goldman Sachs Target Date 2025 Portfolio, Goldman Sachs Target Date 2030 Portfolio, Goldman Sachs Target Date 2035 Portfolio, Goldman Sachs Target Date 2040 Portfolio, Goldman Sachs Target Date 2045 Portfolio, Goldman Sachs Target Date 2050 Portfolio, Goldman Sachs Target Date 2055 Portfolio, and Goldman Sachs Target Date 2060 Portfolio (the “Portfolios”) are investment portfolios of Goldman Sachs Trust II (the “Trust”). Each of the Goldman Sachs Target Date Retirement, 2030, 2040, and 2050 Portfolios were successors to corresponding series of the Madison Target Retirement Funds (collectively, the “Predecessor Funds”). Each Predecessor Fund was managed by Madison Asset Management, LLC (“Madison”) and had an investment objective and strategy similar to that of the applicable Portfolio, and was reorganized into the applicable Portfolio on August 22, 2016.
The Board of Trustees oversees the management of the Trust and reviews the investment performance and expenses of the Portfolios at regularly scheduled meetings held throughout the year. In addition, the Board of Trustees determines annually whether to approve the continuance of the Trust’s investment management agreement (the “Management Agreement”) with Goldman Sachs Asset Management, L.P. (the “Investment Adviser”) on behalf of the Portfolios. The Management Agreement was most recently approved for continuation until August 31, 2021 by the Board of Trustees, including those Trustees who are not parties to the Management Agreement or “interested persons” (as defined in the Investment Company Act of 1940, as amended) of any party thereto (the “Independent Trustees”), at a meeting held on August 10-11, 2020 (the “Annual Meeting”).
The review process undertaken by the Trustees spans the course of the year and culminates with the Annual Meeting. To assist the Trustees in their deliberations, the Trustees have established a Contract Review Committee (the “Committee”), comprised of the Independent Trustees. The Committee held five meetings over the course of the year since the Management Agreement was last approved. At those Committee meetings, regularly scheduled Board or other committee meetings, and/or the Annual Meeting, matters relevant to the renewal of the Management Agreement were considered by the Board, or the Independent Trustees, as applicable. With respect to each Portfolio, such matters included:
| | (a) | | the nature and quality of the advisory, administrative, and other services provided to the Portfolio and certain underlying exchange-traded funds (“ETFs”) managed by the Investment Adviser in which the Portfolio invests (the “Underlying Funds”) by the Investment Adviser and its affiliates, including information about: |
| | (i) | | the structure, staff, and capabilities of the Investment Adviser and its portfolio management teams; |
| | (ii) | | the groups within the Investment Adviser and its affiliates that support the portfolio management teams or provide other types of necessary services, including fund services groups (e.g., accounting and financial reporting, tax, shareholder services, and operations); controls and risk management groups (e.g., legal, compliance, valuation oversight, credit risk management, internal audit, compliance testing, market risk analysis, finance, and central funding); sales and distribution support groups, and others (e.g., information technology and training); |
| | (iii) | | trends in employee headcount; |
| | (iv) | | the Investment Adviser’s financial resources and ability to hire and retain talented personnel and strengthen its operations; and |
| | (v) | | the parent company’s support of the Investment Adviser and its mutual fund business, as expressed by the firm’s senior management; |
| | (b) | | information on the investment performance of the Portfolio, including comparisons to the performance of similar mutual funds, as provided by a third-party mutual fund data provider engaged as part of the contract review process (the “Outside Data Provider”), and a benchmark performance index; and information on general investment outlooks in the markets in which the Portfolio and the Underlying Funds invest; |
| | (c) | | information provided by the Investment Adviser indicating the Investment Adviser’s views on whether the Portfolio’s peer group and/or benchmark index had high, medium, or low relevance given the Portfolio’s particular investment strategy; |
| | (d) | | the terms of the Management Agreement and other agreements with affiliated service providers entered into by the Trust on behalf of the Portfolio; |
| | (e) | | fee and expense information for the Portfolio, including: |
| | (i) | | the relative management fee and expense levels of the Portfolio as compared to those of comparable funds managed by other advisers, as provided by the Outside Data Provider; and |
| | (ii) | | the Portfolio’s expense trends over time; |
| | (f) | | with respect to the investment performance and expense comparison data provided by the Outside Data Provider, its processes in producing that data for the Portfolio; |
| | (g) | | the undertakings of the Investment Adviser and its affiliates to implement fee waivers and/or expense limitations; |
135
GOLDMAN SACHS TARGET DATE PORTFOLIOS
Statement Regarding Basis for Approval of Management Agreement (Unaudited) (continued)
| | (h) | | information relating to the profitability of the Management Agreement and the transfer agency, distribution and service arrangements of the Portfolio to the Investment Adviser and its affiliates; |
| | (i) | | whether the Portfolio’s existing management fee schedule adequately addressed any economies of scale; |
| | (j) | | a summary of the “fall-out” benefits derived by the Investment Adviser and its affiliates from their relationships with the Portfolio, including the fees received by the Investment Adviser’s affiliates from the Portfolio for transfer agency, portfolio trading, distribution and other services; |
| | (k) | | a summary of potential benefits derived by the Portfolio as a result of its relationship with the Investment Adviser; |
| | (l) | | portfolio manager ownership of Portfolio shares; the manner in which portfolio manager compensation is determined; and the number and types of accounts managed by the portfolio managers; |
| | (m) | | the nature and quality of the services provided to the Portfolio by its unaffiliated service providers, and the Investment Adviser’s general oversight and evaluation (including reports on due diligence) of those service providers as part of the administrative services provided under the Management Agreement; and |
| | (n) | | the Investment Adviser’s processes and policies addressing various types of potential conflicts of interest; its approach to risk management; the annual review of the effectiveness of the Portfolio’s compliance program; and periodic compliance reports. |
The Trustees also received an overview of the Portfolios’ distribution arrangements. They received information regarding the Portfolios’ assets, share purchase and redemption activity, and payment of distribution, service, and shareholder administration fees, as applicable. Information was also provided to the Trustees relating to revenue sharing payments made by and services provided by the Investment Adviser and its affiliates to intermediaries that promote the sale, distribution, and/or servicing of Portfolio shares. The Independent Trustees also discussed the broad range of other investment choices that are available to Portfolio investors, including the availability of comparable funds managed by other advisers.
The presentations made at the Board and Committee meetings and at the Annual Meeting encompassed the Portfolios and other mutual funds for which the Board of Trustees has responsibility. In evaluating the Management Agreement at the Annual Meeting, the Trustees relied upon their knowledge, resulting from their meetings and other interactions throughout the year, of the Investment Adviser and its affiliates, their services, and the Portfolios. In conjunction with these meetings, the Trustees received written materials and oral presentations on the topics covered, and the Investment Adviser addressed the questions and concerns of the Trustees, including concerns regarding the investment performance of certain of the funds they oversee. The Independent Trustees were advised by their independent legal counsel regarding their responsibilities and other regulatory requirements related to the approval and continuation of mutual fund investment management agreements under applicable law. In addition, the Investment Adviser and its affiliates provided the Independent Trustees with a written response to a formal request for information sent on behalf of the Independent Trustees by their independent legal counsel. During the course of their deliberations, the Independent Trustees met in executive sessions with their independent legal counsel, without representatives of the Investment Adviser or its affiliates present.
Nature, Extent, and Quality of the Services Provided Under the Management Agreement
As part of their review, the Trustees considered the nature, extent, and quality of the services provided to the Portfolios by the Investment Adviser. In this regard, the Trustees considered both the investment advisory services and non-advisory services that are provided by the Investment Adviser and its affiliates. The Trustees noted the ongoing recruitment efforts aimed at bringing high quality investment talent to the Investment Adviser. They also noted the Investment Adviser’s commitment to maintaining high quality systems and expending substantial resources to respond to ongoing changes to the market, regulatory and control environment in which the Portfolios and the Underlying Funds and their service providers operate, including changes associated with the COVID-19 pandemic, as well as the efforts of the Investment Adviser and its affiliates to combat cyber security risks. The Trustees also considered information regarding the Investment Adviser’s business continuity planning and remote operations in the current environment. The Trustees concluded that the Investment Adviser continued to commit substantial financial and operational resources to the Portfolios and expressed confidence that the Investment Adviser would continue to do so in the future. The Trustees also recognized that the Investment Adviser had made significant commitments to address regulatory compliance requirements applicable to the Portfolios, the Underlying Funds, and the Investment Adviser and its affiliates.
Investment Performance
The Trustees considered the investment performance of the Portfolios. In this regard, they compared the investment performance of each Portfolio to its peers using rankings compiled by the Outside Data Provider, and updated performance information prepared by the Investment Adviser using the peer group identified by the Outside Data Provider. The Trustees also reviewed each Portfolio’s investment performance relative to its performance benchmark. As part of this review, they considered
136
GOLDMAN SACHS TARGET DATE PORTFOLIOS
Statement Regarding Basis for Approval of Management Agreement (Unaudited) (continued)
the investment performance trends of the Portfolios over time, and reviewed the investment performance of each Portfolio in light of its investment objective and policies and market conditions.
In addition, the Trustees considered materials prepared and presentations made by the Investment Adviser’s senior management and portfolio management personnel in which Portfolio performance was assessed. The Trustees also considered the Investment Adviser’s periodic reports with respect to the Portfolios’ risk profiles, and how the Investment Adviser’s approach to risk monitoring and management influences portfolio management.
The Trustees noted that the Goldman Sachs Target Date Retirement Portfolio had placed in the first quartile of its performance peer group for the one- and three-year periods, and had outperformed its benchmark index for the one-year period ended March 31, 2020. They noted that the Target Date Retirement Portfolio had been renamed from the Goldman Sachs Target Date 2020 Portfolio. The Trustees observed that the Goldman Sachs Target Date 2025 Portfolio had placed in the first quartile of its performance peer group for the one-year period and the second quartile for the three-year period, and had outperformed its benchmark index for the one-year period ended March 31, 2020. They noted that the Goldman Sachs Target Date 2030 Portfolio had placed in the first quartile of its performance peer group for the one-year period and the second quartile for the three-year period, and had outperformed its benchmark index for the one-year period ended March 31, 2020. The Trustees observed that the Goldman Sachs Target Date 2035 Portfolio had placed in the first quartile of its performance peer group for the one- and three-year periods, and had outperformed its benchmark index for the one-year period ended March 31, 2020. They noted that the Goldman Sachs Target Date 2040 Portfolio had placed in the first quartile of its performance peer group for the one-year period and the second quartile for the three-year period, and had outperformed its benchmark index for the one-year period ended March 31, 2020. The Trustees noted that the Goldman Sachs Target Date 2045 Portfolio had placed in the third quartile of its performance peer group for the one- and three-year periods, and had underperformed its benchmark index for the one-year period ended March 31, 2020. They observed that the Goldman Sachs Target Date 2050 Portfolio had placed in the third quartile of its performance peer group for the one- and three-year periods, and had underperformed its benchmark index for the one-year period ended March 31, 2020. The Trustees noted that the Goldman Sachs Target Date 2055 Portfolio had placed in the second quartile of its performance peer group for the one-year period and third quartile for the three-year period, and had outperformed its benchmark index for the one-year period ended March 31, 2020. They observed that the Goldman Sachs Target Date 2060 Portfolio had placed in the first quartile of its performance peer group and had outperformed its benchmark index for the one-year period ended March 31, 2020.
They considered that, since assuming day-to-day management responsibility for the Portfolios from Madison in 2018, the Investment Adviser had made certain enhancements to each Portfolio’s glide path strategy, which were designed to improve long-term performance. The Trustees observed that the Portfolios invested in the Underlying Funds, which helped to reduce the cost of the Portfolios. The Trustees also noted that the Portfolios had experienced certain portfolio management changes in 2019.
Costs of Services Provided and Competitive Information
The Trustees considered the contractual terms of the Management Agreement and the fee rates payable by each Portfolio thereunder. In this regard, the Trustees considered information on the services rendered by the Investment Adviser to the Portfolios, which included both advisory and administrative services that were directed to the needs and operations of the Portfolios as registered mutual funds.
In particular, the Trustees reviewed analyses prepared by the Outside Data Provider regarding the expense rankings of the Portfolios. The analyses provided a comparison of each Portfolio’s management fee and breakpoints to those of a relevant peer group and category universe; an expense analysis which compared each Portfolio’s overall net and gross expenses to a peer group and a category universe; and data comparing each Portfolio’s net expenses to the peer and category medians. The analyses also compared each Portfolio’s other expenses and fee waivers/reimbursements to those of the peer group and category medians. The Trustees concluded that the comparisons provided by the Outside Data Provider were useful in evaluating the reasonableness of the management fees and total expenses paid by the Portfolios.
In addition, the Trustees considered the Investment Adviser’s undertakings to implement fee waivers (including a waiver of the amount of management fees associated with investments in the Underlying Funds) and/or expense limitations. In addition, the Trustees noted that shareholders are able to redeem their Portfolio shares at any time if shareholders believe that the Portfolio fees and expenses are too high or if they are dissatisfied with the performance of the Portfolio.
The Investment Adviser’s Profitability
The Trustees reviewed each Portfolio’s contribution to the Investment Adviser’s revenues and pre-tax profit margins. In this regard the Trustees noted that they had received, among other things, profitability analyses and summaries, revenue and expense schedules by Portfolio and by function (i.e., investment management, transfer agency, and distribution and service), and
137
GOLDMAN SACHS TARGET DATE PORTFOLIOS
Statement Regarding Basis for Approval of Management Agreement (Unaudited) (continued)
information on the Investment Adviser’s expense allocation methodology. They observed that the profitability and expense figures are substantially similar to those used by the Investment Adviser for many internal purposes, including compensation decisions among various business groups, and are thus subject to a vigorous internal debate about how certain revenue and expenses should be allocated.
The Trustees also noted that the internal audit group within the Goldman Sachs organization periodically audits the expense allocation methodology and that the internal audit group was satisfied with the reasonableness, consistency, and accuracy of the Investment Adviser’s expense allocation methodology. Profitability data for each Portfolio was provided for 2019 and 2018, and the Trustees considered this information in relation to the Investment Adviser’s overall profitability.
Economies of Scale
The Trustees considered the information that had been provided regarding whether there have been economies of scale with respect to the management of the Portfolios. The Trustees also considered the breakpoints in the fee rate payable under the Management Agreement for each of the Portfolios at the following annual percentage rates of the average daily net assets of the Portfolios:
| | | | |
| Average Daily Net Assets | | Management Fee Annual Rate | |
| |
First $2 billion | | | 0.25 | % |
| |
Next $3 billion | | | 0.23 | % |
| |
Over $5 billion | | | 0.21 | % |
The Trustees noted that the breakpoints were designed to share potential economies of scale, if any, with the Portfolios and their shareholders as assets under management reach those asset levels. The Trustees considered the amounts of assets in the Portfolios; the Portfolios’ recent share purchase and redemption activity; the information provided by the Investment Adviser relating to the costs of the services provided by the Investment Adviser and its affiliates and their realized profits; information comparing fee rates charged by the Investment Adviser with fee rates charged to other funds in the peer group; and the Investment Adviser’s undertakings to waive a portion of its management fee (including a waiver of the amount of management fees associated with investments in the Underlying Funds) and to limit certain expenses of the Portfolios that exceed specified levels, as well as Goldman Sachs & Co. LLC’s (“Goldman Sachs”) undertaking to waive a portion of the transfer agency fees paid by the Class R6 Shares of the Portfolios. Upon reviewing these matters at the Annual Meeting, the Trustees concluded that the fee breakpoints represented a means of assuring that benefits of scalability, if any, would be passed along to shareholders at the specified asset levels.
Other Benefits to the Investment Adviser and Its Affiliates
The Trustees also considered the other benefits derived by the Investment Adviser and its affiliates from their relationships with the Portfolios as stated above, including: (a) transfer agency fees received by Goldman Sachs; (b) the Investment Adviser’s ability to leverage the infrastructure designed to service the Portfolios on behalf of its other clients; (c) the Investment Adviser’s ability to cross-market other products and services to Portfolio shareholders; (d) Goldman Sachs’ retention of certain fees as Portfolio Distributor; (e) the Investment Adviser’s ability to negotiate better pricing with the Portfolios’ custodian on behalf of its other clients, as a result of the relationship with the Portfolios; (f) the investment of cash in money market funds managed by the Investment Adviser that will result in increased assets under management for those money market funds; (g) the investment in the Underlying Funds that will result in increased assets under management for those Underlying Funds and may facilitate the development of the Investment Adviser’s ETF advisory business; and (h) the possibility that the working relationship between the Investment Adviser and the Portfolios’ third-party service providers may cause those service providers to be more likely to do business with other areas of Goldman Sachs. In the course of considering the foregoing, the Independent Trustees requested and received further information quantifying certain of these fall-out benefits.
Other Benefits to the Portfolios and Their Shareholders
The Trustees also noted that the Portfolios receive certain other potential benefits as a result of their relationship with the Investment Adviser, including: (a) enhanced servicing from vendors due to the volume of business generated by the Investment Adviser and its affiliates; (b) the advantages received from the Investment Adviser’s knowledge and experience gained from managing other accounts and products; (c) the Investment Adviser’s ability to hire and retain qualified personnel to provide services to the Portfolios because of the reputation of the Goldman Sachs organization; (d) the Portfolios’ access, through the
138
GOLDMAN SACHS TARGET DATE PORTFOLIOS
Statement Regarding Basis for Approval of Management Agreement (Unaudited) (continued)
Investment Adviser, to certain firm-wide resources (e.g., proprietary risk management systems and databases), subject to certain restrictions; and (e) access to certain affiliated distribution channels.
Conclusion
In connection with their consideration of the Management Agreement, the Trustees gave weight to each of the factors described above, but did not identify any particular factor as controlling their decision. After deliberation and consideration of all of the information provided, including the factors described above, the Trustees concluded, in the exercise of their business judgment, that the management fees paid by each of the Portfolios were reasonable in light of the services provided to it by the Investment Adviser, the Investment Adviser’s costs and each Portfolio’s current and reasonably foreseeable asset levels. The Trustees unanimously concluded that the Investment Adviser’s continued management likely would benefit each Portfolio and its shareholders, and that the Management Agreement should be approved and continued with respect to each Portfolio until August 31, 2021.
139
GOLDMAN SACHS TARGET DATE PORTFOLIOS
Trustees and Officers (Unaudited)
Independent Trustees
| | | | | | | | | | |
Name,
Address and Age1 | | Position(s) Held
with the Trust | | Term of
Office and
Length of
Time Served2 | | Principal Occupation(s)
During Past 5 Years | | Number of
Portfolios in
Fund Complex
Overseen by
Trustee3 | | Other
Directorships
Held by Trustee4 |
| | | | | |
Cheryl K. Beebe Age: 64 | | Chair of the Board of Trustees | | Since 2017 (Trustee since 2015) | | Ms. Beebe is retired. She is Director, Packaging Corporation of America (2008-Present); Director, The Mosaic Company (2019-Present); and was formerly Director, Convergys Corporation (a global leader in customer experience outsourcing) (2015-2018); and formerly held the position of Executive Vice President, (2010-2014); and Chief Financial Officer, Ingredion, Inc. (a leading global ingredient solutions company) (2004-2014). Chair of the Board of Trustees — Goldman Sachs Trust II. | | 19 | | Packaging Corporation of America (producer of container board); The Mosaic Company (producer of phosphate and potash fertilizer) |
| | | | | |
Lawrence Hughes Age: 62 | | Trustee | | Since 2016 | | Mr. Hughes is retired. Formerly, he held senior management positions with BNY Mellon Wealth Management, a division of The Bank of New York Mellon Corporation (a financial services company) (1991-2015), most recently as Chief Executive Officer (2010-2015). He serves as a Member of the Board of Directors, (2012-Present) and formerly served as Chairman (2012-2019), Ellis Memorial and Eldredge House (a not-for-profit organization). Previously, Mr. Hughes served as an Advisory Board Member of Goldman Sachs Trust II (February 2016-April 2016). Trustee — Goldman Sachs Trust II. | | 19 | | None |
| | | | | |
John F. Killian Age: 65 | | Trustee | | Since 2015 | | Mr. Killian is retired. He is Director, Consolidated Edison, Inc. (2007-Present); Director, Houghton Mifflin Harcourt Publishing Company (2011-Present); and formerly held senior management positions with Verizon Communications, Inc., including Executive Vice President and Chief Financial Officer (2009-2010); and President, Verizon Business, Verizon Communications, Inc. (2005-2009). Trustee — Goldman Sachs Trust II. | | 19 | | Consolidated Edison, Inc. (a utility holding company); Houghton Mifflin Harcourt Publishing Company |
| | | | | |
Steven D. Krichmar Age: 62 | | Trustee | | Since 2018 | | Mr. Krichmar is retired. Formerly, he held senior management and governance positions with Putnam Investments, LLC, a financial services company (2001-2016). He was most recently Chief of Operations and a member of the Operating Committee of Putnam Investments, LLC and Principal Financial Officer of The Putnam Funds. Previously, Mr. Krichmar served as an Audit Partner with PricewaterhouseCoopers LLP and its predecessor company (1990-2001). Trustee — Goldman Sachs Trust II. | | 19 | | None |
| | | | | | | | | | |
140
GOLDMAN SACHS TARGET DATE PORTFOLIOS
Trustees and Officers (Unaudited) (continued)
Interested Trustee*
| | | | | | | | | | |
Name,
Address and Age1 | | Position(s) Held
with the Trust | | Term of
Office and
Length of
Time Served2 | | Principal Occupation(s)
During Past 5 Years | | Number of
Portfolios in
Fund Complex
Overseen by
Trustee3 | | Other
Directorships
Held by Trustee4 |
| | | | | |
| James A. McNamara Age: 57 | | President and Trustee | | Since 2012 | | Advisory Director, Goldman Sachs (January 2018-Present); Managing Director, Goldman Sachs (January 2000-December 2017); Director of Institutional Fund Sales, GSAM (April 1998-December 2000); and Senior Vice President and Manager, Dreyfus Institutional Service Corporation (January 1993-April 1998). President and Trustee — Goldman Sachs Trust II; Goldman Sachs Trust; Goldman Sachs Variable Insurance Trust; Goldman Sachs MLP Income Opportunities Fund; Goldman Sachs MLP and Energy Renaissance Fund; Goldman Sachs ETF Trust; Goldman Sachs Credit Income Fund; and Goldman Sachs Real Estate Diversified Income Fund. | | 168 | | None |
| | | | | | | | | | |
| * | | Mr. McNamara is considered to be an “Interested Trustee” because he holds positions with Goldman Sachs and owns securities issued by The Goldman Sachs Group, Inc. He holds comparable positions with certain other companies of which Goldman Sachs, GSAM or an affiliate thereof is the investment adviser, administrator and/or distributor. |
| 1 | | Each Trustee may be contacted by writing to the Trustee, c/o Goldman Sachs, 200 West Street, New York, New York, 10282, Attn: Caroline Kraus. Information is provided as of August 31, 2020. |
| 2 | | Subject to such policies as may be adopted by the Board from time-to-time, each Trustee holds office for an indefinite term, until the earliest of: (a) the election of his or her successor; (b) the date the Trustee resigns or is removed by the Board or shareholders, in accordance with the Trust’s Declaration of Trust; or (c) the termination of the Trust. The Board has adopted policies which provide that (a) no Trustee shall hold office for more than 15 years and (b) a Trustee shall retire as of December 31st of the calendar year in which he or she reaches his or her 74th birthday, unless a waiver of such requirement shall have been adopted by a majority of the other Trustees. These policies may be changed by the Trustees without shareholder vote. |
| 3 | | The Goldman Sachs Fund Complex includes certain other companies listed above for each respective Trustee. As of August 31, 2020, Goldman Sachs Trust II consisted of 19 portfolios (17 of which offered shares to the public); Goldman Sachs Trust consisted of 90 portfolios (89 of which offered shares to the public); Goldman Sachs Variable Insurance Trust consisted of 13 portfolios; Goldman Sachs ETF Trust consisted of 42 portfolios (23 of which offered shares to the public); and Goldman Sachs MLP Income Opportunities Fund, Goldman Sachs MLP and Energy Renaissance Fund, Goldman Sachs Credit Income Fund and Goldman Sachs Real Estate Diversified Income Fund each consisted of one portfolio. Goldman Sachs Credit Income Fund did not offer shares to the public. |
| 4 | | This column includes only directorships of companies required to report to the Securities and Exchange Commission under the Securities Exchange Act of 1934 (i.e., “public companies”) or other investment companies registered under the Act. |
Additional information about the Trustees is available in the Portfolios’ Statement of Additional Information, which can be obtained from Goldman Sachs free of charge by calling this toll-free number (in the United States of America): 1-800-526-7384.
141
GOLDMAN SACHS TARGET DATE PORTFOLIOS
Trustees and Officers (Unaudited) (continued)
Officers of the Trust*
| | | | | | |
| Name, Address and Age1 | | Position(s) Held
with the Trust | | Term of
Office and
Length of
Time Served2 | | Principal Occupation(s) During Past 5 Years |
| | | |
James A. McNamara 200 West Street New York, NY 10282 Age: 57 | | Trustee and President | | Since 2012 | | Advisory Director, Goldman Sachs (January 2018-Present); Managing Director, Goldman Sachs (January 2000-December 2017); Director of Institutional Fund Sales, GSAM (April 1998-December 2000); and Senior Vice President and Manager, Dreyfus Institutional Service Corporation (January 1993-April 1998). President and Trustee — Goldman Sachs Trust II; Goldman Sachs Trust; Goldman Sachs Variable Insurance Trust; Goldman Sachs MLP Income Opportunities Fund; Goldman Sachs MLP and Energy Renaissance Fund; Goldman Sachs ETF Trust; Goldman Sachs Credit Income Fund; and Goldman Sachs Real Estate Diversified Income Fund. |
| | | |
Caroline L. Kraus 200 West Street New York, NY 10282 Age: 43 | | Secretary | | Since 2012 | | Managing Director, Goldman Sachs (January 2016-Present); Vice President, Goldman Sachs (August 2006-December 2015); Senior Counsel, Goldman Sachs (January 2020–Present); Associate General Counsel, Goldman Sachs (2012-December 2019); Assistant General Counsel, Goldman Sachs (August 2006-December 2011); and Associate, Weil, Gotshal & Manges, LLP (2002-2006). Secretary — Goldman Sachs Trust II; Goldman Sachs Trust (previously Assistant Secretary (2012)); Goldman Sachs Variable Insurance Trust (previously Assistant Secretary (2012)); Goldman Sachs BDC, Inc.; Goldman Sachs Private Middle Market Credit LLC; Goldman Sachs Private Middle Market Credit II LLC; Goldman Sachs Middle Market Lending Corp.; Goldman Sachs MLP Income Opportunities Fund; Goldman Sachs MLP and Energy Renaissance Fund; Goldman Sachs ETF Trust; Goldman Sachs Credit Income Fund; and Goldman Sachs Real Estate Diversified Income Fund. |
| | | |
Joseph F. DiMaria 30 Hudson Street Jersey City, NJ 07302 Age: 52 | | Treasurer, Principal Financial Officer and Principal Accounting Officer | | Since 2017 (Treasurer and Principal Financial Officer Since 2019) | | Managing Director, Goldman Sachs (November 2015-Present) and Vice President — Mutual Fund Administration, Columbia Management Investment Advisers, LLC (May 2010-October 2015). Treasurer, Principal Financial Officer and Principal Accounting Officer — Goldman Sachs Trust II (previously Assistant Treasurer (2017)); Goldman Sachs Trust (previously Assistant Treasurer (2016)); Goldman Sachs Variable Insurance Trust (previously Assistant Treasurer (2016)); Goldman Sachs MLP Income Opportunities Fund (previously Assistant Treasurer (2017)); Goldman Sachs MLP and Energy Renaissance Fund (previously Assistant Treasurer (2017)); Goldman Sachs ETF Trust (previously Assistant Treasurer (2017)); Goldman Sachs Credit Income Fund; and Goldman Sachs Real Estate Diversified Income Fund. |
| | | | | | |
| * | | Represents a partial list of officers of the Trust. Additional information about all the officers is available in the Portfolios’ Statement of Additional Information, which can be obtained from Goldman Sachs free of charge by calling this toll-free number (in the United States): 1-800-526-7384. |
| 1 | | Information is provided as of August 31, 2020. |
| 2 | | Officers hold office at the pleasure of the Board of Trustees or until their successors are duly elected and qualified. Each officer holds comparable positions with certain other companies of which Goldman Sachs, GSAM or an affiliate thereof is the investment adviser, administrator and/or distributor. |
142
GOLDMAN SACHS TARGET DATE PORTFOLIOS
Goldman Sachs Trust II — Goldman Sachs Target Date Portfolios — Tax Information (Unaudited)
For the fiscal year ended August 31, 2020, 13.17%, 17.54%, 25.19%, 24.72%, 29.42%, 32.48%, 33.55%, 34.53%, and 32.63% of the dividends paid from net investment company taxable income by the Target Date Retirement Portfolio, Target Date 2025, Target Date 2030, Target Date 2035, Target Date 2040, Target Date 2045, Target Date 2050, Target Date 2055, and Target Date 2060 respectively, qualify for the dividends received deduction available to corporations.
From distributions paid during the fiscal year ended August 31, 2020, the total amount of income received by the Target Date Retirement Portfolio, Target Date 2025, Target Date 2030, Target Date 2035, Target Date 2040, Target Date 2045, Target Date 2050, Target Date 2055, and Target Date 2060 Portfolios from sources within foreign countries and possessions of the United States was $0.0677, $0.0839, $0.0725, $0.0929, $0.0829, $0.1134, $0.1008, $0.1098, and $0.1175 per share, respectively, all of which is attributable to qualified passive income. The percentage of net investment income dividends paid from foreign sources by the Target Date Retirement Portfolio, Target Date 2025, Target Date 2030, Target Date 2035, Target Date 2040, Target Date 2045, Target Date 2050, Target Date 2055, and Target Date 2060 Portfolios was 28.08%, 30.51%, 32.27%, 34.40%, 38.49%, 43.43%, 43.14%, 43.35%, and 43.46% respectively. The total amount of taxes paid by the Target Date Retirement Portfolio, Target Date 2025, Target Date 2030, Target Date 2035, Target Date 2040, Target Date 2045, Target Date 2050, Target Date 2055, and Target Date 2060 Portfolios to such countries was $0.0032, $0.0045, $0.0040, $0.0058, $0.0056, $0.0086, $0.0078, $0.0083, and $0.0091 per share, respectively.
For the fiscal year ended August 31, 2020, the Target Date Retirement Portfolio, Target Date 2025, Target Date 2030, Target Date 2035, Target Date 2040, Target Date 2045, Target Date 2050, Target Date 2055, and Target Date 2060 Portfolios designate 26.79%, 35.66%, 41.26%, 47.71%, 58.23%, 66.13%, 72.80%, 65.74%, and 64.65%, respectively, of the dividends paid from net investment company taxable income as qualifying for the reduced tax rate under the Jobs and Growth Tax Relief and Reconciliation Act of 2003.
Pursuant to Section 852 of the Internal Revenue Code, the Target Date Retirement Portfolio, Target Date 2025, Target Date 2030, Target Date 2035, Target Date 2040, Target Date 2045, Target Date 2050 and Target Date 2055 Portfolios designate $114,853, $257,693, $763,071, $497,818, $1,037,947, $648,859, $973,358, and $774,850, respectively, or, if different, the maximum amount allowable, as capital gain dividends paid during the fiscal year ended August 31, 2020.
During the fiscal year ended August 31, 2020, Target Date 2030, designated $62, as short-term capital gain dividends pursuant to Section 871(k) of the Internal Revenue Code.
143
FUNDS PROFILE
Goldman Sachs Funds
Goldman Sachs is a premier financial services firm, known since 1869 for creating thoughtful and customized investment solutions in complex global markets.
Today, the Consumer and Investment Management Division of Goldman Sachs serves a diverse set of clients worldwide, including private institutions, public entities and individuals. With approximately $1.88 trillion in assets under supervision as of June 30, 2020, Goldman Sachs Asset Management (“GSAM”) has portfolio management teams located around the world and our investment professionals bring firsthand knowledge of local markets to every investment decision. Assets under supervision includes assets under management and other client assets for which Goldman Sachs does not have full discretion. GSAM leverages the resources of Goldman Sachs & Co. LLC subject to legal, internal and regulatory restrictions.
Money Market
Financial Square FundsSM
| ∎ | | Financial Square Treasury Solutions Fund1 |
| ∎ | | Financial Square Government Fund1 |
| ∎ | | Financial Square Money Market Fund2 |
| ∎ | | Financial Square Prime Obligations Fund2 |
| ∎ | | Financial Square Treasury Instruments Fund1 |
| ∎ | | Financial Square Treasury Obligations Fund1 |
| ∎ | | Financial Square Federal Instruments Fund1 |
Investor FundsSM
| ∎ | | Investor Money Market Fund3 |
| ∎ | | Investor Tax-Exempt Money Market Fund3 |
Fixed Income
Short Duration and Government
| ∎ | | High Quality Floating Rate Fund |
| ∎ | | Short-Term Conservative Income Fund |
| ∎ | | Short Duration Government Fund |
| ∎ | | Short Duration Income Fund |
| ∎ | | Inflation Protected Securities Fund |
Multi-Sector
| ∎ | | Global Core Fixed Income Fund4 |
Municipal and Tax-Free
| ∎ | | High Yield Municipal Fund |
| ∎ | | Dynamic Municipal Income Fund |
| ∎ | | Short Duration Tax-Free Fund |
| ∎ | | Municipal Income Completion Fund |
Single Sector
| ∎ | | Investment Grade Credit Fund |
| ∎ | | High Yield Floating Rate Fund |
| ∎ | | Emerging Markets Debt Fund |
| ∎ | | Local Emerging Markets Debt Fund |
Fixed Income Alternatives
| ∎ | | Long Short Credit Strategies Fund |
Fundamental Equity
| ∎ | | Small/Mid Cap Value Fund |
| ∎ | | Small/Mid Cap Growth Fund |
| ∎ | | Concentrated Growth Fund |
| ∎ | | Technology Opportunities Fund |
| ∎ | | Growth Opportunities Fund |
| ∎ | | Rising Dividend Growth Fund |
Tax-Advantaged Equity
| ∎ | | U.S. Tax-Managed Equity Fund |
| ∎ | | International Tax-Managed Equity Fund |
| ∎ | | U.S. Equity Dividend and Premium Fund |
| ∎ | | International Equity Dividend and Premium Fund |
Equity Insights
| ∎ | | Small Cap Equity Insights Fund |
| ∎ | | U.S. Equity Insights Fund |
| ∎ | | Small Cap Growth Insights Fund |
| ∎ | | Large Cap Growth Insights Fund |
| ∎ | | Large Cap Value Insights Fund |
| ∎ | | Small Cap Value Insights Fund |
| ∎ | | International Small Cap Insights Fund |
| ∎ | | International Equity Insights Fund |
| ∎ | | Emerging Markets Equity Insights Fund |
Fundamental Equity International
| ∎ | | International Equity Income Fund |
| ∎ | | International Equity ESG Fund |
| ∎ | | Emerging Markets Equity Fund |
| ∎ | | Imprint Emerging Markets Opportunities Fund |
| ∎ | | ESG Emerging Markets Equity Fund |
Alternative
| ∎ | | Real Estate Securities Fund |
| ∎ | | International Real Estate Securities Fund |
| ∎ | | Commodity Strategy Fund |
| ∎ | | Global Real Estate Securities Fund |
| ∎ | | Alternative Premia Fund |
| ∎ | | Absolute Return Tracker Fund |
| ∎ | | Managed Futures Strategy Fund |
| �� | | MLP Energy Infrastructure Fund |
| ∎ | | Energy Infrastructure Fund7 |
| ∎ | | Multi-Manager Alternatives Fund |
| ∎ | | Global Infrastructure Fund |
| ∎ | | Clean Energy Income Fund |
Total Portfolio Solutions
| ∎ | | Global Managed Beta Fund |
| ∎ | | Multi-Manager Non-Core Fixed Income Fund |
| ∎ | | Multi-Manager U.S. Dynamic Equity Fund |
| ∎ | | Multi-Manager Global Equity Fund |
| ∎ | | Multi-Manager International Equity Fund |
| ∎ | | Tactical Tilt Overlay Fund |
| ∎ | | Balanced Strategy Portfolio |
| ∎ | | Multi-Manager U.S. Small Cap Equity Fund |
| ∎ | | Multi-Manager Real Assets Strategy Fund |
| ∎ | | Growth and Income Strategy Portfolio |
| ∎ | | Growth Strategy Portfolio |
| ∎ | | Dynamic Global Equity Fund |
| ∎ | | Satellite Strategies Portfolio |
| ∎ | | Enhanced Dividend Global Equity Portfolio |
| ∎ | | Tax-Advantaged Global Equity Portfolio |
| ∎ | | Strategic Factor Allocation Fund |
| ∎ | | Target Date Retirement Portfolio8 |
| ∎ | | Target Date 2025 Portfolio |
| ∎ | | Target Date 2030 Portfolio |
| ∎ | | Target Date 2035 Portfolio |
| ∎ | | Target Date 2040 Portfolio |
| ∎ | | Target Date 2045 Portfolio |
| ∎ | | Target Date 2050 Portfolio |
| ∎ | | Target Date 2055 Portfolio |
| ∎ | | Target Date 2060 Portfolio |
| ∎ | | GQG Partners International Opportunities Fund |
| 1 | | You could lose money by investing in the Fund. Although the Fund seeks to preserve the value of your investment at $1.00 per share, it cannot guarantee it will do so. An investment in the Fund is not a deposit of a bank and is not insured or guaranteed by the Federal Deposit Insurance Corporation or any other government agency. The Fund’s sponsor has no legal obligation to provide financial support to the Fund, and you should not expect that the sponsor will provide financial support to the Fund at any time. |
| 2 | | You could lose money by investing in the Fund. Because the share price of the Fund will fluctuate, when you sell your shares they may be worth more or less than what you originally paid for them. The Fund may impose a fee upon sale of your shares or may temporarily suspend your ability to sell shares if the Fund’s liquidity falls below required minimums because of market conditions or other factors. An investment in the Fund is not a deposit of a bank and is not insured or guaranteed by the Federal Deposit Insurance Corporation or any other government agency. The Fund’s sponsor has no legal obligation to provide financial support to the Fund, and you should not expect that the sponsor will provide financial support to the Fund at any time. |
| 3 | | You could lose money by investing in the Fund. Although the Fund seeks to preserve the value of your investment at $1.00 per share, it cannot guarantee it will do so. The Fund may impose a fee upon sale of your shares or may temporarily suspend your ability to sell shares if the Fund’s liquidity falls below required minimums because of market conditions or other factors. An investment in the Fund is not a deposit of a bank and is not insured or guaranteed by the Federal Deposit Insurance Corporation or any other government agency. The Fund’s sponsor has no legal obligation to provide financial support to the Fund, and you should not expect that the sponsor will provide financial support to the Fund at any time. |
| 4 | | Effective after the close of business on April 30, 2020, the Goldman Sachs Global Income Fund was renamed the Goldman Sachs Global Core Fixed Income Fund. |
| 5 | | Effective after the close of business of August 30, 2020, the Goldman Sachs Blue Chip Fund was renamed the Goldman Sachs U.S. Equity ESG Fund. |
| 6 | | Effective after the close of business of November 20, 2019, the Goldman Sachs Asia Equity Fund was renamed the Goldman Sachs China Equity Fund. |
| 7 | | Effective after the close of business on June 26, 2020, the Goldman Sachs MLP & Energy Fund was renamed the Goldman Sachs Energy Infrastructure Fund. |
| 8 | | Effective December 27, 2019, the Goldman Sachs Target Date 2020 Portfolio was renamed the Goldman Sachs Target Date Retirement Portfolio. |
| | | Financial Square FundsSM and Investor FundsSM are registered service marks of Goldman Sachs & Co. LLC. |
| * | | This list covers open-end funds only. Please visit our website at www.GSAMFUNDS.com to learn about our closed-end funds and exchange-traded funds. |
| | |
TRUSTEES Cheryl K. Beebe, Chair Lawrence Hughes John F. Killian Steven D. Krichmar James A. McNamara | | OFFICERS James A. McNamara, President Joseph F. DiMaria, Principal Financial Officer, Principal Accounting Officer and Treasurer Caroline L. Kraus, Secretary |
| |
GOLDMAN SACHS & CO. LLC Distributor and Transfer Agent | | GOLDMAN SACHS ASSET MANAGEMENT, L.P. Investment Adviser |
Visit our web site at www.GSAMFUNDS.com to obtain the most recent month-end returns.
Goldman Sachs Asset Management, L.P. 200 West Street, New York, New York 10282
The portfolio risk management process includes an effort to monitor and manage risk, but does not imply low risk.
The reports concerning the Portfolios included in this shareholder report may contain certain forward-looking statements about the factors that may affect the performance of the Portfolios in the future. These statements are based on Portfolio management’s predictions and expectations concerning certain future events and their expected impact on the Portfolios, such as performance of the economy as a whole and of specific industry sectors, changes in the levels of interest rates, the impact of developing world events, and other factors that may influence the future performance of the Portfolios. Management believes these forward-looking statements to be reasonable, although they are inherently uncertain and difficult to predict. Actual events may cause adjustments in portfolio management strategies from those currently expected to be employed.
Views and opinions expressed are for informational purposes only and do not constitute a recommendation by GSAM to buy, sell, or hold any security. Views and opinions are current as of the date of this presentation and may be subject to change, they should not be construed as investment advice.
A description of the policies and procedures that the Funds use to determine how to vote proxies relating to portfolio securities and information regarding how a Fund voted proxies relating to portfolio securities during the most recent 12 month period ended June 30 is available (i) without charge, upon request by calling 1-800-526-7384 (for Retail Shareholders) or 1-800-621-2550 (for Institutional Shareholders); and (ii) on the Securities and Exchange Commission (“SEC”) web site at http://www.sec.gov.
References to indices, benchmarks or other measures of relative market performance over a specified period of time are provided for your information only and do not imply that the portfolio will achieve similar results. The index composition may not reflect the manner in which a portfolio is constructed. While an adviser seeks to design a portfolio which reflects appropriate risk and return features, portfolio characteristics may deviate from those of the benchmark.
The Portfolios will file portfolio holdings information for each month in a fiscal quarter within 60 days after the end of the relevant fiscal quarter on Form N-PORT. Portfolio holdings information for the third month of each fiscal quarter will be made available on the SEC’s website at http://www.sec.gov. Portfolio holdings information may be obtained upon request and without charge by calling 1-800-526-7384 (for Retail Shareholders) or 1-800-621-2550 (for Institutional Shareholders).
Economic and market forecasts presented herein reflect a series of assumptions and judgments as of the date of this presentation and are subject to change without notice. These forecasts do not take into account the specific investment objectives, restrictions, tax and financial situation or other needs of any specific client. Actual data will vary and may not be reflected here. These forecasts are subject to high levels of uncertainty that may affect actual performance. Accordingly, these forecasts should be viewed as merely representative of a broad range of possible outcomes. These forecasts are estimated, based on assumptions, land are subject to significant revision and may change materially as economic and market conditions change. Goldman Sachs has no obligation to provide updates or changes to these forecasts. Case studies and examples are for illustrative purposes only.
Portfolio holdings and allocations shown are as of August 31, 2019 and may not be representative of future investments. Portfolio holdings should not be relied on in making investment decisions and should not be construed as research or investment advice regarding particular securities. Current and future holdings are subject to risk.
This material is not authorized for distribution to prospective investors unless preceded or accompanied by a current Prospectus or summary prospectus, if applicable. Investors should consider a Portfolio’s objective, risks, and charges and expenses, and read the summary prospectus, if available, and/or the Prospectus carefully before investing or sending money. The summary prospectus, if available, and the Prospectus contain this and other information about a Portfolio and may be obtained from your authorized dealer or from Goldman Sachs & Co. LLC by calling (retail – 1-800-526-7384) (institutional – 1-800-621-2550).
© 2020 Goldman Sachs. All rights reserved 218120-OTU-1285982 TARGDATEAR-20
(a) As of the end of the period covered by this report, the registrant has adopted a code of ethics that applies to the registrant’s principal executive officer, principal financial officer, principal accounting officer or controller, or persons performing similar functions, regardless of whether these individuals are employed by the registrant or a third party (the “Code of Ethics”).
(b) During the period covered by this report, no amendments were made to the provisions of the Code of Ethics.
(c) During the period covered by this report, the registrant did not grant any waivers, including an implicit waiver, from any provision of the Code of Ethics.
(d) A copy of the Code of Ethics is available as provided in Item 13(a)(1) of this report.
| ITEM 3. | AUDIT COMMITTEE FINANCIAL EXPERT. |
The registrant’s board of trustees has determined that the registrant has at least one “audit committee financial expert” (as defined in Item 3 of Form N-CSR) serving on its audit committee. John F. Killian is the “audit committee financial expert” and is “independent” (as each term is defined in Item 3 of Form N-CSR).
| ITEM 4. | PRINCIPAL ACCOUNTANT FEES AND SERVICES. |
Table 1 — Items 4(a) - 4(d). The accountant fees below reflect the aggregate fees billed by the Funds of the Goldman Sachs Trust II to which this certified shareholder report relates.
| | | | | | | | | | | | |
| | | 2020 | | 2019 | | Description of Services Rendered |
| | | | | | | | | | | | |
| | | |
Audit Fees: | | | | | | | | | | | | |
| | | |
• PricewaterhouseCoopers LLP
(“PwC”) | | | $ | 606,785 | | | | $ | 694,985 | | | Financial Statement audits. |
| | | |
Audit-Related Fees: | | | | | | | | | | | | |
| | | |
• PwC | | | $ | 50,388 | | | | $ | 24,305 | | | |
| | | |
Tax Fees: | | | | | | | | | | | | |
| | | |
• PwC | | | $ | 0 | | | | $ | 176,493 | | | |
Table 2 — Items 4(b)(c) & (d). Non-Audit Services to the Goldman Sachs Trust II’s service affiliates * that were pre-approved by the Audit Committee of the Goldman Sachs Trust II pursuant to Rule 2-01(c)(7)(ii) of Regulation S-X.
| | | | | | | | | | | | |
| | | 2020 | | 2019 | | Description of Services Rendered |
| | | | | | | | | | | | |
| | | |
Audit-Related Fees: | | | | | | | | | | | | |
| | | |
• PwC | | | $ | 2,001,446 | | | | $ | 2,400,617 | | | Internal control review performed in accordance with Statement on Standards for Attestation Engagements No. 16 and semi annual updates relating to withholding tax accrual for non-US jurisdictions. These fees are borne by the Funds’ Adviser. |
| * | These include the advisor (excluding sub-advisors) and any entity controlling, controlled by or under common control with the advisor that provides ongoing services to the registrant (hereinafter referred to as “service affiliates”). |
Item 4(e)(1) — Audit Committee Pre-Approval Policies and Procedures
Pre-Approval of Audit and Non-Audit Services Provided to the Funds of the Goldman Sachs Trust II. The Audit and Non-Audit Services Pre-Approval Policy (the “Policy”) adopted by the Audit Committee of Goldman Sachs Trust II (“GST II”) sets forth the procedures and the conditions pursuant to which services performed by an independent auditor for GST II may be pre-approved. Services may be pre-approved specifically by the Audit Committee as a whole or, in certain circumstances, by the Audit Committee Chairman or the person designated as the Audit Committee Financial Expert. In addition, subject to specified cost limitations, certain services may be pre-approved under the provisions of the Policy. The Policy provides that the Audit Committee will consider whether the services provided by an independent auditor are consistent with the Securities and Exchange Commission’s rules on auditor independence. The Policy provides for periodic review and pre-approval by the Audit Committee of the services that may be provided by the independent auditor.
De Minimis Waiver. The pre-approval requirements of the Policy may be waived with respect to the provision of non-audit services that are permissible for an independent auditor to perform, provided (1) the aggregate amount of all such services provided constitutes no more than five percent of the total amount of revenues subject to pre-approval that was paid to the independent auditors during the fiscal year in which the services are provided; (2) such services were not recognized by GST II at the time of the engagement to be non-audit services; and (3) such services are promptly brought to the attention of the Audit Committee and approved prior to the completion of the audit by the Audit Committee or by one or more members of the Audit Committee to whom authority to grant such approvals has been delegated by the Audit Committee, pursuant to the pre-approval provisions of the Policy.
Pre-Approval of Non-Audit Services Provided to GST’s Investment Advisers. The Policy provides that, in addition to requiring pre-approval of audit and non-audit services provided to GST II, the Audit Committee will pre-approve those non-audit services provided to GST II’s investment advisers (and entities controlling, controlled by or under common control with the investment advisers that provide ongoing services to GST II) where the engagement relates directly to the operations or financial reporting of GST II.
Item 4(e)(2) – 0% of the audit-related fees, tax fees and other fees listed in Table 1 were approved by GST II’s Audit Committee pursuant to the “de minimis” exception of Rule 2-01(c)(7)(i)(C) of Regulation S-X. In addition, 0% of the non-audit services to the GST II’s service affiliates listed in Table 2 were approved by GST II’s Audit Committee pursuant to the “de minimis” exception of Rule 2-01(c)(7)(i)(C) of Regulation S-X.
Item 4(f) – Not applicable.
Item 4(g) Aggregate Non-Audit Fees Disclosure
The aggregate non-audit fees billed to GST II by PwC for the twelve months ended August 31, 2020 and August 31, 2019 were $50,388 and $200,798 respectively. The aggregate non-audit fees billed to GST II’s adviser and service affiliates by PwC for the twelve months ended December 31, 2019 and December 31, 2018 were approximately $14.7 million and $12.3 million respectively. With regard to the aggregate non-audit fees billed to GST II’s adviser and service affiliates, the 2019 and 2018 amounts include fees for non-audit services required to be pre-approved [see Table 2] and fees for non-audit services that did not require pre-approval since they did not directly relate to GST II’s operations or financial reporting.
Item 4(h) — GST II’s Audit Committee has considered whether the provision of non-audit services to GST II’s investment adviser and service affiliates that did not require pre-approval pursuant to paragraph (c)(7)(ii) of Rule 2-01 of Regulation S-X is compatible with maintaining the auditors’ independence.
| ITEM 5. | AUDIT COMMITTEE OF LISTED REGISTRANTS. |
| ITEM 6. | SCHEDULE OF INVESTMENTS. |
| | Schedule of Investments is included as part of the Report to Shareholders filed under Item 1. |
| ITEM 7. | DISCLOSURE OF PROXY VOTING POLICIES AND PROCEDURES FOR CLOSED-END MANAGEMENT INVESTMENT COMPANIES. |
| ITEM 8. | PORTFOLIO MANAGERS OF CLOSED-END MANAGEMENT INVESTMENT COMPANIES. |
| ITEM 9. | PURCHASES OF EQUITY SECURITIES BY CLOSED-END MANAGEMENT INVESTMENT COMPANY AND AFFILIATED PURCHASERS. |
| ITEM 10. | SUBMISSION OF MATTERS TO A VOTE OF SECURITY HOLDERS. |
| | There have been no material changes to the procedures by which shareholders may recommend nominees to the registrant’s board of trustees. |
| ITEM 11. | CONTROLS AND PROCEDURES. |
| | (a) | The registrant’s principal executive and principal financial officers, or persons performing similar functions have concluded that the registrant’s disclosure controls and procedures (as defined in Rule 30a-3(c) under the Investment Company Act of 1940, as amended (the “1940 Act”)) are effective as of a date within 90 days of the filing of this report that includes the disclosure required by this paragraph, based on the evaluation of these controls and procedures required by Rule 30a-3(b) under the 1940 Act and 15d-15(b) under the Securities Exchange Act of 1934, as amended. |
| | (b) | There were no changes in the registrant’s internal control over financial reporting (as defined in Rule 30a-3(d) under the 1940 Act) that occurred during the period covered by this report that have materially affected, or are reasonably likely to materially affect, the registrant’s internal control over financial reporting. |
| ITEM 12. | DISCLOSURE OF SECURITIES LENDING ACTIVITIES FOR CLOSED-END MANAGEMENT INVESTMENT COMPANIES |
SIGNATURES
Pursuant to the requirements of the Securities Exchange Act of 1934 and the Investment Company Act of 1940, the registrant has duly caused this report to be signed on its behalf by the undersigned, thereunto duly authorized.
| | | | |
| | | | Goldman Sachs Trust II |
| | |
| By: | | | | /s/ James A. McNamara |
| | |
| | | | James A. McNamara |
| | | | President/Chief Executive Officer |
| | | | Goldman Sachs Trust II |
| | |
| Date: | | | | November 2, 2020 |
Pursuant to the requirements of the Securities Exchange Act of 1934 and the Investment Company Act of 1940, this report has been signed below by the following persons on behalf of the registrant and in the capacities and on the dates indicated.
| | | | |
| | |
| By: | | | | /s/ James A. McNamara |
| | |
| | | | James A. McNamara |
| | | | President/Chief Executive Officer |
| | | | Goldman Sachs Trust II |
| | |
| Date: | | | | November 2, 2020 |
| | |
| By: | | | | /s/ Joseph F. DiMaria |
| | |
| | | | Joseph F. DiMaria |
| | | | Principal Financial Officer |
| | | | Goldman Sachs Trust II |
| | |
| Date: | | | | November 2, 2020 |